Table of Contents
As filed with the Securities and Exchange Commission on March 12, 2013.
SECURITIES AND EXCHANGE COMMISSION
WASHINGTON, D.C. 20549
FORM 20-F
| ¨ | REGISTRATION STATEMENT PURSUANT TO SECTION 12(b) OR 12(g) OF THE SECURITIES EXCHANGE ACT OF 1934 |
Or
| þ | ANNUAL REPORT PURSUANT TO SECTION 13 OR 15(d) OF THE SECURITIES EXCHANGE ACT OF 1934 |
For the fiscal year ended December 31, 2012
Or
| ¨ | TRANSITION REPORT PURSUANT TO SECTION 13 OR 15(d) OF THE SECURITIES EXCHANGE ACT OF 1934 |
Or
| ¨ | SHELL COMPANY REPORT PURSUANT TO SECTION 13 OR 15(d) OF THE SECURITIES EXCHANGE ACT OF 1934 |
Date of event requiring this shell company report
For the transition period from N/A to N/A
Commission file number: 1-14930
HSBC Holdings plc
(Exact name of Registrant as specified in its charter)
| N/A | United Kingdom | |
| (Translation of Registrant’s name into English) | (Jurisdiction of incorporation or organisation) |
8 Canada Square
London E14 5HQ
United Kingdom
(Address of principal executive offices)
Russell C Picot
8 Canada Square
London E14 5HQ
United Kingdom
Tel +44 (0) 20 7991 8888
Fax +44 (0) 20 7992 4880
(Name, Telephone, Email and/or Facsimile number and Address of Company Contact Person)
Securities registered or to be registered pursuant to Section 12(b) of the Securities Exchange Act of 1934:
Title of each class | Name of each exchange on which registered | |
| Ordinary Shares, nominal value US$0.50 each. | London Stock Exchange | |
| Hong Kong Stock Exchange | ||
| Euronext Paris | ||
| Bermuda Stock Exchange | ||
| New York Stock Exchange* | ||
American Depository Shares, each representing 5 Ordinary Shares of nominal value US$0.50 each. | New York Stock Exchange | |
6.20% Non-Cumulative Dollar Preference Shares, Series A | New York Stock Exchange* | |
American Depositary Shares, each representing one- fortieth of a Share of 6.20% Non-Cumulative Dollar Preference Shares, Series A | New York Stock Exchange | |
| 5.10% Senior Unsecured Notes Due 2021 | New York Stock Exchange | |
| 4.00% Senior Unsecured Notes Due 2022 | New York Stock Exchange | |
| 4.875% Senior Unsecured Notes Due 2022 | New York Stock Exchange | |
| 7.625% Subordinated Notes due 2032 | New York Stock Exchange | |
| 7.35% Subordinated Notes due 2032 | New York Stock Exchange | |
| 6.5% Subordinated Notes 2036 | New York Stock Exchange | |
| 6.5% Subordinated Notes 2037 | New York Stock Exchange | |
| 6.8% Subordinated Notes Due 2038 | New York Stock Exchange | |
| 6.100% Senior Unsecured Notes due 2042 | New York Stock Exchange | |
8.125% Perpetual Subordinated Capital Securities Exchangeable at the Issuer’s Option into Non- Cumulative Dollar Preference Shares | New York Stock Exchange | |
8.00% Perpetual Subordinated Capital Securities Exchangeable at the Issuer’s Option into Non- Cumulative Dollar Preference Shares, Series 2 | New York Stock Exchange |
Securities registered or to be registered pursuant to Section 12(g) of the Securities Exchange Act of 1934: None
Securities for which there is a reporting obligation pursuant to Section 15(d) of the Securities Exchange Act of 1934: None
Indicate the number of outstanding shares of each of the issuer’s classes of capital or common stock as of the close of the period covered by the annual report:
Ordinary Shares, nominal value US$0.50 each 18,476,008,664
Indicate by check mark if the registrant is a well-known seasoned issuer, as defined in Rule 405 of the Securities Act.
þ Yes¨ No
If this report is an annual or transition report, indicate by check mark if the registrant is not required to file reports pursuant to Section 13 or 15(d) of the Securities Exchange Act of 1934.
¨ Yesþ No.
Indicate by check mark whether the registrant (1) has filed all reports required to be filed by Section 13 or 15(d) of the Securities Exchange Act of 1934 during the preceding 12 months (or for such shorter period that the registrant was required to file such reports), and (2) has been subject to such filing requirements for the past 90 days.
þ Yes¨ No
Indicate by check mark whether the registrant has submitted electronically and posted on its corporate Web site, if any, every Interactive Data File required to be submitted and posted pursuant to Rule 405 of Regulation S-T (§232.405 of this chapter) during the preceding 12 months (or for such shorter period that the registrant was required to submit and post such files).
¨ Yes¨ No
Indicate by check mark whether the registrant is a large accelerated filer, an accelerated filer, or a non-accelerated filer. See definition of “accelerated filer and large accelerated filer” in Rule 12b-2 of the Exchange Act. (Check one):
| Large accelerated filerþ | Accelerated filer¨ | Non-accelerated filer¨ |
Indicate by check mark which basis of accounting the registrant has used to prepare the financial statements included in this filing:
| U.S. GAAP ¨ | International Financial Reporting Standards as issued by the International Accounting Standards Boardþ | Other ¨ |
If “Other” has been checked in response to the previous question indicate by check mark which financial statement item the registrant has elected to follow.
¨ Item 17 ¨ Item 18
If this is an annual report, indicate by check mark whether the registrant is a shell company (as defined in Rule 12b-2 of the Exchange Act).
¨ Yesþ No
| * | Not for trading, but only in connection with the registration of American Depositary Shares. |
Table of Contents
HSBC HOLDINGS PLC
Annual Report and Accounts 2012
Certain defined terms
Unless the context requires otherwise, ‘HSBC Holdings’ means HSBC Holdings plc and ‘HSBC’, the ‘Group’, ‘we’, ‘us’ and ‘our’ refers to HSBC Holdings together with its subsidiaries. Within this document the Hong Kong Special Administrative Region of the People’s Republic of China is referred to as ‘Hong Kong’. When used in the terms ‘shareholders’ equity’ and ‘total shareholders’ equity’, ‘shareholders’ means holders of HSBC Holdings ordinary shares and those preference shares classified as equity. The abbreviations ‘US$m’ and ‘US$bn’ represent millions and billions (thousands of millions) of US dollars, respectively.
Financial statements
The consolidated financial statements of HSBC and the separate financial statements of HSBC Holdings have been prepared in accordance with International Financial Reporting Standards (‘IFRSs’) as issued by the International Accounting Standards Board (‘IASB’) and as endorsed by the European Union (‘EU’). EU-endorsed IFRSs may differ from IFRSs as issued by the IASB if, at any point in time, new or amended IFRSs have not been endorsed by the EU. At 31 December 2012, there were no unendorsed standards effective for the year ended 31 December 2012 affecting these consolidated and separate financial statements, and there was no difference between IFRSs endorsed by the EU and IFRSs issued by the IASB in terms of their application to HSBC. Accordingly, HSBC’s financial statements for the year ended 31 December 2012 are prepared in accordance with IFRSs as issued by the IASB.
We use the US dollar as our presentation currency because the US dollar and currencies linked to it form the major currency bloc in which we transact and fund our business. Unless otherwise stated, the information presented in this document has been prepared in accordance with IFRSs.
When reference to ‘underlying’ is made in tables or commentaries, comparative information has been expressed at constant currency (see page 25), eliminating the impact of fair value movements in respect of credit spread changes on HSBC’s own debt and adjusting for the effects of acquisitions and disposals as reconciled on page 28. Underlying RoRWA is defined and reconciled on page 52.
| 2 | ||
| 3a | ||
| 4 | ||
| 8 | ||
| 12 | ||
| 13 | ||
| 13 | ||
| 14 | ||
| 17 | ||
| 19 | ||
| 22 | ||
| 25 | ||
| 58 | ||
| 60 | ||
| 79 | ||
| 118 | ||
| 119a | ||
Management’s assessment of internal controls over financial reporting | 119a | |
| 122b | ||
| 122i | ||
Disclosures pursuant to Section 13(r) of the Securities Exchange Act | 122s | |
| 123 | ||
| 281 | ||
| 301 | ||
| 302 | ||
| 309 | ||
| 318 | ||
| 332 | ||
| 334 | ||
| 335 | ||
| 347 | ||
Financial Statements and Other Information | ||
| 369 | ||
Financial Statements1 | ||
| 371 | ||
| 383 | ||
| 516 | ||
| 528 | ||
| 529 | ||
| 532 | ||
| 540 | ||
| 1 | Detailed contents are provided on the referenced pages. |
Table of Contents

Who we are and what we do
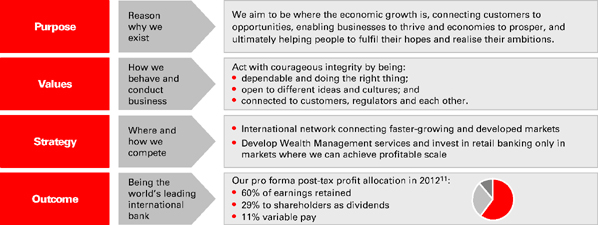
HSBC is one of the world’s largest banking and financial services organisations, with around 6,600 offices in both established and faster-growing markets. We aim to be where the economic growth is, connecting customers to opportunities, enabling businesses to thrive and economies to prosper, and ultimately helping people to fulfil their hopes and realise their ambitions.
We serve around 58 million customers through our four global businesses: Retail Banking and Wealth Management, Commercial Banking, Global Banking and Markets, and Global Private Banking. Our network covers 81 countries and territories in six geographical regions: Europe, Hong Kong, Rest of Asia-Pacific, Middle East and North Africa, North America and Latin America. Our aim is to be acknowledged as the world’s leading international bank.
Listed on the London, Hong Kong, New York, Paris and Bermuda stock exchanges, shares in HSBC Holdings plc are held by about 220,000 shareholders in 129 countries and territories.
Highlights
| • | Profit before tax down 6% to US$20.6bn and revenue down 5% to US$68.3bn on a reported basis. |
| • | Underlying profit before tax up 18% to US$16.4bn. |
| • | Continued to execute our strategy to grow, simplify and restructure the Group. |
| • | Underlying revenue up 7% reflecting revenue growth, notably in Global Banking and Markets and Commercial Banking. |
| • | Achieved sustainable savings of US$2.0bn, taking our total annualised savings to US$3.6bn, exceeding our cumulative target of US$2.5bn to US$3.5bn since 2011. |
| • | Announced 26 disposals and closures of non-strategic businesses and non-core investments in 2012. |
| • | Return on equity was 8.4%, down from 10.9% in 2011. |
| • | Dividends declared in respect of 2012 US$8.3bn or US$0.45 per ordinary share, up 10% on 2011. |
| • | Core tier 1 capital ratio increased during the year from 10.1% to 12.3%. |
Cover image
Financing trade has always been at the heart of HSBC’s business, especially in our home market of Hong Kong. Today, Hong Kong International Airport is the world’s busiest air cargo hub, with its freight volume accounting for over one-third of the total value of Hong Kong’s external trade.
1
Table of Contents
HSBC HOLDINGS PLC
Report of the Directors: Overview
Earnings per share
US$0.74– down 20%
2011: US$0.92 2010: US$0.73 | Dividends per ordinary share1
US$0.41
2011: US$0.39 2010: US$0.34 | Net assets per share
US$9.09– up 7%
2011: US$8.48 2010: US$7.94 | ||
For the year
Profit before taxation
US$20,649m– down 6%
2011: US$21,872m 2010: US$19,037m | Underlying profit before taxation
US$16,385m– up 18%
2011: US$13,861m | Total operating income
US$82,545m– down 1%
2011: US$83,461m 2010: US$80,014m | ||
Net operating income before loan impairment charges and other credit risk provisions
US$68,330m– down 5%
2011: US$72,280m 2010: US$68,247m | Profit attributable to the ordinary
US$13,454m– down 17%
2011: US$16,224m 2010: US$12,746m | |||
At the year-end | ||||
Loans and advances to customers
US$998bn– up 6%
2011: US$940bn 2010: US$958bn | Customer accounts
US$1,340bn– up 7%
2011: US$1,254bn 2010: US$1,228bn | Ratio of customer advances to customer accounts
74.4%
2011: 75.0% 2010: 78.1% | ||
Total equity
US$183bn– up 10%
2011: US$166bn 2010: US$155bn | Average total shareholders’ equity to average total assets
6.2%
2011: 5.6% 2010: 5.5% | Risk-weighted assets
US$1,124bn– down 7%
2011: US$1,210bn 2010: US$1,103bn | ||
| Capital ratios | ||||
Core tier 1 ratio
12.3%
2011: 10.1% 2010: 10.5% | Tier 1 ratio
13.4%
2011: 11.5% 2010: 12.1% | Total capital ratio
16.1%
2011: 14.1% 2010: 15.2% | ||
2
Table of Contents
HSBC HOLDINGS PLC
Report of the Directors: Overview(continued)
Performance ratios
Credit coverage ratios
Loan impairment charges to total operating income
9.9%
2011: 13.8% 2010: 16.9% | Loan impairment charges to average gross customer advances
0.9%
2011: 1.2% 2010: 1.5% | Total impairment allowances to impaired loans at year-end
41.7%
2011: 42.3% 2010: 43.0% |
Return ratios
Return on average ordinary shareholders’ equity2
8.4%
2011: 10.9% 2010: 9.5% | Return on average invested capital3
8.0%
2011: 10.2% 2010: 8.7% | Post-tax return on average total assets
0.6%
2011: 0.6% 2010: 0.6% | Pre-tax return on average risk- weighted assets
1.8%
2011: 1.9% 2010: 1.7% | |||
| Efficiency and revenue mix ratios | ||||||
Cost efficiency ratio4
62.8%
2011: 57.5% 2010: 55.2% | Net interest income to total operating income
45.6%
2011: 48.7% 2010: 49.3% | Net fee income to total operating income
19.9%
2011: 20.6% 2010: 21.7% | Net trading income to total operating income
8.6%
2011: 7.8% 2010: 9.0% | |||
Share information at the year-end
Closing market price | ||||||||
US$0.50 ordinary shares in issue
18,476m
2011: 17,868m 2010: 17,686m | Market capitalisation
US$194bn
2011: US$136bn 2010: US$180bn | London
£6.47
2011: £4.91 2010: £6.51 | Hong Kong
HK$81.3
2011: HK$59.00 2010: HK$79.70 | American Depositary Share5
US$53.07
2011: US$38.10 2010: US$51.04 | ||||
Total shareholder return6 | ||||||||
| Over 1 year | Over 3 years | Over 5 years | ||||||
| To 31 December 2012 | 139 | 104 | 113 | |||||
Benchmarks: | ||||||||
– FTSE 1007 | 110 | 121 | 111 | |||||
– MSCI World8 | 117 | 124 | 97 | |||||
– MSCI Banks9 | 128 | 106 | 68 | |||||
For footnotes, see page 120.
3
Table of Contents
HSBC HOLDINGS PLC
Report of the Directors: Overview(continued)
Cautionary statement regarding forward-looking statements
TheAnnual Report and Accounts 2012 contains certain forward-looking statements with respect to HSBC’s financial condition, results of operations and business.
Statements that are not historical facts, including statements about HSBC’s beliefs and expectations, are forward-looking statements. Words such as ‘expects’, ‘anticipates’, ‘intends’, ‘plans’, ‘believes’, ‘seeks’, ‘estimates’, ‘potential’ and ‘reasonably possible’, variations of these words and similar expressions are intended to identify forward-looking statements. These statements are based on current plans, estimates and projections, and therefore undue reliance should not be placed on them. Forward-looking statements speak only as of the date they are made. HSBC makes no commitment to revise or update any forward-looking statements to reflect events or circumstances occurring or existing after the date of any forward-looking statements.
Written and/or oral forward-looking statements may also be made in the periodic reports to the US Securities and Exchange Commission, summary financial statements to shareholders, proxy statements, offering circulars and prospectuses, press releases and other written materials, and in oral statements made by HSBC’s Directors, officers or employees to third parties, including financial analysts.
Forward-looking statements involve inherent risks and uncertainties. Readers are cautioned that a number of factors could cause actual results to differ, in some instances materially, from those anticipated or implied in any forward-looking statement. These include, but are not limited to:
| • | changes in general economic conditions in the markets in which we operate, such as continuing or deepening recessions and fluctuations in employment beyond those factored into consensus forecasts; changes in foreign exchange rates and interest rates; volatility in equity markets; lack of liquidity in wholesale funding markets; illiquidity and downward price pressure in national real estate markets; adverse changes in central banks’ policies with respect to the provision of liquidity support to financial markets; heightened market concerns over sovereign creditworthiness in over-indebted countries; adverse changes in the funding status |
of public or private defined benefit pensions; and consumer perception as to the continuing availability of credit and price competition in the market segments we serve;
| • | changes in government policy and regulation, including the monetary, interest rate and other policies of central banks and other regulatory authorities; initiatives to change the size, scope of activities and interconnectedness of financial institutions in connection with the implementation of stricter regulation of financial institutions in key markets worldwide; revised capital and liquidity benchmarks which could serve to deleverage bank balance sheets and lower returns available from the current business model and portfolio mix; imposition of levies or taxes designed to change business mix and risk appetite; the practices, pricing or responsibilities of financial institutions serving their consumer markets; expropriation, nationalisation, confiscation of assets and changes in legislation relating to foreign ownership; changes in bankruptcy legislation in the principal markets in which we operate and the consequences thereof; general changes in government policy that may significantly influence investor decisions; extraordinary government actions as a result of current market turmoil; other unfavourable political or diplomatic developments producing social instability or legal uncertainty which in turn may affect demand for our products and services; the costs, effects and outcomes of product regulatory reviews, actions or litigation, including any additional compliance requirements; and the effects of competition in the markets where we operate including increased competition from non-bank financial services companies, including securities firms; and |
| • | factors specific to HSBC, including our success in adequately identifying the risks we face, such as the incidence of loan losses or delinquency, and managing those risks (through account management, hedging and other techniques). Effective risk management depends on, among other things, our ability through stress testing and other techniques to prepare for events that cannot be captured by the statistical models it uses; and our success in addressing operational, legal and regulatory, and litigation challenges, notably compliance with the DPA. |
3a
Table of Contents
HSBC HOLDINGS PLC
Report of the Directors: Overview(continued)

2012 was a year of considerable progress in delivering on the strategic priorities which the Board has tasked management to address. Our decision to focus on reshaping the Group through targeted disposals and closures and internal reorganisation is paying dividends. It is bringing greater clarity and focus and is delivering sustainable cost savings while allowing incremental investment to be available and directed towards the areas of greatest opportunity.
This progress is all the more notable given that during 2012, the banking sector, including HSBC, faced continuing and in many ways unprecedented challenges. Banking has been given a huge wake-up call and we are determined to play our part in restoring its reputation and thereby regaining society’s trust. Thus our restructuring agenda is not only justified economically but is helping the Group shape its response to the media, the regulatory and political challenges, and societal expectations which, simply put, all revolve around restoring the trust of all stakeholders. From depositors to investors, regulators to employees, public policy makers to consumer lobbyists we need to ensure the business model of banking is fair, transparent, sustainable and meeting its core objective of serving society.
Never has it been more important to put the customer first and provide the means and support to help them fulfil their financial aspirations and ambitions. That is our prime purpose and one of which we should never lose sight.
Over the last two years the Board was exercised greatly by the major US regulatory and law enforcement investigations we faced. I covered the background to these investigations, settlement of
which we reached in December, in our Interim Report.
Management is now delivering the required enhancements to our control framework and on top of this we have significantly augmented the Board’s oversight and governance capabilities. This is dealt with in more detail below.
Encouragingly, there is now growing external recognition of the progress being made in delivering against our stated strategic priorities. This, together with our overweight exposure to the world’s more attractive economies, contributed to a total shareholder return of 39% over the year – 7% from dividends paid and 32% from share price appreciation. Over the course of the year the market capitalisation of HSBC grew by US$58bn from US$136bn to US$194bn, returning shareholders once again to the position where their company is worth more than its contributed capital. We remained among the highest dividend payers in the FTSE 100, a performance which we know is of great importance to our shareholders.
The cover to this year’s Annual Report again illustrates our strategy of connecting customers and markets. The scene depicted is the cargo terminal at Hong Kong International Airport, which has been ranked as the busiest airport for international air cargo since 1996. Today the airport’s trade throughput represents over one third of Hong Kong’s external trade. HSBC’s connection with trade financing and trade services through Hong Kong goes back to our earliest days and remains one of our core strengths. Projections of trade growth in Asia and Hong Kong’s role therein reinforce our investment focus in this area.
Performance in 2012
There was much to be positive about in HSBC’s performance in 2012. The majority of our core businesses in Asia, particularly in Hong Kong, continued to perform well, achieving good underlying revenue growth in the year. Increased market confidence around eurozone recovery contributed to a significant turnaround in Global Banking and Markets results in Europe. Targeted disposals and the continuing run-off from our exit portfolios in the United States, together with evidence of recovery in many housing areas were reflected in significantly lower US loan impairment charges.
Progress in managing costs to reflect a lower economic growth environment in developed markets was encouraging. Offsetting these positive factors, credit demand remained muted throughout Europe,
4
Table of Contents
HSBC HOLDINGS PLC
Report of the Directors: Overview(continued)
low interest rates continued to constrain the value of our liquid balance sheet and customer redress costs continued to weigh heavily in the UK.
The Group Chief Executive’s Business Review covers financial performance and progress on strategy delivery in more detail.
Reported results include the benefit of profits arising from the significant disposals made in the year as well as bearing the burden of the fines and penalties levied as part of the settlement with US regulatory and law enforcement agencies and increased customer redress provisions in the UK. When the Board assesses management performance as part of reward measurement, these disposal gains are eliminated but the legal settlement and customer redress costs are not.
Looking through the reported results to underlying financial performance, the Board viewed positively the 2012 outcome.
Although earnings per share of US$0.74 were 20% lower than 2011, this largely reflected a US$9.1bn negative swing in the fair value of our own debt as credit spreads tightened, together with a higher tax rate.
With the Group’s capital position strengthened from retained profits and from capital released from the divestments made in the year, the Board has approved a 29% increase in the final dividend in respect of the year to US$0.18 per share, US$0.04 higher than the final dividend in respect of 2011. Total dividends in respect of 2012 of US$8.3bn, amounted to US$0.45 per share, US$0.9bn higher than in 2011. The Board also intends to increase the quarterly dividends in respect of the first three quarters of 2013 by US$0.01 per share to US$0.10 per share.
Shareholders’ equity at the end of 2012 stood at US$175bn, US$17bn or some 10 % higher than at the beginning of the year. The core tier 1 capital ratio strengthened from 10.1% to 12.3% and the Group remains on track to deliver compliance with the more onerous Basel III requirements in the accelerated timetable being sought by UK regulators.
During 2012, the UK government increased the rate of levy applied on the global balance sheets of UK domiciled banks. The cost to HSBC of the revised levy for the current year was US$571m of which US$295m related to non-UK banking activity. The 2012 levy, which is not tax deductible, is the equivalent of US$0.03 per ordinary share and, as indicated last year, would otherwise have been available for distribution to shareholders or used to strengthen the capital base further.
Progress on regulatory reform
2012 was a further year of progress in delivering key elements of the regulatory reform agenda mandated by the G20 in response to the financial crisis. After a long consultation period, the proposed Liquidity Coverage Ratio within the Basel III framework was recalibrated to better match industry experience, and so strengthen bank liquidity without unnecessarily constraining credit formation.
The list of banks to be designated as globally significant was announced and, as expected, HSBC was one of four placed in the highest category. Good progress was made on clarifying the possible approaches to resolving the failure of a bank with operations in multiple jurisdictions. One approach was directly applicable to the subsidiarised model favoured by HSBC.
On structural reform of banking entities, the Liikanen Group in Europe produced its report for consideration while draft alternatives have been proposed in France and Germany. In the UK, the Government substantially accepted the recommendations of the Independent Commission on Banking in a policy paper and a draft Financial Services (Banking Reform) Bill is expected to be approved in the first half of 2013. Thereafter, the government has signalled its intention to pass secondary legislation by the end of this parliament in 2015, with final implementation of the new regime by 2019.
The key structural change being legislated remains the separation of certain banking activities for personal and small business customers into a ring-fenced bank with its own financial and governance arrangements. The recently appointed Parliamentary Commission on Banking Standards in the UK has reviewed the proposed legislation andinter alia recommended strengthening the ring fence by empowering regulators to force full separation in the event of attempts to frustrate the objectives of the ring fence.
Ongoing work remains extensive. Major areas of policy development covering augmenting loss absorbency through bailing-in certain categories of creditor, addressing the systemic impact of central clearing counterparties, establishing a banking union within the eurozone and revisiting the risk weighting of assets to enhance transparency and consistency, are among the most important.
On top of this, the UK Parliamentary Commission on Banking Standards is currently examining all aspects of conduct, behaviour and
5
Table of Contents
HSBC HOLDINGS PLC
Report of the Directors: Overview(continued)
culture with a view to making recommendations designed to restore trust and confidence in banks.
We are committed to working constructively with public policy makers and our regulators to give effect to these proposals. We note, however, two areas of concern.
First, it is perplexing that, after the great international effort invested in the G20 programme of sound and consistent global financial regulation, and the extent of reform currently underway, an increasing number of countries now appear to be acting unilaterally, thereby putting globally consistent regulation at risk of fragmentation and ‘balkanising’ the capital and liquidity resources of firms.
Second, we believe the sheer scale and timescale of the reform programme is hampering investors’ line of sight to the long-term returns available.
Resolving these two issues, which will require inter-governmental direction and co-operation, would contribute to enhancing the ability of the industry to support the economic growth agenda now being prioritised in most parts of the world.
Enforcing global standards
The Board is determined to adopt and enforce the highest behavioural and compliance standards in HSBC. For well documented reasons, the last two years have been extremely damaging to HSBC’s reputation and to our perception of ourselves. We faced serious failings both in the application of our standards and in our ability to identify, and so prevent, misuse and abuse of the financial system through our networks. Our strategy is entirely configured to eliminate the possibility of this happening again.
We have apologised unreservedly to all our stakeholders and have paid huge penalties both in monetary cost and reputational damage. More important than apologies, however, are the steps being taken to prevent recurrence. Management under Stuart Gulliver, the Group Chief Executive, is leading the work to simplify business and so reinforce risk management and control.
Our success in meeting our objectives will be subject to independent validation not simply through ongoing regulatory review but additionally through the appointment of an independent Monitor who will report to both UK and US authorities. We welcome the additional rigour this will bring to the process of upgrading and enforcing our global standards.
To reinforce the Board’s ability to exercise rigorous governance over these endeavours, we announced the creation of a new Board committee, the Financial System Vulnerabilities Committee on 30 January 2013. This committee will provide governance, oversight and policy guidance over the framework of controls and procedures designed to identify areas where HSBC may become exposed and, through that exposure, expose the financial system more broadly to financial crime or system abuse.
Five subject matter experts drawn from the highest levels of public service will support the committee. Their expertise includes the combating of organised crime, terrorist financing, narcotics trafficking, tax evasion and money laundering as well as expertise in intelligence gathering and international payments systems. They will provide invaluable guidance and advice, and most importantly challenge, as we strengthen our capabilities and enforce the highest standards. Further details of the background and experience of these individuals are contained in the Directors’ Report.
Recognising the need to augment the Board’s own experience and expertise we have also added specialist expertise at Board level.
Board changes
At the end of 2012 we said farewell to Narayana Murthy, who stepped down from the Board after serving with distinction for five years. Narayana, as co-founder and long-term CEO of Infosys, brought to the Board exceptional expertise in technology, operational efficiency and outsourcing matters as well as an in-depth knowledge of India and of international business through his experience on many multinational and educational boards. On behalf of the Board and shareholders I want to record our appreciation and gratitude for his contribution to HSBC.
We welcome two new directors to the Board.
Renato Fassbind joined the Board on 1 January and will serve on the Audit and Remuneration Committees. Renato brings to the Board considerable international business and financial expertise from a distinguished career in industrial, service and financial companies. He is currently Vice Chairman of the Supervisory Board and a member of the audit and the compensation committees of Swiss Reinsurance Company, a member of the Supervisory Board and audit committee of Kühne + Nagel International AG
6
Table of Contents
HSBC HOLDINGS PLC
Report of the Directors: Overview(continued)
and a member of the Supervisory Board of the Swiss Federal Audit Oversight Authority.
Renato stepped down as Chief Financial Officer and a member of the executive board of Credit Suisse Group in September 2010, having served in that role since 2004.
Jim Comeyjoins the Board today and will serve on the newly created Financial System Vulnerabilities Committee. Jim brings to the Board outstanding governance experience from both the private and public sectors. In his private sector roles he acted as General Counsel to leading international businesses and in public life served at the apex of law enforcement in the United States. Most recently, within the private sector, Jim Comey served as General Counsel of Bridgewater Associates, LP and prior to that as Senior Vice President and General Counsel of the Lockheed Martin Corporation. In public life, from 2003 to 2005, he served as US Deputy Attorney General, where he was responsible for supervising the operations of the Department of Justice, and chaired the President’s Corporate Fraud Task Force. From 2002 to 2003, he served as US Attorney for the Southern District of New York.
Fuller details of their background and experience are set out in the Directors’ Report.
Social contribution
Much is currently being written and debated about the role banks should play in society. In large part, this reflects the fact that the economic success that underpins a harmonious society depends upon sustainable financing, confidence and trust in the financial system. That trust is founded upon the broader role that banks play in their local communities.
Within HSBC, many of my colleagues make tremendous personal contributions to their communities and I want to take this opportunity to pay tribute to them. HSBC’s outreach in terms of community investment is primarily in the areas of education and the environment and, in 2012, in financial terms it amounted to some US$120m.
In 2012, we extended our commitment to support disadvantaged and vulnerable young people who are neither in education, employment nor training. We support local and international charities working in this area, and also run our own staff-driven ‘Future First’ programme, which helps street children, children in care and orphans to access education. Initiatives under this programme are developed and supported by HSBC colleagues
around the world and, in 2012, 2,717 members of staff volunteered to support the programme.
Importantly in all our community work we increasingly look to involve our staff to reinforce our links with the communities we serve. In 2012, for example, 114,982 HSBC colleagues spent 724,650 hours in volunteer activity.
We also launched the HSBC Water Programme last year. This is a five-year, US$100m commitment to support Water Aid, WWF and Earthwatch to deliver freshwater and sanitation to poor rural communities in Asia and Africa, educate local communities on sustainable water management in five major river basins around the world, and involve more than 7,500 HSBC staff with local conservation partners to address urban water management issues and learn to carry out scientific water research tasks.
Looking ahead
It is often said that people come together in adversity, learning lessons from the past and each other to create the bonds that ensure a better future. I believe that this has happened within HSBC. The last year has been a difficult one for all at HSBC as we addressed the restructuring of the firm against a lower-growth economic backdrop and with legacy issues and regulatory challenges imposing a further set of imperatives. Our 270,000 staff have had to face up to bewildering descriptions of HSBC that contrasted with the way they conduct their relationships with the firm’s customers and clients.
What has been inspirational is how everyone has pulled together, focused on the future and committed to do all and everything necessary to restore a reputation that we all believe can be positively distinctive. On behalf of the Board, I want to thank all our employees for that commitment and their loyal support.
I also want to thank our clients and customers, our shareholders, our regulators and those in government who believe, as we do, that we will meet the commitments we have made to allow us better to serve the communities who entrust their financial needs to HSBC.

D J Flint,Group Chairman
4 March 2013
7
Table of Contents
HSBC HOLDINGS PLC
Report of the Directors: Overview(continued)
Business Review

HSBC made significant progress in 2012 despite a challenging operating environment characterised by low economic growth and a changing regulatory landscape. We continued to pursue the strategy outlined in May 2011, announcing the sale or closure of 26 businesses or non-core investments, surpassing our sustainable savings target and recording underlying revenue growth in the majority of our faster-growing regions. We also reached agreement with the US authorities and the FSA in relation to past inadequate compliance with anti-money laundering and sanction laws. Although reported pre-tax profit fell by 6% to US$20.6bn in 2012, underlying profit, which includes the impact of fines and penalties and UK customer redress provisions totalling US$4.3bn, grew by 18%. This was primarily due to revenue growth, notably in Global Banking and Markets and Commercial Banking, and lower loan impairment charges in North America. We regard this as a good performance.
Our strategy is founded on a clear sense of purpose – to be where the growth is, connecting customers to opportunities and enabling businesses to thrive, economies to prosper and individuals to realise their ambitions. This has given us clear parameters around the way that we behave and conduct business and where and how we compete.
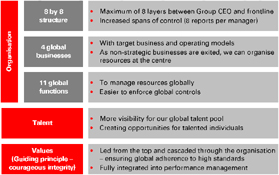
Since 2011, we have created a consistent global structure with strong governance, consisting of four global businesses and 11 global functions. In 2012, we continued to execute our strategic priorities to grow, restructure and simplify HSBC.
We grew our business in 2012, achieving underlying revenue growth in most of our priority
markets. The growth in these markets was a factor in generating a record reported profit before tax in Commercial Banking as we maintained our position as the world’s largest global trade finance bank, as reported in theOliver Wyman Global Transaction Banking Survey 2012. The collaboration between Commercial Banking and Global Banking and Markets delivered incremental gross revenues of over US$0.1bn in 2012. Wealth Management achieved more than US$0.5bn of additional revenues, although further progress is required to achieve our strategic goals.
The restructuring of the US business progressed in 2012 as we continued to run off the Consumer and Mortgage Lending portfolio, resulting in a US$14bn reduction in the value of average risk-weighted assets and a reduced loss before tax of US$3.1bn, reflecting improved loan impairment charges. Following our agreement with the US authorities and the FSA in December 2012, we are adopting global standards as part of our effort to raise our practices to an industry-leading level. This is part of our wholehearted commitment to protect the integrity of the organisation and the financial system, and to do our part to fight financial crime.
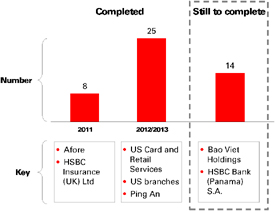
We further simplified the Group structure in 2012, bringing the total number of announced disposals and closures of non-strategic businesses or non-core investments to 47 since the beginning of 2011, including 4 in 2013.
During 2012, we completed the disposal of the Card and Retail Services business and the upstate New York branches in the United States, and the sale or closure of our retail businesses in Thailand, Honduras, El Salvador and Costa Rica, as well as the full service retail brokerage businesses in Canada. Additionally we announced the sale of our operations in Colombia, Peru, Uruguay and Paraguay.
Following completion of all the announced transactions we will have completed the refocus of Retail Banking and Wealth Management (‘RBWM’) to 20 of our 22 home and priority markets, which represented 98% of the RBWM, excluding US CRS and the US run-off portfolio, profit before tax in 2012, plus a limited number of important network and smaller markets.
Notably, on top of the above, we reached agreement in December 2012 to sell our stake in Ping An for an aggregate cash consideration, the equivalent of US$9.4bn. This transaction completed in two tranches, in December 2012 and February 2013, generating a profit of US$3.0bn. In 2012 our share of Ping An’s earnings was US$0.8bn.
8
Table of Contents
HSBC HOLDINGS PLC
Report of the Directors: Overview(continued)
We also made progress in eliminating unnecessary organisational layers and streamlining various processes, achieving an additional US$2.0bn in sustainable cost savings. This takes our total annualised savings to US$3.6bn, surpassing our cumulative target of US$2.5bn to US$3.5bn of sustainable savings since 2011. Taken together, these changes have made HSBC much easier to manage and control.
Although we made some good progress in 2012, the cost efficiency ratio at 62.8% and ROE at 8.4% were outside our target ranges. These were both affected by UK customer redress provisions, as well as payments we were required to make as part of the settlement of the investigations noted above.
Implementing our strategy can add significant value to HSBC. We are on the right track and remain fully committed to achieving our ambition of being the world’s leading international bank.
We are investing to build this distinctive international competitive position.
In Retail Banking and Wealth Management, we accelerated the transformation of the Wealth Management business in HSBC with infrastructure investment to improve customer experience and so drive growth. Technology solutions improved the customer offering in foreign exchange services and we introduced enhanced risk profiling and strategic financial planning tools.
In Commercial Banking we maintained our investment in the faster-growing regions in support of the strong network that helps connect customers with both developed and developing markets as they expand internationally. A great deal of attention is being devoted to the increasing internationalisation of the renminbi. During 2012, we were the first bank to settle cross-border renminbi trade across six continents with capabilities in over 50 countries, offering a competitive advantage to our customers as the renminbi positions to be a major global trade and investment currency. We have expanded our global network of dedicated China desks to cover our top markets, representing about half of the world’s GDP. These are staffed by Mandarin-speaking experts who support mainland Chinese businesses to identify new opportunities to expand overseas.
In Global Banking and Markets, we invested in selective recruitment to support key strategic markets. We continued the successful build-out of our equities and e-FX platforms to broaden our product offerings. In Hong Kong we led the market in Hong Kong dollar bond issuance and were the leading bookrunner for high yield bonds in Asia,
excluding Japan. We now also rank in the top five of equities brokers in Hong Kong. We reinforced our leading position in the renminbi market in 2012, supporting a number of significant client transactions and, as an entity, issuing the first international renminbi bond outside Chinese sovereign territory. Reflecting our capabilities in Latin America, the Middle East and Asia-Pacific, HSBC was recognised as the ‘Best Global Emerging Markets Debt House’ at the 2012EuromoneyAwards for Excellence and was also recognised as ‘RMB House of the Year’ at the 2012 Asia Risk Awards.
I would like to thank all of our employees for their dedication and endurance throughout a difficult year for the bank. They have shown a real sense of passion, pride and duty in the face of critical and often deeply embarrassing media headlines and I too am very grateful for their efforts.
Group performance headlines
| • | Reported profit before tax was US$20.6bn, US$1.2bn lower than in 2011, including US$5.2bn of adverse movements in the fair value of our own debt attributable to credit spreads compared with favourable movements of US$3.9bn in 2011. This variance of US$9.1bn was partially offset by an increase of US$7.5bn in respect of gains from the disposal of businesses, notably from the sale of the US Card and Retail Services business and the agreement to sell our stake in Ping An. |
| • | Underlying profit before tax was US$16.4bn, up US$2.5bn, mainly due to higher revenues and lower loan impairment charges and other credit risk provisions. These factors were partially offset by an increase in operating expenses, primarily reflecting the settlement of the investigations into past inadequate compliance with anti-money laundering and sanction laws and increased provisions for UK customer redress programmes. |
| • | Underlying revenues rose by 7%, led by Global Banking and Markets where the majority of our businesses grew, notably Credit and Rates in Europe, as spreads tightened and investor sentiment improved following stimuli by central banks globally. Commercial Banking also recorded revenue growth as customer loans and advances increased in all regions, with over half of this growth coming from our faster-growing regions of Hong Kong, Rest of Asia-Pacific and Latin America, driven by higher trade-related lending. Customer deposits also rose as we continued to attract deposits through Payments |
9
Table of Contents
HSBC HOLDINGS PLC
Report of the Directors: Overview(continued)
and Cash Management products. In addition, Retail Banking and Wealth Management experienced revenue growth across all faster-growing regions, in particular Hong Kong and Latin America. These factors were partially offset by lower revenue in Global Private Banking, as we focused on repositioning our business model and target client base. |
| • | We achieved growth in reported loans and advances to customers of more than US$57bn during the year, notably in residential mortgages and term and trade-related lending. Customer deposits increased by over US$86bn, allowing us to maintain a strong ratio of customer advances to customer accounts of 74.4%. |
| • | Underlying costs were US$4.3bn higher than in 2011 including payments of US$1.9bn made as part of the settlement of the investigations into past inadequate compliance with anti-money laundering and sanctions laws, additional provisions in respect of UK customer redress programmes of US$1.4bn, and a credit in 2011 of US$0.6bn relating to defined benefit pension obligations in the UK which did not recur. Operating expenses also increased due to inflationary pressures, for example, on wages and salaries, in certain of our Latin American and Asian markets. Other increases arose from investment in strategic initiatives including certain business expansion projects, enhanced processes and technology capabilities, and increased investment in regulatory and compliance infrastructure primarily in the US. |
| • | The reported cost efficiency ratio deteriorated from 57.5% to 62.8% and from 63.4% to 66.0% on an underlying basis, as a result of higher notable cost items, as described above. |
| • | Return on equity was 8.4%, down from 10.9% in 2011, primarily reflecting the adverse movement in fair value of own debt attributable to movements in credit spreads, a higher tax charge and higher average shareholders’ equity. Similarly, the Group’s pre-tax return on average risk-weighted assets (‘RoRWA’) for 2012 was 1.8% or 1.5% on an underlying basis. Adjusting for the negative returns on US consumer finance business and legacy credit in Global Banking and Markets, the remainder of the Group achieved a RoRWA of 1.9% in 2012 and 2.1% in 2011. |
| • | The core tier 1 ratio increased during the year from 10.1% at the end of 2011 to 12.3%. This |
increase was driven by capital generation and a reduction in risk-weighted assets following business disposals.
| • | The Basel III capital rules began their staged 6-10 year implementation in some parts of the world in January 2013. Nevertheless, the FSA has set our 2013 capital target calculation on a Basel III end point basis. This effectively accelerates our implementation of Basel III by several years relative to European regulations and other global banks. Consistent with this, we now operate to an internal capital target set on a Basel III end point basis of 9.5%-10.5%. |
| • | Profit attributable to ordinary shareholders was US$13.5bn, of which US$8.3bn was declared in dividends in respect of the year. This compared with US$2.9bn of variable pay awarded (net of tax) to our employees for 2012. |
| • | Dividends per ordinary share declared in respect of 2012 were US$0.45, an increase of 10% compared with 2011, with a fourth interim dividend for 2012 of US$0.18 per ordinary share. |
Global standards
As a global organisation which trades on its international connectivity, we recognise that we have a responsibility to play a part in protecting the integrity of the financial system. In order to do this effectively, in April 2012 we committed to implementing industry-leading controls to increase our ability to combat financial crime.
The highest compliance standards are being adopted and enforced across HSBC and our Compliance function has already been strengthened considerably. More than 3,500 people are now employed globally to work on compliance and the cost of the Compliance function has approximately doubled since 2010 to more than US$500m. We have created and recruited externally for two new Compliance leadership roles – Global Head of Regulatory Compliance and Head of Group Financial Crime Compliance – and appointed a number of senior staff with extensive experience of handling relevant international legal and financial issues. A review of ‘Know Your Customer’ files is under way across the entire Group and an enhanced global sanctions policy has been devised to ensure that we do not do business with key illicit actors anywhere, in any currency. In addition, we have moved to protect HSBC from the risks inherent in bearer shares by curtailing the ability of clients using bearer share companies to open accounts or transact with HSBC.
10
Table of Contents
HSBC HOLDINGS PLC
Report of the Directors: Overview(continued)
We have also introduced a new filter, against which all existing and prospective clients and businesses are screened. This sixth filter focuses on financial crime risk. It means that where we cannot practically or economically apply the global standards to which we are committed we will stop writing business altogether or significantly restrict our activities. This policy is consistent with our commitments to adopt global standards, to simplify our business and operations, and to de-risk our business activities.
Implementing these standards will be a critical component of our work in 2013.
Outlook
Whilst the operating environment for financial institutions remains difficult, our core business will continue to reap the benefit of recovering economic growth in mainland China and its positive impact on other faster-growing regions. We expect the developing economies, led by mainland China, to continue to grow briskly at 5.4%, while developed economies should see more gradual growth of 1.0%. We forecast growth of 8.6% in mainland China in 2013.
The US economy should continue its gradual recovery, with continuing quantitative easing measures supporting a recovery in the housing market, although the recovery is still not strong enough to support a sustained reduction in
unemployment. We expect higher growth in Latin America in 2013, due in part to a modest recovery in Brazil. The biggest risk to the world economy remains an uncharted shock from Europe and an exacerbation of the sovereign debt crisis. We remain cautious on the outlook for Europe due to weak demand, slow growth, and political and regulatory uncertainty.
Finally, I am pleased to report that the business had a good start to the year. Our results in 2013 will include a dilution gain of US$1.2bn on our investment in Industrial Bank, following its issue of additional share capital to third parties on 7 January. There was also a US$0.6bn net gain on the completion of the sale of our shares in Ping An, which offsets the adverse fair value movement on the forward contract included within our 2012 results. On 19 February 2013 we announced the sale of our operations in Panama for US$2.1bn.

S T Gulliver,Group Chief Executive
4 March 2013
11
Table of Contents
HSBC HOLDINGS PLC
Report of the Directors: Overview(continued)
HSBC strives to maintain the highest standards of disclosure in our reporting
It has long been our policy to provide disclosures that help investors and other stakeholders understand the Group’s performance, financial position and changes thereto. In accordance with this policy, the information provided in the ‘Notes on the Financial Statements’ and the ‘Report of the Directors’ goes beyond the minimum levels required by accounting standards, statutory and regulatory requirements and listing rules. For this reason, we wholeheartedly supported the work of the Enhanced Disclosure Task Force (‘EDTF’) in 2012.
Enhanced Disclosure Task Force
Following increased demands for enhanced risk disclosures, the Financial Stability Board established the EDTF in May 2012 with the goal of developing principles for enhancing risk disclosures by major banks, recommending disclosure improvements and identifying existing leading practice disclosures by global financial institutions, starting with December
2012 risk disclosures and continuing into 2013 and beyond.
The task force brought together senior officials and experts from financial institutions, investors and audit firms from around the world and, on 29 October 2012, the EDTF issued its report, ‘Enhancing the Risk Disclosures of Banks’.
Our approach
HSBC’sAnnual Report and Accounts 2011 contained disclosures consistent with a majority of the report’s recommendations, including some disclosures referenced in the report as ‘leading practice’. We have implemented the recommendations of the report in 2012 and will further enhance our risk disclosures in 2013.
Guide to the implementation of EDTF recommendations in this Report
Our response to selected EDTF disclosure recommendations of particular significance may be found on the following pages, and in HSBC’sPillar 3 Disclosures 2012report:
| Type of risk | Disclosure | Page | ||
General | • Risks to which the business is exposed, risk appetite and stress testing. | 124 to 128 | ||
• Top and emerging risks. | 130 to 136 | |||
Risk Governance and risk management strategies/ business models |
• Group Risk Committee. • Diagram of risk exposures by global business. | 323 to 328 20 | ||
Capital adequacy and risk-weighted assets | • Reconciliation of the accounting balance sheet to the regulatory balance sheet.
• Regulatory capital flow statement.
| 287
285 | ||
• Analysis of credit risk by Basel asset class. | Pillar 3 | |||
Disclosures 2012 23 to 28 and 32 to 38 | ||||
• Risk-weighted assets flow statements for each risk-weighted asset type. | 282 and 284 | |||
Liquidity | • Liquid asset buffer. | 206 to 207 | ||
Funding | • Encumbrance. | 211 to 214 | ||
• Maturity analysis by balance sheet line. | 485 to 492 | |||
• Sources of funding and funding strategy. | 209 to 211 | |||
Market risk | • Relationship between the market risk measures for trading and non-trading portfolios and balance sheet classification. | 218 to 219 | ||
Credit risk | • Policies for impaired loans and reconciliation of movement in impaired loans.
• Loan forbearance policies. | 162 and 254 to 259 257 | ||
• Credit risk mitigation and collateral. | 163 to 168 | |||
Other risks | • Quantified measures on the management of operational risk. | 227 to 230 | ||
For a detailed list of all disclosure enhancements prepared in response to the recommendations of the EDTF, along with their locations, see page 119.
12
Table of Contents
HSBC HOLDINGS PLC
Report of the Directors: Overview(continued)
HSBC’s vision
For footnote, see page 120.
Our purpose is to enable businesses to thrive and economies to prosper, helping people fulfil their hopes and realise their ambitions.
HSBC is one of the largest banking and financial services organisations in the world, with a market capitalisation of US$194bn at 31 December 2012. We are headquartered in London.
Our products and services are delivered to clients through four global businesses, Retail Banking and Wealth Management (‘RBWM’), Commercial Banking (‘CMB’), Global Banking and Markets (‘GB&M’) and Global Private Banking (‘GPB’).
We operate through long-established businesses and have an international network of some 6,600 offices in 81 countries and territories in six geographical regions; Europe, Hong Kong, Rest of Asia-Pacific, Middle East and North Africa (‘MENA’), North America and Latin America.
Taken together, our five largest customers do not account for more than 1% of our income. We have contractual and other arrangements with numerous third parties in support of our business activities. None of the arrangements is individually considered to be essential to the business of the Group.
Continuing the Group-wide review of our businesses, 26 disposals or closures of non-strategic and non core investments were announced in 2012 and a further four in 2013, taking the total to 47 since 2011. The most significant of these transactions which were completed in 2012 were the sale of the US Card and Retail Services business and
the upstate New York branches for a total gain of US$4.0bn. In December 2012, we announced an agreement to sell our entire shareholding in Ping An Insurance (Group) Company of China, Limited (‘Ping An’), the sale of which was completed on 6 February 2013, generating a gain of US$3.0bn. For further information on all disposals, see page 27.
In 2012, we merged our operations in Oman with those of the Oman International Bank S.A.O.G. (‘OIB’) and acquired the onshore retail and commercial banking businesses of Lloyds Banking Group in the United Arab Emirates (see page 470).
Embedding global standards across HSBC in a consistent manner is a top priority and will shape the way we do business.
The role of HSBC Values in daily operating practice is fundamental to our culture in the context of the financial services sector and the wider economy.
This is particularly so in the light of developments and changes in regulatory policy, investor confidence and society’s view of the role of banks. We expect our executives and employees to act with courageous integrity in the execution of their duties by being:
| • | dependable and doing the right thing; |
| • | open to different ideas and cultures; and |
| • | connected with our customers, communities, regulators and each other. |
We continue to enhance our values-led culture by embedding HSBC Values into how we conduct our business and in the selection, assessment, recognition and training provided to staff.
13
Table of Contents
HSBC HOLDINGS PLC
Report of the Directors: Overview(continued)
Ensuring our conduct matches our values
In line with our ambition to be recognised as the world’s leading international bank, we aspire to lead the industry in our standards of conduct. As international markets become more interconnected and complex and, as threats to the global financial system grow, we are strengthening further the policies and practices which govern how we do business and with whom.
Like any business, we greatly value our reputation. HSBC’s success over the years is due in no small part to our reputation for trustworthiness and integrity. In April 2012, as part of this effort, we committed to adopting and enforcing the highest compliance standards across HSBC. Doing so will help us to achieve three key objectives:
| • | strengthen our capabilities to combat the ongoing threat of financial crime; |
| • | make consistent – and therefore simplify – how we monitor and enforce high standards at HSBC; and |
| • | ensure that we consistently apply our values so as to serve positively the customers and societies who entrust their financial needs to HSBC. |
Under the supervision of HSBC’s Global Standards Steering Committee, co-chaired by our Group Chief Risk Officer and our Chief Legal Officer, who report to the Group Chief Executive, we are already strengthening policies and processes in a number of important areas, described on the right.
We are also reinforcing the status of compliance and standards as an important element of how we assess and reward senior executives, and rolling out communication, training and assurance programmes to ensure that our staff understand and meet their responsibilities.
We have adopted the UK Code of Practice for the Taxation of Banks and seeks to apply the spirit as well as the letter of the law in all the territories in which it operates. We deal with tax authorities in an open and honest manner. We are strengthening our policies and controls with the objective of ensuring our services are not used by clients seeking to evade their tax obligations.
A new committee of the HSBC Holdings Board, the Financial System Vulnerabilities Committee, will provide governance, oversight and policy guidance over the framework of controls and procedures designed to identify areas where HSBC may become exposed and through that exposure, expose the financial system more broadly to financial crime or system abuse.
Global standards execution framework – priority areas
Financial crime filter
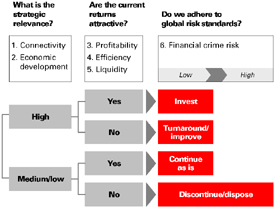
Under the Group’s strategy described on page 17, we analyse different markets against five financial filters to help us determine where to do business and the type of business we can do in line with our values and financial return objectives. In 2012, we added a sixth filter under which we also analyse all new and existing business to limit activity and client acquisition in jurisdictions with a high risk of financial crime.
Tax transparency
We are strengthening our policies and controls with the objective of ensuring that HSBC’s services are not used by clients seeking to evade their tax obligations.
Sanctions
We have expanded our application of financial sanctions to ensure that the most demanding standards are enforced for all currencies and in all jurisdictions. Through application of these standards, we screen clients and all cross-border payments to prevent the use of HSBC’s banking services for the benefit of blacklisted countries, companies and individuals.
Information sharing
We are extending the sharing of key compliance information between different parts of HSBC, to the extent permitted by law, for the purpose of managing our exposure to financial crime.
Customer due diligence
We are applying a globally consistent approach to the knowledge needed to accept or retain a customer relationship. When any customer or potential customer is considered an unacceptable reputational risk – or otherwise does not meet our standards – that determination will be applied globally.
Affiliates’ due diligence
We are building a single central repository holding all required due diligence information on each of our affiliates in order to facilitate seamlessly cross-border transactions on behalf of our clients.
Bearer shares
Shares not registered to any owner, but beneficially owned by the person who has physical possession of the share certificates, carry inherent risks relating to money laundering and tax evasion. We have set out minimum, highly restrictive standards, applicable in all markets, for dealing with customers who utilise bearer shares.
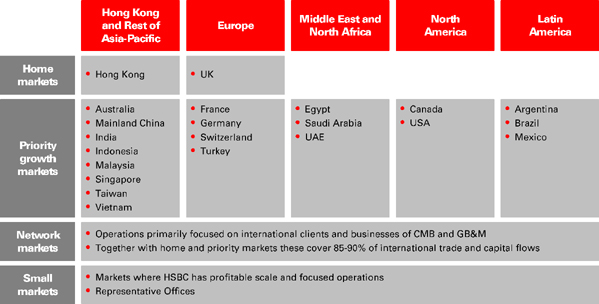
Our business model is based on an international network connecting faster-growing and developed markets.
Our businesses are organised to serve a cohesive portfolio of markets, as tabulated below.
Business model
We take deposits from our customers and use these funds to make loans, either directly or through the capital markets. Our direct lending includes residential and commercial mortgages and overdrafts, and term loan facilities. We finance importers and exporters engaged in international trade and provide
14
Table of Contents
HSBC HOLDINGS PLC
Report of the Directors: Overview(continued)
advances to companies secured on amounts owed to them by their customers. In addition, we offer a wide variety of products and financial services including broking, asset management, financial advisory, life insurance manufacturing, corporate finance, markets, securities services and alternative investments. We provide these products for clients ranging from governments to large and mid-market corporates, small and medium-sized enterprises (‘SME’s), high net worth individuals and retail customers.
Our operating income is primarily derived from:
| • | net interest income – interest income we earn on customer loans and advances and on our surplus funds, less interest expense we pay on interest-bearing customer accounts and debt securities in issue; |
| • | net fee income – fee income we earn from the provision of financial services and products to customers; and |
| • | net trading income – income from trading activities primarily conducted in Global Markets, including Foreign Exchange, Credit, Rates and Equities trading. |
At our Investor Day in May 2012, we outlined our geographical priorities where we expect future growth opportunities to be concentrated. We have defined the UK and Hong Kong as our home markets, and a further 20 countries as priority growth markets. These 22 markets accounted for over 90% of our profit before tax in 2012, and will be the primary focus of capital deployment. Network markets are markets with strong international relevance which serve to complement our international network, operating mainly through CMB and GB&M. Our combination of home, priority growth and network markets covers around 85-90% of all international trade and financial flows.
The final category, small markets, includes those where our operations are of sufficient scale to operate profitably, or markets where we maintain representative offices. This structure is illustrated below.
HSBC’s market structure
Operating model
HSBC has a matrix management structure which includes global businesses, geographical regions and global functions. Global businesses are responsible for setting globally consistent business strategies and operating models. Geographical regions execute business strategies set by the global businesses. Global functions, including HSBC Technology and Services, support and facilitate the execution of the strategy.
Holding company
HSBC Holdings plc, the holding company of the Group, is listed in London, Hong Kong, New York, Paris and Bermuda. HSBC Holdings is the primary provider of equity capital to its subsidiaries and provides non-equity capital to them when necessary.
Under authority delegated by the Board of HSBC Holdings, the Group Management Board (‘GMB’) is responsible for management and day-to-
15
Table of Contents
HSBC HOLDINGS PLC
Report of the Directors: Overview(continued)
day running of the Group, within the risk appetite set by the Board. The Board, through the GMB, works to ensure that there are sufficient cash resources to pay dividends to shareholders, interest to bondholders, expenses and taxes.
HSBC Holdings does not provide core funding to any subsidiary, nor is a lender of last resort and does not carry out any banking business in its own right. HSBC has a legal entity-based Group structure, with subsidiaries operating under their own boards of directors as separately capitalised, ring-fenced entities, implementing Group strategy and delivering Group products and services, in most cases in the country or territory in which they are domiciled.
Global businesses
Our four global businesses are responsible for developing, implementing and managing their business propositions consistently across the Group, focusing on profitability and efficiency. They set their strategies within the confines of the Group strategy in liaison with the geographical regions, are responsible for issuing planning guidance regarding their businesses, are accountable for their profit and loss performance, and manage their headcount.
The main business activities of our global businesses are summarised below. Further details are provided on page 60.
Main business activities by global business
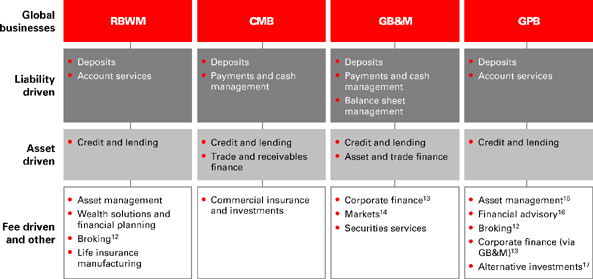
For footnotes, see page 120.
Geographical regions
The geographical regions share responsibility for executing the strategies set by the global businesses. They represent the Group to clients, regulators, employee groups and other stakeholders; allocate capital; manage risk appetite, liquidity and funding by legal entity; and are accountable for profit and loss performance in line with global business plans.
Within the geographical regions, the Group is structured as a network of regional banks and locally incorporated regulated banking entities. Each bank is separately capitalised in accordance with applicable prudential requirements and is required to consider its risk and maintain a capital buffer consistent with the Group’s risk appetite for the relevant country or region. The banking entities manage their own funding and liquidity within parameters set centrally.
Global functions
Our global functions are Communications, Company Secretaries, Corporate Sustainability, Finance, Human Resources, Internal Audit, Legal, Risk (including Compliance), Strategy and Planning, Marketing, and HSBC Technology and Services, our global service delivery organisation. The global functions establish and manage all policies, processes and delivery platforms relevant to their activities, are fully accountable for their costs globally and are responsible for managing their headcount.
16
Table of Contents
HSBC HOLDINGS PLC
Report of the Directors: Overview(continued)
Our strategic objective is to become the world’s leading international bank.
Our strategic direction is aligned to two long-term trends:
| • | International trade and capital flows –the world economy is becoming ever more connected. Growth in world trade and cross-border capital flows continues to outstrip growth in average gross domestic product. Financial flows between countries and regions are highly concentrated, and over the next decade we expect 35 markets to generate 90% of world trade growth with a similar degree of concentration in cross-border capital flows. |
| • | Economic developmentand wealth creation – we expect economies currently deemed ‘emerging’ to have increased five-fold in size by 2050, benefiting from demographics and urbanisation, by which time they will be larger than the developed world. By then, we expect 19 of the 30 largest economies will be markets that are currently described as emerging. |
HSBC is one of the few truly international banks and our advantages lie in the extent to which our network corresponds with markets relevant to international financial flows, our access and exposure to high growth markets and businesses, and our strong balance sheet, which helps to generate a resilient stream of earnings.
Based on these long-term trends and our competitive position, our strategy has two parts:
| • | Network of businesses connecting the world – HSBC is well positioned to capture the growing international financial flows. Our global reach and range of services put us in a strong position to serve corporate clients as they grow from small enterprises into large and international corporates. Our access to local retail funding and our suite of international products allows us to offer distinctive solutions for these clients profitably. We will focus on ‘South-South’ trade, connecting faster-growing economies with each other. |
| • | Wealth management and retail with local scale – social mobility and wealth creation in the faster-growing markets in which we are positioned will generate demand for financial services which we will meet through our Wealth Management and GPB businesses. We will only invest in retail businesses in markets where we can achieve critical mass. |
To implement this strategy we have set priorities across three areas to simplify, restructure and grow the Group, as described below.
Simplifying HSBC
We will continue to make HSBC easier to manage and control. This includes (i) running off legacy assets in the US and in GB&M, (ii) addressing fragmentation in our business portfolio through our six filters disposing of non-strategic businesses, and (iii) improving organisational efficiency.
In 2012, we added a sixth filter to the existing five strategic evaluation criteria used to assess our business (international connectivity, economic development, profitability, cost efficiency and liquidity). The sixth filter requires compliance with our global standards on financial crime and involves the assessment of existing and new client relationships and activities against those standards.
Run-off portfolios
Run-off portfolios comprise Consumer and Mortgage Lending portfolios and certain related treasury services in the US and, in GB&M, a legacy credit business. The latter comprises a separately identifiable, discretely managed business comprising Solitaire Funding Limited (‘Solitaire’), securities investment conduits, asset-backed securities, trading portfolios and credit correlation portfolios, derivative transactions entered into with monoline insurers and certain structured credit transactions.
We continue to run off US legacy consumer assets and are actively analysing opportunities to reduce risk and improve returns.
Run-off of portfolio receivables in the US
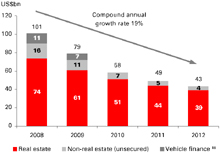
For footnote, see page 120.
We have identified segments of the real estate portfolio in the US that represent a high risk and/or a high operational burden or may be sold on a capital
17
Table of Contents
HSBC HOLDINGS PLC
Report of the Directors: Overview(continued)
accretive basis. We have also identified the non-real estate portfolio for sale to reduce operational risk.
In GB&M, decisions to hold or sell legacy assets depend on whether the net present value of future cash flows from the assets (e.g. the terminal value net of funding and operational costs and the cost of capital) exceed the total of the expected loss on sale and the costs of the transaction.
Addressing fragmentation
Fragmentation of the business is being addressed using the six filters to guide strategic actions.
Using the six filters in decision-making
Since 2011 we have announced and completed a significant number of disposals:
Announced transactions19
For footnote, see page 120.
Improving organisational efficiency
We continued to make headway with the Four Programmes that we launched in May 2011 designed to simplify HSBC and make the Group easier to manage and control. The Four Programmes are
| (i) | implementing consistent business models; |
| (ii) | re-engineering global functions; |
| (iii) | re-engineering operational processes; and |
| (iv) | streamlining IT. |
Our approach to organisation, talent and values
Restructuring HSBC
We will restructure certain businesses to adapt to the new environment, including GB&M, our US franchise and GPB.
Global Banking and Markets
Product profitability for the industry as a whole is declining with client activity relatively subdued and regulatory changes reducing available capital and liquidity while, at the same time, posing significant challenges to some traditional business models. Overall, there is downward pressure on returns on capital.
GB&M is well positioned for the new business environment, with its deep and diversified client base, network of markets covering the majority of global financial flows, global product capabilities and diversified funding base.
GB&M is actively managing its legacy credit exposures. In 2012, risk-weighted assets (‘RWA’s) decreased mainly because of downgrades to positions which resulted in a change from being risk-weighted to being deducted from capital. A clear economic framework has been put in place for decision-making over when and how to dispose of legacy investments.
With regard to its ongoing business activities, GB&M manages its RWAs comprehensively and pro-actively, which helps mitigate RWA growth arising from regulatory and model changes.
Our US businesses
Our US operations are being reshaped to focus on core activities, with the sale of the US Card and Retail Services business and the upstate New York
18
Table of Contents
HSBC HOLDINGS PLC
Report of the Directors: Overview(continued)
branches and the repositioning of our activities towards international businesses.
| • | CMB is now focused on five hubs contributing over 50% of US corporate imports and exports, including the West Coast Southeast and Midwest. |
| • | Global Banking serves top-tier multinationals and Global Markets (New York) provides a hub for international clients across America and globally, providing US dollar funding. |
| • | RBWM and GPB target internationally mobile clients in large metropolitan centres on the West and East coasts. |
Global Private Banking
The private banking industry faces challenges from stricter regulatory requirements, particularly to its international banking model, and increasing competition to capture new wealth inflows. To meet these challenges and better serve the needs of our clients, GPB is repositioning its business to focus on priority markets and improve its operational standards in the following ways:
| • | operational risk and compliance – GPB will adhere to the highest standards in the industry, and will continue to strengthen its compliance and risk framework, focusing on global standards and tax transparency; |
| • | integrated operating model– GPB has implemented a new global operating model that will provide better integration and coordination between geographical regions, and it will complete the roll-out of improved data security and compliance governance, systems and processes; |
| • | integration with the Group – GPB will intensify collaboration with CMB to access wealth created by entrepreneurs who already bank with HSBC on the business side. GPB will also contribute to a seamless Group wealth proposition for personal customers; and |
| • | capturing growth – GPB will focus investment on the most attractive developed and faster-growing wealth markets where it can build access to well established client franchises and strong local and international product capabilities. |
Growing HSBC
We continue to position HSBC for growth. We also continue to benefit from the closer coordination and collaboration among our four global businesses to
capture significant revenue opportunities utilising, in particular, CMB’s potential for increasing referrals and cross-selling with GB&M and GPB.
Faster-growing regions20 as a share of Group data
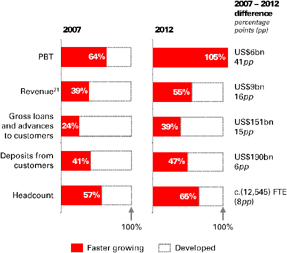
For footnotes, see page 120.
We will actively deploy capital in our home and priority growth markets (see ‘HSBC’s market structure’ on page 15), access faster-growing markets and all major trade corridors and capture growth opportunities in trade finance as competitors deleverage.
Our aim in executing our strategy is to be regarded as the world’s leading international bank. We have defined financial targets to achieve a return on equity of between 12% and 15% with a core tier 1 ratio of between 9.5% and 10.5%, and achieve a cost efficiency ratio of between 48% and 52%. We have also defined Key Performance Indicators to monitor the outcomes of actions across the three areas of capital deployment, cost efficiency and growth (see page 22).
As a provider of banking and financial services, risk is at the core of our day-to-day activities.
The chart below is designed to provide a high level guide to how HSBC’s business activities are reflected in our risk measures and in our balance sheet.
The third party assets and liabilities shown provide a guide to the proportion of the Group’s balance sheet which is contributed by each of them. In addition, we have used the regulatory RWAs to illustrate the relative size of the risks each of them incur.
19
Table of Contents
HSBC HOLDINGS PLC
Report of the Directors: Overview(continued)
Exposure to risks arising from the business activities of global businesses
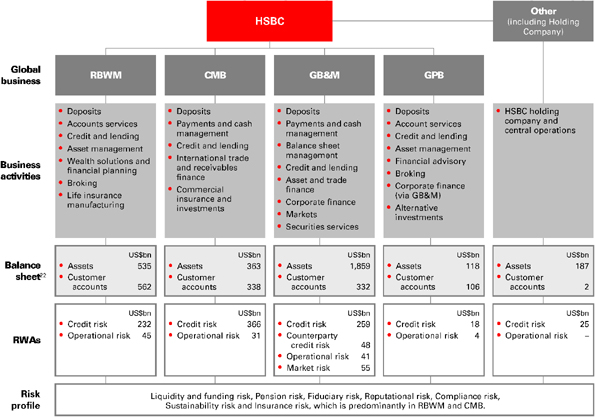
For footnote, see page 120.
In carrying out its business activities, HSBC incurs a range of risks, some of which are measured and managed via capital, some by other mechanisms. For the former, we use both regulatory and economic capital. Currently, the Group’s risk appetite is most affected by the regulatory capital dimension as it exceeds economic capital. The table above shows the Pillar 1 regulatory capital demand for those risks and is represented by RWAs. Under this regulatory capital framework, the capital invested in our Insurance business is deducted from regulatory capital; as at 31 December 2012, the capital invested in our Insurance business was US$10.1bn. HSBC is also exposed to other risks as shown in the table above. The regulatory capital required against these other risks is covered within the total capital that HSBC holds.
We have identified a comprehensive suite of risk factors which encompasses the broad range of risks we are exposed to, but may not necessarily be deemed as top or emerging risks. The risk factors inform our ongoing assessment of our top and emerging risks. This assessment may result in our risk appetite being revised.
Risk factors
Our businesses are exposed to a variety of risk factors that could potentially affect the results of our operations or financial condition. These are:
Macroeconomic and geopolitical risk
| • | Current economic and market conditions may adversely affect our results. |
| • | We have exposure to the ongoing economic crisis in the eurozone. |
| • | We are subject to political and economic risks in the countries in which we operate, including the risk of government intervention. |
| • | Changes in foreign currency exchange rates may affect our results. |
Macro-prudential, regulatory and legal risks to our business model
| • | Failure to comply with certain regulatory requirements would have an adverse material effect on our results and operations. |
| • | We are subject to a number of legal and regulatory actions and investigations, the outcomes of which are inherently difficult to |
20
Table of Contents
HSBC HOLDINGS PLC
Report of the Directors: Overview(continued)
predict, but unfavourable outcomes could have a material adverse effect on our operating results and brand. |
| • | Unfavourable legislative or regulatory developments, or changes in the policy of regulators or governments, could generate model risk and could have a significant adverse effect on our operations, financial condition and prospects. |
| • | The UK Government has proposed draft legislation for banking reforms based on the recommendations of the Independent Commission on Banking. Additional proposals are being considered in France, Germany and the EU and any resulting structural changes could have a material adverse effect on us. |
| • | We are subject to tax-related risks in the countries in which we operate which could have a material adverse effect on our operating results. |
Risks related to our business operations, governance and internal control systems including compliance
| • | Our risk management measures may not be successful. |
| • | Operational risks are inherent in our business. |
| • | Our operations are subject to the threat of fraudulent activity. |
| • | Our operations are subject to disruption from the external environment. |
| • | Our operations utilise third party suppliers. |
| • | Our operations are highly dependent on our information technology systems. |
| • | Our operations have inherent reputational risk. |
| • | We may suffer losses due to employee misconduct. |
| • | We rely on recruiting, retaining and developing appropriate senior management and skilled personnel. |
| • | Our financial statements are based in part on assumptions and estimates which, if inaccurate, could cause material misstatement of the results and financial position of the Group. |
| • | Third parties may use us as a conduit for illegal activities without our knowledge, which could have a material adverse effect on us. |
| • | We may not achieve all the expected benefits of our strategic initiatives. |
Risks related to our business
| • | We have significant exposure to counterparty risk within the financial sector and to other risk concentrations. |
| • | Market fluctuations may reduce our income or the value of our portfolios. |
| • | Liquidity, or ready access to funds, is essential to our businesses. |
| • | Any reduction in the credit rating assigned to HSBC Holdings, any subsidiaries of HSBC Holdings or any of their respective debt securities could increase the cost or decrease the availability of our funding and adversely affect our liquidity position and interest margins. |
| • | Risks concerning borrower credit quality are inherent in our businesses. |
| • | Our Insurance business is subject to risks relating to insurance claim rates and changes in insurance customer behaviour. |
| • | HSBC Holdings is a holding company and, as a result, is dependent on dividends from its subsidiaries to meet its obligations, including obligations with respect to its debt securities, and to provide profits for payment of future dividends to shareholders. |
| • | We may be required to make substantial contributions to our pension plans. |
21
Table of Contents
HSBC HOLDINGS PLC
Report of the Directors: Overview(continued)
Macroeconomic and geopolitical risk
Current economic and market conditions may adversely affect our results
Our earnings are affected by global and local economic and market conditions. Following the global financial crisis in 2007, a difficult economic climate remains with continued pressures on household and corporate finances. During 2012, world economic growth slowed in all regions and growth is expected to remain well below its long-term potential in 2013. Mature economies are deleveraging and implementing austerity and structural reforms that are restricting economic activity in the short term. In emerging markets, growth was affected by lower overseas demand and cautious official policies even where domestic demand remained positive. Core difficulties remain in Europe, the US and Japan as economic growth is expected to resume at a very slow pace. In the US, the first quarter of 2013 will remain challenging as issues surrounding the fiscal policy and debt ceiling will have to be resolved. In the eurozone and in Japan, the ageing population, the structure of labour markets and the cost of the social welfare models are major concerns which are difficult to tackle without aggravating the sovereign debt crisis. In addition, mainland China experienced a slowdown in economic growth in 2011 and in 2012 and faces uncertainty over its future growth.
In the face of such economic uncertainty, markets have been very volatile throughout 2012 and are expected to remain so at least during the first half of 2013. The adverse economic conditions continue to create a challenging operating environment for financial services companies such as HSBC. In particular, we may face the following challenges to our operations and operating model in connection with these factors:
| • | the demand for borrowing from creditworthy customers may diminish if economic activity slows or remains subdued; |
| • | as capital flows are increasingly disrupted, some emerging markets could be tempted to impose protectionist measures that could affect financial institutions and their clients; |
| • | European banks may come under renewed stress as a result of the interdependencies between economic conditions and the sovereign debt crisis in the eurozone; |
| • | geopolitical risks might grow in different regions of the world, affecting directly the economies of these countries and their economic policies. An immediate cause for concern is |
Egypt, where the political situation is leading to a shortage of liquidity in the banking system; |
| • | a prolonged period of modest interest rates will constrain, for example, through margin compression and low returns on assets, the net interest income we earn from investing our excess deposits; |
| • | our ability to borrow from other financial institutions or to engage in funding transactions may be adversely affected by market disruption, for example, in the event of contagion from stress in the eurozone sovereign and financial sectors; and |
| • | market developments may continue to depress consumer and business confidence beyond expectations. If growth in the UK or the US remains subdued, for example, asset prices and payment patterns may be adversely affected, leading to increases in delinquencies, default rates, write-offs and loan impairment charges beyond our expectations. |
The occurrence of any of these events or circumstances could have a material adverse effect on our business, our financial condition, our prospects, our customers and their operations and/or results of our operations.
We have exposure to the ongoing economic crisis in the eurozone
The risk of a split of the eurozone has been receding at the end of 2012, primarily as a result of the support given by the ECB and to the first steps taken to move towards fiscal union. This was however, obtained due in large part to the implementation of austerity measures in almost all countries in the eurozone and notably in the eurozone periphery. As a result, the region entered recession by mid-2012 and this recession is expected to continue during the first part of 2013. All European countries, including Germany and other Northern countries, are affected, by the lower demand and global deleveraging.
The risk of a vicious circle between economic recession and sovereign crisis throughout and beyond the eurozone remains significant. Although banks have reduced their exposure to sovereign debt issued by the weakest states, they are still vulnerable to a potential default or a significant widening of credit spreads. Although our direct exposure to peripheral eurozone economies is limited, we have substantial exposure to financial institutions and central banks in core European countries which may be affected by the ongoing crisis. For a further description of our exposures to selected eurozone
21a
Table of Contents
HSBC HOLDINGS PLC
Report of the Directors: Overview(continued)
countries, eurozone banks and other financial institutions and corporates see ‘Areas of special interest’ on page 128.
We are subject to political and economic risks in the countries in which we operate, including the risk of government intervention
We operate through an international network of subsidiaries and affiliates in 81 countries and territories around the world. Our results are, therefore, subject to the risk of loss from unfavourable political developments, currency fluctuations, social instability and changes in government policies on such matters as expropriation, authorisations, international ownership, interest-rate caps, limits on dividend flows and tax in the jurisdictions in which we operate. For example, in the Middle East, the ‘Arab Spring’ continues to create political instability across the region, while strategic risks to regional security and global oil prices arising from Iran’s nuclear programme are likely to intensify in 2013. In East Asia, tensions over a number of maritime sovereignty disputes involving mainland China have increased in 2012. Leadership changes in the region at the end of 2012, particularly in Japan and mainland China, may result in tensions rising in 2013 with a concomitantly higher risk of military escalation. A break-up of the eurozone or continued social unrest triggered by the ongoing economic crisis and related austerity programmes may result in political and social disruption throughout Europe.
Changes in foreign currency exchange rates may affect our results
We prepare our accounts in US dollars, but because a substantial portion of our assets, liabilities, assets under management, revenues and expenses are denominated in other currencies, changes in foreign exchange rates have an effect on our reported income, cash flows and shareholders’ equity and may have a material adverse effect on our business, prospects, financial condition and/or results of operations.
Macro-prudential, regulatory and legal risks to our business model
Failure to comply with certain regulatory requirements would have an adverse material effect on our results and operations.
In December 2012, HSBC reached agreement with US authorities in relation to investigations regarding inadequate compliance with anti-money laundering, the US Bank Secrecy Act and sanctions law. This
includes a DPA with the US Department of Justice (‘DoJ’). We also reached agreement to achieve a resolution with all other US government agencies that have investigated our past conduct related to these issues, and finalised an undertaking with the FSA to comply with certain forward-looking obligations with respect to anti-money laundering and sanctions requirements over a five-year term. Under these agreements, we made payments totalling US$1,921m to US authorities and take further action to strengthen our compliance policies and procedures. Over the five-year term of the agreement with the DoJ and the FSA, an independent monitor (who will, for FSA purposes, be a ‘skilled person’ under section 166 of the Financial Services and Markets Act (FSMA)) will evaluate and assess our progress in fully implementing these and other measures it recommends and will produce regular assessment of the effectiveness of our Compliance function.
Additionally and as reflected in the agreement entered into with the Office of the Comptroller of the Currency (‘OCC’) in December 2012 (the ‘GLBA Agreement’), the OCC has determined that HSBC Bank USA is not in compliance with the requirements set forth in 12 U.S.C. § 24a(a)(2)(c) and 12 C.F.R. § 5.39(g)(1), which provide that a national bank and each depository institution affiliate of the national bank must be both well capitalised and well managed in order to own or control a financial subsidiary. As a result, HSBC USA and its parent holding companies, including HSBC, no longer meet the qualification requirements for financial holding company status, and may not engage in any new types of financial activities without the prior approval of the Federal Reserve Board. In addition, HSBC Bank USA may not directly or indirectly acquire control of, or hold an interest in, any new financial subsidiary, nor commence a new activity in its existing financial subsidiary, unless it receives prior approval from the OCC. If all of our affiliate depositary institutions are not in compliance with these requirements within the time periods specified in the GLBA Agreement, as they may be extended, HSBC could be required either to divest HSBC Bank USA or to divest or terminate any financial activities conducted in reliance on the Gramm-Leach Bliley Act (‘GLB Act’). Similar consequences could result for subsidiaries of HSBC Bank USA that engage in financial activities in reliance on expanded powers provided for in the GLB Act. Any such divestiture or termination of activities would have a material adverse effect on our business, prospects, financial condition and results of operation.
21b
Table of Contents
HSBC HOLDINGS PLC
Report of the Directors: Overview(continued)
We are subject to a number of legal and regulatory actions and investigations, the outcomes of which are inherently difficult to predict, but unfavourable outcomes could have a material adverse effect on our operating results and brand
We face significant legal and regulatory risks in our business. The volume and amount of damages claimed in litigation, regulatory proceedings and other adversarial proceedings against financial institutions are increasing for many reasons, including a substantial increase in the number of regulatory changes taking place globally and higher expectations from regulators and the public.
Additionally, we continue to be subject to a number of material legal proceedings, regulatory actions and investigations as described in Note 43 on the Financial Statements. It is inherently difficult to predict the outcome of many of the legal, regulatory and other adversarial proceedings involving our businesses, particularly those cases in which the matters are brought on behalf of various classes of claimants, seek damages of unspecified or indeterminate amounts or involve novel legal claims. An unfavourable result in one or more of these proceedings could have a material adverse effect on our business, prospects, financial condition, reputation and/or results of operations.
Unfavourable legislative or regulatory developments, or changes in the policy of regulators or governments, could generate model risk and could have a material adverse effect on our operations, financial condition and prospects
Our businesses are subject to ongoing regulation and associated regulatory risks, including the effects of changes in the laws, regulations, policies, voluntary codes of practice and interpretations in the UK, the US, Hong Kong, the EU and the other markets where we operate. This is particularly so in the current environment, where we expect government and regulatory intervention in the banking sector to continue to increase for the foreseeable future. Since 2008, regulators and governments have focused on reforming both the prudential regulation of the financial services industry, to improve financial stability, and the ways in which business is conducted. Measures include enhanced capital, liquidity and funding requirements, the separation or prohibition of certain activities by banks, changes in the capital regime and the operation of capital markets activities, the introduction of tax levies and transaction taxes, changes in compensation practices and adjustments to how business is conducted. The US government, the UK government, our regulators in the UK, US, Hong Kong, the EU or elsewhere
may intervene further in relation to areas of industry risk already identified, or in new areas, which could adversely affect us.
Changes in laws, rules or regulations, or in their interpretation or enforcement, or in how new laws, rules or regulations are implemented may adversely affect our business, prospects, financial condition and/or results of operations. Further, uncertainty and lack of international regulatory coordination as enhanced supervisory standards are developed and implemented may adversely affect our ability to engage in effective business, capital and risk management planning.
More stringent regulatory requirements governing the development of parameters applied and controls around models used for measuring risk can give rise to changes, including increases in capital requirements.
We may fail to comply with all applicable regulations, particularly in areas where applicable regulations may be unclear or where regulators revise existing guidance or courts overturn previous rulings. Authorities in many jurisdictions have the power to bring administrative or judicial proceedings against us which could result in, among other things, the suspension or revocation of our licenses, cease and desist orders, fines, civil penalties, criminal penalties or other disciplinary action which could have a material adverse effect on our business, prospects, financial condition, reputation and/or results of operations and seriously harm our reputation.
Areas where changes could have an adverse effect include, but are not limited to:
| • | general changes in government, central bank or regulatory policy, or changes in regulatory regimes that may influence investor decisions in particular markets in which we operate; |
| • | proposed changes in and the implementation of regulations for derivatives and central counterparties, the UK ICB ring-fencing proposals, recovery and resolution plans, the Volcker Rule and the Foreign Account Tax Compliance Act (‘FATCA’), which may change the structure of those markets and the products offered or may increase the costs of doing business in those markets; |
| • | external bodies applying or interpreting standards or laws differently to us; |
| • | further requirements relating to financial reporting, corporate governance, conduct of business and employee compensation; and |
21c
Table of Contents
HSBC HOLDINGS PLC
Report of the Directors: Overview(continued)
| • | expropriation, nationalisation, confiscation of assets and changes in legislation or regulations relating to foreign ownership. |
The FSA supervises HSBC on a consolidated basis but the UK financial services regulatory structure is currently in the process of substantial reform. Legislation has been passed to abolish the FSA and establish three new regulatory bodies from 1 April 2013. These three bodies will comprise the Financial Policy Committee (‘FPC’), the Prudential Regulation Authority (‘PRA’) and the Financial Conduct Authority (‘FCA’). The FPC will not directly supervise firms, being responsible for macro-prudential regulation and considering systemic risk affecting economic and financial stability. The PRA and the FCA will inherit the majority of the FSA’s existing functions as the micro-prudential supervisors. Some subsidiaries such as HSBC Bank will be ‘dual-regulated’ firms, subject to prudential regulation by the PRA and to conduct regulation by the FCA. These reforms will endow the new regulatory bodies with additional powers. For example, under certain circumstances, the PRA and the FCA will be able to issue directions to unregulated qualifying parent undertakings such as HSBC Holdings plc. The FPC will have powers to give a direction to the FCA or the PRA, and it may make recommendations within the Bank of England to the Treasury, to the FCA or the PRA or to ‘other persons’. In addition, new European supervisory authorities, the EBA, the European Insurance and Occupational Pensions Authority (‘EIOPA’) and the European Securities and Markets Authority (‘ESMA’) are likely to exert greater influence on regulatory issues across the EU. These developments are expected to continue to change the way in which we are regulated and supervised.
The Basel Committee has approved significant changes to the regulation of banking institutions’ capital and liquidity, involving a substantial strengthening of the minimum requirements. Implementation at the national level remains ongoing.
HSBC has been classified by the Financial Stability Board (‘FSB’) as a Global Systemically Important Bank (‘G-SIB’) which will require the Group to meet higher capital standards at least 2.5% above the Basel III minimum core equity requirement of 7%, although the implications for capital management of our locally incorporated banks and branch operations are unclear. The rules for G-SIBS also provide a framework for more intensive supervision of these firms.
The ongoing implementation of Dodd-Frank and related final regulations in the US could result in additional costs or limit or restrict the way we conduct our business. Uncertainty remains about many of the details, impact and timing of these reforms and the effect they will ultimately have on HSBC. Within Dodd-Frank, the Volcker Rule is intended to prohibit deposit-taking banks from engaging in proprietary trading and investing in or sponsoring hedge funds or private equity funds. The Volcker rule came into force in July 2012 with a two-year conformance period ending in full implementation in July 2014. This could affect our various businesses widely, and geographically beyond North America, although the initial draft rules are being revised. In addition, in December 2012, the Federal Reserve Board issued draft proposals to apply enhanced supervisory standards to large foreign banking organisations such as HSBC. These are subject to comment and amendment and the possible effect on HSBC is unclear.
There are also a number of ongoing regulatory initiatives at the EU and at a national level in the UK in various stages of development which could result in additional costs or limit or restrict the way we conduct business. The UK and EU proposals on recovery and resolution could lead to changes in the structure of the Group and relationships between underlying legal entities. In addition, at an EU level, the initiatives include the EU’s implementation of the Basel III proposals (‘CRD IV’), the proposed Recovery and Resolution Directive (‘RRD’) and the implementation of The European Markets Infrastructure Regulation (‘EMIR’) and the revised Markets in Financial Instruments Directive (‘MiFID’). Although the target implementation date for the Basel III capital framework was 1 January 2013, CRD IV has not yet been finalised and increased capital requirements and changes to what is defined to constitute capital may constrain the Group’s planned activities and could increase costs and contribute to adverse impacts on the Group’s earnings. Additionally, during periods of market dislocation, increasing the Group’s capital resources in order to meet targets may prove more difficult or costly.
At a national level in the UK, other relevant regulatory initiatives include the FSA’s Retail Distribution and Mortgage Market Reviews and an ever greater focus on “conduct risk” including attention to sales processes and incentives, product and investment suitability and conduct of business concerns more generally. Uncertainty remains about the details and timing of some of these reforms and the effect they will ultimately have on HSBC.
21d
Table of Contents
HSBC HOLDINGS PLC
Report of the Directors: Overview(continued)
These measures are concerned principally, but not exclusively, with the conduct of business with retail customers and in conjunction with this focus, the UK regulators are making increasing use of existing and new powers of intervention and enforcement, including powers to consider past business undertaken and implement customer compensation and redress schemes or other, potentially significant remedial work. Additionally, the UK and other regulators may increasingly take actions in response to customer complaints either specific to an institution or more generally in relation to a particular product. We have seen recent examples of this approach in the context of the mis-selling of payment protection insurance and of interest rate derivative products to SME.
The UK and other regulators may identify future industry-wide mis-selling or other issues that could affect the Group. This may lead from time to time to: (i) significant direct costs or liabilities (including in relation to mis-selling); and (ii) changes in the practices of such businesses which benefit customers at a cost to shareholders. Further, decisions taken in the UK by the Financial Ombudsman Service in relation to customer complaints (or any overseas equivalent that has jurisdiction) could, if applied to a wider class or grouping of customers, have a material adverse effect on the business, operating results, financial condition and prospects of the Group.
The UK Government has proposed draft legislation for banking reforms based on the recommendations of the Independent Commission on Banking. Additional proposals are being considered in France and the EU and any resulting structural changes could have a material adverse effect on us
The UK Independent Commission on Banking (‘ICB’) published its final report in September 2011 and the UK Government expressed broad approval for the principle of establishing a ring-fenced bank and greater primary loss absorbing capacity. The ICB further recommends that the first £85,000 of an eligible person’s deposits in a bank are proposed to be made preferred debts, so that in the event of an insolvency they will rank ahead of other creditors.
The UK Government subsequently undertook consultation on the ICB proposals during 2012. In October 2012, draft primary legislation was presented to the UK’s Parliamentary Commission on Banking Standards for pre-legislative scrutiny and the UK Government is now considering whether its original proposal should be adjusted in the light of these deliberations. The draft legislation did not incorporate some of the details set out in the final
report from the ICB or adjustments arising from the subsequent consultations. These details will be reflected in secondary legislation and underlying rules from supervisory authorities. The UK Chancellor announced in February 2013 that if banks attempt to game or flout the rules establishing the ring-fence, they could be subject to full legal separation.
The UK Government has proposed a deadline of May 2015 (the end of the current session of Parliament) for the Banking Reform Bill and all relevant secondary legislation to be completed. The UK Government has also indicated that it will follow the ICB’s preferred deadline of 1 January 2019 for the implementation of the ring-fencing reforms and the introduction of depositor preference.
In respect of UK universal banks, including HSBC’s major UK banking subsidiary, HSBC Bank, the ICB has proposed a separation of the UK retail and wholesale banking operations through the creation of a ring-fenced retail bank. A requirement is that all deposits and overdrafts of UK personal customers and smaller companies and payments services would be provided by this ring-fenced bank, but it could also include banking services for larger customers. The UK Government also proposed that some simpler hedging activities could be undertaken within this bank.
In addition, the ICB proposed that large UK-headquartered groups (which would include HSBC) should have primary loss-absorbing capacity (‘PLAC’) equal to at least 17% of risk-weighted assets (‘RWA’s) calculated under Basel III. This capacity should be satisfied by the issuance of additional equity and/or debt that is loss-absorbing at the point of non-viability. The UK supervisor would retain the power to increase this minimum loss-absorbing capacity if it had concerns about the ability of the bank to restructure or liquidate at the point of failure.
The UK Government has indicated that if a large UK-headquartered group has non-UK subsidiaries which are demonstrably resolvable without an adverse effect on UK financial stability, they would be excluded from the calculation of the PLAC requirement.
The ICB also recommended that a large ring-fenced bank should be required to maintain an equity ‘ring-fence buffer’ of at least 10% of RWAs, and the minimum leverage ratio of equity-to-total assets should be adjusted to 4.06% for larger banks, including HSBC Bank. The UK Government has however proposed that the leverage ratio should
21e
Table of Contents
HSBC HOLDINGS PLC
Report of the Directors: Overview(continued)
remain at the minimum of 3% as set out in the Basel III proposals.
If the proposals described above regarding ICB are adopted substantially in the form described, major changes to our corporate structure and business activities conducted in the UK through HSBC Bank might be required. The changes would include separating the ring-fenced bank from the existing UK incorporated universal bank. The proposals would take an extended period of time to implement and would significantly increase our costs, both from implementation and from running our operations as restructured.
In February 2012, the European Commission appointed a High Level Expert Group under the Governor of the Bank of Finland, Erkki Liikanen, to consider potential structural changes in banks within the EU. The Liikanen Group presented its recommendations on 2 October 2012, which included the ring-fencing of certain market-making and trading activities from the deposit-taking and retail payments activities of major banks and possible amendments to the use of bail-in instruments as a resolution tool, changes to banks’ capital requirements, particularly relating to trading assets and real estate-related loans as well as a number of other recommendations. The European Commission has held a consultation on the recommendations and may make its own proposals during 2013. A summary of responses to the consultation were published on 21 December 2012, which state that the proposal for mandatory separation of bank trading activities was subject to the most comment and controversy. The Commission has indicated in January 2013 that it intended to publish a directive or a regulation on the reform of the structure of EU banks in the third quarter of 2013.
The French Government has also made legislative proposals to prohibit a limited range of trading activities within banks and these are now being subjected to parliamentary scrutiny. The relationship between the ICB proposals in the UK, the French proposals and the Liikanen proposals at the EU level has still to be clarified.
We are subject to tax-related risks in the countries in which we operate which could have a material adverse effect on our operating results
HSBC is subject to the substance and interpretation of tax laws in all countries in which we operate and is subject to routine review and audit by tax authorities in relation thereto. We provide for potential tax liabilities that may arise on the basis
of the amounts expected to be paid to the tax authorities. The amounts ultimately paid may differ materially from the amounts provided depending on the ultimate resolution of such matters. Changes to tax law, tax rates and penalties for failure to comply could have a material adverse effect on our business, financial condition and/or results of operations.
Risks related to our business operations, governance and internal control systems including compliance
Our risk management measures may not be successful
The management of risk is an integral part of all our activities. Risk constitutes our exposure to uncertainty and the consequent variability of return. Specifically, risk equates to the adverse effect on profitability or financial condition arising from different sources of uncertainty including retail and wholesale credit risk, market risk, operational risk, non-traded market risk, insurance risk, concentration risk, liquidity and funding risk, litigation risk, reputational risk, strategic risk, pension obligation risk and regulatory risk. We seek to monitor and manage our risk exposure through a variety of separate but complementary control and reporting systems such as financial, credit, market, operational, compliance and legal. While we employ a broad and diversified set of risk monitoring and risk mitigation techniques, such techniques and the judgements that accompany their application cannot anticipate every unfavourable event or the specifics and timing of every outcome. Failure to manage risks appropriately could have a significant effect on our business prospects, financial condition and/or results of operations.
Operational risks are inherent in our business
We are exposed to many types of operational risk, that are inherent in banking operations including fraudulent and other criminal activities (both internal and external), breakdowns in processes or procedures and systems failure or non-availability. These risks apply equally when we rely on outside suppliers or vendors to provide services to us and our customers. Any such divestiture or termination of activities would have a material adverse effect on our business, prospects, financial condition and results of operation.
Our operations are subject to the threat of fraudulent activity
Fraudsters may target any of our products, services and delivery channels including lending, internet banking, payments, cards services and account
21f
Table of Contents
HSBC HOLDINGS PLC
Report of the Directors: Overview(continued)
takeover. This may result in financial loss to the bank, an adverse customer experience, reputational damage and potential regulatory action depending on the circumstances of the event. Any such divestiture or termination of activities would have a material adverse effect on our business, prospects, financial condition and results of operation.
Our operations are subject to disruption from the external environment
HSBC operates in many geographic locations, which are subject to events which are outside our control. These events may be acts of god such as natural disasters and epidemics, geopolitical risks including acts of terrorism and social unrest and infrastructure issues such as transport or power failure. These risk events may give rise to disruption to our services, result in physical damage and/or loss of life, and have an economic impact on us. Any such divestiture or termination of activities would have a material adverse effect on our business, prospects, financial condition and results of operation.
Our operations utilise third party suppliers
HSBC also utilises third party firms for the supply of certain of its goods and services. The inadequate management of its significant third party supplies of goods and services could lead to a failure to meet our operational and business requirements which, in turn, may involve regulatory breaches, civil or monetary penalties or damage both to shareholder value and to our reputation/brand image. Any such divestiture or termination of activities would have a material adverse effect on our business, prospects, financial condition and results of operation.
Our operations are highly dependent on our information technology systems
The reliability and security of our information and technology infrastructure and our customer databases are crucial to maintaining the service availability of banking applications and processes and to protecting the HSBC brand. The proper functioning of our payment systems, financial control, risk management, credit analysis and reporting, accounting, customer service and other information technology systems, as well as the communication networks between our branches and main data processing centres, are critical to our operations.
Critical system failure, any prolonged loss of service availability or any material breach of data security, particularly involving confidential customer data, could cause serious damage to our ability to
service our clients, could breach regulations under which we operate and could cause long-term damage to our business and brand that could have a material adverse effect on our business, prospects, financial condition, reputation and/or results of operations. This includes the operation of our key payments services. During 2012, a major payment systems outage experienced by another UK Bank demonstrated the potential damage, in particular to its reputation, associated with a prolonged systems outage.
The threat from cyber attacks is a concern for our organisation and failure to protect our operations from internet crime or cyber attacks may result in financial loss and loss of customer data or other sensitive information which could undermine our reputation and our ability to attract and keep customers. This could have a material adverse effect on our business, financial condition and/or results of our operations. We face various cyber risks in line with other multinational organisations. During 2012, we were subjected to six ‘denial of service’ attacks on our external facing websites across Latin America, Asia and North America. A denial of service attack is the attempt to intentionally paralyse a computer network by flooding it with data sent simultaneously from many individual computers.
One of these attacks affected several geographical regions and lasted 15 hours; there was limited effect from the five other attacks with services maintained. We did not experience any loss of data as a result of these attacks.
Our operations have inherent reputational risk
Reputational risk is the risk that illegal, unethical or inappropriate behaviour by the Group itself, members of staff, representatives of the Group or its clients act in a way that will damage HSBC’s reputation leading, potentially, to a loss of business, fines or penalties. Reputational risk could arise from negative public opinion about the actual, or perceived, manner in which we conduct our business activities, our financial performance, and actual or perceived practices in banking and the financial services industry generally.
Modern technologies, in particular online social networks and other broadcast tools which facilitate communication with large audiences in short time frames and with minimal costs, may significantly enhance and accelerate the impact of damaging information and allegations. Negative public opinion may adversely affect our ability to keep and attract customers and, in particular, corporate and retail depositors and could have a material adverse effect
21g
Table of Contents
HSBC HOLDINGS PLC
Report of the Directors: Overview(continued)
on our business, prospects, financial condition, reputation and/or results of operations.
We may suffer losses due to employee misconduct
Our businesses are exposed to risk from potential non-compliance with policies, employee misconduct or negligence and fraud, which could result in regulatory sanctions and serious reputational or financial harm. In recent years, a number of multinational financial institutions have suffered material losses due to the actions of ‘rogue traders’ or other employees. It is not always possible to deter employee misconduct and the precautions we take to prevent and detect this activity may not always be effective.
We rely on recruiting, retaining and developing appropriate senior management and skilled personnel
Our continued success depends in part on the continued service of key members of our management team. The ability to continue to attract, train, motivate and retain highly qualified professionals is a key element of our strategy. The successful implementation of our growth strategy depends on the availability of skilled management, both at our head office and at each of our business units. If one of our business units or other functions fails to staff its operations appropriately or loses one or more of its key senior executives, and fails to replace them in a satisfactory and timely manner, our business prospects, financial condition and/or results of operations, including control and operational risks, may be materially adversely affected. Likewise, if we fail to attract and appropriately train, motivate and retain qualified professionals, our business may be adversely affected.
Our financial statements are based in part on assumptions and estimates which, if inaccurate, could cause material misstatement of the results and financial position of the Group
The preparation of financial statements requires management to make judgements, estimates and assumptions that affect the reported amounts of assets, liabilities, income and expenses. Due to the inherent uncertainty in making estimates, actual results reported in future periods may be based upon amounts which differ from those estimates. Estimates, judgements and assumptions are continually evaluated and are based on historical experience and other factors, including expectations of future events that are believed to be reasonable under the circumstances. Revisions to accounting
estimates are recognised in the period in which the estimate is revised and in any future periods affected. The accounting policies deemed critical to our results and financial position, based upon materiality and significant judgements and estimates, include impairment of loans and advances, goodwill impairment, valuation of financial instruments, deferred tax assets and provision for liabilities, which are discussed in detail in ‘Critical accounting policies’ on page 54.
The valuation of financial instruments measured at fair value can be subjective, in particular where models are used which include unobservable inputs. Given the uncertainty and subjectivity associated with valuing such instruments it is possible that the results of operations and the financial position of the Group could be materially misstated if the estimates and assumptions used prove to be inaccurate. For further details, see ‘Critical accounting policies’ on page 54.
If the judgement, estimates and assumptions we use in preparing our consolidated financial statements are subsequently found to be incorrect, this could materially affect our business, financial conditions, prospects, and/or results of operations and have a corresponding effect on our funding requirements and capital ratios.
Third parties may use us as a conduit for illegal activities without our knowledge, which could have a material adverse effect on us
We are required to comply with applicable anti-money laundering laws and regulations and have adopted various policies and procedures, including internal control and ‘know-your-customer’ procedures, aimed at preventing use of HSBC for money laundering. A major focus of US governmental policy relating to financial institutions in recent years has been combating money laundering and enforcing compliance with US economic sanctions, and this prioritisation is evidenced by our agreements with US authorities relating to various investigations regarding inadequate compliance with anti-money laundering and sanctions law including DPAs with the US DoJ and others. Certain US subsidiaries of HSBC Holdings have entered into a consent cease and desist order with the OCC and a similar consent order with the Federal Reserve Board which requires the implementation of improvements to compliance procedures regarding obligations under the US Bank Secrecy Act (the ‘BSA’) and anti-money laundering (‘AML’) rules. These consent orders do not preclude additional enforcement actions by bank regulatory,
21h
Table of Contents
HSBC HOLDINGS PLC
Report of the Directors: Overview(continued)
governmental or law enforcement agencies or private litigation.
In relevant situations and where permitted by regulation, we may rely upon certain counterparties to maintain and properly apply their own appropriate AML procedures. While permitted by regulation, such reliance may not be completely effective in preventing third parties from using us (and our relevant counterparties) as a conduit for money laundering including illegal cash operations without our (and our relevant counterparties’) knowledge. If we are associated with, or even accused of being associated with, or become a party to, money laundering, our reputation could suffer and we could become subject to fines, sanctions and/or legal enforcement (including being added to any ‘blacklists’ that would prohibit certain parties from engaging in transactions with us), any one of which could have a material adverse effect on our business, prospects, financial condition and/or results of operations.
A number of the remedial actions taken or being taken as a result of the matters to which the DPA relates are intended to ensure that the Group’s businesses are better protected in respect of these risks. These actions are listed in the DPA. It will, however, take time to complete these remedial actions. Breach of the DPA at any time during its term may allow the DoJ or the New York County District Attorney’s Office to prosecute HSBC in relation to the matters which are the subject of the DPA.
We may not achieve all the expected benefits of our strategic initiatives
In 2011 we developed and presented a new strategy for the Group (see ‘Strategic direction’ on page 17). Our strategy is built around two trends, the continued growth of international trade and capital flows, and wealth creation, particularly in faster-growing markets. We have analysed those trends, and have developed criteria to help us better deploy capital in response. We have also launched an initiative to reduce costs, part of which includes the disposal of non-core businesses. The development and implementation of our strategy requires difficult, subjective and complex judgements, including forecasts of economic conditions in various parts of the world. We may fail to correctly identify the trends we seek to exploit and the relevant factors in making decisions as to capital deployment and cost reduction. Our ability to execute our strategy may also be limited by our operational capacity and the increasing complexity of the regulatory environment in which we operate. For example,
the complexities of separating disposed assets from continuing operations, including transitional arrangements, could increase operational and reputational risks and threaten successful execution of an announced disposal. In addition, factors beyond our control, including but not limited to the market and economic conditions and other challenges discussed in detail above, could limit our ability to achieve all of the expected benefits of these initiatives.
Risks related to our business
We have significant exposure to counterparty risk within the financial sector and to other risk concentrations
We have exposure to virtually all major industries and counterparties, and we routinely execute transactions with counterparties in financial services, including brokers and dealers, commercial banks, investment banks, mutual and hedge funds, and other institutional clients. Many of these transactions expose us to credit risk in the event of default by our counterparty or client. Our ability to engage in routine transactions to fund our operations and manage our risks could be materially adversely affected by the actions and commercial soundness of other financial services institutions. Financial institutions are necessarily interdependent because of trading, clearing, counterparty or other relationships. As a consequence, a default by, or decline in market confidence in, individual institutions, or anxiety about the financial services industry generally, can lead to further individual and/or systemic difficulties, defaults and losses. Where counterparty risk has been mitigated by taking collateral, our credit risk may remain high if the collateral we hold cannot be realised or has to be liquidated at prices which are insufficient to recover the full amount of our loan or derivative exposure. There is a risk that a change in the law could affect our ability to forecast on collateral or otherwise enforce contractual rights.
This risk that collateral cannot be realised includes situations where this arises by change of law that may impact our ability to foreclose on collateral or otherwise enforce contractual rights.
The Group also has credit exposure arising from mitigants such as credit default swaps (‘CDS’s), and other credit derivatives, each of which is carried at fair value. The risk of default by counterparties to CDSs and other credit derivatives used as mitigants impacts on the fair value of these instruments depending on the valuation and the perceived credit risk of the underlying instrument against which protection has been purchased. Any such
21i
Table of Contents
HSBC HOLDINGS PLC
Report of the Directors: Overview(continued)
adjustments or fair value changes may have a material adverse effect and on our financial condition and results of operations.
Market fluctuations may reduce our income or the value of our portfolios
Our businesses are inherently subject to risks in financial markets and in the wider economy, including changes in, and increased volatility of, interest rates, inflation rates, credit spreads, foreign exchange rates, commodity, equity, bond and property prices and the risk that our customers act in a manner inconsistent with our business, pricing and hedging assumptions.
Market movements will continue to have a significant impact on us in a number of key areas. For example, our pension scheme assets include equity and debt securities, the cash flows of which change as equity prices and interest rates vary. Banking and trading activities are subject to interest rate risk, foreign exchange risk, inflation risk and credit spread risk. Changes in interest rate levels, interbank spreads over official rates, yield curves and spreads affect the interest rate spread realised between lending and borrowing costs. The potential for future volatility and margin changes remains. Competitive pressures on fixed rates or product terms in existing loans and deposits sometimes restrict our ability to change interest rates applying to customers in response to changes in official and wholesale market rates.
Our insurance businesses are exposed to the risk that market fluctuations will cause mismatches to occur between product liabilities and the investment assets which back them. Market risks can affect our insurance products in a number of ways depending upon the product and associated contract. For example, mismatches between assets and liability yields and maturities give rise to interest rate risk. Some of these risks are borne directly by the customer and some are borne by the insurance businesses themselves, with their excess capital invested in the markets. Some insurance contracts involve guarantees and options that increase in value in adverse investment markets. There is a risk that the insurance businesses will bear some of the cost of such guarantees and options. The performance of the investment markets will thus have a direct impact upon the value embedded in the insurance and investment contracts and our operating results, financial condition and prospects.
It is difficult to predict with any accuracy changes in market conditions, and such changes may
have a material adverse effect on our business, operating results, financial condition and prospects.
Liquidity, or ready access to funds, is essential to our businesses
Our ability to borrow on a secured or unsecured basis and the cost of so doing can be affected by increases in interest rates or credit spreads, the availability of credit, regulatory requirements relating to liquidity or the market perceptions of risk relating to us or the banking sector, including our perceived or actual creditworthiness.
Current accounts and savings deposits payable on demand or at short notice form a significant part of our funding, and we place considerable importance on maintaining their stability. For deposits, stability depends upon preserving investor confidence in our capital strength and liquidity, and on comparable and transparent pricing. Although deposits have been, over time, a stable source of funding, this may not continue.
We also access wholesale markets in order to provide funding for entities that do not accept deposits, to align asset and liability maturities and currencies and to maintain a presence in local markets. An inability to obtain financing in the unsecured long-term or short-term debt capital markets, or to access the secured lending markets, could have a substantial adverse effect on our liquidity. We continued to have good access to debt capital markets in 2012. Our cost of issuing new debt fell significantly, principally in the second half of the year. However, unfavourable macroeconomic developments, market disruptions or regulatory developments may increase our funding costs or challenge our ability to raise funds to support or expand our businesses, materially adversely affecting our business, prospects, financial condition and/or results of operations.
If we are unable to raise funds through deposits and/or in the capital markets, our liquidity position could be adversely affected and we might be unable to meet deposit withdrawals on demand or at their contractual maturity, to repay borrowings as they mature, to meet our obligations under committed financing facilities and insurance contracts, or to fund new loans, investments and businesses. We may need to liquidate unencumbered assets to meet our liabilities. In a time of reduced liquidity, we may be unable to sell some of our assets, or we may need to sell assets at depressed prices, which in either case could materially adversely affect our business, prospects, results of operations and/or financial condition.
21j
Table of Contents
HSBC HOLDINGS PLC
Report of the Directors: Overview(continued)
Any reduction in the credit rating assigned to HSBC Holdings, any subsidiaries of HSBC Holdings or any of their respective debt securities could increase the cost or decrease the availability of our funding and adversely affect our liquidity position and interest margins
Credit ratings affect the cost and other terms upon which we are able to obtain market funding. Rating agencies regularly evaluate HSBC Holdings and certain of its subsidiaries, as well as their respective debt securities. Their ratings are based on a number of factors, including their assessment of the relative financial strength of HSBC or of the relevant entity, as well as conditions affecting the financial services industry generally. There can be no assurance that the rating agencies will maintain HSBC’s or the relevant entity’s current ratings or outlook, especially in light of the difficulties in the financial services industry and the financial markets. In 2012, HSBC Holdings’ long-term credit ratings were downgraded by Moody’s (to AA2) and Fitch (to AA-) due to Moody’s global review of bank credit ratings and Fitch’s reassessment of HSBC’s financial strengths. We experienced no change in market demand or the cost of issuing liabilities and negligible changes in our collateral requirements arising from these changes in rating. Further reductions in these ratings and outlook could increase the cost of our funding, limit access to capital markets and require additional collateral to be placed and, consequently, materially adversely affect our interest margins and/or our liquidity position.
Under the terms of our current collateral obligations under derivative contracts, we estimate that HSBC could be required to post additional collateral of up to US$1.5bn (2011: US$3.0bn) in the event of a one notch downgrade in credit ratings, which would increase to US$2.5bn (2011:US$3.8bn) in the event of a two notch downgrade.
Risks concerning borrower credit quality are inherent in our businesses
Risks arising from changes in credit quality and the recoverability of loans and amounts due from borrowers and counterparties (e.g. reinsurers and counterparties in derivative transactions) are inherent in a wide range of our businesses. Adverse changes in the credit quality of our borrowers and counterparties arising from a general deterioration in economic conditions or systemic risks in the financial systems could reduce the recoverability and value of our assets and require an increase in our loan impairment charges.
We estimate and recognise impairment allowances for credit losses inherent in our credit exposure. This process, which is critical to our results and financial condition, requires difficult, subjective and complex judgements, including forecasts of how these economic conditions might impair the ability of our borrowers to repay their loans and the ability of other counterparties to meet their obligations. As is the case with any such assessments, we may fail to estimate accurately the effect of factors that we identify or fail to identify relevant factors. Further, the information we use to assess the creditworthiness of our counterparties may be inaccurate or incorrect. Any failure by us to accurately estimate the ability of our counterparties to meet their obligations may have a material adverse effect on our business, prospects, financial conditions and/or results of operations.
Our insurance businesses are subject to risks relating to insurance claim rates and changes in insurance customer behaviour
We provide various insurance products for customers with whom we have a banking relationship, including several types of life insurance products. The cost of claims and benefits can be influenced by many factors, including mortality and morbidity rates, lapse and surrender rates and, if the policy has a savings element, the performance of assets to support the liabilities. Adverse developments in any of these factors may materially adversely affect our financial condition and results of operations.
Our general insurance businesses are exposed to the risk of uncertain insurance claim rates. For example, extreme weather conditions can result in high property damage claims, higher levels of theft can increase claims on home insurance and changes to unemployment levels can increase claims on loan protection insurance. These claims rates may differ from business assumptions and negative developments may materially adversely affect our financial condition and results of operations.
HSBC Holdings is a holding company and as a result, is dependent on dividends from its subsidiaries to meet its obligations, including obligations with respect to its debt securities, and to provide profits for payment of future dividends to shareholders
HSBC Holdings is a non-operating holding company and as such the principal sources of its income are from operating subsidiaries which hold the principal assets of HSBC. As a separate legal entity, HSBC Holdings relies on remittance of its subsidiaries’ profits and other funds in order to be able to pay
21k
Table of Contents
HSBC HOLDINGS PLC
Report of the Directors: Overview(continued)
obligations to shareholders and debt holders as they fall due. The ability of HSBC Holdings subsidiaries and affiliates to pay dividends could be restricted by changes in official banking measures, exchange controls and other requirements.
We may be required to make substantial contributions to our pension plans
We operate a number of pension plans throughout the world, including defined benefit plans. Pension scheme obligations fluctuate with changes in long-term interest rates, inflation, salary levels and the longevity of scheme members. The level of contributions we make to our pension plans has a direct effect on our cash flow. To the extent plan assets are insufficient to cover existing liabilities, higher levels of contributions will be required. As a result, deficits in those pension plans may have a material adverse affect on our business, prospects, financial condition and/or results of operations.
21l
Table of Contents
HSBC HOLDINGS PLC
Report of the Directors: Overview(continued)
Top and emerging risks
We classify certain risks as ‘top’ or ‘emerging’. We define a ‘top risk’ as being a current, emerged risk which has arisen across any of our risk categories, regions or global businesses and has the potential to have a material impact on our financial results or our reputation and the sustainability of our long-term business model, and which may form and crystallise within a one-year horizon. We consider an ‘emerging risk’ to be one which has large uncertain outcomes which may form and crystallise beyond a one-year horizon and, if it were to crystallise, could have a material effect on our long-term strategy.
Our approach to identifying and monitoring top and emerging risks is informed by the risk factors.
All of our activities involve, to varying degrees, the measurement, evaluation, acceptance and management of risk or combinations of risks which we assess on a Group-wide basis. Top and emerging risks fall under the following three broad categories:
| • | macroeconomic and geopolitical risk; |
| • | macro-prudential, regulatory and legal risks to our business model; and |
| • | risks related to our business operations, governance and internal control systems. |
During 2012, our senior management paid particular attention to a number of top and emerging risks. The current list is summarised below:
Macroeconomic and geopolitical risk
| • | Emerging markets slow down. |
| • | Macroeconomic risks within developed economies. |
| • | Increased geopolitical risk in certain regions. |
Macro-prudential, regulatory and legal risks to our business model
| • | Regulatory developments affecting our business model and Group profitability. |
| • | Regulatory investigations, fines, sanctions and requirements relating to conduct of business and financial crime negatively affecting our results and brand. |
| • | Dispute risk. |
Risks related to our business operations, governance and internal control systems
| • | Regulatory commitments and consent orders including under the Deferred Prosecution Agreements. |
| • | Challenges to achieving our strategy in a downturn. |
| • | Internet crime and fraud. |
| • | Level of change creating operational complexity and heightened operational risk. |
| • | Information security risk. |
| • | Model risk. |
A detailed account of these risks is provided on page 131. All of them are regarded as top risks. Further comments on expected risks and uncertainties are made throughout theAnnual Report and Accounts 2012, particularly in the section on Risk, pages 123 to 249.
Risk appetite
Risk appetite is a key component of our management of risk and describes the types and level of risk we are prepared to accept in delivering our strategy. Our risk appetite is set out in the Group’s Risk Appetite Statement and is central to the annual planning process. Global businesses, geographical regions and global functions are required to articulate their risk appetite statements. They are discussed further on page 126.
Our risk appetite may be revised in response to the top and emerging risks we have identified.
The Board of Directors and the GMB monitor HSBC’s progress against its strategic objectives. Progress is assessed by comparison with our strategy, our operating plan and our historical performance using both financial and non-financial measures.
From time to time the Group reviews its key performance indicators (‘KPIs’) in light of its strategic objectives and may in the future adopt new or refined measures, or modify or adjust existing targets, to better align the KPIs to our strategic objectives.
The GMB remains focused on improving our capital deployment to support the achievement of our medium-term target for return on equity of between 12% and 15%, utilising the six filter analysis across our portfolio of businesses. We will continue to evaluate our businesses in 2013 using this methodology.
Employee engagement has been monitored through annual Global People Surveys. In 2012, quarterly Pulse Surveys were introduced, and the Global People Surveys scheduled biennially. The next Global People Survey will be in 2013. As the Pulse Surveys were not designed to report employee engagement information comparable with that derived from the Global People Surveys, we have not disclosed this KPI in 2012.
22
Table of Contents
HSBC HOLDINGS PLC
Report of the Directors: Overview(continued)
| Strategy | Restructuring HSBC – improving the way we deploy capital | |||||
| Return on average ordinary shareholders’ equity2 | Core tier 1 capital ratio10 | Advances to core funding ratio23 | ||||
 | 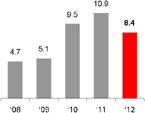 | 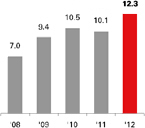 | 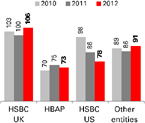 | |||
Measure: (percentage) profit attributable to ordinary shareholders divided by average ordinary shareholders’ equity. |
Measure: (percentage) ratio of core tier 1 capital comprising shareholders’ equity and related non-controlling interests less regulatory deductions and adjustments to total risk-weighted assets.
|
Measure: loans and advances to customers as a percentage of the total of core customer deposits and term funding with a remaining term to maturity in excess of one year. | ||||
| Target: to maintain a return in the medium term of between 12% and 15%. | Target: to maintain a strong capital base to support the development of the business and meet regulatory capital requirements at all times.
| Target: to maintain an advances to core funding ratio below limits set for each entity. | ||||
Outcome: return on average ordinary shareholders’ equity remained outside our target range and was 2.5 percentage points below 2011. The latter primarily reflected adverse fair value movements on own debt attributable to credit spreads, compared with favourable movements in 2011, a higher tax charge and higher average shareholders’ equity.
| Outcome: the increase in core tier 1 capital ratio to 12.3% was driven by capital generation and a reduction in RWAs following business disposals, notably the disposal of the US Card and Retail Services business and derecognition of Ping An as an associate. | Outcome: The operating entities reported remained inside their advances to core funding limits of between 70% and 115% during 2012, except for one operating entity reported within the total of HSBC’s other principal entities which operated with a limit of 125% during the year. This limit has been reduced to 115% for 2013. | ||||
| Strategy | Simplifying HSBC – a lean and values-driven organisation | |||
Cost efficiency (2012: underlying cost efficiency 66.0%) | Basic earnings per ordinary share | |||
| 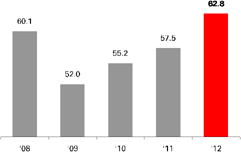 | 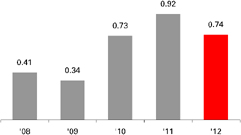 | ||
Measure: (percentage) total operating expenses divided by net operating income before loan impairment and other credit risk provisions.
|
Measure: (US$) level of basic earnings generated per ordinary share. | |||
Target: to be between 48% and 52%, a range within which business is expected to remain to accommodate both returns to shareholders and the need for continued investment in support of future business growth.
| Target: to deliver consistent growth in basic earnings per share. | |||
| Outcome: the ratio remained outside the target range. On a reported basis, revenues decreased primarily due to adverse fair value movements on own debt attributable to credit spreads, coupled with higher costs in part reflecting a charge in respect of fines and penalties as part of the settlement of investigations into HSBC’s past inadequate compliance with anti-money laundering and sanctions laws as well as an increase in provisions relating to UK customer redress programmes. On an underlying basis, revenue growth was more than offset by the increase in costs. | Outcome: Earnings per share decreased in 2012 reflecting adverse fair value movements on own debt attributable to credit spreads, compared with favourable movements in 2011, and a higher tax charge which resulted in a decrease in reported profits. | |||
23
Table of Contents
HSBC HOLDINGS PLC
Report of the Directors: Overview(continued)
Growing HSBC – continuing to position ourselves for growth | Strategy | |||
Risk-adjusted revenue growth (2012: underlying growth 13%) | Dividends per ordinary share growth | |||
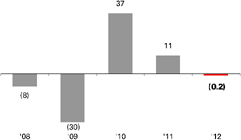 | 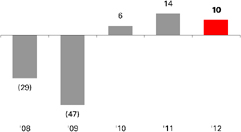 |  | ||
Measure: (percentage) increase in reported net operating income after loan impairment and other credit risk charges since last year. |
Measure: (percentage) increase in dividends per share since last year, based on dividends paid in respect of the year to which the dividend relates.
| |||
| Target: to deliver consistent growth in risk adjusted revenues. | Target: to deliver sustained dividend per share growth.
| |||
| Outcome: reported risk-adjusted revenue was broadly in line with 2011. On an underlying basis, there was an increase due to revenue growth, notably in GB&M and CMB, and lower loan impairment charges, notably in North America. | Outcome:dividends per share increased by 10%. | |||
| Customer recommendation | Brand value | |||
Measure:we measure our customer satisfaction through an independent market research survey of retail banking customers in selected countries, using a specific customer recommendation index (‘CRI’) to score performance. We benchmark our performance against key competitors in each market and set targets relative to our peer group of banks.
Target:the Group target is for 75% of all the markets (based on their weighted revenue) to meet their CRI targets.
Outcome:RBWM failed to make its target of 75% as a consequence of reputational issues in certain of our major developed markets that adversely affected customers’ perception of the bank in the third quarter of 2012. We saw a good recovery in the fourth quarter but, taking the overall averaged annual position into account, we only met our target in 38% of our weighted revenue. 55% of the weighted revenue target was within two points (from a 100-point scale).
For CMB, we changed our measures in 2012 for customer satisfaction to reflect the strategic focus of the business. Previously, we only surveyed small business customers in a limited number of markets and measured customer recommendation. For 2012, we introduced a new measure of our performance through a ‘client engagement’ survey conducted for us by a third party. This provides a more complete perspective for our performance across all our CMB segments and will give us a competitive benchmark in 13 of our top markets. In 2012, therefore, we set benchmarks but not targets. We will set targets for 2013 and report results in the future. |
Measure:in 2011, we moved our brand measure to the Brand Finance valuation method as reported inThe Banker Magazine. This is our second year of using this benchmark. The Brand Finance methodology gives us a more complete measure of the strength of the brand and its impact across all business lines and customer groups. It is a wholly independent measure and is publicly reported. | | ||
Target:a top three position in the banking peer group.
Outcome:The HSBC brand moved from first to third in the Brand Finance ranking and suffered a substantial reduction in value. We achieved our target of a top three position but, in consultation with the Brand Finance organisation, we have seen reputational issues cited as a major factor in our reduced performance in 2012. | ||||
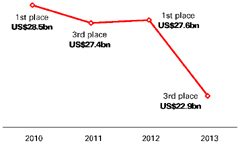
For footnotes, see page 120.
24
Table of Contents
HSBC HOLDINGS PLC
Report of the Directors: Operating and Financial Review
| 25 | ||
| 25 | ||
| 26 | ||
| 29 | ||
| 33 | ||
| 33 | ||
| 35 | ||
| 36 | ||
Net income/(expense) from financial instruments designated at fair value | 37 | |
| 38 | ||
| 38 | ||
Gains on disposal of US branch network, US cards business and Ping An | 39 | |
| 39 | ||
Net insurance claims incurred and movement in liabilities to policyholders | 40 | |
| 41 | ||
| 42 | ||
| 43 | ||
| 44 | ||
| 44a | ||
| 44j | ||
| 45 | ||
| 46 | ||
| 49a | ||
| 49a | ||
Analysis of changes in net interest income and net interest expense | 49h | |
| 49k | ||
| 49k | ||
| 49l | ||
| 49m | ||
| 50a | ||
| 51 | ||
| 52 | ||
| 52 | ||
| 53a | ||
| 54 |
The management commentary included in the Report of the Directors: ‘Overview’ and ‘Operating and Financial Review’, together with the ‘Employees’ and ‘Corporate sustainability’ sections of ‘Corporate Governance’ and the ‘Directors’ Remuneration Report’ is presented in compliance with the IFRS Practice Statement‘Management Commentary’ issued by the IASB.
Use of non-GAAP financial measures
Our reported results are prepared in accordance with IFRSs as detailed in the Financial Statements starting on page 372. There are times when we measure our performance internally, using financial measures which have been derived from our reported results, in order to eliminate factors which distort year-on-year comparisons so we can view our results on a more like-for-like basis; these are considered non-GAAP measures. ‘Constant currency’ and ‘underlying’ performance are non-GAAP measures that we use throughout our Operating and Financial Review and are described below. Other non-GAAP financial measures are described and reconciled to the closest reported financial measure when used.
The constant currency measure adjusts for the year-on-year effects of foreign currency translation differences by comparing reported results for 2012 with reported results for 2011 retranslated at 2012 exchange rates. Except where stated otherwise, commentaries are on a constant currency basis, as reconciled in the table overleaf.
The foreign currency translation differences reflect the movements of the US dollar against most major currencies during 2012.
We exclude the translation differences when monitoring progress against operating plans and past results because management believes the like-for-like basis of constant currency financial measures more appropriately reflects changes due to operating performance.
Constant currency
Constant currency comparatives for 2011 referred to in the commentaries are computed by retranslating into US dollars for non-US dollar branches, subsidiaries, joint ventures and associates:
| • | the income statements for 2011 at the average rates of exchange for 2012; and |
| • | the balance sheet at 31 December 2011 at the prevailing rates of exchange on 31 December 2012. |
Constant currency comparatives for 2010 referred to in the 2011 commentaries are computed on the same basis, by applying average rates of exchange for 2011 to the 2010 income statement and rates of exchange on 31 December 2011 to the balance sheet at 31 December 2010.
No adjustment has been made to the exchange rates used to translate foreign currency denominated assets and liabilities into the functional currencies of any HSBC branches, subsidiaries, joint ventures or associates. When reference is made to ‘constant currency’ in tables or commentaries, comparative data reported in the functional currencies of HSBC’s operations have been translated at the appropriate exchange rates applied in the current period on the basis described above.
25
Table of Contents
HSBC HOLDINGS PLC
Report of the Directors: Operating and Financial Review
Reconciliation of reported and constant currency profit before tax
| 2012 compared with 2011 | ||||||||||||||||||||||||||||||||||
| HSBC | 2011 as reported US$m | Currency translation adjustment24 US$m | 2011 at 2012 exchange rates US$m | 2012 as reported US$m | Reported change25 % | Constant currency change25 % | ||||||||||||||||||||||||||||
Net interest income | 40,662 | (1,151 | ) | 39,511 | 37,672 | (7 | ) | (5 | ) | |||||||||||||||||||||||||
Net fee income | 17,160 | (436 | ) | 16,724 | 16,430 | (4 | ) | (2 | ) | |||||||||||||||||||||||||
Own credit spread26 | 3,933 | (35 | ) | 3,898 | (5,215 | ) | ||||||||||||||||||||||||||||
Gains on disposal of US branch network, US cards business and Ping An | – | – | – | 7,024 | ||||||||||||||||||||||||||||||
Other income27 | 10,525 | (446 | ) | 10,079 | 12,419 | 18 | 23 | |||||||||||||||||||||||||||
Net operating income21 | 72,280 | (2,068 | ) | 70,212 | 68,330 | (5 | ) | (3 | ) | |||||||||||||||||||||||||
Loan impairment charges and other credit risk provisions | (12,127 | ) | 277 | (11,850 | ) | (8,311 | ) | 31 | 30 | |||||||||||||||||||||||||
Net operating income | 60,153 | (1,791 | ) | 58,362 | 60,019 | – | 3 | |||||||||||||||||||||||||||
Operating expenses | (41,545 | ) | 1,273 | (40,272 | ) | (42,927 | ) | (3 | ) | (7 | ) | |||||||||||||||||||||||
Operating profit | 18,608 | (518 | ) | 18,090 | 17,092 | (8 | ) | (6 | ) | |||||||||||||||||||||||||
Share of profit in associates and joint ventures | 3,264 | 55 | 3,319 | 3,557 | 9 | 7 | ||||||||||||||||||||||||||||
Profit before tax | 21,872 | (463 | ) | 21,409 | 20,649 | (6 | ) | (4 | ) | |||||||||||||||||||||||||
By global business28 | ||||||||||||||||||||||||||||||||||
Retail Banking and Wealth Management | 4,270 | (71 | ) | 4,199 | 9,575 | 124 | 128 | |||||||||||||||||||||||||||
Commercial Banking | 7,947 | (180 | ) | 7,767 | 8,535 | 7 | 10 | |||||||||||||||||||||||||||
Global Banking and Markets | 7,049 | (200 | ) | 6,849 | 8,520 | 21 | 24 | |||||||||||||||||||||||||||
Global Private Banking | 944 | (8 | ) | 936 | 1,009 | 7 | 8 | |||||||||||||||||||||||||||
Other | 1,662 | (4 | ) | 1,658 | (6,990 | ) | ||||||||||||||||||||||||||||
Profit before tax | 21,872 | (463 | ) | 21,409 | 20,649 | (6 | ) | (4 | ) | |||||||||||||||||||||||||
By geographical region28 | ||||||||||||||||||||||||||||||||||
Europe | 4,671 | (130 | ) | 4,541 | (3,414 | ) | ||||||||||||||||||||||||||||
Hong Kong | 5,823 | 20 | 5,843 | 7,582 | 30 | 30 | ||||||||||||||||||||||||||||
Rest of Asia-Pacific | 7,471 | (79 | ) | 7,392 | 10,448 | 40 | 41 | |||||||||||||||||||||||||||
Middle East and North Africa | 1,492 | (7 | ) | 1,485 | 1,350 | (10 | ) | (9 | ) | |||||||||||||||||||||||||
North America | 100 | (14 | ) | 86 | 2,299 | 2,199 | 2,573 | |||||||||||||||||||||||||||
Latin America | 2,315 | (253 | ) | 2,062 | 2,384 | 3 | 16 | |||||||||||||||||||||||||||
Profit before tax | 21,872 | (463 | ) | 21,409 | 20,649 | (6 | ) | (4 | ) | |||||||||||||||||||||||||
For footnotes, see page 120.
Underlying performance:
| • | adjusts for the year-on-year effects of foreign currency translation; |
| • | eliminates the fair value movements on our long-term debt attributable to credit spread (‘own credit spread’) where the net result of such movements will be zero upon maturity of the debt (see footnote 26 on page 120); and |
| • | adjusts for acquisitions, disposals and changes of ownership levels of subsidiaries, associates and businesses (see footnote 29 on page 120). |
For disposals, acquisitions and changes of ownership levels of subsidiaries, associates and businesses, we eliminate the gain or loss on disposal in the period incurred and remove the operating profit or loss of the acquired and disposed of businesses from all periods presented. Previously, this adjustment for the results of operations was effected by removing the time-equivalent component of operating profit or loss from the comparative period. During 2012 we changed this adjustment to better reflect the results of the ongoing business. Had we maintained our previous approach, underlying profit before tax would have been US$1.7bn higher in 2012. This was mainly due to the elimination of the US Card and Retail Services business.
26
Table of Contents
HSBC HOLDINGS PLC
Report of the Directors: Operating and Financial Review(continued)
We use underlying performance when monitoring progress against operating plans and past results because we believe that this basis more appropriately reflects operating performance. We use underlying performance in our commentaries to explain year-on-year changes when the effect of fair
value movements on own debt, acquisitions, disposals or dilution is significant.
The following acquisitions, disposals and changes to ownership levels affected the underlying performance:
Disposal gains/(losses) affecting underlying performance
| Date | Disposal gain/(loss) | |||||||
| US$m | ||||||||
HSBC Financial Services (Middle East) Limited’s disposal of majority stake in HSBC Private Equity Middle East Limited | Jun 2011 | (7 | ) | |||||
Dilution gain on our holding in Ping An following the issue of share capital to a third party | Jun 2011 | 181 | ||||||
Grupo Financiero HSBC, S.A. de C.V.’s disposal of HSBC Afore S.A. de C.V.30 | Aug 2011 | 83 | ||||||
Dilution gain as a result of the merger between HSBC Saudi Arabia Limited and SABB Securities Limited | Dec 2011 | 27 | ||||||
HSBC Bank Canada’s disposal of HSBC Securities (Canada) Inc’s full service retail brokerage business30 | Jan 2012 | 83 | ||||||
The Hongkong and Shanghai Banking Corporation Limited’s disposal of RBWM operations in Thailand30 | Mar 2012 | 108 | ||||||
HSBC Finance Corporation, HSBC USA Inc. and HSBC Technology and Services (USA) Inc.’s disposal of US Card and Retail Services business30 | May 2012 | 3,148 | ||||||
HSBC Bank USA, N.A.’s disposal of 138 non-strategic branches30 | May 2012 | 661 | ||||||
HSBC Argentina Holdings S.A.’s disposal of its general insurance manufacturing subsidiary30 | May 2012 | 102 | ||||||
The Hongkong and Shanghai Banking Corporation Limited’s disposal of its private banking business in Japan30 | Jun 2012 | 67 | ||||||
The Hongkong and Shanghai Banking Corporation Limited’s disposal of its shareholding in a property company in the Philippines | Jun 2012 | 130 | ||||||
HSBC Bank USA, N.A.’s disposal of 57 non-strategic branches30 | Aug 2012 | 203 | ||||||
Hang Seng Bank Limited’s disposal of its general insurance manufacturing subsidiary30 | Jul 2012 | 46 | ||||||
HSBC Asia Holdings B.V.’s investment loss on a subsidiary30 | Aug 2012 | (85 | ) | |||||
HSBC Bank plc’s disposal of HSBC Securities SA | Aug 2012 | (11 | ) | |||||
HSBC Europe ( Netherlands) B.V.’s disposal of HSBC Credit Zrt | Aug 2012 | (2 | ) | |||||
HSBC Europe ( Netherlands) B.V.’s disposal of HSBC Insurance (Ireland) Limited | Oct 2012 | (12 | ) | |||||
HSBC Europe ( Netherlands) B.V.’s disposal of HSBC Reinsurance Limited | Oct 2012 | 7 | ||||||
HSBC Private Bank (UK) Limited’s disposal of Property Vision Holdings Limited | Oct 2012 | (1 | ) | |||||
HSBC Investment Bank Holdings Limited’s disposal of its stake in Havas Havalimanlari Yer Hizmetleri Yatirim Holding Anonim Sirketi | Oct 2012 | 18 | ||||||
HSBC Insurance (Asia) Limited’s disposal of its general insurance portfolios30 | Nov 2012 | 117 | ||||||
HSBC Bank plc’s disposal of HSBC Shipping Services Limited | Nov 2012 | (2 | ) | |||||
HSBC Bank (Panama) S.A.’s disposal of its operations in Costa Rica, El Salvador and Honduras30 | Dec 2012 | (62 | ) | |||||
HSBC Insurance Holdings Limited and The Hongkong and Shanghai Banking Corporation Limited’s disposal of their shares in Ping An30 | Dec 2012 | 3,012 | ||||||
The Hongkong and Shanghai Banking Corporation Limited’s disposal of its shareholding in Global Payments Asia-Pacific Limited30 | Dec 2012 | 212 | ||||||
For footnote, see page 120.
Acquisition gains/(losses) affecting the underlying performance
| Date | Fair value gain on acquisition | |||||||
| US$m | ||||||||
Our share of the loss recorded by Ping An on re-measurement of its previously held equity interest in Ping An bank (formerly known as Shenzhen Development Bank) when Ping An took control and fully consolidated Ping An Bank | Jul 2011 | (48 | ) | |||||
Gain on the merger of Oman International Bank S.A.O.G. and the Omani operations of HSBC Bank Middle East Limited | Jun 2012 | 3 | ||||||
Gain on the acquisition of the onshore retail and commercial banking business of Lloyds Banking Group in the UAE by HSBC Bank Middle East Limited | Oct 2012 | 18 | ||||||
27
Table of Contents
HSBC HOLDINGS PLC
Report of the Directors: Operating and Financial Review(continued)
The following table reconciles our reported revenue, loan impairment charges, operating expenses and profit before tax for 2012 and 2011 to an underlying basis. Throughout thisAnnual Report and Accounts, we reconcile other reported results to underlying results when doing so results in
a more useful discussion of operating performance. Equivalent tables are provided for each of our global businesses and geographical segments in the Form 20-F filed with the Securities and Exchange Commission (‘SEC’), which is available on www.hsbc.com.
Reconciliation of reported and underlying items
| 2012 | 2011 | Change25 | ||||||||||||||
| US$m | US$m | % | ||||||||||||||
Revenue21 | ||||||||||||||||
Reported revenue | 68,330 | 72,280 | (5 | ) | ||||||||||||
Currency translation adjustment24 | (2,033 | ) | ||||||||||||||
Own credit spread26 | 5,215 | (3,933 | ) | |||||||||||||
Acquisitions, disposals and dilutions | (10,048 | ) | (6,976 | ) | ||||||||||||
Underlying revenue | 63,497 | 59,338 | 7 | |||||||||||||
Loan impairment charges and other credit risk provisions (‘LIC’s) | ||||||||||||||||
Reported LICs | (8,311 | ) | (12,127 | ) | 31 | |||||||||||
Currency translation adjustment24 | 277 | |||||||||||||||
Acquisitions, disposals and dilutions | 338 | 1,619 | ||||||||||||||
Underlying LICs | (7,973 | ) | (10,231 | ) | 22 | |||||||||||
Operating expenses | ||||||||||||||||
Reported operating expenses | (42,927 | ) | (41,545 | ) | (3 | ) | ||||||||||
Currency translation adjustment24 | 1,273 | |||||||||||||||
Acquisitions, disposals and dilutions | 1,004 | 2,666 | ||||||||||||||
Underlying operating expenses | (41,923 | ) | (37,606 | ) | (11 | ) | ||||||||||
Underlying cost efficiency ratio | 66.0% | 63.4% | ||||||||||||||
Profit before tax | ||||||||||||||||
Reported profit before tax | 20,649 | 21,872 | (6 | ) | ||||||||||||
Currency translation adjustment24 | (428 | ) | ||||||||||||||
Own credit spread26 | 5,215 | (3,933 | ) | |||||||||||||
Acquisitions, disposals and dilutions | (9,479 | ) | (3,650 | ) | ||||||||||||
Underlying profit before tax | 16,385 | 13,861 | 18 | |||||||||||||
By global business28 | ||||||||||||||||
Retail Banking and Wealth Management | 4,001 | 871 | 359 | |||||||||||||
Commercial Banking | 7,941 | 7,691 | 3 | |||||||||||||
Global Banking and Markets | 8,371 | 6,735 | 24 | |||||||||||||
Global Private Banking | 954 | 945 | 1 | |||||||||||||
Other | (4,882 | ) | (2,381 | ) | (105 | ) | ||||||||||
Underlying profit before tax | 16,385 | 13,861 | 18 | |||||||||||||
By geographical region28 | ||||||||||||||||
Europe | 699 | 1,629 | (57 | ) | ||||||||||||
Hong Kong | 7,162 | 5,761 | 24 | |||||||||||||
Rest of Asia-Pacific | 6,403 | 6,249 | 2 | |||||||||||||
Middle East and North Africa | 1,380 | 1,417 | (3 | ) | ||||||||||||
North America | (1,499 | ) | (3,076 | ) | 51 | |||||||||||
Latin America | 2,240 | 1,881 | 19 | |||||||||||||
Underlying profit before tax | 16,385 | 13,861 | 18 | |||||||||||||
For footnotes, see page 120.
28
Table of Contents
HSBC HOLDINGS PLC
Report of the Directors: Operating and Financial Review(continued)
Five-year summary consolidated income statement
2012 US$m | 2011 US$m | 2010 US$m | 2009 US$m | 2008 US$m | ||||||||||||||||||||||||
Net interest income | 37,672 | 40,662 | 39,441 | 40,730 | 42,563 | |||||||||||||||||||||||
Net fee income | 16,430 | 17,160 | 17,355 | 17,664 | 20,024 | |||||||||||||||||||||||
Net trading income | 7,091 | 6,506 | 7,210 | 9,863 | 6,560 | |||||||||||||||||||||||
Net income/(expense) from financial instruments designated at fair value | (2,226 | ) | 3,439 | 1,220 | (3,531 | ) | 3,852 | |||||||||||||||||||||
Gains less losses from financial investments | 1,189 | 907 | 968 | 520 | 197 | |||||||||||||||||||||||
Dividend income | 221 | 149 | 112 | 126 | 272 | |||||||||||||||||||||||
Net earned insurance premiums | 13,044 | 12,872 | 11,146 | 10,471 | 10,850 | |||||||||||||||||||||||
Gains on disposal of French regional banks | – | – | – | – | 2,445 | |||||||||||||||||||||||
Gains on disposal of US branch network, US cards business and Ping An | 7,024 | – | – | – | – | |||||||||||||||||||||||
Other operating income | 2,100 | 1,766 | 2,562 | 2,788 | 1,808 | |||||||||||||||||||||||
Gains arising from dilution of interests in associates and joint ventures | – | 208 | 188 | – | – | |||||||||||||||||||||||
Other | 2,100 | 1,558 | 2,374 | 2,788 | 1,808 | |||||||||||||||||||||||
Total operating income | 82,545 | 83,461 | 80,014 | 78,631 | 88,571 | |||||||||||||||||||||||
Net insurance claims incurred and movement in liabilities to policyholders | (14,215 | ) | (11,181 | ) | (11,767 | ) | (12,450 | ) | (6,889 | ) | ||||||||||||||||||
Net operating income before loan impairment charges and other credit risk provisions | 68,330 | 72,280 | 68,247 | 66,181 | 81,682 | |||||||||||||||||||||||
Loan impairment charges and other credit risk provisions | (8,311 | ) | (12,127 | ) | (14,039 | ) | (26,488 | ) | (24,937 | ) | ||||||||||||||||||
Net operating income | 60,019 | 60,153 | 54,208 | 39,693 | 56,745 | |||||||||||||||||||||||
Total operating expenses34 | (42,927 | ) | (41,545 | ) | (37,688 | ) | (34,395 | ) | (49,099 | ) | ||||||||||||||||||
Operating profit | 17,092 | 18,608 | 16,520 | 5,298 | 7,646 | |||||||||||||||||||||||
Share of profit in associates and joint ventures | 3,557 | 3,264 | 2,517 | 1,781 | 1,661 | |||||||||||||||||||||||
Profit before tax | 20,649 | 21,872 | 19,037 | 7,079 | 9,307 | |||||||||||||||||||||||
Tax expense | (5,315 | ) | (3,928 | ) | (4,846 | ) | (385 | ) | (2,809 | ) | ||||||||||||||||||
Profit for the year | 15,334 | 17,944 | 14,191 | 6,694 | 6,498 | |||||||||||||||||||||||
Profit attributable to shareholders of the parent company | 14,027 | 16,797 | 13,159 | 5,834 | 5,728 | |||||||||||||||||||||||
Profit attributable to non-controlling interests | 1,307 | 1,147 | 1,032 | 860 | 770 | |||||||||||||||||||||||
| Five-year financial information | ||||||||||||||||||||||||||||
| US$ | US$ | US$ | US$ | US$ | ||||||||||||||||||||||||
Basic earnings per share35 | 0.74 | 0.92 | 0.73 | 0.34 | 0.41 | |||||||||||||||||||||||
Diluted earnings per share35 | 0.74 | 0.91 | 0.72 | 0.34 | 0.41 | |||||||||||||||||||||||
Basic earnings excluding goodwill impairment per share34,35 | 0.74 | 0.92 | 0.73 | 0.34 | 1.19 | |||||||||||||||||||||||
Dividends per ordinary share1 | 0.41 | 0.39 | 0.34 | 0.34 | 0.93 | |||||||||||||||||||||||
| % | % | % | % | % | ||||||||||||||||||||||||
Dividend payout ratio36 | ||||||||||||||||||||||||||||
– reported | 55.4 | 42.4 | 46.6 | 100.0 | 226.8 | |||||||||||||||||||||||
– excluding goodwill impairment34 | 55.4 | 42.4 | 46.6 | 100.0 | 78.2 | |||||||||||||||||||||||
Post-tax return on average total assets | 0.6 | 0.65 | 0.57 | 0.27 | 0.26 | |||||||||||||||||||||||
Return on average ordinary shareholders’ equity | 8.4 | 10.9 | 9.5 | 5.1 | 4.7 | |||||||||||||||||||||||
Average foreign exchange translation rates to US$: | ||||||||||||||||||||||||||||
US$1: £ | 0.631 | 0.624 | 0.648 | 0.641 | 0.545 | |||||||||||||||||||||||
US$1: € | 0.778 | 0.719 | 0.755 | 0.719 | 0.684 | |||||||||||||||||||||||
For footnotes, see page 120.
29
Table of Contents
HSBC HOLDINGS PLC
Report of the Directors: Operating and Financial Review(continued)
Reported profit before tax of US$20.6bn in 2012 was US$1.2bn, or 6%, lower than in 2011. This was primarily due to adverse fair value movements on own debt attributable to credit spreads of US$5.2bn, compared with favourable movements of US$3.9bn in 2011. The variance was partially offset by US$7.5bn of gains (net of losses) on disposals, in particular in respect of the US Card and Retail Services business and our associate, Ping An. Our remaining shareholding in Ping An has been reclassified as a financial investment (see Note 26 on the Financial Statements), the sale of which was completed on 6 February 2013.
We expect disposal of the Card and Retail Services business in North America and of our associate shares in Ping An in Rest of Asia-Pacific to have a significant impact on our profits in each of these regions for the foreseeable future. In addition, future profits in Rest of Asia-Pacific are expected to be affected by the dilution of our shareholding in Industrial Bank Co. Limited (‘Industrial Bank’), following its issue of additional share capital to third parties on 7 January 2013. Our shareholding in Industrial Bank has now been classified as a financial investment.
On an underlying basis, profit before tax rose by 18%, primarily due to higher net operating income before loan impairment charges and other credit risk provisions (‘revenue’) and lower loan impairment charges and other credit risk provisions, which were partially offset by an increase in operating expenses. The latter was primarily driven by fines and penalties paid as part of the settlement of investigations into past inadequate compliance with anti-money laundering and sanctions laws of US$1.9bn, and a higher provision for UK customer redress programmes of US$1.4bn.
The following commentary is on an underlying basis, except where otherwise stated. The difference between reported and underlying results is explained and reconciled on page 26.
Revenue of US$63.5bn was US$4.2bn, or 7%, higher than in 2011, primarily due to lower adverse movements on non-qualifying hedges which accounted for US$1.1bn of the increase, and revenue growth in GB&M and CMB.
Revenue growth in GB&M mainly reflected higher Rates and Credit income, notably in Europe, as spreads tightened and investor sentiment improved following stimuli by central banks globally.
In CMB, revenue growth primarily reflected increased net interest income as a result of average balance sheet growth. Customer loans and advances
grew in all regions, with over half this growth coming from our faster-growing regions of Hong Kong, Rest of Asia-Pacific and Latin America, driven by trade-related lending. In Europe, lending balances increased, notably in the UK, despite muted demand for credit. Customer deposits also rose as we continued to attract deposits through our Payments and Cash Management products.
Revenue growth in RBWM reflected increased insurance income, mainly in Hong Kong and Latin America, which benefited from higher investment returns and increased sales of life insurance products. In addition, net interest income grew, mainly in Hong Kong and Latin America, reflecting higher average lending and deposit balances. These factors were partially offset by the continued run-off of our Consumer and Mortgage Lending (‘CML’) portfolio in the US.
Loan impairment charges and other credit risk provisions were US$2.3bn lower than in 2011. This primarily reflected a decrease in North America, mainly due to the continued decline in lending balances and lower delinquency rates in the CML portfolio. In addition, in Europe there were lower credit risk provisions on available-for-sale asset-backed securities (‘ABS’s) driven by an improvement in underlying asset prices, and lower loan impairment charges in RBWM, most notably in the UK, as delinquency rates improved across both unsecured and secured lending portfolios. These factors were partially offset by increased loan impairment charges and other credit risk provisions in Latin America, particularly in Brazil, which were primarily due to higher delinquency rates in RBWM and in Business Banking in CMB. In Rest of Asia-Pacific, there were also higher individually assessed loan impairments on a small number of customers in CMB.
Operating expenses were higher than in 2011, primarily from fines and penalties paid as part of the settlement of investigations into past inadequate compliance with anti-money laundering and sanctions laws of US$1.9bn, as well as an increase in provisions relating to UK customer redress programmes of US$1.4bn. In addition, in 2011 operating expenses included a credit of US$570m relating to defined benefit pension obligations in the UK, which did not recur.
The charges for UK customer redress programmes include estimates in respect of possible mis-selling in previous years of payment protection insurance (‘PPI’) policies of US$1.7bn and interest rate protection products of US$598m. The additional provision relating to PPI reflects our recent claims
30
Table of Contents
HSBC HOLDINGS PLC
Report of the Directors: Operating and Financial Review(continued)
experience. The provision in relation to interest rate protection products reflects an estimate of possible customer redress requirements following an independent review carried out at the request of the Financial Services Authority (‘FSA’). There are many factors which affect these estimated liabilities and there remains a high degree of uncertainty as to the eventual cost of redress for these matters.
Operating expenses also increased due to inflationary pressures, for example, on wages and salaries, in certain of our Latin American and Asian markets. Other increases arose from investment in strategic initiatives including certain business expansion projects, enhanced processes and technology capabilities, and increased investment in regulatory and compliance infrastructure, primarily in the US. These factors were partly offset by US$2.0bn of sustainable cost savings achieved across all regions, as we continued with our organisational effectiveness programmes during 2012. The number of full time equivalent staff numbers (‘FTEs’) fell by more than 27,700, reflecting the planned net reduction of staff numbers across the Group from organisational effectiveness initiatives and business disposals.
On a constant currency basis,income from associates increased, mainly driven by strong results in our mainland China associates. The contribution from Bank of Communications Co., Limited (‘BoCom’) and Industrial Bank rose due to loan growth and higher fee income. These factors were partially offset by a decline in income from Ping An due to market valuation losses on equity securities held by their insurance business, reflecting volatile domestic equity markets.
The reportedprofit after tax was US$2.6bn or 15% lower than in 2011, reflecting a decrease in taxable profits, and a higher tax charge in 2012. The increased tax charge included the effect of the non-tax deductible charge for fines and penalties paid as part of the settlement of investigations into past inadequate compliance with anti-money laundering and sanctions laws, together with the non-recognition of the tax benefit in respect of the accounting charge associated with negative fair value movements on own debt. The lower tax charge in 2011 included the benefit of US foreign tax credits. The effective tax rate in 2012 was 26% compared with 18% in 2011.
Notable revenue items by geographical region
| Europe | Hong Kong | Rest of Asia- Pacific | MENA | North America | Latin America | Total | ||||||||||||||||||||||||||||||||||
| US$m | US$m | US$m | US$m | US$m | US$m | US$m | ||||||||||||||||||||||||||||||||||
2012 | ||||||||||||||||||||||||||||||||||||||||
Non-qualifying hedges | (51 | ) | (31 | ) | (20 | ) | – | (194 | ) | – | (296 | ) | ||||||||||||||||||||||||||||
Ping An contingent forward sale contract37 | – | – | (553 | ) | – | – | – | (553 | ) | |||||||||||||||||||||||||||||||
Gain on sale of non-core investments in India | – | 314 | – | – | – | – | 314 | |||||||||||||||||||||||||||||||||
Loss recognised following the classification of businesses to held for sale | – | – | – | – | – | (96 | ) | (96 | ) | |||||||||||||||||||||||||||||||
2011 | ||||||||||||||||||||||||||||||||||||||||
Non-qualifying hedges | (291 | ) | (14 | ) | (20 | ) | – | (1,067 | ) | – | (1,392 | ) | ||||||||||||||||||||||||||||
Refinement of PVIF calculation | 95 | 135 | 11 | – | – | 2 | 243 | |||||||||||||||||||||||||||||||||
2010 | ||||||||||||||||||||||||||||||||||||||||
Non-qualifying hedges | (691 | ) | (17 | ) | 4 | – | (353 | ) | – | (1,057 | ) | |||||||||||||||||||||||||||||
Notable revenue items by global business
Retail and Wealth | Commercial Banking | Global Banking and Markets | Global Private Banking | Other | Total | |||||||||||||||||||||||||||||
| US$m | US$m | US$m | US$m | US$m | US$m | |||||||||||||||||||||||||||||
2012 | ||||||||||||||||||||||||||||||||||
Non-qualifying hedges | (193 | ) | – | (42 | ) | 4 | (65 | ) | (296 | ) | ||||||||||||||||||||||||
Ping An contingent forward sale contract37 | – | – | – | – | (553 | ) | (553 | ) | ||||||||||||||||||||||||||
Gain on sale of non-core investments in India | – | – | – | – | 314 | 314 | ||||||||||||||||||||||||||||
Loss recognised following the classification of businesses to held for sale | (26 | ) | (35 | ) | (27 | ) | – | (8 | ) | (96 | ) | |||||||||||||||||||||||
2011 | ||||||||||||||||||||||||||||||||||
Non-qualifying hedges | (1,038 | ) | – | 90 | (5 | ) | (439 | ) | (1,392 | ) | ||||||||||||||||||||||||
Refinement of PVIF calculation | 181 | 62 | – | – | – | 243 | ||||||||||||||||||||||||||||
2010 | ||||||||||||||||||||||||||||||||||
Non-qualifying hedges | (310 | ) | – | (309 | ) | 1 | (439 | ) | (1,057 | ) | ||||||||||||||||||||||||
For footnote, see page 120.
31
Table of Contents
HSBC HOLDINGS PLC
Report of the Directors: Operating and Financial Review(continued)
Notable cost items by geographical region38
| Europe | Hong Kong | Rest of Asia- Pacific | MENA | North America | Latin America | Total | ||||||||||||||||||||||||||||||||||
| US$m | US$m | US$m | US$m | US$m | US$m | US$m | ||||||||||||||||||||||||||||||||||
2012 | ||||||||||||||||||||||||||||||||||||||||
Restructuring and other related costs | 299 | 31 | 131 | 27 | 221 | 167 | 876 | |||||||||||||||||||||||||||||||||
UK customer redress programmes | 2,338 | – | – | – | – | – | 2,338 | |||||||||||||||||||||||||||||||||
UK bank levy | 472 | – | – | – | – | – | 472 | |||||||||||||||||||||||||||||||||
Fines and penalties for inadequate compliance with anti-money laundering and sanction laws | 375 | – | – | – | 1,546 | – | 1,921 | |||||||||||||||||||||||||||||||||
US mortgage foreclosure and servicing costs | – | – | – | – | 104 | – | 104 | |||||||||||||||||||||||||||||||||
2011 | ||||||||||||||||||||||||||||||||||||||||
Restructuring and other related costs | 404 | 68 | 45 | 31 | 236 | 338 | 1,122 | |||||||||||||||||||||||||||||||||
UK customer redress programmes | 898 | – | – | – | – | – | 898 | |||||||||||||||||||||||||||||||||
UK bank levy | 570 | – | – | – | – | – | 570 | |||||||||||||||||||||||||||||||||
UK pension credit | (587 | ) | – | – | – | – | – | (587 | ) | |||||||||||||||||||||||||||||||
Payroll tax | (13 | ) | – | – | – | – | – | (13 | ) | |||||||||||||||||||||||||||||||
US mortgage foreclosure and servicing costs | – | – | – | – | 257 | – | 257 | |||||||||||||||||||||||||||||||||
2010 | ||||||||||||||||||||||||||||||||||||||||
Restructuring and other related costs | 87 | 15 | 36 | – | 13 | 3 | 154 | |||||||||||||||||||||||||||||||||
UK customer redress programmes | 78 | – | – | – | – | – | 78 | |||||||||||||||||||||||||||||||||
US accounting gain on change in staff benefits | – | – | – | – | (148 | ) | – | (148 | ) | |||||||||||||||||||||||||||||||
Payroll tax | 324 | – | – | – | – | – | 324 | |||||||||||||||||||||||||||||||||
Notable cost items by global business38
| Retail Banking and Wealth Management | Commercial Banking | Global Banking and Markets | Global Private Banking | Other | Total | |||||||||||||||||||||||||||||
| US$m | US$m | US$m | US$m | US$m | US$m | |||||||||||||||||||||||||||||
2012 | ||||||||||||||||||||||||||||||||||
Restructuring and other related costs | 266 | 62 | 63 | 58 | 427 | 876 | ||||||||||||||||||||||||||||
UK customer redress programmes | 1,751 | 258 | 331 | (2 | ) | – | 2,338 | |||||||||||||||||||||||||||
UK bank levy | – | – | – | – | 472 | 472 | ||||||||||||||||||||||||||||
Fines and penalties for inadequate compliance with anti-money laundering and sanction laws | – | – | – | – | 1,921 | 1,921 | ||||||||||||||||||||||||||||
US mortgage foreclosure and servicing costs | 104 | – | – | – | – | 104 | ||||||||||||||||||||||||||||
2011 | ||||||||||||||||||||||||||||||||||
Restructuring and other related costs | 405 | 122 | 158 | 38 | 399 | 1,122 | ||||||||||||||||||||||||||||
UK customer redress programmes | 875 | 23 | – | – | – | 898 | ||||||||||||||||||||||||||||
UK bank levy | – | – | – | – | 570 | 570 | ||||||||||||||||||||||||||||
UK pension credit | (264 | ) | (212 | ) | (111 | ) | – | – | (587 | ) | ||||||||||||||||||||||||
Payroll tax | – | – | (13 | ) | – | – | (13 | ) | ||||||||||||||||||||||||||
US mortgage foreclosure and servicing costs | 257 | – | – | – | – | 257 | ||||||||||||||||||||||||||||
2010 | ||||||||||||||||||||||||||||||||||
Restructuring and other related costs | 22 | 1 | 4 | – | 127 | 154 | ||||||||||||||||||||||||||||
UK customer redress programmes | 78 | – | – | – | – | 78 | ||||||||||||||||||||||||||||
US accounting gain on change in staff benefits | (99 | ) | (16 | ) | (19 | ) | (5 | ) | (9 | ) | (148 | ) | ||||||||||||||||||||||
Payroll tax | 5 | 3 | 307 | 9 | – | 324 | ||||||||||||||||||||||||||||
For footnote, see page 120.
32
Table of Contents
HSBC HOLDINGS PLC
Report of the Directors: Operating and Financial Review(continued)
Group performance by income and expense item
2012 US$m | 2011 US$m | 2010 US$m | ||||||||||||||
Interest income | 56,702 | 63,005 | 58,345 | |||||||||||||
Interest expense | (19,030 | ) | (22,343 | ) | (18,904 | ) | ||||||||||
Net interest income39 | 37,672 | 40,662 | 39,441 | |||||||||||||
Average interest-earning assets | 1,625,068 | 1,622,658 | 1,472,294 | |||||||||||||
Gross interest yield40 | 3.49% | 3.88% | 3.96% | |||||||||||||
Less: cost of funds | (1.36% | ) | (1.56% | ) | (1.41% | ) | ||||||||||
Net interest spread41 | 2.13% | 2.32% | 2.55% | |||||||||||||
Net interest margin42 | 2.32% | 2.51% | 2.68% | |||||||||||||
Summary of interest income by type of asset
| 2012 | 2011 | 2010 | ||||||||||||||||||||||||||||||||||||||||||||||||||
Average balance US$m | Interest income US$m | Yield % | Average balance US$m | Interest income US$m | Yield % | Average balance US$m | Interest income US$m | Yield % | ||||||||||||||||||||||||||||||||||||||||||||
Short-term funds and loans and advances to banks | 275,979 | 4,307 | 1.56 | 261,749 | 5,860 | 2.24 | 236,742 | 4,555 | 1.92 | |||||||||||||||||||||||||||||||||||||||||||
Loans and advances to customers | 934,656 | 41,043 | 4.39 | 945,288 | 45,250 | 4.79 | 858,499 | 44,186 | 5.15 | |||||||||||||||||||||||||||||||||||||||||||
Financial investments | 387,329 | 9,078 | 2.34 | 384,059 | 10,229 | 2.66 | 378,971 | 9,375 | 2.47 | |||||||||||||||||||||||||||||||||||||||||||
Other interest-earning assets43 | 27,104 | 2,274 | 8.39 | 31,562 | 1,666 | 5.28 | (1,918 | ) | 229 | (11.94 | ) | |||||||||||||||||||||||||||||||||||||||||
Total interest-earning assets | 1,625,068 | 56,702 | 3.49 | 1,622,658 | 63,005 | 3.88 | 1,472,294 | 58,345 | 3.96 | |||||||||||||||||||||||||||||||||||||||||||
Trading assets and financial assets designated at fair value44,45 | 368,406 | 6,931 | 1.88 | 410,038 | 8,671 | 2.11 | 385,203 | 7,060 | 1.83 | |||||||||||||||||||||||||||||||||||||||||||
Impairment provisions | (17,421 | ) | (18,738 | ) | (22,905 | ) | ||||||||||||||||||||||||||||||||||||||||||||||
Non-interest-earning assets | 730,901 | 752,965 | 664,308 | |||||||||||||||||||||||||||||||||||||||||||||||||
Total assets and interest income | 2,706,954 | 63,633 | 2.35 | 2,766,923 | 71,676 | 2.59 | 2,498,900 | 65,405 | 2.62 | |||||||||||||||||||||||||||||||||||||||||||
Summary of interest expense by type of liability and equity
| ||||||||||||||||||||||||||||||||||||||||||||||||||||
| 2012 | 2011 | 2010 | ||||||||||||||||||||||||||||||||||||||||||||||||||
Average balance US$m | Interest expense US$m | Cost % | Average balance US$m | Interest expense US$m | Cost % | Average balance US$m | Interest expense US$m | Cost % | ||||||||||||||||||||||||||||||||||||||||||||
Deposits by banks46 | 92,803 | 1,160 | 1.25 | 106,099 | 1,591 | 1.50 | 111,443 | 1,136 | 1.02 | |||||||||||||||||||||||||||||||||||||||||||
Financial liabilities designated at fair value – own debt issued47 | 75,016 | 1,325 | 1.77 | 73,635 | 1,313 | 1.78 | 66,706 | 1,271 | 1.91 | |||||||||||||||||||||||||||||||||||||||||||
Customer accounts48 | 1,052,812 | 10,878 | 1.03 | 1,058,326 | 13,456 | 1.27 | 962,613 | 10,778 | 1.12 | |||||||||||||||||||||||||||||||||||||||||||
Debt securities in issue | 161,348 | 4,755 | 2.95 | 181,482 | 5,260 | 2.90 | 189,898 | 4,931 | 2.60 | |||||||||||||||||||||||||||||||||||||||||||
Other interest-bearing liabilities | 19,275 | 912 | 4.73 | 14,024 | 723 | 5.16 | 8,730 | 788 | 9.03 | |||||||||||||||||||||||||||||||||||||||||||
Total interest-bearing liabilities | 1,401,254 | 19,030 | 1.36 | 1,433,566 | 22,343 | 1.56 | 1,339,390 | 18,904 | 1.41 | |||||||||||||||||||||||||||||||||||||||||||
Trading liabilities and financial liabilities designated at fair value (excluding own debt issued) | 318,883 | 3,445 | 1.08 | 355,345 | 4,564 | 1.28 | 275,804 | 3,780 | 1.37 | |||||||||||||||||||||||||||||||||||||||||||
Non-interest bearing current accounts | 177,085 | 162,369 | 142,579 | |||||||||||||||||||||||||||||||||||||||||||||||||
Total equity and other non-interest bearing liabilities | 809,732 | 815,643 | 741,127 | |||||||||||||||||||||||||||||||||||||||||||||||||
Total equity and liabilities | 2,706,954 | 22,475 | 0.83 | 2,766,923 | 26,907 | 0.97 | 2,498,900 | 22,684 | 0.91 | |||||||||||||||||||||||||||||||||||||||||||
For footnotes, see page 120.
33
Table of Contents
HSBC HOLDINGS PLC
Report of the Directors: Operating and Financial Review(continued)
The commentary in the following sections is on a constant currency basis unless otherwise stated.
Reported net interest income decreased by 7%. On a constant currency basis, it declined by 5%.
On an underlying basis, excluding net interest income earned by the businesses sold during 2012 (see page 29) from all periods presented (2012: US$1.6bn; 2011: US$4.8bn) and currency translation movements of US$1.2bn, net interest income rose by 4%. This reflected strong balance sheet growth in Hong Kong and Rest of Asia-Pacific, together with a lower cost of funds in Latin America driven by a decline in interest rates in Brazil.
The decrease in both net interest spread and net interest margin compared with 2011 was attributable to significantly lower yields on customer lending and on our surplus liquidity, partly offset by a reduction in our cost of funds, notably on customer accounts.
Interest income was lower than in 2011. This was driven by lower interest income on customer lending, including loans classified within ‘Assets held for sale’, due in part to the loss of interest income from disposals during 2012, principally in the US. These disposals also led to a change in the composition of our lending book as the decline in higher yielding card balances was replaced by volume growth in relatively lower yielding products, mainly residential mortgages and term lending, in Hong Kong, Rest of Asia-Pacific and Europe. Growth in average residential mortgage balances reflected the success of marketing campaigns and competitive pricing in the UK, the continued strength in the property market in Hong Kong and the expansion of our distribution network in Rest of Asia-Pacific. Average term lending balances increased in Hong Kong and Rest of Asia-Pacific as we capitalised on trade and capital flows, while the rise in Europe was in spite of muted demand for credit. As a result of the change in composition of the lending book, the gross yield on customer lending fell.
Revenue in Balance Sheet Management also decreased, principally in Europe as yield curves continued to flatten and liquidity arising from maturities and sales of available-for-sale debt securities was re-invested at lower prevailing rates. In addition, we placed a greater portion of our liquidity with central banks. This was partly offset by higher revenue in Rest of Asia-Pacific, notably mainland China, as strong customer deposit growth led to a rise in the size of the available-for-sale debt securities portfolio.
The decline in interest income was partly offset by lower interest expense, notably on customer accounts. This was driven by a reduction in the cost of funds on customer accounts in Latin America, notably in Brazil, and in Europe due to the downward movement in interest rates during the year, together with deposit repricing initiatives in the US and Europe. The reduction in average customer account balances due to the disposal of non-strategic branches in the US was largely offset by significant volume growth in other parts of the business, notably in Hong Kong, reflecting more conservative customer behaviour during the year in RBWM, and in Rest of Asia-Pacific, as a result of new mandates and deposit acquisition in Payments and Cash Management in CMB and GB&M.
Interest expense on deposits by banks decreased, mainly in Europe. This was due to lower placements by other financial institutions with HSBC, in part due to lower interest rates offered, together with a reduction in the cost of sale and repurchase (‘repo’) funding as market rates fell. Lower average balances and interest rates in Brazil also contributed to the decline.
There was also a decrease in interest expense on debt securities issued by the Group, driven by a net reduction in average balances outstanding, mainly in North America and, to a lesser extent, in Europe. Funding requirements in the US fell as a result of the business disposals and continued reduction of the CML portfolio in run-off and, as a consequence, maturing debt was not replaced and some of the outstanding debt was repaid with the proceeds from the sales. In addition, maturing debt was not replaced in Europe. These decreases were partly offset by higher interest expense in Latin America, as a result of new debt issued, principally in 2011. The Group’s cost of funds on debt securities rose as the new issuances in Latin America were at a higher effective interest rate than that paid in other parts of the Group. The replacement of short-term debt by the issuance of medium-term notes in Europe also contributed to the rise in the cost of funds of debt securities in issue.
‘Net interest income’ includes the expense of internally funding trading assets, while related revenue is reported in ‘Net trading income’. The internal cost of funding of these assets declined, reflecting the reduction in average trading assets during the year. In reporting our global business results, this cost is included within ‘Net trading income’.
34
Table of Contents
HSBC HOLDINGS PLC
Report of the Directors: Operating and Financial Review(continued)
| 2012 US$m | 2011 US$m | 2010 US$m | ||||||||||||||
Account services | 3,563 | 3,670 | 3,632 | |||||||||||||
Cards | 3,030 | 3,955 | 3,801 | |||||||||||||
Funds under management | 2,561 | 2,753 | 2,511 | |||||||||||||
Credit facilities | 1,761 | 1,749 | 1,635 | |||||||||||||
Broking income | 1,350 | 1,711 | 1,789 | |||||||||||||
Imports/exports | 1,196 | 1,103 | 991 | |||||||||||||
Remittances | 819 | 770 | 680 | |||||||||||||
Unit trusts | 739 | 657 | 560 | |||||||||||||
Underwriting | 739 | 578 | 623 | |||||||||||||
Global custody | 737 | 751 | 700 | |||||||||||||
Insurance | 696 | 1,052 | 1,147 | |||||||||||||
Corporate finance | 370 | 441 | 440 | |||||||||||||
Trust income | 283 | 294 | 291 | |||||||||||||
Investment contracts | 141 | 136 | 109 | |||||||||||||
Mortgage servicing | 86 | 109 | 118 | |||||||||||||
Taxpayer financial services | – | 2 | 73 | |||||||||||||
Maintenance income on operating leases | – | – | 99 | |||||||||||||
Other | 2,078 | 1,766 | 1,918 | |||||||||||||
Fee income | 20,149 | 21,497 | 21,117 | |||||||||||||
Less: fee expense | (3,719 | ) | (4,337 | ) | (3,762 | ) | ||||||||||
Net fee income | 16,430 | 17,160 | 17,355 | |||||||||||||
Net fee income decreased by US$730m on a reported basis, and by US$294m on a constant currency basis.
On an underlying basis, which excludes the net fee income relating to the business disposals listed on page 29 (2012: US$401m and 2011:US$1.41bn) and currency translation movements of US$436m, net fee income rose by US$726m, or 5%.
The reduction on a constant currency basis was primarily due to the sale of the Card and Retail Services business, which led to a reduction in cards and insurance fee income and fee expenses. As part of that transaction, we entered into a transition service agreement with the purchaser to support certain account servicing operations until they are integrated into the purchaser’s infrastructure. We receive fees for providing these services, which are reported in ‘Other fee income’. The associated costs are reported in ‘Operating expenses’.
Broking income fell, most notably in Hong Kong and Europe, due to reduced transaction volumes reflecting investor sentiment. Income from funds under management (‘FuM’) fell, mainly in
Rest of Asia-Pacific, as customers invested in lower yielding products reflecting their lower risk appetite. Income from FuM was also lower in North America, due to the sale of the full service retail brokerage business in Canada. In Europe, the decline was mainly due to challenging market conditions in the latter half of 2011 which led to a fall in average client assets in 2012 as well as net new money outflows and a fall in client numbers within GPB.
Partly offsetting these reductions was growth in underwriting fees as we actively captured increased client demand for debt capital financing in North America, Hong Kong and Europe in 2012, in part, reflecting the enhanced collaboration between CMB and GB&M. Trade-related income also increased, most notably in Europe and Hong Kong, reflecting increased transaction volumes as we capitalised on our global network to capture cross-border trade flows.
Fees from unit trusts also rose in Hong Kong, reflecting higher sales volumes.
35
Table of Contents
HSBC HOLDINGS PLC
Report of the Directors: Operating and Financial Review(continued)
2012 US$m | 2011 US$m | 2010 US$m | ||||||||||||||
Trading activities | 5,249 | 4,873 | 5,708 | |||||||||||||
Ping An contingent forward sale contract37 | (553 | ) | – | – | ||||||||||||
Net interest income on trading activities | 2,683 | 3,223 | 2,530 | |||||||||||||
Other trading income – hedge ineffectiveness: | ||||||||||||||||
– on cash flow hedges | 35 | 26 | (9 | ) | ||||||||||||
– on fair value hedges | (27 | ) | (224 | ) | 38 | |||||||||||
Non-qualifying hedges | (296 | ) | (1,392 | ) | (1,057 | ) | ||||||||||
Net trading income49,50 | 7,091 | 6,506 | 7,210 | |||||||||||||
For footnotes, see page 120.
Reported net trading income of US$7.1bn was US$585m higher than in 2011. On a constant currency basis, net trading income rose by US$849m, driven by lower adverse fair value movements on non-qualifying hedges. Net income from trading activities rose in GB&M, but this was more than offset by lower net interest income on trading activities and adverse fair value movements on the contingent forward sale contract relating to Ping An.
There were lower adverse fair value movements on non-qualifying hedges. These hedges are derivatives entered into as part of a documented interest rate management strategy for which hedge accounting was not, nor could be, applied. They are principally cross-currency and interest rate swaps used to economically hedge fixed rate debt issued by HSBC Holdings and floating rate debt issued by HSBC Finance Corporation (‘HSBC Finance’). The size and direction of the changes in the fair value of non-qualifying hedges that are recognised in the income statement can be volatile from year-to-year, but do not alter the cash flows expected as part of the documented interest rate management strategy for both the instruments and the underlying economically hedged assets and liabilities if the derivative is held to maturity. In North America, there were lower adverse fair value movements on non-qualifying hedges as US long-term interest rates declined to a lesser extent than in 2011. There were also lower adverse fair value movements on non-qualifying hedges in Europe. This was driven by favourable fair value movements in HSBC Holdings, compared with adverse fair value movements in 2011, reflecting the less pronounced decline in long-term US interest rates relative to sterling and euro interest rates compared with 2011. This was partly offset by adverse movements in European operating entities as interest rates fell.
During 2012, HSBC Finance terminated approximately US$3.0bn of non-qualifying hedges. A further US$2.4bn of non-qualifying hedges were
terminated in January 2013 to better align our hedges with the overall interest rate position in HSBC Finance. The losses on these economic hedges reported in previous years were therefore crystallised.
Net income from trading activities increased compared with 2011, driven by a strong performance in GB&M. This was after taking into account a net charge of US$385m in the fourth quarter of 2012 as a result of a change in estimation methodology in respect of credit valuation adjustments on derivative assets and debit valuation adjustments on derivative liabilities to reflect evolving market practices (see page 441).
Rates revenue was significantly higher, notably in Europe, as spreads on government debt securities tightened and investor sentiment improved following stimuli by central banks. This was despite significant adverse fair value movements due to own credit spreads on structured liabilities as spreads tightened, compared with a gain reported in 2011, together with a credit valuation adjustment charge of US$837m. The improvement in market sentiment also led to tighter spreads on corporate debt securities, resulting in strong growth in Credit revenue. Foreign Exchange revenue was broadly in line with 2011, as higher income resulting from enhanced collaboration between GB&M and CMB, and increased volumes from improvements in our electronic pricing and distribution capabilities, offset the effect of less volatile markets in 2012. These favourable movements were partly offset by a reduction in Equities trading revenue, reflecting a decline in market volumes together with adverse fair value movements on structured liabilities as own credit spreads tightened in 2012, compared with favourable movements in 2011.
These factors were partly offset by unfavourable fair value movements on assets held as economic hedges of foreign currency debt at fair value compared with favourable movements in 2011, due to movements in the underlying currencies. These offset favourable foreign exchange
36
Table of Contents
HSBC HOLDINGS PLC
Report of the Directors: Operating and Financial Review(continued)
movements on foreign currency debt which are reported in ‘Net expense from financial instruments designated at fair value’.
Net interest income on trading activities also declined. This was driven by a significant reduction in average trading assets, notably holdings of debt securities in Europe, in the latter part of 2011 and the first quarter of 2012 as eurozone sovereign debt concerns dominated the market. In addition, yields fell as a result of both price appreciation in a low
interest rate environment and an increase in the proportion of the portfolio invested in relatively lower-yielding treasury bills and government debt securities. This was partly offset by a reduction in funding costs, reflecting both the decline in the size of the portfolio and the low rate environment.
There were also adverse fair value movements of US$553m on the contingent forward sale contract relating to Ping An (see page 472).
Net income/(expense) from financial instruments designated at fair value
2012 US$m | 2011 US$m | 2010 US$m | ||||||||||||||
Net income/(expense) arising from: | ||||||||||||||||
– financial assets held to meet liabilities under insurance and investment contracts | 2,980 | (933 | ) | 2,349 | ||||||||||||
– liabilities to customers under investment contracts | (996 | ) | 231 | (946 | ) | |||||||||||
– HSBC’s long-term debt issued and related derivatives | (4,327 | ) | 4,161 | (258 | ) | |||||||||||
Change in own credit spread on long-term debt | (5,215 | ) | 3,933 | (63 | ) | |||||||||||
Other changes in fair value51 | 888 | 228 | (195 | ) | ||||||||||||
– other instruments designated at fair value and related derivatives | 117 | (20 | ) | 75 | ||||||||||||
Net income/(expense) from financial instruments designated at fair value | (2,226 | ) | 3,439 | 1,220 | ||||||||||||
Assets and liabilities from which net income/(expense) from financial instruments designated at fair value arose
|
| |||||||||||||||
2012 US$m | 2011 US$m | 2010 US$m | ||||||||||||||
Financial assets designated at fair value at 31 December | 33,582 | 30,856 | 37,011 | |||||||||||||
Financial liabilities designated at fair value at 31 December | 87,720 | 85,724 | 88,133 | |||||||||||||
Including: | ||||||||||||||||
Financial assets held to meet liabilities under: | ||||||||||||||||
– insurance contracts and investment contracts with DPF52 | 8,376 | 7,221 | 7,167 | |||||||||||||
– unit-linked insurance and other insurance and investment contracts | 23,655 | 20,033 | 19,725 | |||||||||||||
Long-term debt issues designated at fair value | 74,768 | 73,808 | 69,906 | |||||||||||||
For footnotes, see page 120.
The accounting policies for the designation of financial instruments at fair value and the treatment of the associated income and expenses are described in Notes 2i and 2b on the Financial Statements, respectively.
The majority of the financial liabilities designated at fair value are fixed-rate long-term debt issues, the rate profile of which has been changed to floating through interest rate swaps as part of a documented interest rate management strategy. The movement in fair value of these long-term debt issues and the related hedges includes the effect of our credit spread changes and any ineffectiveness in the economic relationship between the related swaps and own debt. As credit spreads widen or narrow, accounting profits or losses, respectively, are booked. The size and direction of the changes in the credit spread on our debt and ineffectiveness, which are recognised in the income statement, can be volatile from year to
year, but do not alter the cash flows expected as part of the documented interest rate management strategy. As a consequence, fair value movements arising from changes in our own credit spread on long-term debt and other fair value movements on the debt and related derivatives are not regarded internally as part of managed performance and are therefore not allocated to global businesses, but are reported in ‘Other’. Credit spread movements on own debt designated at fair value are excluded from underlying results, and related fair value movements are not included in the calculation of regulatory capital.
We reported net expense from financial instruments designated at fair value of US$2.2bn in 2012 compared with net income of US$3.4bn in 2011. This included the credit spread-related movements in the fair value of our own long-term debt, on which we reported adverse fair value movements of US$5.2bn in 2012 and favourable
37
Table of Contents
HSBC HOLDINGS PLC
Report of the Directors: Operating and Financial Review(continued)
movements of US$3.9bn in 2011. The adverse fair value movements arose in 2012 as credit spreads tightened in Europe and North America, having widened during 2011.
Net income arising from financial assets held to meet liabilities under insurance and investment contracts reflected net investment gains in 2012 as global equity market conditions improved, compared with net investment losses in 2011. This predominantly affected the value of assets held to support unit-linked contracts in the UK and Hong Kong, insurance contracts with discretionary participation features (‘DPF’) in Hong Kong, and investment contracts with DPF in France.
The investment gains or losses arising from equity markets result in a corresponding movement in liabilities to customers, reflecting the extent to which unit-linked policyholders, in particular, participate in the investment performance of the
associated asset portfolio. Where these relate to assets held to back investment contracts, the corresponding movement in liabilities to customers is also recorded under ‘Net income/(expense) from financial instruments designated at fair value’. This is in contrast to gains or losses related to assets held to back insurance contracts or investment contracts with DPF, where the corresponding movement in liabilities to customers is recorded under ‘Net insurance claims incurred and movement in liabilities to policyholders’.
Within net income from financial instruments designated at fair value were favourable foreign exchange movements in 2012, compared with adverse movements in 2011, on foreign currency debt designated at fair value issued as part of our overall funding strategy. An offset from assets held as economic hedges was reported in ‘Net trading income’.
Gains less losses from financial investments
2012 US$m | 2011 US$m | 2010 US$m | ||||||||||||||
Net gains/(losses) from disposal of: | ||||||||||||||||
– debt securities | 781 | 712 | 564 | |||||||||||||
– equity securities | 823 | 360 | 516 | |||||||||||||
– other financial investments | 5 | 12 | (7 | ) | ||||||||||||
| 1,609 | 1,084 | 1,073 | ||||||||||||||
Impairment of available-for-sale equity securities | (420 | ) | (177 | ) | (105 | ) | ||||||||||
Gains less losses from financial investments | 1,189 | 907 | 968 | |||||||||||||
Gains less losses from financial investments increased by US$282m on a reported basis and US$310m on a constant currency basis.
The increase was driven by higher net gains from the disposal of available-for-sale equity securities, notably in Hong Kong as a result of the sale of our shares in four Indian banks. In addition, we reported a rise in disposal gains in Principal Investments in GB&M.
Higher gains were also reported on the disposal of available-for-sale government debt securities, principally in the UK as part of Balance Sheet
Management’s structural interest rate risk management activities. This was partly offset by losses on the disposal of legacy assets in GB&M in the UK (see page 18), together with the non-recurrence of gains in 2011 on the disposal of available-for-sale debt securities in our Insurance business in RBWM, also in Europe.
There were higher impairments of available-for-sale equity securities due to significant write-downs in 2012 on three holdings, two of which were in our direct investment business, which is in run-off.
2012 US$m | 2011 US$m | 2010 US$m | ||||||||||||||
Gross insurance premium income | 13,602 | 13,338 | 11,609 | |||||||||||||
Reinsurance premiums | (558 | ) | (466 | ) | (463 | ) | ||||||||||
Net earned insurance premiums | 13,044 | 12,872 | 11,146 | |||||||||||||
38
Table of Contents
HSBC HOLDINGS PLC
Report of the Directors: Operating and Financial Review(continued)
Net earned insurance premiums were broadly in line with 2011 on a reported basis. On a constant currency basis net earned premiums increased by 6%.
The rise in net earned premium income was driven by Hong Kong and Latin America. In Hong Kong, sales of insurance contracts increased, in particular deferred annuity products, as we widened our product offerings to fulfil customers’ long-term savings and retirement needs, supported by successful marketing campaigns. Renewal premiums from both unit-linked and insurance contracts with DPF also increased reflecting strong sales in previous years. The increase in net earned premiums in Latin America was due to higher sales of unit-linked and
term life products in Brazil, reflecting customer appetite for life insurance products. It was partly offset by a decrease in net earned premiums following the sale of the general insurance business in Argentina in May 2012. In Europe, net earned premiums decreased, mainly on investment contracts with DPF in France, as a result of the uncertain economic and political environment in the election year and increased product competition. The non-renewal and transfer to third parties of certain contracts in our Irish business during 2011 also contributed to the decline. This was partly offset by a rise in net earned premiums in the UK due, in part, to the sale of a unit-linked insurance product through two new third party platforms.
Gains on disposal of US branch network, US cards business and Ping An
2012 US$m | 2011 US$m | 2010 US$m | ||||||||||||||
Gains on disposal of US branch network | 864 | – | – | |||||||||||||
Gains on disposal of US cards business | 3,148 | – | – | |||||||||||||
Gains on disposal of Ping An | 3,012 | – | – | |||||||||||||
Total | 7,024 | – | – | |||||||||||||
Significant progress was made in 2012 in exiting non-strategic markets and disposing of businesses and investments not aligned with the Group’s long-term strategy. These included three major disposals:
| • | In May 2012, HSBC USA Inc., HSBC Finance and HSBC Technology and Services (USA) Inc. sold their US Card and Retail Services business to Capital One Financial Corporation, realising a gain on sale of US$3.1bn. |
| • | In May 2012, HSBC Bank USA, N.A. (‘HSBC Bank USA’) sold 138 out of 195 branches primarily in upstate New York to First Niagara Bank, realising a gain of US$661m. In August 2012, it sold the remaining 57 branches to the same purchaser, realising a gain of US$203m. |
| • | In December 2012, HSBC Insurance Holdings Limited and The Hongkong and Shanghai Banking Corporation agreed to sell to indirect wholly-owned subsidiaries of Charoen Pokphand Group Company Limited their entire shareholdings in Ping An, representing 15.57% of the issued share capital of Ping An, in two tranches. The first tranche was completed on 7 December 2012. The completion of the second tranche took place on 6 February 2013. The disposal of this associate resulted in a gain of US$3.0bn in 2012 (see page 472). Our remaining shareholding has been classified as a financial investment. |
2012 US$m | 2011 US$m | 2010 US$m | ||||||||||||||
Rent received | 210 | 217 | 535 | |||||||||||||
Gains/(losses) recognised on assets held for sale | 485 | 55 | (263 | ) | ||||||||||||
Valuation gains on investment properties | 72 | 118 | 93 | |||||||||||||
Gain on disposal of property, plant and equipment, intangible assets and non-financial investments | 187 | 57 | 701 | |||||||||||||
Gains arising from dilution of interests in associates and joint ventures | – | 208 | 188 | |||||||||||||
Change in present value of in-force long-term insurance business | 737 | 726 | 705 | |||||||||||||
Other | 409 | 385 | 603 | |||||||||||||
Other operating income | 2,100 | 1,766 | 2,562 | |||||||||||||
39
Table of Contents
HSBC HOLDINGS PLC
Report of the Directors: Operating and Financial Review(continued)
Change in present value of in-force long-term insurance business
2012 US$m | 2011 US$m | 2010 US$m | ||||||||||||||
Value of new business | 1,027 | 943 | 737 | |||||||||||||
Expected return | (420 | ) | (428 | ) | (85 | ) | ||||||||||
Assumption changes and experience variances | 69 | (30 | ) | 59 | ||||||||||||
Other adjustments | 61 | 241 | (6 | ) | ||||||||||||
Change in present value of in-force long-term insurance business | 737 | 726 | 705 | |||||||||||||
Reported other operating income of US$2.1bn increased by 19% in 2012. On a constant currency basis, it rose by 25% as a result of business disposals during the year.
We continued to rationalise our portfolio in non-strategic markets, resulting in a number of gains and losses on disposal which are excluded from our underlying results (see page 28). These included gains of US$108m on the sale of our RBWM operations in Thailand, US$130m on the sale of our shareholding in a property company in the Philippines, US$163m on the sales of the HSBC and Hang Seng general insurance businesses in Hong Kong, US$102m following the completion of the sale of our general insurance manufacturing business in Argentina, and US$212m following the sale of our shares in Global Payments Asia-Pacific Ltd. The gains on disposal were partly offset by an investment loss on a subsidiary of US$85m in the Middle East and North Africa and a loss of US$62m on the sale of our operations in Costa Rica, Honduras and El Salvador.
Reported other operating income in 2011 included a gain of US$181m arising from a dilution of our holding in Ping An following its issue of share capital to a third party and a gain of US$83m from the sale of HSBC Afore S.A. de C.V. (‘HSBC Afore’), our Mexican pension business.
On an underlying basis, excluding the gains and losses on disposal totalling US$747m in 2012 and US$354m in 2011, other operating income rose.
This was due to lower losses on foreclosed properties due to the reduction in foreclosure activity in the US, less deterioration in housing prices during 2012 and, in some markets, improvements in pricing compared with 2011 in the US.
The present value of in-force (‘PVIF’) long-term insurance business asset was broadly in line with 2011. The value of new business from the sale of life insurance products, favourable investment returns, together with the recognition of a PVIF asset relating to the unit-linked pension products in Brazil contributed to a rise. In addition, there were lower adverse changes to non-economic assumptions, including mortality and lapse rates in Hong Kong and North America in 2012. These factors were substantially offset by adverse assumption changes in 2012, principally relating to the valuation of policyholder options and guarantees in Hong Kong, along with the non-recurrence of a gain of US$237m (US$243m as reported) recognised upon refinement of the PVIF asset in 2011.
The increase in other operating income was partly offset by losses recognised on the sale of syndicated loans in Europe and on the reclassification of certain businesses to held-for-sale in South America. In addition, a gain on sale and leaseback of branches in Mexico recognised in 2011 did not recur.
Net insurance claims incurred and movement in liabilities to policyholders
2012 US$m | 2011 US$m | 2010 US$m | ||||||||||||||
Insurance claims incurred and movement in liabilities to policyholders: | ||||||||||||||||
– gross | 14,529 | 11,631 | 11,969 | |||||||||||||
– reinsurers’ share | (314 | ) | (450 | ) | (202 | ) | ||||||||||
– net53 | 14,215 | 11,181 | 11,767 | |||||||||||||
For footnote, see page 120.
Net insurance claims incurred and movement in liabilities to policyholders increased by 27% on a reported basis, and by 33% on a constant currency basis.
The increase in liabilities to policyholders largely resulted from gains in the fair value of the assets where the policyholders bear the investment risk, particularly in relation to unit-linked insurance
40
Table of Contents
HSBC HOLDINGS PLC
Report of the Directors: Operating and Financial Review(continued)
contracts and investment and insurance contracts with DPF.
The higher investment returns were largely the result of positive equity market movements in 2012 compared with losses experienced during 2011 notably in Hong Kong, France and the UK. The gains or losses on the financial assets designated at fair value held to support these insurance and investment contract liabilities are reported in ‘Net income from financial instruments designated at fair value’.
The increase in liabilities to policyholders also reflected the increase in new business written, notably in Hong Kong and Brazil as explained under ‘Net earned insurance premiums’. This was partly offset by a lower increase in reserves in France attributable to the decline in net earned premiums, and a decrease in Argentina due to the sale of the general insurance business in May 2012.
Loan impairment charges and other credit risk provisions
2012 US$m | 2011 US$m | 2010 US$m | ||||||||||||||
Loan impairment charges | ||||||||||||||||
New allowances net of allowance releases | 9,306 | 12,931 | 14,568 | |||||||||||||
Recoveries of amounts previously written off | (1,146 | ) | (1,426 | ) | (1,020 | ) | ||||||||||
| 8,160 | 11,505 | 13,548 | ||||||||||||||
Individually assessed allowances | 2,139 | 1,915 | 2,625 | |||||||||||||
Collectively assessed allowances | 6,021 | 9,590 | 10,923 | |||||||||||||
Impairment of available-for-sale debt securities | 99 | 631 | 472 | |||||||||||||
Other credit risk provisions/(recoveries) | 52 | (9 | ) | 19 | ||||||||||||
Loan impairment charges and other credit risk provisions | 8,311 | 12,127 | 14,039 | |||||||||||||
Reported loan impairment charges and other credit risk provisions (‘LIC’s) fell from US$12bn to US$8.3bn, a decrease of 31% compared with 2011. On an underlying basis they reduced from US$10bn to US$8.0bn.
On a constant currency basis, they declined by US$3.5bn or 30% compared with 2011. Collectively assessed allowances were down by US$3.3bn and credit risk provisions fell by US$456m, partly offset by higher individually assessed impairment charges of US$258m.
At 31 December 2012, the aggregate balance of customer loan impairment allowances was US$16bn. This represented 2% of gross loans and advances to customers (net of reverse repos and settlement accounts) in line with 31 December 2011.
The fall in collectively assessed impairment allowances was most significant in RBWM in North America due to the continued reduction in the CML portfolios in run-off, and the sale of the Card and Retail Services business. In addition, lower loan impairment charges in Europe in RBWM were due to improved credit quality as we continued to pro-actively identify and monitor customers facing financial hardship and focused our lending growth on higher quality assets, notably in the UK. These factors were partly offset by higher loan impairment charges and other credit risk provisions in Latin America which were driven by increased delinquency rates in RBWM and CMB, mainly in Brazil.
Impairment of available-for-sale debt securities reduced, mainly in Europe, due to lower charges on available-for-sale ABSs and on Greek sovereign debt, partly offset by an increase in Rest of Asia-Pacific due to a charge on an available-for-sale debt security in GB&M.
Individually assessed impairment allowances increased by 14%, primarily in Europe in CMB, reflecting challenging economic conditions in the UK, Greece, Spain and Turkey. In addition, higher individually assessed impairments in Latin America mainly related to a single exposure in Brazil.
LICs declined in North America, primarily in the CML portfolio, as well as in Europe, Hong Kong and the Middle East and North Africa. The decrease was partly offset by an increase in Latin America and Rest of Asia-Pacific.
In North America, LICs fell by 51% to US$3.5bn. Within this, loan impairment charges fell by US$1.3bn following the sale of the Card and Retail Services business. Loan impairment charges in our CML business in the US fell by 48% to US$2.6bn, driven by lower lending balances, as we continued to run off the portfolio, and lower delinquency levels. Loan impairment charges continued to be adversely affected by delays in expected cash flows from mortgage loans due, in part, to delays in foreclosure processing, although the effects were less pronounced than in 2011. These decreases were partly offset by an adjustment made
41
Table of Contents
HSBC HOLDINGS PLC
Report of the Directors: Operating and Financial Review(continued)
following a review completed in the fourth quarter of 2012 which concluded that the estimated average period of time from current status to write-off was ten months for real estate loans. In CMB and GB&M, loan impairment charges increased, mainly in Bermuda, due to individually assessed impairments on a small number of exposures.
In Europe, LICs decreased by 22% to US$1.9bn. This was mainly in GB&M due to lower credit risk provisions on available-for-sale ABSs as a result of an improvement in underlying asset prices, as well as lower charges on Greek sovereign debt. Further information on our exposures to countries in the eurozone is provided on page 192. This was partly offset by increased impairment charges on the legacy credit loans and receivables portfolio. In RBWM, loan impairment charges continued to decline, primarily in the UK, as we focused our lending growth on higher quality assets and continued to pro-actively identify and monitor customers facing financial hardship. As a result, delinquency rates improved across both the secured and unsecured lending portfolios. This was partly offset by an increase in impairments in Turkey due to strong growth in previous years in our RBWM customer loans and advances. In addition, there were higher individually assessed provisions in CMB across a range of sectors, reflecting increased stress on the financial status of certain customers in the challenging economic conditions in certain eurozone countries.
In Hong Kong, LICs fell by 53% to US$74m, largely due to lower specific impairment charges in CMB and the non-recurrence of charges relating to available-for-sale Greek sovereign debt securities.
In the Middle East and North Africa, LICs decreased by US$6m to US$286m. Lower loan impairment charges in RBWM reflected repositioning of the book towards higher quality secured lending in previous years. This was largely offset by higher LICs recorded for a small number of large exposures in GB&M.
LICs in Latin America and Rest of Asia-Pacific increased compared with 2011. In Latin America, they increased by 29% to US$2.1bn. This was mainly in Brazil, driven by increased delinquency rates in RBWM and CMB, particularly in the Business Banking portfolio reflecting lower economic growth in 2012. We took a number of steps to reposition the portfolios in RBWM and CMB including improving our collections capabilities, reducing third-party originations and lowering credit limits where appropriate. Loan impairment charges fell in Brazil during the second half of 2012, mainly due to lower collective portfolio provisions.
In Rest of Asia-Pacific, LICs increased by 64% to US$436m, notably in CMB as a result of the impairment of a corporate exposure in Australia and a small number of corporate exposures in India, as well as a credit risk provision on an available-for-sale debt security in GB&M.
2012 US$m | 2011 US$m | 2010 US$m | ||||||||||||||
By expense category | ||||||||||||||||
Employee compensation and benefits | 20,491 | 21,166 | 19,836 | |||||||||||||
Premises and equipment (excluding depreciation and impairment) | 4,326 | 4,503 | 4,348 | |||||||||||||
General and administrative expenses | 15,657 | 12,956 | 10,808 | |||||||||||||
Administrative expenses | 40,474 | 38,625 | 34,992 | |||||||||||||
Depreciation and impairment of property, plant and equipment | 1,484 | 1,570 | 1,713 | |||||||||||||
Amortisation and impairment of intangible assets | 969 | 1,350 | 983 | |||||||||||||
Operating expenses | 42,927 | 41,545 | 37,688 | |||||||||||||
Staff numbers (full-time equivalents)
| At 31 December | ||||||||||||||||
| 2012 | 2011 | 2010 | ||||||||||||||
Europe | 70,061 | 74,892 | 75,698 | |||||||||||||
Hong Kong | 27,742 | 28,984 | 29,171 | |||||||||||||
Rest of Asia-Pacific | 85,024 | 91,051 | 91,607 | |||||||||||||
Middle East and North Africa | 8,765 | 8,373 | 8,676 | |||||||||||||
North America | 22,443 | 30,981 | 33,865 | |||||||||||||
Latin America | 46,556 | 54,035 | 56,044 | |||||||||||||
Staff numbers | 260,591 | 288,316 | 295,061 | |||||||||||||
42
Table of Contents
HSBC HOLDINGS PLC
Report of the Directors: Operating and Financial Review(continued)
Reported operating expenses of US$42.9bn were US$1.4bn or 3% higher than in 2011. On an underlying basis, costs increased by 11%.
On a constant currency basis, operating expenses in 2012 were US$2.7bn or 7% higher than in 2011, primarily driven by fines and penalties paid as part of the settlement of investigations into past inadequate compliance with anti-money laundering and sanction laws of US$1.9bn, of which US$1.5bn was attributed to, and paid by, HSBC North America Holdings Inc. (‘HNAH’) and its subsidiaries and US$375m was paid by HSBC Holdings. Further provisions for the UK customer redress programmes of US$2.3bn were raised during 2012 compared with a charge of US$890m in 2011 (US$898m as reported). This included a charge for additional estimated redress for possible mis-selling in previous years of PPI policies US$1.7bn (2011: US$713m) and interest rate protection products (US$598m), which took the balance sheet provision for the UK customer redress programmes at 31 December 2012 to US$2.2bn.
In 2011 we recorded a credit of US$570m (US$587m as reported) following a change in the inflation measure used to calculate the defined benefit obligation in the UK for deferred pensions which did not recur in 2012.
Costs also rose due to inflationary pressures in certain of our Latin American and Asian markets and increased investment costs in strategic initiatives, including certain business expansion projects, and in enhanced processes and technology capabilities. We also increased investment in our regulatory and compliance infrastructure primarily in the US.
The above increases in costs were mitigated by strict cost control and the continued delivery of our organisational effectiveness programmes, which resulted in sustainable cost savings of US$2.0bn. The number of employees (expressed in FTEs) at the end of the 2012 was 10% lower than at the end of 2011. This reflected the planned net reduction of staff numbers across the Group from organisational effectiveness initiatives and business disposals. In 2012, average FTEs fell by 7%.
Business disposals in 2011 and 2012 resulted in a lower cost base, most significantly from the sale of the Card and Retail Services business and the 195 branches in the US.
Restructuring and other related costs were US$876m in 2012 compared with US$1.1bn in 2011 (US$1.1bn as reported).
Cost efficiency ratios4
2012 % | 2011 % | 2010 % | ||||||||||||||
HSBC | 62.8 | 57.5 | 55.2 | |||||||||||||
Geographical regions | ||||||||||||||||
Europe | 108.4 | 70.4 | 67.9 | |||||||||||||
Hong Kong | 39.0 | 44.5 | 43.4 | |||||||||||||
Rest of Asia-Pacific | 42.7 | 54.2 | 55.7 | |||||||||||||
Middle East and North Africa | 48.0 | 44.5 | 44.7 | |||||||||||||
North America | 60.8 | 55.7 | 48.8 | |||||||||||||
Latin America | 58.7 | 63.3 | 65.7 | |||||||||||||
Global businesses | ||||||||||||||||
Retail Banking and Wealth Management | 58.4 | 63.2 | 58.1 | |||||||||||||
Commercial Banking | 45.9 | 46.3 | 49.4 | |||||||||||||
Global Banking and Markets | 54.2 | 57.0 | 48.8 | |||||||||||||
Global Private Banking | 67.6 | 68.8 | 65.8 | |||||||||||||
For footnote, see page 120.
Share of profit in associates and joint ventures
2012 US$m | 2011 US$m | 2010 US$m | ||||||||||||||
Associates | ||||||||||||||||
Bank of Communications Co., Limited | 1,670 | 1,370 | 987 | |||||||||||||
Ping An Insurance (Group) Company of China, Ltd | 763 | 946 | 848 | |||||||||||||
Industrial Bank Co., Limited | 670 | 471 | 327 | |||||||||||||
The Saudi British Bank | 346 | 308 | 161 | |||||||||||||
Other | 72 | 126 | 156 | |||||||||||||
Share of profit in associates | 3,521 | 3,221 | 2,479 | |||||||||||||
Share of profit in joint ventures | 36 | 43 | 38 | |||||||||||||
Share of profit in associates and joint ventures | 3,557 | 3,264 | 2,517 | |||||||||||||
43
Table of Contents
HSBC HOLDINGS PLC
Report of the Directors: Operating and Financial Review(continued)
The reported share of profit in associates and joint ventures was US$3.6bn, an increase of 9% compared with 2011. On a constant currency basis, it increased by 7%, driven by higher contributions from our associates in mainland China.
Our share of profits from BoCom rose, as a result of loan growth and higher fee income from cards, management service and guarantees and commitments. This was partly offset by increased operating expenses reflecting investment in staff and technology, and higher loan impairment charges. Profits from Industrial Bank also increased, reflecting continued growth in lending balances and a rise in associated fee income, partly offset by higher operating expenses in line with business expansion, as well as increased loan impairment charges. On 7 January 2013, our holding in Industrial Bank was diluted following its issue of additional share capital to third parties. Our
shareholding has now been classified as a financial investment.
Profits from The Saudi British Bank rose, driven by higher revenues reflecting strong balance sheet growth and lower costs resulting from effective control and monitoring.
Profits from Ping An were lower due to market valuation losses on equity securities held by their insurance business, reflecting volatile domestic equity markets, partly offset by increased income from the banking business reflecting the contribution of Ping An Bank (formerly Shenzhen Development Bank). On 5 December 2012, we agreed to sell our entire shareholding in Ping An and recognised a gain on the disposal of the associate. Our remaining shareholding has been classified as a financial investment (see page 39 for details of this transaction).
2012 US$m | 2011 US$m | 2010 US$m | ||||||||||||||
Profit before tax | 20,649 | 21,872 | 19,037 | |||||||||||||
Tax expense | (5,315 | ) | (3,928 | ) | (4,846 | ) | ||||||||||
Profit after tax | 15,334 | 17,944 | 14,191 | |||||||||||||
Effective tax rate | 25.7% | 18.0% | 25.5% | |||||||||||||
The tax charge in 2012 was US$1.4bn or 35% higher than in 2011 on a reported basis.
The higher tax charge in 2012 reflected the non-tax deductible effect of fines and penalties paid as part of the settlement of investigations into past inadequate compliance with anti-money laundering and sanctions laws, together with the non-recognition of the tax benefit in respect of the accounting charge associated with negative fair value movements on own debt. The lower tax charge in 2011 included the benefit of US deferred tax recognised in 2011 in respect of foreign tax credits.
As a result of these factors, the reported effective tax rate for 2012 was 25.7 % compared with 18.0% for 2011.
In 2012, the tax paid by the Group was US$9.3bn (2011: US$8.0bn). The amount differs from the tax charge reported in the income statement due to indirect taxes such as VAT and the bank levy included in the pre-tax profit and the timing of payments.
The Group also plays a major role as tax collector for governments in the jurisdictions in which we operate. In 2012, the Group collected US$8.5bn (2011: US$8.7bn).
44
Table of Contents
HSBC HOLDINGS PLC
Report of the Directors: Operating and Financial Review(continued)
Reconciliation of reported and underlying profit before tax31
| 2011 compared with 2010 | ||||||||||||||||||||||||||||||||||||||||||||||||||||
| HSBC | 2010 as | 2010 ments32 US$m | Currency translation adjustment 24 US$m | 2010 at 2011 rates33 US$m | 2011 as reported US$m | 2011 adjust- ments32 US$m | 2011 lying | Re- change25 % | Under- change25 % | |||||||||||||||||||||||||||||||||||||||||||
Net interest income | 39,441 | 48 | 781 | 40,270 | 40,662 | – | 40,662 | 3 | 1 | |||||||||||||||||||||||||||||||||||||||||||
Net fee income | 17,355 | (55 | ) | 349 | 17,649 | 17,160 | – | 17,160 | (1 | ) | (3 | ) | ||||||||||||||||||||||||||||||||||||||||
Own credit spread26 | (63 | ) | 63 | – | – | 3,933 | (3,933 | ) | – | |||||||||||||||||||||||||||||||||||||||||||
Other income27 | 11,514 | (847 | ) | 284 | 10,951 | 10,525 | (291 | ) | 10,234 | (9 | ) | (7 | ) | |||||||||||||||||||||||||||||||||||||||
Net operating income21 | 68,247 | (791 | ) | 1,414 | 68,870 | 72,280 | (4,224 | ) | 68,056 | 6 | (1 | ) | ||||||||||||||||||||||||||||||||||||||||
Loan impairment charges and other credit risk provisions | (14,039 | ) | – | (206 | ) | (14,245 | ) | (12,127 | ) | – | (12,127 | ) | 14 | 15 | ||||||||||||||||||||||||||||||||||||||
Net operating income | 54,208 | (791 | ) | 1,208 | 54,625 | 60,153 | (4,224 | ) | 55,929 | 11 | 2 | |||||||||||||||||||||||||||||||||||||||||
Operating expenses | (37,688 | ) | 220 | (842 | ) | (38,310 | ) | (41,545 | ) | – | (41,545 | ) | (10 | ) | (8 | ) | ||||||||||||||||||||||||||||||||||||
Operating profit | 16,520 | (571 | ) | 366 | 16,315 | 18,608 | (4,224 | ) | 14,384 | 13 | (12 | ) | ||||||||||||||||||||||||||||||||||||||||
Income from associates | 2,517 | – | 93 | 2,610 | 3,264 | 48 | 3,312 | 30 | 27 | |||||||||||||||||||||||||||||||||||||||||||
Profit before tax | 19,037 | (571 | ) | 459 | 18,925 | 21,872 | (4,176 | ) | 17,696 | 15 | (6 | ) | ||||||||||||||||||||||||||||||||||||||||
By geographical region | ||||||||||||||||||||||||||||||||||||||||||||||||||||
Europe | 4,302 | (88 | ) | 167 | 4,381 | 4,671 | (2,947 | ) | 1,724 | 9 | (61 | ) | ||||||||||||||||||||||||||||||||||||||||
Hong Kong | 5,692 | (130 | ) | (10 | ) | 5,552 | 5,823 | – | 5,823 | 2 | 5 | |||||||||||||||||||||||||||||||||||||||||
Rest of Asia-Pacific | 5,902 | (187 | ) | 227 | 5,942 | 7,471 | (135 | ) | 7,336 | 27 | 23 | |||||||||||||||||||||||||||||||||||||||||
Middle East and North Africa | 892 | 42 | (10 | ) | 924 | 1,492 | (41 | ) | 1,451 | 67 | 57 | |||||||||||||||||||||||||||||||||||||||||
North America | 454 | (208 | ) | 39 | 285 | 100 | (970 | ) | (870 | ) | (78 | ) | ||||||||||||||||||||||||||||||||||||||||
Latin America | 1,795 | – | 46 | 1,841 | 2,315 | (83 | ) | 2,232 | 29 | 21 | ||||||||||||||||||||||||||||||||||||||||||
Profit before tax | 19,037 | (571 | ) | 459 | 18,925 | 21,872 | (4,176 | ) | 17,696 | 15 | (6 | ) | ||||||||||||||||||||||||||||||||||||||||
By global business | ||||||||||||||||||||||||||||||||||||||||||||||||||||
Retail Banking and Wealth Management | 3,839 | (3 | ) | 126 | 3,962 | 4,270 | (83 | ) | 4,187 | 11 | 6 | |||||||||||||||||||||||||||||||||||||||||
Commercial Banking | 6,090 | (119 | ) | 126 | 6,097 | 7,947 | – | 7,947 | 30 | 30 | ||||||||||||||||||||||||||||||||||||||||||
Global Banking and Markets | 9,215 | (262 | ) | 198 | 9,151 | 7,049 | – | 7,049 | (24 | ) | (23 | ) | ||||||||||||||||||||||||||||||||||||||||
Global Private Banking | 1,054 | – | 6 | 1,060 | 944 | – | 944 | (10 | ) | (11 | ) | |||||||||||||||||||||||||||||||||||||||||
Other | (1,161 | ) | (187 | ) | 3 | (1,345 | ) | 1,662 | (4,093 | ) | (2,431 | ) | (81 | ) | ||||||||||||||||||||||||||||||||||||||
Profit before tax | 19,037 | (571 | ) | 459 | 18,925 | 21,872 | (4,176 | ) | 17,696 | 15 | (6 | ) | ||||||||||||||||||||||||||||||||||||||||
For footnotes, see page 120.
Consolidated income statement
Reported profit before tax of US$21.9bn in 2011 was US$2.8bn higher than in 2010, primarily due to US$3.9bn of favourable fair value movements on own debt attributable to credit spreads compared with a negative movement of US$63m in 2010. On an underlying basis, profit before tax was 6% lower than in 2010 due to increased operating expenses which were partly offset by lower loan impairment charges and other credit risk provisions.
The results of the Group continued to be adversely affected by the losses in the US consumer
finance business, which were US$2.4bn in 2011 and US$2.2bn in 2010. We have agreed to sell the profitable US Card and Retail Services portfolio, with the remainder of the loss-making US consumer finance business being run down. We expect the sale of this business to have a significant impact on both revenue and profitability in North America for the foreseeable future.
The difference between reported and underlying results is explained on page 26. Except where stated otherwise, the commentaries in the Financial Summary are on an underlying basis and references to HSBC Finance Corporation (‘HSBC Finance’) and
44a
Table of Contents
HSBC HOLDINGS PLC
Report of the Directors: Operating and Financial Review(continued)
HSBC Bank USA N.A. (‘HSBC Bank USA’) are on a management basis, rather than a legal entity basis.
Net operating income before loan impairment charges and other credit risk provisions (‘revenue’) was broadly in line with 2010, due to the adverse effect on GB&M revenue in Europe of the turmoil in the eurozone sovereign debt market and a decline in lending balances in RBWM in North America being offset by revenue growth in faster-growing regions. The eurozone turmoil resulted in lower trading income from our Credit and Rates businesses as problems escalated, particularly in the second half of 2011. Our GB&M performance was also affected by lower revenues in Balance Sheet Management, as higher yielding positions matured and interest rates remained low, and in our legacy credit portfolio. In North America, we continued to reposition our business and we remained focused on managing down our run-off portfolios. As a consequence, revenue fell, reflecting declining customer loan balances in the run-off portfolios and in the Card and Retail Services businesses.
These factors were broadly offset by increased net interest income in CMB as a result of strong balance sheet growth in 2010 which continued into 2011, albeit at a slower pace during the latter part of the year. Revenue also benefited from balance sheet growth in RBWM in Rest of Asia-Pacific and Latin America. There were also strong performances in over half of our business lines in GB&M, including Global Banking, Foreign Exchange and Equities, particularly in the faster growing regions of Rest of Asia-Pacific and Latin America.
Loan impairment charges and other credit risk provisions were considerably lower than in 2010, with decreases across all regions except Latin America and Hong Kong. The most significant decline in loan impairment charges was in RBWM in North America, reflecting lower balances in our consumer finance portfolios and lower lending balances and improved credit quality in Card and Retail Services. There was also a notable decline in loan impairment charges in Europe, due to successful initiatives taken to mitigate risk within RBWM which resulted in a reduction in delinquency rates in personal lending in the UK. Loan impairment charges and other credit risk provisions fell in the Middle East in GB&M due to the non-recurrence of restructuring activity for a small number of large customers. In Latin America, loan impairment charges and other credit risk provisions increased as a result of strong lending growth in RBWM and CMB, along with a rise in delinquency rates in Brazil during the second half of 2011.
Operating expenses were higher than in 2010, reflecting an increase in notable items and higher staff costs in faster-growing regions. Notable items included restructuring costs of US$1.1bn, a bank levy introduced by the UK government of US$570m, higher provisions relating to customer redress programmes of US$898m and US mortgage servicing costs of US$257m. The restructuring costs were incurred as a result of actions taken following the review of our capital deployment and operational effectiveness. This led to a reduction of more than 7,600 FTEs during the second half of 2011 and sustainable savings of US$0.9bn. These notable items were partially offset by a credit of US$587m resulting from a change in the inflation measure used to calculate the defined benefit obligation of the HSBC Bank plc (‘HSBC Bank’) UK defined benefit plan for deferred pensions.
Income from associates increased, mainly driven by strong results in our mainland China associates. The contribution from Bank of Communications Co., Limited (‘BoCom’) rose due to loan growth, wider deposit spreads and higher fee income. Our share of profits from Industrial Bank Co. Limited (‘Industrial Bank’) rose due to strong growth in customer lending and an increase in fee-based revenue.
The reported profit after tax was US$3.8bn or 26% higher, due to the increase in taxable profits, primarily from movements on the fair value of own debt and a lower tax expense. This reflected the inclusion in 2011 of a deferred tax benefit now eligible to be recognised in respect of foreign tax credits. In addition, the tax charge in 2010 included US$1.2bn attributable to a taxable gain from an internal reorganisation in North America. As a result of these factors, the effective tax rate for 2011 was 18% compared with 25.5% in 2010.
Group performance by income and expense item
Net interest income
Net interest income was US$40.7bn, 3% higher than in 2010. On an underlying basis, net interest income was broadly in line with the previous year, as the benefit to income from continued strong growth in average interest-earning balances was largely offset by a decline in spreads.
Average loans and advances to customers grew strongly in 2011, reflecting targeted lending growth during 2010 and the first half of 2011 in CMB and GB&M, as well as strong mortgage lending growth in our RBWM businesses in the UK, Hong Kong and Rest of Asia-Pacific throughout both years. During the year, we announced the sale of 195 non-strategic
44b
Table of Contents
HSBC HOLDINGS PLC
Report of the Directors: Operating and Financial Review(continued)
branches and our Cards and Retail Services business in the US, and reclassified the related loans and advances to customers to other assets held for sale, reported within ‘Other interest-earning assets’. This, together with the continued decline in the consumer finance portfolios in run-off, partly offset the rise in average lending balances in other regions.
The benefit to interest income of the strong customer lending volume growth was offset in part by a reduction in gross yields from loans and advances to customers. This reflected the transfer of balances to assets held for sale, including higher yielding unsecured lending, the continued decline within the US consumer finance portfolios and the repositioning of RBWM towards higher quality secured lending, particularly mortgages, together with intense competition in certain markets.
Interest income from short-term funds and loans and advances to banks also increased, attributable to higher average balances with central banks. This reflected higher deposit requirements by central banks in certain markets, together with the placement of excess liquidity in Asia with central banks. Interest income from short-term funds and loans and advances to banks, as well as financial investments, also benefited from higher yields as interest rates rose, particularly in mainland China, India and Brazil.
Interest income from other interest earning assets rose as a result of the reclassification of assets held for sale and the related income.
The rise in interest income was largely offset by higher interest expense. This was driven by a significant increase in average customer account balances in Hong Kong, Rest of Asia-Pacific and Europe as a result of targeted deposit campaigns. The cost of funds also rose as a result of base rate increases, notably in mainland China, India and Brazil, and competitive pricing to attract and retain deposits in many markets.
The increase in interest expense on deposits by banks was driven by a rise in the cost of funds in Europe, reflecting the maturity of derivatives used to hedge interest rate risk and their replacement at lower prevailing interest rates.
The interest expense on own debt designated at fair value also rose, reflecting the volume of new issuances during the year. Although the average balance of debt securities in issue declined due to maturities not being replaced in North America and Europe, the related interest expense increased as a result of a general widening of credit spreads in the financial sector.
‘Net interest income’ includes the expense of internally funding trading assets, while related revenue is reported in ‘Net trading income’. The internal cost of funding these assets rose due to the increase in average trading assets during the year. In reporting our global business results, this cost is included within ‘Net trading income’.
The decrease in the net interest spread compared with 2010 was attributable to lower yields on loans and advances to customers as we continued to target higher quality assets, coupled with a rising cost of funds on customer accounts. Our net interest margin also fell, but by a lesser amount, due to the benefit from net free funds. This benefit rose as a result of the increase in the Group’s cost of funds, coupled with higher third party funding of our trading book, in line with the growth of trading assets.
Net fee income
Reported net fee income was broadly in line with 2010. Reported results in 2010 included revenue from Eversholt Rail Group and HSBC Insurance Brokers Ltd. These items are excluded from our underlying results which declined by 3%. This was mainly due to increased fee expenses in North America and the impact of discontinuing certain business operations.
Fee expenses increased in North America, reflecting higher ‘revenue-share’ payments to our credit card partners as improved portfolio performance resulted in increased cash flows. Fee expenses also rose in Latin America, reflecting increased transaction volumes, and in Europe, notably in GB&M, which benefited from higher recoveries from the securities investment conduits in 2010.
Card-related income was higher, led by growth in Hong Kong due to higher transaction volumes, driven by increased retail spending and customer promotions, and in Europe due to increased interchange commissions from higher volumes and rates.
Fee income from unit trusts increased due to higher transaction volumes, notably in Hong Kong, reflecting increased product offerings, competitive pricing and successful sales activity as clients sought to maximise returns in the low interest rate environment. However, broking income was lower, primarily in Hong Kong due to increased competition in the territory during the second half of the year.
Remittances and trade-related fee income increased, notably in the Rest of Asia-Pacific region, due to higher trade and transaction volumes as we
44c
Table of Contents
HSBC HOLDINGS PLC
Report of the Directors: Operating and Financial Review(continued)
targeted asset growth and trade activity in the region, supported by marketing activities, customer acquisition and a rise in transactions from existing customers.
The negligible income from Taxpayer Financial Services in the US during 2011 resulted from the decision to exit the business.
We expect the sale of the Card and Retail Services business to have a significant impact on both fee income related to cards and insurance, and fee expenses.
Net trading income
Reported net trading income was US$6.5bn, 10% lower than in 2010. On an underlying basis, net trading income declined by 15%, driven by significantly lower net income from trading activities in GB&M as turmoil in eurozone sovereign debt markets escalated, particularly in the second half of 2011. Increased risk aversion and limited client activity led to a significant widening of spreads on certain eurozone sovereign and corporate bonds, resulting in trading losses in our European Credit and Rates businesses.
Net trading income also declined from our legacy credit portfolio, a separately identifiable, discretely managed business comprising Solitaire Funding Limited, the securities investment conduits, the asset-backed securities trading portfolios and credit correlation portfolios, derivative transactions entered into directly with monoline insurers, and certain other structured credit transactions. This reflected the non-recurrence of the price appreciation during the previous year and lower holdings as a result of maturities and disposals aimed at reducing capital consumption, coupled with the non-recurrence of an US$89m gain from a 2010 legal settlement relating to certain loans previously purchased for resale from a third party.
In addition, lower favourable foreign exchange movements were reported on trading assets held as economic hedges of foreign currency debt designated at fair value. These offset lower adverse foreign exchange movements on the foreign currency debt which are reported in ‘Net expense from financial instruments designated at fair value’.
Notwithstanding the difficult trading conditions, there were strong performances across other parts of GB&M. Rates trading revenues in Hong Kong, North America and Latin America remained resilient as client flows increased. Fair value gains on structured liabilities also increased, mainly in Rates, as credit spreads widened more significantly than in
2010, resulting in a gain of US$458m compared with US$23m in 2010.
Our Foreign Exchange business benefited from increased activity from both Global Banking and CMB customers, particularly in Hong Kong, Rest of Asia-Pacific, North America and Latin America, coupled with an improved trading environment compared with 2010. The latter reflected market volatility caused by geopolitical tensions, ongoing eurozone sovereign debt concerns and interventions by central banks. Equities revenues also rose as investment in platforms improved our competitive positioning and helped capture increased client flows, notably in the first half of the year in Europe and Hong Kong.
In addition to the decline in net income from trading activities in GB&M, we reported adverse fair value movements on derivatives relating to certain legacy provident funds in Hong Kong as long-term investment returns fell. This was offset in part by a reduction in the loss provisions for mortgage loan repurchase obligations associated with loans previously sold in RBWM in North America, which decreased by US$341m to US$92m.
There were adverse fair value movements on non-qualifying hedges. These are derivatives entered into as part of a documented interest rate management strategy for which hedge accounting was not, or could not be, applied. They are principally cross-currency and interest rate swaps used to economically hedge fixed rate debt issued by HSBC Holdings and floating rate debt issued by HSBC Finance. The size and direction of the changes in fair value of non-qualifying hedges that are recognised in the income statement can be volatile from year to year, but do not alter the cash flows expected as part of the documented interest rate management strategy for both the instruments and the underlying economically hedged assets and liabilities. The adverse fair value movement on non-qualifying hedges in North America was higher in 2011 as long-term US interest rates declined to a greater extent than in 2010. This was partly offset by lower adverse fair value movements on these instruments in Europe.
Ineffectiveness in the hedging of available-for-sale investment portfolios resulted in adverse movements on fair value hedges. This was due to growth in the underlying investment portfolio in Europe as a result of new purchases and a more pronounced decline in yield curves in North America than in 2010.
Net interest income earned on trading activities rose by 23%, driven by an increase in average
44d
Table of Contents
HSBC HOLDINGS PLC
Report of the Directors: Operating and Financial Review(continued)
holdings and higher yields on our trading portfolio. This was partly offset by higher interest expense on trading liabilities reflecting an increase in funding requirements in line with the growth in average trading assets. The cost of internally funding these assets also rose, but this interest expense is reported within ‘Net interest income’.
Net income from financial instruments designated at fair value
The accounting policies for the designation of financial instruments at fair value and the treatment of the associated income and expenses are described in Notes 2i and 2b on the Financial Statements, respectively.
The majority of the financial liabilities designated at fair value relate to certain fixed-rate long-term debt issues whose rate profile has been changed to floating through interest rate swaps as part of a documented interest rate management strategy. The movement in fair value of these long-term debt issues includes the effect of our credit spread changes and any ineffectiveness in the economic relationship between the related swaps and own debt. As credit spreads widen or narrow, accounting profits or losses, respectively, are booked. The size and direction of the changes in the credit spread on our debt and ineffectiveness, which are recognised in the income statement, can be volatile from year to year, but do not alter the cash flows envisaged as part of the documented interest rate management strategy. As a consequence, fair value movements arising from changes in our own credit spread on long-term debt and other fair value movements on the debt and related derivatives are not regarded internally as part of managed performance and are therefore not allocated to customer groups, but are reported in ‘Other’. Credit spread movements on own debt are excluded from underlying results, and related fair value movements are not included in the calculation of regulatory capital.
We reported net income from financial instruments designated at fair value of US$3.4bn in 2011 compared with US$1.2bn in 2010. This included the credit spread-related movements in the fair value of our own long-term debt, on which we reported favourable fair value movements of US$3.9bn in 2011 and adverse movements of US$63m in 2010. These favourable fair value movements arose in 2011 as credit spreads widened, in comparison with smaller favourable fair value movements in North America and adverse fair value movements in Europe, both in 2010.
On an underlying basis, which excludes credit spread-related movements in the fair value of our own long-term debt, the equivalent figures were net expense of US$494m in 2011 and net income of US$1.3bn in 2010. Net expense arising from financial assets held to meet liabilities under insurance and investment contracts reflected net investment losses in 2011 as a result of adverse movements in equity markets, primarily in Europe and Hong Kong, compared with net investment gains experienced during 2010. This predominantly affected the value of assets held to support unit-linked contracts in the UK and Hong Kong, insurance contracts with discretionary participation features (‘DPF’) in Hong Kong, and investment contracts with DPF in France.
The investment gains or losses arising from equity markets resulted in a corresponding movement in liabilities to customers, reflecting the extent to which unit-linked policyholders, in particular, participate in the investment performance of the associated asset portfolio. Where these relate to assets held to back investment contracts, the corresponding movement in liabilities to customers is also recorded under ‘Net income from financial instruments designated at fair value’. This is in contrast to gains or losses related to assets held to back insurance contracts or investment contracts with DPF, where the corresponding movement in liabilities to customers is recorded under ‘Net insurance claims incurred and movement in liabilities to policyholders’.
Within net income from financial instruments designated at fair value were lower adverse foreign exchange movements than in 2010 on foreign currency debt designated at fair value issued as part of our overall funding strategy, with an offset from trading assets held as economic hedges reported in ‘Net trading income’.
Gains less losses from financial investments
Reported gains less losses from financial investments decreased by US$61m to US$907m. On an underlying basis, excluding an accounting gain of US$62m arising from the reclassification of Bao Viet as an associate in 2010, they declined by 4%.
The reduction was principally driven by lower net gains from the disposal of available-for-sale equity securities, as deterioration in market confidence resulted in fewer disposal opportunities and lower gains from the sale of private equity investments, notably in Europe. We also recognised a gain on disposal in 2010 of an equity investment in a Singaporean property company which did not recur.
44e
Table of Contents
HSBC HOLDINGS PLC
Report of the Directors: Operating and Financial Review(continued)
This was partly offset by a gain on sale of shares in a Mexican listed company.
Impairments of available-for-sale equity securities rose, due to write downs of our equity investments in real estate companies, reflecting a decline in property values in 2011.
Net gains from the disposal of available-for-sale debt securities increased in Europe and North America following sales of government bonds and mortgage-backed securities by Balance Sheet Management as part of normal portfolio management activities. However, this was offset in part by lower net gains in Hong Kong and Rest of Asia-Pacific on the disposal of government debt securities in 2011.
Net earned insurance premiums
Net earned insurance premiums which relate to insurance and investment contracts with DPF increased by 15% on a reported basis and by 13% on an underlying basis, primarily driven by strong sales in the Hong Kong life insurance business and also in Latin America. This reflected the strategic focus of the Group on wealth management, of which insurance is a key part.
In Hong Kong, sales of deferred annuities, unit-linked products and a universal life product targeted at high net worth individuals all rose, coupled with higher levels of renewals from a larger in-force book of business due to an increased demand for wealth products. Sales of a universal life insurance product targeted at high net worth individuals were also higher in Rest of Asia-Pacific, notably in Singapore, driven by successful sales initiatives.
In Latin America, net earned premiums also grew strongly due to a rise in contributions from unit-linked, life and credit protection products in Brazil, reflecting investment in the distribution network. This was supported by higher premiums from the motor insurance business in Argentina as a result of volume growth and repricing initiatives.
In Europe, net earned premiums decreased resulting from the non-renewal and transfer to third parties of certain contracts in our Irish business as well as the continued run-off and subsequent disposal of the motor business in the UK during 2011.
This was partly offset by premium growth in both France, on investment contracts with DPF as a result of targeted sales campaigns aimed at high net worth clients, and the UK, on unit-linked products due to increased distribution channels.
Other operating income
Reported other operating income of US$1.8bn decreased by US$796m in 2011. Reported results in 2011 included a gain of US$181m arising from a dilution of our holding in Ping An following its issue of share capital to a third party and a gain of US$83m from the sale of HSBC Afore, our Mexican pension administration business. We also reported a dilution gain of US$27m as a result of the reduction in our holding in HSBC Saudi Arabia Limited following its merger with SABB Securities Limited. Income in 2010 included a gain of US$188m following the dilution of our holding in Ping An along with gains from the sale of HSBC Insurance Brokers (US$107m), the Wells Fargo HSBC Trade Bank (US$66m), Eversholt Rail Group (US$255m) and HSBC Private Equity (Asia) Ltd (US$74m), partly offset by a loss of US$42m on the disposal of our shareholding in British Arab Commercial Bank plc.
On an underlying basis, excluding the items referred to above, other operating income decreased by US$71m compared with 2010. Lower losses on assets held for sale driven by the non-recurrence of the US$207m loss on the sale of the US vehicle finance servicing operation in 2010 and associated loan portfolio were more than offset by the non-recurrence of gains of US$250m on the sale and leaseback of our Paris and New York headquarters in 2010, which exceeded gains recorded in 2011 on the sale of buildings including US$61m from the sale and leaseback of branches in Mexico.
Favourable net movements in the present value of in-force (‘PVIF’) long-term insurance business compared with 2010 were driven by a one-off gain of US$243m recognised upon the refinement of the calculation of the PVIF asset to bring greater comparability and consistency across our insurance operations, and strong sales of life insurance products, notably in Hong Kong and Singapore. Largely offsetting this was a net decrease from experience and assumption updates and a higher unwind of cash flows from the growing in-force book.
Net insurance claims incurred and movement in liabilities to policyholders
Net insurance claims incurred and movement in liabilities to policyholders decreased by 5% on a reported basis and by 7% on an underlying basis, driven by investment losses on insurance assets, notably in Europe and Hong Kong.
44f
Table of Contents
HSBC HOLDINGS PLC
Report of the Directors: Operating and Financial Review(continued)
In France, the UK and Hong Kong we experienced a reduction in the movement in liabilities to policyholders resulting from a fall in fair value of the assets held to support policyholder funds, particularly in relation to unit-linked insurance contracts and investment and insurance contracts with DPF, as a result of equity market falls.
The gains or losses experienced on the financial assets designated at fair value held to support insurance contract liabilities and investment contracts with DPF are reported in ‘Net income from financial instruments designated at fair value’.
Further declines in the movement in liabilities to policyholders resulted from the non-renewal and transfer to third parties of certain contracts in our Irish businesses as well as the continued run-off and subsequent sale of the motor business in the UK during 2011.
Reductions in the movement in liabilities to policyholders were partly offset by additional liabilities established for new business premiums written, notably in Hong Kong, Brazil, France, the UK and Singapore, which are consistent with increases in net earned premiums.
Loan impairment charges and other credit risk provisions
Loan impairment charges and other credit risk provisions were US$12.1bn, a decline of 14% compared with 2010 on a reported basis and 15% on an underlying basis.
At 31 December 2011, the aggregate balance of customer loan impairment allowances was US$17.5bn, representing 1.9% of gross loans and advances to customers (net of reverse repos and settlement accounts) compared with 2.2% at 31 December 2010.
In 2011, loan impairment charges and other credit risk provisions declined in all regions except Latin America and Hong Kong. The reduction was most significant in our consumer finance portfolios in HSBC Finance in North America, which contributed 66% of the reduction, reflecting lower lending balances in the run-off portfolio along with a reduction in lending balances and lower delinquency rates as our Card and Retail Services customers focused on repayments. In Latin America, principally Brazil, and also in Hong Kong, collective loan impairment allowances rose as we grew our lending book on the back of strong economic growth and increased customer demand.
During 2011, we reported US$631m of impairments related to available-for-sale debt
securities, compared with US$472m in 2010. In 2011, we recognised a charge of US$212m to write down to market value available-for-sale Greek sovereign debt now judged to be impaired following the deterioration in Greece’s fiscal position. This was partly offset as losses arising in underlying collateral pools generated lower charges on asset-backed securities.
In our US run-off portfolios, loan impairment charges of US$5.0bn were 14% lower than in 2010. The decline was mainly in our Consumer and Mortgage Lending (‘CML’) portfolio, driven by the reduction in customer lending balances, in part offset by higher loan impairment allowances reflecting a rise in the estimated cost to obtain collateral as well as delays in the timing of expected cash flows, both the result of the industry-wide delays in foreclosure processing.
In the third quarter of 2011, loan impairment charges in the CML portfolio increased markedly as delinquency worsened compared with the first half of 2011. In addition, we increased our loan impairment allowances to reflect a rise in the expected cost to obtain and realise collateral following delays in foreclosure processing. Despite a decline in loan impairment charges in the fourth quarter, these factors contributed significantly to a rise in the Group’s loan impairment charges in the second half of 2011 compared with the first half of the year.
In Card and Retail Services, loan impairment charges fell by 26% to US$1.6bn reflecting lower lending balances and improved delinquency rates as customer repayment rates remained strong during 2011.
In CMB, loan impairment charges and other credit risk provisions in North America declined in both Canada and the US reflecting improved credit quality, and in Canada this was also due to lower lending balances. These declines were partly offset by a loan impairment charge on a commercial real estate lending exposure.
The reduction in loan impairment charges and other credit risk provisions in North America was partly offset by an increase in GB&M, reflecting lower releases of collective loan impairment allowances compared with 2010. In addition, 2011 included a loan impairment charge associated with a corporate lending relationship.
Loan impairment charges and other credit risk provisions in Europe fell by 20% to US$2.5bn, notably in the UK. The reduction was mainly in our RBWM business where loan impairment charges declined by 53% to US$596m despite the difficult
44g
Table of Contents
HSBC HOLDINGS PLC
Report of the Directors: Operating and Financial Review(continued)
economic climate and continued pressures on households’ finances. Delinquency rates declined across both the secured and unsecured lending portfolios, reflecting improvement in portfolio quality and the continued low interest rate environment as well as successful actions taken to mitigate credit risk and proactive account management. In CMB, loan impairment charges and other credit risk provisions were 7% lower, mainly in the UK. This was partly offset by an increase in individually assessed loan impairment charges in Greece as economic conditions worsened.
In GB&M in Europe, loan impairment charges and other credit risk provisions increased by 8% as we recorded an impairment of US$145m to write down to market value available-for-sale Greek sovereign debt now judged to be impaired following the deterioration in Greece’s fiscal position.
In the Middle East and North Africa, loan impairment charges and other credit risk provisions fell by 53% to US$293m, primarily due to a marked decline in loan impairment charges and other credit risk provisions in our GB&M business. This reflected the non-recurrence of individually assessed loan impairment charges recorded in the first half of 2010 related to restructuring activity for a small number of large corporate customers in the United Arab Emirates (‘UAE’). In RBWM, loan impairment charges declined by 45%, due to significantly improved delinquency rates reflecting a repositioning of the loan book towards higher quality lending as we continued to manage down unsecured lending, together with impaired collections practices.
In Rest of Asia-Pacific, loan impairment charges and other credit risk provisions declined by 42% to US$267m, driven by reductions in India and Singapore. The marked decline in India reflected an improvement in delinquency, particularly in the unsecured portfolios as lending balances were managed down. In GB&M, loan impairment charges and other credit risk provisions declined by 58%, mainly in Singapore, due to a reduction in individually assessed loan impairment charges.
In Latin America, loan impairment charges increased by 17% to US$1.9bn. In Brazil, loan impairment charges and other credit risk provisions rose by 43% to US$1.4bn due to a rise in collective loan impairment allowances in both RBWM and CMB following the strong growth in our customer lending balances and a rise in delinquency rates in the second half of 2011. In addition, we recognised a significant individually assessed loan impairment charge related to a commercial customer. The increase in Brazil was partly offset by a 28% decline in
loan impairment charges and other credit risk provisions in Mexico. This was mainly in our RBWM business due to lower balances in our credit card portfolio as certain higher risk portfolios were run-down and both credit quality and collections improved.
In Hong Kong, loan impairment charges and other credit risk provisions increased by 36% to US$156m. In CMB, higher loan impairment charges included a specific impairment charge related to a single customer, as well as higher collectively assessed charges reflecting growth in lending balances. In GPB, loan impairment charges and other credit risk provisions also increased, reflecting an impairment of available-for-sale Greek sovereign debt.
Operating expenses
Operating expenses increased by 10% to US$41.5bn on a reported basis. On an underlying basis, costs increased by 8% compared with 2010, driven by a higher amount of notable items in 2011 as listed in the table above and a rise in staff costs, primarily in faster growing regions. Notable items included restructuring costs, provisions relating to customer redress programmes in the UK, including a charge in respect of the possible mis-selling of Payment Protection Insurance (‘PPI’) in previous years, the UK bank levy and a new provision for US mortgage foreclosure and servicing costs. These were partially offset by a credit resulting from a change in the inflation measure used to calculate the defined benefit obligation in the UK for deferred pensions and the non-recurrence of the 2010 payroll and bonus taxes in the UK and France.
Salaries and wages rose, primarily driven by wage inflation in Rest of Asia-Pacific and Hong Kong and union-agreed salary increases in Latin America.
The growth in business volumes, primarily in Hong Kong, Rest of Asia-Pacific and Latin America, was supported by a small rise in average staff numbers (expressed as FTEs) which grew marginally in 2011. Staff costs also rose due to higher amortisation charges for previous years’ restricted and performance share awards and an acceleration in the expense recognition for deferred bonus awards of US$163m, in line with regulatory and best practice guidance. Otherwise, performance-related costs were lower than in 2010, primarily in GB&M where net operating income declined.
During the year, we incurred US$1.1bn of restructuring costs including US$542m which were
44h
Table of Contents
HSBC HOLDINGS PLC
Report of the Directors: Operating and Financial Review(continued)
staff related and US$325m of impairment of certain software projects now deferred or cancelled.
During 2011, we began a Group-wide review of our organisational effectiveness. We achieved US$0.9bn of sustainable savings in 2011, approximately one third of our objective of US$2.5bn to US$3.5bn over three years. We started implementing consistent business models in RBWM and CMB and undertook a detailed review of our head offices. In addition, we began the re-engineering of our global functions, we commenced the streamlining of our IT function including the consolidation of some data centres and other services, and we re-engineered a number of customer-facing and back-office processes leading to a more efficient use of our corporate real estate.
This resulted in a net reduction of staff numbers of more than 7,600 during the second half of 2011 despite continuing to recruit selectively in our target growth areas.
The savings achieved by delivering on these programmes enabled the funding of investment in strategic initiatives, including the development of Prime Services and equity market capabilities and the expansion of the Rates and Foreign Exchange e-commerce platforms in Europe, and the recruitment of additional front office staff in selected markets.
Costs increased due to a rise in compliance costs in GB&M and litigation expenses in RBWM, both predominantly in the US. However, marketing costs fell in North America and Latin America as discretionary costs were tightly controlled.
Share of profit in associates and joint ventures
The reported share of profit in associates and joint ventures was US$3.3bn, an increase of 30% compared with 2010. On an underlying basis, which excludes the re-measurement loss relating to Ping An’s acquisition of Shenzhen Development Bank, the share of profits from associates increased by 27%. This was driven mainly by higher contributions from our mainland China associates.
Our share of profits from BoCom rose, driven by strong loan growth, wider spreads following benchmark interest rate rises by the People’s Bank of China and effective re-pricing. Fee-based income also increased due to the continued development of investment banking services as well as increased credit card spending. The contribution from Industrial Bank rose as a result of continued growth in customer lending, higher fee income and a fall in loan impairment charges.
Profits from Saudi British Bank increased, driven by a decline in loan impairment charges as the credit environment improved in Saudi Arabia and due to good cost control.
Higher profits from Ping An resulted from strong growth in sales in the insurance business and higher income from the banking business following the acquisition of Shenzhen Development Bank in July 2011.
Tax expense
Our reported tax expense decreased by US$0.9bn compared with 2010. The lower tax charge reflected the benefit of a deferred tax credit of US$0.9bn now eligible to be recognised in respect of foreign tax credits in the US. In addition, the tax charge in 2010 included US$1.2bn attributable to a taxable gain from an internal reorganisation in our North American operations. The resulting reported effective tax rate for 2011 was 18% compared with 25.5% in 2010.
Economic profit
Our internal performance measures include economic profit/(loss), a calculation which compares the return on financial capital invested in HSBC by our shareholders with the cost of that capital. We price our cost of capital internally and the difference between that cost and the post-tax profit attributable to ordinary shareholders represents the amount of economic profit/(loss) generated. In order to concentrate on external factors rather than measurement bases, we emphasise the trend in economic profit/(loss) ahead of absolute amounts.
Our long-term cost of capital is reviewed annually and is 11% for 2011; this remains unchanged from 2010. The following commentary is on a reported basis.
The return on invested capital increased by 1.5 percentage points to 10.2%, which was 0.8 percentage points lower than our benchmark cost of capital. Our economic loss was US$1.3bn, US$2.0bn less than the loss at 31 December 2010, reflecting an increase in profit attributable to shareholders. This was predominantly driven by a significant increase in the fair value of own debt and a lower tax charge.
The increase in average invested capital reflected higher retained earnings and an increase in average foreign exchange reserves, primarily due to the effect of euro and sterling exchange rate movements on our underlying assets.
44i
Table of Contents
HSBC HOLDINGS PLC
Report of the Directors: Operating and Financial Review(continued)
On 5 March 2013, we announced an agreement to sell HSBC Finance’s non-real estate personal loan portfolio to SpringCastle Acquisition LLC, a Delaware-based company owned by Springleaf Finance, Inc, and Newcastle Investment Corp for expected cash consideration of US$3.2bn, adjusted for cash received from the loan portfolio and agreed funding and servicing costs of the portfolio between
31 December 2012 and the completion date. The sale is scheduled for completion in the second quarter of 2013 and is subject to customary closing conditions. We expect to record a loss of US$250m based on the cash consideration of US$3.2bn. The ultimate gain or loss on disposal will be based on the net cash consideration received after adjustments as described above. The portfolio was classified as ‘Asset held for sale’ as at 31 December 2012 with a carrying amount of US$3.4bn.
44j
Table of Contents
HSBC HOLDINGS PLC
Report of the Directors: Operating and Financial Review(continued)
Five-year summary consolidated balance sheet and selected financial information
| At 31 December | ||||||||||||||||||||||||||||
2012 US$m | 2011 US$m | 2010 US$m | 2009 US$m | 2008 US$m | ||||||||||||||||||||||||
ASSETS | ||||||||||||||||||||||||||||
Cash and balances at central banks | 141,532 | 129,902 | 57,383 | 60,655 | 52,396 | |||||||||||||||||||||||
Trading assets | 408,811 | 330,451 | 385,052 | 421,381 | 427,329 | |||||||||||||||||||||||
Financial assets designated at fair value | 33,582 | 30,856 | 37,011 | 37,181 | 28,533 | |||||||||||||||||||||||
Derivatives | 357,450 | 346,379 | 260,757 | 250,886 | 494,876 | |||||||||||||||||||||||
Loans and advances to banks | 152,546 | 180,987 | 208,271 | 179,781 | 153,766 | |||||||||||||||||||||||
Loans and advances to customers54 | 997,623 | 940,429 | 958,366 | 896,231 | 932,868 | |||||||||||||||||||||||
Financial investments | 421,101 | 400,044 | 400,755 | 369,158 | 300,235 | |||||||||||||||||||||||
Assets held for sale | 19,269 | 39,558 | 1,991 | 3,118 | 2,075 | |||||||||||||||||||||||
Other assets | 160,624 | 156,973 | 145,103 | 146,061 | 135,387 | |||||||||||||||||||||||
Total assets | 2,692,538 | 2,555,579 | 2,454,689 | 2,364,452 | 2,527,465 | |||||||||||||||||||||||
LIABILITIES AND EQUITY | ||||||||||||||||||||||||||||
Liabilities | ||||||||||||||||||||||||||||
Deposits by banks | 107,429 | 112,822 | 110,584 | 124,872 | 130,084 | |||||||||||||||||||||||
Customer accounts | 1,340,014 | 1,253,925 | 1,227,725 | 1,159,034 | 1,115,327 | |||||||||||||||||||||||
Trading liabilities | 304,563 | 265,192 | 300,703 | 268,130 | 247,652 | |||||||||||||||||||||||
Financial liabilities designated at fair value | 87,720 | 85,724 | 88,133 | 80,092 | 74,587 | |||||||||||||||||||||||
Derivatives | 358,886 | 345,380 | 258,665 | 247,646 | 487,060 | |||||||||||||||||||||||
Debt securities in issue | 119,461 | 131,013 | 145,401 | 146,896 | 179,693 | |||||||||||||||||||||||
Liabilities under insurance contracts | 68,195 | 61,259 | 58,609 | 53,707 | 43,683 | |||||||||||||||||||||||
Liabilities of disposal groups held for sale | 5,018 | 22,200 | 86 | 3 | – | |||||||||||||||||||||||
Other liabilities | 118,123 | 111,971 | 109,868 | 148,411 | 149,150 | |||||||||||||||||||||||
Total liabilities | 2,509,409 | 2,389,486 | 2,299,774 | 2,228,791 | 2,427,236 | |||||||||||||||||||||||
Equity | ||||||||||||||||||||||||||||
Total shareholders’ equity | 175,242 | 158,725 | 147,667 | 128,299 | 93,591 | |||||||||||||||||||||||
Non-controlling interests | 7,887 | 7,368 | 7,248 | 7,362 | 6,638 | |||||||||||||||||||||||
Total equity | 183,129 | 166,093 | 154,915 | 135,661 | 100,229 | |||||||||||||||||||||||
Total equity and liabilities | 2,692,538 | 2,555,579 | 2,454,689 | 2,364,452 | 2,527,465 | |||||||||||||||||||||||
Five-year selected financial information | ||||||||||||||||||||||||||||
Called up share capital | 9,238 | 8,934 | 8,843 | 8,705 | 6,053 | |||||||||||||||||||||||
Capital resources55,56 | 180,806 | 170,334 | 167,555 | 155,729 | 131,460 | |||||||||||||||||||||||
Undated subordinated loan capital | 2,778 | 2,779 | 2,781 | 2,785 | 2,843 | |||||||||||||||||||||||
Preferred securities and dated subordinated loan capital57 | 48,260 | 49,438 | 54,421 | 52,126 | 50,307 | |||||||||||||||||||||||
Risk-weighted assets and capital ratios55 | ||||||||||||||||||||||||||||
Risk-weighted assets | 1,123,943 | 1,209,514 | 1,103,113 | 1,133,168 | 1,147,974 | |||||||||||||||||||||||
| % | % | % | % | % | ||||||||||||||||||||||||
Core tier 1 ratio | 12.3 | 10.1 | 10.5 | 9.4 | 7.0 | |||||||||||||||||||||||
Total capital ratio | 16.1 | 14.1 | 15.2 | 13.7 | 11.4 | |||||||||||||||||||||||
Financial statistics | ||||||||||||||||||||||||||||
Loans and advances to customers as a percentage of customer accounts | 74.4 | 75.0 | 78.1 | 77.3 | 83.6 | |||||||||||||||||||||||
Average total shareholders’ equity to average total assets | 6.16 | 5.64 | 5.53 | 4.72 | 4.87 | |||||||||||||||||||||||
Net asset value per ordinary share at year-end58 (US$) | 9.09 | 8.48 | 7.94 | 7.17 | 7.44 | |||||||||||||||||||||||
Number of US$0.50 ordinary shares in issue (millions) | 18,476 | 17,868 | 17,686 | 17,408 | 12,105 | |||||||||||||||||||||||
Closing foreign exchange translation rates to US$: | ||||||||||||||||||||||||||||
US$1: £ | 0.619 | 0.646 | 0.644 | 0.616 | 0.686 | |||||||||||||||||||||||
US$1: € | 0.758 | 0.773 | 0.748 | 0.694 | 0.717 | |||||||||||||||||||||||
For footnotes, see page 120.
A more detailed consolidated balance sheet is contained in the Financial Statements on page 374.
45
Table of Contents
HSBC HOLDINGS PLC
Report of the Directors: Operating and Financial Review(continued)
Total reported assets were US$2.7 trillion, 5% higher than at 31 December 2011. Excluding the effect of currency movements, total assets increased by 4%, as shown on page 48.
Our business model (see page 14) and our approach to managing the Group balance sheet contributed to our strong liquidity position. Customer deposits increased by over US$65bn in 2012, which enabled us to continue to support our customers’ borrowing requirements. Loans and advances to customers grew by more than US$39bn during the year, notably in residential mortgages and term and trade-related lending to corporate and commercial customers. Higher customer activity also led to a rise in trading assets.
We have made significant progress in simplifying and re-shaping our balance sheet to improve our capital deployment. We completed a significant number of business disposals during the year, most notably the Card and Retail Services business and non-strategic branches in the US. This led to a significant reduction in ‘Assets held for sale’ with further transactions due to complete in 2013.
Assets
Cash and balances at central banks rose by 7% as we placed a greater portion of our surplus liquidity in Hong Kong, Europe and Rest of Asia-Pacific with central banks, reflecting both our risk profile and growth in customer deposits. This was partly offset by a reduction in North America as liquidity was redeployed into highly-rated financial investments.
Trading assets increased by 21%. At the end of 2011, client activity fell as eurozone debt concerns dominated the global economy and, as a result, we reduced our holdings of debt and equity securities and did not replace maturities in our reverse repo book. In 2012, client activity increased from these subdued levels which resulted in a rise in reverse repo and securities borrowing balances, together with higher holdings of equity securities. Notwithstanding the rise in year-end balances, we actively managed the trading inventory in GB&M and the average balance for the year declined by 9%.
Financial assets designated at fair value rose by 8%. Holdings of equity securities in our insurance businesses in Hong Kong and Europe increased, reflecting favourable market movements. Portfolio growth was also partly attributable to net premiums received in the year.
Derivative assets remained broadly in line with December 2011 levels. Downward movements in
yield curves in major currencies led to a rise in the fair value of interest rate contracts, largely in Europe and, to a lesser extent, the US. This was partly offset by a decline in the fair value of credit derivative contracts in Europe and the US, as spreads tightened, and foreign exchange contracts in Europe reflecting lower volumes of open trades. In addition, netting increased from an increase in trading through clearing houses and a rise in the fair value of interest rate contracts.
Loans and advances to banks declined by 16%, driven by a reduction in reverse repo balances in Europe, in part reflecting the redeployment of liquidity to central banks, together with maturities and repayments in Hong Kong and Rest of Asia-Pacific.
Loans and advances to customers increased by 4%. Residential mortgage balances continued to grow strongly, following the success of marketing campaigns and competitive pricing in the UK, the continued strength in the property market in Hong Kong and expansion of the distribution network in Rest of Asia-Pacific. Our focus on corporate and commercial customers that trade internationally led to a rise in term and trade-related lending in Hong Kong and Rest of Asia-Pacific. Lending to CMB customers also increased in Europe, notably in the UK despite muted demand for credit, and in North America, reflecting our focus on target segments in the US. In the Middle East and North Africa, the rise in term lending balances followed the completion of the merger of our operations in Oman with OIB and the acquisition of the onshore retail and commercial banking business of Lloyds Banking Group in the UAE. Corporate overdraft balances which did not meet netting criteria also increased in the UK, with a corresponding rise in related customer accounts. The above movements were partly offset by a reduction in residential mortgage balances in North America as a result of repayments and write-offs on the run-off portfolio. Lending to GB&M customers in Europe also declined as we reduced our exposure to certain sectors and disposed of selected positions, and clients chose to re-finance through the capital markets. Reverse repo balances also declined, mainly in Europe.
During 2012 we reclassified to ‘Assets held for sale’ loans and advances to customers relating to the planned disposals of non-strategic RBWM banking operations in Rest of Asia-Pacific and businesses in Latin America and Middle East and North Africa. In addition, loans and advances to customers, net of customer allowances, relating to the planned disposal of non-real estate personal loan balances
46
Table of Contents
HSBC HOLDINGS PLC
Report of the Directors: Operating and Financial Review(continued)
in the CML run-off portfolio in North America were reclassified as ‘Assets held for sale’.
Financial investments rose by 4% as excess liquidity was deployed into available-for-sale investments, notably treasury bills in Hong Kong and highly rated debt securities in North America.
Assets held for saledeclined by 51% following the completion of the US disposals. This was partly offset by the reclassification to ‘Assets held for sale’ during the year of the non-real estate personal loan balances in North America, our shareholdings in Ping An and Bao Viet Holdings and other non-strategic businesses.
Liabilities
Deposits by banks declined by 6% due to lower placements by, and repo activity with, other financial institutions in Europe. This was partly offset by higher short-term placements in North America and Hong Kong.
Customer accounts rose by 5%. This was driven in part by a significant rise in Hong Kong, where RBWM customers adopted a more conservative approach to managing their assets. CMB benefited from increased liquidity in the market, higher Payments and Cash Management balances and a rise in deposits from Business Banking customers. There was also strong deposit growth in CMB and GB&M in Europe, which benefited from higher balances in Payments and Cash Management, while growth in RBWM in Europe reflected the success of deposit gathering campaigns. The increase in current accounts in GB&M in the UK was also related to the rise in overdrafts which did not meet netting criteria. These movements were partly offset by a decrease in Brazil due to both a managed reduction in term deposits and the continued transformation of our funding base, substituting wholesale customer deposits for medium-term notes. Customer account balances in North America also fell as short-term deposits in the US placed at the end of 2011 were withdrawn. In addition, we reduced rates offered to customers as our funding requirements diminished following the business disposals and the continued decline of the consumer finance portfolios in run-off.
Trading liabilities increased by 12%, due to higher repo activity, notably in the US and in Europe, which we used to fund the rise in trading assets resulting from higher client activity.
Financial liabilities designated at fair value remained broadly in line with December 2011 levels. A net increase in Europe due to new issuances was largely offset by a net reduction in North America as maturities were not replaced, reflecting the decrease in funding requirements in the US.
The increase in the value ofderivative liabilities was in line with that of ‘Derivative assets’ as the underlying risk is broadly matched.
Debt securities in issue declined by 10% as maturing debt was not replaced in North America due to the decline in funding requirements there.
Liabilities under insurance contracts rose by 11%, largely due to higher investment returns which resulted in a rise in the fair value of assets held to support unit-linked insurance contracts and investment and insurance contracts with DPF, together with the related liabilities to policyholders. In addition, liabilities to policyholders were established for new business written in Hong Kong, Europe and Latin America. This was offset in part by a reduction in liabilities under insurance contracts reflecting disposals of general insurance businesses in Hong Kong, Rest of Asia-Pacific, Latin America and Europe, together with the reclassification to ‘Liabilities of disposal groups held for sale’ of general insurance liabilities in North America and life insurance liabilities in Rest of Asia-Pacific.
Liabilities of disposal groups held for sale declined by 77% following the completion of the US disposals. This was partly offset by the transfer to this classification of other non-strategic businesses.
Other liabilities rose by 5%, reflecting higher provisions for customer redress programmes in the UK together with a rise in amounts owed to clearing houses as trading activity conducted through them increased.
Equity
Total shareholders’ equity rose by 9%, driven in part by profits generated in the year. In addition, there was a favourable movement on the available-for-sale reserve from a negative balance of US$3.3bn at 31 December 2011 to a positive balance of US$1.6bn at 31 December 2012, reflecting an improvement in the fair value of these assets.
47
Table of Contents
HSBC HOLDINGS PLC
Report of the Directors: Operating and Financial Review(continued)
Reconciliation of reported and constant currency assets and liabilities
| 31 December 2012 compared with 31 December 2011 | ||||||||||||||||||||||||||||||||||
| HSBC | 31 Dec 11 as reported US$m | Currency translation adjustment59 US$m | 31 Dec 11 at 31 Dec 12 exchange rates US$m | 31 Dec 12 as reported US$m | Reported change % | Constant currency change % | ||||||||||||||||||||||||||||
Cash and balances at central banks | 129,902 | 2,011 | 131,913 | 141,532 | 9 | 7 | ||||||||||||||||||||||||||||
Trading assets | 330,451 | 7,317 | 337,768 | 408,811 | 24 | 21 | ||||||||||||||||||||||||||||
Financial assets designated at fair value | 30,856 | 147 | 31,003 | 33,582 | 9 | 8 | ||||||||||||||||||||||||||||
Derivative assets | 346,379 | 9,519 | 355,898 | 357,450 | 3 | – | ||||||||||||||||||||||||||||
Loans and advances to banks | 180,987 | 1,436 | 182,423 | 152,546 | (16 | ) | (16 | ) | ||||||||||||||||||||||||||
Loans and advances to customers | 940,429 | 18,175 | 958,604 | 997,623 | 6 | 4 | ||||||||||||||||||||||||||||
Financial investments | 400,044 | 4,772 | 404,816 | 421,101 | 5 | 4 | ||||||||||||||||||||||||||||
Assets held for sale | 39,558 | (175 | ) | 39,383 | 19,269 | (51 | ) | (51 | ) | |||||||||||||||||||||||||
Other assets | 156,973 | 719 | 157,692 | 160,624 | 2 | 2 | ||||||||||||||||||||||||||||
Total assets | 2,555,579 | 43,921 | 2,599,500 | 2,692,538 | 5 | 4 | ||||||||||||||||||||||||||||
Deposits by banks | 112,822 | 1,809 | 114,631 | 107,429 | (5 | ) | (6 | ) | ||||||||||||||||||||||||||
Customer accounts | 1,253,925 | 20,233 | 1,274,158 | 1,340,014 | 7 | 5 | ||||||||||||||||||||||||||||
Trading liabilities | 265,192 | 6,262 | 271,454 | 304,563 | 15 | 12 | ||||||||||||||||||||||||||||
Financial liabilities designated at fair value | 85,724 | 1,782 | 87,506 | 87,720 | 2 | – | ||||||||||||||||||||||||||||
Derivative liabilities | 345,380 | 9,566 | 354,946 | 358,886 | 4 | 1 | ||||||||||||||||||||||||||||
Debt securities in issue | 131,013 | 2,053 | 133,066 | 119,461 | (9 | ) | (10 | ) | ||||||||||||||||||||||||||
Liabilities under insurance contracts | 61,259 | 145 | 61,404 | 68,195 | 11 | 11 | ||||||||||||||||||||||||||||
Liabilities of disposal groups held for sale | 22,200 | (486 | ) | 21,714 | 5,018 | (77 | ) | (77 | ) | |||||||||||||||||||||||||
Other liabilities | 111,971 | 693 | 112,664 | 118,123 | 5 | 5 | ||||||||||||||||||||||||||||
Total liabilities | 2,389,486 | 42,057 | 2,431,543 | 2,509,409 | 5 | 3 | ||||||||||||||||||||||||||||
Total shareholders’ equity | 158,725 | 1,821 | 160,546 | 175,242 | 10 | 9 | ||||||||||||||||||||||||||||
Non-controlling interests | 7,368 | 43 | 7,411 | 7,887 | 7 | 6 | ||||||||||||||||||||||||||||
Total equity | 166,093 | 1,864 | 167,957 | 183,129 | 10 | 9 | ||||||||||||||||||||||||||||
Total equity and liabilities | 2,555,579 | 43,921 | 2,599,500 | 2,692,538 | 5 | 4 | ||||||||||||||||||||||||||||
For footnote, see page 120.
48
Table of Contents
HSBC HOLDINGS PLC
Report of the Directors: Operating and Financial Review(continued)
In implementing our strategy, we have agreed to sell a number of businesses across the Group. Assets and liabilities of businesses which, it is highly probable, will be sold are reported as held for sale on the balance sheet until the sale is closed. We include loans and advances to customers and customer
account balances reported as held for sale in our combined view of customer lending and customer accounts. We consider the combined view more accurately reflects the size of our lending and deposit books and growth thereof.
Combined view of customer lending and customer deposits
2012 US$m | 2011 US$m | Change % | ||||||||||||||
Loans and advances to customers | 997,623 | 940,429 | 6 | |||||||||||||
Loans and advances to customers reported in assets held for sale60 | 6,124 | 35,105 | (83 | ) | ||||||||||||
Card and Retail Services | – | 29,137 | (100 | ) | ||||||||||||
US branches | – | 2,441 | (100 | ) | ||||||||||||
Other | 6,124 | 3,527 | 74 | |||||||||||||
| ||||||||||||||||
Combined customer lending | 1,003,747 | 975,534 | 3 | |||||||||||||
Customer accounts | 1,340,014 | 1,253,925 | 7 | |||||||||||||
Customer accounts reported in assets held for sale62 | 2,990 | 20,138 | (85 | ) | ||||||||||||
US branches | – | 15,144 | (100 | ) | ||||||||||||
Other | 2,990 | 4,994 | (40 | ) | ||||||||||||
| ||||||||||||||||
Combined customer deposits | 1,343,004 | 1,274,063 | 5 | |||||||||||||
For footnote, see page 120.
Financial investments
| At 31 December 2012 | ||||||||||||||||
Equity securities US$bn | Debt securities US$bn | Total US$bn | ||||||||||||||
Balance Sheet Management | – | 293.4 | 293.4 | |||||||||||||
Insurance entities | – | 43.4 | 43.4 | |||||||||||||
Special purpose entities | – | 24.7 | 24.7 | |||||||||||||
Principal investments | 2.9 | – | 2.9 | |||||||||||||
Other | 2.9 | 53.8 | 56.7 | |||||||||||||
| 5.8 | 415.3 | 421.1 | ||||||||||||||
The table above analyses the Group’s holdings of financial investments by business activity. Further information can be found in the following sections:
| • | ‘Balance Sheet Management’ (page 223) for a description of the activities and an analysis of third party assets in balance sheet management. |
| • | ‘Risk management of insurance operations’ (page 232) includes a discussion and further analysis of the use of financial investments within our insurance operations. |
| • | ‘Special purpose entities’ (page 502) for further information about the nature of securities investment conduits in which the above financial investments are held. |
| • | ‘Equity securities classified as available for sale’ (page 222) includes private equity holdings and other strategic investments. |
| • | ‘Other’ represents financial investments held in certain locally managed treasury portfolios and other GB&M portfolios held for specific business activities. |
49
Table of Contents
HSBC HOLDINGS PLC
Report of the Directors: Operating and Financial Review(continued)
Average balance sheet and net interest income
Average balances and related interest are shown for the domestic operations of our principal commercial banks by geographical region. ‘Other operations’ comprise the operations of our principal commerical banking and consumer finance entities outside their domestic markets and all other banking operations, including investment banking balances and transactions.
Average balances are based on daily averages for the principal areas of our banking activities with monthly or less frequent averages used elsewhere.
Balances and transactions with fellow subsidiaries are reported gross in the principal commercial banking and consumer finance entities
within ‘Other interest-earning assets’ and ‘Other interest-bearing liabilities’ as appropriate and the elimination entries are included within ‘Other operations’ in those two categories.
Net interest margin numbers are calculated by dividing net interest income as reported in the income statement by the average interest-earning assets from which interest income is reported within the ‘Net interest income’ line of the income statement. Total interest-earning assets include loans where the carrying amount has been adjusted as a result of impairment allowances. In accordance with IFRSs, we recognise interest income on assets after the carrying amount has been adjusted as a result of impairment. Fee income which forms an integral part of the effective interest rate of a financial instrument is recognised as an adjustment to the effective interest rate and recorded in ‘Interest income’.
Assets
| 2012 | 2011 | 2010 | ||||||||||||||||||||||||||||||||||||||||||||||||||||
Average balance | Interest income | Yield % | Average balance | Interest income | Yield % | Average balance | Interest income | Yield % | ||||||||||||||||||||||||||||||||||||||||||||||
Summary | ||||||||||||||||||||||||||||||||||||||||||||||||||||||
Interest-earning assets measured at amortised cost (itemised below) | 1,625,068 | 56,702 | 3.49 | 1,622,658 | 63,005 | 3.88 | 1,472,294 | 58,345 | 3.96 | |||||||||||||||||||||||||||||||||||||||||||||
Trading assets and financial assets designated at fair value90,91 | 368,406 | 6,931 | 1.88 | 410,038 | 8,671 | 2.11 | 385,203 | 7,060 | 1.83 | |||||||||||||||||||||||||||||||||||||||||||||
Impairment provisions | (17,421 | ) | (18,738 | ) | (22,905 | ) | ||||||||||||||||||||||||||||||||||||||||||||||||
Non-interest-earning assets | 730,901 | 752,965 | 664,308 | |||||||||||||||||||||||||||||||||||||||||||||||||||
Total assets and interest income | 2,706,954 | 63,633 | 2.35 | 2,766,923 | 71,676 | 2.59 | 2,498,900 | 65,405 | 2.62 | |||||||||||||||||||||||||||||||||||||||||||||
Average yield on all interest-earning assets | 3.19 | 3.53 | 3.52 | |||||||||||||||||||||||||||||||||||||||||||||||||||
Short-term funds and loans and advances to banks | ||||||||||||||||||||||||||||||||||||||||||||||||||||||
Europe | HSBC Bank | 86,496 | 1,040 | 1.20 | 62,489 | 1,186 | 1.90 | 47,741 | 1,290 | 2.70 | ||||||||||||||||||||||||||||||||||||||||||||
HSBC Private Banking Holdings (Suisse) | 2,072 | 9 | 0.43 | 1,886 | 14 | 0.74 | 2,603 | 15 | 0.58 | |||||||||||||||||||||||||||||||||||||||||||||
HSBC France | 33,199 | 176 | 0.53 | 36,023 | 477 | 1.32 | 47,094 | 337 | 0.72 | |||||||||||||||||||||||||||||||||||||||||||||
Hong Kong | Hang Seng Bank | 16,396 | 283 | 1.73 | 17,761 | 334 | 1.88 | 14,884 | 222 | 1.49 | ||||||||||||||||||||||||||||||||||||||||||||
The Hongkong and Shanghai Banking Corporation | 18,379 | 224 | 1.22 | 22,033 | 233 | 1.06 | 16,544 | 117 | 0.71 | |||||||||||||||||||||||||||||||||||||||||||||
Rest of Asia-Pacific | The Hongkong and Shanghai Banking Corporation | 42,814 | 805 | 1.88 | 41,692 | 920 | 2.21 | 30,288 | 464 | 1.53 | ||||||||||||||||||||||||||||||||||||||||||||
HSBC Bank Malaysia | 5,375 | 157 | 2.92 | 6,049 | 174 | 2.88 | 5,113 | 126 | 2.46 | |||||||||||||||||||||||||||||||||||||||||||||
MENA | HSBC Bank Middle East | 5,922 | 41 | 0.69 | 4,467 | 42 | 0.94 | 5,335 | 60 | 1.12 | ||||||||||||||||||||||||||||||||||||||||||||
North America | HSBC Bank USA | 23,768 | 106 | 0.45 | 27,495 | 97 | 0.35 | 28,653 | 103 | 0.36 | ||||||||||||||||||||||||||||||||||||||||||||
HSBC Bank Canada | 1,677 | 17 | 1.01 | 2,886 | 23 | 0.80 | 3,823 | 16 | 0.42 | |||||||||||||||||||||||||||||||||||||||||||||
Latin America | HSBC Mexico | 3,053 | 119 | 3.90 | 3,383 | 130 | 3.84 | 3,238 | 129 | 3.98 | ||||||||||||||||||||||||||||||||||||||||||||
Brazilian operations92 | 14,610 | 1,155 | 7.91 | 18,954 | 2,036 | 10.74 | 16,102 | 1,525 | 9.47 | |||||||||||||||||||||||||||||||||||||||||||||
HSBC Bank Panama | 410 | 5 | 1.22 | 1,138 | 10 | 0.88 | 959 | 8 | 0.83 | |||||||||||||||||||||||||||||||||||||||||||||
HSBC Bank Argentina | 396 | 45 | 11.36 | 341 | 33 | 9.68 | 169 | 20 | 11.83 | |||||||||||||||||||||||||||||||||||||||||||||
Other operations | 21,412 | 125 | 0.58 | 15,152 | 151 | 1.00 | 14,196 | 123 | 0.87 | |||||||||||||||||||||||||||||||||||||||||||||
| 275,979 | 4,307 | 1.56 | 261,749 | 5,860 | 2.24 | 236,742 | 4,555 | 1.92 | ||||||||||||||||||||||||||||||||||||||||||||||
49a
Table of Contents
HSBC HOLDINGS PLC
Report of the Directors: Operating and Financial Review(continued)
| 2012 | 2011 | 2010 | ||||||||||||||||||||||||||||||||||||||||||||||||||||
Average balance | Interest income | Yield % | Average balance | Interest income | Yield % | Average balance | Interest income | Yield % | ||||||||||||||||||||||||||||||||||||||||||||||
Loans and advances to customers | ||||||||||||||||||||||||||||||||||||||||||||||||||||||
Europe | HSBC Bank | 289,586 | 10,596 | 3.66 | 299,775 | 10,225 | 3.41 | 265,163 | 9,761 | 3.68 | ||||||||||||||||||||||||||||||||||||||||||||
HSBC Private Banking Holdings (Suisse) | 12,591 | 199 | 1.58 | 14,631 | 255 | 1.74 | 11,987 | 191 | 1.59 | |||||||||||||||||||||||||||||||||||||||||||||
HSBC France | 69,021 | 1,713 | 2.48 | 75,033 | 2,087 | 2.78 | 66,910 | 1,684 | 2.52 | |||||||||||||||||||||||||||||||||||||||||||||
HSBC Finance | 886 | 42 | 4.74 | 1,486 | 98 | 6.59 | 2,251 | 198 | 8.80 | |||||||||||||||||||||||||||||||||||||||||||||
Hong Kong | Hang Seng Bank | 64,907 | 1,895 | 2.92 | 63,198 | 1,569 | 2.48 | 51,028 | 1,313 | 2.57 | ||||||||||||||||||||||||||||||||||||||||||||
The Hongkong and Shanghai Banking Corporation | 100,203 | 2,410 | 2.41 | 91,209 | 1,975 | 2.17 | 65,226 | 1,755 | 2.69 | |||||||||||||||||||||||||||||||||||||||||||||
Rest of Asia-Pacific | The Hongkong and Shanghai Banking Corporation | 109,298 | 5,231 | 4.79 | 99,683 | 4,863 | 4.88 | 81,080 | 3,928 | 4.84 | ||||||||||||||||||||||||||||||||||||||||||||
HSBC Bank Malaysia | 13,456 | 707 | 5.25 | 12,118 | 657 | 5.42 | 9,614 | 531 | 5.52 | |||||||||||||||||||||||||||||||||||||||||||||
MENA | HSBC Bank Middle East | 24,012 | 1,214 | 5.06 | 22,494 | 1,296 | 5.76 | 21,193 | 1,303 | 6.15 | ||||||||||||||||||||||||||||||||||||||||||||
North America | HSBC Bank USA | 59,806 | 1,742 | 2.91 | 67,817 | 3,226 | 4.76 | 78,556 | 4,582 | 5.83 | ||||||||||||||||||||||||||||||||||||||||||||
HSBC Finance | 43,887 | 3,904 | 8.90 | 59,857 | 5,842 | 9.76 | 78,105 | 7,741 | 9.91 | |||||||||||||||||||||||||||||||||||||||||||||
HSBC Bank Canada | 44,673 | 1,588 | 3.55 | 44,512 | 1,683 | 3.78 | 46,360 | 1,643 | 3.54 | |||||||||||||||||||||||||||||||||||||||||||||
Latin America | HSBC Mexico | 14,411 | 1,613 | 11.19 | 14,290 | 1,630 | 11.41 | 12,309 | 1,571 | 12.76 | ||||||||||||||||||||||||||||||||||||||||||||
Brazilian operations92 | 27,621 | 5,468 | 19.80 | 30,212 | 6,584 | 21.79 | 23,366 | 5,118 | 21.90 | |||||||||||||||||||||||||||||||||||||||||||||
HSBC Bank Panama | 5,691 | 395 | 6.94 | 10,346 | 833 | 8.05 | 9,348 | 815 | 8.72 | |||||||||||||||||||||||||||||||||||||||||||||
HSBC Bank Argentina | 3,644 | 718 | 19.70 | 3,320 | 524 | 15.78 | 2,460 | 367 | 14.92 | |||||||||||||||||||||||||||||||||||||||||||||
Other operations | 50,963 | 1,608 | 3.16 | 35,307 | 1,903 | 5.39 | 33,543 | 1,685 | 5.02 | |||||||||||||||||||||||||||||||||||||||||||||
| 934,656 | 41,043 | 4.39 | 945,288 | 45,250 | 4.79 | 858,499 | 44,186 | 5.15 | ||||||||||||||||||||||||||||||||||||||||||||||
Financial investments | ||||||||||||||||||||||||||||||||||||||||||||||||||||||
Europe | HSBC Bank | 80,475 | 1,275 | 1.58 | 95,522 | 1,631 | 1.71 | 85,206 | 1,725 | 2.02 | ||||||||||||||||||||||||||||||||||||||||||||
HSBC Private Banking Holdings (Suisse) | 5,722 | 107 | 1.87 | 13,521 | 247 | 1.83 | 17,013 | 287 | 1.69 | |||||||||||||||||||||||||||||||||||||||||||||
HSBC France | 11,208 | 130 | 1.16 | 4,662 | 133 | 2.85 | 4,017 | 102 | 2.54 | |||||||||||||||||||||||||||||||||||||||||||||
Hong Kong | Hang Seng Bank | 29,319 | 590 | 2.01 | 26,095 | 596 | 2.28 | 30,334 | 541 | 1.78 | ||||||||||||||||||||||||||||||||||||||||||||
The Hongkong and Shanghai Banking Corporation | 48,695 | 320 | 0.66 | 52,357 | 399 | 0.76 | 65,256 | 477 | 0.73 | |||||||||||||||||||||||||||||||||||||||||||||
Rest of Asia-Pacific | The Hongkong and Shanghai Banking Corporation | 46,095 | 1,501 | 3.26 | 40,033 | 1,422 | 3.55 | 37,833 | 1,161 | 3.07 | ||||||||||||||||||||||||||||||||||||||||||||
HSBC Bank Malaysia | 1,798 | 59 | 3.28 | 1,013 | 33 | 3.26 | 911 | 28 | 3.07 | |||||||||||||||||||||||||||||||||||||||||||||
MENA | HSBC Bank Middle East | 10,266 | 113 | 1.10 | 10,944 | 150 | 1.37 | 8,086 | 126 | 1.56 | ||||||||||||||||||||||||||||||||||||||||||||
North America | HSBC Bank USA | 61,510 | 1,092 | 1.78 | 50,357 | 1,250 | 2.48 | 38,541 | 1,156 | 3.00 | ||||||||||||||||||||||||||||||||||||||||||||
HSBC Finance | 941 | 67 | 7.12 | 2,956 | 104 | 3.52 | 2,834 | 116 | 4.09 | |||||||||||||||||||||||||||||||||||||||||||||
HSBC Bank Canada | 21,179 | 297 | 1.40 | 17,821 | 307 | 1.72 | 14,310 | 257 | 1.80 | |||||||||||||||||||||||||||||||||||||||||||||
Latin America | HSBC Mexico | 8,021 | 379 | 4.73 | 9,767 | 473 | 4.84 | 7,177 | 388 | 5.41 | ||||||||||||||||||||||||||||||||||||||||||||
Brazilian operations92 | 9,527 | 1,019 | 10.70 | 10,072 | 1,206 | 11.97 | 9,564 | 1,089 | 11.39 | |||||||||||||||||||||||||||||||||||||||||||||
HSBC Bank Panama | 585 | 20 | 3.42 | 1,147 | 50 | 4.36 | 996 | 38 | 3.82 | |||||||||||||||||||||||||||||||||||||||||||||
HSBC Bank Argentina | 701 | 96 | 13.69 | 651 | 99 | 15.21 | 370 | 58 | 15.68 | |||||||||||||||||||||||||||||||||||||||||||||
Other operations | 51,287 | 2,013 | 3.92 | 47,141 | 2,129 | 4.52 | 56,523 | 1,826 | 3.23 | |||||||||||||||||||||||||||||||||||||||||||||
| 387,329 | 9,078 | 2.34 | 384,059 | 10,229 | 2.66 | 378,971 | 9,375 | 2.47 | ||||||||||||||||||||||||||||||||||||||||||||||
49b
Table of Contents
HSBC HOLDINGS PLC
Report of the Directors: Operating and Financial Review(continued)
Assets (continued)
| 2012 | 2011 | 2010 | ||||||||||||||||||||||||||||||||||||||||||||||||||||
Average balance US$m | Interest income US$m | Yield % | Average balance US$m | Interest income US$m | Yield % | Average balance US$m | Interest income US$m | Yield % | ||||||||||||||||||||||||||||||||||||||||||||||
Other interest-earning assets | ||||||||||||||||||||||||||||||||||||||||||||||||||||||
Europe | HSBC Bank | 119,175 | 153 | 0.13 | 53,394 | 101 | 0.19 | 14,255 | 100 | 0.70 | ||||||||||||||||||||||||||||||||||||||||||||
HSBC Private Banking Holdings (Suisse) | 14,461 | 189 | 1.31 | 19,568 | 262 | 1.34 | 17,738 | 241 | 1.36 | |||||||||||||||||||||||||||||||||||||||||||||
HSBC France | 13,107 | 121 | 0.92 | 10,037 | 160 | 1.59 | 9,954 | 93 | 0.93 | |||||||||||||||||||||||||||||||||||||||||||||
Hong Kong | Hang Seng Bank | 1,003 | 9 | 0.90 | 854 | 9 | 1.05 | 1,077 | 13 | 1.21 | ||||||||||||||||||||||||||||||||||||||||||||
The Hongkong and Shanghai Banking Corporation | 43,871 | 441 | 1.01 | 32,917 | 383 | 1.16 | 27,112 | 260 | 0.96 | |||||||||||||||||||||||||||||||||||||||||||||
Rest of Asia-Pacific | The Hongkong and Shanghai Banking Corporation | 15,320 | 40 | 0.26 | 15,414 | 53 | 0.34 | 18,476 | 55 | 0.30 | ||||||||||||||||||||||||||||||||||||||||||||
HSBC Bank Malaysia | 553 | 4 | 0.72 | 578 | 8 | 1.38 | 745 | 14 | 1.88 | |||||||||||||||||||||||||||||||||||||||||||||
MENA | HSBC Bank Middle East | 1,914 | 72 | 3.76 | 698 | 22 | 3.15 | 1,272 | 46 | 3.62 | ||||||||||||||||||||||||||||||||||||||||||||
North America | HSBC Bank USA | 12,324 | 872 | 7.08 | 15,187 | 903 | 5.95 | 3,467 | 58 | 1.67 | ||||||||||||||||||||||||||||||||||||||||||||
HSBC Finance | 7,723 | 656 | 8.49 | 6,014 | 671 | 11.16 | 2,895 | 7 | 0.24 | |||||||||||||||||||||||||||||||||||||||||||||
HSBC Bank Canada | 2,340 | 69 | 2.95 | 3,109 | 59 | 1.90 | 1,287 | 20 | 1.55 | |||||||||||||||||||||||||||||||||||||||||||||
Latin America | HSBC Mexico | 614 | 39 | 6.35 | 383 | 27 | 7.05 | 158 | 9 | 5.70 | ||||||||||||||||||||||||||||||||||||||||||||
Brazilian operations92 | 1,338 | 100 | 7.47 | 2,031 | 54 | 2.66 | 1,170 | 80 | 6.84 | |||||||||||||||||||||||||||||||||||||||||||||
HSBC Bank Panama | 4,647 | 348 | 7.49 | 804 | 10 | 1.24 | 1,234 | 12 | 0.97 | |||||||||||||||||||||||||||||||||||||||||||||
HSBC Bank Argentina | 106 | 4 | 4 | 88 | – | – | 87 | – | – | |||||||||||||||||||||||||||||||||||||||||||||
Other operations | (211,392 | ) | (843 | ) | (129,514 | ) | (1,056 | ) | (102,845 | ) | (779 | ) | ||||||||||||||||||||||||||||||||||||||||||
| 27,104 | 2,274 | 8.39 | 31,562 | 1,666 | 5.28 | (1,918 | ) | 229 | (11.94 | ) | ||||||||||||||||||||||||||||||||||||||||||||
Total interest-earning assets | ||||||||||||||||||||||||||||||||||||||||||||||||||||||
Europe | HSBC Bank | 575,732 | 13,064 | 2.27 | 511,180 | 13,143 | 2.57 | 412,365 | 12,876 | 3.12 | ||||||||||||||||||||||||||||||||||||||||||||
HSBC Private Banking Holdings (Suisse) | 34,846 | 504 | 1.45 | 49,606 | 778 | 1.57 | 49,341 | 734 | 1.49 | |||||||||||||||||||||||||||||||||||||||||||||
HSBC France | 126,535 | 2,140 | 1.69 | 125,755 | 2,857 | 2.27 | 127,975 | 2,216 | 1.73 | |||||||||||||||||||||||||||||||||||||||||||||
HSBC Finance | 889 | 42 | 4.72 | 1,486 | 98 | 6.59 | 2,251 | 198 | 8.80 | |||||||||||||||||||||||||||||||||||||||||||||
Hong Kong | Hang Seng Bank | 111,625 | 2,777 | 2.49 | 107,908 | 2,508 | 2.32 | 97,323 | 2,089 | 2.15 | ||||||||||||||||||||||||||||||||||||||||||||
The Hongkong and Shanghai Banking Corporation | 211,148 | 3,395 | 1.61 | 198,516 | 2,990 | 1.51 | 174,138 | 2,609 | 1.50 | |||||||||||||||||||||||||||||||||||||||||||||
Rest of Asia-Pacific | The Hongkong and Shanghai Banking Corporation | 213,527 | 7,577 | 3.55 | 196,822 | 7,258 | 3.69 | 167,677 | 5,608 | 3.34 | ||||||||||||||||||||||||||||||||||||||||||||
HSBC Bank Malaysia | 21,182 | 927 | 4.38 | 19,758 | 872 | 4.41 | 16,383 | 699 | 4.27 | |||||||||||||||||||||||||||||||||||||||||||||
MENA | HSBC Bank Middle East | 42,114 | 1,440 | 3.42 | 38,603 | 1,510 | 3.91 | 35,886 | 1,535 | 4.28 | ||||||||||||||||||||||||||||||||||||||||||||
North America | HSBC Bank USA | 157,408 | 3,812 | 2.42 | 160,856 | 5,476 | 3.40 | 149,217 | 5,899 | 3.95 | ||||||||||||||||||||||||||||||||||||||||||||
HSBC Finance | 54,342 | 4,627 | 8.51 | 68,827 | 6,617 | 9.61 | 83,834 | 7,864 | 9.38 | |||||||||||||||||||||||||||||||||||||||||||||
HSBC Bank Canada | 69,869 | 1,971 | 2.82 | 68,328 | 2,072 | 3.03 | 65,780 | 1,936 | 2.94 | |||||||||||||||||||||||||||||||||||||||||||||
Latin America | HSBC Mexico | 26,099 | 2,150 | 8.24 | 27,823 | 2,260 | 8.12 | 22,882 | 2,097 | 9.16 | ||||||||||||||||||||||||||||||||||||||||||||
Brazilian operations92 | 53,096 | 7,742 | 14.58 | 61,269 | 9,880 | 16.13 | 50,202 | 7,812 | 15.56 | |||||||||||||||||||||||||||||||||||||||||||||
HSBC Bank Panama | 11,333 | 768 | 6.78 | 13,435 | 903 | 6.72 | 12,537 | 873 | 6.96 | |||||||||||||||||||||||||||||||||||||||||||||
HSBC Bank Argentina | 4,847 | 863 | 17.80 | 4,400 | 656 | 14.91 | 3,086 | 445 | 14.42 | |||||||||||||||||||||||||||||||||||||||||||||
Other operations | (89,524 | ) | 2,903 | (31,914 | ) | 3,127 | 1,417 | 2,855 | ||||||||||||||||||||||||||||||||||||||||||||||
| 1,625,068 | 56,702 | 3.49 | 1,622,658 | 63,005 | 3.88 | 1,472,294 | 58,345 | 3.96 | ||||||||||||||||||||||||||||||||||||||||||||||
For footnotes, see page 120.
49c
Table of Contents
HSBC HOLDINGS PLC
Report of the Directors: Operating and Financial Review(continued)
Equity and liabilities
| 2012 | 2011 | 2010 | ||||||||||||||||||||||||||||||||||||||||||||||||||||
Average balance US$m | Interest expense US$m | Cost % | Average balance US$m | Interest expense US$m | Cost % | Average balance US$m | Interest expense US$m | Cost % | ||||||||||||||||||||||||||||||||||||||||||||||
Summary | ||||||||||||||||||||||||||||||||||||||||||||||||||||||
Interest-bearing liabilities measured at amortised cost (itemised below) | 1,401,020 | 19,030 | 1.36 | 1,433,566 | 22,343 | 1.56 | 1,339,390 | 18,904 | 1.41 | |||||||||||||||||||||||||||||||||||||||||||||
Trading liabilities and financial liabilities designated at fair value (excluding own debt issued) | 318,883 | 3,445 | 1.08 | 355,345 | 4,564 | 1.28 | 275,804 | 3,780 | 1.37 | |||||||||||||||||||||||||||||||||||||||||||||
Non-interest bearing current accounts | 177,085 | 162,369 | 142,579 | |||||||||||||||||||||||||||||||||||||||||||||||||||
Total equity and other non-interest bearing liabilities | 809,876 | 815,643 | 741,127 | |||||||||||||||||||||||||||||||||||||||||||||||||||
Total equity and liabilities | 2,706,864 | 22,475 | 0.83 | 2,766,923 | 26,907 | 0.97 | 2,498,900 | 22,684 | 0.91 | |||||||||||||||||||||||||||||||||||||||||||||
Average cost on all interest-bearing liabilities | 1.31 | 1.50 | 1.40 | |||||||||||||||||||||||||||||||||||||||||||||||||||
Deposits by banks93 | ||||||||||||||||||||||||||||||||||||||||||||||||||||||
Europe | HSBC Bank | 27,738 | 435 | 1.57 | 33,764 | 529 | 1.57 | 32,850 | 260 | 0.79 | ||||||||||||||||||||||||||||||||||||||||||||
HSBC Private Banking Holdings (Suisse) | 657 | 2 | 0.30 | 874 | 2 | 0.23 | 964 | 2 | 0.21 | |||||||||||||||||||||||||||||||||||||||||||||
HSBC France | 26,026 | 171 | 0.66 | 29,329 | 396 | 1.35 | 42,399 | 340 | 0.80 | |||||||||||||||||||||||||||||||||||||||||||||
Hong Kong | Hang Seng Bank | 1,305 | 15 | 1.15 | 1,903 | 7 | 0.37 | 1,456 | 4 | 0.27 | ||||||||||||||||||||||||||||||||||||||||||||
The Hongkong and Shanghai Banking Corporation | 7,648 | 12 | 0.16 | 8,389 | 13 | 0.15 | 5,691 | 10 | 0.18 | |||||||||||||||||||||||||||||||||||||||||||||
Rest of Asia-Pacific | The Hongkong and Shanghai Banking Corporation | 10,668 | 159 | 1.49 | 10,613 | 159 | 1.50 | 9,540 | 131 | 1.37 | ||||||||||||||||||||||||||||||||||||||||||||
HSBC Bank Malaysia | 961 | 20 | 2.08 | 360 | 9 | 2.50 | 164 | 4 | 2.44 | |||||||||||||||||||||||||||||||||||||||||||||
MENA | HSBC Bank Middle East | 1,588 | 6 | 0.38 | 1,511 | 6 | 0.40 | 762 | 6 | 0.79 | ||||||||||||||||||||||||||||||||||||||||||||
North America | HSBC Bank USA | 7,587 | 19 | 0.25 | 7,730 | 18 | 0.23 | 8,693 | 26 | 0.30 | ||||||||||||||||||||||||||||||||||||||||||||
HSBC Bank Canada | 1,613 | 9 | 0.56 | 760 | 15 | 1.97 | 946 | 5 | 0.53 | |||||||||||||||||||||||||||||||||||||||||||||
Latin America | HSBC Mexico | 1,103 | 52 | 4.71 | 1,167 | 62 | 5.31 | 1,002 | 51 | 5.09 | ||||||||||||||||||||||||||||||||||||||||||||
Brazilian operations92 | 4,323 | 194 | 4.49 | 6,433 | 331 | 5.15 | 3,610 | 247 | 6.84 | |||||||||||||||||||||||||||||||||||||||||||||
HSBC Bank Panama | 645 | 12 | 1.86 | 802 | 18 | 2.24 | 612 | 18 | 2.94 | |||||||||||||||||||||||||||||||||||||||||||||
HSBC Bank Argentina | 44 | 3 | 6.82 | 24 | 2 | 8.33 | 17 | 1 | 5.88 | |||||||||||||||||||||||||||||||||||||||||||||
Other operations | 897 | 51 | 5.69 | 2,440 | 24 | 0.98 | 2,737 | 31 | 1.13 | |||||||||||||||||||||||||||||||||||||||||||||
| 92,803 | 1,160 | 1.25 | 106,099 | 1,591 | 1.50 | 111,443 | 1,136 | 1.02 | ||||||||||||||||||||||||||||||||||||||||||||||
Financial liabilities designated at fair value – own debt issued94 | ||||||||||||||||||||||||||||||||||||||||||||||||||||||
Europe | HSBC Holdings | 23,864 | 446 | 1.87 | 19,654 | 342 | 1.74 | 16,577 | 308 | 1.86 | ||||||||||||||||||||||||||||||||||||||||||||
HSBC Bank | 28,046 | 556 | 1.98 | 26,504 | 462 | 1.74 | 15,169 | 270 | 1.78 | |||||||||||||||||||||||||||||||||||||||||||||
HSBC France | 7,147 | 118 | 1.65 | 6,907 | 174 | 2.52 | 7,154 | 113 | 1.58 | |||||||||||||||||||||||||||||||||||||||||||||
Hong Kong | Hang Seng Bank | – | – | – | – | – | – | 63 | – | – | ||||||||||||||||||||||||||||||||||||||||||||
North America | HSBC Bank USA | 1,853 | 38 | 2.05 | 1,642 | 38 | 2.31 | 1,721 | 25 | 1.45 | ||||||||||||||||||||||||||||||||||||||||||||
HSBC Finance | 12,147 | 184 | 1.51 | 17,108 | 289 | 1.69 | 24,740 | 528 | 2.13 | |||||||||||||||||||||||||||||||||||||||||||||
Other operations | 1,959 | (17 | ) | (0.87 | ) | 1,820 | 8 | 0.44 | 1,282 | 27 | 2.11 | |||||||||||||||||||||||||||||||||||||||||||
| 75,016 | 1,325 | 1.77 | 73,635 | 1,313 | 1.78 | 66,706 | 1,271 | 1.91 | ||||||||||||||||||||||||||||||||||||||||||||||
49d
Table of Contents
HSBC HOLDINGS PLC
Report of the Directors: Operating and Financial Review(continued)
Equity and liabilities (continued)
| 2012 | 2011 | 2010 | ||||||||||||||||||||||||||||||||||||||||||||||||||||
Average balance US$m | Interest expense US$m | Cost % | Average balance US$m | Interest expense US$m | Cost % | Average balance US$m | Interest expense US$m | Cost % | ||||||||||||||||||||||||||||||||||||||||||||||
Customer accounts95 | ||||||||||||||||||||||||||||||||||||||||||||||||||||||
Europe | HSBC Bank | 309,808 | 2,445 | 0.79 | 306,060 | 2,387 | 0.78 | 275,153 | 2,042 | 0.74 | ||||||||||||||||||||||||||||||||||||||||||||
HSBC Private Banking Holdings (Suisse) | 15,926 | 84 | 0.53 | 22,025 | 163 | 0.74 | 20,530 | 144 | 0.70 | |||||||||||||||||||||||||||||||||||||||||||||
HSBC France | 47,974 | 403 | 0.84 | 49,363 | 650 | 1.32 | 50,096 | 377 | 0.75 | |||||||||||||||||||||||||||||||||||||||||||||
Hong Kong | Hang Seng Bank | 85,425 | 365 | 0.43 | 83,220 | 342 | 0.41 | 76,708 | 205 | 0.27 | ||||||||||||||||||||||||||||||||||||||||||||
The Hongkong and Shanghai Banking Corporation | 190,654 | 250 | 0.13 | 177,336 | 231 | 0.13 | 160,794 | 146 | 0.09 | |||||||||||||||||||||||||||||||||||||||||||||
Rest of Asia-Pacific | The Hongkong and Shanghai Banking Corporation | 129,419 | 2,381 | 1.84 | 121,237 | 2,277 | 1.88 | 104,648 | 1,696 | 1.62 | ||||||||||||||||||||||||||||||||||||||||||||
HSBC Bank Malaysia | 13,624 | 311 | 2.28 | 13,326 | 299 | 2.24 | 11,213 | 220 | 1.96 | |||||||||||||||||||||||||||||||||||||||||||||
MENA | HSBC Bank Middle East | 17,477 | 163 | 0.93 | 17,484 | 237 | 1.36 | 15,906 | 284 | 1.79 | ||||||||||||||||||||||||||||||||||||||||||||
North America | HSBC Bank USA | 68,134 | 224 | 0.33 | 83,988 | 340 | 0.40 | 85,946 | 540 | 0.63 | ||||||||||||||||||||||||||||||||||||||||||||
HSBC Bank Canada | 45,116 | 344 | 0.76 | 44,833 | 358 | 0.80 | 41,153 | 304 | 0.74 | |||||||||||||||||||||||||||||||||||||||||||||
Latin America | HSBC Mexico | 17,735 | 528 | 2.98 | 18,139 | 538 | 2.97 | 14,127 | 398 | 2.82 | ||||||||||||||||||||||||||||||||||||||||||||
Brazilian operations92 | 30,352 | 2,411 | 7.94 | 41,194 | 4,471 | 10.85 | 36,727 | 3,502 | 9.54 | |||||||||||||||||||||||||||||||||||||||||||||
HSBC Bank Panama | 4,303 | 96 | 2.23 | 8,915 | 294 | 3.30 | 8,771 | 321 | 3.66 | |||||||||||||||||||||||||||||||||||||||||||||
HSBC Bank Argentina | 3,594 | 268 | 7.46 | 3,149 | 200 | 6.35 | 2,538 | 97 | 3.82 | |||||||||||||||||||||||||||||||||||||||||||||
Other operations | 73,271 | 605 | 0.83 | 68,057 | 669 | 0.98 | 58,303 | 502 | 0.86 | |||||||||||||||||||||||||||||||||||||||||||||
| 1,052,812 | 10,878 | 1.03 | 1,058,326 | 13,456 | 1.27 | 962,613 | 10,778 | 1.12 | ||||||||||||||||||||||||||||||||||||||||||||||
Debt securities in issue | ||||||||||||||||||||||||||||||||||||||||||||||||||||||
Europe | HSBC Bank | 69,294 | 989 | 1.43 | 79,670 | 982 | 1.23 | 62,735 | 1,130 | 1.80 | ||||||||||||||||||||||||||||||||||||||||||||
HSBC France | 14,801 | 118 | 0.80 | 18,043 | 260 | 1.44 | 20,686 | 160 | 0.77 | |||||||||||||||||||||||||||||||||||||||||||||
Hong Kong | Hang Seng Bank | 1,606 | 15 | 0.93 | 1,424 | 13 | 0.91 | 1,034 | 13 | 1.26 | ||||||||||||||||||||||||||||||||||||||||||||
Rest of Asia-Pacific | The Hongkong and Shanghai Banking Corporation | 7,732 | 241 | 3.12 | 7,918 | 263 | 3.32 | 5,558 | 218 | 3.92 | ||||||||||||||||||||||||||||||||||||||||||||
HSBC Bank Malaysia | 1,016 | 25 | 2.46 | 568 | 18 | 3.17 | 389 | 15 | 3.86 | |||||||||||||||||||||||||||||||||||||||||||||
MENA | HSBC Bank Middle East | 3,769 | 83 | 2.20 | 3,870 | 77 | 1.99 | 3,940 | 63 | 1.60 | ||||||||||||||||||||||||||||||||||||||||||||
North America | HSBC Bank USA | 12,738 | 390 | 3.06 | 12,535 | 395 | 3.15 | 12,680 | 375 | 2.96 | ||||||||||||||||||||||||||||||||||||||||||||
HSBC Finance | 29,198 | 1,059 | 3.63 | 40,629 | 1,413 | 3.48 | 48,561 | 1,766 | 3.64 | |||||||||||||||||||||||||||||||||||||||||||||
HSBC Bank Canada | 12,675 | 390 | 3.08 | 12,061 | 392 | 3.25 | 13,205 | 343 | 2.60 | |||||||||||||||||||||||||||||||||||||||||||||
Latin America | HSBC Mexico | 897 | 51 | 5.69 | 1,074 | 57 | 5.31 | 922 | 51 | 5.53 | ||||||||||||||||||||||||||||||||||||||||||||
Brazilian operations92 | 9,114 | 732 | 8.03 | 6,825 | 708 | 10.37 | 2,112 | 151 | 7.15 | |||||||||||||||||||||||||||||||||||||||||||||
HSBC Bank Panama | 182 | 9 | 4.95 | 601 | 29 | 4.83 | 771 | 40 | 5.19 | |||||||||||||||||||||||||||||||||||||||||||||
HSBC Bank Argentina | 121 | 20 | 16.53 | 66 | 11 | 16.67 | 4 | – | – | |||||||||||||||||||||||||||||||||||||||||||||
Other operations | (1,795 | ) | 633 | (35.26 | ) | (3,802 | ) | 642 | (16.89 | ) | 17,301 | 606 | 3.50 | |||||||||||||||||||||||||||||||||||||||||
| 161,348 | 4,755 | 2.95 | 181,482 | 5,260 | 2.90 | 189,898 | 4,931 | 2.60 | ||||||||||||||||||||||||||||||||||||||||||||||
49e
Table of Contents
HSBC HOLDINGS PLC
Report of the Directors: Operating and Financial Review(continued)
| 2012 | 2011 | 2010 | ||||||||||||||||||||||||||||||||||||||||||||||||||||
Average balance | Interest expense | Cost | Average balance | Interest expense | Cost | Average balance | Interest expense | Cost | ||||||||||||||||||||||||||||||||||||||||||||||
| US$m | US$m | % | US$m | US$m | % | US$m | US$m | % | ||||||||||||||||||||||||||||||||||||||||||||||
Other interest-bearing liabilities | ||||||||||||||||||||||||||||||||||||||||||||||||||||||
Europe | HSBC Bank | 126,279 | 671 | 0.53 | 66,449 | 595 | 0.90 | 28,269 | 434 | 1.54 | ||||||||||||||||||||||||||||||||||||||||||||
HSBC Private Banking Holdings (Suisse) | 4,195 | 4 | 0.10 | 3,006 | 8 | 0.27 | 2,921 | 7 | 0.24 | |||||||||||||||||||||||||||||||||||||||||||||
HSBC France | 20,853 | 28 | 0.13 | 20,294 | 170 | 0.84 | 16,668 | 78 | 0.47 | |||||||||||||||||||||||||||||||||||||||||||||
HSBC Finance | 303 | 2 | 0.66 | 828 | 6 | 0.72 | 1,595 | 15 | 0.94 | |||||||||||||||||||||||||||||||||||||||||||||
Hong Kong | Hang Seng Bank | 1,715 | 39 | 2.27 | 1,422 | 25 | 1.76 | 829 | 5 | 0.60 | ||||||||||||||||||||||||||||||||||||||||||||
The Hongkong and Shanghai Banking Corporation | 11,213 | 71 | 0.63 | 12,759 | 72 | 0.56 | 8,580 | 55 | 0.64 | |||||||||||||||||||||||||||||||||||||||||||||
Rest of Asia-Pacific | The Hongkong and Shanghai Banking Corporation | 40,827 | 406 | 0.99 | 35,562 | 361 | 1.02 | 34,027 | 248 | 0.73 | ||||||||||||||||||||||||||||||||||||||||||||
HSBC Bank Malaysia | 1,069 | 16 | 1.50 | 1,121 | 17 | 1.52 | 706 | 8 | 1.13 | |||||||||||||||||||||||||||||||||||||||||||||
MENA | HSBC Bank Middle East | 1,681 | 76 | 4.52 | 1,506 | 50 | 3.32 | 1,496 | 63 | 4.21 | ||||||||||||||||||||||||||||||||||||||||||||
North America | HSBC Bank USA | 26,255 | 408 | 1.55 | 23,431 | 820 | 3.50 | 14,669 | 609 | 4.15 | ||||||||||||||||||||||||||||||||||||||||||||
HSBC Finance | 3,196 | 162 | 5.07 | 4,345 | 29 | 0.67 | 3,487 | 102 | 2.93 | |||||||||||||||||||||||||||||||||||||||||||||
HSBC Bank Canada | 772 | 4 | 0.52 | 360 | 2 | 0.56 | 1,806 | 3 | 0.17 | |||||||||||||||||||||||||||||||||||||||||||||
HSBC Markets Inc | 1,202 | 36 | 3.00 | 2,193 | 40 | 1.82 | 1,266 | 25 | 1.97 | |||||||||||||||||||||||||||||||||||||||||||||
Latin America | HSBC Mexico | 1,305 | 19 | 1.46 | 1,379 | 22 | 1.60 | 804 | 13 | 1.62 | ||||||||||||||||||||||||||||||||||||||||||||
Brazilian operations92 | 4,705 | 362 | 7.69 | 4,223 | 335 | 7.93 | 2,803 | 316 | 11.27 | |||||||||||||||||||||||||||||||||||||||||||||
HSBC Bank Panama | 3,722 | 113 | 3.04 | 717 | 14 | 1.95 | 108 | 1 | 0.93 | |||||||||||||||||||||||||||||||||||||||||||||
HSBC Bank Argentina | 26 | 3 | 11.54 | 15 | 1 | 6.67 | 4 | – | – | |||||||||||||||||||||||||||||||||||||||||||||
Other operations | (230,043 | ) | (1,508 | ) | (165,586 | ) | (1,844 | ) | (111,308 | ) | (1,194 | ) | ||||||||||||||||||||||||||||||||||||||||||
| 19,275 | 912 | 4.73 | 14,024 | 723 | 5.16 | 8,730 | 788 | 9.03 | ||||||||||||||||||||||||||||||||||||||||||||||
Total interest-bearing liabilities | ||||||||||||||||||||||||||||||||||||||||||||||||||||||
Europe | HSBC Bank | 561,165 | 5,096 | 0.91 | 512,447 | 4,955 | 0.97 | 414,176 | 4,136 | 1.00 | ||||||||||||||||||||||||||||||||||||||||||||
HSBC Private Banking Holdings (Suisse) | 20,778 | 90 | 0.43 | 25,905 | 173 | 0.67 | 24,415 | 153 | 0.63 | |||||||||||||||||||||||||||||||||||||||||||||
HSBC France | 116,801 | 838 | 0.72 | 123,936 | 1,650 | 1.33 | 137,003 | 1,068 | 0.78 | |||||||||||||||||||||||||||||||||||||||||||||
HSBC Finance | 303 | 2 | 0.66 | 828 | 6 | 0.72 | 1,595 | 15 | 0.94 | |||||||||||||||||||||||||||||||||||||||||||||
Hong Kong | Hang Seng Bank | 90,051 | 434 | 0.48 | 87,969 | 387 | 0.44 | 80,090 | 227 | 0.28 | ||||||||||||||||||||||||||||||||||||||||||||
The Hongkong and Shanghai Banking Corporation | 209,515 | 333 | 0.16 | 198,484 | 316 | 0.16 | 175,065 | 211 | 0.12 | |||||||||||||||||||||||||||||||||||||||||||||
Rest of Asia-Pacific | The Hongkong and Shanghai Banking Corporation | 188,646 | 3,187 | 1.69 | 175,330 | 3,060 | 1.75 | 153,773 | 2,293 | 1.49 | ||||||||||||||||||||||||||||||||||||||||||||
HSBC Bank Malaysia | 16,670 | 372 | 2.23 | 15,375 | 343 | 2.23 | 12,472 | 247 | 1.98 | |||||||||||||||||||||||||||||||||||||||||||||
MENA | HSBC Bank Middle East | 24,515 | 328 | 1.34 | 24,371 | 370 | 1.52 | 22,104 | 416 | 1.88 | ||||||||||||||||||||||||||||||||||||||||||||
North America | HSBC Bank USA | 116,567 | 1,079 | 0.93 | 129,326 | 1,611 | 1.25 | 123,709 | 1,575 | 1.27 | ||||||||||||||||||||||||||||||||||||||||||||
HSBC Finance | 44,541 | 1,405 | 3.15 | 62,082 | 1,731 | 2.79 | 76,788 | 2,396 | 3.12 | |||||||||||||||||||||||||||||||||||||||||||||
HSBC Bank Canada | 60,176 | 747 | 1.24 | 58,014 | 767 | 1.32 | 57,110 | 655 | 1.15 | |||||||||||||||||||||||||||||||||||||||||||||
HSBC Markets Inc | 1,202 | 36 | 3.00 | 2,193 | 40 | 1.82 | 1,266 | 25 | 1.97 | |||||||||||||||||||||||||||||||||||||||||||||
Latin America | HSBC Mexico | 21,040 | 650 | 3.09 | 21,759 | 679 | 3.12 | 16,855 | 513 | 3.04 | ||||||||||||||||||||||||||||||||||||||||||||
Brazilian operations92 | 48,494 | 3,699 | 7.63 | 58,675 | 5,845 | 9.96 | 45,252 | 4,216 | 9.32 | |||||||||||||||||||||||||||||||||||||||||||||
HSBC Bank Panama | 8,852 | 230 | 2.64 | 11,035 | 355 | 3.22 | 10,262 | 379 | 3.69 | |||||||||||||||||||||||||||||||||||||||||||||
HSBC Bank Argentina | 3,785 | 294 | 7.77 | 3,254 | 217 | 6.67 | 2,563 | 98 | 3.82 | |||||||||||||||||||||||||||||||||||||||||||||
Other operations | (131,847 | ) | 210 | (77,417 | ) | (162 | ) | (15,108 | ) | 281 | ||||||||||||||||||||||||||||||||||||||||||||
| 1,401,254 | 19,030 | 1.36 | 1,433,566 | 22,343 | 1.56 | 1,339,390 | 18,904 | 1.41 | ||||||||||||||||||||||||||||||||||||||||||||||
For footnotes, see page 120.
49f
Table of Contents
HSBC HOLDINGS PLC
Report of the Directors: Operating and Financial Review(continued)
Net interest margin96
| 2012 % | 2011 % | 2010 % | ||||||||||||||||
Total | 2.32 | 2.51 | 2.68 | |||||||||||||||
Europe | HSBC Bank | 1.38 | 1.60 | 2.12 | ||||||||||||||
HSBC Private Banking Holdings (Suisse) | 1.19 | 1.22 | 1.18 | |||||||||||||||
HSBC France | 1.03 | 0.96 | 0.90 | |||||||||||||||
HSBC Finance | 4.50 | 6.19 | 8.13 | |||||||||||||||
Hong Kong | Hang Seng Bank | 2.10 | 1.97 | 1.91 | ||||||||||||||
The Hongkong and Shanghai Banking Corporation | 1.45 | 1.35 | 1.38 | |||||||||||||||
Rest of Asia-Pacific | The Hongkong and Shanghai Banking Corporation | 2.06 | 2.13 | 1.98 | ||||||||||||||
HSBC Bank Malaysia | 2.62 | 2.68 | 2.76 | |||||||||||||||
MENA | HSBC Bank Middle East | 2.64 | 2.95 | 3.12 | ||||||||||||||
North America | HSBC Bank USA | 1.74 | 2.40 | 2.90 | ||||||||||||||
HSBC Finance | 5.93 | 7.10 | 6.52 | |||||||||||||||
HSBC Bank Canada | 1.75 | 1.91 | 1.95 | |||||||||||||||
Latin America | HSBC Mexico | 5.75 | 5.68 | 6.92 | ||||||||||||||
Brazilian operations92 | 7.61 | 6.59 | 7.16 | |||||||||||||||
HSBC Bank Panama | 4.75 | 4.08 | 3.94 | |||||||||||||||
HSBC Bank Argentina | 11.74 | 9.98 | 11.24 | |||||||||||||||
| Distribution of average total assets | ||||||||||||||||||
2012 % | 2011 % | 2010 % | ||||||||||||||||
Europe | HSBC Bank | 44.8 | 41.5 | 37.5 | ||||||||||||||
HSBC Private Banking Holdings (Suisse) | 1.7 | 2.1 | 2.2 | |||||||||||||||
HSBC France | 11.5 | 10.3 | 12.9 | |||||||||||||||
HSBC Finance | – | 0.1 | 0.1 | |||||||||||||||
Hong Kong | Hang Seng Bank | 4.8 | 4.5 | 4.5 | ||||||||||||||
The Hongkong and Shanghai Banking Corporation | 12.0 | 11.0 | 10.7 | |||||||||||||||
Rest of Asia-Pacific | The Hongkong and Shanghai Banking Corporation | 11.3 | 10.6 | 9.4 | ||||||||||||||
HSBC Bank Malaysia | 1.0 | 0.8 | 0.7 | |||||||||||||||
MENA | HSBC Bank Middle East | 1.8 | 1.6 | 1.6 | ||||||||||||||
North America | HSBC Bank USA | 10.2 | 9.7 | 9.7 | ||||||||||||||
HSBC Finance | 2.1 | 2.7 | 3.6 | |||||||||||||||
HSBC Bank Canada | 3.2 | 3.0 | 3.0 | |||||||||||||||
Latin America | HSBC Mexico | 1.5 | 1.5 | 1.4 | ||||||||||||||
Brazilian operations92 | 2.7 | 3.0 | 2.6 | |||||||||||||||
HSBC Bank Panama | 0.5 | 0.5 | 0.6 | |||||||||||||||
HSBC Bank Argentina | 0.2 | 0.2 | 0.2 | |||||||||||||||
Other operations (including consolidation adjustments) | (9.3 | ) | (3.1 | ) | (0.7 | ) | ||||||||||||
| 100.0 | 100.0 | 100.0 | ||||||||||||||||
For footnotes, see page 120.
49g
Table of Contents
HSBC HOLDINGS PLC
Report of the Directors: Operating and Financial Review(continued)
Analysis of changes in net interest income and net interest expense
The following tables allocate changes in net interest income and net interest expense between volume and rate for 2012 compared with 2011, and for 2011 compared with 2010. We isolate volume variances and allocate any change arising from both volume and rate to rate.
Interest income
| Increase/(decrease) in 2012 compared with 2011 | Increase/(decrease) in 2011 compared with 2010 | |||||||||||||||||||||||||||||||||||||||||
2012 US$m | Volume US$m | Rate US$m | 2011 US$m | Volume US$m | Rate US$m | 2010 US$m | ||||||||||||||||||||||||||||||||||||
Short-term funds and loans and advances to banks | ||||||||||||||||||||||||||||||||||||||||||
Europe | HSBC Bank | 1,040 | 456 | (602 | ) | 1,186 | 398 | (502 | ) | 1,290 | ||||||||||||||||||||||||||||||||
HSBC Private Banking Holdings (Suisse) | 9 | 1 | (6 | ) | 14 | (4 | ) | 3 | 15 | |||||||||||||||||||||||||||||||||
HSBC France | 176 | (37 | ) | (264 | ) | 477 | (80 | ) | 220 | 337 | ||||||||||||||||||||||||||||||||
Hong Kong | Hang Seng Bank | 283 | (26 | ) | (25 | ) | 334 | 43 | 69 | 222 | ||||||||||||||||||||||||||||||||
The Hongkong and Shanghai Banking Corporation | 224 | (39 | ) | 30 | 233 | 39 | 77 | 117 | ||||||||||||||||||||||||||||||||||
Rest of Asia-Pacific | The Hongkong and Shanghai Banking Corporation | 805 | 25 | (140 | ) | 920 | 174 | 282 | 464 | |||||||||||||||||||||||||||||||||
HSBC Bank Malaysia | 157 | (19 | ) | 2 | 174 | 23 | 25 | 126 | ||||||||||||||||||||||||||||||||||
MENA | HSBC Bank Middle East | 41 | 14 | (15 | ) | 42 | (10 | ) | (8 | ) | 60 | |||||||||||||||||||||||||||||||
North America | HSBC Bank USA | 106 | (13 | ) | 22 | 97 | (4 | ) | (2 | ) | 103 | |||||||||||||||||||||||||||||||
HSBC Bank Canada | 17 | (10 | ) | 4 | 23 | (4 | ) | 11 | 16 | |||||||||||||||||||||||||||||||||
Latin America | HSBC Mexico | 119 | (13 | ) | 2 | 130 | 6 | (5 | ) | 129 | ||||||||||||||||||||||||||||||||
Brazilian operations92 | 1,155 | (467 | ) | (414 | ) | 2,036 | 270 | 241 | 1,525 | |||||||||||||||||||||||||||||||||
HSBC Bank Panama | 5 | (6 | ) | 1 | 10 | 1 | 1 | 8 | ||||||||||||||||||||||||||||||||||
HSBC Bank Argentina | 45 | 5 | 7 | 33 | 20 | (7 | ) | 20 | ||||||||||||||||||||||||||||||||||
Other operations | 125 | 63 | (89 | ) | 151 | 8 | 20 | 123 | ||||||||||||||||||||||||||||||||||
| 4,307 | 319 | (1,872 | ) | 5,860 | 480 | 825 | 4,555 | |||||||||||||||||||||||||||||||||||
Loans and advances to customers | ||||||||||||||||||||||||||||||||||||||||||
Europe | HSBC Bank | 10,596 | (347 | ) | 718 | 10,225 | 1,274 | (810 | ) | 9,761 | ||||||||||||||||||||||||||||||||
HSBC Private Banking Holdings (Suisse) | 199 | (35 | ) | (21 | ) | 255 | 42 | 22 | 191 | |||||||||||||||||||||||||||||||||
HSBC France | 1,713 | (167 | ) | (207 | ) | 2,087 | 205 | 198 | 1,684 | |||||||||||||||||||||||||||||||||
HSBC Finance | 42 | (40 | ) | (16 | ) | 98 | (67 | ) | (33 | ) | 198 | |||||||||||||||||||||||||||||||
Hong Kong | Hang Seng Bank | 1,895 | 42 | 284 | 1,569 | 313 | (57 | ) | 1,313 | |||||||||||||||||||||||||||||||||
The Hongkong and Shanghai Banking Corporation | 2,410 | 195 | 240 | 1,975 | 699 | (479 | ) | 1,755 | ||||||||||||||||||||||||||||||||||
Rest of Asia-Pacific | The Hongkong and Shanghai Banking Corporation | 5,231 | 469 | (101 | ) | 4,863 | 900 | 35 | 3,928 | |||||||||||||||||||||||||||||||||
HSBC Bank Malaysia | 707 | 73 | (23 | ) | 657 | 138 | (12 | ) | 531 | |||||||||||||||||||||||||||||||||
MENA | HSBC Bank Middle East | 1,214 | 87 | (169 | ) | 1,296 | 80 | (87 | ) | 1,303 | ||||||||||||||||||||||||||||||||
North America | HSBC Bank USA | 1,742 | (381 | ) | (1,103 | ) | 3,226 | (626 | ) | (730 | ) | 4,582 | ||||||||||||||||||||||||||||||
HSBC Finance | 3,904 | (1,559 | ) | (379 | ) | 5,842 | (1,808 | ) | (91 | ) | 7,741 | |||||||||||||||||||||||||||||||
HSBC Bank Canada | 1,588 | 6 | (101 | ) | 1,683 | (65 | ) | 105 | 1,643 | |||||||||||||||||||||||||||||||||
Latin America | HSBC Mexico | 1,613 | 14 | (31 | ) | 1,630 | 253 | (194 | ) | 1,571 | ||||||||||||||||||||||||||||||||
Brazilian operations92 | 5,468 | (565 | ) | (551 | ) | 6,584 | 1,499 | (33 | ) | 5,118 | ||||||||||||||||||||||||||||||||
HSBC Bank Panama | 395 | (375 | ) | (63 | ) | 833 | 87 | (69 | ) | 815 | ||||||||||||||||||||||||||||||||
HSBC Bank Argentina | 718 | 51 | 143 | 524 | 128 | 29 | 367 | |||||||||||||||||||||||||||||||||||
Other operations | 1,608 | 844 | (1,139 | ) | 1,903 | 89 | 129 | 1,685 | ||||||||||||||||||||||||||||||||||
| 41,043 | (509 | ) | (3,698 | ) | 45,250 | 4,470 | (3,406 | ) | 44,186 | |||||||||||||||||||||||||||||||||
49h
Table of Contents
HSBC HOLDINGS PLC
Report of the Directors: Operating and Financial Review(continued)
Interest income (continued)
| Increase/(decrease) in 2012 compared with 2011 | Increase/(decrease) in 2011 compared with 2010 | |||||||||||||||||||||||||||||||||||||||||
| 2012 US$m | Volume US$m | Rate US$m | 2011 US$m | Volume US$m | Rate US$m | 2010 US$m | ||||||||||||||||||||||||||||||||||||
Financial investments | ||||||||||||||||||||||||||||||||||||||||||
Europe | HSBC Bank | 1,275 | (257 | ) | (99 | ) | 1,631 | 208 | (302 | ) | 1,725 | |||||||||||||||||||||||||||||||
HSBC Private Banking Holdings (Suisse) | 107 | (143 | ) | 3 | 247 | (59 | ) | 19 | 287 | |||||||||||||||||||||||||||||||||
HSBC France | 130 | 187 | (190 | ) | 133 | 16 | 15 | 102 | ||||||||||||||||||||||||||||||||||
Hong Kong | Hang Seng Bank | 590 | 74 | (80 | ) | 596 | (75 | ) | 130 | 541 | ||||||||||||||||||||||||||||||||
The Hongkong and Shanghai Banking Corporation | 320 | (28 | ) | (51 | ) | 399 | (94 | ) | 16 | 477 | ||||||||||||||||||||||||||||||||
Rest of Asia-Pacific | The Hongkong and Shanghai Banking Corporation | 1,501 | 215 | (136 | ) | 1,422 | 68 | 193 | 1,161 | |||||||||||||||||||||||||||||||||
HSBC Bank Malaysia | 59 | 26 | – | 33 | 3 | 2 | 28 | |||||||||||||||||||||||||||||||||||
MENA | HSBC Bank Middle East | 113 | (9 | ) | (28 | ) | 150 | 45 | (21 | ) | 126 | |||||||||||||||||||||||||||||||
North America | HSBC Bank USA | 1,092 | 277 | (435 | ) | 1,250 | 354 | (260 | ) | 1,156 | ||||||||||||||||||||||||||||||||
HSBC Finance | 67 | (71 | ) | 34 | 104 | 5 | (17 | ) | 116 | |||||||||||||||||||||||||||||||||
HSBC Bank Canada | 297 | 58 | (68 | ) | 307 | 63 | (13 | ) | 257 | |||||||||||||||||||||||||||||||||
Latin America | HSBC Mexico | 379 | (85 | ) | (9 | ) | 473 | 140 | (55 | ) | 388 | |||||||||||||||||||||||||||||||
Brazilian operations92 | 1,019 | (65 | ) | (122 | ) | 1,206 | 58 | 59 | 1,089 | |||||||||||||||||||||||||||||||||
HSBC Bank Panama | 20 | (25 | ) | (5 | ) | 50 | 6 | 6 | 38 | |||||||||||||||||||||||||||||||||
HSBC Bank Argentina | 96 | 8 | (11 | ) | 99 | 44 | (3 | ) | 58 | |||||||||||||||||||||||||||||||||
Other operations | 2,013 | 187 | (303 | ) | 2,129 | (303 | ) | 606 | 1,826 | |||||||||||||||||||||||||||||||||
| 9,078 | 87 | (1,238 | ) | 10,229 | 126 | 728 | 9,375 | |||||||||||||||||||||||||||||||||||
For footnote, see page 120.
Interest expense
|
| |||||||||||||||||||||||||||||||||||||||||
| Increase/(decrease) in 2012 compared with 2011 | Increase/(decrease) in 2011 compared with 2010 | |||||||||||||||||||||||||||||||||||||||||
| 2012 US$m | Volume US$m | Rate US$m | 2011 US$m | Volume US$m | Rate US$m | 2010 US$m | ||||||||||||||||||||||||||||||||||||
Deposits by banks | ||||||||||||||||||||||||||||||||||||||||||
Europe | HSBC Bank | 435 | (95 | ) | 1 | 529 | 7 | 262 | 260 | |||||||||||||||||||||||||||||||||
HSBC Private Banking Holdings (Suisse) | 2 | – | – | 2 | – | – | 2 | |||||||||||||||||||||||||||||||||||
HSBC France | 171 | (45 | ) | (180 | ) | 396 | (105 | ) | 161 | 340 | ||||||||||||||||||||||||||||||||
Hong Kong | Hang Seng Bank | 15 | (2 | ) | 10 | 7 | 1 | 2 | 4 | |||||||||||||||||||||||||||||||||
The Hongkong and Shanghai Banking Corporation | 12 | (1 | ) | – | 13 | 5 | (2 | ) | 10 | |||||||||||||||||||||||||||||||||
Rest of Asia-Pacific | The Hongkong and Shanghai Banking Corporation | 159 | 1 | (1 | ) | 159 | 15 | 13 | 131 | |||||||||||||||||||||||||||||||||
HSBC Bank Malaysia | 20 | 15 | (4 | ) | 9 | 5 | – | 4 | ||||||||||||||||||||||||||||||||||
MENA | HSBC Bank Middle East | 6 | – | – | 6 | 6 | (6 | ) | 6 | |||||||||||||||||||||||||||||||||
North America | HSBC Bank USA | 19 | – | 1 | 18 | (3 | ) | (5 | ) | 26 | ||||||||||||||||||||||||||||||||
HSBC Bank Canada | 9 | 17 | (23 | ) | 15 | (1 | ) | 11 | 5 | |||||||||||||||||||||||||||||||||
Latin America | HSBC Mexico | 52 | (3 | ) | (7 | ) | 62 | 8 | 3 | 51 | ||||||||||||||||||||||||||||||||
Brazilian operations92 | 194 | (109 | ) | (28 | ) | 331 | 193 | (109 | ) | 247 | ||||||||||||||||||||||||||||||||
HSBC Bank Panama | 12 | (4 | ) | (2 | ) | 18 | 6 | (6 | ) | 18 | ||||||||||||||||||||||||||||||||
HSBC Bank Argentina | 3 | 2 | (1 | ) | 2 | – | 1 | 1 | ||||||||||||||||||||||||||||||||||
Other operations | 51 | (15 | ) | 42 | 24 | (3 | ) | (4 | ) | 31 | ||||||||||||||||||||||||||||||||
| 1,160 | (199 | ) | (232 | ) | 1,591 | (55 | ) | 510 | 1,136 | |||||||||||||||||||||||||||||||||
49i
Table of Contents
HSBC HOLDINGS PLC
Report of the Directors: Operating and Financial Review (continued)
| Increase/(decrease) in 2012 compared with 2011 | Increase/(decrease) in 2011 compared with 2010 | |||||||||||||||||||||||||||||||||||||||||
2012 US$m | Volume US$m | Rate US$m | 2011 US$m | Volume US$m | Rate US$m | 2010 US$m | ||||||||||||||||||||||||||||||||||||
Customer accounts | ||||||||||||||||||||||||||||||||||||||||||
Europe | HSBC Bank | 2,445 | 29 | 29 | 2,387 | 229 | 116 | 2,042 | ||||||||||||||||||||||||||||||||||
HSBC Private Banking Holdings (Suisse) | 84 | (45 | ) | (34 | ) | 163 | 10 | 9 | 144 | |||||||||||||||||||||||||||||||||
HSBC France | 403 | (18 | ) | (229 | ) | 650 | (5 | ) | 278 | 377 | ||||||||||||||||||||||||||||||||
Hong Kong | Hang Seng Bank | 365 | 9 | 14 | 342 | 18 | 119 | 205 | ||||||||||||||||||||||||||||||||||
The Hongkong and Shanghai Banking Corporation | 250 | 17 | 2 | 231 | 15 | 70 | 146 | |||||||||||||||||||||||||||||||||||
Rest of Asia-Pacific | The Hongkong and Shanghai Banking Corporation | 2,381 | 154 | (50 | ) | 2,277 | 269 | 312 | 1,696 | |||||||||||||||||||||||||||||||||
HSBC Bank Malaysia | 311 | 7 | 5 | 299 | 41 | 38 | 220 | |||||||||||||||||||||||||||||||||||
MENA | HSBC Bank Middle East | 163 | – | (74 | ) | 237 | 28 | (75 | ) | 284 | ||||||||||||||||||||||||||||||||
North America | HSBC Bank USA | 224 | (63 | ) | (53 | ) | 340 | (12 | ) | (188 | ) | 540 | ||||||||||||||||||||||||||||||
HSBC Bank Canada | 344 | 2 | (16 | ) | 358 | 27 | 27 | 304 | ||||||||||||||||||||||||||||||||||
Latin America | HSBC Mexico | 528 | (12 | ) | 2 | 538 | 113 | 27 | 398 | |||||||||||||||||||||||||||||||||
Brazilian operations92 | 2,411 | (1,176 | ) | (884 | ) | 4,471 | 426 | 543 | 3,502 | |||||||||||||||||||||||||||||||||
HSBC Bank Panama | 96 | (152 | ) | (46 | ) | 294 | 5 | (32 | ) | 321 | ||||||||||||||||||||||||||||||||
HSBC Bank Argentina | 268 | 28 | 40 | 200 | 23 | 80 | 97 | |||||||||||||||||||||||||||||||||||
Other operations | 605 | 51 | (115 | ) | 669 | 84 | 83 | 502 | ||||||||||||||||||||||||||||||||||
| 10,878 | (70 | ) | (2,508 | ) | 13,456 | 1,072 | 1,606 | 10,778 | ||||||||||||||||||||||||||||||||||
Financial liabilities designated at fair value – own debt issued | 1,325 | 25 | (13 | ) | 1,313 | 132 | (90 | ) | 1,271 | |||||||||||||||||||||||||||||||||
Debt securities in issue | ||||||||||||||||||||||||||||||||||||||||||
Europe | HSBC Bank | 989 | (128 | ) | 135 | 982 | 305 | (453 | ) | 1,130 | ||||||||||||||||||||||||||||||||
HSBC France | 118 | (47 | ) | (95 | ) | 260 | (20 | ) | 120 | 160 | ||||||||||||||||||||||||||||||||
Hong Kong | Hang Seng Bank | 15 | 2 | – | 13 | 5 | (5 | ) | 13 | |||||||||||||||||||||||||||||||||
Rest of Asia-Pacific | The Hongkong and Shanghai Banking Corporation | 241 | (6 | ) | (16 | ) | 263 | 93 | (48 | ) | 218 | |||||||||||||||||||||||||||||||
HSBC Bank Malaysia | 25 | 14 | (7 | ) | 18 | 7 | (4 | ) | 15 | |||||||||||||||||||||||||||||||||
MENA | HSBC Bank Middle East | 83 | (2 | ) | 8 | 77 | (1 | ) | 15 | 63 | ||||||||||||||||||||||||||||||||
North America | HSBC Bank USA | 390 | 6 | (11 | ) | 395 | (4 | ) | 24 | 375 | ||||||||||||||||||||||||||||||||
HSBC Finance | 1,059 | (398 | ) | 44 | 1,413 | (289 | ) | (64 | ) | 1,766 | ||||||||||||||||||||||||||||||||
HSBC Bank Canada | 390 | 20 | (22 | ) | 392 | (30 | ) | 79 | 343 | |||||||||||||||||||||||||||||||||
Latin America | HSBC Mexico | 51 | (9 | ) | 3 | 57 | 8 | (2 | ) | 51 | ||||||||||||||||||||||||||||||||
Brazilian operations92 | 732 | 237 | (213 | ) | 708 | 337 | 220 | 151 | ||||||||||||||||||||||||||||||||||
HSBC Bank Panama | 9 | (20 | ) | – | 29 | (9 | ) | (2 | ) | 40 | ||||||||||||||||||||||||||||||||
HSBC Bank Argentina | 20 | 9 | – | 11 | – | 11 | – | |||||||||||||||||||||||||||||||||||
Other operations | 633 | (339 | ) | 330 | 642 | (739 | ) | 775 | 606 | |||||||||||||||||||||||||||||||||
| 4,755 | (588 | ) | 83 | 5,260 | (219 | ) | 548 | 4,931 | ||||||||||||||||||||||||||||||||||
For footnote, see page 120.
49j
Table of Contents
HSBC HOLDINGS PLC
Report of the Directors: Operating and Financial Review (continued)
We include short-term borrowings within customer accounts, deposits by banks and debt securities in issue and do not show short-term borrowings separately on the balance sheet. Short-term borrowings are defined by the US Securities and Exchange Commission as Federal funds purchased and securities sold under agreements to repurchase, commercial paper and other short-term borrowings.
Our only significant short-term borrowings are securities sold under agreements to repurchase and certain debt securities in issue. For securities sold under agreements to repurchase, we run matched repo and reverse repo trading books. We generally observe lower year-end demand in our reverse repo lending business which results in lower repo balances at the balance sheet date. Additional information on these is provided in the table below.
Repos and short-term bonds
2012 US$m | 2011 US$m | 2010 US$m | ||||||||||
Securities sold under agreements to repurchase | ||||||||||||
Outstanding at 31 December | 170,790 | 135,239 | 159,256 | |||||||||
Average amount outstanding during the year | 206,352 | 236,290 | 175,955 | |||||||||
Maximum quarter-end balance outstanding during the year | 176,162 | 202,305 | 193,319 | |||||||||
Weighted average interest rate during the year | 0.4% | 0.6% | 0.5% | |||||||||
Weighted average interest rate at the year-end | 0.5% | 1.0% | 0.9% | |||||||||
Short-term bonds | ||||||||||||
Outstanding at 31 December | 44,240 | 35,415 | 44,152 | |||||||||
Average amount outstanding during the year | 40,349 | 40,679 | 37,981 | |||||||||
Maximum quarter-end balance outstanding during the year | 44,240 | 42,785 | 44,152 | |||||||||
Weighted average interest rate during the year | 1.4% | 1.9% | 2.9% | |||||||||
Weighted average interest rate at the year-end | 1.3% | 2.2% | 4.5% | |||||||||
The table below provides details of our material contractual obligations as at 31 December 2012.
| Payments due by period | ||||||||||||||||||||||||||||
| Total | Less than 1 year | 1–3 years | 3–5 years | More than 5 years | ||||||||||||||||||||||||
| US$m | US$m | US$m | US$m | US$m | ||||||||||||||||||||||||
Long-term debt obligations | 218,443 | 64,015 | 42,968 | 45,240 | 66,220 | |||||||||||||||||||||||
Term deposits and certificates of deposit | 159,410 | 142,975 | 13,669 | 1,687 | 1,079 | |||||||||||||||||||||||
Capital (finance) lease obligations | 430 | 81 | 139 | 14 | 196 | |||||||||||||||||||||||
Operating lease obligations | 5,730 | 965 | 1,476 | 1,042 | 2,247 | |||||||||||||||||||||||
Purchase obligations | 607 | 433 | 1 | 173 | – | |||||||||||||||||||||||
Short positions in debt securities and equity shares | 60,974 | 45,702 | 2,435 | 4,487 | 8,350 | |||||||||||||||||||||||
Current tax liability | 1,452 | 1,452 | – | – | – | |||||||||||||||||||||||
Pension/healthcare obligation | 16,658 | 1,371 | 2,820 | 3,089 | 9,378 | |||||||||||||||||||||||
| 463,704 | 256,994 | 63,508 | 55,732 | 87,470 | ||||||||||||||||||||||||
49k
Table of Contents
HSBC HOLDINGS PLC
Report of the Directors: Operating and Financial Review(continued)
Loan maturity and interest sensitivity analysis
At 31 December 2012, the geographical analysis of loan maturity and interest sensitivity by loan type on a contractual repayment basis was as follows:
| Europe | Hong Kong | Rest of Asia- Pacific | MENA | North America | Latin America | Total | ||||||||||||||||||||||||||||||||||
| US$m | US$m | US$m | US$m | US$m | US$m | US$m | ||||||||||||||||||||||||||||||||||
Maturity of 1 year or less | ||||||||||||||||||||||||||||||||||||||||
Loans and advances to banks | 41,233 | 20,445 | 43,234 | 8,764 | 13,398 | 13,206 | 140,280 | |||||||||||||||||||||||||||||||||
Commercial loans to customers | ||||||||||||||||||||||||||||||||||||||||
Manufacturing and international trade and services | 89,674 | 33,623 | 42,058 | 10,039 | 8,549 | 14,188 | 198,131 | |||||||||||||||||||||||||||||||||
Real estate and other property related | 15,234 | 11,475 | 6,227 | 2,110 | 5,442 | 1,994 | 42,482 | |||||||||||||||||||||||||||||||||
Non-bank financial institutions | 46,817 | 3,646 | 3,242 | 274 | 7,025 | 1,034 | 62,038 | |||||||||||||||||||||||||||||||||
Governments | 1,414 | 1,523 | 855 | 1,501 | 684 | 1,082 | 7,059 | |||||||||||||||||||||||||||||||||
Other commercial | 31,765 | 3,468 | 10,631 | 2,935 | 3,790 | 3,440 | 56,029 | |||||||||||||||||||||||||||||||||
| 184,904 | 53,735 | 63,013 | 16,859 | 25,490 | 21,738 | 365,739 | ||||||||||||||||||||||||||||||||||
Maturity after 1 year but within 5 years | ||||||||||||||||||||||||||||||||||||||||
Loans and advances to banks | 3,644 | 2,062 | 1,322 | 434 | 67 | 822 | 8,351 | |||||||||||||||||||||||||||||||||
Commercial loans to customers | ||||||||||||||||||||||||||||||||||||||||
Manufacturing and international trade and services | 29,211 | 9,848 | 8,771 | 2,100 | 11,530 | 6,382 | 67,842 | |||||||||||||||||||||||||||||||||
Real estate and other property related | 18,866 | 20,195 | 8,634 | 533 | 5,418 | 1,226 | 54,872 | |||||||||||||||||||||||||||||||||
Non-bank financial institutions | 7,652 | 856 | 1,013 | 698 | 2,971 | 449 | 13,639 | |||||||||||||||||||||||||||||||||
Governments | 399 | 758 | 215 | 81 | 75 | 199 | 1,727 | |||||||||||||||||||||||||||||||||
Other commercial | 13,924 | 5,627 | 5,185 | 1,253 | 4,243 | 2,887 | 33,119 | |||||||||||||||||||||||||||||||||
| 70,052 | 37,284 | 23,818 | 4,665 | 24,237 | 11,143 | 171,199 | ||||||||||||||||||||||||||||||||||
Interest rate sensitivity of loans and advances to banks and commercial loans to customers | ||||||||||||||||||||||||||||||||||||||||
Fixed interest rate | 14,551 | 116 | 1,267 | 1,159 | 5,535 | 3,417 | 26,045 | |||||||||||||||||||||||||||||||||
Variable interest rate | 59,145 | 39,230 | 23,873 | 3,940 | 18,769 | 8,548 | 153,505 | |||||||||||||||||||||||||||||||||
| 73,696 | 39,346 | 25,140 | 5,099 | 24,304 | 11,965 | 179,550 | ||||||||||||||||||||||||||||||||||
Maturity after 5 years | ||||||||||||||||||||||||||||||||||||||||
Loans and advances to banks | 443 | 993 | 36 | – | – | 2,500 | 3,972 | |||||||||||||||||||||||||||||||||
Commercial loans to customers | ||||||||||||||||||||||||||||||||||||||||
Manufacturing and international trade and services | 8,759 | 715 | 701 | 349 | 3,071 | 1,970 | 15,565 | |||||||||||||||||||||||||||||||||
Real estate and other property related | 6,581 | 8,113 | 1,066 | 325 | 3,319 | 534 | 19,938 | |||||||||||||||||||||||||||||||||
Non-bank financial institutions | 1,263 | 44 | – | 224 | 3,939 | 111 | 5,581 | |||||||||||||||||||||||||||||||||
Governments | 580 | 557 | 66 | 80 | 15 | 701 | 1,999 | |||||||||||||||||||||||||||||||||
Other commercial | 10,348 | 3,297 | 896 | 1,146 | 1,947 | 987 | 18,621 | |||||||||||||||||||||||||||||||||
| 27,531 | 12,726 | 2,729 | 2,124 | 12,291 | 4,303 | 61,704 | ||||||||||||||||||||||||||||||||||
Interest rate sensitivity of loans and advances to banks and commercial loans to customers | ||||||||||||||||||||||||||||||||||||||||
Fixed interest rate | 7,286 | 968 | 68 | 616 | 3,319 | 934 | 13,191 | |||||||||||||||||||||||||||||||||
Variable interest rate | 20,688 | 12,751 | 2,697 | 1,508 | 8,972 | 5,869 | 52,485 | |||||||||||||||||||||||||||||||||
| 27,974 | 13,719 | 2,765 | 2,124 | 12,291 | 6,803 | 65,676 | ||||||||||||||||||||||||||||||||||
49l
Table of Contents
HSBC HOLDINGS PLC
Report of the Directors: Operating and Financial Review(continued)
The following tables summarise the average amount of bank deposits, customer deposits and certificates of deposit (‘CD’s) and other money market instruments (which are included within ‘Debt securities in issue’ in the balance sheet), together
with the average interest rates paid thereon for each of the past three years. The geographical analysis of average deposits is based on the location of the office in which the deposits are recorded and excludes balances with HSBC companies. The ‘Other’ category includes securities sold under agreements to repurchase.
Deposits by banks
| 2012 | 2011 | 2010 | ||||||||||||||||||||||||||
Average balance | Average rate % | Average balance US$m | Average rate % | Average balance US$m | Average rate % | |||||||||||||||||||||||
Europe | 64,497 | 75,890 | 85,973 | |||||||||||||||||||||||||
Demand and other – non-interest bearing | 9,377 | – | 10,788 | – | 8,298 | – | ||||||||||||||||||||||
Demand – interest bearing | 8,988 | 0.4 | 16,492 | 0.8 | 13,783 | 0.6 | ||||||||||||||||||||||
Time | 24,698 | 1.5 | 19,893 | 2.2 | 28,337 | 0.9 | ||||||||||||||||||||||
Other | 21,434 | 1.1 | 28,717 | 1.3 | 35,555 | 0.8 | ||||||||||||||||||||||
Hong Kong | 13,355 | 13,222 | 10,000 | |||||||||||||||||||||||||
Demand and other – non-interest bearing | 4,727 | – | 3,047 | – | 2,860 | – | ||||||||||||||||||||||
Demand – interest bearing | 5,643 | 0.1 | 6,052 | 0.1 | 4,787 | 0.2 | ||||||||||||||||||||||
Time | 2,013 | 0.4 | 3,347 | 0.3 | 1,803 | 0.3 | ||||||||||||||||||||||
Other | 972 | 0.6 | 776 | 0.1 | 550 | 0.7 | ||||||||||||||||||||||
Rest of Asia-Pacific | 14,485 | 13,650 | 11,476 | |||||||||||||||||||||||||
Demand and other – non-interest bearing | 2,495 | – | 2,535 | – | 1,746 | – | ||||||||||||||||||||||
Demand – interest bearing | 6,190 | 1.1 | 5,802 | 1.2 | 4,937 | 1.2 | ||||||||||||||||||||||
Time | 3,879 | 1.5 | 4,218 | 1.6 | 3,626 | 1.5 | ||||||||||||||||||||||
Other | 1,921 | 3.1 | 1,095 | 3.0 | 1,167 | 2.0 | ||||||||||||||||||||||
Middle East and North Africa | 1,892 | 2,060 | 1,250 | |||||||||||||||||||||||||
Demand and other – non-interest bearing | 301 | – | 548 | – | 484 | – | ||||||||||||||||||||||
Demand – interest bearing | 8 | 6.5 | 20 | – | 9 | – | ||||||||||||||||||||||
Time | 1,543 | 0.4 | 1,424 | 0.4 | 685 | 0.6 | ||||||||||||||||||||||
Other | 40 | 1.8 | 68 | 1.6 | 72 | 1.2 | ||||||||||||||||||||||
North America | 13,695 | 11,904 | 13,324 | |||||||||||||||||||||||||
Demand and other – non-interest bearing | 4,470 | – | 2,367 | – | 2,493 | – | ||||||||||||||||||||||
Demand – interest bearing | 2,996 | 0.1 | 3,849 | 0.1 | 3,386 | 0.1 | ||||||||||||||||||||||
Time | 4,756 | 0.4 | 4,797 | 0.4 | 4,716 | 0.4 | ||||||||||||||||||||||
Other | 1,473 | 0.5 | 891 | 1.3 | 2,729 | 0.5 | ||||||||||||||||||||||
Latin America | 6,463 | 8,819 | 5,523 | |||||||||||||||||||||||||
Demand and other – non-interest bearing | 212 | – | 161 | – | 222 | – | ||||||||||||||||||||||
Demand – interest bearing | 333 | 3.9 | 545 | 3.7 | 322 | 4.3 | ||||||||||||||||||||||
Time | 3,665 | 3.7 | 4,924 | 4.3 | 2,246 | 5.5 | ||||||||||||||||||||||
Other | 2,253 | 6.1 | 3,189 | 6.0 | 2,733 | 6.6 | ||||||||||||||||||||||
| ||||||||||||||||||||||||||||
Total | 114,385 | 125,545 | 127,546 | |||||||||||||||||||||||||
Demand and other – non-interest bearing | 21,582 | – | 19,446 | – | 16,103 | – | ||||||||||||||||||||||
Demand – interest bearing | 24,157 | 0.5 | 32,760 | 0.7 | 27,224 | 0.6 | ||||||||||||||||||||||
Time | 40,553 | 1.4 | 38,603 | 2.0 | 41,413 | 1.1 | ||||||||||||||||||||||
Other | 28,093 | 1.7 | 34,736 | 1.7 | 42,806 | 1.3 | ||||||||||||||||||||||
49m
Table of Contents
HSBC HOLDINGS PLC
Report of the Directors: Operating and Financial Review(continued)
Customer accounts
| 2012 | 2011 | 2010 | ||||||||||||||||||||||||||
| Average balance US$m | Average rate % | Average balance US$m | Average rate % | Average balance US$m | Average rate % | |||||||||||||||||||||||
Europe | 467,472 | 467,393 | 424,561 | |||||||||||||||||||||||||
Demand and other – non-interest bearing | 71,342 | – | 72,743 | – | 62,869 | – | ||||||||||||||||||||||
Demand – interest bearing | 242,769 | 0.4 | 220,314 | 0.4 | 203,727 | 0.4 | ||||||||||||||||||||||
Savings | 62,626 | 1.8 | 57,070 | 1.7 | 51,793 | 1.8 | ||||||||||||||||||||||
Time | 59,034 | 1.3 | 67,499 | 1.5 | 60,140 | 1.2 | ||||||||||||||||||||||
Other | 31,701 | 0.5 | 49,767 | 0.7 | 46,032 | 0.5 | ||||||||||||||||||||||
Hong Kong | 325,909 | 307,513 | 280,733 | |||||||||||||||||||||||||
Demand and other – non-interest bearing | 34,714 | – | 31,694 | – | 27,412 | – | ||||||||||||||||||||||
Demand – interest bearing | 236,198 | – | 219,581 | – | 202,330 | – | ||||||||||||||||||||||
Savings | 39,752 | 0.8 | 38,283 | 0.7 | 37,119 | 0.5 | ||||||||||||||||||||||
Time | 14,252 | 1.0 | 16,910 | 1.0 | 12,793 | 0.7 | ||||||||||||||||||||||
Other | 993 | 0.3 | 1,045 | 0.3 | 1,079 | 0.2 | ||||||||||||||||||||||
Rest of Asia-Pacific | 179,587 | 170,008 | 142,807 | |||||||||||||||||||||||||
Demand and other – non-interest bearing | 20,914 | – | 19,283 | – | 16,418 | – | ||||||||||||||||||||||
Demand – interest bearing | 78,563 | 1.0 | 74,636 | 1.1 | 63,033 | 1.0 | ||||||||||||||||||||||
Savings | 67,424 | 2.9 | 63,500 | 2.8 | 51,757 | 2.4 | ||||||||||||||||||||||
Time | 12,381 | 1.0 | 11,815 | 1.0 | 10,734 | 0.9 | ||||||||||||||||||||||
Other | 305 | 3.6 | 774 | 2.2 | 865 | 2.2 | ||||||||||||||||||||||
Middle East and North Africa | 37,604 | 36,105 | 32,747 | |||||||||||||||||||||||||
Demand and other – non-interest bearing | 14,564 | – | 13,016 | – | 11,873 | – | ||||||||||||||||||||||
Demand – interest bearing | 10,967 | 0.6 | 9,887 | 0.6 | 6,315 | 1.5 | ||||||||||||||||||||||
Savings | 11,555 | 3.0 | 12,596 | 3.2 | 13,774 | 2.8 | ||||||||||||||||||||||
Time | 452 | 2.2 | 530 | 2.5 | 604 | 2.6 | ||||||||||||||||||||||
Other | 66 | 1.5 | 76 | – | 181 | 0.1 | ||||||||||||||||||||||
North America | 153,057 | 165,779 | 157,361 | |||||||||||||||||||||||||
Demand and other – non-interest bearing | 28,403 | – | 26,524 | – | 22,235 | – | ||||||||||||||||||||||
Demand – interest bearing | 38,419 | 0.3 | 35,440 | 0.3 | 28,569 | 0.2 | ||||||||||||||||||||||
Savings | 68,039 | 0.7 | 75,866 | 0.8 | 78,040 | 0.8 | ||||||||||||||||||||||
Time | 9,587 | 0.4 | 13,835 | 0.4 | 17,975 | 0.8 | ||||||||||||||||||||||
Other | 8,609 | 0.2 | 14,114 | 0.1 | 10,542 | 0.6 | ||||||||||||||||||||||
Latin America | 73,323 | 89,603 | 77,618 | |||||||||||||||||||||||||
Demand and other – non-interest bearing | 14,203 | – | 14,815 | – | 12,407 | – | ||||||||||||||||||||||
Demand – interest bearing | 8,258 | 2.2 | 8,374 | 1.7 | 6,270 | 1.2 | ||||||||||||||||||||||
Savings | 35,294 | 7.5 | 47,197 | 9.8 | 41,784 | 8.5 | ||||||||||||||||||||||
Time | 13,095 | 4.0 | 16,567 | 3.9 | 15,716 | 3.9 | ||||||||||||||||||||||
Other | 2,473 | 4.7 | 2,650 | 7.2 | 1,441 | 7.5 | ||||||||||||||||||||||
| ||||||||||||||||||||||||||||
Total | 1,236,953 | 1,236,401 | 1,115,827 | |||||||||||||||||||||||||
Demand and other – non-interest bearing | 184,140 | – | 178,075 | – | 153,214 | – | ||||||||||||||||||||||
Demand – interest bearing | 615,175 | 0.4 | 568,232 | 0.4 | 510,244 | 0.3 | ||||||||||||||||||||||
Savings | 284,690 | 2.4 | 294,512 | 2.9 | 274,267 | 2.5 | ||||||||||||||||||||||
Time | 108,801 | 1.5 | 127,156 | 1.6 | 117,962 | 1.4 | ||||||||||||||||||||||
Other | 44,147 | 0.7 | 68,426 | 0.9 | 60,140 | 0.7 | ||||||||||||||||||||||
49n
Table of Contents
HSBC HOLDINGS PLC
Report of the Directors: Operating and Financial Review(continued)
Customer accounts by country
| At 31 December | ||||||||||
2012 US$m | 2011 US$m | |||||||||
Europe | 555,009 | 493,404 | ||||||||
UK | 426,144 | 373,737 | ||||||||
France61 | 55,578 | 55,278 | ||||||||
Germany | 15,611 | 8,738 | ||||||||
Malta | 5,957 | 5,695 | ||||||||
Switzerland62 | 20,211 | 19,888 | ||||||||
Turkey | 7,629 | 6,809 | ||||||||
Other | 23,879 | 23,259 | ||||||||
Hong Kong | 346,208 | 315,345 | ||||||||
Rest of Asia-Pacific | 183,621 | 174,012 | ||||||||
Australia | 20,430 | 18,802 | ||||||||
India | 10,415 | 10,227 | ||||||||
Indonesia | 6,512 | 6,490 | ||||||||
Mainland China | 35,572 | 31,570 | ||||||||
Malaysia | 17,641 | 16,970 | ||||||||
Singapore | 47,862 | 44,447 | ||||||||
Taiwan | 12,497 | 11,659 | ||||||||
Vietnam | 2,147 | 1,834 | ||||||||
Other | 30,545 | 32,013 | ||||||||
Middle East and North Africa (excluding Saudi Arabia) | 39,583 | 36,422 | ||||||||
Egypt | 7,548 | 7,047 | ||||||||
Qatar | 2,704 | 2,796 | ||||||||
UAE | 18,448 | 18,172 | ||||||||
Other | 10,883 | 8,407 | ||||||||
North America | 149,037 | 155,982 | ||||||||
US | 90,627 | 97,542 | ||||||||
Canada | 47,049 | 45,510 | ||||||||
Bermuda | 11,361 | 12,930 | ||||||||
Latin America | 66,556 | 78,760 | ||||||||
Argentina | 5,351 | 4,878 | ||||||||
Brazil | 30,144 | 42,410 | ||||||||
Mexico | 22,724 | 21,772 | ||||||||
Panama | 5,940 | 5,463 | ||||||||
Other | 2,397 | 4,237 | ||||||||
| ||||||||||
Total | 1,340,014 | 1,253,925 | ||||||||
For footnotes, see page 120.
50
Table of Contents
HSBC HOLDINGS PLC
Report of the Directors: Operating and Financial Review(continued)
Certificates of deposit and other money market instruments
| 2012 | 2011 |
| 2010 | |||||||||||||||||||||||||
| Average balance US$m | Average rate % | Average balance US$m | Average rate % | Average balance US$m | Average rate % | |||||||||||||||||||||||
Europe | 32,602 | 0.4 | 46,641 | 0.6 | 57,018 | 0.4 | ||||||||||||||||||||||
Hong Kong | 1,458 | 0.9 | 932 | 1.0 | 213 | 3.8 | ||||||||||||||||||||||
Rest of Asia-Pacific | 3,863 | 3.0 | 3,951 | 3.4 | 3,529 | 3.4 | ||||||||||||||||||||||
Middle East and North Africa | – | – | – | – | 68 | 0.5 | ||||||||||||||||||||||
North America | 9,339 | 0.6 | 10,936 | 0.5 | 10,607 | 0.5 | ||||||||||||||||||||||
Latin America | 7,344 | 8.5 | 5,499 | 9.2 | 1,126 | 4.0 | ||||||||||||||||||||||
| 54,606 | 1.8 | 67,959 | 1.4 | 72,561 | 0.6 | |||||||||||||||||||||||
Certificates of deposit and other time deposits
The maturity analysis of certificates of deposit (‘CD’s) and other wholesale time deposits is expressed by remaining maturity. The majority of CDs and time deposits are in amounts of US$100,000 and over or the equivalent in other currencies.
| At 31 December 2012 | ||||||||||||||||||||||||||||||
3 months or less | After 3 months but within 6 months US$m | After 6 months but within 12 months US$m | After 12 months US$m | Total US$m | ||||||||||||||||||||||||||
Europe | 65,352 | 11,384 | 7,321 | 12,361 | 96,418 | |||||||||||||||||||||||||
Certificates of deposit | 14,205 | 4,689 | 869 | – | 19,763 | |||||||||||||||||||||||||
Time deposits: | ||||||||||||||||||||||||||||||
– banks | 10,205 | 1,636 | 111 | 9,138 | 21,090 | |||||||||||||||||||||||||
– customers | 40,942 | 5,059 | 6,341 | 3,223 | 55,565 | |||||||||||||||||||||||||
Hong Kong | 12,850 | 1,742 | 504 | 593 | 15,689 | |||||||||||||||||||||||||
Certificates of deposit | 50 | 637 | 319 | 537 | 1,543 | |||||||||||||||||||||||||
Time deposits: | ||||||||||||||||||||||||||||||
– banks | 2,194 | 107 | 4 | – | 2,305 | |||||||||||||||||||||||||
– customers | 10,606 | 998 | 181 | 56 | 11,841 | |||||||||||||||||||||||||
Rest of Asia-Pacific | 13,529 | 809 | 1,035 | 1,308 | 16,681 | |||||||||||||||||||||||||
Certificates of deposit | 1,120 | 78 | 771 | 687 | 2,656 | |||||||||||||||||||||||||
Time deposits: | ||||||||||||||||||||||||||||||
– banks | 2,870 | 18 | 3 | 29 | 2,920 | |||||||||||||||||||||||||
– customers | 9,539 | 713 | 261 | 592 | 11,105 | |||||||||||||||||||||||||
Middle East and North Africa | 1,220 | 15 | 16 | 74 | 1,325 | |||||||||||||||||||||||||
Time deposits: | ||||||||||||||||||||||||||||||
– banks | 975 | 10 | – | – | 985 | |||||||||||||||||||||||||
– customers | 245 | 5 | 16 | 74 | 340 | |||||||||||||||||||||||||
North America | 11,670 | 924 | 1,106 | 416 | 14,116 | |||||||||||||||||||||||||
Time deposits: | ||||||||||||||||||||||||||||||
– banks | 5,112 | 14 | 198 | – | 5,324 | |||||||||||||||||||||||||
– customers | 6,558 | 910 | 908 | 416 | 8,792 | |||||||||||||||||||||||||
Latin America | 10,269 | 1,617 | 1,612 | 1,683 | 15,181 | |||||||||||||||||||||||||
Certificates of deposit | 43 | 255 | 261 | 107 | 666 | |||||||||||||||||||||||||
Time deposits: | ||||||||||||||||||||||||||||||
– banks | 1,001 | 383 | 477 | 611 | 2,472 | |||||||||||||||||||||||||
– customers | 9,225 | 979 | 874 | 965 | 12,043 | |||||||||||||||||||||||||
| ||||||||||||||||||||||||||||||
Total | 114,890 | 16,491 | 11,594 | 16,435 | 159,410 | |||||||||||||||||||||||||
Certificates of deposit | 15,418 | 5,659 | 2,220 | 1,331 | 24,628 | |||||||||||||||||||||||||
Time deposits: | ||||||||||||||||||||||||||||||
– banks | 22,357 | 2,168 | 793 | 9,778 | 35,096 | |||||||||||||||||||||||||
– customers | 77,115 | 8,664 | 8,581 | 5,326 | 99,686 | |||||||||||||||||||||||||
50a
Table of Contents
HSBC HOLDINGS PLC
Report of the Directors: Operating and Financial Review(continued)
Our internal performance measures include economic profit/(loss), a calculation which compares the return on financial capital invested in HSBC by our shareholders with the cost of that capital. We price our cost of capital internally and the difference between that cost and the post-tax profit attributable to ordinary shareholders represents the amount of economic profit/(loss) generated.
Our long-term cost of capital is reviewed annually and is 11% for 2012; this remains unchanged from 2011. However, it has been revised to 10% for 2013, primarily due to a reduction in the risk-free rate, reflecting the continued intervention of central banks, quantitative easing and the flight to
quality, and greater banking sector stability through higher levels of capital and liquidity.
The following commentary is on a reported basis.
The return on invested capital fell by 2.2 percentage points to 8.0%, which was 3.0 percentage points lower than our benchmark cost of capital. Our economic loss was US$5.1bn, a deterioration of US$3.7bn compared with the loss in 2011. This reflected higher average invested capital and a decrease in profits attributable to ordinary shareholders, primarily due to adverse fair value movements on own debt attributable to credit spreads of US$5.2bn, compared with favourable movements of US$3.9bn in 2011, an increase in notable cost items and a higher tax charge in 2012.
| 2012 | 2011 | |||||||||||||||||||||
| US$m | %63 | US$m | %63 | |||||||||||||||||||
Average total shareholders’ equity | 166,820 | 156,129 | ||||||||||||||||||||
Adjusted by: | ||||||||||||||||||||||
Goodwill previously amortised or written off | 8,399 | 8,123 | ||||||||||||||||||||
Property revaluation reserves | (896 | ) | (914 | ) | ||||||||||||||||||
Reserves representing unrealised losses on effective cash flow hedges | 55 | 287 | ||||||||||||||||||||
Reserves representing unrealised losses on available-for-sale securities | 1,185 | 3,379 | ||||||||||||||||||||
Preference shares and other equity instruments | (7,256 | ) | (7,256 | ) | ||||||||||||||||||
Average invested capital64 | 168,307 | 159,748 | ||||||||||||||||||||
Return on invested capital65 | 13,454 | 8.0 | 16,224 | 10.2 | ||||||||||||||||||
Benchmark cost of capital | (18,514 | ) | (11.0 | ) | (17,572 | ) | (11.0 | ) | ||||||||||||||
Economic loss and spread | (5,060 | ) | (3.0 | ) | (1,348 | ) | (0.8 | ) | ||||||||||||||
For footnotes, see page 120.
51
Table of Contents
HSBC HOLDINGS PLC
Report of the Directors: Operating and Financial Review(continued)
Reconciliation of RoRWA measures
Performance Management
We target a return on average ordinary shareholders’ equity of 12%–15%. For internal management purposes we monitor global businesses and geographical regions by pre-tax return on RWAs, a metric which combines return on equity and regulatory capital efficiency objectives.
In addition to measuring return on average risk-weighted assets (‘RoRWA’) we measure our performance internally using the non-GAAP measure of underlying RoRWA, which is underlying profit before tax as a percentage of average risk-weighted assets adjusted for the effects of foreign currency translation differences and business disposals. Underlying RoRWA adjusts performance for certain items which distort year-on-year performance as explained on page 26.
We also present the non-GAAP measure of underlying RoRWA adjusted for the effect of operations which are not regarded as contributing to the longer-term performance of the Group. These include the run-off portfolios and the Card and Retail Services business which was sold in 2012.
The Card and Retail Services average RWAs in the table below represent the average of the associated operational risk RWAs that were not immediately released on disposal and have not already been adjusted as part of the underlying RoRWA calculation. The pre-tax loss for Card and Retail Services in the table below primarily relates to litigation expenses incurred after the sale of the business that have not been adjusted as part of the underlying RoRWA calculation.
Reconciliation of underlying RoRWA (excluding run-off portfolios and Card and Retail Services)
| 2012 | 2011 | |||||||||||||||||||||||||||||||||
Pre-tax return US$m | Average RWAs66 US$bn | RoRWA 66,67 % | Pre-tax return US$m | Average RWAs66 US$bn | RoRWA 66,67 % | |||||||||||||||||||||||||||||
Reported | 20,649 | 1,172 | 1.8 | 21,872 | 1,154 | 1.9 | ||||||||||||||||||||||||||||
Underlying67 | 16,385 | 1,129 | 1.5 | 13,861 | 1,077 | 1.3 | ||||||||||||||||||||||||||||
Run-off portfolios | (1,630 | ) | 167 | (1.0 | ) | (4,901 | ) | 169 | (2.9 | ) | ||||||||||||||||||||||||
Legacy credit in GB&M | (280 | ) | 45 | (0.6 | ) | (429 | ) | 33 | (1.3 | ) | ||||||||||||||||||||||||
US CML and other68 | (1,350 | ) | 122 | (1.1 | ) | (4,472 | ) | 136 | (3.3 | ) | ||||||||||||||||||||||||
Card and Retail Services | (150 | ) | 5 | (3.0 | ) | – | – | – | ||||||||||||||||||||||||||
Underlying (excluding run-off portfolios and Card and Retail Services) | 18,165 | 957 | 1.9 | 18,762 | 908 | 2.1 | ||||||||||||||||||||||||||||
For footnotes, see page 120.
Reconciliation of reported and underlying average risk-weighted assets
| Year ended 31 December | ||||||||||||||||
2012 US$bn | 2011 US$bn | Change % | ||||||||||||||
Average reported RWAs66 | 1,172 | 1,154 | 2 | |||||||||||||
Currency translation adjustment24 | – | (7 | ) | |||||||||||||
Acquisitions, disposals and dilutions | (43 | ) | (70 | ) | ||||||||||||
Average underlying RWAs66 | 1,129 | 1,077 | 5 | |||||||||||||
Disposals, held for sale and run-off portfolios
In implementing our strategy, we have sold or agreed to sell a number of businesses and investments across the Group. The sale of these businesses and investments will have a significant effect on both our revenue and profitability in the future. In addition, we have substantial portfolios which are being run down. We expect the losses on these portfolios to continue to affect the Group in the future.
The table below presents the contribution of these businesses and investments to the historical results of the Group. We do not expect the historical results to be indicative of future results because of disposals or run-offs. Fixed allocated costs, included in total operating costs, will not necessarily be removed upon disposal and have been separately identified.
52
Table of Contents
HSBC HOLDINGS PLC
Report of the Directors: Operating and Financial Review(continued)
Summary income statements for disposals, held for sale and run-off portfolios69,70
| 2012 | ||||||||||||||||||||||||||||||||||
| Held | Run-off portfolios | |||||||||||||||||||||||||||||||||
|
| Card and Retail Services US$m |
| | Ping An U$m | |
| Other disposals US$m |
|
| for sale excluding US CML US$m |
|
| US CML and other71 US$m |
|
| Legacy credit in GB&M US$m |
| |||||||||||||||||
Net interest income/(expense) | 1,267 | – | 352 | 303 | 2,561 | (28 | ) | |||||||||||||||||||||||||||
Net fee income/(expense) | 395 | – | 13 | (35 | ) | 33 | (17 | ) | ||||||||||||||||||||||||||
Net trading income/(expense) | – | – | 67 | 22 | (226 | ) | 99 | |||||||||||||||||||||||||||
Net income/(expense) from financial instruments designated at fair value | – | – | 3 | 5 | (785 | ) | 10 | |||||||||||||||||||||||||||
Gains less losses from financial investments | – | – | 8 | 27 | – | (72 | ) | |||||||||||||||||||||||||||
Dividend income | – | – | – | – | 3 | – | ||||||||||||||||||||||||||||
Net earned insurance premiums | – | – | 430 | 315 | – | – | ||||||||||||||||||||||||||||
Other operating income/(expense) | 7 | – | 10 | 5 | 37 | (3 | ) | |||||||||||||||||||||||||||
Total operating income/(expense) | 1,669 | – | 883 | 642 | 1,623 | (11 | ) | |||||||||||||||||||||||||||
Net insurance claims incurred and movement in liabilities to policyholders | – | – | (218 | ) | (225 | ) | – | – | ||||||||||||||||||||||||||
Net operating income/(expense)21 | 1,669 | – | 665 | 417 | 1,623 | (11 | ) | |||||||||||||||||||||||||||
Loan impairment charges and other credit risk provisions | (322 | ) | – | (16 | ) | (77 | ) | (2,569 | ) | (168 | ) | |||||||||||||||||||||||
Net operating income/(expense) | 1,347 | – | 649 | 340 | (946 | ) | (179 | ) | ||||||||||||||||||||||||||
Total operating expenses | (729 | ) | – | (467 | ) | (344 | ) | (1,106 | ) | (101 | ) | |||||||||||||||||||||||
Operating profit/(loss) | 618 | – | 182 | (4 | ) | (2,052 | ) | (280 | ) | |||||||||||||||||||||||||
Share of profit in associates and joint ventures | – | 763 | 12 | 9 | 2 | – | ||||||||||||||||||||||||||||
Profit/(loss) before tax | 618 | 763 | 194 | 5 | (2,050 | ) | (280 | ) | ||||||||||||||||||||||||||
By global business | ||||||||||||||||||||||||||||||||||
Retail Banking and Wealth Management | 618 | 622 | 99 | (29 | ) | (1,274 | ) | – | ||||||||||||||||||||||||||
Commercial Banking | – | 82 | 40 | 24 | 9 | – | ||||||||||||||||||||||||||||
Global Banking and Markets | – | 59 | 65 | 28 | – | (280 | ) | |||||||||||||||||||||||||||
Global Private Banking | – | – | (9 | ) | – | – | – | |||||||||||||||||||||||||||
Other | – | – | (1 | ) | (18 | ) | (785 | ) | – | |||||||||||||||||||||||||
Profit/(loss) before tax | 618 | 763 | 194 | 5 | (2,050 | ) | (280 | ) | ||||||||||||||||||||||||||
By geographical region | ||||||||||||||||||||||||||||||||||
Europe | – | – | (1 | ) | – | – | (281 | ) | ||||||||||||||||||||||||||
Hong Kong | – | – | 45 | – | – | 1 | ||||||||||||||||||||||||||||
Rest of Asia-Pacific | – | 763 | (31 | ) | 22 | – | (2 | ) | ||||||||||||||||||||||||||
Middle East and North Africa | – | – | 46 | – | – | – | ||||||||||||||||||||||||||||
North America | 618 | – | 25 | (25 | ) | (2,050 | ) | 2 | ||||||||||||||||||||||||||
Latin America | – | – | 110 | 8 | – | – | ||||||||||||||||||||||||||||
Profit/(loss) before tax | 618 | 763 | 194 | 5 | (2,050 | ) | (280 | ) | ||||||||||||||||||||||||||
| Other information | ||||||||||||||||||||||||||||||||||
Gain on sale | 3,148 | 3,012 | 1,579 | |||||||||||||||||||||||||||||||
Fixed allocated costs included in total operating expenses | 188 | – | 77 | 52 | 230 | – | ||||||||||||||||||||||||||||
| US$bn | US$bn | US$bn | US$bn | US$bn | US$bn | |||||||||||||||||||||||||||||
Reduction in RWAs on disposal72 | 39.3 | 24.9 | 7.5 | 8.8 | ||||||||||||||||||||||||||||||
RWAs72 | 9.3 | 107.1 | 38.6 | |||||||||||||||||||||||||||||||
| % | % | % | % | % | % | |||||||||||||||||||||||||||||
Share of HSBC’s profit before tax | 3.0 | 3.7 | 0.9 | – | (10.0 | ) | (1.4 | ) | ||||||||||||||||||||||||||
Cost efficiency ratio | 43.7 | – | 70.2 | 82.5 | 68.1 | – | ||||||||||||||||||||||||||||
For footnotes, see page 120.
53
Table of Contents
HSBC HOLDINGS PLC
Report of the Directors: Operating and Financial Review(continued)
Ratio of earnings to fixed charges96
| 2012 | 2011 | 2010 | 2009 | 2008 | ||||||||||||||||
Ratio of earnings to fixed charges | ||||||||||||||||||||
– excluding interest on deposits | 7.39 | 7.34 | 7.10 | 2.99 | 3.17 | |||||||||||||||
– including interest on deposits | 1.76 | 1.68 | 1.73 | 1.22 | 1.14 | |||||||||||||||
Ratio of earnings to combined fixed charges and preference share dividends | ||||||||||||||||||||
– excluding interest on deposits | 5.79 | 5.95 | 5.89 | 2.64 | 2.97 | |||||||||||||||
– including interest on deposits | 1.71 | 1.64 | 1.69 | 1.20 | 1.13 | |||||||||||||||
For footnote, see page 120.
53a
Table of Contents
HSBC HOLDINGS PLC
Report of the Directors: Operating and Financial Review(continued)
(Audited)
Introduction
The results of HSBC are sensitive to the accounting policies, assumptions and estimates that underlie the preparation of our consolidated financial statements. The significant accounting policies are described in Note 2 on the Financial Statements.
The accounting policies that are deemed critical to our results and financial position, in terms of the materiality of the items to which the policies are applied and the high degree of judgement involved, including the use of assumptions and estimation, are discussed below.
Impairment of loans and advances
Our accounting policy for losses arising from the impairment of customer loans and advances is described in Note 2g on the Financial Statements. Loan impairment allowances represent management’s best estimate of losses incurred in the loan portfolios at the balance sheet date.
Management is required to exercise judgement in making assumptions and estimates when calculating loan impairment allowances on both individually and collectively assessed loans and advances.
The majority of the collectively assessed loan impairment allowances are in North America, where they were US$5.2bn, representing 54% (2011: US$6.8bn; 62%) of the Group’s total collectively assessed loan impairment allowances and 32% of the Group’s total impairment allowances. Of the North American collective impairment allowances approximately 86% (2011: 75%) related to the US CML portfolio.
The methods used to calculate collective impairment allowances on homogeneous groups of loans and advances that are not considered individually significant are disclosed in Note 2g on the Financial Statements. They are subject to estimation uncertainty, in part because it is not practicable to identify losses on an individual loan basis because of the large number of individually insignificant loans in the portfolio.
The estimation methods include the use of statistical analyses of historical information, supplemented with significant management judgement, to assess whether current economic and credit conditions are such that the actual level of inherent losses is likely to be greater or less than that suggested by historical experience. Where
changes in economic, regulatory or behavioural conditions result in the most recent trends in portfolio risk factors being not fully reflected in the statistical models, risk factors are taken into account by adjusting the impairment allowances derived solely from historical loss experience.
Risk factors include loan portfolio growth, product mix, unemployment rates, bankruptcy trends, geographical concentrations, loan product features, economic conditions such as national and local trends in housing markets, the level of interest rates, portfolio seasoning, account management policies and practices, changes in laws and regulations, and other influences on customer payment patterns. Different factors are applied in different regions and countries to reflect local economic conditions, laws and regulations. The methodology and the assumptions used in calculating impairment losses are reviewed regularly in the light of differences between loss estimates and actual loss experience. For example, roll rates, loss rates and the expected timing of future recoveries are regularly benchmarked against actual outcomes to ensure they remain appropriate.
In 2012, a portfolio risk factor adjustment of US$225m was made to increase the collective loan impairment allowances for our US mortgage lending portfolios. The adjustment was made following a review completed in the fourth quarter of 2012 which concluded that the estimated average period of time from current status to write-off was ten months for real estate loans (previously a period of seven months was used). During 2013, this revised estimate will be incorporated into the statistical impairment allowance models.
Where loans are individually assessed for impairment, management judgement is required in determining whether there is objective evidence that a loss event has occurred, and if so, the measurement of the impairment allowance. In determining whether there is objective evidence that a loss event has occurred, judgement is exercised in evaluating all relevant information on indicators of impairment, which is not restricted to the consideration of whether payments are contractually past-due but includes broader consideration of factors indicating deterioration in the financial condition and outlook of borrowers affecting their ability to pay. A higher level of judgement is required for loans to borrowers showing signs of financial difficulty in market sectors experiencing economic stress, particularly where the likelihood of repayment is affected by the prospects for refinancing or the sale of a specified asset. For those loans where objective evidence of impairment exists, management determine the size
54
Table of Contents
HSBC HOLDINGS PLC
Report of the Directors: Operating and Financial Review(continued)
of the allowance required based on a range of factors such as the realisable value of security, the likely dividend available on liquidation or bankruptcy, the viability of the customer’s business model and the capacity to trade successfully out of financial difficulties and generate sufficient cash flow to service debt obligations.
Under certain specified conditions, we provide loan forbearance to borrowers experiencing financial difficulties by agreeing to modify the contractual payment terms of loans in order to improve the management of customer relationships, maximise collection opportunities and, if possible, avoid default or repossession. Where forbearance activities are significant, higher levels of judgement and estimation uncertainty are involved in determining their effects on loan impairment allowances. Forbearance activities take place in both retail and wholesale loan portfolios, but our largest concentration is in the US, in HSBC Finance’s CML portfolio.
The exercise of judgement requires the use of assumptions which are highly subjective and very sensitive to the risk factors, in particular to changes in economic and credit conditions across a large number of geographical areas. Many of the factors have a high degree of interdependency and there is no single factor to which our loan impairment allowances as a whole are sensitive, though they are particularly sensitive to general economic and credit conditions in North America. For example, a 10% increase in impairment allowances on collectively assessed loans and advances in North America would have increased loan impairment allowances by US$0.5bn at 31 December 2012 (2011: US$0.7bn).
It is possible that the outcomes within the next financial year could differ from the assumptions used, and this could result in a material adjustment to the carrying amount of loans and advances.
Goodwill impairment
Our accounting policy for goodwill is described in Note 2p on the Financial Statements. Note 23 on the Financial Statements lists our cash generating units (‘CGU’s) by geographical region and global business. HSBC’s total goodwill amounted to US$21bn at 31 December 2012 (2011: US$21bn).
The review of goodwill for impairment reflects management’s best estimate of the future cash flows of the CGUs and the rates used to discount these cash flows, both of which are subject to uncertain factors as follows:
| • | the future cash flows of the CGUs are sensitive to the cash flows projected for the periods for which detailed forecasts are available and to assumptions regarding the long-term pattern of sustainable cash flows thereafter. Forecasts are compared with actual performance and verifiable economic data, but they necessarily reflect management’s view of future business prospects at the time of the assessment; and |
| • | the rates used to discount future expected cash flows are based on the costs of capital assigned to individual CGUs and the rates can have a significant effect on their valuation. The cost of capital percentage is generally derived from a Capital Asset Pricing Model, which incorporates inputs reflecting a number of financial and economic variables, including the risk-free interest rate in the country concerned and a premium for the risk of the business being evaluated. These variables are subject to fluctuations in external market rates and economic conditions beyond our control and are consequently subject to uncertainty and require the exercise of significant judgement. |
A decline in a CGU’s expected cash flows and/or an increase in its cost of capital reduces the CGU’s estimated recoverable amount. If this is lower than the carrying value of the CGU, a charge for impairment of goodwill is recognised in our income statement for the year.
The accuracy of forecast cash flows is subject to a high degree of uncertainty in volatile market conditions. In such market conditions, management retests goodwill for impairment more frequently than annually to ensure that the assumptions on which the cash flow forecasts are based continue to reflect current market conditions and management’s best estimate of future business prospects.
During 2012, no impairment of goodwill was identified (2011: nil). In addition to the annual impairment test which was performed as at 1 July 2012, management reviewed the current and expected performance of the CGUs as at 31 December 2012 and determined that there was no indication of potential impairment of the goodwill allocated to them, except for the GB&M – Europe CGU, which experienced significantly reduced profitability in the second half of 2012 compared with the first half of 2012. The reduced forecast profitability resulted in a reduction in the recoverable amount of the CGU over its carrying amount (‘headroom’). Consequently, the results of the goodwill impairment testing for this CGU are more sensitive to key assumptions used. Management retested the goodwill
55
Table of Contents
HSBC HOLDINGS PLC
Report of the Directors: Operating and Financial Review(continued)
for this CGU and concluded that there was no impairment.
Note 23 on the Financial Statements includes details of the CGUs with significant balances of goodwill, states the key assumptions used to assess the goodwill in each of those CGUs for impairment and provides a discussion of the sensitivity of the carrying value of goodwill to changes in key assumptions.
Valuation of financial instruments
Our accounting policy for determining the fair value of financial instruments is described in Note 2d on the Financial Statements. The best evidence of fair value is a quoted price for the instrument being measured in an actively traded market. In the event that the market for a financial instrument is not active, a valuation technique is used. The majority of valuation techniques employ only observable market data and so the reliability of the fair value measurement is high. However, certain financial instruments are valued on the basis of valuation techniques that include one or more significant market inputs that are unobservable. Valuation techniques that rely to a greater extent on unobservable inputs require a higher level of management judgement to calculate a fair value than those based wholly on observable inputs.
Valuation techniques used to calculate fair values are discussed in Note 15 on the Financial Statements. The main assumptions and estimates which management consider when applying a model with valuation techniques are:
| • | the likelihood and expected timing of future cash flows on the instrument. These cash flows are estimated based on the terms of the instrument, and judgement may be required when the ability of the counterparty to service the instrument in accordance with the contractual terms is in doubt. Future cash flows may be sensitive to changes in market rates; |
| • | selecting an appropriate discount rate for the instrument. The determination of this rate is based on an assessment of what a market participant would regard as the appropriate spread of the rate for the instrument over the appropriate risk-free rate; and |
| • | judgement to determine what model to use to calculate fair value in areas where the choice of valuation model is particularly subjective, for example, when valuing complex derivative products. |
When applying a model with unobservable inputs, estimates are made to reflect uncertainties in fair values resulting from a lack of market data inputs, for example, as a result of illiquidity in the market. For these instruments, the fair value measurement is less reliable. Inputs into valuations based on unobservable data are inherently uncertain because there is little or no current market data available from which to determine the level at which an arm’s length transaction would occur under normal business conditions. However, in most cases there is some market data available on which to base a determination of fair value, for example historical data, and the fair values of most financial instruments are based on some market observable inputs even when unobservable inputs are significant.
The fair values of financial assets and liabilities of US$718bn (2011: US$665bn) and US$622bn (2011: US$569bn), respectively, were determined using valuation techniques which represented 60% (2011: 61%) and 83% (2011: 82%), respectively, of financial assets and liabilities measured at fair value.
The methodology for estimating credit valuation adjustments (‘CVA’) and debit valuation adjustments (‘DVA’) has been revised as at 31 December 2012 as a result of changing market practices in response to regulatory and accounting changes, as well as general market developments.
A key input into the calculation of CVA is the probability of default (‘PD’). Prior to the revision of the methodology, the PD was based on HSBC’s internal credit rating for the counterparty. The revised methodology maximises the use of PD based on market-observable data, such as credit default swap (‘CDS’) spreads. Where CDS spreads are not available, PDs are estimated having regard to market practice, considering relevant data including CDS indices and historical rating transition matrices. In addition, HSBC aligned its methodology for determining DVA to be consistent with that applied for CVA as at 31 December 2012. Historically, HSBC considered that a zero spread was appropriate in respect of own credit risk and consequently did not adjust derivative liabilities for its own credit risk.
The types and amounts of adjustments made in determining the fair value of financial instruments measured at fair value using valuation techniques, and a sensitivity analysis of fair values for financial instruments with significant unobservable inputs to reasonably possible alternative assumptions, are described in Note 15 on the Financial Statements.
Given the uncertainty and subjective nature of valuing financial instruments at fair value, it is
56
Table of Contents
HSBC HOLDINGS PLC
Report of the Directors: Operating and Financial Review(continued)
possible that the outcomes in the next financial year could differ from the assumptions used, and this could result in a material adjustment to the carrying amount of financial instruments measured at fair value.
Deferred tax assets
Our accounting policy for the recognition of deferred tax assets is described in Note 2s on the Financial Statements. The recognition of a deferred tax asset relies on an assessment of the probability and sufficiency of future taxable profits, future reversals of existing taxable temporary differences and ongoing tax planning strategies.
The most significant judgements concern the US deferred tax asset, given the recent history of losses in our US operations. The net US deferred tax asset amounted to US$4.6bn or 61% (2011: US$5.2bn; 68%) of deferred tax assets recognised on the Group’s balance sheet. These judgements take into consideration the reliance placed on the use of tax planning strategies.
The most significant tax planning strategy is the retention of capital in our US operations to ensure the realisation of the deferred tax assets. The principal strategy involves generating future taxable profits through the retention of capital in the US in excess of normal regulatory requirements in order to reduce deductible funding expenses or otherwise deploy such capital or increase levels of taxable income. Management expects that, with this strategy, the US operations will generate sufficient future profits to support the recognition of the deferred tax assets. If HSBC Holdings were to decide not to provide this ongoing support, the full recovery of the deferred tax asset may no longer be probable and could result in a significant reduction of the deferred tax asset which would be recognised as a charge in the income statement.
Provisions
The accounting policy for provisions is described in Note 2w on the Financial Statements. Note 32 on the Financial Statements discloses the major categories of provisions recognised. The closing balance of provisions amounted to US$5.3bn (2011: US$3.3bn), of which US$1.7bn (2011: US$1.5bn) relates to legal proceedings and regulatory matters and US$2.4bn (2011: US$1.1bn) relates to customer remediation.
Judgement is involved in determining whether a present obligation exists, and in estimating the probability, timing and amount of any outflows. Professional expert advice is taken on litigation
provisions, property provisions (including onerous contracts) and similar liabilities.
Provisions for legal proceedings and regulatory matters typically require a higher degree of judgement than other types of provisions. When cases are at an early stage, accounting judgements can be difficult because of the high degree of uncertainty associated with determining whether a present obligation exists, and estimating the probability and amount of any outflows that may arise. As matters progress through various stages of development, management and legal advisers evaluate on an ongoing basis whether provisions should be recognised and their estimated amounts, revising previous judgements and estimates as appropriate. At more advanced stages, it is typically possible to make judgements and estimates around a better defined set of possible outcomes. However, such judgements can be very difficult and the amount of any provision can be very sensitive to the assumptions used. There could be a wide range of possible outcomes for any pending legal proceedings, investigations or inquiries. As a result, it is often not practicable to quantify a range of possible outcomes for individual matters. It is also not practicable to meaningfully quantify ranges of potential outcomes in aggregate for these types of provisions because of the diverse nature and circumstances of such matters and the wide range of uncertainties involved. For a detailed description of the nature of uncertainties and assumptions and the effect on the amount and timing of possible cash outflows on material matters, see Note 43 on the Financial Statements.
Provisions for customer remediation also require significant levels of estimation and judgement. The amounts of provisions recognised depend on a number of different assumptions, for example, the volume of inbound complaints, the projected period of inbound complaint volumes, the decay rate of complaint volumes, the population identified as systemically mis-sold and the number of policies per customer complaint.
In view of the inherent uncertainties and the high level of subjectivity involved in the recognition and measurement of provisions, it is possible that the outcomes in the next financial year could differ from those on which management’s estimates are based, resulting in materially different amounts of provisions recognised and outflows of economic benefits from those estimated by management for the purposes of the 2012 Financial Statements.
57
Table of Contents
HSBC HOLDINGS PLC
Report of the Directors: Operating and Financial Review(continued)
| 58 | ||
| 60 | ||
| 62 | ||
| 65 | ||
| 68 | ||
| 72 | ||
| 74 | ||
Reconciliation of reported to constant currency and underlying profit/(loss) before tax | 75a | |
Reconciliation of reported to underlying profit/(loss) before tax | 75i | |
| 76 | ||
| 78 |
HSBC reviews operating activity on a number of bases, including by geographical region and by global business.
The commentaries below present global businesses followed by geographical regions (page 79). Performance is discussed in this order because certain strategic themes, business initiatives and trends affect more than one geographical region. All commentaries are on a constant currency basis (page 25) unless stated otherwise.
Basis of preparation
The results of global businesses are presented in accordance with the accounting policies used in the preparation of HSBC’s consolidated financial statements. Our operations are closely integrated and, accordingly, the presentation of global business data includes internal allocations of certain items of income and expense. These allocations include the costs of certain support services and global functions, to the extent that these can be meaningfully attributed to operational business lines. While such allocations have been made on a systematic and consistent basis, they necessarily involve some subjectivity.
Where relevant, income and expense amounts presented include the results of inter-segment funding as well as inter-company and inter-business line transactions. All such transactions are undertaken on arm’s length terms.
The expense of the UK bank levy is included in the Europe geographical region as HSBC regards the levy as a cost of being headquartered in the UK. For the purposes of the segmentation by global business, the cost of the levy is included in ‘Other’.
The fines and penalties paid as part of the settlement of investigations into past inadequate compliance with anti-money laundering and sanctions laws of US$1.9bn are included in the North America (US$1.5bn) and Europe (US$0.4bn) geographical regions, and in ‘Other’ for the purposes of the segmentation by global business.
Profit/(loss) before tax
| 2012 | 2011 | 2010 | ||||||||||||||||||||||||||||||||
| US$m | % | US$m | % | US$m | % | |||||||||||||||||||||||||||||
Retail Banking and Wealth Management | 9,575 | 46.4 | 4,270 | 19.6 | 3,839 | 20.2 | ||||||||||||||||||||||||||||
Commercial Banking | 8,535 | 41.3 | 7,947 | 36.3 | 6,090 | 32.0 | ||||||||||||||||||||||||||||
Global Banking and Markets | 8,520 | 41.3 | 7,049 | 32.2 | 9,215 | 48.4 | ||||||||||||||||||||||||||||
Global Private Banking | 1,009 | 4.9 | 944 | 4.3 | 1,054 | 5.5 | ||||||||||||||||||||||||||||
Other73 | (6,990 | ) | (33.9 | ) | 1,662 | 7.6 | (1,161 | ) | (6.1 | ) | ||||||||||||||||||||||||
| 20,649 | 100.0 | 21,872 | 100.0 | 19,037 | 100.0 | |||||||||||||||||||||||||||||
Total assets74
| At 31 December | ||||||||||||||||||||||
| 2012 | 2011 | |||||||||||||||||||||
| US$m | % | US$m | % | |||||||||||||||||||
Retail Banking and Wealth Management | 536,244 | 19.9 | 540,548 | 21.2 | ||||||||||||||||||
Commercial Banking | 363,659 | 13.5 | 334,966 | 13.1 | ||||||||||||||||||
Global Banking and Markets | 1,942,470 | 72.1 | 1,877,627 | 73.5 | ||||||||||||||||||
Global Private Banking | 118,440 | 4.4 | 119,839 | 4.7 | ||||||||||||||||||
Other | 201,741 | 7.5 | 180,126 | 7.0 | ||||||||||||||||||
Intra-HSBC items | (470,016 | ) | (17.4 | ) | (497,527 | ) | (19.5 | ) | ||||||||||||||
| 2,692,538 | 100.0 | 2,555,579 | 100.0 | |||||||||||||||||||
For footnotes, see page 120.
58
Table of Contents
HSBC HOLDINGS PLC
Report of the Directors: Operating and Financial Review(continued)
Risk-weighted assets
| At 31 December | ||||||||||||||||||||||
| 2012 | 2011 | |||||||||||||||||||||
| US$bn | % | US$bn | % | |||||||||||||||||||
Retail Banking and Wealth Management | 276.6 | 24.6 | 351.2 | 29.0 | ||||||||||||||||||
Commercial Banking | 397.0 | 35.3 | 382.9 | 31.7 | ||||||||||||||||||
Global Banking and Markets | 403.1 | 35.9 | 423.0 | 35.0 | ||||||||||||||||||
Global Private Banking | 21.7 | 1.9 | 22.5 | 1.9 | ||||||||||||||||||
Other | 25.5 | 2.3 | 29.9 | 2.4 | ||||||||||||||||||
| 1,123.9 | 100.0 | 1,209.5 | 100.0 | |||||||||||||||||||
Selected items included in profit before tax by global business
Acquisitions, disposals and dilutions75
| 2012 | 2011 | 2010 | ||||||||||||||
| US$m | US$m | US$m | ||||||||||||||
Retail Banking and Wealth Management | 5,574 | 3,328 | 3 | |||||||||||||
Commercial Banking | 594 | 76 | 119 | |||||||||||||
Global Banking and Markets | 149 | 114 | 262 | |||||||||||||
Global Private Banking | 55 | (9 | ) | – | ||||||||||||
Other73 | 3,107 | 141 | 250 | |||||||||||||
| 9,479 | 3,650 | 634 | ||||||||||||||
For footnotes, see page 120.
59
Table of Contents
HSBC HOLDINGS PLC
Report of the Directors: Operating and Financial Review(continued)
Retail Banking and Wealth Management
RBWM serves over 54 million personal customers. We take deposits and provide transactional banking services to enable customers to manage their day-to-day finances and save for the future. We selectively offer credit facilities to assist customers in their short or longer-term borrowing requirements; and we provide financial advisory, broking, insurance and investment services to help them to manage and protect their financial futures.
We develop products designed to meet the needs of specific customer segments, which may include a range of different services and delivery channels.
Typically, customer offerings include:
• liability-driven services: deposits and account services;
• asset-driven services: credit and lending, both secured and unsecured; and
• fee-driven and other services: financial advisory, broking, life insurance manufacturing and asset management. | We deliver services through four principal channels: branches, self-service terminals, telephone service centres and digital (internet and mobile). Customers can transact with the bank via a combination of these channels, through the following offerings:
• HSBC Premier: we provide preferential banking services and global recognition to our mass affluent customers and their immediate families with a dedicated relationship manager, specialist wealth advice and tailored solutions. Customers can access emergency travel assistance, priority telephone banking and an online ‘global view’ of their Premier accounts around the world.
• HSBC Advance: we provide a range of preferential products and services to simplify the banking needs of customers and to help them manage and plan their money to achieve their financial goals and ambitions.
• Wealth Solutions & Financial Planning: a financial planning process designed around individual customer needs to help our clients to protect, grow and manage their wealth through investment and wealth insurance products manufactured by Global Asset Management, Global Markets and HSBC Insurance and by selected third-party providers.
• Basic Banking: we increasingly provide globally standardised but locally delivered, reliable, easy to understand, good-value banking products and services using global product platforms and globally set service standards.
| |
Commercial Banking
We segment our CMB business into Corporate, to serve both corporate and mid-market companies with more sophisticated financial needs, and Business Banking, to serve SMEs, enabling differentiated coverage of our target customers. This allows us to provide continuous support to companies as they grow both domestically and internationally, and ensures a clear focus on internationally aspirant customers.
We place particular emphasis on international connectivity to meet the needs of our business customers. We aim to be recognised as the leading international trade and business bank by focusing on faster-growing markets, repositioning towards international business and enhancing collaboration across the Group. This will be underpinned by reducing complexity and operational risk and driving efficiency gains through adopting a global operating model. | • Credit and Lending: we offer a broad range of domestic and cross-border financing, including overdrafts, corporate cards, term loans and syndicated, leveraged, acquisition and project finance. Asset finance is also offered in selected countries.
• International trade and receivables finance: we provide the services and finance our clients need throughout the trade cycle including; letters of credit, collections, guarantees; receivables finance; supply chain solutions; commodity and structured finance; and risk distribution. HSBC is supporting the development of renminbi as a trade currency, with renminbi capabilities in more than 50 markets.
• Payments and Cash Management: we are a leading provider of domestic and cross-border payments, collections, liquidity management and account services offering local, regional and global solutions delivered via e-enabled platforms designed to address the current and future needs of our clients.
• Insurance and Investments: we offer business and financial protection, trade insurance, employee benefits, corporate wealth management and a variety of other commercial risk insurance products in selected countries.
• GB&M: our CMB franchise represents a key client base for GB&M products and services, including foreign exchange and interest rate products, together with capital raising on debt and equity markets and advisory services.
| |
60
Table of Contents
HSBC HOLDINGS PLC
Report of the Directors: Operating and Financial Review(continued)
Global Banking and Markets
GB&M provides tailored financial solutions to major government, corporate and institutional clients and private investors worldwide. Managed as a global business, GB&M operates a long-term relationship management approach to build a full understanding of clients’ financial requirements. Sector-focused client service teams comprising relationship managers and product specialists develop financial solutions to meet individual client needs. With a presence in over 60 countries/territories and access to HSBC’s worldwide presence and capabilities, this business serves subsidiaries and offices of our clients on a global basis.
GB&M is managed as two principal business lines: Global Markets and Global Banking. This structure allows us to focus on relationships and sectors that best fit the Group’s geographic reach and facilitate seamless delivery of our products and services to clients.
In addition, Balance Sheet Management is responsible for the management of liquidity and funding. It also manages structural interest rate positions within the Global Markets limit structure.
| • Global Markets operations consist of treasury and capital markets services. Products include foreign exchange; currency, interest rate, bond, credit, equity and other derivatives; government and non-government fixed income and money market instruments; precious metals and exchange-traded futures; equity services; distribution of capital markets instruments; and securities services, including custody and clearing services and funds administration to both domestic and cross-border investors.
• Global Banking offers financing, advisory and transaction services. Products include:
– capital raising, advisory services, bilateral and syndicated lending, leveraged and acquisition finance, structured and project finance, lease finance and non-retail deposit taking;
– international, regional and domestic payments and cash management services; and trade services for large corporate clients. | |
Global Private Banking
GPB provides investment management and trustee solutions to high net worth individuals and their families globally. We aim to meet the needs of our clients by providing excellent customer service, utilising our global reach and offering a comprehensive suite of solutions.
Drawing on the strength of the HSBC Group and the most suitable products from the marketplace, we work with our clients to provide solutions to grow, manage, and preserve wealth for today and for the future. | • Private Banking services comprise multicurrency and fiduciary deposits, account services, and credit and specialist lending. GPB also accesses HSBC’s universal banking capabilities to offer products and services such as credit cards, internet banking, and corporate and investment banking solutions.
• Investment Management comprises advisory and discretionary investment services, as well as brokerage across asset classes. This includes a complete range of investment vehicles, portfolio management, security services and alternatives.
• Private Trust Solutions comprise trusts and estate planning, designed to protect wealth and preserve it for future generations through structures tailored to meet the individual needs of each client.
| |
61
Table of Contents
HSBC HOLDINGS PLC
Report of the Directors: Operating and Financial Review(continued)
Retail Banking and Wealth Management
RBWM provides banking and wealth management services for our personal customers to help them to manage their finances and protect and build their financial futures.
| 2012 | 2011 | 2010 | ||||||||||||||
| US$m | US$m | US$m | ||||||||||||||
Net interest income | 20,298 | 24,101 | 24,166 | |||||||||||||
Net fee income | 7,205 | 8,226 | 8,397 | |||||||||||||
Other income | 6,358 | 1,206 | 1,048 | |||||||||||||
Net operating income21 | 33,861 | 33,533 | 33,611 | |||||||||||||
LICs76 | (5,515 | ) | (9,319 | ) | (11,259 | ) | ||||||||||
Net operating income | 28,346 | 24,214 | 22,352 | |||||||||||||
Total operating expenses | (19,769 | ) | (21,202 | ) | (19,539 | ) | ||||||||||
Operating profit | 8,577 | 3,012 | 2,813 | |||||||||||||
Income from associates77 | 998 | 1,258 | 1,026 | |||||||||||||
Profit before tax | 9,575 | 4,270 | 3,839 | |||||||||||||
RoRWA66 | 3.1% | 1.2% | 1.1% | |||||||||||||
Underlying revenue growth
in all faster-growing regions
Announced
34
disposals or closures since
the start of 2011 and completed
12
in 2012
Best in Wealth Management
in Hong Kong
(The Asian Banker, March 2012)
Strategic direction
RBWM provides retail banking and wealth management services for personal customers in markets where we have, or can build, the scale to do so cost effectively.
We focus on three strategic imperatives:
| • | building a consistent, high standard, customer needs-driven wealth management service for retail customers drawing on our Insurance and Asset Management businesses; |
| • | leveraging global expertise to improve customer service and productivity, to provide a high standard of banking solutions and service to our customers efficiently; and |
| • | simplifying and re-shaping the RBWM portfolio of businesses globally, to focus our capital and resources on key markets. |
For footnotes, see page 120.
The commentary is on a constant currency basis unless stated otherwise.
Review of performance
| • | RBWM reported profit before tax of US$9.6bn compared with US$4.3bn in 2011 (US$4.2bn on a constant currency basis). This included net gains resulting from a number of strategic transactions, including US$3.7bn from the disposals of the Card and Retail Services (‘CRS’) business and non-strategic branches in the US. |
| • | On an underlying basis, profit before tax increased by US$3.1bn, largely driven by lower loan impairment charges in the US run-off portfolio and higher insurance profits in Hong Kong and Brazil. These were partly offset by charges relating to the customer redress programmes in the UK of US$1.8bn, compared with US$868m in 2011 (US$875m as reported). |
RBWM – profit/(loss) before tax
| 2012 | 2011 | 2010 | ||||||||||||||
| US$m | US$m | US$m | ||||||||||||||
RBWM excluding US CRS and | 7,083 | 6,681 | 5,936 | |||||||||||||
US CRS | 3,766 | 2,061 | 1,979 | |||||||||||||
US run-off portfolio | (1,274 | ) | (4,472 | ) | (4,076 | ) | ||||||||||
| 9,575 | 4,270 | 3,839 | ||||||||||||||
| • | Loss before tax in the US run-off portfolio declined significantly, mainly due to lower loan impairment charges reflecting the decline in average lending balances. In addition, revenue benefited from lower adverse movements on the fair value of non-qualifying hedges in HSBC Finance of US$227m, compared with US$1.2bn in 2011. This was partly offset by a fall in net interest income largely driven by the continued reduction in lending balances. |
| • | Profit before tax for RBWM excluding US CRS and the US run-off portfolio increased by US$472m, with revenue growth in Hong Kong, Latin America and Rest of Asia-Pacific partly offset by a fall in profit in the UK due to a US$883m increase in customer redress provisions and the non-recurrence of a credit of US$256m (US$264m as reported) relating to defined benefit pension obligations. |
| • | Revenue grew by 13% in Hong Kong reflecting wider deposit spreads, higher lending and deposit balances and the gains on sale of the general insurance businesses and our shares in Global Payments Asia-Pacific Ltd. Insurance income also increased due to higher investment returns and strong sales and renewals of life insurance products. This was partly offset by the |
62
Table of Contents
HSBC HOLDINGS PLC
Report of the Directors: Operating and Financial Review(continued)
non-recurrence of the implementation benefit from refining the PVIF asset calculation in 2011. |
| • | Revenue in Rest of Asia-Pacific increased by 3% due to the gain on sale of our operations in Thailand, partly offset by the loss of operating revenues associated with this disposal and the discontinuation of our HSBC Premier (‘Premier’) service in Japan. Net interest income remained broadly in line with 2011. Mortgage and deposit balances grew, primarily in Singapore, mainland China, Australia and Malaysia, although the effect was offset by narrower asset and deposit spreads. |
| • | In Latin America, revenue grew by 6%, driven by higher insurance revenues from strong sales of unit-linked pension and term life products and the favourable effect of the recognition of a PVIF asset (US$144m) in Brazil. In addition, we reported a gain on sale of the general insurance business in Argentina. Net interest income increased due to growth in personal loans and deposit balances. Growth was partly offset by the loss on sale of certain businesses as well as the non-recurrence of gains on the sale and leaseback of branches and the sale of HSBC Afore, both in Mexico during 2011. |
| • | In Europe, revenue remained broadly in line with 2011. Revenue decreased in the UK, largely driven by deposit spread compression. This was partly offset by higher mortgage spreads and average balances in the UK and business expansion in Turkey, which led to higher net interest income following growth in personal lending and mortgage balances. |
| • | Loan impairment charges in RBWM excluding US CRS and the US run-off portfolio were broadly in line with 2011. Reductions in Europe, driven by lower delinquencies across both the secured and unsecured lending portfolios, particularly in the UK, were offset by higher impairments in Brazil, where delinquency rates increased as economic growth slowed in 2012. |
| • | Operating expenses in RBWM excluding US CRS and the US run-off portfolio increased only modestly, despite significantly higher customer redress provisions and the non-recurrence of a pension credit in the UK. Excluding these items, expenses decreased through both our organisational effectiveness programmes and the transactions undertaken |
as part of our portfolio management activities, detailed below. These led to a reduction of more than 13,500 FTEs, with all regions contributing to sustainable cost savings of more than US$350m. |
| • | Share of profit from associates and joint ventures decreased by 22%, mainly from Ping An due to market valuation losses on equity securities held by their insurance business, reflecting volatile domestic equity markets. Following the disposal of our associate, Ping An, our remaining shareholding has been classified as a financial investment. |
Strategic imperatives
Developing a high standard of wealth management for retail customers
| • | In 2012, we accelerated the transformation of the Wealth Management business in HSBC, investing significantly in infrastructure to improve customer experience and revenue generation, although further progress is required to achieve our strategic goals. |
| • | Wealth Management revenues increased by over US$550m in 2012 to US$6.4bn, primarily due to growth from insurance, mutual funds and foreign exchange. Wealth insurance revenues improved, driven by higher investment returns, notably in Hong Kong and France and strong sales of life insurance products in Hong Kong and Brazil. Mutual funds sales grew, with revenues increasing by 17% to US$935m. Revenues from foreign exchange transactions benefited from infrastructure investments, including the successful deployment of our web-enabled foreign currency ‘Get Rate’ system across key markets in Europe and Asia towards the end of 2011. |
| • | Foreign exchange services are a core component of our wealth strategy, and we continue to invest in order to further enhance our customer offering. By 31 December 2012, over 220,000 of our customers were using our Global View and Global Transfer products, making cross-border transfers amounting to more than US$13bn in the year. We enhanced our international wire services by improving limits and pricing. We also completed the online launch of dual-currency deposits in Asian markets, and improved market access for foreign exchange trading. |
63
Table of Contents
HSBC HOLDINGS PLC
Report of the Directors: Operating and Financial Review(continued)
| • | Sales of our long-term fund products, including our managed solutions, continued to grow. We launched the HSBC Asia Focused Income Fund in May which grew to US$1bn by the end of 2012. World Selection and Premier Investment Management Services for retail customers continued to grow, with total net sales amounting to US$2bn during the year, resulting in a 20% increase to US$19bn in FuM related to these portfolios. |
| • | HSBC Global Asset Management’s investment performance was strong in 2012, with over 70% of its Equity, Multi-Asset and Fixed Income funds by value ranking above median. As a result, 71% of eligible funds were in the top two quartiles over the three-year period to 31 December 2012. |
| • | We made significant investments to reinforce the wealth risk management framework, introducing enhanced risk profiling and strategic financial planning tools to enable more effective control of compliance and regulatory risks. |
| • | As part of the drive to enhance customer experience, we started the global roll-out of a new Wealth Dashboard, which allows customers easy access and analysis of personal holdings and enables ongoing comparison with reference portfolios. Additionally, in a number of markets we introduced a global insurance point-of-sale system which offers customers a faster, more integrated service. |
Leveraging global expertise in retail banking
| • | We continued to enhance our digital banking capabilities with the launch of the first mobile payment solution in Hong Kong enabling contactless credit card transactions through Visa payWave terminals, the first deployment of a global application platform in the US, and the roll-out of mortgage digital sales tools in the UK, India, UAE and Malaysia. |
| • | Our business re-engineering programme is driving cost reduction and efficiency improvements through standardisation. We used our global scale to improve cost controls and progressively standardised the design of our Contact Centres. In addition, we are successfully deploying enhanced analytical capabilities to improve customer experience. |
Portfolio management to drive superior returns
| • | Good progress was made in portfolio management activities with 17 disposals or |
closures announced in 2012 and a further four in 2013, following the 13 announced in 2011, and 12 transactions completed in 2012. During 2012, we completed the sale or closure of our retail businesses in Thailand, Honduras, El Salvador and Costa Rica, disposed of the Card and Retail Services business and upstate New York branches in the US and the full service retail brokerage business in Canada and recorded an investment loss on a subsidiary. Additionally, we announced the sale of our retail banking operations in Colombia, Peru, Uruguay, Paraguay and Pakistan and the closure of the consumer finance business in Canada. In December 2012 we disposed of our associate, Ping An, with our remaining shareholding classified as a financial investment, and also completed the sale of our shares in Global Payments Asia-Pacific Ltd. Following completion of all the announced transactions we will have refocused our business to 20 home and priority markets (representing 98% of 2012 profit before tax) and a limited number of network and small markets. |
| • | We are exiting the general insurance manufacturing business and focusing on life insurance manufacturing where we have scale. In 2012, we completed the sale of our general insurance businesses in Hong Kong, Singapore, Argentina and Ireland, announced the sale of our insurance manufacturing businesses in the US and Taiwan and reached an agreement to sell a portfolio of general insurance assets and liabilities in Mexico. |
| • | In October 2012, we completed the acquisition of the onshore retail banking business of Lloyds Banking Group in the UAE, following the merger in the second quarter of our Omani operations with OIB. |
| • | We remained focused on managing the run-off of balances in our CML portfolio, with year-end lending balances, including loans held for sale, declining by 14% from December 2011 to US$43bn. In the third quarter of 2012, we reclassified US$3.7bn of non-real estate personal loan balances, net of impairment allowances, from our consumer finance portfolio to ‘Assets held for sale’ as we actively marketed the portfolio. We also identified real estate secured loan balances which we plan to actively market in multiple transactions over the next two years. |
64
Table of Contents
HSBC HOLDINGS PLC
Report of the Directors: Operating and Financial Review(continued)
CMB offers a full range of commercial financial services and tailored solutions to more than three million customers ranging from small and medium-sized enterprises to publicly quoted companies in more than 60 countries.
| 2012 | 2011 | 2010 | ||||||||||||||
| US$m | US$m | US$m | ||||||||||||||
Net interest income | 10,361 | 9,931 | 8,487 | |||||||||||||
Net fee income | 4,470 | 4,291 | 3,964 | |||||||||||||
Other income | 1,720 | 1,389 | 1,383 | |||||||||||||
Net operating income21 | 16,551 | 15,611 | 13,834 | |||||||||||||
LICs76 | (2,099 | ) | (1,738 | ) | (1,805 | ) | ||||||||||
Net operating income | 14,452 | 13,873 | 12,029 | |||||||||||||
Total operating expenses | (7,598 | ) | (7,221 | ) | (6,831 | ) | ||||||||||
Operating profit/(loss) | 6,854 | 6,652 | 5,198 | |||||||||||||
Income from associates77 | 1,681 | 1,295 | 892 | |||||||||||||
Profit/(loss) before tax | 8,535 | 7,947 | 6,090 | |||||||||||||
RoRWA66 | 2.2% | 2.2% | 2.0% | |||||||||||||
Record reported profit before tax
US$8.5bn
9%
increase in customer deposits, driven by Payments
and Cash Management
Number one global trade finance
bank in the world
(Oliver Wyman Global Transaction Banking Survey 2012)
Strategic direction
CMB aims to be the banking partner of choice for international businesses by building on our rich heritage, international capabilities and relationships to enable connectivity and support trade and capital flows around the world, thereby strengthening our leading position in international business and trade.
We have four strategic imperatives:
| • | focus on faster-growing markets while connecting revenue and investment flows with developed markets; |
| • | capture growth in international SMEs and corporate businesses; |
| • | enhance collaboration across all global businesses to provide our customers with access to the full range of the Group’s services; and |
| • | simplify processes and enhance risk management controls by adopting a global operating model. |
For footnotes, see page 120.
The commentary is on a constant currency basis unless stated otherwise.
Review of performance
| • | CMB reported a record profit before tax of US$8.5bn in 2012, 7% higher than in 2011. On a constant currency basis, profit before tax increased by 10%. This included gains totalling US$468m mainly from the sale of branches in the US, the disposal of general insurance businesses in Argentina and Hong Kong and the sale of our shares in Global Payments Asia-Pacific Ltd in Hong Kong. |
| • | On an underlying basis, profit before tax increased by 3%. This was driven by strong revenue growth and higher income from our associates, substantially offset by a rise in operating expenses which reflected the effect of notable cost items that included a customer redress provision of US$268m relating to interest rate protection products in the UK. Loan impairment charges also rose, driven by higher individually assessed provisions in Europe and Rest of Asia-Pacific, and a rise in collective charges in Latin America. |
| • | Revenue grew by 10% in the year, with increases in all regions. This reflected strong net interest income growth, higher net fee income and a rise in other income driven by the gains on disposals. |
| • | Net interest income increased by 8% as a result of average balance sheet growth. Customer loans and advances rose in all regions, with over half this growth coming from our faster growing regions of Hong Kong, Rest of Asia-Pacific and Latin America, driven by higher trade-related lending as demand for export finance increased. In Europe, despite muted demand for credit, net interest income from lending activities also rose as a result of growth in average lending balances, notably in the UK. Net interest income from customer accounts rose as we continued to attract deposits through our Payments and Cash Management products. Net interest income from deposits also benefited from higher liability spreads in Hong Kong, reflecting an increase in short-term interest rates. |
| • | Net fee income benefited from higher transaction volumes of Payments and Cash Management products, mainly in Europe, Latin America and Hong Kong. Net fee income from Global Trade and Receivables Finance products also rose in Hong Kong, due to continued demand for export finance as we captured international trade and capital flows, and in Europe as we continued to expand our Trade and Commodity and Structured Trade Finance offerings. In addition, |
65
Table of Contents
HSBC HOLDINGS PLC
Report of the Directors: Operating and Financial Review(continued)
our collaboration with GB&M led to higher revenues generated primarily from sales of foreign exchange products. |
| • | Loan impairment charges and other credit risk provisions increased by US$442m, driven by higher individually assessed loan impairments in Europe, reflecting the challenging economic conditions in the UK, Greece, Spain and Turkey, and in Rest of Asia-Pacific in respect of a small number of customers in our Corporate segment. Collective impairment provisions also rose in Latin America, mainly in Brazil from increased delinquency in the Business Banking portfolio. |
| • | Operating expensesincreased by 10%, primarily due to a US$268m customer redress provision relating to interest rate protection products in the UK (see page 32). The rise in costs also reflected the non-recurrence of a credit in 2011 of US$206m (US$212m as reported), arising from a change in the measurement of defined benefit pension obligations in the UK. In addition, we continued to invest in and strengthen our Risk and Compliance function as part of our global operating model. Operating expenses also increased in our faster-growing regions of Latin America and Rest of Asia-Pacific due to inflationary pressures and continued investment in front line and support staff. |
| • | Income from associates grew by 28% as our associates in mainland China benefited from a rise in lending and associated fee income, reflecting continued economic growth. |
Strategic imperatives
Focus on faster-growing markets while connecting with developed markets
| • | We continued to position the business for growth, maintaining our investment in our faster-growing regions, where revenues rose by 12 percentage points from 2011 and represented over 54% of our revenues. Our top 20 markets contributed over 90% of our profit before tax in 2012, with 14 of these countries located in the faster-growing regions. |
| • | Our strong network helps connect customers with both developed and developing markets as they expand internationally. During 2012, we were the first bank to settle cross-border renminbi trade across six continents with our ability to provide related services in over 50 countries offering a competitive advantage to |
our customers as the renminbi is positioned as a major global trade and investment currency. We have expanded our global network of dedicated China desks to cover our top markets, representing about half of the world’s GDP. These are staffed by Mandarin-speaking experts who support mainland Chinese businesses to identify new opportunities to expand overseas. |
| • | As reported in theOliver Wyman Global Transaction Banking Survey 2012, we maintained our position as the world’s largest global trade finance bank with a market share of global trade finance revenue that increased from 9% in 2011 to 10% in the first half of 2012, in spite of a slowdown in world trade growth. Our Global Trade and Receivables Finance revenues increased by 11% as our network provided customers with access to over 75% of world trade flows. In addition, we continued to expand our Commodity and Structured Trade Finance offering across CMB and GB&M, establishing new teams in four countries, which brought the total to seven by the end of 2012. Our team of product specialists more than doubled from 31 at the end of 2011 to 78 across Europe, Hong Kong and Rest of Asia-Pacific, with plans for further expansion in Latin America, Middle East and North Africa, North America and additional countries in Rest of Asia-Pacific by the end of 2013. |
| • | International payments volumes in Payments and Cash Management have grown at twice the rate of the market globally since 2010 with year-on-year revenue increasing by 15% in 2012. This growth reflected new mandates and investments in new products such as HSBCnet mobile to improve our customers’ experience. Double digit revenue growth was reported in the UK, Brazil and Hong Kong, all of which are top markets for CMB, reflecting the strength of the franchise in both developed and developing markets. In 2012, HSBC was the first bank to be named ‘Best Cash Management Bank’ globally for both ‘Financial Institutions’ and ‘Non-Financial Institutions’ in the same year byEuromoney’s customer survey. Also in this poll, we were named ‘Best Domestic Cash Management Provider’ in over 20 countries. |
Capture growth in international businesses
| • | Our strong international network offers a distinctive presence in key markets with major trade flows, facilitating growth for international businesses. Our international customer base generated around 40% of our revenues. |
66
Table of Contents
HSBC HOLDINGS PLC
Report of the Directors: Operating and Financial Review(continued)
| • | In Business Banking, we continued to attract and serve an increasing number of international SMEs and further differentiated our service offering to them by extending our global network of specialist International Relationship Managers (‘IRM’s) who focus on high value international clients. During 2012, we added over 165 IRMs in France, Brazil and the UK and plan to expand the model into other key Business Banking markets in 2013. |
| • | We continued to support SMEs through the economic recovery, with a particular focus on those with international aspirations. In the first half of 2012, we launched an international SME fund in the UK to support UK businesses that trade, or aspire to trade, internationally. By the end of 2012, we had approved lending through the fund of £5.1bn (US$8.2bn), exceeding our original target of £4.0bn (US$6.5bn), and provided £12bn (US$20bn) of gross new lending to UK SMEs, including the renewal of overdraft and other lending facilities. Over 80% of small business lending applications received during the year were approved. Similarly, in the UAE, we launched our third SME fund of AED1bn (US$272m) targeted at international trade customers. |
| • | Our global expertise helped connect our customers with new market opportunities. We held three ‘Global Connections International Exchanges’ in Brazil, mainland China and Dubai in 2012, where we were joined by clients from all of our top 20 markets who were able to make contacts, share their specialist market knowledge and identify new business opportunities. |
Strong partnership with global businesses
| • | Our collaboration with GB&M has delivered nearly US$0.7bn in incremental gross revenue since 2010. Gross revenues from sales of GB&M products to CMB customers which are shared across the two global businesses grew by over US$0.1bn in 2012 or by 5%, mainly driven by sales of foreign exchange products. |
| • | We continued to benefit from GB&M’s e-FX platform to deliver our standard foreign exchange products to customers more efficiently. We also addressed demand for |
alternative sources of finance, providing our customers with access to debt and equity capital markets and offering specialised financing, such as Project and Export Finance, via GB&M. |
| • | Dedicated executives are now in place in both CMB and GPB to promote cross-business referral activities and support the collaboration between the businesses. For example, the Global Priority Clients initiative was launched in 2012 to service the Group’s largest ultra-high net worth clients’ corporate and personal needs jointly. |
| • | In 2012, we launched our trade credit insurance offering in Hong Kong, Brazil and the UK. It will be rolled out to further markets in the first half of 2013, including Turkey, France, Singapore and Malaysia. |
Simplify processes and enhance risk management controls by adopting a global operating model
| • | The successful adoption of a global model has enabled us to deliver a number of benefits, notably simplified processes for our customers, enhanced governance and compliance oversight, and sustainable cost savings across the business. |
| • | We have made significant progress in simplifying and reducing the time to complete our credit renewal process, implementing improvements in 17 key markets with further countries in scope for the first quarter of 2013. In addition, we have deployed a consistent model for cross-border account opening to facilitate the on-boarding of new international customers. |
| • | The sustainable cost savings of over US$100m achieved through process re-engineering and organisational effectiveness have been reinvested in both front line staff and our Risk and Compliance function. We introduced enhanced consistent Know Your Customer procedures, a global product governance board and dedicated resources to improve governance oversight. This investment, combined with our values-based approach to relationship management, is helping to foster a disciplined and constructive culture of risk management in CMB while encouraging balanced and sustainable growth. |
67
Table of Contents
HSBC HOLDINGS PLC
Report of the Directors: Operating and Financial Review(continued)
GB&M provides tailored financial solutions to major government, corporate and institutional clients worldwide.
| 2012 US$m | 2011 US$m | 2010 US$m | ||||||||||||||
Net interest income | 6,960 | 7,263 | 7,343 | |||||||||||||
Net fee income | 3,329 | 3,227 | 3,664 | |||||||||||||
Net trading income78 | 5,690 | 5,204 | 5,830 | |||||||||||||
Other income | 2,294 | 1,363 | 2,075 | |||||||||||||
Net operating income21 | 18,273 | 17,057 | 18,912 | |||||||||||||
LICs76 | (670 | ) | (984 | ) | (990 | ) | ||||||||||
Net operating income | 17,603 | 16,073 | 17,922 | |||||||||||||
Total operating expenses | (9,907 | ) | (9,722 | ) | (9,228 | ) | ||||||||||
Operating profit | 7,696 | 6,351 | 8,694 | |||||||||||||
Income from associates77 | 824 | 698 | 521 | |||||||||||||
Profit before tax | 8,520 | 7,049 | 9,215 | |||||||||||||
RoRWA66 | 2.1% | 1.8% | 2.5% | |||||||||||||
Record reported revenues from
corporate and institutional
debt issuance
77%
of profit before tax
from faster-growing regions
Most Innovative
Investment Bank of the Year
(The Banker Investment Banking Awards 2012)
Strategic direction
GB&M continues to pursue its well-established ‘emerging markets-led and financing-focused’ strategy, with the objective of being a leading international wholesale bank. This strategy has evolved to include a greater emphasis on connectivity between the global businesses, across the regions and within GB&M, leveraging the Group’s extensive distribution network.
We focus on four strategic imperatives:
| • | reinforce client coverage and client-led solutions for major government, corporate and institutional clients; |
| • | continue to selectively invest in the business to support the delivery of an integrated suite of products and services; |
| • | enhance collaboration with other global businesses, particularly CMB, to appropriately service the needs of our international client base; and |
| • | focus on business re-engineering to optimise operational efficiency and reduce costs. |
For footnotes, see page 120.
The commentary is on a constant currency basis unless stated otherwise.
Review of performance
| • | GB&M reported profit before tax of US$8.5bn, 21% higher than in 2011. On a constant currency basis, profit before tax increased by 24% despite a significant net charge relating to credit and debit derivative valuation adjustments. The rise in profit before tax was driven by strong revenue growth, notably in Rates and Credit, together with significantly lower credit risk provisions than in 2011, partly offset by higher operating expenses. GB&M is well positioned for growth in faster-growing regions with record reported revenues in Hong Kong (US$2.8bn), Rest of Asia-Pacific (US$4.0bn) and Latin America (US$1.8bn). |
| • | In the fourth quarter a net charge of US$385m was reported in net trading income as a result of a change in estimation methodology in respect of credit valuation adjustments on derivative assets of US$903m and debit valuation adjustments on derivative liabilities of US$518m to reflect evolving market practices (see Note 15 on the Financial Statements). |
| • | Notwithstanding the charge noted above,revenues rose by 10%, primarily due to significantly higher trading revenues in Rates and Credit, notably in Europe, as spreads tightened and investor sentiment improved following stimuli by central banks globally. Balance Sheet Management reported higher gains on the disposal of available-for-sale debt securities, largely in the UK, while Payments and Cash Management benefited from growth in average liability balances, increased transaction volumes and new mandates. These increases were partly offset by a fall in revenues from our Equities business due to lower client activity as market volumes declined. Revenues in 2012 also included adverse fair value movements from own credit spreads on structured liabilities of US$629m compared with a favourable fair value movement of US$458m reported in 2011. |
| • | Loan impairment charges and other credit risk provisions decreased by US$300m compared with 2011. Credit risk provisions declined significantly, from US$515m in 2011 to US$117m in 2012, driven by lower impairment charges on Greek sovereign debt, and on available-for-sale ABSs in our legacy portfolio reflecting an improvement in underlying asset prices. This was partly offset by a US$97m increase in loan impairment charges as a result of a small number of specific impairments in |
68
Table of Contents
HSBC HOLDINGS PLC
Report of the Directors: Operating and Financial Review(continued)
Global Banking and on the legacy credit loans and receivables portfolio.
| • | Operating expenses increased by US$393m to US$9.9bn, predominantly due to a customer redress provision of US$330m relating to interest rate protection products in the UK (see page 32). Performance costs rose, albeit at a lower rate of growth than net operating income, which resulted in a lower total compensation ratio than in 2011. 2011 also included a credit of US$108m (US$111m as reported) relating to defined benefit pension obligations in the UK, which did not recur. |
Management view of total operating income
2012 US$m | 2011 US$m | 2010 US$m | ||||||||||||||
Global Markets79 | 8,733 | 8,098 | 9,173 | |||||||||||||
Credit | 779 | 335 | 1,649 | |||||||||||||
Rates | 1,771 | 1,341 | 2,052 | |||||||||||||
Foreign Exchange | 3,215 | 3,272 | 2,752 | |||||||||||||
Equities | 679 | 961 | 755 | |||||||||||||
Securities Services | 1,663 | 1,673 | 1,511 | |||||||||||||
Asset and Structured Finance | 626 | 516 | 454 | |||||||||||||
Global Banking | 5,568 | 5,401 | 4,621 | |||||||||||||
Financing and Equity Capital Markets | 3,071 | 3,233 | 2,852 | |||||||||||||
Payments and Cash Management80 | 1,744 | 1,534 | 1,133 | |||||||||||||
Other transaction services81 | 753 | 634 | 636 | |||||||||||||
Balance Sheet Management82 | 3,738 | 3,488 | 4,102 | |||||||||||||
Principal Investments | 125 | 209 | 319 | |||||||||||||
Debit valuation adjustment | 518 | – | – | |||||||||||||
Other83 | (409 | ) | (139 | ) | 697 | |||||||||||
Total operating income | 18,273 | 17,057 | 18,912 | |||||||||||||
Balance Sheet Management revenues included a notional tax credit on income earned from tax-exempt investments of US$116m in 2012 (2011: US$85m; 2010: US$50m), which is offset above within ‘Other.’
For footnotes, see page 120.
| • | Included in the table above are the following amounts in relation to the change in credit valuation adjustment estimation methodology: |
2012 US$m | ||||
Credit | (52 | ) | ||
Rates | (837 | ) | ||
Foreign Exchange | (7 | ) | ||
Equities | (7 | ) | ||
Total | (903 | ) | ||
| • | Global Markets delivered a strong performance in an uncertain financial and economic environment, in part due to a US$444m increase in Rates revenues. This was despite significant adverse fair value movements from own credit spreads on structured liabilities as spreads tightened, compared with favourable movements reported in 2011, together with a credit valuation adjustment of US$837m in 2012. Revenues in Credit increased by US$453m due to strong trading income, mainly in Europe, as spreads tightened on corporate debt securities. Additionally, we achieved record reported revenues from primary market issuance, mainly within Credit, with revenues in Europe, Hong Kong and North America increasing as we enhanced regional coverage and actively captured growth in client demand for debt capital financing. |
| • | Foreign Exchange income was broadly in line with 2011, as higher revenues from enhanced collaboration between GB&M and CMB, and increased volumes from the improvement in our electronic pricing and distribution capabilities, offset the effect of less volatile markets in 2012. Notwithstanding the capture of higher market share within a number of our target emerging markets, Equities revenues decreased by 27%, driven by lower client activity as market volumes declined against the backdrop of economic and fiscal uncertainty in Europe and North America. This was coupled with adverse fair value movements on structured liabilities compared with favourable movements in 2011. |
| • | In Global Banking, Financing and Equity Capital Markets revenues were broadly unchanged compared with 2011 as lower advisory and underwriting fees, mainly in Europe, reflecting the challenging market environment, were partly offset by higher Project and Export Finance revenues, as deal volumes increased, and as we captured a higher market share of public and private sector investment in infrastructure development in emerging markets. Payments and Cash Management revenues increased by 15% due to higher average liability balances and an increase in transaction volumes. We increased our focus on cross-selling Payments and Cash Management products to selected international customers and saw a rise in new mandates. |
| • | In ‘Other transaction services’, revenues increased by 24% as the Global Trade and Receivables Finance business benefited from enhanced collaboration between Global Banking |
69
Table of Contents
HSBC HOLDINGS PLC
Report of the Directors: Operating and Financial Review(continued)
relationship managers and specialist sales teams and the expansion of the Commodity and Structured Trade Finance offering leading to higher revenues in Europe and Rest of Asia-Pacific. Revenues in Rest of Asia-Pacific also increased as a result of growth in export lending and improved spreads.
| • | Balance Sheet Management revenues rose by US$324m due to higher gains on the disposal of available-for-sale debt securities as part of structural interest rate risk management of the balance sheet, notably in Europe. Net interest income declined in Europe, however, as yield curves continued to flatten and liquidity from maturities and sales of available-for-sale debt securities was re-invested at lower prevailing rates. In addition, we placed a greater portion of our liquidity with central banks. Higher net interest income was reported in Rest of Asia-Pacific due to higher yields and portfolio growth in mainland China, and in Latin America due to lower funding costs in Brazil as interest rates declined. |
| • | Principal Investments revenue declined by US$76m compared with 2011 owing to higher impairments, mainly on three available-for-sale equity securities, two of which were in our direct investment business in run-off. This was offset in part by higher realised gains on disposals. |
Strategic imperatives
Reinforce client coverage and client-led solutions
| • | Our multinational coverage teams continued to expand our offerings of cross-product solutions for our clients and delivered revenue growth, particularly in faster-growing regions as we successfully executed a number of notable cross-border transactions. This included providing financing and advisory services to clients through our Project and Export Financing business, which resulted in HSBC being awarded ‘Best Project Finance House’ in Asia, the Middle East and Latin America in theEuromoney Awards for Excellence 2012. |
| • | To further strengthen client coverage and product expertise, we invested in selective recruitment in key strategic markets. In Rest of Asia-Pacific, we enhanced our advisory, debt capital markets and credit and lending businesses through a number of senior appointments in the Resources and Energy and the Financial Institutions groups. We also appointed a Co-Head of Global Banking in Brazil to drive strategic dialogue with key |
clients and develop our advisory business in Latin America.
| • | We continued to develop our distinctive geographical franchise to enhance client coverage, particularly within debt capital markets. A number of successfully executed transactions, notably in emerging markets, demonstrated the benefit of partnering between regional and global product teams. These partnerships facilitated the delivery of innovative solutions and alternative funding opportunities for our clients. As a result, HSBC was awarded ‘Best Global Emerging Market Debt House’ in theEuromoney Awards for Excellence 2012. Additionally, we increased our market share of, and maintained our leading position in, emerging markets debt issuance. |
Enhance core product strengths and selectively develop new capabilities
| • | We continued to develop cross-product capabilities in the growing renminbi market. Earlier in the year, we issued the first international renminbi bond outside Chinese sovereign territory. Since then, a number of significant transactions were supported by in-depth collaboration between regional teams, reinforcing HSBC’s position as the leading house for international renminbi issuance. In recognition of these achievements, HSBC was awarded ‘RMB House of the Year’ in the2012 Asia Risk Awards, along with ‘Best for overall products/services’ and ‘Most likely RMB products/services provider’ in the2012 Asiamoney Offshore RMB Services survey. |
| • | In Foreign Exchange, we remained focused on enhancing product offerings in our e-FX platforms for a broader client base, particularly for CMB and RBWM customers. This included the launch of our ‘Dynamic Currency Conversion’ product within our transactional Foreign Exchange business in the UK in time for the Olympics, along with a real-time online foreign currency margin trading product in Hong Kong. Our strength in foreign exchange capabilities, particularly in emerging markets, was recognised by several awards during the year including ‘Best Bank for Foreign Exchange’ in Asia-Pacific and ‘Best Bank for Emerging Asian currencies’ in the2012 FX Week Best Banks Awards. Our innovation and achievements in the renminbi market contributed to HSBC also being awarded ‘Foreign Exchange House of the Year’ in the2012 Structured Products Asia Awards. |
70
Table of Contents
HSBC HOLDINGS PLC
Report of the Directors: Operating and Financial Review(continued)
| • | As a result of recent investment in our equity execution platform and research capabilities in emerging markets, we progressed in repositioning the business for future growth and enhanced our ability to respond to client needs. We are now ranked in the top five of equities brokers in Hong Kong, while our ranking in theAsiamoney 2012 Brokers Poll for Asian Equity Research and Sales rose from fifth in 2011 to second in 2012. |
| • | In a challenging economic environment, our clients demand visibility and control of their intra-day cash positions. To facilitate this, we expanded the Global Liquidity Solutions platform within Payments and Cash Management, and it is now live in 27 countries. We were also the first foreign bank to gain approval to establish an automated, cross-border pooling structure in mainland China. The pilot scheme, which aims to centralise foreign currency management for multinational companies by connecting their onshore and offshore cash management structures, will enable our clients to manage their cash positions more efficiently. |
| • | We are actively managing our legacy credit exposures and exited from certain positions, including ABSs in the UK and certain structured credit positions and related hedges in the US during 2012. We will look to reduce the size of this portfolio further as opportunities arise, using the economic framework put in place in 2011 (see page 18). |
Collaborate with other global businesses to deliver incremental revenues
| • | We have worked closely with CMB to provide their clients with appropriate GB&M products and this has delivered nearly US$0.7bn in incremental gross revenue since 2010. Gross revenues, which are shared across the two global businesses, grew by over US$0.1bn in 2012, or by 5%, mainly driven by sales of foreign exchange products. A number of appointments during the year, including a new Head of Commercial Banking Coverage for Asia-Pacific in Global Banking, further strengthened collaboration efforts and enhanced our ability to meet the financing needs of our clients. |
| • | We continued to enhance collaboration across the Group through the Institutional Private Clients (‘IPC’) initiative with GPB and the Premier referrals initiative with RBWM, leading to higher revenues and increased Premier account openings respectively, compared with 2011. We also appointed a Head of Coverage in Hong Kong to strengthen our Global Banking franchise and deliver on IPC initiatives in the region. |
Strategic re-engineering to deliver sustainable cost savings
| • | The successful implementation of the organisational design we announced in 2011, and our continued resource optimisation through re-engineering, delivered over US$200m of sustainable savings in 2012. |
71
Table of Contents
HSBC HOLDINGS PLC
Report of the Directors: Operating and Financial Review(continued)
GPB serves high net worth individuals and families with complex and international needs.
| 2012 US$m | 2011 US$m | 2010 US$m | ||||||||||||||
Net interest income | 1,294 | 1,439 | 1,345 | |||||||||||||
Net fee income | 1,232 | 1,382 | 1,299 | |||||||||||||
Other income | 646 | 471 | 449 | |||||||||||||
Net operating income21 | 3,172 | 3,292 | 3,093 | |||||||||||||
LIC (charges)/recoveries76 | (27 | ) | (86 | ) | 12 | |||||||||||
Net operating income | 3,145 | 3,206 | 3,105 | |||||||||||||
Total operating expenses | (2,143 | ) | (2,266 | ) | (2,035 | ) | ||||||||||
Operating profit | 1,002 | 940 | 1,070 | |||||||||||||
Income/(expense) from associates77 | 7 | 4 | (16 | ) | ||||||||||||
Profit before tax | 1,009 | 944 | 1,054 | |||||||||||||
RoRWA66 | 4.6% | 3.9% | 4.1% | |||||||||||||
Significant progress towards rationalising and
repositioning our business
OverUS$70m
of sustainable cost savings
Outstanding Private Bank
in Asia-Pacific and in the Middle East
(Private Banker International Awards, 2012)
Strategic direction
GPB works with high net worth clients to manage and preserve their wealth while connecting them to global opportunities. We focus on three strategic imperatives:
| • | implementing a new operating model to manage the business globally and better service client needs, with an enhanced systems platform and adherence to the highest risk and compliance standards in the industry; |
| • | intensifying collaboration within the Group, particularly with CMB, to access entrepreneur wealth creation; and |
| • | capturing growth by focusing investment on the most attractive developed and faster-growing wealth markets, where GPB can access the Group’s client franchise and its strong local and international product capabilities. |
For footnotes, see page 120.
The commentary is on a constant currency basis unless stated otherwise.
Review of performance
| • | Reported profit before tax of US$1.0bn was 7% higher than in 2011 on a reported basis and 8% higher on a constant currency basis. |
| • | On an underlying basis, which excludes the gain on the sale of our operations in Japan (US$67m) and associated operating results, profit before tax was broadly unchanged as lower operating expenses and decreased loan impairment charges and other credit risk provisions were largely offset by reduced revenues. |
| • | Revenue declined by 3%, primarily due to lower fee income. Brokerage fees fell, reflecting a reduction in client transaction volumes due, in part, to lower volatility. Fees from assets under management and account service fees also declined as challenging market conditions in the latter half of 2011 led to a fall in average client assets in 2012, coupled with a reduction in client numbers as we repositioned our target client base. Net interest income was lower as higher yielding positions matured, opportunities for reinvestment were limited by lower prevailing yields and we selectively managed our exposures to eurozone sovereign debt. Narrower liability spreads and lower deposit balances in Switzerland and the sale of our operations in Japan also contributed to the fall in net interest income. These factors were partly offset by gains on the sale of our operations in Japan and our headquarters building in Switzerland of US$67m and US$53m, respectively. |
| • | Loan impairment charges and other credit risk provisions reduced by 68% as a result of the non-recurrence of charges relating to available-for-sale Greek sovereign debt securities and lower individually assessed and collective impairments in the UK. These factors were partly offset by lower recoveries in the US. |
| • | Operating expenses decreased by 4%, primarily due to a managed reduction in average staff numbers and lower performance costs. The decrease in staff costs was partly offset by higher customer redress provisions, costs relating to the merger of pension funds in Switzerland, and increased restructuring and other related costs. |
72
Table of Contents
HSBC HOLDINGS PLC
Report of the Directors: Operating and Financial Review(continued)
Client assets84
| 2012 US$bn | 2011 US$bn | |||||||||
At 1 January | 377 | 390 | ||||||||
Net new money | (7 | ) | 13 | |||||||
Value change | 17 | (20 | ) | |||||||
Exchange and other | 11 | (6 | ) | |||||||
At 31 December | 398 | 377 | ||||||||
| • | Client assets, which include FuM and cash deposits, increased by US$21bn, driven by the inclusion of custody assets in client assets and favourable market and foreign exchange movements, partly offset by negative net new money and the disposal of our operations in Japan. Negative net new money included a small number of large client withdrawals and reflected lower inflows as we became more selective in establishing new client relationships, as well as the adoption of more stringent compliance and tax transparency standards. We also stopped marketing in certain non-strategic countries. In addition, we implemented a redefined segmentation model to reposition our client base towards higher net worth international and domestic relationships. This programme, along with a review of certain client relationships with a view to reducing control risk, resulted in a reduction of around US$4.5bn of client assets in 2012. |
| • | ‘Total client assets’, which also include some non-financial assets held in client trusts, increased from US$496bn at 31 December 2011 to US$517bn at 31 December 2012 largely due to market movements partly offset by negative net new money as noted above. |
| • | Our return on assets, defined as the percentage of our revenues to our average client assets, was unchanged as the reduction in revenues corresponded with the fall in average client assets. |
Strategic imperatives
| • | 2012 was a year of transition for GPB as we repositioned our business model and target client base to focus investment in selected priority markets, enhance our compliance and risk frameworks and encourage better alignment with the other global businesses. We are targeting higher net worth international and domestic customers and have built on existing product strengths and leveraged Group capabilities to meet their needs. We expect this period of transition and implementation to continue throughout 2013. |
Implementing a more focused business model that better services client needs
| • | We implemented a new target operating model based on six ‘global markets’ (North Asia; South East Asia; North America; Latin America; Europe; and Middle East, North Africa and Turkey). This enables us to operate as an integrated global business rather than a federation of private banks and to provide our clients with globally consistent products and services and improved co-ordination of marketing and servicing activity. |
| • | We sold or closed a number of non-strategic, underperforming businesses in order to rationalise our business and focus on priority markets. Disposals included our operations in Japan, our UK property advisory business, a portfolio of non-strategic clients in Monaco, our domestic trust business in Malaysia and a branch of our UK business in Ireland. |
| • | Our compliance and risk framework was strengthened by the establishment of a GPB Global Standards Committee and a revised risk appetite framework. The implementation of ongoing workstreams including tax transparency and cross-border marketing will be accelerated in 2013. |
| • | We enhanced our global front office systems with the roll out of Global Vision in Switzerland, Global Client Relationship Management in the US and Global Private Wealth Solutions in the Channel Islands, which provide integrated databases to support effective client management. We will continue to roll these systems out to other locations during 2013. |
Developing closer collaboration across the Group
| • | We leveraged existing relationships across the Group in order to access wealth created by entrepreneurs who already bank with HSBC on the business side. Referral flows from other global businesses generated net new money of US$5.4bn. To further support referrals with CMB, a collaboration framework was put in place, dedicated executives appointed and referral targets agreed. |
| • | We worked with RBWM to define and promote a Group-wide wealth offering. GPB and RBWM now operate a systematic process for the review and referral of clients to ensure they receive the service most appropriate to their needs. |
73
Table of Contents
HSBC HOLDINGS PLC
Report of the Directors: Operating and Financial Review(continued)
| • | The Global Priority Clients initiative was launched with GB&M and CMB to service jointly the Group’s largest ultra-high net worth clients with corporate and personal needs through a dedicated single point of contact. The framework has been defined, clients identified for joint coverage and investment specialists assigned, and we have begun to roll out a new credit advisory model to fund credit transactions. |
Capturing growth in faster-growing and domestic markets
| • | We continued to focus on faster-growing markets, and attracted positive net new money of US$1.9bn and US$0.5bn from clients in Asia and the Middle East, respectively. |
| • | Our product range was further developed during 2012; in particular, we made progress in strengthening our Alternatives platform, with four new real estate ‘club deals’ and two private equity launches in the year raising more than US$1.3bn. Further launches are expected in 2013. |
‘Other’ contains the results of certain property transactions, unallocated investment activities, centrally held investment companies, movements in fair value of own debt, central support and functional costs with associated recoveries, HSBC’s holding company and financing operations.
| 2012 US$m | 2011 US$m | 2010 US$m | ||||||||||||||
Net interest expense | (730 | ) | (911 | ) | (998 | ) | ||||||||||
Net fee income | 194 | 34 | 32 | |||||||||||||
Net trading expense | (537 | ) | (355 | ) | (311 | ) | ||||||||||
Change in credit spread on long-term debt | (4,327 | ) | 4,161 | (258 | ) | |||||||||||
Other changes in fair value | (1,136 | ) | 78 | 42 | ||||||||||||
Net income/(expense) from financial instruments designated at fair value | (5,463 | ) | 4,239 | (216 | ) | |||||||||||
Other income | 8,868 | 6,138 | 6,153 | |||||||||||||
Net operating income21 | 2,332 | 9,145 | 4,660 | |||||||||||||
LIC recoveries76 | – | – | 3 | |||||||||||||
Net operating income | 2,332 | 9,145 | 4,663 | |||||||||||||
Total operating expenses | (9,369 | ) | (7,492 | ) | (5,918 | ) | ||||||||||
Operating profit/(loss) | (7,037 | ) | 1,653 | (1,255 | ) | |||||||||||
Income from associates77 | 47 | 9 | 94 | |||||||||||||
Profit/(loss) before tax | (6,990 | ) | 1,662 | (1,161 | ) | |||||||||||
For footnotes, see page 120.
The commentary is on a constant currency basis unless stated otherwise.
74
Table of Contents
HSBC HOLDINGS PLC
Report of the Directors: Operating and Financial Review(continued)
Notes
| • | The reported loss before tax of US$7.0bn in 2012 compared with reported profit before tax of US$1.7bn in 2011. On a constant currency basis, pre-tax loss increased by US$8.7bn. |
| • | These results included adverse movements of US$5.2bn on the fair value of our own debt attributable to a tightening of our own credit spreads in 2012, notably in Europe and North America, compared with favourable movements of US$3.9bn in 2011. Reported results also included a number of gains and losses on disposal (see page 27). These included a gain of US$3.0bn on the disposal of our associate, Ping An. Our remaining shareholding has been classified as a financial investment (see Note 26 on the Financial Statements). In addition, we reported a gain on disposal of US$130m from the sale of our shareholding in a property company in the Philippines. Reported profits in 2011 included accounting gains of US$181m relating to the dilution of our shareholding in Ping An, partly offset by a remeasurement loss of US$48m relating to Ping An’s consolidation of Ping An Bank (formerly known as Shenzhen Development Bank). |
| • | On an underlying basis, excluding the items noted above, the pre-tax loss increased by US$2.5bn, driven by higher operating expenses, notably the charge of US$1.9bn relating to US fines and penalties paid as part of the settlement of investigations into past inadequate compliance with anti-money laundering and sanctions laws. In addition, revenues declined due to adverse fair value movements of US$553m on the contingent forward sale contract relating to Ping An. |
| • | Net fee income increased by US$166m, due in part to fees received under the transition services agreement entered into following the sale of the Card and Retail Services business in North America. |
| • | Net trading expenseincreased from US$353m to US$537m, driven by adverse fair value movements on the contingent forward sale contract relating to Ping An. This was partly offset by lower adverse fair value movements on non-qualifying hedges in 2012. This was driven by non-qualifying hedges in HSBC Holdings, mainly related to cross-currency swaps used to |
economically hedge fixed rate long-term debt, on which there were favourable movements of US$122m in 2012 compared with adverse fair value movements of US$276m in 2011.
| • | Gains less losses from financial investmentsincluded gains of US$314m on the sale of our non-strategic investments in four Indian banks. |
| • | Excluding the movements in the fair value of our own debt,Net expense from financial instruments designated at fair value of US$248m compared with net income of US$293m in 2011. This was due to adverse fair value movements in 2012 from interest and exchange rate ineffectiveness in the hedging of long-term debt designated at fair value, issued principally by HSBC Holdings and its European and North American subsidiaries, compared with favourable fair value movements in 2011. |
| • | We reported a gain of US$3.0bn on the disposal of our associate, Ping An. Our remaining shareholding has been classified as a financial investment. |
| • | Other operating incomedecreased by 9%, due to lower intra-group recharges from centralised operational activities due to divestments and on-going cost savings, notably in North America. This was partly offset by a gain of US$130m from the sale of our shareholding in a property company in the Philippines. |
| • | Operating expensesincreased by 27% to US$9.4bn, primarily due to fines and penalties paid as part of the settlement of investigations into past inadequate compliance with anti-money laundering and sanctions laws of US$1.9bn, of which US$1.5bn was attributed to and paid by HNAH and its subsidiaries and US$375m was paid by HSBC Holdings. In addition, there were inflationary pressures in certain of our Latin American and Asian markets. However, the charge relating to the UK bank levy declined as the current year charge of US$571m was partly offset by an adjustment of US$99m in the 2011 bank levy charge of US$570m as the basis of calculation was clarified. Costs related to operational activities also fell due to divestments and on-going cost savings, notably in North America. These costs are recorded in ‘Other’ and charged to global businesses through a recharge mechanism, with income reported in ‘Other operating income’. |
75
Table of Contents
HSBC HOLDINGS PLC
Report of the Directors: Operating and Financial Review(continued)
Reconciliation of reported to constant currency and underlying profit/(loss) before tax
Retail Banking and Wealth Management
2012 compared with 2011
| 2011 as reported US$m | Currency translation adjustment24 US$m | 2011 at 2012 exchange rates US$m | 2012 as reported US$m | Reported change25 % | Constant change25 % | |||||||||||||||||||||||||||||
Net interest income | 24,101 | (702 | ) | 23,399 | 20,298 | (16 | ) | (13 | ) | |||||||||||||||||||||||||
Net fee income | 8,226 | (187 | ) | 8,039 | 7,205 | (12 | ) | (10 | ) | |||||||||||||||||||||||||
Gains on disposal of US branch network and cards business | – | – | – | 3,735 | ||||||||||||||||||||||||||||||
Other income27 | 1,206 | (100 | ) | 1,106 | 2,623 | 117 | 137 | |||||||||||||||||||||||||||
Net operating income21 | 33,533 | (989 | ) | 32,544 | 33,861 | 1 | 4 | |||||||||||||||||||||||||||
Loan impairment charges and other credit risk provisions | (9,319 | ) | 181 | (9,138 | ) | (5,515 | ) | 41 | 40 | |||||||||||||||||||||||||
Net operating income | 24,214 | (808 | ) | 23,406 | 28,346 | 17 | 21 | |||||||||||||||||||||||||||
Operating expenses | (21,202 | ) | 712 | (20,490 | ) | (19,769 | ) | 7 | 4 | |||||||||||||||||||||||||
Operating profit | 3,012 | (96 | ) | 2,916 | 8,577 | 185 | 194 | |||||||||||||||||||||||||||
Income from associates | 1,258 | 25 | 1,283 | 998 | (21 | ) | (22 | ) | ||||||||||||||||||||||||||
Profit before tax | 4,270 | (71 | ) | 4,199 | 9,575 | 124 | 128 | |||||||||||||||||||||||||||
For footnotes, see page 120.
75a
Table of Contents
HSBC HOLDINGS PLC
Report of the Directors: Operating and Financial Review(continued)
Reconciliation of reported and underlying29 items
| Year ended 31 December | ||||||||||||||||
| 2012 US$m | 2011 US$m | Change % | ||||||||||||||
Revenue21 | ||||||||||||||||
Reported revenue | 33,861 | 33,533 | 1 | |||||||||||||
Currency translation adjustment24 | (989 | ) | ||||||||||||||
Acquisitions, disposals and dilutions | (6,164 | ) | (6,427 | ) | ||||||||||||
Underlying revenue | 27,697 | 26,117 | 6 | |||||||||||||
Loan impairment charges and other credit risk provisions (‘LIC’s) | ||||||||||||||||
Reported LICs | (5,515 | ) | (9,319 | ) | 41 | |||||||||||
Currency translation adjustment24 | 181 | |||||||||||||||
Acquisitions, disposals and dilutions | 339 | 1,616 | ||||||||||||||
Underlying LICs | (5,176 | ) | (7,522 | ) | 31 | |||||||||||
Operating expenses | ||||||||||||||||
Reported operating expenses | (19,769 | ) | (21,202 | ) | 7 | |||||||||||
Currency translation adjustment24 | 712 | |||||||||||||||
Acquisitions, disposals and dilutions | 873 | 2,429 | ||||||||||||||
Underlying operating expenses | (18,896 | ) | (18,061 | ) | (5 | ) | ||||||||||
Underlying cost efficiency ratio | 68.2% | 69.2% | ||||||||||||||
Profit before tax | ||||||||||||||||
Reported profit before tax | 9,575 | 4,270 | 124 | |||||||||||||
Currency translation adjustment24 | (71 | ) | ||||||||||||||
Acquisitions, disposals and dilutions | (5,574 | ) | (3,328 | ) | ||||||||||||
Underlying profit before tax | 4,001 | 871 | 359 | |||||||||||||
For footnotes, see page 120.
Retail Banking and Wealth Management – HSBC Finance
Reconciliation of reported and underlying29 items | ||||||||||||||||
| Year ended 31 December | ||||||||||||||||
2012 US$m | 2011 US$m | Change % | ||||||||||||||
Revenue21 | ||||||||||||||||
Reported revenue | 7,251 | 7,216 | – | |||||||||||||
Acquisitions, disposals and dilutions | (4,830 | ) | (5,462 | ) | ||||||||||||
Underlying revenue | 2,421 | 1,754 | 38 | |||||||||||||
Profit/(loss) before tax | ||||||||||||||||
Reported profit/(loss) before tax | 2,443 | (2,405 | ) | |||||||||||||
Acquisitions, disposals and dilutions | (3,916 | ) | (2,061 | ) | ||||||||||||
Underlying loss before tax | (1,473 | ) | (4,466 | ) | (67 | ) | ||||||||||
For footnotes, see page 120.
75b
Table of Contents
HSBC HOLDINGS PLC
Report of the Directors: Operating and Financial Review(continued)
Commercial Banking
2012 compared with 2011
| 2011 as reported US$m | Currency translation adjustment24 US$m | 2011 at 2012 exchange rates US$m | 2012 as reported US$m | Reported change25 % | Constant change25 % | |||||||||||||||||||||||||||||
Net interest income | 9,931 | (381 | ) | 9,550 | 10,361 | 4 | 8 | |||||||||||||||||||||||||||
Net fee income | 4,291 | (132 | ) | 4,159 | 4,470 | 4 | 7 | |||||||||||||||||||||||||||
Gains on disposal of US branch network | – | – | – | 277 | ||||||||||||||||||||||||||||||
Other income27 | 1,389 | (58 | ) | 1,331 | 1,443 | 4 | 8 | |||||||||||||||||||||||||||
Net operating income21 | 15,611 | (571 | ) | 15,040 | 16,551 | 6 | 10 | |||||||||||||||||||||||||||
Loan impairment charges and other credit risk provisions | (1,738 | ) | 81 | (1,657 | ) | (2,099 | ) | (21 | ) | (27 | ) | |||||||||||||||||||||||
Net operating income | 13,873 | (490 | ) | 13,383 | 14,452 | 4 | 8 | |||||||||||||||||||||||||||
Operating expenses | (7,221 | ) | 288 | (6,933 | ) | (7,598 | ) | (5 | ) | (10 | ) | |||||||||||||||||||||||
Operating profit | 6,652 | (202 | ) | 6,450 | 6,854 | 3 | 6 | |||||||||||||||||||||||||||
Income from associates | 1,295 | 22 | 1,317 | 1,681 | 30 | 28 | ||||||||||||||||||||||||||||
Profit before tax | 7,947 | (180 | ) | 7,767 | 8,535 | 7 | 10 | |||||||||||||||||||||||||||
For footnotes, see page 120.
Reconciliation of reported and underlying29 items
| Year ended 31 December | ||||||||||||||||
2012 US$m | 2011 US$m | Change % | ||||||||||||||
Revenue21 | ||||||||||||||||
Reported revenue | 16,551 | 15,611 | 6 | |||||||||||||
Currency translation adjustment24 | (571 | ) | ||||||||||||||
Acquisitions, disposals and dilutions | (605 | ) | (232 | ) | ||||||||||||
Underlying revenue | 15,946 | 14,808 | 8 | |||||||||||||
Loan impairment charges and other credit risk provisions (‘LIC’s) | ||||||||||||||||
Reported LICs | (2,099 | ) | (1,738 | ) | (21 | ) | ||||||||||
Currency translation adjustment24 | 81 | |||||||||||||||
Acquisitions, disposals and dilutions | (1 | ) | 3 | |||||||||||||
Underlying LICs | (2,100 | ) | (1,654 | ) | (27 | ) | ||||||||||
Operating expenses | ||||||||||||||||
Reported operating expenses | (7,598 | ) | (7,221 | ) | (5 | ) | ||||||||||
Currency translation adjustment24 | 288 | |||||||||||||||
Acquisitions, disposals and dilutions | 100 | 162 | ||||||||||||||
Underlying operating expenses | (7,498 | ) | (6,771 | ) | (11 | ) | ||||||||||
Underlying cost efficiency ratio | 47.0% | 45.7% | ||||||||||||||
Profit before tax | ||||||||||||||||
Reported profit before tax | 8,535 | 7,947 | 7 | |||||||||||||
Currency translation adjustment24 | (180 | ) | ||||||||||||||
Acquisitions, disposals and dilutions | (594 | ) | (76 | ) | ||||||||||||
Underlying profit before tax | 7,941 | 7,691 | 3 | |||||||||||||
For footnotes, see page 120.
75c
Table of Contents
HSBC HOLDINGS PLC
Report of the Directors: Operating and Financial Review(continued)
Global Banking and Markets
2012 compared with 2011
| 2011 as reported US$m | Currency translation adjustment24 US$m | 2011 at 2012 exchange rates US$m | 2012 as reported US$m | Reported change25 % | Constant change25 % | |||||||||||||||||||||||||||||
Net interest income | 7,263 | (197 | ) | 7,066 | 6,960 | (4 | ) | (2 | ) | |||||||||||||||||||||||||
Net fee income | 3,227 | (92 | ) | 3,135 | 3,329 | 3 | 6 | |||||||||||||||||||||||||||
Net trading income | 5,204 | (116 | ) | 5,088 | 5,690 | 9 | 12 | |||||||||||||||||||||||||||
Other income27 | 1,363 | (26 | ) | 1,337 | 2,294 | 68 | 72 | |||||||||||||||||||||||||||
Net operating income21 | 17,057 | (431 | ) | 16,626 | 18,273 | 7 | 10 | |||||||||||||||||||||||||||
Loan impairment charges and other credit risk provisions | (984 | ) | 14 | (970 | ) | (670 | ) | 32 | 31 | |||||||||||||||||||||||||
Net operating income | 16,073 | (417 | ) | 15,656 | 17,603 | 10 | 12 | |||||||||||||||||||||||||||
Operating expenses | (9,722 | ) | 208 | (9,514 | ) | (9,907 | ) | (2 | ) | (4 | ) | |||||||||||||||||||||||
Operating profit | 6,351 | (209 | ) | 6,142 | 7,696 | 21 | 25 | |||||||||||||||||||||||||||
Income from associates | 698 | 9 | 707 | 824 | 18 | 17 | ||||||||||||||||||||||||||||
Profit before tax | 7,049 | (200 | ) | 6,849 | 8,520 | 21 | 24 | |||||||||||||||||||||||||||
For footnotes, see page 120.
Reconciliation of reported and constant currency management view of total operating income of Global Banking and Markets
|
| |||||||||||||||||||||||||||||||||
| 2011 as reported US$m | Currency translation adjustment24 US$m | 2011 at 2012 exchange rates US$m | 2012 as reported US$m | Reported change25 % | Constant change25 % | |||||||||||||||||||||||||||||
Global Markets79 | 8,098 | (206 | ) | 7,892 | 8,733 | 8 | 11 | |||||||||||||||||||||||||||
Credit | 335 | (9 | ) | 326 | 779 | 133 | 139 | |||||||||||||||||||||||||||
Rates | 1,341 | (14 | ) | 1,327 | 1,771 | 32 | 33 | |||||||||||||||||||||||||||
Foreign Exchange | 3,272 | (77 | ) | 3,195 | 3,215 | (2 | ) | 1 | ||||||||||||||||||||||||||
Equities | 961 | (36 | ) | 925 | 679 | (29 | ) | (27 | ) | |||||||||||||||||||||||||
Securities Services | 1,673 | (43 | ) | 1,630 | 1,663 | (1 | ) | 2 | ||||||||||||||||||||||||||
Asset and Structured Finance | 516 | (27 | ) | 489 | 626 | 21 | 28 | |||||||||||||||||||||||||||
Global Banking | 5,401 | (132 | ) | 5,269 | 5,568 | 3 | 6 | |||||||||||||||||||||||||||
Financing and Equity Capital Markets | 3,233 | (87 | ) | 3,146 | 3,071 | (5 | ) | (2 | ) | |||||||||||||||||||||||||
Payments and Cash Management80 | 1,534 | (19 | ) | 1,515 | 1,744 | 14 | 15 | |||||||||||||||||||||||||||
Other transaction services81 | 634 | (26 | ) | 608 | 753 | 19 | 24 | |||||||||||||||||||||||||||
Balance Sheet Management82 | 3,488 | (74 | ) | 3,414 | 3,738 | 7 | 9 | |||||||||||||||||||||||||||
Principal Investments | 209 | (8 | ) | 201 | 125 | (40 | ) | (38 | ) | |||||||||||||||||||||||||
Debit valuation adjustment | – | – | – | 518 | – | – | ||||||||||||||||||||||||||||
Other83 | (139 | ) | (11 | ) | (150 | ) | (409 | ) | (194 | ) | (173 | ) | ||||||||||||||||||||||
Total operating income | 17,057 | (431 | ) | 16,626 | 18,273 | 7 | 10 | |||||||||||||||||||||||||||
For footnotes, see page 120.
75d
Table of Contents
HSBC HOLDINGS PLC
Report of the Directors: Operating and Financial Review(continued)
Reconciliation of reported and underlying29 items
| Year ended 31 December | ||||||||||||||||
| 2012 US$m | 2011 US$m | Change % | ||||||||||||||
Revenue21 | ||||||||||||||||
Reported revenue | 18,273 | 17,057 | 7 | |||||||||||||
Currency translation adjustment24 | (431 | ) | ||||||||||||||
Acquisitions, disposals and dilutions | (107 | ) | (81 | ) | ||||||||||||
Underlying revenue | 18,166 | 16,545 | 10 | |||||||||||||
Loan impairment charges and other credit risk provisions (‘LIC’s) | ||||||||||||||||
Reported LICs | (670 | ) | (984 | ) | 32 | |||||||||||
Currency translation adjustment24 | 14 | |||||||||||||||
Acquisitions, disposals and dilutions | – | – | ||||||||||||||
Underlying LICs | (670 | ) | (970 | ) | 31 | |||||||||||
Operating expenses | ||||||||||||||||
Reported operating expenses | (9,907 | ) | (9,722 | ) | (2 | ) | ||||||||||
Currency translation adjustment24 | 208 | |||||||||||||||
Acquisitions, disposals and dilutions | 21 | 34 | ||||||||||||||
Underlying operating expenses | (9,886 | ) | (9,480 | ) | (4 | ) | ||||||||||
Underlying cost efficiency ratio | 54.4% | 57.3% | ||||||||||||||
Profit before tax | ||||||||||||||||
Reported profit before tax | 8,520 | 7,049 | 21 | |||||||||||||
Currency translation adjustment24 | (200 | ) | ||||||||||||||
Acquisitions, disposals and dilutions | (149 | ) | (114 | ) | ||||||||||||
Underlying profit before tax | 8,371 | 6,735 | 24 | |||||||||||||
For footnotes, see page 120.
75e
Table of Contents
HSBC HOLDINGS PLC
Report of the Directors: Operating and Financial Review(continued)
Balance sheet data significant to Global Banking and Markets
| Europe | Hong Kong | Rest of Asia- Pacific | MENA | North America | Latin America | Total | ||||||||||||||||||||||
| US$m | US$m | US$m | US$m | US$m | US$m | US$m | ||||||||||||||||||||||
At 31 December 2012 | ||||||||||||||||||||||||||||
Trading assets98 | 242,175 | 31,614 | 22,804 | 530 | 95,347 | 9,506 | 401,976 | |||||||||||||||||||||
Derivative assets99 | 287,427 | 28,531 | 22,700 | 1,417 | 80,096 | 5,117 | 425,288 | |||||||||||||||||||||
Trading liabilities | 176,838 | 9,345 | 4,470 | 1,081 | 94,943 | 5,950 | 292,627 | |||||||||||||||||||||
Derivative liabilities99 | 292,711 | 27,720 | 22,900 | 1,430 | 79,437 | 4,899 | 429,097 | |||||||||||||||||||||
At 31 December 2011 | ||||||||||||||||||||||||||||
Trading assets98 | 180,790 | 38,637 | 19,167 | 938 | 69,568 | 14,370 | 323,470 | |||||||||||||||||||||
Derivative assets99 | 272,756 | 25,203 | 23,056 | 1,275 | 86,619 | 4,825 | 413,734 | |||||||||||||||||||||
Trading liabilities | 157,934 | 8,282 | 3,781 | 757 | 70,288 | 5,014 | 246,056 | |||||||||||||||||||||
Derivative liabilities99 | 274,803 | 25,186 | 23,877 | 1,245 | 86,697 | 4,469 | 416,277 | |||||||||||||||||||||
At 31 December 2010 | ||||||||||||||||||||||||||||
Trading assets98 | 232,918 | 32,023 | 18,256 | 958 | 87,120 | 6,459 | 377,734 | |||||||||||||||||||||
Derivative assets99 | 199,654 | 21,644 | 17,135 | 832 | 65,153 | 3,955 | 308,373 | |||||||||||||||||||||
Trading liabilities | 178,861 | 8,650 | 3,846 | 122 | 91,980 | 2,702 | 286,161 | |||||||||||||||||||||
Derivative liabilities99 | 199,751 | 22,622 | 17,121 | 845 | 66,323 | 3,913 | 310,575 | |||||||||||||||||||||
For footnotes, see page 120.
75f
Table of Contents
HSBC HOLDINGS PLC
Report of the Directors: Operating and Financial Review(continued)
Global Private Banking
2012 compared with 2011
|
| 2011 as reported US$m |
|
| Currency translation adjustment24 US$m |
|
| 2011 at 2012 exchange rates US$m |
|
| 2012 as reported US$m |
|
| Reported change25 % |
|
| Constant currency change25 % |
| |||||||||||||||||
Net interest income | 1,439 | (12 | ) | 1,427 | 1,294 | (10 | ) | (9 | ) | |||||||||||||||||||||||||
Net fee income | 1,382 | (19 | ) | 1,363 | 1,232 | (11 | ) | (10 | ) | |||||||||||||||||||||||||
Other income27 | 471 | (4 | ) | 467 | 646 | 37 | 38 | |||||||||||||||||||||||||||
Net operating income21 | 3,292 | (35 | ) | 3,257 | 3,172 | (4 | ) | (3 | ) | |||||||||||||||||||||||||
Loan impairment charges and other credit risk provisions | (86 | ) | 1 | (85 | ) | (27 | ) | 69 | 68 | |||||||||||||||||||||||||
Net operating income | 3,206 | (34 | ) | 3,172 | 3,145 | (2 | ) | (1 | ) | |||||||||||||||||||||||||
Operating expenses | (2,266 | ) | 26 | (2,240 | ) | (2,143 | ) | 5 | 4 | |||||||||||||||||||||||||
Operating profit | 940 | (8 | ) | 932 | 1,002 | 7 | 8 | |||||||||||||||||||||||||||
Income from associates | 4 | – | 4 | 7 | 75 | 75 | ||||||||||||||||||||||||||||
Profit before tax | 944 | (8 | ) | 936 | 1,009 | 7 | 8 | |||||||||||||||||||||||||||
For footnotes, see page 120.
Reconciliation of reported and underlying29 items
| Year ended 31 December | ||||||||||||||||
2012 US$m | 2011 US$m | Change % | ||||||||||||||
Revenue21 | ||||||||||||||||
Reported revenue | 3,172 | 3,292 | (4 | ) | ||||||||||||
Currency translation adjustment24 | – | (35 | ) | |||||||||||||
Acquisitions, disposals and dilutions | (65 | ) | (28 | ) | ||||||||||||
Underlying revenue | 3,107 | 3,229 | (4 | ) | ||||||||||||
Loan impairment charges and other credit risk provisions (‘LIC’s) | ||||||||||||||||
Reported LICs | (27 | ) | (86 | ) | 69 | |||||||||||
Currency translation adjustment24 | 1 | |||||||||||||||
Acquisitions, disposals and dilutions | – | – | ||||||||||||||
Underlying LICs | (27 | ) | (85 | ) | 68 | |||||||||||
Operating expenses | ||||||||||||||||
Reported operating expenses | (2,143 | ) | (2,266 | ) | 5 | |||||||||||
Currency translation adjustment24 | 26 | |||||||||||||||
Acquisitions, disposals and dilutions | 10 | 37 | ||||||||||||||
Underlying operating expenses | (2,133 | ) | (2,203 | ) | 3 | |||||||||||
Underlying cost efficiency ratio | 68.7% | 68.2% | ||||||||||||||
Profit before tax | ||||||||||||||||
Reported profit before tax | 1,009 | 944 | 7 | |||||||||||||
Currency translation adjustment24 | (8 | ) | ||||||||||||||
Acquisitions, disposals and dilutions | (55 | ) | 9 | |||||||||||||
Underlying profit before tax | 954 | 945 | 1 | |||||||||||||
For footnotes, see page 120.
75g
Table of Contents
HSBC HOLDINGS PLC
Report of the Directors: Operating and Financial Review(continued)
Other
2012 compared with 2011
| 2011 as reported US$m | Currency translation adjustment24 US$m | 2011 at exchange rates US$m | 2012 as reported US$m | Reported change25 % | Constant change25 % | |||||||||||||||||||||||||||||
Net interest income | (911 | ) | 35 | (876 | ) | (730 | ) | 20 | 17 | |||||||||||||||||||||||||
Net fee income | 34 | (6 | ) | 28 | 194 | 471 | 593 | |||||||||||||||||||||||||||
Own credit spread26 | 3,933 | (35 | ) | 3,898 | (5,215 | ) | ||||||||||||||||||||||||||||
Gains on disposal of Ping An | – | – | – | 3,012 | ||||||||||||||||||||||||||||||
Other income27 | 6,089 | (119 | ) | 5,970 | 5,071 | (17 | ) | (15 | ) | |||||||||||||||||||||||||
Net operating income21 | 9,145 | (125 | ) | 9,020 | 2,332 | (74 | ) | (74 | ) | |||||||||||||||||||||||||
Loan impairment charges and other credit risk provisions | – | – | – | – | ||||||||||||||||||||||||||||||
Net operating income | 9,145 | (125 | ) | 9,020 | 2,332 | (74 | ) | (74 | ) | |||||||||||||||||||||||||
Operating expenses | (7,492 | ) | 122 | (7,370 | ) | (9,369 | ) | (25 | ) | (27 | ) | |||||||||||||||||||||||
Operating profit/(loss) | 1,653 | (3 | ) | 1,650 | (7,037 | ) | ||||||||||||||||||||||||||||
Income from associates | 9 | (1 | ) | 8 | 47 | 422 | 488 | |||||||||||||||||||||||||||
Profit/(loss) before tax | 1,662 | (4 | ) | 1,658 | (6,990 | ) | ||||||||||||||||||||||||||||
For footnotes, see page 120.
Reconciliation of reported and underlying29 items
| Year ended 31 December | ||||||||||||||||
| 2012 US$m | 2011 US$m | Change % | ||||||||||||||
Revenue21 | ||||||||||||||||
Reported revenue | 2,332 | 9,145 | (74 | ) | ||||||||||||
Currency translation adjustment24 | (90 | ) | ||||||||||||||
Own credit spread26 | 5,215 | (3,933 | ) | |||||||||||||
Acquisitions, disposals and dilutions | (3,107 | ) | (208 | ) | ||||||||||||
Underlying revenue | 4,440 | 4,914 | (10 | ) | ||||||||||||
Operating expenses | ||||||||||||||||
Reported operating expenses | (9,369 | ) | (7,492 | ) | (25 | ) | ||||||||||
Currency translation adjustment24 | 122 | |||||||||||||||
Acquisitions, disposals and dilutions | – | 4 | ||||||||||||||
Underlying operating expenses | (9,369 | ) | (7,366 | ) | (27 | ) | ||||||||||
Underlying cost efficiency ratio | 211.0% | 149.9% | ||||||||||||||
Profit/(loss) before tax | ||||||||||||||||
Reported profit/(loss) before tax | (6,990 | ) | 1,662 | |||||||||||||
Currency translation adjustment24 | 31 | |||||||||||||||
Own credit spread26 | 5,215 | (3,933 | ) | |||||||||||||
Acquisitions, disposals and dilutions | (3,107 | ) | (141 | ) | ||||||||||||
Underlying loss before tax | (4,882 | ) | (2,381 | ) | (105 | ) | ||||||||||
For footnotes, see page 120.
75h
Table of Contents
HSBC HOLDINGS PLC
Report of the Directors: Operating and Financial Review(continued)
Reconciliation of reported to underlying profit/(loss) before tax
2011 compared with 2010
Retail Banking and Wealth Management31
| 2010 as reported US$m | 2010 ments32 US$m | Currency translation adjustment24 US$m | 2010 rates33 US$m | 2011 as reported US$m | 2011 ments32 US$m | 2011 under- lying US$m | Re- change25 % | Under- change25 % | ||||||||||||||||||||||||||||||||||||||||||||
Net interest income | 24,166 | – | 424 | 24,590 | 24,101 | – | 24,101 | – | (2 | ) | ||||||||||||||||||||||||||||||||||||||||||
Net fee income | 8,397 | (2 | ) | 154 | 8,549 | 8,226 | – | 8,226 | (2 | ) | (4 | ) | ||||||||||||||||||||||||||||||||||||||||
Other income27 | 1,048 | (3 | ) | 36 | 1,081 | 1,206 | (83 | ) | 1,123 | 15 | 4 | |||||||||||||||||||||||||||||||||||||||||
Net operating income21 | 33,611 | (5 | ) | 614 | 34,220 | 33,533 | (83 | ) | 33,450 | – | (2 | ) | ||||||||||||||||||||||||||||||||||||||||
Loan impairment charges and other credit risk provisions | (11,259 | ) | – | (113 | ) | (11,372 | ) | (9,319 | ) | – | (9,319 | ) | 17 | 18 | ||||||||||||||||||||||||||||||||||||||
Net operating income | 22,352 | (5 | ) | 501 | 22,848 | 24,214 | (83 | ) | 24,131 | 8 | 6 | |||||||||||||||||||||||||||||||||||||||||
Operating expenses | (19,539 | ) | 2 | (421 | ) | (19,958 | ) | (21,202 | ) | – | (21,202 | ) | (9 | ) | (6 | ) | ||||||||||||||||||||||||||||||||||||
Operating profit | 2,813 | (3 | ) | 80 | 2,890 | 3,012 | (83 | ) | 2,929 | 7 | 1 | |||||||||||||||||||||||||||||||||||||||||
Income from associates | 1,026 | – | 46 | 1,072 | 1,258 | – | 1,258 | 23 | 17 | |||||||||||||||||||||||||||||||||||||||||||
Profit before tax | 3,839 | (3 | ) | 126 | 3,962 | 4,270 | (83 | ) | 4,187 | 11 | 6 | |||||||||||||||||||||||||||||||||||||||||
For footnotes, see page 120.
Commercial Banking31
| 2010 as reported US$m | 2010 ments32 US$m | Currency translation adjustment24 US$m | 2010 at rates33 US$m | 2011 as reported US$m | 2011 ments32 US$m | 2011 under- lying US$m | Re- change25 % | Under- lying change25 % | ||||||||||||||||||||||||||||||||||||||||||||
Net interest income | 8,487 | (1 | ) | 194 | 8,680 | 9,931 | – | 9,931 | 17 | 14 | ||||||||||||||||||||||||||||||||||||||||||
Net fee income | 3,964 | (37 | ) | 99 | 4,026 | 4,291 | – | 4,291 | 8 | 7 | ||||||||||||||||||||||||||||||||||||||||||
Other income27 | 1,383 | (119 | ) | 19 | 1,283 | 1,389 | – | 1,389 | 1 | 8 | ||||||||||||||||||||||||||||||||||||||||||
Net operating income21 | 13,834 | (157 | ) | 312 | 13,989 | 15,611 | – | 15,611 | 13 | 12 | ||||||||||||||||||||||||||||||||||||||||||
Loan impairment charges and other credit risk provisions | (1,805 | ) | – | (49 | ) | (1,854 | ) | (1,738 | ) | – | (1,738 | ) | 4 | 6 | ||||||||||||||||||||||||||||||||||||||
Net operating income | 12,029 | (157 | ) | 263 | 12,135 | 13,873 | – | 13,873 | 15 | 14 | ||||||||||||||||||||||||||||||||||||||||||
Operating expenses | (6,831 | ) | 38 | (165 | ) | (6,958 | ) | (7,221 | ) | – | (7,221 | ) | (6 | ) | (4 | ) | ||||||||||||||||||||||||||||||||||||
Operating profit | 5,198 | (119 | ) | 98 | 5,177 | 6,652 | – | 6,652 | 28 | 29 | ||||||||||||||||||||||||||||||||||||||||||
Income from associates | 892 | – | 28 | 920 | 1,295 | – | 1,295 | 45 | 41 | |||||||||||||||||||||||||||||||||||||||||||
Profit before tax | 6,090 | (119 | ) | 126 | 6,097 | 7,947 | – | 7,947 | 31 | 30 | ||||||||||||||||||||||||||||||||||||||||||
For footnotes, see page 120.
75i
Table of Contents
HSBC HOLDINGS PLC
Report of the Directors: Operating and Financial Review(continued)
Global Banking and Markets31
2010 as | 2010 ments32 US$m | Currency translation adjustment24 US$m | 2010 at 2011 rates33 US$m | 2011 as | 2011 ments32 US$m | 2011 under- lying US$m | Re- change25 % | Under- change25 % | ||||||||||||||||||||||||||||||||||||||||||||
Net interest income | 7,343 | 49 | 176 | 7,568 | 7,263 | – | 7,263 | (1 | ) | (4 | ) | |||||||||||||||||||||||||||||||||||||||||
Net fee income | 3,664 | (16 | ) | 82 | 3,730 | 3,227 | – | 3,227 | (12 | ) | (13 | ) | ||||||||||||||||||||||||||||||||||||||||
Net trading income | 5,830 | 243 | 179 | 6,252 | 5,204 | – | 5,204 | (11 | ) | (17 | ) | |||||||||||||||||||||||||||||||||||||||||
Other income27 | 2,075 | (718 | ) | 54 | 1,411 | 1,363 | – | 1,363 | (34 | ) | (3 | ) | ||||||||||||||||||||||||||||||||||||||||
Net operating income21 | 18,912 | (442 | ) | 491 | 18,961 | 17,057 | – | 17,057 | (10 | ) | (10 | ) | ||||||||||||||||||||||||||||||||||||||||
Loan impairment charges and other credit risk provisions | (990 | ) | – | (41 | ) | (1,031 | ) | (984 | ) | – | (984 | ) | 1 | 5 | ||||||||||||||||||||||||||||||||||||||
Net operating income | 17,922 | (442 | ) | 450 | 17,930 | 16,073 | – | 16,073 | (10 | ) | (10 | ) | ||||||||||||||||||||||||||||||||||||||||
Operating expenses | (9,228 | ) | 180 | (266 | ) | (9,314 | ) | (9,722 | ) | – | (9,722 | ) | (5 | ) | (4 | ) | ||||||||||||||||||||||||||||||||||||
Operating profit | 8,694 | (262 | ) | 184 | 8,616 | 6,351 | – | 6,351 | (27 | ) | (26 | ) | ||||||||||||||||||||||||||||||||||||||||
Income from associates | 521 | – | 14 | 535 | 698 | – | 698 | 34 | 30 | |||||||||||||||||||||||||||||||||||||||||||
Profit before tax | 9,215 | (262 | ) | 198 | 9,151 | 7,049 | – | 7,049 | (24 | ) | (23 | ) | ||||||||||||||||||||||||||||||||||||||||
For footnotes, see page 120.
Global Private Banking31
2010 as | 2010 ments32 US$m | Currency translation adjustment24 US$m | 2010 rates33 US$m | 2011 as | 2011 ments32 US$m | 2011 under- lying US$m | Re- change25 % | Under- lying change25 % | ||||||||||||||||||||||||||||||||||||||||||||
Net interest income | 1,345 | – | 13 | 1,358 | 1,439 | – | 1,439 | 7 | 6 | |||||||||||||||||||||||||||||||||||||||||||
Net fee income | 1,299 | – | 15 | 1,314 | 1,382 | – | 1,382 | 6 | 5 | |||||||||||||||||||||||||||||||||||||||||||
Other income27 | 449 | – | 2 | 451 | 471 | – | 471 | 5 | 4 | |||||||||||||||||||||||||||||||||||||||||||
Net operating income21 | 3,093 | – | 30 | 3,123 | 3,292 | – | 3,292 | 6 | 5 | |||||||||||||||||||||||||||||||||||||||||||
Loan impairment (charges)/recoveries and other credit risk provisions | 12 | – | (1 | ) | 11 | (86 | ) | – | (86 | ) | ||||||||||||||||||||||||||||||||||||||||||
Net operating income | 3,105 | – | 29 | 3,134 | 3,206 | – | 3,206 | 3 | 2 | |||||||||||||||||||||||||||||||||||||||||||
Operating expenses | (2,035 | ) | – | (23 | ) | (2,058 | ) | (2,266 | ) | – | (2,266 | ) | (11 | ) | (10 | ) | ||||||||||||||||||||||||||||||||||||
Operating profit | 1,070 | – | 6 | 1,076 | 940 | – | 940 | (12 | ) | (13 | ) | |||||||||||||||||||||||||||||||||||||||||
Income from associates | (16 | ) | – | – | (16 | ) | 4 | – | 4 | |||||||||||||||||||||||||||||||||||||||||||
Profit before tax | 1,054 | – | 6 | 1,060 | 944 | – | 944 | (10 | ) | (11 | ) | |||||||||||||||||||||||||||||||||||||||||
For footnotes, see page 120.
75j
Table of Contents
HSBC HOLDINGS PLC
Report of the Directors: Operating and Financial Review(continued)
Other31
2010 as | 2010 ments32 US$m | Currency translation adjustment24 US$m | 2010 at 2011 rates33 US$m | 2011 as | 2011 ments32 US$m | 2011 under- lying US$m | Re- change25 % | Under- change25 % | ||||||||||||||||||||||||||||||||||||||||||||
Net interest expense | (998 | ) | – | (41 | ) | (1,039 | ) | (911 | ) | – | (911 | ) | 9 | 12 | ||||||||||||||||||||||||||||||||||||||
Net fee income | 31 | – | (1 | ) | 30 | 34 | – | 34 | 10 | 13 | ||||||||||||||||||||||||||||||||||||||||||
Changes in fair value26 | (63 | ) | 63 | – | – | 3,933 | (3,933 | ) | – | |||||||||||||||||||||||||||||||||||||||||||
Other income27 | 5,690 | (250 | ) | 65 | 5,505 | 6,089 | (208 | ) | 5,881 | 7 | 7 | |||||||||||||||||||||||||||||||||||||||||
Net operating income21 | 4,660 | (187 | ) | 23 | 4,496 | 9,145 | (4,141 | ) | 5,004 | 96 | 11 | |||||||||||||||||||||||||||||||||||||||||
Loan impairment recoveries and other credit risk provisions | 3 | – | (2 | ) | 1 | – | – | – | ||||||||||||||||||||||||||||||||||||||||||||
Net operating income | 4,663 | (187 | ) | 21 | 4,497 | 9,145 | (4,141 | ) | 5,004 | 96 | 11 | |||||||||||||||||||||||||||||||||||||||||
Operating expenses | (5,918 | ) | – | (24 | ) | (5,942 | ) | (7,492 | ) | – | (7,492 | ) | (27 | ) | (26 | ) | ||||||||||||||||||||||||||||||||||||
Operating profit/(loss) | (1,255 | ) | (187 | ) | (3 | ) | (1,445 | ) | 1,653 | (4,141 | ) | (2,488 | ) | (72 | ) | |||||||||||||||||||||||||||||||||||||
Income from associates | 94 | – | 6 | 100 | 9 | 48 | 57 | (90 | ) | (43 | ) | |||||||||||||||||||||||||||||||||||||||||
Profit/(loss) before tax | (1,161 | ) | (187 | ) | 3 | (1,345 | ) | 1,662 | (4,093 | ) | (2,431 | ) | (81 | ) | ||||||||||||||||||||||||||||||||||||||
For footnotes, see page 120.
75k
Table of Contents
HSBC HOLDINGS PLC
Report of the Directors: Operating and Financial Review(continued)
HSBC profit/(loss) before tax and balance sheet data
| 2012 | ||||||||||||||||||||||||||||||||||||||||
| Retail Banking and Wealth Management US$m | Commercial Banking | Global Banking and Markets US$m | Global Private Banking US$m | Other73 US$m | Inter– elimination85 US$m | Total US$m | ||||||||||||||||||||||||||||||||||
Profit before tax | ||||||||||||||||||||||||||||||||||||||||
Net interest income/(expense) | 20,298 | 10,361 | 6,960 | 1,294 | (730 | ) | (511 | ) | 37,672 | |||||||||||||||||||||||||||||||
Net fee income | 7,205 | 4,470 | 3,329 | 1,232 | 194 | – | 16,430 | |||||||||||||||||||||||||||||||||
Trading income/(expense) excluding net interest income | 276 | 617 | 3,588 | 476 | (549 | ) | – | 4,408 | ||||||||||||||||||||||||||||||||
Net interest income on trading activities | 28 | 16 | 2,102 | 14 | 12 | 511 | 2,683 | |||||||||||||||||||||||||||||||||
Net trading income/(expense)78 | 304 | 633 | 5,690 | 490 | (537 | ) | 511 | 7,091 | ||||||||||||||||||||||||||||||||
Changes in fair value of long-term debt issued and related derivatives | – | – | – | – | (4,327 | ) | – | (4,327 | ) | |||||||||||||||||||||||||||||||
Net income/(expense) from other financial instruments designated at fair value | 1,893 | 250 | 1,094 | – | (1,136 | ) | – | 2,101 | ||||||||||||||||||||||||||||||||
Net income/(expense) from financial instruments designated at fair value | 1,893 | 250 | 1,094 | – | (5,463 | ) | – | (2,226 | ) | |||||||||||||||||||||||||||||||
Gains less losses from financial investments | 96 | 22 | 730 | (3 | ) | 344 | – | 1,189 | ||||||||||||||||||||||||||||||||
Dividend income | 24 | 18 | 148 | 6 | 25 | – | 221 | |||||||||||||||||||||||||||||||||
Net earned insurance premiums | 11,191 | 1,786 | 25 | 42 | – | – | 13,044 | |||||||||||||||||||||||||||||||||
Gains on disposal of US branch network, US cards business and Ping An | 3,735 | 277 | – | – | 3,012 | – | 7,024 | |||||||||||||||||||||||||||||||||
Other operating income | 1,472 | 536 | 313 | 151 | 5,487 | (5,859 | ) | 2,100 | ||||||||||||||||||||||||||||||||
Total operating income | 46,218 | 18,353 | 18,289 | 3,212 | 2,332 | (5,859 | ) | 82,545 | ||||||||||||||||||||||||||||||||
Net insurance claims86 | (12,357 | ) | (1,802 | ) | (16 | ) | (40 | ) | – | – | (14,215 | ) | ||||||||||||||||||||||||||||
Net operating income21 | 33,861 | 16,551 | 18,273 | 3,172 | 2,332 | (5,859 | ) | 68,330 | ||||||||||||||||||||||||||||||||
Loan impairment charges and other credit risk provisions | (5,515 | ) | (2,099 | ) | (670 | ) | (27 | ) | – | – | (8,311 | ) | ||||||||||||||||||||||||||||
Net operating income | 28,346 | 14,452 | 17,603 | 3,145 | 2,332 | (5,859 | ) | 60,019 | ||||||||||||||||||||||||||||||||
Employee expenses87 | (5,532 | ) | (2,247 | ) | (3,764 | ) | (915 | ) | (8,033 | ) | – | (20,491 | ) | |||||||||||||||||||||||||||
Other operating expenses | (14,237 | ) | (5,351 | ) | (6,143 | ) | (1,228 | ) | (1,336 | ) | 5,859 | (22,436 | ) | |||||||||||||||||||||||||||
Total operating expenses | (19,769 | ) | (7,598 | ) | (9,907 | ) | (2,143 | ) | (9,369 | ) | 5,859 | (42,927 | ) | |||||||||||||||||||||||||||
Operating profit/(loss) | 8,577 | 6,854 | 7,696 | 1,002 | (7,037 | ) | – | 17,092 | ||||||||||||||||||||||||||||||||
Share of profit in associates and joint ventures | 998 | 1,681 | 824 | 7 | 47 | – | 3,557 | |||||||||||||||||||||||||||||||||
Profit/(loss) before tax | 9,575 | 8,535 | 8,520 | 1,009 | (6,990 | ) | – | 20,649 | ||||||||||||||||||||||||||||||||
| % | % | % | % | % | % | |||||||||||||||||||||||||||||||||||
Share of HSBC’s profit before tax | 46.4 | 41.3 | 41.3 | 4.9 | (33.9 | ) | 100.0 | |||||||||||||||||||||||||||||||||
Cost efficiency ratio | 58.4 | 45.9 | 54.2 | 67.6 | – | 62.8 | ||||||||||||||||||||||||||||||||||
Balance sheet data74 | ||||||||||||||||||||||||||||||||||||||||
| US$m | US$m | US$m | US$m | US$m | US$m | |||||||||||||||||||||||||||||||||||
Loans and advances to customers (net) | 378,040 | 288,033 | 283,842 | 45,213 | 2,495 | 997,623 | ||||||||||||||||||||||||||||||||||
Total assets | 536,244 | 363,659 | 1,942,470 | 118,440 | 201,741 | (470,016 | ) | 2,692,538 | ||||||||||||||||||||||||||||||||
Customer accounts | 562,151 | 338,405 | 332,115 | 105,772 | 1,571 | 1,340,014 | ||||||||||||||||||||||||||||||||||
76
Table of Contents
HSBC HOLDINGS PLC
Report of the Directors: Operating and Financial Review(continued)
| 2011 | ||||||||||||||||||||||||||||||||||||||||
| Retail Banking and Wealth Management US$m | Commercial Banking | Global Banking | Global Private Banking US$m | Other73 US$m | Inter– elimination85 US$m | Total US$m | ||||||||||||||||||||||||||||||||||
Profit before tax | ||||||||||||||||||||||||||||||||||||||||
Net interest income/(expense) | 24,101 | 9,931 | 7,263 | 1,439 | (911 | ) | (1,161 | ) | 40,662 | |||||||||||||||||||||||||||||||
Net fee income | 8,226 | 4,291 | 3,227 | 1,382 | 34 | – | 17,160 | |||||||||||||||||||||||||||||||||
Trading income/(expense) excluding net interest income | (562 | ) | 565 | 3,306 | 415 | (441 | ) | – | 3,283 | |||||||||||||||||||||||||||||||
Net interest income on trading activities | 43 | 19 | 1,898 | 16 | 86 | 1,161 | 3,223 | |||||||||||||||||||||||||||||||||
Net trading income/(expense)78 | (519 | ) | 584 | 5,204 | 431 | (355 | ) | 1,161 | 6,506 | |||||||||||||||||||||||||||||||
Changes in fair value of long-term debt issued and related derivatives | – | – | – | – | 4,161 | – | 4,161 | |||||||||||||||||||||||||||||||||
Net income/(expense) from other financial instruments designated at fair value | (761 | ) | 33 | (72 | ) | – | 78 | – | (722 | ) | ||||||||||||||||||||||||||||||
Net income/(expense) from financial instruments designated at fair value | (761 | ) | 33 | (72 | ) | – | 4,239 | – | 3,439 | |||||||||||||||||||||||||||||||
Gains less losses from financial investments | 124 | 20 | 761 | 3 | (1 | ) | – | 907 | ||||||||||||||||||||||||||||||||
Dividend income | 27 | 15 | 75 | 7 | 25 | – | 149 | |||||||||||||||||||||||||||||||||
Net earned insurance premiums | 10,882 | 1,956 | 47 | – | (13 | ) | – | 12,872 | ||||||||||||||||||||||||||||||||
Other operating income | 907 | 483 | 577 | 30 | 6,127 | (6,358 | ) | 1,766 | ||||||||||||||||||||||||||||||||
Total operating income | 42,987 | 17,313 | 17,082 | 3,292 | 9,145 | (6,358 | ) | 83,461 | ||||||||||||||||||||||||||||||||
Net insurance claims86 | (9,454 | ) | (1,702 | ) | (25 | ) | – | – | – | (11,181 | ) | |||||||||||||||||||||||||||||
Net operating income21 | 33,533 | 15,611 | 17,057 | 3,292 | 9,145 | (6,358 | ) | 72,280 | ||||||||||||||||||||||||||||||||
Loan impairment charges and other credit risk provisions | (9,319 | ) | (1,738 | ) | (984 | ) | (86 | ) | – | – | (12,127 | ) | ||||||||||||||||||||||||||||
Net operating income | 24,214 | 13,873 | 16,073 | 3,206 | 9,145 | (6,358 | ) | 60,153 | ||||||||||||||||||||||||||||||||
Employee expenses87 | (6,538 | ) | (2,184 | ) | (4,196 | ) | (1,351 | ) | (6,897 | ) | – | (21,166 | ) | |||||||||||||||||||||||||||
Other operating expenses | (14,664 | ) | (5,037 | ) | (5,526 | ) | (915 | ) | (595 | ) | 6,358 | (20,379 | ) | |||||||||||||||||||||||||||
Total operating expenses | (21,202 | ) | (7,221 | ) | (9,722 | ) | (2,266 | ) | (7,492 | ) | 6,358 | (41,545 | ) | |||||||||||||||||||||||||||
Operating profit | 3,012 | 6,652 | 6,351 | 940 | 1,653 | – | 18,608 | |||||||||||||||||||||||||||||||||
Share of profit in associates and joint ventures | 1,258 | 1,295 | 698 | 4 | 9 | – | 3,264 | |||||||||||||||||||||||||||||||||
Profit before tax | 4,270 | 7,947 | 7,049 | 944 | 1,662 | – | 21,872 | |||||||||||||||||||||||||||||||||
| % | % | % | % | % | % | |||||||||||||||||||||||||||||||||||
Share of HSBC’s profit before tax | 19.6 | 36.3 | 32.2 | 4.3 | 7.6 | 100.0 | ||||||||||||||||||||||||||||||||||
Cost efficiency ratio | 63.2 | 46.3 | 57.0 | 68.8 | 81.9 | 57.5 | ||||||||||||||||||||||||||||||||||
Balance sheet data74 | ||||||||||||||||||||||||||||||||||||||||
| US$m | US$m | US$m | US$m | US$m | US$m | |||||||||||||||||||||||||||||||||||
Loans and advances to customers (net) | 357,907 | 262,039 | 276,463 | 41,856 | 2,164 | 940,429 | ||||||||||||||||||||||||||||||||||
Total assets | 540,548 | 334,966 | 1,877,627 | 119,839 | 180,126 | (497,527 | ) | 2,555,579 | ||||||||||||||||||||||||||||||||
Customer accounts | 529,017 | 306,174 | 306,454 | 111,814 | 466 | 1,253,925 | ||||||||||||||||||||||||||||||||||
For footnotes, see page 120.
77
Table of Contents
HSBC HOLDINGS PLC
Report of the Directors: Operating and Financial Review(continued)
Profit/(loss) before tax and balance sheet data(continued)
| 2010 | ||||||||||||||||||||||||||||||||||||||||
Retail Banking and Wealth Manage- ment US$m | Commercial Banking | Global Banking and Markets US$m | Global Private Banking US$m | Other73 US$m | Inter- elimination85 US$m | Total US$m | ||||||||||||||||||||||||||||||||||
Profit/(loss) before tax | ||||||||||||||||||||||||||||||||||||||||
Net interest income/(expense) | 24,166 | 8,487 | 7,343 | 1,345 | (998 | ) | (902 | ) | 39,441 | |||||||||||||||||||||||||||||||
Net fee income | 8,397 | 3,964 | 3,664 | 1,299 | 31 | – | 17,355 | |||||||||||||||||||||||||||||||||
Trading income/(expense) excluding net interest income | (106 | ) | 427 | 4,326 | 391 | (358 | ) | – | 4,680 | |||||||||||||||||||||||||||||||
Net interest income on trading activities | 28 | 28 | 1,504 | 21 | 47 | 902 | 2,530 | |||||||||||||||||||||||||||||||||
Net trading income/(expense)78 | (78 | ) | 455 | 5,830 | 412 | (311 | ) | 902 | 7,210 | |||||||||||||||||||||||||||||||
Changes in fair value of long-term debt issued and related derivatives | – | – | – | – | (258 | ) | – | (258 | ) | |||||||||||||||||||||||||||||||
Net income from other financial instruments designated at fair value | 1,210 | 190 | 36 | – | 42 | – | 1,478 | |||||||||||||||||||||||||||||||||
Net income/(expense) from financial instruments designated at fair value | 1,210 | 190 | 36 | – | (216 | ) | – | 1,220 | ||||||||||||||||||||||||||||||||
Gains less losses from financial investments | (24 | ) | (1 | ) | 863 | (6 | ) | 136 | – | 968 | ||||||||||||||||||||||||||||||
Dividend income | 27 | 12 | 48 | 5 | 20 | – | 112 | |||||||||||||||||||||||||||||||||
Net earned insurance premiums | 9,737 | 1,379 | 41 | – | (11 | ) | – | 11,146 | ||||||||||||||||||||||||||||||||
Other operating income | 684 | 585 | 1,113 | 38 | 6,005 | (5,863 | ) | 2,562 | ||||||||||||||||||||||||||||||||
Total operating income | 44,119 | 15,071 | 18,938 | 3,093 | 4,656 | (5,863 | ) | 80,014 | ||||||||||||||||||||||||||||||||
Net insurance claims86 | (10,508 | ) | (1,237 | ) | (26 | ) | – | 4 | – | (11,767 | ) | |||||||||||||||||||||||||||||
Net operating income21 | 33,611 | 13,834 | 18,912 | 3,093 | 4,660 | (5,863 | ) | 68,247 | ||||||||||||||||||||||||||||||||
Loan impairment (charges)/recoveries and other credit risk provisions | (11,259 | ) | (1,805 | ) | (990 | ) | 12 | 3 | – | (14,039 | ) | |||||||||||||||||||||||||||||
Net operating income | 22,352 | 12,029 | 17,922 | 3,105 | 4,663 | (5,863 | ) | 54,208 | ||||||||||||||||||||||||||||||||
Employee expenses87 | (5,770 | ) | (2,153 | ) | (4,353 | ) | (1,237 | ) | (6,323 | ) | – | (19,836 | ) | |||||||||||||||||||||||||||
Other operating expenses | (13,769 | ) | (4,678 | ) | (4,875 | ) | (798 | ) | 405 | 5,863 | (17,852 | ) | ||||||||||||||||||||||||||||
Total operating expenses | (19,539 | ) | (6,831 | ) | (9,228 | ) | (2,035 | ) | (5,918 | ) | 5,863 | (37,688 | ) | |||||||||||||||||||||||||||
Operating profit/(loss) | 2,813 | 5,198 | 8,694 | 1,070 | (1,255 | ) | – | 16,520 | ||||||||||||||||||||||||||||||||
Share of profit/(loss) in associates and joint ventures | 1,026 | 892 | 521 | (16 | ) | 94 | – | 2,517 | ||||||||||||||||||||||||||||||||
Profit/(loss) before tax | 3,839 | 6,090 | 9,215 | 1,054 | (1,161 | ) | – | 19,037 | ||||||||||||||||||||||||||||||||
| % | % | % | % | % | % | |||||||||||||||||||||||||||||||||||
Share of HSBC’s profit before tax | 20.2 | 32.0 | 48.4 | 5.5 | (6.1 | ) | 100.0 | |||||||||||||||||||||||||||||||||
Cost efficiency ratio | 58.1 | 49.4 | 48.8 | 65.8 | 127.0 | 55.2 | ||||||||||||||||||||||||||||||||||
Balance sheet data74 | ||||||||||||||||||||||||||||||||||||||||
| US$m | US$m | US$m | US$m | US$m | US$m | |||||||||||||||||||||||||||||||||||
Loans and advances to customers (net) | 390,963 | 239,286 | 284,497 | 40,665 | 2,955 | 958,366 | ||||||||||||||||||||||||||||||||||
Total assets | 530,970 | 296,797 | 1,755,043 | 116,846 | 161,458 | (406,425 | ) | 2,454,689 | ||||||||||||||||||||||||||||||||
Customer accounts | 525,221 | 286,007 | 308,416 | 107,130 | 951 | 1,227,725 | ||||||||||||||||||||||||||||||||||
For footnotes, see page 120.
77a
Table of Contents
HSBC HOLDINGS PLC
Report of the Directors: Operating and Financial Review(continued)
Disposals, held for sale and run-off portfolios
In implementing our strategy, we have sold or agreed to sell a number of businesses and investments across the Group. We expect these disposals to have a significant effect on both the revenue and the profitability of the global businesses in the future. In addition, significant portfolios are being run down. We expect the losses on these
portfolios to continue to affect the global businesses in the future.
The table below presents the contribution of these businesses and investments to the historical results of global businesses. We do not expect the historical results to be indicative of future results because of disposal or run-off. Fixed allocated costs, included in total operating costs, will not necessarily be removed upon disposal and have been separately identified on page 53.
Summary income statements for disposals, held for sale and run-off portfolios69,70
| 2012 | ||||||||||||||||||||||||||||
Retail Management US$m | Commercial Banking | Global Banking Markets US$m | Global Private Banking US$m | Other US$m | ||||||||||||||||||||||||
Net interest income/(expense) | 4,281 | 133 | 35 | 8 | (2 | ) | ||||||||||||||||||||||
Net fee income | 380 | – | 1 | 8 | – | |||||||||||||||||||||||
Net trading income/(expense)78 | (204 | ) | 4 | 160 | – | 2 | ||||||||||||||||||||||
Net income/(expense) from financial instruments designated at fair value | 6 | 2 | 10 | – | (785 | ) | ||||||||||||||||||||||
Gains less losses from financial investments | 32 | 1 | (70 | ) | – | – | ||||||||||||||||||||||
Dividend income | 3 | – | – | – | – | |||||||||||||||||||||||
Net earned insurance premiums | 518 | 203 | 25 | – | (1 | ) | ||||||||||||||||||||||
Other operating income/(expense) | 40 | 20 | (3 | ) | (1 | ) | – | |||||||||||||||||||||
Total operating income/(expense) | 5,056 | 363 | 158 | 15 | (786 | ) | ||||||||||||||||||||||
Net insurance claims incurred and movement in liabilities to policyholders | (297 | ) | (129 | ) | (17 | ) | – | – | ||||||||||||||||||||
Net operating income/(expense)21 | 4,759 | 234 | 141 | 15 | (786 | ) | ||||||||||||||||||||||
Loan impairment charges and other credit risk provisions | (2,980 | ) | (4 | ) | (168 | ) | – | – | ||||||||||||||||||||
Net operating income/(expense) | 1,779 | 230 | (27 | ) | 15 | (786 | ) | |||||||||||||||||||||
Total operating expenses | (2,376 | ) | (164 | ) | (165 | ) | (24 | ) | (18 | ) | ||||||||||||||||||
Operating profit/(loss) | (597 | ) | 66 | (192 | ) | (9 | ) | (804 | ) | |||||||||||||||||||
Share of profit in associates and joint ventures | 633 | 89 | 64 | – | – | |||||||||||||||||||||||
Profit/(loss) before tax | 36 | 155 | (128 | ) | (9 | ) | (804 | ) | ||||||||||||||||||||
By geographical region | ||||||||||||||||||||||||||||
Europe | 2 | – | (283 | ) | (1 | ) | – | |||||||||||||||||||||
Hong Kong | 27 | 13 | 6 | – | – | |||||||||||||||||||||||
Rest of Asia-Pacific | 612 | 91 | 57 | (8 | ) | – | ||||||||||||||||||||||
Middle East and North Africa | 10 | – | 36 | – | – | |||||||||||||||||||||||
North America | (656 | ) | 9 | 2 | – | (785 | ) | |||||||||||||||||||||
Latin America | 41 | 42 | 54 | – | (19 | ) | ||||||||||||||||||||||
Profit/(loss) before tax | 36 | 155 | (128 | ) | (9 | ) | (804 | ) | ||||||||||||||||||||
Gain on sale | 4,074 | 476 | 22 | 64 | 3,103 | |||||||||||||||||||||||
For footnotes, see page 120.
78
Table of Contents
HSBC HOLDINGS PLC
Report of the Directors: Operating and Financial Review(continued)
| 79 | ||||
| 81 | ||||
| 88 | ||||
| 93 | ||||
| 99 | ||||
| 104 | ||||
| 111 | ||||
| 117 | ||||
Additional information on results in 2012 may be found in the ‘Financial Summary’ on pages 25 to 54.
In the analysis of profit by geographical regions that follows, operating income and operating expenses include intra-HSBC items of US$3,358m (2011: US$3,421m; 2010: US$3,125m).
Profit/(loss) before tax
| 2012 | 2011 | 2010 | ||||||||||||||||||||||||||||||||
| US$m | % | US$m | % | US$m | % | |||||||||||||||||||||||||||||
Europe | (3,414 | ) | (16.5 | ) | 4,671 | 21.3 | 4,302 | 22.6 | ||||||||||||||||||||||||||
Hong Kong | 7,582 | 36.7 | 5,823 | 26.6 | 5,692 | 29.9 | ||||||||||||||||||||||||||||
Rest of Asia-Pacific | 10,448 | 50.6 | 7,471 | 34.2 | 5,902 | 31.0 | ||||||||||||||||||||||||||||
Middle East and North Africa | 1,350 | 6.5 | 1,492 | 6.8 | 892 | 4.7 | ||||||||||||||||||||||||||||
North America | 2,299 | 11.1 | 100 | 0.5 | 454 | 2.4 | ||||||||||||||||||||||||||||
Latin America | 2,384 | 11.6 | 2,315 | 10.6 | 1,795 | 9.4 | ||||||||||||||||||||||||||||
| 20,649 | 100.0 | 21,872 | 100.0 | 19,037 | 100.0 | |||||||||||||||||||||||||||||
Total assets74
| At 31 December | ||||||||||||||||||||||
| 2012 | 2011 | |||||||||||||||||||||
| US$m | % | US$m | % | |||||||||||||||||||
Europe | 1,389,240 | 51.6 | 1,281,945 | 50.3 | ||||||||||||||||||
Hong Kong | 518,334 | 19.3 | 473,024 | 18.5 | ||||||||||||||||||
Rest of Asia-Pacific | 342,269 | 12.7 | 317,816 | 12.4 | ||||||||||||||||||
Middle East and North Africa | 62,605 | 2.3 | 57,464 | 2.2 | ||||||||||||||||||
North America | 490,247 | 18.2 | 504,302 | 19.7 | ||||||||||||||||||
Latin America | 131,277 | 4.9 | 144,889 | 5.7 | ||||||||||||||||||
Intra-HSBC items | (241,434 | ) | (9.0 | ) | (223,861 | ) | (8.8 | ) | ||||||||||||||
| 2,692,538 | 100.0 | 2,555,579 | 100.0 | |||||||||||||||||||
| Risk-weighted assets88 | ||||||||||||||||||||||
| At 31 December | ||||||||||||||||||||||
| 2012 | 2011 | |||||||||||||||||||||
| US$bn | % | US$bn | % | |||||||||||||||||||
Total | 1,123.9 | 1,209.5 | ||||||||||||||||||||
Europe | 314.7 | 27.6 | 340.2 | 27.8 | ||||||||||||||||||
Hong Kong | 111.9 | 9.8 | 105.7 | 8.6 | ||||||||||||||||||
Rest of Asia-Pacific | 302.2 | 26.4 | 279.3 | 22.8 | ||||||||||||||||||
Middle East and North Africa | 62.2 | 5.4 | 58.9 | 4.8 | ||||||||||||||||||
North America | 253.0 | 22.2 | 337.3 | 27.6 | ||||||||||||||||||
Latin America | 97.9 | 8.6 | 102.3 | 8.4 | ||||||||||||||||||
For footnotes, see page 120.
79
Table of Contents
HSBC HOLDINGS PLC
Report of the Directors: Operating and Financial Review(continued)
Selected items included in profit before tax by geographical region
Fair value movements arising from changes in own credit spreads26
| 2012 US$m | 2011 US$m | 2010 US$m | ||||||||||||||
Europe | (4,110 | ) | 2,947 | (198 | ) | |||||||||||
Hong Kong | – | – | (6 | ) | ||||||||||||
Rest of Asia-Pacific | (3 | ) | 2 | (1 | ) | |||||||||||
Middle East and North Africa | (12 | ) | 14 | – | ||||||||||||
North America | (1,090 | ) | 970 | 142 | ||||||||||||
| (5,215 | ) | 3,933 | (63 | ) | ||||||||||||
Acquisitions, disposals and dilutions75
| 2012 US$m | 2011 US$m | 2010 US$m | ||||||||||||||
Europe | (3 | ) | – | 286 | ||||||||||||
Hong Kong | 420 | 82 | 136 | |||||||||||||
Rest of Asia-Pacific | 4,048 | 1,141 | 188 | |||||||||||||
Middle East and North Africa | (18 | ) | 54 | (42 | ) | |||||||||||
North America | 4,888 | 2,192 | 66 | |||||||||||||
Latin America | 144 | 181 | – | |||||||||||||
| 9,479 | 3,650 | 634 | ||||||||||||||
For footnotes, see page 120.
80
Table of Contents
HSBC HOLDINGS PLC
Report of the Directors: Operating and Financial Review(continued)
Our principal banking operations in Europe are HSBC Bank plc in the UK, HSBC France, HSBC Bank A.S. in Turkey, HSBC Bank Malta p.l.c., HSBC Private Bank (Suisse) SA and HSBC Trinkaus & Burkhardt AG. Through these subsidiaries we provide a wide range of banking, treasury and financial services to personal, commercial and corporate customers across Europe.
2012 US$m | 2011 US$m | 2010 US$m | ||||||||||||||
Net interest income | 10,394 | 11,001 | 11,250 | |||||||||||||
Net fee income | 6,169 | 6,236 | 6,371 | |||||||||||||
Net trading income | 2,707 | 2,161 | 2,863 | |||||||||||||
Other income/(expense) | (1,662 | ) | 4,848 | 2,266 | ||||||||||||
Net operating income21 | 17,608 | 24,246 | 22,750 | |||||||||||||
LICs76 | (1,921 | ) | (2,512 | ) | (3,020 | ) | ||||||||||
Net operating income | 15,687 | 21,734 | 19,730 | |||||||||||||
Total operating expenses | (19,095 | ) | (17,069 | ) | (15,445 | ) | ||||||||||
Operating profit/(loss) | (3,408 | ) | 4,665 | 4,285 | ||||||||||||
Income/(expense) from associates77 | (6 | ) | 6 | 17 | ||||||||||||
Profit/(loss) before tax | (3,414 | ) | 4,671 | 4,302 | ||||||||||||
Cost efficiency ratio | 108.4% | 70.4% | 67.9% | |||||||||||||
RoRWA66 | (1.0% | ) | 1.5% | 1.3% | ||||||||||||
Year-end staff numbers | 70,061 | 74,892 | 75,698 | |||||||||||||
Strong Rates and Credit performance
as investor sentiment improved
40%
reduction in RBWM
loan impairment charges
US$2.3bn
of customer redress
provisions in the UK
For footnotes, see page 120.
Economic background
TheUK economy remained weak in 2012, with little growth in underlying activity. Preliminary data showed that the level of real Gross Domestic Product (‘GDP’) contracted by 0.3% in the fourth quarter, as economic activity fell back after a boost related to the Olympic Games. Despite the lacklustre economy, the labour market remained fairly resilient, with the unemployment rate in the three months to December down to 7.8% from 8.4% in the same period in 2011. In response to the stagnating economy, the Bank of England (‘BoE’) increased the size of its Asset Purchase Facility to £375bn (US$606bn) and launched a new scheme, Funding for Lending, aimed at increasing the supply of credit. Consumer Prices Index (‘CPI’) inflation fell during the first half of the year but remained above the BoE’s 2% target. In the fourth quarter, it rose back to 2.7%, partly due to increases in tuition fees and energy prices.
Theeurozone returned to recession in 2012 as the initial resilience in France and Germany was more than offset by deepening contractions in the periphery, where domestic demand was dragged down by austerity and private sector deleveraging. Inflation slowed from 2.7% at the end of 2011 to 2.2% in 2012 and the European Central Bank (‘ECB’) cut the refinance (‘refi’) rate by 0.25% to 0.75% in July. The sovereign crisis worsened again in the first half of 2012 but early signs of a roadmap for future integration of the economic and monetary union, additional support for Greece and, most importantly, the ECB’s commitment to supporting the euro through its Outright Monetary Transactions bond-buying programme succeeded in lowering peripheral government bond spreads to their lowest level since March 2012.
Review of performance
Our operations in Europe reported a pre-tax loss of US$3.4bn, compared with a profit of US$4.7bn in 2011. On a constant currency basis, pre-tax profits declined by US$8.0bn.
In 2012, there were adverse movements of US$4.1bn on our own debt designated at fair value, resulting from changes in credit spreads, compared with favourable movements of US$2.9bn in 2011. On an underlying basis, pre-tax profits decreased by US$930m due to higher operating expenses reflecting a US$1.4bn increase in the provision for customer redress programmes in the UK, in particular relating to the possible mis-selling of PPI and interest rate protection products. This was partly offset by higher GB&M revenues, notably in the Rates and Credit businesses as spreads on eurozone
81
Table of Contents
HSBC HOLDINGS PLC
Report of the Directors: Operating and Financial Review(continued)
Profit/(loss) before tax by country within global businesses
Retail Management US$m | Commercial Banking US$m | Global Markets US$m | Global Private Banking US$m | Other US$m | Total US$m | |||||||||||||||||||||||||||||
2012 | ||||||||||||||||||||||||||||||||||
UK | 343 | 832 | (111 | ) | 235 | (6,355 | ) | (5,056 | ) | |||||||||||||||||||||||||
France60 | 135 | 203 | 514 | (11 | ) | (263 | ) | 578 | ||||||||||||||||||||||||||
Germany | 29 | 64 | 283 | 40 | (72 | ) | 344 | |||||||||||||||||||||||||||
Malta | 39 | 52 | 31 | – | – | 122 | ||||||||||||||||||||||||||||
Switzerland | – | 2 | 1 | 133 | – | 136 | ||||||||||||||||||||||||||||
Turkey | (32 | ) | 71 | 104 | – | 1 | 144 | |||||||||||||||||||||||||||
Other | (5 | ) | (16 | ) | 164 | 102 | 73 | 318 | ||||||||||||||||||||||||||
| 509 | 1,208 | 986 | 499 | (6,616 | ) | (3,414 | ) | |||||||||||||||||||||||||||
2011 | ||||||||||||||||||||||||||||||||||
UK | 1,330 | 1,227 | (265 | ) | 192 | 1,037 | 3,521 | |||||||||||||||||||||||||||
France60 | 69 | 192 | (194 | ) | 16 | 18 | 101 | |||||||||||||||||||||||||||
Germany | 36 | 69 | 203 | 28 | 16 | 352 | ||||||||||||||||||||||||||||
Malta | 31 | 72 | 21 | – | – | 124 | ||||||||||||||||||||||||||||
Switzerland | – | (8 | ) | – | 225 | – | 217 | |||||||||||||||||||||||||||
Turkey | 7 | 62 | 87 | 2 | – | 158 | ||||||||||||||||||||||||||||
Other | (151 | ) | 73 | 225 | 94 | (43 | ) | 198 | ||||||||||||||||||||||||||
| 1,322 | 1,687 | 77 | 557 | 1,028 | 4,671 | |||||||||||||||||||||||||||||
2010 | ||||||||||||||||||||||||||||||||||
UK | 1,181 | 827 | 1,772 | 223 | (1,605 | ) | 2,398 | |||||||||||||||||||||||||||
France60 | 138 | 135 | 376 | 18 | 26 | 693 | ||||||||||||||||||||||||||||
Germany | 36 | 32 | 231 | 30 | 4 | 333 | ||||||||||||||||||||||||||||
Malta | 37 | 56 | 17 | – | – | 110 | ||||||||||||||||||||||||||||
Switzerland | – | (5 | ) | – | 265 | – | 260 | |||||||||||||||||||||||||||
Turkey | 64 | 80 | 105 | 1 | – | 250 | ||||||||||||||||||||||||||||
Other | (144 | ) | 80 | 202 | 103 | 17 | 258 | |||||||||||||||||||||||||||
| 1,312 | 1,205 | 2,703 | 640 | (1,558 | ) | 4,302 | ||||||||||||||||||||||||||||
For footnote, see page 120.
bonds tightened and investor sentiment improved. In addition, impairment charges fell due to lower credit risk provisions in GB&M, notably in the legacy credit portfolio, and improved delinquency rates in RBWM in the UK as we continued to improve the quality of these portfolios with a higher proportion of secured lending.
We made significant progress in reshaping our business in Europe. The disposal of non-core businesses simplified our European portfolio, allowing us to concentrate resources on businesses where we can deliver sustainable profits and growth while managing risks effectively. We exited from Hungary, Georgia, Slovakia, and RBWM in Russia and Poland, and sold Property Vision in the UK, our insurance and reinsurance businesses in Ireland and the retail equities brokerage in Greece.
During 2012, we made progress with our restructuring programme to align our businesses in each country to their respective global business operating models in order to reduce complexity and lower our costs in a sustainable way. Total restructuring costs (including impairment of assets)
of US$299m were incurred across Europe as a result of organisational effectiveness and other initiatives, which delivered sustainable cost savings of approximately US$770m.
In RBWM, we continued to drive strong growth in mortgage lending in the UK through the success of our competitive offerings and marketing campaigns. Our share of new UK mortgage lending in 2012 was 12%, up from the 10% share of new lending in 2011, while maintaining a loan-to-value ratio of 58%. We have approved new mortgage lending of £19bn (US$32bn) during 2012, compared with our original lending commitment of £15bn (US$24bn), with £5bn (US$8bn) approved for first time buyers. Wealth Management revenue was marginally lower during the year reflecting the challenging economic environment. Our Wealth Management products and services were redesigned in accordance with the FSA’s Retail Distribution Review, which was introduced on 1 January 2013, and we continue to offer a competitive fee-based financial advice service to Premier customers. The expansion of the RBWM business continued in
82
Table of Contents
HSBC HOLDINGS PLC
Report of the Directors: Operating and Financial Review(continued)
Turkey, where we are targeting mass affluent customers.
In CMB, we continued to invest in the UK, and have increased the number of International Relationship Managers to over 200 during the year. In the first half of 2012, we launched an International SME fund in the UK to support UK businesses that trade, or aspire to trade, internationally. By the end of 2012, we had approved lending through the fund of £5.1bn (US$8.2bn), exceeding the original target of £4.0bn (US$6.5bn), and provided £12bn (US$20bn) of gross new lending to UK SMEs, including the renewal of overdraft and other lending facilities. Over 80% of small business lending applications received during the year were approved. Revenue from international customers increased and our focus on this client base, together with targeted growth initiatives such as deposit acquisition and regional pricing strategies, led to a rise in Payments and Cash Management and Global Trade and Receivable Finance income.
Revenues from CMB’s collaboration with GB&M increased primarily from sales of foreign exchange products. During the year, we made a provision for the possible mis-selling of interest rate protection products and the sale of these products to customers in our Business Banking segment, which serves SMEs, was withdrawn.
GB&M continued to develop cross-product capabilities in the growing renminbi market. Early in the year, we issued the first international renminbi bond outside sovereign Chinese territory. Since then, a number of significant transactions were supported by in-depth collaboration between European and other regional teams which reinforced our position as the leading house for international renminbi issuance. In Foreign Exchange, the focus remained on enhancing product offerings in our e-FX platforms for a broader client base, particularly to RBWM and CMB customers. This included the launch of a ‘Dynamic Currency Conversion’ product within the transactional Foreign Exchange business. To enhance coverage efforts in Global Banking, the Corporate Finance Group was established to strengthen the financial advisory and event financing business. Payments and Cash Management won a number of mandates and implemented the Global Liquidity Solutions platform to provide advanced liquidity management functionality for its clients. In addition, our legacy credit exposure was reduced in Europe by exiting from certain positions and the business will reduce the size of this portfolio further as opportunities arise.
In GPB, we revised our medium-term strategic plan to focus the business on investing in priority markets with a redefined client offering that builds on product strengths and leverages Group capabilities. We concentrated on higher net worth international and domestic customers, enhancing our compliance and risk framework and improving alignment with the other global businesses.
Our activities are likely to be affected by proposed legislation in the UK arising from the recommendations of the UK Independent Commission on Banking (‘ICB’) to ring-fence the retail bank from wholesale operations and to require the retail bank to have a greater primary loss absorbing capacity. Proposed changes in regulations are likely to affect how we conduct activities, with the potential to curtail the types of business we carry out and increase the costs of doing business. The implementation of any proposed changes will take a considerable amount of time and involve significant cost (see page 132).
The following commentary is on a constant currency basis.
Net interest income decreased by 3%. Balance Sheet Management revenues declined, principally in the UK, as yield curves continued to flatten and liquidity arising from maturities and sales of available-for-sale debt securities was re-invested at lower prevailing rates. In addition we placed a greater portion of our liquidity with central banks. GPB was similarly affected as higher yielding positions matured and as we managed selectively our exposures to eurozone sovereign debt. Legacy credit revenues in the UK also fell as a result of higher interest expense on structured debt issued at the end of 2011, coupled with lower effective yields on assets. RBWM net interest income declined mainly in the UK due to lower deposit spreads reflecting strong competition in the low interest rate environment. This was partly offset by strong growth in average residential mortgage balances and improved lending spreads in the UK, along with higher personal lending and cards balances in Turkey as the business expanded. In addition, net interest income in CMB benefited from higher average customer account balances as we continued to attract deposits through our Payments and Cash Management products as a result of competitive pricing, while average lending balances also rose, mainly in the UK, despite muted demand for credit.
Net fee income increased by 2%. CMB fee income rose due to higher transaction volumes reflecting new mandates in Payments and Cash Management. RBWM fee income also increased due
83
Table of Contents
HSBC HOLDINGS PLC
Report of the Directors: Operating and Financial Review(continued)
to lower commissions paid as a result of the run-off and subsequent disposal of the insurance businesses in Ireland. These increases were partly offset by a fall in brokerage fees in GPB, reflecting a reduction in client transaction volumes, due in part to lower market volatility. Fees from assets under management and account services also declined, as challenging market conditions in the latter half of 2011 led to a fall in average client assets in 2012, coupled with a reduction in client numbers as we repositioned our target client base.
Net trading income increased by 27%, primarily due to significantly higher Rates trading revenues in the UK and France, and higher Credit trading revenues, mainly in the UK, as spreads tightened and investor sentiment improved following stimuli by central banks. This was despite significant adverse fair value movements in Rates, including a charge from own credit spreads on structured liabilities as spreads tightened which compared with a gain reported in 2011, together with a charge as a result of a change in estimation methodology in respect of credit valuation adjustments on derivative assets (see Note 15 on the Financial Statements). Revenues in our legacy credit portfolio increased due to price appreciation and redemption at par of certain assets. Foreign Exchange income was also stronger due to higher income from GB&M’s ongoing collaboration with CMB, and increased volumes from improvements in our electronic pricing and distribution capabilities, although this was partly offset by the effect of less volatile markets in 2012. In addition, trading income benefited from the change in estimation methodology for debit valuation adjustments on derivative liabilities (see Note 15 on the Financial Statements).
There were lower adverse fair value movements on non-qualifying hedges, driven by favourable fair value movements on non-qualifying hedges in HSBC Holdings, compared with adverse fair value movements in 2011, reflecting the less pronounced decline in long-term US interest rates relative to sterling and euro interest rates than in 2011. This was partly offset by higher adverse movements on non-qualifying hedges in European operating entities as interest rates fell.
Adverse foreign exchange movements were reported on assets held as economic hedges of foreign currency debt designated at fair value compared with favourable movements in 2011. These offset favourable foreign exchange movements on the foreign currency debt which are reported in ‘Net expense from financial instruments designated at fair value’.
Net expense from financial instruments designated at fair value increased by US$4.8bn. Excluding adverse fair value movements due to the change in credit spreads on our own debt held at fair value, net income from financial instruments designated at fair value of US$1.9bn in 2012 compared with a net expense of US$374m in 2011. This reflected favourable foreign exchange movements on foreign currency debt designated at fair value issued as part of our overall funding strategy compared with adverse movements in 2011, with an offset reported in ‘Net trading income’. In addition, net investment gains were recognised on the fair value of assets held to meet liabilities under insurance and investment contracts as market conditions improved, compared with net investment losses in 2011. The corresponding movement in liabilities to customers is recorded under ‘Net insurance claims incurred and movement in liabilities to policyholders’ to the extent that these investment gains or losses are attributable to policyholders holding unit-linked insurance policies and insurance or investment contracts with DPF.
Gains less losses from financial investments decreased by US$133m. This was driven by higher impairments in GB&M in the UK of available-for-sale equity securities due to significant write-downs in 2012 on three holdings, two of which were in our direct investment business in run-off. The decline was also driven by losses on the disposal of legacy assets, also in GB&M in the UK (see page 27), together with the non-recurrence of gains in 2011 on the disposal of available-for-sale debt securities in our Insurance business in RBWM. These factors were partly offset by higher gains on the disposal of available-for-sale debt securities in Balance Sheet Management, mainly in the UK, as part of structural interest rate risk management activities, coupled with a rise in disposal gains in Principal Investments in GB&M.
Net earned insurance premiums decreased by 6%. This mainly reflected lower life insurance sales in RBWM in France as a result of the adverse economic environment and increased competition from other banking products. The run-off and subsequent disposal of the insurance businesses in Ireland in 2012 also contributed to the decline. This was partly offset by a rise in net earned premiums in the UK due, in part, to the sale of a unit-linked insurance product through two new third party platforms.
Other operating incomedecreased by US$95m. GB&M incurred losses on the sale of certain syndicated loans in the UK. In addition, gains in
84
Table of Contents
HSBC HOLDINGS PLC
Report of the Directors: Operating and Financial Review(continued)
2011 on the disposal of a property fund did not recur.
Net insurance claims incurred and movement in liabilities to policyholders increased by 40%, driven by net investment gains on the fair value of the assets held to support policyholder contracts, compared with net losses in 2011. This was partly offset by lower reserves established for new business, reflecting the decline in premiums in France.
Loan impairment charges and other credit risk provisions decreased by 22% to US$1.9bn. GB&M reported lower credit risk provisions, mainly in the UK, on available-for-sale ABSs, driven by an improvement in underlying asset prices, as well as lower charges on Greek sovereign debt. These were coupled with a reduction in loan impairment charges in RBWM, notably in the UK, as we continued to pro-actively identify and monitor customers facing financial hardship and focused on growing higher quality lending. As a result, delinquency rates improved across both the secured and unsecured lending portfolios. This was partly offset by an increase in loan impairment charges in RBWM in Turkey, reflecting business expansion. In addition, there were higher individually assessed provisions in CMB reflecting, mainly, the challenging economic conditions in the UK, Greece, Spain and Turkey.
Operating expenses increased by 15%, driven by higher charges relating to UK customer redress programmes with US$2.3bn reported in 2012, compared with a charge of US$890m (US$898m as reported) in 2011. In 2012 we included an additional charge of US$1.7bn for estimated redress for the possible mis-selling of PPI policies and US$598m in relation to the possible mis-selling of interest rate protection products in previous years, of which US$268m related to the estimated redress to be
paid to customers and the remainder to costs of closing out these positions and related administration costs. A charge relating to the US Office of Foreign Asset Control (‘OFAC’) investigation of US$375m was also incurred in HSBC Holdings, along with the UK bank levy of US$571m. This was partly offset by an adjustment of US$99m in the 2011 bank levy charge of US$570m as the basis of calculation was clarified. In addition, 2011 included a credit of US$570m (US$587m as reported) arising from the defined benefit pension obligations in the UK which did not recur. Restructuring costs of US$299m were US$92m lower than in 2011, as the review initiated in 2011 to improve cost efficiency continued to be implemented and we completed disposals and exits in Europe.
Excluding these items, operating expenses marginally increased compared with 2011. Our organisational effectiveness initiatives progressed, delivering sustainable cost savings of approximately US$770m in 2012. This enabled us to reinvest in, and reallocate capital, to our designated growth businesses such as our mortgage offering, our international CMB business and our home and priority growth markets (UK, France, Germany and Turkey), as well as launching the M&S Bank in the UK.
Operating expenses in Europe
2012 US$m | 2011 US$m | |||||||||
HSBC Holdings | 2,063 | 1,664 | ||||||||
UK | 11,993 | 9,989 | ||||||||
Continental Europe | 5,237 | 5,563 | ||||||||
Intra-region eliminations | (198 | ) | (147 | ) | ||||||
Total operating expenses | 19,095 | 17,069 | ||||||||
85
Table of Contents
HSBC HOLDINGS PLC
Report of the Directors: Operating and Financial Review(continued)
Reconciliation of reported and constant currency profit/(loss) before tax – Europe
2011 as reported | Currency translation adjustment24 US$m | 2011 at 2012 rates US$m | 2012 as reported | Reported change25 % | Constant change25 % | |||||||||||||||||||||||||||||
Net interest income | 11,001 | (325 | ) | 10,676 | 10,394 | (6 | ) | (3 | ) | |||||||||||||||||||||||||
Net fee income | 6,236 | (205 | ) | 6,031 | 6,169 | (1 | ) | 2 | ||||||||||||||||||||||||||
Own credit spread26 | 2,947 | (35 | ) | 2,912 | (4,110 | ) | ||||||||||||||||||||||||||||
Other income27 | 4,062 | (17 | ) | 4,045 | 5,155 | 27 | 27 | |||||||||||||||||||||||||||
Net operating income21 | 24,246 | (582 | ) | 23,664 | 17,608 | (27 | ) | (26 | ) | |||||||||||||||||||||||||
Loan impairment charges and other credit risk provisions | (2,512 | ) | 54 | (2,458 | ) | (1,921 | ) | 24 | 22 | |||||||||||||||||||||||||
Net operating income | 21,734 | (528 | ) | 21,206 | 15,687 | (28 | ) | (26 | ) | |||||||||||||||||||||||||
Operating expenses | (17,069 | ) | 406 | (16,663 | ) | (19,095 | ) | (12 | ) | (15 | ) | |||||||||||||||||||||||
Operating profit/(loss) | 4,665 | (122 | ) | 4,543 | (3,408 | ) | ||||||||||||||||||||||||||||
Income/(loss) from associates | 6 | (8 | ) | (2 | ) | (6 | ) | (200 | ) | |||||||||||||||||||||||||
Profit/(loss) before tax | 4,671 | (130 | ) | 4,541 | (3,414 | ) | ||||||||||||||||||||||||||||
For footnotes, see page 120.
Reconciliation of reported and underlying29 items – Europe
| Year ended 31 December | ||||||||||||||||
2012 US$m | 2011 US$m | Change % | ||||||||||||||
Revenue21 | ||||||||||||||||
Reported revenue | 17,608 | 24,246 | (27 | ) | ||||||||||||
Currency translation adjustment24 | (547 | ) | ||||||||||||||
Own credit spread26 | 4,110 | (2,947 | ) | |||||||||||||
Acquisitions, disposals and dilutions | 3 | – | ||||||||||||||
Underlying revenue | 21,721 | 20,752 | 5 | |||||||||||||
Loan impairment charges and other credit risk provisions (‘LIC’s) | ||||||||||||||||
Reported LICs | (1,921 | ) | (2,512 | ) | 24 | |||||||||||
Currency translation adjustment24 | 54 | |||||||||||||||
Acquisitions, disposals and dilutions | – | – | ||||||||||||||
Underlying LICs | (1,921 | ) | (2,458 | ) | 22 | |||||||||||
Operating expenses | ||||||||||||||||
Reported operating expenses | (19,095 | ) | (17,069 | ) | (12 | ) | ||||||||||
Currency translation adjustment24 | 406 | |||||||||||||||
Acquisitions, disposals and dilutions | – | – | ||||||||||||||
Underlying operating expenses | (19,095 | ) | (16,663 | ) | (15 | ) | ||||||||||
Underlying cost efficiency ratio | 87.9% | 80.3% | ||||||||||||||
Profit/(loss) before tax | ||||||||||||||||
Reported profit/(loss) before tax | (3,414 | ) | 4,671 | |||||||||||||
Currency translation adjustment24 | (95 | ) | ||||||||||||||
Own credit spread26 | 4,110 | (2,947 | ) | |||||||||||||
Acquisitions, disposals and dilutions | 3 | – | ||||||||||||||
Underlying profit before tax | 699 | 1,629 | (57 | ) | ||||||||||||
For footnotes, see page 120.
85a
Table of Contents
HSBC HOLDINGS PLC
Report of the Directors: Operating and Financial Review(continued)
2011 compared with 2010
Economic background
After growing by 2.1% in 2010,UK gross domestic product (‘GDP’) growth eased to 0.9% in 2011. The unemployment rate rose to 8.4% in December 2011. Despite the weakness in the domestic economy, an increase in the rate of value added tax and rising oil prices early in the year pushed the annual rate of consumer price index (‘CPI’) inflation to 5.2% in September 2011 before moderating to 3.6% in December 2011. The Bank of England maintained the Bank Rate at 0.5% throughout the year and expanded the size of its Asset Purchase Programme by £75bn (US$120bn) to £275bn (US$440bn) in October 2011.
Theeurozone economy grew by 1.5% in 2011, on the back of a recovery in global trade in the first half of 2011 and domestic fixed investment growth. Within the region, Germany saw the strongest recovery with GDP growing by 3%. The German unemployment rate, as measured by the International Labour Organisation, fell during the year, touching 5.5% in December but, for the eurozone as a whole, unemployment rose further to 10.4% in December. Concerns about sovereign debt sustainability persisted in 2011, leading to banking sector strains. The European Central Bank cut interest rates to 1% and introduced several new measures to ease strains in the banking sector including long-term refinancing operations of 36 months maturity and easing of commercial banks’ collateral requirements for use in these liquidity operations.
Review of performance
Our European operations reported a pre-tax profit of US$4.7bn, 9% higher than in 2010. These results included favourable fair value movements of US$2.9bn in 2011 due to the change in credit spreads on the Group’s own debt held at fair value, compared with adverse fair value movements of US$198m in 2010. In addition, 2010 included gains of US$107m and US$255m on the disposal of HSBC Insurance Brokers Limited and Eversholt Rail Group, respectively.
Underlying profit before tax, excluding these items, decreased by 61% as turmoil in eurozone sovereign debt markets dominated European market sentiment, resulting in markedly lower revenues in GB&M.
During the year, we began to reshape our business portfolio and announced the closure of our retail banking businesses in Poland and Russia, the exit of operations from Georgia and the disposal of our UK
motor insurance business. In order to improve cost efficiency and organisational effectiveness, we took measures to streamline our processes with the aim of lowering the future cost base of our operations while maintaining high standards of service. As a result of these initiatives, total restructuring costs of US$404m were incurred across the region in 2011.
In RBWM, further progress was made in implementing our strategy of building long-term sustainable relationships with Premier customers. The Wealth Management business continued to develop with HSBC World Selection assets under management increasing by 21% during 2011 to £2.5bn (US$3.8bn) as a result of a strategic focus and continued marketing. The Global Investment Centre service was successfully launched in October 2011, enabling investors to hold and trade a wide range of third party and HSBC funds on-line.
We continued to support the UK housing market during 2011, achieving strong growth in mortgage balances driven by successful marketing campaigns. Our share of new lending increased to 10% in 2011, while maintaining a conservative loan to value ratio of 53% on new lending. To support our customers through the prevailing economic conditions, we committed to make available £350m (US$542m) to UK mortgage borrowers with deposits of 15% or less. In addition, an increase in the customer base of 5% contributed to a growth in our UK deposit balances of 4%.
In CMB, we made further progress on our strategy of becoming the leading international trade and business bank with a significant increase in the number of international customers, resulting in strong income growth from our trade-related business. We continue to strengthen our partnership with GB&M with a focus on driving product income growth, particularly in strategic financing and treasury risk management products. We also achieved strong growth in UK lending, reflecting our continued support to UK businesses during the difficult economic conditions. We exceeded our 2011 lending intentions under the Project Merlin agreement with the UK Government, both in terms of total and SME facilities.
In Continental Europe, we experienced strong demand in term lending and significant growth in our deposit base in both RBWM and CMB, reflecting marketing and pricing initiatives. Our Trade and Supply Chain business performed strongly across the region, following the launch of our export initiative during 2011. In Europe we now have 18 countries with full renminbi functionality with the
85b
Table of Contents
HSBC HOLDINGS PLC
Report of the Directors: Operating and Financial Review(continued)
ability to settle trade transactions via either Shanghai or Hong Kong.
We won several awards in GB&M including ‘Best Debt House’ in Western Europe and the UK fromEuromoney Awards for Excellence in 2011. We continued to invest in technology platforms including Equities and Prime Services and are therefore well positioned to capture medium-term opportunities in the region. We also continued to focus on cross-border initiatives to position ourselves to take advantage of trade flows. In Payments & Cash Management, enhanced network capabilities together with innovative liquidity, channel and payables solutions allowed us to win substantial business across the corporate and financial institution business segments.
In GPB, revenue growth was driven by increased client activity as we leveraged our global businesses’ strengths and connectivity. GPB continues to build on its expertise in alternative investments, emerging markets and foreign exchange.
The pace of regulatory reform is expected to gain momentum. This will include forthcoming legislation arising from the UK Independent Commission on Banking which is likely to require us to make significant changes to our corporate structure and business activities conducted through our UK banking subsidiary, HSBC Bank.
Net interest income decreased by 6%, reflecting the decline in Balance Sheet Management revenues as higher-yielding positions matured and opportunities for reinvestment at similar yields were limited by the prevailing low interest rate environment. This was coupled with a fall in Credit and Lending net interest income as a result of lower balances, coupled with a decrease in effective yields and lower asset holdings in our legacy credit portfolio as a result of maturities and disposals aimed at reducing capital consumption. The above factors were partly offset by higher net interest income in CMB, driven by an increase in term lending balances in the UK and Continental Europe as a result of targeted campaigns during 2010 and 2011. Net interest income also benefited from strong mortgage balance growth in the UK along with strong deposit growth across the region, mainly driven by marketing campaigns, although offset in part by strong competition for deposits resulting in lower deposit spreads, notably in RBWM in the UK.
Net fee income declined by 4% as management services income generated from the securities investment conduits within our legacy credit portfolio was lower, along with higher intercompany
fees payable on intra-group referrals. In addition, overdraft fees declined due to reduced customer appetite for debt in the current market conditions. This was partly offset by higher levels of client activity in GPB due to an increase in transaction volumes related to higher market volatility.
Net trading income decreased by 33%, due to significantly lower trading revenues in Credit and Rates as turmoil in eurozone sovereign debt markets escalated in the second half of 2011. Increased risk aversion and limited client activity led to a significant widening of spreads on certain eurozone sovereign and corporate bonds, resulting in losses in our Credit and Rates businesses. In addition, legacy credit revenues fell due to the non-recurrence of the price appreciation on legacy assets in 2010. Lower favourable foreign exchange movements were also reported on trading assets held as economic hedges of foreign currency debt designated at fair value. These offset lower adverse foreign exchange movements on the foreign currency debt which are reported in ‘Net expense from financial instruments designated at fair value’.
Trading income included a favourable fair value movement of US$391m from structured liabilities, mainly in Rates, as credit spreads widened compared with adverse fair value movements of US$29m in 2010. In our Equities business, revenues rose as investment in platforms improved our competitive positioning and helped capture increased client flows. This was coupled with lower losses on portfolio hedges in Global Banking compared with the previous year.
Net expense from financial instruments designated at fair value was US$479m, reflecting net investment losses during 2011 on assets held by our insurance business to meet liabilities under insurance and investment contracts as equity markets fell, notably in the second half of 2011, compared with gains reported in 2010. To the extent that these losses were attributable to policyholders holding unit-linked insurance policies and insurance or investment contracts with DPF, there was a corresponding decrease in ‘Net insurance claims incurred and movement in liabilities to policyholders’. These losses were partly offset by lower adverse foreign exchange movements on foreign currency debt designated at fair value, issued as part of our overall funding strategy, with an offset reported in ‘Net trading income’.
Gains less losses from financial investments were broadly in line with 2010. Net gains from the disposal of available-for-sale debt securities increased as part of normal portfolio management
85c
Table of Contents
HSBC HOLDINGS PLC
Report of the Directors: Operating and Financial Review(continued)
activities. These were offset by lower gains from the disposal of available-for-sale equity securities as a deterioration in market confidence resulted in fewer disposal opportunities and lower gains from the disposal of private equity investments. In addition, there were write-downs of our equity investments in real estate companies.
Net earned insurance premiums decreased by 3%, resulting from the non-renewal and transfer to third parties of certain contracts in our Irish business and the continued run-off and subsequent disposal of our motor insurance business in the UK. This was partly offset by an increase in premiums as we launched targeted sales campaigns, notably for investment contracts with DPF in France, and expanded distribution channels for unit-linked products in the UK.
Other operating income decreased by 15%, driven by the non-recurrence of a gain on the sale and leaseback of our Paris headquarters in 2010. In addition, there was a reduction in the PVIF asset from net experience and assumption updates and a higher unwind of cash flows related to the growing in-force book, compared with 2010. This reduction was partly offset by a rise in the PVIF asset as a result of higher life insurance sales and a positive impact from a refinement to the PVIF calculation during 2011.
Net insurance claims incurred and movement in liabilities to policyholders decreased by 28% as a result of investment losses experienced in 2011 on unit-linked insurance policies and insurance and investment contracts with DPF as equity markets declined, which contrasted with investment gains in 2010. Also, the non-renewal and transfer to third parties of certain contracts in the Irish business and the continued run-off and subsequent disposal of our legacy motor business in the UK resulted in a decrease in net insurance claims incurred and movement in liabilities to policyholders. Partly offsetting these declines were increases in liabilities to policyholders established for new business written.
Loan impairment charges and other credit risk provisions decreased by 20% to US$2.5bn. This mainly reflected a range of successful initiatives
taken to mitigate credit risk within RBWM including a focus on monitoring and identifying customers facing financial hardship. This resulted in lower delinquency rates across both the secured and unsecured lending portfolios. In CMB, loan impairment charges declined as the non-recurrence of specific provisions in the UK was partly offset by higher specific provisions related to a small number of customers in Greece. In GB&M, we recorded a charge of US$145m to write down to market value available-for-sale Greek sovereign debt now judged to be impaired. In addition, impairments of US$46m were included in our GPB and insurance businesses in relation to Greek available-for-sale debt securities. These were partly offset by lower credit risk provisions on ABSs as the losses arising in the underlying collateral pools generated lower charges on ABSs.
Operating expenses increased by 9%. This included provisions of US$898m relating to UK customer redress programmes, including a charge in respect of possible mis-selling of PPI in previous years, a cost of US$570m in respect of the UK bank levy and restructuring provisions of US$404m. These were partly offset by a credit of US$587m resulting from a change in the inflation measure used to calculate the defined benefit obligation for deferred pensions in the UK. Costs in 2010 included one-off payroll and bonus taxes of US$354m (US$324m as reported) in the UK and France. Excluding these items, operating expenses rose as we incurred higher regulatory and compliance costs, along with an increase in expenses as a result of the strengthening of the Swiss franc, which accounts for a significant proportion of the GPB cost base. In GB&M, performance-related awards were substantially lower than in 2010, reflecting the decline in revenues, although this was mostly offset by higher amortisation charges for previous years’ performance shares and an acceleration in the expense recognition of current-year deferred bonus awards. Notwithstanding these factors, we have achieved about US$300m of sustainable savings during 2011. This has enabled the funding of investment in strategic initiatives, including the development of Prime Services and equity market capabilities and the expansion of the Rates and Foreign Exchange e-commerce platforms.
85d
Table of Contents
HSBC HOLDINGS PLC
Report of the Directors: Operating and Financial Review(continued)
Reconciliation of reported and underlying profit before tax
2011 compared with 2010 – Europe31
2010 as reported | 2010 ments32 US$m | Currency translation adjustment24 US$m | 2010 at 2011 rates33 US$m | 2011 as reported | 2011 ments32 US$m | 2011 under- lying US$m | Re- ported change25 % | Under- lying change25 % | ||||||||||||||||||||||||||||||||||||||||||
Net interest income | 11,250 | 48 | 365 | 11,663 | 11,001 | – | 11,001 | (2 | ) | (6 | ) | |||||||||||||||||||||||||||||||||||||||
Net fee income | 6,371 | (55 | ) | 176 | 6,492 | 6,236 | – | 6,236 | (2 | ) | (4 | ) | ||||||||||||||||||||||||||||||||||||||
Changes in fair value26 | (198 | ) | 198 | – | – | 2,947 | (2,947 | ) | – | – | ||||||||||||||||||||||||||||||||||||||||
Other income27 | 5,327 | (499 | ) | 188 | 5,016 | 4,062 | – | 4,062 | (24 | ) | (19 | ) | ||||||||||||||||||||||||||||||||||||||
Net operating income21 | 22,750 | (308 | ) | 729 | 23,171 | 24,246 | (2,947 | ) | 21,299 | 7 | (8 | ) | ||||||||||||||||||||||||||||||||||||||
Loan impairment charges and other credit risk provisions | (3,020 | ) | – | (112 | ) | (3,132 | ) | (2,512 | ) | – | (2,512 | ) | 17 | 20 | ||||||||||||||||||||||||||||||||||||
Net operating income | 19,730 | (308 | ) | 617 | 20,039 | 21,734 | (2,947 | ) | 18,787 | 10 | (6 | ) | ||||||||||||||||||||||||||||||||||||||
Operating expenses | (15,445 | ) | 220 | (436 | ) | (15,661 | ) | (17,069 | ) | – | (17,069 | ) | (11 | ) | (9 | ) | ||||||||||||||||||||||||||||||||||
Operating profit | 4,285 | (88 | ) | 181 | 4,378 | 4,665 | (2,947 | ) | 1,718 | 9 | (61 | ) | ||||||||||||||||||||||||||||||||||||||
Income from associates | 17 | – | (14 | ) | 3 | 6 | – | 6 | (65 | ) | 100 | |||||||||||||||||||||||||||||||||||||||
Profit before tax | 4,302 | (88 | ) | 167 | 4,381 | 4,671 | (2,947 | ) | 1,724 | 9 | (61 | ) | ||||||||||||||||||||||||||||||||||||||
For footnotes, see page 120.
85e
Table of Contents
HSBC HOLDINGS PLC
Report of the Directors: Operating and Financial Review(continued)
Profit/(loss) before tax and balance sheet data – Europe
| 2012 | ||||||||||||||||||||||||||||||||||||||||||
|
| Retail Banking and Wealth Management US$m |
|
| Commercial Banking US$m |
|
| Global Banking and Markets US$m |
|
| Global Private Banking US$m |
|
| Other US$m |
|
| Inter- segment elimination85 US$m |
|
| Total US$m |
| ||||||||||||||||||||||
| Profit before tax | ||||||||||||||||||||||||||||||||||||||||||
Net interest income/(expense) | 5,437 | 3,228 | 1,409 | 820 | (543 | ) | 43 | 10,394 | ||||||||||||||||||||||||||||||||||
Net fee income | 2,622 | 1,658 | 1,032 | 848 | 9 | – | 6,169 | |||||||||||||||||||||||||||||||||||
Trading income excluding net interest income | 67 | 26 | 848 | 216 | 25 | – | 1,182 | |||||||||||||||||||||||||||||||||||
Net interest income on trading activities | 7 | 14 | 1,500 | 14 | 33 | (43 | ) | 1,525 | ||||||||||||||||||||||||||||||||||
Net trading income78 | 74 | 40 | 2,348 | 230 | 58 | (43 | ) | 2,707 | ||||||||||||||||||||||||||||||||||
Changes in fair value of long-term debt issued and related derivatives | – | – | – | – | (3,091 | ) | – | (3,091 | ) | |||||||||||||||||||||||||||||||||
Net income/(expense) from other financial instruments designated at fair value | 770 | 139 | 1,073 | – | (1,106 | ) | – | 876 | ||||||||||||||||||||||||||||||||||
Net income/(expense) from financial instruments designated at fair value | 770 | 139 | 1,073 | – | (4,197 | ) | – | (2,215 | ) | |||||||||||||||||||||||||||||||||
Gains less losses from financial investments | (5 | ) | (1 | ) | 375 | (3 | ) | (2 | ) | – | 364 | |||||||||||||||||||||||||||||||
Dividend income | – | 1 | 104 | 3 | 3 | – | 111 | |||||||||||||||||||||||||||||||||||
Net earned insurance premiums | 3,150 | 438 | – | 42 | – | – | 3,630 | |||||||||||||||||||||||||||||||||||
Other operating income | 84 | 58 | 88 | 61 | 796 | (9 | ) | 1,078 | ||||||||||||||||||||||||||||||||||
Total operating income/(expense) | 12,132 | 5,561 | 6,429 | 2,001 | (3,876 | ) | (9 | ) | 22,238 | |||||||||||||||||||||||||||||||||
Net insurance claims86 | (4,054 | ) | (536 | ) | – | (40 | ) | – | – | (4,630 | ) | |||||||||||||||||||||||||||||||
Net operating income/(expense)21 | 8,078 | 5,025 | 6,429 | 1,961 | (3,876 | ) | (9 | ) | 17,608 | |||||||||||||||||||||||||||||||||
Loan impairment charges and other credit risk provisions | (347 | ) | (1,109 | ) | (436 | ) | (29 | ) | – | – | (1,921 | ) | ||||||||||||||||||||||||||||||
Net operating income/(expense) | 7,731 | 3,916 | 5,993 | 1,932 | (3,876 | ) | (9 | ) | 15,687 | |||||||||||||||||||||||||||||||||
Total operating expenses | (7,225 | ) | (2,708 | ) | (4,999 | ) | (1,431 | ) | (2,741 | ) | 9 | (19,095 | ) | |||||||||||||||||||||||||||||
Operating profit/(loss) | 506 | 1,208 | 994 | 501 | (6,617 | ) | – | (3,408 | ) | |||||||||||||||||||||||||||||||||
Share of profit/(loss) in associates and joint ventures | 3 | – | (8 | ) | (2 | ) | 1 | – | (6 | ) | ||||||||||||||||||||||||||||||||
Profit/(loss) before tax | 509 | 1,208 | 986 | 499 | (6,616 | ) | – | (3,414 | ) | |||||||||||||||||||||||||||||||||
| % | % | % | % | % | % | |||||||||||||||||||||||||||||||||||||
Share of HSBC’s profit before tax | 2.5 | 5.9 | 4.8 | 2.4 | (32.0 | ) | (16.5 | ) | ||||||||||||||||||||||||||||||||||
Cost efficiency ratio | 89.4 | 53.9 | 77.8 | 73.0 | (70.7 | ) | 108.4 | |||||||||||||||||||||||||||||||||||
| Balance sheet data74 | ||||||||||||||||||||||||||||||||||||||||||
| US$m | US$m | US$m | US$m | US$m | US$m | |||||||||||||||||||||||||||||||||||||
Loans and advances to customers (net) | 170,002 | 105,796 | 156,798 | 29,963 | 881 | 463,440 | ||||||||||||||||||||||||||||||||||||
Total assets | 240,744 | 132,718 | 1,044,507 | 76,145 | 75,513 | (180,387 | ) | 1,389,240 | ||||||||||||||||||||||||||||||||||
Customer accounts | 191,024 | 121,648 | 184,473 | 57,125 | 739 | 555,009 | ||||||||||||||||||||||||||||||||||||
86
Table of Contents
HSBC HOLDINGS PLC
Report of the Directors: Operating and Financial Review(continued)
| 2011 | ||||||||||||||||||||||||||||||||||||||||||
|
| Retail Banking and Wealth Management US$m |
|
| Commercial Banking US$m |
|
| Global Banking and Markets US$m |
|
| Global Private Banking US$m |
|
| Other US$m |
|
| Inter- segment elimination85 US$m |
|
| Total US$m |
| ||||||||||||||||||||||
| Profit before tax | ||||||||||||||||||||||||||||||||||||||||||
Net interest income/(expense) | 5,653 | 3,107 | 2,102 | 936 | (574 | ) | (223 | ) | 11,001 | |||||||||||||||||||||||||||||||||
Net fee income | 2,633 | 1,640 | 989 | 942 | 32 | – | 6,236 | |||||||||||||||||||||||||||||||||||
Trading income/(expense) excluding net interest income | 40 | 5 | 602 | 191 | (201 | ) | – | 637 | ||||||||||||||||||||||||||||||||||
Net interest income on trading activities | 11 | 16 | 1,205 | 16 | 53 | 223 | 1,524 | |||||||||||||||||||||||||||||||||||
Net trading income/(expense)78 | 51 | 21 | 1,807 | 207 | (148 | ) | 223 | 2,161 | ||||||||||||||||||||||||||||||||||
Changes in fair value of long-term debt issued and related derivatives | – | – | – | – | 3,180 | – | 3,180 | |||||||||||||||||||||||||||||||||||
Net income/(expense) from other financial instruments designated at fair value | (672 | ) | (21 | ) | (65 | ) | – | 46 | – | (712 | ) | |||||||||||||||||||||||||||||||
Net income/(expense) from financial instruments designated at fair value | (672 | ) | (21 | ) | (65 | ) | – | 3,226 | – | 2,468 | ||||||||||||||||||||||||||||||||
Gains less losses from financial investments | 51 | (1 | ) | 453 | 1 | 11 | – | 515 | ||||||||||||||||||||||||||||||||||
Dividend income | 1 | 1 | 42 | 4 | 1 | – | 49 | |||||||||||||||||||||||||||||||||||
Net earned insurance premiums | 3,768 | 381 | – | – | (13 | ) | – | 4,136 | ||||||||||||||||||||||||||||||||||
Other operating income | 95 | 58 | 187 | 5 | 760 | 74 | 1,179 | |||||||||||||||||||||||||||||||||||
Total operating income | 11,580 | 5,186 | 5,515 | 2,095 | 3,295 | 74 | 27,745 | |||||||||||||||||||||||||||||||||||
Net insurance claims86 | (3,212 | ) | (287 | ) | – | – | – | – | (3,499 | ) | ||||||||||||||||||||||||||||||||
Net operating income21 | 8,368 | 4,899 | 5,515 | 2,095 | 3,295 | 74 | 24,246 | |||||||||||||||||||||||||||||||||||
Loan impairment (charges)/recoveries and other credit risk provisions | (596 | ) | (960 | ) | (876 | ) | (82 | ) | 2 | – | (2,512 | ) | ||||||||||||||||||||||||||||||
Net operating income | 7,772 | 3,939 | 4,639 | 2,013 | 3,297 | 74 | 21,734 | |||||||||||||||||||||||||||||||||||
Total operating expenses | (6,450 | ) | (2,252 | ) | (4,569 | ) | (1,456 | ) | (2,268 | ) | (74 | ) | (17,069 | ) | ||||||||||||||||||||||||||||
Operating profit | 1,322 | 1,687 | 70 | �� | 557 | 1,029 | – | 4,665 | ||||||||||||||||||||||||||||||||||
Share of profit/(loss) in associates and joint ventures | – | – | 7 | – | (1 | ) | – | 6 | ||||||||||||||||||||||||||||||||||
Profit before tax | 1,322 | 1,687 | 77 | 557 | 1,028 | – | 4,671 | |||||||||||||||||||||||||||||||||||
| % | % | % | % | % | % | |||||||||||||||||||||||||||||||||||||
Share of HSBC’s profit before tax | 6.0 | 7.7 | 0.4 | 2.5 | 4.7 | 21.3 | ||||||||||||||||||||||||||||||||||||
Cost efficiency ratio | 77.1 | 46.0 | 82.8 | 69.5 | 68.8 | 70.4 | ||||||||||||||||||||||||||||||||||||
| Balance sheet data74 | ||||||||||||||||||||||||||||||||||||||||||
| US$m | US$m | US$m | US$m | US$m | US$m | |||||||||||||||||||||||||||||||||||||
Loans and advances to customers (net) | 150,205 | 98,154 | 156,903 | 28,378 | 696 | 434,336 | ||||||||||||||||||||||||||||||||||||
Total assets | 210,140 | 124,049 | 1,021,486 | 77,410 | 63,141 | (214,281 | ) | 1,281,945 | ||||||||||||||||||||||||||||||||||
Customer accounts | 176,134 | 104,530 | 154,208 | 58,265 | 267 | 493,404 | ||||||||||||||||||||||||||||||||||||
For footnotes, see page 120.
87
Table of Contents
HSBC HOLDINGS PLC
Report of the Directors: Operating and Financial Review(continued)
Profit/(loss) before tax and balance sheet data – Europe(continued)
| 2010 | ||||||||||||||||||||||||||||||||||||||||||
|
| Retail Banking and Wealth Management US$m |
|
| Commercial Banking US$m |
|
| Global Banking and Markets US$m |
|
| Global Private Banking US$m |
|
| Other US$m |
|
| Inter- segment elimination85 US$m |
|
| Total US$m |
| ||||||||||||||||||||||
| Profit/(loss) before tax | ||||||||||||||||||||||||||||||||||||||||||
Net interest income/(expense) | 5,537 | 2,774 | 2,935 | 871 | (654 | ) | (213 | ) | 11,250 | |||||||||||||||||||||||||||||||||
Net fee income | 2,559 | 1,570 | 1,320 | 883 | 39 | – | 6,371 | |||||||||||||||||||||||||||||||||||
Trading income/(expense) excluding net interest income | (6 | ) | 3 | 1,541 | 185 | (262 | ) | – | 1,461 | |||||||||||||||||||||||||||||||||
Net interest income/(expense) on trading activities | (1 | ) | 19 | 1,127 | 21 | 23 | 213 | 1,402 | ||||||||||||||||||||||||||||||||||
Net trading income/(expense)78 | (7 | ) | 22 | 2,668 | 206 | (239 | ) | 213 | 2,863 | |||||||||||||||||||||||||||||||||
Changes in fair value of long-term debt issued and related derivatives | – | – | – | – | (365 | ) | – | (365 | ) | |||||||||||||||||||||||||||||||||
Net income/(expense) from other financial instruments designated at fair value | 496 | 113 | (23 | ) | – | 61 | – | 647 | ||||||||||||||||||||||||||||||||||
Net income/(expense) from financial instruments designated at fair value | 496 | 113 | (23 | ) | – | (304 | ) | – | 282 | |||||||||||||||||||||||||||||||||
Gains less losses from financial investments | (36 | ) | – | 525 | (7 | ) | 4 | – | 486 | |||||||||||||||||||||||||||||||||
Dividend income | – | 1 | 16 | 2 | 1 | – | 20 | |||||||||||||||||||||||||||||||||||
Net earned insurance premiums | 3,800 | 278 | – | – | (11 | ) | – | 4,067 | ||||||||||||||||||||||||||||||||||
Other operating income | 187 | 163 | 817 | 7 | 754 | 189 | 2,117 | |||||||||||||||||||||||||||||||||||
Total operating income/(expense) | 12,536 | 4,921 | 8,258 | 1,962 | (410 | ) | 189 | 27,456 | ||||||||||||||||||||||||||||||||||
Net insurance claims86 | (4,364 | ) | (342 | ) | – | – | – | – | (4,706 | ) | ||||||||||||||||||||||||||||||||
Net operating income/(expense)21 | 8,172 | 4,579 | 8,258 | 1,962 | (410 | ) | 189 | 22,750 | ||||||||||||||||||||||||||||||||||
Loan impairment (charges)/recoveries and other credit risk provisions | (1,217 | ) | (997 | ) | (783 | ) | (26 | ) | 3 | – | (3,020 | ) | ||||||||||||||||||||||||||||||
Net operating income/(expense) | 6,955 | 3,582 | 7,475 | 1,936 | (407 | ) | 189 | 19,730 | ||||||||||||||||||||||||||||||||||
Total operating expenses | (5,647 | ) | (2,378 | ) | (4,784 | ) | (1,296 | ) | (1,151 | ) | (189 | ) | (15,445 | ) | ||||||||||||||||||||||||||||
Operating profit/(loss) | 1,308 | 1,204 | 2,691 | 640 | (1,558 | ) | – | 4,285 | ||||||||||||||||||||||||||||||||||
Share of profit in associates and joint ventures | 4 | 1 | 12 | – | – | – | 17 | |||||||||||||||||||||||||||||||||||
Profit/(loss) before tax | 1,312 | 1,205 | 2,703 | 640 | (1,558 | ) | – | 4,302 | ||||||||||||||||||||||||||||||||||
| % | % | % | % | % | % | |||||||||||||||||||||||||||||||||||||
Share of HSBC’s profit before tax | 6.9 | 6.3 | 14.2 | 3.4 | (8.2 | ) | 22.6 | |||||||||||||||||||||||||||||||||||
Cost efficiency ratio | 69.1 | 51.9 | 57.9 | 66.1 | (280.7 | ) | 67.9 | |||||||||||||||||||||||||||||||||||
| Balance sheet data74 | ||||||||||||||||||||||||||||||||||||||||||
| US$m | US$m | US$m | US$m | US$m | US$m | |||||||||||||||||||||||||||||||||||||
Loans and advances to customers (net) | 145,069 | 91,744 | 170,369 | 27,629 | 988 | 435,799 | ||||||||||||||||||||||||||||||||||||
Total assets | 205,032 | 111,356 | 962,861 | 76,631 | 65,824 | (172,177 | ) | 1,249,527 | ||||||||||||||||||||||||||||||||||
Customer accounts | 169,016 | 96,597 | 169,836 | 56,114 | – | 491,563 | ||||||||||||||||||||||||||||||||||||
For footnotes, see page 120.
87a
Table of Contents
HSBC HOLDINGS PLC
Report of the Directors: Operating and Financial Review(continued)
HSBC’s principal banking subsidiaries in Hong Kong are The Hongkong and Shanghai Banking Corporation Limited and Hang Seng Bank Limited. The former is the largest bank incorporated in Hong Kong and is our flagship bank in the Asia-Pacific region. It is one of Hong Kong’s three note-issuing banks, accounting for more than 60% by value of banknotes in circulation in 2012.
| 2012 | 2011 | 2010 | ||||||||||||||
| US$m | US$m | US$m | ||||||||||||||
Net interest income | 5,316 | 4,691 | 4,246 | |||||||||||||
Net fee income | 3,335 | 3,097 | 2,962 | |||||||||||||
Net trading income | 1,463 | 1,189 | 1,312 | |||||||||||||
Other income | 2,308 | 1,705 | 1,682 | |||||||||||||
Net operating income21 | 12,422 | 10,682 | 10,202 | |||||||||||||
LICs76 | (74 | ) | (156 | ) | (114 | ) | ||||||||||
Net operating income | 12,348 | 10,526 | 10,088 | |||||||||||||
Total operating expenses | (4,848 | ) | (4,758 | ) | (4,431 | ) | ||||||||||
Operating profit | 7,500 | 5,768 | 5,657 | |||||||||||||
Income from associates77 | 82 | 55 | 35 | |||||||||||||
Profit before tax | 7,582 | 5,823 | 5,692 | |||||||||||||
Cost efficiency ratio | 39.0% | 44.5% | 43.4% | |||||||||||||
RoRWA66 | 7.0% | 5.3% | 5.0% | |||||||||||||
Year-end staff numbers | 27,742 | 28,984 | 29,171 | |||||||||||||
24%
growth in underlying profit before tax
Market leader in offshore renminbi bond
issuance
Best Commercial Bank 2012
(FinanceAsia)
For footnotes, see page 120.
Economic background
TheHong Kong economy started 2012 on a strong footing, but lost momentum in the second quarter as global trade flows slowed and the mainland Chinese economy cooled, causing GDP to contract slightly. Domestic demand stayed resilient, however, supported by continued wage growth, and firm job market conditions and asset prices. This underpinned investment and private consumption growth, leading the economy back into expansion in the third quarter (0.6%, quarter-on-quarter, seasonally adjusted). Slower economic momentum and deflationary pressures in mainland China allowed the pressure on Hong Kong’s asset prices to ease through most of 2012, resulting in reduced CPI inflation of 4.1%, compared with 5.3% in 2011.
Review of performance
Reported pre-tax profits from our operations in Hong Kong were US$7.6bn compared with US$5.8bn in 2011, an increase of 30% on both a reported and a constant currency basis.
Reported profits included gains on the sale of our shares in Global Payments Asia-Pacific Ltd of US$212m and the HSBC and Hang Seng Bank general insurance businesses of US$117m and US$46m, respectively. Excluding these gains and associated operating results, underlying profit of US$7.2bn increased by 24%, driven by higher net interest income in CMB and RBWM, the gain of US$314m on the sale of non-strategic investments in India, higher trading revenues in GB&M, increased fee income in both CMB and GB&M, and a reduction in loan impairment charges. These favourable movements were partly offset by higher operating expenses.
In RBWM, we continue to develop our Wealth Management services for our retail customers and launched new investment funds, including the Global High Yield Bond Fund which attracted over US$1bn of subscriptions by the end of the year. The sale of the general insurance businesses enabled us to focus on life insurance manufacturing, where we maintained our market leadership position. We also led the market in deposits, mortgages, mandatory provident funds and credit cards. We maintained our prudent lending approach with average loan-to-value ratios of 48% on new mortgage drawdowns and an estimated 32% on the portfolio as a whole. We now offer renminbi current accounts for non-residents and launched the first mobile payment solution in the region, enabling contactless credit card transactions through Visa payWave terminals.
88
Table of Contents
HSBC HOLDINGS PLC
Report of the Directors: Operating and Financial Review(continued)
Profit/(loss) before tax by global business
2012 US$m | 2011 US$m | 2010 US$m | ||||||||||||||
Retail Banking and Wealth Management | 3,694 | 3,022 | 3,001 | |||||||||||||
Commercial Banking | 2,188 | 1,608 | 1,352 | |||||||||||||
Global Banking and Markets | 1,518 | 1,316 | 1,347 | |||||||||||||
Global Private Banking | 249 | 188 | 227 | |||||||||||||
Other | (67 | ) | (311 | ) | (235 | ) | ||||||||||
| 7,582 | 5,823 | 5,692 | ||||||||||||||
In CMB, we capitalised on our international connectivity and our standing as a leading trade finance bank to grow trade-related revenues by 10%, particularly with mainland China. The collaboration between CMB and GB&M continued to strengthen, with revenue growth of 13%, most notably from the provision of foreign exchange products to our corporate customers. We won theFinanceAsia award for ‘Best Commercial Bank 2012’ and tenAsiamoney awards for Payments and Cash Management, including the ‘Best Local Cash Management Bank’ for small, medium and large corporates.
In GB&M, we led the market in Hong Kong dollar bond issuance and were the leading bookrunner for corporate high yield bonds in Asia excluding Japan. We continued to lead the market in offshore renminbi bond issuance with several high-profile deals completed in 2012 for multinationals accessing the market.
We also reinforced our position as a leading international bank for offshore renminbi products, winning theAsia Risk ‘Renminbi House of the Year’ award and all seven product categories inAsiamoney’s ‘Offshore Renminbi Survey’.
The following commentary is on a constant currency basis.
Net interest income was 13% higher than in 2011, notably in CMB and RBWM, driven by increased customer loans and deposit balances and by growth in the insurance portfolio.
In RBWM, we continued to grow our average mortgage balances, reflecting continued strength in the property market. In CMB, average term and trade-related lending balances were higher as we capitalised on trade and capital flows.
Asset spreads in CMB were marginally wider than in 2011 on trade-related and other lending due to repricing, though they began to narrow towards the end of the year.
Net interest income also rose due to higher average deposit balances, notably in RBWM, in part reflecting reduced net outflows from customer
accounts into investments. In addition, deposit spreads widened.
Net fee income of US$3.3bn was 7% higher than in 2011. Fees rose from increased transaction volumes in trade services, remittances and account services as we continued to intermediate international trade and capital flows. Fee income also increased in both CMB and GB&M as we arranged more debt issues for our customers to satisfy their funding requirements while the market for corporate debt improved. In RBWM, fees from unit trusts rose reflecting increased sales volumes, despite customers increasingly preferring lower risk products with lower fees. These increases were largely offset by a reduction in brokerage income from lower market turnover as a result of weaker investor sentiment.
Net trading income increased by 23% from lower adverse fair value movements on derivatives relating to certain provident funds, following reductions in long-term investment returns in 2011. There was also a strong performance in GB&M, notably in Rates trading activities, which reflected increased client demand for risk management products, particularly in yen and renminbi, in part from increased cross-currency debt issuance by corporates. Credit trading revenues also rose, in part due to increased client activity. This was partly offset by a net charge as a result of a change in estimation methodology in respect of the valuation adjustments on derivatives.
Net income from financial instruments designated at fair value was US$447m compared with an expense of US$540m in 2011, due to net investment gains on assets held by the Insurance business (compared with net losses in 2011) as a result of more favourable equity market conditions. To the extent that these investment gains were attributed to policyholders of unit-linked insurance policies and insurance contracts with DPF, there was a corresponding increase in ‘Net insurance claims incurred and movement in liabilities to policyholders’.
89
Table of Contents
HSBC HOLDINGS PLC
Report of the Directors: Operating and Financial Review(continued)
Gains less losses from financial investments were US$322m compared with US$25m in 2011, largely from the gain of US$314m on the sale of our shares in four non-strategic investments in India.
Net earned insurance premiums grew by 17% following increased new sales and renewals of life insurance products. The growth in premiums resulted in a corresponding increase in ‘Net insurance claims incurred and movement in liabilities to policyholders’.
Other operating income of US$1.9bn was US$235m higher than in 2011. We completed the sale of our shares in Global Payments Asia-Pacific Ltd and the HSBC and Hang Seng Bank general insurance businesses, realising gains of US$212m, US$117m and US$46m, respectively. While the value of the PVIF asset rose, this was not to the same extent as in 2011 as increased insurance sales in 2012 were more than offset by lower positive assumption updates during 2012 compared with 2011 and the non-recurrence of the benefit from the refinement to the PVIF asset calculation in 2011.
Net insurance claims incurred and movement in liabilities to policyholders increased by 38%, driven
by net investment gains on fair value of the assets held to support policyholder contracts, compared with net losses in 2011. In addition, policyholder liabilities were established for new business, reflecting the higher premiums, though this was partly offset by the disposal of the insurance businesses in 2012.
Loan impairment charges and other credit risk provisions reduced to US$74m from US$157m in 2011, largely due to lower specific impairment charges in CMB and the non-recurrence of charges relating to available-for-sale Greek sovereign debt securities.
Operating expenses increased by 2%, primarily due to higher systems implementation and processing costs as we continued to invest in our technology infrastructure, and increased property rental costs. Salaries and wages were broadly unchanged as wage inflation was largely offset by reduced average staff numbers as we continued to improve efficiency across our operations, generating sustainable annual savings of approximately US$190m.
90
Table of Contents
HSBC HOLDINGS PLC
Report of the Directors: Operating and Financial Review(continued)
Reconciliation of reported and constant currency profit before tax – Hong Kong
2011 as reported US$m | Currency translation adjustment24 US$m | 2011 at 2012 exchange rates US$m | 2012 as reported US$m | Reported change25 % | Constant currency change25 % | |||||||||||||||||||||||||||||
Net interest income | 4,691 | 20 | 4,711 | 5,316 | 13 | 13 | ||||||||||||||||||||||||||||
Net fee income | 3,097 | 11 | 3,108 | 3,335 | 8 | 7 | ||||||||||||||||||||||||||||
Other income27 | 2,894 | 8 | 2,902 | 3,771 | 30 | 30 | ||||||||||||||||||||||||||||
Net operating income21 | 10,682 | 39 | 10,721 | 12,422 | 16 | 16 | ||||||||||||||||||||||||||||
Loan impairment charges and other credit risk provisions | (156 | ) | (1 | ) | (157 | ) | (74 | ) | 53 | 53 | ||||||||||||||||||||||||
Net operating income | 10,526 | 38 | 10,564 | 12,348 | 17 | 17 | ||||||||||||||||||||||||||||
Operating expenses | (4,758 | ) | (18 | ) | (4,776 | ) | (4,848 | ) | (2 | ) | (2 | ) | ||||||||||||||||||||||
Operating profit | 5,768 | 20 | 5,788 | 7,500 | 30 | 30 | ||||||||||||||||||||||||||||
Income from associates | 55 | – | 55 | 82 | 49 | 49 | ||||||||||||||||||||||||||||
Profit before tax | 5,823 | 20 | 5,843 | 7,582 | 30 | 30 | ||||||||||||||||||||||||||||
For footnotes, see page 120.
Reconciliation of reported and underlying29 items – Hong Kong
| Year ended 31 December | ||||||||||||||||
2012 US$m | 2011 US$m | Change % | ||||||||||||||
Revenue21 | ||||||||||||||||
Reported revenue | 12,422 | 10,682 | 16 | |||||||||||||
Currency translation adjustment24 | 39 | |||||||||||||||
Own credit spread26 | – | – | ||||||||||||||
Acquisitions, disposals and dilutions | (445 | ) | (109 | ) | ||||||||||||
Underlying revenue | 11,977 | 10,612 | 13 | |||||||||||||
Loan impairment charges and other credit risk provisions (‘LIC’s) | ||||||||||||||||
Reported LICs | (74 | ) | (156 | ) | 53 | |||||||||||
Currency translation adjustment24 | (1 | ) | ||||||||||||||
Acquisitions, disposals and dilutions | – | – | ||||||||||||||
Underlying LICs | (74 | ) | (157 | ) | 53 | |||||||||||
Operating expenses | ||||||||||||||||
Reported operating expenses | (4,848 | ) | (4,758 | ) | (2 | ) | ||||||||||
Currency translation adjustment24 | (18 | ) | ||||||||||||||
Acquisitions, disposals and dilutions | 34 | 40 | ||||||||||||||
Underlying operating expenses | (4,814 | ) | (4,736 | ) | (2 | ) | ||||||||||
Underlying cost efficiency ratio | 40.2% | 44.6% | ||||||||||||||
Profit before tax | ||||||||||||||||
Reported profit before tax | 7,582 | 5,823 | 30 | |||||||||||||
Currency translation adjustment24 | 20 | |||||||||||||||
Own credit spread26 | – | – | ||||||||||||||
Acquisitions, disposals and dilutions | (420 | ) | (82 | ) | ||||||||||||
Underlying profit before tax | 7,162 | 5,761 | 24 | |||||||||||||
For footnotes, see page 120.
90a
Table of Contents
HSBC HOLDINGS PLC
Report of the Directors: Operating and Financial Review(continued)
2011 compared with 2010
Economic background
Hong Kong registered very strong economic growth entering 2011. This eased during the course of the year due to supply chain disruptions triggered by the earthquake in Japan and some slowing in demand from mainland China following a tightening of policy to counter inflation. Nonetheless, Hong Kong GDP grew by 5% in 2011. Some slowing in the pace of growth was welcomed as it helped reduce inflationary pressures that had been mounting earlier in 2011 in both consumer and property markets. Unemployment rates in Hong Kong improved steadily during 2011, falling from 3.9% at the end of 2010 to 3.2% by the end of the year. Inter-bank interest rates stayed low during 2011, rising slightly to 0.325% by 31 December.
Review of performance
Our operations in Hong Kong reported pre-tax profits of US$5.8bn compared with US$5.7bn in 2010, an increase of 2%. On an underlying basis, excluding gains arising from the reclassification of Bao Viet as an associate and following the sale of HSBC Private Equity (Asia) Ltd, both in 2010, profit before tax rose by 5%.
The increase in profitability was driven by higher revenues from increased customer lending which reflected growth in trade flows, coupled with strong demand for wealth management products, partly offset by a rise in staff and support costs reflecting wage inflation and higher business volumes in 2011.
Following significant loan growth in 2010 and the first half of 2011, we experienced slower growth in our businesses during the second half of 2011.
In RBWM, we retained market leadership across our key products. In residential mortgages we retained the number one market position as we continued to provide competitive products for our customers. Our leading market share in life insurance reflected our strong customer focus and diverse product offerings. We also maintained market leadership in the provision of mandatory provident funds and launched a new product which offers our customers a wider choice and lower fees. We retained our number one position in cards reflecting the success of our various marketing campaigns and customer focus, and saw continued strong sales of wealth management products, though revenues were affected in the latter part of 2011 as stock market turnover reduced and investor sentiment weakened.
In CMB, we grew trade revenues as we continued to capture cross-border opportunities, particularly with mainland China, which accounted for more than half of our new-to-bank CMB customers. The number of cross-border referrals between Hong Kong and mainland China increased by 9%. We also opened four new business banking centres in Hong Kong and set up the China Corporate team in Hong Kong to service mainland Chinese companies looking to expand internationally.
We continued to strengthen the collaboration between CMB and GB&M, resulting in incremental revenue growth through the provision of foreign exchange and interest rate management products to our corporate clients.
In GB&M, we maintained our number one market position in Hong Kong dollar bond issuance and acted as a joint lead manager on the government’s first inflation-linked bond issue, the largest ever retail bond issue in Hong Kong. We also continued to enhance our equity capital markets capabilities, expanded our equity research team, and were bookrunner in six of the ten largest initial public offerings (‘IPO’s) in Hong Kong this year. During 2011 we won several awards including Best Investment Bank and Best Equity House fromFinanceAsiaand Best Flow House and Best Debt Capital Markets House in Asia fromEuromoney.
We continued to reinforce our position as a leading international renminbi bank and became the market leader in offshore renminbi bond issuance and won awards from bothFinance Asia andIFR Asia for Best Offshore Renminbi Bond House. We arranged the first ever renminbi subordinated bank bond and participated in the largest ever offshore renminbi bond deal by a sovereign issuer, demonstrating the depth and diversity of our involvement in this market.
Net interest income was 11% higher than in 2010, driven by the income from strong lending growth during 2010 and the first half of 2011 which reflected increased trade flows and demand for credit. We saw more moderate loan growth in GB&M and RBWM in the second half of 2011, which was more than offset by a reduction in certain trade finance loans in CMB. The Hong Kong property market slowed in the second half of 2011 and we continued to lend conservatively, with average loan to value ratios of 49% on new residential mortgage draw-downs and an estimated 37% on the portfolio as a whole.
Spreads narrowed in RBWM due to a shift in the product mix to lower-yielding HIBOR-linked
90b
Table of Contents
HSBC HOLDINGS PLC
Report of the Directors: Operating and Financial Review(continued)
mortgages, and in CMB as growth was concentrated in lower-margin trade financing and HIBOR-linked loans. HIBOR-linked spreads began to improve marginally in the second half of the year due to product repricing.
Average customer deposit balances rose despite a highly competitive environment, supported by the opening of new business centres, growth in the offshore renminbi market, our comprehensive suite of renminbi solutions across Trade and Supply Chain, and Payments and Cash Management.
Net fee income increased by 5% as a result of higher sales of wealth management products, particularly unit trusts reflecting increased product offerings, competitive pricing and ongoing marketing campaigns. This was achieved in the low interest rate environment in which clients sought products which could increase their returns. Card transactions grew, reflecting higher retail spending in 2011 supported by marketing campaigns. Underwriting fees rose due to our participation in many of the largest equity capital market transactions in 2011 supported by the continued enhancement of our equity market capabilities. Remittances and trade-related fees also increased reflecting increased product offerings and higher cross-border trade volumes. This was partly offset by lower broking income, notably towards the end of the year due to increased competition.
Net trading income reduced by 9%. We recorded adverse fair value movements on derivatives relating to certain provident funds as long-term investment returns fell. We also incurred losses on equity options backing an endowment product in RBWM due to unfavourable movements in the underlying equity indices which resulted in a corresponding decrease in‘Net insurance claims incurred and movement in liabilities to policyholders’.
These losses were partly offset by higher trading income in GB&M due to a rise in net interest income from trading activities from Asian government debt securities and corporate bonds. Trading income fell through lower revenues in credit trading as credit spreads widened in some markets. This was partly offset by higher revenues in foreign exchange following greater market volatility in the region and the collaboration between CMB and GB&M. In addition, revenues in Equities increased in line with improved volumes in the business.
Net expense from financial instruments designated at fair value was US$537m compared
with gains in 2010 due to investment losses on assets held by the insurance business as a result of negative movements in the equity market during the second half of 2011. To the extent that these investment losses were attributed to policyholders of unit-linked insurance policies and insurance contracts with DPF, there was a corresponding decrease in ‘Net insurance claims incurred and movement in liabilities to policyholders’.
Net earned insurance premiums increased by 18% as a result of successful sales initiatives for deferred annuities, unit-linked products and a universal life insurance product targeted at high net worth individuals. This reflected our strategic focus on wealth management, of which insurance is a key part. The growth in premiums resulted in a corresponding increase in ‘Net insurance claims incurred and movement in liabilities to policyholders’.
Other operating incomeincreased by 10%, largely due to an increase in PVIF and higher revaluation gains on investment properties. PVIF rose as a result of higher life insurance sales, a one-off gain of US$135m recognised upon the refinement of the calculation of the PVIF and a net increase from updates for experience and assumptions during 2011. Partially offsetting this was a higher unwind of cash flows related to the growing in-force book.
Loan impairment charges and other credit risk provisions increased by US$42m from a low base due to a specific impairment charge against one customer, higher collective impairment charges in CMB resulting from lending growth, and an impairment recorded in respect of available-for-sale Greek sovereign debt securities in GPB. These were partly offset by releases in GB&M relating to specific impairment charges raised in 2010.
Operating expenses rose by 7% due to higher staff costs across the business reflecting wage inflation in a competitive labour market and a rise in average staff numbers to support increased business activity. Performance costs increased in GB&M due to higher amortisation charges for previous years’ performance shares and accelerated expense recognition of current year deferred bonus awards. During 2011 we incurred US$68m of restructuring costs as we took steps to improve efficiency, including the restructuring of our regional head office.
90c
Table of Contents
HSBC HOLDINGS PLC
Report of the Directors: Operating and Financial Review(continued)
Reconciliation of reported and underlying profit before tax
2011 compared with 2010 – Hong Kong31
2010 as reported US$m | 2010 adjust- ments32 US$m | Currency translation adjustment24 US$m | 2010 at 2011 exchange rates33 US$m | 2011 as reported US$m | 2011 adjust- ments32 US$m | 2011 under- lying US$m | Re- ported change25 % | Under- lying change25 % | ||||||||||||||||||||||||||||||||||||||||||
Net interest income | 4,246 | – | (1 | ) | 4,245 | 4,691 | – | 4,691 | 10 | 11 | ||||||||||||||||||||||||||||||||||||||||
Net fee income | 2,962 | – | (3 | ) | 2,959 | 3,097 | – | 3,097 | 5 | 5 | ||||||||||||||||||||||||||||||||||||||||
Changes in fair value26 | (6 | ) | 6 | – | – | – | – | – | ||||||||||||||||||||||||||||||||||||||||||
Other income27 | 3,000 | (136 | ) | (7 | ) | 2,857 | 2,894 | – | 2,894 | (4 | ) | 1 | ||||||||||||||||||||||||||||||||||||||
Net operating income21 | 10,202 | (130 | ) | (11 | ) | 10,061 | 10,682 | – | 10,682 | 5 | 6 | |||||||||||||||||||||||||||||||||||||||
Loan impairment charges and other credit risk provisions | (114 | ) | – | – | (114 | ) | (156 | ) | – | (156 | ) | (37 | ) | (37 | ) | |||||||||||||||||||||||||||||||||||
Net operating income | 10,088 | (130 | ) | (11 | ) | 9,947 | 10,526 | – | 10,526 | 4 | 6 | |||||||||||||||||||||||||||||||||||||||
Operating expenses | (4,431 | ) | – | 2 | (4,429 | ) | (4,758 | ) | – | (4,758 | ) | (7 | ) | (7 | ) | |||||||||||||||||||||||||||||||||||
Operating profit | 5,657 | (130 | ) | (9 | ) | 5,518 | 5,768 | – | 5,768 | 2 | 5 | |||||||||||||||||||||||||||||||||||||||
Income from associates | 35 | – | (1 | ) | 34 | 55 | – | 55 | 57 | 62 | ||||||||||||||||||||||||||||||||||||||||
Profit before tax | 5,692 | (130 | ) | (10 | ) | 5,552 | 5,823 | – | 5,823 | 2 | 5 | |||||||||||||||||||||||||||||||||||||||
For footnotes, see page 120.
90d
Table of Contents
HSBC HOLDINGS PLC
Report of the Directors: Operating and Financial Review(continued)
Profit/(loss) before tax and balance sheet data – Hong Kong
| 2012 | ||||||||||||||||||||||||||||||||||||||||
Retail Banking and Wealth Management US$m | Commercial Banking US$m | Global Banking and Markets US$m | Global Private Banking US$m | Other US$m | Inter- segment elimination85 US$m | Total US$m | ||||||||||||||||||||||||||||||||||
Profit/(loss) before tax | ||||||||||||||||||||||||||||||||||||||||
Net interest income/(expense) | 2,851 | 1,629 | 1,087 | 149 | (482 | ) | 82 | 5,316 | ||||||||||||||||||||||||||||||||
Net fee income | 1,769 | 850 | 548 | 155 | 13 | – | 3,335 | |||||||||||||||||||||||||||||||||
Trading income/(expense) excluding net interest income | 176 | 163 | 666 | 170 | (2 | ) | – | 1,173 | ||||||||||||||||||||||||||||||||
Net interest income on trading activities | 10 | 2 | 352 | – | 8 | (82 | ) | 290 | ||||||||||||||||||||||||||||||||
Net trading income78 | 186 | 165 | 1,018 | 170 | 6 | (82 | ) | 1,463 | ||||||||||||||||||||||||||||||||
Changes in fair value of long-term debt issued and related derivatives | – | – | – | – | – | – | – | |||||||||||||||||||||||||||||||||
Net income/(expense) from other financial instruments designated | 511 | (53 | ) | 23 | – | (34 | ) | – | 447 | |||||||||||||||||||||||||||||||
Net income/(expense) from financial instruments designated at fair value | 511 | (53 | ) | 23 | – | (34 | ) | – | 447 | |||||||||||||||||||||||||||||||
Gains less losses from financial investments | – | – | 2 | 7 | 313 | – | 322 | |||||||||||||||||||||||||||||||||
Dividend income | – | 1 | 5 | – | 18 | – | 24 | |||||||||||||||||||||||||||||||||
Net earned insurance premiums | 5,294 | 655 | 8 | – | – | – | 5,957 | |||||||||||||||||||||||||||||||||
Other operating income | 711 | 253 | 77 | 13 | 1,152 | (282 | ) | 1,924 | ||||||||||||||||||||||||||||||||
Total operating income | 11,322 | 3,500 | 2,768 | 494 | 986 | (282 | ) | 18,788 | ||||||||||||||||||||||||||||||||
Net insurance claims86 | (5,757 | ) | (602 | ) | (7 | ) | – | – | – | (6,366 | ) | |||||||||||||||||||||||||||||
Net operating income21 | 5,565 | 2,898 | 2,761 | 494 | 986 | (282 | ) | 12,422 | ||||||||||||||||||||||||||||||||
Loan impairment (charges)/recoveries and other credit risk provisions | (97 | ) | 3 | 17 | 3 | – | – | (74 | ) | |||||||||||||||||||||||||||||||
Net operating income | 5,468 | 2,901 | 2,778 | 497 | 986 | (282 | ) | 12,348 | ||||||||||||||||||||||||||||||||
Total operating expenses | (1,819 | ) | (719 | ) | (1,263 | ) | (248 | ) | (1,081 | ) | 282 | (4,848 | ) | |||||||||||||||||||||||||||
Operating profit/(loss) | 3,649 | 2,182 | 1,515 | 249 | (95 | ) | – | 7,500 | ||||||||||||||||||||||||||||||||
Share of profit in associates and joint ventures | 45 | 6 | 3 | – | 28 | – | 82 | |||||||||||||||||||||||||||||||||
Profit/(loss) before tax | 3,694 | 2,188 | 1,518 | 249 | (67 | ) | – | 7,582 | ||||||||||||||||||||||||||||||||
| % | % | % | % | % | % | |||||||||||||||||||||||||||||||||||
Share of HSBC’s profit before tax | 17.9 | 10.6 | 7.3 | 1.2 | (0.3 | ) | 36.7 | |||||||||||||||||||||||||||||||||
Cost efficiency ratio | 32.7 | 24.8 | 45.7 | 50.2 | 109.6 | 39.0 | ||||||||||||||||||||||||||||||||||
Balance sheet data74 | ||||||||||||||||||||||||||||||||||||||||
| US$m | US$m | US$m | US$m | US$m | US$m | |||||||||||||||||||||||||||||||||||
Loans and advances to customers (net) | 62,533 | 62,944 | 40,223 | 6,464 | 1,449 | 173,613 | ||||||||||||||||||||||||||||||||||
Total assets | 96,185 | 72,056 | 256,295 | 20,705 | 81,085 | (7,992 | ) | 518,334 | ||||||||||||||||||||||||||||||||
Customer accounts | 201,649 | 90,152 | 34,171 | 19,566 | 670 | 346,208 | ||||||||||||||||||||||||||||||||||
91
Table of Contents
HSBC HOLDINGS PLC
Report of the Directors: Operating and Financial Review(continued)
Profit/(loss) before tax and balance sheet data – Hong Kong(continued)
| 2011 | ||||||||||||||||||||||||||||||||||||||||
Retail and Wealth | Commercial Banking | Global Banking and Markets US$m | Global Private | Other US$m | Inter- elimination85 US$m | Total US$m | ||||||||||||||||||||||||||||||||||
Profit/(loss) before tax | ||||||||||||||||||||||||||||||||||||||||
Net interest income/(expense) | 2,571 | 1,317 | 1,051 | 173 | (464 | ) | 43 | 4,691 | ||||||||||||||||||||||||||||||||
Net fee income | 1,741 | 706 | 475 | 160 | 15 | – | 3,097 | |||||||||||||||||||||||||||||||||
Trading income/(expense) excluding net interest income | 120 | 169 | 652 | 135 | (116 | ) | – | 960 | ||||||||||||||||||||||||||||||||
Net interest income on trading activities | 9 | 1 | 246 | – | 16 | (43 | ) | 229 | ||||||||||||||||||||||||||||||||
Net trading income/(expense)78 | 129 | 170 | 898 | 135 | (100 | ) | (43 | ) | 1,189 | |||||||||||||||||||||||||||||||
Changes in fair value of long-term debt issued and related derivatives | – | – | – | – | – | – | – | |||||||||||||||||||||||||||||||||
Net income/(expense) from other financial instruments designated at fair value | (475 | ) | (72 | ) | (5 | ) | – | 15 | – | (537 | ) | |||||||||||||||||||||||||||||
Net income/(expense) from financial instruments designated at fair value | (475 | ) | (72 | ) | (5 | ) | – | 15 | – | (537 | ) | |||||||||||||||||||||||||||||
Gains less losses from financial investments | 3 | 10 | 21 | – | (10 | ) | – | 24 | ||||||||||||||||||||||||||||||||
Dividend income | – | 1 | 14 | – | 24 | – | 39 | |||||||||||||||||||||||||||||||||
Net earned insurance premiums | 4,317 | 758 | 13 | – | – | – | 5,088 | |||||||||||||||||||||||||||||||||
Other operating income | 505 | 175 | 79 | 8 | 1,185 | (268 | ) | 1,684 | ||||||||||||||||||||||||||||||||
Total operating income | 8,791 | 3,065 | 2,546 | 476 | 665 | (268 | ) | 15,275 | ||||||||||||||||||||||||||||||||
Net insurance claims86 | (3,887 | ) | (697 | ) | (9 | ) | – | – | – | (4,593 | ) | |||||||||||||||||||||||||||||
Net operating income21 | 4,904 | 2,368 | 2,537 | 476 | 665 | (268 | ) | 10,682 | ||||||||||||||||||||||||||||||||
Loan impairment (charges)/recoveries and other credit risk provisions | (77 | ) | (66 | ) | 23 | (36 | ) | – | – | (156 | ) | |||||||||||||||||||||||||||||
Net operating income | 4,827 | 2,302 | 2,560 | 440 | 665 | (268 | ) | 10,526 | ||||||||||||||||||||||||||||||||
Total operating expenses | (1,811 | ) | (703 | ) | (1,248 | ) | (252 | ) | (1,012 | ) | 268 | (4,758 | ) | |||||||||||||||||||||||||||
Operating profit/(loss) | 3,016 | 1,599 | 1,312 | 188 | (347 | ) | – | 5,768 | ||||||||||||||||||||||||||||||||
Share of profit in associates and joint ventures | 6 | 9 | 4 | – | 36 | – | 55 | |||||||||||||||||||||||||||||||||
Profit/(loss) before tax | 3,022 | 1,608 | 1,316 | 188 | (311 | ) | – | 5,823 | ||||||||||||||||||||||||||||||||
| % | % | % | % | % | % | |||||||||||||||||||||||||||||||||||
Share of HSBC’s profit before tax | 13.8 | 7.3 | 6.0 | 0.9 | (1.4 | ) | 26.6 | |||||||||||||||||||||||||||||||||
Cost efficiency ratio | 36.9 | 29.7 | 49.2 | 52.9 | 152.2 | 44.5 | ||||||||||||||||||||||||||||||||||
Balance sheet data74 | ||||||||||||||||||||||||||||||||||||||||
| US$m | US$m | US$m | US$m | US$m | US$m | |||||||||||||||||||||||||||||||||||
Loans and advances to customers (net) | 56,296 | 54,986 | 39,667 | 5,447 | 1,269 | 157,665 | ||||||||||||||||||||||||||||||||||
Total assets | 85,866 | 63,516 | 238,892 | 20,680 | 84,782 | (20,712 | ) | 473,024 | ||||||||||||||||||||||||||||||||
Customer accounts | 181,316 | 79,225 | 35,283 | 19,622 | (101 | ) | 315,345 | |||||||||||||||||||||||||||||||||
For footnotes, see page 120.
92
Table of Contents
HSBC HOLDINGS PLC
Report of the Directors: Operating and Financial Review(continued)
Profit/(loss) before tax and balance sheet data – Hong Kong(continued)
| 2010 | ||||||||||||||||||||||||||||||||||||||||
Retail and Wealth Management US$m | Commercial Banking | Global Markets US$m | Global Private | Other US$m | Inter- elimination85 US$m | Total US$m | ||||||||||||||||||||||||||||||||||
Profit/(loss) before tax | ||||||||||||||||||||||||||||||||||||||||
Net interest income/(expense) | 2,604 | 1,106 | 915 | 173 | (463 | ) | (89 | ) | 4,246 | |||||||||||||||||||||||||||||||
Net fee income | 1,656 | 634 | 495 | 163 | 14 | – | 2,962 | |||||||||||||||||||||||||||||||||
Trading income/(expense) excluding net interest income | 198 | 121 | 680 | 120 | (12 | ) | – | 1,107 | ||||||||||||||||||||||||||||||||
Net interest income on trading activities | 4 | – | 100 | – | 12 | 89 | 205 | |||||||||||||||||||||||||||||||||
Net trading income78 | 202 | 121 | 780 | 120 | – | 89 | 1,312 | |||||||||||||||||||||||||||||||||
Changes in fair value of long-term debt issued and | – | – | – | – | (2 | ) | – | (2 | ) | |||||||||||||||||||||||||||||||
Net income/(expense) from other financial instruments designated at fair value | 328 | (10 | ) | 61 | – | 1 | – | 380 | ||||||||||||||||||||||||||||||||
Net income/(expense) from financial instruments designated at fair value | 328 | (10 | ) | 61 | – | (1 | ) | – | 378 | |||||||||||||||||||||||||||||||
Gains less losses from financial investments | – | – | 56 | 1 | 41 | – | 98 | |||||||||||||||||||||||||||||||||
Dividend income | – | 1 | 12 | – | 17 | – | 30 | |||||||||||||||||||||||||||||||||
Net earned insurance premiums | 3,655 | 665 | 12 | �� | – | – | – | 4,332 | ||||||||||||||||||||||||||||||||
Other operating income | 513 | 68 | 156 | 12 | 1,140 | (283 | ) | 1,606 | ||||||||||||||||||||||||||||||||
Total operating income | 8,958 | 2,585 | 2,487 | 469 | 748 | (283 | ) | 14,964 | ||||||||||||||||||||||||||||||||
Net insurance claims86 | (4,193 | ) | (559 | ) | (10 | ) | – | – | – | (4,762 | ) | |||||||||||||||||||||||||||||
Net operating income21 | 4,765 | 2,026 | 2,477 | 469 | 748 | (283 | ) | 10,202 | ||||||||||||||||||||||||||||||||
Loan impairment charges and other credit risk provisions | (76 | ) | (28 | ) | (10 | ) | – | – | – | (114 | ) | |||||||||||||||||||||||||||||
Net operating income | 4,689 | 1,998 | 2,467 | 469 | 748 | (283 | ) | 10,088 | ||||||||||||||||||||||||||||||||
Total operating expenses | (1,693 | ) | (653 | ) | (1,124 | ) | (242 | ) | (1,002 | ) | 283 | (4,431 | ) | |||||||||||||||||||||||||||
Operating profit/(loss) | 2,996 | 1,345 | 1,343 | 227 | (254 | ) | – | 5,657 | ||||||||||||||||||||||||||||||||
Share of profit in associates and joint ventures | 5 | 7 | 4 | – | 19 | – | 35 | |||||||||||||||||||||||||||||||||
Profit/(loss) before tax | 3,001 | 1,352 | 1,347 | 227 | (235 | ) | – | 5,692 | ||||||||||||||||||||||||||||||||
| % | % | % | % | % | % | |||||||||||||||||||||||||||||||||||
Share of HSBC’s profit before tax | 15.7 | 7.1 | 7.1 | 1.2 | (1.2 | ) | 29.9 | |||||||||||||||||||||||||||||||||
Cost efficiency ratio | 35.5 | 32.2 | 45.4 | 51.6 | 134.0 | 43.4 | ||||||||||||||||||||||||||||||||||
Balance sheet data74 | ||||||||||||||||||||||||||||||||||||||||
| US$m | US$m | US$m | US$m | US$m | US$m | |||||||||||||||||||||||||||||||||||
Loans and advances to customers (net) | 50,983 | 48,670 | 34,491 | 4,760 | 1,787 | 140,691 | ||||||||||||||||||||||||||||||||||
Total assets | 76,871 | 55,030 | 223,286 | 20,598 | 62,486 | (8,706 | ) | 429,565 | ||||||||||||||||||||||||||||||||
Customer accounts | 176,960 | 71,209 | 29,388 | 19,241 | 686 | 297,484 | ||||||||||||||||||||||||||||||||||
For footnotes, see page 120.
92a
Table of Contents
HSBC HOLDINGS PLC
Report of the Directors: Operating and Financial Review(continued)
We offer a full range of banking and financial services in mainland China, mainly through our local subsidiary, HSBC Bank (China) Company Limited. We also participate indirectly in mainland China through our primary associate, Bank of Communications.
Outside mainland China, we conduct business in 21 countries and territories in the Rest of Asia-Pacific region, primarily through branches and subsidiaries of The Hongkong and Shanghai Banking Corporation, with particularly strong coverage in Australia, India, Indonesia, Malaysia and Singapore.
| 2012 US$m | 2011 US$m | 2010 US$m | ||||||||||||||
Net interest income | 5,391 | 5,102 | 3,828 | |||||||||||||
Net fee income | 2,083 | 2,111 | 1,932 | |||||||||||||
Net trading income | 1,053 | 1,658 | 1,618 | |||||||||||||
Other income | 5,057 | 1,842 | 1,854 | |||||||||||||
Net operating income21 | 13,584 | 10,713 | 9,232 | |||||||||||||
LICs76 | (436 | ) | (267 | ) | (439 | ) | ||||||||||
Net operating income | 13,148 | 10,446 | 8,793 | |||||||||||||
Total operating expenses | (5,806 | ) | (5,806 | ) | (5,143 | ) | ||||||||||
Operating profit | 7,342 | 4,640 | 3,650 | |||||||||||||
Income from associates77 | 3,106 | 2,831 | 2,252 | |||||||||||||
Profit before tax | 10,448 | 7,471 | 5,902 | |||||||||||||
Cost efficiency ratio | 42.7% | 54.2% | 55.7% | |||||||||||||
RoRWA66 | 3.5% | 3.1% | 3.1% | |||||||||||||
Year-end staff numbers | 85,024 | 91,051 | 91,607 | |||||||||||||
OverUS$3bn
gains recognised following
strategic disposals in 2012
9%
growth in lending balances
(on a constant currency basis)
‘Best Domestic Cash Management Bank’
(Euromoney)
across 14 countries in the region
For footnotes, see page 120.
Economic background
In mainlandChina, economic growth slowed through the first three quarters of 2012 due to a decline in external demand driven by the eurozone crisis, the effect of tightening domestic monetary policy measures and sharp de-stocking by industry. This greater than expected deceleration and increasing pressure on the labour market prompted policy makers to ease monetary policy in the summer of 2012, following two interest rate cuts totalling 50bps and two cuts in the reserve requirement ratio amounting to 100bps in the first half of the year, and speeded up the approval of new infrastructure projects. As these measures took effect, the mainland Chinese economy began to show signs of recovery in the fourth quarter of 2012. GDP slowed to 7.8% in 2012 from 9.3% in 2011, but remained above Beijing’s target of 7.5%. CPI inflation was a modest 2.6%.
Japan’s economy experienced a turbulent 2012. After a very strong start supported by reconstruction demand and government subsidies, growth turned sharply negative in the third quarter as tepid overseas demand prompted a deep slump in exports and manufacturing. Sentiment improved by the end of 2012. The Bank of Japan took steps to ease monetary policy in 2012, establishing a 1% inflation goal in February 2012 and expanding its Asset Purchase Programme by JPY46 trillion (US$534bn).
Slowing global trade reduced growth in the Rest of Asia-Pacific region.South Korea’s full-year growth slowed to 2.1% in 2012, the lowest annual rate for three years, as the slowdown in global trade hit the export-dependent economy hard in the third quarter. To support domestic demand, the Bank of Korea lowered its policy rate from 3.25% to 2.75%.Singapore’s economy slowed notably, with GDP growth declining to 1.2% in 2012 from 5% the year before. 2012 was a tumultuous year forTaiwan’s export-reliant economy, as both western and mainland China demand weakened, particularly from April onwards. However, the impetus provided by key electronic product launches helped to maintain manufacturing activity and jobs, enabling domestic demand to underpin growth more effectively than it did in earlier recessions. The other ASEAN (Association of Southeast Asian Nations) countries demonstrated more resilience, supported by domestic growth. Growth inIndonesia was driven by favourable demographics and a growing middle-income class. InThailand, rebuilding activity and policy support after the floods in 2011 led to a rebound in economic activity. Growth inIndia continued to slow during the course of 2012, with
93
Table of Contents
HSBC HOLDINGS PLC
Report of the Directors: Operating and Financial Review(continued)
Profit/(loss) before tax by country within global businesses
Retail Management US$m | Commercial Banking US$m | Global Markets US$m | Global Private | Other US$m | Total US$m | |||||||||||||||||||||||||||||
2012 | ||||||||||||||||||||||||||||||||||
Australia | 97 | 38 | 184 | – | (44 | ) | 275 | |||||||||||||||||||||||||||
India | 41 | 89 | 497 | 7 | 175 | 809 | ||||||||||||||||||||||||||||
Indonesia | �� | 29 | 124 | 146 | – | 7 | 306 | |||||||||||||||||||||||||||
Mainland China | 838 | 1,724 | 1,257 | (4 | ) | 2,525 | 6,340 | |||||||||||||||||||||||||||
Ping An | 622 | 82 | 60 | – | 2,459 | 3,223 | ||||||||||||||||||||||||||||
Other associates | 268 | 1,466 | 591 | – | – | 2,325 | ||||||||||||||||||||||||||||
Other mainland China | (52 | ) | 176 | 606 | (4 | ) | 66 | 792 | ||||||||||||||||||||||||||
Malaysia | 183 | 131 | 242 | – | 8 | 564 | ||||||||||||||||||||||||||||
Singapore | 201 | 139 | 296 | 97 | (65 | ) | 668 | |||||||||||||||||||||||||||
Taiwan | 62 | 36 | 136 | – | – | 234 | ||||||||||||||||||||||||||||
Vietnam | 9 | 45 | 57 | – | 9 | 120 | ||||||||||||||||||||||||||||
Other | 57 | 276 | 510 | 59 | 230 | 1,132 | ||||||||||||||||||||||||||||
| 1,517 | 2,602 | 3,325 | 159 | 2,845 | 10,448 | |||||||||||||||||||||||||||||
2011 | ||||||||||||||||||||||||||||||||||
Australia | 88 | 106 | 108 | – | 5 | 307 | ||||||||||||||||||||||||||||
India | (14 | ) | 122 | 539 | 5 | 161 | 813 | |||||||||||||||||||||||||||
Indonesia | 6 | 89 | 157 | – | 7 | 259 | ||||||||||||||||||||||||||||
Mainland China | 1,112 | 1,340 | 1,116 | (4 | ) | 117 | 3,681 | |||||||||||||||||||||||||||
Ping An | 946 | – | 63 | – | 117 | 1,126 | ||||||||||||||||||||||||||||
Other associates | 233 | 1,150 | 466 | – | – | 1,849 | ||||||||||||||||||||||||||||
Other mainland China | (67 | ) | 190 | 587 | (4 | ) | – | 706 | ||||||||||||||||||||||||||
Malaysia | 173 | 118 | 228 | 1 | 9 | 529 | ||||||||||||||||||||||||||||
Singapore | 183 | 133 | 189 | 97 | (7 | ) | 595 | |||||||||||||||||||||||||||
Taiwan | 45 | 23 | 130 | – | 12 | 210 | ||||||||||||||||||||||||||||
Vietnam | – | 51 | 79 | – | 24 | 154 | ||||||||||||||||||||||||||||
Other | 48 | 264 | 543 | (8 | ) | 76 | 923 | |||||||||||||||||||||||||||
| 1,641 | 2,246 | 3,089 | 91 | 404 | 7,471 | |||||||||||||||||||||||||||||
2010 | ||||||||||||||||||||||||||||||||||
Australia | 59 | 96 | 95 | – | 8 | 258 | ||||||||||||||||||||||||||||
India | (83 | ) | 71 | 508 | 4 | 179 | 679 | |||||||||||||||||||||||||||
Indonesia | 12 | 94 | 116 | – | (3 | ) | 219 | |||||||||||||||||||||||||||
Mainland China | 839 | 833 | 683 | (7 | ) | 217 | 2,565 | |||||||||||||||||||||||||||
Ping An | 797 | – | 51 | – | 188 | 1,036 | ||||||||||||||||||||||||||||
Other associates | 176 | 746 | 392 | – | – | 1,314 | ||||||||||||||||||||||||||||
Other mainland China | (134 | ) | 87 | 240 | (7 | ) | 29 | 215 | ||||||||||||||||||||||||||
Malaysia | 120 | 88 | 194 | – | (1 | ) | 401 | |||||||||||||||||||||||||||
Singapore | 169 | 87 | 100 | 84 | 84 | 524 | ||||||||||||||||||||||||||||
Taiwan | 31 | 36 | 87 | – | (7 | ) | 147 | |||||||||||||||||||||||||||
Vietnam | (7 | ) | 50 | 61 | – | 7 | 111 | |||||||||||||||||||||||||||
Other | 22 | 201 | 644 | – | 131 | 998 | ||||||||||||||||||||||||||||
| 1,162 | 1,556 | 2,488 | 81 | 615 | 5,902 | |||||||||||||||||||||||||||||
weaker external demand, the lagged effects of monetary policy normalisation and the absence in recent years of structural policies and infrastructure investment playing a role in the slowdown. Encouragingly, the government embarked on a reform programme towards the end of the year which helped lift sentiment and stabilise growth.
Growth in theAustralian economy was uneven in 2012 as it absorbed a mining boom which had the effect of slowing investment in other sectors. For 2012 as a whole, growth was strong at around 3.5%.
Unemployment edged up to 5.4%. In response to the global slowdown and to help re-balance growth away from mining and towards the non-mining sectors, the Reserve Bank of Australia reduced its cash rate from 4.25% to 3.00%.
Review of performance
Our operations in the Rest of Asia-Pacific region reported pre-tax profits of US$10.4bn compared with US$7.5bn in 2011, an increase of 40% or 41% on a constant currency basis.
94
Table of Contents
HSBC HOLDINGS PLC
Report of the Directors: Operating and Financial Review(continued)
Reported profits included a gain on the disposal of our associate, Ping An of US$3.0bn. Our remaining shareholding has been classified as a financial investment (see Note 26 on the Financial Statements). Reported profits also included gains from the sale of the RBWM business in Thailand (US$108m), the GPB business in Japan (US$67m) and our interest in a property company in the Philippines (US$130m). Reported profits in 2011 included an accounting gain of US$181m arising from the dilution of our shareholding in Ping An, offset by a remeasurement loss of US$48m on its consolidation of Ping An Bank (formerly Shenzhen Development Bank).
On an underlying basis, which excludes the items described above and the associated operating results, pre-tax profit rose by 2%. This was driven by higher net interest income, notably from Balance Sheet Management in GB&M in mainland China, and strong growth in average lending balances across most of the region, as well as increased profits from our associates in mainland China. These factors were partly offset by adverse fair value movements of US$553m on the contingent forward sale contract related to the Ping An sale, the effect of which was offset in 2013 on completion of the transaction, and higher operating expenses, in part due to restructuring costs arising from the ongoing strategic review of our businesses and support functions in the region. Loan impairment charges also rose from a small number of specific corporate impairment charges, but remained low as credit quality remained broadly stable.
We maintained our focus on our key priority growth markets in the region. In mainland China, we continued to invest in our branch network and at the end of the year had 141 HSBC China outlets, 20 HSBC rural bank outlets and 46 Hang Seng Bank outlets. We invested a further US$1.7bn in BoCom to maintain our interest of 19.03% in this strategically important associate and reinforce our position as the leading foreign bank in mainland China.
In Malaysia, we now have the largest branch network amongst foreign banks and were designated ‘Best Bank’ for the 10th consecutive year by theAsset Triple A Country Awards.
In RBWM, we made progress in re-shaping the business in line with our strategy, completing the disposal of the non-strategic business in Thailand and announcing the sale of our life insurance business in Taiwan. With our focus on secured lending, we recorded mortgage growth in mainland China, Singapore, Australia and Malaysia, reflecting
the continued strength of the property market and the expansion of our distribution network.
In CMB, trade revenues grew as we capitalised on our global network to capture cross-border trade and capital flows, particularly with mainland China. We continued to strengthen our infrastructure to capture the outbound opportunities from mainland China and now have 14 ‘China desks’ established globally to assist customers with their international trade requirements. Significant new mandates in 2012 in CMB and GB&M reflected investment in our Payments and Cash Management infrastructure. We were recognised as ‘Best Domestic Cash Management Bank’ byEuromoney in fourteen countries across the region, ‘Best Overall Cash Management Bank in Asia’ byGlobal Finance and ‘Best International Trade Bank in China’ byTrade Finance Magazine.
In GB&M, we continued to be a key participant in the internationalisation of the renminbi and enhanced our Payments and Cash Management systems with renminbi capabilities. We continued to build our debt and equity capital markets capabilities in key countries in the region and were involved in several significant government and large corporate issues in Australia, Singapore, India and Indonesia. Revenues from the collaboration between CMB and GB&M increased by 13% as we enhanced sales coordination between the global businesses.
The following commentary is on a constant currency basis.
Net interest income increased by 8%, notably in mainland China from Balance Sheet Management, arising from growth in the debt securities portfolio and improved yields, as well as from increased trade-related and term lending in CMB and GB&M.
We grew average deposit balances, notably in GB&M and CMB reflecting new Payments and Cash Management mandates, and in RBWM from deposit acquisition. The benefit of this growth was partly offset by narrower liability spreads reflecting rate cuts and liquidity easing measures by central banks.
In RBWM, residential mortgage balances grew, primarily in Singapore, Australia, Malaysia and mainland China, reflecting the continued strength of property markets and expansion of our distribution network. However, net interest income was broadly unchanged due to the effect of the sale of the RBWM business in Thailand and narrower asset spreads in a number of countries attributable to competitive pricing pressures.
Net fee income increased by US$29m, primarily in GB&M, from higher fee income from our
95
Table of Contents
HSBC HOLDINGS PLC
Report of the Directors: Operating and Financial Review(continued)
participation in more debt capital markets transactions across the region as we continued to strengthen our capabilities in this area, and lower regulatory fee expenses on Foreign Exchange and Rates transactions in mainland China as volumes reduced. RBWM reported higher income from cards in Australia from increased spending and card issuance and Wealth Management fees in mainland China. The increase from cards was more than offset by the discontinuation of our Premier business in Japan, the sale of our RBWM business in Thailand, and a fall in fund management fees as we saw a move into lower yielding products reflecting investor’s lower risk appetite.
Net trading incomedecreased by 34% compared with 2011, mainly from adverse fair value movements on the contingent forward sale contract of US$553m relating to Ping An (see Note 2b on the Financial Statements). Trading income was also lower, primarily in mainland China due to lower GB&M revenues in Foreign Exchange reflecting reduced volatility. These were partly offset by a net favourable movement as a result of a change in estimation methodology in respect of the valuation adjustments on derivatives.
Net income from financial instruments designated at fair value was US$110m in 2012 compared with a net expense of US$19m in 2011. This was driven by net investment gains on assets held by the Insurance business, primarily in Singapore, due to positive equity market movements. To the extent that these investment gains were attributed to policyholders of unit-linked insurance policies and insurance contracts with DPF, there was a corresponding increase in ‘Net insurance claims incurred and movement in liabilities to policyholders’.
Gains less losses from financial investmentswere US$16m compared with net losses of US$23m in 2011, due to a disposal gain on investments managed by a private equity fund and a gain on the sale of government debt securities in India.
Net earned insurance premiumsrose by 7% to US$812m as a result of increased renewals and new business volumes in mainland China, Singapore and Taiwan. The growth in premiums resulted in a corresponding increase in ‘Net insurance claims incurred and movement in liabilities to policyholders’.
We reported aGain on disposal of Ping An, an associate of Mainland China, of US$3.0bn. Our remaining shareholding has been classified as a financial investment.
Other operating incomeincreased by US$201m due to gains on the sale of our RBWM business in Thailand of US$108m, our GPB business in Japan of US$67m and our interest in a property company in the Philippines of US$130m. These were partly offset by the non-recurrence of an accounting gain of US$181m arising from the dilution of our shareholding in Ping An in 2011.
Net insurance claims incurred and movement in liabilities to policyholders increased by 22%, driven by net investment gains on the fair value of the assets held to support the policyholder contracts compared with net losses in 2011. In addition, policyholder liabilities were established for new business, reflecting the rise in premiums across mainland China, Singapore and Taiwan.
Loan impairment charges and other credit risk provisionsincreased by US$170m as a result of individually assessed impairments on a single corporate exposure in Australia and a small number of corporate exposures in other countries in the region as well as a credit risk provision on an available-for-sale debt security in GB&M. These were partly offset by an impairment release in Singapore compared with a charge in 2011.
Operating expensesincreased by 3%, due to restructuring and other related costs of US$131m (2011: US$45m) incurred across several countries as part of the ongoing strategic review of our businesses and support functions in the region. This resulted in a net reduction of approximately 6,000 FTE staff numbers and generated sustainable annual savings of approximately US$200m, which were more than offset by inflationary pressures and investment for business growth, including branch expansion in mainland China. Costs also increased from a litigation provision of US$98m made in respect of a long-standing court case and the write down by US$51m of our interest in a joint venture.
Share of profit from associates and joint venturesincreased by US$212m, driven by higher profits from BoCom and Industrial Bank which reflected loan growth and higher fee income, partly offset by increased operating expenses and loan impairment charges. The contribution from Ping An reduced due to market valuation losses on equity securities held by their insurance business, which reflected volatile domestic equity markets, partly offset by increased income from the banking business, Ping An Bank. The disposal of Ping An and the dilution of our holding in Industrial Bank, following its issue of additional share capital to third parties on 7 January 2013, are expected to have a significant impact on future profits in the region.
96
Table of Contents
HSBC HOLDINGS PLC
Report of the Directors: Operating and Financial Review(continued)
Reconciliation of reported and constant currency profit before tax – Rest of Asia-Pacific
| 2011 as reported US$m | Currency translation adjustment24 US$m | 2011 rates US$m | 2012 as reported US$m | Reported change25 % | Constant change25 % | |||||||||||||||||||||||||||||
Net interest income | 5,102 | (111 | ) | 4,991 | 5,391 | 6 | 8 | |||||||||||||||||||||||||||
Net fee income | 2,111 | (57 | ) | 2,054 | 2,083 | (1 | ) | 1 | ||||||||||||||||||||||||||
Own credit spread26 | 2 | – | 2 | (3 | ) | |||||||||||||||||||||||||||||
Gains on disposal of Ping An | – | – | – | 3,012 | ||||||||||||||||||||||||||||||
Other income27 | 3,498 | (148 | ) | 3,350 | 3,101 | (11 | ) | (7 | ) | |||||||||||||||||||||||||
Net operating income21 | 10,713 | (316 | ) | 10,397 | 13,584 | 27 | 31 | |||||||||||||||||||||||||||
Loan impairment charges and other credit risk provisions | (267 | ) | 1 | (266 | ) | (436 | ) | (63 | ) | (64 | ) | |||||||||||||||||||||||
Net operating income | 10,446 | (315 | ) | 10,131 | 13,148 | 26 | 30 | |||||||||||||||||||||||||||
Operating expenses | (5,806 | ) | 173 | (5,633 | ) | (5,806 | ) | – | (3 | ) | ||||||||||||||||||||||||
Operating profit | 4,640 | (142 | ) | 4,498 | 7,342 | 58 | 63 | |||||||||||||||||||||||||||
Income from associates | 2,831 | 63 | 2,894 | 3,106 | 10 | 7 | ||||||||||||||||||||||||||||
Profit before tax | 7,471 | (79 | ) | 7,392 | 10,448 | 40 | 41 | |||||||||||||||||||||||||||
For footnotes, see page 120.
Reconciliation of reported and underlying29 items – Rest of Asia-Pacific
| Year ended 31 December | ||||||||||||||||
| 2012 US$m | 2011 US$m | Change % | ||||||||||||||
Revenue21 | ||||||||||||||||
Reported revenue | 13,584 | 10,713 | 27 | |||||||||||||
Currency translation adjustment24 | (316 | ) | ||||||||||||||
Own credit spread26 | 3 | (2 | ) | |||||||||||||
Acquisitions, disposals and dilutions | (3,342 | ) | (295 | ) | ||||||||||||
Underlying revenue | 10,245 | 10,100 | 1 | |||||||||||||
Loan impairment charges and other credit risk provisions (‘LIC’s) | ||||||||||||||||
Reported LICs | (436 | ) | (267 | ) | (63 | ) | ||||||||||
Currency translation adjustment24 | 1 | |||||||||||||||
Acquisitions, disposals and dilutions | (2 | ) | 4 | |||||||||||||
Underlying LICs | (438 | ) | (262 | ) | (67 | ) | ||||||||||
Operating expenses | ||||||||||||||||
Reported operating expenses | (5,806 | ) | (5,806 | ) | – | |||||||||||
Currency translation adjustment24 | 173 | |||||||||||||||
Acquisitions, disposals and dilutions | 60 | 96 | ||||||||||||||
Underlying operating expenses | (5,746 | ) | (5,537 | ) | (4 | ) | ||||||||||
Underlying cost efficiency ratio | 56.1% | 54.8% | ||||||||||||||
Profit before tax | ||||||||||||||||
Reported profit before tax | 10,448 | 7,471 | 40 | |||||||||||||
Currency translation adjustment24 | (79 | ) | ||||||||||||||
Own credit spread26 | 3 | (2 | ) | |||||||||||||
Acquisitions, disposals and dilutions | (4,048 | ) | (1,141 | ) | ||||||||||||
Underlying profit before tax | 6,403 | 6,249 | 2 | |||||||||||||
For footnotes, see page 120.
96a
Table of Contents
HSBC HOLDINGS PLC
Report of the Directors: Operating and Financial Review(continued)
2011 compared with 2010
Economic background
Inmainland China, reducing the pace of consumer price inflation was a key priority for policymakers in the first half of 2011. Monetary conditions were tightened by increasing the reserve requirement ratio to 21.5% for large banks and a number of measures were implemented, focused specifically on reducing demand in the property market. As a result, credit growth slowed in the second half of the year which, coupled with the downturn in global trade, helped to slow the pace of growth and reduce inflationary pressures. The annual rate of inflation peaked at 6.5% in July and eased to around 4% by the year end. Meanwhile, the annual pace of GDP growth slowed from 9.7% in the first quarter to 8.9% in the fourth quarter, bringing the full year GDP growth down to 9.2% in 2011 from 10.4% in 2010. In the final months of the year, the outlook for growth in the eurozone became more of a concern and policymakers reverted to easing monetary and fiscal conditions. Towards the end of 2011, the reserve requirement ratio was cut and a number of fiscal stimulus measures were enacted.
Japan’s economy began 2011 strongly, but the earthquake and tsunami in March led to a sharp contraction in output. Japan continued to suffer from deflationary pressures, leading the Bank of Japan to expand its quantitative easing programme. It also intervened in foreign exchange markets to stem the upward pressure on the yen.
The Rest of Asia-Pacific region experienced a relatively strong first half, with exports and domestic demand growing robustly, following which growth slowed in the latter months of 2011. The highly trade-dependent economies ofSouth Korea,Taiwan andSingapore experienced the most significant decline in activity. Regional trade was disrupted by the Japanese earthquake in March and floods in the fourth quarter inThailand, which caused a sharp contraction in the production of critical electronic and car components. As a result, trade expanded at a slower pace in 2011 than in 2010. In a number of economies, notablyIndia andSouth Korea, domestic demand also slowed markedly in the second half of 2011 after rising inflationary pressures prompted central banks to tighten monetary policy. InMalaysia, domestic demand proved more resilient and the level of GDP in Malaysia in the fourth quarter was 5.2% higher than the level seen a year earlier. Across Asia, inflation peaked in the middle of the year providing policymakers inIndia,Thailand andIndonesia room to start easing monetary policy.
InAustralia GDP growth in early 2011 was initially affected by weather-related disruptions, particularly to coal exports. However, activity strengthened and GDP rose by 2.5% in the year to September, predominantly from ongoing investment in the mining sector. Labour market conditions eased during the year, with the unemployment rate rising modestly to 5.2% by the year end. The Reserve Bank of Australia reduced its policy rate in November and December from 4.75% to 4.25%.
Review of performance
Our operations in the Rest of Asia-Pacific region reported pre-tax profits of US$7.5bn compared with US$5.9bn in 2010, an increase of 27%. Reported profits included gains arising from the dilution of HSBC’s shareholding in Ping An following its issue of share capital to third parties in 2010 and 2011 of US$188m and US$181m, respectively. On an underlying basis, excluding these gains, pre-tax profit rose by 23%.
The growth in profitability in the region reflected strong lending and deposit growth during 2010 and 2011, mainly in Singapore and mainland China, coupled with widening deposit spreads due to higher interest rates in certain countries, notably India and mainland China. Loan impairment charges improved as a result of the non-recurrence of a number of individual impairments and the reduction of certain unsecured lending portfolios. Costs increased, though to a lesser extent than revenues, to support business expansion, notably in mainland China, and maintain our competitive position in our six strategic markets. The contribution from our associates in mainland China also grew, benefiting from ongoing loan growth and increased income from fee-based revenue streams.
We continued to invest in building our franchise in mainland China where the operating profit of our operations more than doubled and we remained the leading foreign bank by network size. In CMB, we increased the coverage of our renminbi trade settlement services to 24 cities within the country, representing the widest geographic coverage among all foreign banks, and offered renminbi capabilities in over 50 countries worldwide. Cross-border referrals between mainland China and the rest of the world grew by 9% compared with 2010 as we capitalised on our international network to capture outbound and inbound trade flows. In GB&M, we focused on leveraging our global connectivity and product capabilities to be the leading international bank of choice for multinational corporations doing business with mainland China and large corporates looking to expand internationally.
96b
Table of Contents
HSBC HOLDINGS PLC
Report of the Directors: Operating and Financial Review(continued)
Profit before tax increased in other key countries across the region as we maintained our strategic focus on these markets, particularly in intermediating cross-border trade flows. Trade revenues grew in most of our sites and we were awarded the ‘Best Trade Finance Bank in Asia Pacific’ byFinanceAsia for the fourteenth consecutive year. Trade-related lending grew strongly in Singapore as we continued to enhance our trade finance capabilities. In Malaysia we expanded our branch network through the launch of new Amanah branches. We also experienced strong commercial lending growth in both Malaysia and Indonesia as a result of various marketing campaigns. In India, we were ranked the number one foreign bank byBloomberg for domestic bonds in 2011 and issued the first and only offshore renminbi bond in the country.
As part of our strategic review process, in December 2011 we announced the sale of our private banking operations in Japan and, in January 2012, we announced the sale of our RBWM operations in Thailand. We expect to complete these transactions during 2012.
Net interest income increased by 28%. Average lending balances grew most notably in CMB and GB&M, particularly in mainland China, as we captured inbound and outbound trade flows and as demand for credit in the region increased. In RBWM mortgage lending balances rose, notably in Singapore and Australia, driven by competitive product offerings and strong property markets.
This was partly offset by continued pressure on asset spreads, most notably in RBWM (particularly in Singapore and Australia), due to competitive pressures and growth in residential mortgage lending at lower spreads.
Customer deposit balances rose across most of the region, notably in Payments and Cash Management reflecting our investment in infrastructure as part of a targeted strategy to support growth in customer lending. Deposit spreads increased as interest rates rose in a number of countries, particularly in mainland China and India.
Net interest income from Balance Sheet Management was higher than in 2010, reflecting increased interest rates and the widening of onshore US dollar lending spreads in mainland China, and a higher return from short-term lending and growth in the balance sheet in Singapore as we attracted increased customer deposits.
Net fee income increased by 4%, primarily from trade-related fees as we targeted asset growth and
trade activity, largely in mainland China, Bangladesh and Singapore, supported by marketing activities, customer acquisition and a rise in transactions from existing customers. Card fees rose, notably in Australia from the increased issuance of our co-branded credit cards, higher retail spending, and more customers converting to a higher card status.
Net trading incomeof US$1.7bn was broadly unchanged compared with 2010. Net interest income on trading activities was lower as we progressively reduced our positions in government debt securities following increased market volatility in bond markets, and from growth in structured deposits where the related income is recorded under ‘Net interest income’. This was offset by higher Foreign Exchange trading income due to increased customer transaction volumes resulting from the collaboration between GB&M and CMB and as more clients sought protection from volatility in the markets.
Net expense from financial instruments designated at fair valuewas US$18m compared with income of US$29m in 2010. This was due to investment losses on assets held by the insurance business, primarily in Singapore, as a result of negative equity market movements during the second half of 2011. To the extent that these investment losses were attributed to policyholders of unit-linked insurance policies and insurance contracts with DPF, there was a corresponding decrease in‘Net insurance claims incurred and movement in liabilities to policyholders’.
Losses from financial investments were US$23m compared with gains of US$151m in 2010, due to an impairment loss on an equity investment in 2011 in GB&M, lower gains on the disposal of government debt securities across the region and the non-recurrence of a gain on disposal of an equity investment in a Singaporean property company in 2010.
Net earned insurance premiums increased by 58% to US$759m as a result of successful sales initiatives, most notably resulting in improved sales of a universal life insurance product targeted at high net worth individuals in Singapore. The growth in premiums resulted in a corresponding increase in ‘Net insurance claims incurred and movement in liabilities to policyholders’.
Other operating income increased by US$92m, largely due to a rise in the PVIF asset in Singapore as a result of higher life insurance sales and a net increase from experience and assumption updates.
Loan impairment charges and other credit risk provisions decreased by 42% to US$267m as a
96c
Table of Contents
HSBC HOLDINGS PLC
Report of the Directors: Operating and Financial Review(continued)
result of the non-recurrence of a number of individual loan impairment charges in GB&M on a small number of accounts, coupled with the ongoing reduction of unsecured lending portfolios in India. We remain cautious on the outlook for credit quality and sustained our focus on maintaining high levels of underwriting and asset quality.
Operating expenses increased by 8% due to wage inflation which reflected the competitive labour market, along with an increase in average staff numbers, notably in mainland China. Increased business volumes across the region led to higher support costs. Premises and equipment costs also rose in certain countries, reflecting increased rental expenses resulting from lease renewals and new branch openings.
Share of profit from associates and joint ventures increased by 22%. The contribution from BoCom rose, driven by strong loan growth, wider deposit spreads following interest rate increases in mainland China and higher fee income, notably from investment banking, settlements and cards. Income from Industrial Bank also increased as a result of strong growth in customer lending, a rise in fee-based revenue and a fall in loan impairment charges. Higher profits from Ping An resulted from strong growth in sales in the insurance business and increased income from the banking business following the acquisition of Shenzhen Development Bank in July 2011.
Reconciliation of reported and underlying profit before tax
2011 compared with 2010 – Rest of Asia-Pacific31
| 2010 as reported US$m | 2010 ments32 US$m | Currency translation adjustment24 US$m | 2010 rates33 US$m | 2011 as reported US$m | 2011 ments32 US$m | 2011 under- lying US$m | Re- ported change25 % | Under- lying change25 % | ||||||||||||||||||||||||||||||||||||||||||||
Net interest income | 3,828 | – | 165 | 3,993 | 5,102 | – | 5,102 | 33 | 28 | |||||||||||||||||||||||||||||||||||||||||||
Net fee income | 1,932 | – | 99 | 2,031 | 2,111 | – | 2,111 | 9 | 4 | |||||||||||||||||||||||||||||||||||||||||||
Changes in fair value26 | (1 | ) | 1 | – | – | 2 | (2 | ) | – | |||||||||||||||||||||||||||||||||||||||||||
Other income27 | 3,473 | (188 | ) | 92 | 3,377 | 3,498 | (181 | ) | 3,317 | 1 | (2 | ) | ||||||||||||||||||||||||||||||||||||||||
Net operating income21 | 9,232 | (187 | ) | 356 | 9,401 | 10,713 | (183 | ) | 10,530 | 16 | 12 | |||||||||||||||||||||||||||||||||||||||||
Loan impairment charges and other credit risk provisions | (439 | ) | – | (24 | ) | (463 | ) | (267 | ) | – | (267 | ) | 39 | 42 | ||||||||||||||||||||||||||||||||||||||
Net operating income | 8,793 | (187 | ) | 332 | 8,938 | 10,446 | (183 | ) | 10,263 | 19 | 15 | |||||||||||||||||||||||||||||||||||||||||
Operating expenses | (5,143 | ) | – | (213 | ) | (5,356 | ) | (5,806 | ) | – | (5,806 | ) | (13 | ) | (8 | ) | ||||||||||||||||||||||||||||||||||||
Operating profit | 3,650 | (187 | ) | 119 | 3,582 | 4,640 | (183 | ) | 4,457 | 27 | 24 | |||||||||||||||||||||||||||||||||||||||||
Income from associates | 2,252 | – | 108 | 2,360 | 2,831 | 48 | 2,879 | 26 | 22 | |||||||||||||||||||||||||||||||||||||||||||
Profit before tax | 5,902 | (187 | ) | 227 | 5,942 | 7,471 | (135 | ) | 7,336 | 27 | 23 | |||||||||||||||||||||||||||||||||||||||||
For footnotes, see page 120.
96d
Table of Contents
HSBC HOLDINGS PLC
Report of the Directors: Operating and Financial Review(continued)
Profit before tax and balance sheet data – Rest of Asia-Pacific
| 2012 | ||||||||||||||||||||||||||||||||||||||||||
Retail Banking and Wealth Management US$m | Commercial Banking US$m | Global Banking and Markets US$m | Global Private Banking US$m | Other US$m | Inter- segment elimination85 US$m | Total US$m | ||||||||||||||||||||||||||||||||||||
Profit before tax | ||||||||||||||||||||||||||||||||||||||||||
Net interest income | 1,787 | 1,396 | 2,156 | 102 | 137 | (187 | ) | 5,391 | ||||||||||||||||||||||||||||||||||
Net fee income/(expense) | 854 | 499 | 666 | 71 | (7 | ) | – | 2,083 | ||||||||||||||||||||||||||||||||||
Trading income/(expense) excluding net interest income | 96 | 188 | 1,002 | 67 | (592 | ) | – | 761 | ||||||||||||||||||||||||||||||||||
Net interest income/(expense) on trading activities | (6 | ) | (3 | ) | 100 | – | 14 | 187 | 292 | |||||||||||||||||||||||||||||||||
Net trading income/(expense)78 | 90 | 185 | 1,102 | 67 | (578 | ) | 187 | 1,053 | ||||||||||||||||||||||||||||||||||
Changes in fair value of long-term debt issued and related derivatives | – | – | – | – | (4 | ) | – | (4 | ) | |||||||||||||||||||||||||||||||||
Net income/(expense) from other financial instruments designated at fair value | 109 | 1 | (3 | ) | – | 3 | – | 110 | ||||||||||||||||||||||||||||||||||
Net income/(expense) from financial instruments designated at fair value | 109 | 1 | (3 | ) | – | (1 | ) | – | 106 | |||||||||||||||||||||||||||||||||
Gains less losses from financial investments | (1 | ) | 2 | (10 | ) | – | 25 | – | 16 | |||||||||||||||||||||||||||||||||
Dividend income | – | – | 1 | – | 4 | – | 5 | |||||||||||||||||||||||||||||||||||
Net earned insurance premiums | 569 | 243 | – | – | – | – | 812 | |||||||||||||||||||||||||||||||||||
Gain on disposal of Ping An | – | – | – | – | 3,012 | – | 3,012 | |||||||||||||||||||||||||||||||||||
Other operating income | 211 | 64 | 82 | 68 | 1,571 | (172 | ) | 1,824 | ||||||||||||||||||||||||||||||||||
Total operating income | 3,619 | 2,390 | 3,994 | 308 | 4,163 | (172 | ) | 14,302 | ||||||||||||||||||||||||||||||||||
Net insurance claims86 | (523 | ) | (195 | ) | – | – | – | – | (718 | ) | ||||||||||||||||||||||||||||||||
Net operating income21 | 3,096 | 2,195 | 3,994 | 308 | 4,163 | (172 | ) | 13,584 | ||||||||||||||||||||||||||||||||||
Loan impairment charges and other credit risk provisions | (234 | ) | (154 | ) | (48 | ) | – | – | – | (436 | ) | |||||||||||||||||||||||||||||||
Net operating income | 2,862 | 2,041 | 3,946 | 308 | 4,163 | (172 | ) | 13,148 | ||||||||||||||||||||||||||||||||||
Total operating expenses | (2,238 | ) | (993 | ) | (1,279 | ) | (149 | ) | (1,319 | ) | 172 | (5,806 | ) | |||||||||||||||||||||||||||||
Operating profit | 624 | 1,048 | 2,667 | 159 | 2,844 | – | 7,342 | |||||||||||||||||||||||||||||||||||
Share of profit in associates and joint ventures | 893 | 1,554 | 658 | – | 1 | – | 3,106 | |||||||||||||||||||||||||||||||||||
Profit before tax | 1,517 | 2,602 | 3,325 | 159 | 2,845 | – | 10,448 | |||||||||||||||||||||||||||||||||||
| % | % | % | % | % | % | |||||||||||||||||||||||||||||||||||||
Share of HSBC’s profit before tax | 7.3 | 12.6 | 16.1 | 0.8 | 13.8 | 50.6 | ||||||||||||||||||||||||||||||||||||
Cost efficiency ratio | 72.3 | 45.2 | 32.0 | 48.4 | 31.7 | 42.7 | ||||||||||||||||||||||||||||||||||||
Balance sheet data74 | ||||||||||||||||||||||||||||||||||||||||||
| US$m | US$m | US$m | US$m | US$m | US$m | |||||||||||||||||||||||||||||||||||||
Loans and advances to customers (net) | 46,027 | 43,968 | 44,721 | 3,238 | 165 | 138,119 | ||||||||||||||||||||||||||||||||||||
Total assets | 55,509 | 59,123 | 201,774 | 12,142 | 24,534 | (10,813 | ) | 342,269 | ||||||||||||||||||||||||||||||||||
Customer accounts | 63,230 | 44,865 | 64,392 | 11,095 | 39 | 183,621 | ||||||||||||||||||||||||||||||||||||
97
Table of Contents
HSBC HOLDINGS PLC
Report of the Directors: Operating and Financial Review(continued)
Profit before tax and balance sheet data – Rest of Asia-Pacific(continued)
| 2011 | ||||||||||||||||||||||||||||||||||||||||||
Retail Banking and Wealth Management US$m | Commercial Banking US$m | Global and Markets US$m | Global Private Banking US$m | Other US$m | Inter- segment elimination85 US$m | Total US$m | ||||||||||||||||||||||||||||||||||||
Profit before tax | ||||||||||||||||||||||||||||||||||||||||||
Net interest income | 1,838 | 1,254 | 1,964 | 116 | 123 | (193 | ) | 5,102 | ||||||||||||||||||||||||||||||||||
Net fee income/(expense) | 904 | 513 | 621 | 82 | (9 | ) | – | 2,111 | ||||||||||||||||||||||||||||||||||
Trading income/(expense) excluding net interest income | 94 | 156 | 1,153 | 66 | (90 | ) | – | 1,379 | ||||||||||||||||||||||||||||||||||
Net interest income/(expense) on trading activities | (2 | ) | 1 | 76 | – | 11 | 193 | 279 | ||||||||||||||||||||||||||||||||||
Net trading income/(expense)78 | 92 | 157 | 1,229 | 66 | (79 | ) | 193 | 1,658 | ||||||||||||||||||||||||||||||||||
Changes in fair value of long-term debt issued and related derivatives | – | – | – | – | 4 | – | 4 | |||||||||||||||||||||||||||||||||||
Net income/(expense) from other financial instruments designated at fair value | (38 | ) | 2 | 1 | – | 15 | – | (20 | ) | |||||||||||||||||||||||||||||||||
Net income/(expense) from financial instruments designated at fair value | (38 | ) | 2 | 1 | – | 19 | – | (16 | ) | |||||||||||||||||||||||||||||||||
Gains less losses from financial investments | – | 2 | (25 | ) | 1 | (1 | ) | – | (23 | ) | ||||||||||||||||||||||||||||||||
Dividend income | – | – | 2 | – | – | – | 2 | |||||||||||||||||||||||||||||||||||
Net earned insurance premiums | 493 | 266 | – | – | – | – | 759 | |||||||||||||||||||||||||||||||||||
Other operating income | 145 | 72 | 75 | 5 | 1,592 | (178 | ) | 1,711 | ||||||||||||||||||||||||||||||||||
Total operating income | 3,434 | 2,266 | 3,867 | 270 | 1,645 | (178 | ) | 11,304 | ||||||||||||||||||||||||||||||||||
Net insurance claims86 | (351 | ) | (240 | ) | – | – | – | – | (591 | ) | ||||||||||||||||||||||||||||||||
Net operating income21 | 3,083 | 2,026 | 3,867 | 270 | 1,645 | (178 | ) | 10,713 | ||||||||||||||||||||||||||||||||||
Loan impairment (charges)/recoveries and other credit risk provisions | (222 | ) | 10 | (57 | ) | 2 | – | – | (267 | ) | ||||||||||||||||||||||||||||||||
Net operating income | 2,861 | 2,036 | 3,810 | 272 | 1,645 | (178 | ) | 10,446 | ||||||||||||||||||||||||||||||||||
Total operating expenses | (2,409 | ) | (945 | ) | (1,268 | ) | (181 | ) | (1,181 | ) | 178 | (5,806 | ) | |||||||||||||||||||||||||||||
Operating profit | 452 | 1,091 | 2,542 | 91 | 464 | – | 4,640 | |||||||||||||||||||||||||||||||||||
Share of profit/(loss) in associates and joint ventures | 1,189 | 1,155 | 547 | – | (60 | ) | – | 2,831 | ||||||||||||||||||||||||||||||||||
Profit before tax | 1,641 | 2,246 | 3,089 | 91 | 404 | – | 7,471 | |||||||||||||||||||||||||||||||||||
| % | % | % | % | % | % | |||||||||||||||||||||||||||||||||||||
Share of HSBC’s profit before tax | 7.5 | 10.3 | 14.1 | 0.4 | 1.9 | 34.2 | ||||||||||||||||||||||||||||||||||||
Cost efficiency ratio | 78.1 | 46.6 | 32.8 | 67.0 | 71.8 | 54.2 | ||||||||||||||||||||||||||||||||||||
Balance sheet data74 | ||||||||||||||||||||||||||||||||||||||||||
| US$m | US$m | US$m | US$m | US$m | US$m | |||||||||||||||||||||||||||||||||||||
| Loans and advances to customers (net) | 40,970 | 38,404 | 41,114 | 3,190 | 190 | 123,868 | ||||||||||||||||||||||||||||||||||||
Total assets | 54,484 | 50,688 | 195,549 | 12,879 | 16,616 | (12,400 | ) | 317,816 | ||||||||||||||||||||||||||||||||||
Customer accounts | 60,831 | 40,423 | 60,855 | 11,872 | 31 | 174,012 | ||||||||||||||||||||||||||||||||||||
For footnotes, see page 120.
98
Table of Contents
HSBC HOLDINGS PLC
Report of the Directors: Operating and Financial Review(continued)
Profit/(loss) before tax and balance sheet data – Rest of Asia-Pacific(continued)
| 2010 | ||||||||||||||||||||||||||||||||||||||||
Retail Banking and Wealth Management US$m | Commercial Banking US$m | Global Banking and Markets US$m | Global Private Banking US$m | Other US$m | Inter- segment elimination85 US$m | Total US$m | ||||||||||||||||||||||||||||||||||
Profit before tax | ||||||||||||||||||||||||||||||||||||||||
Net interest income | 1,581 | 938 | 1,435 | 91 | 55 | (272 | ) | 3,828 | ||||||||||||||||||||||||||||||||
Net fee income/(expense) | 834 | 442 | 611 | 55 | (10 | ) | – | 1,932 | ||||||||||||||||||||||||||||||||
Trading income/(expense) excluding net interest income | 80 | 129 | 967 | 69 | (38 | ) | – | 1,207 | ||||||||||||||||||||||||||||||||
Net interest income on trading activities | – | – | 138 | – | 1 | 272 | 411 | |||||||||||||||||||||||||||||||||
Net trading income/(expense)78 | 80 | 129 | 1,105 | 69 | (37 | ) | 272 | 1,618 | ||||||||||||||||||||||||||||||||
Changes in fair value of long- term debt issued and related | – | – | – | – | (2 | ) | – | (2 | ) | |||||||||||||||||||||||||||||||
Net income/(expense) from other financial instruments designated at fair value | 41 | 2 | (1 | ) | – | (16 | ) | – | 26 | |||||||||||||||||||||||||||||||
Net income/(expense) from financial instruments designated at fair value | 41 | 2 | (1 | ) | – | (18 | ) | – | 24 | |||||||||||||||||||||||||||||||
Gains less losses from financial investments | – | 3 | 51 | – | 92 | – | 146 | |||||||||||||||||||||||||||||||||
Dividend income | – | – | 1 | – | – | – | 1 | |||||||||||||||||||||||||||||||||
Net earned insurance premiums | 386 | 62 | – | – | – | – | 448 | |||||||||||||||||||||||||||||||||
Other operating income | 109 | 86 | 55 | 1 | 1,499 | (152 | ) | 1,598 | ||||||||||||||||||||||||||||||||
Total operating income | 3,031 | 1,662 | 3,257 | 216 | 1,581 | (152 | ) | 9,595 | ||||||||||||||||||||||||||||||||
Net insurance claims86 | (324 | ) | (39 | ) | – | – | – | – | (363 | ) | ||||||||||||||||||||||||||||||
Net operating income21 | 2,707 | 1,623 | 3,257 | 216 | 1,581 | (152 | ) | 9,232 | ||||||||||||||||||||||||||||||||
Loan impairment charges and other credit risk provisions | (298 | ) | (19 | ) | (122 | ) | – | – | – | (439 | ) | |||||||||||||||||||||||||||||
Net operating income | 2,409 | 1,604 | 3,135 | 216 | 1,581 | (152 | ) | 8,793 | ||||||||||||||||||||||||||||||||
Total operating expenses | (2,233 | ) | (799 | ) | (1,094 | ) | (135 | ) | (1,034 | ) | 152 | (5,143 | ) | |||||||||||||||||||||||||||
Operating profit | 176 | 805 | 2,041 | 81 | 547 | – | 3,650 | |||||||||||||||||||||||||||||||||
Share of profit in associates and joint ventures | 986 | 751 | 447 | – | 68 | – | 2,252 | |||||||||||||||||||||||||||||||||
Profit before tax | 1,162 | 1,556 | 2,488 | 81 | 615 | – | 5,902 | |||||||||||||||||||||||||||||||||
| % | % | % | % | % | % | |||||||||||||||||||||||||||||||||||
Share of HSBC’s profit before tax | 6.1 | 8.2 | 13.1 | 0.4 | 3.2 | 31.0 | ||||||||||||||||||||||||||||||||||
Cost efficiency ratio | 82.5 | 49.2 | 33.6 | 62.5 | 65.4 | 55.7 | ||||||||||||||||||||||||||||||||||
Balance sheet data74 | ||||||||||||||||||||||||||||||||||||||||
| US$m | US$m | US$m | US$m | US$m | US$m | |||||||||||||||||||||||||||||||||||
Loans and advances to customers (net) | 37,831 | 31,423 | 35,810 | 3,489 | 178 | 108,731 | ||||||||||||||||||||||||||||||||||
Total assets | 49,758 | 41,588 | 166,710 | 12,126 | 19,450 | (11,570 | ) | 278,062 | ||||||||||||||||||||||||||||||||
Customer accounts | 54,741 | 36,943 | 53,752 | 12,620 | 99 | 158,155 | ||||||||||||||||||||||||||||||||||
For footnotes, see page 120.
98a
Table of Contents
HSBC HOLDINGS PLC
Report of the Directors: Operating and Financial Review(continued)
The network of branches of HSBC Bank Middle East Limited, together with HSBC’s subsidiaries and associates, gives us the widest coverage in the region. Our associate in Saudi Arabia, The Saudi British Bank (40% owned), is the Kingdom’s sixth largest bank by total assets.
| 2012 US$m | 2011 US$m | 2010 US$m | ||||||||||||||
Net interest income | 1,470 | 1,432 | 1,367 | |||||||||||||
Net fee income | 595 | 627 | 677 | |||||||||||||
Net trading income | 390 | 482 | 370 | |||||||||||||
Other income | (25 | ) | 66 | (4 | ) | |||||||||||
Net operating income21 | 2,430 | 2,607 | 2,410 | |||||||||||||
LICs76 | (286 | ) | (293 | ) | (627 | ) | ||||||||||
Net operating income | 2,144 | 2,314 | 1,783 | |||||||||||||
Total operating expenses | (1,166 | ) | (1,159 | ) | (1,078 | ) | ||||||||||
Operating profit | 978 | 1,155 | 705 | |||||||||||||
Income from associates77 | 372 | 337 | 187 | |||||||||||||
Profit before tax | 1,350 | 1,492 | 892 | |||||||||||||
Cost efficiency ratio | 48.0% | 44.5% | 44.7% | |||||||||||||
RoRWA66 | 2.2% | 2.6% | 1.6% | |||||||||||||
Year-end staff numbers | 8,765 | 8,373 | 8,676 | |||||||||||||
Completed two acquisitions and made progress on the Group’s six filters | ||
Approximately US$70m sustainable cost savings from our organisational effectiveness programmes | ||
4th consecutive year:
Best Regional Cash Management Provider in the Middle East Euromoney | 5th consecutive year:
Best Trade Finance Bank in the Middle East and North Africa Global Trade Review 2012 | |
For footnotes, see page 120.
Economic background
Real GDP in theMiddle East and North Africa region grew by an estimated 4.5% in 2012. However, this weighted aggregate figure masked a wide disparity between oil producers (5.1%) and non-oil producers (2.9%). For the Gulf Cooperation Council’s top performers, energy output volumes remained high and revenues rose, fuelling government spending-driven domestic demand which fed through to a stronger non-oil private sector performance, job creation and a recovery in bank lending.Saudi Arabia (which recorded growth of nearly 7% in 2012),Qatar(6%) andOman (5%) fell into this category. In theUAE, more muted fiscal and monetary stimuli meant overall growth was slower, but Dubai’s export-oriented service sector recorded a good recovery in 2012, and Abu Dhabi picked up in the second half of the year. Despite the strong growth, inflation remained low across the Gulf region.
InEgypt, growth remained weak, held back by ongoing political uncertainty which continued to weigh on domestic and foreign investment and consumption. Pressure on public finances and Egypt’s external accounts remained pronounced, with the Egyptian pound weakening significantly. Elsewhere in the oil importing parts of the region, the pressures were not as great, but in Lebanon, Jordan, Morocco and Tunisia, growth fell and their external balances deteriorated, with the latter three, following a significant worsening of public finances, approaching the International Monetary Fund for assistance by the end of the year.
Review of performance
Our operations in the Middle East and North Africa reported a profit before tax of US$1.4bn, a decrease of 10% compared with 2011. On a constant currency basis, pre-tax profits decreased by 9%.
Our reported results in 2012 included an investment loss on a subsidiary of US$85m and adverse movements of US$12m on our own debt designated at fair value resulting from tightening credit spreads, partly offset by gains recognised on acquisitions totalling US$21m. Reported profits in 2011 included a dilution gain of US$27m on our holding in HSBC Saudi Arabia Ltd following its merger with SABB Securities Ltd and a loss of US$7m relating to the disposal of our Private Equity business. On an underlying basis, excluding the items noted above, profit before tax decreased by 3% as a result of a small number of significant impairments on GB&M exposures.
99
Table of Contents
HSBC HOLDINGS PLC
Report of the Directors: Operating and Financial Review(continued)
Profit/(loss) before tax by country within global businesses
Retail Management US$m | Commercial Banking US$m | Global Markets US$m | Global Private | Other US$m | Total US$m | |||||||||||||||||||||||||||||
2012 | ||||||||||||||||||||||||||||||||||
Egypt | 67 | 71 | 157 | – | (5 | ) | 290 | |||||||||||||||||||||||||||
Qatar | 9 | 36 | 84 | – | – | 129 | ||||||||||||||||||||||||||||
United Arab Emirates | 143 | 235 | 141 | 1 | (56 | ) | 464 | |||||||||||||||||||||||||||
Other | (27 | ) | 125 | 29 | – | (37 | ) | 90 | ||||||||||||||||||||||||||
MENA (excluding Saudi Arabia) | 192 | 467 | 411 | 1 | (98 | ) | 973 | |||||||||||||||||||||||||||
Saudi Arabia | 60 | 120 | 170 | 9 | 18 | 377 | ||||||||||||||||||||||||||||
| 252 | 587 | 581 | 10 | (80 | ) | 1,350 | ||||||||||||||||||||||||||||
2011 | ||||||||||||||||||||||||||||||||||
Egypt | 43 | 55 | 129 | – | (2 | ) | 225 | |||||||||||||||||||||||||||
Qatar | (4 | ) | 35 | 81 | – | – | 112 | |||||||||||||||||||||||||||
United Arab Emirates | 134 | 240 | 200 | (6 | ) | 7 | 575 | |||||||||||||||||||||||||||
Other | 17 | 109 | 93 | – | – | 219 | ||||||||||||||||||||||||||||
MENA (excluding Saudi Arabia) | 190 | 439 | 503 | (6 | ) | 5 | 1,131 | |||||||||||||||||||||||||||
Saudi Arabia | 57 | 98 | 140 | 4 | 62 | 361 | ||||||||||||||||||||||||||||
| 247 | 537 | 643 | (2 | ) | 67 | 1,492 | ||||||||||||||||||||||||||||
2010 | ||||||||||||||||||||||||||||||||||
Egypt | 38 | 82 | 77 | – | (2 | ) | 195 | |||||||||||||||||||||||||||
Qatar | 19 | 52 | 67 | – | – | 138 | ||||||||||||||||||||||||||||
United Arab Emirates | 17 | 186 | 121 | 1 | (1 | ) | 324 | |||||||||||||||||||||||||||
Other | 19 | 57 | (19 | ) | – | – | 57 | |||||||||||||||||||||||||||
MENA (excluding Saudi Arabia) | 93 | 377 | 246 | 1 | (3 | ) | 714 | |||||||||||||||||||||||||||
Saudi Arabia | 25 | 107 | 53 | (16 | ) | 9 | 178 | |||||||||||||||||||||||||||
| 118 | 484 | 299 | (15 | ) | 6 | 892 | ||||||||||||||||||||||||||||
During 2012, we focused on simplifying our operations in the Middle East and North Africa by disposing of non-strategic businesses and continuing to improve our organisational efficiency while investing in strategic acquisitions.
We made significant progress in integrating our operations in Oman with OIB following the merger in June 2012. The combined entity, HSBC Bank Oman S.A.O.G., of which we own 51%, is now the third largest bank in the Sultanate. We also completed the acquisition of the onshore retail and commercial banking business of Lloyds Banking Group in the UAE in the fourth quarter of 2012. Lloyds’ strong presence in expatriate retail banking and commercial banking was a good strategic fit with our position as the leading international bank in the UAE. We also completed the disposal of 80.1% of our Private Equity business in December. We announced in September our agreement to sell our operations in Pakistan and, in October, the restructuring of our Amanah business in the region outside Saudi Arabia.
We remained focused on our priority markets, delivering profit growth in Egypt and Saudi Arabia. The strong performance in Egypt was driven by
robust deposit growth in RBWM which led to higher net interest income. We also achieved growth in profits from our associates, mainly The Saudi British Bank, which won theEuromoney award for excellence as ‘The Best Bank in Saudi Arabia’ and ‘The Best Debt House in Saudi Arabia’. Although profit before tax declined in the UAE as a result of the impairments in GB&M noted above, it remains a priority market for HSBC and the economy continued to improve in 2012.
Delivery of sustainable cost savings remained a priority for 2012. Our organisational effectiveness initiatives included streamlining procedures by delayering our management structure and transferring additional operational processes to our global service centres. We realised about US$70m in sustainable savings from our organisational effectiveness programmes.
In RBWM, we remained focused on growing Wealth Management revenues. We entered into a strategic alliance with Zurich Life International (‘Zurich’) in 2012 to provide wealth and general insurance products to our customers in the region. Our focus on foreign exchange resulted in increased transaction volumes, which provided us with higher
100
Table of Contents
HSBC HOLDINGS PLC
Report of the Directors: Operating and Financial Review(continued)
Wealth Management revenues for 2012. In addition, we enhanced our internet banking capabilities in the UAE to provide improved security and rolled out our digital solution for mobile banking in the region to allow customers greater accessibility.
In CMB, we continued to support internationally oriented SMEs. This was evidenced by the launch of our third SME fund in the UAE of AED1bn (US$272m), targeted at international trade customers. We continued to invest in the Global Trade and Receivables Finance client service and business development teams, and enhanced our Receivables Finance products across the region. We endeavoured to strengthen this position by holding mainland China and Turkey events to focus on these emerging trade routes.
Our Payments and Cash Management business continued to record strong revenue growth, and was named ‘The Best Cash Management House in the Middle East 2012’ in theEuromoney awards for excellence for the fourth consecutive year.
In GB&M, we continued to focus on ‘South-South’ connectivity. We leveraged our global expertise to provide access to Asian investors for issuers in the region with funding requirements with our dedicated coverage teams on our mainland China, South Korea and India desks in the UAE and Saudi Arabia. We also completed a significant number of bond issuances, reflecting the continuing investor appetite for the region’s debt. We won severalEuromoney awards for excellence including ‘The Best Debt House in the Middle East’ and ‘The Best Flow House in the Middle East’. GB&M also wonGlobal Investor’s‘The Best Domestic Custodian’.
The following commentary is on a constant currency basis.
Net interest income rose by 3%, driven by higher average deposit balances in RBWM, primarily savings accounts in Egypt, reflecting the competitive pricing introduced at the beginning of the year. Despite this, we benefited from wider spreads as interest rates rose in Egypt. Net interest income in CMB was in line with 2011 as higher income resulting from the merger with OIB was offset by competitive asset pricing across most of the region.
Net fee income decreased by 4% due to a decline in credit and lending, Securities Services and advisory fees in GB&M, which were affected by lower levels of deal activity and the challenging political and economic environment. Fees also declined in RBWM due to higher reward scheme charges in the UAE following revisions to the agreement with our partner aimed at improving card
utilisation, partly offset by higher insurance revenues as a result of the strategic alliance with Zurich. The decline in fees was also attributable to our exit from domestic private banking in the UAE. These factors were partly offset by higher trade import fees in CMB in Algeria, Oman and Jordan driven by higher volumes from targeted sales activity.
Net trading income decreased by 18%, mainly due to unfavourable credit valuation adjustments on trading positions relating to a small number of exposures in GB&M. We also reported adverse fair value movements on certain economic hedges as well as on structured liabilities as credit spreads tightened. This was partly offset by higher revaluation gains on equity holdings in Principal Investments.
Gains less losses from financial investments increased by US$17m, driven by the non-recurrence of impairments on two available-for-sale equity securities in 2011, together with gains on the disposal of available-for-sale equity and debt securities in 2012.
Other operating income decreased by US$89m, driven by the US$85m investment loss on a subsidiary.
Loan impairment charges and other credit risk provisionsdecreased by US$6m. Lower impairments in RBWM attributable to an improvement in delinquency rates reflected the repositioning of the book towards higher quality lending in previous years. In addition, CMB recorded a modest reduction in loan impairment charges as higher customer recoveries were largely offset by individually assessed impairments.These were partly offset by significant loan impairment charges recorded for a small number of large exposures in GB&M.
Operating expenses increased by 1% as a result of employee and legal costs relating to the merger of our Omani operations with OIB and the acquisition of the onshore retail and commercial banking business of Lloyds Banking Group in the UAE. This was partially offset by the benefit arising from sustainable cost saving initiatives implemented in 2011 and throughout 2012. Excluding the effect of the two acquisitions, we reduced both our employee numbers and our cost base.
Share of profits from associates and joint venturesincreased by 10%, mainly from The Saudi British Bank. This was driven by higher revenue resulting from strong balance sheet growth, together with lower costs derived from effective control and monitoring.
101
Table of Contents
HSBC HOLDINGS PLC
Report of the Directors: Operating and Financial Review(continued)
Reconciliation of reported and constant currency profit before tax – Middle East and North Africa
| 2011 as reported US$m | Currency translation adjustment24 US$m | 2011 rates US$m | 2012 as reported US$m | Reported change25 % | Constant change25 % | |||||||||||||||||||||||||||||
Net interest income | 1,432 | (9 | ) | 1,423 | 1,470 | 3 | 3 | |||||||||||||||||||||||||||
Net fee income | 627 | (4 | ) | 623 | 595 | (5 | ) | (4 | ) | |||||||||||||||||||||||||
Own credit spread26 | 14 | – | 14 | (12 | ) | |||||||||||||||||||||||||||||
Other income27 | 534 | (1 | ) | 533 | 377 | (29 | ) | (29 | ) | |||||||||||||||||||||||||
Net operating income21 | 2,607 | (14 | ) | 2,593 | 2,430 | (7 | ) | (6 | ) | |||||||||||||||||||||||||
Loan impairment charges and other credit risk provisions | (293 | ) | 1 | (292 | ) | (286 | ) | 2 | 2 | |||||||||||||||||||||||||
Net operating income | 2,314 | (13 | ) | 2,301 | 2,144 | (7 | ) | (7 | ) | |||||||||||||||||||||||||
Operating expenses | (1,159 | ) | 6 | (1,153 | ) | (1,166 | ) | (1 | ) | (1 | ) | |||||||||||||||||||||||
Operating profit | 1,155 | (7 | ) | 1,148 | 978 | (15 | ) | (15 | ) | |||||||||||||||||||||||||
Income from associates | 337 | – | 337 | 372 | 10 | 10 | ||||||||||||||||||||||||||||
Profit before tax | 1,492 | (7 | ) | 1,485 | 1,350 | (10 | ) | (9 | ) | |||||||||||||||||||||||||
For footnotes, see page 120.
Reconciliation of reported and underlying29 items – Middle East and North Africa
| Year ended 31 December | ||||||||||||||||
| 2012 US$m | 2011 US$m | Change % | ||||||||||||||
Revenue21 | ||||||||||||||||
Reported revenue | 2,430 | 2,607 | (7 | ) | ||||||||||||
Currency translation adjustment24 | �� | (14 | ) | |||||||||||||
Own credit spread26 | 12 | (14 | ) | |||||||||||||
Acquisitions, disposals and dilutions | 3 | (79 | ) | |||||||||||||
Underlying revenue | 2,445 | 2,500 | (2 | ) | ||||||||||||
Loan impairment charges and other credit risk provisions (‘LIC’s) | ||||||||||||||||
Reported LICs | (286 | ) | (293 | ) | 2 | |||||||||||
Currency translation adjustment24 | 1 | |||||||||||||||
Acquisitions, disposals and dilutions | – | – | ||||||||||||||
Underlying LICs | (286 | ) | (292 | ) | 2 | |||||||||||
Operating expenses | ||||||||||||||||
Reported operating expenses | (1,166 | ) | (1,159 | ) | (1 | ) | ||||||||||
Currency translation adjustment24 | 6 | |||||||||||||||
Acquisitions, disposals and dilutions | 15 | 25 | ||||||||||||||
Underlying operating expenses | (1,151 | ) | (1,128 | ) | (2 | ) | ||||||||||
Underlying cost efficiency ratio | 47.1% | 45.1% | ||||||||||||||
Profit before tax | ||||||||||||||||
Reported profit before tax | 1,350 | 1,492 | (10 | ) | ||||||||||||
Currency translation adjustment24 | (7 | ) | ||||||||||||||
Own credit spread26 | 12 | (14 | ) | |||||||||||||
Acquisitions, disposals and dilutions | 18 | (54 | ) | |||||||||||||
Underlying profit before tax | 1,380 | 1,417 | (3 | ) | ||||||||||||
For footnotes, see page 120.
101a
Table of Contents
HSBC HOLDINGS PLC
Report of the Directors: Operating and Financial Review(continued)
2011 compared with 2010
Economic background
In the Middle East and North Africa region, GDP grew by more than 5% in 2011, though the headline figure masks a wide variance in overall performance and growth drivers. In the oil producing states of the Gulf, high oil prices prompted growth in oil output and encouraged substantial increases in current and capital spending, most notably inSaudi Arabia. The export-oriented service sectors of countries including theUAE also grew robustly, supported in part by firm Asian demand.
The aggregate fiscal and current account surpluses of the Gulf Co-operation Council members stood at 15% and 25% of GDP, respectively, significantly higher than in 2010. Despite the pick-up in growth, CPI inflation remained generally muted with slow private sector wage growth and broadly unchanged real estate prices.
Regional political uncertainties weighed more heavily on performance elsewhere, however, particularly in countries that were subject to regime change. InEgypt, the level of GDP fell by an estimated 6 percentage points year-on-year as unrest held back investment and service sector exports, particularly tourism, contracted. Increased pressure on public finances and external account balances also added to the challenges for the post-revolution economies.
Review of performance
Our operations in the Middle East and North Africa reported a profit before tax of US$1.5bn, an increase of US$600m, or 67%. In 2010, we completed the sale of our investment in the British Arab Commercial Bank on which a loss of US$42m was incurred. In 2011, we recorded a dilution gain of US$27m as a result of the reduction of our holding in HSBC Saudi Arabia Limited following its merger with SABB Securities Limited. On an underlying basis, excluding these items, pre-tax profits increased by 57% as significant loan impairment charges in 2010 did not recur and trading income rose. In addition, profits from our associate, The Saudi British Bank, increased significantly driven by a decline in loan impairment charges as the credit environment in Saudi Arabia improved.
Despite political unrest and economic pressures, profits increased in all countries with the exception of Qatar, which was adversely affected by new regulations on foreign banks which curtailed growth in certain products, and Jordan, where we incurred a specific loan impairment charge related to a
corporate customer. Customer deposits across the region grew by 10%, reflecting the overall resilience of the oil-based regional economies and the strength of the HSBC brand.
We initiated a number of strategic programmes to optimise and reconfigure our branch network. This resulted in branch closures and consolidations in Jordan, Lebanon, Qatar and Bahrain together with an exit from our retail operations in Kuwait and part of our Principal Investments business. We also reconfigured domestic private banking in the UAE in order to focus solely on international private banking products and services through the conversion of the existing operation into a representative office for GPB.
In RBWM, we continued to focus on wealth management and secured lending, while building long-term relationships through our Premier and Advance customer offerings. During 2011, we implemented new technologies to improve our financial planning capabilities. We also successfully launched mobile banking in the UAE, Oman, Bahrain and Jordan allowing customers to access HSBC Internet Banking instantly through smart phones.
In CMB, we continued to strengthen our position as a leading international trade and business bank, achieving double-digit trade-related growth year-on-year and increasing market share in key markets. We also launched services to support settlements in renminbi to further facilitate trade between mainland China and the region.
In the UAE, we entered into partnerships with a number of Free Trade Zones to provide improved access to banking services for internationally-oriented SMEs.
In Payments and Cash Management, we launched ‘ClientSphere’, a system which will further simplify cash management products and improve the overall customer experience. We also won a number of awards, including ‘Best Overall Bank for Cash Management in the Middle East’ fromGlobal Finance Awards and ‘Best Cash Management Bank in the Middle East’ fromEuromoney.
Greater collaboration between CMB and GB&M benefited both businesses with a significant increase in GB&M-related revenues from 2010.
In GB&M, we continued to focus on our key clients and used our global expertise and reach both to complete a number of cross-border deals for regional clients and provide risk management solutions tailored for customer needs, including Islamic products. We won a number of awards,
101b
Table of Contents
HSBC HOLDINGS PLC
Report of the Directors: Operating and Financial Review(continued)
including ‘Best for Middle Eastern Currencies’ in theEuromoney FX survey and ‘Best Risk Advisor in Middle East’ fromEuromoney. We continued to be recognised as a leading provider of Islamic financial services and we were awarded ‘Best Islamic Investment Bank, Middle East’ and ‘Sukuk House of the Year’ fromThe Asset Magazine Triple A Islamic Finance Awards.
Net interest incomerose by 6%, driven by strong growth in average trade lending balances in the second half of 2010 and throughout 2011 in CMB as we leveraged opportunities to support global and intra-regional trade flows. GB&M also benefited from the restructuring of a large customer facility along with improved spreads on investment portfolios. This was partly offset by a reduction in spreads in CMB as we priced competitively to drive volume growth. In addition, average lending balances declined in RBWM as unsecured lending portfolios continued to be managed down and replaced by higher quality lending resulting in an overall improvement in the credit quality of the portfolio. Central bank regulations limiting interest rates on certain products in Qatar also contributed to lower net interest income.
Net fee income decreased by 7%, despite higher trade volumes in CMB, as lower institutional equity activity in GB&M reflected the challenging political environment. In addition, net fee income in RBWM decreased due to a decline in the number of credit cards in issue as certain portfolios were managed down, along with lower late fees as a result of an improvement in delinquency rates.
Trading income increased by 31%, mainly in Rates in GB&M due to an increase in government bond trading along with a net release of credit valuation adjustments driven by movements in
exchange rates and an improvement in counterparty risk. A greater focus on sales of GB&M products to CMB customers, notably foreign exchange, also contributed to the rise in trading income.
Loan impairment charges and other credit risk provisions decreased markedly as the significant loan impairment charges which resulted from restructuring activity for a small number of large GB&M customers in 2010 did not recur. In addition, lower loan impairment charges in RBWM reflected a significant improvement in delinquency rates, which resulted from a repositioning of the loan book towards higher quality lending as we continued to manage down higher risk unsecured lending, together with strengthened collection practices. Our lending portfolios were not significantly adversely affected by political instability in the region, although uncertainties remain in certain of these markets.
Operating expenses increased by 8% due to an increase in staff costs as we enhanced the employee base, and to a lesser extent, in line with inflation. Strategic programmes, including de-layering our management structure, streamlining our business processes and implementing the ‘hub and spoke’ model to drive future sustainable cost savings, resulted in lower staff numbers than last year. This resulted in restructuring costs of US$31m. Marketing costs also rose as we increased investment in the promotion of the HSBC brand.
Profit from associates and joint ventures increased by 81%, mainly from The Saudi British Bank, driven by a decline in loan impairment charges as the credit environment in Saudi Arabia improved, along with cost control.
101c
Table of Contents
HSBC HOLDINGS PLC
Report of the Directors: Operating and Financial Review(continued)
Reconciliation of reported and underlying profit before tax
2011 compared with 2010 – Middle East and North Africa31
| 2010 as reported US$m | 2010 ments32 US$m | Currency translation adjustment24 US$m | 2010 rates33 US$m | 2011 as reported US$m | 2011 ments32 US$m | 2011 under- lying US$m | Re- ported change25 % | Under- lying change25 % | ||||||||||||||||||||||||||||||||||||||||||||
Net interest income | 1,367 | – | (12 | ) | 1,355 | 1,432 | – | 1,432 | 5 | 6 | ||||||||||||||||||||||||||||||||||||||||||
Net fee income | 677 | – | (4 | ) | 673 | 627 | – | 627 | (7 | ) | (7 | ) | ||||||||||||||||||||||||||||||||||||||||
Own credit spread26 | – | – | – | – | 14 | (14 | ) | – | – | – | ||||||||||||||||||||||||||||||||||||||||||
Other income27 | 366 | 42 | (3 | ) | 405 | 534 | (27 | ) | 507 | 46 | 25 | |||||||||||||||||||||||||||||||||||||||||
Net operating income21 | 2,410 | 42 | (19 | ) | 2,433 | 2,607 | (41 | ) | 2,566 | 8 | 5 | |||||||||||||||||||||||||||||||||||||||||
Loan impairment charges and other credit risk provisions | (627 | ) | – | 2 | (625 | ) | (293 | ) | – | (293 | ) | 53 | 53 | |||||||||||||||||||||||||||||||||||||||
Net operating income | 1,783 | 42 | (17 | ) | 1,808 | 2,314 | (41 | ) | 2,273 | 30 | 26 | |||||||||||||||||||||||||||||||||||||||||
Operating expenses | (1,078 | ) | – | 8 | (1,070 | ) | (1,159 | ) | – | (1,159 | ) | (8 | ) | (8 | ) | |||||||||||||||||||||||||||||||||||||
Operating profit | 705 | 42 | (9 | ) | 738 | 1,155 | (41 | ) | 1,114 | 64 | 51 | |||||||||||||||||||||||||||||||||||||||||
Income from associates | 187 | – | (1 | ) | 186 | 337 | – | 337 | 80 | 81 | ||||||||||||||||||||||||||||||||||||||||||
Profit before tax | 892 | 42 | (10 | ) | 924 | 1,492 | (41 | ) | 1,451 | 67 | 57 | |||||||||||||||||||||||||||||||||||||||||
For footnotes, see page 120.
101d
Table of Contents
HSBC HOLDINGS PLC
Report of the Directors: Operating and Financial Review(continued)
Profit/(loss) before tax and balance sheet data – Middle East and North Africa
| 2012 | ||||||||||||||||||||||||||||||||||||||||
| Retail Banking and Wealth Management US$m | Commercial Banking | Global Banking and Markets US$m | Global Private | Other US$m | Inter- elimination85 US$m | Total US$m | ||||||||||||||||||||||||||||||||||
Profit/(loss) before tax | ||||||||||||||||||||||||||||||||||||||||
Net interest income | 597 | 492 | 367 | 1 | 42 | (29 | ) | 1,470 | ||||||||||||||||||||||||||||||||
Net fee income/(expense) | 164 | 279 | 160 | 1 | (9 | ) | – | 595 | ||||||||||||||||||||||||||||||||
Trading income excluding net interest income | 68 | 94 | 208 | – | 3 | – | 373 | |||||||||||||||||||||||||||||||||
Net interest income/(expense) on trading activities | – | 2 | 30 | – | (44 | ) | 29 | 17 | ||||||||||||||||||||||||||||||||
Net trading income/(expense)78 | 68 | 96 | 238 | – | (41 | ) | 29 | 390 | ||||||||||||||||||||||||||||||||
Net income from financial instruments designated at fair value | – | – | – | – | (12 | ) | – | (12 | ) | |||||||||||||||||||||||||||||||
Gains less losses from financial investments | – | – | 9 | – | – | – | 9 | |||||||||||||||||||||||||||||||||
Dividend income | – | – | 5 | – | – | – | 5 | |||||||||||||||||||||||||||||||||
Other operating income/ (expense) | (16 | ) | 21 | 14 | 1 | 47 | (94 | ) | (27 | ) | ||||||||||||||||||||||||||||||
Total operating income | 813 | 888 | 793 | 3 | 27 | (94 | ) | 2,430 | ||||||||||||||||||||||||||||||||
Net insurance claims86 | – | – | – | – | – | – | – | |||||||||||||||||||||||||||||||||
Net operating income21 | 813 | 888 | 793 | 3 | 27 | (94 | ) | 2,430 | ||||||||||||||||||||||||||||||||
Loan impairment charges and other credit risk provisions | (55 | ) | (110 | ) | (119 | ) | (2 | ) | – | – | (286 | ) | ||||||||||||||||||||||||||||
Net operating income | 758 | 778 | 674 | 1 | 27 | (94 | ) | 2,144 | ||||||||||||||||||||||||||||||||
Total operating expenses | (561 | ) | (311 | ) | (264 | ) | – | (124 | ) | 94 | (1,166 | ) | ||||||||||||||||||||||||||||
Operating profit/(loss) | 197 | 467 | 410 | 1 | (97 | ) | – | 978 | ||||||||||||||||||||||||||||||||
Share of profit in associates and joint ventures | 55 | 120 | 171 | 9 | 17 | – | 372 | |||||||||||||||||||||||||||||||||
Profit/(loss) before tax | 252 | 587 | 581 | 10 | (80 | ) | – | 1,350 | ||||||||||||||||||||||||||||||||
| % | % | % | % | % | % | |||||||||||||||||||||||||||||||||||
Share of HSBC’s profit before tax | 1.2 | 2.8 | 2.8 | – | (0.3 | ) | 6.5 | |||||||||||||||||||||||||||||||||
Cost efficiency ratio | 69.0 | 35.0 | 33.3 | – | 459.3 | 48.0 | ||||||||||||||||||||||||||||||||||
Balance sheet data74 | ||||||||||||||||||||||||||||||||||||||||
| US$m | US$m | US$m | US$m | US$m | US$m | |||||||||||||||||||||||||||||||||||
Loans and advances to customers (net) | 5,828 | 13,559 | 8,699 | – | – | 28,086 | ||||||||||||||||||||||||||||||||||
Total assets | 6,562 | 15,651 | 36,582 | 50 | 6,840 | (3,080 | ) | 62,605 | ||||||||||||||||||||||||||||||||
Customer accounts | 19,802 | 12,826 | 6,880 | 3 | 72 | 39,583 | ||||||||||||||||||||||||||||||||||
102
Table of Contents
HSBC HOLDINGS PLC
Report of the Directors: Operating and Financial Review(continued)
| 2011 | ||||||||||||||||||||||||||||||||||||||||
| Retail Banking and Wealth Management US$m | Commercial Banking | Global Banking and Markets US$m | Global Private | Other US$m | Inter- elimination85 US$m | Total US$m | ||||||||||||||||||||||||||||||||||
Profit/(loss) before tax | ||||||||||||||||||||||||||||||||||||||||
Net interest income | 589 | 496 | 371 | 2 | 2 | (28 | ) | 1,432 | ||||||||||||||||||||||||||||||||
Net fee income/(expense) | 173 | 271 | 173 | 13 | (3 | ) | – | 627 | ||||||||||||||||||||||||||||||||
Trading income/(expense) excluding net interest income | 62 | 95 | 266 | 1 | (1 | ) | – | 423 | ||||||||||||||||||||||||||||||||
Net interest income/(expense) on trading activities | – | – | 32 | – | (1 | ) | 28 | 59 | ||||||||||||||||||||||||||||||||
Net trading income/(expense)78 | 62 | 95 | 298 | 1 | (2 | ) | 28 | 482 | ||||||||||||||||||||||||||||||||
Net income from financial instruments designated at fair value | – | – | – | – | 10 | – | 10 | |||||||||||||||||||||||||||||||||
Gains less losses from financial investments | 1 | 1 | (7 | ) | – | (3 | ) | – | (8 | ) | ||||||||||||||||||||||||||||||
Dividend income | 1 | 1 | 3 | – | – | – | 5 | |||||||||||||||||||||||||||||||||
Other operating income/ (expense) | 22 | 11 | 11 | (1 | ) | 124 | (108 | ) | 59 | |||||||||||||||||||||||||||||||
Total operating income | 848 | 875 | 849 | 15 | 128 | (108 | ) | 2,607 | ||||||||||||||||||||||||||||||||
Net insurance claims86 | – | – | – | – | – | – | – | |||||||||||||||||||||||||||||||||
Net operating income21 | 848 | 875 | 849 | 15 | 128 | (108 | ) | 2,607 | ||||||||||||||||||||||||||||||||
Loan impairment charges and other credit risk provisions | (126 | ) | (116 | ) | (51 | ) | – | – | �� | – | (293 | ) | ||||||||||||||||||||||||||||
Net operating income | 722 | 759 | 798 | 15 | 128 | (108 | ) | 2,314 | ||||||||||||||||||||||||||||||||
Total operating expenses | (535 | ) | (320 | ) | (295 | ) | (21 | ) | (96 | ) | 108 | (1,159 | ) | |||||||||||||||||||||||||||
Operating profit/(loss) | 187 | 439 | 503 | (6 | ) | 32 | – | 1,155 | ||||||||||||||||||||||||||||||||
Share of profit in associates and joint ventures | 60 | 98 | 140 | 4 | 35 | – | 337 | |||||||||||||||||||||||||||||||||
Profit/(loss) before tax | 247 | 537 | 643 | (2 | ) | 67 | – | 1,492 | ||||||||||||||||||||||||||||||||
| % | % | % | % | % | % | |||||||||||||||||||||||||||||||||||
Share of HSBC’s profit before tax | 1.1 | 2.5 | 2.9 | – | 0.3 | 6.8 | ||||||||||||||||||||||||||||||||||
Cost efficiency ratio | 63.1 | 36.6 | 34.7 | 140.0 | 75.0 | 44.5 | ||||||||||||||||||||||||||||||||||
Balance sheet data74 | ||||||||||||||||||||||||||||||||||||||||
| US$m | US$m | US$m | US$m | US$m | US$m | |||||||||||||||||||||||||||||||||||
Loans and advances to customers (net) | 4,921 | 12,446 | 8,479 | 26 | 3 | 25,875 | ||||||||||||||||||||||||||||||||||
Total assets | 6,549 | 14,556 | 34,676 | 72 | 4,792 | (3,181 | ) | 57,464 | ||||||||||||||||||||||||||||||||
Customer accounts | 18,549 | 10,943 | 6,703 | 114 | 113 | 36,422 | ||||||||||||||||||||||||||||||||||
For footnotes, see page 120.
103
Table of Contents
HSBC HOLDINGS PLC
Report of the Directors: Operating and Financial Review(continued)
Profit/(loss) before tax and balance sheet data – Middle East and North Africa(continued)
| 2010 | ||||||||||||||||||||||||||||||||||||||||
Retail Banking and Wealth Management US$m | Commercial Banking | Global Markets US$m | Global Private | Other US$m | Inter- elimination85 US$m | Total US$m | ||||||||||||||||||||||||||||||||||
Profit/(loss) before tax | ||||||||||||||||||||||||||||||||||||||||
Net interest income | 553 | 473 | 334 | – | 14 | (7 | ) | 1,367 | ||||||||||||||||||||||||||||||||
Net fee income | 200 | 258 | 202 | 17 | – | – | 677 | |||||||||||||||||||||||||||||||||
Trading income/(expense) excluding net interest income | 59 | 85 | 205 | 1 | (7 | ) | – | 343 | ||||||||||||||||||||||||||||||||
Net interest income/(expense) on trading activities | 1 | 7 | 18 | – | (6 | ) | 7 | 27 | ||||||||||||||||||||||||||||||||
Net trading income/(expense)78 | 60 | 92 | 223 | 1 | (13 | ) | 7 | 370 | ||||||||||||||||||||||||||||||||
Net income/(expense) from financial instruments designated at fair value | – | – | – | – | – | – | – | |||||||||||||||||||||||||||||||||
Gains less losses from financial investments | 1 | – | (3 | ) | – | (1 | ) | – | (3 | ) | ||||||||||||||||||||||||||||||
Dividend income | 2 | 1 | 4 | – | – | – | 7 | |||||||||||||||||||||||||||||||||
Other operating income/ (expense) | 27 | (8 | ) | (1 | ) | 1 | 40 | (67 | ) | (8 | ) | |||||||||||||||||||||||||||||
Total operating income | 843 | 816 | 759 | 19 | 40 | (67 | ) | 2,410 | ||||||||||||||||||||||||||||||||
Net insurance claims86 | – | – | – | – | – | – | – | |||||||||||||||||||||||||||||||||
Net operating income21 | 843 | 816 | 759 | 19 | 40 | (67 | ) | 2,410 | ||||||||||||||||||||||||||||||||
Loan impairment charges and other credit risk provisions | (227 | ) | (145 | ) | (255 | ) | – | – | – | (627 | ) | |||||||||||||||||||||||||||||
Net operating income | 616 | 671 | 504 | 19 | 40 | (67 | ) | 1,783 | ||||||||||||||||||||||||||||||||
Total operating expenses | (524 | ) | (297 | ) | (263 | ) | (18 | ) | (43 | ) | 67 | (1,078 | ) | |||||||||||||||||||||||||||
Operating profit/(loss) | 92 | 374 | 241 | 1 | (3 | ) | – | 705 | ||||||||||||||||||||||||||||||||
Share of profit/(loss) in associates and joint ventures | 26 | 110 | 58 | (16 | ) | 9 | – | 187 | ||||||||||||||||||||||||||||||||
Profit/(loss) before tax | 118 | 484 | 299 | (15 | ) | 6 | – | 892 | ||||||||||||||||||||||||||||||||
| % | % | % | % | % | % | |||||||||||||||||||||||||||||||||||
Share of HSBC’s profit before tax | 0.6 | 2.6 | 1.6 | (0.1 | ) | – | 4.7 | |||||||||||||||||||||||||||||||||
Cost efficiency ratio | 62.2 | 36.4 | 34.7 | 94.7 | 107.5 | 44.7 | ||||||||||||||||||||||||||||||||||
Balance sheet data74 | ||||||||||||||||||||||||||||||||||||||||
| US$m | US$m | US$m | US$m | US$m | US$m | |||||||||||||||||||||||||||||||||||
Loans and advances to customers (net) | 5,063 | 12,293 | 7,247 | 21 | 2 | 24,626 | ||||||||||||||||||||||||||||||||||
Total assets | 6,286 | 13,991 | 31,253 | 59 | 4,129 | (2,961 | ) | 52,757 | ||||||||||||||||||||||||||||||||
Customer accounts | 17,538 | 10,319 | 5,306 | 290 | 58 | 33,511 | ||||||||||||||||||||||||||||||||||
For footnotes, see page 120.
103a
Table of Contents
HSBC HOLDINGS PLC
Report of the Directors: Operating and Financial Review(continued)
Our North American businesses are located in the US, Canada and Bermuda. Operations in the US are primarily conducted through HSBC Bank USA, N.A., and HSBC Finance, a national consumer finance company. HSBC Markets (USA) Inc. is the intermediate holding company of,inter alia, HSBC Securities (USA) Inc. HSBC Bank Canada and HSBC Bank Bermuda operate in their respective countries.
| 2012 US$m | 2011 US$m | 2010 US$m | ||||||||||||||
Net interest income | 8,117 | 11,480 | 12,439 | |||||||||||||
Net fee income | 2,513 | 3,308 | 3,664 | |||||||||||||
Net trading income/(expense) | 507 | (362 | ) | 314 | ||||||||||||
Gains on disposals of US branch network and cards business | 4,012 | – | – | |||||||||||||
Other income/(expense) | (456 | ) | 1,574 | 630 | ||||||||||||
Net operating income21 | 14,693 | 16,000 | 17,047 | |||||||||||||
LICs76 | (3,457 | ) | (7,016 | ) | (8,295 | ) | ||||||||||
Net operating income | 11,236 | 8,984 | 8,752 | |||||||||||||
Total operating expenses | (8,940 | ) | (8,919 | ) | (8,322 | ) | ||||||||||
Operating profit | 2,296 | 65 | 430 | |||||||||||||
Income from associates77 | 3 | 35 | 24 | |||||||||||||
Profit before tax | 2,299 | 100 | 454 | |||||||||||||
Cost efficiency ratio | 60.8% | 55.7% | 48.8% | |||||||||||||
RoRWA66 | 0.8% | – | 0.1% | |||||||||||||
Year-end staff numbers | 22,443 | 30,981 | 33,865 | |||||||||||||
Gross balances in the CML portfolio,
including loans held for sale, down by
US$6.8bn to US$43bn
US$3.6bn
reduction in loan impairment charges,
including US$1.3bn relating to
Card and Retail Services
Record reported pre-tax profit of
US$1.1bn
from our Canadian operations
For footnotes, see page 120.
Economic background
In theUS, real GDP expanded by 2.2% in 2012, following 1.8% growth in 2011. Consumer spending increased at a moderate pace as households continued to pay down debt and rebuild wealth. The housing market improved in 2012. Residential investment rose by 11.9%, climbing from a multi-decade low in 2011. Sales of new and existing homes also increased, and house prices rose modestly during the year. The growth in fixed investment by business faltered in the middle of 2012, evidenced by a slowdown in capital equipment orders, but began to recover towards the end of the year. Export growth slowed to 3.2% in 2012, about half the growth recorded in 2011. Fiscal consolidation continued to hold back the economy. Budgetary caps on spending contributed to a 2.2% decline in federal government expenditure in 2012, in real terms. State and local government expenditure also continued to contract, though the severity of the cutbacks diminished compared with 2011.
Inflation was generally subdued in 2012. Headline and core CPI inflation for the year were each recorded at 2.1%. High unemployment and low wage growth continued to hold back labour costs. In addition, prices for goods imported into the US experienced very little inflation in 2012. The Federal Reserve continued to pursue a highly supportive monetary policy. At meetings in January, September, and December, the Federal Open Market Committee adjusted its forward guidance for an exceptionally low federal funds rate and agreed on open-ended purchases of longer-term securities in an effort to maintain downward pressure on interest rates, support mortgage markets and help make broader financial conditions more accommodating.
InCanada, GDP growth slowed in 2012 to 2.0% from 2.6% in 2011. The slowdown in economic activity was particularly notable in the second half of the year. One factor contributing to the slowdown, which took effect in July 2012, was the introduction of measures by the federal government to cool the housing market by tightening mortgage lending conditions. House prices, home sales and housing starts declined after those initiatives came into force. In addition, exports fell sharply with the deceleration in global manufacturing activity and global trade, and temporary disruptions in energy production in Eastern Canada and capacity constraints on Western Canada pipelines. An uncertain US economic outlook together with weakness in key Canadian commodity prices and a sharp decline in corporate performance
104
Table of Contents
HSBC HOLDINGS PLC
Report of the Directors: Operating and Financial Review(continued)
Profit/(loss) before tax by country within global businesses
Retail Management US$m | Commercial Banking US$m | Global Markets US$m | Global Private | Other US$m | Total US$m | |||||||||||||||||||||||||||||
2012 | ||||||||||||||||||||||||||||||||||
US | 2,746 | 637 | 661 | 72 | (2,901 | ) | 1,215 | |||||||||||||||||||||||||||
Canada | 207 | 577 | 314 | (1 | ) | (16 | ) | 1,081 | ||||||||||||||||||||||||||
Bermuda | 42 | (15 | ) | (18 | ) | 1 | (7 | ) | 3 | |||||||||||||||||||||||||
| 2,995 | 1,199 | 957 | 72 | (2,924 | ) | 2,299 | ||||||||||||||||||||||||||||
2011 | ||||||||||||||||||||||||||||||||||
US | (2,861 | ) | 431 | 567 | 83 | 782 | (998 | ) | ||||||||||||||||||||||||||
Canada | 147 | 545 | 265 | – | 8 | 965 | ||||||||||||||||||||||||||||
Bermuda | 49 | 26 | 43 | 7 | 9 | 134 | ||||||||||||||||||||||||||||
Other | – | – | – | – | (1 | ) | (1 | ) | ||||||||||||||||||||||||||
| (2,665 | ) | 1,002 | 875 | 90 | 798 | 100 | ||||||||||||||||||||||||||||
2010 | ||||||||||||||||||||||||||||||||||
US | (2,305 | ) | 402 | 1,284 | 113 | (39 | ) | (545 | ) | |||||||||||||||||||||||||
Canada | 131 | 505 | 227 | – | 4 | 867 | ||||||||||||||||||||||||||||
Bermuda | 58 | 32 | 38 | (3 | ) | 7 | 132 | |||||||||||||||||||||||||||
Other | – | – | – | 1 | (1 | ) | – | |||||||||||||||||||||||||||
| (2,116 | ) | 939 | 1,549 | 111 | (29 | ) | 454 | |||||||||||||||||||||||||||
weighed on business investment. Headline CPI inflation fell steadily through the year to 1.5%, from 2.9% in 2011. Though the Bank of Canada slightly tightened monetary policy early in 2012, the economic slowdown and the decline in the rate of CPI inflation led the Bank to leave rates on hold throughout the year.
Review of performance
Our operations in North America reported a profit before tax of US$2.3bn in 2012, compared with US$100m in 2011. Our reported profits included gains in the US of US$3.1bn and US$864m on completion of the sale of the Card and Retail Services business in May 2012 and the 195 non-strategic retail branches in May and August 2012, respectively. Also included in our reported profits was US$618m relating to profit before tax in Card and Retail Services prior to the disposal (2011: US$2.1bn). In addition, we recorded a gain of US$83m from the sale of the full service retail brokerage business in Canada. We also recognised US$1.2bn of adverse movements on our own debt designated at fair value resulting from tightening in credit spreads, compared with favourable movements of US$964m in 2011.
On an underlying basis, our pre-tax loss of US$1.5bn in 2012 compared with a pre-tax loss of US$3.1bn in 2011. This was due to lower loan impairment charges, primarily in CML, reflecting a decline in lending balances as the portfolio continued to run off, lower delinquency levels, and
higher revenue mainly driven by lower adverse movements on non-qualifying hedges in HSBC Finance. This was partly offset by higher operating expenses due to fines and penalties paid of US$1.5bn by HNAH and its subsidiaries as part of the settlement of investigations into inadequate compliance with anti-money laundering laws in the past.
Underlying profit before tax in Canada rose, as revenues benefited from an increase in fees from commercial lending activities and collaboration with GB&M, higher Rates revenue due to increased trading volumes, and higher revenues in Balance Sheet Management reflecting an increase in gains on sales of available-for-sale assets. These results were partly offset by lower net interest income due to the closure of the Canadian consumer finance company to new business, spread compression from strong competition and the prolonged low interest rate environment. Our operations in Bermuda reported a significantly reduced profit before tax, primarily due to higher loan impairment charges on a small number of exposures in GB&M and CMB.
We made significant progress in disposing of businesses not aligned with our long-term strategy. On completing the sale of our US Card and Retail Services business, we transferred over 5,000 employees and certain real estate facilities to the purchaser. In addition, we entered into a transition services agreement to support some of the account servicing operations until all systems, processes and equipment are integrated into the purchaser’s
105
Table of Contents
HSBC HOLDINGS PLC
Report of the Directors: Operating and Financial Review(continued)
existing infrastructure. We also completed the sale of the retail branches, principally in upstate New York, recognising gains of US$586m in RBWM and US$278m in CMB.
In Canada, we completed the sale of the full service retail brokerage business. We also announced the closure of our consumer finance business, which had net customer loan balances of US$1.5bn at 31 December 2012, and ceased the origination of loans as this business did not fit with our core strategy.
We continued to manage the run-off of lending balances in our CML portfolio and, in the third quarter of 2012, we reclassified non-real estate personal loan balances of US$3.7bn, net of impairment allowances, from our CML portfolio to ‘Assets held for sale’ as we actively marketed the portfolio. We also identified real estate secured loan balances, with a carrying amount of US$3.8bn, which, as part of our strategy, we have announced we plan to actively market in multiple transactions over the next two years. At 31 December 2012, the carrying value of the non-real estate and the real estate secured loans which we intend to sell was approximately US$1bn greater than their estimated fair value. We expect to recognise a loss on sale for these loans over the next few years, the actual amount of which will depend on market conditions at the time of the sales. It is expected that reduction in these loans in our CML portfolio will be capital accretive and will reduce funding requirements, accelerate the winding down of the portfolio and also alleviate some of the operational burdens, given that these loans are servicing intensive and subject to foreclosure delays.
At 31 December 2012, lending balances in CML, including loans held for sale, were US$43bn, a decline of 14% from December 2011, of which 8% was attributable to the balances written off.
We incurred costs of US$221m in 2012 (2011: US$235m) as a result of restructuring activities in the region. These costs were mainly related to the business disposals, the closure of our consumer finance operations in Canada and the continuation of our organisational effectiveness initiatives. We also achieved approximately US$230m of additional sustainable cost savings in 2012, primarily derived from operational efficiencies.
Following the disposals noted above, we are reshaping our US operations to focus on core activities and are continuing to reposition our businesses in both the US and Canada towards international customers.
In RBWM, we continued to develop our Wealth Management capabilities across the region, targeting internationally connected customers in key US and Canadian urban centres. Our relationship-based model offers a suite of wealth services incorporating HSBC and third-party products, enabling our internationally-minded customers to invest in global markets. In the US, we launched a renminbi fixed income fund to provide investors with the opportunity to access mainland China’s bond market.
In CMB, we increased the number of relationship managers and specialist sales staff in 2012 in areas with strong international connectivity, notably the West Coast, South East and Midwest of the US, leading to higher lending balances than in 2011. In Canada, we introduced the first renminbi currency account. We also established dedicated sales teams to enhance CMB’s collaboration with GB&M. In addition, in CMB and GB&M, we continued to target companies with international banking requirements, leading to a rise in Global Trade and Receivables Finance revenues in both the US and Canada.
In GB&M, we continued to work on delivering integrated solutions for our customers across the region, increasing our lending to Latin American corporates. In addition, we actively reduced our legacy credit exposure in the US by exiting certain positions. We will continue to reduce the size of this portfolio as opportunities arise.
The following commentary is on a constant currency basis.
Net interest incomedecreased by 29% to US$8.1bn, due to the loss of income from the Card and Retail Services business together with the continued reduction of the CML portfolio in run-off. Also contributing to the decrease was a change in composition of our lending book towards higher levels of lower yielding real estate loans.
Net fee income decreased by 24% to US$2.5bn, primarily due to the sale of the Card and Retail Services business, the retail branches and the full service retail brokerage business in Canada. This was partly offset by fees from the transition service agreement with the purchaser of the Card and Retail Services business and increased revenues from debt capital markets origination activity due to the strong debt issuance market.
Net trading income of US$507m was US$871m higher than in 2011, primarily due to lower adverse fair value movements on non-qualifying hedges in
106
Table of Contents
HSBC HOLDINGS PLC
Report of the Directors: Operating and Financial Review(continued)
RBWM as long-term interest rates declined to a lesser extent than in 2011. This was partly offset by an increase from US$92m in 2011 to US$134m in 2012 of loss provisions for mortgage loan repurchase obligations related to loans previously sold.
Net trading income increased in GB&M during 2012 as a result of the improved performance of economic hedges used to manage interest rate risk, which benefited from a more stable interest rate environment. Rates revenue was higher due to increased trading volumes. In addition, credit market conditions generally reflected tighter credit spreads, which led to higher income from our credit-related products. These factors were partly offset by adverse fair value movements on structured liabilities as own credit spreads tightened, together with the closure of our bank notes business in 2011, and a reduction in foreign exchange revenue as a result of lower trading volumes in less volatile markets.
Net loss from financial instruments designated at fair value was US$1.2bn compared with net gains of US$964m in 2011. We recognised adverse fair value movements on our own debt designated at fair value as credit spreads tightened during 2012, having widened in 2011. In addition, there were adverse fair value movements from interest rate ineffectiveness in the economic hedging of our long-term debt during the year.
Gains on disposal of US branch network and cards businessincluded a gain of US$3.1bn from the sale of the Card and Retail Services business and US$864m from the sale of 195 retail branches in upstate New York.
Other operating income increased by US$176m to US$405m, reflecting lower losses on foreclosed properties due to the reduction in foreclosure activity, less deterioration in housing prices during 2012 and, in some markets, improvements in pricing compared with 2011.
Loan impairment charges and other credit risk provisions decreased by 51% to US$3.5bn, mainly in the US, reflecting lower lending balances in CML as we continued to run off the portfolio, and lower delinquency levels. Loan impairment charges
remained adversely affected by delays in expected cash flows from mortgage loans due, in part, to delays in foreclosure processing and the higher costs to obtain and realise collateral, although the effects were less pronounced than in 2011. In addition, loan impairment charges declined by US$1.3bn due to the sale of the Card and Retail Services business. These decreases were partly offset by an adjustment made following a review completed in the fourth quarter of 2012 which concluded that the estimated average period of time from current status to write-off was ten months for real estate loans (previously a period of seven months was used).
In CMB and GB&M, loan impairment charges increased, mainly in Bermuda, due to individually assessed impairments on a small number of exposures. Credit quality in Canada remained broadly unchanged.
Operating expenses increased by less than 1% to US$8.9bn, primarily due to a US$1.5bn charge for the settlement of investigations noted above. Compliance costs increased by US$307m, mainly due to investment in process enhancements and infrastructure related to anti-money laundering and Bank Secrecy Act consent orders, along with actions to address the regulatory consent orders relating to foreclosure activities. In addition, following a review of our mortgage foreclosure process, we entered into an agreement in principle with US regulators to pay into a fund and provide other customer assistance to help eligible borrowers who were active in foreclosure during 2009 and 2010 and were financially disadvantaged during the process, for which we recognised a US$104m expense in 2012. These increases were partly offset by the effect of the sale of the Card and Retail Services business and organisational effectiveness initiatives to reduce costs as we achieved approximately US$230m of additional sustainable cost savings primarily derived from operational efficiencies. Average employee numbers decreased from organisational effectiveness initiatives and business disposals. In addition, marketing costs fell and costs of holding foreclosed properties declined, while software impairment charges in 2011 did not recur.
107
Table of Contents
HSBC HOLDINGS PLC
Report of the Directors: Operating and Financial Review(continued)
Reconciliation of reported and constant currency profit before tax – North America
2011 as | Currency translation adjustment24 US$m | 2011 at 2012 rates US$m | 2012 as | Reported change25 % | Constant change25 % | |||||||||||||||||||||||||||||
Net interest income | 11,480 | (17 | ) | 11,463 | 8,117 | (29 | ) | (29 | ) | |||||||||||||||||||||||||
Net fee income | 3,308 | (7 | ) | 3,301 | 2,513 | (24 | ) | (24 | ) | |||||||||||||||||||||||||
Own credit spread26 | 970 | – | 970 | (1,090 | ) | |||||||||||||||||||||||||||||
Gains on disposal of US branch network and cards business | – | – | – | 4,012 | ||||||||||||||||||||||||||||||
Other income27 | 242 | – | 242 | 1,141 | 371 | 371 | ||||||||||||||||||||||||||||
Net operating income21 | 16,000 | (24 | ) | 15,976 | 14,693 | (8 | ) | (8 | ) | |||||||||||||||||||||||||
Loan impairment charges and other credit risk provisions | (7,016 | ) | 1 | (7,015 | ) | (3,457 | ) | 51 | 51 | |||||||||||||||||||||||||
Net operating income | 8,984 | (23 | ) | 8,961 | 11,236 | 25 | 25 | |||||||||||||||||||||||||||
Operating expenses | (8,919 | ) | 9 | (8,910 | ) | (8,940 | ) | – | – | |||||||||||||||||||||||||
Operating profit | 65 | (14 | ) | 51 | 2,296 | 3,432 | 4,402 | |||||||||||||||||||||||||||
Income from associates | 35 | – | 35 | 3 | (91 | ) | (91 | ) | ||||||||||||||||||||||||||
Profit before tax | 100 | (14 | ) | 86 | 2,299 | 2,199 | 2,573 | |||||||||||||||||||||||||||
For footnotes, see page 120.
Reconciliation of reported and underlying29 items – North America
| Year ended 31 December | ||||||||||||||||
| 2012 US$m | 2011 US$m | Change % | ||||||||||||||
Revenue21 | ||||||||||||||||
Reported revenue | 14,693 | 16,000 | (8 | ) | ||||||||||||
Currency translation adjustment24 | (24 | ) | ||||||||||||||
Own credit spread26 | 1,090 | (970 | ) | |||||||||||||
Acquisitions, disposals and dilutions | (5,924 | ) | (6,001 | ) | ||||||||||||
Underlying revenue | 9,859 | 9,005 | 9 | |||||||||||||
Loan impairment charges and other credit risk provisions (‘LIC’s) | ||||||||||||||||
Reported LICs | (3,457 | ) | (7,016 | ) | 51 | |||||||||||
Currency translation adjustment24 | 1 | |||||||||||||||
Acquisitions, disposals and dilutions | 324 | 1,599 | ||||||||||||||
Underlying LICs | (3,133 | ) | (5,416 | ) | 42 | |||||||||||
Operating expenses | ||||||||||||||||
Reported operating expenses | (8,940 | ) | (8,919 | ) | – | |||||||||||
Currency translation adjustment24 | 9 | |||||||||||||||
Acquisitions, disposals and dilutions | 712 | 2,210 | ||||||||||||||
Underlying operating expenses | (8,228 | ) | (6,700 | ) | (23 | ) | ||||||||||
Underlying cost efficiency ratio | 83.5% | 74.4% | ||||||||||||||
Profit/(loss) before tax | ||||||||||||||||
Reported profit before tax | 2,299 | 100 | 2,199 | |||||||||||||
Currency translation adjustment24 | (14 | ) | ||||||||||||||
Own credit spread26 | 1,090 | (970 | ) | |||||||||||||
Acquisitions, disposals and dilutions | (4,888 | ) | (2,192 | ) | ||||||||||||
Underlying loss before tax | (1,499 | ) | (3,076 | ) | 51 | |||||||||||
For footnotes, see page 120.
107a
Table of Contents
HSBC HOLDINGS PLC
Report of the Directors: Operating and Financial Review(continued)
2011 compared with 2010
Economic background
In theUS, GDP expanded by 3.0% in 2010 and the adoption of stimulative tax policies at the end of that year suggested an even faster rate of growth in 2011. However, this failed to materialise for a number of reasons. The first was the adoption of fiscal austerity by state and local governments. Second, the sharp rise in crude oil prices in the first half of 2011 dampened both business and consumer spending. By the second quarter of 2011, average crude oil prices were 50% higher than the levels a year earlier. The third development concerned the disruption to motor vehicle production caused by parts shortages arising from the Japanese earthquake. Finally, financial market turmoil caused by the eurozone debt crisis and the debt ceiling debate in Washington adversely affected business and consumer confidence. The housing market remained weak, although there were some tentative signs of recovery towards the end of the year, albeit from a very low level. As a result, GDP rose by only 1.7% in 2011.
US headline inflation increased during 2011 with the annual rate of CPI inflation rising to 3.1% compared with 1.7% in 2010, but core inflation remained subdued. The labour market recovery continued to be lacklustre; employment grew roughly 0.6% in 2011 following a decline of the same magnitude in 2010. The unemployment rate fell to 8.5% in December 2011, down from 9.6% in 2010, but much of the decline can be attributed to a fall in labour force participation. The Federal Reserve remained focused on countering deflationary pressures; it committed itself to keeping the Fed funds rate in a range of 0 to 0.25% until at least mid-2013 and, in September, with the intention of exerting downward pressure on longer-term interest rates, it decided to extend the average maturity of its securities portfolio by selling US$400bn of short-term Treasury securities and buying an equivalent amount of longer-term Treasury securities in their place. These moves helped stabilise financial asset prices in the final quarter of the year.
The annual rate of GDP growth inCanada slowed in 2011 to 2.4% from 3.2% in 2010. Slower economic growth in the US and other export partners in Europe held back the rate of growth and a slowdown in the pace of job creation dampened the growth of consumer spending as well. Higher energy prices contributed to a rise in inflation, leading to an increase in the annual rate of core CPI inflation to 2.9% from 1.8% the year before. The Bank of Canada held its policy interest rate steady at 1.0% in 2011.
Review of performance
Our operations in North America reported a profit before tax of US$100m in 2011, compared with US$454m in 2010, a decrease of 78%. Reported profits included favourable movements on our own debt designated at fair value of US$970m resulting from changes in credit spreads, compared with favourable movements of US$142m and a gain of US$66m on the sale of our stake in the Wells Fargo HSBC Trade Bank in 2010. On an underlying basis, which excludes the above, we reported a pre-tax loss of US$870m in 2011 compared with a profit before tax of US$285m in 2010.
Our 2011 North America results continued to be affected by the pace of recovery of the US economy, in particular the decline in house prices and high levels of unemployment, as well as the impact of proposed regulatory changes and ongoing compliance initiatives. We expect these factors, as well as the ongoing delays in foreclosure processes, to continue to affect our results going forward.
The reduction in our underlying profit was partly attributable to a decline in GB&M driven by higher costs, mainly from compliance and remediation, lower releases of collective loan impairment allowances and reduced trading income, which in part reflected the non-recurrence of price appreciation on assets in the legacy credit portfolio. In our consumer finance portfolios, revenue continued to decline following the reduction in lending balances, and adverse fair value movements on non-qualifying hedges increased reflecting lower long-term US interest rates. However, these effects were partly offset by a corresponding decline in loan impairment charges.
Performance in the second half of 2011 deteriorated, driven by an increase in adverse fair value movements on non-qualifying hedges as US long-term interest rates declined reflecting increased concerns regarding the pace of US economic recovery and ongoing eurozone concerns. In addition, there was a marked rise in loan impairment charges in our run-off portfolio, reflecting deterioration in delinquency rates, and higher estimated costs to obtain and realise collateral, both related to the industry-wide delays in foreclosure processing.
Our Canadian business continued to perform strongly during 2011. Profit before tax increased by 4% to US$955m driven by improved credit quality in our CMB business, while in GB&M, higher
107b
Table of Contents
HSBC HOLDINGS PLC
Report of the Directors: Operating and Financial Review(continued)
pre-tax profits were driven by a rise in revenue from Balance Sheet Management.
In 2011, we made significant progress in our strategy for our North American businesses. In the second half of 2011, we announced the sale of our Card and Retail Services business to Capital One Financial Group, which we expect to complete in the first half of 2012. We also announced the sale of 195 non-strategic branches, principally in upstate New York, to First Niagara Bank, N.A. We expect this transaction to close in stages, commencing in the second quarter of 2012. These transactions remain subject to regulatory approval. In addition, we announced the disposal of our Canadian investment advisory business and sold our private equity businesses in the US and Canada as well as the cessation of life insurance manufacturing in the US, with effect from January 2012.
The results of our Card and Retail Services business can be seen on page 110. We expect the sale of this business to have a significant impact on both the revenue and profitability of our North America operations going forward.
In 2011, we incurred charges of US$236m (2010: US$13m) associated with restructuring activities in North America which included the impairment of software development costs. In addition we reduced the size of many of our support functions to correspond to the reduced scale of our operations in the region. During 2011 we achieved about US$240m of sustainable savings.
In RBWM, we remained focused on managing down the residual balances in our run-off CML portfolio. We also continued to direct efforts towards the expansion of wealth management and Premier propositions.
In our CMB and GB&M businesses, we continued to proactively target companies that trade and invest internationally. In 2011, we increased the number of CMB relationship managers in areas with strong international connectivity, including the US West Coast, Texas, Florida and central Canada. We grew revenue from the sale of GB&M products to CMB customers and, in GB&M, we continued to interconnect our operations across the Americas to deliver more integrated solutions for our customers.
Net interest income declined by 8% to US$11.5bn, primarily due to lower lending balances in HSBC Finance resulting from the continued run-off of the residual balances in the CML portfolio, as well as the sale of our vehicle finance portfolio in 2010. In Card and Retail Services, lower net interest income reflected a reduction in lending balances
despite higher customer spending, as our customers continued to reduce outstanding credit card debt. It was also affected by lower yields due to the effects of the US Credit Card Accountability, Responsibility and Disclosure Act (‘CARD Act’), which included restrictions on the repricing of delinquent accounts. These reductions were partly offset by a fall in our cost of funds.
Net interest income from Balance Sheet Management activities increased compared with 2010, largely driven by an increase in securities holdings in the US investment portfolio, and favourable positioning for interest rate movements in Canada.
Net fee income fell by 10% to US$3.3bn reflecting the closure of our Taxpayer Financial Services business and the sale of our vehicle finance loan portfolio and loan servicing platform in 2010.
In our Card and Retail Services business fee income reduced, driven by lower late and overlimit fees reflecting reduced delinquencies and fewer accounts, as well as the effect of customers actively seeking to reduce credit card debt and the CARD Act. In addition, fee expense rose as revenue-share payments to our credit card partners increased as improved portfolio performance resulted in increased cash flows. The decline in net fee income was partly offset by a reduction in fees written off reflecting lower fees billed to our customers and improved credit quality.
Net trading expense of US$362m compared with net trading income of US$319m in 2010, primarily driven by an increase in adverse fair value movements on non-qualifying hedges used to economically hedge floating rate debt issued by HSBC Finance. This was due to a decrease in long-term US interest rates, reflecting heightened concerns regarding the pace of US economic recovery and the ongoing eurozone crisis. These rates declined to a greater extent than in 2010, resulting in adverse fair value movements of US$1.1bn in 2011 compared with US$353m in 2010.
In GB&M, trading income declined by 29% as revenue in the legacy credit portfolio was adversely affected by the non-recurrence of price appreciation on assets, as well as a 2010 gain from a legal settlement of US$89m relating to certain loans previously purchased for resale from a third party which did not recur, and the exit from the Bank Notes business in 2010. This decline was partly offset by a rise in foreign exchange and metals revenue, reflecting greater client activity and increased price volatility resulting from global
107c
Table of Contents
HSBC HOLDINGS PLC
Report of the Directors: Operating and Financial Review(continued)
economic uncertainty. Metals revenue also benefited from a rally in precious metal prices. In addition, growth in revenue from Rates was driven by an increase in new deal activity. In RBWM, charges for loan repurchase obligations relating to loans previously sold fell from US$341m to US$92m.
Gains less losses from financial investments increased by 82% following the sale of available-for-sale debt securities in the Balance Sheet Management portfolio. These transactions were undertaken to manage portfolio risk and duration.
Other operating income increased by 37% to US$226m due to the non-recurrence of losses on the sale of our vehicle finance loan portfolio in 2010. This was partly offset by adverse movements in the PVIF asset within the insurance business reflecting assumption updates, including an increase in expected expense rates and updates to mortality, as well as the non-recurrence of a US$56m gain on the sale of our New York headquarters in 2010.
Loan impairment charges and other credit risk provisions decreased by 16% to US$7.0bn, the lowest reported level since 2006.
Loan impairment charges in the CML portfolio fell reflecting the continued run-off, partly offset by higher costs to obtain collateral and delays in the timing of expected cash flows from our real estate secured portfolio as a result of the delays in processing foreclosures. Loan impairment charges increased in the second half of 2011 following a deterioration in delinquency and the adverse effects of the continued disruption to foreclosures.
We anticipate delinquency and write-off levels in the CML portfolio will remain under pressure in 2012 as the US economic environment continues to affect our business, as well as from foreclosure delays. The magnitude of these trends will largely be dependent on economic recovery, including unemployment rates and improvements in the housing market.
In our Card and Retail Services business, loan impairment charges and other credit risk provisions declined by 26% to US$1.6bn driven by lower lending balances and improved delinquency rates as overall credit quality improved.
Further commentary on delinquency trends in the US RBWM portfolios is provided in ‘credit quality of personal lending in the US’ on page 151.
In CMB, loan impairment charges and other credit risk provisions declined by 68%, with significant reductions in both Canada and the US. This was mainly due to lower lending balances and improved credit quality in Canada. In the US the decline was mainly in the commercial real estate and mid-market sectors, while loan impairment charges in Business Banking also declined reflecting improved credit quality and lower delinquency levels. This was partly offset by a specific loan impairment charge associated with the downgrade of a commercial real estate loan exposure.
The reduction in loan impairment charges and other credit risk provisions was partly offset by an increase in GB&M reflecting lower releases of collective loan impairment allowances than in 2010. In addition, 2011 included an individually assessed loan impairment charge associated with a corporate lending relationship.
Operating expenses increased by 7% to US$8.9bn, including an increase in litigation provisions and a new provision of US$257m related to US mortgage foreclosure servicing costs. In addition, we incurred a charge of US$48m associated with costs expected to arise from foreclosure delays involving loans serviced for GSEs. During 2011, restructuring initiatives resulted in charges of US$236m, while in 2010 operating expenses benefited from a pension curtailment gain of US$147m.
Operating expenses also increased in our GB&M business. This largely reflected higher legal and compliance costs, and an increase in staff costs which included higher amortisation charges for previous years’ performance shares and accelerated expense recognition of current year deferred bonus awards. The drivers of expense growth in North America were in part offset by lower costs following the sale of the vehicle finance servicing operation in 2010 and the closure of Taxpayer Financial Services, as well as lower marketing expenses in our Card and Retail Services business. Our third party collection costs were also lower, reflecting reduced delinquencies and the continued run-off of lending balances in the CML portfolio.
We expect that costs incurred in ensuring that we satisfy requirements relating to our mortgage foreclosure process will increase our operating expenses in the future.
107d
Table of Contents
HSBC HOLDINGS PLC
Report of the Directors: Operating and Financial Review(continued)
Reconciliation of reported and underlying profit/(loss) before tax
2011 compared with 2010 – North America31
2010 as | 2010 ments32 US$m | Currency translation adjustment24 US$m | 2010 at 2011 rates33 US$m | 2011 as | 2011 ments32 US$m | 2011 under- lying US$m | Re- change25 % | Under- change25 % | ||||||||||||||||||||||||||||||||||||||||||||
Net interest income | 12,439 | – | 64 | 12,503 | 11,480 | – | 11,480 | (8 | ) | (8 | ) | |||||||||||||||||||||||||||||||||||||||||
Net fee income | 3,664 | – | 27 | 3,691 | 3,308 | – | 3,308 | (10 | ) | (10 | ) | |||||||||||||||||||||||||||||||||||||||||
Own credit spread26 | 142 | (142 | ) | – | – | 970 | (970 | ) | – | |||||||||||||||||||||||||||||||||||||||||||
Other income27 | 802 | (66 | ) | 4 | 740 | 242 | – | 242 | (70 | ) | (67 | ) | ||||||||||||||||||||||||||||||||||||||||
Net operating income21 | 17,047 | (208 | ) | 95 | 16,934 | 16,000 | (970 | ) | 15,030 | (6 | ) | (11 | ) | |||||||||||||||||||||||||||||||||||||||
Loan impairment charges and other credit risk provisions | (8,295 | ) | – | (11 | ) | (8,306 | ) | (7,016 | ) | – | (7,016 | ) | 15 | 16 | ||||||||||||||||||||||||||||||||||||||
Net operating income | 8,752 | (208 | ) | 84 | 8,628 | 8,984 | (970 | ) | 8,014 | 3 | (7 | ) | ||||||||||||||||||||||||||||||||||||||||
Operating expenses | (8,322 | ) | – | (46 | ) | (8,368 | ) | (8,919 | ) | – | (8,919 | ) | (7 | ) | (7 | ) | ||||||||||||||||||||||||||||||||||||
Operating profit/(loss) | 430 | (208 | ) | 38 | 260 | 65 | (970 | ) | (905 | ) | (85 | ) | ||||||||||||||||||||||||||||||||||||||||
Income from associates | 24 | – | 1 | 25 | 35 | – | 35 | 46 | 40 | |||||||||||||||||||||||||||||||||||||||||||
Profit/(loss) before tax | 454 | (208 | ) | 39 | 285 | 100 | (970 | ) | (870 | ) | (78 | ) | ||||||||||||||||||||||||||||||||||||||||
For footnotes, see page 120.
107e
Table of Contents
HSBC HOLDINGS PLC
Report of the Directors: Operating and Financial Review(continued)
Profit/(loss) before tax and balance sheet data – North America
| 2012 | ||||||||||||||||||||||||||||||||||||||||
Retail and Wealth Management | Commercial Banking89 US$m | Global Banking and Markets US$m | Global Private | Other US$m | Inter- elimination85 US$m | Total US$m | ||||||||||||||||||||||||||||||||||
| Profit/(loss) before tax | ||||||||||||||||||||||||||||||||||||||||
Net interest income | 5,481 | 1,443 | 948 | 192 | 118 | (65 | ) | 8,117 | ||||||||||||||||||||||||||||||||
Net fee income | 923 | 562 | 716 | 124 | 188 | – | 2,513 | |||||||||||||||||||||||||||||||||
Trading income/(expense) excluding net interest income | (216 | ) | 47 | 466 | 20 | 16 | – | 333 | ||||||||||||||||||||||||||||||||
Net interest income on trading activities | 17 | 1 | 91 | – | – | 65 | 174 | |||||||||||||||||||||||||||||||||
Net trading income/(expense)78 | (199 | ) | 48 | 557 | 20 | 16 | 65 | 507 | ||||||||||||||||||||||||||||||||
Changes in fair value of long-term debt issued and related derivatives | – | – | – | – | (1,219 | ) | – | (1,219 | ) | |||||||||||||||||||||||||||||||
Net income from other financial instruments designated at fair value | – | – | – | – | – | – | – | |||||||||||||||||||||||||||||||||
Net expense from financial instruments designated at fair value | – | – | – | – | (1,219 | ) | – | (1,219 | ) | |||||||||||||||||||||||||||||||
Gains less losses from financial investments | 27 | – | 223 | (7 | ) | 8 | – | 251 | ||||||||||||||||||||||||||||||||
Dividend income | 15 | 11 | 32 | 3 | – | – | 61 | |||||||||||||||||||||||||||||||||
Net earned insurance premiums | 193 | – | – | – | – | – | 193 | |||||||||||||||||||||||||||||||||
Gains on disposal of US branch network and cards business | 3,735 | 277 | – | – | – | – | 4,012 | |||||||||||||||||||||||||||||||||
Other operating income | 173 | 149 | 191 | 5 | 1,787 | (1,899 | ) | 406 | ||||||||||||||||||||||||||||||||
Total operating income | 10,348 | 2,490 | 2,667 | 337 | 898 | (1,899 | ) | 14,841 | ||||||||||||||||||||||||||||||||
Net insurance claims86 | (148 | ) | – | – | – | – | – | (148 | ) | |||||||||||||||||||||||||||||||
Net operating income21 | 10,200 | 2,490 | 2,667 | 337 | 898 | (1,899 | ) | 14,693 | ||||||||||||||||||||||||||||||||
Loan impairment (charges)/recoveries and other credit risk provisions | (3,241 | ) | (148 | ) | (71 | ) | 3 | – | – | (3,457 | ) | |||||||||||||||||||||||||||||
Net operating income | 6,959 | 2,342 | 2,596 | 340 | 898 | (1,899 | ) | 11,236 | ||||||||||||||||||||||||||||||||
Total operating expenses | (3,966 | ) | (1,144 | ) | (1,639 | ) | (268 | ) | (3,822 | ) | 1,899 | (8,940 | ) | |||||||||||||||||||||||||||
Operating profit/(loss) | 2,993 | 1,198 | 957 | 72 | (2,924 | ) | – | 2,296 | ||||||||||||||||||||||||||||||||
Share of profit in associates and joint ventures | 2 | 1 | – | – | – | – | 3 | |||||||||||||||||||||||||||||||||
Profit/(loss) before tax | 2,995 | 1,199 | 957 | 72 | (2,924 | ) | – | 2,299 | ||||||||||||||||||||||||||||||||
| % | % | % | % | % | % | |||||||||||||||||||||||||||||||||||
Share of HSBC’s profit before tax | 14.5 | 5.8 | 4.6 | 0.3 | (14.2 | ) | 11.1 | |||||||||||||||||||||||||||||||||
Cost efficiency ratio | 38.9 | 45.9 | 61.5 | 79.5 | 425.6 | 60.8 | ||||||||||||||||||||||||||||||||||
| Balance sheet data74 | ||||||||||||||||||||||||||||||||||||||||
| US$m | US$m | US$m | US$m | US$m | US$m | |||||||||||||||||||||||||||||||||||
Loans and advances to customers (net) reported in: | ||||||||||||||||||||||||||||||||||||||||
– loans and advances to customers (net) | 76,414 | 36,387 | 22,498 | 5,457 | – | 140,756 | ||||||||||||||||||||||||||||||||||
– assets held for sale (disposal groups) | 3,899 | – | – | – | – | 3,899 | ||||||||||||||||||||||||||||||||||
Total assets | 101,103 | 48,604 | 345,040 | 8,828 | 12,659 | (25,987 | ) | 490,247 | ||||||||||||||||||||||||||||||||
Customer accounts reported in: | ||||||||||||||||||||||||||||||||||||||||
– customer accounts | 57,758 | 48,080 | 29,595 | 13,553 | 51 | 149,037 | ||||||||||||||||||||||||||||||||||
108
Table of Contents
HSBC HOLDINGS PLC
Report of the Directors: Operating and Financial Review(continued)
| 2011 | ||||||||||||||||||||||||||||||||||||||||
Retail Banking and Wealth Management US$m | Commercial Banking89 US$m | Global Banking and Markets US$m | Global Private Banking US$m | Other US$m | Inter- segment elimination85 US$m | Total US$m | ||||||||||||||||||||||||||||||||||
| Profit/(loss) before tax | ||||||||||||||||||||||||||||||||||||||||
Net interest income | 8,931 | 1,528 | 893 | 187 | 9 | (68 | ) | 11,480 | ||||||||||||||||||||||||||||||||
Net fee income/(expense) | 1,836 | 551 | 773 | 149 | (1 | ) | – | 3,308 | ||||||||||||||||||||||||||||||||
Trading income/(expense) excluding net interest income | (946 | ) | 34 | 261 | 17 | (26 | ) | – | (660 | ) | ||||||||||||||||||||||||||||||
Net interest income/(expense) on trading activities | 25 | 1 | 205 | – | (1 | ) | 68 | 298 | ||||||||||||||||||||||||||||||||
Net trading income/(expense)78 | (921 | ) | 35 | 466 | 17 | (27 | ) | 68 | (362 | ) | ||||||||||||||||||||||||||||||
Changes in fair value of long-term debt issued and related derivatives | – | – | – | – | 967 | – | 967 | |||||||||||||||||||||||||||||||||
Net income/(expense) from other financial instruments designated | – | – | (5 | ) | – | 2 | – | (3 | ) | |||||||||||||||||||||||||||||||
Net income/(expense) from financial instruments designated at fair value | – | – | (5 | ) | – | 969 | – | 964 | ||||||||||||||||||||||||||||||||
Gains less losses from financial investments | 58 | 7 | 195 | – | 2 | – | 262 | |||||||||||||||||||||||||||||||||
Dividend income | 15 | 9 | 13 | 3 | – | – | 40 | |||||||||||||||||||||||||||||||||
Net earned insurance premiums | 236 | – | – | – | – | – | 236 | |||||||||||||||||||||||||||||||||
Other operating income | (125 | ) | 110 | 193 | 11 | 2,244 | (2,207 | ) | 226 | |||||||||||||||||||||||||||||||
Total operating income | 10,030 | 2,240 | 2,528 | 367 | 3,196 | (2,207 | ) | 16,154 | ||||||||||||||||||||||||||||||||
Net insurance claims86 | (154 | ) | – | – | – | – | – | (154 | ) | |||||||||||||||||||||||||||||||
Net operating income21 | 9,876 | 2,240 | 2,528 | 367 | 3,196 | (2,207 | ) | 16,000 | ||||||||||||||||||||||||||||||||
Loan impairment (charges)/recoveries and other credit risk provisions | (6,929 | ) | (105 | ) | (11 | ) | 30 | (1 | ) | – | (7,016 | ) | ||||||||||||||||||||||||||||
Net operating income | 2,947 | 2,135 | 2,517 | 397 | 3,195 | (2,207 | ) | 8,984 | ||||||||||||||||||||||||||||||||
Total operating expenses | (5,615 | ) | (1,166 | ) | (1,642 | ) | (307 | ) | (2,396 | ) | 2,207 | (8,919 | ) | |||||||||||||||||||||||||||
Operating profit/(loss) | (2,668 | ) | 969 | 875 | 90 | 799 | – | 65 | ||||||||||||||||||||||||||||||||
Share of profit/(loss) in associates and joint ventures | 3 | 33 | – | – | (1 | ) | – | 35 | ||||||||||||||||||||||||||||||||
Profit/(loss) before tax | (2,665 | ) | 1,002 | 875 | 90 | 798 | – | 100 | ||||||||||||||||||||||||||||||||
| % | % | % | % | % | % | |||||||||||||||||||||||||||||||||||
Share of HSBC’s profit before tax | (12.2 | ) | 4.6 | 4.0 | 0.4 | 3.7 | 0.5 | |||||||||||||||||||||||||||||||||
Cost efficiency ratio | 56.9 | 52.1 | 65.0 | 83.7 | 75.0 | 55.7 | ||||||||||||||||||||||||||||||||||
| Balance sheet data74 | ||||||||||||||||||||||||||||||||||||||||
| US$m | US$m | US$m | US$m | US$m | US$m | |||||||||||||||||||||||||||||||||||
Loans and advances to customers (net) reported in: | ||||||||||||||||||||||||||||||||||||||||
– loans and advances to customers (net) | 86,490 | 32,215 | 19,289 | 4,753 | – | 142,747 | ||||||||||||||||||||||||||||||||||
– assets held for sale (disposal groups) | 31,058 | 520 | – | – | – | 31,578 | ||||||||||||||||||||||||||||||||||
Total assets | 144,278 | 43,747 | 320,783 | 7,138 | 10,378 | (22,022 | ) | 504,302 | ||||||||||||||||||||||||||||||||
Customer accounts reported in: | ||||||||||||||||||||||||||||||||||||||||
– customer accounts | 63,558 | 47,003 | 30,465 | 14,862 | 94 | 155,982 | ||||||||||||||||||||||||||||||||||
– liabilities of disposal groups held for sale | 10,104 | 5,040 | – | – | – | 15,144 | ||||||||||||||||||||||||||||||||||
For footnotes, see page 120.
109
Table of Contents
HSBC HOLDINGS PLC
Report of the Directors: Operating and Financial Review(continued)
Profit/(loss) before tax and balance sheet data – North America(continued)
| 2010 | ||||||||||||||||||||||||||||||||||||||||
Retail Banking and Wealth Management US$m | Commercial Banking US$m | Global Banking and Markets US$m | Global Private Banking US$m | Other US$m | Inter- segment elimination85 US$m | Total US$m | ||||||||||||||||||||||||||||||||||
| Profit/(loss) before tax | ||||||||||||||||||||||||||||||||||||||||
Net interest income/(expense) | 9,912 | 1,525 | 952 | 190 | (71 | ) | (69 | ) | 12,439 | |||||||||||||||||||||||||||||||
Net fee income/(expense) | 2,142 | 534 | 845 | 149 | (6 | ) | – | 3,664 | ||||||||||||||||||||||||||||||||
Trading income/(expense) excluding net interest income | (472 | ) | 17 | 563 | 13 | (12 | ) | – | 109 | |||||||||||||||||||||||||||||||
Net interest income on trading activities | 24 | 2 | 93 | – | 17 | 69 | 205 | |||||||||||||||||||||||||||||||||
Net trading income/(expense)78 | (448 | ) | 19 | 656 | 13 | 5 | 69 | 314 | ||||||||||||||||||||||||||||||||
Changes in fair value of long-term debt issued and related derivatives | – | – | – | – | 111 | – | 111 | |||||||||||||||||||||||||||||||||
Net income/(expense) from other financial instruments designated | 6 | – | (2 | ) | – | (4 | ) | – | – | |||||||||||||||||||||||||||||||
Net income/(expense) from financial instruments designated at fair value | 6 | – | (2 | ) | – | 107 | – | 111 | ||||||||||||||||||||||||||||||||
Gains less losses from financial investments | 5 | (6 | ) | 141 | – | 3 | – | 143 | ||||||||||||||||||||||||||||||||
Dividend income | 18 | 7 | 12 | 3 | 2 | – | 42 | |||||||||||||||||||||||||||||||||
Net earned insurance premiums | 245 | – | – | – | – | – | 245 | |||||||||||||||||||||||||||||||||
Other operating income | (250 | ) | 242 | 71 | 15 | 2,351 | (2,196 | ) | 233 | |||||||||||||||||||||||||||||||
Total operating income | 11,630 | 2,321 | 2,675 | 370 | 2,391 | (2,196 | ) | 17,191 | ||||||||||||||||||||||||||||||||
Net insurance claims86 | (148 | ) | – | – | – | 4 | – | (144 | ) | |||||||||||||||||||||||||||||||
Net operating income21 | 11,482 | 2,321 | 2,675 | 370 | 2,395 | (2,196 | ) | 17,047 | ||||||||||||||||||||||||||||||||
Loan impairment (charges)/recoveries and other credit risk provisions | (8,194 | ) | (323 | ) | 184 | 38 | – | – | (8,295 | ) | ||||||||||||||||||||||||||||||
Net operating income | 3,288 | 1,998 | 2,859 | 408 | 2,395 | (2,196 | ) | 8,752 | ||||||||||||||||||||||||||||||||
Total operating expenses | (5,408 | ) | (1,081 | ) | (1,310 | ) | (297 | ) | (2,422 | ) | 2,196 | (8,322 | ) | |||||||||||||||||||||||||||
Operating profit/(loss) | (2,120 | ) | 917 | 1,549 | 111 | (27 | ) | – | 430 | |||||||||||||||||||||||||||||||
Share of profit/(loss) in associates and joint ventures | 4 | 22 | – | – | (2 | ) | – | 24 | ||||||||||||||||||||||||||||||||
Profit/(loss) before tax | (2,116 | ) | 939 | 1,549 | 111 | (29 | ) | – | 454 | |||||||||||||||||||||||||||||||
| % | % | % | % | % | % | |||||||||||||||||||||||||||||||||||
Share of HSBC’s profit before tax | (11.1 | ) | 5.0 | 8.1 | 0.6 | (0.2 | ) | 2.4 | ||||||||||||||||||||||||||||||||
Cost efficiency ratio | 47.1 | 46.6 | 49.0 | 80.3 | 101.1 | 48.8 | ||||||||||||||||||||||||||||||||||
Balance sheet data74 | ||||||||||||||||||||||||||||||||||||||||
| US$m | US$m | US$m | US$m | US$m | US$m | |||||||||||||||||||||||||||||||||||
Loans and advances to customers (net) | 131,194 | 30,277 | 24,338 | 4,723 | – | 190,532 | ||||||||||||||||||||||||||||||||||
Total assets | 154,204 | 39,213 | 306,298 | 5,824 | 9,373 | (22,425 | ) | 492,487 | ||||||||||||||||||||||||||||||||
Customer accounts | 76,817 | 46,425 | 22,324 | 12,812 | 108 | 158,486 | ||||||||||||||||||||||||||||||||||
For footnotes, see page 120.
109a
Table of Contents
HSBC HOLDINGS PLC
Report of the Directors: Operating and Financial Review(continued)
North America RBWM – profit/(loss) before tax and balance sheet data
| 2012 | 2011 | |||||||||||||||||||||||||||||||||||||||||||||
| Card and Retail Services US$m | Run-off portfolios US$m | Rest of RBWM US$m | North US$m | Card and Retail Services US$m | Run-off portfolios US$m | Rest of RBWM US$m | North America RBWM US$m | |||||||||||||||||||||||||||||||||||||||
Profit/(loss) before tax | ||||||||||||||||||||||||||||||||||||||||||||||
Net interest income | 1,267 | 2,563 | 1,651 | 5,481 | 4,128 | 2,990 | 1,813 | 8,931 | ||||||||||||||||||||||||||||||||||||||
Net fee income/(expense) | 395 | 33 | 495 | 923 | 1,273 | (49 | ) | 612 | 1,836 | |||||||||||||||||||||||||||||||||||||
Trading income/(expense) excluding net interest income | – | (226 | ) | 10 | (216 | ) | – | (1,145 | ) | 199 | (946 | ) | ||||||||||||||||||||||||||||||||||
Net interest income on trading activities | – | – | 17 | 17 | – | – | 25 | 25 | ||||||||||||||||||||||||||||||||||||||
Net trading income/(expense)78 | – | (226 | ) | 27 | (199 | ) | – | (1,145 | ) | 224 | (921 | ) | ||||||||||||||||||||||||||||||||||
Gains less losses from financial investments | – | – | 27 | 27 | – | 55 | 3 | 58 | ||||||||||||||||||||||||||||||||||||||
Dividend income | – | 3 | 12 | 15 | – | 5 | 10 | 15 | ||||||||||||||||||||||||||||||||||||||
Net earned insurance premiums | – | – | 193 | 193 | – | 230 | 6 | 236 | ||||||||||||||||||||||||||||||||||||||
Gains on disposal of US branch network and | 3,148 | – | 587 | 3,735 | – | – | – | – | ||||||||||||||||||||||||||||||||||||||
Other operating income/(expense) | 7 | 23 | 143 | 173 | 61 | (185 | ) | (1 | ) | (125 | ) | |||||||||||||||||||||||||||||||||||
Total operating income | 4,817 | 2,396 | 3,135 | 10,348 | 5,462 | 1,901 | 2,667 | 10,030 | ||||||||||||||||||||||||||||||||||||||
Net insurance claims86 | – | – | (148 | ) | (148 | ) | – | (156 | ) | 2 | (154 | ) | ||||||||||||||||||||||||||||||||||
Net operating income21 | 4,817 | 2,396 | �� | 2,987 | 10,200 | 5,462 | 1,745 | 2,669 | 9,876 | |||||||||||||||||||||||||||||||||||||
Loan impairment charges and other credit risk provisions | (322 | ) | (2,569 | ) | (350 | ) | (3,241 | ) | (1,600 | ) | (4,982 | ) | (347 | ) | (6,929 | ) | ||||||||||||||||||||||||||||||
Net operating income/(expense) | 4,495 | (173 | ) | 2,637 | 6,959 | 3,862 | (3,237 | ) | 2,322 | 2,947 | ||||||||||||||||||||||||||||||||||||
Total operating expenses | (729 | ) | (1,103 | ) | (2,134 | ) | (3,966 | ) | (1,801 | ) | (1,238 | ) | (2,576 | ) | (5,615 | ) | ||||||||||||||||||||||||||||||
Operating profit/(loss) | 3,766 | (1,276 | ) | 503 | 2,993 | 2,061 | (4,475 | ) | (254 | ) | (2,668 | ) | ||||||||||||||||||||||||||||||||||
Share of profit in associates and joint ventures | – | 2 | – | 2 | – | 3 | – | 3 | ||||||||||||||||||||||||||||||||||||||
Profit/(loss) before tax | 3,766 | (1,274 | ) | 503 | 2,995 | 2,061 | (4,472 | ) | (254 | ) | (2,665 | ) | ||||||||||||||||||||||||||||||||||
| % | % | % | % | % | % | % | % | |||||||||||||||||||||||||||||||||||||||
Share of HSBC’s profit before tax | 18.2 | (6.2 | ) | 2.4 | 14.5 | 9.4 | (20.4 | ) | (1.2 | ) | (12.2 | ) | ||||||||||||||||||||||||||||||||||
Cost efficiency ratio | 15.1 | 46.0 | 71.4 | 38.9 | 33.0 | 70.9 | 96.5 | 56.9 | ||||||||||||||||||||||||||||||||||||||
Balance sheet data74 | ||||||||||||||||||||||||||||||||||||||||||||||
| US$m | US$m | US$m | US$m | US$m | US$m | US$m | US$m | |||||||||||||||||||||||||||||||||||||||
Loans and advances to customers (net) reported in: | ||||||||||||||||||||||||||||||||||||||||||||||
– loans and advances to customers | – | 34,260 | 42,154 | 76,414 | – | 43,543 | 42,947 | 86,490 | ||||||||||||||||||||||||||||||||||||||
– assets held for sale | – | 3,463 | 436 | 3,899 | 29,137 | – | 1,921 | 31,058 | ||||||||||||||||||||||||||||||||||||||
Total assets | – | 54,382 | 46,721 | 101,103 | 30,635 | 56,830 | 56,813 | 144,278 | ||||||||||||||||||||||||||||||||||||||
Customer accounts reported in: | ||||||||||||||||||||||||||||||||||||||||||||||
– customer accounts | – | – | 57,758 | 57,758 | – | – | 63,558 | 63,558 | ||||||||||||||||||||||||||||||||||||||
– liabilities of disposal groups held for sale | – | – | – | – | – | – | 10,104 | 10,104 | ||||||||||||||||||||||||||||||||||||||
For footnotes, see page 120.
110
Table of Contents
HSBC HOLDINGS PLC
Report of the Directors: Operating and Financial Review(continued)
Our operations in Latin America principally comprise HSBC Bank Brasil S.A.-Banco Múltiplo, HSBC México, S.A., HSBC Bank Argentina S.A. and HSBC Bank (Panama) S.A. In addition to banking services, we operate insurance businesses in Brazil, Mexico, Argentina and Panama.
2012 US$m | 2011 US$m | 2010 US$m | ||||||||||||||
Net interest income | 6,984 | 6,956 | 6,311 | |||||||||||||
Net fee income | 1,735 | 1,781 | 1,749 | |||||||||||||
Net trading income | 971 | 1,378 | 733 | |||||||||||||
Other income | 1,261 | 1,338 | 938 | |||||||||||||
Net operating income21 | 10,951 | 11,453 | 9,731 | |||||||||||||
LICs76 | (2,137 | ) | (1,883 | ) | (1,544 | ) | ||||||||||
Net operating income | 8,814 | 9,570 | 8,187 | |||||||||||||
Total operating expenses | (6,430 | ) | (7,255 | ) | (6,394 | ) | ||||||||||
Operating profit | 2,384 | 2,315 | 1,793 | |||||||||||||
Income from associates77 | – | – | 2 | |||||||||||||
Profit before tax | 2,384 | 2,315 | 1,795 | |||||||||||||
Cost efficiency ratio | 58.7% | 63.3% | 65.7% | |||||||||||||
RoRWA66 | 2.4% | 2.3% | 2.0% | |||||||||||||
Year-end staff numbers | 46,556 | 54,035 | 56,044 | |||||||||||||
Significant progress on reducing
fragmentation in our portfolio of businesses
Strong underlying revenue growth
across all global businesses
US$475m
increase in LICs76
(on an underlying basis)
For footnotes, see page 120.
Economic background
Brazil’s GDP growth slowed further in 2012, mostly due to the effects of higher input costs, concern about global financial stability, and domestic regulatory uncertainty. Despite growth remaining low, consumer inflation remained above the 4.5% inflation target pursued by the Central Bank, ending 2012 at 5.8%.
By contrast, growth held up well in Mexico in 2012 led, in particular, by favourable industrial exports to the US. Enhanced competitiveness helped Mexican exports to gain a larger share of total US imports. Domestically, demand stayed largely unchanged, encouraged by labour reforms passed by the new administration. Despite the growth figures, inflation ended 2012 slightly below 4% and converging on the 3% inflation target pursued by Banco de Mexico.
Argentina reported a sharp slowdown in 2012. Balance of payments restrictions gradually escalated from capital flows to the current account, including imports of intermediate goods, which generated disruption in production and deterioration in business confidence. Despite this sharp slowdown, inflation continued to remain high, partly due to regulated price increases and import restrictions that lowered domestic supply.
Review of performance
Our operations in Latin America reported a profit before tax of US$2.4bn in 2012, 3% higher than in 2011 and an increase of 16% on a constant currency basis. This included a gain of US$102m following the completion of the sale of our general insurance manufacturing business in Argentina, a loss of US$62m on the sale of our operations in Costa Rica, Honduras and El Salvador and a loss of US$96m recognised following the reclassification of our non-strategic businesses in Colombia, Peru, and Paraguay to ‘Assets held for sale.’
On an underlying basis, pre-tax profits rose by 19%, primarily due to increased revenues across all global businesses, partly offset by higher loan impairment charges. In RBWM, the revenue increase reflected growth in average lending balances in Argentina and a higher yielding portfolio mix in Brazil while, in CMB, it resulted from continued balance sheet growth in Brazil which was driven by a strong demand for trade-related lending and higher balances of Payment and Cash Management current accounts in Argentina. In addition, there were higher Balance Sheet Management revenues in Brazil following a downward movement in interest rates which lowered the cost of funding. In Brazil, loan
111
Table of Contents
HSBC HOLDINGS PLC
Report of the Directors: Operating and Financial Review(continued)
Profit/(loss) before tax by country within global businesses
Retail and Wealth US$m | Commercial Banking US$m | Global US$m | Global Private | Other US$m | Total US$m | |||||||||||||||||||||||||||||
2012 | ||||||||||||||||||||||||||||||||||
Argentina | 209 | 169 | 174 | – | (46 | ) | 506 | |||||||||||||||||||||||||||
Brazil | 94 | 359 | 696 | 17 | (43 | ) | 1,123 | |||||||||||||||||||||||||||
Mexico | 338 | 176 | 201 | 2 | (18 | ) | 699 | |||||||||||||||||||||||||||
Panama | 29 | 62 | 48 | 2 | – | 141 | ||||||||||||||||||||||||||||
Other | (62 | ) | (15 | ) | 34 | (1 | ) | (41 | ) | (85 | ) | |||||||||||||||||||||||
| 608 | 751 | 1,153 | 20 | (148 | ) | 2,384 | ||||||||||||||||||||||||||||
2011 | ||||||||||||||||||||||||||||||||||
Argentina | 91 | 107 | 148 | – | (2 | ) | 344 | |||||||||||||||||||||||||||
Brazil | 241 | 566 | 515 | 13 | (105 | ) | 1,230 | |||||||||||||||||||||||||||
Mexico | 403 | 129 | 268 | 4 | (178 | ) | 626 | |||||||||||||||||||||||||||
Panama | 23 | 59 | 52 | 3 | (9 | ) | 128 | |||||||||||||||||||||||||||
Other | (55 | ) | 6 | 66 | – | (30 | ) | (13 | ) | |||||||||||||||||||||||||
| 703 | 867 | 1,049 | 20 | (324 | ) | 2,315 | ||||||||||||||||||||||||||||
2010 | ||||||||||||||||||||||||||||||||||
Argentina | 89 | 90 | 105 | – | – | 284 | ||||||||||||||||||||||||||||
Brazil | 151 | 382 | 430 | 6 | 64 | 1,033 | ||||||||||||||||||||||||||||
Mexico | 174 | 24 | 210 | 4 | (11 | ) | 401 | |||||||||||||||||||||||||||
Panama | 48 | 57 | 33 | 2 | – | 140 | ||||||||||||||||||||||||||||
Other | (100 | ) | 1 | 51 | (2 | ) | (13 | ) | (63 | ) | ||||||||||||||||||||||||
| 362 | 554 | 829 | 10 | 40 | 1,795 | |||||||||||||||||||||||||||||
impairment charges rose, primarily as a result of increased delinquency rates in RBWM and CMB, particularly in the Business Banking portfolio, reflecting lower economic growth in 2012. Loan impairment charges improved during the second half of 2012, mainly due to lower collective portfolio provisions in Brazil.
We made significant progress in reducing the fragmentation in our Latin American businesses through disposals in our non-strategic markets. In May 2012, we announced the sale of our businesses in Colombia, Peru, Uruguay and Paraguay, with completion expected in 2013. We will continue to offer full branch services to our customers during transition. In the second half of 2012, we completed the sale of our businesses in Costa Rica, El Salvador and Honduras. In addition, we completed the sale of our general insurance manufacturing business in Argentina and announced the agreement to sell a portfolio of general insurance assets and liabilities in Mexico with completion expected in 2013. Under the terms of these agreements, the purchasers will provide general insurance products to HSBC to sell to our retail customers in the two countries. This long-term collaboration will broaden and strengthen the suite of general insurance products available to our customers. In February 2013, we announced an agreement to sell our operations in Panama. The transaction is subject to regulatory approvals and
other conditions and is expected to complete by the third quarter of 2013.
In our RBWM business, we made good progress in developing a wealth management service that addresses our customers’ needs and we strengthened our sales force capabilities to capture wealth creation in the region. Wealth Management revenues increased by over US$275m or 36%. This included the favourable effect of the recognition of a PVIF asset in Brazil. Excluding this gain, Wealth Management revenues rose by 17%, mainly from insurance and mutual funds.
In CMB, we worked closely with GB&M to ensure our clients had access to appropriate products. In addition, our relationships with CMB payroll customers enabled us to increase personal lending to their employees, who became our RBWM customers. We were able to provide support to companies as they grow internationally through our Global Trade and Receivables Finance products, and used our international expertise to capture trade and capital flows, notably in the Brazil-China trade corridors. We continued to strengthen our service to international SMEs by increasing the number of specialist International Relationship Managers in Brazil.
In GB&M, we continued to target international corporate customers throughout Latin America.
112
Table of Contents
HSBC HOLDINGS PLC
Report of the Directors: Operating and Financial Review(continued)
We were awarded ‘First place in International Debt Capital Markets’ by the Brazilian Financial and Capital Markets Association and ‘Best Project Finance House in Latin America’ fromEuromoney. We also maintained a strong presence in the foreign exchange and derivatives markets.
Across the region, we continued to implement measures to improve operational efficiency, incurring US$167m of restructuring costs in 2012. We achieved a 14% net reduction of almost 7,500 FTEs, including more than 4,000 employees transferred with the disposals described earlier, and approximately US$285m of additional sustainable savings.
The following commentary is on a constant currency basis.
Net interest incomeincreased by 12% compared with 2011, with growth across all global businesses.
In RBWM, net interest income rose due to higher average lending volumes, mainly in personal loans and credit cards in Argentina as a result of successful marketing and sales campaigns. We also benefited from a change in the composition of the lending book in Brazil as we increased our balances of higher yielding assets. Net interest income from deposits also increased due to higher balances in current accounts in Mexico and savings accounts in Argentina supported by marketing campaigns.
In CMB, higher net interest income reflected a rise in average loans and advances to customers in Brazil, driven by strong demand for trade-related lending and our focus on corporate relationships and sectors with potential for international expansion. Net interest income also rose in Argentina, mainly in Payments and Cash Management current accounts, reflecting higher balances which were supported by successful marketing campaigns, and wider spreads driven by a rise in interest rates.
In GB&M, net interest income increased, notably in Balance Sheet Management in Brazil, as we benefited from the downward movements in interest rates which lowered the cost of funding assets in this portfolio.
Net fee incomeincreased by 8% to US$1.7bn, mainly due to higher Payments and Cash Management revenues, which benefited from mandates from new customers and repricing initiatives in Argentina and Brazil. Fee income was also higher as a result of the sale of the general insurance business as fee expense associated with this business was no longer incurred.
Net trading incomeof US$971m was 19% lower than in 2011, primarily due to lower reverse repos driven by positions in GB&M in Brazil that had matured but had not been renewed, and lower income related to government debt securities. This was partly offset by gains in the Rates business as a result of favourable rate movements.
Net income from financial instruments designated at fairvalue increased by 39%, or US$187m, mainly in Brazil, reflecting higher investment gains arising from favourable equity and debt market movements and growth in policyholder assets from higher sales of unit-linked pension products. To the extent that these investment gains were attributed to policyholders there was a corresponding increase in‘Net insurance claims incurred and movement in liabilities to policyholders’.
Gains less losses from financial investmentsof US$227m were 80% or US$100m higher than in 2011, primarily in Brazil due to gains on sale of shares in non-strategic investments and disposals of government debt securities in GB&M in 2012, partly offset by the non-recurrence of a gain in GB&M on the sale of shares in a Mexican listed company in 2011.
Net earned insurance premiumsincreased by 5% to US$2.5bn, driven by increased sales in Brazil of unit-linked pension products and term life insurance products. Premiums also rose in Mexico, mainly due to growth in sales of an endowment product. In Argentina, premiums were lower, following the sale of the general insurance business in 2012.
Other operating income decreased by 8% to US$253m, driven by a loss of US$62m on the sale of our operations in Costa Rica, Honduras and El Salvador, and a loss of US$96m recognised following the reclassification of our non-strategic businesses in Colombia, Peru, and Paraguay to held for sale. In addition, in 2011, we reported a gain on sale of the Mexican pension administration business, HSBC Afore, of US$83m and a gain on the sale and leaseback of branches of US$53m. These factors were partly offset by the favourable effect of the recognition of a PVIF asset in Brazil of US$119m relating to unit-linked pensions, together with an increase in the value of new term life business in Brazil, as well as the gain on sale of the general insurance business in Argentina of US$102m.
Net insurance claims incurred and movement in liabilities to policyholders increased by 15%, driven by higher net investment gains on the fair value of the assets held to support policyholder contracts. In
113
Table of Contents
HSBC HOLDINGS PLC
Report of the Directors: Operating and Financial Review(continued)
addition, liabilities to policyholders were established for new business, reflecting the increase in premiums in Brazil, though this was partly offset by the disposal of the general insurance business in Argentina in 2012.
Loan impairment charges and other credit risk provisionsincreased by 29%. This was mainly in Brazil, driven by increased delinquency rates in RBWM and CMB, particularly in Business Banking, reflecting lower economic growth in 2012. We took a number of steps to reposition our portfolios in RBWM and CMB including reducing third-party originations and lowering credit limits where appropriate. We also improved our collections capabilities. Loan impairment charges improved during the second half of the year in Brazil.
Operating expensesdecreased by US$83m compared with 2011. Restructuring costs declined by US$137m as 2011 included costs associated with the consolidation of the branch network and the reorganisation of regional and country support functions. These restructuring initiatives and our continued efforts to exercise strict cost control and progress with our organisational effectiveness programmes resulted in approximately US$285m of additional sustainable cost savings and a net 7% reduction in average FTEs of around 4,000 in 2012. These savings were partly offset by inflationary pressures, union-agreed wage increases in Brazil and Argentina and a payment of fines and penalties of US$29m in connection with non-compliance with anti-money laundering systems and controls including requirements to report unusual transactions, in Mexico.
114
Table of Contents
HSBC HOLDINGS PLC
Report of the Directors: Operating and Financial Review(continued)
Reconciliation of reported and constant currency profit/(loss) before tax – Latin America
2011 as | Currency translation adjustment24 US$m | 2011 at 2012 rates US$m | 2012 as | Reported change25 % | Constant change25 % | |||||||||||||||||||||||||||||
Net interest income | 6,956 | (709 | ) | 6,247 | 6,984 | – | 12 | |||||||||||||||||||||||||||
Net fee income | 1,781 | (174 | ) | 1,607 | 1,735 | (3 | ) | 8 | ||||||||||||||||||||||||||
Other income27 | 2,716 | (333 | ) | 2,383 | 2,232 | (18 | ) | (6 | ) | |||||||||||||||||||||||||
Net operating income21 | 11,453 | (1,216 | ) | 10,237 | 10,951 | (4 | ) | 7 | ||||||||||||||||||||||||||
Loan impairment charges and other credit risk provisions | (1,883 | ) | 221 | (1,662 | ) | (2,137 | ) | (13 | ) | (29 | ) | |||||||||||||||||||||||
Net operating income | 9,570 | (995 | ) | 8,575 | 8,814 | (8 | ) | 3 | ||||||||||||||||||||||||||
Operating expenses | (7,255 | ) | 742 | (6,513 | ) | (6,430 | ) | 11 | 1 | |||||||||||||||||||||||||
Operating profit | 2,315 | (253 | ) | 2,062 | 2,384 | 3 | 16 | |||||||||||||||||||||||||||
Income from associates | – | – | – | – | – | – | ||||||||||||||||||||||||||||
Profit before tax | 2,315 | (253 | ) | 2,062 | 2,384 | 3 | 16 | |||||||||||||||||||||||||||
For footnotes, see page 120.
Reconciliation of reported and underlying29 items – Latin America
| Year ended 31 December | ||||||||||||||||
2012 $m | 2011 US$m | Change % | ||||||||||||||
Revenue21 | ||||||||||||||||
Reported revenue | 10,951 | 11,453 | (4 | ) | ||||||||||||
Currency translation adjustment24 | (1,216 | ) | ||||||||||||||
Acquisitions, disposals and dilutions | (343 | ) | (492 | ) | ||||||||||||
Underlying revenue | 10,608 | 9,745 | 9 | |||||||||||||
Loan impairment charges and other credit risk provisions (‘LIC’s) | ||||||||||||||||
Reported LICs | (2,137 | ) | (1,883 | ) | (13 | ) | ||||||||||
Currency translation adjustment24 | 221 | |||||||||||||||
Acquisitions, disposals and dilutions | 16 | 16 | ||||||||||||||
Underlying LICs | (2,121 | ) | (1,646 | ) | (29 | ) | ||||||||||
Operating expenses | ||||||||||||||||
Reported operating expenses | (6,430 | ) | (7,255 | ) | 11 | |||||||||||
Currency translation adjustment24 | 742 | |||||||||||||||
Acquisitions, disposals and dilutions | 183 | 295 | ||||||||||||||
Underlying operating expenses | (6,247 | ) | (6,218 | ) | – | |||||||||||
Underlying cost efficiency ratio | 58.9% | 63.8% | ||||||||||||||
Profit before tax | ||||||||||||||||
Reported profit before tax | 2,384 | 2,315 | 3 | |||||||||||||
Currency translation adjustment24 | (253 | ) | ||||||||||||||
Acquisitions, disposals and dilutions | (144 | ) | (181 | ) | ||||||||||||
Underlying profit before tax | 2,240 | 1,881 | 19 | |||||||||||||
For footnotes, see page 120.
114a
Table of Contents
HSBC HOLDINGS PLC
Report of the Directors: Operating and Financial Review(continued)
2011 compared with 2010
Economic background
InBrazil, economic growth in 2011 slowed more quickly than expected, and is anticipated to have ended the year with the economy growing at an annual rate of 3%. While the fallout from the crisis in the eurozone contributed to the slowdown, it was mostly attributable to an easing in domestic demand following a tightening in monetary conditions in response to rising inflation. By the end of 2011 inflation had fallen to 6.5% after peaking at around 7.5% in June. This allowed the government to reverse much of the policy tightening implemented in early 2011.
Mexico’s economy maintained a robust rate of growth in 2011, although export growth moderated at the end of the year on the back of lower external demand. By contrast, domestic demand continued to strengthen, reflecting the greater availability of credit, growth in wages and a steady reduction in unemployment. GDP grew at an annual rate of 3.9% in 2011. The annual rate of CPI inflation rose at the end of 2011 to 3.8% due to a rebound in some agricultural prices and exchange rate depreciation. The Central Bank of Mexico maintained its policy interest rate at 4.5% throughout the year.
InArgentina, during the first three quarters of 2011, real GDP increased by 9.4% compared with the same period in 2010, mainly from increases in consumption of 11.3% and in gross fixed investment of 19.9%. The annual rate of CPI inflation remained high and the GDP deflator measure of inflation accelerated to 16.4% in the third quarter of 2011.
Review of performance
In Latin America, our operations reported a profit before tax of US$2.3bn in 2011, an increase of 29% compared with 2010. On an underlying basis, which excludes a gain of US$83m from the sale of HSBC Afore (the Mexican pension administration business), profit before tax increased by 21%. This was driven by strong growth in lending balances in our CMB and RBWM businesses in Brazil, which reflected the favourable economic environment. Improved revenue in GB&M arose from higher income from foreign exchange driven by greater volatility and an increase in client activity, while growth in insurance revenue followed an increase in our sales force. This was partly offset by cost growth driven by restructuring initiatives, inflationary pressures and business growth, while a rise in loan impairment charges and other credit risk provisions reflected the strong rise in lending, particularly in Brazil.
During 2011, we made progress in the execution of our regional strategy while also improving the efficiency of our operations. We recruited additional relationship managers in our CMB businesses in Brazil to support business growth, particularly from Business Banking and mid-market customers and the increasing number of businesses with international requirements. We increased our focus on sales and customer service with the addition of relationship managers in RBWM in Brazil, and opened 14 new branches in Argentina to capture opportunities arising from demographic changes and upward social mobility.
In order to improve the risk profile of our RBWM business we continued to reposition our lending portfolio towards higher credit-quality customers, notably by building long-term relationships with customers. In Brazil, we increased our focus on secured lending and wealth management products.
In GB&M, our pre-tax profits increased to over US$1.0bn in 2011 as we continued to utilise the connectivity of the HSBC network to serve the growing number of global corporate businesses in Latin America. During 2011, our GB&M sales force actively targeted our CMB customer base and achieved strong growth in revenue compared with 2010, most notably from the sale of GB&M foreign exchange products.
To enhance efficiency, we restructured our regional and country support functions, and in Mexico we consolidated the branch network, reducing it by 43 in the last quarter of 2010 and 77 in 2011. In the second half of 2011 we completed the sale of HSBC Afore and our retail banking operations in Chile. As a consequence, we reduced staff numbers by more than 1,900 in 2011.
In January 2012, we entered into an agreement to sell our operations in Costa Rica, Honduras and El Salvador. We expect to complete this transaction during 2012, subject to regulatory approval.
Net interest income rose by 7% to US$7.0bn, driven by growth in average lending balances in both 2010 and in 2011. This was mainly in CMB and RBWM, reflecting favourable economic conditions and growing consumer demand, partly offset by a rise in internal funding costs on higher balances of reverse repos and government bonds held for trading. In CMB, we grew our average customer lending balances, particularly in Brazil, reflecting the favourable economic conditions, the increase in our customer base and our investment in relationship managers. The rise was mainly in working capital products following marketing campaigns and new
114b
Table of Contents
HSBC HOLDINGS PLC
Report of the Directors: Operating and Financial Review(continued)
product launches, while higher overdraft balances arose from increased utilisation rates. We also grew our trade-related lending in response to strong customer demand and our focus on sales to customers with international connectivity. In RBWM, increased average lending balances and strong lending growth in 2011 led to higher net interest income, mainly in Brazil and Argentina, reflecting economic growth, lower unemployment and increased household income. This was partly offset by a compression of asset spreads in Mexico and Brazil as an increased proportion of our lending book comprised secured, lower-yielding products.
Net fee income declined marginally, driven by a reduction in Mexico where regulatory changes relating to ATM transactions resulted in a reduction in the fees we were able to charge for use of our network. Credit card fees in Mexico declined as a result of lower balances. This was partly offset by growth in fee income from our CMB business in Brazil, mainly in Payments and Cash Management and Account Services, reflecting increased volumes.
Net trading income was 82% higher than in 2010. The majority of the increase was in Brazil due to a rise in net interest income earned on trading activities resulting from an increase in reverse repos and government bonds held for trading. The cost of internally funding these assets also increased, but the related interest expense is reported within ‘Net interest income’. Additionally, trading income in Brazil increased as a result of higher revenue from sales of foreign exchange products reflecting market volatility, while in Mexico higher trading income was due to the completion of a small number of individually large derivative transactions in GB&M.
Net income from financial instruments designated at fair value was 26% higher than in 2010, mainly due to growth in premiums from unit-linked pension products in Brazil which resulted in an increase in the underlying financial assets. Since investment income accruing from these assets was largely attributable to policyholders, there was a corresponding increase in‘Net insurance claims incurred and movement in liabilities to policyholders’.
Gains less losses from financial investments rose by 36%, mainly due to a gain on the sale of shares in a Mexican listed company and increased gains from the sale of debt securities in Argentina.
Net insurance premiums increased by 26% to US$2.7bn. This was mainly in Brazil, reflecting strong growth in sales of unit linked pension and life and credit protection products, following an increase in the sales force and targeted sales campaigns. In
Argentina, strong growth in net insurance premiums was mainly attributable to volume growth and the repricing of motor insurance policies in response to inflationary pressures. In Mexico, a rise in net insurance premiums was principally due to higher sales of an endowment product and improved term life lapse rates. The growth in net insurance premiums, as well as the increase in policyholder assets described above, resulted in corresponding increases in ‘Net insurance claims incurred and movement in liabilities to policyholders’.
Other operating income of US$244m was 74% higher than in 2010 due to gains of US$61m resulting from the sale and leaseback of branches in Mexico. In addition, there was a net increase in the PVIF in Brazil and Mexico as a result of higher life insurance sales, partly offset by a net decrease from experience and assumption updates in addition to a higher unwind of cash flows from the growing in-force book.
Loan impairment charges and other credit risk provisions rose by 17% to US$1.9bn. The increase was mainly in Brazil driven by strong lending growth in RBWM and CMB, as well as worsening delinquency in the second half of 2011, notably in the credit card and Business Banking portfolios. In addition, higher loan impairment charges included a significant individually assessed loan impairment charge related to a single commercial customer.
Loan impairment charges and other credit risk provisions in Mexico declined by 28% reflecting the continued managed decline of the higher risk sections of the credit card portfolio, as well as improvements to both the collections and credit quality of the portfolio following targeted sales campaigns and enhanced pre-screening.
Operating expenses were 10% higher than in 2010. In 2011, we incurred US$338m of restructuring costs, the majority of which are reported in ‘Other’, as we took steps to improve the ongoing efficiency of our operations in the region, including cancelling certain regional projects, restructuring regional and country support functions and consolidating the branch network in Mexico.
In addition, operating expenses were adversely affected by inflationary pressures across the region, as well as union agreed wage increases and a rise in volume-driven transactional taxes in Brazil and Argentina. Sustainable savings of about US$220m resulting from the restructuring and organisational effectiveness programmes enabled investment in strategic initiatives, including the recruitment of additional relationship managers.
114c
Table of Contents
HSBC HOLDINGS PLC
Report of the Directors: Operating and Financial Review(continued)
Reconciliation of reported and underlying profit before tax
2011 compared with 2010 – Latin America31
2010 as | 2010 ments32 US$m | Currency translation adjustment24 | 2010 at 2011 rates33 US$m | 2011 as | 2011 ments32 US$m | 2011 under- lying US$m | Re- change25 % | Under- change25 % | ||||||||||||||||||||||||||||||||||||||||||||
Net interest income | 6,311 | – | 200 | 6,511 | 6,956 | – | 6,956 | 10 | 7 | |||||||||||||||||||||||||||||||||||||||||||
Net fee income | 1,749 | – | 54 | 1,803 | 1,781 | – | 1,781 | 2 | (1 | ) | ||||||||||||||||||||||||||||||||||||||||||
Other income27 | 1,671 | – | 40 | 1,711 | 2,716 | (83 | ) | 2,633 | 63 | 54 | ||||||||||||||||||||||||||||||||||||||||||
Net operating income21 | 9,731 | – | 294 | 10,025 | 11,453 | (83 | ) | 11,370 | 18 | 13 | ||||||||||||||||||||||||||||||||||||||||||
Loan impairment charges and other credit risk provisions | (1,544 | ) | – | (61 | ) | (1,605 | ) | (1,883 | ) | – | (1,883 | ) | (22 | ) | (17 | ) | ||||||||||||||||||||||||||||||||||||
Net operating income | 8,187 | – | 233 | 8,420 | 9,570 | (83 | ) | 9,487 | 17 | 13 | ||||||||||||||||||||||||||||||||||||||||||
Operating expenses | (6,394 | ) | – | (187 | ) | (6,581 | ) | (7,255 | ) | – | (7,255 | ) | (13 | ) | (10 | ) | ||||||||||||||||||||||||||||||||||||
Operating profit | 1,793 | – | 46 | 1,839 | 2,315 | (83 | ) | 2,232 | 29 | 21 | ||||||||||||||||||||||||||||||||||||||||||
Income from associates | 2 | – | – | 2 | – | – | – | |||||||||||||||||||||||||||||||||||||||||||||
Profit before tax | 1,795 | – | 46 | 1,841 | 2,315 | (83 | ) | 2,232 | 29 | 21 | ||||||||||||||||||||||||||||||||||||||||||
For footnotes, see page 120.
114d
Table of Contents
HSBC HOLDINGS PLC
Report of the Directors: Operating and Financial Review(continued)
Profit/(loss) before tax and balance sheet data – Latin America
| 2012 | ||||||||||||||||||||||||||||||||||||||||
Retail and Wealth Management | Commercial Banking | Global and Markets | Global Private | Other US$m | Inter- elimination85 US$m | Total US$m | ||||||||||||||||||||||||||||||||||
| Profit/(loss) before tax | ||||||||||||||||||||||||||||||||||||||||
Net interest income/(expense) | 4,145 | 2,173 | 993 | 30 | (2 | ) | (355 | ) | 6,984 | |||||||||||||||||||||||||||||||
Net fee income | 873 | 622 | 207 | 33 | – | – | 1,735 | |||||||||||||||||||||||||||||||||
Trading income excluding net interest income | 85 | 99 | 398 | 3 | 1 | – | 586 | |||||||||||||||||||||||||||||||||
Net interest income on trading activities | – | – | 29 | – | 1 | 355 | 385 | |||||||||||||||||||||||||||||||||
Net trading income78 | 85 | 99 | 427 | 3 | 2 | 355 | 971 | |||||||||||||||||||||||||||||||||
Changes in fair value of long- term debt issued and related derivatives | – | – | – | – | – | – | – | |||||||||||||||||||||||||||||||||
Net income from other financial instruments designated at fair value | 503 | 163 | 1 | – | – | – | 667 | |||||||||||||||||||||||||||||||||
Net income from financial instruments designated at fair value | 503 | 163 | 1 | – | – | – | 667 | |||||||||||||||||||||||||||||||||
Gains less losses from financial investments | 75 | 21 | 131 | – | – | – | 227 | |||||||||||||||||||||||||||||||||
Dividend income | 9 | 5 | 1 | – | – | – | 15 | |||||||||||||||||||||||||||||||||
Net earned insurance premiums | 1,985 | 450 | 17 | – | – | – | 2,452 | |||||||||||||||||||||||||||||||||
Other operating income/(expense) | 309 | (9 | ) | 6 | 3 | 134 | (190 | ) | 253 | |||||||||||||||||||||||||||||||
Total operating income | 7,984 | 3,524 | 1,783 | 69 | 134 | (190 | ) | 13,304 | ||||||||||||||||||||||||||||||||
Net insurance claims86 | (1,875 | ) | (469 | ) | (9 | ) | – | – | – | (2,353 | ) | |||||||||||||||||||||||||||||
Net operating income21 | 6,109 | 3,055 | 1,774 | 69 | 134 | (190 | ) | 10,951 | ||||||||||||||||||||||||||||||||
Loan impairment charges and other credit risk provisions | (1,541 | ) | (581 | ) | (13 | ) | (2 | ) | – | – | (2,137 | ) | ||||||||||||||||||||||||||||
Net operating income | 4,568 | 2,474 | 1,761 | 67 | 134 | (190 | ) | 8,814 | ||||||||||||||||||||||||||||||||
Total operating expenses | (3,960 | ) | (1,723 | ) | (608 | ) | (47 | ) | (282 | ) | 190 | (6,430 | ) | |||||||||||||||||||||||||||
Operating profit/(loss) | 608 | 751 | 1,153 | 20 | (148 | ) | – | 2,384 | ||||||||||||||||||||||||||||||||
Share of profit in associates and joint ventures | – | – | – | – | – | – | – | |||||||||||||||||||||||||||||||||
Profit/(loss) before tax | 608 | 751 | 1,153 | 20 | (148 | ) | – | 2,384 | ||||||||||||||||||||||||||||||||
| % | % | % | % | % | % | |||||||||||||||||||||||||||||||||||
Share of HSBC’s profit before tax | 2.9 | 3.6 | 5.6 | 0.1 | (0.7 | ) | 11.6 | |||||||||||||||||||||||||||||||||
Cost efficiency ratio | 64.8 | 56.4 | 34.3 | 68.1 | 210.4 | 58.7 | ||||||||||||||||||||||||||||||||||
Balance sheet data74 | ||||||||||||||||||||||||||||||||||||||||
| US$m | US$m | US$m | US$m | US$m | US$m | |||||||||||||||||||||||||||||||||||
Loans and advances to customers (net) | 17,236 | 25,379 | 10,903 | 91 | – | 53,609 | ||||||||||||||||||||||||||||||||||
Total assets | 36,141 | 35,507 | 58,272 | 570 | 1,110 | (323 | ) | 131,277 | ||||||||||||||||||||||||||||||||
Customer accounts | 28,688 | 20,834 | 12,604 | 4,430 | – | 66,556 | ||||||||||||||||||||||||||||||||||
115
Table of Contents
HSBC HOLDINGS PLC
Report of the Directors: Operating and Financial Review(continued)
Profit/(loss) before tax and balance sheet data – Latin America(continued)
| 2011 | ||||||||||||||||||||||||||||||||||||||||
Retail Banking and Wealth Management US$m | Commercial Banking US$m | Global Banking and US$m | Global Private | Other US$m | Inter- elimination85 US$m | Total US$m | ||||||||||||||||||||||||||||||||||
Profit/(loss) before tax | ||||||||||||||||||||||||||||||||||||||||
Net interest income/(expense) | 4,519 | 2,229 | 882 | 25 | (7 | ) | (692 | ) | 6,956 | |||||||||||||||||||||||||||||||
Net fee income | 939 | 610 | 196 | 36 | – | – | 1,781 | |||||||||||||||||||||||||||||||||
Trading income/(expense) excluding net interest income | 68 | 106 | 372 | 5 | (7 | ) | – | 544 | ||||||||||||||||||||||||||||||||
Net interest income on trading activities | – | – | 134 | – | 8 | 692 | 834 | |||||||||||||||||||||||||||||||||
Net trading income78 | 68 | 106 | 506 | 5 | 1 | 692 | 1,378 | |||||||||||||||||||||||||||||||||
Changes in fair value of long- term debt issued and related derivatives | – | – | – | – | – | – | – | |||||||||||||||||||||||||||||||||
Net income from other financial instruments designated at fair value | 424 | 124 | 2 | – | – | – | 550 | |||||||||||||||||||||||||||||||||
Net income from financial instruments designated at fair value | 424 | 124 | 2 | – | – | – | 550 | |||||||||||||||||||||||||||||||||
Gains less losses from financial investments | 11 | 1 | 124 | 1 | – | – | 137 | |||||||||||||||||||||||||||||||||
Dividend income | 10 | 3 | 1 | – | – | – | 14 | |||||||||||||||||||||||||||||||||
Net earned insurance premiums | 2,068 | 551 | 34 | – | – | – | 2,653 | |||||||||||||||||||||||||||||||||
Other operating income | 265 | 57 | 32 | 2 | 222 | (250 | ) | 328 | ||||||||||||||||||||||||||||||||
Total operating income | 8,304 | 3,681 | 1,777 | 69 | 216 | (250 | ) | 13,797 | ||||||||||||||||||||||||||||||||
Net insurance claims86 | (1,850 | ) | (478 | ) | (16 | ) | – | – | – | (2,344 | ) | |||||||||||||||||||||||||||||
Net operating income21 | 6,454 | 3,203 | 1,761 | 69 | 216 | (250 | ) | 11,453 | ||||||||||||||||||||||||||||||||
Loan impairment charges and other credit risk provisions | (1,369 | ) | (501 | ) | (12 | ) | – | (1 | ) | – | (1,883 | ) | ||||||||||||||||||||||||||||
Net operating income | 5,085 | 2,702 | 1,749 | 69 | 215 | (250 | ) | 9,570 | ||||||||||||||||||||||||||||||||
Total operating expenses | (4,382 | ) | (1,835 | ) | (700 | ) | (49 | ) | (539 | ) | 250 | (7,255 | ) | |||||||||||||||||||||||||||
Operating profit/(loss) | 703 | 867 | 1,049 | 20 | (324 | ) | – | 2,315 | ||||||||||||||||||||||||||||||||
Share of profit in associates and joint ventures | – | – | – | – | – | – | – | |||||||||||||||||||||||||||||||||
Profit/(loss) before tax | 703 | 867 | 1,049 | 20 | (324 | ) | – | 2,315 | ||||||||||||||||||||||||||||||||
| % | % | % | % | % | % | |||||||||||||||||||||||||||||||||||
Share of HSBC’s profit before tax | 3.2 | 4.0 | 4.8 | 0.1 | (1.5 | ) | 10.6 | |||||||||||||||||||||||||||||||||
Cost efficiency ratio | 67.9 | 57.3 | 39.8 | 71.0 | 249.5 | 63.3 | ||||||||||||||||||||||||||||||||||
Balance sheet data74 | ||||||||||||||||||||||||||||||||||||||||
| US$m | US$m | US$m | US$m | US$m | US$m | |||||||||||||||||||||||||||||||||||
Loans and advances to customers (net) | 19,025 | 25,834 | 11,011 | 62 | 6 | 55,938 | ||||||||||||||||||||||||||||||||||
Total assets | 39,231 | 38,410 | 66,241 | 1,660 | 417 | (1,070 | ) | 144,889 | ||||||||||||||||||||||||||||||||
Customer accounts | 28,629 | 24,050 | 18,940 | 7,079 | 62 | 78,760 | ||||||||||||||||||||||||||||||||||
For footnotes, see page 120.
116
Table of Contents
HSBC HOLDINGS PLC
Report of the Directors: Operating and Financial Review(continued)
Profit/(loss) before tax and balance sheet data – Latin America(continued)
| 2010 | ||||||||||||||||||||||||||||||||||||||||
Retail and Wealth US$m | Commercial Banking | Global and Markets US$m | Global Private | Other US$m | Inter- elimination85 US$m | Total US$m | ||||||||||||||||||||||||||||||||||
Profit before tax | ||||||||||||||||||||||||||||||||||||||||
Net interest income | 3,979 | 1,671 | 772 | 20 | 121 | (252 | ) | 6,311 | ||||||||||||||||||||||||||||||||
Net fee income/(expense) | 1,006 | 526 | 191 | 32 | (6 | ) | – | 1,749 | ||||||||||||||||||||||||||||||||
Trading income/(expense) excluding net interest income | 35 | 72 | 370 | 3 | (27 | ) | – | 453 | ||||||||||||||||||||||||||||||||
Net interest income on trading activities | – | – | 28 | – | – | 252 | 280 | |||||||||||||||||||||||||||||||||
Net trading income/(expense)78 | 35 | 72 | 398 | 3 | (27 | ) | 252 | 733 | ||||||||||||||||||||||||||||||||
Net income from financial instruments designated at fair value | 339 | 85 | 1 | – | – | – | 425 | |||||||||||||||||||||||||||||||||
Gains less losses from financial investments | 6 | 2 | 93 | – | (3 | ) | – | 98 | ||||||||||||||||||||||||||||||||
Dividend income | 7 | 2 | 3 | – | – | – | 12 | |||||||||||||||||||||||||||||||||
Net earned insurance premiums | 1,651 | 374 | 29 | – | – | – | 2,054 | |||||||||||||||||||||||||||||||||
Other operating income | 98 | 34 | 15 | 2 | 221 | (229 | ) | 141 | ||||||||||||||||||||||||||||||||
Total operating income | 7,121 | 2,766 | 1,502 | 57 | 306 | (229 | ) | 11,523 | ||||||||||||||||||||||||||||||||
Net insurance claims86 | (1,479 | ) | (297 | ) | (16 | ) | – | – | – | (1,792 | ) | |||||||||||||||||||||||||||||
Net operating income21 | 5,642 | 2,469 | 1,486 | 57 | 306 | (229 | ) | 9,731 | ||||||||||||||||||||||||||||||||
Loan impairment charges and other credit risk provisions | (1,247 | ) | (293 | ) | (4 | ) | – | – | – | (1,544 | ) | |||||||||||||||||||||||||||||
Net operating income | 4,395 | 2,176 | 1,482 | 57 | 306 | (229 | ) | 8,187 | ||||||||||||||||||||||||||||||||
Total operating expenses | (4,034 | ) | (1,623 | ) | (653 | ) | (47 | ) | (266 | ) | 229 | (6,394 | ) | |||||||||||||||||||||||||||
Operating profit | 361 | 553 | 829 | 10 | 40 | – | 1,793 | |||||||||||||||||||||||||||||||||
Share of profit in associates and joint ventures | 1 | 1 | – | – | – | – | 2 | |||||||||||||||||||||||||||||||||
Profit before tax | 362 | 554 | 829 | 10 | 40 | – | 1,795 | |||||||||||||||||||||||||||||||||
| % | % | % | % | % | % | |||||||||||||||||||||||||||||||||||
Share of HSBC’s profit before tax | 1.9 | 2.9 | 4.3 | 0.1 | 0.2 | 9.4 | ||||||||||||||||||||||||||||||||||
Cost efficiency ratio | 71.5 | 65.7 | 43.9 | 82.5 | 86.9 | 65.7 | ||||||||||||||||||||||||||||||||||
Balance sheet data74 | ||||||||||||||||||||||||||||||||||||||||
| US$m | US$m | US$m | US$m | US$m | US$m | |||||||||||||||||||||||||||||||||||
Loans and advances to customers (net) | 20,823 | 24,879 | 12,242 | 43 | – | 57,987 | ||||||||||||||||||||||||||||||||||
Total assets | 38,819 | 35,619 | 64,635 | 1,608 | 196 | (939 | ) | 139,938 | ||||||||||||||||||||||||||||||||
Customer accounts | 30,149 | 24,514 | 27,810 | 6,053 | – | 88,526 | ||||||||||||||||||||||||||||||||||
For footnotes, see page 120.
116a
Table of Contents
HSBC HOLDINGS PLC
Report of the Directors: Operating and Financial Review(continued)
Disposals, held for sale and run-off portfolios
In implementing our strategy, we have sold or agreed to sell a number of businesses and investments across the Group. We expect these disposals to have a significant effect on both the revenue and the profitability of the geographical regions in the future. In addition, significant portfolios are being run down. We expect the losses on these portfolios to
continue to affect the geographical regions in the future.
The table below presents the contribution of these businesses and investments to the historical results of geographical regions. We do not expect the historical results to be indicative of future results because of disposal or run-off. Fixed allocated costs, included in total operating costs, will not necessarily be removed upon disposal and have been separately identified on page 53.
Summary income statements for disposals, held for sale and run-off portfolios69,70
| 2012 | ||||||||||||||||||||||||||||||||||
| Europe US$m | Hong Kong US$m | Rest of Asia-Pacific | MENA US$m | North America US$m | Latin America US$m | |||||||||||||||||||||||||||||
Net interest income | (54 | ) | 15 | 40 | 31 | 4,051 | 372 | |||||||||||||||||||||||||||
Net fee income/(expense) | (4 | ) | (45 | ) | (3 | ) | 10 | 401 | 30 | |||||||||||||||||||||||||
Net trading income/(expense) | 68 | (6 | ) | 5 | 54 | (186 | ) | 27 | ||||||||||||||||||||||||||
Net income/(expense) from financial instruments designated at fair value | 10 | – | 5 | – | (785 | ) | 3 | |||||||||||||||||||||||||||
Gains less losses from financial investments | (70 | ) | – | – | – | 26 | 7 | |||||||||||||||||||||||||||
Dividend income | – | – | – | – | 3 | – | ||||||||||||||||||||||||||||
Net earned insurance premiums | 1 | 229 | 133 | – | 190 | 192 | ||||||||||||||||||||||||||||
Other operating income/(expense) | (1 | ) | – | 17 | – | 29 | 11 | |||||||||||||||||||||||||||
Total operating income/(expense) | (50 | ) | 193 | 197 | 95 | 3,729 | 642 | |||||||||||||||||||||||||||
Net insurance claims incurred and movement in liabilities to policyholders | (1 | ) | (119 | ) | (95 | ) | – | (138 | ) | (90 | ) | |||||||||||||||||||||||
Net operating income/(expense)21 | (51 | ) | 74 | 102 | 95 | 3,591 | 552 | |||||||||||||||||||||||||||
Loan impairment charges and other credit risk provisions | (167 | ) | – | – | (2 | ) | (2,919 | ) | (64 | ) | ||||||||||||||||||||||||
Net operating income/(expense) | (218 | ) | 74 | 102 | 93 | 672 | 488 | |||||||||||||||||||||||||||
Total operating expenses | (66 | ) | (37 | ) | (122 | ) | (47 | ) | (2,104 | ) | (371 | ) | ||||||||||||||||||||||
Operating profit/(loss) | (284 | ) | 37 | (20 | ) | 46 | (1,432 | ) | 117 | |||||||||||||||||||||||||
Share of profit in associates and joint ventures | 2 | 9 | 772 | – | 2 | 1 | ||||||||||||||||||||||||||||
Profit/(loss) before tax | (282 | ) | 46 | 752 | 46 | (1,430 | ) | 118 | ||||||||||||||||||||||||||
By global business | ||||||||||||||||||||||||||||||||||
Retail Banking and Wealth Management | 2 | 27 | 612 | 10 | (656 | ) | 41 | |||||||||||||||||||||||||||
Commercial Banking | – | 13 | 91 | – | 9 | 42 | ||||||||||||||||||||||||||||
Global Banking and Markets | (283 | ) | 6 | 57 | 36 | 2 | 54 | |||||||||||||||||||||||||||
Global Private Banking | (1 | ) | – | (8 | ) | – | – | – | ||||||||||||||||||||||||||
Other | – | – | – | – | (785 | ) | (19 | ) | ||||||||||||||||||||||||||
Profit/(loss) before tax | (282 | ) | 46 | 752 | 46 | (1,430 | ) | 118 | ||||||||||||||||||||||||||
Net gain/(loss) on sale | (3 | ) | 375 | 3,317 | (85 | ) | 4,095 | 40 | ||||||||||||||||||||||||||
For footnotes, see page 120.
117
Table of Contents
HSBC HOLDINGS PLC
Report of the Directors: Operating and Financial Review(continued)
Funds under management and assets held in custody
Funds under management
| 2012 | 2011 | |||||||||
| US$bn | US$bn | |||||||||
Funds under management | ||||||||||
At 1 January | 847 | 925 | ||||||||
Net new money | 5 | 2 | ||||||||
Value change | 49 | (40 | ) | |||||||
Exchange and other | 9 | (40 | ) | |||||||
At 31 December | 910 | 847 | ||||||||
| At 31 December | ||||||||||
| 2012 | 2011 | |||||||||
| US$bn | US$bn | |||||||||
Funds under management by business | ||||||||||
Global Asset Management | 425 | 396 | ||||||||
Global Private Banking | 288 | 259 | ||||||||
Affiliates | 3 | 3 | ||||||||
Other | 194 | 189 | ||||||||
| 910 | 847 | |||||||||
Funds under management (‘FuM’) at 31 December 2012 amounted to US$910bn, an increase of 7% compared with 31 December 2011. Total fund holdings increased in 2012, reflecting favourable market movements, the inclusion of custody assets in client assets in GPB and net new money inflows from Global Asset Management.
Global Asset Management funds, including emerging market funds, increased by 7% to US$425bn compared with 31 December 2011, driven by favourable global market movements and net inflows of US$16bn, mainly from sales of long-term funds, notably fixed income and multi-asset products, in Rest of Asia-Pacific, Hong Kong and Latin America.
GPB funds increased by 11% on 31 December 2011 to US$288bn, mainly due to the inclusion of custody assets in client assets and favourable equity market and foreign exchange movements. Negative net new money was driven by net outflows in Europe, primarily due to a programme to reposition our client base towards higher net worth international and domestic relationships, and a review of certain client relationships with a view to reducing control risk, largely offset by net inflows originating from emerging markets.
Other FuM increased by 3% to US$194bn, primarily due to favourable equity market movements partly offset by the disposal of the full service retail brokerage business in Canada.
Assets held in custody and under administration
Custody is the safekeeping and servicing of securities and other financial assets on behalf of clients. At 31 December 2012, we held assets as custodian of US$6.0 trillion, 16% higher than the US$5.2 trillion held at 31 December 2011. This was mainly driven by favourable market movements together with increased new business and favourable movements in foreign exchange.
Our assets under administration business, which includes the provision of various support function activities including the valuation of portfolios of securities and other financial assets on behalf of clients, complements the custody business. At 31 December 2012, the value of assets held under administration by the Group amounted to US$2.9 trillion, compared with US$2.6 trillion in 2011.
Property
At 31 December 2012, we operated from some 8,650 operational properties worldwide, of which approximately 2,150 were located in Europe, 2,600 in Hong Kong and Rest of Asia-Pacific, 550 in North America, 2,950 in Latin America and 400 in the Middle East and North Africa. These properties had an area of approximately 59.7m square feet (2011: 65.7m square feet).
Our freehold and long leasehold properties, together with all our leasehold land in Hong Kong, were valued in 2012. The value of these properties was US$9.7bn (2011: US$8.9bn) in excess of their carrying amount in the consolidated balance sheet an historical cost based measure. In addition, properties with a net book value of US$1.3bn (2011:US$1.3bn) were held for investment purposes.
Our operational properties are stated at cost, being historical cost or fair value at the date of transition to IFRSs (their deemed cost) less any impairment losses, and are depreciated on a basis calculated to write off the assets over their estimated useful lives. Properties owned as a consequence of an acquisition are recognised initially at fair value.
Further details are included in Note 24 on the Financial Statements.
118
Table of Contents
HSBC HOLDINGS PLC
Report of the Directors: Operating and Financial Review(continued)
Detailed list of disclosures in this report arising from EDTF recommendations
| Type of risk | Recommendation | Disclosure | Page | |||
General | 1 | The risks to which the business is exposed. | 124 to 126 | |||
2 |
Our risk appetite and stress testing. |
126 to 128 | ||||
3 |
Top and emerging risks, and the changes during the reporting period. |
130 to 136 | ||||
4 |
Discussion of future regulatory developments affecting our business model and Group profitability, and its implementation in Europe. |
132 and 288 to 292 | ||||
Risk governance, risk management and business model |
5 |
Group Risk Committee, and their activities. |
323 to 328 | |||
6 |
Risk culture and risk governance and ownership. |
124 | ||||
7 |
Diagram of the risk exposure by global business segment. |
20 | ||||
8 |
Stress testing and the underlying assumptions. |
127 to 128 | ||||
Capital adequacy and risk-weighted assets |
9 |
Pillar 1 capital requirements, and the impact for global systemically important banks.
For calculation of Pillar 1 capital requirements, see pages 10 to 14 ofPillar 3 Disclosures 2012. |
294 to 296 and 291 to 292 | |||
10 |
Reconciliation of the accounting balance sheet to the regulatory balance sheet. |
287 | ||||
11 |
Flow statement of the movements in regulatory capital since the previous reporting period, including changes in core tier 1, tier 1 and tier 2 capital. |
285 | ||||
12 |
Discussion of targeted level of capital, and the plans on how to establish this. |
288 | ||||
13 |
Analysis of risk-weighted assets by risk type, global business and geographical region, and market risk RWAs. |
282 to 283 | ||||
| 14 | For analysis of the capital requirements for each Basel asset class, see pages 10 to 14, 23, 58 and 61 ofPillar 3 Disclosures 2012. | |||||
| 15 | For analysis of credit risk for each Basel asset class, see pages 23 to 28 and 32 to 38 ofPillar 3 Disclosures 2012. | |||||
| 16 | Flow statements reconciling the movements in risk-weighted assets for each risk-weighted asset type. | 283 and 284 | ||||
| 17 | For discussion of Basel credit risk model performance, see pages 39 to 41 of thePillar 3 Disclosures 2012 document. | |||||
Liquidity | 18 | Analysis of the Group’s liquid asset buffer. | 206 to 207 | |||
Funding | 19 | Encumbered and unencumbered assets analysed by balance sheet category. | 211 to 214 | |||
| 20 | Consolidated total assets, liabilities and off-balance sheet commitments analysed by remaining contractual maturity at the balance sheet date. | 485 to 492 | ||||
| 21 | Analysis of the Group’s sources of funding and a description of our funding strategy. | 209 to 211 | ||||
Market risk | 22 | Relationship between the market risk measures for trading and non-trading portfolios and the balance sheet, by business segment. | 218 to 219 | |||
| 23 | Discussion of significant trading and non-trading market risk factors. | 220 to 223 | ||||
| 24 | VAR assumptions, limitations and validation. | 266 to 267 | ||||
| 25 | Discussion of stress tests, reverse stress tests and stressed VAR. | 267 | ||||
Credit risk | 26 | Analysis of the aggregate credit risk exposures, including details of both personal and wholesale lending. | 139 to 141 | |||
| 27 | Discussion of the policies for identifying impaired loans, defining impairments and renegotiated loans, and explaining loan forbearance policies. | 162 and 254 to 259 | ||||
| 28 | Reconciliations of the opening and closing balances of impaired loans and impairment allowances during the year. | 163 and 172 | ||||
| 29 | Analysis of counterparty credit risk that arises from derivative transactions. | 145 | ||||
| 30 | Discussion of credit risk mitigation, including collateral held for all sources of credit risk. | 163 to 168 | ||||
Other risks | 31 | Quantified measures of the management of operational risk. | 227 to 230 | |||
| 32 | Discussion of publicly known risk events. | 130 to 136 | ||||
The 32 recommendations listed above are made in the report ‘Enhancing the Risk Disclosures of Banks’ issued by the Enhanced Disclosure Task Force of the Financial Stability Board on 29 October 2012.
119
Table of Contents
HSBC HOLDINGS PLC
Report of the Directors: Operating and Financial Review(continued)
The Group Chief Executive and Group Finance Director, with the assistance of other members of management, carried out an evaluation of the effectiveness of the design and operation of HSBC Holdings’ disclosure controls and procedures as at 31 December 2012. Based upon that evaluation, the Group Chief Executive and Group Finance Director concluded that our disclosure controls and procedures as at 31 December 2012 were effective to provide reasonable assurance that information required to be disclosed in the reports which the company files and submits under the US Securities Exchange Act of 1934, as amended, is recorded, processed, summarised and reported as and when required. There are inherent limitations to the effectiveness of any system of disclosure controls and procedures, including the possibility of human error and the circumvention or overriding of the controls and procedures. Accordingly, even effective disclosure controls and procedures can only provide reasonable assurance of achieving their control objectives.
There has been no change in HSBC Holdings’ internal controls over financial reporting during the year ended 31 December 2012 that has materially affected, or is reasonably likely to materially affect, HSBC Holdings’ internal controls over financial reporting.
Management’s assessment of internal controls over financial reporting
Management is responsible for establishing and maintaining an adequate internal control structure and procedures for financial reporting, and has completed an assessment of the effectiveness of the Group’s internal controls over financial reporting as of 31 December 2012. In making the assessment, management used the framework for Director’s internal control evaluation contained within the UK Corporate Governance Code (‘The Revised Turnbull Guidance’), as well as the criteria established by the Committee of Sponsoring Organisations of the Treadway Commission (‘COSO’) in ‘Internal Control-Integrated Framework’.
Based on the assessment performed, management concluded that as at 31 December 2012, the Group’s internal controls over financial reporting were effective.
KPMG Audit Plc, which has audited the consolidated financial statements of the Group for the year ended 31 December 2012, has also audited the effectiveness of the Group’s internal control over financial reporting under Auditing Standard No. 5 of the Public Company Accounting Oversight Board (United States) as stated in their report on pages 369 and 370.
119a
Table of Contents
HSBC HOLDINGS PLC
Report of the Directors: Operating and Financial Review(continued)
Footnotes to pages 3 to 119
Financial highlights
| 1 | Dividends recorded in the financial statements are dividends per ordinary share declared in a year and are not dividends in respect of, or for, that year. The third interim dividend for 2011 of US$0.09 was paid on 18 January 2012. The fourth interim dividend for 2011 of US$0.14 was paid on 2 May 2012. First, second and third interim dividends for 2012, each of US$0.09 per ordinary share, were paid on 5 July 2012, 4 October 2012 and 12 December 2012, respectively. Note 10 on the Financial Statements provides more information on the dividends declared in 2012. On 4 March 2013 the Directors declared a fourth interim dividend for 2012 of US$0.18 per ordinary share in lieu of a final dividend, which will be payable to ordinary shareholders on 8 May 2013 in cash in US dollars, or in pounds sterling or Hong Kong dollars at exchange rates to be determined on 29 April 2013, with a scrip dividend alternative. The reserves available for distribution at 31 December 2012 were US$38,175m. |
| Quarterly dividends of US$15.50 per 6.2% non-cumulative Series A US dollar preference share, equivalent to a dividend of US$0.3875 per Series A American Depositary Share, each of which represents one-fortieth of a Series A US dollar preference share, were paid on 15 March 2012, 15 June 2012, 17 September 2012 and 17 December 2012. |
| Quarterly coupons of US$0.508 per security were paid with respect to 8.125% capital securities on 17 January 2012, 16 April 2012, 16 July 2012 and 15 October 2012. |
| Quarterly coupons of US$0.50 per security were paid with respect to 8% capital securities on 15 March 2012, 15 June 2012, 17 September 2012 and 17 December 2012. |
| 2 | The return on average ordinary shareholders’ equity is defined as profit attributable to ordinary shareholders of the parent company divided by average ordinary shareholders’ equity. |
| 3 | Return on average invested capital is based on the profit attributable to ordinary shareholders. Average invested capital is measured as average total shareholders’ equity after adding back goodwill previously amortised or written-off directly to reserves, deducting average equity preference shares issued by HSBC Holdings and deducting/(adding) average reserves for unrealised gains/(losses) on effective cash flow hedges and available-for-sale securities and property revaluation reserves. This measure reflects capital initially invested and subsequent profit. |
| 4 | The cost efficiency ratio is defined as total operating expenses divided by net operating income before loan impairment charges and other credit risk provisions. |
| 5 | Each American Depositary Share represents five ordinary shares. |
| 6 | Total shareholder return is defined as the growth in share value and declared dividend income during the relevant period. |
| 7 | The Financial Times Stock Exchange 100 Index. |
| 8 | The Morgan Stanley Capital International World Index. |
| 9 | The Morgan Stanley Capital International World Bank Index. |
| 10 | The core tier 1 capital ratio for 2012 and 2011 includes the effect of the Basel 2.5 rules. |
Business and operating models and KPIs
| 11 | Based upon pro forma post-tax profits allocation. See page 349 for details. |
| 12 | Intermediation of securities, funds and insurance products, including Securities Services in GB&M. |
| 13 | Merger and acquisition, ECM, event and project financing, and co-investments in GPB. |
| 14 | Including Foreign Exchange, Rates, Credit and Equities. |
| 15 | Including portfolio management. |
| 16 | Including private trust and estate planning (for financial and non-financial assets). |
| 17 | Including hedge funds, real estate and private equity. |
| 18 | Vehicle Finance was sold in 2010. |
| 19 | ‘Transactions’ refers to the sale or closure of non-strategic businesses or non-core investment. |
| 20 | Hong Kong, Rest of Asia-Pacific, Middle East and North Africa, and Latin America. |
| 21 | Net operating income before loan impairment charges and other credit risk provisions, also referred to as ‘revenue.’ |
| 22 | The sum of balances presented does not agree to consolidated amounts because inter-company eliminations are not presented here. |
| 23 | For definitions of HSBC UK, HBAP and HSBC US, see footnotes 40 to 42, respectively, on page 249. Subsidiaries of these entities are not included unless there is unrestricted transferability of liquidity between the subsidiaries and the parent. ‘Other entities’ (footnote 43 on page 249) comprise our other main banking subsidiaries and, as such, includes businesses spread across a range of locations, in many of which we may require a higher ratio of net liquid assets to customer liabilities to reflect local market conditions. |
Reconciliations of reported and underlying profit/(loss) before tax
| 24 | ‘Currency translation adjustment’ is the effect of translating the results of subsidiaries and associates for the previous year at the average rates of exchange applicable in the current year. |
| 25 | Positive numbers are favourable: negative numbers are unfavourable. |
| 26 | Changes in fair value due to movements in own credit spread on long-term debt issued. This does not include the fair value changes due to own credit spread on structured notes issued, derivatives and other hybrid instruments included within trading liabilities. |
| 27 | Other income in this context comprises where applicable net trading income, net income/(expense) from other financial instruments designated at fair value, gains less losses from financial investments, dividend income, net earned insurance premiums and other operating income less net insurance claims incurred and movement in liabilities to policyholders. |
| 28 | Individual reconciliations by global businesses and geographical regions are available on www.hsbc.com. |
| 29 | Underlying performance eliminates the effects of acquisitions, disposals and changes of ownership levels of subsidiaries, associates and businesses so we can view results on a like-for-like basis. We achieve this by eliminating gains and losses on disposal or dilution in the year incurred and by removing material results of operations from all the years presented. For example, if a disposal was made in the current year after four months of operations, the results of the disposed of business would be removed from the results of the current year and the previous year as if the disposed of business did not exist in those years. |
| 30 | In addition, the operating results of these disposals were removed from underlying results. |
| 31 | The presentation of the ‘Reconciliation of reported and underlying profit/(loss) before tax’ for 2011 compared with 2010 has not been updated to reflect the change in presentation in 2012 splitting underlying reconciliations from the constant currency reconciliations. The presentational change had no material impact on results. |
| 32 | These columns comprise the net increments or decrements in profits in the current year compared with the previous year which are attributable to acquisitions or disposals, gains on the dilution of interests in associates and/or movements in fair value of own debt |
120
Table of Contents
HSBC HOLDINGS PLC
Report of the Directors: Operating and Financial Review(continued)
| attributable to credit spread. The inclusion of acquisitions and disposals is determined in the light of events each year. |
| 33 | Excluding adjustments in 2010. |
Financial summary
| 34 | In 2008, an impairment charge of US$10,564m to fully write off goodwill in PFS in North America was reported in ‘Total operating expenses’. This amount is excluded from ‘Total operating expenses’ in calculating the ratio. |
| 35 | The effect of the bonus element of the rights issue in 2009 has been included within the basic and diluted earnings per share. |
| 36 | Dividends per ordinary share expressed as a percentage of basic earnings per share. |
| 37 | For full description of the Ping An forward contract, see page 470. |
| 38 | In 2011, ‘Deferred variable compensation awards-accelerated amortisation’ was included as a notable cost item. In 2012, this item recurs but is now considered part of our operating cost base and therefore has been excluded from notable items in both years. |
| 39 | Net interest income includes the cost of funding trading assets, while the related external revenues are reported in ‘Trading income’. In our global business results, the cost of funding trading assets is included with GB&M’s net trading income as interest expense. |
| 40 | Gross interest yield is the average annualised interest rate earned on average interest-earning assets (‘AIEA’). |
| 41 | Net interest spread is the difference between the average annualised interest rate earned on AIEA, net of amortised premiums and loan fees, and the average annualised interest rate paid on average interest-bearing funds. |
| 42 | Net interest margin is net interest income expressed as an annualised percentage of AIEA. |
| 43 | In 2011, ‘Other interest-earning assets’ includes the average assets of disposal groups held for sale. In prior years other interest-earning assets included intercompany eliminations. In 2012, intercompany eliminations have been included in the relevant line item. |
| 44 | Interest income on trading assets is reported as ‘Net trading income’ in the consolidated income statement. |
| 45 | Interest income on financial assets designated at fair value is reported as ‘Net income from financial instruments designated at fair value’ in the consolidated income statement. |
| 46 | Including interest-bearing bank deposits only. |
| 47 | Interest expense on financial liabilities designated at fair value is reported as ‘Net income on financial instruments designated at fair value’ in the consolidated income statement, other than interest on own debt which is reported in ‘Interest expense’. |
| 48 | Including interest-bearing customer accounts only. |
| 49 | The cost of internal funding of trading assets was US$511m (2011: US$1,161m; 2010: US$902m) and is excluded from the reported ‘Net trading income’ line and included in ‘Net interest income’. However, this cost is reinstated in ‘Net trading income’ in our global business reporting. |
| 50 | Net trading income includes a charge of US$629m (2011: income of US$458m; 2010: income of US$23m), associated with changes in the fair value of issued structured notes and other hybrid instrument liabilities derived from movements in HSBC issuance spreads. |
| 51 | Other changes in fair value include gains and losses arising from changes in the fair value of derivatives that are managed in conjunction with HSBC’s long-term debt issued. |
| 52 | Discretionary participation features. |
| 53 | Net insurance claims incurred and movement in liabilities to policyholders arise from both life and non-life insurance business. For non-life business, amounts reported represent the cost of claims paid during the year and the estimated cost of notified claims. For life business, the main element of claims is the liability to policyholders created on the initial underwriting of the policy and any subsequent movement in the liability that arises, primarily from the attribution of investment performance to savings-related policies. Consequently, claims rise in line with increases in sales of savings-related business and with investment market growth. |
Consolidated balance sheet
| 54 | Net of impairment allowances. |
| 55 | The calculation of capital resources, capital ratios and risk-weighted assets for 2012 and 2011 is on a Basel 2.5 basis. All other comparatives are on a Basel II basis. |
| 56 | Capital resources are total regulatory capital, the calculation of which is set out on page 286. |
| 57 | Including perpetual preferred securities, details of which can be found in Note 33 on the Financial Statements. |
| 58 | The definition of net asset value per share is total shareholders’ equity, less non-cumulative preference shares and capital securities, divided by the number of ordinary shares in issue. |
| 59 | ‘Currency translation adjustment’ is the effect of translating the assets and liabilities of subsidiaries and associates for the previous year-end at the rates of exchange applicable at the current year-end. |
| 60 | See Note 26 on the Financial Statements. |
| 61 | France primarily comprises the domestic operations of HSBC France, HSBC Assurances Vie and the Paris branch of HSBC Bank plc. |
| 62 | The classification of customer accounts by country within Europe has changed from amounts formerly disclosed. Certain balances which were previously presented within the country of domicile of the consolidating legal entity are now presented on the basis of the country of account origination. The most significant effect of this change is on Switzerland, where the balance of US$45,283m previously disclosed at 31 December 2011 has been restated as US$19,888m on the new basis. |
Economic profit
| 63 | Expressed as a percentage of average invested capital. |
| 64 | Average invested capital is measured as average total shareholders’ equity after: |
| – | adding back the average balance of goodwill amortised pre-transition to IFRSs or subsequently written-off, directly to reserves (less goodwill previously amortised in respect of the French regional banks sold in 2008); |
| – | deducting the average balance of HSBC’s revaluation surplus relating to property held for own use. This reserve was generated when determining the deemed carrying cost of such properties on transition to IFRSs and will run down over time as the properties are sold; |
| – | deducting average preference shares and other equity instruments issued by HSBC Holdings; and |
| – | deducting average reserves for unrealised gains/(losses) on effective cash flow hedges and available-for-sale securities. |
| 65 | Return on invested capital is profit attributable to ordinary shareholders of the parent company, which can be found in Note 11 on the Financial Statements on page 426. |
121
Table of Contents
HSBC HOLDINGS PLC
Report of the Directors: Operating and Financial Review(continued)
Reconciliation of RoRWA measures
| 66 | Risk-weighted assets (‘RWA’s) and pre-tax return on average risk-weighted assets (‘RoRWA’). |
| 67 | Underlying RoRWA is calculated using underlying pre-tax return and reported average RWAs at constant currency and adjusted for the effects of business disposals. |
| 68 | ‘Other’ includes treasury services related to the US Consumer and Mortgage Lending business and commercial operations in run-off. US CML includes loan portfolios within the run-off business that are designated held for sale. |
Disposals, held for sale and run-off portfolios
| 69 | The results of operations of disposed businesses are stated up to and including the date of disposal. The results of operations of businesses held for sale and run-off portfolios are for 2012. |
| 70 | The summary income statements present the historical results of disposals, held-for-sale and run-off portfolios to provide information on trends. The historical results are those which appear in the Group IFRS income statement and include fixed allocated costs which will not necessarily be removed or reduced upon disposal or run-off. Fixed allocated costs included in total operating expenses are disclosed separately on page 38. The results of disposed businesses exclude gains on sale and post disposal income and expenditure items; for example, restructuring costs. The results of businesses held for sale exclude losses recognised upon reclassification to the held-for-sale category. These losses are disclosed in Note 26 on the Financial Statements. |
| 71 | ‘US CML’ includes non-real estate personal loans that were reclassified to ‘Assets held for sale’ during 2012. At 31 December 2012, the carrying value of this portfolio, net of transferred impairment allowances, was US$3.4bn. The portfolio contributed interest income of US$813m and loan impairment charges of US$347m to profit before tax in 2012. ‘Other’ includes treasury services related to the US Consumer and Mortgage Lending business and commercial operations in run-off. |
| 72 | ‘Reduction in RWAs on disposal’ for disposal and held-for-sale portfolios are shown exclusive of operational risk RWAs as these are not immediately released on disposal. RWAs for held-for-sale and run-off portfolios are shown inclusive of operational risk RWAs. |
Global businesses and geographical regions
| 73 | The main items reported under ‘Other’ are certain property activities, unallocated investment activities, centrally held investment companies, gains arising from the dilution of interests in associates and joint ventures, part of the movement in the fair value of our long-term debt designated at fair value (the remainder of the Group’s movement on own debt is included in GB&M) and HSBC’s holding company and financing operations. The results also include net interest earned on free capital held centrally, operating costs incurred by the head office operations in providing stewardship and central management services to HSBC, and costs incurred by the Group Service Centres and Shared Service Organisations and associated recoveries. In addition, fines and penalties as part of the settlement of investigations into past inadequate compliance with anti-money laundering and sanctions laws together with the UK bank levy are recorded in ‘Other’. |
| 74 | Assets by geographical region and global businesses include intra-HSBC items. These items are eliminated, where appropriate, under the heading ‘Intra-HSBC items’ or ‘inter-segment elimination’, as appropriate. |
| 75 | For divested businesses, this includes the gain or loss on disposal and material results of operations as described on page 26. |
| 76 | Loan impairment charges and other credit risk provisions. |
| 77 | Share of profit in associates and joint ventures. |
| 78 | In the analysis of global businesses, net trading income comprises all gains and losses from changes in the fair value of financial assets and financial liabilities classified as held for trading, together with related external and internal interest income and interest expense, and dividends received; in the statutory presentation internal interest income and expense are eliminated. |
| 79 | In 2012, Global Markets included an adverse fair value movement of US$629m on the widening of credit spreads on structured liabilities (2011: favourable fair value movement of US$458m; 2010: favourable fair value movement of US$23m). |
| 80 | Total income earned on payments and cash management products in the Group amounted to US$6.2bn (2011: US$5.6bn; 2010: US$4.4bn), of which US$4.5bn was in CMB (2011: US$4.0bn; 2010: US$3.3bn) and US$1.7bn was in GB&M (2011: US$1.5bn; 2010: US$1.1bn). |
| 81 | Total income earned on other transaction services in the Group amounted to US$3.6bn (2011: US$3.2bn; 2010: US$2.7bn), of which US$2.8bn was in CMB relating to trade and receivables finance (2011: US$2.6bn; 2010: US$2.1bn) and US$753m was in GB&M of which US$738m related to trade and receivables finance (2011: US$601m; 2010: US$523m) and US$15m related to banknotes and other (2011: US$33m; 2010: US$113m). |
| 82 | In each Group entity, Balance Sheet Management is responsible for managing liquidity and funding under the supervision of the local Asset and Liability Management Committee. Balance Sheet Management also manages the non-trading interest rate positions of the entity transferred to it within a Global Markets limit structure. Balance Sheet Management revenues include notional tax credits on income earned from tax-exempt investments of US$116m in 2012, US$85m in 2011 and US$50m in 2010, which are offset within ‘Other’. |
| 83 | ‘Other’ in GB&M includes net interest earned on free capital held in the global business not assigned to products, allocated funding costs and gains resulting from business disposals. Within the management view of total operating income, notional tax credits are allocated to the businesses to reflect the economic benefit generated by certain activities which is not reflected within operating income, for example notional credits on income earned from tax-exempt investments where the economic benefit of the activity is reflected in tax expense. In order to reflect the total operating income on an IFRS basis, the offset to these tax credits are included within ‘Other’. |
| 84 | ‘Client assets’ are translated at the rates of exchange applicable for their respective period-ends, with the effects of currency translation reported separately. The main components of client assets are funds under management, which are not reported on the Group’s balance sheet, and customer deposits, which are reported on the Group’s balance sheet. |
| 85 | Inter-segment elimination comprises (i) the costs of shared services and Group Service Centres included within ‘Other’ which are recovered from global businesses, and (ii) the intra-segment funding costs of trading activities undertaken within GB&M. HSBC’s Balance Sheet Management business, reported within GB&M, provides funding to the trading businesses. To report GB&M’s ‘Net trading income’ on a fully funded basis, ‘Net interest income’ and ‘Net interest income/(expense) on trading activities’ are grossed up to reflect internal funding transactions prior to their elimination in the inter-segment column. |
| 86 | Net insurance claims incurred and movement in liabilities to policyholders. |
| 87 | ‘Employee expenses’ comprise costs directly incurred by each global business. The reallocation and recharging of employee and other expenses directly incurred in the ‘Other’ category are shown in ‘Other operating expenses’. |
| 88 | RWAs are non-additive across geographical regions due to market risk diversification effects within the Group. |
| 89 | CMB results include US$128m (2011: US$110m) of net operating income and US$43m (2011: US$23m) of profit before tax, related to low income housing tax credit investments in the US which are offset within the ‘Other’ segment. |
122
Table of Contents
HSBC HOLDINGS PLC
Report of the Directors: Operating and Financial Review(continued)
Average balance sheet
| 90 | Interest income on trading assets is reported as ‘Net trading income’ in the consolidated income statement. |
| 91 | Interest income on financial assets designated at fair value is reported as ‘Net income from financial instruments designated at fair value’ in the consolidated income statement. |
| 92 | Brazilian operations comprise HSBC Bank Brasil S.A.-Banco Múltiplo and subsidiaries, plus HSBC Serviços e Participações Limitada. |
| 93 | This includes interest-bearing bank deposits only. See page 36(d) for an analysis of all bank deposits. |
| 94 | Interest expense on financial liabilities designated at fair value is reported as ‘Net income on financial instruments designated at fair value’ in the consolidated income statement, other than interest on own debt which is reported in ‘Interest Expense’. |
| 95 | This includes interest-bearing customer accounts only. See page 36(e) for an analysis of all customer accounts. |
| 96 | Net interest margin is calculated as net interest income divided by average interest earning assets. |
| 97 | For the purpose of calculating the ratios, earnings consist of income from continuing operations before taxation and non-controlling interests, plus fixed charges, and after deduction of the unremitted pre-tax income of associated undertakings. Fixed charges consist of total interest expense, including or excluding interest on deposits, as appropriate, dividends on preference shares and other equity instruments, as applicable, and the proportion of rental expense deemed representative of the interest factor. |
| 98 | Trading assets and financial investments held by GB&M in North America include financial assets which may be repledged or resold by counterparties. |
| 99 | Derivative assets and derivative liabilities of GB&M include derivative transactions between different regions of GB&M. |
122a
Table of Contents
HSBC HOLDINGS PLC
Report of the Directors: Operating and Financial Review(continued)
Legal proceedings and regulatory matters
HSBC is party to legal proceedings, investigations and regulatory matters in a number of jurisdictions arising out of its normal business operations. Apart from the matters described below, HSBC considers that none of these matters is material, either individually or in the aggregate. HSBC recognises a provision for a liability in relation to these matters when it is probable that an outflow of economic benefits will be required to settle an obligation which has arisen as a result of past events, and for which a reliable estimate can be made of the amount of the obligation. While the outcome of these matters is inherently uncertain, management believes that, based on the information available to it, appropriate provisions have been made in respect of legal proceedings and regulatory matters as at 31 December 2012 (see Note 32).
Securities litigation
As a result of an August 2002 restatement of previously reported consolidated financial statements and other corporate events, including the 2002 settlement with 46 State Attorneys General relating to real estate lending practices, Household International (now HSBC Finance) and certain former officers were named as defendants in a class action law suit, Jaffe v Household International Inc, et al No 2. C 5893 (N.D.Ill, filed 19 August 2002). The complaint asserted claims under the US Securities Exchange Act of 1934. Ultimately, a class was certified on behalf of all persons who acquired and disposed of Household International common stock between 30 July 1999 and 11 October 2002. The claims alleged that the defendants knowingly or recklessly made false and misleading statements of material fact relating to Household’s Consumer Lending operations, including collections, sales and lending practices, some of which ultimately led to the 2002 State settlement agreement, and facts relating to accounting practices evidenced by the restatement.
A jury trial concluded in April 2009, which was decided partly in favour of the plaintiffs. Following post-trial briefing, the District Court ruled that various legal challenges to the verdict, including as to loss causation and other matters, would not be considered until after a second phase of the proceedings addressing issues of reliance and the submission of claims by class members had been completed. The District Court ruled on 22 November 2010 that claim forms should be mailed to class members to ascertain which class members may have claims for damages arising from reliance on the
misleading statements found by the jury. The District Court also set out a method for calculating damages for class members who filed claims. As previously reported, lead plaintiffs, in court filings in March 2010, estimated that damages could range ‘somewhere between US$2.4bn to US$3.2bn to class members’, before pre-judgement interest.
In December 2011, the report of the court-appointed claims administrator to the District Court stated that the total number of claims that generated an allowed loss was 45,921, and that the aggregate amount of these claims was approximately US$2.23bn. Defendants filed legal challenges asserting that the presumption of reliance was defeated as to the class and raising various objections with respect to compliance with the claims form requirements as to certain claims.
In September 2012, the District Court rejected defendants’ arguments that the presumption of reliance generally had been defeated either as to the class or as to particular institutional claimants. In addition, the District Court has made various rulings with respect to the validity of specific categories of claims, and held certain categories of claims valid, certain categories of claims invalid, and directed further proceedings before a court-appointed Special Master to address objections regarding certain other claim submission issues. In light of those rulings and through various agreements of the parties, currently there is approximately US$1.37bn in claims as to which there remain no unresolved objections relating to the claims form submissions. In addition, approximately US$800m in claims remain to be addressed before the Special Master with respect to various claims form objections, with a small portion of those potentially subject to further trial proceedings. Therefore, based upon proceedings to date, the current range of a possible final judgement, prior to imposition of pre-judgement interest (if any), is between approximately US$1.37bn and US$2.17bn. With the imposition of pre-judgement interest calculated through 31 December 2012, the top-end of a possible final judgement is approximately US$2.7bn. The District Court may wait for a resolution of all disputes as to all claims before entering final judgement, or the District Court may enter a partial judgement on fewer than all claims pending resolution of disputes as to the remaining claims. Post-verdict legal challenges remain to be addressed by the District Court.
Despite the jury verdict and the various rulings of the District Court, HSBC continues to believe that it has meritorious grounds for appeal of one or more of the rulings in the case, and intends to appeal the
122b
Table of Contents
HSBC HOLDINGS PLC
Report of the Directors: Operating and Financial Review(continued)
District Court’s final judgement, partial or otherwise. Upon final judgement, partial or otherwise, HSBC Finance will be required to provide security for the judgement in order to suspend its execution while the appeal is on-going by either depositing cash in an interest-bearing escrow account or posting an appeal bond in the amount of the judgement (including any pre-judgement interest awarded).
Given the complexity and uncertainties associated with the actual determination of damages, including the outcome of any appeals, there is a wide range of possible damages. HSBC believes it has meritorious grounds for appeal on matters of both liability and damages and will argue on appeal that damages should be nil or a relatively insignificant amount. If the Appeals Court rejects or only partially accepts HSBC’s arguments, the amount of damages, based upon the claims submitted and the potential application of pre-judgement interest may lie in a range from a relatively insignificant amount to somewhere in the region of US$2.7bn (or higher should plaintiffs successfully cross-appeal certain issues related to the validity of specific claims).
Bernard L. Madoff Investment Securities LLC
In December 2008, Bernard L. Madoff (‘Madoff’) was arrested for running a Ponzi scheme and a trustee was appointed for the liquidation of his firm, Bernard L. Madoff Investment Securities LLC (‘Madoff Securities’), an SEC-registered broker-dealer and investment adviser. Since his appointment, the trustee has been recovering assets and processing claims of Madoff Securities customers. Madoff subsequently pleaded guilty to various charges and is serving a 150 year prison sentence. He has acknowledged, in essence, that while purporting to invest his customers’ money in securities and, upon request, return their profits and principal, he in fact never invested in securities and used other customers’ money to fulfil requests for the return of profits and principal. The relevant US authorities are continuing their investigations into his fraud, and have brought charges against others, including certain former employees and the former auditor of Madoff Securities.
Various non-US HSBC companies provided custodial, administration and similar services to a number of funds incorporated outside the US whose assets were invested with Madoff Securities. Based on information provided by Madoff Securities, as at 30 November 2008, the purported aggregate value of these funds was US$8.4bn, an amount that includes fictitious profits reported by Madoff. Based on information available to HSBC to date, HSBC estimates that the funds’ actual transfers to Madoff
Securities minus their actual withdrawals from Madoff Securities during the time that HSBC serviced the funds totalled approximately US$4bn. Plaintiffs (including funds, fund investors, and the Madoff Securities trustee) have commenced Madoff-related proceedings against numerous defendants in a multitude of jurisdictions. Various HSBC companies have been named as defendants in suits in the US, Ireland, Luxembourg and other jurisdictions. Certain suits (which included four US putative class actions) allege that the HSBC defendants knew or should have known of Madoff’s fraud and breached various duties to the funds and fund investors.
In November 2011, the US District Court Judge overseeing three related putative class actions in the Southern District of New York dismissed all claims against the HSBC defendants onforum non conveniens grounds, but temporarily stayed this ruling as to one of the actions against the HSBC defendants – the claims of investors in Thema International Fund plc – in light of a proposed amended settlement agreement, pursuant to which, subject to various conditions, the HSBC defendants had agreed to pay from US$52.5m up to a maximum of US$62.5m. In December 2011, the court lifted this temporary stay and dismissed all remaining claims against the HSBC defendants, and declined to consider preliminary approval of the settlement. In light of the court’s decisions, HSBC terminated the settlement agreement. The Thema plaintiff contests HSBC’s right to terminate. Plaintiffs in all three actions have filed notices of appeal to the US Court of Appeals for the Second Circuit. Briefing in that appeal was completed in September 2012; oral argument is expected in early 2013.
In November and December 2012, HSBC settled two of the individual claims commenced by investors in Thema International Fund plc against HSBC in the Irish High Court.
In December 2010, the Madoff Securities trustee commenced suits against various HSBC companies in the US Bankruptcy Court and in the English High Court. The US action (which also names certain funds, investment managers, and other entities and individuals) sought US$9bn in damages and additional recoveries from HSBC and the various co-defendants. It sought damages against HSBC for allegedly aiding and abetting Madoff’s fraud and breach of fiduciary duty. In July 2011, after withdrawing the case from the Bankruptcy Court in order to decide certain threshold issues, the US District Court Judge dismissed the trustee’s various common law claims on the grounds that the trustee lacks standing to assert them. In December 2011, the trustee filed a notice of appeal to the US Court of
122c
Table of Contents
HSBC HOLDINGS PLC
Report of the Directors: Operating and Financial Review(continued)
Appeals for the Second Circuit. Briefing in that appeal was completed in April 2012, and oral argument was held in November 2012. A decision is expected in 2013.
The District Court returned the remaining claims to the US Bankruptcy Court for further proceedings. Those claims seek, pursuant to US bankruptcy law, recovery of unspecified amounts received by HSBC from funds invested with Madoff, including amounts that HSBC received when it redeemed units HSBC held in the various funds. HSBC acquired those fund units in connection with financing transactions HSBC had entered into with various clients. The trustee’s US bankruptcy law claims also seek recovery of fees earned by HSBC for providing custodial, administration and similar services to the funds. Between September 2011 and April 2012, the HSBC defendants and certain other defendants moved again to withdraw the case from the Bankruptcy Court. The District Court granted those withdrawal motions as to certain issues, and briefing and oral arguments on the merits of the withdrawn issues are now complete. The District Court has issued rulings on two of the withdrawn issues, but decisions with respect to all other issues are still pending and are expected in early 2013.
The trustee’s English action seeks recovery of unspecified transfers of money from Madoff Securities to or through HSBC, on the grounds that the HSBC defendants actually or constructively knew of Madoff’s fraud. HSBC has not been served with the trustee’s English action.
Between October 2009 and April 2012, Fairfield Sentry Limited, Fairfield Sigma Limited and Fairfield Lambda Limited (‘Fairfield’), funds whose assets were directly or indirectly invested with Madoff Securities, commenced multiple suits in the British Virgin Islands (‘BVI’) and the US against numerous fund shareholders, including various HSBC companies that acted as nominees for clients of HSBC’s private banking business and other clients who invested in the Fairfield funds. The Fairfield actions seek restitution of amounts paid to the defendants in connection with share redemptions, on the ground that such payments were made by mistake, based on inflated values resulting from Madoff’s fraud, and some actions also seek recovery of the share redemptions under BVI insolvency law. The actions in the US are currently stayed in the Bankruptcy Court pending developments in related appellate litigation in the BVI.
There are many factors which may affect the range of possible outcomes, and the resulting financial impact, of the various Madoff-related
proceedings, including but not limited to the circumstances of the fraud, the multiple jurisdictions in which the proceedings have been brought and the number of different plaintiffs and defendants in such proceedings. For these reasons, among others, it is not practicable at this time for HSBC to estimate reliably the aggregate liabilities, or ranges of liabilities, that might arise as a result of all such claims but they could be significant. In any event, HSBC considers that it has good defences to these claims and will continue to defend them vigorously.
US mortgage-related investigations
In April 2011, HSBC Bank USA entered into a consent cease and desist order with the Office of the Comptroller of the Currency and HSBC Finance and HSBC North America Holdings Inc. (‘HNAH’) entered into a similar consent order with the Federal Reserve Board following completion of a broad horizontal review of industry residential mortgage foreclosure practices. These consent orders require prescribed actions to address the deficiencies noted in the joint examination and described in the consent orders. HSBC Bank USA, HSBC Finance and HNAH continue to work with the Office of the Comptroller of the Currency and the Federal Reserve Board to align their processes with the requirements of the consent orders and are implementing operational changes as required.
These consent orders required an independent review of foreclosures (the ‘Independent Foreclosure Review’) pending or completed between January 2009 and December 2010 to determine if any customer was financially injured as a result of an error in the foreclosure process. As required by the consent orders, an independent consultant was retained to conduct that review.
On 28 February 2013, HSBC Bank USA entered into an agreement with the Office of the Comptroller of the Currency, and HSBC Finance and HNAH entered into an agreement with the Federal Reserve Board, pursuant to which the Independent Foreclosure Review will cease and we will make a cash payment of US$96m into a fund that will be used to make payments to borrowers that were in active foreclosure during 2009 and 2010, and in addition, will provide other assistance (e.g. loan modifications) to help eligible borrowers. These actions form HSBC’s portion of a larger agreement announced by the Federal Reserve Board and the Office of the Comptroller of the Currency in January 2013 involving HSBC and twelve other mortgage servicers subject to foreclosure consent orders pursuant to which the mortgage servicers would pay, in the aggregate, in excess of US$9.3bn in cash
122d
Table of Contents
HSBC HOLDINGS PLC
Report of the Directors: Operating and Financial Review(continued)
payments and other assistance to help eligible borrowers. Pursuant to these agreements, the Independent Foreclosure Reviews will cease and be replaced by a broader framework under which all eligible borrowers will receive compensation regardless of whether they filed a request for independent review of their foreclosure and regardless of whether the borrower was financially injured as a result of an error in the foreclosure process. Borrowers who receive compensation will not be required to execute a release or waiver of rights and will not be precluded from pursuing litigation concerning foreclosure or other mortgage servicing practices. For participating servicers, including HSBC Bank USA and HSBC Finance, fulfilment of the terms of these agreements will satisfy the Independent Foreclosure Review requirements of these consent orders. These consent orders do not preclude additional enforcement actions against HSBC Bank USA, HSBC Finance or HNAH by bank regulatory, governmental or law enforcement agencies, such as the US Department of Justice (‘DoJ’) or State Attorneys General, which could include the imposition of civil money penalties and other sanctions relating to the activities that are the subject of the consent orders. Pursuant to the agreement with the Office of the Comptroller of the Currency, however, the Office of the Comptroller of the Currency has agreed that it will not assess civil money penalties or initiate any further enforcement action with respect to past mortgage servicing and foreclosure-related practices addressed in the consent orders, provided the terms of the agreement are fulfilled. The Office of the Comptroller of the Currency’s agreement not to assess civil money penalties is further conditioned on HSBC North America making payments or providing borrower assistance pursuant to any agreement that may be entered into with the DoJ in connection with the servicing of residential mortgage loans within two years. The Federal Reserve Board has agreed that any assessment of civil money penalties by the Federal Reserve Board will reflect a number of adjustments, including amounts expended in consumer relief and payments made pursuant to any agreement that may be entered into with the DoJ in connection with the servicing of residential mortgage loans. In addition, the agreement does not preclude private litigation concerning these practices.
Separate from the consent orders and settlement related to the Independent Foreclosure Review discussed above, it has been announced that the five largest US mortgage servicers (not including HSBC Group companies) have reached a settlement with the DoJ, the US Department of Housing and Urban Development and State Attorneys General of 49
states with respect to foreclosure and other mortgage servicing practices. HNAH, HSBC Bank USA and HSBC Finance have had discussions with US bank regulators and other governmental agencies regarding a potential resolution, although the timing of any settlement is not presently known. HSBC recognised provisions of US$257m in 2011 to reflect the estimated liability associated with a proposed settlement of this matter. Any such settlement, however, may not completely preclude other enforcement actions by state or federal agencies, regulators or law enforcement bodies related to foreclosure and other mortgage servicing practices, including, but not limited to matters relating to the securitisation of mortgages for investors. In addition, such a settlement would not preclude private litigation concerning these practices.
Participants in the US mortgage securitisation market that purchased and repackaged whole loans have been the subject of lawsuits and governmental and regulatory investigations and inquiries, which have been directed at groups within the US mortgage market, such as servicers, originators, underwriters, trustees or sponsors of securitisations, and at particular participants within these groups. As the industry’s residential mortgage foreclosure issues continue, HSBC Bank USA has taken title to an increasing number of foreclosed homes as trustee on behalf of various securitisation trusts. As nominal record owner of these properties, HSBC Bank USA has been sued by municipalities and tenants alleging various violations of law, including laws regarding property upkeep and tenants’ rights. While HSBC believes and continues to maintain that the obligations at issue and the related liability are properly those of the servicer of each trust, HSBC continues to receive significant and adverse publicity in connection with these and similar matters, including foreclosures that are serviced by others in the name of ‘HSBC, as trustee’.
HSBC Bank USA and HSBC Securities (USA) Inc. have been named as defendants in a number of actions in connection with residential mortgage-backed securities (‘RMBS’) offerings, which generally allege that the offering documents for securities issued by securitisation trusts contained material misstatements and omissions, including statements regarding the underwriting standards governing the underlying mortgage loans. These include an action filed in September 2011 by the Federal Housing Finance Agency (‘FHFA’). This action is one of a series of similar actions filed against 17 financial institutions alleging violations of federal and state securities laws in connection with the sale of private-label RMBS purchased by Fannie
122e
Table of Contents
HSBC HOLDINGS PLC
Report of the Directors: Operating and Financial Review(continued)
Mae and Freddie Mac, primarily from 2005 to 2008. This action, along with all of the similar FHFA RMBS actions, was transferred to a single judge, who directed the defendant in the first-filed matter to file a motion to dismiss. In May 2012, the District Court filed its decision denying the motion to dismiss FHFA’s securities law claims and granting the motion to dismiss FHFA’s negligent misrepresentation claims. The District Court’s ruling will form the basis for rulings on the other matters, including the action filed against HSBC Bank USA and HSBC Securities (USA) Inc. Subsequently, the defendant in the first-filed matter sought leave to appeal to the US Court of Appeals for the Second Circuit on certain issues raised in the motion to dismiss. The District Court and the Court of Appeals granted the request for leave to appeal, and this appeal is pending before the Court of Appeals. In December 2012, the District Court directed the parties to schedule mediation with the Magistrate Judge assigned to this action. However, mediation has not yet been scheduled.
In 2012, HSBC Finance received notice of several claims from claimants related to its activities as sponsor and the activities of its subsidiaries as originators in connection with RMBSs purchased between 2005 and 2007. The claims are currently being evaluated and discussions continue to be held with the claimants, but it has not been concluded that these claims are procedurally or substantively valid. In December 2010 and February 2011, HSBC Bank USA has received subpoenas from the SEC seeking production of documents and information relating to its involvement and the involvement of its affiliates in specified private label RMBS transactions as an issuer, sponsor, underwriter, depositor, trustee, custodian or servicer. HSBC Bank USA has also had preliminary contacts with other government authorities exploring the role of trustees in private label RMBS transactions. In February 2011, HSBC Bank USA also received a subpoena from the US Attorney’s Office, Southern District of New York seeking production of documents and information relating to loss mitigation efforts with respect to residential mortgages in the State of New York. In January 2012, HSBC Securities (USA) Inc. was served with a Civil Investigative Demand from the Massachusetts State Attorney General seeking documents, information and testimony related to the sale of RMBS to public and private customers in the State of Massachusetts from January 2005 to the present.
HSBC expects this level of focus will continue and, potentially, intensify, so long as the US real estate markets continue to be distressed. As a result,
HSBC Group companies may be subject to additional claims, litigation and governmental and regulatory scrutiny related to its participation in the US mortgage securitisation market, either individually or as a member of a group. HSBC is unable to estimate reliably the financial effect of any action or litigation relating to these matters. As situations develop it is possible that any related claims could be significant.
Anti-money laundering and sanctions-related
In October 2010, HSBC Bank USA entered into a consent cease and desist order with the Office of the Comptroller of the Currency and the indirect parent of that company, HNAH, entered into a consent cease and desist order with the Federal Reserve Board (the ‘Orders’). These Orders required improvements to establish an effective compliance risk management programme across the Group’s US businesses, including various issues relating to US Bank Secrecy Act (‘BSA’) and anti-money laundering (‘AML’) compliance. Steps continue to be taken to address the requirements of the Orders to ensure compliance, and that effective policies and procedures are maintained.
In addition, in December 2012, HSBC, HNAH and HSBC Bank USA entered into agreements to achieve a resolution with US and UK government agencies that have investigated HSBC’s conduct related to inadequate compliance with anti-money laundering, BSA and sanctions laws, including the previously reported investigations by the DoJ, the Federal Reserve, the Office of the Comptroller of the Currency and the US Department of Treasury’s Financial Crimes Enforcement Network (‘FinCEN’) in connection with AML/BSA compliance, including cross-border transactions involving our cash handling business in Mexico and banknotes business in the US, and the DoJ, the New York County District Attorney’s Office, the Office of Foreign Assets Control (‘OFAC’), the Federal Reserve and the Office of the Comptroller of the Currency regarding historical transactions involving Iranian parties and other parties subject to OFAC economic sanctions. As part of the resolution, HSBC entered into a deferred prosecution agreement among HSBC, HSBC Bank USA, the DoJ, the United States Attorney’s Office for the Eastern District of New York, and the United States Attorney’s Office for the Northern District of West Virginia (the ‘US DPA’), and a deferred prosecution agreement with the New York County District Attorney, and consented to a cease and desist order and, along with HNAH, consented to a monetary penalty order with the
122f
Table of Contents
HSBC HOLDINGS PLC
Report of the Directors: Operating and Financial Review(continued)
Federal Reserve. In addition, HSBC Bank USA entered into the US DPA, an agreement and consent orders with the Office of the Comptroller of the Currency, and a consent order with FinCEN. HSBC also entered into an undertaking with the UK Financial Services Authority (‘FSA’) to comply with certain forward-looking obligations with respect to anti-money laundering and sanctions requirements over a five-year term.
Under these agreements, HSBC and HSBC Bank USA made payments totalling US$1,921m to US authorities and will continue to cooperate fully with US and UK regulatory and law enforcement authorities and take further action to strengthen their compliance policies and procedures. Over the five-year term of the agreement with the DoJ and FSA, an independent monitor (who will, for FSA purposes, be a ‘skilled person’ under Section 166 of the Financial Services and Markets Act (‘FSMA’)) will evaluate HSBC’s progress in fully implementing these and other measures it recommends, and will produce regular assessments of the effectiveness of HSBC’s compliance function. If HSBC fulfils all of the requirements imposed by the US DPA and other agreements, the DOJ’s charges against it will be dismissed at the end of the five-year period. The US DPA remains subject to certain proceedings before the United States District Court for the Eastern District of New York. The DoJ or the New York County District Attorney’s Office may prosecute HSBC in relation to the matters which are the subject of the US DPA if HSBC breaches the terms of the US DPA.
Steps continue to be taken to address the requirements of the US DPA and the FSA undertaking to ensure compliance, and that effective policies and procedures are maintained. In addition, the settlement with regulators does not preclude private litigation relating to, among other things, HSBC’s compliance with applicable anti-money laundering, BSA and sanctions laws.
In July 2012, HSBC Mexico paid a fine imposed by the Mexican National Banking and Securities Commission amounting to 379m Mexican pesos (approximately US$28m), in connection with non-compliance with anti-money laundering systems and controls.
US tax and broker-dealer investigations
HSBC continues to cooperate in ongoing investigations by the DoJ and the US Internal Revenue Service regarding whether certain Group companies and employees acted appropriately in relation to certain customers who had US tax
reporting requirements. In connection with these investigations, HSBC Private Bank Suisse SA, with due regard for Swiss law, has produced records and other documents to the DoJ and is cooperating with the investigation. Other HSBC entities are also cooperating with the relevant US authorities, including with respect to US-based clients of an HSBC Group company in India.
In April 2011, HSBC Bank USA received a summons from the US Internal Revenue Service directing HSBC Bank USA to produce records with respect to US-based clients of an HSBC Group company in India. HSBC Bank USA has cooperated fully by providing responsive documents in its possession in the US to the US Internal Revenue Service.
Also in April 2011, HSBC Bank USA received a subpoena from the SEC directing HSBC Bank USA to produce records in the US related to, among other things, HSBC Private Bank Suisse SA’s cross-border policies and procedures and adherence to US broker-dealer and investment adviser rules and regulations when dealing with US resident clients. HSBC Bank USA continues to cooperate with the SEC. HSBC Private Bank Suisse SA has also produced records and other documents to the SEC and is cooperating with the SEC’s investigation.
Based on the facts currently known in respect of each of these investigations, there is a high degree of uncertainty as to the terms on which the ongoing investigations will be resolved and the timing of such resolution, including the amounts of any fines and/or penalties. As matters progress, it is possible that any fines and/or penalties could be significant.
Investigations and reviews into the setting of London interbank offered rates, European interbank offered rates and other benchmark interest and foreign exchange rates
Various regulators and competition and enforcement authorities around the world including in the UK, the US, Canada, the EU, Switzerland and Asia, are conducting investigations and reviews related to certain past submissions made by panel banks and the processes for making submissions in connection with the setting of London interbank offered rates (‘Libor’), European interbank offered rates (‘Euribor’) and other benchmark interest and foreign exchange rates. Several of these panel banks have reached settlements with various regulatory authorities. As certain HSBC entities are members of such panels, HSBC and/or its subsidiaries have been the subject of regulatory demands for information and are cooperating with those investigations and
122g
Table of Contents
HSBC HOLDINGS PLC
Report of the Directors: Operating and Financial Review(continued)
reviews. Based on the facts currently known, there is a high degree of uncertainty as to the resolution of these regulatory investigations and reviews, including the timing. The potential impact and size of any fines or penalties that could be imposed on HSBC cannot be measured reliably.
In addition, HSBC and other panel banks have been named as defendants in private lawsuits filed in the US with respect to the setting of Libor, including putative class action lawsuits which have been consolidated before the US District Court for the Southern District of New York. The complaints in those actions assert claims against HSBC and other panel banks under various US laws including US antitrust laws, the US Commodities Exchange Act, and state law. Based on the facts currently known, it is not practicable at this time for HSBC to predict the resolution of these private lawsuits, including the timing and potential impact on HSBC.
122h
Table of Contents
HSBC HOLDINGS PLC
Report of the Directors: Operating and Financial Review(continued)
(Unaudited)
With listings of its ordinary shares in London, Hong Kong, New York, Paris and Bermuda, HSBC Holdings complies with the relevant requirements for listing and trading on each of these exchanges. In the UK, these are the Listing Rules of the Financial Services Authority (‘FSA’); in Hong Kong, The Rules Governing the Listing of Securities on The Stock Exchange of Hong Kong Limited (‘HKSE’); in the US, where the shares are traded in the form of ADSs, HSBC Holdings’ shares are registered with the US Securities and Exchange Commission (‘SEC’). As a consequence of its US listing, HSBC Holdings is also subject to the reporting and other requirements of the US Securities Act of 1933, as amended, the Securities Exchange Act of 1934, as amended, and the New York Stock Exchange’s (‘NYSE’) Listed Company Manual, in each case as applied to foreign private issuers. In France and Bermuda, HSBC Holdings is subject to the listing rules of Euronext, Paris and the Bermuda Stock Exchange respectively, applicable to companies with secondary listings.
A statement of our compliance with the provisions of the UK Corporate Governance Code issued by the Financial Reporting Council and with the Hong Kong Corporate Governance Code (formerly the Code on Corporate Governance Practice in Appendix 14 to the Rules Governing the Listing of Securities on The Stock Exchange of Hong Kong Limited) is set out in the ‘Report of the Directors: Corporate Governance’ on page 301.
Our operations throughout the world are regulated and supervised by over 450 different central banks and other regulatory authorities in those jurisdictions in which we have offices, branches or subsidiaries. These authorities impose a variety of requirements and controls designed to provide financial stability, transparency in financial markets and a contribution to economic growth. These regulations and controls cover,inter alia, capital adequacy, depositor protection, market liquidity, governance standards, customer protection (for example, fair lending practices, product design and marketing and documentation standards), and social responsibility obligations (for example, anti-money laundering, anti-bribery and corruption, and anti-terrorist financing measures). In addition, a number of countries in which we operate impose rules that affect, or place limitations on, foreign or foreign-owned or controlled banks and financial institutions. The rules include restrictions on the opening of local offices, branches or subsidiaries and the types of banking and non-banking activities that
may be conducted by those local offices, branches or subsidiaries; restrictions on the acquisition of local banks or regulations requiring a specified percentage of local ownership; and restrictions on investment and other financial flows entering or leaving the country. Country supervisory and regulatory regimes will determine to some degree our ability to expand into new markets, the services and products that we will be able to offer in those markets and how we structure specific operations. As a result of government interventions in response to global economic conditions, there has been (and it is expected that there will continue to be) a substantial increase in government regulation and supervision of the financial services industry, including the imposition of higher capital and liquidity requirements, heightened disclosure standards and restrictions on certain types of products or transaction structures.
The FSA supervises the Group on a consolidated basis and it has certain limited direct supervisory powers over our holding company, HSBC Holdings. In addition, each operating bank, finance company or insurance operation within HSBC is regulated by local supervisors. The primary regulatory authorities are those in the UK, Hong Kong and the US, our principal jurisdictions of operation. However, and in addition, the European Banking Authority, the European Insurance and Occupational Pensions Authority and the European Securities and Markets Authority, as the three European supervisory authorities, are also likely to have greater influence on the supervisory agenda and regulatory approach across the EU. Developments in the EU could lead to changes in how we are regulated and supervised on a day-to-day basis as each of these authorities develops its powers having regard to some of the regulatory initiatives highlighted in this report.
UK regulation and supervision
UK banking and financial services institutions are subject to multiple regulations. The primary UK statute in this context is the Financial Services and Markets Act 2000 (‘FSMA’). Other UK financial services legislation includes that derived from EU directives relating to banking, securities, insurance, investments and sales of personal financial services.
In addition to its role as our lead regulator, the FSA is responsible for authorising and supervising all our operating businesses in the UK which require authorisation under FSMA. These include deposit-taking, retail banking, life and general insurance, pensions, investments, mortgages, custody and share-dealing businesses and treasury and capital
122i
Table of Contents
HSBC HOLDINGS PLC
Report of the Directors: Operating and Financial Review(continued)
markets activity. HSBC Bank is our principal authorised institution in the UK.
FSA rules establish the minimum criteria for the authorisation of banks and financial services businesses in the UK and the FSA has the right to object, on prudential grounds, to persons who hold, or intend to hold, 10% or more of the voting power or shares of a financial institution that it regulates, or of its parent undertaking. It also sets out reporting (and, as applicable, consent) requirements with regard to large individual exposures and large exposures to related borrowers. In its capacity as our supervisor on a consolidated basis, the FSA receives information on the capital adequacy of, and sets requirements for, the Group as a whole. Individual banking subsidiaries are directly regulated by their local banking supervisors, who set and monitor,inter alia, their capital adequacy requirements.
We calculate capital at a Group level using the Basel II framework of the Basel Committee on Banking Supervision. However, local regulators are at different stages of implementation of this framework and also of the updated Basel III requirements and as such, local reporting may differ. In most jurisdictions, non-banking financial subsidiaries are also subject to the supervision and capital requirements of local regulatory authorities.
Basel II is structured around three ‘pillars’: minimum capital requirements, supervisory review process and market discipline. The Capital Requirements Directive (‘CRD’) implemented Basel II in the EU and the FSA then gave effect to the CRD by including the EU’s requirements in its own rulebooks. Further information on developments relevant to our prudential regulatory framework is set out in ‘Future developments’ on page 291.
The FSA monitors authorised institutions through ongoing supervision and the review of routine andad hoc reports relating to financial, prudential and conduct of business matters. The FSA may also obtain independent reports from a skilled person on the adequacy of procedures and systems covering internal control and governing records and accounting. The FSA meets regularly with our senior executives to discuss our adherence to the FSA’s prudential guidelines. In addition, it regularly discusses fundamental matters relating to our business in the UK and internationally, including areas such as strategic and operating plans, risk control, loan portfolio composition and organisational changes, including succession planning and recovery and resolution arrangements. During the year, we also participated in and satisfied
various regulator-required stress tests. With the rapid pace of regulatory change and market conditions, we continue to experience a high level of ongoing interaction with the FSA.
The UK financial services regulatory structure is currently in the process of substantial reform and legislation has been passed to abolish the FSA and establish three new regulatory bodies from 1 April 2013. These three bodies will comprise the Financial Policy Committee (‘FPC’), the Prudential Regulation Authority (‘PRA’) and the Financial Conduct Authority (‘FCA’) under the control of the Bank of England (‘BoE’). The FPC will not directly supervise firms, being responsible for macro-prudential regulation and considering systemic risks affecting economic and financial stability. The PRA and the FCA will inherit the majority of the FSA’s existing functions as the micro-prudential supervisors. Some subsidiaries such as HSBC Bank will be a ‘dual-regulated’ firm, subject to prudential regulation by the PRA and to conduct regulation by the FCA. Within these reforms, the new regulatory bodies will gain additional powers. For example, under certain circumstances, the PRA and FCA will be able to issue directions to unregulated qualifying parent undertakings such as HSBC Holdings.
FSMA is being substantially revised, to reflect these regulatory reforms.
The FPC will have powers to give a direction to the FCA or the PRA on the exercise of their supervisory powers, and it may make recommendations within the BoE, to the Treasury, to the FCA or the PRA or to ‘other persons’. The UK Government is also proposing to make the FPC responsible for decisions on the countercyclical capital buffer (‘CCB’), a Basel III global requirement, to be applied to certain financial institutions in the United Kingdom. The CCB is a macro-prudential tool at the disposal of national authorities that can be deployed when the FPC judges that threats to financial stability have arisen in the UK increasing system-wide risk, and to protect the banking sector from future potential losses. Should a CCB be required, it is expected to be held in the range of 0-2.5%.
It is also planned to give the FPC direction power, under the new legislation, over sectoral capital requirements (‘SCR’s). The SCR tool would allow the FPC to change capital requirements above minimum regulatory standards on exposures held by all UK banks to three broad sectors judged to pose a risk to the system as a whole (residential property, including mortgages; commercial property; and exposures to the financial sector), as well as more
122j
Table of Contents
HSBC HOLDINGS PLC
Report of the Directors: Operating and Financial Review(continued)
granular sub-sectors (for example, to mortgages with high loan-to-value or loan-to-income ratios at origination). This will include both banking book and trading book exposures and be irrespective of the domicile of the ultimate borrower.
The CCB and SCR tools are stated as broad tools designed to reduce the likelihood and severity of financial crises, their primary purpose being to tackle cyclical risks. Both tools provide the FPC with means to increase the amount of capital that banks must have when threats to financial stability are judged to be emerging. However the amount of potential capital add-ons for SCR has not been quantified.
There is also the proposal for a systemic risk buffer for the banking system as a whole (or a subset thereof) to mitigate structural macro prudential risk.
There are a substantial number of other ongoing regulatory initiatives affecting the Group, driven by or from the UK. These include the UK bank levy, ongoing rule making regarding remuneration and recovery and resolution plans (‘RRP’) and the implementation of the recommendations of the UK Independent Commission on Banking (‘ICB’).
Legislation in respect of the UK bank levy was substantively enacted in July 2011, in the form of the Finance Act 2011 and the levy has been applied since January 2011. HSBC is a UK banking group for these purposes and the UK levy is chargeable on the Group’s consolidated balance sheet at the year end. A charge of US$571m for the UK bank levy has been recognised in 2012 of which US$295m related to non-UK banking activity.
The Financial Services Act 2010 (amongst other things), empowered the FSA to make rules about remuneration requiring all authorised firms to operate a remuneration policy which is consistent with the effective management of risks and the Financial Stability Board’s (‘FSB’) ‘Implementation Standards for Principles for Sound Compensation Practices’. In 2011, the FSA implemented the requirements of CRD III, which requires certain financial institutions, including banks and investment firms, to have in place remuneration policies that are consistent with effective risk management. While not changed in 2012, these requirements may be updated in 2013 by CRD IV, which remains subject to discussion and the timetable for finalisation and implementation is uncertain. In addition to the rules required by the FSA for the Group, individual legal entities may also be subject to their own local requirements.
The Financial Services Act 2010 also empowered the FSA to make rules requiring authorised firms to prepare and keep up-to-date RRP. During 2012, the FSA set out the rules for the RRP for HSBC on a Group basis, with additional requirements specific to HSBC Bank. These rules may be amended by the European Recovery and Resolution Directive, a draft of which was published in June 2012, but this remains subject to discussion. In December 2012, the European Council called for the Council of the EU to reach agreement on the RRP by March 2013. In addition to the rules required by the FSA for the Group, individual legal entities may also be subject to their own local requirements.
The ICB published its final report in September 2011 and the UK Government expressed broad approval for the principle of establishing a ring-fenced bank for retail banking activities and greater loss absorbing capacity. The UK Government subsequently undertook two stages of consultation on the ICB proposals during 2012. Draft primary legislation was presented to the UK’s Parliamentary Commission on Banking Standards for pre-legislative scrutiny and they presented their initial findings on 21 December 2012. The UK Government is now considering if its original proposal should be adjusted in the light of those findings. The draft legislation did not incorporate many of the details set out in the final report from the ICB nor adjustments arising from the subsequent consultations. These details may be reflected in secondary legislation and underlying rules from supervisory authorities.
In respect of UK universal banks, including HSBC’s major UK banking subsidiary, HSBC Bank, the ICB has proposed a separation of the UK retail and wholesale banking operations through the creation of a ring-fenced retail bank. A requirement is that all deposits and overdrafts for UK personal customers and smaller companies and payments services should be provided by this ring-fenced bank but it could also include banking services for larger customers. The UK Government also proposed that some simpler hedging activities could be undertaken within this bank.
In addition, the ICB proposed that large UK-headquartered Groups (which would include HSBC) should have primary loss-absorbing capacity (‘PLAC’) equal to at least 17% of RWAs calculated under Basel III. This capacity should be satisfied by issuance of additional equity and/or debt that is loss-absorbing at the point of non-viability. The UK supervisor would retain the power to increase this minimum loss-absorbing capacity if it had concerns
122k
Table of Contents
HSBC HOLDINGS PLC
Report of the Directors: Operating and Financial Review(continued)
about the ability of the bank to restructure or liquidate at the point of failure.
The Government has indicated that if a large UK-headquartered Group has non-UK subsidiaries which are demonstrably resolvable without an adverse effect on UK financial stability, they would be excluded from the calculation of the higher PLAC requirement.
The ICB also recommended that a large ring-fenced bank should be required to maintain an equity ‘ring-fence buffer’ of at least 10% of RWAs, and the minimum leverage ratio of equity-to-total assets, as proposed under Basel III should be increased from 3.0% to 4.06% for larger banks. The UK Government has, however, proposed that the leverage ratio should revert to the original Basel III proposals.
If the proposals described above are adopted substantially in the form prescribed, major changes to our corporate structure and business activities conducted in the UK through HSBC Bank might be required. The changes would include separating the ring-fenced bank from the existing UK incorporated universal bank. The proposals would take an extended period of time to implement and would significantly increase our costs, both from implementation and from running our operations as restructured.
At a national level in the UK, other relevant regulatory initiatives include the FSA’s Retail Distribution and Mortgage Market Reviews and an ever greater focus on ‘conduct risk’ including attention to sales processes and incentives, product and investment suitability and conduct of business concerns more generally. Uncertainty remains about the details and timing of some of these reforms and the effect they will ultimately have on HSBC.
These measures are concerned principally, but not exclusively, with the conduct of business with retail customers and in conjunction with this focus, the UK regulators are making increasing use of existing and new powers of intervention and enforcement, including powers to consider past business undertaken and implement customer compensation and redress schemes or other, potentially significant remedial work. Additionally, the UK and other regulators may increasingly take actions in response to customer complaints either specific to an institution or, more generally, in relation to a particular product. We have seen recent examples of this approach in the context of the mis-selling of payment protection insurance and of interest rate derivative products to SME.
The UK and other regulators may identify future industry-wide mis-selling or other issues that could affect the Group. This may lead from time to time to: (i) significant direct costs or liabilities (including in relation to mis-selling); and (ii) changes in the practices of such businesses which benefit customers at a cost to shareholders. Further, decisions taken in the UK by the Financial Ombudsman Service in relation to customer complaints (or any overseas equivalent that has jurisdiction) could, if applied to a wider class or grouping of customers, have a material adverse effect on the operating results, financial condition and prospects of the Group.
Hong Kong regulation and supervision
Banking in Hong Kong is subject to the provisions of the Banking Ordinance and to the powers, functions and duties ascribed by the Banking Ordinance to the Hong Kong Monetary Authority (the ‘HKMA’). The principal function of the HKMA is to promote the general stability and effective working of the banking system in Hong Kong. The HKMA is responsible for supervising compliance with the provisions of the Banking Ordinance. The Banking Ordinance gives power to the Chief Executive of Hong Kong to give directions to the HKMA and the Financial Secretary with respect to the exercise of their respective functions under the Banking Ordinance.
The HKMA has responsibility for authorising banks, and has discretion to attach conditions to its authorisation. The HKMA requires that banks or their holding companies file regular prudential returns, and holds regular discussions with the management of the banks to review their operations. The HKMA may also conduct ‘on-site’ examinations of banks and, in the case of banks incorporated in Hong Kong, of any local and overseas branches and subsidiaries. The HKMA requires all authorised institutions to have adequate systems of internal control and requires the institutions’ external auditors, upon request, to report on those systems and other matters such as the accuracy of information provided to the HKMA. In addition, the HKMA may from time to time conduct tripartite discussions with banks and their external auditors.
The HKMA has the power to serve a notice of objection on persons if they are no longer deemed to be fit and proper to be controllers of the bank, if they may otherwise threaten the interests of depositors or potential depositors, or if they have contravened any conditions specified by the HKMA. The HKMA may revoke authorisation in the event of an institution’s non-compliance with the provisions of the Banking Ordinance. These provisions require, among other
122l
Table of Contents
HSBC HOLDINGS PLC
Report of the Directors: Operating and Financial Review(continued)
things, the furnishing of accurate reports. The HKMA has implemented Basel II for all authorised institutions incorporated in Hong Kong and subsequently adopted Basel III from 1 January 2013, implementing in accordance with the Basel Committee on Banking Supervision’s timetable, including transitional arrangements.
The marketing of, dealing in and provision of advice and asset management services in relation to securities in Hong Kong are subject to the provisions of the Securities and Futures Ordinance of Hong Kong. Entities engaging in activities regulated by the Ordinance are required to be licensed. The HKMA is the primary regulator for banks involved in the securities business, while the Securities and Futures Commission is the regulator for non-banking entities.
US regulation and supervision
We are subject to extensive federal and state supervision and regulation in the US. Banking laws and regulations of the Board of Governors of the Federal Reserve System (the ‘Federal Reserve Board’), the Office of the Comptroller of the Currency (the ‘OCC’) and the Federal Deposit Insurance Corporation (the ‘FDIC’) govern many aspects of our US business. Furthermore, since we have substantial operations outside the US which conduct many of their day-to-day transactions in US dollars which are ultimately cleared and settled in the US, HSBC entities’ operations outside the US are also subject to the extra-territorial effects of US regulation in many respects. The requirements of the Deferred Prosecution Agreement entered into by HSBC in December 2012 and described in this section under ‘Anti-money laundering and related regulation’ should also be noted in this context.
In July 2010, the US enacted the Dodd-Frank Wall Street Reform and Consumer Protection Act (‘Dodd-Frank’), which provides a broad framework for significant regulatory changes that will extend to almost every area of US financial regulation. The implementation of Dodd-Frank requires further detailed rulemaking over several years by different US regulators, including the Department of the Treasury, the Federal Reserve Board, the FDIC, the SEC, the Commodity Futures Trading Commission (‘CFTC’), the Financial Stability Oversight Council (‘FSOC’) and the Consumer Financial Protection Bureau (‘Consumer Bureau’). Notwithstanding the time that has passed since Dodd-Frank was enacted, substantial uncertainty remains about many of the final details, timing and impact of the rules.
The FSOC may take certain actions, including
precluding mergers, restricting financial products offered, restricting or terminating activities or imposing conditions on activities or requiring the sale or transfer of assets, against any bank holding company with assets greater than US$50bn that is found to pose a grave threat to financial stability. The FSOC is supported by the Office of Financial Research (‘OFR’) which may impose data reporting requirements on financial institutions. The cost of operating both the FSOC and OFR will be paid for through an assessment on large bank holding companies.
Over a transition period from 2013 to 2019, the Federal Reserve Board will apply more stringent capital and risk management requirements on bank holding companies such as HSBC North America Holdings Inc. (‘HNAH’), which will require a minimum leverage ratio of 4% and a minimum total risk-based capital ratio of 10.5%. Also, failure to maintain a ratio of tier 1 common equity to RWAs of greater than 5% in simulated stress conditions will restrict HNAH from engaging in capital distributions such as dividends or share repurchases. In addition, large bank holding companies such as HNAH (or their parent companies) are now required to file resolution plans identifying material subsidiaries and core business lines domiciled in the US, describing what strategy would be followed in the event of significant financial distress and including identifying how insured bank subsidiaries are adequately protected from risk created by other affiliates. The failure to cure deficiencies in a resolution plan would enable the US regulators to impose more stringent capital, leverage and liquidity requirements, restrict the growth, activities or operations of the company or, if such failure persists, require the company to divest assets or operations. The Federal Reserve Board has also proposed a series of increased supervisory standards to be followed by large bank holding companies, and certain foreign banking organisations that meet particular thresholds including required remediation in the event of failure to meet capital requirements, stress testing requirements and risk management standards. Under the proposals, the Federal Reserve would also be able to restrict the size and growth of systemically significant non-bank financial companies and large interconnected bank holding companies, and would be able to require foreign banking organisations deemed systemically significant to restructure their US operations. In addition, the Federal Reserve has proposed to impose a 15-to-1 debt-to-equity ratio limit on non-bank financial companies, bank holding companies and the US operations of foreign banking organisations that the FSOC determines to pose a
122m
Table of Contents
HSBC HOLDINGS PLC
Report of the Directors: Operating and Financial Review(continued)
grave threat to the financial stability of the United States.
HSBC and its US operations are subject to supervision, regulation and examination by the Federal Reserve Board because HSBC is a ‘bank holding company’ under the US Bank Holding Company Act of 1956 (‘BHCA’), as a result of its control of HSBC Bank USA, N.A., McLean, Virginia (‘HSBC Bank USA’); and HSBC Trust Company (Delaware), N.A., Wilmington, Delaware (‘HTCD’). HNAH is also a ‘bank holding company’. Both HSBC and HNAH have elected to be financial holding companies (‘FHC’s) pursuant to the provisions of the Gramm-Leach Bliley Act (the ‘GLB Act’) and, accordingly, may affiliate with securities firms and insurance companies and engage in other activities that are financial in nature or incidental or complementary to activities that are financial in nature.
Under regulations implemented by the Federal Reserve Board, if any financial holding company, or any depository institution controlled by a financial holding company, ceases to meet certain capital or management standards, the Federal Reserve Board may impose corrective capital and/or managerial requirements on the financial holding company and place limitations on its ability to conduct the broader financial activities permissible for financial holding companies. In addition, the Federal Reserve Board may require divestiture of the holding company’s depository institutions or its affiliates engaged in broader financial activities in reliance on the GLB Act if the deficiencies persist. The regulations also provide that if any depository institution controlled by a financial holding company fails to maintain a satisfactory rating under the Community Reinvestment Act of 1977, the Federal Reserve Board must prohibit the financial holding company and its subsidiaries from engaging in any additional activities other than those permissible for bank holding companies that are not financial holding companies.
As reflected in the agreement entered into with the OCC on December 11, 2012 (the ‘GLBA Agreement’), the OCC has determined that HSBC Bank USA is not in compliance with the requirements set forth in 12 U.S.C. § 24a(a)(2)(c) and 12 C.F.R. § 5.39(g)(1), which provide that a national bank and each depository institution affiliate of the national bank must be both well capitalised and well managed in order to own or control a financial subsidiary. As a result, HSBC Bank USA and its parent holding companies, including HSBC, no longer meet the qualification requirements for financial holding company status, and may not
engage in any new types of financial activities without the prior approval of the Federal Reserve Board. In addition, HSBC Bank USA may not directly or indirectly acquire control of, or hold an interest in, any new financial subsidiary, nor commence a new activity in its existing financial subsidiary, unless it receives prior approval from the OCC. If all of our affiliate US depositary institutions are not in compliance with these requirements within the time periods specified in the GLBA Agreement, as they may be extended, HSBC could be required either to divest HSBC Bank USA or to divest or terminate any financial activities conducted in reliance on the GLB Act. Similar consequences could result for subsidiaries of HSBC Bank USA that engage in financial activities in reliance on expanded powers provided for in the GLB Act. The GLBA Agreement requires HSBC Bank USA to take all steps necessary to correct the circumstances and conditions resulting in HSBC Bank USA’s noncompliance with the requirements referred to above. We have initiated steps to satisfy the requirements of the GLBA Agreement.
The two US banks, HSBC Bank USA and HTCD, are subject to regulation and examination primarily by the OCC, secondly by the FDIC, and by the Federal Reserve Board. Banking laws and regulations restrict many aspects of their operations and administration, including the establishment and maintenance of branch offices, capital and reserve requirements, deposits and borrowings, investment and lending activities, payment of dividends and numerous other matters. In addition, the FDIC requires FDIC-insured banks with US$50bn or more in total assets (such as HSBC Bank USA) to submit resolution plans that should enable the FDIC to resolve the bank in a manner that ensures that depositors receive access to their insured deposits within one business day of the institution’s failure (two business days if the failure occurs on a day other than Friday), maximises the value from the sale or disposition of its assets and minimises the amount of any loss to be realised by the institution’s creditors.
Large bank holding companies, including HNAH, became subject to the US rules adopted in 2007 that provided for the implementation of Basel II advanced approaches in the US. The US Basel II implementation timetable originally consisted of a parallel calculation period under the current regulatory capital regime (Basel I), followed by a three-year transitional ‘floor’ period, during which Basel II advance approaches risk-based capital requirements could not fall below certain floors based on Basel I regulations.
122n
Table of Contents
HSBC HOLDINGS PLC
Report of the Directors: Operating and Financial Review(continued)
In June 2011, the US banking agencies adopted final regulations to implement the ‘capital floor’ provision of the so-called ‘Collins Amendment’ of Dodd-Frank. These regulations eliminated the three-year transitional floor period in favour of a permanent floor based on the generally applicable risk-based capital rules (currently Basel I although the US banking agencies have proposed to replace Basel I with a modified version of the Basel II standarised approach beginning in 2015). Pursuant to these regulations, a banking organisation that has formally implemented the Basel II advanced approaches must calculate its capital requirements under Basel I and the Basel II advanced approaches, compare the two results, and then use the lower of such ratios for purposes of determining compliance with its minimum tier 1 capital and total risk-based capital requirements. Prior to adoption of the Basel II advanced approaches, HNAH is required to successfully complete a parallel run by measuring regulatory capital under both the new regulatory capital rules and the existing general risk-based rules for a period of at least four quarters. Successful completion of the parallel run period requires the approval of US regulators. We began the parallel run period, which encompasses enhancements to a number of risk policies, processes and systems to align HSBC Bank USA with the Basel II advanced approaches final rule requirements, in January 2010. The timing of receipt of US regulatory approval is uncertain.
The US banking agencies have published draft rules for the application of Basel III to US banking organisations but these have still to be finalised. As a result, the implementation did not commence on the original start date envisaged by the Basel Committee of 1 January 2013. In June 2012, the US banking agencies issued proposed rules that would (i) implement the Basel III capital framework in the United States; (ii) replace the current generally applicable risk-based capital rules (Basel I) with a modified version of the Basel II standarised approach; and (iii) remove from both the generally applicable risk-based rules and the Basel II advanced approaches rules all references to and reliance upon external credit ratings, as required under Dodd-Frank.
The US banking agencies announced in November 2012 that due to the number and complexity of the public comments received on these draft rules, the US would not meet the Basel Committee’s target of 1 January 2013 for implementation of the Basel III capital framework. A more detailed description of Basel III can be found in ‘Future developments’ on page 291.
Apart from the Basel II and Basel III rules regarding credit and operational risks, in June 2010, the Basel Committee agreed on certain revisions to the market risk capital framework (Basel 2.5) that would also result in additional capital requirements. In June 2011, the US banking agencies issued a final rule to amend the market risk capital rule to implement Basel 2.5 and the prohibition in Dodd-Frank on references to and reliance upon the use of external credit ratings in the US banking agencies’ regulations. The final market risk rule sets forth alternative methodologies to external credit ratings that must be used to determine the capital requirements applicable to certain debt and securitisation positions subject to the market risk capital rule. The US banking agencies have proposed similar methodologies in their June 2012 proposals to revise the generally applicable capital rules and the Basel II advanced approaches rules.
HSBC Bank USA and HTCD are subject to risk-based assessments from the FDIC, which insures deposits generally to a maximum of US$250,000 per depositor for domestic deposits. Dodd-Frank provides for unlimited deposit insurance for certain non-interest-bearing transaction accounts for the period to 31 December 2012. Due to projected shortfalls in the FDIC fund as a result of continuing bank failures, the FDIC required all insured banks, including HSBC Bank USA and HTCD, to prepay their insurance premium for the years 2010, 2011 and 2012.
Dodd-Frank changes the FDIC’s risk-based deposit insurance assessment framework primarily by basing assessments on an FDIC-insured institution’s total assets less tangible equity rather than US domestic deposits, which is expected to shift a greater portion of the aggregate assessments to large FDIC-insured institutions. The new large bank pricing system will result in higher assessment rates for banks with high-risk asset concentrations, less stable balance sheet liquidity, or potentially higher loss severity in the event of failure.
With effect from July 2013, Dodd-Frank and the applicable regulations of the OCC required that the lending limits applicable to HSBC Bank USA and HTCD take into account credit exposure from derivative transactions, securities borrowing and lending transactions, and repurchase and reverse repurchase agreements.
Our US consumer finance operations are subject to extensive state-by-state regulation in the US, and to laws relating to consumer protection (both in general, and in respect of sub-prime lending operations, which have been subject to enhanced
122o
Table of Contents
HSBC HOLDINGS PLC
Report of the Directors: Operating and Financial Review(continued)
regulatory scrutiny); discrimination in extending credit; use of credit reports; privacy matters; disclosure of credit terms; and correction of billing errors. They also are subject to regulations and legislation that limit operations in certain jurisdictions.
Additionally in July 2012, part of Dodd-Frank commonly referred to as the ‘Volcker Rule’, came into force. The Volcker Rule will limit the ability of companies related to a US bank (including HSBC group companies outside the US) to sponsor or invest in private equity or hedge funds or to engage in certain types of proprietary trading. This is subject to a two-year ‘conformance period’, although the detailed rules have yet to be finalised.
Dodd-Frank also provides regulators with tools to provide greater capital, leverage and liquidity requirements and other prudential standards, particularly for financial institutions that pose significant systemic risk. However, in imposing heightened capital, leverage, liquidity and other prudential standards on non-US banks, the Federal Reserve Board is directed to take into account the principle of national treatment and equality of competitive opportunity, and the extent to which the foreign bank is subject to comparable home country standards. As noted above, the Federal Reserve Board has issued draft enhanced supervisory standards that would apply to HSBC and the effect on HSBC is unclear.
Furthermore, Dodd-Frank provides for an extensive framework for the regulation of over-the-counter (‘OTC’) derivatives, including mandatory clearing, exchange trading and transaction reporting of certain OTC derivatives, as well as rules regarding the registration of swap dealers and major swap participants, and related capital, margin, business conduct, record keeping and other requirements applicable to such entities. These rules became effective in October 2012. Relevant Group companies are progressing applications for registration and we continue to assess how compliance with these new rules will affect our business.
Dodd-Frank also grants the SEC discretionary rule-making authority to impose a new fiduciary standard on brokers, dealers and investment advisers, and expands the extraterritorial jurisdiction of US courts over actions brought by the SEC or the US with respect to violations of the anti-fraud provisions in the Securities Act, the Securities Exchange Act of 1934 and the Investment Advisers Act of 1940. In addition, regulations which the FSOC, the Consumer Bureau or other regulators may adopt could affect the nature of the activities which our FDIC-insured
depository institution subsidiaries may conduct, and may impose restrictions and limitations on the conduct of such activities.
The ongoing implementation of Dodd-Frank and related final regulations could result in additional costs or limit or restrict the way we conduct our business, both in relation to our US operations and our non-US operations, although uncertainty remains about many of the details, impact and timing of these reforms and the ultimate effect they will have on HSBC.
Global and regional prudential and other regulatory developments
The Group is subject to regulation and supervision by a large number of regulatory bodies and other agencies. In addition to changes being pursued at a local level, changes are also being pursued globally through the actions of bodies such as the G-20, the FSB and Basel Committee, as well as regionally through the EU and similar. Key areas include the work of the FSB on global systemically important financial institutions (‘G-SIFI’s), the Basel Committee’s Basel III capital requirements, the EU’s measures to implement Basel III (referred to as ‘CRD IV’), and the EU’s proposed recovery and resolution framework.
Recovery and resolution
The FSB has been designated by the G-20 as the body responsible for coordinating the delivery of a global reform programme following the financial crisis, a key element of which is that no firm should be too big or too complicated to fail, and that taxpayers should not bear the cost of resolution. HSBC has been classified by the FSB as a G-SIFI and therefore will be subject to what the FSB refers to as a ‘multi-pronged and integrated set of policies’. These include proposals that would place an additional capital buffer on the Group and require enhanced reporting.
The FSB also determined that recovery and resolution strategies should be developed for all G-SIFIs. Recovery plans set out the actions which management may take during a period of stress to avoid the failure of the firm. Resolution plans are prepared by the authorities based on information provided by firms and set out the actions which may be taken if the firm reaches the point of non-viability. This work is led by the FSA and the Bank of England in the case of the consolidated Group in conjunction with the regulators of HSBC’s largest operating entities which make up the Crisis Management Group (‘CMG’) for HSBC.
122p
Table of Contents
HSBC HOLDINGS PLC
Report of the Directors: Operating and Financial Review(continued)
In accordance with guidance from the FSB and UK requirements, HSBC has produced a recovery plan for the Group, drawing together many of the actions contained in stress testing and scenario planning exercises conducted within the Group. The recovery plan identifies a series of early warning signals indicative of developing financial stress and establishes triggers which, if breached, would precipitate pre-planned but urgent action from the Group. The plan also contains a series of recovery options to raise additional capital or funding for the Group or individual entities as appropriate. These options would be reviewed for applicability and feasibility once the cause and magnitude of the financial stress was evident. This recovery plan has been submitted to the FSA and the Bank of England in the UK and through them discussed with the CMG.
HSBC has also provided the FSA, the Bank of England and CMG with information for them to determine a resolution strategy for the HSBC Group. The FSB notes that strategies could include a ‘single point of entry’ or ‘top down’ approach, where a group is resolved through intervention at the level of the holding or parent company; or a ‘multiple point of entry resolution’ (as described by the FSB) approach where separate resolution action may be taken at the level of operating subsidiaries.
Given that HSBC primarily consists of a large number of separately incorporated and capitalised banking entities across different jurisdictions, HSBC considers the most appropriate resolution approach for the Group to be ‘multiple point of entry resolution’. This decision ultimately rests with the UK authorities in consultation with CMG members. In this scenario, where an individual banking entity within the Group is no longer viable, the resolution of that entity would be the responsibility of that entity’s local regulator and resolution authority. In order to support this approach, HSBC is working with the FSA, the Bank of England and its CMG to consider whether there are financial, managerial and operational linkages across the Group which might be barriers to effective resolution. HSBC is also working with the regulators and resolution authorities of a number of its banking entities to develop individual recovery and resolution plans for these entities.
European regulation
Through the UK’s membership of the EU, HSBC is both directly and indirectly subject to European financial services regulation.
In December 2010, the Basel Committee issued
two documents: ‘A global regulatory framework for more resilient banks and banking systems’ and ‘International framework for liquidity risk measurement, standards and monitoring’, which together are commonly referred to as ‘Basel III’. These will be given effect across the EU via a recasting of CRD. The proposals have been issued in the form of a new Regulation and Directive, which collectively are known as CRD IV. These have been subject to extensive discussion but have still to be finalised. Proposals include:
| • | Quality of capital: CRD IV requires a further strengthening and harmonisation of the criteria for eligibility of capital instruments with an emphasis on common equity as the principal component of tier 1 capital; |
| • | Capital buffers: proposals comprise a capital conservation buffer of 2.5% of RWAs to be built up during periods of economic growth, aimed at ensuring the capacity to absorb losses in stressed periods that may span a number of years; and a countercyclical capital buffer to be built up when threats to stability emerge; |
| • | Derivatives and central counterparty clearing:higher capital requirements to be imposed for bilateral (uncleared) transactions, to incentivise the use of central clearing; |
| • | Counterparty credit risk: requirements for managing and capitalising counterparty credit risk are to be strengthened. In particular, an additional capital charge for potential losses associated with the deterioration in the creditworthiness of individual counterparties (Credit Valuation Adjustment or CVA) will be introduced; and |
| • | Liquidity and funding: a new minimum standard, the Liquidity Coverage Ratio, designed to improve the short-term resilience of a bank’s liquidity risk profile, will be introduced after an observation and review period in 2015. In January 2013, the Basel Committee issued revisions to the later document significantly revising the liquidity coverage ratio, which requires banking organisations to hold high quality liquid assets that can be quickly and easily monetised to cover their liquidity needs over a 30-day liquidity stress scenario. |
A description of the estimated effect of adopting Basel III can be found in ‘Basel III’ on page 289.
Additionally, and as a result of the ongoing challenges in the eurozone, the EU is now pursuing proposals for increased integration in the European banking system, referred to as ‘Banking Union’.
122q
Table of Contents
HSBC HOLDINGS PLC
Report of the Directors: Operating and Financial Review(continued)
The first stage will be the introduction of a Single Supervisory Mechanism that will give ultimate responsibility for bank supervisory tasks for larger banks to the European Central Bank. Additional proposals are expected during 2013 on:
| • | harmonised depositor protection schemes; and |
| • | a single European Recovery and Resolution Framework. |
The Banking Union is expected to apply on a mandatory basis to the 17 eurozone countries with some scope for other EU member states to opt in. The UK has indicated that it will not join the Banking Union.
In February 2012, the European Commission appointed a High Level Expert Group under the Governor of the Bank of Finland, Erkki Liikanen, to consider potential structural changes in banks within the EU. The Liikanen Group presented its recommendations on 2 October 2012, which included the ring-fencing of certain market-making and trading activities from the deposit-taking and retail payments activities of major banks and possible amendments to the use of bail-in instruments as a resolution tool, as well as a number of other comments. The European Commission has held a consultation on the recommendations and may make its own proposals during 2013.
The French Government has also made proposals to prohibit a limited range of trading activities within banks and these are now being subjected to parliamentary scrutiny. The relationship between the ICB proposals in the UK, the French proposals and the Liikanen proposals at the EU level has still to be clarified.
The EU also continues to work on a Recovery and Resolution Directive (formerly the Crisis Management Directive), and a draft was published in June 2012. This is intended to provide a harmonised framework for the resolution of credit institutions across the EU. While setting out a general framework, the proposals delegated much of the detailed application to local supervisors. This proposal remains subject to discussion between EU bodies. See page 122p for more detail on the Group’s current approach to recovery and resolution.
The EU also continues to pursue the development of markets, and conduct-related EU regulations such as the Short Selling Regulation and the European Markets Infrastructure Regulation, which are now being implemented, and a number of other EU regulations, are in the legislative process. For example, in 2013/2014 it is expected that the Markets in Financial Instrument Directive/
Regulation and the Market Abuse Directive/ Regulation will be finalised and will move into the implementation phase.
Anti-money laundering and related regulation
HSBC places a high priority on its obligations to deter money laundering and terrorist financing. HSBC policy requires that all Group companies should adhere to the letter and spirit of all applicable laws and regulations and we have policies, procedures and training intended to ensure that our employees know and understand our criteria for deciding when a client relationship or business should be evaluated as higher risk.
In December 2012, HSBC reached agreement with US authorities in relation to investigations regarding inadequate compliance with anti-money laundering (‘AML’) and sanctions law. This included a Deferred Prosecution Agreement (‘DPA’) with the US Department of Justice (‘DoJ’). HSBC has also reached agreement to achieve a resolution with all other US government agencies that have investigated HSBC’s past conduct in relation to these issues, as well as finalising an undertaking with the UK FSA. Under these agreements, HSBC made payments totalling US$1,921m and must also continue to cooperate fully with regulatory and law enforcement authorities and take further action to strengthen its compliance policies and procedures.
The duration of the agreements varies, and during the five-year DPA with the DoJ, and pursuant to the undertaking with the FSA, an independent monitor (who will for FSA purposes, be a ‘skilled person’ under Section 166 of the Financial Services and Markets Act (‘FSMA’)) will evaluate and assess HSBC’s progress. In relation to the DPA, the Group has committed to take or continue to adhere to a number of remedial measures.
Breach of the DPA at any time during its term may allow the DoJ or the New York County District Attorney’s Office to prosecute HSBC in relation to the matters which are the subject of the DPA.
A number of measures to address requirements of the DPA and otherwise to enhance our AML and sanctions compliance framework have been taken during 2012 and/or are ongoing. These measures include work to:
| • | adopt and enforce the most effective standards globally including a globally consistent approach to knowing and retaining our customers; |
| • | maximise information sharing for risk |
122r
Table of Contents
HSBC HOLDINGS PLC
Report of the Directors: Operating and Financial Review(continued)
management purposes across HSBC to the extent permitted by law;
| • | require all HSBC affiliates to complete due diligence on any other HSBC affiliate with which they have a correspondent banking relationship; |
| • | introduce a global risk filter which will standardise the way we do business in high risk countries; and |
| • | reinforce a consistent global sanctions policy. |
Additionally, we have substantially revised our governance framework in this area, appointing a new Chief Legal Officer with particular expertise and experience in US law and regulation, and creating and appointing experienced individuals to the new roles of Head of Group Financial Crime Compliance and Global Head of Regulatory Compliance.
As part of our continuing evaluation of AML and sanctions risk, we also monitor our activities relating to the countries subject to US economic sanctions programmes administered by OFAC, as well as those subject to United Nations, UK and EU sanctions. HSBC Group Policy requires all Group companies to comply to the extent applicable with US law and regulation, including the country and individual sanctions promulgated by OFAC sanctions. This means that not only must US subsidiaries and US nationals comply with OFAC regulations, but that HSBC subsidiaries outside the US which are not US persons must not participate in US dollar business that would, if conducted by a US person, contravene the OFAC sanctions. We do not consider that our business activities with counterparties in, or directly relating to, these countries are material to our business, and such activities represented a very small part of the Group’s total assets at 31 December 2012 and total revenues for the year ended 31 December 2012.
Other
HSBC Bank USA entered into a Consent Cease and Desist Order with the OCC, and HNAH entered into a Consent Cease and Desist Order with the Federal Reserve Board in October 2010. These Orders require improvement of our Compliance Risk Management Programme including AML controls across our US businesses. Steps continue to be taken to address the requirements of these Orders and to ensure that compliance and effective policies and procedures are maintained.
Disclosures pursuant to Section 13(r) of the Securities Exchange Act
Section 219 of the Iran Threat Reduction and Syria Human Rights Act of 2012 added a new subsection (r) to section 13 of the Securities Exchange Act, requiring each issuer registered with the SEC to disclose in its annual or quarterly reports whether it or any of its affiliates have knowingly engaged in specified activities or transactions with persons or entities targeted by US sanctions programmes relating to Iran, terrorism, or the proliferation of weapons of mass destruction, even if those activities are not prohibited by US law and are conducted outside the US by non-US affiliates in compliance with local laws and regulations.
In order to comply with this new requirement, HSBC Holdings has requested relevant information from its affiliates globally. The following activities are disclosed in response to Section 13(r):
Loans in repayment
Between 2001 and 2005, the Project and Export Finance (PEF) division of HSBC arranged or participated in a portfolio of loans to Iranian energy companies and banks. All of these loans were guaranteed by European and Asian export credit agencies, and they have varied maturity dates with final maturity in 2018. For those loans that remain outstanding, we continue to seek repayment in accordance with our obligations to the supporting export credit agencies and, in all cases, with appropriate regulatory approvals. Details of these loans follow.
We have 15 loans outstanding to an Iranian petrochemical and energy company. These loans are supported by the official Export Credit Agencies of the following countries: the United Kingdom,
122s
Table of Contents
HSBC HOLDINGS PLC
Report of the Directors: Operating and Financial Review(continued)
France, Germany, Spain, The Netherlands, South Korea and Japan. We continue to seek repayments from the company under the existing loans in accordance with the original maturity profiles. All repayments made by the Iranian company have received a licence or an authorisation from relevant authorities, and each loan received two repayments in 2012.
Bank Melli and Bank Saderat acted as sub-participants in three of the aforementioned loans. In 2012, the repayments due to these banks under the loan agreements were paid into frozen accounts under licences or authorisations from relevant European governments.
In 2002, we provided a loan to Bank Tejarat with a guarantee from the Government of Iran to fund the construction of a petrochemical plant undertaken by a UK contractor. This loan was supported by the UK Export Credit Agency. While the loan remains in existence and has been licensed by the relevant European government, no repayments were received in 2012 from Bank Tejarat.
We also maintain sub-participations in five loans provided by other international banks to Bank Tejarat and Bank Mellat with guarantees from the Government of Iran. These sub-participations were supported by the Export Credit Agencies of Italy. The Netherlands, France, and Spain. The repayments due under the sub-participations were not received in 2012 and claims were settled by the relevant European Export Credit Agencies. Licences and relevant authorisations have been obtained from the competent authorities of the European Union in respect of the transactions.
We also acted as the Agent under a loan provided to Bank Mellat by the Japan Bank for International Development. The loan matured and was repaid in 2012.
Estimated gross revenue generated by these loans in repayment for 2012, which includes interest and fees, was US$6 million. Estimated net profit for 2012 was US$1.1 million. While we intend to continue to seek repayment, we do not intend to extend any new loans.
Legacy contractual obligations related to guarantees
Between 1996 and 2007, HSBC provided guarantees to a number of its non-Iranian customers in Europe and the Middle East for various business activities in Iran. In a number of cases, HSBC issued counter indemnities in support of guarantees issued by
Iranian banks as the Iranian beneficiaries of the guarantees required that they be backed directly by Iranian banks. The Iranian banks to which HSBC provided counter indemnities included Bank Tejarat, Bank Melli, and the Bank of Industry and Mine.
We have worked with relevant regulatory authorities to obtain licences where required and ensure compliance with laws and regulations while seeking to cancel the guarantees and counter indemnities. Several were cancelled in 2012, and 30 remain outstanding. The only relevant activity related to these guarantees in 2012 involved the payment of cancellation fees into frozen accounts of the relevant Iranian banks.
Estimated gross revenue for 2012, which includes fees and/or commissions, was US$37,000. We do not allocate direct costs to fees and commissions and therefore have not disclosed a separate profits measure. We are seeking to cancel all relevant guarantees and do not intend to provide any new guarantees involving Iran.
Cheque clearing
Certain Iranian banks sanctioned by the United States continue to participate in official clearing systems in the UAE, Bahrain, Oman, Lebanon, Qatar, and Turkey. We have a presence in these countries and, as such, participate in the clearing systems. The Iranian banks participating in the clearing systems vary by location and include Bank Saderat, Bank Melli, Future Bank, and Bank Mellat.
While we have attempted to restrict or terminate our role as paying or collecting bank, some cheque transactions with US-sanctioned Iranian financial institutions have been settled. Our ability to effectively terminate or implement cheque-clearing restrictions is dependent on the relevant central banks permitting us to do so unilaterally. Where permitted, we have terminated the activity altogether, implementing both automated and manual controls.
There is no measurable gross revenue or net profit generated by this activity in 2012.
Other relationships with Iranian banks
Activity related to US-sanctioned Iranian banks not covered elsewhere in this disclosure includes the following:
| • | We maintain a frozen account in the UK for an Iranian-owned, FSA-regulated financial institution. In April 2007, the UK government issued a licence to allow us to handle certain transactions (operational payments and |
122t
Table of Contents
HSBC HOLDINGS PLC
Report of the Directors: Operating and Financial Review(continued)
settlement of pre-sanction transactions) for this institution. There was some licensed activity in 2012.
| • | We act as the trustee and administrator for pension schemes involving three employees of a US-sanctioned Iranian bank in Hong Kong. Under the rules of these schemes, we accept contributions from the Iranian bank each month and allocate the funds into the pension accounts of the three Iranian bank employees. We run and operate these schemes in accordance with Hong Kong laws and regulations. |
| • | In 2010, we closed our representative office in Iran. We maintain a local account with a US-sanctioned Iranian bank in Tehran in order to facilitate residual activity related to the closure. Most account activity in 2012 involved the payment of associated local professional fees. |
| • | We provide local currency clearing services to banks in the UK that maintain frozen accounts for sanctioned Iranian banks. We have processed payments received from or destined to those accounts on a case-by-case basis only as permitted under relevant UK licences. |
Estimated gross revenue for 2012 for all Iranian bank-related activity described in this section, which includes fees and/or commissions, was US$7,000. We do not allocate direct costs to fees and commissions and therefore have not disclosed a separate profits measure. We intend to continue to wind down this Iranian bank-related activity and not enter into any new such activity.
Iranian embassy-related activity
We maintain a bank account in London for the Iranian embassy in London, which is used for official embassy business and supporting Iranian students studying in the UK. The main embassy account was closed following the expulsion of diplomats by the UK early in 2012. There have been some transactions in 2012.
We have also processed a limited number of payments on behalf of customers to Iranian embassies in other locations.
Estimated gross revenue for 2012 from embassy-related activity, which includes fees and/or commissions, was US$13,000. We do not allocate direct costs to fees and commissions and therefore have not disclosed a separate profits measure.
Frozen accounts and transactions
We maintain several accounts that are frozen under relevant sanctions programmes and on which no activity took place during 2012. In 2012, we also froze payments with an Iranian interest where required under relevant sanctions programmes. There was no gross revenue or net profit.
Activity related to US Executive Order 13224
In 2012, we maintained two personal accounts and one business account in the UK for two individuals sanctioned by the US under Executive Order 13224. Both of these individuals were delisted by the UK and the UN Security Council in 2012, the relevant accounts were frozen prior to delisting. The customers have been notified that the accounts are being closed.
We maintained a frozen personal account for an individual sanctioned under Executive Order 13224, and by the UK and the UN Security Council. Activity on this account in 2012 was permitted by a licence issued by the UK.
Estimated gross revenue in 2012 for the activity above, which includes fees and/or commissions, was US$1,200. We do not allocate direct costs to fees and commissions and therefore have not disclosed a separate profits measure.
We also hold an account and have an outstanding loan for a partnership that included one individual sanctioned under Executive Order 13224. The account is in overdraft, and the loan is in arrears. The individual was delisted by the UK and the UN Security Council in 2011. Activity in 2012 consisted of principal repayments on the loan. Attempts will be made to obtain full repayment of the loan, and the account will be closed. There was no gross revenue or net profits recognised in 2012 for the activity on this loan.
122u
Table of Contents
HSBC HOLDINGS PLC
Report of the Directors: Operating and Financial Review(continued)
| Page | App1 | |||||||
| 123 | ||||||||
| 252 | ||||||||
| 124 | ||||||||
| 124 | ||||||||
| 124 | ||||||||
| 124 | ||||||||
| 126 | ||||||||
| 126 | ||||||||
| 127 | ||||||||
| 128 | ||||||||
| 128 | ||||||||
| 128 | ||||||||
| 129 | ||||||||
| 130 | ||||||||
| 130 | ||||||||
| 131 | ||||||||
Macro-prudential, regulatory and legal risks to our business model | 132 | |||||||
Risks related to our business operations, governance and internal control systems | 134 | |||||||
| 137 | 252 | |||||||
| 192 | ||||||||
| 203 | 261 | |||||||
| 217 | 265 | |||||||
| 227 | 270 | |||||||
| 230 | 271 | |||||||
| 231 | 273 | |||||||
| 232 | 273 | |||||||
| 246 | ||||||||
| 246 | 278 | |||||||
| 246 | 278 | |||||||
| 249 | 280 | |||||||
1 Appendix to Risk – risk policies and practices. | ||||||||
2 Unaudited.3Audited.4Audited where indicated. | ||||||||
 | For details of HSBC’s policies and practices regarding risk management and governance see the Appendix to Risk on page 252. |
(Unaudited)
Managing our risk profile
| • | A strong balance sheet remains core to our philosophy. |
| • | Our portfolios remain aligned to our risk appetite and strategy. |
| • | Our risk management framework is supported by strong forward-looking risk identification. |
Maintaining capital strength and strong liquidity position
| • | Our core tier 1 capital ratio remains strong at 12.3%. |
| • | We have sustained our strong liquidity position throughout 2012. |
| • | Our ratio of customer advances to deposits remains below 90%. |
Strong governance
| • | Robust risk governance and accountability is embedded across the Group. |
| • | The Board, advised by the Group Risk Committee, approves our risk appetite. |
| • | The compliance control function is being restructured and expanded to improve focus on financial crime and regulatory compliance. |
| • | Our global risk operating model supports adherence to globally consistent standards and risk management policies across the Group. |
Our top and emerging risks
| • | Macroeconomic and geopolitical risk. |
| • | Macro-prudential, regulatory and legal risk to our business model. |
| • | Risks related to our business operations, governance and internal control systems. |
123
Table of Contents
HSBC HOLDINGS PLC
Report of the Directors: Operating and Financial Review(continued)
(Unaudited)
All of our activities involve, to varying degrees, the analysis, evaluation, acceptance and management of risks or combinations of risks. These are described in the table below.
All staff are required to identify, assess and manage risk within the scope of their assigned responsibilities. Our global standards set the tone from the top and are central to our approach to balancing risk and reward. Personal accountability is reinforced by our HSBC Values, with staff expected to act with courageous integrity in conducting their duties and being:
| • | dependable, doing the right thing; |
| • | open to different ideas and culture; and |
| • | connected to our customers, regulators and each other. |
Staff are supported by a disclosure line which enables them to raise concerns in a confidential manner. We also have in place a suite of mandatory training to ensure a clear and consistent attitude is communicated to staff; our mandatory training not only focuses on the technical aspects of risk but also
on our attitude towards risk and the behaviours expected by our policies.
Our risk culture is reinforced by our approach to remuneration, which is discussed in the Report of the Remuneration Committee on page 347. Individual awards are based on the achievement of both financial and non-financial (relating to our values) objectives which are aligned to our global strategy.
An established risk governance framework and ownership structure ensures oversight of and accountability for the effective management of risk at Group, regional and global business levels. The governance structure for the management of risk is set out in the report of the Group Risk Committee on page 323, with similar arrangements in place in major operating subsidiaries. This structure has been augmented by the establishment of the Financial System Vulnerabilities Committee, details of which are set out on page 328. Our risk management framework fosters the continuous monitoring of the risk environment and an integrated evaluation of risks and their interactions. Integral to our risk management framework are risk appetite, stress testing and the identification of top and emerging risks, all of which are discussed below.
Description of risks
| Risks | Arising from | Measurement, monitoring and management of risk | ||
| Credit risk | ||||
| The risk of financial loss if a customer or counterparty fails to meet an obligation under a contract. | Credit risk arises principally from direct lending, trade finance and leasing business, but also from certain other products such as guarantees and derivatives. | Credit risk:
• is measured as the amount which could be lost if a customer or counterparty fails to make repayments. In the case of derivatives, the measurement of exposure takes into account the current mark to market value to HSBC of the contract and the expected potential change in that value over time caused by movements in market rates;
• is monitored within limits, approved by individuals within a framework of delegated authorities. These limits represent the peak exposure or loss to which HSBC could be subjected should the customer or counterparty fail to perform its contractual obligations; and
• is managed through a robust risk control framework which outlines clear and consistent policies, principles and guidance for risk managers.
| ||
| Liquidity and funding risk | ||||
| The risk that we do not have sufficient financial resources to meet our obligations as they fall due or that we can only do so at excessive cost. | Liquidity risk arises from mismatches in the timing of cash flows.
Funding risk arises when the liquidity needed to fund illiquid asset positions cannot be obtained at the expected terms and when required. | Liquidity and funding risk:
• is measured using internal metrics including stressed operational cash flow projections, coverage ratio and advances to core funding ratios;
• is monitored against the Group’s liquidity and funding risk framework and overseen by regional Asset and Liability Management Committees (‘ALCO’s), Group ALCO and the Risk Management Meeting; and
• is managed on a stand-alone basis with no reliance on any Group entity (unless pre-committed) or central bank unless this represents routine established business as usual market practice.
| ||
124
Table of Contents
HSBC HOLDINGS PLC
Report of the Directors: Operating and Financial Review(continued)
| Risks | Arising from | Measurement, monitoring and management of risk | ||
| Market risk | ||||
| The risk that movements in market factors, including foreign exchange rates and commodity prices, interest rates, credit spreads and equity prices, will reduce our income or the value of our portfolios. | Exposure to market risk is separated into two portfolios:
• Trading portfolios comprise positions arising from market-making and warehousing of customer-derived positions
• Non-trading portfolios comprise positions that primarily arise from the interest rate management of our retail and commercial banking assets and liabilities, financial investments designated as available for sale and held to maturity, and exposures arising from our insurance operations
| Market risk:
• is measured in terms of value at risk, which is used to estimate potential losses on risk positions as a result of movements in market rates and prices over a specified time horizon and to a given level of confidence, augmented with stress testing to evaluate the potential impact on portfolio values of more extreme, though plausible, events or movements in a set of financial variables;
• is monitored using measures including the sensitivity of net interest income and the sensitivity of structural foreign exchange which are applied to the market risk positions within each risk type; and
• is managed using risk limits approved by the GMB for HSBC Holdings and our various global businesses. These units are allocated across business lines and to the Group’s legal entities. | ||
| Operational risk | ||||
| The risk of loss resulting from inadequate or failed internal processes, people and systems or from external events, including legal risk (along with accounting, tax, security and fraud, people, systems, projects, operations and organisational change risk). | Operational risk arises from day to day operations or external events, and is relevant to every aspect of our business | Operational risk:
• is measured using both the top risk analysis process and the risk and control assessment process, which assess the level of risk and effectiveness of controls;
• is monitored using key indicators and other internal control activities; and
• is primarily managed by global business and functional managers. They identify and assess risks, implement controls to manage them and monitor the effectiveness of these controls utilising the operational risk management framework. The Global Operational Risk and Internal Control function is responsible for the framework and for overseeing the management of operational risks within businesses and functions.
| ||
| Compliance risk | ||||
| The risk that we fail to observe the letter and spirit of all relevant laws, codes, rules, regulations and standards of good market practice, and incur fines and penalties and suffer damage to our business as a consequence. | Compliance risk is part of operational risk, and arises from rules, regulations, other standards and Group policies, including those relating to anti-money laundering, anti-bribery and corruption, conduct of business, counter- terrorist financing and sanctions compliance. | Compliance risk:
• is measured by reference to identified metrics, incident assessments (whether affecting HSBC or the wider industry), regulatory feedback and the judgement and assessment of the managers of our global businesses and functions;
• is monitored against our compliance risk assessments and metrics, the results of the monitoring and control activities of the second line of defence functions, including the Global Compliance function, and the results of internal and external audits and regulatory inspections; and
• is managed by establishing and communicating appropriate policies and procedures, training employees in them, and monitoring activity to assure their observance. Proactive risk control and/or remediation work is undertaken where required.
| ||
| Insurance risk | ||||
| The risk that over time, the combined cost of acquiring and administering a contract, claims and benefits may exceed the aggregate amount of premiums received and investment income. | Insurance risk arises from mortality and morbidity experience. Lapse and surrender rates and if, the policy has a savings element, the performance of the assets held to support the liabilities also impact the cost of claims and benefits. The performance of assets supporting insurance liabilities depends on financial risks such as market, credit and liquidity. | Insurance risk:
• is measured in terms of life insurance liabilities and non-life written premiums for their respective contract types;
• is monitored by the Group Insurance Risk Management Committee, which checks the risk profile of the insurance operations against a risk appetite for insurance business agreed by the GMB; and
• is managed both centrally and locally using product design, underwriting, reinsurance and claims-handling procedures.
|
125
Table of Contents
HSBC HOLDINGS PLC
Report of the Directors: Operating and Financial Review(continued)
| Risks | Arising from | Measurement, monitoring and management of risk | ||
| Fiduciary risk | �� | |||
| The risk of breaching our fiduciary duties. | Fiduciary risk arises from our business activities where we act in a fiduciary capacity as Trustee, Investment Manager or as mandated by law or regulation. | Fiduciary risk:
• is measured by monitoring against risk appetite;
• is monitored through the use of key indicators; and
• is managed within the designated businesses via a comprehensive policy framework.
| ||
| Reputational risk | ||||
| The risk that illegal, unethical or inappropriate behaviour by the Group itself, members of staff or clients or representatives of the Group will damage HSBC’s reputation, leading, potentially, to a loss of business, fines or penalties. | Reputational risk encompasses negative reaction not only to activities which may be illegal or against regulations, but also to activities that may be counter to societal standards, values and expectations. It arises from a wide variety of causes, including how we conduct our business and the way in which clients to whom we provide financial services, and bodies who represent HSBC, conduct themselves. | Reputational risk:
• is measured by reference to our reputation as indicated by our dealings with all relevant stakeholders, including media, regulators, customers and employees;
• is monitored through a reputational risk management framework, taking into account the results of the compliance risk monitoring activity outlined above; and
• is managed by every member of staff and is covered by a number of policies and guidelines. There is a clear structure of committees and individuals charged with mitigating reputational risk, including the Group Reputational Risk Policy Committee and regional/business equivalents.
| ||
| Pension risk | ||||
The risk that contributions from Group companies and members fail to generate sufficient funds to meet the cost of accruing benefits for the future service of active members, and the risk that the performance of assets held in pension funds is insufficient to cover existing pension liabilities.
| Pension risk arises from investments delivering an inadequate return, economic conditions leading to corporate failures, adverse changes in interest rates or inflation, or members living longer than expected (longevity risk). Pension risk includes operational risks listed above. | Pension risk:
• is measured in terms of the schemes’ ability to generate sufficient funds to meet the cost of their accrued benefits;
• is monitored through the specific risk appetite that has been developed at both Group and regional levels; and
• is managed locally through the appropriate pension risk governance structure and globally through the Risk Management Meeting. | ||
| Sustainability risk | ||||
| The risk that the environmental and social effects of providing financial services outweigh the economic benefits. | Sustainability risk arises from the provision of financial services to companies or projects which run counter to the needs of sustainable development. | Sustainability risk:
• is measured by assessing the potential sustainability effect of a customer’s activities and assigning a Sustainability Risk Rating to all high risk transactions;
• is monitored quarterly by the Risk Management Meeting and monthly by Group Sustainability Risk management; and
• is managed using sustainability risk policies covering project finance lending and sector-based sustainability polices for sectors with high environmental or social impacts. |
Risks are assumed by our global businesses in accordance with their risk appetite and are managed at Group, global business and regional levels. All risks are identified through our risk map process, which sets out the Group’s risk profile in relation to key risk categories in different regions and global businesses. In addition to those listed above, risks including model, financial management, capital, Islamic finance and strategic risk are identified and monitored through the risk map process.
These risks are then regularly assessed through our risk appetite framework, subjected to stress testing and considered for classification as top and emerging risks. These processes are discussed in further detail below.
Credit, market and operational risks are measured using the Pillar 1 framework for regulatory capital through the allocation of risk-weighted assets. We measure other risks using our economic capital model under Pillar 2 (as described in ourPillar 3 Disclosures 2012 report.)
Risk appetite is set out in the Group’s Risk Appetite Statement, which describes the types and levels of risk that the Group is prepared to accept in executing our strategy. It is approved by the Board on the advice of the Group Risk Committee, and is a key component of our risk management framework. It is central to the annual planning process, in which global businesses, geographical regions and functions are required to articulate their risk
126
Table of Contents
HSBC HOLDINGS PLC
Report of the Directors: Operating and Financial Review(continued)
appetite statements. These are aligned with Group strategy, and provide a risk profile of each global business, region or function in the context of the risk categories discussed above.
Quantitative and qualitative metrics are assigned to nine key categories: earnings, capital, liquidity and funding, securitisations, cost of risk, intra-group lending, strategic investments, risk categories and risk diversification and concentration. Measurement against the metrics:
| • | guides underlying business activity, ensuring it is aligned to risk appetite statements; |
| • | informs risk-adjusted remuneration; |
| • | enables the key underlying assumptions to be monitored and, where necessary, adjusted through subsequent business planning cycles; and |
| • | promptly identifies business decisions needed to mitigate risk. |
Some of the core metrics that are measured, monitored and presented to the Board monthly are tabulated below:
Risk appetite metrics
| Target | Actual | |||||||
Core tier 1 ratio | 9.5% to 10.5% | 12.3% | ||||||
Return on equity | 12% to 15% | 8.4% | ||||||
Return on RWAs | 1.8% to 2.6% | 1.8% | ||||||
Dividend payout ratio | 40% to 60% | 55.4% | ||||||
Cost efficiency ratio | 48% to 52% | 62.8% | ||||||
Advances to customer accounts ratio | Below 90% | 74.4% | ||||||
Cost of risk (LICs) | | Below 20% of operating income | | 9.9% | ||||
Our stress testing and scenario analysis programme is central to the monitoring of top and emerging risks. We conduct a range of Group stress-testing scenarios including, but not limited to, severe global economic downturn, country, sector and counterparty failures and a variety of projected major operational risk events. The outcomes of the stress testing are used to assess the potential demand for regulatory capital under the various scenarios. We also participate, where appropriate, in scenario analyses requested by regulatory bodies.
In the course of 2012, we examined several scenarios reflecting potential developments in the eurozone and more widely. Those reported to senior management during 2012 included an assessment of the annual operating plan 2012 under two macroeconomic stress scenarios, as described below. The results of the two scenarios demonstrated that HSBC would remain satisfactorily capitalised under the mild and severe scenarios after taking account of assumed management actions.
In addition to the suite of risk scenarios considered for the Group, each major HSBC subsidiary conducts regular macroeconomic and event-driven scenario analyses specific to their region.
Stress testing is used across risk categories such as market risk, liquidity and funding risk and credit risk to evaluate the potential impact of stress scenarios on portfolio values, structural long-term funding positions, income or capital.
Stress scenario assumptions
| Scenario | Mild scenario assumptions | Severe scenario assumptions | ||
| Assumptions | • the situation in Greece worsens and there is an orderly default in Greece;
• Greek banks also default and, with support from the EU and the International Monetary Fund, are bailed out;
• increasing bond yields in Portugal, Ireland, Spain and Italy trigger further fiscal austerity measures, and governments strive to disassociate their countries from Greece;
• through financial and trade linkages, an orderly default in Greece results in the spread of contagion to the rest of the world;
• the UK, US and emerging markets are adversely affected, albeit to varying degrees; and
• slower global demand curbs growth and increases the risk premium on interest rates as well as commodity prices. | • a disorderly default in Greece, where the eurozone governments are unable to ring-fence peripheral countries and their banks;
• default of Portugal and Ireland with increases in bond yields for high debt countries;
• the ensuing credit crunch together with declining business and consumer confidence more than offset any relief gained from the depreciation of the euro;
• investors become increasingly uncomfortable with the US and the UK’s fiscal positions, with the severe scenario resulting in a global slowdown; and
• emerging economies are less affected by the financial shock. | ||
127
Table of Contents
HSBC HOLDINGS PLC
Report of the Directors: Operating and Financial Review(continued)
We also conduct reverse stress testing.
Reverse stress testing is a process of working backwards from the event of non-viability of the business model to identification of a range of events that could bring that event about. Non-viability might occur before the bank’s capital is depleted, and could result from a variety of events. These include idiosyncratic, systemic or combinations of events, and/or could imply failure of the Group’s holding company or one of its major subsidiaries and does not necessarily mean the simultaneous failure of all the major subsidiaries.
We use reverse stress testing as part of our risk management process to strengthen resilience by helping to inform early-warning triggers, management actions and contingency plans to mitigate against potential stresses and vulnerabilities which the Group might face.
(Unaudited)
In 2012, we experienced increasing levels of compliance risk as regulators and other agencies pursued investigations into historical activities, and we continued to work with them in relation to existing issues. Manifestation of these risks included an appearance before the US Senate Permanent Subcommittee on Investigations and the Deferred Prosecution Agreement reached with US authorities in relation to investigations regarding inadequate compliance with anti-money laundering and sanctions law, plus a related undertaking with the FSA. We have also been involved in investigations into the mis-selling of interest rate derivative products to SMEs in the UK and investigations and reviews related to certain past submissions made by panel banks and the process for making submissions in connection with the setting of Libor, Euribor and other benchmark interest and foreign exchange rates.
With a new senior leadership team and a new strategy in place since 2011, we have already taken significant steps to address these issues including making changes to strengthen compliance, risk management and culture. These steps, which should also enhance our compliance risk management capabilities, include the following:
| • | the creation of a new global structure which will make HSBC easier to manage and control; |
| • | simplifying our business through the ongoing implementation of our organisational |
effectiveness programme and our five economic filters strategy; |
| • | developing a sixth global risk filter which should help to standardise our approach to doing business in higher risk countries; |
| • | substantially increasing resources, doubling global expenditure and significantly strengthening Compliance as a control (rather than as an advisory) function; |
| • | continuing to roll out the HSBC Values programme that defines the way everyone in the Group should act; |
| • | appointing a new Chief Legal Officer and Head of Group Financial Crime Compliance with particular expertise and experience in US law and regulation; |
| • | appointing a new Global Head of Regulatory Compliance and starting to restructure the Global Compliance function accordingly; |
| • | designing and implementing new global standards by which we conduct our businesses; and |
| • | enforcing a consistent global sanctions policy. |
It is clear from both our own and wider industry experience that the level of activity among regulators and law enforcement agencies in investigating possible breaches of regulations has increased, and that the direct and indirect costs of such breaches can be significant. Coupled with a substantial increase in the volume of new regulation, much of which has some element of extra-territorial reach, and the geographical spread of our businesses, we believe that the level of inherent compliance risk that we face as a Group will continue to remain high for the foreseeable future.
Our exposure to commercial real estate lending continued to be concentrated in Hong Kong, the UK, Rest of Asia-Pacific and North America. The market in Hong Kong and most other Asian markets in which we conduct commercial real estate lending, after relative buoyancy in 2011, began to stabilise in 2012, partly due to initiatives taken by various supervisory authorities. In the UK, many regions were negatively affected by weak growth in the economy, though London and the South East, where more than 50% of our UK CRE lending is based, continued to exhibit relative strength. In North America, the market remained stable, in part supported by the continued low levels of interest rates.
128
Table of Contents
HSBC HOLDINGS PLC
Report of the Directors: Operating and Financial Review(continued)
Refinance risk, which is subject to close scrutiny in key commercial real estate markets, is the risk that a loan which is due to be repaid through refinancing over the short term cannot, at maturity, be refinanced on current market terms. Such cases may either lead to the loan being treated as impaired because the borrower’s ability to pay is considered doubtful or, if refinanced by HSBC, may result in it being treated as a renegotiated loan because of the degree of forbearance required (see page 158 for a description of renegotiated loans). In commercial real estate markets, refinance risk can arise particularly when a loan is serviced exclusively by the property to which it relates, i.e. when the bank does not, or is not able to, place principal reliance on other cash flows available to the borrower. We monitor the commercial real estate portfolio, assessing those drivers that may indicate potential issues with refinancing. The principal driver is the vintage of the loan, where origination reflected previous market norms which no longer apply in the current market. Examples are higher loan-to-value ratios and/or lower interest cover ratios. The range of refinancing sources in the local market is also an important consideration, with concern increasing when this is restricted to banks and when bank liquidity is limited. In addition, the quality of underlying fundamentals such as tenant reliability, ability to let, and the condition of the property itself is also important, as it influences property value. With the exception of the UK, in our material commercial real estate portfolios globally, the behaviour of the market and the quality of assets does not cause undue concern. In the UK, the above drivers combine to cause a concern regarding our sensitivity to risks of refinance that warrant enhanced management attention.
At 31 December 2012, the UK had US$24.5bn of commercial real estate loans, of which US$7.4bn were due to be refinanced within the next 12 months, of which US$2.4bn were assessed as possessing characteristics that indicated an increased risk of refinancing difficulty. Such cases are monitored closely with US$1.9bn already under special management within our Loan Management Units. US$0.9bn were disclosed as impaired with impairment allowances of US$0.4bn. Where these loans are not considered impaired it is because, while they may possess characteristics that indicate a potential issue with refinancing, as described above, there is no evidence to indicate that all contractual cash flows will not be recovered or that the loans will need to be refinanced on terms we would consider below market norms.
The relevance of current market conditions to impairment assessment is particularly relevant over a 12-month period. Over a 12 to 24-month horizon, US$3.3bn of UK commercial real estate and other property-related lending loans are due to be refinanced. Reviews of more sensitive assets due between 12 and 24 months have been conducted to ensure that there are no further cases currently requiring special management or that should be considered impaired.
Eurozone countries are members of the EU and part of the euro single currency bloc. The peripheral eurozone countries are those that have exhibited levels of market volatility that exceeded other eurozone countries, demonstrating fiscal or political uncertainty which may persist through the first half of 2013. In 2012, in spite of improvements through austerity and structural reforms, the peripheral eurozone countries of Greece, Ireland, Italy, Portugal, Spain and Cyprus continued to exhibit a high ratio of sovereign debt to GDP or short to medium-term maturity concentration of their liabilities, with Greece, Spain and Cyprus seeking assistance.
Exposure to eurozone countries is analysed in the table on page 193.
Risk reduction in 2012
At 31 December 2012, our net exposure to the peripheral eurozone countries was US$38bn, including net exposure to sovereign borrowers, agencies and banks of US$12bn. During the year, we continued to reduce our overall net exposure to sovereigns, agencies and banks of peripheral eurozone countries. In addition, we continued to actively reduce exposures to counterparties domiciled in other eurozone countries that had exposures to sovereigns and/or banks in peripheral eurozone countries of sufficient size to threaten their on-going viability in the event of an unfavourable conclusion to the current crisis.
This was undertaken through an analysis of publicly available information, reviews of external analyst reports and meetings with the counter-parties’ officials. Vulnerable counterparties were identified and subjected to enhanced monitoring, and our exposure was managed in a similar manner to the monitoring and management of direct exposures to the peripheral eurozone countries. One of the primary issues underpinning this process was the management of our surplus liquidity, resulting in the
129
Table of Contents
HSBC HOLDINGS PLC
Report of the Directors: Operating and Financial Review(continued)
placement of funds directly with central banks in the most highly-rated countries.
Our businesses in peripheral eurozone countries are funded from a mix of local deposits, local wholesale funding and intra-Group loans extended from HSBC operations with surplus funds. Intra-Group funding carries the risk that a member country might exit the eurozone and redenominate its national currency, which could result in a significant currency devaluation. A description of risks relating to currency redenomination in the event of the exit of a eurozone member is provided on page 131.
Risk management and contingency planning
There is an established framework for dealing with counterparty and systemic crisis situations, both regionally and globally, which is complemented by regular specific and enterprise-wide stress testing and scenario planning. The framework functions both in pre and in-crisis situations and ensures that we have detailed operational plans in the event of an adverse scenario materialising. It was deployed in 2011 and has continued to operate throughout 2012 to ensure that pre-crisis preparation remains apposite and robust.
The main focus of preparation for eurozone exit continues to be on Greece and Spain although, as the eurozone situation has developed in 2012, we have also considered other scenarios including contagion risk to non-eurozone countries or the exit of a higher impact eurozone member. Management actions include regular meetings of a Eurozone Major Incident Group and a tested regional eurozone contingency plan covering all global businesses and functions. The plan considers payments, legal, client account, internal and external communication and regulatory and compliance issues associated with eurozone breakup.
The slight improvement in US economic conditions continued throughout 2012. Real GDP grew by 2.2% and consumer spending growth remained moderate. Threats to economic growth remained, primarily with the uncertainty in the housing market and elevated unemployment levels, although both of them demonstrated modest improvements during the year.
We remained focused on managing the run-off of balances in our HSBC Finance portfolio and completed the sales of our US Card and Retail Services business and 195 retail branches principally in upstate New York in 2012. Total lending balances, including loans held for sale, within HSBC
Finance were US$43bn at 31 December 2012, a decline of US$6.8bn compared with the end of 2011. The rate at which balances in the CML portfolio are declining continues to be affected by the lack of refinancing opportunities available to customers and the continued impact of the temporary suspension of foreclosure activity in 2010. Foreclosure processing has now resumed in substantially all states, although there continues to be a backlog of loans which have not yet been referred to foreclosure. In addition, our loan modification programmes, which are designed to improve cash collections and avoid foreclosure, continued to slow repayment rates.
In the third quarter of 2012, we reclassified non-real estate personal loan balances of US$3.7bn, net of impairment allowances, from our consumer finance portfolio to ‘Assets held for sale’ as we actively marketed the portfolio. We also identified real estate secured loan balances, with a carrying amount of US$3.8bn which, as part of our strategy, we have announced that we plan to actively market in multiple transactions generally over the next two years. At 31 December 2012, the carrying value of the non-real estate and the real estate secured loans which we intend to sell was approximately US$1bn greater than their estimated fair value. We expect to recognise a loss on sale for these loans over the next few years, the actual amount of which will depend on market conditions at the time of the sales.
Total mortgage lending in the US was US$55bn at 31 December 2012, a decline of 7% compared with the end of 2011, mainly due to the continued run-off of the CML portfolio.
(Unaudited)
Identifying and monitoring top and emerging risks is integral to our approach to risk management. We define a ‘top risk’ as being a current, emerged risk which has arisen across any of our risk categories, regions or global businesses and has the potential to have a material impact on our financial results or our reputation and the sustainability of our long-term business model, and which may form and crystallise within a one-year horizon. We consider an ‘emerging risk’ to be one which has large uncertain outcomes that may form beyond a one-year horizon which, if they were to crystallise, could have a material effect on our long-term strategy. Our top and emerging risk framework enables us to focus on current and forward looking aspects of our risk exposures and ensure our risk profile remains in line with our risk appetite and that our appetite remains appropriate. Our current top and emerging risks are as follows:
130
Table of Contents
HSBC HOLDINGS PLC
Report of the Directors: Operating and Financial Review(continued)
Macroeconomic and geopolitical risk
| • | Emerging market slowdown. |
| • | Macroeconomic risks within developed economies. |
| • | Increased geopolitical risk in certain regions. |
Emerging market slowdown
World growth is slowing as demand in mature economies is subdued and credit availability and investment activity remain constrained. A number of mature economies are implementing austerity measures in order to reduce their deficits and public debt. This is expected to help resolve the sovereign and banking crisis in the medium term but, in the short term, it is limiting growth, leaving labour markets weak and thereby making fiscal consolidation a bigger challenge. This is affecting the rest of the world through lower trade, reduced international financing as banks are deleveraging, and the potential disruption to capital flows. In addition, it makes emerging countries more vulnerable to a slowdown in mature economies.
Potential impact on HSBC
| • | Trade and capital flows may contract as a result of lower world production, banks deleveraging, the introduction of protectionist measures in certain markets or the emergence of geopolitical risks, which in turn might curtail profitability. |
| • | A prolonged period of low interest rates due to policy actions taken to address the economic crisis in mature economies will constrain through spread compression and low returns on assets the interest income we earn from investing our excess deposits. |
| • | During 2012, we continued to reduce our sovereign and financial institution counterparty credit positions in peripheral eurozone countries. In addition, we actively sought to identify and reduce exposures to those counterparties domiciled in core European countries that had exposures to sovereigns and/or banks in peripheral eurozone countries of sufficient size to threaten their ongoing viability in the event of an unfavourable conclusion to the current situation. |
Macroeconomic risks within developed economies
There is still some risk of one or more countries leaving the euro, although the situation improved in 2012. Even without a eurozone break-up, the currency will remain vulnerable to market
perception. Banks in some countries remain very fragile and the rest of the European banking industry could be affected through its exposure to the weakest countries. Banks are therefore expected to continue to deleverage. In the current context of very low growth due to austerity measures, this could further aggravate the economic crisis and could push European countries into a vicious circle of economic crisis and sovereign difficulties. Although our exposure to the peripheral eurozone countries is relatively limited, we are exposed to counterparties in the core European countries which could be affected by any sovereign or currency crisis. Our eurozone exposures are described in more detail on page 192.
Potential impact on HSBC
| • | We could incur significant losses stemming from the exit of one or more countries from the eurozone and the redenomination of their currencies. |
| • | Our exposures to European banks may come under stress, heightening the potential for credit and market risk losses, if the sovereign debt and banking system crisis in the region increases the need to recapitalise parts of the sector. |
| • | In the event of contagion from stress in the peripheral eurozone sovereign and financial sectors, our ability to borrow from other financial institutions or to engage in funding transactions may be adversely affected by market dislocation and tightening liquidity. |
| • | A sovereign default without co-ordinated intervention to protect the rest of the eurozone could trigger banking defaults in companies with which we do business and have a knock-on effect on the global banking system. We have actively managed the risk of sovereign defaults during 2012 by reducing exposures and other measures. |
| • | In seeking to manage and mitigate these risks, we have prepared and tested detailed operational contingency plans to deal with such a scenario. However, such plans may not be adequate or may not prove effective. |
Increased geopolitical risk in certain regions
Weak global economic growth is exacerbating the risk of protectionism and some countries may impose restrictions on trade or on capital flows to protect their domestic economies.
In Egypt, the political process remains in transition with a continuing risk of instability. In
131
Table of Contents
HSBC HOLDINGS PLC
Report of the Directors: Operating and Financial Review(continued)
addition, the fighting in Syria may disrupt global international relations, with tensions between Israel and Iran adding to the risks in the region.
Potential impact on HSBC
| • | Our results are subject to the risk of loss from unfavourable political developments, currency fluctuations, social instability and changes in government policies on matters such as expropriation, authorisations, international ownership, interest-rate caps, foreign exchange transferability and tax in the jurisdictions in which we operate. Actual conflict could bring about loss of life among our staff and physical damage to our assets. |
| • | We have increased our monitoring of the geopolitical and economic outlook, in particular in countries where we have material exposures and a physical presence. Our internal credit risk rating of sovereign counterparties takes these factors into account and drives our appetite for conducting business in those countries. Where necessary, we adjust our country limits and exposures to reflect our appetite and mitigate these risks as appropriate. |
Macro-prudential, regulatory and legal risks to our business model
| • | Regulatory developments affecting our business model and Group profitability. |
| • | Regulatory investigations, fines, sanctions and requirements relating to conduct of business and financial crime negatively affecting our results and brand. |
| • | Dispute risk. |
Financial service providers face increasingly stringent and costly regulatory and supervisory requirements, particularly in the areas of capital and liquidity management, conduct of business, operational structures and the integrity of financial services delivery. Increased government intervention and control over financial institutions, together with measures to reduce systemic risk, may significantly alter the competitive landscape. These measures may be introduced as formal requirements in a supra-equivalent manner and to differing timetables across regulatory regimes.
Regulatory developments affecting our business model and Group profitability
Several regulatory changes are likely to affect our activities, both of the Group as a whole and of some
or all of our principal subsidiaries. These changes include (i) the introduction of Basel III measures in the EU through CRD IV and uncertainty on both the timing and final form of implementation given that certain areas, such as, the operation of capital buffers have yet to be finalised and the technical guidance from the European Banking Authority (‘EBA’) across numerous areas has yet to be published, (ii) a new regulatory structure within the UK comprising the Financial Policy Committee (‘FPC’), Prudential Regulatory Authority (‘PRA’) and Financial Conduct Authority (‘FCA’) and, in particular, the effects of the ability of the FPC to seek additional capital for lending to sectors perceived as higher risk, (iii) the designation of the Group by the Financial Stability Board as a global systemically important bank; (iv) proposed legislation in the UK to give effect to the recommendations of the ICB in relation to ‘ring-fencing’ of the UK retail banking from wholesale banking activities, the structural separation of other activities envisaged in legislative proposals in the US (including the Volcker Rule proposed under the Dodd-Frank Act) and in France and, in the EU, considerations following the Liikanen Group recommendations; (v) changes in the regime for the operation of capital markets with increasing standardisation, central clearing, reporting and margin requirements; (vi) requirements flowing from arrangements for the recovery and resolution of the Group and its main operating entities; and (v) changing standards for the conduct of business. There is also continued risk of further changes to regulation relating to remuneration and other taxes.
Potential impact on HSBC
| • | Proposed changes relating to capital and liquidity requirements, remuneration and/or taxes could increase the Group’s cost of doing business, reducing future profitability. |
| • | Proposed changes in and the implementation of regulations for derivatives and central counterparties, the ICB ring-fencing proposals, recovery and resolution plans, the Volcker Rule and the Foreign Account Tax Compliance Act (‘FATCA’) may affect the manner in which we conduct our activities and structure ourselves, with the potential both to increase the costs of doing business and curtail the types of business we can carry out, with the risk of decreased profitability as a result. Due to the fact that the development and implementation of many of |
132
Table of Contents
HSBC HOLDINGS PLC
Report of the Directors: Operating and Financial Review(continued)
these various regulations are in their early stages, it is not possible to estimate the effect, if any, on our operations. |
We are closely engaged with the governments and regulators in the countries in which we operate to help ensure that the new requirements are properly considered and can be implemented in an effective manner. We are also ensuring that our capital and liquidity plans take into account the potential effects of the changes. Capital allocation and liquidity management disciplines have been expanded to incorporate future increased capital and liquidity requirements and drive appropriate risk management and mitigating actions.
Regulatory investigations, fines, sanctions and requirements relating to conduct of business and financial crime negatively affecting our results and brand
Financial service providers are at risk of regulatory sanctions or fines related to conduct of business and financial crime. The incidence of regulatory proceedings and other adversarial proceedings against financial service firms is increasing.
In December 2012, HSBC reached agreement with US authorities in relation to investigations regarding inadequate compliance with anti-money laundering, the US Bank Secrecy Act and sanctions law. This includes a DPA with the US Department of Justice (‘DoJ’). We also reached agreement to achieve a resolution with all other US government agencies that have investigated our past conduct related to these issues, and finalised an undertaking with the FSA to comply with certain forward-looking obligations with respect to anti-money laundering and sanctions requirements over a five-year term. Under these agreements, we made payments totalling US$1,921m to US authorities and undertook to continue cooperating fully with US and UK regulatory and law enforcement authorities and take further action to strengthen our compliance policies and procedures. Over the five-year term of the agreement with the DoJ and the FSA, an independent monitor (who will, for FSA purposes, be a ‘skilled person’ under section 166 of the Financial Services and Markets Act (FSMA)) will evaluate and assess our progress in fully implementing these and other measures it recommends and will produce regular assessments of the effectiveness of our Compliance function.
As reflected in the agreement entered into with the Office of the Comptroller of the Currency (‘OCC’) in December 2012 (the ‘GLBA Agreement’), the OCC has determined that HSBC
Bank USA is not in compliance with the requirements which provide that a national bank and each depository institution affiliate of the national bank must be both well capitalised and well managed in order to own or control a financial subsidiary. As a result, HSBC Bank USA and its parent holding companies, including HSBC, no longer meet the qualification requirements for financial holding company status, and may not engage in any new types of financial activities without the prior approval of the Federal Reserve Board. In addition, HSBC Bank USA may not directly or indirectly acquire control of, or hold an interest in, any new financial subsidiary, nor commence a new activity in its existing financial subsidiary, unless it receives prior approval from the OCC.
In the UK, the FSA has continued to increase its focus on ‘conduct risk’ including attention to sales processes and incentives, product and investment suitability and conduct of business concerns more generally. These measures are concerned principally, but not exclusively, with the conduct of business with retail customers and in conjunction with this focus, the UK regulators are making increasing use of existing and new powers of intervention and enforcement, including powers to consider past business undertaken and implement customer compensation and redress schemes or other, potentially significant remedial work. Additionally, the UK and other regulators increasingly take actions in response to customer complaints either specific to an institution or more generally in relation to a particular product. We have seen recent examples of this approach in the context of the mis-selling of payment protection insurance and of interest rate derivative products to SMEs.
The Group also continues to be subject to a number of other regulatory proceedings, including investigations and reviews by various regulators and competition and enforcement authorities around the world, including in the UK, the US, Canada, the EU, Switzerland and Asia, who are conducting investigations and reviews related to certain past submissions made by panel banks and the process for making submissions in connection with the setting of London interbank offered rates (‘Libor’), European interbank offered rates (‘Euribor’) and other benchmark interest and foreign exchange rates. As certain HSBC entities are members of such panels, HSBC and/or its subsidiaries have been the subject of regulatory demands for information and are cooperating with those investigations and reviews. In addition, HSBC and other panel banks have been named as defendants in private lawsuits
133
Table of Contents
HSBC HOLDINGS PLC
Report of the Directors: Operating and Financial Review(continued)
filed in the US with respect to the setting of Libor, including putative class action lawsuits which have been consolidated before the US District Court for the Southern District of New York. The complaints in those actions assert claims against HSBC and other panel banks under various US laws including US antitrust laws, the US Commodities Exchange Act, and state law.
Potential impact on HSBC
| • | It is difficult to predict the outcome of the regulatory proceedings involving our businesses. Unfavourable outcomes may have a material adverse effect on our reputation, brand and results, including loss of business and withdrawal of funding. |
| • | In relation to the DPA, the Group has committed to take or continue to adhere to a number of remedial measures. Breach of the DPA at any time during its term may allow the DoJ or the New York County District Attorney’s Office to prosecute HSBC in relation to the matters which are the subject of the DPA. |
| • | In relation to the GLBA Agreement, if all of our affiliate depositary institutions are not in compliance with these requirements within the time periods specified in the GLBA Agreement, HSBC could be required either to divest HSBC Bank USA or to divest or terminate any financial activities conducted in reliance on the Gramm-Leach Bliley Act (‘GLB Act’). Similar consequences could result for subsidiaries of HSBC Bank USA that engage in financial activities in reliance on expanded powers provided for in the GLB Act. Any such divestiture or termination of activities would have an adverse material effect on the consolidated results and operation of HSBC. |
| • | The UK and other regulators may identify future industry-wide mis-selling or other issues that could affect the Group. This may lead from time to time to: (i) significant direct costs or liabilities (including in relation to mis-selling); and (ii) changes in the practices of such businesses which benefit customers at a cost to shareholders. Further, decisions taken in the UK by the Financial Ombudsman Service in relation to customer complaints (or any overseas equivalent that has jurisdiction) could, if applied to a wider class or grouping of customers, have a material adverse effect on the operating results, financial condition and prospects of the Group. |
Steps to address many of the requirements of the DPA and the GLBA Agreement have either already been taken or are under way. These include simplifying the Group’s control structure, strengthening the governance structure with new leadership appointments, revising key policies and establishing bodies to implement single global standards shaped by the highest or most effective standards available in any location where the Group operates, as well as substantially increasing spending and staffing in the anti-money laundering and regulatory compliance areas in the past few years. There can be no assurance that these steps will be effective or that HSBC will not have to take additional remedial measures in the future to comply with the terms of the DPA or the GLBA Agreement.
Dispute risk
The current economic environment has increased the Group’s exposure to actual and potential litigation. Further details are provided in Note 43 on the Financial Statements.
Potential impact on HSBC
Dispute risk gives rise to potential financial loss and significant reputational damage which could adversely affect customer and investor confidence.
Risks related to our business operations, governance and internal control systems
| • | Regulatory commitments and consent orders including under the Deferred Prosecution Agreements. |
| • | Challenges to achieving our strategy in a downturn. |
| • | Internet crime and fraud. |
| • | Level of change creating operational complexity and heightened operational risk. |
| • | Information security risk. |
| • | Model risk. |
Regulatory commitments and consent orders including under the Deferred Prosecution Agreements
There is a risk that we fail to meet our deadlines or we are judged to have material gaps in our plans or implementation compared with the requirements of the DPAs and other orders. Further details of this risk are provided on page 128.
134
Table of Contents
HSBC HOLDINGS PLC
Report of the Directors: Operating and Financial Review(continued)
Potential impact on HSBC
If, during the term of the DPA, HSBC is determined to have breached the DPA, the DoJ or the New York County District Attorney’s Office may prosecute HSBC in relation to the matters which are the subject of the DPA. The FSA may, in similar vein, take enforcement action against the Group as a result of a breach of the DPA or of our related undertakings to the FSA.
Challenges to achieving our strategy in a downturn
The external environment remains challenging and the structural changes which the financial sector is going through are creating obstacles to the achievement of strategic objectives. This, combined with the prolonged global economic slowdown, could affect the achievement of our strategic targets for the Group as a whole and our global businesses.
Potential impact on HSBC
| • | The slowdown may put pressure on our ability to earn returns on equity in excess of our cost of equity while operating within the overall parameters of our risk appetite. |
| • | Through our strategic initiatives, which have heightened the focus on capital allocation and cost efficiency, we are actively seeking to manage and mitigate this risk. |
Internet crime and fraud
With the ever-growing acceptance of and demand for internet and mobile services by customers, HSBC is increasingly exposed to fraudulent and criminal activities via these channels. Internet crime could result in financial loss and/or customer data and sensitive information being compromised. Along with internet fraud, the overall threat of external fraud may increase during adverse economic conditions, particularly in retail and commercial banking.
We also face the risk of breakdowns in processes or procedures and systems failure or unavailability, and our business is subject to disruption from events that are wholly or partially beyond our control, such as internet crime and acts of terrorism.
Potential impact on HSBC
| • | Internet crime and fraud may give rise to losses in service to customers and/or economic loss to HSBC. The same threats apply equally when we |
rely on external suppliers or vendors to provide services to us and our customers. |
| • | We have increased our defences through enhanced monitoring and have implemented additional controls, such as two-factor authentication, to reduce the possibility of losses from fraud. We continually assess these threats as they evolve and adapt our controls to mitigate them. |
Level of change creating operational complexity and heightened operational risk
There are many drivers of change affecting HSBC and the banking industry, including new banking regulations, the increased globalisation of economic and business activities, new products and delivery channels and organisational change.
Operational complexity has the potential to heighten all types of operational risk arising from our activities. These risks include process errors, systems failures and fraud. Complexity can also increase operational costs.
The implementation of our strategy to simplify our business, which involves withdrawing from certain markets, presents disposal risks which must be carefully managed. Implementing organisational changes to support the Group’s strategy also requires close management oversight.
Potential impact on HSBC
| • | The implementation of our strategy has involved the re-organisation and clarification of management accountabilities. There is consequently a risk that issues are missed during the transition. This change activity is being monitored through a comprehensive review programme and robust governance arrangements. |
| • | Critical systems failure and a prolonged loss of service availability could cause serious damage to our ability to serve our customers, breach regulations under which we operate and cause long-term damage to our business, reputation and brand. Systems and controls could be degraded as a result of organisational effectiveness initiatives unless there is strong governance and an oversight framework to monitor the risk and control environment. We seek to ensure that our critical systems infrastructure, including IT services, essential buildings, offshore processes and key vendors, is constantly monitored and properly resourced to mitigate against systems failures. |
135
Table of Contents
HSBC HOLDINGS PLC
Report of the Directors: Operating and Financial Review(continued)
| • | We pro-actively review relevant external events and assess the impact they may have on our systems. Within HSBC, we have a strong focus on industry best practices. We rigorously test and review all planned updates to our systems environment. All changes are risk-assessed, and appropriate mitigating controls are required for any planned changes classified as high risk. During periods of heightened risk, comprehensive change embargoes are imposed to minimise the risk of customers being affected. Following the systems outage at a major UK bank in 2012, we assessed our own exposure to similar risks and implemented appropriate steps in mitigation. We also assessed the systems scheduling tools used in the Group. There are controls in place to manage inter-dependencies, report exceptions and alert file data corruption. These additional controls are intended to ensure that the effect of any similar product failure at HSBC would be limited. In addition, a continuity test of a similar problem within our major datacentres in the UK and Hong Kong was conducted in the second half of 2012. |
| • | The potential effects of disposal risks include regulatory breaches, industrial action, loss of key personnel and interruption to systems and processes during business transformation, and they can have both financial and reputational implications. Steps taken to manage these risks proactively include maintaining a close dialogue with regulators and customers and involving HR, legal, compliance and other functional experts. Some disposals also involve Transitional Service Agreements where there are ongoing risks, which are subject to close management oversight. |
Information security risk
The security of our information and technology infrastructure is crucial for maintaining our banking applications and processes while protecting our customers and the HSBC brand.
Potential impact on HSBC
| • | These risks give rise to potential financial loss and reputational damage which could adversely affect customer and investor confidence. Loss of customer data would also trigger regulatory breaches which could result in fines and penalties being incurred. |
| • | We have invested significantly in addressing this risk through increased training to raise staff awareness of the requirements and enhanced multi-layered controls protecting our information and technical infrastructure. |
Model risk
More stringent regulatory requirements governing the development of parameters applied to and controls around models used for measuring risk can give rise to changes, including increases in capital requirements. Furthermore, the changing external economic and legislative environment and changes in customer behaviour can lead to the assumptions we have made in our models becoming invalid.
Potential impact on HSBC
| • | These model risks can result in a potentially increased and volatile capital requirement. |
| • | We continue to address these risks through enhanced model development, independent review and model oversight to ensure our models remain fit for purpose. |
136
Table of Contents
HSBC HOLDINGS PLC
Report of the Directors: Operating and Financial Review(continued)
137
Table of Contents
HSBC HOLDINGS PLC
Report of the Directors: Operating and Financial Review(continued)
138
Table of Contents
HSBC HOLDINGS PLC
Report of the Directors: Operating and Financial Review(continued)
Credit risk is the risk of financial loss if a customer or counterparty fails to meet an obligation under a contract. It arises principally from direct lending, trade finance and leasing business, but also from certain other products such as guarantees and credit derivatives and from holding assets in the form of debt securities.
There were no material changes to our policies and practices for the management of credit risk in 2012.
| A summary of our current policies and practices regarding credit risk is provided in the Appendix to Risk on page 252. |
Summary of credit risk in 2012
(Unaudited)
Maximum exposure to credit risk
| At 31 December | ||||||||||
| 2012 | 2011 | |||||||||
| US$m | US$m | |||||||||
Trading assets | 367,177 | 309,449 | ||||||||
Financial assets designated at fair value | 12,714 | 12,926 | ||||||||
Derivatives | 357,450 | 346,379 | ||||||||
Loans and advances held at amortised cost | 1,150,169 | 1,121,416 | ||||||||
– to banks | 152,546 | 180,987 | ||||||||
– to customers | 997,623 | 940,429 | ||||||||
Financial investments | 415,312 | 392,834 | ||||||||
Assets held for sale | 9,292 | 37,808 | ||||||||
Other assets | 203,561 | 192,024 | ||||||||
Off-balance sheet exposures | 624,462 | 694,228 | ||||||||
– financial guarantees and similar contracts | 44,993 | 39,324 | ||||||||
– loan and other credit-related commitments | 579,469 | 654,904 | ||||||||
| ||||||||||
| 3,140,137 | 3,107,064 | |||||||||
In 2012, net loans and advances to customers continued to represent our most significant exposure to credit risk, making up 32% of total credit exposure compared with 30% in 2011. Other significant components of our credit exposures were financial investments at 13%, unchanged from 2011, trading assets at 12% (2011: 10%) and derivatives at 11% (unchanged from 2011). Loans and advances to banks fell as a proportion of the Group’s credit exposure from 6% in 2011 to 5% in 2012. Off-balance sheet assets contributed 20% of our total credit exposure, mainly relating to loan and other credit-related commitments (2011: 22%).
Of our net loans and advances to customers, corporate and commercial lending made up the largest proportion at 51% (2011: 49%), with significant exposures in Europe, Hong Kong and Rest of Asia-Pacific. First lien residential mortgages
represented 30% of total gross loans and advances, mainly in the UK, the US and Hong Kong. Other personal lending (including second lien residential mortgages) made up the bulk of the remaining exposure.
Loans and advances excluding held for sale: total exposure, impairment allowances and charges
(Unaudited)
| 2012 | 2011 | |||||||||
| US$bn | US$bn | |||||||||
At 31 December | ||||||||||
Total gross loans and advances (A) | 1,166.3 | 1,139.1 | ||||||||
Impairment allowances | 16.2 | 17.6 | ||||||||
– as a percentage of A | 1.39% | 1.55% | ||||||||
Loans and advances net of impairment allowances | 1,150.2 | 1,121.5 | ||||||||
Year ended 31 December | ||||||||||
Impairment charges | 8.2 | 11.5 | ||||||||
The increase in corporate and commercial lending stemmed mainly from Europe, due to a rise in overdrafts which did not meet accounting criteria for netting against corresponding current account balances. Increases in North America reflected CMB’s focus on target segments in the US, partly offset by the continued decline in balances in the run-off CML portfolio. In addition, during the year we reclassified US$3.7bn of non-real estate personal loan balances in the CML portfolio and US$2.2bn of lending balances associated with certain operations in Latin America, net of impairment allowances, to ‘Assets held for sale’. The disposal of the Card and Retail Services business in the US during the year did not contribute to the decline as the related balances had been transferred to ‘Assets held for sale’ during 2011.
The increase in first lien residential mortgages reflected the success of marketing campaigns and competitive pricing in the UK, the continued strength of the property market in Hong Kong and distribution network expansion in Rest of Asia-Pacific.
Within net loans and advances, loan impairment allowances fell by US$1.4bn, driven by run-off in the CML portfolio and the reclassification of non-real estate personal loan balances to ‘Assets held for sale’.
Trading assets include debt securities (principally government and government-related securities), reverse repo and stock borrowing balances. Balances recovered in 2012 from the subdued levels seen at the end of 2011, when client activity declined due to the eurozone debt concerns dominating the global economy.
Loans and advances to banks fell, driven by a reduction in reverse repo balances, in part reflecting the redeployment of liquidity in Europe to central
139
Table of Contents
HSBC HOLDINGS PLC
Report of the Directors: Operating and Financial Review(continued)
banks, together with maturities and repayments in Hong Kong.
Loan and other credit-related commitments declined from US$655bn to US$579bn. The
reduction in exposure in 2012 was largely driven by the sale of Card and Retail Services in the US.
For a more detailed analysis of our maximum exposure to credit risk, see page 144.
(Unaudited)
| Europe US$m | Hong Kong US$m | Rest of Pacific | MENA US$m | North America US$m | Latin America US$m | Total US$m | ||||||||||||||||||||||
2012 | ||||||||||||||||||||||||||||
First lien residential mortgages | ||||||||||||||||||||||||||||
Gross amount (B) | 135,172 | 52,296 | 36,906 | 2,144 | 70,133 | 5,211 | 301,862 | |||||||||||||||||||||
Impairment allowances | 489 | 4 | 66 | 136 | 4,163 | 47 | 4,905 | |||||||||||||||||||||
– as a percentage of B | 0.4% | 0.0% | 0.2% | 6.3% | 5.9% | 0.9% | 1.6% | |||||||||||||||||||||
Other personal lending1 | ||||||||||||||||||||||||||||
Gross amount (C) | 51,102 | 18,045 | 12,399 | 4,088 | 14,221 | 13,376 | 113,231 | |||||||||||||||||||||
Impairment allowances | 977 | 57 | 143 | 189 | 684 | 1,257 | 3,307 | |||||||||||||||||||||
– as a percentage of C | 1.9% | 0.3% | 1.2% | 4.6% | 4.8% | 9.4% | 2.9% | |||||||||||||||||||||
Total personal lending | ||||||||||||||||||||||||||||
Gross amount (D) | 186,274 | 70,341 | 49,305 | 6,232 | 84,354 | 18,587 | 415,093 | |||||||||||||||||||||
Impairment allowances | 1,466 | 61 | 209 | 325 | 4,847 | 1,304 | 8,212 | |||||||||||||||||||||
– as a percentage of D | 0.8% | 0.1% | 0.4% | 5.2% | 5.7% | 7.0% | 2.0% | |||||||||||||||||||||
2011 | ||||||||||||||||||||||||||||
First lien residential mortgages | ||||||||||||||||||||||||||||
Gross amount (E) | 119,902 | 46,817 | 32,136 | 1,837 | 73,278 | 4,993 | 278,963 | |||||||||||||||||||||
Impairment allowances | 441 | 12 | 58 | 126 | 4,578 | 106 | 5,321 | |||||||||||||||||||||
– as a percentage of E | 0.4% | 0.0% | 0.2% | 6.9% | 6.2% | 2.1% | 1.9% | |||||||||||||||||||||
Other personal lending1 | ||||||||||||||||||||||||||||
Gross amount (F) | 46,245 | 16,364 | 11,445 | 3,432 | 22,058 | 15,118 | 114,662 | |||||||||||||||||||||
Impairment allowances | 1,111 | 52 | 138 | 198 | 1,768 | 1,172 | 4,439 | |||||||||||||||||||||
– as a percentage of F | 2.4% | 0.3% | 1.2% | 5.8% | 8.0% | 7.8% | 3.9% | |||||||||||||||||||||
Total personal lending | ||||||||||||||||||||||||||||
Gross amount (G) | 166,147 | 63,181 | 43,581 | 5,269 | 95,336 | 20,111 | 393,625 | |||||||||||||||||||||
Impairment allowances | 1552 | 64 | 196 | 324 | 6,346 | 1,278 | 9,760 | |||||||||||||||||||||
– as a percentage of G | 0.9% | 0.1% | 0.4% | 6.1% | 6.7% | 6.4% | 2.5% | |||||||||||||||||||||
For footnote, see page 249.
Our personal lending balances increased from US$394bn at 31 December 2011 to US$415bn at 31 December 2012, compared with the end of 2011. This was primarily due to growth in residential mortgages in Europe, Hong Kong and Rest of Asia-Pacific. In Europe, this was due to successful marketing campaigns and competitive pricing in the UK. The growth in mortgage balances in Hong Kong was driven by the low interest rate environment, and robust residential property market. The latter was also a factor in Rest of Asia-Pacific, most notably in Singapore, mainland China, Australia and Malaysia. This growth in total personal lending balances was partly offset by a decline in North America, in part due to the run-off of the CML portfolio and the reclassification of non-real estate personal loan balances to ‘Assets held for sale’. In Latin America personal lending decreased, mainly reflecting the
transfer of balances relating to the operations in Colombia, Peru and Paraguay to ‘Assets held for sale’ in the second quarter of 2012, as well as lower balances in Brazil, where we continued to manage down our exposure to non-strategic portfolios.
Impairment allowances declined by 16%, primarily in North America in the CML portfolio, reflecting the reclassification of non-real estate personal loan balances to ‘Assets held for sale’ and the continued run-off. In Hong Kong and Rest of Asia-Pacific, impairment allowances remained at low levels throughout 2012. In Europe, in other personal lending, impairment allowances as a percentage of lending balances, declined from 2.4% to 1.9% as we focused our lending growth on higher quality assets.
For a more detailed analysis of our personal lending, see page 147.
140
Table of Contents
HSBC HOLDINGS PLC
Report of the Directors: Operating and Financial Review(continued)
(Unaudited)
| Europe US$m | Hong Kong US$m | Rest of Pacific | MENA US$m | North America US$m | Latin America US$m | Total US$m | ||||||||||||||||||||||
2012 | ||||||||||||||||||||||||||||
Corporate and commercial | ||||||||||||||||||||||||||||
Gross amount (H) | 226,755 | 99,199 | 85,305 | 22,452 | 48,083 | 35,590 | 517,384 | |||||||||||||||||||||
Impairment allowances | 3,537 | 383 | 526 | 1,312 | 732 | 856 | 7,346 | |||||||||||||||||||||
– as a percentage of H | 1.56% | 0.39% | 0.62% | 5.84% | 1.52% | 2.41% | 1.42% | |||||||||||||||||||||
Financial2 | ||||||||||||||||||||||||||||
Gross amount (I) | 101,052 | 28,046 | 48,847 | 10,394 | 27,400 | 18,122 | 233,861 | |||||||||||||||||||||
Impairment allowances | 358 | 29 | 11 | 174 | 37 | 2 | 611 | |||||||||||||||||||||
– as a percentage of I | 0.35% | 0.10% | 0.02% | 1.67% | 0.14% | 0.01% | 0.26% | |||||||||||||||||||||
2011 | ||||||||||||||||||||||||||||
Corporate and commercial | ||||||||||||||||||||||||||||
Gross amount (J) | 209,760 | 91,592 | 77,887 | 21,152 | 41,775 | 35,930 | 478,096 | |||||||||||||||||||||
Impairment allowances | 3,256 | 492 | 576 | 1,242 | 756 | 729 | 7,051 | |||||||||||||||||||||
– as a percentage of J | 1.55% | 0.54% | 0.74% | 5.87% | 1.81% | 2.03% | 1.47% | |||||||||||||||||||||
Financial2 | ||||||||||||||||||||||||||||
Gross amount (K) | 118,077 | 38,632 | 50,492 | 9,739 | 27,648 | 22,743 | 267,331 | |||||||||||||||||||||
Impairment allowances | 484 | 26 | 11 | 166 | 135 | 3 | 825 | |||||||||||||||||||||
– as a percentage of K | 0.41% | 0.07% | 0.02% | 1.70% | 0.49% | 0.01% | 0.31% | |||||||||||||||||||||
For footnote, see page 249.
At 31 December 2012, our corporate and commercial lending balances were US$517bn. The increase of 8% compared with the end of 2011 was mainly in the international trade and services sector, largely in Europe despite muted demand for credit, and in Hong Kong, driven by growth in trade finance volumes as we capitalised on trade and capital flows. In the manufacturing sector in Europe, balances increased due to growth in the UK of overdraft balances and corresponding customer accounts which did not, however, meet netting criteria under accounting rules.
Financial sector lending decreased from US$267bn at 31 December 2011 to US$234bn at 31 December 2012. This was mainly in Europe due to a fall in reverse repo activity as liquidity was
redeployed to central banks, together with maturities and repayments in Hong Kong and Rest of Asia-Pacific.
Impairment allowances remained at low levels as a percentage of wholesale lending balances. In North America, impairment allowances as a percentage of financial lending balances declined from 0.49% to 0.14% reflecting a few large write-offs in 2012. Lending balances in this category remained broadly unchanged. In Europe, impairment allowances declined from US$484m to US$358m reflecting the disposal of a small number of exposures.
For a more detailed analysis of our wholesale lending, see page 152.
141
Table of Contents
HSBC HOLDINGS PLC
Report of the Directors: Operating and Financial Review(continued)
Credit quality of gross loans and advances
(Unaudited)
| Europe US$m | Hong Kong US$m | Rest of Pacific | MENA US$m | North America US$m | Latin America US$m | Total US$m | ||||||||||||||||||||||
2012 | ||||||||||||||||||||||||||||
Neither past due nor impaired | 500,599 | 200,110 | 179,337 | 35,628 | 127,457 | 65,520 | 1,108,651 | |||||||||||||||||||||
Of which renegotiated | 3,871 | 275 | 199 | 1,300 | 6,061 | 1,109 | 12,815 | |||||||||||||||||||||
Past due but not impaired | 2,339 | 1,311 | 2,974 | 975 | 7,721 | 3,591 | 18,911 | |||||||||||||||||||||
Of which renegotiated | 371 | 8 | 35 | 168 | 3104 | 133 | 3,819 | |||||||||||||||||||||
Impaired | 11,145 | 477 | 1,147 | 2,474 | 20,345 | 3,188 | 38,776 | |||||||||||||||||||||
Of which renegotiated | 5,732 | 109 | 318 | 921 | 16,997 | 1516 | 25,593 | |||||||||||||||||||||
2011 | ||||||||||||||||||||||||||||
Neither past due nor impaired | 480,173 | 191,691 | 168,571 | 32,550 | 131,785 | 72,534 | 1,077,304 | |||||||||||||||||||||
Of which renegotiated | 5,136 | 309 | 264 | 1,532 | 6,570 | 909 | 14,720 | |||||||||||||||||||||
Past due but not impaired | 1,990 | 1,107 | 2,319 | 1,165 | 10,216 | 3,212 | 20,009 | |||||||||||||||||||||
Of which renegotiated | 282 | 4 | 47 | 311 | 4,061 | 168 | 4,873 | |||||||||||||||||||||
Impaired | 11,819 | 608 | 1,070 | 2,445 | 22,758 | 3,039 | 41,739 | |||||||||||||||||||||
Of which renegotiated | 6,046 | 134 | 137 | 812 | 17,844 | 1,399 | 26,372 | |||||||||||||||||||||
At 31 December 2012, US$1,109bn of gross loans and advances were classified as neither past due nor impaired. This was an increase of 3%, mainly in Europe and in Rest of Asia-Pacific.
At 31 December 2012, US$19bn of gross loans and advances were classified as past due but not impaired compared with US$20bn at the end of 2011. The largest concentration of these balances was in HSBC Finance. The decline of 5% was mainly in North America due to the reclassification of non-real estate personal loan balances to ‘Assets held for sale’, as well as the continued run-off of the mortgage balances in the CML portfolio. This was partly offset by an increase in Rest of Asia-Pacific in the personal and corporate and commercial sectors.
Gross loans and advances classified as impaired decreased by 7%, mainly in North America due to the continued run-off of the CML portfolio, as well as the reclassification of non-real estate personal loan balances to ‘Assets held for sale’ in our CML portfolio.
Renegotiated loans totalled US$42bn at 31 December 2012, compared with US$46bn at the end of 2011. North America accounted for the largest volume of renegotiated loans which amounted to US$26bn or 62% of total renegotiated loans at 31 December 2012 (2011: US$28bn or 62%), most of which were first lien residential mortgages held by HSBC Finance. Of the total renegotiated loans in North America, US$17bn were presented as impaired at 31 December 2012 (2011: US$18bn). Of total renegotiated loans, US$3.8bn were presented as past due but not impaired at 31 December 2012, down from US$4.9bn at 31 December 2011. This was mainly in North America in the CML portfolio due to the reclassification of non-real estate personal loan balances to ‘Assets held for sale’ as well as the continued run-off of the lending balances.
For a more detailed analysis of the credit quality of financial instruments, see page 154.
142
Table of Contents
HSBC HOLDINGS PLC
Report of the Directors: Operating and Financial Review(continued)
Impairment of loans and advances
(Unaudited)
Loan impairment charges by geographical region
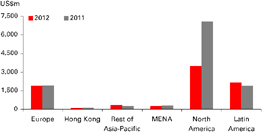
Loan impairment charges by industry
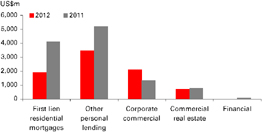
Loan impairment charges decreased from US$12bn to US$8.2bn on a reported basis, a decline of 29% compared with 2011. On a constant currency basis, they were 27% lower.
The improvement in loan impairment charges was most significant in RBWM in North America due to the continued decline in the CML portfolio that is in run-off and the sale of the Card and Retail Services business.
This was in part reduced by higher loan impairment charges in Latin America. In Brazil, delinquencies in RBWM and CMB increased, reflecting lower economic growth in 2012. In Rest of Asia-Pacific, loan impairment charges increased as a result of individually assessed impairments on a single corporate exposure in Australia and a small number of corporate exposures in other countries.
For a more detailed analysis of the impairment of loans and advances, see page 168.
During 2012, the growth in gross loans and advances was affected by a reclassification of certain lending balances to ‘Assets held for sale’. Disclosures relating to assets held for sale are provided in the following credit risk management tables, primarily where the disclosure is relevant to the measurement of these financial assets:
| • | Maximum exposure to credit risk (page 146); |
| • | Distribution of financial instruments by credit quality (page 155); and |
| • | Ageing analysis of days past due but not impaired gross financial instruments (page 157). |
Although gross loans and advances and related impairment allowances are reclassified from ‘Loans and advances to customers’ and ‘Loans and advances to banks’ in the balance sheet, there is no equivalent income statement reclassification. As a result, charges for loan impairment losses shown in the credit risk disclosures include loan impairment charges relating to financial assets classified as ‘Assets held for sale’.
Loans and advances to customers and banks measured at amortised cost
(Audited)
| At 31 December 2012 | At 31 December 2011 | |||||||||||||||||||||
| Gross loans and advances US$m | Impairment allowances on loans and advances | Gross loans and advances US$m | Impairment allowances on loans and advances | |||||||||||||||||||
Reported in ‘Loans and advances to customers and banks’ | 1,166,338 | 16,169 | 1,139,052 | 17,636 | ||||||||||||||||||
Reported in ‘Assets held for sale’ | 7,350 | 718 | 37,273 | 1,614 | ||||||||||||||||||
| 1,173,688 | 16,887 | 1,176,325 | 19,250 | |||||||||||||||||||
143
Table of Contents
HSBC HOLDINGS PLC
Report of the Directors: Operating and Financial Review(continued)
The lending balances in ‘Assets held for sale’ at the end of 2012 included non-real estate personal loan balances from our CML portfolio in North America and balances associated with the disposal of our operations in Colombia, Paraguay and Peru, net of impairment allowances. The lending balances and impairment allowances reported in ‘Assets held for sale’ at the end of 2011 included the US Card and Retail Services portfolio which was disposed of in 2012. As the latter was reclassified in 2011, the disposal had no impact on the year on year movement in loans and advances or impairment allowances in 2012.
Lending balances held for sale continue to be measured at amortised cost less allowances for impairment; such carrying amounts may differ from fair value. Any difference between the carrying amount and the sales price, which is the fair value at the time of sale, would be recognised as a gain or loss. See Note 16 on the Financial Statements for the carrying amount and the fair value at 31 December 2012 of loans and advances to banks and customers classified as held for sale.
The table below analyses the amount of loan impairment charges and other credit risk provisions (‘LIC’s) arising from assets held for sale. They primarily related to the non-real estate personal loans reclassified to held-for-sale in the CML portfolio, as well as to the US Card and Retail Services business classified as such at 31 December 2011 which was sold in 2012.
Loan impairment charges and other credit risk provisions
(Unaudited)
| 2012 US$m | ||||
LICs arising from: | ||||
– disposals and assets held for sale | 766 | |||
– assets not held for sale | 7,545 | |||
| 8,311 | ||||
Maximum exposure to credit risk
(Audited)
In 2012, our exposure to credit risk remained well diversified across asset classes. We increased our overall exposure to credit risk in 2012, largely from increases in trading assets in Europe and North America, driven by higher client trading activity. Loans and advances to customers also rose, mainly in the UK, Hong Kong and Rest of Asia-Pacific.
‘Maximum exposure to credit risk’ table (page 146)
The table presents our maximum exposure to credit risk from balance sheet and off-balance sheet financial instruments before taking account of any collateral held or other credit enhancements (unless such enhancements meet accounting offsetting requirements). For financial assets recognised on the balance sheet, the maximum exposure to credit risk equals their carrying amount; for financial guarantees and similar contracts granted, it is the maximum amount that we would have to pay if the guarantees were called upon. For loan commitments and other credit-related commitments that are irrevocable over the life of the respective facilities, it is generally the full amount of the committed facilities.
Loans and advances
Our maximum exposure to loans and advances carried at amortised cost increased by 3% compared with the end of 2011. The rise primarily reflected growth in residential mortgage balances in the UK following the continued focus on sales and competitive pricing, the ongoing strength of the property market in Hong Kong and in Rest of Asia-Pacific, coupled with expansion of our distribution network in the latter. Term and trade-related lending rose in Europe despite muted demand for credit in the UK and in Hong Kong and Rest of Asia-Pacific, reflecting our focus on corporate and commercial customers that trade internationally. Lending also rose in Europe as overdraft balances that did not meet netting criteria increased in the UK, with a corresponding rise in related customer accounts. In North America corporate and commercial lending increased, reflecting our focus on target segments in the US.
These increases were partly offset by a decline in North America from repayments and write-offs on the run-off CML portfolio. In addition, during the year we reclassified US$3.7bn of non real estate personal loan balances in the CML portfolio and US$2.2bn of lending balances associated with certain operations in Latin America, net of impairment allowances, to ‘Assets held for sale’. Reverse repo balances also declined, mainly in Europe.
Our exposure to loans and advances to banks decreased in Hong Kong and Rest of Asia-Pacific due to maturities and repayments, and in Europe as reverse repo balances declined due, in part, to the redeployment of liquidity to central banks. Balances also decreased in Latin America.
The loans and advances offset adjustment in the table on page 146 primarily relates to customer loans and deposits and balances arising from repo and reverse repo transactions where there is a legally enforceable right of offset in the event of counterparty default and where, as a result, there is a net exposure for credit risk management purposes.
144
Table of Contents
HSBC HOLDINGS PLC
Report of the Directors: Operating and Financial Review(continued)
However, as there is no intention to settle these balances on a net basis under normal circumstances, they do not qualify for net presentation for accounting purposes.
Financial investments
Maximum exposure to financial investments increased by 6% compared with the end of 2011. This largely reflected the deployment of surplus liquidity into available-for-sale investments, notably treasury bills in Hong Kong and highly rated debt securities in North America.
Trading assets
In 2012, our exposure to trading assets rose by 19% reflecting increased client activity compared with the subdued levels seen in 2011. This resulted in higher reverse repo balances in Europe and North America, and higher securities borrowing balances in Rest of Asia-Pacific and Europe, which vary in line with levels of trading activity.
Cash and balances at central banks
The Group’s maximum exposure to cash and balances at central banks increased by 9%, driven by redeployment of excess liquidity in Europe and Hong Kong to central banks. This reflected the Group’s risk appetite coupled with growth in customer deposit balances. In North America, we reduced balances at the US Federal Reserve as surplus liquidity was redeployed into highly-rated financial investments.
Derivatives
Our maximum exposure to derivatives increased slightly, primarily reflecting a rise in the fair value of interest rate derivative contracts in Europe and, to a lesser extent, in the US due to downward movements in yield curves in major currencies.
This was partly offset by a decrease in the fair value of credit derivative contracts, primarily in Europe and the US, as credit spreads tightened. Nearly half of all trades are exchange traded or otherwise settled centrally, the majority of these being interest rate derivatives.
The derivative offset amount in the table on page 146 relates to exposures where the counterparty has an offsetting derivative exposure with HSBC, a master netting arrangement is in place and the credit risk exposure is managed on a net basis, or the position is specifically collateralised, normally in the form of cash. At 31 December 2012, the total amount of such offsets was US$311bn (2011: US$306bn), of which US$270bn (2011: US$272bn) were offsets under a master netting arrangement, US$39bn (2011: US$33bn) was collateral received in cash and US$1.8bn (2011: US$0.7bn) was other collateral. These amounts do not qualify for net presentation for accounting purposes as settlement is not intended to be made on a net basis.
Other credit risk mitigants
While not disclosed as offset in the maximum exposure to credit risk table on page 146, other arrangements including short positions in securities and financial assets held as part of linked insurance/ investment contracts where the risk is predominately borne by the policyholder, reduce our maximum exposure to credit risk. In addition, we hold collateral in respect of individual loans and advances (see page 163).
Loans and other credit-related commitments
Loans and other credit-related commitments remain well diversified across geographical regions. For more details, see page 146.
Counterparty analysis of notional contract amounts of derivatives by product type
(Unaudited)
| Traded over the counter | ||||||||||||||||||||||
Traded on recognised exchanges | Settled by central counterparties | Not settled by central counterparties | Total | |||||||||||||||||||
| US$m | US$m | US$m | US$m | |||||||||||||||||||
At 31 December 2012 | ||||||||||||||||||||||
HSBC | ||||||||||||||||||||||
Foreign exchange | 27,869 | 11,156 | 4,413,532 | 4,452,557 | ||||||||||||||||||
Interest rate | 837,604 | 12,316,673 | 8,459,665 | 21,613,942 | ||||||||||||||||||
Equity | 225,452 | – | 270,216 | 495,668 | ||||||||||||||||||
Credit | – | 73,281 | 828,226 | 901,507 | ||||||||||||||||||
Commodity and other | 19,006 | – | 61,213 | 80,219 | ||||||||||||||||||
| 1,109,931 | 12,401,110 | 14,032,852 | 27,543,893 | |||||||||||||||||||
The purpose for which HSBC uses derivatives is set out in Note 19 on the Financial Statements.
145
Table of Contents
HSBC HOLDINGS PLC
Report of the Directors: Operating and Financial Review(continued)
Maximum exposure to credit risk
(Audited)
| At 31 December 2012 |
| At 31 December 2011 | ||||||||||||||||||||||||||||||||
| Maximum exposure US$m | Offset US$m | Net US$m | Maximum exposure US$m | Offset US$m | Net US$m | |||||||||||||||||||||||||||||
Cash and balances at central banks | 141,532 | – | 141,532 | 129,902 | – | 129,902 | ||||||||||||||||||||||||||||
Items in the course of collection from other banks | 7,303 | – | 7,303 | 8,208 | – | 8,208 | ||||||||||||||||||||||||||||
Hong Kong Government certificates of indebtedness | 22,743 | – | 22,743 | 20,922 | – | 20,922 | ||||||||||||||||||||||||||||
Trading assets | 367,177 | (19,700 | ) | 347,477 | 309,449 | (4,656 | ) | 304,793 | ||||||||||||||||||||||||||
Treasury and other eligible bills | 26,282 | – | 26,282 | 34,309 | – | 34,309 | ||||||||||||||||||||||||||||
Debt securities | 144,677 | – | 144,677 | 130,487 | – | 130,487 | ||||||||||||||||||||||||||||
Loans and advances to banks | 78,271 | – | 78,271 | 75,525 | – | 75,525 | ||||||||||||||||||||||||||||
Loans and advances to customers | 117,947 | (19,700 | ) | 98,247 | 69,128 | (4,656 | ) | 64,472 | ||||||||||||||||||||||||||
Financial assets designated at fair value | 12,714 | – | 12,714 | 12,926 | – | 12,926 | ||||||||||||||||||||||||||||
Treasury and other eligible bills | 54 | – | 54 | 123 | – | 123 | ||||||||||||||||||||||||||||
Debt securities | 12,551 | – | 12,551 | 11,834 | – | 11,834 | ||||||||||||||||||||||||||||
Loans and advances to banks | 55 | – | 55 | 119 | – | 119 | ||||||||||||||||||||||||||||
Loans and advances to customers | 54 | – | 54 | 850 | – | 850 | ||||||||||||||||||||||||||||
Derivatives | 357,450 | (310,859 | ) | 46,591 | 346,379 | (305,616 | ) | 40,763 | ||||||||||||||||||||||||||
Loans and advances held at amortised cost | 1,150,169 | (95,578 | ) | 1,054,591 | 1,121,416 | (87,978 | ) | 1,033,438 | ||||||||||||||||||||||||||
– to banks | 152,546 | (3,732 | ) | 148,814 | 180,987 | (3,066 | ) | 177,921 | ||||||||||||||||||||||||||
– to customers | 997,623 | (91,846 | ) | 905,777 | 940,429 | (84,912 | ) | 855,517 | ||||||||||||||||||||||||||
Financial investments | 415,312 | – | 415,312 | 392,834 | – | 392,834 | ||||||||||||||||||||||||||||
Treasury and other similar bills | 87,550 | – | 87,550 | 65,223 | – | 65,223 | ||||||||||||||||||||||||||||
Debt securities | 327,762 | – | 327,762 | 327,611 | – | 327,611 | ||||||||||||||||||||||||||||
Assets held for sale | 9,292 | (164 | ) | 9,128 | 37,808 | (204 | ) | 37,604 | ||||||||||||||||||||||||||
– disposal groups | 5,359 | (164 | ) | 5,195 | 37,746 | (204 | ) | 37,542 | ||||||||||||||||||||||||||
– non-current assets held for sale | 3,933 | – | 3,933 | 62 | – | 62 | ||||||||||||||||||||||||||||
Other assets | 31,983 | – | 31,983 | 32,992 | – | 32,992 | ||||||||||||||||||||||||||||
Endorsements and acceptances | 12,032 | – | 12,032 | 11,010 | – | 11,010 | ||||||||||||||||||||||||||||
Other | 19,951 | – | 19,951 | 21,982 | – | 21,982 | ||||||||||||||||||||||||||||
Financial guarantees and similar contracts | 44,993 | – | 44,993 | 39,324 | – | 39,324 | ||||||||||||||||||||||||||||
Loan and other credit-related commitments3 | 579,469 | – | 579,469 | 654,904 | – | 654,904 | ||||||||||||||||||||||||||||
| 3,140,137 | (426,301 | ) | 2,713,836 | 3,107,064 | (398,454 | ) | 2,708,610 | |||||||||||||||||||||||||||
For footnote, see page 249.
Loan and other credit-related commitments
(Unaudited)
| Asia US$m | Europe US$m | Americas US$m | Total US$m | |||||||||||||||||||
At 31 December 2012 | ||||||||||||||||||||||
Personal | 79,021 | 80,596 | 31,566 | 191,183 | ||||||||||||||||||
Corporate and commercial | 139,897 | 91,957 | 110,401 | 342,255 | ||||||||||||||||||
Financial | 10,330 | 15,080 | 20,621 | 46,031 | ||||||||||||||||||
| 229,248 | 187,633 | 162,588 | 579,469 | |||||||||||||||||||
At 31 December 2011 | ||||||||||||||||||||||
Personal | 76,901 | 76,658 | 139,458 | 293,017 | ||||||||||||||||||
Corporate and commercial | 122,618 | 84,797 | 101,861 | 309,276 | ||||||||||||||||||
Financial | 8,646 | 21,060 | 22,905 | 52,611 | ||||||||||||||||||
| 208,165 | 182,515 | 264,224 | 654,904 | |||||||||||||||||||
A description of loan and other credit related commitments is set out in Note 40 on the Financial Statements. The reduction in the total amount from 2011 to 2012 is mainly due to the disposal of the US
Cards business and US branch network in 2012. In the table above, Asia includes amounts in Hong Kong, Rest of Asia-Pacific and the Middle East and North Africa.
146
Table of Contents
HSBC HOLDINGS PLC
Report of the Directors: Operating and Financial Review(continued)
(Unaudited)
We provide a broad range of secured and unsecured personal lending products to meet customer needs. Given the diverse nature of the markets in which we operate, the range is not standard across all countries but is tailored to meet the demands of individual markets.
Personal lending includes advances to customers for asset purchases, such as residential property, where the loans are typically secured by the assets being acquired. We also offer loans secured on existing assets, such as first and second liens on residential property; unsecured lending products such as overdrafts, credit cards and payroll loans; and debt consolidation loans which may be secured or unsecured.
(Unaudited)
| UK US$m | Rest of Europe US$m | Hong Kong | US4 US$m | Rest of North America US$m | Other regions5 | Total US$m | ||||||||||||||||||||||||||||||||||||
At 31 December 2012 | ||||||||||||||||||||||||||||||||||||||||||
First lien residential mortgages | 127,024 | 8,148 | 52,296 | 49,417 | 20,716 | 44,261 | 301,862 | |||||||||||||||||||||||||||||||||||
Other personal lending | 23,446 | 27,656 | 18,045 | 7,382 | 6,839 | 29,863 | 113,231 | |||||||||||||||||||||||||||||||||||
– motor vehicle finance | – | 24 | – | – | 20 | 3,871 | 3,915 | |||||||||||||||||||||||||||||||||||
– credit cards | 11,369 | 3,060 | 5,930 | 821 | 735 | 8,881 | 30,796 | |||||||||||||||||||||||||||||||||||
– second lien residential mortgages | 508 | – | – | 5,959 | 363 | 131 | 6,961 | |||||||||||||||||||||||||||||||||||
– other | 11,569 | 24,572 | 12,115 | 602 | 5,721 | 16,980 | 71,559 | |||||||||||||||||||||||||||||||||||
| ||||||||||||||||||||||||||||||||||||||||||
Total personal lending (A) | 150,470 | 35,804 | 70,341 | 56,799 | 27,555 | 74,124 | 415,093 | |||||||||||||||||||||||||||||||||||
Impairment allowances on personal lending | ||||||||||||||||||||||||||||||||||||||||||
First lien residential mortgages | (425 | ) | (64 | ) | (4 | ) | (4,133 | ) | (30 | ) | (249 | ) | (4,905 | ) | ||||||||||||||||||||||||||||
Other personal lending | (576 | ) | (401 | ) | (57 | ) | (590 | ) | (94 | ) | (1,589 | ) | (3,307 | ) | ||||||||||||||||||||||||||||
– motor vehicle finance | – | (4 | ) | – | – | (1 | ) | (144 | ) | (149 | ) | |||||||||||||||||||||||||||||||
– credit cards | (150 | ) | (184 | ) | (28 | ) | (40 | ) | (14 | ) | (385 | ) | (801 | ) | ||||||||||||||||||||||||||||
– second lien residential mortgages | (44 | ) | – | – | (542 | ) | (6 | ) | – | (592 | ) | |||||||||||||||||||||||||||||||
– other | (382 | ) | (213 | ) | (29 | ) | (8 | ) | (73 | ) | (1,060 | ) | (1,765 | ) | ||||||||||||||||||||||||||||
| ||||||||||||||||||||||||||||||||||||||||||
Total | (1,001 | ) | (465 | ) | (61 | ) | (4,723 | ) | (124 | ) | (1,838 | ) | (8,212 | ) | ||||||||||||||||||||||||||||
– as a percentage of A | 0.7% | 1.3% | 0.1% | 8.3% | 0.5% | 2.5% | 2.0% | |||||||||||||||||||||||||||||||||||
At 31 December 2011 | ||||||||||||||||||||||||||||||||||||||||||
First lien residential mortgages | 111,224 | 8,678 | 46,817 | 52,484 | 20,794 | 38,966 | 278,963 | |||||||||||||||||||||||||||||||||||
Other personal lending | 22,218 | 24,027 | 16,364 | 14,087 | 7,971 | 29,995 | 114,662 | |||||||||||||||||||||||||||||||||||
– motor vehicle finance | – | 24 | – | 20 | 29 | 4,494 | 4,567 | |||||||||||||||||||||||||||||||||||
– credit cards | 11,279 | 2,192 | 5,304 | 833 | 1,262 | 8,618 | 29,488 | |||||||||||||||||||||||||||||||||||
– second lien residential mortgages | 694 | – | – | 7,063 | 468 | 233 | 8,458 | |||||||||||||||||||||||||||||||||||
– other | 10,245 | 21,811 | 11,060 | 6,171 | 6,212 | 16,650 | 72,149 | |||||||||||||||||||||||||||||||||||
| ||||||||||||||||||||||||||||||||||||||||||
Total personal lending (B) | 133,442 | 32,705 | 63,181 | 66,571 | 28,765 | 68,961 | 393,625 | |||||||||||||||||||||||||||||||||||
Impairment allowances on personal lending | ||||||||||||||||||||||||||||||||||||||||||
First lien residential mortgages | (383 | ) | (58 | ) | (12 | ) | (4,551 | ) | (27 | ) | (290 | ) | (5,321 | ) | ||||||||||||||||||||||||||||
Other personal lending | (745 | ) | (366 | ) | (52 | ) | (1,659 | ) | (109 | ) | (1,508 | ) | (4,439 | ) | ||||||||||||||||||||||||||||
– motor vehicle finance | – | (4 | ) | – | – | – | (164 | ) | (168 | ) | ||||||||||||||||||||||||||||||||
– credit cards | (177 | ) | (148 | ) | (22 | ) | (46 | ) | (35 | ) | (406 | ) | (834 | ) | ||||||||||||||||||||||||||||
– second lien residential mortgages | (42 | ) | (1 | ) | – | (740 | ) | (9 | ) | – | (792 | ) | ||||||||||||||||||||||||||||||
– other | (526 | ) | (213 | ) | (30 | ) | (873 | ) | (65 | ) | (938 | ) | (2645 | ) | ||||||||||||||||||||||||||||
| ||||||||||||||||||||||||||||||||||||||||||
Total | (1,128 | ) | (424 | ) | (64 | ) | (6,210 | ) | (136 | ) | (1,798 | ) | (9,760 | ) | ||||||||||||||||||||||||||||
– as a percentage of B | 0.8% | 1.3% | 0.1% | 9.3% | 0.5% | 2.6% | 2.5% | |||||||||||||||||||||||||||||||||||
For footnotes, see page 249.
147
Table of Contents
HSBC HOLDINGS PLC
Report of the Directors: Operating and Financial Review(continued)
In 2012, the credit quality of the majority of our personal lending portfolios improved, reflecting the continued low levels of interest rates and strong customer repayments in many markets, as well as actions taken in previous years to tighten our lending criteria and focus on higher quality and secured assets.
In the US, the origination of new personal lending was limited as we have discontinued all new consumer finance real estate lending following the closure of the consumer finance distribution network. Customer lending balances across HSBC Finance portfolios continued to decline and, in May and August 2012 respectively, we completed the sales of the Card and Retail Services business and non-strategic branches, in the US. We continue to explore options to accelerate the liquidation of the CML portfolio and, to this effect, reclassified certain non-real estate personal loan balances, net of impairment allowances, to ‘Assets held for sale’ as we actively marketed this portfolio.
The commentary that follows is on a constant currency basis.
At 31 December 2012, the Group’s exposure to personal lending was US$415bn, 3% higher than at 31 December 2011, reflecting a rise in first lien residential mortgage lending, partly offset by a reduction in other personal lending. Loan impairment allowances on our personal lending portfolios were US$8.2bn compared with US$9.8bn at the end of 2011, while the ratio of loan impairment allowances to total personal lending reduced from 2.4% at 31 December 2011 to 2.0% at 31 December 2012. This decline reflected volume and performance-based improvements, predominantly in our US portfolios, due to the continued run-off of the CML portfolio as well as the reclassification of impairment allowances on non-real estate personal loan balances to ‘Assets held for sale’. We also continued to focus on growing our lower-risk residential mortgage portfolios in the UK, Hong Kong and rest of Asia-Pacific, where our loss experience and impairment allowance requirements are typically lower.
Loan impairment charges in our personal lending portfolios were US$5.4bn in 2012, US$3.8bn or 41% lower than in 2011 and representing 66% of the overall Group’s LICs. The decline was predominantly in the US reflecting the reduction in balances in the CML portfolio and the sale of the Card and Retail Services business in May 2012.
At 31 December 2012, total personal lending increased by US$13.7bn reflecting growth in first lien residential mortgages, notably in the UK, Hong Kong and Rest of Asia-Pacific. Balances in the UK increased following the success of marketing campaigns and competitive pricing. The rise in Hong Kong reflected the low interest rate environment and active property market, whereas growth in the Rest of Asia-Pacific, mainly in Singapore, mainland China, Australia and Malaysia, reflected the continued strength of property markets and expansion of our distribution network.
Total personal lending balances in the US at 31 December 2012 were US$57bn, a decrease of 15% compared with the end of 2011. The decline reflected the run-off of our CML portfolio, which also fell due to the reclassification of non-real estate personal loan balances to ‘Assets held for sale’.
In Latin America, personal lending decreased by 4% compared with 31 December 2011, following a reduction in other personal lending in Brazil, where we managed down our exposure to non-strategic portfolios and focused on higher quality lending including first lien residential mortgage lending. This complemented a range of corrective actions, including improving our collections capabilities, reducing third party originations and improving credit scoring models. These actions were implemented to limit our exposure to further market weakness following a rise in delinquency in 2011 which continued in 2012. We also reclassified lending balances in Colombia, Paraguay and Peru to ‘Assets held for sale’.
(Unaudited)
We offer a wide range of mortgage products designed to meet customer needs, including capital repayment, interest-only, affordability and offset mortgages.
Group credit policy prescribes the range of acceptable residential property loan-to-value (‘LTV’) thresholds with the maximum upper limit for new loans set between 75% and 95%. Specific LTV thresholds and debt-to-income ratios are managed at regional and country levels and, although the parameters must comply with Group policy, strategy and risk appetite, they differ in the various locations in which we operate to reflect the local economic and housing market conditions, regulations, portfolio performance, pricing and other product features.
148
Table of Contents
HSBC HOLDINGS PLC
Report of the Directors: Operating and Financial Review(continued)
The commentary that follows is on a constant currency basis.
At 31 December 2012, total mortgage lending, comprising first lien and second lien residential
mortgages, was US$309bn, 5% higher than at the end of 2011. Our most significant concentrations of mortgage lending were in the UK, the US and Hong Kong.
(Unaudited)
| UK US$m | Rest of Europe US$m | Hong Kong | US4 US$m | Rest of North | Other regions5 | Total US$m | ||||||||||||||||||||||||||||||||||
At 31 December 2012 | ||||||||||||||||||||||||||||||||||||||||
First lien residential mortgages | 127,024 | 8,148 | 52,296 | 49,417 | 20,716 | 44,261 | 301,862 | |||||||||||||||||||||||||||||||||
Second lien residential mortgages | 508 | – | – | 5,959 | 363 | 131 | 6,961 | |||||||||||||||||||||||||||||||||
Total mortgage lending (A) | 127,532 | 8,148 | 52,296 | 55,376 | 21,079 | 44,392 | 308,823 | |||||||||||||||||||||||||||||||||
Second lien as a percentage of A | 0.4% | – | 0.0% | 10.8% | 1.7% | 0.3% | 2.3% | |||||||||||||||||||||||||||||||||
Impairment allowances on mortgage lending | (469 | ) | (64 | ) | (4 | ) | (4,675 | ) | (36 | ) | (249 | ) | (5,497 | ) | ||||||||||||||||||||||||||
First lien residential mortgages | (425 | ) | (64 | ) | (4 | ) | (4,133 | ) | (30 | ) | (249 | ) | (4,905 | ) | ||||||||||||||||||||||||||
Second lien residential mortgages | (44 | ) | – | – | (542 | ) | (6 | ) | – | (592 | ) | |||||||||||||||||||||||||||||
Interest-only (including offset) mortgages | 49,650 | 52 | 30 | – | 531 | 1,146 | 51,409 | |||||||||||||||||||||||||||||||||
Affordability mortgages, including adjustable-rate mortgages (‘ARM’s) | 6 | 532 | 19 | 18,456 | – | 5,135 | 24,148 | |||||||||||||||||||||||||||||||||
Other | 99 | – | – | – | – | 204 | 303 | |||||||||||||||||||||||||||||||||
Total interest-only, affordability mortgages and other | 49,755 | 584 | 49 | 18,456 | 531 | 6,485 | 75,860 | |||||||||||||||||||||||||||||||||
– as a percentage of A | 39.0% | 7.2% | 0.1% | 33.3% | 2.5% | 14.6% | 24.6% | |||||||||||||||||||||||||||||||||
At 31 December 2011 | ||||||||||||||||||||||||||||||||||||||||
First lien residential mortgages | 111,224 | 8,678 | 46,817 | 52,484 | 20,794 | 38,966 | 278,963 | |||||||||||||||||||||||||||||||||
Second lien residential mortgages | 694 | – | – | 7,063 | 468 | 233 | 8,458 | |||||||||||||||||||||||||||||||||
Total mortgage lending (B) | 111,918 | 8,678 | 46,817 | 59,547 | 21,262 | 39,199 | 287,421 | |||||||||||||||||||||||||||||||||
Second lien as a percentage of B | 0.6% | – | – | 11.9% | 2.2% | 0.6% | 2.9% | |||||||||||||||||||||||||||||||||
Impairment allowances on mortgage lending | (425 | ) | (59 | ) | (12 | ) | (5,291 | ) | (36 | ) | (290 | ) | (6,113 | ) | ||||||||||||||||||||||||||
First lien residential mortgages | (383 | ) | (58 | ) | (12 | ) | (4,551 | ) | (27 | ) | (290 | ) | (5,321 | ) | ||||||||||||||||||||||||||
Second lien residential mortgages | (42 | ) | (1 | ) | – | (740 | ) | (9 | ) | – | (792 | ) | ||||||||||||||||||||||||||||
Interest-only (including offset) mortgages | 46,886 | 48 | 46 | – | 667 | 1,210 | 48,857 | |||||||||||||||||||||||||||||||||
Affordability mortgages, including ARMs | 177 | 496 | 31 | 17,089 | 277 | 6,863 | 24,933 | |||||||||||||||||||||||||||||||||
Other | 106 | – | – | – | – | 189 | 295 | |||||||||||||||||||||||||||||||||
Total interest-only, affordability mortgages and other | 47,169 | 544 | 77 | 17,089 | 944 | 8,262 | 74,085 | |||||||||||||||||||||||||||||||||
– as a percentage of B | 42.1% | 6.3% | 0.2% | 28.7% | 4.4% | 21.1% | 25.8% | |||||||||||||||||||||||||||||||||
For footnotes, see page 249.
Mortgage lending in the UK was US$128bn at 31 December 2012, representing the Group’s largest concentration of mortgage exposure, an increase of 9% compared with the end of 2011.
The credit quality of our UK mortgage portfolio remained high, reflecting actions taken in previous years which included restrictions on lending to purchase residential property for the purpose of
149
Table of Contents
HSBC HOLDINGS PLC
Report of the Directors: Operating and Financial Review(continued)
rental. Almost all lending was originated through our own sales force, and the self-certification of income was not permitted. The majority of our mortgage lending in the UK was to existing customers who held current or savings accounts with HSBC. The average LTV ratio for new business was 59% during December 2012, while loan impairment charges and delinquency levels in our UK mortgage book remained stable, aided by the continued low levels of interest rates.
Interest-only mortgage products in the UK totalled US$50bn or 39% of the UK mortgage portfolio, US$23bn or (47%) of which related to the first direct offset product where customers may adopt a capital repayment profile or make significant regular or one-off repayments, but are able to redraw additional funds within the agreed limit.
Our affordability underwriting criteria for interest-only products are consistent with those for equivalent capital repayment mortgages, and such products are typically originated at more conservative LTV ratios. We monitor specific risk characteristics within the interest-only portfolio, such as current LTV ratio, age at expiry, current income levels and credit bureau scores. There are currently no concentrations of higher risk characteristics that cause the interest-only portfolio to be considered as carrying unduly high credit risk, and delinquency and impairment charges remain low, demonstrating similar performance characteristics to our capital repayment products. We run contact programmes to ensure we build an informed relationship with customers whereby they receive the appropriate support in meeting the final repayment of principal and understand the alternative repayment options available.
In Hong Kong, mortgage lending was US$52bn, an increase of 11% compared with the end of 2011. The quality of our mortgage book was strong with loan impairment charges at very low levels. The average LTV ratio on new mortgage lending was 48% and the average LTV for the overall portfolio was 32%.
Mortgage balances in Rest of Asia-Pacific grew by 10% to US$37bn, mainly in Singapore, mainland China, Australia and Malaysia reflecting the continued strength of property markets and expansion of our distribution networks.
(Unaudited)
In the US, total mortgage lending balances were US$ 55bn at 31 December 2012, a decline of 7% compared with the end of 2011. Overall, US mortgage lending represented 13% of our total personal lending and 18% of our total mortgage lending, compared with 15% and 20%, respectively, at 31 December 2011.
HSBC Finance
At 31 December 2012, mortgage lending balances at HSBC Finance were US$39bn, a decline of 12% compared with the end of 2011 due to the continued run-off of the CML portfolio.
Our CML portfolio continued to be affected by high unemployment levels and a housing market that is slow to recover. In addition, our loan modification programmes, which are designed to manage customer relationships, improve cash collections and avoid foreclosure, contributed to slower loan repayment rates.
HSBC Finance US CML6– residential mortgages
(Unaudited)
| At 31 December | ||||||||||
2012 US$m | 2011 US$m | |||||||||
Residential mortgages | ||||||||||
First lien | 35,092 | 39,608 | ||||||||
Second lien | 3,651 | 4,520 | ||||||||
Total (A) | 38,743 | 44,128 | ||||||||
Impairment allowances | 4,480 | 5,088 | ||||||||
– as a percentage of (A) | 11.6% | 11.5% | ||||||||
For footnote, see page 249.
HSBC Bank USA
In HSBC Bank USA, we continued to sell a substantial portion of new originations to the secondary market as a means of managing our interest rate risk and improving structural liquidity. Mortgage lending balances of US$17bn at 31 December 2012 remained broadly unchanged compared with the end of 2011, despite an increase in first lien residential mortgages, driven by increased origination to our Premier customers including higher balances of adjustable-rate mortgages. This was offset by a decline in other mortgages.
150
Table of Contents
HSBC HOLDINGS PLC
Report of the Directors: Operating and Financial Review(continued)
Credit quality of personal lending in the US
(Unaudited)
For further information on renegotiated loans in North America, see page 158.
Mortgage lending
In our CML first lien residential mortgage portfolio, two months and over delinquent balances were US$7.6bn at 31 December 2012, compared with US$7.9bn at 31 December 2011. The decline mainly reflected the continued run-off of balances and the improvement in economic conditions. The reduction was partly offset by the increase in late stage delinquency driven by the suspension of foreclosure activities which began in late 2010. In our HSBC Bank USA portfolio, two months and over delinquent balances increased by 8% to US$1.4bn due also to foreclosure delays.
In the US, second lien mortgage balances declined by 16% to US$6.0bn at 31 December 2012, representing 11% of the overall US mortgage lending portfolio. Two months and over delinquent
balances were US$477m at 31 December 2012 compared with US$674m at 31 December 2011.
The majority of second lien residential mortgages are taken up by customers who hold a first lien mortgage issued by a third party. Second lien residential mortgage loans have a risk profile characterised by higher LTV ratios, because in the majority of cases the loans were taken out to complete the refinancing of properties. Loss severity on default of second lien loans has typically approached 100% of the amount outstanding, as any equity in the property is consumed through the repayment of the first lien loan.
Impairment allowances for these loans are determined by applying a roll-rate migration analysis which captures the propensity of these loans to default based on past experience. Once we believe that a second lien residential mortgage loan is likely to progress to write-off, the loss severity assumed in establishing our impairment allowance is close to 100% in the CML portfolios, and more than 80% in HSBC Bank USA.
HSBC Finance: foreclosed properties in the US
(Unaudited)
| Year ended | Half-year ended | Year ended 2011 | ||||||||||||||
31 December 2012 | 31 December 2012 | 30 June 2012 | ||||||||||||||
Number of foreclosed properties at end of period | 2,973 | 2,973 | 2,836 | 3,511 | ||||||||||||
Number of properties added to foreclosed inventory in the period | 6,827 | 3,212 | 3,615 | 11,187 | ||||||||||||
Average loss on sale of foreclosed properties7 | 6% | 6% | 7% | 8% | ||||||||||||
Average total loss on foreclosed properties8 | 54% | 53% | 55% | 56% | ||||||||||||
Average time to sell foreclosed properties (days) | 172 | 166 | 179 | 185 | ||||||||||||
For footnotes, see page 249.
In late 2010, we suspended all new foreclosure proceedings and, in early 2011, ceased foreclosures where judgement had yet to be entered while we enhanced our processes. We have now resumed the processing of suspended foreclosures in substantially all states, although there remains a significant backlog which will take time to resolve. Loss severities may be increased by any additional delays in the processing of foreclosures.
The number of foreclosed properties at HSBC Finance at 31 December 2012 decreased compared with the end of December 2011 as the rate at which properties were added to real estate owned inventory was slow as a result of the backlog in foreclosure activities and the continuing sales of these properties during 2012. We expect that the number of foreclosed
properties added to the inventory will increase and this will continue to be affected by ongoing refinements to our processes and extended foreclosure timelines.
The average total loss on foreclosed properties and the average loss on sale of foreclosed properties decreased compared with 2011. This reflected a greater proportion of properties sold where we had accepted a deed-in-lieu. Typically, losses on a deed-in-lieu are lower than losses from properties acquired through a standard foreclosure process. The decrease in the loss on sale also reflected a slowdown in the rate of decline in house prices during 2012 and, in some markets, improvements in pricing compared with 2011.
151
Table of Contents
HSBC HOLDINGS PLC
Report of the Directors: Operating and Financial Review(continued)
Valuation of foreclosed properties in the US
We obtain real estate by foreclosing on the collateral pledged as security for residential mortgages. Prior to foreclosure, carrying amounts of the loans in excess of fair value less costs to sell are written down to the discounted cash flows expected to be recovered, including from the sale of the property. Broker price opinions are obtained and updated every 180 days and real estate price trends are reviewed quarterly to reflect any improvement or additional deterioration. Our methodology is regularly validated by comparing the discounted cash flows expected to be recovered based on current market conditions (including estimated cash flows from the sale of the property) to the updated broker price opinion, adjusted for the estimated historical difference between interior and exterior appraisals. The fair values of foreclosed properties are initially determined based on broker price opinions. Within 90 days of foreclosure, a more detailed property valuation is performed reflecting information obtained from a physical interior inspection of the property and additional allowances or write-downs are recorded as appropriate. Updates to the valuation are performed no less than once every 45 days until the property is sold, with declines or increases recognised through changes to allowances. |
Credit cards
In the first half of 2012 we completed the sale of our US Card and Retail Services business, transferring general and private label credit card lending balances to the purchaser. The residual balances in the US at 31 December 2012 were related to HSBC Bank USA’s credit card programme.
Personal non-credit card lending
Personal non-credit card lending balances and two months and over delinquent balances in the US fell, largely due to the reclassification of non-real estate personal loan balances to ‘Assets held for sale’ and portfolio run-off, as this business is closed to new advances.
Trends in two months and over contractual delinquency in the US
(Unaudited)
| At 31 December | ||||||||||||||||
| 2012 US$m | 2011 US$m | 2010 US$m | ||||||||||||||
In personal lending in the US | ||||||||||||||||
First lien residential mortgages | 8,926 | 9,065 | 8,632 | |||||||||||||
Consumer and Mortgage Lending | 7,629 | 7,922 | 7,618 | |||||||||||||
Other mortgage lending | 1,297 | 1,143 | 1,014 | |||||||||||||
Second lien residential mortgages | 477 | 674 | 847 | |||||||||||||
Consumer and Mortgage Lending | 350 | 501 | 668 | |||||||||||||
Other mortgage lending | 127 | 173 | 179 | |||||||||||||
Credit card | 27 | 714 | 957 | |||||||||||||
Private label | – | 316 | 404 | |||||||||||||
Personal non-credit card | 335 | 513 | 811 | |||||||||||||
Total | 9,765 | 11,282 | 11,651 | |||||||||||||
| % | % | % | ||||||||||||||
As a percentage of the relevant loans and receivables balances | ||||||||||||||||
First lien residential mortgages | 18.1 | 17.1 | 15.0 | |||||||||||||
Second lien residential mortgages | 8.0 | 8.5 | 9.1 | |||||||||||||
Credit card | 3.3 | 3.8 | 4.7 | |||||||||||||
Private label | – | 2.5 | 3.0 | |||||||||||||
Personal non-credit card | 7.4 | 8.3 | 9.5 | |||||||||||||
Total | 16.1 | 11.4 | 10.7 | |||||||||||||
(Unaudited)
Wholesale lending covers the range of credit facilities granted to sovereign borrowers, banks, non-bank financial institutions, corporate entities
and commercial borrowers. Our wholesale portfolios are well diversified across geographical and industry sectors, with certain exposures subject to specific portfolio controls.
152
Table of Contents
HSBC HOLDINGS PLC
Report of the Directors: Operating and Financial Review(continued)
(Unaudited)
| Europe US$m | Hong Kong | Rest of Asia- Pacific | MENA US$m | North America US$m | Latin America US$m | Total US$m | ||||||||||||||||||||||||||||||||||
At 31 December 2012 | ||||||||||||||||||||||||||||||||||||||||
Corporate and commercial | 223,061 | 99,199 | 85,305 | 22,452 | 47,886 | 35,590 | 513,493 | |||||||||||||||||||||||||||||||||
– Manufacturing | 56,690 | 10,354 | 19,213 | 3,373 | 9,731 | 12,788 | 112,149 | |||||||||||||||||||||||||||||||||
– International trade and services | 70,954 | 33,832 | 32,317 | 9,115 | 13,419 | 9,752 | 169,389 | |||||||||||||||||||||||||||||||||
– Commercial real estate | 33,279 | 23,384 | 9,286 | 865 | 6,572 | 3,374 | 76,760 | |||||||||||||||||||||||||||||||||
– Other property-related | 7,402 | 16,399 | 6,641 | 2,103 | 7,607 | 380 | 40,532 | |||||||||||||||||||||||||||||||||
– Government | 2,393 | 2,838 | 1,136 | 1,662 | 774 | 1,982 | 10,785 | |||||||||||||||||||||||||||||||||
– Other commercial9 | 52,343 | 12,392 | 16,712 | 5,334 | 9,783 | 7,314 | 103,878 | |||||||||||||||||||||||||||||||||
| Financial (non-bank financial institutions) | 55,732 | 4,546 | 4,255 | 1,196 | 13,935 | 1,594 | 81,258 | |||||||||||||||||||||||||||||||||
Asset-backed securities reclassified | 3,694 | – | – | – | 197 | – | 3,891 | |||||||||||||||||||||||||||||||||
Loans and advances to banks | 45,320 | 23,500 | 44,592 | 9,198 | 13,465 | 16,528 | 152,603 | |||||||||||||||||||||||||||||||||
Total wholesale lending (A) | 327,807 | 127,245 | 134,152 | 32,846 | 75,483 | 53,712 | 751,245 | |||||||||||||||||||||||||||||||||
Impairment allowances on wholesale lending | ||||||||||||||||||||||||||||||||||||||||
Corporate and commercial | 3,537 | 383 | 526 | 1,312 | 732 | 856 | 7,346 | |||||||||||||||||||||||||||||||||
– Manufacturing | 611 | 86 | 129 | 210 | 84 | 287 | 1,407 | |||||||||||||||||||||||||||||||||
– International trade and services | 992 | 233 | 185 | 360 | 189 | 329 | 2,288 | |||||||||||||||||||||||||||||||||
– Commercial real estate | 1,011 | 5 | 62 | 156 | 214 | 103 | 1,551 | |||||||||||||||||||||||||||||||||
– Other property-related | 164 | 20 | 81 | 241 | 102 | 13 | 621 | |||||||||||||||||||||||||||||||||
– Government | 15 | – | – | 42 | 2 | – | 59 | |||||||||||||||||||||||||||||||||
– Other commercial | 744 | 39 | 69 | 303 | 141 | 124 | 1,420 | |||||||||||||||||||||||||||||||||
Financial (non-bank financial institutions) | 318 | 29 | 11 | 157 | 37 | 2 | 554 | |||||||||||||||||||||||||||||||||
Loans and advances to banks | 40 | – | – | 17 | – | – | 57 | |||||||||||||||||||||||||||||||||
Total | 3,895 | 412 | 537 | 1,486 | 769 | 858 | 7,957 | |||||||||||||||||||||||||||||||||
– as a percentage of A | 1.19% | 0.32% | 0.40% | 4.52% | 1.02% | 1.60% | 1.06% | |||||||||||||||||||||||||||||||||
At 31 December 2011 | ||||||||||||||||||||||||||||||||||||||||
Corporate and commercial | 204,984 | 91,592 | 77,887 | 21,152 | 41,271 | 35,930 | 472,816 | |||||||||||||||||||||||||||||||||
– Manufacturing | 45,632 | 9,004 | 16,909 | 3,517 | 7,888 | 13,104 | 96,054 | |||||||||||||||||||||||||||||||||
– International trade and services | 64,604 | 29,066 | 29,605 | 8,664 | 10,710 | 10,060 | 152,709 | |||||||||||||||||||||||||||||||||
– Commercial real estate | 32,099 | 20,828 | 9,537 | 1,002 | 7,069 | 3,406 | 73,941 | |||||||||||||||||||||||||||||||||
– Other property-related | 7,595 | 17,367 | 6,396 | 1,770 | 5,729 | 682 | 39,539 | |||||||||||||||||||||||||||||||||
– Government | 3,143 | 2,918 | 962 | 1,563 | 656 | 1,837 | 11,079 | |||||||||||||||||||||||||||||||||
– Other commercial9 | 51,911 | 12,409 | 14,478 | 4,636 | 9,219 | 6,841 | 99,494 | |||||||||||||||||||||||||||||||||
Financial (non-bank financial institutions) | 63,671 | 3,473 | 3,183 | 1,168 | 12,817 | 1,907 | 86,219 | |||||||||||||||||||||||||||||||||
Asset-backed securities reclassified | 4,776 | – | – | – | 504 | – | 5,280 | |||||||||||||||||||||||||||||||||
Loans and advances to banks | 54,406 | 35,159 | 47,309 | 8,571 | 14,831 | 20,836 | 181,112 | |||||||||||||||||||||||||||||||||
Total wholesale lending (B) | 327,837 | 130,224 | 128,379 | 30,891 | 69,423 | 58,673 | 745,427 | |||||||||||||||||||||||||||||||||
Impairment allowances on wholesale lending | ||||||||||||||||||||||||||||||||||||||||
Corporate and commercial | 3,256 | 492 | 576 | 1,242 | 756 | 729 | 7,051 | |||||||||||||||||||||||||||||||||
– Manufacturing | 571 | 107 | 287 | 202 | 95 | 243 | 1,505 | |||||||||||||||||||||||||||||||||
– International trade and services | 962 | 316 | 154 | 428 | 166 | 298 | 2,324 | |||||||||||||||||||||||||||||||||
– Commercial real estate | 892 | 4 | 39 | 159 | 179 | 83 | 1,356 | |||||||||||||||||||||||||||||||||
– Other property-related | 155 | 15 | 22 | 154 | 154 | 16 | 516 | |||||||||||||||||||||||||||||||||
– Government | 4 | – | – | 28 | 1 | – | 33 | |||||||||||||||||||||||||||||||||
– Other commercial | 672 | 50 | 74 | 271 | 161 | 89 | 1,317 | |||||||||||||||||||||||||||||||||
Financial (non-bank financial institutions) | 435 | 26 | 11 | 149 | 76 | 3 | 700 | |||||||||||||||||||||||||||||||||
Loans and advances to banks | 49 | – | – | 17 | 59 | – | 125 | |||||||||||||||||||||||||||||||||
Total | 3,740 | 518 | 587 | 1,408 | 891 | 732 | 7,876 | |||||||||||||||||||||||||||||||||
– as a percentage of B | 1.14% | 0.40% | 0.46% | 4.56% | 1.28% | 1.25% | 1.06% | |||||||||||||||||||||||||||||||||
For footnote, see page 249.
153
Table of Contents
HSBC HOLDINGS PLC
Report of the Directors: Operating and Financial Review(continued)
Corporate and commercial lending, excluding commercial real estate and other property-related lending, increased from US$365bn at 31 December 2011 to US$400bn at 31 December 2012.
At 31 December 2012, this represented 39% of total gross loans and advances to customers, compared with 38% at 31 December 2011. The growth was mainly in the international trade and services sector, where balances mainly increased in Europe despite muted demand for credit and, in Hong Kong, driven by growth in trade finance volumes as we capitalised on trade and capital flows. In the manufacturing sector, balances increased in Europe due to growth in the UK of overdraft balances and corresponding customer accounts which did not meet netting criteria under accounting rules.
The aggregate of our commercial real estate and other property-related lending was US$117bn at 31 December 2012, 3% higher than at 31 December 2011, representing 12% of total loans and advances to customers. This growth was mainly in Hong Kong, where demand for funds remained strong despite a degree of market stabilisation after a sustained period of buoyancy in the property investment and property development sectors. Commercial real estate and other property-related lending also grew in North America due to an increase in originations in commercial mortgages, which reflected our continued focus on expanding our core offering to gain a larger presence in key growth markets, including the West Coast, Southeast and Midwest of the US.
For information on refinancing in commercial real estate lending, see page 128.
Financial (non-bank) lending decreased from US$86bn at 31 December 2011 to US$81bn at 31 December 2012. This was mainly in Europe due to a decline in reverse repo activity, partly offset by higher balances in North America, due to an increase in reverse repo balances in Canada, and in Hong Kong and Rest of Asia-Pacific, driven by an increase in loans drawn by financial planning companies, leasing companies and insurance companies reflecting higher demand for funds from a small number of corporates.
Loans and advances to banks decreased from US$181bn at 31 December 2011 to US$153bn at 31 December 2012. This was mainly driven by maturities and repayments in Hong Kong together
with a decline in reverse repos in Europe reflecting, in part, the redeployment of liquidity to central banks.
Credit quality of financial instruments
(Audited)
| A summary of our current policies and practices regarding the credit quality of financial instruments is provided in the Appendix to Risk on page 253. |
The five classifications describing the credit quality of our lending, debt securities portfolios and derivatives are defined on page 253. Additional credit quality information in respect of our consolidated holdings of ABSs is provided on page 259.
For the purpose of the following disclosure, retail loans which are past due up to 89 days and are not otherwise classified as impaired in accordance with our disclosure convention (see page 253), are not disclosed within the expected loss (‘EL’) grade to which they relate, but are separately classified as past due but not impaired.
(Unaudited)
We assess credit quality on all financial instruments which are subject to credit risk, as shown in the table on page 155. The balance of these financial instruments was US$2,516bn at 31 December 2012, an increase of 4% over 2011, of which US$1,690bn or 67% was classified as ‘strong’. This percentage declined marginally compared with 68% at 31 December 2011. The proportion of financial instruments classified as ‘good’ remained broadly stable at 16% and the proportion of ‘satisfactory’ balances increased marginally from 12% to 14%. The proportion of ‘sub-standard’ financial instruments remained low at 2% in both 2012 and 2011.
The proportion of trading assets classified as ‘strong’ declined from 75% to 65%. Overall trading assets rose, largely in Europe, due to an increase in holdings of debt securities from 2011’s subdued levels which, coupled with the downgrading of certain eurozone countries, resulted in an absolute and relative increase in debt securities classified as ‘good’. In addition, holdings of ‘strong’ treasury and other eligible bills fell both absolutely and relative to the rest of trading assets primarily in Hong Kong due to maturities without replacement of government bonds, while increased levels of reverse repo and stock lending balances with customers increased the proportion of ‘good’ and ‘satisfactory’ classifications compared with ‘strong’.
154
Table of Contents
HSBC HOLDINGS PLC
Report of the Directors: Operating and Financial Review(continued)
The proportion of financial investments categorised as ‘strong’ remained high at 86% and 87%, at 31 December 2012 and 31 December 2011 respectively, as the year-on-year increase in balances was mainly due to the deployment of surplus liquidity into highly-rated government, quasi-government and supranational debt securities in North America and Hong Kong.
The proportion of cash and balances at central banks considered ‘strong’ remained high at 98%, reflecting deployment of surplus liquidity into
central banks in Europe, Hong Kong and Rest of Asia-Pacific.
The proportion of loans and advances held at amortised cost and categorised as ‘strong’ remained broadly flat compared with the end of 2011 at 54%. Derivative balances classified as ‘strong’ declined marginally from 81% to 79%; the movement in balances was mainly in Europe reflecting fair value movements of existing contracts.
The following table shows our distribution of financial instruments by measures of credit quality:
Distribution of financial instruments by credit quality
(Audited)
| Neither past due nor impaired | Past due | Impair- | ||||||||||||||||||||||||||||||||||||||||||||
| Strong US$m | Good US$m | Satisfactory US$m | Sub- standard | but not impaired | Impaired US$m | ment allowances10 | Total US$m | |||||||||||||||||||||||||||||||||||||||
At 31 December 2012 | ||||||||||||||||||||||||||||||||||||||||||||||
Cash and balances at central banks | 138,124 | 3,235 | 147 | 26 | 141,532 | |||||||||||||||||||||||||||||||||||||||||
Items in the course of collection from other banks | 6,661 | 203 | 439 | – | 7,303 | |||||||||||||||||||||||||||||||||||||||||
Hong Kong Government certificates of indebtedness | 22,743 | – | – | – | 22,743 | |||||||||||||||||||||||||||||||||||||||||
Trading assets11 | 237,078 | 60,100 | 66,537 | 3,462 | 367,177 | |||||||||||||||||||||||||||||||||||||||||
– treasury and other eligible bills | 20,793 | 4,108 | 1,340 | 41 | 26,282 | |||||||||||||||||||||||||||||||||||||||||
– debt securities | 106,453 | 16,685 | 20,931 | 608 | 144,677 | |||||||||||||||||||||||||||||||||||||||||
– loans and advances: | 49,133 | 21,018 | 7,418 | 702 | 78,271 | |||||||||||||||||||||||||||||||||||||||||
to customers | 60,699 | 18,289 | 36,848 | 2,111 | 117,947 | |||||||||||||||||||||||||||||||||||||||||
Financial assets designated at fair value11 | 6,186 | 5,884 | 401 | 243 | 12,714 | |||||||||||||||||||||||||||||||||||||||||
– treasury and other eligible bills | 54 | – | – | – | 54 | |||||||||||||||||||||||||||||||||||||||||
– debt securities | 6,089 | 5,830 | 391 | 241 | 12,551 | |||||||||||||||||||||||||||||||||||||||||
– loans and advances: | 43 | – | 10 | 2 | 55 | |||||||||||||||||||||||||||||||||||||||||
to customers | – | 54 | – | – | 54 | |||||||||||||||||||||||||||||||||||||||||
Derivatives11 | 284,115 | 46,214 | 24,877 | 2,244 | 357,450 | |||||||||||||||||||||||||||||||||||||||||
Loans and advances held at amortised cost | 625,091 | 246,323 | 213,241 | 23,996 | 18,911 | 38,776 | (16,169 | ) | 1,150,169 | |||||||||||||||||||||||||||||||||||||
– to banks | 117,220 | 23,921 | 10,575 | 772 | 10 | 105 | (57 | ) | 152,546 | |||||||||||||||||||||||||||||||||||||
– to customers12 | 507,871 | 222,402 | 202,666 | 23,224 | 18,901 | 38,671 | (16,112 | ) | 997,623 | |||||||||||||||||||||||||||||||||||||
Financial investments | 357,452 | 27,428 | 21,143 | 6,759 | – | 2,530 | 415,312 | |||||||||||||||||||||||||||||||||||||||
– treasury and other similar bills | 80,320 | 3,818 | 1,957 | 1,455 | – | – | 87,550 | |||||||||||||||||||||||||||||||||||||||
– debt securities | 277,132 | 23,610 | 19,186 | 5,304 | – | 2,530 | 327,762 | |||||||||||||||||||||||||||||||||||||||
Assets held for sale | 2,425 | 3,287 | 2,311 | 314 | 387 | 1,286 | (718 | ) | 9,292 | |||||||||||||||||||||||||||||||||||||
– disposal groups | 2,033 | 1,118 | 1,789 | 268 | 118 | 82 | (49 | ) | 5,359 | |||||||||||||||||||||||||||||||||||||
– non-current assets held for sale | 392 | 2,169 | 522 | 46 | 269 | 1,204 | (669 | ) | 3,933 | |||||||||||||||||||||||||||||||||||||
Other assets | 9,679 | 6,007 | 13,845 | 1,759 | 231 | 462 | 31,983 | |||||||||||||||||||||||||||||||||||||||
– endorsements and acceptances | 1,995 | 4,344 | 5,195 | 483 | 7 | 8 | 12,032 | |||||||||||||||||||||||||||||||||||||||
– accrued income and other | 7,684 | 1,663 | 8,650 | 1,276 | 224 | 454 | 19,951 | |||||||||||||||||||||||||||||||||||||||
Total financial instruments | 1,689,554 | 398,681 | 342,941 | 38,803 | 19,529 | 43,054 | (16,887 | ) | 2,515,675 | |||||||||||||||||||||||||||||||||||||
155
Table of Contents
HSBC HOLDINGS PLC
Report of the Directors: Operating and Financial Review(continued)
Distribution of financial instruments by credit quality(continued)
| Neither past due nor impaired | Past due | Impair- | ||||||||||||||||||||||||||||||||||||||||||||
| Strong US$m | Good US$m | Satisfactory US$m | Sub- standard | but not impaired US$m | Impaired US$m | ment allowances10 US$m | Total US$m | |||||||||||||||||||||||||||||||||||||||
At 31 December 2011 | ||||||||||||||||||||||||||||||||||||||||||||||
Cash and balances at central banks | 126,926 | 2,678 | 263 | 35 | 129,902 | |||||||||||||||||||||||||||||||||||||||||
Items in the course of collection from other banks | 7,707 | 150 | 350 | 1 | 8,208 | |||||||||||||||||||||||||||||||||||||||||
Hong Kong Government certificates of indebtedness | 20,922 | – | – | – | 20,922 | |||||||||||||||||||||||||||||||||||||||||
Trading assets11 | 231,594 | 37,182 | 39,171 | 1,502 | 309,449 | |||||||||||||||||||||||||||||||||||||||||
– treasury and other eligible bills | 33,199 | 538 | 564 | 8 | 34,309 | |||||||||||||||||||||||||||||||||||||||||
– debt securities | 103,163 | 8,497 | 18,188 | 639 | 130,487 | |||||||||||||||||||||||||||||||||||||||||
– loans and advances: | 49,021 | 20,699 | 5,186 | 619 | 75,525 | |||||||||||||||||||||||||||||||||||||||||
to customers | 46,211 | 7,448 | 15,233 | 236 | 69,128 | |||||||||||||||||||||||||||||||||||||||||
Financial assets designated at fair value11 | 7,176 | 4,728 | 830 | 192 | 12,926 | |||||||||||||||||||||||||||||||||||||||||
– treasury and other eligible bills | 123 | – | – | – | 123 | |||||||||||||||||||||||||||||||||||||||||
– debt securities | 6,148 | 4,728 | 767 | 191 | 11,834 | |||||||||||||||||||||||||||||||||||||||||
– loans and advances: | 55 | – | 63 | 1 | 119 | |||||||||||||||||||||||||||||||||||||||||
to customers | 850 | – | – | – | 850 | |||||||||||||||||||||||||||||||||||||||||
Derivatives11 | 279,557 | 45,858 | 18,627 | 2,337 | 346,379 | |||||||||||||||||||||||||||||||||||||||||
Loans and advances held at amortised cost | 609,081 | 245,352 | 194,661 | 28,210 | 20,009 | 41,739 | (17,636 | ) | 1,121,416 | |||||||||||||||||||||||||||||||||||||
– to banks | 144,815 | 28,813 | 6,722 | 568 | 39 | 155 | (125 | ) | 180,987 | |||||||||||||||||||||||||||||||||||||
– to customers12 | 464,266 | 216,539 | 187,939 | 27,642 | 19,970 | 41,584 | (17,511 | ) | 940,429 | |||||||||||||||||||||||||||||||||||||
Financial investments | 340,173 | 24,757 | 22,139 | 3,532 | – | 2,233 | 392,834 | |||||||||||||||||||||||||||||||||||||||
– treasury and other similar bills | 58,627 | 3,348 | 3,144 | 104 | – | – | 65,223 | |||||||||||||||||||||||||||||||||||||||
– debt securities | 281,546 | 21,409 | 18,995 | 3,428 | – | 2,233 | 327,611 | |||||||||||||||||||||||||||||||||||||||
Assets held for sale | 14,365 | 12,587 | 7,931 | 536 | 2,524 | 1,479 | (1,614 | ) | 37,808 | |||||||||||||||||||||||||||||||||||||
– disposal groups | 14,317 | 12,587 | 7,931 | 536 | 2,522 | 1,467 | (1,614 | ) | 37,746 | |||||||||||||||||||||||||||||||||||||
– non-current assets held for sale | 48 | – | – | – | 2 | 12 | – | 62 | ||||||||||||||||||||||||||||||||||||||
Other assets | 11,956 | 6,526 | 12,379 | 1,193 | 421 | 517 | 32,992 | |||||||||||||||||||||||||||||||||||||||
– endorsements and acceptances | 1,789 | 4,075 | 4,629 | 504 | 10 | 3 | 11,010 | |||||||||||||||||||||||||||||||||||||||
– accrued income and other | 10,167 | 2,451 | 7,750 | 689 | 411 | 514 | 21,982 | |||||||||||||||||||||||||||||||||||||||
| ||||||||||||||||||||||||||||||||||||||||||||||
Total financial instruments | 1,649,457 | 379,818 | 296,351 | 37,538 | 22,954 | 45,968 | (19,250 | ) | 2,412,836 | |||||||||||||||||||||||||||||||||||||
For footnotes, see page 249.
Past due but not impaired gross financial instruments
(Audited)
Past due but not impaired loans are those in respect of which the customer is in the early stages of delinquency and has failed to make a payment or a partial payment in accordance with the contractual terms of the loan agreement. This is typically when a loan is less than 90 days past due and there are no other indicators of impairment.
Further examples of exposures past due but not impaired include individually assessed mortgages that are in arrears more than 90 days, but there are no other indicators of impairment and the value of collateral is sufficient to repay both the principal debt and all potential interest for at least one year, or short-term trade facilities past due more than 90 days for technical reasons such as delays in documentation but there is no concern over the creditworthiness of the counterparty. When groups of loans are collectively assessed for impairment,
156
Table of Contents
HSBC HOLDINGS PLC
Report of the Directors: Operating and Financial Review(continued)
collective impairment allowances are recognised for loans classified as past due but not impaired.
At 31 December 2012, US$19bn of loans and advances held at amortised cost were classified as past due but not impaired (2011: US$20bn). The largest concentration of these balances was in HSBC Finance. The decrease in 2012 was primarily in North America in the CML portfolio, due to the reclassification of non-real estate personal loan balances to ‘Assets held for sale’ as well as the
continued run-off of the lending balances. This was partly offset by increases in Rest of Asia-Pacific relating to a number of corporate exposures across the region. The rise in Latin America was mainly in Panama in the corporate and commercial sector across various industries. In Europe, the increase in past due but not impaired loans mainly related to business expansion in Turkey. In Hong Kong, the rise was mainly in overdrafts and term lending.
Past due but not impaired loans and advances to customers and banks by geographical region
(Audited)
| Europe US$m | Hong Kong | Rest of Pacific | MENA US$m | North America US$m | Latin America US$m | Total US$m | ||||||||||||||||||||||||||||||||||||
31 December 2012 | ||||||||||||||||||||||||||||||||||||||||||
Banks | – | – | 10 | – | – | – | 10 | |||||||||||||||||||||||||||||||||||
Customers | 2,339 | 1,311 | 2,964 | 975 | 7,721 | 3,591 | 18,901 | |||||||||||||||||||||||||||||||||||
Personal | 1,416 | 638 | 1,961 | 248 | 5,806 | 2,198 | 12,267 | |||||||||||||||||||||||||||||||||||
Corporate and commercial | 909 | �� | 579 | 953 | 726 | 1,910 | 1,360 | 6,437 | ||||||||||||||||||||||||||||||||||
Financial (non-bank financial institutions) | 14 | 94 | 50 | 1 | 5 | 33 | 197 | |||||||||||||||||||||||||||||||||||
| ||||||||||||||||||||||||||||||||||||||||||
| 2,339 | 1,311 | 2,974 | 975 | 7,721 | 3,591 | 18,911 | ||||||||||||||||||||||||||||||||||||
31 December 2011 | ||||||||||||||||||||||||||||||||||||||||||
Banks | – | 38 | 1 | – | – | – | 39 | |||||||||||||||||||||||||||||||||||
Customers | 1,990 | 1,069 | 2,318 | 1,165 | 10,216 | 3,212 | 19,970 | |||||||||||||||||||||||||||||||||||
Personal | 1,362 | 715 | 1,626 | 166 | 7,941 | 2,141 | 13951 | |||||||||||||||||||||||||||||||||||
Corporate and commercial | 614 | 346 | 680 | 997 | 2,159 | 1,059 | 5855 | |||||||||||||||||||||||||||||||||||
Financial (non-bank financial institutions) | 14 | 8 | 12 | 2 | 116 | 12 | 164 | |||||||||||||||||||||||||||||||||||
| ||||||||||||||||||||||||||||||||||||||||||
| 1,990 | 1,107 | 2,319 | 1,165 | 10,216 | 3,212 | 20,009 | ||||||||||||||||||||||||||||||||||||
Ageing analysis of days past due but not impaired gross financial instruments
(Audited)
| Up to 29 days US$m | 30-59 days US$m | 60-89 days US$m | 90-179 days US$m | 180 days and over | Total US$m | |||||||||||||||||||||||||||||||
At 31 December 2012 | ||||||||||||||||||||||||||||||||||||
Loans and advances held at amortised cost | 14,236 | 3,189 | 1,262 | 200 | 24 | 18,911 | ||||||||||||||||||||||||||||||
– to banks | 10 | – | – | – | – | 10 | ||||||||||||||||||||||||||||||
– to customers | 14,226 | 3,189 | 1,262 | 200 | 24 | 18,901 | ||||||||||||||||||||||||||||||
Assets held for sale | 251 | 84 | 48 | 2 | 2 | 387 | ||||||||||||||||||||||||||||||
– disposal groups | 87 | 17 | 11 | 1 | 2 | 118 | ||||||||||||||||||||||||||||||
– non-current assets held for sale | 164 | 67 | 37 | 1 | – | 269 | ||||||||||||||||||||||||||||||
Other assets | 122 | 37 | 24 | 12 | 36 | 231 | ||||||||||||||||||||||||||||||
– endorsements and acceptances | 6 | 1 | – | – | – | 7 | ||||||||||||||||||||||||||||||
– other | 116 | 36 | 24 | 12 | 36 | 224 | ||||||||||||||||||||||||||||||
| ||||||||||||||||||||||||||||||||||||
| 14,609 | 3,310 | 1,334 | 214 | 62 | 19,529 | |||||||||||||||||||||||||||||||
At 31 December 2011 | ||||||||||||||||||||||||||||||||||||
Loans and advances held at amortised cost | 14,239 | 3,680 | 1,727 | 223 | 140 | 20,009 | ||||||||||||||||||||||||||||||
– to banks | 39 | – | – | – | – | 39 | ||||||||||||||||||||||||||||||
– to customers | 14,200 | 3,680 | 1,727 | 223 | 140 | 19,970 | ||||||||||||||||||||||||||||||
Assets held for sale | 1,563 | 644 | 307 | 8 | 2 | 2,524 | ||||||||||||||||||||||||||||||
– disposal groups | 1,563 | 644 | 307 | 7 | 1 | 2,522 | ||||||||||||||||||||||||||||||
– non-current assets held for sale | – | – | – | 1 | 1 | 2 | ||||||||||||||||||||||||||||||
Other assets | 225 | 80 | 37 | 22 | 57 | 421 | ||||||||||||||||||||||||||||||
– endorsements and acceptances | 7 | 2 | – | 1 | – | 10 | ||||||||||||||||||||||||||||||
– other | 218 | 78 | 37 | 21 | 57 | 411 | ||||||||||||||||||||||||||||||
| ||||||||||||||||||||||||||||||||||||
| 16,027 | 4,404 | 2,071 | 253 | 199 | 22,954 | |||||||||||||||||||||||||||||||
157
Table of Contents
HSBC HOLDINGS PLC
Report of the Directors: Operating and Financial Review(continued)
Renegotiated loans and forbearance
(Audited)
| Current policies and procedures regarding renegotiated loans and forbearance are described in the Appendix to Risk on page 254. |
The contractual terms of a loan may be modified for a number of reasons, which include changing market conditions, customer retention and other factors not related to the current or potential credit deterioration of a customer. Loans are classified as ‘renegotiated
loans’ when their contractual payment terms have been modified because we have significant concerns about the borrowers’ ability to meet contractual payments when due. For the purposes of this disclosure, the term ‘forbearance’ is synonymous with the renegotiation of loans for these reasons.
The following tables show the gross carrying amounts of the Group’s holdings of renegotiated loans and advances to customers by industry sector, geography and credit quality classification.
Renegotiated loans and advances to customers
(Audited)
| At 31 December 2012 | At 31 December 2011 | |||||||||||||||||||||||||||||||||||||||||||||
Neither due nor | Past due but not impaired US$m | Impaired US$m | Total US$m | Neither due nor | Past due but not impaired US$m | Impaired US$m | Total US$m | |||||||||||||||||||||||||||||||||||||||
Personal | 7,952 | 3,524 | 18,279 | 29,755 | 8,133 | 4,401 | 19,125 | 31,659 | ||||||||||||||||||||||||||||||||||||||
First lien residential mortgages | 5,861 | 2,828 | 15,459 | 24,148 | 5,916 | 3,560 | 15,932 | 25,408 | ||||||||||||||||||||||||||||||||||||||
Other personal1 | 2,091 | 696 | 2,820 | 5,607 | 2,217 | 841 | 3,193 | 6,251 | ||||||||||||||||||||||||||||||||||||||
Corporate and commercial | 4,608 | 295 | 6,892 | 11,795 | 6,338 | 472 | 6,756 | 13,566 | ||||||||||||||||||||||||||||||||||||||
Manufacturing and international trade services | 2,381 | 154 | 3,012 | 5,547 | 2,396 | 255 | 2,755 | 5,406 | ||||||||||||||||||||||||||||||||||||||
Commercial real estate and other property-related | 1,796 | 10 | 3,484 | 5,290 | 2,949 | 122 | 3,550 | 6,621 | ||||||||||||||||||||||||||||||||||||||
Governments | 177 | – | – | 177 | 113 | 2 | 132 | 247 | ||||||||||||||||||||||||||||||||||||||
Other commercial9 | 254 | 131 | 396 | 781 | 880 | 93 | 319 | 1,292 | ||||||||||||||||||||||||||||||||||||||
Financial | 255 | – | 422 | 677 | 249 | – | 491 | 740 | ||||||||||||||||||||||||||||||||||||||
| 12,815 | 3,819 | 25,593 | 42,227 | 14,720 | 4,873 | 26,372 | 45,965 | |||||||||||||||||||||||||||||||||||||||
Total renegotiated loans and advances to customers as a percentage of total gross loans and advances to customers | 4.2% | 4.8% | ||||||||||||||||||||||||||||||||||||||||||||
For footnotes, see page 249.
Renegotiated loans and advances to customers by geographical region
(Audited)
| Europe US$m | Hong Kong | Rest of Pacific | MENA US$m | North America US$m | Latin America US$m | Total US$m | ||||||||||||||||||||||||||||||||||
31 December 2012 | ||||||||||||||||||||||||||||||||||||||||
Personal | 2,817 | 245 | 248 | 190 | 25,474 | 781 | 29,755 | |||||||||||||||||||||||||||||||||
First lien residential mortgages | 1,896 | 68 | 78 | 112 | 21,896 | 98 | 24,148 | |||||||||||||||||||||||||||||||||
Other personal1 | 921 | 177 | 170 | 78 | 3,578 | 683 | 5,607 | |||||||||||||||||||||||||||||||||
Corporate and commercial | 6,829 | 147 | 300 | 1,859 | 685 | 1,975 | 11,795 | |||||||||||||||||||||||||||||||||
Manufacturing and international trade services | 3,002 | 22 | 193 | 659 | 191 | 1,480 | 5,547 | |||||||||||||||||||||||||||||||||
Commercial real estate and other property-related | 3,641 | 25 | 37 | 899 | 486 | 202 | 5,290 | |||||||||||||||||||||||||||||||||
Governments | – | – | – | 2 | – | 175 | 177 | |||||||||||||||||||||||||||||||||
Other commercial9 | 186 | 100 | 70 | 299 | 8 | 118 | 781 | |||||||||||||||||||||||||||||||||
Financial | 328 | – | 4 | 340 | 3 | 2 | 677 | |||||||||||||||||||||||||||||||||
| 9,974 | 392 | 552 | 2,389 | 26,162 | 2,758 | 42,227 | ||||||||||||||||||||||||||||||||||
Total impairment allowances on renegotiated loans | 1,547 | 16 | 96 | 546 | 3,864 | 485 | 6,554 | |||||||||||||||||||||||||||||||||
Individually assessed | 1,545 | 15 | 63 | 543 | 39 | 213 | 2,418 | |||||||||||||||||||||||||||||||||
Collectively assessed | 2 | 1 | 33 | 3 | 3,825 | 272 | 4,136 | |||||||||||||||||||||||||||||||||
158
Table of Contents
HSBC HOLDINGS PLC
Report of the Directors: Operating and Financial Review(continued)
| Europe US$m | Hong Kong | Rest of Pacific | MENA US$m | North America US$m | Latin America US$m | Total US$m | ||||||||||||||||||||||||||||||||||
31 December 2011 | ||||||||||||||||||||||||||||||||||||||||
Personal | 2,524 | 285 | 267 | 220 | 27,773 | 590 | 31,659 | |||||||||||||||||||||||||||||||||
First lien residential mortgages | 1,630 | 86 | 85 | 93 | 23,442 | 72 | 25,408 | |||||||||||||||||||||||||||||||||
Other personal1 | 894 | 199 | 182 | 127 | 4,331 | 518 | 6,251 | |||||||||||||||||||||||||||||||||
Corporate and commercial | 8,453 | 157 | 181 | 2,198 | 700 | 1,877 | 13,566 | |||||||||||||||||||||||||||||||||
Manufacturing and international trade services | 3,013 | 32 | 104 | 887 | 174 | 1,196 | 5,406 | |||||||||||||||||||||||||||||||||
Commercial real estate and other property-related | 4,897 | 29 | 45 | 913 | 522 | 215 | 6,621 | |||||||||||||||||||||||||||||||||
Governments | – | – | – | 5 | – | 242 | 247 | |||||||||||||||||||||||||||||||||
Other commercial9 | 543 | 96 | 32 | 393 | 4 | 224 | 1,292 | |||||||||||||||||||||||||||||||||
Financial | 487 | 5 | – | 237 | 2 | 9 | 740 | |||||||||||||||||||||||||||||||||
| 11,464 | 447 | 448 | 2,655 | 28,475 | 2,476 | 45,965 | ||||||||||||||||||||||||||||||||||
Total impairment allowances on renegotiated loans | 1,821 | 20 | 64 | 300 | 5,017 | 448 | 7,670 | |||||||||||||||||||||||||||||||||
Individually assessed | 1,760 | 19 | 41 | 300 | 44 | 147 | 2,311 | |||||||||||||||||||||||||||||||||
Collectively assessed | 61 | 1 | 23 | – | 4,973 | 301 | 5,359 | |||||||||||||||||||||||||||||||||
For footnotes, see page 249.
(Unaudited)
Renegotiated loans totalled US$42bn at 31 December 2012 (2011: US$46bn). North America accounted for the largest volume of renegotiated loans which amounted to US$26bn or 62% of total renegotiated loans at 31 December 2012 (2011: US$28bn or 62%), most of which were first lien residential mortgages held by HSBC Finance. Of the total renegotiated loans in North America, US$17bn were impaired at 31 December 2012 (2011: US$18bn). The ratio of total impairment allowances to impaired loans at 31 December 2012 was 23% (2011: 28%). This decrease was driven by a reduction in both impaired loans and impairment allowances as we continued to run-off the CML portfolio. As the portfolio has been closed to new business since 2007, the volume of first time renegotiations has reduced significantly.
In Europe, renegotiated loans at 31 December 2012 amounted to US$10bn (2011: US$11bn), constituting 24% of total renegotiated loans (2011: 25%). Of the total renegotiated loans in Europe, US$5.7bn were impaired at 31 December 2012 (2011: US$6.0bn), and the ratio of total impairment allowances to impaired loans at 31 December 2012 was 27% (2011: 30%). This decline was driven by a reduction in both impaired loans and impairment allowances due to releases and write-offs of a number of non-performing loans as well as the sale of a number of exposures. The renegotiated loans in Europe largely consisted of commercial real estate and other property-related sector lending of 37% (2011: 43%) mainly in the UK, and manufacturing
and international trade services sector lending of 30% (2011: 26%).
Forbearance within Latin America (primarily in Mexico and Brazil) was predominantly undertaken in the manufacturing and international trade services sector. The largest increase in renegotiated loans compared with 2011 was in this sector in Mexico. In addition, renegotiation activity in the personal lending portfolios increased in Brazil, where a collections campaign led to a significant increase in both the refinancing and debt consolidation portfolios.
In the Middle East and North Africa, renegotiated loans decreased compared with 2011, mainly in the corporate and commercial sector due to repayments and reduced exposures. Forbearance activity in Hong Kong and Rest of Asia-Pacific remained insignificant.
HSBC Finance loan modifications and re-ageing
(Unaudited)
HSBC Finance maintains loan modification and re-age (‘loan renegotiation’) programmes in order to manage customer relationships, improve collection opportunities and, if possible, avoid foreclosure.
Since 2006, HSBC Finance has implemented an extensive loan renegotiation programme, and a significant portion of its loan portfolio has been subject to renegotiation at some stage in the life of the customer relationship as a consequence of the economic conditions in the US and the nature of HSBC Finance’s customer base.
159
Table of Contents
HSBC HOLDINGS PLC
Report of the Directors: Operating and Financial Review(continued)
The volume of loans that qualify for modification has reduced significantly in recent years. We expect this trend to continue as HSBC Finance believes the percentage of its customers with unmodified loans who would benefit from loan modification in a way that would avoid non-payment of future cash flows is decreasing. In addition, volumes of new loan modifications are expected to decrease due to gradual improvements in economic conditions, the cessation of new real estate secured and personal non-credit card receivables originations and the continued run-off of the CML portfolio.
Types of loan renegotiation programme in HSBC Finance
| • | A temporary modification is a change to the contractual terms of a loan that results in the giving up of a right to contractual cash flows over a pre-defined period. With a temporary modification the loan is expected to revert back to the original contractual terms, including the interest rate charged, after the modification period. An example is reduced interest payments. |
A substantial number of HSBC Finance modifications involve interest rate reductions. These modifications lower the amount of interest income HSBC Finance is contractually entitled to receive in future periods. Historically, modifications have generally been for six months, although extended modification periods are now more common.
Loans that have been re-aged are classified as impaired with the exception of first-time loan re-ages that were less than 60 days past due at the time of re-age. These remain classified as impaired until they have demonstrated a history of payment performance against their original contracted terms for at least 12 months.
| • | A permanent modification is a change to the contractual terms of a loan that results in giving up a right to contractual cash flows over the life of the loan. An example is a permanent reduction in the interest rate charged. |
Permanent or long-term modifications which are due to an underlying hardship event remain classified as impaired for their full life.
| • | The term ‘re-age’ describes a renegotiation by which the contractual delinquency status of a loan is reset to current after demonstrating payment performance. The overdue principal and/or interest is deferred and paid at a later date. Loan re-ageing enables customers who have been unable to make a small number of payments to have their loan delinquency status reset to current so that their credit score is not affected by the overdue balances. |
Loans that have been re-aged remain classified as impaired until they have demonstrated a history of payment performance against the original contractual terms for at least 12 months.
A temporary or permanent modification may also lead to a re-ageing of a loan although a loan may be re-aged without any modification to its original terms and conditions.
Where loans have been granted multiple concessions, subject to the qualifying criteria discussed below, the concession is deemed to have been made due to concern regarding the borrower’s ability to pay, and the loan is disclosed as impaired. The loan remains disclosed as impaired from that date forward until the borrower has demonstrated a history of repayment performance for the period of time required for either modifications or re-ages, as described above.
Qualifying criteria
For an account to qualify for renegotiation it must meet certain criteria. However, HSBC Finance retains the right to decline a renegotiation. The extent to which HSBC Finance renegotiates accounts that are eligible under its existing policies will vary depending upon its view of prevailing economic conditions and other factors which may change from year to year. In addition, exceptions to policies and practices may be made in specific situations in response to legal or regulatory agreements or orders.
Renegotiated real estate secured and personal lending receivables are not eligible for a subsequent renegotiation for twelve or six months, respectively, with a maximum of five renegotiations permitted within a five-year period. Borrowers must be approved for a modification and generally make two minimum qualifying monthly payments within 60 days to activate a modification.
In certain circumstances where the debt has been restructured in bankruptcy proceedings, fewer or no payments may be required. Accounts whose borrowers are subject to a Chapter 13 plan filed with a bankruptcy court generally may be re-aged upon receipt of one qualifying payment, whereas accounts whose borrowers have filed for Chapter 7 bankruptcy protection may be re-aged upon receipt of a signed reaffirmation agreement. In addition, for some products, accounts may be re-aged without receipt of a payment in certain special circumstances (e.g. in the event of a natural disaster or a hardship programme).
2012 compared with 2011
At 31 December 2012, renegotiated real estate secured accounts in HSBC Finance represented 86% (2011: 86%) of North America’s total renegotiated loans; US$14bn (2011: US$16bn) of these renegotiated real estate secured loans were classified as impaired. This decline was mainly due to lower lending balances as we continued to run-off the CML portfolio. A significant portion of HSBC Finance’s renegotiated portfolio has received multiple renegotiations. Consequently, a significant proportion of loans included in the table below have undergone multiple re-ages or modifications. In this regard, multiple modifications have remained consistent at 75% to 80% of total modifications. Further details of HSBC Finance’s real estate secured accounts and renegotiation programmes are provided below.
160
Table of Contents
HSBC HOLDINGS PLC
Report of the Directors: Operating and Financial Review(continued)
Gross loan portfolio of HSBC Finance real estate secured balances
(Unaudited)
|
| Re-aged US$m | 13
| | Modified and re-aged | | | Modified US$m | |
| Total re- negotiated loans |
| Total non- renegotiated loans US$m |
|
| Total gross loans |
|
| Total impair- ment allowances |
|
| Impair- ment allowances/ gross loans |
| ||||||||||||
31 December 2012 | 9,640 | 11,660 | 1,121 | 22,421 | 16,261 | 38,743 | 4,481 | 12 | ||||||||||||||||||||||||||
31 December 2011 | 10,265 | 12,829 | 1,494 | 24,588 | 19,540 | 44,128 | 5,088 | 12 | ||||||||||||||||||||||||||
For footnote, see page 249.
Movement in HSBC Finance renegotiated real estate balances
(Unaudited)
| 2012 | ||||
| US$m | ||||
At 1 January | 24,588 | |||
Additions | 1,221 | |||
Payments | (1,133 | ) | ||
Write-offs | (1,796 | ) | ||
Transfer to ‘Assets held for sale’ and ‘Other assets’ | (459 | ) | ||
At 31 December | 22,421 | |||
Number of renegotiated real estate secured accounts remaining in HSBC Finance’s portfolio
(Unaudited)
| Number of renegotiated loans (000s) | Total number of loans (000s) | |||||||||||||||||||
| Re-aged | Modified and re-aged | Modified | Total | |||||||||||||||||
31 December 2012 | 117 | 107 | 11 | 235 | 427 | |||||||||||||||
31 December 2011 | 121 | 112 | 14 | 246 | 469 | |||||||||||||||
During 2012, the aggregate number of renegotiated loans reduced due to the run-off of the portfolio. Within the constraints of our Group credit policy, HSBC Finance’s policies allow for multiple renegotiations under certain circumstances, and a significant number of accounts received a second (or further) renegotiation during the year which does not appear in the statistics tabulated above because they present a loan as an addition to the volume of renegotiated loans on its first renegotiation only. At 31 December 2012, renegotiated loans were 58% (2011: 56%) of the total portfolio of HSBC Finance’s real estate secured accounts.
Corporate and commercial forbearance
(Unaudited)
| For the current policies and procedures regarding forbearance in the corporate and commercial sector, see the Appendix to Risk on page 257. |
Renegotiated loan balances in the corporate and commercial sector decreased by US$1.8bn. The majority of the decrease was due to falling renegotiated loan balances in the commercial real estate and other property-related sector in 2012, which fell by US$1.3bn. This was primarily in Europe although the commercial real estate sector, particularly in the UK, continued to experience
weaker property values, with fewer financial institutions financing commercial real estate lending, renegotiated loan balances fell as refinements in forbearance identification procedures reduced the renegotiated loan balances in UK commercial real estate and other property-related lending. Excluding the change in basis of reporting renegotiated loans, total renegotiated loans in the commercial real estate and other property-related sector remained broadly unchanged.
Within the commercial real estate and other property-related loans, the balances classified as ‘impaired’ declined marginally compared with 2011. Balances classified as ‘past due but not impaired’ declined by US$112m, mainly in the Middle East and North Africa relating to a small number of exposures in the UAE. Balances classified as ‘neither past due nor impaired’ declined by 39%, mainly in Europe reflecting the reduction in balances in the commercial real estate sector described above.
The commercial real estate mid-market sector continued to experience higher levels of renegotiation activity than larger corporates, where borrowers remained generally better capitalised with access to wider funding market opportunities. When considering acceptable restructuring terms for commercial real estate loans in Europe, we take into account the ability of the customer to service
161
Table of Contents
HSBC HOLDINGS PLC
Report of the Directors: Operating and Financial Review(continued)
the revised interest payments as a prerequisite. Similarly, for principal payment modifications, we require the customer to be capable of complying with the revised terms as a necessary pre-condition. When principal payments are modified and permanent forgiveness results, or when it is otherwise considered that there is no longer a realistic prospect of recovering outstanding principal, the affected balances are written off. When principal repayments are postponed, the customer is expected to be able to pay in line with the renegotiated terms, including meeting the postponed principal repayment if due from refinancing. In all cases, a loan renegotiation is only granted when it is expected that the customer will be able to meet the revised terms.
Renegotiated loan balances in the manufacturing and international trade services sector increased in 2012, mainly in Latin America from the restructuring of a small number of loans in Mexico. In the Middle East and North Africa, renegotiated loan balances decreased, partly due to the repayment of a significant loan in the UAE.
(Audited)
Impaired loans and advances are those that meet any of the following criteria:
| • | loans and advances classified as CRR 9, CRR 10, EL 9 or EL 10 (a description of our internal credit rating grades is provided on page 253); |
| • | retail exposures 90 days or more past due, unless individually they have been assessed as not impaired; or |
| • | renegotiated loans and advances that have been subject to a change in contractual cash flows as a result of a concession which the lender would not otherwise consider, and where it is probable that without the concession the borrower would be unable to meet its contractual payment obligations in full, unless the concession is insignificant and there are no other indicators of impairment. Renegotiated loans remain classified as impaired until there is sufficient evidence to demonstrate a significant reduction in the risk of non-payment of future cash flows, and there are no other indicators of impairment. |
For loans that are assessed for impairment on a collective basis, the evidence to support reclassification as no longer impaired typically comprises a history of payment performance against the original or revised terms, depending on the nature and volume of forbearance and the credit risk characteristics surrounding the renegotiation. For loans that are assessed for impairment on an individual basis, all available evidence is assessed on a case by case basis.
In HSBC Finance, where a significant majority of HSBC’s loan forbearance activity occurs, the history of payment performance is assessed with reference to the original terms of the contract, reflecting the higher credit risk characteristics of this portfolio. The payment performance periods are monitored to ensure they remain appropriate to the levels of recidivism observed within the portfolio.
Further disclosure about loans subject to forbearance is provided on page 254. Renegotiated loans and forbearance disclosures are subject to evolving industry practice and regulatory guidance.
162
Table of Contents
HSBC HOLDINGS PLC
Report of the Directors: Operating and Financial Review(continued)
Movement in impaired loans by geographical region
(Unaudited)
| Europe US$m | Hong Kong US$m | Rest of Pacific | MENA US$m | North America US$m | Latin America US$m | Total US$m | ||||||||||||||||||||||||||||||||||||
Impaired loans at 1 January 2012 | 11,819 | 608 | 1,070 | 2,445 | 22,758 | 3,039 | 41,739 | |||||||||||||||||||||||||||||||||||
Personal | 2,797 | 190 | 388 | 428 | 21,094 | 1,646 | 26,543 | |||||||||||||||||||||||||||||||||||
Corporate and commercial | 8,113 | 372 | 667 | 1,798 | 1,517 | 1,391 | 13,858 | |||||||||||||||||||||||||||||||||||
Financial2 | 909 | 46 | 15 | 219 | 147 | 2 | 1,338 | |||||||||||||||||||||||||||||||||||
Classified as impaired during the year | 3,482 | 292 | 924 | 648 | 8,130 | 4,507 | 17,983 | |||||||||||||||||||||||||||||||||||
Personal | 933 | 169 | 549 | 73 | 7,363 | 2,807 | 11,894 | |||||||||||||||||||||||||||||||||||
Corporate and commercial | 2,481 | 123 | 375 | 531 | 739 | 1,696 | 5,945 | |||||||||||||||||||||||||||||||||||
Financial2 | 68 | – | – | 44 | 28 | 4 | 144 | |||||||||||||||||||||||||||||||||||
Transferred from impaired to unimpaired during the year | (1,164 | ) | (47 | ) | (85 | ) | (321 | ) | (4,223 | ) | (1,765 | ) | (7,605 | ) | ||||||||||||||||||||||||||||
Personal | (279 | ) | (38 | ) | (69 | ) | (32 | ) | (4,124 | ) | (1,124 | ) | (5,666 | ) | ||||||||||||||||||||||||||||
Corporate and commercial | (858 | ) | (5 | ) | (15 | ) | (289 | ) | (99 | ) | (640 | ) | (1,906 | ) | ||||||||||||||||||||||||||||
Financial2 | (27 | ) | (4 | ) | (1 | ) | – | – | (1 | ) | (33 | ) | ||||||||||||||||||||||||||||||
Amounts written off | (1,891 | ) | (217 | ) | (564 | ) | (264 | ) | (3,514 | ) | (2,112 | ) | (8,562 | ) | ||||||||||||||||||||||||||||
Personal | (632 | ) | (127 | ) | (373 | ) | (96 | ) | (3,227 | ) | (1,521 | ) | (5,976 | ) | ||||||||||||||||||||||||||||
Corporate and commercial | (1,212 | ) | (90 | ) | (191 | ) | (143 | ) | (202 | ) | (590 | ) | (2,428 | ) | ||||||||||||||||||||||||||||
Financial2 | (47 | ) | – | – | (25 | ) | (85 | ) | (1 | ) | (158 | ) | ||||||||||||||||||||||||||||||
Net repayments and other | (1,101 | ) | (159 | ) | (198 | ) | (34 | ) | (2,806 | ) | (481 | ) | (4,779 | ) | ||||||||||||||||||||||||||||
Personal | (353 | ) | (22 | ) | (56 | ) | (5 | ) | (2,380 | ) | (228 | ) | (3,044 | ) | ||||||||||||||||||||||||||||
Corporate and commercial | (466 | ) | (133 | ) | (136 | ) | (26 | ) | (363 | ) | (253 | ) | (1,377 | ) | ||||||||||||||||||||||||||||
Financial2 | (282 | ) | (4 | ) | (6 | ) | (3 | ) | (63 | ) | – | (358 | ) | |||||||||||||||||||||||||||||
| ||||||||||||||||||||||||||||||||||||||||||
At 31 December 2012 | 11,145 | 477 | 1,147 | 2,474 | 20,345 | 3,188 | 38,776 | |||||||||||||||||||||||||||||||||||
Personal | 2,466 | 172 | 439 | 368 | 18,726 | 1,580 | 23,751 | |||||||||||||||||||||||||||||||||||
Corporate and commercial | 8,058 | 267 | 700 | 1,872 | 1,592 | 1,604 | 14,093 | |||||||||||||||||||||||||||||||||||
Financial2 | 621 | 38 | 8 | 234 | 27 | 4 | 932 | |||||||||||||||||||||||||||||||||||
| ||||||||||||||||||||||||||||||||||||||||||
For footnote, see page 249.
Collateral and other credit enhancements held
(Audited)
Loans and advances held at amortised cost
Although collateral can be an important mitigant of credit risk, it is the Group’s practice to lend on the basis of the customer’s ability to meet their obligations out of cash flow resources rather than rely on the value of security offered. Depending on the customer’s standing and the type of product, facilities may be provided unsecured. However, for other lending a charge over collateral is obtained and considered in determining the credit decision and pricing. In the event of default, the bank may utilise the collateral as a source of repayment.
Depending on its form, collateral can have a significant financial effect in mitigating our exposure to credit risk.
The tables below provide a quantification of the value of fixed charges we hold over a borrower’s specific asset (or assets) where we have a history of enforcing, and are able to enforce, the collateral in satisfying a debt in the event of the borrower failing
to meet its contractual obligations, and where the collateral is cash or can be realised by sale in an established market. The collateral valuation in the tables below excludes any adjustments for obtaining and selling the collateral.
We may also manage our risk by employing other types of collateral and credit risk enhancements, such as second charges, other liens and unsupported guarantees, but the valuation of such mitigants is less certain and their financial effect has not been quantified. In particular, loans shown in the tables below as not collateralised or partially collateralised may benefit from such credit mitigants.
Certain credit mitigants are used strategically in portfolio management activities. While single name concentrations arise in portfolios managed by Global Banking and Corporate Banking, it is only in Global Banking that their size requires the use of portfolio level credit mitigants. Across Global Banking risk limits and utilisations, maturity profiles and risk quality are monitored and managed pro-actively. This process is key to the setting of risk appetite for these larger, more complex, geographically distributed customer groups. While the principal
163
Table of Contents
HSBC HOLDINGS PLC
Report of the Directors: Operating and Financial Review(continued)
form of risk management continues to be at the point of exposure origination, through the lending decision-making process, Global Banking also utilises loan sales and credit default swap (‘CDS’) hedges to manage concentrations and reduce risk. These transactions are the responsibility of a
dedicated Global Banking portfolio management team. Hedging activity is carried out within agreed credit parameters, and is subject to market risk limits and a robust governance structure. CDS mitigants are held at portfolio level and are not reported in the presentation below.
Personal lending
Residential mortgage loans including loan commitments by level of collateral
(Audited)
| Europe US$m | Hong Kong US$m | Rest of Asia-Pacific US$m | MENA US$m | North America US$m | Latin America | Total US$m | ||||||||||||||||||||||||||||||||||||
At 31 December 2012 | ||||||||||||||||||||||||||||||||||||||||||
Fully collateralised | 141,673 | 53,478 | 43,662 | 2,106 | 59,799 | 5,193 | 305,911 | |||||||||||||||||||||||||||||||||||
Loan to value (‘LTV’) ratio: | ||||||||||||||||||||||||||||||||||||||||||
– less than 25% | 11,733 | 8,090 | 4,438 | 125 | 3,703 | 319 | 28,408 | |||||||||||||||||||||||||||||||||||
– 25% to 50% | 36,038 | 30,155 | 12,752 | 623 | 10,934 | 1,522 | 92,022 | |||||||||||||||||||||||||||||||||||
– 51% to 75% | 60,395 | 12,770 | 19,625 | 1,001 | 26,582 | 2,295 | 122,668 | |||||||||||||||||||||||||||||||||||
– 76% to 90% | 27,118 | 1,931 | 6,195 | 189 | 12,307 | 871 | 48,611 | |||||||||||||||||||||||||||||||||||
– 91% to 100% | 6,389 | 532 | 652 | 168 | 6,273 | 186 | 14,200 | |||||||||||||||||||||||||||||||||||
Partially collateralised: | ||||||||||||||||||||||||||||||||||||||||||
– greater than 100% LTV | 2,967 | 2 | 376 | 85 | 10,210 | 16 | 13,656 | |||||||||||||||||||||||||||||||||||
– collateral value | 2,565 | 1 | 323 | 76 | 8,684 | 12 | 11,661 | |||||||||||||||||||||||||||||||||||
| ||||||||||||||||||||||||||||||||||||||||||
Total residential mortgages | 144,640 | 53,480 | 44,038 | 2,191 | 70,009 | 5,209 | 319,567 | |||||||||||||||||||||||||||||||||||
At 31 December 2011 | ||||||||||||||||||||||||||||||||||||||||||
Fully collateralised | 125,702 | 46,532 | 38,381 | 1,761 | 60,794 | 4,891 | 278,061 | |||||||||||||||||||||||||||||||||||
LTV ratio: | ||||||||||||||||||||||||||||||||||||||||||
– less than 25% | 9,898 | 5,364 | 2,383 | 58 | 3,576 | 282 | 21,561 | |||||||||||||||||||||||||||||||||||
– 25% to 50% | 31,601 | 19,643 | 9,978 | 336 | 10,593 | 1,350 | 73,501 | |||||||||||||||||||||||||||||||||||
– 51% to 75% | 52,656 | 17,748 | 18,006 | 895 | 25,138 | 2,221 | 116,664 | |||||||||||||||||||||||||||||||||||
– 76% to 90% | 23,919 | 2,884 | 7,624 | 304 | 13,590 | 876 | 49,197 | |||||||||||||||||||||||||||||||||||
– 91% to 100% | 7,628 | 893 | 390 | 168 | 7,897 | 162 | 17,138 | |||||||||||||||||||||||||||||||||||
Partially collateralised: | ||||||||||||||||||||||||||||||||||||||||||
– greater than 100% LTV | 3,275 | 484 | 295 | 174 | 12,503 | 102 | 16,833 | |||||||||||||||||||||||||||||||||||
– collateral value | 2,821 | 466 | 37 | 135 | 10,566 | 24 | 14,049 | |||||||||||||||||||||||||||||||||||
| ||||||||||||||||||||||||||||||||||||||||||
Total residential mortgages | 128,977 | 47,016 | 38,676 | 1,935 | 73,297 | 4,993 | 294,894 | |||||||||||||||||||||||||||||||||||
The above table shows residential mortgage lending including off-balance sheet loan commitments by level of collateral. Off-balance sheet commitments include loans that have been approved but which the customer has not yet drawn, and the undrawn portion of loans that have a flexible drawdown facility such as the offset mortgage product. The collateral included in the table above consists of first charges on real estate.
The LTV ratio is calculated as the gross on-balance sheet carrying amount of the loan and any off-balance sheet loan commitment at the balance sheet date divided by the value of collateral. The methodologies for obtaining residential property collateral values vary throughout the Group, but are typically determined through a combination of professional appraisals, house price indices or statistical analysis. Valuations must be updated on
a regular basis and, as a minimum, at intervals of every three years. Valuations are conducted more frequently when market conditions or portfolio performance are subject to significant change or when a loan is identified and assessed as impaired.
The LTV ratio bandings are consistent with our internal risk management reporting. While we do have mortgages in the higher LTV bands, our appetite for such lending is restricted and the larger portion of our portfolio is concentrated in the lower risk LTV bandings of 75% and below.
Other personal lending
Other personal lending consists primarily of overdrafts, credit cards and second lien mortgage portfolios. Second lien lending is supported by collateral but the claim on the collateral is
164
Table of Contents
HSBC HOLDINGS PLC
Report of the Directors: Operating and Financial Review(continued)
subordinate to the first lien charge. The majority of our second lien portfolios were originated in North America where loss experience on defaulted second lien loans has typically approached 100%; consequently, we do not generally attach any significant financial value to this type of collateral. Credit cards and overdrafts are usually unsecured.
Corporate, commercial and financial (non-bank) lending
Collateral held is analysed separately below for commercial real estate and for other corporate, commercial and financial (non-bank) lending. This reflects the difference in collateral held on the portfolios. In each case, the analysis includes off-balance sheet loan commitments, primarily undrawn credit lines.
Commercial real estate loans and advances including loan commitments by level of collateral
(Audited)
| Europe US$m | Hong Kong US$m | Rest of Asia-Pacific US$m | MENA US$m | North America US$m | Latin America | Total US$m | ||||||||||||||||||||||||||||||||||||
At 31 December 2012 | ||||||||||||||||||||||||||||||||||||||||||
Rated CRR/EL 1 to 7 | ||||||||||||||||||||||||||||||||||||||||||
Not collateralised | 7,068 | 10,790 | 3,647 | 569 | 181 | 2,083 | 24,338 | |||||||||||||||||||||||||||||||||||
Fully collateralised | 23,450 | 17,355 | 6,106 | 92 | 9,054 | 1,846 | 57,903 | |||||||||||||||||||||||||||||||||||
Partially collateralised (A) | 3,088 | 1,476 | 1,150 | 33 | 1,063 | 903 | 7,713 | |||||||||||||||||||||||||||||||||||
– collateral value on A | 2,780 | 1,179 | 464 | 29 | 401 | 423 | 5,276 | |||||||||||||||||||||||||||||||||||
| ||||||||||||||||||||||||||||||||||||||||||
| 33,606 | 29,621 | 10,903 | 694 | 10,298 | 4,832 | 89,954 | ||||||||||||||||||||||||||||||||||||
Rated CRR/EL 8 to 10 | ||||||||||||||||||||||||||||||||||||||||||
Not collateralised | 418 | – | – | 14 | 34 | 105 | 571 | |||||||||||||||||||||||||||||||||||
Fully collateralised | 1,261 | 2 | 60 | 8 | 408 | 141 | 1,880 | |||||||||||||||||||||||||||||||||||
LTV ratio: | ||||||||||||||||||||||||||||||||||||||||||
– less than 25% | 34 | – | 1 | – | 25 | 10 | 70 | |||||||||||||||||||||||||||||||||||
– 25% to 50% | 119 | 1 | 55 | 7 | 86 | 8 | 276 | |||||||||||||||||||||||||||||||||||
– 51% to 75% | 437 | – | 2 | – | 69 | 28 | 536 | |||||||||||||||||||||||||||||||||||
– 76% to 90% | 501 | – | 1 | – | 58 | 63 | 623 | |||||||||||||||||||||||||||||||||||
– 91% to 100% | 170 | 1 | 1 | 1 | 170 | 32 | 375 | |||||||||||||||||||||||||||||||||||
Partially collateralised (B) | 1,585 | – | 51 | 204 | 377 | 24 | 2,241 | |||||||||||||||||||||||||||||||||||
– collateral value on B | 938 | – | 15 | 111 | 265 | 13 | 1,342 | |||||||||||||||||||||||||||||||||||
| ||||||||||||||||||||||||||||||||||||||||||
| 3,264 | 2 | 111 | 226 | 819 | 270 | 4,692 | ||||||||||||||||||||||||||||||||||||
Total commercial real estate loans and advances | 36,870 | 29,623 | 11,014 | 920 | 11,117 | 5,102 | 94,646 | |||||||||||||||||||||||||||||||||||
At 31 December 2011 | ||||||||||||||||||||||||||||||||||||||||||
Rated CRR/EL 1 to 7 | ||||||||||||||||||||||||||||||||||||||||||
Not collateralised | 5,730 | 12,552 | 2,973 | 631 | 97 | 2,136 | 24,119 | |||||||||||||||||||||||||||||||||||
Fully collateralised | 24,547 | 11,734 | 6,929 | 65 | 8,506 | 1,706 | 53,487 | |||||||||||||||||||||||||||||||||||
Partially collateralised (C) | 3,099 | 916 | 1,032 | 50 | 1,635 | 999 | 7,731 | |||||||||||||||||||||||||||||||||||
– collateral value on C | 1,775 | 591 | 280 | 39 | 311 | 559 | 3,555 | |||||||||||||||||||||||||||||||||||
| ||||||||||||||||||||||||||||||||||||||||||
| 33,376 | 25,202 | 10,934 | 746 | 10,238 | 4,841 | 85,337 | ||||||||||||||||||||||||||||||||||||
Rated CRR/EL 8 to 10 | ||||||||||||||||||||||||||||||||||||||||||
Not collateralised | 434 | 2 | 10 | 55 | 135 | 127 | 763 | |||||||||||||||||||||||||||||||||||
Fully collateralised | 1,413 | 2 | 23 | 74 | 521 | 196 | 2,229 | |||||||||||||||||||||||||||||||||||
LTV ratio: | ||||||||||||||||||||||||||||||||||||||||||
– less than 25% | 24 | – | – | – | 65 | 9 | 98 | |||||||||||||||||||||||||||||||||||
– 25% to 50% | 140 | 2 | – | – | 5 | 21 | 168 | |||||||||||||||||||||||||||||||||||
– 51% to 75% | 935 | – | 1 | – | 217 | 28 | 1,181 | |||||||||||||||||||||||||||||||||||
– 76% to 90% | 159 | – | 2 | 74 | 61 | 117 | 413 | |||||||||||||||||||||||||||||||||||
– 91% to 100% | 155 | – | 20 | – | 173 | 21 | 369 | |||||||||||||||||||||||||||||||||||
Partially collateralised (D) | 1,921 | – | 42 | 181 | 401 | 3 | 2,548 | |||||||||||||||||||||||||||||||||||
– collateral value on D | 1,083 | – | 26 | 89 | 246 | 1 | 1,445 | |||||||||||||||||||||||||||||||||||
| ||||||||||||||||||||||||||||||||||||||||||
| 3,768 | 4 | 75 | 310 | 1,057 | 326 | 5,540 | ||||||||||||||||||||||||||||||||||||
Total commercial real estate loans and advances | 37,144 | 25,206 | 11,009 | 1,056 | 11,295 | 5,167 | 90,877 | |||||||||||||||||||||||||||||||||||
The collateral included in the table above consists of fixed first charges on real estate and charges over cash for commercial real estate. These
facilities are disclosed as not collateralised if they are unsecured or benefit from credit risk mitigation from guarantees, which are not quantified for the
165
Table of Contents
HSBC HOLDINGS PLC
Report of the Directors: Operating and Financial Review(continued)
purposes of this disclosure. In Hong Kong, market practice is for lending to major property companies to be typically secured by guarantees or unsecured. In Europe, facilities of a working capital nature are generally not secured by a first fixed charge and are therefore disclosed as not collateralised.
The value of commercial real estate collateral is determined through a combination of professional and internal valuations and physical inspection. Due to the complexity of valuing collateral for commercial real estate, local valuation policies determine the frequency of review based on local market conditions. Revaluations are sought with greater frequency when, as part of the regular credit assessment of the obligor, material concerns arise in
relation to the transaction which may reflect on the underlying performance of the collateral, or in circumstances where an obligor’s credit quality has declined sufficiently to cause concern that the principal payment source may not fully meet the obligation (i.e. the obligor’s credit quality classification indicates it is at the lower end, that is sub-standard, or approaching impaired). Where such concerns exist the revaluation method selected will depend upon the loan-to-value relationship, the direction in which the local commercial real estate market has moved since the last valuation and, most importantly, the specific characteristics of the underlying commercial real estate which is of concern.
Other corporate, commercial and financial (non-bank) loans and advances including loan commitments by level of collateral rated CRR/EL 8 to 10 only
(Audited)
| Europe US$m | Hong Kong US$m | Rest of Asia-Pacific US$m | MENA US$m | North America US$m | Latin America | Total US$m | ||||||||||||||||||||||||||||||||||||
At 31 December 2012 | ||||||||||||||||||||||||||||||||||||||||||
Not collateralised | 5,110 | 260 | 572 | 1,186 | 533 | 1,023 | 8,684 | |||||||||||||||||||||||||||||||||||
Fully collateralised | 1,463 | 82 | 146 | 132 | 478 | 284 | 2,585 | |||||||||||||||||||||||||||||||||||
LTV ratio: | ||||||||||||||||||||||||||||||||||||||||||
– less than 25% | 77 | 3 | 11 | – | 11 | 68 | 170 | |||||||||||||||||||||||||||||||||||
– 25% to 50% | 192 | 4 | 62 | 6 | 49 | 84 | 397 | |||||||||||||||||||||||||||||||||||
– 51% to 75% | 290 | 39 | 31 | 33 | 131 | 61 | 585 | |||||||||||||||||||||||||||||||||||
– 76% to 90% | 196 | 24 | 11 | 18 | 96 | 17 | 362 | |||||||||||||||||||||||||||||||||||
– 91% to 100% | 708 | 12 | 31 | 75 | 191 | 54 | 1,071 | |||||||||||||||||||||||||||||||||||
Partially collateralised (A) | 1,106 | 84 | 251 | 828 | 753 | 273 | 3,295 | |||||||||||||||||||||||||||||||||||
– collateral value on A | 628 | 41 | 89 | 124 | 359 | 108 | 1,349 | |||||||||||||||||||||||||||||||||||
| 7,679 | 426 | 969 | 2,146 | 1,764 | 1,580 | 14,564 | ||||||||||||||||||||||||||||||||||||
At 31 December 2011 | ||||||||||||||||||||||||||||||||||||||||||
Not collateralised | 5,583 | 349 | 795 | 1,695 | 801 | 1,546 | 10,769 | |||||||||||||||||||||||||||||||||||
Fully collateralised | 1,765 | 63 | 147 | 60 | 441 | 602 | 3,078 | |||||||||||||||||||||||||||||||||||
LTV ratio: | ||||||||||||||||||||||||||||||||||||||||||
– less than 25% | 173 | 4 | 10 | 3 | 16 | 106 | 312 | |||||||||||||||||||||||||||||||||||
– 25% to 50% | 274 | 47 | 29 | 3 | 38 | 74 | 465 | |||||||||||||||||||||||||||||||||||
– 51% to 75% | 587 | 11 | 32 | 31 | 51 | 96 | 808 | |||||||||||||||||||||||||||||||||||
– 76% to 90% | 153 | – | 32 | 20 | 128 | 21 | 354 | |||||||||||||||||||||||||||||||||||
– 91% to 100% | 578 | 1 | 44 | 3 | 208 | 305 | 1,139 | |||||||||||||||||||||||||||||||||||
Partially collateralised (B) | 1,367 | 100 | 156 | 498 | 1,206 | 390 | 3,717 | |||||||||||||||||||||||||||||||||||
– collateral value on B | 558 | 55 | 76 | 103 | 541 | 214 | 1,547 | |||||||||||||||||||||||||||||||||||
| 8,715 | 512 | 1,098 | 2,253 | 2,448 | 2,538 | 17,564 | ||||||||||||||||||||||||||||||||||||
The collateral used in the assessment of the above lending primarily includes first legal charges over real estate and charges over cash in the commercial and industrial sector, and charges over cash and marketable financial instruments in the financial sector. Government sector lending is generally unsecured.
It should be noted that the table above excludes other types of collateral which are commonly taken
for corporate and commercial lending such as unsupported guarantees and floating charges over the assets of a customer’s business. While such mitigants have value, often providing rights in insolvency, their assignable value is insufficiently certain and they are assigned no value for disclosure purposes.
As with commercial real estate, the value of real estate collateral included in the table above is
166
Table of Contents
HSBC HOLDINGS PLC
Report of the Directors: Operating and Financial Review(continued)
generally determined through a combination of professional and internal valuations and physical inspection. The frequency of revaluation is undertaken on a similar basis to commercial real estate loans and advances; however, for financing activities in corporate and commercial lending that are not predominantly commercial real estate-oriented, collateral value is not as strongly correlated to principal repayment performance. Collateral values will generally be refreshed when an obligor’s general credit performance deteriorates and it is necessary to assess the likely performance of secondary sources of repayment should reliance upon them prove necessary. For this reason, the table above reports values only for customers with CRR 8 to 10, recognising that these loans and advances generally have valuations which are comparatively recent. For the table above, cash is valued at its nominal value and marketable securities at their fair value.
The difference between the collateral value and the value of partially collateralised lending disclosed in the tables above cannot be directly compared with any impairment allowances recognised in respect of impaired loans, as the loans may be performing in accordance with their contractual terms. When loans are not performing in accordance with their contractual terms, the recovery of cash flows may be affected by other cash resources of the customer, or other credit risk enhancements not quantified for the tables above. The Group’s policy for determining impairment allowances, including the effect of collateral on these impairment allowances, is described on page 258.
Loans and advances to banks
The following table shows loans and advances to banks, including off-balance sheet loan commitments by level of collateral.
Loans and advances to banks including loan commitments by level of collateral
(Audited)
Europe US$m | Hong Kong US$m | Rest of Asia-Pacific US$m | MENA US$m | North America US$m | Latin America | Total US$m | ||||||||||||||||||||||||||||||||||||
At 31 December 2012 | ||||||||||||||||||||||||||||||||||||||||||
Not collateralised | 36,043 | 24,622 | 40,694 | 7,290 | 9,050 | 12,838 | 130,537 | |||||||||||||||||||||||||||||||||||
Fully collateralised | 25,496 | 2,294 | 5,667 | – | 811 | 3,691 | 37,959 | |||||||||||||||||||||||||||||||||||
Partially collateralised (A) | 62 | 1,459 | 1,207 | – | – | – | 2,728 | |||||||||||||||||||||||||||||||||||
– collateral value on A | 61 | 1,452 | 1,135 | – | – | – | 2,648 | |||||||||||||||||||||||||||||||||||
| ||||||||||||||||||||||||||||||||||||||||||
| 61,601 | 28,375 | 47,568 | 7,290 | 9,861 | 16,529 | 171,224 | ||||||||||||||||||||||||||||||||||||
At 31 December 2011 | ||||||||||||||||||||||||||||||||||||||||||
Not collateralised | 25,896 | 34,892 | 42,586 | 9,337 | 14,132 | 19,516 | 146,359 | |||||||||||||||||||||||||||||||||||
Fully collateralised | 31,515 | 1,365 | 6,927 | 32 | 978 | 1,238 | 42,055 | |||||||||||||||||||||||||||||||||||
Partially collateralised (B) | 146 | 50 | 445 | – | 784 | 114 | 1,539 | |||||||||||||||||||||||||||||||||||
– collateral value on B | 104 | 50 | 207 | – | 702 | 88 | 1,151 | |||||||||||||||||||||||||||||||||||
| ||||||||||||||||||||||||||||||||||||||||||
| 57,557 | 36,307 | 49,958 | 9,369 | 15,894 | 20,868 | 189,953 | ||||||||||||||||||||||||||||||||||||
The collateral used in the assessment of the above lending relates primarily to cash and marketable securities. Loans and advances to banks are typically unsecured. Certain products such as reverse repos and stock borrowing are effectively collateralised and have been included in the above as fully or partly collateralised. The fully collateralised loans and advances to banks for Europe in the table above consist primarily of reverse repo agreements and stock borrowing.
Derivatives
The International Swaps and Derivatives Association (‘ISDA’) Master Agreement is our preferred agreement for documenting derivatives activity. It provides the contractual framework within which dealing activity across a full range of over-the-
counter (‘OTC’) products is conducted, and contractually binds both parties to apply close-out netting across all outstanding transactions covered by an agreement if either party defaults or another pre-agreed termination event occurs. It is common, and our preferred practice, for the parties to execute a Credit Support Annex (‘CSA’) in conjunction with the ISDA Master Agreement. Under a CSA, collateral is passed between the parties to mitigate the counterparty risk inherent in outstanding positions. The majority of our CSAs are with financial institutional clients.
We manage our counterparty exposure arising due to market risk on OTC derivative contracts through the use of collateral agreements with counterparties and netting agreements. We do not currently undertake active management of our
167
Table of Contents
HSBC HOLDINGS PLC
Report of the Directors: Operating and Financial Review(continued)
general OTC derivative counterparty exposure in the credit markets, although we may manage individual exposures in certain circumstances.
A description of the derivative offset amount in the ‘Maximum exposure to credit risk’ table is provided on page 145.
Other credit risk exposures
In addition to collateralised lending described above, other credit enhancements are employed and methods used to mitigate credit risk arising from financial assets. These are described in more detail below.
Securities issued by governments, banks and other financial institutions may benefit from additional credit enhancement, notably through government guarantees that reference these assets. Details of government guarantees are included in Notes 6, 10 and 12 on the Financial Statements. Corporate issued debt securities are primarily unsecured. Debt securities issued by banks and financial institutions include ABSs and similar instruments, which are supported by underlying pools of financial assets. Credit risk associated with ABSs is reduced through the purchase of CDS protection. Disclosure of the Group’s holdings of ABSs and associated CDS protection is provided on page 184.
Trading assets include loans and advances held with trading intent, the majority of which consist of reverse repos and stock borrowing which, by their nature, are collateralised. Collateral accepted as security that the Group is permitted to sell or repledge under these arrangements is described in Note 36 on the Financial Statements. Trading assets also include money market term placements, which are unsecured.
The Group’s maximum exposure to credit risk includes financial guarantees and similar arrangements that we issue or enter into, and loan commitments that we are irrevocably committed to. Depending on the terms of the arrangement, we may have recourse to additional credit mitigation in the event that a guarantee is called upon or a loan commitment is drawn and subsequently defaults. Further information about these arrangements is provided in Note 40 on the Financial Statements.
Collateral and other credit enhancements obtained
(Audited)
The carrying amount of assets obtained by taking possession of collateral held as security, or calling upon other credit enhancements, is as follows:
| Carrying amount at 31 December | ||||||||||
| 2012 US$m | 2011 US$m | |||||||||
Nature of assets | ||||||||||
Residential property | 353 | 420 | ||||||||
Commercial and industrial property | 88 | 64 | ||||||||
Other | 3 | 17 | ||||||||
| 444 | 501 | |||||||||
The significant reduction in residential properties was due to the suspension of foreclosure activities at the end of 2011 and during the first half of 2012 (see page 151).
We make repossessed properties available for sale in an orderly fashion, with the proceeds used to reduce or repay the outstanding indebtedness. If excess funds arise after the debt has been repaid, they are made available to repay other secured lenders with lower priority or returned to the customer. We do not generally occupy repossessed properties for our business use.
Impairment of loans and advances
(Audited)
| A summary of our current policies and practices regarding impairment assessment is provided in the Appendix to Risk on page 258. |
The tables below analyse by geographical region the impairment allowances recognised for impaired loans and advances that are either individually assessed or collectively assessed, and collective impairment allowances on loans and advances classified as not impaired.
168
Table of Contents
HSBC HOLDINGS PLC
Report of the Directors: Operating and Financial Review(continued)
Impairment allowances on loans and advances to customers by geographical region
(Audited)
Europe US$m | Hong Kong US$m | Rest of Asia- Pacific US$m | MENA US$m | North America US$m | Latin America US$m | Total US$m | ||||||||||||||||||||||||||||||||||||
At 31 December 2012 | ||||||||||||||||||||||||||||||||||||||||||
Gross loans and advances to customers | ||||||||||||||||||||||||||||||||||||||||||
Individually assessed impaired loans14 (A) | 9,959 | 398 | 1,019 | 2,251 | 1,849 | 1,295 | 16,771 | |||||||||||||||||||||||||||||||||||
Collectively assessed15 (B) | 458,802 | 173,688 | 137,846 | 27,629 | 144,523 | 54,476 | 996,964 | |||||||||||||||||||||||||||||||||||
Impaired loans14 | 1,121 | 79 | 128 | 197 | 18,482 | 1,893 | 21,900 | |||||||||||||||||||||||||||||||||||
Non-impaired loans16 | 457,681 | 173,609 | 137,718 | 27,432 | 126,041 | 52,583 | 975,064 | |||||||||||||||||||||||||||||||||||
Total (C) | 468,761 | 174,086 | 138,865 | 29,880 | 146,372 | 55,771 | 1,013,735 | |||||||||||||||||||||||||||||||||||
Impairment allowances (C) | 5,321 | 473 | 746 | 1,794 | 5,616 | 2,162 | 16,112 | |||||||||||||||||||||||||||||||||||
Individually assessed (A) | 3,781 | 192 | 442 | 1,323 | 428 | 406 | 6,572 | |||||||||||||||||||||||||||||||||||
Collectively assessed (B) | 1,540 | 281 | 304 | 471 | 5,188 | 1,756 | 9,540 | |||||||||||||||||||||||||||||||||||
Net loans and advances | 463,440 | 173,613 | 138,119 | 28,086 | 140,756 | 53,609 | 997,623 | |||||||||||||||||||||||||||||||||||
| % | % | % | % | % | % | % | ||||||||||||||||||||||||||||||||||||
Allowances as a percentage of loans and advances: | ||||||||||||||||||||||||||||||||||||||||||
– individually assessed (A) | 38.0 | 48.2 | 43.4 | 58.8 | 23.1 | 31.4 | 39.2 | |||||||||||||||||||||||||||||||||||
– collectively assessed (B) | 0.3 | 0.2 | 0.2 | 1.7 | 3.6 | 3.2 | 1.0 | |||||||||||||||||||||||||||||||||||
– total (C) | 1.1 | 0.3 | 0.5 | 6.0 | 3.8 | 3.9 | 1.6 | |||||||||||||||||||||||||||||||||||
| US$m | US$m | US$m | US$m | US$m | US$m | US$m | ||||||||||||||||||||||||||||||||||||
At 31 December 2011 | ||||||||||||||||||||||||||||||||||||||||||
Gross loans and advances to customers | ||||||||||||||||||||||||||||||||||||||||||
Individually assessed impaired loans14 (E) | 10,490 | 519 | 963 | 2,187 | 1,832 | 563 | 16,554 | |||||||||||||||||||||||||||||||||||
Collectively assessed15 (F) | 429,088 | 157,727 | 123,687 | 25,402 | 148,096 | 57,386 | 941,386 | |||||||||||||||||||||||||||||||||||
Impaired loans14 | 1,261 | 85 | 106 | 238 | 20,864 | 2,476 | 25,030 | |||||||||||||||||||||||||||||||||||
Non-impaired loans16 | 427,827 | 157,642 | 123,581 | 25,164 | 127,232 | �� | 54,910 | 916,356 | ||||||||||||||||||||||||||||||||||
Total (G) | 439,578 | 158,246 | 124,650 | 27,589 | 149,928 | 57,949 | 957,940 | |||||||||||||||||||||||||||||||||||
Impairment allowances (G) | 5,242 | 581 | 782 | 1,714 | 7,181 | 2,011 | 17,511 | |||||||||||||||||||||||||||||||||||
Individually assessed (E) | 3,754 | 288 | 505 | 1,250 | 416 | 324 | 6,537 | |||||||||||||||||||||||||||||||||||
Collectively assessed (F) | 1,488 | 293 | 277 | 464 | 6,765 | 1,687 | 10,974 | |||||||||||||||||||||||||||||||||||
Net loans and advances | 434,336 | 157,665 | 123,868 | 25,875 | 142,747 | 55,938 | 940,429 | |||||||||||||||||||||||||||||||||||
| % | % | % | % | % | % | % | ||||||||||||||||||||||||||||||||||||
Allowances as a percentage of loans and advances: | ||||||||||||||||||||||||||||||||||||||||||
– individually assessed (E) | 35.8 | 55.5 | 52.4 | 57.2 | 22.7 | 57.4 | 39.5 | |||||||||||||||||||||||||||||||||||
– collectively assessed (F) | 0.3 | 0.2 | 0.2 | 1.8 | 4.6 | 2.9 | 1.2 | |||||||||||||||||||||||||||||||||||
– total (G) | 1.2 | 0.4 | 0.6 | 6.2 | 4.8 | 3.5 | 1.8 | |||||||||||||||||||||||||||||||||||
For footnotes, see page 249.
169
Table of Contents
HSBC HOLDINGS PLC
Report of the Directors: Operating and Financial Review(continued)
Net loan impairment charge to the income statement by geographical region
(Unaudited)
| Europe US$m | Hong Kong US$m | Rest of Pacific | MENA US$m | North America US$m | Latin America US$m | Total US$m | ||||||||||||||||||||||||||||||||||
2012 | ||||||||||||||||||||||||||||||||||||||||
Individually assessed impairment allowances | 1,387 | (8 | ) | 97 | 205 | 258 | 200 | 2,139 | ||||||||||||||||||||||||||||||||
New allowances | 1,960 | 32 | 239 | 369 | 380 | 292 | 3,272 | |||||||||||||||||||||||||||||||||
Release of allowances no longer required | (516 | ) | (34 | ) | (117 | ) | (133 | ) | (85 | ) | (49 | ) | (934 | ) | ||||||||||||||||||||||||||
Recoveries of amounts previously written off | (57 | ) | (6 | ) | (25 | ) | (31 | ) | (37 | ) | (43 | ) | (199 | ) | ||||||||||||||||||||||||||
Collectively assessed impairment allowances | 487 | 92 | 243 | 50 | 3,204 | 1,945 | 6,021 | |||||||||||||||||||||||||||||||||
New allowances net of allowance releases | 839 | 117 | 368 | 94 | 3,296 | 2,254 | 6,968 | |||||||||||||||||||||||||||||||||
Recoveries of amounts previously written off | (352 | ) | (25 | ) | (125 | ) | (44 | ) | (92 | ) | (309 | ) | (947 | ) | ||||||||||||||||||||||||||
| ||||||||||||||||||||||||||||||||||||||||
Total charge for impairment losses | 1,874 | 84 | 340 | 255 | 3,462 | 2,145 | 8,160 | |||||||||||||||||||||||||||||||||
Customers | 1,874 | 84 | 340 | 255 | 3,462 | 2,145 | 8,160 | |||||||||||||||||||||||||||||||||
| ||||||||||||||||||||||||||||||||||||||||
2011 | ||||||||||||||||||||||||||||||||||||||||
Individually assessed impairment allowances | 1,262 | 18 | 67 | 199 | 243 | 126 | 1,915 | |||||||||||||||||||||||||||||||||
New allowances | 1,670 | 79 | 207 | 328 | 398 | 222 | 2,904 | |||||||||||||||||||||||||||||||||
Release of allowances no longer required | (378 | ) | (41 | ) | (114 | ) | (80 | ) | (111 | ) | (74 | ) | (798 | ) | ||||||||||||||||||||||||||
Recoveries of amounts previously written off | (30 | ) | (20 | ) | (26 | ) | (49 | ) | (44 | ) | (22 | ) | (191 | ) | ||||||||||||||||||||||||||
Collectively assessed impairment allowances | 640 | 99 | 207 | 93 | 6,807 | 1,744 | 9,590 | |||||||||||||||||||||||||||||||||
New allowances net of allowance releases | 1,181 | 126 | 366 | 147 | 6,894 | 2,111 | 10,825 | |||||||||||||||||||||||||||||||||
Recoveries of amounts previously written off | (541 | ) | (27 | ) | (159 | ) | (54 | ) | (87 | ) | (367 | ) | (1,235 | ) | ||||||||||||||||||||||||||
| ||||||||||||||||||||||||||||||||||||||||
Total charge for impairment losses | 1,902 | 117 | 274 | 292 | 7,050 | 1870 | 11,505 | |||||||||||||||||||||||||||||||||
Banks | (11 | ) | – | – | – | (5 | ) | – | (16 | ) | ||||||||||||||||||||||||||||||
Customers | 1,913 | 117 | 274 | 292 | 7,055 | 1,870 | 11,521 | |||||||||||||||||||||||||||||||||
| ||||||||||||||||||||||||||||||||||||||||
(Unaudited)
The following commentary is on a constant currency basis.
Loan impairment allowances were US$16.2bn, a decline of 9% compared with 2011, reflecting lower lending balances in our US CML portfolio which included the reclassification of impairment allowances on non-real estate personal loan balances to ‘Assets held for sale’. Releases and recoveries of US$2.1bn were 3% lower, mainly in North America due to lower customer repayments in the corporate and commercial sector, as well as the non-recurrence of a number of releases and recoveries incurred in 2011 in Hong Kong and Rest of Asia-Pacific.
Impaired loans were 3% of total gross loans and advances at the end of 2012, compared with 4% at 31 December 2011.
InEurope, new loan impairment allowances were US$2.8bn, broadly unchanged compared with 2011. New collectively assessed loan impairment allowances declined by 28%, mainly in the UK personal lending book, as we focused our lending growth on higher quality assets and continued to pro-actively identify and monitor customers
facing financial hardship. This resulted in lower delinquency rates across both the secured and unsecured lending portfolios. Individually assessed new loan impairment allowances increased by 21% across a range of sectors reflecting the challenging economic conditions in the UK, Greece, Spain and Turkey. In addition, a rise in impairments in Turkey was due to strong balance sheet growth in customer loans and advances in RBWM, notably in credit cards and personal loans, driven by business expansion. Impaired loans of US$11.1bn were 9% lower than at 31 December 2011, mainly due to increased focus on higher quality loans, lower delinquency rates and the continued low interest rate environment.
Releases and recoveries in Europe were US$925m, broadly unchanged on 2011.
InHong Kong, new individually assessed loan impairment allowances fell by 28% compared with 2011 due to lower specific impairment charges in CMB. New collectively assessed loan impairment allowances also declined as delinquency rates continued to improve, reflecting stable loan growth and sound underlying economic conditions. Impaired loans declined by 22% from 31 December 2011, as a number of corporate loans in the international
170
Table of Contents
HSBC HOLDINGS PLC
Report of the Directors: Operating and Financial Review(continued)
trade sector were written off or upgraded following repayments, and delinquency rates reduced.
Releases and recoveries in Hong Kong were US$65m, 27% lower than at the end of 2011 when an allowance relating to a loan in GB&M that was no longer considered impaired was released.
New loan impairment allowances inRest of Asia-Pacificincreased by 8% to US$607m. This reflected higher new collectively assessed loan impairment allowances, mainly from the growth in Singapore of RBWM’s credit card portfolio. New individually assessed loan impairment allowances also increased, as a result of the impairment of a corporate exposure in Australia and individual charges on a small number of corporate exposures in India. Impaired loans in the region increased by 4% to US$1.1bn in 2012 due to the downgrade of a number of customers in Australia and Taiwan, partly offset by the restructuring of a significant loan in Singapore following the renegotiation of terms, which is therefore regarded as no longer impaired.
Releases and recoveries in the region decreased by 7%, mainly in India as the cards portfolio continued to run off, and in Thailand following the sale of the RBWM business. These were partly offset by an impairment allowance release in Singapore compared with a charge in 2011.
In theMiddle East and North Africa, new loan impairment allowances decreased by 2% to US$463m in 2012. New collectively assessed loan impairment allowances declined, primarily in the UAE, due to the improvement in credit quality reflecting the repositioning of the book towards higher quality lending in previous years. New individually assessed loan impairment allowances rose due to significant loan impairment charges recorded for a small number of large exposures in GB&M. Impaired loans remained broadly unchanged compared with 31 December 2011.
Releases and recoveries in the region increased by 14% to US$208m in 2012, mainly relating to a small number of exposures in UAE.
InNorth America, new loan impairment allowances fell sharply, reducing by 50% to
US$3.7bn. New collectively assessed loan impairment allowances declined, largely in the CML portfolio due to the reclassification of impairment allowances on non-real estate personal loan balances to ‘Assets held for sale’ as well as the continued run-off in the residential portfolios. This was partly offset by a portfolio risk factor adjustment of US$225m which was made to increase the collective loan impairment allowances for our US mortgage lending portfolios. The adjustment was made following a review completed in the fourth quarter of 2012 which concluded that the estimated average period of time from current status to write-off was ten months for real estate loans (previously a period of seven months was used). During 2013, this revised estimate will be incorporated into the statistical impairment allowance models. It was also partly offset by new loan impairment allowances by HSBC Bank Bermuda on a small number of exposures. Releases and recoveries in North America declined by 11% to US$214m. This reflected lower levels of impairments being booked due to improving market conditions within the corporate and commercial sector.
Impaired loans decreased by 11% in 2012 to US$20.3bn, due to the continued run-off of the CML portfolio which included the reclassification of certain non-real estate personal loan balances to held for sale.
InLatin America, new loan impairment allowances increased by 23% to US$2.5bn. The increase in new collectively assessed loan impairment allowances was mainly in Brazil, driven by higher delinquency rates in RBWM and CMB, particularly in the Business Banking portfolio, reflecting lower economic growth in 2012. Impaired loans were 9% higher than at the end of 2011, driven by past growth in the CMB portfolio in Brazil.
Releases and recoveries in Latin America decreased by 2% from the end of 2011 to US$401m, mainly in Brazil.
For an analysis of loan impairment charges and other credit risk provisions by global business, see page 76.
171
Table of Contents
HSBC HOLDINGS PLC
Report of the Directors: Operating and Financial Review(continued)
(Unaudited)
On a reported basis, loan impairment charges to the income statement of US$11.5bn in 2011 declined by 15% compared with 2010 and by 16% on a constant currency basis. During 2011, we revised our disclosure convention for impaired loans for regions with material levels of forbearance which resulted in an increase in the population of impaired loans. Impaired loan comparative data for 2010 has been restated to reflect the change in disclosure convention. On a reported basis our restated impaired loans were US$41.7bn, 11% lower than at 31 December 2010.
The following commentary is on a constant currency basis.
New loan impairment allowances were US$13.7bn, a decline of 12% compared with 2010, reflecting lower lending balances in our US consumer finance portfolios. Releases and recoveries of US$2.2bn were 17% higher, mainly in Europe and Latin America reflecting improvements in our collections operations.
Impaired loans were 4% of total gross loans and advances at the end of 2011, in line with 31 December 2010.
InEurope, new loan impairment allowances were US$2.9bn, 14% lower than 2010. Individually assessed new loan impairment allowances decreased, mainly in the UK, as the credit quality of our lending portfolio improved, partly offset by an increase in allowances in respect of a small number of CMB customers in Greece. New collectively assessed loan impairment allowances also declined, mainly in the UK personal lending book, as a result of improved delinquency rates, reflecting improved quality in both the secured and unsecured portfolios, and a range of successful actions taken to mitigate credit risk within RBWM including a focus on monitoring and identifying customers facing financial difficulty at an earlier stage. In addition, lower new loan impairment allowances reflected a reduction in unsecured lending balances. Impaired loans of US$11.8bn were 5% higher than at 31 December 2010.
Releases and recoveries in Europe were US$949m, an increase of 36% compared with the end of 2010 due to successful actions taken to mitigate credit risk as described above.
InHong Kong, new loan impairment allowances fell by 10% compared with 2010 driven by a reduction in new loan impairment allowances against specific exposures. This was partly offset by
a rise in new collectively assessed loan impairment allowances following a more significant release of allowances in 2010, as well as strong growth in lending balances. Impaired loans declined by 9% from 31 December 2010, reflecting loans whose performance improved following the renegotiation of terms and are therefore regarded as no longer impaired.
Releases and recoveries in Hong Kong were US$88m, 4% lower than at the end of 2010.
New loan impairment allowances inRest of Asia-Pacificdecreased by 22% to US$573m. The decline reflected lower new collectively assessed loan impairment allowances, mainly in India, where lending balances fell as certain higher risk unsecured portfolios were managed down. New individually assessed loan impairment allowances also decreased, mainly in Singapore, due to lower new loan impairment allowances raised against a single GB&M customer compared with 2010. Impaired loans in the region decreased by 16% from the end of 2010 to US$1.1bn at the end of 2011, mainly in India due to the repayment or write-off of previously impaired loans.
Releases and recoveries in the region increased by 5%, mainly due to the increased release of individually assessed allowances, principally in Australia and India.
In theMiddle East and North Africa, new loan impairment allowances declined by 35% to US$475m in 2011. New individually assessed loan impairment allowances fell, as charges in 2011 were restricted to a small number of corporate exposures and significant charges recorded in 2010 following the restructuring of corporate exposures in the UAE did not recur. New collectively assessed loan impairment allowances also declined, primarily in the UAE, due to lower delinquencies reflecting a repositioning of the loan book to reduce our exposure to unsecured lending and focus on higher quality customers. Impaired loans declined by 4% from 31 December 2010 due to improved delinquency in line with stricter credit criteria, as referred to above.
Releases and recoveries in the region increased by 63% to US$183m in 2011 due to improved economic conditions.
InNorth America, new loan impairment allowances declined markedly, reducing by 16% to US$7.3bn. New collectively assessed loan impairment allowances declined, mainly in the CML portfolio, reflecting continued run-off and, in our Card and Retail Services business, lower balances,
171a
Table of Contents
HSBC HOLDINGS PLC
Report of the Directors: Operating and Financial Review(continued)
as well as improved delinquency rates as overall credit quality improved. This was partly offset by additional new loan impairment allowances related to the effects of the delays in foreclosure activity. Releases and recoveries in North America declined by 36% to US$242m. This reflected both the improvement in economic conditions in 2010, which enabled a high volume of customers who were in financial difficulty to make repayments, and the continued reductions in outstanding balances in 2011 as the CML portfolio continued to run off.
Impaired loans decreased by 18% from the end of 2010 to US$22.8bn, due to the continued run-off of the CML portfolio and the reclassification of balances relating to the pending sale of our Card and Retail Services business. This was partly offset by the effects of the delays in foreclosure processing which slowed the rate at which lending balances were transferred to foreclosed.
InLatin America, new loan impairment allowances increased by 21% to US$2.3bn. The increase in new loan impairment allowances was primarily in Brazil reflecting strong lending growth in RBWM and CMB, as well as a rise in delinquency rates, notably in the second half of 2011. This was partly offset by lower new collectively assessed loan impairment allowances in Mexico, driven by the managed decline of the riskier elements of the credit cards portfolio. Impaired loans were 8% higher than at the end of 2010 driven by increased delinquency observed during the year.
Releases and recoveries in Latin America increased by 36% from the end of 2010 to US$463m, largely reflecting an increase in the volume of accounts that are delinquent.
For an analysis of loan impairment charges and other credit risk provisions by global business, see page 76.
171b
Table of Contents
HSBC HOLDINGS PLC
Report of the Directors: Operating and Financial Review(continued)
Further analysis of impairment
Movement in impairment allowances by industry sector and by geographical region
(Unaudited)
| Europe US$m | Hong Kong US$m | Rest of Pacific | MENA US$m | North America US$m | Latin America US$m | Total US$m | ||||||||||||||||||||||||||||||||||
Impairment allowances at 1 January 2012 | 5,292 | 581 | 782 | 1,731 | 7,239 | 2,011 | 17,636 | |||||||||||||||||||||||||||||||||
Amounts written off | (2,375 | ) | (219 | ) | (540 | ) | (305 | ) | (4,181 | ) | (2,192 | ) | (9,812 | ) | ||||||||||||||||||||||||||
Personal | (828 | ) | (128 | ) | (347 | ) | (126 | ) | (3,862 | ) | (1,614 | ) | (6,905 | ) | ||||||||||||||||||||||||||
– first lien residential mortgages | (28 | ) | – | (7 | ) | (2 | ) | (1,952 | ) | (70 | ) | (2,059 | ) | |||||||||||||||||||||||||||
– other personal1 | (800 | ) | (128 | ) | (340 | ) | (124 | ) | (1,910 | ) | (1,544 | ) | (4,846 | ) | ||||||||||||||||||||||||||
Corporate and commercial | (1,428 | ) | (91 | ) | (193 | ) | (154 | ) | (234 | ) | (577 | ) | (2,677 | ) | ||||||||||||||||||||||||||
– manufacturing and international trade and services | (661 | ) | (91 | ) | (164 | ) | (137 | ) | (59 | ) | (498 | ) | (1,610 | ) | ||||||||||||||||||||||||||
– commercial real estate and other property-related | (377 | ) | – | (8 | ) | (6 | ) | (97 | ) | (18 | ) | (506 | ) | |||||||||||||||||||||||||||
– other commercial9 | (390 | ) | – | (21 | ) | (11 | ) | (78 | ) | (61 | ) | (561 | ) | |||||||||||||||||||||||||||
Financial2 | (119 | ) | – | – | (25 | ) | (85 | ) | (1 | ) | (230 | ) | ||||||||||||||||||||||||||||
Recoveries of amounts written off in previous years | 409 | 31 | 150 | 75 | 129 | 352 | 1,146 | |||||||||||||||||||||||||||||||||
Personal | 354 | 30 | 132 | 50 | 88 | 312 | 966 | |||||||||||||||||||||||||||||||||
– first lien residential mortgages | 34 | 4 | 2 | 5 | 46 | 49 | 140 | |||||||||||||||||||||||||||||||||
– other personal1 | 320 | 26 | 130 | 45 | 42 | 263 | 826 | |||||||||||||||||||||||||||||||||
Corporate and commercial | 51 | 1 | 18 | 25 | 38 | 39 | 172 | |||||||||||||||||||||||||||||||||
– manufacturing and international trade and services | 16 | 1 | 5 | 2 | 7 | 28 | 59 | |||||||||||||||||||||||||||||||||
– commercial real estate and other property-related | 9 | – | 11 | – | 19 | 2 | 41 | |||||||||||||||||||||||||||||||||
– other commercial9 | 26 | – | 2 | 23 | 12 | 9 | 72 | |||||||||||||||||||||||||||||||||
Financial2 | 4 | – | – | – | 3 | 1 | 8 | |||||||||||||||||||||||||||||||||
Charge to income statement | 1,874 | 84 | 340 | 255 | 3,462 | 2,145 | 8,160 | |||||||||||||||||||||||||||||||||
Personal | 348 | 96 | 234 | 57 | 3,228 | 1,399 | 5,362 | |||||||||||||||||||||||||||||||||
– first lien residential mortgages | (56 | ) | (11 | ) | 14 | 7 | 1,986 | (30 | ) | 1,910 | ||||||||||||||||||||||||||||||
– other personal1 | 404 | 107 | 220 | 50 | 1,242 | 1,429 | 3,452 | |||||||||||||||||||||||||||||||||
Corporate and commercial | 1,547 | (14 | ) | 102 | 169 | 252 | 746 | 2,802 | ||||||||||||||||||||||||||||||||
– manufacturing and international trade and services | 670 | (12 | ) | 32 | 80 | 62 | 625 | 1,457 | ||||||||||||||||||||||||||||||||
– commercial real estate and other property-related | 444 | 7 | 55 | 62 | 94 | 28 | 690 | |||||||||||||||||||||||||||||||||
– other commercial9 | 433 | (9 | ) | 15 | 27 | 96 | 93 | 655 | ||||||||||||||||||||||||||||||||
Financial2 | (21 | ) | 2 | 4 | 29 | (18 | ) | – | (4 | ) | ||||||||||||||||||||||||||||||
Exchange and other movements18 | 161 | (4 | ) | 14 | 55 | (1,033 | ) | (154 | ) | (961 | ) | |||||||||||||||||||||||||||||
At 31 December 2012 | 5,361 | 473 | 746 | 1,811 | 5,616 | 2,162 | 16,169 | |||||||||||||||||||||||||||||||||
Impairment allowances against banks: | ||||||||||||||||||||||||||||||||||||||||
– individually assessed | 40 | – | – | 17 | – | – | 57 | |||||||||||||||||||||||||||||||||
Impairment allowances against customers: | ||||||||||||||||||||||||||||||||||||||||
– individually assessed | 3,781 | 192 | 442 | 1,323 | 428 | 406 | 6,572 | |||||||||||||||||||||||||||||||||
– collectively assessed17 | 1,540 | 281 | 304 | 471 | 5,188 | 1,756 | 9,540 | |||||||||||||||||||||||||||||||||
At 31 December 2012 | 5,361 | 473 | 746 | 1,811 | 5,616 | 2,162 | 16,169 | |||||||||||||||||||||||||||||||||
172
Table of Contents
HSBC HOLDINGS PLC
Report of the Directors: Operating and Financial Review(continued)
| Europe US$m | Hong Kong US$m | Rest of Pacific | MENA US$m | North America US$m | Latin America US$m | Total US$m | ||||||||||||||||||||||||||||||||||
Impairment allowances at 1 January 2011 | 5,740 | 629 | 959 | 1,669 | 9,234 | 2,010 | 20,241 | |||||||||||||||||||||||||||||||||
Amounts written off | (2,781 | ) | (210 | ) | (554 | ) | (187 | ) | (6,830 | ) | (1,918 | ) | (12,480 | ) | ||||||||||||||||||||||||||
Personal | (1,685 | ) | (116 | ) | (391 | ) | (172 | ) | (6,591 | ) | (1,476 | ) | (10,431 | ) | ||||||||||||||||||||||||||
– first lien residential mortgages | (25 | ) | – | (6 | ) | (2 | ) | (2,545 | ) | (84 | ) | (2,662 | ) | |||||||||||||||||||||||||||
– other personal1 | (1,660 | ) | (116 | ) | (385 | ) | (170 | ) | (4,046 | ) | (1,392 | ) | (7,769 | ) | ||||||||||||||||||||||||||
Corporate and commercial | (1,066 | ) | (94 | ) | (161 | ) | (15 | ) | (233 | ) | (440 | ) | (2,009 | ) | ||||||||||||||||||||||||||
– manufacturing and international trade and services | (554 | ) | (64 | ) | (120 | ) | (4 | ) | (100 | ) | (295 | ) | (1,137 | ) | ||||||||||||||||||||||||||
– commercial real estate and other property-related | (265 | ) | (6 | ) | (13 | ) | (10 | ) | (83 | ) | (15 | ) | (392 | ) | ||||||||||||||||||||||||||
– other commercial9 | (247 | ) | (24 | ) | (28 | ) | (1 | ) | (50 | ) | (130 | ) | (480 | ) | ||||||||||||||||||||||||||
Financial2 | (30 | ) | – | (2 | ) | – | (6 | ) | (2 | ) | (40 | ) | ||||||||||||||||||||||||||||
Recoveries of amounts written off in previous years | 572 | 47 | 185 | 102 | 132 | 388 | 1,426 | |||||||||||||||||||||||||||||||||
Personal | 525 | 31 | 168 | 53 | 101 | 297 | 1,175 | |||||||||||||||||||||||||||||||||
– first lien residential mortgages | 21 | 4 | 3 | – | 39 | 19 | 86 | |||||||||||||||||||||||||||||||||
– other personal1 | 504 | 27 | 165 | 53 | 62 | 278 | 1,089 | |||||||||||||||||||||||||||||||||
Corporate and commercial | 44 | 16 | 12 | 49 | 30 | 91 | 242 | |||||||||||||||||||||||||||||||||
– manufacturing and international trade and services | 19 | 16 | 8 | 2 | 8 | 82 | 135 | |||||||||||||||||||||||||||||||||
– commercial real estate and other property-related | 7 | – | 1 | – | 8 | 4 | 20 | |||||||||||||||||||||||||||||||||
– other commercial9 | 18 | – | 3 | 47 | 14 | 5 | 87 | |||||||||||||||||||||||||||||||||
Financial2 | 3 | – | 5 | – | 1 | – | 9 | |||||||||||||||||||||||||||||||||
Charge to income statement | 1,902 | 117 | 274 | 292 | 7,050 | 1,870 | 11,505 | |||||||||||||||||||||||||||||||||
Personal | 610 | 77 | 215 | 124 | 6,887 | 1,405 | 9,318 | |||||||||||||||||||||||||||||||||
– first lien residential mortgages | 98 | (10 | ) | 5 | 42 | 3,899 | 69 | 4,103 | ||||||||||||||||||||||||||||||||
– other personal1 | 512 | 87 | 210 | 82 | 2,988 | 1,336 | 5,215 | |||||||||||||||||||||||||||||||||
Corporate and commercial | 1,277 | 37 | 55 | 146 | 122 | 477 | 2,114 | |||||||||||||||||||||||||||||||||
– manufacturing and international trade and services | 416 | 57 | 35 | 25 | 42 | 326 | 901 | |||||||||||||||||||||||||||||||||
– commercial real estate and other property-related | 498 | – | 9 | 150 | 48 | 59 | 764 | |||||||||||||||||||||||||||||||||
– other commercial9 | 363 | (20 | ) | 11 | (29 | ) | 32 | 92 | 449 | |||||||||||||||||||||||||||||||
Financial2 | 15 | 3 | 4 | 22 | 41 | (12 | ) | 73 | ||||||||||||||||||||||||||||||||
Exchange and other movements18 | (141 | ) | (2 | ) | (82 | ) | (145 | ) | (2,347 | ) | (339 | ) | (3,056 | ) | ||||||||||||||||||||||||||
At 31 December 2011 | 5,292 | 581 | 782 | 1,731 | 7,239 | 2,011 | 17,636 | |||||||||||||||||||||||||||||||||
Impairment allowances against banks: | ||||||||||||||||||||||||||||||||||||||||
– individually assessed | 50 | – | – | 17 | 58 | – | 125 | |||||||||||||||||||||||||||||||||
Impairment allowances against customers: | ||||||||||||||||||||||||||||||||||||||||
– individually assessed | 3,754 | 288 | 505 | 1,250 | 416 | 324 | 6,537 | |||||||||||||||||||||||||||||||||
– collectively assessed17 | 1,488 | 293 | 277 | 464 | 6,765 | 1,687 | 10,974 | |||||||||||||||||||||||||||||||||
At 31 December 2011 | 5,292 | 581 | 782 | 1,731 | 7,239 | 2,011 | 17,636 | |||||||||||||||||||||||||||||||||
For footnotes, see page 249.
173
Table of Contents
HSBC HOLDINGS PLC
Report of the Directors: Operating and Financial Review(continued)
Movement in impairment allowances by industry sector
(Unaudited)
| 2012 US$m | 2011 US$m | 2010 US$m | 2009 US$m | 2008 US$m | ||||||||||||||||||||||||
Impairment allowances at 1 January | 17,636 | 20,241 | 25,649 | 23,972 | 19,212 | |||||||||||||||||||||||
Amounts written off | (9,812 | ) | (12,480 | ) | (19,300 | ) | (24,840 | ) | (17,955 | ) | ||||||||||||||||||
Personal | (6,905 | ) | (10,431 | ) | (16,458 | ) | (22,703 | ) | (16,625 | ) | ||||||||||||||||||
– first lien residential mortgages | (2,059 | ) | (2,662 | ) | (4,163 | ) | (4,704 | ) | (2,110 | ) | ||||||||||||||||||
– other personal1 | (4,846 | ) | (7,769 | ) | (12,295 | ) | (17,999 | ) | (14,515 | ) | ||||||||||||||||||
Corporate and commercial | (2,677 | ) | (2,009 | ) | (2,789 | ) | (1,984 | ) | (1,294 | ) | ||||||||||||||||||
– manufacturing and international trade and services | (1,610 | ) | (1,137 | ) | (1,050 | ) | (1,093 | ) | (789 | ) | ||||||||||||||||||
– commercial real estate and other property-related | (506 | ) | (392 | ) | (1,280 | ) | (327 | ) | (115 | ) | ||||||||||||||||||
– other commercial9 | (561 | ) | (480 | ) | (459 | ) | (564 | ) | (390 | ) | ||||||||||||||||||
Financial2 | (230 | ) | (40 | ) | (53 | ) | (153 | ) | (36 | ) | ||||||||||||||||||
Recoveries of amounts written off in previous years | 1,146 | 1,426 | 1,020 | 890 | 834 | |||||||||||||||||||||||
Personal | 966 | 1,175 | 846 | 712 | 686 | |||||||||||||||||||||||
– first lien residential mortgages | 140 | 86 | 93 | �� | 61 | 19 | ||||||||||||||||||||||
– other personal1 | 826 | 1,089 | 753 | 651 | 667 | |||||||||||||||||||||||
Corporate and commercial | 172 | 242 | 156 | 170 | 142 | |||||||||||||||||||||||
– manufacturing and international trade and services | 59 | 135 | 92 | 123 | 76 | |||||||||||||||||||||||
– commercial real estate and other property-related | 41 | 20 | 21 | 9 | 6 | |||||||||||||||||||||||
– other commercial9 | 72 | 87 | 43 | 38 | 60 | |||||||||||||||||||||||
Financial2 | 8 | 9 | 18 | 8 | 6 | |||||||||||||||||||||||
Charge to income statement | 8,160 | 11,505 | 13,548 | 24,942 | 24,131 | |||||||||||||||||||||||
Personal | 5,362 | 9,318 | 11,187 | 19,781 | 20,950 | |||||||||||||||||||||||
– first lien residential mortgages | 1,910 | 4,103 | 3,461 | 4,185 | 5,000 | |||||||||||||||||||||||
– other personal1 | 3,452 | 5,215 | 7,726 | 15,596 | 15,950 | |||||||||||||||||||||||
Corporate and commercial | 2,802 | 2,114 | 2,198 | 4,711 | 2,879 | |||||||||||||||||||||||
– manufacturing and international trade and services | 1,457 | 901 | 909 | 2,392 | 1,573 | |||||||||||||||||||||||
– commercial real estate and other property-related | 690 | 764 | 660 | 1,492 | 755 | |||||||||||||||||||||||
– other commercial9 | 655 | 449 | 629 | 827 | 551 | |||||||||||||||||||||||
Financial2 | (4 | ) | 73 | 163 | 450 | 302 | ||||||||||||||||||||||
Exchange and other movements18 | (961 | ) | (3,056 | ) | (676 | ) | 685 | (2,250 | ) | |||||||||||||||||||
At 31 December | 16,169 | 17,636 | 20,241 | 25,649 | 23,972 | |||||||||||||||||||||||
Impairment allowances against banks: | ||||||||||||||||||||||||||||
– individually assessed | 57 | 125 | 158 | 107 | 63 | |||||||||||||||||||||||
Impairment allowances against customers: | ||||||||||||||||||||||||||||
– individually assessed | 6,572 | 6,537 | 6,457 | 6,494 | 3,284 | |||||||||||||||||||||||
– collectively assessed | 9,540 | 10,974 | 13,626 | 19,048 | 20,625 | |||||||||||||||||||||||
At 31 December | 16,169 | 17,636 | 20,241 | 25,649 | 23,972 | |||||||||||||||||||||||
For footnotes, see page 249.
174
Table of Contents
HSBC HOLDINGS PLC
Report of the Directors: Operating and Financial Review(continued)
Movement in impairment allowances on loans and advances to customers and banks
(Audited)
Banks individually assessed |
| Customers | ||||||||||||||||||||
| Individually assessed US$m | Collectively assessed US$m | Total US$m | ||||||||||||||||||||
2012 | ||||||||||||||||||||||
At 1 January | 125 | 6,537 | 10,974 | 17,636 | ||||||||||||||||||
Amounts written off | (70 | ) | (2,361 | ) | (7,381 | ) | (9,812 | ) | ||||||||||||||
Recoveries of loans and advances previously written off | – | 199 | 947 | 1,146 | ||||||||||||||||||
Charge to income statement | – | 2,139 | 6,021 | 8,160 | ||||||||||||||||||
Exchange and other movements18 | 2 | 58 | (1,021 | ) | (961 | ) | ||||||||||||||||
At 31 December | 57 | 6,572 | 9,540 | 16,169 | ||||||||||||||||||
Impairment allowances on loans; and advances to customers | 6,572 | 9,540 | 16,112 | |||||||||||||||||||
– personal | 685 | 7,527 | 8,212 | |||||||||||||||||||
– corporate and commercial | 5,407 | 1,939 | 7,346 | |||||||||||||||||||
– financial | 480 | 74 | 554 | |||||||||||||||||||
| % | % | % | % | |||||||||||||||||||
As a percentage of loans and advances19,20 | 0.05 | 0.67 | 0.98 | 1.48 | ||||||||||||||||||
| US$m | US$m | US$m | US$m | |||||||||||||||||||
2011 | ||||||||||||||||||||||
At 1 January | 158 | 6,457 | 13,626 | 20,241 | ||||||||||||||||||
Amounts written off | (16 | ) | (1,633 | ) | (10,831 | ) | (12,480 | ) | ||||||||||||||
Recoveries of loans and advances previously written off | – | 191 | 1,235 | 1,426 | ||||||||||||||||||
Charge to income statement | (16 | ) | 1,931 | 9,590 | 11,505 | |||||||||||||||||
Exchange and other movements18 | (1 | ) | (409 | ) | (2,646 | ) | (3,056 | ) | ||||||||||||||
At 31 December | 125 | 6,537 | 10,974 | 17,636 | ||||||||||||||||||
Impairment allowances on loans and advances to customers | 6,537 | 10,974 | 17,511 | |||||||||||||||||||
– personal | 694 | 9,066 | 9,760 | |||||||||||||||||||
– corporate and commercial | 5,231 | 1,820 | 7,051 | |||||||||||||||||||
– financial | 612 | 88 | 700 | |||||||||||||||||||
| % | % | % | % | |||||||||||||||||||
As a percentage of loans and advances19,20 | 0.09 | 0.71 | 1.20 | 1.67 | ||||||||||||||||||
For footnotes, see page 249.
Individually and collectively assessed impairment charge to the income statement by industry sector
(Unaudited)
| 2012 |
| 2011 | ||||||||||||||||||||||||||||||||
Individually US$m | Collectively US$m | Total US$m | Individually US$m | Collectively US$m | Total US$m | |||||||||||||||||||||||||||||
Banks | – | – | – | (16 | ) | – | (16 | ) | ||||||||||||||||||||||||||
Personal | 96 | 5,266 | 5,362 | 141 | 9,177 | 9,318 | ||||||||||||||||||||||||||||
First lien residential mortgages | 40 | 1,870 | 1,910 | 104 | 3,999 | 4,103 | ||||||||||||||||||||||||||||
Other personal1 | 56 | 3,396 | 3,452 | 37 | 5,178 | 5,215 | ||||||||||||||||||||||||||||
Corporate and commercial | 2,029 | 773 | 2,802 | 1,703 | 411 | 2,114 | ||||||||||||||||||||||||||||
Manufacturing and international trade and services | 910 | 547 | 1,457 | 572 | 329 | 901 | ||||||||||||||||||||||||||||
Commercial real estate and other property-related | 604 | 86 | 690 | 768 | (4 | ) | 764 | |||||||||||||||||||||||||||
Other commercial9 | 515 | 140 | 655 | 363 | 86 | 449 | ||||||||||||||||||||||||||||
Financial | 14 | (18 | ) | (4 | ) | 87 | 2 | 89 | ||||||||||||||||||||||||||
Total charge to income statement | 2,139 | 6,021 | 8,160 | 1,915 | 9,590 | 11,505 | ||||||||||||||||||||||||||||
For footnotes, see page 249.
175
Table of Contents
HSBC HOLDINGS PLC
Report of the Directors: Operating and Financial Review(continued)
Net loan impairment charge to the income statement
(Unaudited)
2012 US$m | 2011 US$m | 2010 US$m | 2009 US$m | 2008 US$m | ||||||||||||||||||||||||
Individually assessed impairment allowances | 2,139 | 1,915 | 2,625 | 4,458 | 2,064 | |||||||||||||||||||||||
New allowances | 3,272 | 2,904 | 3,617 | 5,173 | 2,742 | |||||||||||||||||||||||
Release of allowances no longer required | (934 | ) | (798 | ) | (847 | ) | (581 | ) | (565 | ) | ||||||||||||||||||
Recoveries of amounts previously written off | (199 | ) | (191 | ) | (145 | ) | (134 | ) | (113 | ) | ||||||||||||||||||
Collectively assessed impairment allowances | 6,021 | 9,590 | 10,923 | 20,484 | 22,067 | |||||||||||||||||||||||
New allowances net of allowance releases | 6,968 | 10,825 | 11,798 | 21,240 | 22,788 | |||||||||||||||||||||||
Recoveries of amounts previously written off | (947 | ) | (1,235 | ) | (875 | ) | (756 | ) | (721 | ) | ||||||||||||||||||
| ||||||||||||||||||||||||||||
Total charge for impairment losses | 8,160 | 11,505 | 13,548 | 24,942 | 24,131 | |||||||||||||||||||||||
Banks | – | (16 | ) | 12 | 70 | 54 | ||||||||||||||||||||||
Customers | 8,160 | 11,521 | 13,536 | 24,872 | 24,077 | |||||||||||||||||||||||
| ||||||||||||||||||||||||||||
At 31 December | ||||||||||||||||||||||||||||
Impaired loans | 38,776 | 41,739 | 47,064 | 30,845 | 25,422 | |||||||||||||||||||||||
Impairment allowances | 16,169 | 17,636 | 20,241 | 25,649 | 23,972 | |||||||||||||||||||||||
Charge for impairment losses as a percentage of average gross loans and advances to customers by geographical region
(Unaudited)
Europe % | Hong % | Rest of Pacific % | MENA % | North % | Latin % | Total % | ||||||||||||||||||||||||||||||||||
2012 | ||||||||||||||||||||||||||||||||||||||||
New allowances net of allowance releases | 0.58 | 0.07 | 0.37 | 1.16 | 2.31 | 4.36 | 1.00 | |||||||||||||||||||||||||||||||||
Recoveries | (0.10 | ) | (0.02 | ) | (0.11 | ) | (0.26 | ) | (0.08 | ) | (0.62 | ) | (0.12 | ) | ||||||||||||||||||||||||||
Total charge for impairment losses | 0.48 | 0.05 | 0.26 | 0.90 | 2.23 | 3.74 | 0.88 | |||||||||||||||||||||||||||||||||
Amount written off net of recoveries | 0.50 | 0.11 | 0.30 | 0.81 | 2.57 | 3.21 | 0.93 | |||||||||||||||||||||||||||||||||
2011 | ||||||||||||||||||||||||||||||||||||||||
New allowances net of allowance releases | 0.59 | 0.11 | 0.38 | 1.46 | 4.01 | 3.54 | 1.34 | |||||||||||||||||||||||||||||||||
Recoveries | (0.14 | ) | (0.03 | ) | (0.15 | ) | (0.38 | ) | (0.07 | ) | (0.61 | ) | (0.15 | ) | ||||||||||||||||||||||||||
Total charge for impairment losses | 0.45 | 0.08 | 0.23 | 1.08 | 3.94 | 2.93 | 1.19 | |||||||||||||||||||||||||||||||||
Amount written off net of recoveries | 0.52 | 0.11 | 0.31 | 0.32 | 3.74 | 2.39 | 1.14 | |||||||||||||||||||||||||||||||||
176
Table of Contents
HSBC HOLDINGS PLC
Report of the Directors: Operating and Financial Review(continued)
Charge for impairment losses as a percentage of average gross loans and advances to customers
(Unaudited)
| 2012 | 2011 | 2010 | 2009 | 2008 | ||||||||||||||||||||||||
| % | % | % | % | % | ||||||||||||||||||||||||
New allowances net of allowance releases | 1.00 | 1.34 | 1.65 | 2.92 | 2.54 | |||||||||||||||||||||||
Recoveries | (0.12 | ) | (0.15 | ) | (0.12 | ) | (0.10 | ) | (0.09 | ) | ||||||||||||||||||
Total charge for impairment losses | 0.88 | 1.19 | 1.53 | 2.82 | 2.45 | |||||||||||||||||||||||
Amount written off net of recoveries | 0.93 | 1.14 | 2.08 | 2.71 | 1.75 | |||||||||||||||||||||||
Loans and advances to customers are excluded from average balances when reclassified to ‘Assets held for sale’. Including these loans and advances to customers, the total new allowances net
of allowance releases would be 1.00%, recoveries 0.12%, and amounts written off net of recoveries 0.93%.
Reconciliation of reported and constant currency changes by geographical region
(Unaudited)
|
| 31 Dec 11 as reported |
|
| Currency translation adjustment |
21 | | 31 Dec 11 at 31 Dec 12 exchange rates | | | Movement on a constant currency basis | |
| 31 Dec 12 as reported |
|
| Reported change | 22 |
| Constant currency change |
22 | ||||||||||||||||||||
| US$m | US$m | US$m | US$m | US$m | % | % | ||||||||||||||||||||||||||||||||||
Impaired loans | ||||||||||||||||||||||||||||||||||||||||
Europe | 11,819 | 451 | 12,270 | (1,125 | ) | 11,145 | (6 | ) | (9 | ) | ||||||||||||||||||||||||||||||
Hong Kong | 608 | 1 | 609 | (132 | ) | 477 | (22 | ) | (22 | ) | ||||||||||||||||||||||||||||||
Rest of Asia-Pacific | 1,070 | 27 | 1,097 | 50 | 1,147 | 7 | 5 | |||||||||||||||||||||||||||||||||
Middle East and North Africa | 2,445 | (6 | ) | 2,439 | 35 | 2,474 | 1 | 1 | ||||||||||||||||||||||||||||||||
North America | 22,758 | 17 | 22,775 | (2,430 | ) | 20,345 | (11 | ) | (11 | ) | ||||||||||||||||||||||||||||||
Latin America | 3,039 | (108 | ) | 2,931 | 257 | 3,188 | 5 | 9 | ||||||||||||||||||||||||||||||||
| 41,739 | 382 | 42,121 | (3,345 | ) | 38,776 | (7 | ) | (8 | ) | |||||||||||||||||||||||||||||||
Impairment allowances | ||||||||||||||||||||||||||||||||||||||||
Europe | 5,292 | 203 | 5,495 | (134 | ) | 5,361 | 1 | (2 | ) | |||||||||||||||||||||||||||||||
Hong Kong | 581 | 2 | 583 | (110 | ) | 473 | (19 | ) | (19 | ) | ||||||||||||||||||||||||||||||
Rest of Asia-Pacific | 782 | 17 | 799 | (53 | ) | 746 | (5 | ) | (7 | ) | ||||||||||||||||||||||||||||||
Middle East and North Africa | 1,731 | (5 | ) | 1,726 | 85 | 1,811 | 5 | 5 | ||||||||||||||||||||||||||||||||
North America | 7,239 | 14 | 7,253 | (1,637 | ) | 5,616 | (22 | ) | (23 | ) | ||||||||||||||||||||||||||||||
Latin America | 2,011 | (114 | ) | 1,897 | 265 | 2,162 | 8 | 13 | ||||||||||||||||||||||||||||||||
| 17,636 | 117 | 17,753 | (1,584 | ) | 16,169 | (8 | ) | (9 | ) | |||||||||||||||||||||||||||||||
For footnotes, see page 249.
177
Table of Contents
HSBC HOLDINGS PLC
Report of the Directors: Operating and Financial Review(continued)
Reconciliation of reported and constant currency impairment charge to the income statement
(Unaudited)
|
| 31 Dec 11 as reported |
|
| Currency translation adjustment |
21 | | 31 Dec 11 at 31 Dec 12 exchange rates | | | Movement on a constant currency basis | |
| 31 Dec 12 as reported |
|
| Reported change | 22 |
| Constant currency change |
22 | ||||||||||||||||||||
| US$m | US$m | US$m | US$m | US$m | % | % | ||||||||||||||||||||||||||||||||||
Europe | ||||||||||||||||||||||||||||||||||||||||
Charge for impairment losses | 1,902 | (47 | ) | 1,855 | 19 | 1,874 | (1 | ) | 1 | |||||||||||||||||||||||||||||||
New allowances | 3,033 | (82 | ) | 2,951 | 92 | 3,043 | 0 | 3 | ||||||||||||||||||||||||||||||||
Releases | (560 | ) | 29 | (531 | ) | (229 | ) | (760 | ) | 36 | 43 | |||||||||||||||||||||||||||||
Recoveries | (571 | ) | 6 | (565 | ) | 156 | (409 | ) | (28 | ) | (28 | ) | ||||||||||||||||||||||||||||
Hong Kong | ||||||||||||||||||||||||||||||||||||||||
Charge for impairment losses | 117 | – | 117 | (33 | ) | 84 | (28 | ) | (28 | ) | ||||||||||||||||||||||||||||||
New allowances | 268 | – | 268 | (44 | ) | 224 | (16 | ) | (16 | ) | ||||||||||||||||||||||||||||||
Releases | (104 | ) | – | (104 | ) | (5 | ) | (109 | ) | 5 | 5 | |||||||||||||||||||||||||||||
Recoveries | (47 | ) | – | (47 | ) | 16 | (31 | ) | (34 | ) | (34 | ) | ||||||||||||||||||||||||||||
Rest of Asia-Pacific | ||||||||||||||||||||||||||||||||||||||||
Charge for impairment losses | 274 | (1 | ) | 273 | 67 | 340 | 24 | 25 | ||||||||||||||||||||||||||||||||
New allowances | 681 | (17 | ) | 664 | 13 | 677 | (1 | ) | 2 | |||||||||||||||||||||||||||||||
Releases | (222 | ) | 10 | (212 | ) | 25 | (187 | ) | (16 | ) | (12 | ) | ||||||||||||||||||||||||||||
Recoveries | (185 | ) | 6 | (179 | ) | 29 | (150 | ) | (19 | ) | (16 | ) | ||||||||||||||||||||||||||||
MENA | ||||||||||||||||||||||||||||||||||||||||
Charge for impairment losses | 292 | – | 292 | (37 | ) | 255 | (13 | ) | (13 | ) | ||||||||||||||||||||||||||||||
New allowances | 630 | – | 630 | (50 | ) | 580 | (8 | ) | (8 | ) | ||||||||||||||||||||||||||||||
Releases | (235 | ) | – | (235 | ) | (15 | ) | (250 | ) | 6 | 6 | |||||||||||||||||||||||||||||
Recoveries | (103 | ) | – | (103 | ) | 28 | (75 | ) | (27 | ) | (27 | ) | ||||||||||||||||||||||||||||
North America | ||||||||||||||||||||||||||||||||||||||||
Charge for impairment losses | 7,050 | – | 7,050 | (3,588 | ) | 3,462 | (51 | ) | (51 | ) | ||||||||||||||||||||||||||||||
New allowances | 7,566 | – | 7,566 | (3,677 | ) | 3,889 | (49 | ) | (49 | ) | ||||||||||||||||||||||||||||||
Releases | (385 | ) | – | (385 | ) | 87 | (298 | ) | (23 | ) | (23 | ) | ||||||||||||||||||||||||||||
Recoveries | (131 | ) | – | (131 | ) | 2 | (129 | ) | (2 | ) | (2 | ) | ||||||||||||||||||||||||||||
Latin America | ||||||||||||||||||||||||||||||||||||||||
Charge for impairment losses | 1,870 | (217 | ) | 1,653 | 492 | 2,145 | 15 | 30 | ||||||||||||||||||||||||||||||||
New allowances | 2,421 | (239 | ) | 2,182 | 399 | 2,581 | 7 | 18 | ||||||||||||||||||||||||||||||||
Releases | (162 | ) | (24 | ) | (186 | ) | 102 | (84 | ) | (48 | ) | (55 | ) | |||||||||||||||||||||||||||
Recoveries | (389 | ) | 46 | (343 | ) | (9 | ) | (352 | ) | (10 | ) | 3 | ||||||||||||||||||||||||||||
| ||||||||||||||||||||||||||||||||||||||||
Total | ||||||||||||||||||||||||||||||||||||||||
Charge for impairment losses | 11,505 | (265 | ) | 11,240 | (3,080 | ) | 8,160 | (29 | ) | (27 | ) | |||||||||||||||||||||||||||||
New allowances | 14,599 | (338 | ) | 14,261 | (3,267 | ) | 10,994 | (25 | ) | (23 | ) | |||||||||||||||||||||||||||||
Releases | (1,668 | ) | 15 | (1,653 | ) | (35 | ) | (1,688 | ) | 1 | 2 | |||||||||||||||||||||||||||||
Recoveries | (1,426 | ) | 58 | (1,368 | ) | 222 | (1,146 | ) | (20 | ) | (16 | ) | ||||||||||||||||||||||||||||
| ||||||||||||||||||||||||||||||||||||||||
(Unaudited)
| Concentrations of credit risk are described in the Appendix to Risk on page 259. An analysis of credit quality is provided on page 154. |
The diversification of our lending portfolio across the regions, together with our broad range of global businesses and products, ensured that we were not overly dependent on a few countries or markets to generate income and growth in 2012. Our geographical diversification also supported our strategies for growth in faster-growing markets and those with international connectivity.
(Unaudited)
| 2012 | 2011 | |||||||||
| US$bn | US$bn | |||||||||
Trading securities23 | 213 | 186 | ||||||||
Loans and advances to banks | 78 | 76 | ||||||||
Loans and advances to customers | 118 | 69 | ||||||||
| 409 | 331 | |||||||||
For footnote, see page 249.
The largest concentration of securities held-for-trading within trading assets was in government and government agency debt securities. We had significant exposures to US Treasury and government agency securities (US$28bn) and
178
Table of Contents
HSBC HOLDINGS PLC
Report of the Directors: Operating and Financial Review(continued)
UK (US$12bn) and Hong Kong (US$6bn) government securities. For an analysis of securities held for trading, see Note 14 on the Financial Statements.
Financial investments
Our holdings of available-for-sale government and government agency debt securities, corporate debt securities, ABSs and other securities were spread across a wide range of issuers and geographical regions, with 14% invested in securities issued by banks and other financial institutions. We also hold assets backing insurance and investment contracts. For an analysis of financial investments, see Note 20 on the Financial Statements.
Derivatives
Derivative assets were US$357bn at 31 December 2012 (2011: US$346bn), of which the largest concentrations were interest rate and, to a lesser extent, foreign exchange derivatives. Our exposure
to derivatives increased, mainly due to a rise in the fair value of interest rate contracts following the downward movements in yield curves in major currencies, largely in Europe. However, this was partly offset by a rise in netting from an increase in trading through clearing houses coupled with the rise in fair values. For an analysis of derivatives, see Note 19 on the Financial Statements.
Loans and advances
Gross loans and advances to customers (excluding the financial sector) of US$932bn increased by US$61bn or 7% at 31 December 2012 compared with 2011, or 5% on a constant currency basis.
The following tables analyse loans by industry sector and by the location of the principal operations of the lending subsidiary or, in the case of the operations of The Hongkong and Shanghai Banking Corporation, HSBC Bank, HSBC Bank Middle East and HSBC Bank USA, by the location of the lending branch.
Gross loans and advances by industry sector
(Unaudited)
| 2012 | Currency effect | Move- ment | 2011 | 2010 | 2009 | 2008 | ||||||||||||||||||||||||||||||||||
| US$m | US$m | US$m | US$m | US$m | US$m | US$m | ||||||||||||||||||||||||||||||||||
Personal | 415,093 | 7,741 | 13,727 | 393,625 | 425,320 | 434,206 | 440,227 | |||||||||||||||||||||||||||||||||
First lien residential mortgages24 | 301,862 | 6,776 | 16,123 | 278,963 | 268,681 | 260,669 | 243,337 | |||||||||||||||||||||||||||||||||
Other personal1 | 113,231 | 965 | (2,396 | ) | 114,662 | 156,639 | 173,537 | 196,890 | ||||||||||||||||||||||||||||||||
Corporate and commercial | 513,493 | 8,376 | 32,301 | 472,816 | 445,512 | 383,090 | 407,474 | |||||||||||||||||||||||||||||||||
Manufacturing | 112,149 | 1,392 | 14,703 | 96,054 | 91,121 | 80,487 | 81,103 | |||||||||||||||||||||||||||||||||
International trade and services | 169,389 | 2,727 | 13,953 | 152,709 | 146,573 | 115,641 | 128,737 | |||||||||||||||||||||||||||||||||
Commercial real estate | 76,760 | 1,544 | 1,275 | 73,941 | 71,880 | 69,389 | 70,969 | |||||||||||||||||||||||||||||||||
Other property-related | 40,532 | 406 | 587 | 39,539 | 34,838 | 30,520 | 30,739 | |||||||||||||||||||||||||||||||||
Government | 10,785 | 184 | (478 | ) | 11,079 | 8,594 | 6,689 | 6,544 | ||||||||||||||||||||||||||||||||
Other commercial9 | 103,878 | 2,123 | 2,261 | 99,494 | 92,506 | 80,364 | 89,382 | |||||||||||||||||||||||||||||||||
Financial | 81,258 | 1,963 | (6,924 | ) | 86,219 | 101,725 | 96,650 | 101,085 | ||||||||||||||||||||||||||||||||
Non-bank financial institutions | 79,817 | 1,966 | (7,424 | ) | 85,275 | 100,163 | 95,237 | 99,536 | ||||||||||||||||||||||||||||||||
Settlement accounts | 1,441 | (3 | ) | 500 | 944 | 1,562 | 1,413 | 1,549 | ||||||||||||||||||||||||||||||||
Asset-backed securities reclassified | 3,891 | 208 | (1,597 | ) | 5,280 | 5,892 | 7,827 | 7,991 | ||||||||||||||||||||||||||||||||
Total gross loans and advances to customers | 1,013,735 | 18,288 | 37,507 | 957,940 | 978,449 | 921,773 | 956,777 | |||||||||||||||||||||||||||||||||
Gross loans and advances to banks | 152,603 | 1,439 | (29,948 | ) | 181,112 | 208,429 | 179,888 | 153,829 | ||||||||||||||||||||||||||||||||
Total gross loans and advances (A) | 1,166,338 | 19,727 | 7,559 | 1,139,052 | 1,186,878 | 1,101,661 | 1,110,606 | |||||||||||||||||||||||||||||||||
Impaired loans and advances | 38,671 | 379 | (3,292 | ) | 41,584 | 46,871 | 30,606 | 25,352 | ||||||||||||||||||||||||||||||||
– as a percentage of A | 3.3% | 4.3% | 4.8% | 3.3% | 2.6% | |||||||||||||||||||||||||||||||||||
Impairment allowances on loans and advances | 16,112 | 114 | (1,513 | ) | 17,511 | 20,083 | 25,542 | 23,909 | ||||||||||||||||||||||||||||||||
– as a percentage of A | 1.4% | 1.8% | 2.1% | 2.8% | 2.5% | |||||||||||||||||||||||||||||||||||
179
Table of Contents
HSBC HOLDINGS PLC
Report of the Directors: Operating and Financial Review(continued)
Gross loans and advances by industry sector (continued)
| Year ended 31 December | ||||||||||||||||||||||||||||||||||||||||
| 2012 | Currency effect | Move- ment | 2011 | 2010 | 2009 | 2008 | ||||||||||||||||||||||||||||||||||
| US$m | US$m | US$m | US$m | US$m | US$m | US$m | ||||||||||||||||||||||||||||||||||
Charge for impairment losses | 8,160 | 1,558 | (4,903 | ) | 11,505 | 13,548 | 24,942 | 24,131 | ||||||||||||||||||||||||||||||||
New allowances net of allowance releases | 9,306 | 1,500 | (5,125 | ) | 12,931 | 14,568 | 25,832 | 24,965 | ||||||||||||||||||||||||||||||||
Recoveries | (1,146 | ) | 58 | 222 | (1,426 | ) | (1,020 | ) | (890 | ) | (834 | ) | ||||||||||||||||||||||||||||
For footnotes, see page 249.
The following commentary is on a constant currency basis (see page 179):
Personal lending was 41% of gross lending to customers at 31 December 2012. Personal lending balances of US$415bn were 3% higher than at 31 December 2011 for reasons explained under ‘Personal lending’ (see page 24-25). First lien residential mortgage lending continued to represent the Group’s largest concentration in a single exposure type, the most significant balances being in the UK (42%), Hong Kong (17%) and the US (16%).
Corporate and commercial lending was 51% of gross lending to customers at 31 December 2012, representing our largest lending category. International trade and services was the biggest portion of the corporate and commercial lending category, which increased by 9% compared with 31 December 2011, mainly in Hong Kong and Rest of Asia-Pacific as we focused on corporate and commercial customers that trade internationally as well as in the UK, despite muted demand for credit. The most significant concentrations of international trade and services lending were in the UK, Hong Kong and Rest of Asia-Pacific. Our concentration in respect of the manufacturing sector increased, mainly driven by higher lending balances in Europe, due to growth in the UK of overdraft balances and corresponding customer accounts which did not meet netting criteria under accounting rules.
Commercial real estate lending represented 8% of total gross lending to customers. Lending increased marginally, as the demand for funds in property investment and development remained strong in Hong Kong. The main concentrations of commercial real estate lending were in the UK and Hong Kong.
Lending to non-bank financial institutions was US$81bn, a decrease of 8% compared with 31 December 2011 due to a decline in reverse repo balances, mainly in Europe. Our exposure was spread across a range of institutions, with the most significant concentration in the UK, France and the US.
Loans and advances to banks were widely distributed across many countries and decreased by 16% in 2012 as reverse repo balances declined, reflecting redeployment of liquidity to central banks, mainly in Europe.
The tables that follow provide information on loans and advances by geographical region and by country. The commentary on these loans and advances can be found in the ‘Personal lending’ and ‘Wholesale lending’ sections on pages 147 to 152.
180
Table of Contents
HSBC HOLDINGS PLC
Report of the Directors: Operating and Financial Review(continued)
Gross loans and advances to customers by industry sector and by geographical region
(Audited)
| Gross loans and advances to customers | ||||||||||||||||||||||||||||||||||||||||||||||
| Europe | Hong Kong | Rest of Pacific | MENA | North America | Latin America | Total | As a % gross | |||||||||||||||||||||||||||||||||||||||
| US$m | US$m | US$m | US$m | US$m | US$m | US$m | loans | |||||||||||||||||||||||||||||||||||||||
At 31 December 2012 | ||||||||||||||||||||||||||||||||||||||||||||||
Personal | 186,274 | 70,341 | 49,305 | 6,232 | 84,354 | 18,587 | 415,093 | 41.0 | ||||||||||||||||||||||||||||||||||||||
First lien residential mortgages24 | 135,172 | 52,296 | 36,906 | 2,144 | 70,133 | 5,211 | 301,862 | 29.8 | ||||||||||||||||||||||||||||||||||||||
Other personal1 | 51,102 | 18,045 | 12,399 | 4,088 | 14,221 | 13,376 | 113,231 | 11.2 | ||||||||||||||||||||||||||||||||||||||
Corporate and commercial | 223,061 | 99,199 | 85,305 | 22,452 | 47,886 | 35,590 | 513,493 | 50.6 | ||||||||||||||||||||||||||||||||||||||
Manufacturing | 56,690 | 10,354 | 19,213 | 3,373 | 9,731 | 12,788 | 112,149 | 11.1 | ||||||||||||||||||||||||||||||||||||||
International trade and services | 70,954 | 33,832 | 32,317 | 9,115 | 13,419 | 9,752 | 169,389 | 16.6 | ||||||||||||||||||||||||||||||||||||||
Commercial real estate | 33,279 | 23,384 | 9,286 | 865 | 6,572 | 3,374 | 76,760 | 7.6 | ||||||||||||||||||||||||||||||||||||||
Other property-related | 7,402 | 16,399 | 6,641 | 2,103 | 7,607 | 380 | 40,532 | 4.0 | ||||||||||||||||||||||||||||||||||||||
Government | 2,393 | 2,838 | 1,136 | 1,662 | 774 | 1,982 | 10,785 | 1.1 | ||||||||||||||||||||||||||||||||||||||
Other commercial9 | 52,343 | 12,392 | 16,712 | 5,334 | 9,783 | 7,314 | 103,878 | 10.2 | ||||||||||||||||||||||||||||||||||||||
Financial | 55,732 | 4,546 | 4,255 | 1,196 | 13,935 | 1,594 | 81,258 | 8.0 | ||||||||||||||||||||||||||||||||||||||
Non-bank financial institutions | 55,262 | 4,070 | 3,843 | 1,194 | 13,935 | 1,513 | 79,817 | 7.9 | ||||||||||||||||||||||||||||||||||||||
Settlement accounts | 470 | 476 | 412 | 2 | – | 81 | 1,441 | 0.1 | ||||||||||||||||||||||||||||||||||||||
Asset-backed securities reclassified | 3,694 | – | – | – | 197 | – | 3,891 | 0.4 | ||||||||||||||||||||||||||||||||||||||
Total gross loans and advances to customers (A) | 468,761 | 174,086 | 138,865 | 29,880 | 146,372 | 55,771 | 1,013,735 | 100.0 | ||||||||||||||||||||||||||||||||||||||
Percentage of A by geographical region | 46.3% | 17.2% | 13.7% | 2.9% | 14.4% | 5.5% | 100.0% | |||||||||||||||||||||||||||||||||||||||
Impaired loans | 11,080 | 477 | 1,147 | 2,448 | 20,331 | 3,188 | 38,671 | |||||||||||||||||||||||||||||||||||||||
– as a percentage of A | 2.4% | 0.3% | 0.8% | 8.2% | 13.9% | 5.7% | 3.8% | |||||||||||||||||||||||||||||||||||||||
Total impairment allowances | 5,321 | 473 | 746 | 1,794 | 5,616 | 2,162 | 16,112 | |||||||||||||||||||||||||||||||||||||||
– as a percentage of A | 1.1% | 0.3% | 0.5% | 6.0% | 3.8% | 3.9% | 1.6% | |||||||||||||||||||||||||||||||||||||||
At 31 December 2011 | ||||||||||||||||||||||||||||||||||||||||||||||
Personal | 166,147 | 63,181 | 43,580 | 5,269 | 95,336 | 20,112 | 393,625 | 41.1 | ||||||||||||||||||||||||||||||||||||||
First lien residential mortgages24 | 119,902 | 46,817 | 32,136 | 1,837 | 73,278 | 4,993 | 278,963 | 29.1 | ||||||||||||||||||||||||||||||||||||||
Other personal1 | 46,245 | 16,364 | 11,444 | 3,432 | 22,058 | 15,119 | 114,662 | 12.0 | ||||||||||||||||||||||||||||||||||||||
Corporate and commercial | 204,984 | 91,592 | 77,887 | 21,152 | 41,271 | 35,930 | 472,816 | 49.3 | ||||||||||||||||||||||||||||||||||||||
Manufacturing | 45,632 | 9,004 | 16,909 | 3,517 | 7,888 | 13,104 | 96,054 | 10.0 | ||||||||||||||||||||||||||||||||||||||
International trade and services | 64,604 | 29,066 | 29,605 | 8,664 | 10,710 | 10,060 | 152,709 | 15.9 | ||||||||||||||||||||||||||||||||||||||
Commercial real estate | 32,099 | 20,828 | 9,537 | 1,002 | 7,069 | 3,406 | 73,941 | 7.7 | ||||||||||||||||||||||||||||||||||||||
Other property-related | 7,595 | 17,367 | 6,396 | 1,770 | 5,729 | 682 | 39,539 | 4.1 | ||||||||||||||||||||||||||||||||||||||
Government | 3,143 | 2,918 | 962 | 1,563 | 656 | 1,837 | 11,079 | 1.2 | ||||||||||||||||||||||||||||||||||||||
Other commercial9 | 51,911 | 12,409 | 14,478 | 4,636 | 9,219 | 6,841 | 99,494 | 10.4 | ||||||||||||||||||||||||||||||||||||||
Financial | 63,671 | 3,473 | 3,183 | 1,168 | 12,817 | 1,907 | 86,219 | 9.0 | ||||||||||||||||||||||||||||||||||||||
Non-bank financial institutions | 63,313 | 3,192 | 2,937 | 1,162 | 12,817 | 1,854 | 85,275 | 8.9 | ||||||||||||||||||||||||||||||||||||||
Settlement accounts | 358 | 281 | 246 | 6 | – | 53 | 944 | 0.1 | ||||||||||||||||||||||||||||||||||||||
Asset-backed securities reclassified | 4,776 | – | – | – | 504 | – | 5,280 | 0.6 | ||||||||||||||||||||||||||||||||||||||
Total gross loans and advances to customers (B) | 439,578 | 158,246 | 124,650 | 27,589 | 149,928 | 57,949 | 957,940 | 100.0 | ||||||||||||||||||||||||||||||||||||||
Percentage of B by geographical region | 45.9% | 16.5% | 13.0% | 2.9% | 15.7% | 6.0% | 100.0% | |||||||||||||||||||||||||||||||||||||||
Impaired loans | 11,751 | 604 | 1,069 | 2,425 | 22,696 | 3,039 | 41,584 | |||||||||||||||||||||||||||||||||||||||
– as a percentage of B | 2.7% | 0.4% | 0.9% | 8.8% | 15.1% | 5.2% | 4.3% | |||||||||||||||||||||||||||||||||||||||
Total impairment allowances | 5,242 | 581 | 782 | 1,714 | 7,181 | 2,011 | 17,511 | |||||||||||||||||||||||||||||||||||||||
– as a percentage of B | 1.2% | 0.4% | 0.6% | 6.2% | 4.8% | 3.5% | 1.8% | |||||||||||||||||||||||||||||||||||||||
For footnotes, see page 249.
181
Table of Contents
HSBC HOLDINGS PLC
Report of the Directors: Operating and Financial Review(continued)
Loans and advances to banks by geographical region
(Unaudited)
| Europe |
| Hong Kong |
|
| Rest of Asia- Pacific |
| MENA | | North America | | | Latin America | | | Loans and advances to banks | |
| Impair- ment allowances |
25 | |||||||||||||
| US$m | US$m | US$m | US$m | US$m | US$m | US$m | US$m | |||||||||||||||||||||||||
At 31 December 2012 | 45,320 | 23,500 | 44,592 | 9,198 | 13,465 | 16,528 | 152,603 | (57 | ) | |||||||||||||||||||||||
At 31 December 2011 | 54,406 | 35,159 | 47,309 | 8,571 | 14,831 | 20,836 | 181,112 | (125 | ) | |||||||||||||||||||||||
At 31 December 2010 | 78,239 | 33,585 | 40,437 | 9,335 | 19,479 | 27,354 | 208,429 | (158 | ) | |||||||||||||||||||||||
At 31 December 2009 | 65,614 | 36,197 | 35,648 | 8,435 | 15,386 | 18,608 | 179,888 | (107 | ) | |||||||||||||||||||||||
At 31 December 2008 | 62,012 | 29,646 | 28,665 | 7,476 | 11,458 | 14,572 | 153,829 | (63 | ) | |||||||||||||||||||||||
For footnote, see page 249.
Gross loans and advances to customers by country
(Unaudited)
| First lien residential mortgages US$m | Other personal US$m | Property- related US$m | Commercial, international trade and other US$m | Total US$m | ||||||||||||||||||||||||||
At 31 December 2012 | ||||||||||||||||||||||||||||||
Europe | 135,172 | 51,102 | 40,681 | 241,806 | 468,761 | |||||||||||||||||||||||||
UK | 127,024 | 23,446 | 30,342 | 179,799 | 360,611 | |||||||||||||||||||||||||
France | 2,643 | 10,960 | 8,465 | 42,891 | 64,959 | |||||||||||||||||||||||||
Germany | 9 | 284 | 126 | 5,212 | 5,631 | |||||||||||||||||||||||||
Malta | 1,821 | 563 | 454 | 1,631 | 4,469 | |||||||||||||||||||||||||
Switzerland | 298 | 9,403 | 66 | 191 | 9,958 | |||||||||||||||||||||||||
Turkey | 1,062 | 4,084 | 317 | 3,356 | 8,819 | |||||||||||||||||||||||||
Other | 2,315 | 2,362 | 911 | 8,726 | 14,314 | |||||||||||||||||||||||||
Hong Kong | 52,296 | 18,045 | 39,783 | 63,962 | 174,086 | |||||||||||||||||||||||||
Rest of Asia-Pacific | 36,906 | 12,399 | 15,927 | 73,633 | 138,865 | |||||||||||||||||||||||||
Australia | 10,037 | 1,490 | 2,311 | 7,208 | 21,046 | |||||||||||||||||||||||||
India | 1,000 | 394 | 521 | 5,389 | 7,304 | |||||||||||||||||||||||||
Indonesia | 83 | 508 | 95 | 5,349 | 6,035 | |||||||||||||||||||||||||
Mainland China | 3,539 | 302 | 5,078 | 19,083 | 28,002 | |||||||||||||||||||||||||
Malaysia | 5,025 | 2,175 | 1,813 | 5,880 | 14,893 | |||||||||||||||||||||||||
Singapore | 10,123 | 4,812 | 3,938 | 9,854 | 28,727 | |||||||||||||||||||||||||
Taiwan | 3,323 | 597 | 120 | 5,180 | 9,220 | |||||||||||||||||||||||||
Vietnam | 50 | 252 | 60 | 1,710 | 2,072 | |||||||||||||||||||||||||
Other | 3,726 | 1,869 | 1,991 | 13,980 | 21,566 | |||||||||||||||||||||||||
Middle East and North Africa | 2,144 | 4,088 | 2,968 | 20,680 | 29,880 | |||||||||||||||||||||||||
Egypt | 2 | 479 | 124 | 2,600 | 3,205 | |||||||||||||||||||||||||
Qatar | 11 | 385 | 484 | 1,082 | 1,962 | |||||||||||||||||||||||||
UAE | 1,743 | 1,822 | 1,533 | 12,264 | 17,362 | |||||||||||||||||||||||||
Other | 388 | 1,402 | 827 | 4,734 | 7,351 | |||||||||||||||||||||||||
North America | 70,133 | 14,221 | 14,179 | 47,839 | 146,372 | |||||||||||||||||||||||||
US | 49,417 | 7,382 | 9,449 | 29,315 | 95,563 | |||||||||||||||||||||||||
Canada | 19,040 | 6,444 | 4,136 | 17,369 | 46,989 | |||||||||||||||||||||||||
Bermuda | 1,676 | 395 | 594 | 1,155 | 3,820 | |||||||||||||||||||||||||
Latin America | 5,211 | 13,376 | 3,754 | 33,430 | 55,771 | |||||||||||||||||||||||||
Argentina | 28 | 1,532 | 85 | 2,465 | 4,110 | |||||||||||||||||||||||||
Brazil | 1,745 | 8,042 | 1,287 | 18,022 | 29,096 | |||||||||||||||||||||||||
Mexico | 1,989 | 2,756 | 1,280 | 9,447 | 15,472 | |||||||||||||||||||||||||
Panama | 1,402 | 1,023 | 1,049 | 2,405 | 5,879 | |||||||||||||||||||||||||
Other | 47 | 23 | 53 | 1,091 | 1,214 | |||||||||||||||||||||||||
| ||||||||||||||||||||||||||||||
| 301,862 | 113,231 | 117,292 | 481,350 | 1,013,735 | ||||||||||||||||||||||||||
182
Table of Contents
HSBC HOLDINGS PLC
Report of the Directors: Operating and Financial Review(continued)
| First lien residential mortgages US$m | Other personal US$m | Property- related US$m | Commercial, international trade and other US$m | Total US$m | ||||||||||||||||||||||||||
At 31 December 2011 | ||||||||||||||||||||||||||||||
Europe | 119,902 | 46,245 | 39,694 | 233,737 | 439,578 | |||||||||||||||||||||||||
UK | 111,224 | 22,218 | 29,191 | 160,236 | 322,869 | |||||||||||||||||||||||||
France | 3,353 | 9,305 | 8,160 | 49,572 | 70,390 | |||||||||||||||||||||||||
Germany | 10 | 343 | 112 | 4,518 | 4,983 | |||||||||||||||||||||||||
Malta | 1,708 | 567 | 520 | 1,591 | 4,386 | |||||||||||||||||||||||||
Switzerland | 1,803 | 10,684 | 156 | 1,918 | 14,561 | |||||||||||||||||||||||||
Turkey | 767 | 2,797 | 255 | 3,652 | 7,471 | |||||||||||||||||||||||||
Other | 1,037 | 331 | 1,300 | 12,250 | 14,918 | |||||||||||||||||||||||||
Hong Kong | 46,817 | 16,364 | 38,195 | 56,870 | 158,246 | |||||||||||||||||||||||||
Rest of Asia-Pacific | 32,136 | 11,444 | 15,933 | 65,137 | 124,650 | |||||||||||||||||||||||||
Australia | 9,251 | 1,327 | 2,357 | 6,073 | 19,008 | |||||||||||||||||||||||||
India | 830 | 461 | 809 | 3,914 | 6,014 | |||||||||||||||||||||||||
Indonesia | 81 | 463 | 97 | 4,577 | 5,218 | |||||||||||||||||||||||||
Mainland China | 2,769 | 317 | 5,078 | 15,665 | 23,829 | |||||||||||||||||||||||||
Malaysia | 4,329 | 2,166 | 1,351 | 5,898 | 13,744 | |||||||||||||||||||||||||
Singapore | 7,919 | 4,108 | 3,690 | 9,433 | 25,150 | |||||||||||||||||||||||||
Taiwan | 3,062 | 550 | 139 | 4,555 | 8,306 | |||||||||||||||||||||||||
Vietnam | 42 | 184 | 42 | 1,397 | 1,665 | |||||||||||||||||||||||||
Other | 3,853 | 1,868 | 2,370 | 13,625 | 21,716 | |||||||||||||||||||||||||
Middle East and North Africa | 1,837 | 3,432 | 2,772 | 19,548 | 27,589 | |||||||||||||||||||||||||
Egypt | 2 | 441 | 100 | 2,775 | 3,318 | |||||||||||||||||||||||||
Qatar | 9 | 445 | 354 | 1,098 | 1,906 | |||||||||||||||||||||||||
UAE | 1,520 | 1,882 | 1,464 | 12,070 | 16,936 | |||||||||||||||||||||||||
Other | 306 | 664 | 854 | 3,605 | 5,429 | |||||||||||||||||||||||||
North America | 73,278 | 22,058 | 12,798 | 41,794 | 149,928 | |||||||||||||||||||||||||
US | 52,484 | 14,087 | 7,850 | 27,307 | 101,728 | |||||||||||||||||||||||||
Canada | 19,045 | 7,518 | 4,391 | 13,600 | 44,554 | |||||||||||||||||||||||||
Bermuda | 1,749 | 453 | 557 | 887 | 3,646 | |||||||||||||||||||||||||
Latin America | 4,993 | 15,119 | 4,088 | 33,749 | 57,949 | |||||||||||||||||||||||||
Argentina | 32 | 1,379 | 114 | 2,331 | 3,856 | |||||||||||||||||||||||||
Brazil | 1,657 | 9,802 | 1,660 | 18,638 | 31,757 | |||||||||||||||||||||||||
Mexico | 1,847 | 2,261 | 1,284 | 8,210 | 13,602 | |||||||||||||||||||||||||
Panama | 1,240 | 1,014 | 923 | 2,537 | 5,714 | |||||||||||||||||||||||||
Other | 217 | 663 | 107 | 2,033 | 3,020 | |||||||||||||||||||||||||
| ||||||||||||||||||||||||||||||
| 278,963 | 114,662 | 113,480 | 450,835 | 957,940 | ||||||||||||||||||||||||||
183
Table of Contents
HSBC HOLDINGS PLC
Report of the Directors: Operating and Financial Review(continued)
Country distribution of outstandings and cross-border exposures
(Unaudited)
We control the risk associated with cross-border lending through a centralised structure of internal country limits. Exposures to individual countries and cross-border exposure in the aggregate are kept under continual review.
The following table summarises the aggregate of our in-country foreign currency and cross-border outstandings by type of borrower to countries which individually represent in excess of 0.75% of our total
assets. The classification is based on the country of residence of the borrower but also recognises the transfer of country risk in respect of third-party guarantees, eligible collateral held and residence of the head office when the borrower is a branch. In accordance with the Bank of England Country Exposure Report (‘Form CE’) guidelines, outstandings comprise loans and advances (excluding settlement accounts), amounts receivable under finance leases, acceptances, commercial bills, certificates of deposit (‘CD’s) and debt and equity securities (net of short positions), and exclude accrued interest and intra-HSBC exposures.
In-country foreign currency and cross-border amounts outstanding
(Unaudited)
| Banks | Government and official institutions | Other | Total | |||||||||||||
| US$bn | US$bn | US$bn | US$bn | |||||||||||||
At 31 December 2012 | ||||||||||||||||
US | 5.9 | 37.9 | 14.7 | 58.5 | ||||||||||||
UK | 18.0 | 2.8 | 34.7 | 55.5 | ||||||||||||
Mainland China | 23.4 | 3.3 | 16.0 | 42.7 | ||||||||||||
Germany | 11.6 | 15.9 | 10.2 | 37.7 | ||||||||||||
France | 12.8 | 11.3 | 13.2 | 37.3 | ||||||||||||
Hong Kong | 8.3 | 1.0 | 21.3 | 30.6 | ||||||||||||
Japan76 | 6.7 | 16.8 | 1.6 | 25.1 | ||||||||||||
Ireland76 | 0.8 | 0.1 | 19.5 | 20.4 | ||||||||||||
At 31 December 2011 | ||||||||||||||||
UK | 9.5 | 4.5 | 53.7 | 67.7 | ||||||||||||
US | 8.1 | 40.8 | 16.7 | 65.6 | ||||||||||||
Mainland China | 25.4 | 7.6 | 13.3 | 46.3 | ||||||||||||
Japan | 8.6 | 25.8 | 0.9 | 35.3 | ||||||||||||
France | 11.0 | 11.3 | 10.0 | 32.3 | ||||||||||||
Hong Kong | 7.2 | 1.2 | 17.7 | 26.1 | ||||||||||||
Germany | 9.7 | 7.2 | 5.0 | 21.9 | ||||||||||||
Ireland | 1.7 | 0.1 | 17.5 | 19.3 | ||||||||||||
At 31 December 2010 | ||||||||||||||||
UK | 27.6 | 6.3 | 51.6 | 85.5 | ||||||||||||
US | 13.6 | 37.6 | 17.6 | 68.8 | ||||||||||||
France | 23.8 | 11.1 | 11.2 | 46.1 | ||||||||||||
Hong Kong | 15.4 | 1.6 | 17.2 | 34.2 | ||||||||||||
Mainland China | 21.5 | 1.2 | 9.1 | 31.8 | ||||||||||||
Japan | 14.0 | 16.2 | 1.3 | 31.5 | ||||||||||||
Germany | 17.8 | 4.2 | 9.4 | 31.4 | ||||||||||||
Ireland | 2.1 | 0.1 | 8.2 | 10.4 | ||||||||||||
For footnote, see page 249.
183a
Table of Contents
HSBC HOLDINGS PLC
Report of the Directors: Operating and Financial Review(continued)
(Audited)
Risk in HSBC Holdings is overseen by the HSBC Holdings Asset and Liability Management Committee (‘ALCO’). The major risks faced by HSBC Holdings are credit risk and market risk (in the form of interest rate risk and foreign exchange risk), of which the most significant is credit risk.
Credit risk in HSBC Holdings primarily arises from transactions with Group subsidiaries and from guarantees issued in support of obligations assumed by certain Group operations in the normal conduct of their business.
These risks are reviewed and managed within regulatory and internal limits for exposures by our
Global Risk function, which provides high-level centralised oversight and management of our credit risks worldwide.
HSBC Holdings’ maximum exposure to credit risk at 31 December 2012 is shown below. Its financial assets principally represent claims on Group subsidiaries in Europe and North America.
All of the derivative transactions are with HSBC undertakings which are banking counterparties (2011: 100%) and for which HSBC Holdings has in place master netting arrangements. From 2012, the credit risk exposure has been managed on a net basis and the remaining net exposure specifically collateralised in the form of cash.
HSBC Holdings – maximum exposure to credit risk
(Audited)
| At 31 December 2012 | At 31 December 2011 | |||||||||||||||||||||||||||||||||
| Maximum exposure | Offset | Exposure to credit risk (net) | Maximum exposure | Offset | Exposure to credit risk (net) | |||||||||||||||||||||||||||||
| US$m | US$m | US$m | US$m | US$m | US$m | |||||||||||||||||||||||||||||
Cash at bank and in hand: | ||||||||||||||||||||||||||||||||||
– balances with HSBC undertakings | 353 | – | 353 | 316 | – | 316 | ||||||||||||||||||||||||||||
Derivatives | 3,768 | (3,768 | ) | – | 3,568 | – | 3,568 | |||||||||||||||||||||||||||
Loans and advances to HSBC undertakings | 41,675 | – | 41,675 | 28,048 | – | 28,048 | ||||||||||||||||||||||||||||
Financial investments | 1,208 | – | 1,208 | 1,078 | – | 1,078 | ||||||||||||||||||||||||||||
Financial guarantees and similar contracts | 49,402 | – | 49,402 | 49,402 | – | 49,402 | ||||||||||||||||||||||||||||
Loan and other credit-related commitments | 1,200 | – | 1,200 | 1,810 | – | 1,810 | ||||||||||||||||||||||||||||
| 97,606 | (3,768 | ) | 93,838 | 84,222 | – | 84,222 | ||||||||||||||||||||||||||||
The credit quality of the loans and advances to HSBC undertakings is assessed as ‘strong’ or ‘good’, with 100% of the exposure being neither past due nor impaired (2011: 100%). The financial investments held by HSBC Holdings were rated by Standard and Poor’s (‘S&P’) at A– (2011: within the range of A to A–).
Securitisation exposures and other structured products
(Audited)
This section contains information about our exposure to the following:
| • | asset-backed securities (‘ABS’s), including mortgage-backed securities (‘MBS’s) and related collateralised debt obligations (‘CDO’s); |
| • | direct lending at fair value through profit or loss; |
| • | monoline insurance companies (‘monolines’); |
| • | leveraged finance transactions; and |
| • | representations and warranties related to mortgage sales and securitisation activities. |
Within the above is included information on the GB&M legacy credit activities in respect of Solitaire, the securities investment conduits (‘SIC’s), the ABSs trading portfolios and derivative transactions with monolines. Further information in respect of Solitaire and the SICs is provided in Note 42 on the Financial Statements.
Accounting policies
Our accounting policies for the classification and measurement of financial instruments are in accordance with the requirements of IAS 32 ‘Financial Instruments: Presentation’ and IAS 39 ‘Financial Instruments: Recognition and Measurement’, as described in Note 2 on the Financial Statements, and the use of assumptions and estimates in respect of the valuation of financial instruments is described in Note 15 on the Financial Statements.
184
Table of Contents
HSBC HOLDINGS PLC
Report of the Directors: Operating and Financial Review(continued)
(Unaudited)
Balance Sheet Management (see page 222) holds ABSs primarily issued by government agency and sponsored enterprises as part of our investment portfolios.
Our investment portfolios include SICs and money market funds. We also originate leveraged finance loans for the purpose of syndicating or selling them down to generate trading profit or holding them to earn interest margin over their lives.
(Audited)
2012 saw an improvement in the US housing market with home prices rising during the year. This
improvement coincided with decreasing concerns around sovereign credit, particularly in the second half of the year, and gave rise to price appreciation across this range of ABS asset classes. Unrealised losses in our available-for-sale portfolios reduced in the year from US$5.1bn to US$2.2bn, mainly as a result of price appreciation.
Within the following table are assets held in the GB&M legacy credit portfolio with a carrying value of US$31.6bn (2011: US$35.4bn).
| A summary of the nature of HSBC’s exposures is provided in the Appendix to Risk on page 259. |
(Audited)
| At 31 December 2012 | At 31 December 2011 | |||||||||||||||||||||
|
| Carrying amount | 26 | | Including sub-prime | |
| Carrying amount | 26 | | Including sub-prime and Alt-A | | |||||||||||
| US$bn | US$bn | US$bn | US$bn | |||||||||||||||||||
Asset-backed securities | 59.0 | 7.0 | 65.6 | 6.9 | ||||||||||||||||||
– fair value through profit or loss | 3.4 | 0.2 | 3.0 | 0.2 | ||||||||||||||||||
– available for sale27 | 49.6 | 6.1 | 54.6 | 5.7 | ||||||||||||||||||
– held to maturity27 | 1.6 | 0.1 | 2.0 | 0.2 | ||||||||||||||||||
– loans and receivables | 4.4 | 0.6 | 6.0 | 0.8 | ||||||||||||||||||
Direct lending at fair value through profit or loss | 1.0 | 0.6 | 1.2 | 0.8 | ||||||||||||||||||
Total asset-backed securities and direct lending at fair value through profit or loss | 60.0 | 7.6 | 66.8 | 7.7 | ||||||||||||||||||
Less securities subject to risk mitigation from credit derivatives with monolines and other financial institutions | (1.9 | ) | (0.2 | ) | (1.9 | ) | (0.2 | ) | ||||||||||||||
| 58.1 | 7.4 | 64.9 | 7.5 | |||||||||||||||||||
Leveraged finance loans | 2.8 | – | 3.6 | – | ||||||||||||||||||
– fair value through profit or loss | – | – | 0.2 | – | ||||||||||||||||||
– loans and receivables | 2.8 | – | 3.4 | – | ||||||||||||||||||
| ||||||||||||||||||||||
| 60.9 | 7.4 | 68.5 | 7.5 | |||||||||||||||||||
Exposure including securities subject to risk mitigation from credit derivatives with monolines and other financial institutions | 62.8 | 7.6 | 70.4 | 7.7 | ||||||||||||||||||
For footnotes, see page 249.
ABSs classified as available for sale
Our principal holdings of available-for-sale ABSs are in GB&M through special purpose entities (‘SPE’s), which were established from the outset
with the benefit of external investor first loss protection support, together with positions held directly and by Solitaire, where we provide first loss protection of US$1.2bn through credit enhancement and a liquidity facility.
185
Table of Contents
HSBC HOLDINGS PLC
Report of the Directors: Operating and Financial Review(continued)
Movement in the available-for-sale reserve
(Audited)
| 2012 | 2011 | |||||||||||||||||||||||||||||||||
|
| Directly held/ Solitaire |
28 | SPEs | Total |
| Directly held/ Solitaire |
28 | SPEs | Total | |||||||||||||||||||||||||
| US$m | US$m | US$m | US$m | US$m | US$m | |||||||||||||||||||||||||||||
Available-for-sale reserve at 1 January | (3,085 | ) | (2,061 | ) | (5,146 | ) | (4,102 | ) | (2,306 | ) | (6,408 | ) | ||||||||||||||||||||||
Increase/(decrease) in fair value of securities | 1,195 | 914 | 2,109 | 622 | (137 | ) | 485 | |||||||||||||||||||||||||||
Effect of impairments29 | 339 | 394 | 733 | 383 | 339 | 722 | ||||||||||||||||||||||||||||
Repayment of capital | 164 | 174 | 338 | 162 | 183 | 345 | ||||||||||||||||||||||||||||
Other movements | (86 | ) | (141 | ) | (227 | ) | (150 | ) | (140 | ) | (290 | ) | ||||||||||||||||||||||
Available-for-sale reserve at 31 December | (1,473 | ) | (720 | ) | (2,193 | ) | (3,085 | ) | (2,061 | ) | (5,146 | ) | ||||||||||||||||||||||
For footnotes, see page 249.
Securities investment conduits
(Unaudited)
The total carrying amount of ABSs held through SPEs in the above table represents holdings in which significant first loss protection is provided through capital notes issued by SICs, excluding Solitaire.
At each reporting date, we assess whether there is any objective evidence of impairment in the value of the ABSs held by SPEs. Impairment charges incurred on these assets are offset by a
credit to the impairment line for the amount of the loss allocated to capital note holders, subject to the carrying amount of the capital notes being sufficient to offset the loss. During the year impairment charges in one SPE, Mazarin Funding Ltd (‘Mazarin’), exceeded the carrying value of the capital notes liability and a charge of US$119m (2011: US$26m) was borne by HSBC as shown in the table below. In respect of the SICs, the capital notes held by third parties are expected to absorb the cash losses in the vehicles.
Available-for-sale reserve and economic first loss protection in SICs, excluding Solitaire
(Unaudited)
SICs excluding Solitaire at 31 December | ||||||||
| 2012 | 2011 | |||||||
| US$m | US$m | |||||||
Available-for-sale reserve | (787 | ) | (2,701 | ) | ||||
– related to asset-backed securities | (720 | ) | (2,061 | ) | ||||
Economic first loss protection | 2,286 | 2,286 | ||||||
Carrying amount of capital notes liability | 249 | 154 | ||||||
Impairment charge for the year: | ||||||||
– borne by HSBC | 119 | 26 | ||||||
– allocated to capital note holders | – | 313 | ||||||
(Audited)
The accounting policy for impairment and indicators of impairment is set out in Note 2 on the Financial Statements.
| | A summary of our impairment methodologies is provided in the Appendix to Risk on page 260. |
Analysis of exposures and significant movements
(Audited)
Sub-prime residential mortgage-related assets
The assets in the table below included US$2.2bn (2011: US$2.4bn) relating to US-originated assets and US$1.3bn (2011: US$1.0bn) relating to UK non-conforming residential mortgage-related assets.
At 31 December 2012, 13% (US$0.5bn) of our sub-prime residential mortgage-related assets were rated AA or AAA (2011: 25% (US$0.9bn)).
186
Table of Contents
HSBC HOLDINGS PLC
Report of the Directors: Operating and Financial Review(continued)
Carrying amount of HSBC’s consolidated holdings of ABSs, and direct lending held at fair value through profit or loss26
(Audited)
| Trading | | Available for sale | | | Held to maturity | | | Designated at fair value through profit or loss | | | Loans and receivables | | Total |
| Of which held through consolidated SPEs |
|
| Gross principal exposure |
30 |
| Credit default swap protection |
31 |
| Net principal exposure |
32 | |||||||||||||||||||||||||||||||||
| US$m | US$m | US$m | US$m | US$m | US$m | US$m | US$m | US$m | US$m | |||||||||||||||||||||||||||||||||||||||||||||||||
At 31 December 2012 | ||||||||||||||||||||||||||||||||||||||||||||||||||||||||||
Mortgage-related assets: | ||||||||||||||||||||||||||||||||||||||||||||||||||||||||||
Sub-prime residential | 698 | 2,455 | – | – | 435 | 3,588 | 2,723 | 5,483 | 130 | 5,353 | ||||||||||||||||||||||||||||||||||||||||||||||||
Direct lending | 566 | – | – | – | – | 566 | 482 | 1,221 | – | 1,221 | ||||||||||||||||||||||||||||||||||||||||||||||||
MBSs and MBS CDOs | 132 | 2,455 | – | – | 435 | 3,022 | 2,241 | 4,262 | 130 | 4,132 | ||||||||||||||||||||||||||||||||||||||||||||||||
US Alt-A residential | 157 | 3,658 | 118 | – | 157 | 4,090 | 2,994 | 6,992 | 100 | 6,892 | ||||||||||||||||||||||||||||||||||||||||||||||||
Direct lending | 71 | – | – | – | – | 71 | – | 77 | – | 77 | ||||||||||||||||||||||||||||||||||||||||||||||||
MBSs | 86 | 3,658 | 118 | – | 157 | 4,019 | 2,994 | 6,915 | 100 | 6,815 | ||||||||||||||||||||||||||||||||||||||||||||||||
US Government agency and sponsored enterprises: | ||||||||||||||||||||||||||||||||||||||||||||||||||||||||||
MBSs | 369 | 23,341 | 1,455 | – | – | 25,165 | – | 23,438 | – | 23,438 | ||||||||||||||||||||||||||||||||||||||||||||||||
Other residential | 695 | 2,084 | – | – | 499 | 3,278 | 1,459 | 3,888 | 87 | 3,801 | ||||||||||||||||||||||||||||||||||||||||||||||||
Direct lending | 322 | – | – | – | – | 322 | – | 322 | – | 322 | ||||||||||||||||||||||||||||||||||||||||||||||||
MBSs | 373 | 2,084 | – | – | 499 | 2,956 | 1,459 | 3,566 | 87 | 3,479 | ||||||||||||||||||||||||||||||||||||||||||||||||
Commercial property | ||||||||||||||||||||||||||||||||||||||||||||||||||||||||||
MBSs and MBS CDOs | 164 | 6,995 | – | 109 | 1,319 | 8,587 | 5,959 | 9,489 | – | 9,489 | ||||||||||||||||||||||||||||||||||||||||||||||||
| 2,083 | 38,533 | 1,573 | 109 | 2,410 | 44,708 | 13,135 | 49,290 | 317 | 48,973 | |||||||||||||||||||||||||||||||||||||||||||||||||
Leveraged finance-related assets: | ||||||||||||||||||||||||||||||||||||||||||||||||||||||||||
ABSs and ABS CDOs | 450 | 5,330 | – | – | 284 | 6,064 | 4,303 | 6,726 | 717 | 6,009 | ||||||||||||||||||||||||||||||||||||||||||||||||
Student loan-related assets: | ||||||||||||||||||||||||||||||||||||||||||||||||||||||||||
ABSs and ABS CDOs | 179 | 4,219 | – | – | 156 | 4,554 | 3,722 | 5,826 | 199 | 5,627 | ||||||||||||||||||||||||||||||||||||||||||||||||
Other assets: | ||||||||||||||||||||||||||||||||||||||||||||||||||||||||||
ABSs and ABS CDOs | 1,511 | 1,553 | – | 49 | 1,537 | 4,650 | 1,140 | 5,769 | 1,318 | 4,451 | ||||||||||||||||||||||||||||||||||||||||||||||||
| 4,223 | 49,635 | 1,573 | 158 | 4,387 | 59,976 | 22,300 | 67,611 | 2,551 | 65,060 | |||||||||||||||||||||||||||||||||||||||||||||||||
187
Table of Contents
HSBC HOLDINGS PLC
Report of the Directors: Operating and Financial Review(continued)
Carrying amount of HSBC’s consolidated holdings of ABSs, and direct lending held at fair value through profit or loss26(continued)
| Trading | | Available for sale | | | Held to maturity | | | Designated at fair value through profit or loss | | | Loans and receivables | | Total |
| Of which held through consolidated SPEs |
|
| Gross principal exposure |
30 |
| Credit default swap protection |
31 |
| Net principal exposure |
32 | |||||||||||||||||||||||||||||||||
| US$m | US$m | US$m | US$m | US$m | US$m | US$m | US$m | US$m | US$m | |||||||||||||||||||||||||||||||||||||||||||||||||
At 31 December 2011 | ||||||||||||||||||||||||||||||||||||||||||||||||||||||||||
Mortgage-related assets: | ||||||||||||||||||||||||||||||||||||||||||||||||||||||||||
Sub-prime residential | 896 | 2,134 | – | – | 598 | 3,628 | 2,367 | 6,222 | 275 | 5,947 | ||||||||||||||||||||||||||||||||||||||||||||||||
Direct lending | 733 | – | – | – | – | 733 | 487 | 1,684 | – | 1,684 | ||||||||||||||||||||||||||||||||||||||||||||||||
MBSs and MBS CDOs | 163 | 2,134 | – | – | 598 | 2,895 | 1,880 | 4,538 | 275 | 4,263 | ||||||||||||||||||||||||||||||||||||||||||||||||
US Alt-A residential | 190 | 3,516 | 166 | – | 243 | 4,115 | 2,827 | 8,610 | 100 | 8,510 | ||||||||||||||||||||||||||||||||||||||||||||||||
Direct lending | 114 | – | – | – | – | 114 | – | 119 | – | 119 | ||||||||||||||||||||||||||||||||||||||||||||||||
MBSs | 76 | 3,516 | 166 | – | 243 | 4,001 | 2,827 | 8,491 | 100 | 8,391 | ||||||||||||||||||||||||||||||||||||||||||||||||
US Government agency and sponsored enterprises: | ||||||||||||||||||||||||||||||||||||||||||||||||||||||||||
MBSs | 38 | 26,152 | 1,813 | – | – | 28,003 | – | 26,498 | – | 26,498 | ||||||||||||||||||||||||||||||||||||||||||||||||
Other residential | 670 | 3,286 | – | – | 978 | 4,934 | 2,098 | 5,702 | – | 5,702 | ||||||||||||||||||||||||||||||||||||||||||||||||
Direct lending | 314 | – | – | – | – | 314 | – | 309 | – | 309 | ||||||||||||||||||||||||||||||||||||||||||||||||
MBSs | 356 | 3,286 | – | – | 978 | 4,620 | 2,098 | 5,393 | – | 5,393 | ||||||||||||||||||||||||||||||||||||||||||||||||
Commercial property | ||||||||||||||||||||||||||||||||||||||||||||||||||||||||||
MBSs and MBS CDOs | 300 | 7,240 | – | 107 | 1,816 | 9,463 | 5,795 | 11,222 | – | 11,222 | ||||||||||||||||||||||||||||||||||||||||||||||||
| 2,094 | 42,328 | 1,979 | 107 | 3,635 | 50,143 | 13,087 | 58,254 | 375 | 57,879 | |||||||||||||||||||||||||||||||||||||||||||||||||
Leveraged finance-related assets: | ||||||||||||||||||||||||||||||||||||||||||||||||||||||||||
ABSs and ABS CDOs | 362 | 5,566 | – | – | 347 | 6,275 | 4,324 | 7,112 | 782 | 6,330 | ||||||||||||||||||||||||||||||||||||||||||||||||
Student loan-related assets: | ||||||||||||||||||||||||||||||||||||||||||||||||||||||||||
ABSs and ABS CDOs | 179 | 4,665 | – | – | 153 | 4,997 | 4,114 | 6,681 | 199 | 6,482 | ||||||||||||||||||||||||||||||||||||||||||||||||
Other assets: | ||||||||||||||||||||||||||||||||||||||||||||||||||||||||||
ABSs and ABS CDOs | 1,477 | 2,044 | – | 94 | 1,818 | 5,433 | 1,473 | 7,539 | 1,391 | 6,148 | ||||||||||||||||||||||||||||||||||||||||||||||||
| 4,112 | 54,603 | 1,979 | 201 | 5,953 | 66,848 | 22,998 | 79,586 | 2,747 | 76,839 | |||||||||||||||||||||||||||||||||||||||||||||||||
For footnotes, see page 249.
The above table excludes leveraged finance transactions, which are shown separately on page 190.
188
Table of Contents
HSBC HOLDINGS PLC
Report of the Directors: Operating and Financial Review(continued)
Of the non-high grade assets held of US$3.1bn (2011: US$2.7bn), US$1.4bn (2011: US$1.2bn) related to US-originated assets.
There was an increase in market prices for sub-prime assets during the course of 2012. Write-backs of US$44m on assets were recognised in 2012 (2011: impairments of US$42m). Of the above write-backs, there were US$67m of write-backs (2011: US$5m of write-backs) in the SICs, of which US$27m (2011: US$5m) were attributed to capital noteholders.
US Alt-A residential mortgage-related assets
In respect of US Alt-A securities, there were write-backs of US$19m (2011: impairments of US$687m). Despite the overall write-backs, impairments of US$190m (2011: US$344m) occurred in the SICs, of which US$32m (2011: US$318m) was borne by the capital noteholders.
At 31 December 2012, 5% (US$0.2bn) of these assets were rated AA or AAA (2011: 9% (US$0.4bn)).
Commercial property mortgage-related assets
Of our total of US$8.6bn (2011: US$9.5bn) of commercial property mortgage-related assets, US$4.1bn related to US-originated assets (2011: US$4.9bn). Spreads tightened on both US and non-US commercial property mortgage-related assets during 2012. Impairments of US$125m were recognised in 2012 (2011: US$36m).
Transactions with monoline insurers
(Audited)
HSBC’s exposure to derivative transactions entered into directly with monolines
Our principal exposure to monolines is through a number of OTC derivative transactions, mainly CDSs. We entered into these CDSs primarily to purchase credit protection against securities held at the time within the trading portfolio.
During 2012, our overall credit exposure to monolines decreased, primarily as a result of the tightening of credit spreads which reduced the fair value of the derivatives. The table below sets out the fair value, essentially the replacement cost, of the remaining derivative transactions at 31 December 2012, and hence the amount at risk if the CDS protection purchased were to be wholly ineffective because, for example, the monoline insurer was unable to meet its obligations. In order to further analyse that risk, the value of protection purchased is shown subdivided between those monolines that were rated by S&P at ‘BBB- or above’ at 31 December 2012, and those that were ‘below BBB–’ (BBB– is the S&P cut-off for an investment grade classification). The ‘Credit valuation adjustment’ column indicates the valuation adjustment taken against the net exposures, and reflects our best estimate of the likely loss of value on purchased protection arising from the deterioration in creditworthiness of the monolines. These valuation adjustments, which reflect a measure of the irrecoverability of the protection purchased, have been charged to the income statement.
HSBC’s exposure to derivative transactions entered into directly with monoline insurers
(Audited)
|
| Notional amount |
|
| Net exposure before credit valuation adjustment |
33 |
| Credit valuation adjustment |
34 |
| Net exposure after credit valuation adjustment |
| |||||||||||
| US$m | US$m | US$m | US$m | |||||||||||||||||||
At 31 December 2012 | ||||||||||||||||||||||
Derivative transactions with monoline counterparties | ||||||||||||||||||||||
Monoline – investment grade (BBB– or above) | 4,191 | 606 | (121 | ) | 485 | |||||||||||||||||
Monoline – sub-investment grade (below BBB–) | 957 | 303 | (158 | ) | 145 | |||||||||||||||||
| 5,148 | 909 | (279 | ) | 630 | ||||||||||||||||||
At 31 December 2011 | ||||||||||||||||||||||
Derivative transactions with monoline counterparties | ||||||||||||||||||||||
Monoline – investment grade (BBB– or above) | 4,936 | 873 | (87 | ) | 786 | |||||||||||||||||
Monoline – sub-investment grade (below BBB–) | 1,552 | 370 | (217 | ) | 153 | |||||||||||||||||
| 6,488 | 1,243 | (304 | ) | 939 | ||||||||||||||||||
For footnotes, see page 249.
189
Table of Contents
HSBC HOLDINGS PLC
Report of the Directors: Operating and Financial Review(continued)
Market prices are generally not readily available for CDSs, so they are valued on the basis of market prices of the referenced securities.
As described on page 56, during 2012 we amended our methodology for the calculation of credit valuation adjustments and debit valuation adjustments to reflect evolving market practice. As a result, our monoline credit and debit valuation adjustment calculations utilise a methodology based on CDS spreads with no adjustments being made based on the credit rating of the monoline.
Credit valuation adjustments for monolines
For monolines, the standard credit valuation adjustment methodology (as described on page 56) applies, with the exception that the future exposure profile is deemed to be constant (equal to the current market value) over the weighted average life of the referenced security. |
HSBC’s exposure to debt securities which benefit from guarantees provided by monolines
Within both the trading and available-for-sale portfolios, we hold bonds that are ‘wrapped’ with a credit enhancement from a monoline. As the bonds are traded explicitly with the benefit of this enhancement, any deterioration in the credit profile of the monoline is reflected in market prices and, therefore, in the carrying amount of these securities at 31 December 2012. For wrapped bonds held in our trading portfolio, the mark-to-market movement
is reflected through the income statement. For wrapped bonds held in the available-for-sale portfolio, the mark-to-market movement is reflected in equity unless there is objective evidence of impairment, in which case the impairment loss is reflected in the income statement. No wrapped bonds were included in the reclassification of financial assets described in Note 17 on the Financial Statements.
Leveraged finance transactions
(Audited)
Leveraged finance transactions include sub-investment grade acquisition or event-driven financing. The following table shows our exposure to leveraged finance transactions arising from primary transactions. Our additional exposure to leveraged finance loans through holdings of ABSs from our trading and investment activities is shown in the table on page 187.
We held leveraged finance commitments of US$2.8bn at 31 December 2012 (2011: US$3.7bn), of which US$2.6bn (2011: US$3.3bn) was funded.
At 31 December 2012, our principal exposures were to companies in two sectors: US$0.7bn to data processing (2011: US$1.3bn) and US$1.8bn to communications and infrastructure (2011: US$1.9bn).
HSBC’s exposure to leveraged finance transactions
(Audited)
| Exposures at 31 December 2012 | Exposures at 31 December 2011 | |||||||||||||||||||||||||||||||||
| Funded | 35 | Unfunded | 36 | Total | Funded | 35 | Unfunded | 36 | Total | |||||||||||||||||||||||||
| US$m | US$m | US$m | US$m | US$m | US$m | |||||||||||||||||||||||||||||
Europe | 2,108 | 162 | 2,270 | 2,795 | 253 | 3,048 | ||||||||||||||||||||||||||||
North America | 414 | 92 | 506 | 445 | 126 | 571 | ||||||||||||||||||||||||||||
| 2,522 | 254 | 2,776 | 3,240 | 379 | 3,619 | |||||||||||||||||||||||||||||
Held within: | ||||||||||||||||||||||||||||||||||
– loans and receivables | 2,522 | 252 | 2,774 | 3,120 | 328 | 3,448 | ||||||||||||||||||||||||||||
– fair value through profit or loss | – | 2 | 2 | 120 | 51 | 171 | ||||||||||||||||||||||||||||
For footnotes, see page 249.
190
Table of Contents
HSBC HOLDINGS PLC
Report of the Directors: Operating and Financial Review(continued)
Representations and warranties related to mortgage sales and securitisation activities
(Unaudited)
We have been involved in various activities related to the sale and securitisation of residential mortgages which are not recognised on our balance sheet. These activities include:
| • | the purchase of US$24bn of third-party originated mortgages by HSBC Bank USA and the securitisation of these by HSBC Securities (USA) Inc. (‘HSI’) between 2005 and 2007; |
| • | HSI acting as underwriter for third-party issuance of private label MBSs with an original issuance value of US$37bn, most of which were sub-prime; and |
| • | the origination and sale by HSBC Bank USA of mortgage loans, primarily to government sponsored entities. |
In sales and securitisations of mortgage loans, various representations and warranties regarding the loans may be made to purchasers of the mortgage loans and MBSs. In respect of the purchase and securitisation of third party originated mortgages and the underwriting of third party MBSs, the obligation to repurchase loans in the event of a breach of loan level representations and warranties resides predominantly with the organisation that originated the loan.
Participants in the US mortgage securitisation market that purchased and repackaged whole loans have been the subject of lawsuits and governmental and regulatory investigations and inquiries which have been directed at groups within the US mortgage market such as servicers, originators, underwriters, trustees or sponsors of securitisations. Further information is provided in Note 43 on the Financial Statements.
At 31 December 2012, a liability of US$219m was recognised in respect of various representations and warranties relating to the origination and sale by HSBC Bank USA of mortgage loans, primarily to government sponsored entities (2011: US$237m). These relate to, among other things, the ownership of the loans, the validity of the liens, the loan selection and origination process and compliance with the origination criteria established by the agencies. In the event of a breach of our representations and warranties, HSBC Bank USA may be obliged to repurchase the loans with identified defects or to indemnify the buyers. The liability is estimated based on the level of outstanding repurchase demands, the level of outstanding requests for loan files and estimated future demands in respect of mortgages sold to date which are either two or more payments delinquent or expected to become delinquent at an estimated conversion rate. Repurchase demands of US$89m were outstanding at 2012 (2011: US$113m).
191
Table of Contents
HSBC HOLDINGS PLC
Report of the Directors: Operating and Financial Review(continued)
Upon receipt of a repurchase demand, we perform a detailed evaluation of the request. In many cases, we ultimately are not required to repurchase a loan as we are able to resolve the purported defect. From initial inquiry to ultimate resolution, a typical case takes roughly 12 months. Acceptance of a repurchase demand will involve either a) repurchase of the loan at the unpaid principal balance plus accrued interest or b) reimbursement for any realised loss on the sale of a property (‘make-whole’ payment).
To date, repurchase demands we have received primarily relate to prime loans sourced during 2004
through 2008 from the legacy broker channel which we exited from in late 2008. Loans sold to GSEs and other third parties originated in 2004 through 2008 subject to representations and warranties for which we may be liable had an outstanding principal balance of approximately US$15.1bn at 31 December 2012, including US$9.6bn of loans sourced from our legacy broker channel.
The trend in repurchase demands received on loans sold to GSEs and other third parties by loan origination vintage, outstanding repurchase demands and movement in repurchase liabilities are as follows:
Trend in repurchase demands received by loans sold to GSEs and other third parties by origination vintage
2012 US$m | 2011 US$m | |||||||||
Pre-2004 | 7 | 5 | ||||||||
2004 | 21 | 13 | ||||||||
2005 | 28 | 24 | ||||||||
2006 | 80 | 56 | ||||||||
2007 | 209 | 146 | ||||||||
2008 | 123 | 98 | ||||||||
Post-2008 | 18 | 68 | ||||||||
Total repurchase demands received | 486 | 410 | ||||||||
Outstanding repurchase demands received from GSEs and other third parties
| At 31 December | ||||||||||
2012 US$m | 2011 US$m | |||||||||
GSEs | 86 | 78 | ||||||||
Others | 3 | 35 | ||||||||
Total | 89 | 113 | ||||||||
Movement in repurchase liability for loans sold to GSEs and other third parties
2012 US$m | 2011 US$m | |||||||||
At 1 January | 237 | 262 | ||||||||
Increase in liability recorded through earnings | 134 | 92 | ||||||||
Realised losses | (152 | ) | (117 | ) | ||||||
At 31 December | 219 | 237 | ||||||||
Because the level of mortgage loan repurchase losses are dependent upon economic factors, investor demand strategies and other external risk factors such as housing market trends that may change, the estimate of the liability for a mortgage loan repurchase requires significant judgement. Because these estimates are influenced by factors outside our control, there is uncertainty inherent in them, making it reasonably possible that the estimates could change.
Risk elements in the loan portfolio
(Unaudited)
The disclosure of credit risk elements in this section reflects US accounting practice and classifications. The purpose of the disclosure is to present within the US disclosure framework those elements of the loan portfolios with a greater risk of loss. The three main classifications of credit risk elements presented are:
| • | impaired loans; |
| • | unimpaired loans contractually past due 90 days or more as to interest or principal; and |
191a
Table of Contents
HSBC HOLDINGS PLC
Report of the Directors: Operating and Financial Review(continued)
| • | troubled debt restructurings not included in the above. |
Interest forgone on impaired and restructured loans
Interest income that would have been recognised under the original terms of impaired and restructured loans amounted to approximately US$2.9bn in 2012 (2011: US$3.6bn). The table below analyses this by geographic region.
| 2012 | 2011 | |||||||||
| US$m | US$m | |||||||||
Europe | 215 | 266 | ||||||||
Hong Kong | 29 | 62 | ||||||||
Rest of Asia-Pacific | 78 | 109 | ||||||||
Middle East and North Africa | 118 | 140 | ||||||||
North America | 1,817 | 2,498 | ||||||||
Latin America | 610 | 545 | ||||||||
| 2,867 | 3,620 | |||||||||
Interest income from such loans of approximately US$1.7bn was recorded in 2012 (2011: US$1.9bn). The table below analyses this by geographic region.
| 2012 | 2011 | |||||||||
| US$m | US$m | |||||||||
Europe | 41 | 69 | ||||||||
Hong Kong | 7 | 6 | ||||||||
Rest of Asia-Pacific | 29 | 49 | ||||||||
Middle East and North Africa | 29 | 33 | ||||||||
North America | 1,110 | 1,310 | ||||||||
Latin America | 491 | 391 | ||||||||
| 1,707 | 1,858 | |||||||||
In the following tables, we present information on our impaired loans and advances in accordance with the classification approach described on page 162.
A loan is impaired, and an impairment allowance is recognised, when there is objective evidence of a loss event that has an effect on the cash flows of the loan which can be reliably estimated. In accordance with IFRSs, we recognise interest income on assets after they have been written down as a result of an impairment loss.
The balance of impaired loans at 31 December 2012 was US$3.0bn lower than at 31 December 2011. This reduction occurred primarily in North America due to the continued run-off of the CML portfolio which included the reclassification of certain impaired non-real estate personal loan balances to held for sale. In addition, impaired loans declined in Europe due to releases and write-offs of a number of non-performing loans, increased focus on higher quality loans, lower delinquency rates and the continued low interest rate environment.
Unimpaired loans past due 90 days or more
Examples of unimpaired loans past due 90 days or more include individually assessed mortgages that are in arrears more than 90 days where there are no other indicators of impairment, but where the value of collateral is sufficient to repay both the principal debt and all potential interest for at least one year; and short-term trade facilities past due more than 90 days for technical reasons such as delays in documentation, but where there is no concern over the creditworthiness of the counterparty.
The amount of unimpaired loans past due 90 days or more at 31 December 2012 was US$224m, US$139m lower than at 31 December 2011. The decrease was primarily in the Middle East and North Africa due to the repayment of a significant loan relating to an individual customer.
Under US GAAP, a troubled debt restructuring (‘TDR’) is a loan the terms of which have been modified for economic or legal reasons related to the borrower’s financial difficulties to grant a concession to the borrower that the lender would not otherwise consider. A modification which results in a delay in payment that is considered insignificant is not regarded as a concession for the purposes of this disclosure. The SEC requires separate disclosure of any loans which meet the definition of a TDR that are not included in the previous two loan categories. These are classified as TDR’s in the table on page 191d. Loans that have been identified as a TDR under the US guidance retain this designation until they are repaid or are derecognised. This treatment differs from the Group’s impaired loans disclosure convention under IFRS under which a loan may return to unimpaired status after demonstrating a significant reduction in the risk of non-payment of future cash flows. As a result reported TDRs include those loans that have returned to unimpaired status under the Group’s disclosure convention for renegotiated loans.
The amount of TDRs at 31 December 2012 was US$2.2bn higher than at 31 December 2011. The increase was mainly in North America, and to a lesser extent in Europe. Renegotiated loans meeting the TDR definition which have ceased to be classified as impaired loans after the demonstration of a significant reduction in the risk of non-payment of future cash-flows continue to be classified in the TDR category until they are either repaid or written
191b
Table of Contents
HSBC HOLDINGS PLC
Report of the Directors: Operating and Financial Review(continued)
off. The TDR balances have continued to increase in 2012, reflecting renegotiated loans that have demonstrated continued payment performance and are no longer disclosed as impaired.
Potential problem loans are loans where information on possible credit problems among borrowers causes management to seriously doubt their ability to comply with the loan repayment terms. There are no potential problem loans other than those identified in the table of risk elements on page 191d. The following concentrations of credit risk have a higher risk of containing potential problem loans.
‘Mortgage lending’ on page 148 includes disclosure about certain homogeneous groups of loans which are collectively assessed for impairment, which may represent exposures to potential problem loans, including interest-only mortgages and affordability mortgages, including ARMs. Collectively assessed loans and advances, as set out on page 169, although not classified as impaired until more than 90 days past due, are assessed collectively for losses that have been incurred but have not yet been individually
identified. This policy is further described on pages 258 and 389.
‘Renegotiated loans and forbearance’ on page 158 includes disclosure about the credit quality of loans whose contractual terms have been changed at some point in the life of the loan because of significant concerns about the borrower’s ability to make contractual payments when due. Where renegotiated loans are not classified as impaired, this is because they exhibit a lower risk of non-payment of future cash flows than those presented as impaired. However, some of these loans may have a higher risk of becoming delinquent in the future, and may therefore be potential problem loans.
‘Areas of special interest’ on page 128 includes information on refinancing risk which is a focus of scrutiny in key commercial real estate markets. Where a loan which is due to be repaid through refinancing over the short term cannot, at maturity, be refinanced by HSBC or other banks on current market terms this will either lead to the loan being treated as impaired due to repayment default or, if refinanced within HSBC, may result in it being treated as a renegotiated loan because of the degree of forbearance required. Therefore loans in portfolios subject to refinancing risk may include potential problem loans.
191c
Table of Contents
HSBC HOLDINGS PLC
Report of the Directors: Operating and Financial Review(continued)
Analysis of risk elements in the loan portfolio by geographical region
(Unaudited)
| At 31 December | ||||||||||||||||||||||||||||
2012 US$m | 2011 US$m | 2010 US$m | 2009 US$m | 2008 US$m | ||||||||||||||||||||||||
Impaired loans | ||||||||||||||||||||||||||||
Europe | 11,145 | 11,819 | 11,500 | 10,873 | 6,844 | |||||||||||||||||||||||
Hong Kong | 477 | 608 | 665 | 846 | 852 | |||||||||||||||||||||||
Rest of Asia-Pacific | 1,147 | 1,070 | 1,324 | 1,201 | 835 | |||||||||||||||||||||||
Middle East and North Africa | 2,474 | 2,445 | 2,549 | 1,666 | 279 | |||||||||||||||||||||||
North America | 20,345 | 22,758 | 27,902 | 13,308 | 14,285 | |||||||||||||||||||||||
Latin America | 3,188 | 3,039 | 3,124 | 2,951 | 2,327 | |||||||||||||||||||||||
| 38,776 | 41,739 | 47,064 | 30,845 | 25,422 | ||||||||||||||||||||||||
Unimpaired loans contractually past due 90 days or more as to principal or interest | ||||||||||||||||||||||||||||
Europe | 33 | 41 | 65 | 57 | 635 | |||||||||||||||||||||||
Hong Kong | 4 | 3 | 7 | 4 | 43 | |||||||||||||||||||||||
Rest of Asia-Pacific | 10 | 21 | 40 | 36 | 84 | |||||||||||||||||||||||
Middle East and North Africa | 108 | 214 | 263 | 215 | 190 | |||||||||||||||||||||||
North America | 69 | 74 | 265 | 217 | 108 | |||||||||||||||||||||||
Latin America | – | 10 | 3 | 40 | 21 | |||||||||||||||||||||||
| 224 | 363 | 643 | 569 | 1,081 | ||||||||||||||||||||||||
Troubled debt restructurings (not included in the classifications above) | ||||||||||||||||||||||||||||
Europe | 1,306 | 753 | 591 | 436 | 366 | |||||||||||||||||||||||
Hong Kong | 134 | 108 | 205 | 236 | 165 | |||||||||||||||||||||||
Rest of Asia-Pacific | 102 | 122 | 198 | 135 | 90 | |||||||||||||||||||||||
Middle East and North Africa | 593 | 444 | 141 | 103 | 29 | |||||||||||||||||||||||
North America | 3,813 | 2,300 | 1,970 | 9,613 | 5,618 | |||||||||||||||||||||||
Latin America | 1,001 | 1,037 | 1,274 | 1,518 | 1,067 | |||||||||||||||||||||||
| 6,949 | 4,764 | 4,379 | 12,041 | 7,335 | ||||||||||||||||||||||||
Trading loans classified as in default | ||||||||||||||||||||||||||||
North America | 166 | 230 | 412 | 798 | 561 | |||||||||||||||||||||||
Risk elements on loans77 | ||||||||||||||||||||||||||||
Europe | 12,484 | 12,613 | 12,157 | 11,366 | 7,845 | |||||||||||||||||||||||
Hong Kong | 615 | 719 | 877 | 1,086 | 1,060 | |||||||||||||||||||||||
Rest of Asia-Pacific | 1,259 | 1,213 | 1,562 | 1,372 | 1,009 | |||||||||||||||||||||||
Middle East and North Africa | 3,175 | 3,103 | 2,953 | 1,984 | 498 | |||||||||||||||||||||||
North America | 24,393 | 25,362 | 30,549 | 23,936 | 20,572 | |||||||||||||||||||||||
Latin America | 4,189 | 4,086 | 4,401 | 4,509 | 3,415 | |||||||||||||||||||||||
| 46,115 | 47,096 | 52,499 | 44,253 | 34,399 | ||||||||||||||||||||||||
Assets held for resale78 | ||||||||||||||||||||||||||||
Europe | 51 | 60 | 47 | 52 | 81 | |||||||||||||||||||||||
Hong Kong | 5 | 4 | 2 | 10 | 26 | |||||||||||||||||||||||
Rest of Asia-Pacific | 14 | 10 | 5 | 8 | 11 | |||||||||||||||||||||||
Middle East and North Africa | – | – | 2 | 2 | 2 | |||||||||||||||||||||||
North America | 319 | 359 | 1,084 | 707 | 1,758 | |||||||||||||||||||||||
Latin America | 55 | 69 | 121 | 153 | 113 | |||||||||||||||||||||||
| 444 | 502 | 1,261 | 932 | 1,991 | ||||||||||||||||||||||||
Total risk elements | ||||||||||||||||||||||||||||
Europe | 12,535 | 12,673 | 12,204 | 11,418 | 7,926 | |||||||||||||||||||||||
Hong Kong | 620 | 723 | 879 | 1,096 | 1,086 | |||||||||||||||||||||||
Rest of Asia-Pacific | 1,273 | 1,223 | 1,567 | 1,380 | 1,020 | |||||||||||||||||||||||
Middle East and North Africa | 3,175 | 3,103 | 2,955 | 1,986 | 500 | |||||||||||||||||||||||
North America | 24,712 | 25,721 | 31,633 | 24,643 | 22,330 | |||||||||||||||||||||||
Latin America | 4,244 | 4,155 | 4,522 | 4,662 | 3,528 | |||||||||||||||||||||||
| 46,559 | 47,598 | 53,760 | 45,185 | 36,390 | ||||||||||||||||||||||||
| % | % | % | % | % | ||||||||||||||||||||||||
Loan impairment allowances as a percentage of risk elements on loans79 | 35.2 | 37.6 | 38.9 | 59.0 | 70.8 | |||||||||||||||||||||||
For footnotes, see page 249.
191d
Table of Contents
HSBC HOLDINGS PLC
Report of the Directors: Operating and Financial Review(continued)
(Unaudited)
| Page | Tables | Page | ||||||||||
| 192 | ||||||||||||
| 192 | ||||||||||||
| 193 | Summary of exposures to eurozone countries | 193 | ||||||||||
| 194 | Exposures to Spain | 194 | ||||||||||
| Exposures to Ireland | 195 | |||||||||||
| Exposures to Italy | 196 | |||||||||||
| Exposures to Greece | 197 | |||||||||||
| Exposures to Portugal | 198 | |||||||||||
| 199 | ||||||||||||
| 200 | Summary of exposures to other eurozone countries | 200 | ||||||||||
| 201 | In-country funding exposure | 202 | ||||||||||
Exposures to countries in the eurozone
(Audited)
The tables in this section summarise our exposures to selected eurozone countries, including:
| • | governments and central banks along with quasi government agencies; |
| • | banks; |
| • | other financial institutions and corporates; and |
| • | personal lending. |
Exposures to banks, other financial institutions, other corporates and personal lending are based upon the counterparty’s country of domicile.
The gross exposure represents the on-balance sheet carrying amounts recorded in accordance with IFRSs and off-balance sheet exposures.
The net exposure is stated after taking into account mitigating offsets that are incorporated into the risk management view of the exposure but do not meet accounting offset requirements. These risk mitigating offsets include:
| • | short positions managed together with trading assets; |
| • | derivative liabilities for which a legally enforceable right of offset with derivative assets exists; and |
| • | collateral received on derivative assets. |
Short positions managed together with trading assets mitigate risk to which HSBC is exposed at the balance sheet date when, in the event of default, the trading asset and related short position crystallise
gains and losses simultaneously. When such relationships exist, an element of the risk will remain where the short and long positions do not match exactly, for example, the maturity of the short position is less than the trading asset or the short position does not represent an identical security. The remaining risk is reflected in the gross balance sheet exposure shown before risk mitigation. However, as the net position best reflects the effects of a credit event should it occur at the balance sheet date, we consider that this measure is a key view of risk at that date.
Credit risk mitigation includes derivative liabilities with the same counterparty when a master netting arrangement is in place and the credit risk exposure is managed on a net basis or the position is specifically collateralised, normally in the form of cash. These amounts do not qualify for net presentation for accounting purposes as settlement may not actually be made on a net basis, though we consider the net presentation more accurately reflects the risk exposure.
The effect of the transfer of risk to policyholders under unit linked insurance contracts, as well as trading assets which represent collateral to support associated liabilities, are separately disclosed in the detailed peripheral country exposures, but are not deducted from the total net exposure.
CDSs reported in the detailed peripheral eurozone country tables are not included in the derivative exposure line as they are typically transacted with counterparties incorporated or domiciled outside the country whose exposure they reference.
192
Table of Contents
HSBC HOLDINGS PLC
Report of the Directors: Operating and Financial Review(continued)
Credit default swaps and off-balance sheet exposures
The CDSs were transacted with banks with investment grade credit ratings, and would pay out in the event of the default of the referenced security and certain other credit events. CDS contracts disclosed in the tables below were principally entered into for customer facilitation with banks and financial institutions where their terms are typically drawn up in accordance with the guidance set out in the 2003 ISDA Credit Derivatives Definitions and the 2009 Supplement. The credit events that trigger the payout of CDSs may differ as they are based on the terms of each agreement
between the counterparties. Such credit events normally include bankruptcy, payment default on a reference asset or assets, restructuring and repudiation or moratoria.
Off-balance sheet exposures mainly relate to commitments to lend and the amounts shown in the tables represent the amounts that could be drawn down by the counterparties. In some instances, limitations are imposed on a counterparty’s ability to draw down on a facility. These limitations are governed by the documentation, which differs from counterparty to counterparty. In the majority of cases, we are bound to fulfil commitments made to third parties.
Summary of exposures to eurozone countries
(Unaudited)
On-balance sheet exposures | Off-balance sheet exposures | Total gross exposures | Risk mitigation | Total net exposure | ||||||||||||||||||||||||
| US$bn | US$bn | US$bn | US$bn | US$bn | ||||||||||||||||||||||||
At 31 December 2012 | ||||||||||||||||||||||||||||
Spain | 15.3 | 3.2 | 18.5 | (6.4 | ) | 12.1 | ||||||||||||||||||||||
Ireland | 20.7 | 1.3 | 22.0 | (12.1 | ) | 9.9 | ||||||||||||||||||||||
Italy | 12.6 | 3.0 | 15.6 | (6.0 | ) | 9.6 | ||||||||||||||||||||||
Greece | 5.9 | 0.7 | 6.6 | (0.8 | ) | 5.8 | ||||||||||||||||||||||
Portugal | 1.1 | 0.3 | 1.4 | (0.4 | ) | 1.0 | ||||||||||||||||||||||
Cyprus | 0.3 | 0.1 | 0.4 | – | 0.4 | |||||||||||||||||||||||
France | 158.3 | 28.0 | 186.3 | (40.8 | ) | 145.5 | ||||||||||||||||||||||
Germany | 112.4 | 11.6 | 124.0 | (56.6 | ) | 67.4 | ||||||||||||||||||||||
The Netherlands | 39.7 | 4.1 | 43.8 | (14.4 | ) | 29.4 | ||||||||||||||||||||||
Others | 38.0 | 4.9 | 42.9 | (14.3 | ) | 28.6 | ||||||||||||||||||||||
| 404.3 | 57.2 | 461.5 | (151.8 | ) | 309.7 | |||||||||||||||||||||||
At 31 December 2011 | ||||||||||||||||||||||||||||
Spain | 15.7 | 2.0 | 17.7 | (5.4 | ) | 12.3 | ||||||||||||||||||||||
Ireland | 14.1 | 0.3 | 14.4 | (8.6 | ) | 5.8 | ||||||||||||||||||||||
Italy | 16.4 | 1.4 | 17.8 | (9.4 | ) | 8.4 | ||||||||||||||||||||||
Greece | 6.6 | 1.6 | 8.2 | (0.6 | ) | 7.6 | ||||||||||||||||||||||
Portugal | 1.7 | – | 1.7 | (0.6 | ) | 1.1 | ||||||||||||||||||||||
Cyprus | 0.2 | 0.2 | 0.4 | – | 0.4 | |||||||||||||||||||||||
France | 154.8 | 26.5 | 181.3 | (31.3 | ) | 150.0 | ||||||||||||||||||||||
Germany | 86.3 | 10.1 | 96.4 | (38.0 | ) | 58.4 | ||||||||||||||||||||||
The Netherlands | 70.1 | 1.8 | 71.9 | (6.2 | ) | 65.7 | ||||||||||||||||||||||
Others | 36.1 | 4.0 | 40.1 | (14.0 | ) | 26.1 | ||||||||||||||||||||||
| 402.0 | 47.9 | 449.9 | (114.1 | ) | 335.8 | |||||||||||||||||||||||
193
Table of Contents
HSBC HOLDINGS PLC
Report of the Directors: Operating and Financial Review(continued)
Exposures to peripheral eurozone countries
(Audited)
| At 31 December 2012 | At 31 December 2011 | |||||||||||||||||||||||||||||||||||||||||||||||||||||||||||
Sovereign and agencies | Banks | Other financial institutions and corporates | Personal | Total | Sovereign and agencies | Banks | Other financial institutions and | Personal | Total | |||||||||||||||||||||||||||||||||||||||||||||||||||
| US$bn | US$bn | US$bn | US$bn | US$bn | US$bn | US$bn | US$bn | US$bn | US$bn | |||||||||||||||||||||||||||||||||||||||||||||||||||
Cash and balances at central banks | – | – | – | – | – | 0.1 | – | – | – | 0.1 | ||||||||||||||||||||||||||||||||||||||||||||||||||
Loans and advances | – | 0.1 | 5.0 | – | 5.1 | – | 0.2 | 5.6 | – | 5.8 | ||||||||||||||||||||||||||||||||||||||||||||||||||
– gross | – | 0.1 | 5.1 | – | 5.2 | – | 0.2 | 5.7 | – | 5.9 | ||||||||||||||||||||||||||||||||||||||||||||||||||
– impairment allowances | – | – | (0.1 | ) | – | (0.1 | ) | – | – | (0.1 | ) | – | (0.1 | ) | ||||||||||||||||||||||||||||||||||||||||||||||
Financial investments available for sale37 | 0.4 | 0.3 | 0.1 | – | 0.8 | 0.9 | 0.4 | 0.1 | – | 1.4 | ||||||||||||||||||||||||||||||||||||||||||||||||||
– amortised cost | 0.2 | 0.4 | 0.1 | – | 0.7 | 0.9 | 0.4 | 0.1 | – | 1.4 | ||||||||||||||||||||||||||||||||||||||||||||||||||
Trading assets | 1.4 | 1.9 | 0.1 | – | 3.4 | 1.8 | 2.4 | 0.2 | – | 4.4 | ||||||||||||||||||||||||||||||||||||||||||||||||||
Derivative assets | 0.1 | 4.8 | 1.1 | – | 6.0 | 0.2 | 3.6 | 0.2 | – | 4.0 | ||||||||||||||||||||||||||||||||||||||||||||||||||
Gross balance sheet exposure before risk mitigation | 1.9 | 7.1 | 6.3 | – | 15.3 | 3.0 | 6.6 | 6.1 | – | 15.7 | ||||||||||||||||||||||||||||||||||||||||||||||||||
Risk mitigation | (0.9 | ) | (4.6 | ) | (0.9 | ) | – | (6.4 | ) | (1.8 | ) | (3.5 | ) | (0.1 | ) | – | (5.4 | ) | ||||||||||||||||||||||||||||||||||||||||||
– short trading positions | (0.9 | ) | (0.1 | ) | (0.1 | ) | – | (1.1 | ) | (1.7 | ) | (0.4 | ) | (0.1 | ) | – | (2.2 | ) | ||||||||||||||||||||||||||||||||||||||||||
– collateral and derivative liabilities | – | (4.5 | ) | (0.8 | ) | – | (5.3 | ) | (0.1 | ) | (3.1 | ) | – | – | (3.2 | ) | ||||||||||||||||||||||||||||||||||||||||||||
| ||||||||||||||||||||||||||||||||||||||||||||||||||||||||||||
Net on-balance sheet exposure | 1.0 | 2.5 | 5.4 | – | 8.9 | 1.2 | 3.1 | 6.0 | – | 10.3 | ||||||||||||||||||||||||||||||||||||||||||||||||||
Off-balance sheet exposures | – | 0.3 | 2.9 | – | 3.2 | 1.0 | 0.4 | 0.6 | – | 2.0 | ||||||||||||||||||||||||||||||||||||||||||||||||||
– commitments | – | – | 2.3 | – | 2.3 | 1.0 | – | 0.1 | – | 1.1 | ||||||||||||||||||||||||||||||||||||||||||||||||||
– guarantees and other | – | 0.3 | 0.6 | – | 0.9 | – | 0.4 | 0.5 | – | 0.9 | ||||||||||||||||||||||||||||||||||||||||||||||||||
| ||||||||||||||||||||||||||||||||||||||||||||||||||||||||||||
Total net exposure | 1.0 | 2.8 | 8.3 | – | 12.1 | 2.2 | 3.5 | 6.6 | – | 12.3 | ||||||||||||||||||||||||||||||||||||||||||||||||||
Of which: | ||||||||||||||||||||||||||||||||||||||||||||||||||||||||||||
– net trading assets representing cash collateral posted | – | 1.5 | – | – | 1.5 | 0.1 | 1.3 | – | – | 1.4 | ||||||||||||||||||||||||||||||||||||||||||||||||||
– on-balance sheet exposures held to meet DPF insurance liabilities | 0.2 | 0.3 | 0.1 | – | 0.6 | 0.4 | 0.4 | 0.1 | – | 0.9 | ||||||||||||||||||||||||||||||||||||||||||||||||||
Total credit default swaps | ||||||||||||||||||||||||||||||||||||||||||||||||||||||||||||
– CDS bought positions | 0.4 | – | – | – | 0.4 | 0.4 | 0.1 | 0.1 | – | 0.6 | ||||||||||||||||||||||||||||||||||||||||||||||||||
– CDS sold positions | (0.3 | ) | – | – | – | (0.3 | ) | (0.4 | ) | (0.1 | ) | (0.1 | ) | – | (0.6 | ) | ||||||||||||||||||||||||||||||||||||||||||||
– CDS bought notionals | 6.8 | 2.8 | 1.2 | – | 10.8 | 3.3 | 1.5 | 1.4 | – | 6.2 | ||||||||||||||||||||||||||||||||||||||||||||||||||
– CDS sold notionals | 6.4 | 2.7 | 1.2 | – | 10.3 | 3.5 | 1.4 | 1.3 | – | 6.2 | ||||||||||||||||||||||||||||||||||||||||||||||||||
For footnote, see page 249.
For commentary, see page 199.
194
Table of Contents
HSBC HOLDINGS PLC
Report of the Directors: Operating and Financial Review(continued)
(Audited)
| At 31 December 2012 | At 31 December 2011 | |||||||||||||||||||||||||||||||||||||||||||||||||||||||||||
Sovereign and agencies | Banks | Other financial institutions and corporates | Personal | Total | Sovereign and agencies | Banks | Other financial institutions and | Personal | Total | |||||||||||||||||||||||||||||||||||||||||||||||||||
| US$bn | US$bn | US$bn | US$bn | US$bn | US$bn | US$bn | US$bn | US$bn | US$bn | |||||||||||||||||||||||||||||||||||||||||||||||||||
Loans and advances | – | 0.1 | 2.5 | 0.1 | 2.7 | – | 0.1 | 2.1 | 0.1 | 2.3 | ||||||||||||||||||||||||||||||||||||||||||||||||||
– gross | – | 0.1 | 2.5 | 0.2 | 2.8 | – | 0.1 | 2.1 | 0.2 | 2.4 | ||||||||||||||||||||||||||||||||||||||||||||||||||
– impairment allowances | – | – | – | (0.1 | ) | (0.1 | ) | – | – | – | (0.1 | ) | (0.1 | ) | ||||||||||||||||||||||||||||||||||||||||||||||
Financial investments held to maturity | – | 0.2 | – | – | 0.2 | – | 0.2 | – | – | 0.2 | ||||||||||||||||||||||||||||||||||||||||||||||||||
– fair value | – | 0.2 | – | – | 0.2 | – | 0.2 | – | – | 0.2 | ||||||||||||||||||||||||||||||||||||||||||||||||||
Financial investments available for sale | 0.1 | – | 2.3 | – | 2.4 | 0.1 | 0.4 | 0.3 | – | 0.8 | ||||||||||||||||||||||||||||||||||||||||||||||||||
– amortised cost | 0.1 | – | 2.5 | – | 2.6 | 0.1 | 0.4 | 0.4 | – | 0.9 | ||||||||||||||||||||||||||||||||||||||||||||||||||
– available-for-sale reserve | – | – | (0.2 | ) | – | (0.2 | ) | – | – | (0.1 | ) | – | (0.1 | ) | ||||||||||||||||||||||||||||||||||||||||||||||
Trading assets | 0.3 | 1.5 | 0.8 | – | 2.6 | 0.3 | 0.9 | 0.3 | – | 1.5 | ||||||||||||||||||||||||||||||||||||||||||||||||||
Derivative assets | 0.7 | 11.1 | 1.0 | – | 12.8 | 0.3 | 8.3 | 0.7 | – | 9.3 | ||||||||||||||||||||||||||||||||||||||||||||||||||
Gross balance sheet exposure before risk mitigation | 1.1 | 12.9 | 6.6 | 0.1 | 20.7 | 0.7 | 9.9 | 3.4 | 0.1 | 14.1 | ||||||||||||||||||||||||||||||||||||||||||||||||||
Risk mitigation | (0.7 | ) | (11.1 | ) | (0.3 | ) | – | (12.1 | ) | (0.4 | ) | (8.0 | ) | (0.2 | ) | – | (8.6 | ) | ||||||||||||||||||||||||||||||||||||||||||
– short trading positions | (0.1 | ) | – | – | – | (0.1 | ) | (0.1 | ) | – | – | – | (0.1 | ) | ||||||||||||||||||||||||||||||||||||||||||||||
– collateral and derivative liabilities | (0.6 | ) | (11.1 | ) | (0.3 | ) | – | (12.0 | ) | (0.3 | ) | (8.0 | ) | (0.2 | ) | – | (8.5 | ) | ||||||||||||||||||||||||||||||||||||||||||
| ||||||||||||||||||||||||||||||||||||||||||||||||||||||||||||
Net on-balance sheet exposure | 0.4 | 1.8 | 6.3 | 0.1 | 8.6 | 0.3 | 1.9 | 3.2 | 0.1 | 5.5 | ||||||||||||||||||||||||||||||||||||||||||||||||||
Off-balance sheet exposures | – | – | 1.3 | – | 1.3 | – | – | 0.3 | – | 0.3 | ||||||||||||||||||||||||||||||||||||||||||||||||||
– commitments | – | – | 1.1 | – | 1.1 | – | – | 0.1 | – | 0.1 | ||||||||||||||||||||||||||||||||||||||||||||||||||
– guarantees and others | – | – | 0.2 | – | 0.2 | – | – | 0.2 | – | 0.2 | ||||||||||||||||||||||||||||||||||||||||||||||||||
| ||||||||||||||||||||||||||||||||||||||||||||||||||||||||||||
Total net exposure | 0.4 | 1.8 | 7.6 | 0.1 | 9.9 | 0.3 | 1.9 | 3.5 | 0.1 | 5.8 | ||||||||||||||||||||||||||||||||||||||||||||||||||
Of which: | ||||||||||||||||||||||||||||||||||||||||||||||||||||||||||||
– net trading assets representing cash collateral posted | 0.1 | �� | 1.5 | – | – | 1.6 | 0.1 | 0.6 | – | – | 0.7 | |||||||||||||||||||||||||||||||||||||||||||||||||
– on-balance sheet exposures held to meet DPF insurance liabilities | 0.1 | 0.2 | – | – | 0.3 | 0.1 | 0.2 | – | – | 0.3 | ||||||||||||||||||||||||||||||||||||||||||||||||||
Total credit default swaps | ||||||||||||||||||||||||||||||||||||||||||||||||||||||||||||
– CDS bought positions | – | – | – | – | – | 0.2 | – | – | – | 0.2 | ||||||||||||||||||||||||||||||||||||||||||||||||||
– CDS sold positions | – | – | – | – | – | (0.2 | ) | – | – | – | (0.2 | ) | ||||||||||||||||||||||||||||||||||||||||||||||||
– CDS bought notionals | 1.5 | – | 0.5 | – | 2.0 | 0.9 | – | 0.3 | – | 1.2 | ||||||||||||||||||||||||||||||||||||||||||||||||||
– CDS sold notionals | 1.5 | – | 0.2 | – | 1.7 | 0.9 | – | 0.3 | – | 1.2 | ||||||||||||||||||||||||||||||||||||||||||||||||||
For commentary, see page 199.
195
Table of Contents
HSBC HOLDINGS PLC
Report of the Directors: Operating and Financial Review(continued)
(Audited)
| At 31 December 2012 | At 31 December 2011 | |||||||||||||||||||||||||||||||||||||||||||||||||||||||||||
Sovereign and agencies | Banks | Other financial institutions and corporates | Personal | Total | Sovereign and agencies | Banks | Other financial institutions and | Personal | Total | |||||||||||||||||||||||||||||||||||||||||||||||||||
| US$bn | US$bn | US$bn | US$bn | US$bn | US$bn | US$bn | US$bn | US$bn | US$bn | |||||||||||||||||||||||||||||||||||||||||||||||||||
Loans and advances | – | 0.1 | 1.2 | 0.1 | 1.4 | – | 0.5 | 1.4 | 0.1 | 2.0 | ||||||||||||||||||||||||||||||||||||||||||||||||||
– gross | – | 0.1 | 1.2 | 0.1 | 1.4 | – | 0.5 | 1.4 | 0.1 | 2.0 | ||||||||||||||||||||||||||||||||||||||||||||||||||
Financial investments held to maturity | 0.1 | 0.2 | – | – | 0.3 | 0.1 | 0.2 | – | – | 0.3 | ||||||||||||||||||||||||||||||||||||||||||||||||||
– fair value | 0.1 | 0.2 | – | – | 0.3 | 0.1 | 0.2 | – | – | 0.3 | ||||||||||||||||||||||||||||||||||||||||||||||||||
Financial investments available for sale37 | 0.8 | 0.3 | 0.3 | – | 1.4 | 0.8 | 0.3 | 0.3 | – | 1.4 | ||||||||||||||||||||||||||||||||||||||||||||||||||
– amortised cost | 0.8 | 0.3 | 0.3 | – | 1.4 | 0.8 | 0.3 | 0.2 | – | 1.3 | ||||||||||||||||||||||||||||||||||||||||||||||||||
Financial assets designated at fair value | – | – | 0.1 | – | 0.1 | – | – | – | – | – | ||||||||||||||||||||||||||||||||||||||||||||||||||
Trading assets | 5.2 | 0.7 | 0.1 | – | 6.0 | 8.3 | 0.6 | 0.2 | – | 9.1 | ||||||||||||||||||||||||||||||||||||||||||||||||||
Derivative assets | 0.5 | 1.7 | 1.2 | – | 3.4 | 0.7 | 1.9 | 1.0 | – | 3.6 | ||||||||||||||||||||||||||||||||||||||||||||||||||
Gross balance sheet exposure before risk mitigation | 6.6 | 3.0 | 2.9 | 0.1 | 12.6 | 9.9 | 3.5 | 2.9 | 0.1 | 16.4 | ||||||||||||||||||||||||||||||||||||||||||||||||||
Risk mitigation | (3.9 | ) | (1.6 | ) | (0.5 | ) | – | (6.0 | ) | (7.6 | ) | (1.5 | ) | (0.3 | ) | – | (9.4 | ) | ||||||||||||||||||||||||||||||||||||||||||
– short trading positions | (3.9 | ) | – | – | – | (3.9 | ) | (6.9 | ) | – | – | – | (6.9 | ) | ||||||||||||||||||||||||||||||||||||||||||||||
– collateral and derivative liabilities | – | (1.6 | ) | (0.5 | ) | – | (2.1 | ) | (0.7 | ) | (1.5 | ) | (0.3 | ) | – | (2.5 | ) | |||||||||||||||||||||||||||||||||||||||||||
| ||||||||||||||||||||||||||||||||||||||||||||||||||||||||||||
Net on-balance sheet exposure | 2.7 | 1.4 | 2.4 | 0.1 | 6.6 | 2.3 | 2.0 | 2.6 | 0.1 | 7.0 | ||||||||||||||||||||||||||||||||||||||||||||||||||
Off-balance sheet exposures | – | 0.2 | 2.8 | – | 3.0 | – | 0.1 | 1.3 | – | 1.4 | ||||||||||||||||||||||||||||||||||||||||||||||||||
– commitments | – | – | 1.8 | – | 1.8 | – | – | 0.9 | – | 0.9 | ||||||||||||||||||||||||||||||||||||||||||||||||||
– guarantees and others | – | 0.2 | 1.0 | – | 1.2 | – | 0.1 | 0.4 | – | 0.5 | ||||||||||||||||||||||||||||||||||||||||||||||||||
| ||||||||||||||||||||||||||||||||||||||||||||||||||||||||||||
Total net exposure | 2.7 | 1.6 | 5.2 | 0.1 | 9.6 | 2.3 | 2.1 | 3.9 | 0.1 | 8.4 | ||||||||||||||||||||||||||||||||||||||||||||||||||
Of which: | ||||||||||||||||||||||||||||||||||||||||||||||||||||||||||||
– net trading assets representing cash collateral posted | – | 0.6 | – | – | 0.6 | – | 0.5 | – | – | 0.5 | ||||||||||||||||||||||||||||||||||||||||||||||||||
– on-balance sheet exposures held to meet DPF insurance liabilities | 0.3 | 0.4 | 0.2 | – | 0.9 | 0.3 | 0.4 | 0.2 | – | 0.9 | ||||||||||||||||||||||||||||||||||||||||||||||||||
Total credit default swaps | ||||||||||||||||||||||||||||||||||||||||||||||||||||||||||||
– CDS bought positions | 0.6 | 0.1 | 0.1 | – | 0.8 | 0.6 | 0.5 | 0.3 | – | 1.4 | ||||||||||||||||||||||||||||||||||||||||||||||||||
– CDS sold positions | (0.5 | ) | (0.1 | ) | – | – | (0.6 | ) | (0.6 | ) | (0.5 | ) | (0.2 | ) | – | (1.3 | ) | |||||||||||||||||||||||||||||||||||||||||||
– CDS bought notionals | 9.9 | 6.1 | 3.6 | – | 19.6 | 3.9 | 3.5 | 3.7 | – | 11.1 | ||||||||||||||||||||||||||||||||||||||||||||||||||
– CDS sold notionals | 10.3 | 6.1 | 3.6 | – | 20.0 | 3.8 | 3.5 | 3.5 | – | 10.8 | ||||||||||||||||||||||||||||||||||||||||||||||||||
For footnote, see page 249.
For commentary, see page 199.
196
Table of Contents
HSBC HOLDINGS PLC
Report of the Directors: Operating and Financial Review(continued)
(Audited)
| At 31 December 2012 | At 31 December 2011 | |||||||||||||||||||||||||||||||||||||||||||||||||||||||||||
Sovereign and agencies | Banks | Other financial institutions and corporates | Personal | Total | Sovereign and agencies | Banks | Other financial institutions and | Personal | Total | |||||||||||||||||||||||||||||||||||||||||||||||||||
| US$bn | US$bn | US$bn | US$bn | US$bn | US$bn | US$bn | US$bn | US$bn | US$bn | |||||||||||||||||||||||||||||||||||||||||||||||||||
Loans and advances | 0.1 | – | 3.4 | 1.0 | 4.5 | – | 0.1 | 3.8 | 1.0 | 4.9 | ||||||||||||||||||||||||||||||||||||||||||||||||||
– gross | 0.1 | – | 3.4 | 1.0 | 4.5 | – | 0.1 | 4.0 | 1.0 | 5.1 | ||||||||||||||||||||||||||||||||||||||||||||||||||
– impairment allowances | – | – | – | – | – | – | – | (0.2 | ) | – | (0.2 | ) | ||||||||||||||||||||||||||||||||||||||||||||||||
| ||||||||||||||||||||||||||||||||||||||||||||||||||||||||||||
Financial investments available for sale | – | – | – | – | – | 0.1 | – | – | – | 0.1 | ||||||||||||||||||||||||||||||||||||||||||||||||||
– cumulative impairment | – | – | – | – | – | 0.2 | – | – | – | 0.2 | ||||||||||||||||||||||||||||||||||||||||||||||||||
Trading assets | – | 0.6 | – | – | 0.6 | 0.4 | 0.4 | – | – | 0.8 | ||||||||||||||||||||||||||||||||||||||||||||||||||
Derivative assets | – | 0.8 | – | – | 0.8 | – | 0.7 | 0.1 | – | 0.8 | ||||||||||||||||||||||||||||||||||||||||||||||||||
Gross balance sheet exposure before risk mitigation | 0.1 | 1.4 | 3.4 | 1.0 | 5.9 | 0.5 | 1.2 | 3.9 | 1.0 | 6.6 | ||||||||||||||||||||||||||||||||||||||||||||||||||
Risk mitigation | – | (0.8 | ) | – | – | (0.8 | ) | (0.1 | ) | (0.5 | ) | – | – | (0.6 | ) | |||||||||||||||||||||||||||||||||||||||||||||
– short trading positions | – | – | – | – | – | (0.1 | ) | – | – | – | (0.1 | ) | ||||||||||||||||||||||||||||||||||||||||||||||||
– collateral and derivative liabilities | – | (0.8 | ) | – | – | (0.8 | ) | – | (0.5 | ) | – | – | (0.5 | ) | ||||||||||||||||||||||||||||||||||||||||||||||
| ||||||||||||||||||||||||||||||||||||||||||||||||||||||||||||
Net on-balance sheet exposure | 0.1 | 0.6 | 3.4 | 1.0 | 5.1 | 0.4 | 0.7 | 3.9 | 1.0 | 6.0 | ||||||||||||||||||||||||||||||||||||||||||||||||||
Off-balance sheet exposures | – | – | 0.7 | – | 0.7 | 0.2 | 1.4 | – | 1.6 | |||||||||||||||||||||||||||||||||||||||||||||||||||
– commitments | – | – | 0.2 | – | 0.2 | – | – | 0.8 | – | 0.8 | ||||||||||||||||||||||||||||||||||||||||||||||||||
– guarantees and others | – | – | 0.5 | – | 0.5 | – | 0.2 | 0.6 | – | 0.8 | ||||||||||||||||||||||||||||||||||||||||||||||||||
| ||||||||||||||||||||||||||||||||||||||||||||||||||||||||||||
Total net exposure | 0.1 | 0.6 | 4.1 | 1.0 | 5.8 | 0.4 | 0.9 | 5.3 | 1.0 | 7.6 | ||||||||||||||||||||||||||||||||||||||||||||||||||
Total credit default swaps | ||||||||||||||||||||||||||||||||||||||||||||||||||||||||||||
– CDS bought positions | – | – | – | – | – | 1.2 | – | 0.1 | – | 1.3 | ||||||||||||||||||||||||||||||||||||||||||||||||||
– CDS sold positions | – | – | – | – | – | (0.7 | ) | – | (0.1 | ) | – | (0.8 | ) | |||||||||||||||||||||||||||||||||||||||||||||||
– CDS bought notionals | – | – | 0.4 | – | 0.4 | 1.8 | – | 0.2 | – | 2.0 | ||||||||||||||||||||||||||||||||||||||||||||||||||
– CDS sold notionals | – | – | 0.4 | – | 0.4 | 1.0 | – | 0.3 | – | 1.3 | ||||||||||||||||||||||||||||||||||||||||||||||||||
For commentary, see page 199.
197
Table of Contents
HSBC HOLDINGS PLC
Report of the Directors: Operating and Financial Review(continued)
(Audited)
| At 31 December 2012 | At 31 December 2011 | |||||||||||||||||||||||||||||||||||||||||||||||||||||||||||
Sovereign and agencies | Banks | Other financial institutions and corporates | Personal | Total | Sovereign and agencies | Banks | Other financial institutions and | Personal | Total | |||||||||||||||||||||||||||||||||||||||||||||||||||
| US$bn | US$bn | US$bn | US$bn | US$bn | US$bn | US$bn | US$bn | US$bn | US$bn | |||||||||||||||||||||||||||||||||||||||||||||||||||
Loans and advances | – | 0.3 | 0.2 | – | 0.5 | – | 0.3 | – | – | 0.3 | ||||||||||||||||||||||||||||||||||||||||||||||||||
– gross | – | 0.3 | 0.2 | – | 0.5 | – | 0.3 | – | – | 0.3 | ||||||||||||||||||||||||||||||||||||||||||||||||||
Financial investments available for sale | 0.1 | – | – | – | 0.1 | 0.1 | – | 0.1 | – | 0.2 | ||||||||||||||||||||||||||||||||||||||||||||||||||
– cumulative impairment | – | – | – | – | – | – | – | – | – | – | ||||||||||||||||||||||||||||||||||||||||||||||||||
– amortised cost | 0.1 | – | – | – | 0.1 | 0.1 | – | 0.1 | – | 0.2 | ||||||||||||||||||||||||||||||||||||||||||||||||||
– available-for-sale reserve | – | – | – | – | – | – | – | – | – | – | ||||||||||||||||||||||||||||||||||||||||||||||||||
Trading assets | 0.3 | – | – | – | 0.3 | 0.6 | 0.1 | – | – | 0.7 | ||||||||||||||||||||||||||||||||||||||||||||||||||
Derivative assets | – | 0.2 | – | – | 0.2 | 0.3 | 0.2 | – | – | 0.5 | ||||||||||||||||||||||||||||||||||||||||||||||||||
Gross balance sheet exposure before risk mitigation | 0.4 | 0.5 | 0.2 | – | 1.1 | 1.0 | 0.6 | 0.1 | – | 1.7 | ||||||||||||||||||||||||||||||||||||||||||||||||||
Risk mitigation | (0.2 | ) | (0.2 | ) | – | – | (0.4 | ) | (0.5 | ) | (0.1 | ) | – | – | (0.6 | ) | ||||||||||||||||||||||||||||||||||||||||||||
– short trading positions | (0.2 | ) | – | – | – | (0.2 | ) | (0.2 | ) | – | – | – | (0.2 | ) | ||||||||||||||||||||||||||||||||||||||||||||||
– collateral and derivative liabilities | – | (0.2 | ) | – | – | (0.2 | ) | (0.3 | ) | (0.1 | ) | – | – | (0.4 | ) | |||||||||||||||||||||||||||||||||||||||||||||
| ||||||||||||||||||||||||||||||||||||||||||||||||||||||||||||
Net on-balance sheet exposure | 0.2 | 0.3 | 0.2 | – | 0.7 | 0.5 | 0.5 | 0.1 | – | 1.1 | ||||||||||||||||||||||||||||||||||||||||||||||||||
Off-balance sheet exposures | – | 0.1 | 0.2 | – | 0.3 | – | – | – | – | – | ||||||||||||||||||||||||||||||||||||||||||||||||||
– commitments | – | – | 0.2 | – | 0.2 | – | – | – | – | – | ||||||||||||||||||||||||||||||||||||||||||||||||||
– guarantees and others | – | 0.1 | – | – | 0.1 | – | – | – | – | – | ||||||||||||||||||||||||||||||||||||||||||||||||||
| ||||||||||||||||||||||||||||||||||||||||||||||||||||||||||||
Total net exposure | 0.2 | 0.4 | 0.4 | – | 1.0 | 0.5 | 0.5 | 0.1 | – | 1.1 | ||||||||||||||||||||||||||||||||||||||||||||||||||
Of which: | ||||||||||||||||||||||||||||||||||||||||||||||||||||||||||||
– net trading assets representing cash collateral posted | – | – | – | – | – | – | 0.1 | – | – | 0.1 | ||||||||||||||||||||||||||||||||||||||||||||||||||
– on-balance sheet exposures held to meet DPF insurance liabilities | 0.1 | – | – | – | 0.1 | 0.1 | – | 0.1 | – | 0.2 | ||||||||||||||||||||||||||||||||||||||||||||||||||
Total credit default swaps | ||||||||||||||||||||||||||||||||||||||||||||||||||||||||||||
– CDS bought positions | 0.1 | – | – | – | 0.1 | 0.4 | 0.1 | 0.1 | – | 0.6 | ||||||||||||||||||||||||||||||||||||||||||||||||||
– CDS sold positions | (0.1 | ) | – | – | – | (0.1 | ) | (0.3 | ) | (0.1 | ) | (0.1 | ) | – | (0.5 | ) | ||||||||||||||||||||||||||||||||||||||||||||
– CDS bought notionals | 1.6 | 0.9 | 0.8 | – | 3.3 | 1.2 | 0.6 | 0.6 | – | 2.4 | ||||||||||||||||||||||||||||||||||||||||||||||||||
– CDS sold notionals | 1.5 | 0.9 | 0.8 | – | 3.2 | 1.2 | 0.5 | 0.7 | – | 2.4 | ||||||||||||||||||||||||||||||||||||||||||||||||||
For commentary, see page 199.
198
Table of Contents
HSBC HOLDINGS PLC
Report of the Directors: Operating and Financial Review(continued)
Spain
At 31 December 2012, our total net exposure to Spain was US$12.1bn, US$0.2bn lower than at the end of 2011.
Our total net exposure to Spanish sovereign and agencies was US$1.0bn, US$1.2bn lower than at the end of 2011. The reduction was primarily due to lower off-balance sheet positions.
Our total net exposure to Spanish banks was US$2.8bn, US$0.7bn lower than at the end of 2011. The reduced exposure was due to increased risk mitigation. Our total net exposure to Spanish other financial institutions and corporates was US$8.3bn, an increase of US$1.7bn primarily due to higher off-balance sheet commitments. Our exposure to Spanish other financial institutions and corporates mainly comprised large multinational companies and other financial institutions with significant operations outside Spain, which mitigated the risk. Exposure to the commercial real estate sector in Spain remained insignificant.
Ireland
At 31 December 2012, our total net exposure to Ireland was US$9.9bn, US$4.1bn higher than at the end of 2011. This increase was in respect of exposures to other financial institutions and corporates.
Our total net exposure to Irish other financial institutions and corporates was US$7.6bn, US$4.1bn higher than at the end of 2011. The increase was primarily in financial investments available for sale for which the underlying risk is not predominantly Irish. A significant portion of our exposure related to foreign-owned entities incorporated in Ireland.
Italy
At 31 December 2012, our total net exposure to Italy was US$9.6bn, US$1.2bn higher than at the end of 2011.
Our total net exposure to Italian sovereign agencies was US$2.7bn, US$0.4bn higher than at the end of 2011. This was due to a decrease in risk mitigation.
Our total net exposure to Italian banks was US$1.6bn, US$0.5bn lower than at the end of 2011. The reduced exposure was primarily due to lower amounts of loans and advances.
Our total net exposure to other financial institutions and corporates at 31 December 2012 was US$5.2bn, an increase of US$1.3bn. Our exposure to
Italian other financial institutions and corporates mainly comprised large multinational companies and other financial institutions with significant operations outside Italy, which mitigated the risk.
Greece
At 31 December 2012, our total net exposure to Greece was US$5.8bn, US$1.8bn lower than at the end of 2011. Although there was a reduction in exposure levels to all Greek counterparties in the first half of 2012, the majority of the reduction was in respect of exposures to other financial institutions and corporates.
Our total net exposure to Greek sovereign and agencies was US$0.1bn, US$0.3bn lower than at the end of 2011. Our Greek sovereign exposure decreased as a result of the debt restructuring in March 2012 and the associated settlement of CDS contracts.
Our total net exposure to Greek banks was US$0.6bn, US$0.3bn lower than at the end of 2011. The decrease was primarily due to lower off-balance sheet positions.
Our total net exposure to Greek other financial institutions and corporates was US$4.1bn, US$1.2bn lower than at the end of 2011. The reduction was primarily due to lower level of off-balance sheet positions. At 31 December 2012, our exposure to Greek shipping companies amounted to US$2.2bn. We believe the industry is less sensitive to the Greek economy as it is mainly dependent on international trade.
Portugal
At 31 December 2012, our total net exposure to Portugal was US$1.0bn, similar to the end of 2011.
Our total net exposure to Portuguese other financial institutions and corporates was US$0.4bn, US$0.3bn higher than at the end of 2011. The increase was primarily due to higher off-balance sheet commitments, which were in support of internationally active corporates with significant operations outside Portugal, which reduced the risk.
Cyprus
Our gross on-balance sheet exposure to Cyprus of US$0.3bn (2011: US$0.2bn) consisted primarily of loans and advances to other financial institutions and corporates of US$0.3bn (2011: US$0.2bn). We have also provided off-balance sheet commitments and guarantees to other financial institutions and corporates of US$0.1bn (2011: US$0.1bn).
199
Table of Contents
HSBC HOLDINGS PLC
Report of the Directors: Operating and Financial Review(continued)
Exposures to other eurozone countries
Summary of exposures to other eurozone countries
(Unaudited)
Sovereign and agencies US$bn | Banks US$bn | Other financial institutions and corporates US$bn | Personal US$bn | Total US$bn | ||||||||||||||||||||||||
At 31 December 2012 | ||||||||||||||||||||||||||||
France | ||||||||||||||||||||||||||||
On-balance sheet exposure | 44.1 | 55.0 | 43.7 | 15.5 | 158.3 | |||||||||||||||||||||||
Off-balance sheet exposure | 0.2 | 1.7 | 25.3 | 0.8 | 28.0 | |||||||||||||||||||||||
Total gross exposure | 44.3 | 56.7 | 69.0 | 16.3 | 186.3 | |||||||||||||||||||||||
Risk mitigation | (11.3 | ) | (26.2 | ) | (3.3 | ) | – | (40.8 | ) | |||||||||||||||||||
Total net exposure | 33.0 | 30.5 | 65.7 | 16.3 | 145.5 | |||||||||||||||||||||||
Germany | ||||||||||||||||||||||||||||
On-balance sheet exposure | 40.8 | 56.5 | 14.8 | 0.3 | 112.4 | |||||||||||||||||||||||
Off-balance sheet exposure | – | 0.2 | 11.1 | 0.3 | 11.6 | |||||||||||||||||||||||
Total gross exposure | 40.8 | 56.7 | 25.9 | 0.6 | 124.0 | |||||||||||||||||||||||
Risk mitigation | (13.4 | ) | (42.4 | ) | (0.8 | ) | – | (56.6 | ) | |||||||||||||||||||
Total net exposure | 27.4 | 14.3 | 25.1 | 0.6 | 67.4 | |||||||||||||||||||||||
The Netherlands | ||||||||||||||||||||||||||||
On-balance sheet exposure | 14.4 | 10.4 | 14.8 | 0.1 | 39.7 | |||||||||||||||||||||||
Off-balance sheet exposure | – | 0.1 | 4.0 | – | 4.1 | |||||||||||||||||||||||
Total gross exposure | 14.4 | 10.5 | 18.8 | 0.1 | 43.8 | |||||||||||||||||||||||
Risk mitigation | (4.4 | ) | (5.2 | ) | (4.8 | ) | – | (14.4 | ) | |||||||||||||||||||
Total net exposure | 10.0 | 5.3 | 14.0 | 0.1 | 29.4 | |||||||||||||||||||||||
Others | ||||||||||||||||||||||||||||
On-balance sheet exposure | 13.0 | 14.0 | 8.4 | 2.6 | 38.0 | |||||||||||||||||||||||
Off-balance sheet exposure | – | 0.3 | 4.0 | 0.6 | 4.9 | |||||||||||||||||||||||
Total gross exposure | 13.0 | 14.3 | 12.4 | 3.2 | 42.9 | |||||||||||||||||||||||
Risk mitigation | (3.2 | ) | (10.7 | ) | (0.4 | ) | – | (14.3 | ) | |||||||||||||||||||
Total net exposure | 9.8 | 3.6 | 12.0 | 3.2 | 28.6 | |||||||||||||||||||||||
At 31 December 2011 | ||||||||||||||||||||||||||||
France | ||||||||||||||||||||||||||||
On-balance sheet exposure | 36.7 | 67.0 | 37.1 | 14.0 | 154.8 | |||||||||||||||||||||||
Off-balance sheet exposure | 1.9 | 1.8 | 21.7 | 1.1 | 26.5 | |||||||||||||||||||||||
Total gross exposure | 38.6 | 68.8 | 58.8 | 15.1 | 181.3 | |||||||||||||||||||||||
Risk mitigation | (9.5 | ) | (19.9 | ) | (1.7 | ) | (0.2 | ) | (31.3 | ) | ||||||||||||||||||
Total net exposure | 29.1 | 48.9 | 57.1 | 14.9 | 150.0 | |||||||||||||||||||||||
Germany | ||||||||||||||||||||||||||||
On-balance sheet exposure | 31.0 | 47.6 | 7.4 | 0.3 | 86.3 | |||||||||||||||||||||||
Off-balance sheet exposure | – | 1.5 | 8.2 | 0.4 | 10.1 | |||||||||||||||||||||||
Total gross exposure | 31.0 | 49.1 | 15.6 | 0.7 | 96.4 | |||||||||||||||||||||||
Risk mitigation | (11.0 | ) | (26.4 | ) | (0.6 | ) | – | (38.0 | ) | |||||||||||||||||||
Total net exposure | 20.0 | 22.7 | 15.0 | 0.7 | 58.4 | |||||||||||||||||||||||
The Netherlands | ||||||||||||||||||||||||||||
On-balance sheet exposure | 43.3 | 16.3 | 10.4 | 0.1 | 70.1 | |||||||||||||||||||||||
Off-balance sheet exposure | – | 0.2 | 1.6 | – | 1.8 | |||||||||||||||||||||||
Total gross exposure | 43.3 | 16.5 | 12.0 | 0.1 | 71.9 | |||||||||||||||||||||||
Risk mitigation | (3.3 | ) | (1.3 | ) | (1.6 | ) | – | (6.2 | ) | |||||||||||||||||||
Total net exposure | 40.0 | 15.2 | 10.4 | 0.1 | 65.7 | |||||||||||||||||||||||
Others | ||||||||||||||||||||||||||||
On-balance sheet exposure | 10.3 | 14.3 | 9.2 | 2.3 | 36.1 | |||||||||||||||||||||||
Off-balance sheet exposure | – | 0.3 | 2.9 | 0.8 | 4.0 | |||||||||||||||||||||||
Total gross exposure | 10.3 | 14.6 | �� | 12.1 | 3.1 | 40.1 | ||||||||||||||||||||||
Risk mitigation | (3.0 | ) | (10.7 | ) | (0.3 | ) | – | (14.0 | ) | |||||||||||||||||||
Total net exposure | 7.3 | 3.9 | 11.8 | 3.1 | 26.1 | |||||||||||||||||||||||
200
Table of Contents
HSBC HOLDINGS PLC
Report of the Directors: Operating and Financial Review(continued)
At 31 December 2012, our net on-balance sheet exposure to France, Germany and the Netherlands was US$199bn, US$37bn lower than at the end of 2011.
Our net on-balance sheet exposure to the sovereign and agency debt of France, Germany and the Netherlands was US$70bn, US$17bn lower than at the end of 2011. Our exposure to France and Germany was commensurate with the size of our operations in these countries. In 2012, cash balances held with the Dutch Central Bank were reduced and redirected to the French Central Bank to align more closely with our underlying operations. The cash placements continued to be put into the euro clearing system managed by the ECB.
At 31 December 2012, our net on-balance sheet exposure to the bank debt of France, Germany, and the Netherlands was US$48bn, US$35bn lower than at the end of 2011. The decrease reflected our ongoing efforts to reduce exposure to counterparties domiciled in these countries with exposures to sovereigns and/or banks in peripheral eurozone countries of sufficient size to threaten the counterparties’ on-going viability in the event of an unfavourable conclusion to the current crisis.
At 31 December 2012, our net on-balance sheet exposure to the corporate and other financial institution debt of France, Germany and the Netherlands was US$64bn, US$13bn higher than at the end of 2011. Off-balance sheet exposures increased by US$3.6bn in France. Our exposure in Germany and France was commensurate with the size of our operations and was well diversified across portfolios, sectors and products.
Our relationships in these countries are mostly with large global entities that have significant operations outside their respective domestic markets. This mitigates our risk as these corporates have diversified the sources of their revenue and, more importantly, their ability to raise finance internationally should their domestic markets become strained.
In France, our net exposure to personal lending at 31 December 2012 was US$16bn, US$1bn higher than at the end of 2011. The exposure was mainly in residential mortgages, loans secured by a national guarantee scheme and unsecured personal loans, and both delinquency and impairment charges remained low.
Exposure to other eurozone countries
In addition to the countries disclosed above, HSBC had net on-balance sheet exposures of US$24bn , US$1.6bn higher than in 2011 to eurozone countries that were not significant to the Group. Of these, the largest exposure was represented by our retail and corporate banking
operations in Malta, which had a net on-balance sheet exposure of US$5.8bn, US$0.2bn lower than in 2011. Our second largest exposure was in Finland with US$4.3bn of net on-balance sheet exposure to sovereign, agencies and banks (of which US$2.6bn was cash collateral held in respect of derivative liabilities). We also had US$3.3bn of net on-balance sheet exposure to sovereigns, agencies and banks in Belgium (of which US$1.4bn was fully collateralised) and US$1.2bn to other financial institutions and corporates. Our remaining net on-balance sheet exposure to the eurozone was less than 5% of the Group’s total equity.
(Unaudited)
As the peripheral eurozone countries continue to exhibit distress, there is continuing possibility of a member state exiting from the eurozone. There remains no established legal framework within the European treaties to facilitate such an event; consequently, it is not possible to accurately predict the course of events and legal consequences that would ensue.
Our current view is that there would be a greater impact on HSBC from a euro exit of Greece, Italy or Spain than from Ireland, Portugal or Cyprus.
Key risks associated with an exit by a eurozone member include:
Foreign exchange losses: an exit would probably be accompanied by the passing of laws in the country concerned establishing a new local currency and providing for a redenomination of euro-denominated assets into the new local currency. The value of assets and liabilities in the country would immediately fall assuming the value of the redenominated currency is less than the original euros when translated into the carrying amounts. It is not possible to predict what the total consequential loss might be as it is uncertain which assets and liabilities would be legally re-denominated or what the extent of the devaluation would be. However, in order to provide an indication of one part of the possible exposure, the table below identifies assets and liabilities booked in our banking operations in Greece, Italy and Spain (described as ‘in-country’). These assets and liabilities predominantly comprise loans and deposits arising from our commercial banking operations in these countries. The net assets represent our net funding exposure to those countries which we consider most likely to be affected by a redenomination event. The table also identifies in-country off-balance sheet exposures as these are at risk of redenomination should they be called, giving
201
Table of Contents
HSBC HOLDINGS PLC
Report of the Directors: Operating and Financial Review(continued)
rise to a balance sheet exposure. It is to be noted that this analysis can only be an indication as it does not include euro-denominated exposures booked by HSBC outside the countries at risk which are connected with those countries (see ‘external contracts’ below).
External contracts redenomination risk: contracts entered into between HSBC businesses based outside a country exiting the euro with in-country counterparties or those otherwise closely connected with the relevant country, may be affected by redenomination. The effect remains subject to a high level of uncertainty. Factors such as the country law under which the contract is documented, the HSBC entity involved and the payment mechanism may all be relevant to this assessment, as will the precise exit scenario as the consequences for external contracts of a disorderly exit or one
sanctioned under EU law may be different. In addition, capital controls could be introduced which may affect the ability to repatriate funds including currencies not affected by the redenomination event.
We continue to identify and monitor potential redenomination risks and, where possible, take steps to mitigate them and/or reduce our overall exposure to losses that might arise in the event of a redenomination. We continue to emphasise, however, that a euro exit could take different forms in a number of different scenarios. These give rise to distinct legal consequences which could significantly alter the potential effectiveness of any steps taken, and it is accordingly not possible to predict how effective particular measures may be until they are tested against the precise circumstances of a redenomination event.
(Unaudited)
| Denominated in: | ||||||||||||||||||||||||
| euros US$bn | US dollars US$bn | other currencies | Total US$bn | |||||||||||||||||||||
At 31 December 2012 | ||||||||||||||||||||||||
Greece | In-country assets | 2.1 | 0.1 | – | 2.2 | |||||||||||||||||||
| In-country liabilities | (1.5 | ) | (0.8 | ) | (0.1 | ) | (2.4 | ) | ||||||||||||||||
| Net in-country funding exposure | 0.6 | (0.7 | ) | (0.1 | ) | (0.2 | ) | |||||||||||||||||
| Off-balance sheet exposure | (0.3 | ) | 0.2 | 0.2 | 0.1 | |||||||||||||||||||
Italy | In-country assets | 1.0 | – | – | 1.0 | |||||||||||||||||||
| In-country liabilities38 | (2.0 | ) | – | – | (2.0 | ) | ||||||||||||||||||
| Net in-country funding exposure | (1.0 | ) | – | – | (1.0 | ) | ||||||||||||||||||
| Off-balance sheet exposure | 0.8 | – | – | 0.8 | ||||||||||||||||||||
Spain | In-country assets | 2.4 | 0.8 | – | 3.2 | |||||||||||||||||||
| In-country liabilities | (1.7 | ) | (0.1 | ) | – | (1.8 | ) | |||||||||||||||||
| Net in-country funding exposure | 0.7 | 0.7 | – | 1.4 | ||||||||||||||||||||
| Off-balance sheet exposure | 0.7 | 0.2 | – | 0.9 | ||||||||||||||||||||
At 31 December 2011 | ||||||||||||||||||||||||
Greece | In-country assets | 2.9 | 2.2 | 0.1 | 5.2 | |||||||||||||||||||
| In-country liabilities | (2.1 | ) | (1.6 | ) | (0.1 | ) | (3.8 | ) | ||||||||||||||||
| Net in-country funding exposure | 0.8 | 0.6 | – | 1.4 | ||||||||||||||||||||
| Off-balance sheet exposure | 0.2 | – | – | 0.2 | ||||||||||||||||||||
Italy | In-country assets | 2.1 | – | – | 2.1 | |||||||||||||||||||
| In-country liabilities38 | (2.6 | ) | – | – | (2.6 | ) | ||||||||||||||||||
| Net in-country funding exposure | (0.5 | ) | – | – | (0.5 | ) | ||||||||||||||||||
| Off-balance sheet exposure | 0.8 | – | – | 0.8 | ||||||||||||||||||||
Spain | In-country assets | 4.4 | 0.6 | 0.1 | 5.1 | |||||||||||||||||||
| In-country liabilities | (1.7 | ) | (0.1 | ) | – | (1.8 | ) | |||||||||||||||||
| Net in-country funding exposure | 2.7 | 0.5 | 0.1 | 3.3 | ||||||||||||||||||||
| Off-balance sheet exposure | 2.4 | 0.5 | – | 2.9 | ||||||||||||||||||||
For footnote, see page 249.
202
Table of Contents
HSBC HOLDINGS PLC
Report of the Directors: Operating and Financial Review(continued)
| Page | App1 | Tables | Page | |||||||||||
| 261 | ||||||||||||||
| 261 | ||||||||||||||
| 204 | ||||||||||||||
| 204 | ||||||||||||||
| 205 | ||||||||||||||
| 205 | 261 | |||||||||||||
| 261 | ||||||||||||||
| 262 | ||||||||||||||
| 205 | 262 | 205 | ||||||||||||
| 205 | 262 | 206 | ||||||||||||
| 262 | ||||||||||||||
| 206 | 263 | 207 | ||||||||||||
| 207 | 208 | |||||||||||||
| 264 | ||||||||||||||
| 264 | ||||||||||||||
Contingent liquidity risk arising from committed lending facilities | 208 | 265 | Group’s contractual undrawn exposures monitored under the contingent liquidity risk limit structure | 209 | ||||||||||
| 209 | 261 | 210 | ||||||||||||
| 210 | ||||||||||||||
| 211 | ||||||||||||||
| 211 | 211 | |||||||||||||
| 212 | ||||||||||||||
Off-balance sheet collateral received and pledged for reverse repo and stock borrowing transactions | 212 | |||||||||||||
Off-balance sheet non-cash collateral received and pledged for derivative transactions | 212 | |||||||||||||
Analysis of on-balance sheet encumbered and unencumbered assets | 212 | Analysis of on-balance sheet encumbered and unencumbered assets | 213 | |||||||||||
| 213 | ||||||||||||||
| 214 | ||||||||||||||
| 214 | Cash flows payable by HSBC under financial liabilities by remaining contractual maturities | 215 | ||||||||||||
| 265 | ||||||||||||||
| 215 | 265 | Cash flows payable by HSBC Holdings under financial liabilities by remaining contractual maturities | 216 | |||||||||||
| 216 | ||||||||||||||
1Appendix to Risk – risk policies and practices | ||||||||||||||
203
Table of Contents
HSBC HOLDINGS PLC
Report of the Directors: Operating and Financial Review(continued)
Liquidity risk is the risk that the Group does not have sufficient financial resources to meet its obligations as they fall due, or will have to do so at an excessive cost. The risk arises from mismatches in the timing of cash flows.
There were no material changes to our policies and practices for the management of liquidity and funding risks in 2012.
| A summary of our current policies and practices regarding liquidity and funding is provided in the Appendix to Risk on page 261. |
Our liquidity and funding risk management framework
The objective of our liquidity framework is to allow us to withstand very severe liquidity stresses. It is designed to be adaptable to changing business models, markets and regulations.
| Our liquidity and funding risk management framework requires: |
| • | liquidity to be managed by operating entities on a stand-alone basis with no implicit reliance on the Group or central banks; |
| • | all operating entities to comply with their limits for the advances to core funding ratio; and |
| • | all operating entities to maintain a positive stressed cash flow position out to three months under prescribed Group stress scenarios. |
Further details of the metrics are provided in the Appendix to Risk on page 261.
(Unaudited)
The liquidity position of the Group strengthened in 2012, and we continued to enjoy strong inflows of customer deposits and maintained good access to wholesale markets. During 2012, customer accounts grew by 7% (US$86bn) while loans and advances to customers increased by 6% (US$57bn), leading to a small decrease in our advances to deposits ratio to 74% (2011: 75%).
HSBC UK (see footnote 40 on page 249) recorded an increase in its advances to core funding ratio to 106% at 31 December 2012 (2011: 100%). During 2012, HSBC UK continued to fund the majority of its growth in advances with growth in core deposits and remained within its advances to core funding limit.
The Hongkong and Shanghai Banking Corporation (see footnote 41 on page 249)
recorded a decrease in its advances to core funding ratio to 73% at 31 December 2012 (2011: 75%), mainly as a result of its core deposits increasing more than advances.
The completion of the sale of the US cards business and branch network during 2012 improved the liquidity and funding position of both HSBC Finance and HSBC USA (see footnote 42 on page 249), the latter recording a decrease in its advances to core funding ratio to 78% as at 31 December 2012 (2011: 86%).
Customer accounts increased by 7% year on year. After excluding repo balances, the year-on-year increase was 7%.
Retail Banking and Wealth Management
We continued to grow our RBWM customer accounts, which increased by 6%, by providing differentiated products and services to different segments. The growth in retail deposits benefited from the wider macroeconomic trend of expanded money supply, customer deleveraging and weak loan growth, which partially offset the competitive pressure in some of our key markets for retail deposits and savers’ reluctance to place funds into low-rate deposits.
Global Private Banking
As economic conditions remained subdued and interest rates continued to fall, part of the GPB customer base realigned its risk appetite and made use of the wide range of products available, with some asset reallocation to higher yielding off-balance sheet products including equities, funds and bonds. As a result, customer accounts decreased by 5% year on year.
Commercial Banking
Customer accounts increased by 11% year on year, with the majority of this increase resulting from increases in Payments and Cash Management accounts. The growth in these customer accounts and the strong growth in payment volumes demonstrated a funding source that is correlated to the operational services that HSBC provides to the CMB customer base.
204
Table of Contents
HSBC HOLDINGS PLC
Report of the Directors: Operating and Financial Review(continued)
Global Banking and Markets
Customer accounts increased by 8% year on year. After excluding repo balances with customers, GB&M deposits increased by 10% year on year, with the majority of this rise resulting from increases in Payments and Cash Management accounts. The growth in these customer accounts and the strong growth in payment volumes demonstrated a funding source that is strongly linked to the operational services that HSBC provides to the GB&M customer base.
Wholesale funding markets gradually improved during 2012, although the volume of term debt issued by banks was low by recent standards, influenced to a significant extent by reduced bank funding requirements. Globally, market conditions across public wholesale funding markets were predominantly driven by sovereign-related and more general events in the eurozone.
HSBC continued to have good access to debt capital markets throughout 2012 with Group entities issuing US$10.5bn of public transactions of which US$9.8bn was senior unsecured debt.
In January 2013 the Group repaid €5bn (US$6.6bn) of funding raised through the ECB’s Long Term Repo Operations (‘LTRO’), leaving only €473m (US$624m) outstanding.
Management of liquidity and funding risk
(Audited)
Our liquidity and funding risk management framework (‘LFRF’) employs two key measures to define, monitor and control the liquidity and funding risk of each of our operating entities. The advances to core funding ratio is used to monitor the structural long-term funding position, and the stressed coverage ratio, incorporating Group-defined stress scenarios, is used to monitor the resilience to severe liquidity stresses.
The three principal entities listed in the tables below represented 62% (2011: 61%) of the Group’s customer accounts (excluding repos). Including other principal entities, the percentage was 94% (2011: 96%).
Advances to core funding ratio
The table below shows the extent to which loans and advances to customers in our principal banking entities were financed by reliable and stable sources of funding.
Advances to core funding limits set for operating entities at 31 December 2012 ranged between 70% and 115%, except for one operating entity reported within the total of HSBC’s other principal entities which operated with a limit of 125% during 2012. This limit has been reduced to 115% for 2013.
Advances to core funding ratios39
(Audited)
| At 31 December | ||||||||
2012 % | 2011 % | |||||||
HSBC UK40 | ||||||||
Year-end | 106 | 100 | ||||||
Maximum | 106 | 103 | ||||||
Minimum | 100 | 98 | ||||||
Average | 103 | 101 | ||||||
The Hongkong and Shanghai Banking Corporation41 | ||||||||
Year-end | 73 | 75 | ||||||
Maximum | 75 | 79 | ||||||
Minimum | 71 | 70 | ||||||
Average | 73 | 76 | ||||||
HSBC USA42 | ||||||||
Year-end | 78 | 86 | ||||||
Maximum | 86 | 90 | ||||||
Minimum | 68 | 80 | ||||||
Average | 78 | 85 | ||||||
Total of HSBC’s other principal entities43 | ||||||||
Year-end | 91 | 86 | ||||||
Maximum | 92 | 90 | ||||||
Minimum | 85 | 86 | ||||||
Average | 88 | 89 | ||||||
For footnotes, see page 249.
The stressed coverage ratios tabulated below express stressed cash inflows as a percentage of stressed cash outflows over both one-month and three-month time horizons. Operating entities are required to maintain a ratio of 100% or greater out to three months.
Inflows included in the numerator of the stressed coverage ratio are those that are assumed to be generated from liquid assets net of assumed haircuts, and cash inflows related to assets contractually maturing within the time period.
In general, customer advances are assumed to be renewed and as a result do not generate a cash inflow.
205
Table of Contents
HSBC HOLDINGS PLC
Report of the Directors: Operating and Financial Review(continued)
Stressed one-month and three-month coverage ratios39
(Audited)
Stressed one-month coverage ratios at 31 December | Stressed three-month coverage Ratios at 31 December | |||||||||||||||
| HSBC UK40 | 2012 % | 2011 % | 2012 % | 2011 % | ||||||||||||
Year-end | 114 | 116 | 103 | 102 | ||||||||||||
Maximum | 117 | 118 | 103 | 102 | ||||||||||||
Minimum | 108 | 109 | 101 | 99 | ||||||||||||
Average | 112 | 113 | 102 | 100 | ||||||||||||
The Hongkong and Shanghai Banking Corporation41 | ||||||||||||||||
Year-end | 129 | 123 | 126 | 118 | ||||||||||||
Maximum | 134 | 145 | 126 | 126 | ||||||||||||
Minimum | 123 | 116 | 118 | 110 | ||||||||||||
Average | 129 | 124 | 123 | 116 | ||||||||||||
HSBC USA42 | ||||||||||||||||
Year-end | 126 | 118 | 119 | 113 | ||||||||||||
Maximum | 137 | 128 | 130 | 122 | ||||||||||||
Minimum | 115 | 109 | 113 | 105 | ||||||||||||
Average | 127 | 119 | 123 | 116 | ||||||||||||
Total of HSBC’s other principal entities43 | ||||||||||||||||
Year-end | 127 | 118 | 117 | 108 | ||||||||||||
Maximum | 127 | 120 | 117 | 113 | ||||||||||||
Minimum | 117 | 116 | 108 | 107 | ||||||||||||
Average | 121 | 118 | 111 | 109 | ||||||||||||
For footnotes, see page 249.
The stressed coverage ratios for HSBC UK remained broadly unchanged.
The stressed coverage ratios for The Hongkong and Shanghai Banking Corporation improved as the increase in core deposits exceeded the increase in loans and advances to customers. The resulting surplus was deployed in liquid assets, thereby improving the stressed coverage ratios.
The stressed coverage ratios for HSBC USA improved as a result of the net effect of selling the US Card and Retail Services business and non-strategic branches during 2012, which resulted in a reduction in core deposits that was lower than the reduction in loans and advances to customers. The resulting surplus was deployed in liquid assets, thereby improving the stressed coverage ratios.
The three-month stressed coverage ratio for the total of HSBC’s other principal entities remained broadly unchanged. The one-month stressed coverage ratio improved as a result of an increase in contractual maturities between one month and three months.
Liquid assets of HSBC’s principal operating entities
The table below shows the estimated liquidity value (before assumed haircuts) of assets categorised as liquid used for the purposes of calculating the three-month stressed coverage ratios, as defined under the LFRF.
Any unencumbered asset held as a consequence of a reverse repo transaction with a residual contractual maturity within the stressed coverage ratio time period and unsecured interbank loans maturing within three months are not included in liquid assets, as these assets are reflected as contractual cash inflows.
Liquid assets are held and managed on a standalone operating entity basis. Most of the liquid assets shown are held directly by each operating entity’s Balance Sheet Management function, primarily for the purpose of managing liquidity risk, in line with the LFRF.
Liquid assets also include any unencumbered liquid assets held outside Balance Sheet Management for any other purpose. The LFRF gives ultimate control of all unencumbered assets and sources of liquidity to Balance Sheet Management.
206
Table of Contents
HSBC HOLDINGS PLC
Report of the Directors: Operating and Financial Review(continued)
Liquid assets of HSBC’s principal entities
| Estimated liquidity value44 | ||||||||||||||||
31 Dec 2012 Audited US$m | 30 Jun 2012 Unaudited US$m | 31 Dec 2011 Audited US$m | ||||||||||||||
HSBC UK40 | ||||||||||||||||
Level 1 | 138,812 | 120,690 | 114,596 | |||||||||||||
Level 2 | 374 | 475 | 344 | |||||||||||||
Level 3 | 27,656 | 9,320 | – | |||||||||||||
Non-government assets | – | – | 23,007 | |||||||||||||
| 166,842 | 130,485 | 137,947 | ||||||||||||||
The Hongkong and Shanghai Banking Corporation41 | ||||||||||||||||
Level 1 | 112,167 | 104,943 | 107,056 | |||||||||||||
Level 2 | 5,740 | 5,929 | ||||||||||||||
Level 3 | 3,968 | 4,889 | – | |||||||||||||
Non-government assets | – | – | 2,151 | |||||||||||||
| 121,875 | 115,761 | 109,207 | ||||||||||||||
HSBC USA42 | ||||||||||||||||
Level 1 | 60,981 | 62,966 | 86,060 | |||||||||||||
Level 2 | 15,609 | 16,511 | 1,369 | |||||||||||||
Level 3 | 5,350 | 8,405 | – | |||||||||||||
Other | 6,521 | 6,238 | – | |||||||||||||
Non-government assets | – | – | 19,093 | |||||||||||||
| 88,461 | 94,120 | 106,522 | ||||||||||||||
Total of HSBC’s other principal entities43 | ||||||||||||||||
Level 1 | 154,445 | 118,616 | 138,085 | |||||||||||||
Level 2 | 18,048 | 36,713 | 2,827 | |||||||||||||
Level 3 | 6,468 | 11,205 | – | |||||||||||||
Other | 2,447 | – | – | |||||||||||||
Non-government assets | – | – | 23,584 | |||||||||||||
| 181,408 | 166,534 | 164,496 | �� | |||||||||||||
For footnotes, see page 249.
Our liquid asset policy was refined at 1 January 2012 to apply a more granular classification of liquid assets, as described in the Appendix to Risk on page 261. Under the previous framework, liquid assets were classified into two categories: central government, central bank and US agency MBS exposures; and all other non-government exposures. Central government, central bank and US agency MBS exposures qualify as Level 1 or Level 2 under the new policy and are shown as such in the comparatives.
All assets held within the liquid asset portfolio are unencumbered.
Liquid assets held by HSBC UK increased as a result of a rise in customer accounts, which led to an increase in the level of non-core deposits and, consequently, liquid assets.
Liquid assets held by The Hongkong and Shanghai Banking Corporation also rose as a result of an increase in customer accounts. As the growth in core deposits exceeded the increases in loans and advances to customers, the difference was deployed into liquid assets and the level of liquid assets held grew accordingly.
Liquid assets held by HSBC USA decreased as a result of the sale of the US Card and Retail Services business and non-strategic branches during 2012.
The following table quantifies the contractual cash flows from interbank and intergroup loans and deposits, and reverse repo, repo (including intergroup transactions) and short positions for the principal entities shown. These contractual cash inflows and outflows are reflected gross in the numerator and denominator, respectively, of the one and three-month stressed coverage ratios and should be considered alongside the level of liquid assets.
Outflows included in the denominator of the stressed coverage ratios include the principal outflows associated with the contractual maturity of wholesale debt securities reported in the table headed ‘Wholesale funding cash flows payable by HSBC under financial liabilities by remaining contractual maturities’ on page 210.
207
Table of Contents
HSBC HOLDINGS PLC
Report of the Directors: Operating and Financial Review(continued)
Net cash inflows/(outflows) for interbank and intragroup loans and deposits and reverse repo, repo and short positions
(Audited)
| At 31 December 2012 | At 31 December 2011 | |||||||||||||||||
Cash flows within one month US$m | Cash flows from one to three months | Cash flows within one month US$m | Cash flows from one to three months | |||||||||||||||
Interbank and intragroup loans and deposits | ||||||||||||||||||
HSBC UK40 | (16,464 | ) | (1,429 | ) | (12,832 | ) | 446 | |||||||||||
The Hongkong and Shanghai Banking Corporation41 | 4,402 | 9,685 | 8,715 | 9,246 | ||||||||||||||
HSBC USA42 | (30,269 | ) | (473 | ) | (32,154 | ) | 213 | |||||||||||
Total of HSBC’s other principal entities43 | 5,419 | 10,511 | 14,053 | 2,589 | ||||||||||||||
Reverse repo, repo, stock borrowing, stock lending and outright short positions (including intragroup) | ||||||||||||||||||
HSBC UK40 | (4,184 | ) | (13,776 | ) | (558 | ) | (171 | ) | ||||||||||
The Hongkong and Shanghai Banking Corporation41 | 13,672 | 2,501 | 7,393 | (487 | ) | |||||||||||||
HSBC USA42 | (4,003 | ) | 62 | (3,872 | ) | (377 | ) | |||||||||||
Total of HSBC’s other principal entities43 | (31,951 | ) | (231 | ) | (6,597 | ) | 10,162 | |||||||||||
For footnotes, see page 249.
Net cash flow arising from interbank and intragroup loans and deposits
Under the LFRF, a net cash inflow within three months arising from interbank and intragroup loans and deposits will give rise to a lower liquid asset requirement. Conversely, a net cash outflow within three months arising from interbank and intragroup loans and deposits will give rise to a higher liquid assets requirement.
Net cash flow arising from reverse repo, repo, stock borrowing, stock lending and outright short positions (including intragroup)
A net cash inflow represents additional liquid resources, in addition to liquid assets, because any unencumbered asset held as a consequence of a reverse repo transaction with a residual contractual maturity within the stressed coverage ratio time period is not reflected as a liquid asset.
The impact of net cash outflow depends on whether the underlying collateral encumbered as a result will qualify as a liquid asset when released at the maturity of the repo. The majority of the Group’s repo transactions are collateralised by liquid assets and, as such, any net cash outflow shown is offset by the return of liquid assets, which are excluded from the liquid asset table above.
Contingent liquidity risk arising from committed lending facilities
(Audited)
The Group’s operating entities provide commitments to various counterparts. In terms of liquidity risk, the most significant risk relates to committed lending facilities which, whilst undrawn, give rise to contingent liquidity risk, as these could be drawn during a period of liquidity stress. Commitments are given to customers and committed lending facilities are provided to consolidated multi-seller conduits, established to enable clients to access a flexible market-based source of finance (see page 209), consolidated securities investment conduits and third-party sponsored conduits.
The consolidated securities investment conduits primarily represent Solitaire and Mazarin (see pages 186). These conduits issue asset-backed commercial paper secured against the portfolio of securities held by these conduits. At 31 December 2012, HSBC UK had undrawn committed lending facilities to these conduits of US$18bn (2011: US$22bn, of which Solitaire represented US$13bn (2011: US$16bn) and the remaining US$5.1bn (2011: US$6.2bn) pertained to Mazarin. At 31 December 2012, the commercial paper issued by Solitaire and Mazarin was entirely held by HSBC
208
Table of Contents
HSBC HOLDINGS PLC
Report of the Directors: Operating and Financial Review(continued)
UK. Since HSBC controls the size of the portfolio of securities held by these conduits, no contingent liquidity risk exposure arises as a result of these undrawn committed lending facilities.
The table below shows the level of undrawn commitments to customers outstanding for the five largest single facilities and the largest market sector, and the extent to which they are undrawn.
The Group’s contractual undrawn exposures at 31 December monitored under the contingent liquidity risk limit structure
(Audited)
| HSBC UK | HSBC USA | HSBC Canada | The Hongkong and Shanghai Banking Corporation | |||||||||||||||||||||||||||||||||||
| 2012 US$bn | 2011 US$bn | 2012 US$bn | 2011 US$bn | 2012 US$bn | 2011 US$bn | 2012 US$bn | 2011 US$bn | |||||||||||||||||||||||||||||||
Commitments to conduits | ||||||||||||||||||||||||||||||||||||||
Consolidated multi-seller conduits | ||||||||||||||||||||||||||||||||||||||
– total lines | 7.8 | 11.4 | 2.3 | 0.9 | 1.0 | 0.7 | – | – | ||||||||||||||||||||||||||||||
– largest individual lines | 0.7 | 0.7 | 0.5 | 0.3 | 0.8 | 0.5 | – | – | ||||||||||||||||||||||||||||||
Consolidated securities investment conduits | ||||||||||||||||||||||||||||||||||||||
– total lines | 18.1 | 22.1 | – | – | – | – | – | – | ||||||||||||||||||||||||||||||
Third party conduits | ||||||||||||||||||||||||||||||||||||||
– total lines | – | – | 0.8 | 1.4 | – | – | – | – | ||||||||||||||||||||||||||||||
Commitments to customers | ||||||||||||||||||||||||||||||||||||||
– five largest45 | 6.0 | 3.4 | 6.0 | 5.7 | 1.7 | 1.8 | 2.1 | 1.9 | ||||||||||||||||||||||||||||||
– largest market sector46 | 11.0 | 7.5 | 7.5 | 6.5 | 4.5 | 3.8 | 2.4 | 2.5 | ||||||||||||||||||||||||||||||
For footnotes, see page 249.
(Audited)
Our primary sources of funding are customer current accounts and customer savings deposits payable on demand or at short notice. We issue wholesale securities (secured and unsecured) to supplement our customer deposits and change the currency mix, maturity profile or location of our liabilities.
The funding sources and uses table, which provides a consolidated view of how our balance sheet is funded, should be read in the light of the LFRF, which requires operating entities to manage liquidity and funding risk on a stand-alone basis.
The table analyses our consolidated balance sheet according to the assets that primarily arise from operating activities and the sources of funding primarily supporting these activities. The assets and
liabilities that do not arise from operating activities are presented as a net balancing source or deployment of funds.
The level of customer accounts continued to exceed the level of loans and advances to customers. Excluding the effect of repos from customer accounts and reverse repos from loans and advances to customers, the adjusted advances to deposits ratio at 31 December 2012 was 73.4% (2011: 73.5%). The positive funding gap was predominantly deployed into liquid assets; cash and balances with central banks and financial investments, as required by the LFRF.
Loans and other receivables due from banks continued to exceed deposits taken from banks. The Group remained a net unsecured lender to the banking sector.
209
Table of Contents
HSBC HOLDINGS PLC
Report of the Directors: Operating and Financial Review(continued)
(Audited)
2012 US$m | 2011 US$m | |||||||||
Sources | ||||||||||
Customer accounts | 1,340,014 | 1,253,925 | ||||||||
– repos | 28,618 | 30,785 | ||||||||
– cash deposits | 1,311,396 | 1,223,140 | ||||||||
Deposits by banks | 107,429 | 112,822 | ||||||||
– repos | 11,949 | 17,617 | ||||||||
– cash deposits | 95,480 | 95,205 | ||||||||
Debt securities issued | 119,461 | 131,013 | ||||||||
Liabilities of disposal groups held for sale | 5,018 | 22,200 | ||||||||
Subordinated liabilities | 29,479 | 30,606 | ||||||||
Financial liabilities designated at fair value | 87,720 | 85,724 | ||||||||
Liabilities under insurance contracts | 68,195 | 61,259 | ||||||||
Trading liabilities | 304,563 | 265,192 | ||||||||
– repos | 130,223 | 86,838 | ||||||||
– stock lending | 6,818 | 4,595 | ||||||||
– other trading liabilities | 167,522 | 173,759 | ||||||||
Total equity | 183,129 | 166,093 | ||||||||
| 2,245,008 | 2,128,834 | |||||||||
2012 US$m | 2011 US$m | |||||||||||
| Uses | ||||||||||||
| Loans and advances to customers | 997,623 | 940,429 | ||||||||||
| – reverse repos | 34,651 | 41,419 | ||||||||||
| – loans or other receivables | 962,972 | 899,010 | ||||||||||
| Loans and advances to banks | 152,546 | 180,987 | ||||||||||
| – reverse repos | 35,461 | 41,909 | ||||||||||
| – loans or other receivables | 117,085 | 139,078 | ||||||||||
| Assets held for sale | 19,269 | 39,558 | ||||||||||
| Trading assets | 408,811 | 330,451 | ||||||||||
| – reverse repos | 118,681 | 79,848 | ||||||||||
| – stock borrowing | 16,071 | 9,459 | ||||||||||
| – other trading assets | 274,059 | 241,144 | ||||||||||
| Financial investments | 421,101 | 400,044 | ||||||||||
| Cash and balances with central banks | 141,532 | 129,902 | ||||||||||
Net deployment in other balance sheet assets and liabilities | 104,126 | 107,463 | ||||||||||
| 2,245,008 | 2,128,834 | |||||||||||
Wholesale funding cash flows payable by HSBC under financial liabilities by remaining contractual maturities
(Unaudited)
On demand US$m | Due within 3 months | Due within 3 to 12 | Total due within 1 year | Due between 1 and 5 years US$m | Due after 5 years US$m | Total US$m | ||||||||||||||||||||||||||||||||||
At 31 December 2012 | ||||||||||||||||||||||||||||||||||||||||
Debt securities issued | 2,419 | 41,139 | 50,697 | 94,255 | 97,198 | 31,217 | 222,670 | |||||||||||||||||||||||||||||||||
Unsecured CDs and CP | – | 22,158 | 10,125 | 32,283 | 5,344 | – | 37,627 | |||||||||||||||||||||||||||||||||
Unsecured senior MTNs | 1 | 6,306 | 33,363 | 39,670 | 68,949 | 23,478 | 132,097 | |||||||||||||||||||||||||||||||||
Unsecured senior structured notes | 2,234 | 1,329 | 3,978 | 7,541 | 6,942 | 5,325 | 19,808 | |||||||||||||||||||||||||||||||||
Secured covered bonds | – | 51 | 2,467 | 2,518 | 8,840 | 542 | 11,900 | |||||||||||||||||||||||||||||||||
Secured ABCP | – | 10,358 | – | 10,358 | – | – | 10,358 | |||||||||||||||||||||||||||||||||
Secured ABS | 16 | 782 | 646 | 1,444 | 4,557 | 707 | 6,708 | |||||||||||||||||||||||||||||||||
Others | 168 | 155 | 118 | 441 | 2,566 | 1,165 | 4,172 | |||||||||||||||||||||||||||||||||
Subordinated liabilities | 7 | 838 | 1,864 | 2,709 | 14,641 | 77,930 | 95,280 | |||||||||||||||||||||||||||||||||
Subordinated debt securities | 7 | 573 | 1,509 | 2,089 | 12,625 | 57,503 | 72,217 | |||||||||||||||||||||||||||||||||
Preferred securities | – | 265 | 355 | 620 | 2,016 | 20,427 | 23,063 | |||||||||||||||||||||||||||||||||
| ||||||||||||||||||||||||||||||||||||||||
| 2,426 | 41,977 | 52,561 |
| 96,964 |
| 111,839 | 109,147 | 317,950 | ||||||||||||||||||||||||||||||||
210
Table of Contents
HSBC HOLDINGS PLC
Report of the Directors: Operating and Financial Review(continued)
On demand | Due within 3 months | Due within 3 to 12 | Total due within 1 year | Due between 1 and 5 years | Due after 5 years | Total US$m | ||||||||||||||||||||||||||||||||||
At 31 December 2011 | ||||||||||||||||||||||||||||||||||||||||
Debt securities issued | 1,907 | 49,923 | 39,011 | 90,841 | 104,689 | 37,028 | 232,558 | |||||||||||||||||||||||||||||||||
Unsecured CDs and CP | 280 | 28,918 | 8,143 | 37,341 | 9,713 | 26 | 47,080 | |||||||||||||||||||||||||||||||||
Unsecured senior MTNs | 122 | 3,704 | 26,541 | 30,367 | 80,884 | 29,081 | 140,332 | |||||||||||||||||||||||||||||||||
Unsecured senior structured notes | 1,505 | 575 | 1,858 | 3,938 | 1,878 | 1,156 | 6,972 | |||||||||||||||||||||||||||||||||
Secured covered bonds | – | 607 | 1,549 | 2,156 | 7,649 | 3,694 | 13,499 | |||||||||||||||||||||||||||||||||
Secured ABCP | – | 10,446 | – | 10,446 | – | – | 10,446 | |||||||||||||||||||||||||||||||||
Secured ABS | – | 326 | 546 | 872 | 3,071 | 1,779 | 5,722 | |||||||||||||||||||||||||||||||||
Others | – | 5,347 | 374 | 5,721 | 1,494 | 1,292 | 8,507 | |||||||||||||||||||||||||||||||||
Subordinated liabilities | 6 | 913 | 6,004 | 6,923 | 15,134 | 78,569 | 100,626 | |||||||||||||||||||||||||||||||||
Subordinated debt securities | 6 | 694 | 5,552 | 6,252 | 12,908 | 58,051 | 77,211 | |||||||||||||||||||||||||||||||||
Preferred securities | – | 219 | 452 | 671 | 2,226 | 20,518 | 23,415 | |||||||||||||||||||||||||||||||||
| ||||||||||||||||||||||||||||||||||||||||
| 1,913 | 50,836 | 45,015 | 97,764 | 119,823 | 115,597 | 333,184 | ||||||||||||||||||||||||||||||||||
The balances in the table above will not agree directly with those in our consolidated balance sheet as the table incorporates, on an undiscounted basis, all cash flows relating to principal and future coupon payments.
We do not expect the professional markets to be a source of funding for HSBC Finance in the future in view of the sale of the Card and Retail Services business and the run-off of its remaining portfolio. HSBC Finance expects to meet future funding needs by asset sales and affiliate funding. As a consequence, no new external third-party funding, including commercial paper, is being originated by HSBC Finance.
Encumbered and unencumbered assets
(Unaudited)
The objective of this disclosure is to facilitate an understanding of available and unrestricted assets that could be used to support potential future funding and collateral needs.
An asset is defined as encumbered if it has been pledged as collateral against an existing liability, and as a result is no longer available to the bank to secure funding, satisfy collateral needs or be sold to reduce the funding requirement. An asset is therefore categorised as unencumbered if it has not been pledged against an existing liability. Unencumbered assets are then further analysed into four separate sub-categories; ‘readily realisable assets’, ‘other realisable assets’, ‘reverse repo/stock borrowing receivables and derivative assets’ and ‘cannot be pledged as collateral’.
The disclosure is not designed to identify assets which would be available to meet the claims of
creditors or to predict assets that would be available to creditors in the event of a resolution or bankruptcy.
The table below summarises the total on and off-balance sheet assets that are capable of supporting future funding and collateral needs and shows the extent to which these assets are currently pledged for this purpose.
Summary of assets available to support potential future funding and collateral needs (on and off-balance sheet)
(Unaudited)
| 2012 | ||||
| US$bn | ||||
Total on-balance sheet assets | 2,693 | |||
Less: | ||||
Reverse repo/stock borrowing receivables and derivative assets | 562 | |||
Other assets that cannot be pledged as collateral | 247 | |||
Total on-balance sheet assets that can support funding and collateral needs | 1,884 | |||
Add off-balance sheet assets: | ||||
Fair value of collateral received from reverse repo/stock borrowing that is available to sell or repledge | 296 | |||
Fair value of collateral received from derivatives that is available to sell or repledge | 6 | |||
Total assets that can support funding and collateral needs (on and off-balance sheet) | 2,186 | |||
Less: | ||||
On-balance sheet assets pledged | 233 | |||
Off-balance sheet collateral received from reverse repo/stock borrowing which has been repledged or sold | 203 | |||
Off-balance sheet collateral received from derivative transactions which has been repledged or sold | 1 | |||
Assets available to support funding and collateral needs | 1,749 | |||
211
Table of Contents
HSBC HOLDINGS PLC
Report of the Directors: Operating and Financial Review(continued)
At 31 December 2012, the Group held US$1,749bn of unencumbered assets that could be used to support potential future funding and collateral needs, representing 80% of the total assets that can support funding and collateral needs (on and off-balance sheet). Of this amount, US$764bn (US$666bn on-balance sheet) were assessed to be readily realisable.
The effect of active collateral management
Collateral is managed on an operating entity basis, consistent with the operating entity management of liquidity and funding. The available collateral held by each operating entity is managed as a single collateral pool. In managing this collateral and deciding which collateral to pledge, each operating entity will seek to optimise the use of the available collateral pool, within the confines of the LFRF, irrespective of whether the collateral pledged is recognised on-balance sheet or was received in respect of reverse repo, stock borrowing or derivative transactions.
As a result of managing collateral in this manner, in terms of asset encumbrance presentation, we may encumber on-balance sheet holdings while maintaining available unencumbered off-balance sheet holdings, even though we are not seeking to directly finance the on-balance sheet holdings pledged.
In quantifying the level of encumbrance of negotiable securities, the encumbrance has been analysed on an individual security basis. In doing so where a particular security has been encumbered and HSBC has holdings of the security both on-balance sheet and off-balance sheet with the right to repledge, it is assumed for the purpose of this disclosure that the off-balance sheet holding is encumbered ahead of the on-balance sheet holding.
An on balance-sheet encumbered and off-balance sheet unencumbered asset will occur, for example, if we receive a specific security as a result of a reverse repo/stock borrow transaction, but finance the cash lent by pledging a generic collateral basket, even if the security received is eligible for the collateral basket pledged. This will also occur if we receive a generic collateral basket as a result of a reverse repo transaction but finance the cash lent by pledging specific securities, even if the securities pledged are eligible for the collateral basket.
Off-balance sheet collateral received and pledged for reverse repo and stock borrowing transactions
The fair value of assets accepted as collateral that HSBC is permitted to sell or repledge in the absence of default was US$296bn at 31 December 2012 (2011: US$302bn). The fair value of any such collateral that has been sold or repledged was US$203bn (2011: US$189bn). HSBC is obliged to return equivalent securities. These transactions are conducted under terms that are usual and customary to standard reverse repo and stock borrowing transactions.
The fair value of collateral received and repledged in relation to reverse repo and stock borrowing are reported on a gross basis. The related balance sheet receivables and payables are reported on a net basis where required under IFRS netting criteria.
As a result of reverse repo and stock borrowing transactions where the collateral received can be sold or re-pledged, but has not been sold or re-pledged, we held US$93bn of unencumbered collateral available to support potential future funding and collateral needs at 31 December 2012.
Off-balance sheet non-cash collateral received and pledged for derivative transactions
The fair value of assets accepted as collateral related to derivative transactions that we are permitted to sell or repledge in the absence of default was US$6.0bn. The fair value of any such collateral that has been sold or repledged was US$0.8bn. We are obliged to return equivalent securities. These transactions are conducted under terms that are usual and customary to derivative transactions.
Analysis of on-balance sheet encumbered and unencumbered assets
The table on page 213 presents an analysis of on-balance sheet holdings only, and shows the amounts of balance sheet assets that are encumbered. The table therefore excludes any available off-balance sheet holdings received in respect of reverse repo, stock borrowing or derivatives.
212
Table of Contents
HSBC HOLDINGS PLC
Report of the Directors: Operating and Financial Review(continued)
Analysis of on-balance sheet encumbered and unencumbered assets
(Unaudited)
| Encumbered | Unencumbered | Unencumbered – cannot be pledged as collateral | ||||||||||||||||||||||||||||||||
Assets pledged as collateral | Readily realisable assets | Other realisable assets | Reverse repo/stock borrowing receivables & derivative assets | Cannot be pledged as collateral | Total | |||||||||||||||||||||||||||||
| US$m | US$m | US$m | US$m | US$m | US$m | |||||||||||||||||||||||||||||
At 31 December 2012 | ||||||||||||||||||||||||||||||||||
Cash and balances at central banks | – | 139,963 | 220 | – | 1,349 | 141,532 | ||||||||||||||||||||||||||||
Items in the course of collection from other banks | – | – | – | – | 7,303 | 7,303 | ||||||||||||||||||||||||||||
Hong Kong Government certificates of indebtedness | – | – | – | – | 22,743 | 22,743 | ||||||||||||||||||||||||||||
Trading assets | 143,019 | 116,395 | 10,330 | 134,752 | 4,315 | 408,811 | ||||||||||||||||||||||||||||
– Treasury and other eligible bills | 2,309 | 23,973 | – | – | – | 26,282 | ||||||||||||||||||||||||||||
– debt securities | 97,157 | 47,311 | 205 | – | 4 | 144,677 | ||||||||||||||||||||||||||||
– equity securities | 5,592 | 35,420 | 622 | – | – | 41,634 | ||||||||||||||||||||||||||||
– loans and advances to banks | 20,588 | 1,909 | 2,582 | 50,376 | 2,816 | 78,271 | ||||||||||||||||||||||||||||
– loans and advances to customers | 17,373 | 7,782 | 6,921 | 84,376 | 1,495 | 117,947 | ||||||||||||||||||||||||||||
Financial assets designated at fair value | – | 447 | 610 | – | 32,525 | 33,582 | ||||||||||||||||||||||||||||
– Treasury and other eligible bills | – | 14 | – | – | 40 | 54 | ||||||||||||||||||||||||||||
– debt securities | – | 431 | 128 | – | 11,992 | 12,551 | ||||||||||||||||||||||||||||
– equity securities | – | 2 | 482 | – | 20,384 | 20,868 | ||||||||||||||||||||||||||||
– loans and advances to banks | – | – | – | – | 55 | 55 | ||||||||||||||||||||||||||||
– loans and advances to customers | – | – | – | – | 54 | 54 | ||||||||||||||||||||||||||||
Derivatives | – | – | – | 357,450 | – | 357,450 | ||||||||||||||||||||||||||||
Loans and advances to banks | 1,191 | 4,722 | 81,802 | 35,461 | 29,370 | 152,546 | ||||||||||||||||||||||||||||
Loans and advances to customers | 40,792 | 85,626 | 827,903 | 34,664 | 8,638 | 997,623 | ||||||||||||||||||||||||||||
Financial investments | 46,678 | 300,255 | 7,990 | – | 66,178 | 421,101 | ||||||||||||||||||||||||||||
– Treasury and other eligible bills | 2,024 | 84,991 | 156 | – | 379 | 87,550 | ||||||||||||||||||||||||||||
– debt securities | 44,654 | 214,545 | 4,112 | – | 64,451 | 327,762 | ||||||||||||||||||||||||||||
– equity securities | – | 719 | 3,722 | – | 1,348 | 5,789 | ||||||||||||||||||||||||||||
Assets held for sale | – | – | 19,269 | – | – | 19,269 | ||||||||||||||||||||||||||||
Other assets | 1,600 | 18,601 | 11,621 | – | 22,894 | 54,716 | ||||||||||||||||||||||||||||
Current tax assets | – | – | – | – | 515 | 515 | ||||||||||||||||||||||||||||
Prepayments and accrued income | – | – | – | – | 9,502 | 9,502 | ||||||||||||||||||||||||||||
Interest in associates and joint ventures | – | – | 17,480 | – | 354 | 17,834 | ||||||||||||||||||||||||||||
Goodwill and intangible assets | – | – | – | – | 29,853 | 29,853 | ||||||||||||||||||||||||||||
Property, plant and equipment | – | – | 6,772 | – | 3,816 | 10,588 | ||||||||||||||||||||||||||||
Deferred tax | – | – | – | – | 7,570 | 7,570 | ||||||||||||||||||||||||||||
| 233,280 | 666,009 | 983,997 | 562,327 | 246,925 | 2,692,538 | |||||||||||||||||||||||||||||
Cash collateral posted to satisfy margin requirements on derivatives, is reported as encumbered under trading assets within loans or advances to banks and loans and advances to customers.
The US$41bn of loans and advances to customers reported in the table above as encumbered have been pledged predominantly to support the issuance of secured debt instruments, such as covered bonds and ABSs including asset-backed commercial paper issued by consolidated multi-seller conduits. It also includes those pledged in relation to any other form of secured borrowing.
In total, the Group has pledged US$152bn of negotiable securities, predominantly as a result of market-making in securities financing to our clients.
Additional contractual obligations
Under the terms of our current collateral obligations under derivative contracts, we estimate based on the positions as at 31 December 2012 that HSBC could be required to post additional collateral of up to US$1.5bn (2011: US$3bn) in the event of a one notch downgrade in credit ratings, which would increase to US$2.5bn (2011: US$3.8bn) in the event of a two notch downgrade.
213
Table of Contents
HSBC HOLDINGS PLC
Report of the Directors: Operating and Financial Review(continued)
Definitions of the categories included in the table ‘Analysis of encumbered and unencumbered assets’:
| • | Encumbered assets are assets on our balance sheet which have been pledged as collateral against an existing liability, and as a result are assets which are unavailable to the bank to secure funding, satisfy collateral needs or be sold to reduce potential future funding requirements. |
| • | Unencumbered – readily realisable assets are assets regarded by the bank to be readily realisable in the normal course of business, to secure funding, meet collateral needs, or be sold to reduce potential future funding requirements, and are not subject to any restrictions on their use for these purposes. |
| • | Unencumbered – other realisable assets are assets where there are no restrictions on their use to secure funding, meet collateral needs, or be sold to reduce potential future funding requirements, but are not readily realisable in the normal course of business in their current form. |
| • | Unencumbered – reverse repo/stock borrow receivables and derivative assets are assets related specifically to reverse repo, stock borrowing and derivative transactions. These are shown separately as these on-balance sheet assets cannot be pledged, but often give rise to the receipt of non-cash assets which are not recognised on the balance sheet, and can additionally be used to raise secured funding, meet additional collateral requirements or be sold. |
| • | Unencumbered – cannot be pledged as collateral are assets that have not been pledged but which we have assessed could not be pledged and therefore could not be used to secure funding, meet collateral needs, or be sold to reduce potential future funding requirements, for example assets held by the Group’s insurance subsidiaries that back liabilities to policyholders and support the solvency of these entities. |
Historically, the Group has not recognised any contingent liquidity value for assets other than those assets defined under the LFRF as being liquid assets, and any other negotiable instruments that under stress are assumed to be realisable after three months, even though they may currently be realisable. This approach has generally been driven by our risk appetite not to place any reliance on central banks. In a few cases, we have recognised the contingent value of discrete pools of assets, but the amounts involved are insignificant. As a result, we have reported the majority of our loans and advances to customers and banks in the category ‘Other realisable assets’ as management would need to perform additional actions in order to make the assets transferable and readily realisable.
The amount of such assets reported in Note 36 on the Financial Statements may be greater than the book value of assets reported as being encumbered in the table on page 213. Examples of where such differences will occur are:
| • | ABSs and covered bonds where the amount of liabilities issued plus the required mandatory over-collateralisation is lower than the book value of assets pledged to the pool. Any difference is categorised in the table above as ‘Unencumbered – readily realisable assets;’ |
| • | negotiable securities held by custodians or settlement agents, where a floating charge has been given over the entire holding to secure intra-day settlement liabilities, are only reported as encumbered to the extent that we have a liability to the custodian or settlement agent at the reporting date, with the balance reported as ‘Unencumbered – readily realisable assets;’ and |
| • | assets pre-positioned with central banks or government agencies are only reported as encumbered to the extent that we have secured funding with the collateral. The unutilised pre-positioned collateral is reported as ‘Unencumbered – readily realisable assets.’ |
Contractual maturity of financial liabilities
(Audited)
The balances in the table below will not agree directly with those in our consolidated balance sheet as the table incorporates, on an undiscounted basis, all cash flows relating to principal and future coupon payments (except for trading liabilities and derivatives not treated as hedging derivatives). Undiscounted cash flows payable in relation to hedging derivative liabilities are classified according to their contractual maturities. Trading liabilities and derivatives not treated as hedging derivatives are included in the ‘On demand’ time bucket and not by contractual maturity. A maturity analysis of repos and debt securities in issue included in trading liabilities is presented on page 485.
In addition, loan and other credit-related commitments and financial guarantees and similar contracts are generally not recognised on our balance sheet. The undiscounted cash flows potentially payable under financial guarantees and similar contracts are classified on the basis of the earliest date they can be called.
214
Table of Contents
HSBC HOLDINGS PLC
Report of the Directors: Operating and Financial Review(continued)
Cash flows payable by HSBC under financial liabilities by remaining contractual maturities
(Audited)
On demand US$m | Due within 3 months US$m | Due between 3 and 12 months US$m | Due between 1 and 5 years US$m | Due after 5 years US$m | ||||||||||||||||||||||||
At 31 December 2012 | ||||||||||||||||||||||||||||
Deposits by banks | 45,290 | 51,321 | 4,495 | 11,718 | 789 | |||||||||||||||||||||||
Customer accounts | 1,035,636 | 229,642 | 62,650 | 17,508 | 720 | |||||||||||||||||||||||
Trading liabilities | 304,564 | – | – | – | – | |||||||||||||||||||||||
Financial liabilities designated at fair value | 7,778 | 1,211 | 7,825 | 42,683 | 62,279 | |||||||||||||||||||||||
Derivatives | 351,367 | 355 | 995 | 4,785 | 1,855 | |||||||||||||||||||||||
Debt securities in issue | 64 | 37,938 | 37,167 | 45,433 | 6,034 | |||||||||||||||||||||||
Subordinated liabilities | 7 | 386 | 1,149 | 9,058 | 46,322 | |||||||||||||||||||||||
Liabilities of disposal groups held for sale47 | 1,416 | 993 | 707 | 201 | 24 | |||||||||||||||||||||||
Other financial liabilities | 26,963 | 31,557 | 5,381 | 3,467 | 829 | |||||||||||||||||||||||
| 1,773,085 | 353,403 | 120,369 | 134,853 | 118,852 | ||||||||||||||||||||||||
Loan and other credit-related commitments | 375,818 | 76,394 | 51,330 | 57,506 | 18,421 | |||||||||||||||||||||||
Financial guarantees and similar contracts | 14,321 | 5,506 | 12,104 | 9,266 | 3,796 | |||||||||||||||||||||||
| 2,163,224 | 435,303 | 183,803 | 201,625 | 141,069 | ||||||||||||||||||||||||
At 31 December 2011 | ||||||||||||||||||||||||||||
Deposits by banks | 47,659 | 59,096 | 3,578 | 11,048 | 997 | |||||||||||||||||||||||
Customer accounts | 914,762 | 252,226 | 72,993 | 20,508 | 1,094 | |||||||||||||||||||||||
Trading liabilities | 265,192 | – | – | – | – | |||||||||||||||||||||||
Financial liabilities designated at fair value | 7,066 | 930 | 9,789 | 39,915 | 57,295 | |||||||||||||||||||||||
Derivatives | 340,394 | 394 | 497 | 2,858 | 1,007 | |||||||||||||||||||||||
Debt securities in issue | 117 | 48,465 | 27,520 | 57,507 | 7,019 | |||||||||||||||||||||||
Subordinated liabilities | 6 | 528 | 1,834 | 9,616 | 47,715 | |||||||||||||||||||||||
Liabilities of disposal groups held for sale47 | 3,108 | 1,721 | 1,045 | 211 | 150 | |||||||||||||||||||||||
Other financial liabilities | 25,452 | 28,137 | 5,845 | 2,023 | 1,377 | |||||||||||||||||||||||
| 1,603,756 | 391,497 | 123,101 | 143,686 | 116,654 | ||||||||||||||||||||||||
Loan and other credit-related commitments | 355,366 | 65,245 | 94,120 | 111,061 | 29,113 | |||||||||||||||||||||||
Financial guarantees and similar contracts | 12,460 | 7,585 | 12,107 | 5,899 | 1,273 | |||||||||||||||||||||||
| 1,971,582 | 464,327 | 229,328 | 260,646 | 147,040 | ||||||||||||||||||||||||
For footnote, see page 249.
(Audited)
During 2012, HSBC Holdings issued US$2.0bn of senior debt (2011: US$5.3bn). The eligibility requirements for non-equity instruments under Basel III rules have not been clearly defined in the UK, so HSBC Holdings issued no debt instruments which qualified as capital in 2012 (2011: nil).
The balances in the table below will not agree directly with those on the balance sheet of HSBC Holdings as the table incorporates, on an undiscounted basis, all cash flows relating to principal and future coupon payments (except for
derivatives not treated as hedging derivatives). Undiscounted cash flows payable in relation to hedging derivative liabilities are classified according to their contractual maturities. Derivatives not treated as hedging derivatives are included in the ‘On demand’ time bucket.
In addition, loan commitments and financial guarantees and similar contracts are generally not recognised on our balance sheet. The undiscounted cash flows potentially payable under financial guarantees and similar contracts are classified on the basis of the earliest date they can be called.
215
Table of Contents
HSBC HOLDINGS PLC
Report of the Directors: Operating and Financial Review(continued)
Cash flows payable by HSBC Holdings under financial liabilities by remaining contractual maturities
(Audited)
On demand | Due within 3 months | Due between 3 and 12 months | Due between 1 and 5 years | Due after 5 years | ||||||||||||||||||||||||
| US$m | US$m | US$m | US$m | US$m | ||||||||||||||||||||||||
At 31 December 2012 | ||||||||||||||||||||||||||||
Amounts owed to HSBC undertakings | 3,032 | 604 | 1,096 | 1,918 | 7,570 | |||||||||||||||||||||||
Financial liabilities designated at fair value | – | 269 | 807 | 5,345 | 31,970 | |||||||||||||||||||||||
Derivatives | 760 | – | – | – | – | |||||||||||||||||||||||
Debt securities in issue | – | 36 | 107 | 1,946 | 1,487 | |||||||||||||||||||||||
Subordinated liabilities | – | 205 | 614 | 3,273 | 25,049 | |||||||||||||||||||||||
Other financial liabilities | – | 394 | 211 | – | – | |||||||||||||||||||||||
| 3,792 | 1,508 | 2,835 | 12,482 | 66,076 | ||||||||||||||||||||||||
Loan commitments | 1,200 | – | – | – | – | |||||||||||||||||||||||
Financial guarantees and similar contracts | 49,402 | – | – | – | – | |||||||||||||||||||||||
| 54,394 | 1,508 | 2,835 | 12,482 | 66,076 | ||||||||||||||||||||||||
At 31 December 2011 | ||||||||||||||||||||||||||||
Amounts owed to HSBC undertakings | – | 1,110 | 81 | 1,428 | – | |||||||||||||||||||||||
Financial liabilities designated at fair value | – | 281 | 3,530 | 4,987 | 28,988 | |||||||||||||||||||||||
Derivatives | 1,067 | – | – | – | – | |||||||||||||||||||||||
Debt securities in issue | – | 35 | 104 | 1,975 | 1,490 | |||||||||||||||||||||||
Subordinated liabilities | – | 216 | 649 | 3,461 | 27,558 | |||||||||||||||||||||||
Other financial liabilities | – | 1,252 | 208 | – | – | |||||||||||||||||||||||
| 1,067 | 2,894 | 4,572 | 11,851 | 58,036 | ||||||||||||||||||||||||
Loan commitments | 1,810 | – | – | – | – | |||||||||||||||||||||||
Financial guarantees and similar contracts | 49,402 | – | – | – | – | |||||||||||||||||||||||
| 52,279 | 2,894 | 4,572 | 11,851 | 58,036 | ||||||||||||||||||||||||
(Unaudited)
In December 2010, the Basel Committee published the ‘International framework for liquidity risk measurement, standards and monitoring’. The framework comprises two liquidity metrics: the liquidity coverage ratio (‘LCR’) and the net stable funding ratio (‘NSFR’). The ratios are subject to an observation period that began in 2011, and are expected to become established standards by 2015 and 2018, respectively. During the observation period, the standards are under review by the Basel Committee. In January 2013, the Basel Committee announced several changes to the calibration of the LCR which
included reducing the outflow applied to non-operational non-financial corporate deposits from 75% to 40% and reducing the outflow applied to committed liquidity facilities from 100% to 30%.
A significant level of interpretation is required applying the definitions as currently drafted, in particular, the definition of operational deposits. Uncertainty around LCR also arises from the fact that the implementation of the Basel LCR framework still requires EU endorsement. In addition, the final calibration of the NSFR is highly uncertain and is expected to remain so, with no announcement on this expected from the Basel Committee until 2014.
216
Table of Contents
HSBC HOLDINGS PLC
Report of the Directors: Operating and Financial Review(continued)
| Page | App1 | Tables | Page | |||||||||||
| 218 | ||||||||||||||
| 265 | ||||||||||||||
| 265 | ||||||||||||||
| 266 | ||||||||||||||
| 266 | ||||||||||||||
| 267 | ||||||||||||||
| 218 | 218 | |||||||||||||
| 218 | ||||||||||||||
| 219 | ||||||||||||||
| 218 | ||||||||||||||
| 219 | 219 | |||||||||||||
| 219 | ||||||||||||||
| 220 | 268 | |||||||||||||
| 220 | 220 | |||||||||||||
| 220 | ||||||||||||||
| 220 | ||||||||||||||
Daily distribution of Global Markets’ trading and other trading revenues | 220 | |||||||||||||
| 220 | ||||||||||||||
| 221 | ||||||||||||||
| 221 | ||||||||||||||
| 268 | ||||||||||||||
| 268 | ||||||||||||||
| 221 | 268 | |||||||||||||
| 221 | 221 | |||||||||||||
| 221 | ||||||||||||||
| 221 | 268 | |||||||||||||
| 222 | 222 | |||||||||||||
| 222 | 268 | |||||||||||||
| 222 | ||||||||||||||
| 222 | 223 | |||||||||||||
| 223 | 269 | 223 | ||||||||||||
| 224 | ||||||||||||||
| 224 | 269 | 224 | ||||||||||||
Additional market risk measures applicable only to the parent company | 224 | 270 | ||||||||||||
| 225 | 225 | |||||||||||||
| 225 | Sensitivity of HSBC Holdings net interest income to interest rate movements | 225 | ||||||||||||
| 226 | 226 | |||||||||||||
| 1Appendix to Risk – risk policies and practices. | ||||||||||||||
217
Table of Contents
HSBC HOLDINGS PLC
Report of the Directors: Operating and Financial Review(continued)
Market risk is the risk that movements in market factors, including foreign exchange rates and commodity prices, interest rates, credit spreads and equity prices, will reduce our income or the value of our portfolios.
There were no material changes to our policies and practices for the management of market risk in 2012.
| A summary of our current policies and practices regarding market risk is provided in the Appendix to Risk on page 265. |
Exposure to market risk
Exposure to market risk is separated into two portfolios:
| • | Trading portfolios comprise positions arising from market-making and warehousing of customer-derived positions. |
| • | Non-trading portfolioscomprise positions that primarily arise from the interest rate management of our retail and commercial banking assets and liabilities, financial investments designated as available for sale and held to maturity, and exposures arising from our insurance operations (see page 239). |
Monitoring and limiting market risk exposures
Our objective is to manage and control market risk exposures while maintaining a market profile consistent with our risk appetite.
We use a range of tools to monitor and limit market risk exposures, including:
| • | sensitivity measures include sensitivity of net interest income and sensitivity for structural foreign exchange, which are used to monitor the market risk positions within each risk type; |
| • | value at risk(‘VAR’) is a technique that estimates the potential losses that could occur on risk positions as a result of movements in market rates and prices over a specified time horizon and to a given level of confidence; and |
| • | in recognition of VAR’s limitations we augment VAR withstress testing to evaluate the potential impact on portfolio values of more extreme, though plausible, events or movements in a set of financial variables. Examples of scenarios reflecting current market concerns are the slowdown of mainland China and the potential effects of a sovereign debt default, including its wider contagion effects. |
(Audited)
Some credit spread and interest rate exposures to sovereign borrowers were managed down during 2012 against the backdrop of continued concerns around eurozone sovereigns and financial institutions, the global economic slowdown and uncertainty about fiscal policy in the US. The second half of the year was characterised by
improved market sentiment, primarily because the ECB pledged to support the euro. This led to a more benign market environment and generally subdued volatilities of credit spreads and other market risk factors.
Trading and non-trading portfolios
(Audited)
The following tables provide an overview of the types of risks within the different global businesses.
Types of risk by global business
Risk types
| Global businesses
| |
Trading risk | GB&M including Balance | |
– Foreign exchange and commodities | Sheet Management (‘BSM’) | |
– Interest rate | ||
– Equities | ||
– Credit spread
| ||
Non-trading risk | GB&M including BSM, | |
– Foreign exchange (structural) | RBWM, CMB and GPB | |
– Interest rate | ||
– Credit spread | ||
The market risk for insurance operations is reported separately on page 239.
Market risk reporting measures
The following table provides an overview of the reporting of risks within this section:
| Portfolio | ||||||||
| Trading | Non-trading | |||||||
Risk type | ||||||||
Foreign exchange and commodity | VAR | VAR | ||||||
Interest rate | VAR | | VAR/ Sensitivity | | ||||
Equity | VAR | Sensitivity | ||||||
Credit spread | VAR | VAR | ||||||
Structural foreign exchange | n/a | Sensitivity | ||||||
Structural foreign exchange risk is monitored using sensitivity analysis (see page 268). The reporting of commodity risk is consolidated with foreign exchange risk. There is no commodity risk in the non-trading portfolios. The interest rate risk on the fixed-rate securities issued by HSBC Holdings is not included in the Group VAR. The management of this risk is described on page 270.
218
Table of Contents
HSBC HOLDINGS PLC
Report of the Directors: Operating and Financial Review(continued)
Market risk linkages to the accounting balance sheet
Trading assets and liabilities
The Group’s trading assets and liabilities are in substantially all cases originated by GB&M. As described on page 393, the assets and liabilities are classified as held for trading if they have been acquired or incurred principally for the purpose of selling or repurchasing in the near term, or form part of a portfolio of identified financial instruments that are managed together and for which there is evidence of a recent pattern of short-term profit-taking. These assets and liabilities are treated as traded risk for the purposes of market risk management, other than a limited number of exceptions, primarily in Global Banking where the short-term acquisition and disposal of the assets are linked to other non-trading related activities such as loan origination.
Financial assets designated at fair value
Financial assets designated at fair value within HSBC are predominantly held within the Insurance entities. The majority of these assets are linked to policyholder liabilities for either unit-linked or insurance and investment contracts with DPF. Further information in respect of these assets is given on page 393. The risks of these assets largely offset the market risk on the liabilities under the policyholder contracts, and are risk managed on a non-trading basis. Market risk for insurance operations is covered on page 239.
Financial liabilities designated at fair value
Financial liabilities designated at fair value within HSBC are primarily fixed-rate securities issued by HSBC entities for funding purposes. As described on page 393, an accounting mismatch would arise if the debt securities were accounted for at amortised cost because the derivatives which economically hedge market risks on the securities would be accounted for at fair value with changes recognised in the income statement. The market risks of these liabilities are treated as non-traded risk, the principal risks being interest rate and/or foreign exchange risks. We also incur liabilities to customers under investment contracts, where the liabilities on unit-linked contracts are based on the fair value of assets within the unit-linked funds. The exposures on these funds are treated as non-traded risk and the principal risks are those of the underlying assets in the funds.
Derivative assets and liabilities
As described in Note 19 on the Financial Statements HSBC undertakes derivative activity for three primary purposes; to | create risk management solutions for clients, to manage the portfolio risks arising from client business and to manage and hedge HSBC’s own risks. Most of HSBC’s derivative exposures arise from sales and trading activities within GB&M and are treated as traded risk for market risk management purposes.
Within derivative assets and liabilities there are portfolios of derivatives which are not risk managed on a trading intent basis and are treated as non-traded risk for VAR measurement purposes. These arise when the derivative was entered into in order to manage risk arising from non-traded exposures. These include non-qualifying hedging derivatives, and derivatives qualifying for fair value and cash flow hedge accounting. The use of non-qualifying hedges whose primary risks relate to interest rate and foreign exchange exposure is described on page 397. Details of derivatives in fair value and cash flow hedge accounting relationships are given in Note 19 on the Financial Statements. HSBC’s primary risks in respect of these instruments relate to interest rate and foreign exchange risks.
Loans and advances to customers
The primary risk on assets within loans and advances to customers is the credit risk of the borrower. The risk of these assets is treated as non-trading risk for market risk management purposes.
Financial investments
Financial investments include assets held on an available-for-sale and held-to-maturity basis. An analysis of the Group’s holdings of these securities by accounting classification and issuer type is shown on page 457 and by business activity on page 20. The majority of these securities are mainly held within Balance Sheet Management in GB&M. The positions which are originated in order to manage structural interest rate and liquidity risk are treated as non-trading risk for the purposes of market risk management. Available-for-sale security holdings within insurance entities are treated as non-trading risk and are largely held to back non-linked insurance policyholder liabilities. Market risk for insurance operations is covered on page 239.
The other main holdings of available-for-sale assets are the ABSs within GB&M’s legacy credit business, which are treated as non-trading risk for market risk management purposes, the principal risk being the credit risk of the obligor.
The Group’s held-to-maturity securities are principally held within the Insurance business. Risks of held-to-maturity assets are treated as non-trading for risk management purposes.
|
Value at risk of the trading and non-trading portfolios
Our Group VAR, both trading and non-trading, was as tabulated below. For a description of HSBC’s fair value and price verification controls, see page 438.
Trading and non-trading value at risk
(Audited)
2012 US$m | 2011 US$m | |||||||
At 31 December | 181.3 | 367.0 | ||||||
Average | 244.4 | 301.6 | ||||||
Minimum | 163.8 | 231.5 | ||||||
Maximum | 383.9 | 404.3 | ||||||
Daily trading and non-trading VAR (US$m)
(Unaudited)
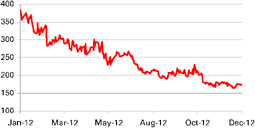
The decrease of Group trading and non-trading VAR during 2012 was driven primarily by the reduced effect of credit spreads, as a result of subdued volatilities and lower credit spread baselines utilised in the VAR calculations.
219
Table of Contents
HSBC HOLDINGS PLC
Report of the Directors: Operating and Financial Review(continued)
| | For a description of the parameters used in calculating VAR, see the ‘Appendix to Risk’ on page 266. |
(Audited)
Value at risk of the trading portfolios
Our Group trading VAR was as shown below:
2012 US$m | 2011 US$m | |||||||
At 31 December | 78.8 | 118.3 | ||||||
Average | 74.2 | 101.8 | ||||||
Minimum | 47.3 | 62.2 | ||||||
Maximum | 130.9 | 143.9 | ||||||
Almost all trading VAR resides within Global Markets. The VAR for trading activity at 31 December 2012 was lower than at 31 December 2011 due primarily to the reduced contribution of credit spread exposures to sovereigns. This reduction was driven by positions being managed down, together with the lower credit spread volatilities and baselines in the VAR calculations.
We routinely validate the accuracy of our VAR models by back-testing the actual daily profit and loss results, adjusted to remove non-modelled items such as fees and commissions, against the corresponding VAR numbers. We expect on average to see losses in excess of VAR 1% of the time over a one-year period. The actual number of losses in excess of VAR over this period can therefore be used to gauge how well the models are performing. In 2012, there were no exceptions at the Group level.
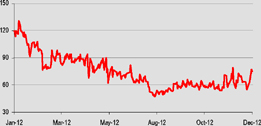
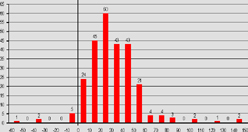
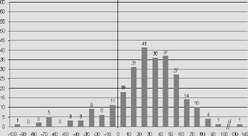
For footnotes, see page 249.
VAR by risk type for trading activities50
(Audited)
Foreign exchange and commodity | Interest rate | Equity | Credit spread | Portfolio diversification51 | Total52 | |||||||||||||||||||
| US$m | US$m | US$m | US$m | US$m | US$m | |||||||||||||||||||
At 31 December 2012 | 20.5 | 37.5 | 17.7 | 16.1 | (12.9 | ) | 78.8 | |||||||||||||||||
Average | 23.5 | 42.7 | 9.3 | 26.8 | (28.1 | ) | 74.2 | |||||||||||||||||
Minimum | 6.9 | 29.5 | 2.7 | 12.2 | – | 47.3 | ||||||||||||||||||
Maximum | 46.0 | 60.0 | 24.9 | 77.9 | – | 130.9 | ||||||||||||||||||
220
Table of Contents
HSBC HOLDINGS PLC
Report of the Directors: Operating and Financial Review(continued)
Foreign exchange and commodity | Interest rate | Equity | Credit spread | Portfolio diversification51 | Total52 | |||||||||||||||||||
| US$m | US$m | US$m | US$m | US$m | US$m | |||||||||||||||||||
At 31 December 2011 | 18.6 | 49.4 | 7.4 | 75.2 | (32.3 | ) | 118.3 | |||||||||||||||||
Average | 16.8 | 54.2 | 8.0 | 57.3 | (34.4 | ) | 101.8 | |||||||||||||||||
Minimum | 7.6 | 30.1 | 2.5 | 34.7 | – | 62.2 | ||||||||||||||||||
Maximum | 31.9 | 80.2 | 17.2 | 103.2 | – | 143.9 | ||||||||||||||||||
For footnotes, see page 249.
Stressed value at risk of the trading portfolios
(Unaudited)
Stressed VAR is primarily used for regulatory capital purposes but is integrated into the risk management process to facilitate efficient capital management and to highlight potentially risky positions based on previous market volatility.
Our Group stressed VAR for trading portfolios was as follows:
Stressed value at risk (1-day equivalent)
(Unaudited)
| 2012 | 2011 | |||||||
| US$m | US$m | |||||||
At 31 December | 172.4 | 293.6 | ||||||
Stressed VAR for trading portfolios reduced primarily as a result of the de-risking of exposures to eurozone sovereigns and managing down of interest rate risks, together with the impact of lower credit spread levels on the VAR calculation.
(Audited)
Value at risk of the non-trading portfolios
| 2012 | 2011 | |||||||
| US$m | US$m | |||||||
At 31 December | 119.2 | 310.9 | ||||||
Average | 197.9 | 244.2 | ||||||
Minimum | 118.1 | 182.2 | ||||||
Maximum | 322.5 | 354.8 | ||||||
The daily levels of non-trading VAR over the course of 2012 are set out in the graph below.
Daily VAR (non-trading portfolios) (US$m)
(Unaudited)
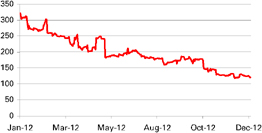
Most of the Group non-trading VAR relates to Balance Sheet Management (‘BSM’) or local treasury management functions. Contributions to Group non-trading VAR are driven by interest rates and credit spread risks arising from all global businesses as illustrated on page 265). The decrease of non-trading VAR during 2012 was due primarily to the reduced contribution of credit spread risks as a result of lower volatilities and credit spread baselines utilised in the VAR calculations. This movement includes the reduction in credit spread risks relating to the Group’s holdings of available for sale debt securities (excluding those held in insurance operations), which is discussed further in the following section.
Non-trading VAR also includes the interest rate risk of non-trading financial instruments held by the global businesses and transferred into portfolios managed by Global Markets or local treasury functions. In measuring, monitoring and managing risk in our non-trading portfolios, VAR is just one of the tools used. The management of interest rate risk in the banking book is described further in ‘Non-trading interest rate risk’ below, including the role of Balance Sheet Management.
Non-trading VAR excludes equity risk on available for sale securities, structural foreign exchange risk, and interest rate risk on fixed rate securities issued by HSBC Holdings, the management of which is described in the relevant sections below. These sections together describe the scope of HSBC’s management of market risks in non-trading books.
Credit spread risk for available-for-sale debt securities
Credit spread VAR for available-for-sale debt securities, excluding those held in insurance operations, is included in the Group non-trading VAR.
At 31 December 2012, the sensitivity of equity capital to the effect of movements in credit spreads on our available-for-sale debt securities, including the gross exposure for the SICs consolidated within our balance sheet, based on credit spread VAR, was US$150m (2011: US$389m). This sensitivity was
221
Table of Contents
HSBC HOLDINGS PLC
Report of the Directors: Operating and Financial Review(continued)
calculated before taking into account losses which would have been absorbed by the capital note holders. Excluding the gross exposure for SICs consolidated in our balance sheet, this exposure reduced to US$119m (2011: US$325m).
The decrease in this sensitivity at 31 December 2012 compared with 31 December 2011 was due mainly to the effect of the lower volatility in credit spreads observed during 2012.
At 31 December 2012, the capital note holders would absorb the first US$2.3bn (2011: US$2.3bn) of any losses incurred by the SICs before we incur any equity losses.
Equity securities classified as available for sale
Fair value of equity securities
(Audited)
| 2012 | 2011 | |||||||||
| US$bn | US$bn | |||||||||
Private equity holdings53 | 2.9 | 3.0 | ||||||||
Funds invested for short-term cash management | 0.2 | 0.2 | ||||||||
Investment to facilitate ongoing business54 | 1.1 | 1.1 | ||||||||
Other strategic investments | 1.6 | 2.9 | ||||||||
| 5.8 | 7.2 | |||||||||
For footnotes, see page 249.
The fair value of the constituents of equity securities classified as available for sale can fluctuate considerably. The table above sets out maximum possible loss on shareholder’s equity from available-for-sale equity securities.
For details of the impairment incurred on available-for-sale equity securities, see ‘Securitisation exposures and other structured products’ on page 184.
Structural foreign exchange exposures
(Unaudited)
Our policies and procedures for managing structural foreign exchange exposures are described on page 268. For details of structural foreign exchange exposures see Note 35 on the Financial Statements.
Non-trading interest rate risk
(Unaudited)
Asset, Liability and Capital Management (‘ALCM’) is responsible for measuring and controlling non-trading interest rate risk under the supervision of the Risk Management Meeting (‘RMM’). Its primary responsibilities are:
| • | to define the rules governing the transfer of interest rate risk from the global businesses to BSM; |
| • | to ensure that all market interest rate risk that can be hedged is transferred from the global businesses to BSM; and |
| • | to define the rules and metrics for monitoring the residual interest rate risk in the global businesses. |
The different types of non-trading interest rate risk and the controls which we use to quantify and limit exposure to these risks can be categorised as follows:
| • | risk which is transferred to BSM and managed by BSM within a defined risk mandate (see below); |
| • | risk which remains outside BSM because it cannot be hedged or which arises due to our behaviouralised transfer pricing assumptions. This risk is captured by our net interest income or Economic Value of Equity (‘EVE’) sensitivity and corresponding limits are part of our global and regional risk appetite statements for non-trading interest rate risk. A typical example would be margin compression created by unusually low rates in key currencies; |
| • | basis risk which is transferred to BSM when it can be hedged. Any residual basis risk remaining in the global businesses is reported to ALCO. A typical example would be a managed rate savings product transfer-priced using a Libor-based interest rate curve; and |
| • | model risks which cannot be captured by net interest income or EVE sensitivity, but are controlled by our stress testing framework. A typical example would be prepayment risk on residential mortgages or pipeline risk. |
(Unaudited)
Effective governance across BSM is supported by the dual reporting lines it has to the CEO of GB&M and to the Group Treasurer. In each operating entity, BSM is responsible for managing liquidity and funding under the supervision of the local ALCO. It also manages the non-trading interest rate positions transferred to it within a Global Markets limit structure.
BSM reinvests excess liquidity into highly rated liquid assets. The majority of the liquidity is invested in central bank deposits and government, supranational and agency securities with most of
222
Table of Contents
HSBC HOLDINGS PLC
Report of the Directors: Operating and Financial Review(continued)
the remainder held in short-term interbank and central bank loans.
Analysis of third party assets in Balance Sheet Management
(Unaudited)
At 31 December | ||||
| US$m | ||||
Cash and balances at central banks | 93,946 | |||
Trading assets | 8,724 | |||
Financial assets designated at fair value | 74 | |||
Loans and advances: | ||||
– to banks | 72,771 | |||
– to customers | 22,052 | |||
Financial investments | 293,421 | |||
Other | 2,948 | |||
| 493,936 | ||||
Central bank deposits are accounted for as cash balances. Interbank loans and loans to central banks are accounted for as loans and advances to banks. BSM’s holdings of securities are accounted for as available-for-sale or to a lesser extent, held to maturity assets.
BSM is permitted to use derivatives as part of its mandate to manage interest rate risk. Derivative activity is predominantly through the use of vanilla interest rate swaps which are part of cash flow hedging and fair value hedging relationships.
Credit risk in BSM is predominantly limited to short-term bank exposure created by interbank lending and exposure to central banks as well as high quality sovereigns, supranationals or agencies which constitute the majority of BSM’s liquidity portfolio.
BSM does not manage the structural credit risk of any Group entity balance sheets.
BSM is permitted to enter into single name and index credit derivatives activity, but it does so to manage credit risk on the exposure specific to its securities portfolio in limited circumstances only. The risk limits are extremely limited and closely monitored. At 31 December 2012 and 31 December 2011 BSM had no open credit derivative index risk.
VAR is calculated on both trading and non-trading positions held in BSM. It is calculated by applying the same methodology used for the Global Markets business and utilised as a tool for market risk control purposes.
BSM holds trading portfolio instruments in only very limited circumstances. Positions and the associated VAR were not significant during 2012 and 2011.
Sensitivity of net interest income
(Unaudited)
The table below sets out the effect on our future net interest income of an incremental 25 basis points parallel rise or fall in all yield curves worldwide at the beginning of each quarter during the 12 months from 1 January 2013. Assuming no management actions, a sequence of such rises would increase planned net interest income for 2013 by US$1,391m (2012: US$1,571m), while a sequence of such falls would decrease planned net interest income by US$1,471m (2012: US$1,909m). These figures incorporate the effect of any option features in the underlying exposures.
Sensitivity of projected net interest income55
(Unaudited)
US dollar bloc US$m | Rest of Americas bloc US$m | Hong Kong dollar bloc US$m | Rest of Asia bloc US$m | Sterling bloc US$m | Euro bloc US$m | Total US$m | ||||||||||||||||||||||
Change in 2013 projected net interest income arising from a shift in yield curves of: | ||||||||||||||||||||||||||||
+25 basis points at the beginning of each quarter | 133 | 64 | 246 | 237 | 679 | 44 | 1,403 | |||||||||||||||||||||
–25 basis points at the beginning of each quarter | (366 | ) | (52 | ) | (305 | ) | (168 | ) | (602 | ) | (57 | ) | (1,550 | ) | ||||||||||||||
Change in 2012 projected net interest income arising from a shift in yield curves of: | ||||||||||||||||||||||||||||
+25 basis points at the beginning of each quarter | 209 | 62 | 263 | 232 | 729 | 76 | 1,571 | |||||||||||||||||||||
–25 basis points at the beginning of each quarter | (465 | ) | (59 | ) | (443 | ) | (166 | ) | (708 | ) | (68 | ) | (1,909 | ) | ||||||||||||||
For footnote, see page 249.
223
Table of Contents
HSBC HOLDINGS PLC
Report of the Directors: Operating and Financial Review(continued)
The interest rate sensitivities set out above are illustrative only and are based on simplified scenarios. The limitations of this analysis are discussed in the Appendix to Risk on page 269.
The year-on-year change in the sensitivity of the Group’s net interest income to the change in rates shown in the table above is largely driven by lower implied yield curves, reducing the capacity to shock interest rates down. Net interest income and its associated sensitivity as reflected in the table above include the expense of internally funding trading
assets, while related revenue is reported in ‘Net trading income’.
We monitor the sensitivity of reported reserves to interest rate movements on a monthly basis by assessing the expected reduction in valuation of available-for-sale portfolios and cash flow hedges due to parallel movements of plus or minus 100bps in all yield curves. The table below describes the sensitivity of our reported reserves to these movements and the maximum and minimum month-end figures during the year:
Sensitivity of reported reserves to interest rate movements
(Unaudited)
| US$m | Maximum impact | Minimum impact US$m | ||||||||||
At 31 December 2012 | ||||||||||||
+ 100 basis point parallel move in all yield curves | (5,602 | ) | (5,748 | ) | (5,166 | ) | ||||||
As a percentage of total shareholders’ equity | (3.2% | ) | (3.3% | ) | (2.9 | )%) | ||||||
– 100 basis point parallel move in all yield curves | 4,996 | 5,418 | 4,734 | |||||||||
As a percentage of total shareholders’ equity | 2.9% | 3.1% | 2.7% | |||||||||
At 31 December 2011 | ||||||||||||
+ 100 basis point parallel move in all yield curves | (5,594 | ) | (6,178 | ) | (5,594 | ) | ||||||
As a percentage of total shareholders’ equity | (3.5% | ) | (3.9% | ) | (3.5% | ) | ||||||
– 100 basis point parallel move in all yield curves | 5,397 | 6,411 | 5,397 | |||||||||
As a percentage of total shareholders’ equity | 3.4% | 4.0% | 3.4% | |||||||||
The sensitivities above are illustrative only and are based on simplified scenarios. The table shows the potential sensitivity of reported reserves to valuation changes in available-for-sale portfolios and from cash flow hedges following the specified shifts in yield curves. These particular exposures form only a part of our overall interest rate exposures. The accounting treatment of our remaining interest rate exposures, while economically largely offsetting the exposures shown in the above table, does not require revaluation movements to go to reserves.
Defined benefit pension schemes
(Audited)
Market risk arises within our defined benefit pension schemes to the extent that the obligations of the schemes are not fully matched by assets with determinable cash flows.
HSBC’s defined benefit pension schemes
(Audited)
| 2012 | 2011 | |||||||||
| US$bn | US$bn | |||||||||
Liabilities (present value) | 38.1 | 35.0 | ||||||||
| % | % | |||||||||
Assets: | ||||||||||
Equities | 18 | 15 | ||||||||
Debt securities | 71 | 73 | ||||||||
Other (including property) | 11 | 12 | ||||||||
| 100 | 100 | |||||||||
For details of our defined benefit schemes, see Note 7 on the Financial Statements, and for pension risk management, see page 269.
Additional market risk measures applicable only to the parent company
(Audited)
The principal tools used in the management of market risk are VAR for foreign exchange rate risk, and the projected sensitivity of HSBC Holdings’ net interest income to future changes in yield curves and interest rate gap re-pricing tables for interest rate risk.
224
Table of Contents
HSBC HOLDINGS PLC
Report of the Directors: Operating and Financial Review(continued)
Total foreign exchange VAR arising within HSBC Holdings in 2012 was as follows:
HSBC Holdings – foreign exchange VAR
(Audited)
2012 US$m | 2011 US$m | |||||||
At 31 December | 69.9 | 47.7 | ||||||
Average | 51.4 | 43.3 | ||||||
Minimum | 39.2 | 38.2 | ||||||
Maximum | 69.9 | 48.3 | ||||||
The foreign exchange risk largely arises from loans to subsidiaries of a capital nature that are not denominated in the functional currency of either the provider or the recipient and which are accounted for as financial assets. Changes in the carrying amount of these loans due to foreign exchange rate differences are taken directly to HSBC Holdings’ income statement. These loans, and most of the associated foreign exchange exposures, are eliminated on a Group consolidated basis.
Sensitivity of net interest income
(Audited)
HSBC Holdings monitors net interest income sensitivity over a 5-year time horizon reflecting the longer-term perspective on interest rate risk management appropriate to a financial services holding company. The table below sets out the effect on HSBC Holdings’ future net interest income over a 5-year time horizon of incremental 25 basis point parallel falls or rises in all yield curves worldwide at the beginning of each quarter during the 12 months from 1 January 2013.
Assuming no management actions, a sequence of such rises would increase planned net interest income for the next five years by US$532m (2011: decrease of US$269m), while a sequence of such falls would decrease planned net interest income by US$329m (2011: increase of US$248m). These figures incorporate the effect of any option features in the underlying exposures.
Sensitivity of HSBC Holdings’ net interest income to interest rate movements55
(Audited)
US dollar bloc | Sterling bloc | Euro bloc | Total | |||||||||||||
| US$m | US$m | US$m | US$m | |||||||||||||
Change in projected net interest income as at 31 December arising from a shift in yield curves | ||||||||||||||||
2012 | ||||||||||||||||
of + 25 basis points at the beginning of each quarter | ||||||||||||||||
0-1 year | 83 | (23 | ) | 4 | 64 | |||||||||||
2-3 years | 303 | (108 | ) | 37 | 232 | |||||||||||
4-5 years | 319 | (120 | ) | 37 | 236 | |||||||||||
of – 25 basis points at the beginning of each quarter | ||||||||||||||||
0-1 year | (34 | ) | 21 | (2 | ) | (15 | ) | |||||||||
2-3 years | (139 | ) | 65 | (17 | ) | (91 | ) | |||||||||
4-5 years | (306 | ) | 118 | (35 | ) | (223 | ) | |||||||||
Change in projected net interest income as at 31 December arising from a shift in yield curves | ||||||||||||||||
2011 | ||||||||||||||||
of + 25 basis points at the beginning of each quarter | ||||||||||||||||
0-1 year | (13 | ) | 11 | 4 | 2 | |||||||||||
2-3 years | (161 | ) | 33 | 33 | (95 | ) | ||||||||||
4-5 years | (244 | ) | 21 | 47 | (176 | ) | ||||||||||
of – 25 basis points at the beginning of each quarter | ||||||||||||||||
0-1 year | 14 | (11 | ) | (4 | ) | (1 | ) | |||||||||
2-3 years | 127 | (27 | ) | (27 | ) | 73 | ||||||||||
4-5 years | 244 | (21 | ) | (47 | ) | 176 | ||||||||||
For footnote, see page 249.
The interest rate sensitivities tabulated above are illustrative only and are based on simplified scenarios. The figures represent hypothetical movements in net interest income based on our projected yield curve scenarios, HSBC Holdings’ current interest rate risk profile and assumed changes to that profile during the next five years. The main driver of the change in the US dollar projected net
interest income sensitivity was a change in the assumptions for projected capital funding. The change to the GBP projected net interest income sensitivity was caused by changes in the composition of HSBC Holdings’ investments. Changes to assumptions concerning the risk profile over the next five years can have a significant impact on the net interest income sensitivity for that period. However, the figures do not
225
Table of Contents
HSBC HOLDINGS PLC
Report of the Directors: Operating and Financial Review(continued)
take into account the effect of actions that could be taken to mitigate this interest rate risk.
Interest rate repricing gap table
The interest rate risk on the fixed-rate securities
issued by HSBC Holdings is not included within the Group VAR but is managed on a repricing gap basis. The interest rate repricing gap table below analyses the full-term structure of interest rate mismatches within HSBC Holdings’ balance sheet.
Repricing gap analysis of HSBC Holdings
(Audited)
| Total | Up to 1 year | Between 1 and 5 years | Between 5 and 10 years | More than 10 years | Non-interest bearing | |||||||||||||||||||||||||||||
| US$m | US$m | US$m | US$m | US$m | US$m | |||||||||||||||||||||||||||||
At 31 December 2012 | ||||||||||||||||||||||||||||||||||
Cash at bank and in hand: | ||||||||||||||||||||||||||||||||||
– balances with HSBC undertakings | 353 | 312 | – | – | – | 41 | ||||||||||||||||||||||||||||
Derivatives | 3,768 | – | – | – | – | 3,768 | ||||||||||||||||||||||||||||
Loans and advances to HSBC undertakings | 41,675 | 38,473 | – | 1,477 | 630 | 1,095 | ||||||||||||||||||||||||||||
Financial investments | 1,208 | – | 300 | 731 | – | 177 | ||||||||||||||||||||||||||||
Investments in subsidiaries | 92,234 | – | – | – | – | 92,234 | ||||||||||||||||||||||||||||
Other assets | 246 | – | – | – | – | 246 | ||||||||||||||||||||||||||||
Total assets | 139,484 | 38,785 | 300 | 2,208 | 630 | 97,561 | ||||||||||||||||||||||||||||
Amounts owed to HSBC undertakings | (12,856 | ) | (12,259 | ) | – | – | – | (597 | ) | |||||||||||||||||||||||||
Financial liabilities designated at fair values | (23,195 | ) | (1,654 | ) | (6,334 | ) | (7,708 | ) | (4,301 | ) | (3,198 | ) | ||||||||||||||||||||||
Derivatives | (760 | ) | – | – | – | – | (760 | ) | ||||||||||||||||||||||||||
Debt securities in issue | (2,691 | ) | – | (1,648 | ) | – | (1,051 | ) | 8 | |||||||||||||||||||||||||
Other liabilities | (1,048 | ) | – | – | – | – | (1,048 | ) | ||||||||||||||||||||||||||
Subordinated liabilities | (11,907 | ) | – | (808 | ) | (2,110 | ) | (8,828 | ) | (161 | ) | |||||||||||||||||||||||
Total equity | (87,027 | ) | – | – | – | – | (87,027 | ) | ||||||||||||||||||||||||||
Total liabilities and equity | (139,484 | ) | (13,913 | ) | (8,790 | ) | (9,818 | ) | (14,180 | ) | (92,783 | ) | ||||||||||||||||||||||
Off-balance sheet items attracting interest rate sensitivity | – | (18,583 | ) | 6,348 | 7,341 | 4,325 | 569 | |||||||||||||||||||||||||||
Net interest rate risk gap | – | 6,289 | (2,142 | ) | (269 | ) | (9,225 | ) | 5,347 | |||||||||||||||||||||||||
Cumulative interest rate gap | – | 6,289 | 4,147 | 3,878 | (5,347 | ) | – | |||||||||||||||||||||||||||
At 31 December 2011 | ||||||||||||||||||||||||||||||||||
Cash at bank and in hand: | ||||||||||||||||||||||||||||||||||
– balances with HSBC undertakings | 316 | 280 | – | – | – | 36 | ||||||||||||||||||||||||||||
Derivatives | 3,568 | – | – | – | – | 3,568 | ||||||||||||||||||||||||||||
Loans and advances to HSBC undertakings | 28,048 | 25,373 | 1,175 | 279 | 603 | 618 | ||||||||||||||||||||||||||||
Financial investments | 1,078 | – | 300 | 731 | – | 47 | ||||||||||||||||||||||||||||
Investments in subsidiaries | 90,621 | – | – | – | – | 90,621 | ||||||||||||||||||||||||||||
Other assets | 231 | – | – | – | – | 231 | ||||||||||||||||||||||||||||
Total assets | 123,862 | 25,653 | 1,475 | 1,010 | 603 | 95,121 | ||||||||||||||||||||||||||||
Amounts owed to HSBC undertakings | (2,479 | ) | (2,260 | ) | – | – | – | (219 | ) | |||||||||||||||||||||||||
Financial liabilities designated at fair values | (21,151 | ) | (2,694 | ) | (6,423 | ) | (6,157 | ) | (5,156 | ) | (721 | ) | ||||||||||||||||||||||
Derivatives | (1,067 | ) | – | – | – | – | (1,067 | ) | ||||||||||||||||||||||||||
Debt securities in issue | (2,613 | ) | – | (1,617 | ) | – | (1,006 | ) | 10 | |||||||||||||||||||||||||
Other liabilities | (1,919 | ) | – | – | – | – | (1,919 | ) | ||||||||||||||||||||||||||
Subordinated liabilities | (12,450 | ) | (776 | ) | (774 | ) | (2,070 | ) | (8,671 | ) | (159 | ) | ||||||||||||||||||||||
Total equity | (82,183 | ) | – | – | – | – | (82,183 | ) | ||||||||||||||||||||||||||
Total liabilities and equity | (123,862 | ) | (5,730 | ) | (8,814 | ) | (8,227 | ) | (14,833 | ) | (86,258 | ) | ||||||||||||||||||||||
Off-balance sheet items attracting interest rate sensitivity | – | (17,945 | ) | 6,405 | 5,749 | 5,048 | 743 | |||||||||||||||||||||||||||
Net interest rate risk gap | – | 1,978 | (934 | ) | (1,468 | ) | (9,182 | ) | (9,606 | ) | ||||||||||||||||||||||||
Cumulative interest rate gap | – | 1,978 | 1,044 | (424 | ) | (9,606 | ) | – | ||||||||||||||||||||||||||
226
Table of Contents
HSBC HOLDINGS PLC
Report of the Directors: Operating and Financial Review(continued)
(Unaudited)
| Page | App1 | Tables | Page | |||||||||||
| 270 | ||||||||||||||
| 227 | Three lines of defence | 227 | ||||||||||||
| Operational risk management framework | 228 | |||||||||||||
| 228 | ||||||||||||||
| 229 | Frequency of operational risk incidents by risk category | 229 | ||||||||||||
| Distribution of operational risk losses in US dollars by risk category | 230 | |||||||||||||
| 230 | 271 | |||||||||||||
| 271 | ||||||||||||||
| 271 | ||||||||||||||
| 272 | ||||||||||||||
| 272 | ||||||||||||||
| 231 | 273 | |||||||||||||
| 1 | Appendix to Risk – risk policies and practices. |
Operational risk is relevant to every aspect of our business, and covers a wide spectrum of issues, in particular legal, compliance, security and fraud. Losses arising from breaches of regulation and law, unauthorised activities, error, omission, inefficiency, fraud, systems failure or external events all fall within the definition of operational risk.
We continued to enhance our operational risk management framework (‘ORMF’) policies and procedures in 2012, including the implementation of a top risk analysis process to improve the quantification and management of material risks through scenario analysis. This provides a top down, forward-looking view of risks to help determine whether they are being effectively managed within our risk appetite or whether further management action is required.
Responsibility for minimising operational risk management lies with HSBC’s management and staff. Each regional, global business, country, business unit and functional head is required to maintain oversight over operational risk and internal control covering all business and operational activities for which they are responsible.
| A summary of our current policies and practices regarding operational risk is provided in the Appendix to Risk on page 270. |
Operational risk management framework
The Group Operational Risk function and the ORMF
assist business management in discharging their responsibilities.
The ORMF defines minimum standards and processes, and the governance structure for operational risk and internal control across the Group. Inherent to the ORMF is a ‘three lines of defence’ model for the management of risk, as described below:
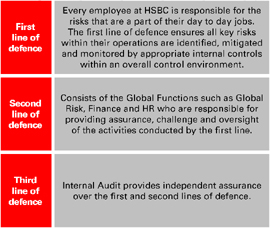
A diagrammatic representation of the ORMF is presented below:
227
Table of Contents
HSBC HOLDINGS PLC
Report of the Directors: Operating and Financial Review(continued)
Operational risk management framework
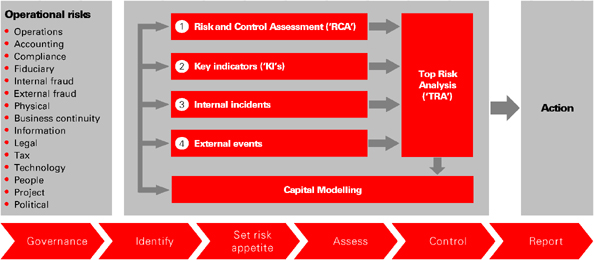
| • | RCAs are used to inform the evaluation of the effectiveness of controls over top risks. |
| • | KIs are linked to TRAs to help monitor the risks and controls in the operational risk system. |
| • | Internal incidents are used to forecast typical losses. |
| • | External sources (e.g. Fitch and ORX databases) are used to inform the assessment of extreme TRAs. |
During 2012, our top and emerging risk profile was dominated by compliance and legal risks as referred to in the ‘Top and emerging risks’ section and Note 43 on the Financial Statements. A number of other material losses were realised in 2012, which related largely to events that occurred in previous years. These events included the possible historical mis-selling of PPI and interest rate protection products in the UK (see Note 32 on the Financial Statements). A number of mitigating actions continue to be taken to prevent future mis-selling incidents including enhanced new product approval processes.
The incidence of regulatory proceedings and other adversarial proceedings against financial service firms is increasing. Proposed changes relating to capital and liquidity requirements, remuneration and/or taxes could increase our cost of doing business, reducing future profitability. Various regulators and competition authorities around the world are also investigating and reviewing certain past submissions made by panel banks and the process for making submissions in connection with the setting of Libor, Euribor and other benchmark interest and foreign exchange rates. In response, we have undertaken a number of initiatives which seek to address the issues identified, including creating a new global management structure, enhancing our governance and oversight, increasing our compliance function resource, emphasising HSBC Values and designing and implementing new global standards as
described on page 6. For further information, see Note 43 on the Financial Statements.
Other significant operational risks included:
| • | challenges to achieving our strategy in a downturn: businesses and geographical regions have prioritised strategy and annual operating plans to reflect current economic conditions. Performance against plan is monitored through a number of means including the use of balanced scorecards and performance reporting at all relevant management committees; |
| • | internet crime and fraud: the threat of external fraud, especially in retail and commercial banking, may increase during adverse economic conditions. We have increased our defences through enhanced monitoring and have implemented additional controls, such as two-factor authentication, to mitigate the possibility of losses from fraud risks. We continually assess these threats as they evolve and adapt our controls to mitigate these risks; |
| • | level of change creating operational complexity: the Risk function is engaged with business management in business transformation initiatives to ensure robust internal controls are maintained, including through participation in all relevant management committees. For example, we undertake rigorous testing and review of all planned updates to our systems environment. All changes are risk assessed and |
228
Table of Contents
HSBC HOLDINGS PLC
Report of the Directors: Operating and Financial Review(continued)
appropriate mitigating controls are required for any planned high risk changes;
| • | information security: the security of our information and technology infrastructure is crucial for maintaining our banking applications and processes while protecting our customers and the HSBC brand. In common with other banks and multinational organisations, we face a growing threat of cyber attacks. A failure of our defences against such attacks could result in financial loss, loss of customer data and other sensitive information which could undermine both our reputation and our ability to retain the trust of our customers. We experienced a number of cyber attacks in 2012, none of which resulted in financial loss or the loss of customer data. Significant investment has already been made in enhancing controls, including increased training to raise staff awareness of the requirements, improved controls around data access and heightened monitoring of information flows. The threat from cyber attacks is a concern for our organisation and failure to protect our operations from internet crime or cyber attacks may result in financial loss, loss of customer data or other sensitive information which could undermine our reputation and our ability to attract and keep customers. This area will continue to be a focus of ongoing initiatives to strengthen the control environment; |
| • | vendor risk management: this continues to evolve, with a project underway to accelerate the review of existing contracts, including those that support key economic functions, and a global project to manage the performance of critical outsourced vendors; and |
| • | compliance with regulatory agreements and orders: in relation to the Deferred Prosecution Agreements (‘DPA’s), the Group has committed to take or continue to adhere to a number of remedial measures. Breach of the DPAs at any time during its term may allow the DoJ or the New York County District Attorney’s Office to prosecute HSBC in relation to the matters which are the subject of the DPAs. For further detail please see ‘Top and emerging risks’. |
Other operational risks are also monitored and managed through the use of the ORMF, including investments made to further improve the resilience of our payments infrastructure.
Further information on the nature of these risks is provided in ‘Top and emerging risks’ on page 130.
Frequency and amount of operational risk losses
The profile of operational risk incidents and associated losses is summarised below, showing the distribution of operational risk incidents in terms of their frequency of occurrence and total loss amount in US dollars.
The operational risk incident profile in 2012 comprised both high frequency, low impact events and high impact events that occurred much less frequently. For example, losses due to external fraud incidents such a credit card fraud occurred more often than other types of event, but the amounts involved were often small in value. Fraud incidents continued to account for over 50% of the total number of incidents but only 4% of operational risk losses.
By contrast, operational risk incidents in the compliance category remained relatively low frequency events, but the total cost was significant. Compliance-related losses increased in 2012 to 79% of total operational risk losses due to significant historical events including the possible mis-selling of PPI and interest rate protection products in the UK and the incidence of regulatory matters described in Note 43 on the Financial Statements.
Frequency of operational risk incidents by risk category
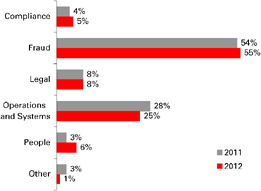
229
Table of Contents
HSBC HOLDINGS PLC
Report of the Directors: Operating and Financial Review(continued)
Distribution of operational risk losses in US dollars by risk category
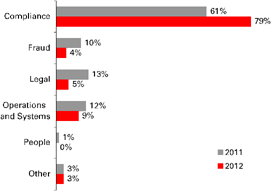
(Unaudited)
Compliance risk is the risk that we fail to observe the letter and spirit of all relevant laws, codes, rules, regulations and standards of good market practice, and incur fines and penalties and suffer damage to our business as a consequence.
All Group companies are required to observe the letter and spirit of all relevant laws, codes, rules, regulations and standards of good market practice. In 2012, we experienced increasing levels of compliance risk as regulators and other agencies pursued investigations into historical activities and as we continued to work with them in relation to already identified issues. These included:
| • | an appearance before the US Senate Permanent Subcommittee on Investigations and the DPAs reached with US authorities in relation to investigations regarding inadequate compliance with anti-money laundering, the US Bank Secrecy Act and sanctions laws, plus a related undertaking with the FSA; |
| • | investigations into the possible mis-selling of interest rate derivative products to SMEs in the UK; and |
| • | investigations and reviews related to certain past submissions made by panel banks and the process for making submissions in connection with the setting of Libor, Euribor and other benchmark interest and foreign exchange rates. As some HSBC entities are members of such panels, HSBC Holdings and certain of its subsidiaries have been the subject of regulatory demands for information. |
With a new senior leadership team and strategy in place since 2011, we have already taken steps to address these issues including making significant changes to strengthen compliance, risk management and culture. These steps, which will also enhance our compliance risk management capabilities, including the following:
| • | the creation of a new global structure, which will make HSBC easier to manage and control; |
| • | simplifying our business through the ongoing implementation of our organisational effectiveness programme and our five economic filters strategy; |
| • | introducing a sixth global risk filter which will standardise the way we do business in high risk countries; |
| • | substantially increasing resources, doubling global expenditure and significantly strengthening Compliance as a control (rather than as an advisory) function; |
| • | continuing to roll out an HSBC Values programme that defines the way everyone in the Group should act; and |
| • | adopting and enforcing the most effective standards globally, including a globally consistent approach to knowing and retaining our customers. |
Additionally, we have substantially revised our governance framework in this area, appointing a new Chief Legal Officer with particular expertise and experience in US law and regulation, and creating and appointing experienced individuals to the new roles of Head of Group Financial Crime Compliance and Global Head of Regulatory Compliance.
It is clear from both our own and wider industry experience that there is a significantly increased level of activity from regulators and law enforcement agencies in pursuing investigations in relation to possible breaches of regulation and that the direct and indirect costs of such breaches can be significant. Coupled with a substantial increase in the volume of new regulation, much of which has some level of extra-territorial effect, and the geographical spread of our businesses, we believe that the level of inherent compliance risk that we face will continue to remain high for the foreseeable future.
230
Table of Contents
HSBC HOLDINGS PLC
Report of the Directors: Operating and Financial Review(continued)
(Unaudited)
Fiduciary risk is the risk to the Group of breaching our fiduciary duties when we act in a fiduciary capacity as trustee or investment manager or as mandated by law or regulation.
A fiduciary duty is one where HSBC holds, manages, oversees or has responsibility for assets for a third party that involves a legal and/or regulatory duty to act with the highest standard of care and with utmost good faith. A fiduciary must make decisions and act in the best interests of the third party and must place the wants and needs of the client first, above the needs of the Group.
We may be held liable for damages or other penalties caused by failure to act in accordance with those duties. Fiduciary duties may also arise in other circumstances, such as when we act as an agent for a principal, unless the fiduciary duties are specifically excluded (e.g. under the agency appointment contract).
During 2012, our principal fiduciary businesses (the ‘designated businesses’) developed fiduciary risk appetite statements for their various fiduciary roles and a joint review was commissioned by Global Operational Risk and RBWM to identify businesses other than designated businesses conducting fiduciary activities to ensure that they were subject to adequate review and oversight.
231
Table of Contents
HSBC HOLDINGS PLC
Report of the Directors: Operating and Financial Review(continued)
Risk management of insurance operations
(Audited)
| Page | App1 | Tables | Page | |||||||||||
| 233 | ||||||||||||||
| 273 | ||||||||||||||
| 273 | ||||||||||||||
| 274 | ||||||||||||||
| 233 | ||||||||||||||
| 233 | Analysis of life insurance risk – liabilities to policyholders | 234 | ||||||||||||
Analysis of non-life insurance risk – net written insurance premiums | 234 | |||||||||||||
| 235 | Balance sheet of insurance manufacturing subsidiaries: | |||||||||||||
| – by type of contract | 236 | |||||||||||||
| – by geographical region | 237 | |||||||||||||
| 238 | 275 | Financial assets held by insurance manufacturing subsidiaries | 238 | |||||||||||
| 239 | 275 | 239 | ||||||||||||
Sensitivity of HSBC’s insurance manufacturing subsidiaries to market risk factors | 240 | |||||||||||||
| 240 | 277 | 240 | ||||||||||||
| 242 | ||||||||||||||
| 242 | 277 | 242 | ||||||||||||
Remaining contractual maturity of investment contract liabilities | 243 | |||||||||||||
| 243 | 244 | |||||||||||||
Key assumptions used in the computation of PVIF for main life insurance operations | 244 | |||||||||||||
| 244 | 244 | |||||||||||||
| 245 | 245 | |||||||||||||
1Appendix to Risk – policies and practices.
232
Table of Contents
HSBC HOLDINGS PLC
Report of the Directors: Operating and Financial Review(continued)
The majority of the risk in our Insurance business derives from manufacturing activities and can be categorised as insurance risk and financial risk. Insurance risk is the risk, other than financial risk, of loss transferred from the holder of the insurance contract to the issuer (HSBC). Financial risks include market risk, credit risk and liquidity risk.
There were no material changes to our policies and practices for the management of risks arising in the insurance operations, including the risks relating to different life and non-life products, during 2012.
| A summary of our policies and practices regarding the risk management of insurance operations, and the main contracts we manufacture, are provided in the Appendix to Risk on page 273. |
We operate an integrated bancassurance model which provides wealth and protection insurance products principally for customers with whom we have a banking relationship. Insurance products are sold through all global businesses, predominantly by RBWM and CMB, through our branches and direct channels worldwide.
The insurance contracts we sell largely relate to the underlying needs of our banking customers, which we can identify from our point-of-sale contacts and customer knowledge. The majority of sales are of savings and investment products and term and credit life contracts. By focusing largely on personal and SME lines of business we are able to optimise volumes and diversify individual insurance risks.
Where we have operational scale and risk appetite, mostly in life insurance, these insurance products are manufactured by HSBC subsidiaries. Manufacturing insurance allows us to retain the risks and rewards associated with writing insurance contracts as part of the underwriting profit, investment income and distribution commission are kept within the Group.
Where we do not have the risk appetite or operational scale to be an effective insurance manufacturer, we engage through a handful of leading external insurance companies in order to provide insurance products to our customers through our banking network and direct channels. These arrangements are generally structured with our exclusive strategic partners and earn the Group a combination of commissions, fees and profit-share.
We distribute insurance products in all of our geographical regions. We have core life insurance
manufacturing entities, the majority of which are direct subsidiaries of legal banking entities, in seven countries (Argentina, Brazil, Mexico, France, UK, Hong Kong and Singapore). Our life insurance manufacturing entities in the US are held-for-sale at 31 December 2012.
Risk management of insurance operations in 2012
This section provides disclosures on the risks arising from insurance manufacturing operations, including insurance risk and financial risks such as market risk, credit risk and liquidity risk.
Risks in these operations are managed within the insurance entities using methodologies and processes appropriate to the insurance activities, but remain subject to oversight at Group level.
The consolidated Group liquidity and market risk management disclosures exclude insurance operations. The assets of the insurance manufacturing subsidiaries are included within the consolidated Group credit risk disclosures.
Operational and sustainability risks are covered by the Group’s overall respective risk management processes and are not included in this section.
Insurance risk is principally measured in two ways:
| • | liabilities to policyholders on life insurance contracts; and |
| • | net written insurance premiums for non-life contracts. |
The insurance risk profile of our life insurance manufacturing businesses did not change materially during 2012 despite the increase in liabilities to policyholders on these contracts to US$68bn (2011: US$60bn). This growth in liabilities largely resulted from market value gains on underlying financial assets in addition to new business generated during 2012.
The insurance risk profile of our non-life insurance manufacturing businesses changed during the year as net written insurance premiums declined to US$656m (2011: US$993m). This was in line with our strategy to focus on the manufacturing of life insurance products, with non-life manufacturing entities or portfolios in Argentina, Hong Kong, Ireland and Singapore sold during 2012.
A principal risk we continue to face is that, over time, the cost of acquiring and administering a contract, claims and benefits may exceed the aggregate amount of premiums received and investment income. The cost of claims and benefits
233
Table of Contents
HSBC HOLDINGS PLC
Report of the Directors: Operating and Financial Review(continued)
can be influenced by many factors, including mortality and morbidity experience, lapse and surrender rates and, if the policy has a savings element, the performance of the assets held to support the liabilities.
In respect of financial risks, subsidiaries manufacturing products with guarantees are usually exposed to falls in market interest rates and equity prices to the extent that the market exposure
cannot be managed by utilising any discretionary participation (or bonus) features (‘DPF’) within the policy contracts they issue.
The following tables analyse our insurance risk exposures by geographical region and by type of business. The insurance risk profile and related exposures remained largely consistent with those observed at 31 December 2011.
Analysis of life insurance risk – liabilities to policyholders56
(Audited)
| Europe US$m | Hong Kong US$m | Rest of Asia- Pacific US$m | North America57 | Latin America US$m | Total US$m | |||||||||||||||||||||||||||||
At 31 December 2012 | ||||||||||||||||||||||||||||||||||
Life (non-linked) | 1,319 | 25,615 | 1,587 | – | 2,163 | 30,684 | ||||||||||||||||||||||||||||
Insurance contracts with DPF58 | 353 | 23,685 | 439 | – | – | 24,477 | ||||||||||||||||||||||||||||
Credit life | 160 | – | 61 | – | – | 221 | ||||||||||||||||||||||||||||
Annuities | 586 | – | 122 | – | 1,579 | 2,287 | ||||||||||||||||||||||||||||
Term assurance and other long-term contracts | 220 | 1,930 | 965 | – | 584 | 3,699 | ||||||||||||||||||||||||||||
Life (linked) | 3,249 | 3,786 | 594 | – | 5,427 | 13,056 | ||||||||||||||||||||||||||||
Investment contracts with DPF58,59 | 24,370 | – | 4 | – | – | 24,374 | ||||||||||||||||||||||||||||
Insurance liabilities to policyholders | 28,938 | 29,401 | 2,185 | – | 7,590 | 68,114 | ||||||||||||||||||||||||||||
At 31 December 2011 | ||||||||||||||||||||||||||||||||||
Life (non-linked) | 1,163 | 21,460 | 1,227 | 982 | 2,094 | 26,926 | ||||||||||||||||||||||||||||
Insurance contracts with DPF58 | 335 | 20,109 | 338 | – | – | 20,782 | ||||||||||||||||||||||||||||
Credit life | 219 | – | 58 | 34 | – | 311 | ||||||||||||||||||||||||||||
Annuities | 517 | – | 78 | 741 | 1,546 | 2,882 | ||||||||||||||||||||||||||||
Term assurance and other long-term contracts | 92 | 1,351 | 753 | 207 | 548 | 2,951 | ||||||||||||||||||||||||||||
Life (linked) | 2,508 | 3,393 | 476 | – | 4,833 | 11,210 | ||||||||||||||||||||||||||||
Investment contracts with DPF58,59 | 21,477 | – | 11 | – | – | 21,488 | ||||||||||||||||||||||||||||
Insurance liabilities to policyholders | 25,148 | 24,853 | 1,714 | 982 | 6,927 | 59,624 | ||||||||||||||||||||||||||||
For footnotes, see page 249.
Our most significant life insurance products are investment contracts with DPF issued in France, insurance contracts with DPF issued in Hong Kong and unit-linked contracts issued in Latin America,
Hong Kong and the UK. The decline in life insurance liabilities in North America reflects the classification of this business as held for sale at 31 December 2012.
Analysis of non-life insurance risk – net written insurance premiums60
(Audited)
| Europe US$m | Hong Kong US$m | Rest of Asia- Pacific US$m | North America US$m | Latin America US$m | Total US$m | |||||||||||||||||||||||||||||
2012 | ||||||||||||||||||||||||||||||||||
Accident and health | 7 | 181 | 7 | – | 34 | 229 | ||||||||||||||||||||||||||||
Motor | – | 14 | 20 | – | 161 | 195 | ||||||||||||||||||||||||||||
Fire and other damage | – | 20 | 15 | 24 | 20 | 79 | ||||||||||||||||||||||||||||
Liability | – | 15 | 4 | – | 1 | 20 | ||||||||||||||||||||||||||||
Credit (non-life) | – | – | – | 36 | 1 | 37 | ||||||||||||||||||||||||||||
Marine, aviation and transport | – | 7 | 4 | – | 13 | 24 | ||||||||||||||||||||||||||||
Other non-life insurance contracts | 5 | 33 | 1 | 3 | 30 | 72 | ||||||||||||||||||||||||||||
Total net written insurance premiums | 12 | 270 | 51 | 63 | 260 | 656 | ||||||||||||||||||||||||||||
Net insurance claims incurred and movement in liabilities to policyholders | (5 | ) | (117 | ) | (22 | ) | (24 | ) | (116 | ) | (284 | ) | ||||||||||||||||||||||
234
Table of Contents
HSBC HOLDINGS PLC
Report of the Directors: Operating and Financial Review(continued)
| Europe US$m | Hong Kong US$m | Rest of Asia- Pacific US$m | North America US$m | Latin America US$m | Total US$m | |||||||||||||||||||||||||||||
2011 | ||||||||||||||||||||||||||||||||||
Accident and health | 23 | 186 | 8 | – | 39 | 256 | ||||||||||||||||||||||||||||
Motor | – | 17 | 25 | – | 328 | 370 | ||||||||||||||||||||||||||||
Fire and other damage | 5 | 29 | 13 | 30 | 29 | 106 | ||||||||||||||||||||||||||||
Liability | 1 | 16 | 5 | – | 1 | 23 | ||||||||||||||||||||||||||||
Credit (non-life) | 6 | – | – | 48 | 1 | 55 | ||||||||||||||||||||||||||||
Marine, aviation and transport | – | 10 | 3 | – | 25 | 38 | ||||||||||||||||||||||||||||
Other non-life insurance contracts | 7 | 39 | 1 | 7 | 91 | 145 | ||||||||||||||||||||||||||||
Total net written insurance premiums | 42 | 297 | 55 | 85 | 514 | 993 | ||||||||||||||||||||||||||||
Net insurance claims incurred and movement in liabilities to policyholders | 56 | (127 | ) | (26 | ) | (22 | ) | (231 | ) | (350 | ) | |||||||||||||||||||||||
2010 | ||||||||||||||||||||||||||||||||||
Accident and health | 78 | 174 | 8 | 3 | 37 | 300 | ||||||||||||||||||||||||||||
Motor | – | 15 | 28 | – | 267 | 310 | ||||||||||||||||||||||||||||
Fire and other damage | 38 | 29 | 11 | 16 | 22 | 116 | ||||||||||||||||||||||||||||
Liability | – | 20 | 4 | – | 2 | 26 | ||||||||||||||||||||||||||||
Credit (non-life) | 25 | – | – | 53 | 2 | 80 | ||||||||||||||||||||||||||||
Marine, aviation and transport | 3 | 10 | 4 | – | 18 | 35 | ||||||||||||||||||||||||||||
Other non-life insurance contracts | 20 | 39 | 1 | 9 | 84 | 153 | ||||||||||||||||||||||||||||
Total net written insurance premiums | 164 | 287 | 56 | 81 | 432 | 1,020 | ||||||||||||||||||||||||||||
Net insurance claims incurred and movement in liabilities to policyholders | (169 | ) | (117 | ) | (25 | ) | (13 | ) | (201 | ) | (525 | ) | ||||||||||||||||||||||
For footnotes, see page 249.
Our motor business was written predominantly in Argentina; this business was sold in May 2012.
Our accident and health and fire and other damage to property contracts was written in all regions but mainly in Hong Kong; this business was sold in November 2012.
Credit non-life insurance, which was historically originated in conjunction with the provision of loans but now in run-off, was concentrated in the US.
Balance sheet of insurance manufacturing subsidiaries
(Audited)
A principal tool used to manage exposures to both financial and insurance risk, in particular for life insurance contracts, is asset and liability matching.
In many markets in which we operate it is neither possible nor appropriate to follow a perfect asset and liability matching strategy. For long-dated non-linked contracts in particular, this results in a duration mismatch between assets and liabilities. We therefore structure portfolios to support projected liabilities from non-linked contracts.
In the absence of insurable events occurring, unit-linked contracts match assets more directly with liabilities. This results in the policyholder bearing the majority of the financial risk exposure.
The tables below show the composition of assets and liabilities by contract and by geographical region and demonstrate that there were sufficient assets to cover the liabilities to policyholders in each case at the end of 2012.
235
Table of Contents
HSBC HOLDINGS PLC
Report of the Directors: Operating and Financial Review(continued)
Balance sheet of insurance manufacturing subsidiaries by type of contract
(Audited)
| Insurance contracts | Investment contracts | |||||||||||||||||||||||||||||||||||||||||||||||||||||||||
With DPF | Unit- linked US$m | Annu- ities US$m | Term assur- ance61 | Non-life US$m | With DPF59 | Unit- linked | Other US$m | Other assets62 | Total US$m | |||||||||||||||||||||||||||||||||||||||||||||||||
At 31 December 2012 | ||||||||||||||||||||||||||||||||||||||||||||||||||||||||||
Financial assets | 24,288 | 12,619 | 1,785 | 4,350 | 356 | 23,620 | 8,780 | 4,315 | 4,692 | 84,805 | ||||||||||||||||||||||||||||||||||||||||||||||||
– trading assets | – | – | 4 | – | – | – | – | – | – | 4 | ||||||||||||||||||||||||||||||||||||||||||||||||
– financial assets designated at fair value | 2,333 | 12,440 | 571 | 756 | 196 | 6,043 | 8,206 | 1,486 | 987 | 33,018 | ||||||||||||||||||||||||||||||||||||||||||||||||
– derivatives | 40 | 4 | – | 6 | – | 117 | 13 | 86 | 69 | 335 | ||||||||||||||||||||||||||||||||||||||||||||||||
– financial investments | 18,283 | – | 932 | 3,315 | 73 | 16,022 | – | 1,853 | 2,928 | 43,406 | ||||||||||||||||||||||||||||||||||||||||||||||||
– other financial assets | 3,632 | 175 | 278 | 273 | 87 | 1,438 | 561 | 890 | 708 | 8,042 | ||||||||||||||||||||||||||||||||||||||||||||||||
Reinsurance assets | 124 | 593 | 494 | 320 | 14 | – | – | – | 22 | 1,567 | ||||||||||||||||||||||||||||||||||||||||||||||||
PVIF63 | – | – | – | – | – | – | – | – | 4,847 | 4,847 | ||||||||||||||||||||||||||||||||||||||||||||||||
Other assets and investment properties | 448 | 7 | 34 | 110 | 11 | 754 | 24 | 28 | 2,420 | 3,836 | ||||||||||||||||||||||||||||||||||||||||||||||||
Total assets | 24,860 | 13,219 | 2,313 | 4,780 | 381 | 24,374 | 8,804 | 4,343 | 11,981 | 95,055 | ||||||||||||||||||||||||||||||||||||||||||||||||
Liabilities under investment contracts: | ||||||||||||||||||||||||||||||||||||||||||||||||||||||||||
– designated at fair value | – | – | – | – | – | – | 8,691 | 3,765 | – | 12,456 | ||||||||||||||||||||||||||||||||||||||||||||||||
– carried at amortised cost | – | – | – | – | – | – | – | 455 | – | 455 | ||||||||||||||||||||||||||||||||||||||||||||||||
Liabilities under insurance contracts | 24,477 | 13,056 | 2,287 | 3,920 | 81 | 24,374 | – | – | – | 68,195 | ||||||||||||||||||||||||||||||||||||||||||||||||
Deferred tax | 13 | – | 13 | 12 | 1 | – | – | – | 1,161 | 1,200 | ||||||||||||||||||||||||||||||||||||||||||||||||
Other liabilities | – | – | – | – | – | – | – | – | 2,760 | 2,760 | ||||||||||||||||||||||||||||||||||||||||||||||||
Total liabilities | 24,490 | 13,056 | 2,300 | 3,932 | 82 | 24,374 | 8,691 | 4,220 | 3,921 | 85,066 | ||||||||||||||||||||||||||||||||||||||||||||||||
Total equity | – | – | – | – | – | – | – | – | 9,989 | 9,989 | ||||||||||||||||||||||||||||||||||||||||||||||||
Total equity and liabilities64 | 24,490 | 13,056 | 2,300 | 3,932 | 82 | 24,374 | 8,691 | 4,220 | 13,910 | 95,055 | ||||||||||||||||||||||||||||||||||||||||||||||||
At 31 December 2011 | ||||||||||||||||||||||||||||||||||||||||||||||||||||||||||
Financial assets | 20,520 | 10,355 | 2,531 | 3,398 | 1,656 | 20,745 | 7,843 | 4,103 | 7,219 | 78,370 | ||||||||||||||||||||||||||||||||||||||||||||||||
– trading assets | – | – | 3 | – | 24 | – | – | – | – | 27 | ||||||||||||||||||||||||||||||||||||||||||||||||
– financial assets designated at fair value | 1,730 | 10,101 | 426 | 594 | 206 | 5,491 | 7,191 | 1,515 | 1,616 | 28,870 | ||||||||||||||||||||||||||||||||||||||||||||||||
– derivatives | 23 | 1 | – | – | – | 231 | 7 | 89 | 7 | 358 | ||||||||||||||||||||||||||||||||||||||||||||||||
– financial investments | 15,523 | 1 | 1,778 | 2,540 | 791 | 13,732 | – | 1,913 | 4,008 | 40,286 | ||||||||||||||||||||||||||||||||||||||||||||||||
– other financial assets | 3,244 | 252 | 324 | 264 | 635 | 1,291 | 645 | 586 | 1,588 | 8,829 | ||||||||||||||||||||||||||||||||||||||||||||||||
Reinsurance assets | 12 | 903 | 441 | 196 | 250 | – | – | – | 42 | 1,844 | ||||||||||||||||||||||||||||||||||||||||||||||||
PVIF63 | – | – | – | – | – | – | – | – | 4,092 | 4,092 | ||||||||||||||||||||||||||||||||||||||||||||||||
Other assets and investment properties | 384 | 6 | 14 | 188 | 169 | 744 | 28 | 34 | 753 | 2,320 | ||||||||||||||||||||||||||||||||||||||||||||||||
Total assets | 20,916 | 11,264 | 2,986 | 3,782 | 2,075 | 21,489 | 7,871 | 4,137 | 12,106 | 86,626 | ||||||||||||||||||||||||||||||||||||||||||||||||
Liabilities under investment contracts: | ||||||||||||||||||||||||||||||||||||||||||||||||||||||||||
– designated at fair value | – | – | – | – | – | – | 7,813 | 3,586 | – | 11,399 | ||||||||||||||||||||||||||||||||||||||||||||||||
– carried at amortised cost | – | – | – | – | – | – | – | 435 | – | 435 | ||||||||||||||||||||||||||||||||||||||||||||||||
Liabilities under insurance contracts | 20,782 | 11,210 | 2,882 | 3,262 | 1,635 | 21,488 | – | – | – | 61,259 | ||||||||||||||||||||||||||||||||||||||||||||||||
Deferred tax | 15 | – | 21 | 6 | 1 | – | – | – | 931 | 974 | ||||||||||||||||||||||||||||||||||||||||||||||||
Other liabilities | – | – | – | – | – | – | – | – | 1,930 | 1,930 | ||||||||||||||||||||||||||||||||||||||||||||||||
Total liabilities | 20,797 | 11,210 | 2,903 | 3,268 | 1,636 | 21,488 | 7,813 | 4,021 | 2,861 | 75,997 | ||||||||||||||||||||||||||||||||||||||||||||||||
Total equity | – | – | – | – | – | – | – | – | 10,629 | 10,629 | ||||||||||||||||||||||||||||||||||||||||||||||||
Total equity and liabilities64 | 20,797 | 11,210 | 2,903 | 3,268 | 1,636 | 21,488 | 7,813 | 4,021 | 13,490 | 86,626 | ||||||||||||||||||||||||||||||||||||||||||||||||
For footnotes, see page 249.
236
Table of Contents
HSBC HOLDINGS PLC
Report of the Directors: Operating and Financial Review(continued)
Balance sheet of insurance manufacturing subsidiaries by geographical region56
(Audited)
| Europe US$m | Hong Kong US$m | Rest of Asia- Pacific US$m | North America57 | Latin America US$m | Total US$m | |||||||||||||||||||||||||||||
At 31 December 2012 | ||||||||||||||||||||||||||||||||||
Financial assets | 37,325 | 35,632 | 2,594 | – | 9,254 | 84,805 | ||||||||||||||||||||||||||||
– trading assets | – | – | – | – | 4 | 4 | ||||||||||||||||||||||||||||
– financial assets designated at fair value | 17,590 | 7,356 | 1,370 | – | 6,702 | 33,018 | ||||||||||||||||||||||||||||
– derivatives | 203 | 126 | 6 | – | – | 335 | ||||||||||||||||||||||||||||
– financial investments | 17,139 | 23,275 | 994 | – | 1,998 | 43,406 | ||||||||||||||||||||||||||||
– other financial assets | 2,393 | 4,875 | 224 | – | 550 | 8,042 | ||||||||||||||||||||||||||||
Reinsurance assets | 809 | 715 | 8 | – | 35 | 1,567 | ||||||||||||||||||||||||||||
PVIF63 | 1,140 | 2,846 | 304 | – | 557 | 4,847 | ||||||||||||||||||||||||||||
Other assets and investment properties | 849 | 983 | 230 | 1,573 | 201 | 3,836 | ||||||||||||||||||||||||||||
Total assets | 40,123 | 40,176 | 3,136 | 1,573 | 10,047 | 95,055 | ||||||||||||||||||||||||||||
Liabilities under investment contracts: | ||||||||||||||||||||||||||||||||||
– designated at fair value | 7,783 | 4,673 | – | – | – | 12,456 | ||||||||||||||||||||||||||||
– carried at amortised cost | – | – | – | – | 455 | 455 | ||||||||||||||||||||||||||||
Liabilities under insurance contracts | 28,954 | 29,402 | 2,200 | – | 7,639 | 68,195 | ||||||||||||||||||||||||||||
Deferred tax | 403 | 532 | 88 | – | 177 | 1,200 | ||||||||||||||||||||||||||||
Other liabilities | 782 | 347 | 267 | 1,037 | 327 | 2,760 | ||||||||||||||||||||||||||||
Total liabilities | 37,922 | 34,954 | 2,555 | 1,037 | 8,598 | 85,066 | ||||||||||||||||||||||||||||
Total equity | 2,201 | 5,222 | 581 | 536 | 1,449 | 9,989 | ||||||||||||||||||||||||||||
Total equity and liabilities64 | 40,123 | 40,176 | 3,136 | 1,573 | 10,047 | 95,055 | ||||||||||||||||||||||||||||
At 31 December 2011 | ||||||||||||||||||||||||||||||||||
Financial assets | 34,163 | 30,126 | 2,093 | 2,414 | 9,574 | 78,370 | ||||||||||||||||||||||||||||
– trading assets | – | – | – | – | 27 | 27 | ||||||||||||||||||||||||||||
– financial assets designated at fair value | 15,583 | 5,875 | 1,155 | – | 6,257 | 28,870 | ||||||||||||||||||||||||||||
– derivatives | 244 | 114 | – | – | – | 358 | ||||||||||||||||||||||||||||
– financial investments | 15,531 | 19,858 | 617 | 1,846 | 2,434 | 40,286 | ||||||||||||||||||||||||||||
– other financial assets | 2,805 | 4,279 | 321 | 568 | 856 | 8,829 | ||||||||||||||||||||||||||||
Reinsurance assets | 746 | 912 | 39 | 19 | 128 | 1,844 | ||||||||||||||||||||||||||||
PVIF63 | 1,097 | 2,322 | 282 | 65 | 326 | 4,092 | ||||||||||||||||||||||||||||
Other assets and investment properties | 909 | 946 | 31 | 24 | 410 | 2,320 | ||||||||||||||||||||||||||||
Total assets | 36,915 | 34,306 | 2,445 | 2,522 | 10,438 | 86,626 | ||||||||||||||||||||||||||||
Liabilities under investment contracts: | ||||||||||||||||||||||||||||||||||
– designated at fair value | 6,961 | 4,405 | 33 | – | – | 11,399 | ||||||||||||||||||||||||||||
– carried at amortised cost | – | – | – | – | 435 | 435 | ||||||||||||||||||||||||||||
Liabilities under insurance contracts | 25,795 | 25,160 | 1,802 | 1,079 | 7,423 | 61,259 | ||||||||||||||||||||||||||||
Deferred tax | 352 | 408 | 60 | 28 | 126 | 974 | ||||||||||||||||||||||||||||
Other liabilities | 1,200 | 269 | 69 | 13 | 379 | 1,930 | ||||||||||||||||||||||||||||
Total liabilities | 34,308 | 30,242 | 1,964 | 1,120 | 8,363 | 75,997 | ||||||||||||||||||||||||||||
Total equity | 2,607 | 4,064 | 481 | 1,402 | 2,075 | 10,629 | ||||||||||||||||||||||||||||
Total equity and liabilities64 | 36,915 | 34,306 | 2,445 | 2,522 | 10,438 | 86,626 | ||||||||||||||||||||||||||||
For footnotes, see page 249.
237
Table of Contents
HSBC HOLDINGS PLC
Report of the Directors: Operating and Financial Review(continued)
(Audited)
Financial risk exposures can be categorised into:
| • | Market risk – risks arising from changes in the fair values of financial assets or their future cash flows from fluctuations in variables such as interest rates, foreign exchange rates and equity prices; |
| • | Credit risk – the risk of financial loss following the default of third parties to meet their obligations; and |
| • | Liquidity risk – the risk of not being able to make payments to policyholders as they fall due |
as there are insufficient assets that can be realised as cash.
Further details on the nature of these financial risks and how they are managed are provided in the Appendix to Risk on page 252.
The following table analyses the assets held in our insurance manufacturing subsidiaries at 31 December 2012 by type of contract, and provides a view of the exposure to financial risk. For linked contracts, which pay benefits to policyholders which are determined by reference to the value of the investments supporting the policies, we typically designate assets at fair value; for non-linked contracts, the classification of the assets is driven by the nature of the underlying contract.
Financial assets held by insurance manufacturing subsidiaries
(Audited)
| Life linked contracts65 US$m | Life non-linked contracts66 US$m | Non-life insurance67 US$m | Other assets62 US$m | Total US$m | ||||||||||||||||||||||||
At 31 December 2012 | ||||||||||||||||||||||||||||
Trading assets | ||||||||||||||||||||||||||||
Debt securities | – | 4 | – | – | 4 | |||||||||||||||||||||||
Financial assets designated at fair value | 20,646 | 11,189 | 196 | 987 | 33,018 | |||||||||||||||||||||||
Treasury bills | – | 39 | – | – | 39 | |||||||||||||||||||||||
Debt securities | 8,028 | 3,607 | 196 | 408 | 12,239 | |||||||||||||||||||||||
Equity securities | 12,618 | 7,543 | – | 579 | 20,740 | |||||||||||||||||||||||
Financial investments | ||||||||||||||||||||||||||||
Held-to-maturity: debt securities | – | 20,245 | – | 1,548 | 21,793 | |||||||||||||||||||||||
Available-for-sale: | – | 20,160 | 73 | 1,380 | 21,613 | |||||||||||||||||||||||
– debt securities | – | 20,160 | 66 | 1,354 | 21,580 | |||||||||||||||||||||||
– equity securities | – | – | 7 | 26 | 33 | |||||||||||||||||||||||
Derivatives | 17 | 249 | – | 69 | 335 | |||||||||||||||||||||||
Other financial assets68 | 736 | 6,511 | 87 | 708 | 8,042 | |||||||||||||||||||||||
Total financial assets64 | 21,399 | 58,358 | 356 | 4,692 | 84,805 | |||||||||||||||||||||||
At 31 December 2011 | ||||||||||||||||||||||||||||
Trading assets | ||||||||||||||||||||||||||||
Debt securities | – | 3 | – | – | 3 | |||||||||||||||||||||||
Equity securities | – | – | 24 | – | 24 | |||||||||||||||||||||||
Financial assets designated at fair value | 17,292 | 9,756 | 206 | 1,616 | 28,870 | |||||||||||||||||||||||
Treasury bills | 4 | 107 | – | – | 111 | |||||||||||||||||||||||
Debt securities | 6,823 | 3,198 | 206 | 795 | 11,022 | |||||||||||||||||||||||
Equity securities | 10,465 | 6,451 | – | 821 | 17,737 | |||||||||||||||||||||||
Financial investments | ||||||||||||||||||||||||||||
Held-to-maturity: debt securities | – | 17,506 | 175 | 1,300 | 18,981 | |||||||||||||||||||||||
Available-for-sale: | 1 | 17,980 | 616 | 2,708 | 21,305 | |||||||||||||||||||||||
– other eligible bills | – | – | – | 50 | 50 | |||||||||||||||||||||||
– debt securities | – | 17,963 | 599 | 2,520 | 21,082 | |||||||||||||||||||||||
– equity securities | 1 | 17 | 17 | 138 | 173 | |||||||||||||||||||||||
Derivatives | 8 | 343 | – | 7 | 358 | |||||||||||||||||||||||
Other financial assets68 | 897 | 5,709 | 635 | 1,588 | 8,829 | |||||||||||||||||||||||
Total financial assets64 | 18,198 | 51,297 | 1,656 | 7,219 | 78,370 | |||||||||||||||||||||||
For footnotes, see page 249.
238
Table of Contents
HSBC HOLDINGS PLC
Report of the Directors: Operating and Financial Review(continued)
Approximately 65.6% of financial assets were invested in debt securities at 31 December 2012 (2011: 65.2%) with 24.5% (2011: 22.9%) invested in equity securities.
In life linked insurance, premium income less charges levied is invested in a portfolio of assets. We manage the financial risks of this product on behalf of the policyholders by holding appropriate assets in segregated funds or portfolios to which the liabilities are linked. These assets represented 25.2% (2011: 23.2%) of the total financial assets of our insurance manufacturing subsidiaries at the end of 2012.
The remaining financial risks are managed either solely on behalf of the shareholder, or jointly on behalf of the shareholder and policyholders where DPF exist.
(Audited)
Market risk arises when mismatches occur between product liabilities and the investment assets which back them. For example, mismatches between asset and liability yields and maturities give rise to interest rate risk.
Long-term insurance or investment products may incorporate benefits that are guaranteed. Where mismatches exist as a result of current yields falling below guaranteed levels for a prolonged period, the risk that shareholder capital is required to meet liabilities to policyholders increases. The table below shows, in respect of each category of guarantee, the total liabilities to policyholders established for guaranteed products manufactured by our insurance subsidiaries. The table also shows the range of investment returns on the assets supporting these products and the implied investment returns that would enable the business to meet the guarantees.
Immediate annuities, where current investment returns are below guarantees, relate to a closed portfolio in the US which is held for sale at 31 December 2012. Annual return guarantees between 4.5-6%, where current investment returns are below guarantees, is a closed portfolio in Hong Kong. The only other portfolio of contracts identified where current investment returns are below guarantees relate to a closed portfolio in France. This portfolio has reserves of US$495m for which current portfolio yields are 3.25% but investment returns implied by the guarantees are 4.5%.
Liabilities to policyholders69
(Audited)
| 2012 | 2011 | |||||||||||||||||||||||||||||||||
| Amount of reserve US$m | Investment returns implied by guarantee64 | Current yields % | �� | Amount of reserve US$m | Investment returns implied by guarantee64 | Current % | ||||||||||||||||||||||||||||
Annuities in payment | 1,379 | 0.0 – 11.7 | 4.6 – 20.8 | 1,414 | 0.0 – 9.6 | 4.2 – 25.2 | ||||||||||||||||||||||||||||
Deferred annuities | 179 | 0.0 – 6.0 | 3.3 – 20.4 | 175 | 0.0 – 6.0 | 3.2 – 22.7 | ||||||||||||||||||||||||||||
Immediate annuities70 | 485 | 6.0 – 12.0 | 5.4 – 5.5 | 538 | 6.0 – 12.0 | 5.3 – 5.4 | ||||||||||||||||||||||||||||
Annual return | 23,878 | 0.0 – 2.5 | 1.4 – 4.7 | 20,465 | 0.0 – 2.5 | 0.0 – 6.9 | ||||||||||||||||||||||||||||
Annual return | 4,315 | 2.5 – 4.5 | 3.3 – 6.7 | 3,849 | 2.5 – 4.5 | 3.3 – 10.0 | ||||||||||||||||||||||||||||
Annual return | 155 | 4.5 – 6.0 | 4.1 – 4.2 | 163 | 4.5 – 6.0 | 6.4 – 6.5 | ||||||||||||||||||||||||||||
Capital | 18,779 | – | 0.0 – 7.2 | 17,400 | – | 2.3 – 7.8 | ||||||||||||||||||||||||||||
For footnotes, see page 249.
The following table illustrates the effects of selected interest rate, equity price, foreign exchange rate and credit spread scenarios on our profit for the year and total equity of our insurance manufacturing subsidiaries.
Where appropriate, we include the impact of the stress on the PVIF in the results of the sensitivity tests. The relationship between the profit and total
equity and the risk factors is non-linear and, therefore, the results disclosed should not be extrapolated to measure sensitivities to different levels of stress. The sensitivities are stated before allowance for management actions which may mitigate the effect of changes in market rates, and for any factors such as policyholder behaviour that may change in response to changes in market risk.
239
Table of Contents
HSBC HOLDINGS PLC
Report of the Directors: Operating and Financial Review(continued)
Sensitivity of HSBC’s insurance manufacturing subsidiaries to market risk factors
(Audited)
| 2012 | 2011 | |||||||||||||||||||||
| Effect on profit for the year US$m | Effect on total equity | Effect on profit for the year US$m | Effect on total equity | |||||||||||||||||||
+ 100 basis points parallel shift in yield curves | 125 | (263 | ) | 108 | (178 | ) | ||||||||||||||||
– 100 basis points parallel shift in yield curves | (208 | ) | 205 | (115 | ) | 191 | ||||||||||||||||
10% increase in equity prices | 91 | 91 | 106 | 106 | ||||||||||||||||||
10% decrease in equity prices | �� | (92 | ) | (92 | ) | (164 | ) | (164 | ) | |||||||||||||
10% increase in US dollar exchange rate compared to all currencies | 40 | 40 | 31 | 31 | ||||||||||||||||||
10% decrease in US dollar exchange rate compared to all currencies | (40 | ) | (40 | ) | (31 | ) | (31 | ) | ||||||||||||||
Sensitivity to credit spread increases | (18 | ) | (50 | ) | (30 | ) | (75 | ) | ||||||||||||||
(Audited)
Credit risk can give rise to losses through default and can lead to volatility in our income statement and balance sheet figures through movements in credit spreads, principally on the US$48bn (2011: US$44bn) non-linked bond portfolio.
As tabulated above, the sensitivity of the net profit after tax of our insurance subsidiaries to the effects of increases in credit spreads has decreased since 2011 due to narrowing of credit spreads experienced in 2012. The balance and related movement are small because about 90% of the debt securities held by our insurance subsidiaries are classified as either held to maturity or available for sale, and consequently any changes in the fair value of these financial investments, absent impairment, would have no effect on the profit after tax. We calculate the sensitivity using simplified assumptions
based on a one-day movement in credit spreads over a two-year period. A confidence level of 99%, consistent with our Group VAR, is applied.
Credit quality
(Audited)
The following table presents an analysis of treasury bills, other eligible bills and debt securities within our Insurance business by measures of credit quality. The five credit quality classifications are defined in the Appendix to Risk on page 253. Only assets supporting liabilities under non-linked insurance and investment contracts and shareholders’ funds are included in the table as financial risk on assets supporting linked liabilities is predominantly borne by the policyholder. 83.5% (2011: 86.6%) of the assets included in the table are invested in investments rated as strong.
Treasury bills, other eligible bills and debt securities in HSBC’s insurance manufacturing subsidiaries
(Audited)
| Neither past due nor impaired | ||||||||||||||||||||||||||||||
| Strong62 US$m | Good US$m | Satisfactory US$m | Sub-standard US$m | Total US$m | ||||||||||||||||||||||||||
At 31 December 2012 | ||||||||||||||||||||||||||||||
Supporting liabilities under non-linked insurance and investment contracts | ||||||||||||||||||||||||||||||
Trading assets – debt securities | 1 | – | 3 | – | 4 | |||||||||||||||||||||||||
Financial assets designated at fair value | 2,807 | 638 | 219 | 178 | 3,842 | |||||||||||||||||||||||||
– treasury and other eligible bills | 39 | – | – | – | 39 | |||||||||||||||||||||||||
– debt securities | 2,768 | 638 | 219 | 178 | 3,803 | |||||||||||||||||||||||||
Financial investments | 34,392 | 4,265 | 1,627 | 187 | 40,471 | |||||||||||||||||||||||||
– debt securities | 34,392 | 4,265 | 1,627 | 187 | 40,471 | |||||||||||||||||||||||||
| ||||||||||||||||||||||||||||||
| 37,200 | 4,903 | 1,849 | 365 | 44,317 | ||||||||||||||||||||||||||
240
Table of Contents
HSBC HOLDINGS PLC
Report of the Directors: Operating and Financial Review(continued)
| Neither past due nor impaired | ||||||||||||||||||||||||||||||
| Strong62 US$m | Good US$m | Satisfactory US$m | Sub-standard US$m | Total US$m | ||||||||||||||||||||||||||
Supporting shareholders’ funds71 | ||||||||||||||||||||||||||||||
Financial assets designated at fair value | 229 | 146 | 13 | 20 | 408 | |||||||||||||||||||||||||
– debt securities | 229 | 146 | 13 | 20 | 408 | |||||||||||||||||||||||||
Financial investments | 2,356 | 353 | 131 | 62 | 2,902 | |||||||||||||||||||||||||
– debt securities | 2,356 | 353 | 131 | 62 | 2,902 | |||||||||||||||||||||||||
| ||||||||||||||||||||||||||||||
| 2,585 | 499 | 144 | 82 | 3,310 | ||||||||||||||||||||||||||
Total64 | ||||||||||||||||||||||||||||||
Trading assets – debt securities | 1 | – | 3 | – | 4 | |||||||||||||||||||||||||
Financial assets designated at fair value | 3,036 | 784 | 232 | 198 | 4,250 | |||||||||||||||||||||||||
– treasury and other eligible bills | 39 | – | – | – | 39 | |||||||||||||||||||||||||
– debt securities | 2,997 | 784 | 232 | 198 | 4,211 | |||||||||||||||||||||||||
Financial investments | 36,748 | 4,618 | 1,758 | 249 | 43,373 | |||||||||||||||||||||||||
– debt securities | 36,748 | 4,618 | 1,758 | 249 | 43,373 | |||||||||||||||||||||||||
| ||||||||||||||||||||||||||||||
| �� | ||||||||||||||||||||||||||||||
| 39,785 | 5,402 | 1,993 | 447 | 47,627 | ||||||||||||||||||||||||||
At 31 December 2011 | ||||||||||||||||||||||||||||||
Supporting liabilities under non-linked insurance and investment contracts | ||||||||||||||||||||||||||||||
Trading assets – debt securities | 1 | – | 2 | – | 3 | |||||||||||||||||||||||||
Financial assets designated at fair value | 2,851 | 168 | 349 | 143 | 3,511 | |||||||||||||||||||||||||
– treasury and other eligible bills | 107 | – | – | – | 107 | |||||||||||||||||||||||||
– debt securities | 2,744 | 168 | 349 | 143 | 3,404 | |||||||||||||||||||||||||
Financial investments | 32,062 | 2,716 | 1,269 | 196 | 36,243 | |||||||||||||||||||||||||
– debt securities | 32,062 | 2,716 | 1,269 | 196 | 36,243 | |||||||||||||||||||||||||
| ||||||||||||||||||||||||||||||
| 34,914 | 2,884 | 1,620 | 339 | 39,757 | ||||||||||||||||||||||||||
Supporting shareholders’ funds71 | ||||||||||||||||||||||||||||||
Financial assets designated at fair value | 341 | 348 | 61 | 45 | 795 | |||||||||||||||||||||||||
– debt securities | 341 | 348 | 61 | 45 | 795 | |||||||||||||||||||||||||
Financial investments | 3,198 | 560 | 83 | 29 | 3,870 | |||||||||||||||||||||||||
– other eligible bills | 50 | – | – | – | 50 | |||||||||||||||||||||||||
– debt securities | 3,148 | 560 | 83 | 29 | 3,820 | |||||||||||||||||||||||||
| ||||||||||||||||||||||||||||||
| 3,539 | 908 | 144 | 74 | 4,665 | ||||||||||||||||||||||||||
Total64 | ||||||||||||||||||||||||||||||
Trading assets – debt securities | 1 | – | 2 | – | 3 | |||||||||||||||||||||||||
Financial assets designated at fair value | 3,192 | 516 | 410 | 188 | 4,306 | |||||||||||||||||||||||||
– treasury and other eligible bills | 107 | – | – | – | 107 | |||||||||||||||||||||||||
– debt securities | 3,085 | 516 | 410 | 188 | 4,199 | |||||||||||||||||||||||||
Financial investments | 35,260 | 3,276 | 1,352 | 225 | 40,113 | |||||||||||||||||||||||||
– other eligible bills | 50 | – | – | – | 50 | |||||||||||||||||||||||||
– debt securities | 35,210 | 3,276 | 1,352 | 225 | 40,063 | |||||||||||||||||||||||||
| ||||||||||||||||||||||||||||||
| 38,453 | 3,792 | 1,764 | 413 | 44,422 | ||||||||||||||||||||||||||
For footnotes, see page 249.
Credit risk also arises when assumed insurance risk is ceded to reinsurers. The split of liabilities ceded to reinsurers and outstanding reinsurance recoveries, analysed by credit quality, is shown
below. Our exposure to third parties under the reinsurance agreements described in the Appendix to Risk on page 274 is included in this table.
241
Table of Contents
HSBC HOLDINGS PLC
Report of the Directors: Operating and Financial Review(continued)
Reinsurers’ share of liabilities under insurance contracts
(Audited)
| Neither past due nor impaired | Past due | |||||||||||||||||||||||||||||||||
| Strong | Good | Satisfactory | Sub- standard | but not impaired | Total | |||||||||||||||||||||||||||||
| US$m | US$m | US$m | US$m | US$m | US$m | |||||||||||||||||||||||||||||
At 31 December 2012 | ||||||||||||||||||||||||||||||||||
Linked insurance contracts | 55 | 400 | – | – | – | 455 | ||||||||||||||||||||||||||||
Non-linked insurance contracts | 936 | 4 | 6 | – | 6 | 952 | ||||||||||||||||||||||||||||
Total64 | 991 | 404 | 6 | – | 6 | 1,407 | ||||||||||||||||||||||||||||
Reinsurance debtors | 19 | 133 | – | – | 8 | 160 | ||||||||||||||||||||||||||||
At 31 December 2011 | ||||||||||||||||||||||||||||||||||
Linked insurance contracts | 45 | 858 | – | – | – | 903 | ||||||||||||||||||||||||||||
Non-linked insurance contracts | 782 | 10 | 104 | 3 | – | 899 | ||||||||||||||||||||||||||||
Total64 | 827 | 868 | 104 | 3 | – | 1,802 | ||||||||||||||||||||||||||||
Reinsurance debtors | 18 | 2 | 9 | 1 | 12 | 42 | ||||||||||||||||||||||||||||
For footnote, see page 249.
(Audited)
The following tables show the expected undiscounted cash flows for insurance contract liabilities and the remaining contractual maturity of investment contract liabilities at 31 December 2012. A significant proportion of our non-life insurance business is viewed as short-term, with the settlement of liabilities expected to occur within one year of the
period of risk. There is a greater spread of expected maturities for the life business where, in a large proportion of cases, the liquidity risk is borne in conjunction with policyholders (wholly borne by the policyholder in the case of unit-linked business).
The profile of the expected maturity of the insurance contracts at 31 December 2012 remained comparable with 2011.
Expected maturity of insurance contract liabilities
(Audited)
| Expected cash flows (undiscounted) | ||||||||||||||||||||||||||||
| Within 1 year | 1-5 years | 5-15 years | Over 15 years | Total | ||||||||||||||||||||||||
| US$m | US$m | US$m | US$m | US$m | ||||||||||||||||||||||||
At 31 December 2012 | ||||||||||||||||||||||||||||
Non-life insurance | 78 | 3 | – | – | 81 | |||||||||||||||||||||||
Life insurance (non-linked) | 4,176 | 12,199 | 23,420 | 27,836 | 67,631 | |||||||||||||||||||||||
Life insurance (linked) | 1,243 | 3,761 | 10,446 | 13,497 | 28,947 | |||||||||||||||||||||||
Total64 | 5,497 | 15,963 | 33,866 | 41,333 | 96,659 | |||||||||||||||||||||||
At 31 December 2011 | ||||||||||||||||||||||||||||
Non-life insurance | 742 | 704 | 176 | 13 | 1,635 | |||||||||||||||||||||||
Life insurance (non-linked) | 2,006 | 12,243 | 21,332 | 25,990 | 61,571 | |||||||||||||||||||||||
Life insurance (linked) | 920 | 3,262 | 9,070 | 15,546 | 28,798 | |||||||||||||||||||||||
Total64 | 3,668 | 16,209 | 30,578 | 41,549 | 92,004 | |||||||||||||||||||||||
For footnote, see page 249.
242
Table of Contents
HSBC HOLDINGS PLC
Report of the Directors: Operating and Financial Review(continued)
Remaining contractual maturity of investment contract liabilities
(Audited)
Liabilities under investment contracts by insurance manufacturing subsidiaries | ||||||||||||||||||||||
Linked investment contracts | Other investment contracts | Investment contracts with DPF | Total | |||||||||||||||||||
| US$m | US$m | US$m | US$m | |||||||||||||||||||
At 31 December 2012 | ||||||||||||||||||||||
Remaining contractual maturity:64 | ||||||||||||||||||||||
– due within 1 year | 195 | 458 | 4 | 657 | ||||||||||||||||||
– due between 1 and 5 years | 675 | – | – | 675 | ||||||||||||||||||
– due between 5 and 10 years | 731 | – | – | 731 | ||||||||||||||||||
– due after 10 years | 2,061 | – | – | 2,061 | ||||||||||||||||||
– undated72 | 5,029 | 3,762 | 24,370 | 33,161 | ||||||||||||||||||
| 8,691 | 4,220 | 24,374 | 37,285 | |||||||||||||||||||
At 31 December 2011 | ||||||||||||||||||||||
Remaining contractual maturity:64 | ||||||||||||||||||||||
– due within 1 year | 191 | 438 | 8 | 637 | ||||||||||||||||||
– due between 1 and 5 years | 595 | – | 3 | 598 | ||||||||||||||||||
– due between 5 and 10 years | 548 | – | – | 548 | ||||||||||||||||||
– due after 10 years | 2,063 | – | – | 2,063 | ||||||||||||||||||
– undated72 | 4,416 | 3,583 | 21,477 | 29,476 | ||||||||||||||||||
| 7,813 | 4,021 | 21,488 | 33,322 | |||||||||||||||||||
For footnotes, see page 249.
Present value of in-force long-term insurance business
(Audited)
Our life insurance business is accounted for using the embedded value approach which,inter alia, provides a risk and valuation framework. The PVIF asset at 31 December 2012 was US$4.8bn (2011: US$4.1bn), representing the present value of the shareholders’ interest in the profits expected to emerge from the book of in-force policies at that date.
The PVIF calculation projects expected cash flows, adjusted for a variety of assumptions made by each insurance operation to reflect local market conditions and management’s judgement of future trends. The main assumptions relate to economic and non-economic assumptions and policyholder behaviour. Assumptions are subject to uncertainty and can contribute to volatility in the results of the Insurance business.
The key drivers of the movement in the value of the PVIF asset are the expected cash flows from:
| • | new business adjusted for anticipated maturities and assumptions relating to policyholder behaviour (‘Value of new business written during the year’); |
| • | unwind of the discount rate less the reversal of expected cash flows for the period (‘Expected return’); |
| • | changes in non-economic operating assumptions such as mortality or lapse rates (‘Change in operating assumptions’); |
| • | impacts arising from changes in projected future cash flows associated with operating assumption experience variances compared to those assumed at the start of the period (‘Experience variances’); |
| • | changes related to future investment returns (‘Changes in investment assumptions’); and |
| • | the impact of actual investment experience on future cash flows compared to those assumed at the start of the period (‘Investment return variances’). |
The valuation of the PVIF asset includes explicit risk margins for non-economic risks in the projection assumptions and explicit allowances for financial options and guarantees using stochastic methods. Risk discount rates are set on an active basis with reference to market risk free yields.
The following table shows the movements recorded during the year in respect of total equity and PVIF of insurance operations.
243
Table of Contents
HSBC HOLDINGS PLC
Report of the Directors: Operating and Financial Review(continued)
Movements in PVIF and total equity of insurance operations
(Audited)
| 2012 | 2011 | |||||||||||||||||||||
| PVIF | Total equity | PVIF | Total equity | |||||||||||||||||||
| US$m | US$m | US$m | US$m | |||||||||||||||||||
At 1 January | 4,092 | 10,629 | 3,440 | 9,778 | ||||||||||||||||||
| ||||||||||||||||||||||
Change in PVIF of long-term insurance business | 737 | 737 | 726 | 726 | ||||||||||||||||||
Value of new business written during the year73 | 1,027 | 943 | ||||||||||||||||||||
Movements arising from in-force business: | ||||||||||||||||||||||
– expected return | (420 | ) | (428 | ) | ||||||||||||||||||
– experience variances74 | 12 | 1 | ||||||||||||||||||||
– changes in operating assumptions | (3 | ) | (222 | ) | ||||||||||||||||||
Investment return variances | (18 | ) | (103 | ) | ||||||||||||||||||
Changes in investment assumptions | 78 | 294 | ||||||||||||||||||||
Other adjustments | 61 | 241 | ||||||||||||||||||||
Return on net assets | – | 1,232 | – | 1,057 | ||||||||||||||||||
Capital transactions | – | (1,525 | ) | – | (500 | ) | ||||||||||||||||
Disposals of subsidiaries/portfolios | – | (382 | ) | – | (96 | ) | ||||||||||||||||
Exchange differences and other | 18 | (702 | ) | (74 | ) | (336 | ) | |||||||||||||||
At 31 December | 4,847 | 9,989 | 4,092 | 10,629 | ||||||||||||||||||
For footnotes, see page 249.
Other adjustments for 2012 included a one-off gain of US$119m for a PVIF asset recognised on linked insurance business in Brazil. For 2011, other
adjustments related to the US$243m gain recognised upon refinement of the PVIF calculation.
Key assumptions used in the computation of PVIF for main life insurance operations
(Audited)
| 2012 | 2011 | |||||||||||||||||||||||||
| UK | Hong Kong | France | UK | Hong Kong | France | |||||||||||||||||||||
| % | % | % | % | % | % | |||||||||||||||||||||
Risk free rate | 1.53 | 0.60 | 2.12 | 2.24 | 1.47 | 2.77 | ||||||||||||||||||||
Risk discount rate | 2.03 | 7.46 | 4.05 | 2.74 | 8.00 | 5.95 | ||||||||||||||||||||
Expense inflation | 2.84 | 3.00 | 2.00 | 3.45 | 3.00 | 2.00 | ||||||||||||||||||||
(Audited)
The following table shows the effect on the PVIF of reasonably possible changes in the main economic assumption, risk-free rates, across all insurance manufacturing subsidiaries.
Due to certain characteristics of the contracts, the relationships are non-linear and the results of the sensitivity testing should not be extrapolated to higher levels of stress. The sensitivities shown are before actions that could be taken by management to mitigate effects and before resultant changes in policyholder behaviour.
Sensitivity of PVIF to changes in economic assumptions
(Audited)
| PVIF at 31 December | ||||||||
| 2012 | 2011 | |||||||
| US$m | US$m | |||||||
+ 100 basis point shift in risk-free rate | 137 | 128 | ||||||
– 100 basis point shift in risk-free rate | (191 | ) | (91 | ) | ||||
244
Table of Contents
HSBC HOLDINGS PLC
Report of the Directors: Operating and Financial Review(continued)
(Audited)
We determine the policyholder liabilities for non-life manufacturers by reference to non-economic assumptions including claims costs and expense rates.
Policyholder liabilities and PVIF for life manufacturers are determined by reference to non-economic assumptions including mortality and/or morbidity, lapse rates and expense rates. The table below shows the sensitivity of profit for 2012 and total equity at 31 December 2012 to reasonably possible changes in these non-economic assumptions at that date across all our insurance manufacturing subsidiaries, with comparatives for 2011.
The cost of claims is a risk associated with non-life insurance business. An increase in claims costs would have a negative effect on profit. Sensitivities have significantly decreased since 2011 due to the disposal of the non-life entities or portfolios in Argentina, Hong Kong, Ireland and Singapore during 2012.
Mortality and morbidity risk is typically associated with life insurance contracts. The effect on profit of an increase in mortality or morbidity depends on the type of business being written. Our largest exposures to mortality and morbidity risk exist in Brazil, France, Hong Kong and the US.
Sensitivity to lapse rates depends on the type of contracts being written. For insurance contracts, claims are funded by premiums received and income earned on the investment portfolio supporting the liabilities. For a portfolio of term assurance, an increase in lapse rates typically has a negative effect on profit due to the loss of future premium income on the lapsed policies. However, some contract lapses have a positive effect on profit due to the existence of policy surrender charges. Brazil, France, Hong Kong and the UK are where we are most sensitive to a change in lapse rates.
Expense rate risk is the exposure to a change in expense rates. To the extent that increased expenses cannot be passed on to policyholders, an increase in expense rates will have a negative impact on our profits.
(Audited)
| Effect on profit and total equity at 31 December | ||||||||||||
| Life | Non-life | Total | ||||||||||
| US$m | US$m | US$m | ||||||||||
2012 | ||||||||||||
20% increase in claims costs | – | (12 | ) | (12 | ) | |||||||
20% decrease in claims costs | – | 12 | 12 | |||||||||
10% increase in mortality and/or morbidity rates | (88 | ) | – | (88 | ) | |||||||
10% decrease in mortality and/or morbidity rates | 92 | – | 92 | |||||||||
50% increase in lapse rates | (491 | ) | – | (491 | ) | |||||||
50% decrease in lapse rates | 842 | – | 842 | |||||||||
10% increase in expense rates | (105 | ) | (1 | ) | (106 | ) | ||||||
10% decrease in expense rates | 106 | 1 | 107 | |||||||||
2011 | ||||||||||||
20% increase in claims costs | – | (135 | ) | (135 | ) | |||||||
20% decrease in claims costs | – | 135 | 135 | |||||||||
10% increase in mortality and/or morbidity rates | (100 | ) | – | (100 | ) | |||||||
10% decrease in mortality and/or morbidity rates | 110 | – | 110 | |||||||||
50% increase in lapse rates | (349 | ) | – | (349 | ) | |||||||
50% decrease in lapse rates | 609 | – | 609 | |||||||||
10% increase in expense rates | (89 | ) | (12 | ) | (101 | ) | ||||||
10% decrease in expense rates | 89 | 12 | 101 | |||||||||
245
Table of Contents
HSBC HOLDINGS PLC
Report of the Directors: Operating and Financial Review(continued)
| Page | App1 | Tables | Page | |||||
| 246 | 278 | |||||||
| ||||||||
| 246 | 278 | |||||||
| 279 | ||||||||
| 246 | The principal plan – target asset allocation | 247 | ||||||
| Benefit payments (US$m) | 247 | |||||||
| 248 | ||||||||
| 279 | ||||||||
The HSBC Group Hong Kong Local Staff Retirement Benefit Scheme | 248 | |||||||
| 280 | ||||||||
| 249 | ||||||||
| ||||||||
| 249 | 280 | |||||||
| ||||||||
1Appendix to Risk – risk policies and practices. | ||||||||
(Unaudited)
The safeguarding of our reputation is paramount. It is the responsibility of all members of staff, supported by a global risk management structure underpinned by relevant policies and practices, readily available guidance, and regular training.
We have acknowledged, in the context of last year’s US Senate Permanent Subcommittee on Investigations, the Deferred Prosecution Agreements with US authorities and the undertakings with the UK FSA, that it was not enough to fix the specific issues that they focused on. Additionally, therefore, we have outlined our implementation of a global strategy to tackle the root causes of these identified deficiencies.
With a new senior leadership team and a new strategy in place since 2011, HSBC has already taken steps to augment the framework to address these issues including making significant changes to strengthen compliance, risk management and culture. These steps, which should also serve, over time, to enhance our reputational risk management, are discussed further on page 278.
Success in detecting and preventing illicit actors’ access to the global financial system calls for constant vigilance and HSBC will continue to work in close cooperation with all governments to achieve this. This is integral to the execution of HSBC’s strategy, to our core values and to preserving and enhancing our reputation.
(Audited)
We operate a number of pension plans throughout the world. Some are defined benefit plans, of which the largest is the HSBC Bank (UK) Pension Scheme (‘the principal plan’).
There were no material changes to our policies and procedures for the management of pension risk in 2012.
During 2012, the Group’s defined benefit pension plans reduced from a net liability of US$0.2bn to a net asset of US$0.03bn. This was mainly due to growth in the value of the principal plan’s assets outstripping the comparable growth in liabilities.
(Audited)
In 2006 the principal plan assets consisted of a strategic portfolio. At the time, HSBC and the trustee of the principal plan agreed to change the investment strategy in order to reduce the investment risk. The target asset allocations for this strategy at that time, as revised in 2011 and at this year end are shown below, demonstrating the ongoing evolution of the strategy. The strategy is to hold the majority of assets in bonds, with the remainder in a more diverse range of investments, and includes a commitment to undertake a programme of swap arrangements (see Note 44 on the Financial Statements) by which the principal plan makes Libor-related interest payments in exchange for the receipt of cash flows which are based on projected future benefit payments to be made from the principal plan.
246
Table of Contents
HSBC HOLDINGS PLC
Report of the Directors: Operating and Financial Review(continued)
The principal plan – target asset allocation
| 2012 | 2011 | 2006 | ||||||||||||||
| % | % | % | ||||||||||||||
Equities | 15.5 | 15.5 | 15.0 | |||||||||||||
Bonds | 60.5 | 60.5 | 50.0 | |||||||||||||
Alternative assets75 | 9.5 | 9.5 | 10.0 | |||||||||||||
Property | 9.0 | 9.0 | 10.0 | |||||||||||||
Cash | 5.5 | 5.5 | 15.0 | |||||||||||||
| 100.0 | 100.0 | 100.0 | ||||||||||||||
For footnote, see page 249.
As a result of a special contribution to the principal plan in June 2010 of £1,760m (US$2,638m), a cash generating portfolio was established. The portfolio comprised supra-national, agency and government-guaranteed securities, ABSs, corporate subordinated debt and auction rate securities. A further special contribution in December 2011 of £184m (US$286m) added to this portfolio. The contribution was used to purchase ABSs from HSBC at an arm’s length value determined by the Scheme’s independent third-party advisers. However, these assets may be supplemented with other assets from time to time.
The latest actuarial valuation of the principal plan was made as at 31 December 2011 by C G Singer, Fellow of the Institute of Actuaries, of Towers Watson Limited. At that date, the market value of the HSBC Bank (UK) Pension Scheme’s assets was £18.3bn (US$28.3bn) (including assets relating to the defined benefit plan, the defined contribution plan and additional voluntary contributions). The market value of the plan assets represented 100% of the amount expected to be required, on the basis of the assumptions adopted, to provide the benefits accrued to members after allowing for expected future increases in earnings. There was therefore no resulting surplus/deficit. The method adopted for this valuation was the projected unit method.
The expected cash flows from the principal plan were projected by reference to the Retail Price Index (‘RPI’) swap break-even curve at 31 December 2011. Salary increases were assumed to be 0.5% per annum above RPI and inflationary pension increases, subject to a minimum of 0% and a maximum of 5% (maximum of 3% per annum in respect of service accrued since 1 July 2009), were assumed to be in line with RPI. The projected cash flows were discounted at the Libor swap curve at 31 December 2011 plus a margin for the expected return on the investment strategy of 160bps per annum. The mortality experience of the principal plan’s pensioners over the six-year period (2006-2011) was analysed and, on the basis of this analysis, the mortality assumptions were set, based on the SAPS S1 series of tables adjusted to reflect the
pensioner experience. Allowance was made for future improvements to mortality rates in line with the Continuous Mortality Investigation core projections with a long run improvement rate set at 2% for males and 1.5% for females. The benefits payable from the defined benefit plan from 2013 are expected to be as shown in the chart below.
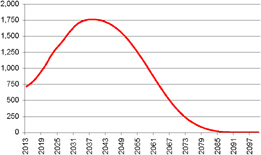
As part of the 31 December 2011 valuation, calculations were also carried out as to the amount of assets that might be needed to meet the liabilities if the Scheme was discontinued and the members’ benefits bought out with an insurance company (although in practice this may not be possible for a plan of this size) or the Trustee continued to run the plan without the support of HSBC. The amount required under this approach was estimated to be £26.2bn (US$40.6bn) as at 31 December 2011. In arriving at this estimation, a more prudent assumption about future mortality was made than for the assessment of the ongoing position and it was assumed that the Trustee would alter the investment strategy to be an appropriately matched portfolio of UK government bonds. An explicit allowance for expenses was also included.
Based on the latest valuation as at 31 December 2011 and there being no deficit, no Technical Provisions Recovery Plan is required and the schedule of future funding payments agreed after the 2008 actuarial valuation was dissolved.
HSBC and the Trustee have developed a general framework, which, over time, will see the Scheme’s asset strategy evolve to be less risky and further aligned to future cash-flows, referred to as the Target Matching Portfolio (‘TMP’). Evolution to the TMP can be achieved by asset returns in excess of that assumed and/or additional funding. In February 2013, HSBC agreed to make three general framework contributions of £64m (US$103m) in each of the calendar years 2013, 2014 and 2015.
247
Table of Contents
HSBC HOLDINGS PLC
Report of the Directors: Operating and Financial Review(continued)
After the 2008 valuation, HSBC considered that the agreed recovery plan payments, together with investment returns (at an expected level of 240 basis points above the Libor swap curve), would be sufficient to meet the deficit as at 31 December 2008 over the agreed period. HSBC also agreed with the Trustee, that at each subsequent actuarial valuation any shortfall in investment returns relative to this expected level, subject to a maximum of 50 basis points per annum, would be eliminated by payment of equal cash instalments over the remaining years to the end of the recovery plan period.
Although the 2011 triennial valuation disclosed no deficit and therefore no technical provisions recovery plan is required, HSBC and the Trustee have agreed to maintain this investment performance underwriting agreement. The investment performance will be assessed every three years, with an end date of 31 December 2017. Any payments due would only be payable if a Technical Provisions deficit is present at the reference date.
HSBC Bank is also making ongoing contributions to the principal plan in respect of the accrual of benefits of defined benefit section members. Since April 2010, after completion of the 2008 valuation, HSBC has paid contributions at the rate of 34% of pensionable salaries (less member contributions).
Following completion of the 2011 triennial valuation, HSBC will pay contributions at the rate of 43% of pensionable salaries (less member contributions) from 1 April 2013. An additional employer contribution will be paid on or before 30 April 2013 equal to 9% of pensionable salaries, in respect of the period 1 January 2012 to 31 March 2013.
(Unaudited)
In January 2013, as part of a wider review of employee benefits, HSBC announced proposals to cease future accrual of service for active members of the Defined Benefit Section with effect from 30 June 2014. Under the proposals, all active members of the Defined Benefit Section will become deferred members from 30 June 2014 (and will become members of the Defined Contribution Section from 1 July 2014).
The valuation of the Scheme’s defined benefit obligation is sensitive to changes in actuarial assumptions. The proposed removal of future salary escalation from the pay assumptions is estimated to reduce the defined benefit obligation by approximately US$0.3bn and the proposed change in
the underlying inflation assumption for indexation from RPI, for active members, to CPI, for deferred members, by a further US$0.5bn. The proposed cessation of the Scheme to provide ill-health benefits to members, to be covered by insurance policies provided by HSBC under these proposals, is estimated to reduce the defined benefit obligation by approximately US$0.5bn.
The consultation period for these proposals will end, and a final decision is expected to be made, in the second quarter of 2013 at which time a past service credit will be recognised in the income statement.
The future effect of these proposed changes on the income statement is dependent primarily on the level of pension contributions made by HSBC and employees to the Defined Contribution Section, the final outcome of which remains uncertain. In all reasonably likely scenarios, the net effect on earnings over time is not expected to be material.
The HSBC Group Hong Kong Local Staff Retirement Benefit Scheme
(Audited)
The scheme mainly invests in bonds with a smaller portion in equities and each investment manager has been assigned an investment mandate with the targeted asset allocation. The ranges of target asset allocations for the portfolio are as follows: Bonds and cash 55-100%, Equity 0-25% and Alternative Investments 0-20%. Alternative Investments refer to high-return and high-risk alternatives, including but not limited to private equity funds, hedge funds, energy, gold, agriculture, commodities and distressed assets.
The latest actuarial valuation of the defined benefit scheme was made at 31 December 2010 by Wing Lui, Fellow of the Society of Actuaries, of Towers Watson Hong Kong Limited. At that valuation date, the market value of the defined benefit scheme’s assets was US$1,109m. On an ongoing basis, the defined benefit scheme’s assets represented 104% of the actuarial present value of the benefits accrued to members, after allowing for expected future increases in salaries, and the resulting surplus amounted to US$41m. On a wind-up basis, the scheme’s assets represented 110% of the members’ vested benefits, based on current salaries, and the resulting surplus amounted to US$105m. The attained age method has been adopted for the valuation and the major assumptions used in this valuation were a discount rate of 6% per annum and long-term salary increases of 5% per annum. The recommended employer contribution rate as a percentage of scheme salaries is 14.3% over
248
Table of Contents
HSBC HOLDINGS PLC
Report of the Directors: Operating and Financial Review(continued)
the period 1 January 2011 to 31 December 2013. No additional special contributions have been agreed.
The HSBC North America (US) Retirement Income Plan
(Audited)
In 2010, the Investment Committee (the ‘Committee’) unanimously agreed to transition the Plan’s target asset allocation mix to 40% equity securities, 59% fixed income securities and 1% cash over a 24-month period. In 2011, the Committee decided to accelerate this shift to the 2011 year-end and the target asset allocation mix was maintained during 2012. Should interest rates rise faster than currently projected by the Committee, a further shift to a higher percentage of fixed income securities may be made.
In the third quarter of 2012, it was agreed to cease all future contributions under the cash balance formula and freeze the plan with effect from 1 January 2013. While participants with existing balances continue to receive interest credits until the account is distributed, they no longer accrue benefits beginning in 2013.
The most recent actuarial valuation of the plan to determine compliance with US statutory funding requirements was made at 1 January 2012 by Jennifer Jakubowski, Fellow of the Society of Actuaries, Enrolled Actuary, member of the American Academy of Actuaries, formerly of Mercer. At that date, the market value of the plan’s
assets was US$3,194m. The assets represented 118% of the benefits accrued to members as valued under the provisions of the Pension Protection Act of 2006 that was effective for the plan year beginning 1 January 2008. The resulting surplus amounted to US$479m. The method employed for this valuation was the traditional unit credit method and the discount rate was determined using a segment rate method as selected by HSBC under the relevant regulations, which resulted in an effective interest rate of 7.13% per annum.
(Unaudited)
Assessing the environmental and social impacts of providing finance to our customers is integral to our overall risk management processes.
In 2012, we implemented several changes to our policies and procedures to streamline our management of sustainability risks. This ranged from producing guidelines on how we extend the Equator Principles beyond project finance into corporate loans, to technical fixes in our systems to improve the accuracy of our management information.
| A summary of our current policies and practices regarding reputational risk, pension risk and sustainability risk is provided in the Appendix to Risk on page 278. |
Footnotes to Risk
Credit risk
| 1 | ‘Other personal loans and advances’ include second lien mortgages and other property-related lending. |
| 2 | ‘Financial’ includes loans and advances to banks. |
| 3 | The amount of the loan commitments reflects, where relevant, the expected level of take-up of pre-approved loan offers made by mailshots to personal customers. In addition to those amounts, there is a further maximum possible exposure to credit risk of US$28bn (2011: US$171bn), reflecting the full take-up of such irrevocable loan commitments. The take-up of such offers is generally at modest levels. |
| 4 | Includes residential mortgages of HSBC Bank USA and HSBC Finance. |
| 5 | Comprising Rest of Asia-Pacific, Middle East and North Africa, and Latin America. |
| 6 | HSBC Finance lending is shown on a management basis and includes loans transferred to HSBC USA Inc. which are managed by HSBC Finance. |
| 7 | Property acquired through foreclosure is initially recognised at the lower of the carrying amount of the loan or its fair value less estimated costs to sell (‘Initial Foreclosed Property Carrying Amount’). The average loss on sale of foreclosed properties is calculated as cash proceeds less the Initial Foreclosed Properties Carrying Amount divided by the unpaid loan principal balance prior to write-down (excluding any accrued finance income) plus certain other ancillary disbursements that, by law, are reimbursable from the cash proceeds (e.g. real estate tax advances) and were incurred prior to our taking title to the property. This ratio represents the portion of our total loss on foreclosed properties that occurred after we took title to the property. |
| 8 | The average total loss on foreclosed properties includes both the loss on sale of the foreclosed property as discussed in footnote 7 and the cumulative write-downs recognised on the loans up to the time we took title to the property. |
| 9 | ‘Other commercial loans and advances’ include advances in respect of agriculture, transport, energy and utilities. |
| 10 | Impairment allowances are not reported for financial instruments whereby the carrying amount is reduced directly for impairment and not through the use of an allowance account. |
| 11 | Impairment is not measured for assets held in trading portfolios or designated at fair value as assets in such portfolios are managed according to movements in fair value, and the fair value movement is taken directly to the income statement. Consequently, we report all such balances under ‘Neither past due nor impaired’. |
| 12 | ‘Loans and advances to customers’ includes asset-backed securities that have been externally rated as strong (2012: US$2.3bn; 2011: US$3.5bn), good (2012: US$457m; 2011: US$476m), satisfactory (2012: US$390m; 2011: US$428m), sub-standard (2012: US$422m; 2011: US$556m) and impaired (2012: US$259m; 2011: US$229m). |
249
Table of Contents
HSBC HOLDINGS PLC
Report of the Directors: Operating and Financial Review(continued)
| 13 | Included in this category are loans of US$2.3bn (2011: US$2.9bn) that have been re-aged once and were less than 60 days past due at the point of re-age. These loans are not classified as impaired following re-age due to the overall expectation that these customers will perform on the original contractual terms of their borrowing in the future. |
| 14 | ‘Impaired loans and advances’ are those classified as CRR 9, CRR 10, EL 9 or EL 10, retail loans 90 days or more past due, unless individually they have been assessed as not impaired (see page 156, ‘Past due but not impaired gross financial instruments’) and renegotiated loans and advances meeting the criteria to be disclosed as impaired (see page 162). |
| 15 | ‘Collectively assessed loans and advances’ comprise homogeneous groups of loans that are not considered individually significant, and loans subject to individual assessment where no impairment has been identified on an individual basis, but on which a collective impairment allowance has been calculated to reflect losses which have been incurred but not yet identified. |
| 16 | ‘Collectively assessed loans and advances not impaired’ are those classified as CRR1 to CRR8 and EL1 to EL8 but excluding retail loans 90 days past due and renegotiated loans and advances meeting the criteria to be disclosed as impaired. |
| 17 | ‘Collectively assessed impairment allowances’ are allocated to geographical segments based on the location of the office booking the allowances or provisions. Consequently, the collectively assessed impairment allowances booked in Hong Kong may cover assets booked in branches located outside Hong Kong, principally in Rest of Asia-Pacific, as well as those booked in Hong Kong. |
| 18 | Included within ‘Exchange and other movements’ is US$0.8bn of impairment allowances reclassified to held for sale (2011: US$1.6bn). |
| 19 | Net of repo transactions, settlement accounts and stock borrowings. |
| 20 | As a percentage of loans and advances to banks and loans and advances to customers, as applicable. |
| 21 | ‘Currency translation’ is the effect of translating the results of subsidiaries and associates for the previous year at the average rates of exchange applicable in the current year. |
| 22 | Negative numbers are favourable: positive numbers are unfavourable. |
| 23 | Equity securities not included. |
| 24 | ‘First lien residential mortgages’ include Hong Kong Government Home Ownership Scheme loans of US$3.2bn at 31 December 2012 (2011: US$3.3bn). Where disclosed, earlier comparatives were 2010: US$3.5bn; 2009: US$3.5bn; 2008: US$3.9bn. |
| 25 | The impairment allowances on loans and advances to banks in 2012 relate to the geographical regions, Europe, North America, and Middle East and North Africa. (2011: Europe and North America). |
| 26 | Carrying amount of the net principal exposure. |
| 27 | Total includes holdings of ABSs issued by The Federal Home Loan Mortgage Corporation (‘Freddie Mac’) and The Federal National Mortgage Association (‘Fannie Mae’). |
| 28 | ‘Directly held’ includes assets held by Solitaire where we provide first loss protection and assets held directly by the Group. |
| 29 | ‘Effect of impairments’ represents the reduction or increase in the reserve on initial impairment and subsequent reversal of impairment of the assets. |
| 30 | The gross principal is the redemption amount on maturity or, in the case of an amortising instrument, the sum of the future redemption amounts through the residual life of the security. |
| 31 | Credit default swap (‘CDS’) gross protection is the gross principal of the underlying instrument that is protected by CDSs. |
| 32 | Net principal exposure is the gross principal amount of assets that are not protected by CDSs. It includes assets that benefit from monoline protection, except where this protection is purchased with a CDS. |
| 33 | Net exposure after legal netting and any other relevant credit mitigation prior to deduction of the credit valuation adjustment. |
| 34 | Cumulative fair value adjustment recorded against exposures to OTC derivative counterparties to reflect their creditworthiness. |
| 35 | Funded exposures represent the loan amount advanced to the customer, less any fair value write-downs, net of fees held on deposit. |
| 36 | Unfunded exposures represent the contractually committed loan facility amount not yet drawn down by the customer, less any fair value write-downs, net of fees held on deposit. |
Eurozone exposures
| 37 | Our available-for-sale holdings in sovereign and agency debt of Italy and Spain include debt held to support insurance contracts which provide discretionary profit participation to policyholders. For such contracts, unrealised movements in liabilities are recognised in other comprehensive income, following the treatment of the unrealised movements on related available-for-sale assets. To the extent that the movements are matched, no movement in the available-for-sale reserve is recognised. For those available-for-sale debt instruments described above that are not held to support insurance contracts which provide discretionary profit participation to policyholders, the available-for-sale reserves at 31 December 2012 were insignificant. |
| 38 | ‘In-country liabilities’ in Italy include liabilities issued under local law but booked outside the country. |
Liquidity and funding
| 39 | The most favourable metrics are a smaller advances to core funding and larger stressed one-month and three-month coverage ratios. |
| 40 | The HSBC UK entity shown comprises three legal entities; HSBC Bank plc (including SPEs consolidated by HSBC Bank plc for Financial Statement purposes, HFC Bank Ltd, and all overseas branches), Marks and Spencer Financial Services Limited and HSBC Trust Company (UK) Limited, managed as a single operating entity, in line with the application of UK liquidity regulation as agreed with the UK FSA. |
| 41 | The Hongkong and Shanghai Banking Corporation represents the bank in Hong Kong including all overseas branches. Each branch is monitored and controlled for liquidity and funding risk purposes as a stand-alone operating entity. |
| 42 | The HSBC USA principal entity shown represents the HSBC USA Inc consolidated group; predominantly HSBC USA Inc and HSBC Bank USA, NA. The HSBC USA Inc consolidated group is managed as a single operating entity. |
| 43 | The total shown for other principal HSBC operating entities represents the combined position of all the other operating entities overseen directly by the Risk Management Meeting of the GMB. |
| 44 | Estimated liquidity value represents the expected realisable value of assets prior to management assumed haircuts. |
| 45 | The undrawn balance for the five largest committed liquidity facilities provided to customers other than facilities to conduits. |
| 46 | The undrawn balance for the total of all committed liquidity facilities provided to the largest market sector, other than facilities to conduits. |
| 47 | As a result of the significant level of disposal groups held for sale at 31 December 2012, the financial liabilities of the disposal groups held for sale has been separately shown in the table. For further details of the disposal groups held for sale, refer to Note 30 on the Financial Statements. |
250
Table of Contents
HSBC HOLDINGS PLC
Report of the Directors: Operating and Financial Review(continued)
Market risk
| 48 | The standard deviation measures the variation of daily revenues about the mean value of those revenues. |
| 49 | Revenues within the daily distribution graph include all revenues booked in Global Markets (gross of brokerage fees). The effect of any month-end adjustments, not attributable to a specific daily market move, is spread evenly over the days in the month in question. The 2012 daily distribution of trading revenues excludes the effect of the one-off credit valuation adjustment on derivative assets of US$903m. |
| 50 | Trading intent portfolios include positions arising from market-making and position taking. |
| 51 | Portfolio diversification is the market risk dispersion effect of holding a portfolio containing different risk types. It represents the reduction in unsystematic market risk that occurs when combining a number of different risk types, for example, interest rate, equity and foreign exchange, together in one portfolio. It is measured as the difference between the sum of the VAR by individual risk type and the combined total VAR. A negative number represents the benefit of portfolio diversification. As the maximum and minimum occur on different days for different risk types, it is not meaningful to calculate a portfolio diversification benefit for these measures. |
| 52 | The total VAR is non-additive across risk types due to diversification effects. |
| 53 | Investments in private equity are primarily made through managed funds that are subject to limits on the amount of investment. Potential new commitments are subject to risk appraisal to ensure that industry and geographical concentrations remain within acceptable levels for the portfolio as a whole. Regular reviews are performed to substantiate the valuation of the investments within the portfolio. |
| 54 | Investments held to facilitate ongoing business include holdings in government-sponsored enterprises and local stock exchanges. |
| 55 | Instead of assuming that all interest rates move together, we group our interest rate exposures into currency blocs whose rates are considered likely to move together. See ‘Cautionary Statement regarding Forward-Looking Statements’ on page 525. |
Risk management of insurance operations
| 56 | HSBC has no insurance manufacturing subsidiaries in the Middle East and North Africa. |
| 57 | The decline in life insurance liabilities in North America reflects the classification of the majority of this business as held for sale at 31 December 2012. At 31 December 2012, the held-for-sale North American life insurance liabilities by contract type comprised credit life contracts (US$15m), annuities (US$723m) and term assurance and other long-term contracts (US$205m). |
| 58 | Insurance contracts and investment contracts with discretionary participation features (‘DPF’) can give policyholders the contractual right to receive, as a supplement to their guaranteed benefits, additional benefits that may be a significant portion of the total contractual benefits, but whose amount and timing are determined by HSBC. These additional benefits are contractually based on the performance of a specified pool of contracts or assets, or the profit of the company issuing the contracts. |
| 59 | Although investment contracts with DPF are financial investments, HSBC continues to account for them as insurance contracts as permitted by IFRS 4. |
| 60 | Net written insurance premiums represent gross written premiums less gross written premiums ceded to reinsurers. |
| 61 | Term assurance includes credit life insurance. |
| 62 | The Other assets column shows shareholder assets as well as assets and liabilities classified as held for sale. The majority of the assets for insurance businesses classified as held for sale are reported as ‘Other assets and investment properties’ and totalled US$2.0bn at 31 December 2012 (2011: US$0.1bn). Assets classified as held for sale consist primarily of debt securities, the majority of which have a ‘strong’ credit rating at 31 December 2012. All liabilities for insurance businesses classified as held for sale are reported in ‘Other liabilities’ and totalled US$1.2bn at 31 December 2012 (2011: US$0.1bn). The majority of these liabilities were life and non-life policyholder liabilities expected to mature after 5 years. |
| 63 | Present value of in-force long-term insurance contracts and investment contracts with DPF. |
| 64 | Does not include associated insurance companies, SABB Takaful Company and Bao Viet Holdings, or joint venture insurance companies, Hana Life and Canara HSBC Oriental Bank of Commerce Life Insurance Company Limited. |
| 65 | Comprise life linked insurance contracts and linked long-term investment contracts. |
| 66 | Comprise life non-linked insurance contracts and non-linked long-term investment contracts. |
| 67 | Comprise non-life insurance contracts. |
| 68 | Comprise mainly loans and advances to banks, cash and intercompany balances with other non-insurance legal entities. |
| 69 | The table excludes contracts where the risk is 100% reinsured. |
| 70 | The majority of reserves for immediate annuities with guarantees are within insurance businesses that are held for sale at 31 December 2012. |
| 71 | Shareholders’ funds comprise solvency and unencumbered assets. |
| 72 | In most cases, policyholders have the option to terminate their contracts at any time and receive the surrender values of their policies. These may be significantly lower than the amounts shown. |
| 73 | Value of net new business during the year is the present value of the projected stream of profits from the business. |
| 74 | Experience variances include the effect of the difference between demographic, expense and persistency assumptions used in the previous PVIF calculation and actual experience observed during the year to the extent this impacts profits on future business. |
Pension risk
| 75 | In 2011 and 2012, alternative assets included ABSs, MBSs and infrastructure assets. In 2006, alternative assets included loans and infrastructure assets. |
251
Table of Contents
HSBC HOLDINGS PLC
Report of the Directors: Operating and Financial Review(continued)
Country distribution of outstandings and cross-border exposures
| 76 | These balances were between 0.75% and 1% of total assets. All other balances were above 1%. |
Risk elements in the loan portfolio
| 77 | In addition to the numbers presented there were US$1.3bn of impaired loans (2011: US$1.5bn); no unimpaired loans contractually past due 90 days or more as to principal or interest (2011: nil); and US$0.4bn of troubled debt restructurings (not included in the classifications above (2011: US$0.1bn)), all relating to assets held for sale at 31 December 2012. |
| 78 | Assets held for resale represent assets obtained by taking possession of collateral held as security for financial assets. |
| 79 | Ratio excludes trading loans classified as in default. |
251a
Table of Contents
HSBC HOLDINGS PLC
Report of the Directors: Operating and Financial Review(continued)
| Appendix to Risk
Risk policies and practices |
This appendix describes the significant policies and practices employed by HSBC in managing our credit risk, liquidity and funding, market risk, operational risk (including compliance risk, legal risk and fiduciary risk), insurance risk, reputational risk, pension risk and sustainability risk.
(Unaudited)
Our strong risk governance reflects the importance placed by the Board on shaping the Group’s risk strategy and managing risks effectively. It is supported by a clear policy framework of risk ownership, by the cascading from the Group Management Board (‘GMB’) of performance scorecards that align business and risk objectives, and by the accountability of all staff for identifying, assessing and managing risks within the scope of their assigned responsibilities. This personal accountability, reinforced by the governance structure, experience and mandatory learning, helps to foster a disciplined and constructive culture of risk management and control throughout HSBC.
Credit risk
(Audited)
The role of an independent credit control unit is fulfilled by the Global Risk function. Credit approval authorities are delegated by the Board to certain executive officers of HSBC Holdings plc. Similar credit approval authorities are delegated by the boards of subsidiary companies to executive officers of the relevant subsidiaries. In each major subsidiary, a Chief Risk Officer reports to the local Chief Executive Officer on credit-related issues, while maintaining a direct functional reporting line to the Group Chief Risk Officer in Global Risk. Details of the roles and responsibilities of the credit risk management function and the policies and procedures for managing credit risk are set out below. Apart from the creation of a new Group Models Oversight Committee and supportive framework there were no significant changes in 2012.
The high-level oversight and management of credit risk provided globally by the Credit Risk function in Global Risk
| • | to formulate Group credit policy. Compliance, subject to approved dispensations, is mandatory for all operating companies which must develop local credit policies consistent with Group policies; |
| • | to guide operating companies on our appetite for credit risk exposure to specified market sectors, activities and banking products and controlling exposures to certain higher-risk sectors; |
| • | to undertake an independent review and objective assessment of risk. Global Risk assesses all commercial non-bank credit facilities and exposures over designated limits, prior to the facilities being committed to customers or transactions being undertaken; |
| • | to monitor the performance and management of portfolios across the Group; |
| • | to control exposure to sovereign entities, banks and other financial institutions, as well as debt securities which are not held solely for the purpose of trading; |
| • | to set Group policy on large credit exposures, ensuring that concentrations of exposure by counterparty, sector or geography do not become excessive in relation to our capital base, and remain within internal and regulatory limits; |
| • | to control our cross-border exposures (see page 259); |
| • | to maintain and develop our risk rating framework and systems, the governance of which is under the general oversight of the Group Model Oversight Committee (‘MOC’). The Group MOC meets bi-monthly and reports to the Risk Management Meeting. It is chaired by the risk function and its membership is drawn from Global Risk and global businesses; |
| • | to report to the Risk Management Meeting, the Group Risk Committee and the Board on high risk portfolios, risk concentrations, country limits and cross-border exposures, large impaired accounts, impairment allowances, stress testing results and recommendations and retail portfolio performance; and |
| • | to act on behalf of HSBC Holdings as the primary interface, for credit-related issues, with the Bank of England, the FSA, local regulators, rating agencies, analysts and counterparts in major banks and non-bank financial institutions. |
252
Table of Contents
HSBC HOLDINGS PLC
Report of the Directors: Operating and Financial Review(continued)
Principal objectives of our credit risk management
| • | to maintain across HSBC a strong culture of responsible lending and a robust risk policy and control framework; |
| • | to both partner and challenge our businesses in defining, implementing and continually re-evaluating our risk appetite under actual and scenario conditions; and |
| • | to ensure there is independent, expert scrutiny of credit risks, their costs and their mitigation. |
Credit quality of financial instruments
(Audited)
Our credit risk rating systems and processes differentiate exposures in order to highlight those with greater risk factors and higher potential severity of loss. In the case of individually significant accounts that are predominantly within our wholesale businesses, risk ratings are reviewed regularly and any amendments are implemented promptly. Within our retail businesses, risk is assessed and managed using a wide range of risk and pricing models to generate portfolio data.
Our risk rating system facilitates the internal ratings-based (‘IRB’) approach under Basel II adopted by the Group to support calculation of our minimum credit regulatory capital requirement. For further details see definitions of our credit quality classifications below.
Special attention is paid to problem exposures in order to accelerate remedial action. When appropriate, our operating companies use specialist units to provide customers with support to help them avoid default wherever possible.
Group and regional Credit Review and Risk Identification teams regularly review exposures and processes in order to provide an independent, rigorous assessment of credit risk across the Group, reinforce secondary risk management controls and share best practice. Internal audit, as a tertiary control function, focuses on risks with a global perspective and on the design and effectiveness of primary and secondary controls, carrying out oversight audits via the sampling of global/regional control frameworks, themed audits of key or emerging risks and project audits to assess major change initiatives.
The five credit quality classifications defined below each encompass a range of more granular, internal credit rating grades assigned to wholesale and retail lending businesses, as well as the external ratings attributed by external agencies to debt securities.
There is no direct correlation between the internal and external ratings at granular level, except to the extent each falls within a single quality classification.
(Unaudited)
|
| Debt securities and other bills |
|
| Wholesale lending and derivatives |
| Retail lending | ||||||||||||||||||||||
External credit rating | Internal credit rating | 12 month default % | Internal credit rating1 | Expected loss % | ||||||||||||||||||||||||
Quality classification | ||||||||||||||||||||||||||||
Strong | A– and above | CRR1 to CRR2 | 0 – 0.169 | EL1 to EL2 | 0 – 0.999 | |||||||||||||||||||||||
Good | BBB+ to BBB– | CRR3 | 0.170 – 0.740 | EL3 | 1.000 – 4.999 | |||||||||||||||||||||||
Satisfactory |
| BB+ to B+ and unrated |
| CRR4 to CRR5 | 0.741 – 4.914 | EL4 to EL5 | 5.000 – 19.999 | |||||||||||||||||||||
Sub-standard | B to C | CRR6 to CRR8 | 4.915 – 99.999 | EL6 to EL8 | 20.000 – 99.999 | |||||||||||||||||||||||
Impaired | Default | CRR9 to CRR10 | 100 | EL9 to EL10 | 100+ or defaulted | 2 | ||||||||||||||||||||||
| 1 | We observe the disclosure convention that, in addition to those classified as EL9 to EL10, retail accounts classified EL1 to EL8 that are delinquent by 90 days or more are considered impaired, unless individually they have been assessed as not impaired (see page 156, ‘Past due but not impaired gross financial instruments’). |
| 2 | The EL percentage is derived through a combination of PD and LGD, and may exceed 100% in circumstances where the LGD is above 100% reflecting the cost of recoveries. |
253
Table of Contents
HSBC HOLDINGS PLC
Report of the Directors: Operating and Financial Review(continued)
Quality classification definitions
| • | ‘Strong’ exposures demonstrate a strong capacity to meet financial commitments, with negligible or low probability of default and/or low levels of expected loss. Retail accounts operate within product parameters and only exceptionally show any period of delinquency. |
| • | ‘Good’ exposures require closer monitoring and demonstrate a good capacity to meet financial commitments, with low default risk. Retail accounts typically show only short periods of delinquency, with any losses expected to be minimal following the adoption of recovery processes. |
| • | ‘Satisfactory’ exposures require closer monitoring and demonstrate an average to fair capacity to meet financial commitments, with moderate default risk. Retail accounts typically show only short periods of delinquency, with any losses expected to be minor following the adoption of recovery processes. |
| • | ‘Sub-standard’ exposures require varying degrees of special attention and default risk is of greater concern. Retail portfolio segments show longer delinquency periods of generally up to 90 days past due and/or expected losses are higher due to a reduced ability to mitigate these through security realisation or other recovery processes. |
| • | ‘Impaired’ exposures have been assessed as impaired. Wholesale exposures where the bank considers that either the customer is unlikely to pay its credit obligations in full, without recourse by the bank to the actions such as realising security if held, or the customer is past due more than 90 days on any material credit obligation. Retail loans and advances greater than 90 days past due unless individually they have been assessed as not impaired. Renegotiated loans that have met the requirements to be disclosed as impaired and have not yet met the criteria to be returned to the unimpaired portfolio (see page 255). |
The customer risk rating (‘CRR’) 10-grade scale summarises a more granular underlying 23-grade scale of obligor probability of default (‘PD’). All HSBC customers are rated using the 10 or 23-grade scale, depending on the degree of sophistication of the Basel II approach adopted for the exposure.
The expected loss (‘EL’) 10-grade scale for retail business summarises a more granular underlying EL scale for these customer segments; this combines obligor and facility/product risk factors in a composite measure.
For debt securities and certain other financial instruments, external ratings have been aligned to the five quality classifications. The ratings of Standard and Poor’s are cited, with those of other agencies being treated equivalently. Debt securities with short-term issue ratings are reported against the long-term rating of the issuer of those securities. If major rating agencies have different ratings for the same debt securities, a prudent rating selection is made in line with regulatory requirements.
Renegotiated loans and forbearance
(Audited)
A range of forbearance strategies is employed in order to improve the management of customer relationships, maximise collection opportunities and, if possible, avoid default, foreclosure or repossession. They include extended payment terms, a reduction in interest or principal repayments, approved external debt management plans, debt consolidations, the deferral of foreclosures, and other forms of loan modifications and re-ageing.
Our policies and practices are based on criteria which enable local management to judge whether repayment is likely to continue. These typically provide a customer with terms and conditions that are more favourable than those provided initially. Loan forbearance is only granted in situations where the customer has showed a willingness to repay the borrowing and is expected to be able to meet the revised obligations.
For retail lending our credit risk management policy sets out restrictions on the number and frequency of renegotiations, the minimum period an account must have been opened before any renegotiation can be considered and the number of qualifying payments that must be received. The application of this policy varies according to the nature of the market, the product and the management of customer relationships through the occurrence of exceptional events.
Identifying renegotiated loans
The contractual terms of a loan may be modified for a number of reasons including changing market conditions, customer retention and other factors not related to the current or potential credit deterioration of a customer. When the contractual payment terms of a loan have been modified because we have significant concerns about the borrower’s ability to meet contractual payments when due, these loans are classified as ‘renegotiated loans’. For the purposes of this disclosure the term ‘forbearance’ is synonymous with the renegotiation of loans.
For retail lending, when considering whether there is ‘significant concern’ regarding a customer’s ability to meet contractual loan repayments when due, we assess the customer’s delinquency status, account behaviour, repayment history, current financial situation and continued ability to repay. Where the customer is not meeting contractual repayments or it is evident that they will be unable to do so without the renegotiation, there will be a significant
254
Table of Contents
HSBC HOLDINGS PLC
Report of the Directors: Operating and Financial Review(continued)
concern regarding their ability to meet contractual payments, and the loan will be disclosed as impaired, unless the concession granted is insignificant as discussed below.
For loan restructurings in wholesale lending, indicators of significant concerns regarding a borrower’s ability to pay include:
| • | the debtor is currently in default on any of its debt; |
| • | the debtor has declared or is in the process of declaring bankruptcy or entering into a similar process; |
| • | there is significant doubt as to whether the debtor will continue to be a going concern; |
| • | currently, the debtor has securities that have been delisted, are in the process of being delisted, or are under threat of being delisted from an exchange as a result of trading or financial difficulties; |
| • | based on estimates and projections that only encompass the current business capabilities, the bank forecasts that the debtor’s entity-specific cash flows will be insufficient to service the debt (both interest and principal) in accordance with the contractual terms of the existing agreement through maturity. Thus actual payment default may not yet have occurred; and |
| • | absent the modification, the debtor cannot obtain funds from sources other than the existing creditors at an effective interest rate equal to the current market interest rate for similar debt for a non-distressed debtor. |
Where the modification of contractual payment terms of a loan represents a concession for economic or legal reasons relating to the borrower’s financial difficulty, and is a concession that we would not otherwise consider, then the renegotiated loan is disclosed as impaired in accordance with our impaired loan disclosure convention described in more detail on page 162, unless the concession is insignificant and there are no other indicators of impairment. Insignificant concessions are primarily restricted to our CML portfolio in HSBC Finance, where loans which are in the early stages of delinquency (less than 60 days delinquent), and typically have the equivalent of two payments deferred for the first time, are excluded from our impaired loan classification as the contractual payment deferrals are deemed to be insignificant compared with payments due on the loan as a whole. For details of HSBC Finance’s loan renegotiated programmes and portfolios, see pages 158 to 162.
Credit quality classification of renegotiated loans
(Audited)
Under IFRSs, an entity is required to assess whether there is objective evidence that financial assets are impaired at the end of each reporting period. A loan is impaired, and an impairment allowance is recognised, when there is objective evidence of a loss event that has an effect on the cash flows of the loan which can be reliably estimated. When we grant a concession to a customer that we would not otherwise consider, as a result of their financial difficulty, this is objective evidence of impairment and impairment losses are measured accordingly.
A renegotiated loan is presented as impaired when:
| • | there has been a change in contractual cash flows as a result of a concession which the lender would otherwise not consider, and |
| • | it is probable that without the concession, the borrower would be unable to meet contractual payment obligations in full. |
This presentation applies unless the concession is insignificant and there are no other indicators of impairment.
The renegotiated loan will continue to be disclosed as impaired until there is sufficient evidence to demonstrate a significant reduction in the risk of non-payment of future cash flows, and there are no other indicators of impairment. For loans that are assessed for impairment on a collective basis, the evidence typically comprises a history of payment performance against the original or revised terms, as appropriate to the circumstances. For loans that are assessed for impairment on an individual basis, all available evidence is assessed on a case by case basis.
For retail lending the minimum period of payment performance required depends on the nature of loans in the portfolio, but is typically not less than six months. Where portfolios have more significant levels of forbearance activity, such as that undertaken by HSBC Finance, the minimum repayment performance period required may be substantially more (for further details on HSBC Finance see page 150). Payment performance periods are monitored to ensure they remain appropriate to the levels of recidivism observed within the portfolio. These performance periods are in addition to the receipt of a minimum of two payments within a 60 day period which must be received for the customer to initially qualify for the renegotiation (in the case of HSBC Finance, in certain circumstances, for example where debt has been restructured in bankruptcy proceedings, fewer or no qualifying payments may be required). The qualifying payments are required in order to demonstrate that the renegotiated terms are sustainable
255
Table of Contents
HSBC HOLDINGS PLC
Report of the Directors: Operating and Financial Review(continued)
for the borrower. For corporate and commercial loans, which are individually assessed for impairment and where non-monthly payments are more commonly agreed, the history of payment performance will depend on the underlying structure of payments agreed as part of the restructure.
Renegotiated loans are classified as unimpaired where the renegotiation has resulted from significant concern about a borrower’s ability to meet their contractual payment terms but the renegotiated terms are based on current market rates and contractual cash flows are expected to be collected in full following the renegotiation. Unimpaired renegotiated loans also include previously impaired renegotiated loans that have demonstrated satisfactory performance over a period of time or have been assessed based on all available evidence as having no remaining indicators of impairment.
Loans that have been identified as renegotiated retain this designation until maturity or derecognition. When a loan is restructured as part of a forbearance strategy and the restructuring results in derecognition of the existing loan, such as in some debt consolidations, the new loan is disclosed as renegotiated.
When determining whether a loan that is restructured should be derecognised and a new loan recognised, we consider the extent to which the changes to the original contractual terms result in the renegotiated loan, considered as a whole, being a substantially different financial instrument. The following are examples of circumstances that are likely to result in this test being met and derecognition accounting being applied:
| • | an uncollateralised loan becomes fully collateralised; |
| • | the addition or removal of cross collateralisation provisions; |
| • | multiple facilities are consolidated into a single new facility; |
| • | removal or addition of conversion features attached to the loan agreement; |
| • | a change in the currency in which the principal or interest is denominated; |
| • | a change in the liquidation preference or ranking of the instrument; or |
| • | the contract is altered in any other manner so that the terms under the new or modified contract are substantially different from those under the original contract. |
The following are examples of factors that we consider may indicate that the revised loan is a substantially different financial instrument, but are unlikely to be conclusive in themselves:
| • | change in guarantees or loan covenants provided; |
| • | less significant changes to collateral arrangements; or |
| • | the addition of repayment provisions or prepayment premium clauses. |
Renegotiated loans and recognition of impairment allowances
(Audited)
For retail lending, renegotiated loans are segregated from other parts of the loan portfolio for collective impairment assessment to reflect the higher rates of losses often encountered in these segments. When empirical evidence indicates an increased propensity to default and higher losses on such accounts, such as for re-aged loans in the US, the use of roll-rate methodology ensures these factors are taken into account when calculating impairment allowances by applying roll rates specifically calculated on the pool of loans subject to forbearance. When the portfolio size is small or when information is insufficient or not reliable enough to adopt a roll-rate methodology, a basic formulaic approach based on historical loss rate experience is used. As a result of our roll-rate methodology, we recognise collective impairment allowances on homogeneous groups of loans, including renegotiated loans, where there is historical evidence that there is a likelihood that loans in these groups will progress through the various stages of delinquency, and ultimately prove irrecoverable as a result of events occurring before the balance sheet date. This treatment applies irrespective of whether or not those loans are presented as impaired in accordance with our impaired loans disclosure convention. When we consider that there are additional risk factors inherent in the portfolios that may not be fully reflected in the statistical roll rates or historical experience, these risk factors are taken into account by adjusting the impairment allowances derived solely from statistical or historical experience. For further details of the risk factor adjustments see ‘Critical accounting policies’ on page 54.
In the corporate and commercial sectors, renegotiated loans are typically assessed individually. Credit risk ratings are intrinsic to the impairment assessment. A distressed restructuring is classified as an impaired loan. The individual impairment assessment takes into account the higher risk of the non-payment of future cash flows inherent in renegotiated loans.
256
Table of Contents
HSBC HOLDINGS PLC
Report of the Directors: Operating and Financial Review(continued)
Corporate and commercial forbearance
(Unaudited)
In the corporate and commercial sectors, forbearance activity is undertaken selectively where it has been identified that repayment difficulties against the original terms already have, or are very likely to, materialise. These cases are treated as impaired loans where:
| • | the customer is experiencing, or is very likely to experience, difficulty in meeting a payment obligation to the bank (i.e. due to current credit distress); and |
| • | the bank is offering to the customer revised payment arrangements which constitute a concession (i.e. it is offering terms it would not normally be prepared to offer). |
These cases are described as distressed restructurings. The agreement of a restructuring which meets the criteria above requires all loans, advances and counterparty exposures to the customer to be treated as impaired. Against the background of this requirement, as a customer approaches the point that it becomes clear that there is an increasing risk that a restructuring of this kind might be necessary, the exposures will typically be regarded as sub-standard to reflect the deteriorating credit risk profile, and will be graded as impaired when the restructure is proposed for approval, or sooner if there is sufficient concern regarding the customer’s likeliness to pay.
For the purposes of determining whether changes to a customer’s agreement should be treated as a distressed restructuring the following types of modification are regarded as concessionary:
| • | transfers from the customer of receivables from third parties, real estate, or other assets to satisfy fully or partially a debt; |
| • | issuance or other granting of an equity interest to satisfy fully or partially a debt unless the equity interest is granted pursuant to existing terms for converting the debt into an equity interest; and |
| • | modification of the terms of a debt, such as one or more of the following: |
| – | reduction (absolute or contingent) of the stated interest rate for the remaining original life of the debt; |
| – | extension of the maturity date or dates at a stated interest rate lower than the current market rate for new debt with similar risk; |
| – | reduction (absolute or contingent) of the face amount or maturity amount of the debt; and |
| – | reduction (absolute or contingent) of accrued interest. |
Modifications that are unrelated to payment arrangements, such as the restructuring of collateral or security arrangements or the waiver of rights under covenants within documentation, are not regarded by themselves to be evidence of credit distress affecting payment capacity. Typically, covenants are in place to give the bank rights of repricing or acceleration, but they are frequently set at levels where payment capacity has yet to be affected. They provide rights of action at earlier stages of credit deterioration. However, when these modifications are made in conjunction with modifications affecting payment arrangements as a result of significant concerns regarding the payment of contractual cash flows, they are treated as a distressed restructuring.
In assessing whether payment-related forbearance is a satisfactory and sustainable strategy, the customer’s entire exposure and facilities will be reviewed and the customer’s ability to meet the terms of both the revised obligation and other credit facilities not amended in the renegotiation is assessed. Should this assessment identify that a renegotiation will not deal with a customer’s payment capacity issues satisfactorily, other special management options may be applied. This process may identify the need to provide assistance to a customer specifically to restructure their business operations and activities so as to restore satisfactory payment capacity.
Modifications may be made on a temporary basis when time is needed for the customer to make arrangements for payment, when deterioration in payment capacity is expected to be acute but short lived, or when more time is needed to accommodate discussions regarding a more permanent accommodation with other bankers, for example in syndicated facilities where multilateral negotiation commonly features.
If a restructuring proceeds and the customer demonstrates satisfactory performance over a period of time, the case may be returned to a non-impaired grade (CRR1-8) provided no other indicators of impairment remain. Such a case cannot be returned to a non-impaired grade when a specific impairment reserve remains against any of the customer’s credit facilities. The period of performance will vary depending on the frequency of payments to be made by the customer under the amended agreement and the extent to which the customer’s financial position is considered to have improved.
257
Table of Contents
HSBC HOLDINGS PLC
Report of the Directors: Operating and Financial Review(continued)
(Audited)
It is our policy that each operating company in HSBC creates impairment allowances for impaired loans promptly and appropriately.
For details of our impairment policies on loans and advances and financial investments, see Notes 2g and 2j on the Financial Statements.
Impairment and credit risk mitigation
The existence of collateral has an impact when calculating impairment on individually assessed impaired loans. When we no longer expect to recover the principal and interest due on a loan in full or in accordance with the original terms and conditions, it is assessed for impairment. If exposures are secured, the current net realisable value of the collateral will be taken into account when assessing the need for an impairment allowance. No impairment allowance is recognised in cases where all amounts due are expected to be settled in full on realisation of the security.
Personal lending portfolios are generally assessed for impairment on a collective basis as the portfolios typically consist of large groups of homogeneous loans. Two methods are used to calculate allowances on a collective basis: a roll rate methodology or a more basic formulaic approach based on historical losses.
The historical loss methodology is typically used to calculate collective impairment allowances for secured, or low default portfolios such as mortgages, until the point at which they are individually identified and assessed as impaired. For loans which are collectively assessed using historical loss methodology, the historical loss rate is derived from the average contractual write-off net of recoveries over a defined period. The net contractual write-off rate is the actual amount of loss experienced after the realisation of collateral and receipt of recoveries.
A roll rate methodology is more commonly adopted for unsecured portfolios when there are sufficient volumes of empirical data to develop robust statistical models. In certain circumstances mortgage portfolios have a statistically significant number of defaults and losses available, enabling reliable roll rates to be generated. In these cases a roll rate methodology is applied until the point at which the loans are individually identified and assessed as impaired, and the average loss rate for each delinquency bucket is adjusted to reflect the average loss expected following realisation of security and receipt of recoveries. The average loss expected is derived from average historical collateral realisation values.
The nature of the collective allowance assessment prevents individual collateral values or loan-to-value (‘LTV’) ratios from being included within the calculation. However, the loss rates used in the collective assessment are adjusted for the collateral realisation experiences which will vary depending on the LTV composition of the portfolio. For example mortgage portfolios under a historical loss rate methodology with lower LTV ratios will typically experience lower loss history and consequently a lower net contractual write-off rate.
For wholesale collectively assessed loans historical loss methodologies are applied to measure loss event impairments which have been incurred but not reported. Loss rates are derived from the observed contractual write-off net of recoveries over a defined period, typically 60 months. The net contractual write-off rate is the actual amount of loss experienced after realisation of collateral and receipt of recoveries. These historical loss rates are adjusted by an economic factor which adjusts the historical averages to better represent current economic conditions affecting the portfolio. In order to reflect the likelihood of a loss event not being identified and assessed an emergence period assumption is applied. This reflects the period between a loss occurring and its identification. The emergence period is estimated by local management for each identified portfolio. The factors that may influence this estimation include economic and market conditions, customer behaviour, portfolio management information, credit management techniques and collection and recovery experiences in the market. A fixed range for the period between a loss occurring and its identification is not defined across the Group and as it is assessed empirically on a periodic basis, it may vary over time as these factors change. Given that credit management policies require all customers to be reviewed at least annually, we expect this estimated period would be at most 12 months.
258
Table of Contents
HSBC HOLDINGS PLC
Report of the Directors: Operating and Financial Review(continued)
Write-off of loans and advances
For details of our policy on the write-off of loans and advances, see Note 2g on the Financial Statements.
In HSBC Finance, the carrying amounts of residential mortgage and second lien loans in excess of net realisable value are written off at or before the time foreclosure is completed or settlement is reached with the borrower. If there is no reasonable expectation of recovery, and foreclosure is pursued, the loan is normally written off no later than the end of the month in which the loan becomes 180 days contractually past due.
Unsecured personal facilities, including credit cards, are generally written off at between 150 and 210 days past due, the standard period being the end of the month in which the account becomes 180 days contractually delinquent. Write-off periods may be extended, generally to no more than 360 days past due but, in very exceptional circumstances, exceeding that figure in a few countries where local regulation or legislation constrain earlier write-off, or where the realisation of collateral for secured real estate lending extends to this time.
In the event of bankruptcy or analogous proceedings, write-off may occur earlier than at the periods stated above. Collections procedures may continue after write-off.
Concentration of exposure
(Audited)
Concentrations of credit risk arise when a number of counterparties or exposures have comparable economic characteristics, or such counterparties are engaged in similar activities or operate in the same geographical areas or industry sectors, so that their collective ability to meet contractual obligations is uniformly affected by changes in economic, political or other conditions. We use a number of controls and measures to minimise undue concentration of exposure in our portfolios across industry, country and global businesses. These include portfolio and counterparty limits, approval and review controls, and stress testing.
Wrong-way risk is an aggravated form of concentration risk and arises when there is a strong correlation between the counterparty’s probability of default and the mark-to-market value of the underlying transaction. We use a range of procedures to monitor and control wrong-way risk, including requiring entities to obtain prior approval before undertaking wrong-way risk transactions outside pre-agreed guidelines.
Cross-border exposures
We assess the vulnerability of countries to foreign currency payment restrictions, including economic and political factors, when considering impairment allowances on cross-border exposures. Impairment allowances are assessed in respect of all qualifying exposures within vulnerable countries unless these exposures and the inherent risks are:
| • | performing, trade-related and of less than one year’s maturity; |
| • | mitigated by acceptable security cover which is, other than in exceptional cases, held outside the country concerned; |
| • | in the form of securities held for trading purposes for which a liquid and active market exists, and which are measured at fair value daily; and |
| • | performing facilities with a principal (excluding security) of US$1m or below and/or with maturity dates shorter than three months. |
Nature of HSBC’s securitisation and other structured exposures
(Audited)
Mortgage-backed securities (‘MBS’s) are securities that represent interests in groups of mortgages and provide investors with the right to receive cash from future mortgage payments (interest and/or principal). An MBS which references mortgages with different risk profiles is classified according to the highest risk class.
Collateralised debt obligations (‘CDO’s) are securities backed by a pool of bonds, loans or other assets such as asset-backed securities (‘ABS’s). CDOs may include exposure to sub-prime or Alt-A mortgage assets where these are part of the underlying assets or reference assets. As there is often uncertainty surrounding the precise nature of the underlying collateral supporting CDOs, all CDOs supported by residential mortgage-related assets are classified as sub-prime. Our holdings of ABSs and CDOs and direct lending positions, and the categories of mortgage collateral and lending activity, are described overleaf.
259
Table of Contents
HSBC HOLDINGS PLC
Report of the Directors: Operating and Financial Review(continued)
Our exposure to non-residential mortgage-related ABSs and direct lending includes securities with collateral relating to:
| • | commercial property mortgages; |
| • | leveraged finance loans; |
| • | student loans; and |
| • | other assets, such as securities with other receivable-related collateral. |
Categories of ABSs and CDOs | Definition | Classification | ||
| Sub-prime | Loans to customers who have limited credit histories, modest incomes or high debt-to-income ratios or have experienced credit problems caused by occasional delinquencies, prior charge-offs, bankruptcy or other credit-related actions.
| For US mortgages, a FICO score of 620 or less has primarily been used to determine whether a loan is sub-prime. For non-US mortgages, management judgement is used. | ||
| US Home Equity Lines of Credit (‘HELoC’s) | A form of revolving credit facility provided to customers, which is supported in the majority of circumstances by a second lien or lower ranking charge over residential property.
| Holdings of HELoCs are classified as sub-prime. | ||
| US Alt-A | Lower risk loans than sub-prime, but they share higher risk characteristics than lending under fully conforming standard criteria. | US credit scores and the completeness of documentation held (such as proof of income), are considered when determining whether an Alt-A classification is appropriate. Non sub-prime mortgages in the US are classified as Alt-A if they are not eligible for sale to the major US Government mortgage agencies or sponsored entities.
| ||
| US Government agency and sponsored enterprises mortgage-related assets | Securities that are guaranteed by US Government agencies such as the Government National Mortgage Association (‘Ginnie Mae’), or by US Government sponsored entities including the Federal National Mortgage Association (‘Fannie Mae’) and the Federal Home Loan Mortgage Corporation (‘Freddie Mac’).
| Holdings of US Government agency and US Government sponsored enterprises’ mortgage-related assets are classified as prime exposures. | ||
| UK non-conforming mortgages | UK mortgages that do not meet normal lending criteria. Examples include mortgages where the expected level of documentation is not provided (such as income with self-certification), or where poor credit history increases risk and results in pricing at a higher than normal lending rate.
| UK non-conforming mortgages are treated as sub-prime exposures. | ||
| Other mortgages | Residential mortgages, including prime mortgages, that do not meet any of the classifications described above. | Prime residential mortgage-related assets are included in this category. | ||
Impairment methodologies
(Audited)
To identify objective evidence of impairment for available-for-sale ABSs, an industry standard valuation model is normally applied which uses data with reference to the underlying asset pools and models their projected future cash flows. The estimated future cash flows of the securities are assessed at the specific financial asset level to determine whether any of them are unlikely to be recovered as a result of loss events occurring on or before the reporting date.
The principal assumptions and inputs to the models are typically the delinquency status of the underlying loans, the probability of delinquent loans progressing to default, the prepayment profiles of the underlying assets and the loss severity in the event of default. However, the models utilise other variables relevant to specific classes of collateral to forecast future defaults and recovery rates. Management uses externally available data and applies judgement when determining the appropriate assumptions in respect of these factors. We use a modelling approach which incorporates historically observed progression rates to default to determine if the decline in aggregate projected cash flows from the underlying collateral will lead to a shortfall in contractual cash flows. In such cases, the security is considered to be impaired.
In respect of CDOs, expected future cash flows for the underlying collateral are assessed to determine whether there is likely to be a shortfall in the contractual cash flows of the CDO.
260
Table of Contents
HSBC HOLDINGS PLC
Report of the Directors: Operating and Financial Review(continued)
When a security benefits from a contract provided by a monoline insurer that insures payments of principal and interest, the expected recovery on the contract is assessed in determining the total expected credit support available to the ABS.
(Audited)
The management of liquidity and funding is primarily undertaken locally (by country) in our operating entities in compliance with the Group’s liquidity and funding risk management framework (the ‘LFRF’), and with practices and limits set by the GMB through the Risk Management Meeting and approved by the Board. These limits vary according to the depth and the liquidity of the markets in which the entities operate. Our general policy is that each defined operating entity should be self-sufficient in funding its own activities. Where transactions exist between operating entities, they are reflected symmetrically in both entities.
As part of our Asset, Liability and Capital Management (‘ALCM’) structure, we have established ALCOs at Group level, in the regions and in operating entities. The terms of reference of all ALCOs include the monitoring and control of liquidity and funding.
The primary responsibility for managing liquidity and funding within the Group’s framework and risk appetite resides with the local operating entity ALCO. Our most significant operating entities are overseen by regional ALCOs, Group ALCO and the Risk Management Meeting. The remaining smaller operating entities are overseen by regional ALCOs, with appropriate escalation of significant issues to Group ALCO and the Risk Management Meeting.
Operating entities are predominately defined on a country basis to reflect our local management of liquidity and funding. Typically, an operating entity will be defined as a single legal entity. However, to take account of the situation where operations in a country are booked across multiple subsidiaries or branches:
| • | an operating entity may be defined as a wider sub-consolidated group of legal entities if they are incorporated in the same country, liquidity and funding are freely fungible between the entities and permitted by local regulation, and the definition reflects how liquidity and funding are managed locally; or |
| • | an operating entity may be defined more narrowly as a principal office (branch) of a wider legal entity operating in multiple countries, reflecting the local country management of liquidity and funding. |
The list of entities it directly oversees and the composition of these entities is reviewed and agreed annually by the Risk Management Meeting.
(Audited)
Customer deposits in the form of current accounts and savings deposits payable on demand or at short notice form a significant part of our funding, and we place considerable importance on maintaining their stability. For deposits, stability depends upon maintaining depositor confidence in our capital strength and liquidity, and on competitive and transparent pricing.
We also access wholesale funding markets by issuing senior secured and unsecured debt securities (publically and privately) and borrowing from the secured repo markets against high quality collateral, in order to obtain funding for non-banking subsidiaries that do not accept deposits, to align asset and liability maturities and currencies and to maintain a presence in local wholesale markets.
The management of funding and liquidity risk
Inherent liquidity risk categorisation
We place our operating entities into one of three categories (low, medium and high) to reflect our assessment of their inherent liquidity risk, considering political, economic and regulatory factors within the host country and factors specific to the operating entities themselves, such as the local market, market share and balance sheet strength. The categorisation involves management judgement and is based on the perceived liquidity risk of an operating entity relative to other entities in the Group. The categorisation is intended to reflect the possible impact of a liquidity event, not the probability of an event. The categorisation is part of our risk appetite and is used to determine the prescribed stress scenario that we require our operating entities to be able to withstand, and to manage to.
261
Table of Contents
HSBC HOLDINGS PLC
Report of the Directors: Operating and Financial Review(continued)
A key assumption of our internal framework is the categorisation of customer deposits into core and non-core based on our expectation of the behaviour of these deposits during liquidity stress. This characterisation takes into account the inherent liquidity risk categorisation of the operating entity originating the deposit, the nature of the customer and the size and pricing of the deposit. No deposit is considered to be core in its entirety unless it is contractually collateralising a loan. The core deposit base in each operating entity is considered to be a long-term source of funding and therefore is assumed not to be withdrawn in the liquidity stress scenario that we use to calculate our principal liquidity risk metrics.
The three filters considered in assessing whether a deposit in any operating entity is core are:
| • | price: any deposit priced significantly above market or benchmark rates is generally treated as entirely non-core; |
| • | size: depositors with total funds above certain monetary thresholds are excluded. Thresholds are established by considering the business line and inherent liquidity risk categorisation; and |
| • | line of business: the element of any deposit remaining after the application of the price and size filters is assessed on the basis of the line of business to which the deposit is associated. The proportion of any customer deposit that can be considered core under this filter is between 35% and 90%. |
Repo transactions and bank deposits cannot be categorised as core deposits.
Advances to core funding ratio
Core customer deposits are an important source of funding to finance lending to customers, and mitigate against reliance on short-term wholesale funding. Limits are placed on operating entities to restrict their ability to increase loans and advances to customers without corresponding growth in core customer deposits or long-term debt funding with a residual maturity beyond one year; this measure is referred to as the ‘advances to core funding’ ratio.
Advances to core funding ratio limits are set by the Risk Management Meeting for the most significant operating entities, and by regional ALCOs for smaller operating entities, and are monitored by ALCM teams. The ratio describes current loans and advances to customers as a percentage of the total of core customer deposits and term funding with a remaining term to maturity in excess of one year. In general, customer loans are assumed to be renewed and are included in the numerator of the advances to core funding ratio, irrespective of the contractual maturity date. Reverse repo arrangements are excluded from the advances to core funding ratio.
Stressed coverage ratios
Stressed coverage ratios are derived from stressed cash flow scenario analyses and express the stressed cash inflows as a percentage of stressed cash outflows over one-month and three-month time horizons.
The stressed cash inflows include:
| • | inflows (net of assumed haircuts) expected to be generated from the realisation of liquid assets; and |
| • | contractual cash inflows from maturing assets that are not already reflected as a utilisation of liquid assets. |
In line with the approach adopted for the advances to core funding ratio, customer loans are, in general, assumed not to generate any cash inflows under stress scenarios and are therefore excluded from the numerator of the stressed coverage ratios, irrespective of the contractual maturity date.
A stressed coverage ratio of 100% or higher reflects a positive cumulative cash flow under the stress scenario being monitored. Group operating entities are required to maintain a ratio of 100% or greater out to three months under the combined market-wide and HSBC-specific stress scenario defined by the inherent liquidity risk categorisation of the operating entity concerned.
Compliance with operating entity limits is monitored by ALCM teams and reported monthly to the Risk Management Meeting for the main operating entities and to regional ALCOs for the smaller operating entities.
We use a number of standard Group stress scenarios designed to model:
| • | combined market-wide and HSBC-specific liquidity crisis scenarios; and |
| • | market-wide liquidity crisis scenarios. |
262
Table of Contents
HSBC HOLDINGS PLC
Report of the Directors: Operating and Financial Review(continued)
These scenarios are modelled by all operating entities. The appropriateness of the assumptions for each scenario is reviewed by ALCM regularly and formally approved by the Risk Management Meeting and the Board annually as part of the liquidity and funding risk appetite approval process.
Stressed cash outflows are determined by applying a standard set of prescribed stress assumptions to the Group’s cash flow model. Our framework prescribes the use of two market-wide scenarios and three further combined market-wide and HSBC-specific stress scenarios of increasing severity. In addition to our standard stress scenarios, individual operating entities are required to design their own scenarios to reflect specific local market conditions, products and funding bases.
The three combined market-wide and HSBC-specific scenarios model a more severe scenario than the two market-wide scenarios. The relevant combined market-wide and HSBC-specific stress scenario that an operating entity manages to is based upon its inherent liquidity risk categorisation. The key assumptions factored into the three combined market-wide and HSBC-specific stress scenarios are summarised as follows:
| • | all non-core deposits are deemed to be withdrawn within three months (80% within one month), with the level of non-core deposits dependent on the operating entity’s inherent liquidity risk categorisation; |
| • | the ability to access interbank funding and unsecured term debt markets ceases for the duration of the scenario; |
| • | the ability to generate funds from illiquid asset portfolios (securitisation and secured borrowing) is restricted to 25-75% of the lower of issues in the last six months or the expected issues in the next six months. The restriction is based on current market conditions and is dependent on the operating entity’s inherent liquidity risk categorisation; |
| • | the ability to access repo funding ceases for any asset not classified as liquid under our liquid asset policy for the duration of the scenario; |
| • | drawdowns on committed lending facilities must be consistent with the severity of the market stress being modelled and dependent on the inherent liquidity risk categorisation of the operating entity; |
| • | outflows are triggered by a defined downgrade in long-term ratings. We maintain an on-going assessment of the appropriate number of notches to reflect; |
| • | customer loans are assumed to be renewed at contractual maturity; |
| • | interbank loans and reverse repos are assumed to run off contractually; and |
| • | assets defined as liquid assets are assumed to be realised in cash ahead of their contractual maturity, after applying a defined stressed haircut of up to 20%. |
Liquid assets of HSBC’s principal operating entities
Stressed scenario analysis and the numerator of the coverage ratio include the assumed cash inflows that would be generated from the realisation of liquid assets, after applying the appropriate stressed haircut. These assumptions are made based on management’s expectation of when an asset is deemed to be realisable.
Liquid assets are unencumbered assets that meet the Group’s definition of liquid assets and are either held outright or as a consequence of a reverse repo transaction with a residual contractual maturity beyond the time horizon of the stressed coverage ratio being monitored. Any unencumbered asset held as a result of reverse repo transactions with a contractual maturity within the time horizon of the stressed coverage ratio being monitored is excluded from the stock of liquid assets and instead reflected as a contractual cash inflow.
Our framework defines the asset classes that can be assessed locally as high quality and realisable within one month and between one month and three months. Each local ALCO has to be satisfied that any asset which may be treated as liquid in accordance with the Group’s liquid asset policy will remain liquid under the stress scenario being managed to.
Inflows from the utilisation of liquid assets within one month can generally only be based on confirmed withdrawable central bank deposits, gold or the sale or repo of government and quasi-government exposures generally restricted to those denominated in the sovereign’s domestic currency. High quality ABSs (predominantly US MBSs) and covered bonds are also included but inflows assumed for these assets are capped.
Inflows after one month are also reflected for high quality non-financial and non-structured corporate bonds and equities within the most liquid indices.
263
Table of Contents
HSBC HOLDINGS PLC
Report of the Directors: Operating and Financial Review(continued)
| Internal categorisation | Cash inflow recognised | Asset classes | ||
| Level 1 | Within one month | Central government
Central bank (including confirmed withdrawable reserves)
Supranationals
Multilateral development banks
| ||
| Level 2 | Within one month but capped | Local and regional government
Public sector entities
Secured covered bonds and pass-through ABSs
Gold
| ||
| Level 3 | From one to three months | Unsecured non-financial entity securities
Equities listed on recognised exchanges and within liquid indices | ||
Any entity owned and controlled by central or local/regional government but not explicitly guaranteed is treated as a public sector entity.
Any exposure explicitly guaranteed is reflected as an exposure to the ultimate guarantor.
In terms of the criteria used to ensure liquid assets are of a high quality, the Group’s liquid asset policy sets out the following additional criteria:
| 1. | Central bank and central government exposures denominated in the domestic currency of the related sovereign and held onshore in the domestic banking system qualify as level 1 liquid assets. |
| 2. | Central bank and central government exposures denominated in the domestic currency of the related sovereign and held offshore must be risk weighted 20% or lower under the Basel standardised risk weighting methodology, to qualify as level 1 liquid assets. |
| 3. | Central bank and central government exposures denominated in a currency other than the currency of the related sovereign (i.e. foreign currency) must be risk weighted 20% or lower under the Basel standardised risk weighting methodology and issued in a limited number of major currencies, to qualify as level 1 liquid assets. |
The treatment of eurozone countries using the euro as their domestic currency depends on whether the exposures are held onshore in the domestic banking system or offshore. Central bank and central government exposures held onshore in the domestic banking system qualify as level 1 liquid assets under criteria 1, but central bank and central government exposures held offshore are considered to be denominated in a foreign currency and considered under criteria 3.
| 4. | Local/regional government exposures held onshore and considered by the local regulator to be the same risk as central government exposures can be considered central government exposures. |
| 5. | Supranationals and multilateral development banks must be 0% risk weighted under the Basel standardised risk weighting methodology, to qualify as level 1 liquid assets. |
| 6. | To qualify as a level 2 liquid asset the exposure must be risk weighted 20% or lower under the Basel standardised risk weighting methodology. |
| 7. | To qualify as a level 3 liquid asset an unsecured non-financial corporate debt exposure must satisfy a minimum internal rating requirement. |
Where wholesale debt term markets are accessed to raise funding, ALCO is required to establish cumulative rolling three-month and 12-month debt maturity limits to ensure no concentration of maturities within these timeframes.
Liquidity behaviouralisation is applied to reflect our assessment of the expected period for which we are confident that we will have access to our liabilities, even under a severe liquidity stress scenario, and the expected period for which we must assume that we will need to fund our assets. Behaviouralisation is applied when the contractual terms do not reflect the expected behaviour. Liquidity behaviouralisation is reviewed and approved by local ALCO in compliance with policies set by the Risk Management Meeting. Our approach to liquidity risk management will often
264
Table of Contents
HSBC HOLDINGS PLC
Report of the Directors: Operating and Financial Review(continued)
mean a different approach is applied to assets and liabilities. For example, management may assume a shorter life for liabilities and a longer-term funding requirement for assets.
Contingent liquidity risk
Operating entities provide customers with committed facilities and committed backstop lines to the conduit vehicles we sponsor. These facilities increase our funding requirements when customers draw down. The liquidity risk associated with the potential drawdown on non-cancellable committed facilities is factored into our stressed scenarios and limits are set for these facilities.
Management of cross-currency liquidity and funding risk
Our liquidity and funding risk framework also considers the ability of each entity to continue to access foreign exchange markets under stress when a surplus in one currency is used to meet a deficit in another currency, for example, by the use of the foreign currency swap markets. Where appropriate, operating entities are required to monitor stressed coverage ratios and advances to core funding ratios for non-local currencies.
HSBC Holdings
(Audited)
HSBC Holdings’ primary sources of cash are dividends received from subsidiaries, interest on and repayment of intra-group loans and interest earned on its own liquid funds. HSBC Holdings also raises ancillary funds in the debt capital markets through subordinated and senior debt issuance. Cash is primarily used for the provision of capital to subsidiaries, interest payments to debt holders and dividend payments to shareholders.
HSBC Holdings is also subject to contingent liquidity risk by virtue of loan and other credit-related commitments and guarantees and similar contracts issued. Such commitments and guarantees are only issued after due consideration of HSBC Holdings’ ability to finance the commitments and guarantees and the likelihood of the need arising.
HSBC Holdings actively manages the cash flows from its subsidiaries to optimise the amount of cash held at the holding company level. The ability of subsidiaries to pay dividends or advance monies to HSBC Holdings depends on, among other things, their respective regulatory capital requirements, statutory reserves, and financial and operating performance. The wide range of our activities means that HSBC Holdings is not dependent on a single source of profits to fund its dividend payments to shareholders.
Market risk
Overview of market risk in global businesses
The diagram below illustrates the main business areas where trading and non-trading market risks reside.
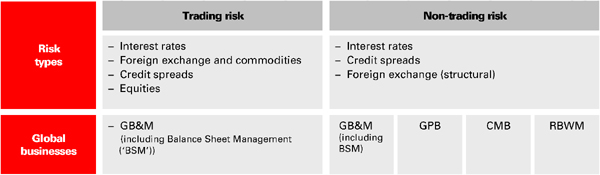
Monitoring and limiting market risk exposures
(Audited)
We employ a range of tools to monitor and limit market risk exposures. These include sensitivity analysis, value at risk (‘VAR’), stressed VAR and stress testing. While VAR provides the GMB with a measure of the market risk in the Group, sensitivity analysis and VAR are more commonly utilised for the management of the business units. Stress testing and stressed VAR complement these measures with potential losses arising from market turmoil.
265
Table of Contents
HSBC HOLDINGS PLC
Report of the Directors: Operating and Financial Review(continued)
Market risk is managed and controlled through limits approved by the GMB for HSBC Holdings and our various global businesses. These limits are allocated across business lines and to the Group’s legal entities.
The management of market risk is principally undertaken in Global Markets, where 85% of the total value at risk of HSBC Holdings (excluding Insurance) and almost all trading VAR resides, using risk limits approved by the GMB. Limits are set for portfolios, products and risk types, with market liquidity being a primary factor in determining the level of limits set. Group Risk, an independent unit within Group Head Office, is responsible for our market risk management policies and measurement techniques. Each major operating entity has an independent market risk management and control function which is responsible for measuring market risk exposures in accordance with the policies defined by Group Risk, and monitoring and reporting these exposures against the prescribed limits on a daily basis. The risk appetite is governed according to the framework illustrated below.
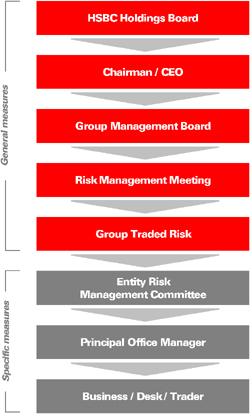 | Each operating entity is required to assess the market risks arising on each product in its business and to transfer them to either its local Global Markets unit for management, or to separate books managed under the supervision of the local ALCO. Our aim is to ensure that all market risks are consolidated within operations that have the necessary skills, tools, management and governance to manage them professionally. In certain cases where the market risks cannot be fully transferred, we identify the impact of varying scenarios on valuations or on net interest income resulting from any residual risk positions. Further details on the control and management process for residual risks are provided on pages 268 to 269.
(Unaudited)
We use sensitivity measures to monitor the market risk positions within each risk type, for example, the present value of a basis point movement in interest rates for interest rate risk. Sensitivity limits are set for portfolios, products and risk types, with the depth of the market being one of the principal factors in determining the level of limits set. |
Value at risk and stressed value at risk
(Audited)
VAR is a technique that estimates the potential losses on risk positions as a result of movements in market rates and prices over a specified time horizon and to a given level of confidence. Stressed VAR is primarily used for Regulatory Capital purposes but is integrated into the risk management process to facilitate efficient capital management and to highlight possible high-risk positions based on previous market volatility.
Both the VAR and Stressed VAR models we use are based predominantly on historical simulation. These models derive plausible future scenarios from past series of recorded market rates and prices, taking into account inter-relationships between different markets and rates such as interest rates and foreign exchange rates. The models also incorporate the effect of option features on the underlying exposures.
The historical simulation models used incorporate the following features:
| • | historical market rates and prices are calculated with reference to foreign exchange rates and commodity prices, interest rates, equity prices and the associated volatilities; |
| • | potential market movements utilised for VAR are calculated with reference to data from the past two years, |
| • | (unaudited)potential market movements employed for stressed VAR calculations are based on a continuous one-year period of stress for the trading portfolio; the choice of period (March 2008 to February 2009) is based on the assessment at the Group level of the most volatile period in recent history; and |
266
Table of Contents
HSBC HOLDINGS PLC
Report of the Directors: Operating and Financial Review(continued)
| • | VAR measures are calculated to a 99% confidence level and use a one-day holding period scaled to 10 days, whereas stressed VAR uses a 10-day holding period. |
The nature of the VAR models means that an increase in observed market volatility will lead to an increase in VAR without any changes in the underlying positions.
We routinely validate the accuracy of our VAR models by back-testing the actual daily profit and loss results, adjusted to remove non-modelled items such as fees and commissions, against the corresponding VAR numbers. We expect on average to see losses in excess of VAR 1% of the time over a one-year period.
Although a valuable guide to risk, VAR should always be viewed in the context of its limitations. For example:
| • | the use of historical data as a proxy for estimating future events may not encompass all potential events, particularly those which are extreme in nature; |
| • | the use of a one-day holding period assumes that all positions can be liquidated or the risks offset in one day. This may not fully reflect the market risk arising at times of severe illiquidity, when a one-day holding period may be insufficient to liquidate or hedge all positions fully; |
| • | the use of a 99% confidence level does not take into account losses that might occur beyond this level of confidence; |
| • | VAR is calculated on the basis of exposures outstanding at the close of business and therefore does not necessarily reflect intra-day exposures; and |
| • | VAR is unlikely to reflect loss potential on exposures that only arise under significant market moves. |
Our VAR model is designed to capture significant basis risks such as CDS vs bond, asset swap spreads and cross-currency basis. Other basis risks which are not completely covered in VAR, such as the Libor tenor basis, are complemented by our risk-not-in-VAR calculations and are integrated into our capital framework. Stress testing is also used as one of the market risk tools for managing basis risks.
(Audited)
In recognition of the limitations of VAR, we augment it with stress testing to evaluate the potential impact on portfolio values of more extreme, although plausible, events or movements in a set of financial variables.
Stress testing is implemented at the legal entity, regional and the overall Group levels. A standard set of scenarios is utilised consistently across all regions within the Group. Scenarios are tailored in order to capture the relevant events or market movements at each level. The risk appetite around potential stress losses for the Group is set and monitored against referral limits.
The process is governed by the Stress Testing Review Group forum which, in conjunction with regional risk management, determines the scenarios to be applied at portfolio and consolidated levels, as follows:
| • | single risk factor stress scenarios that are unlikely to be captured within the VAR models, such as the break of a currency peg; |
| • | technical scenarios consider the largest move in each risk factor without consideration of any underlying market correlation; |
| • | hypothetical scenarios consider potential macroeconomic events, for example, the slowdown in mainland China and the potential effects of a sovereign debt default, including its wider contagion effects; and |
| • | historical scenarios incorporate historical observations of market movements during previous periods of stress which would not be captured within VAR. |
Stress testing results are submitted to the GMB and Risk Management Committee (‘RMC’) meetings in order to provide senior management with an assessment of the financial effect such events would have.
In addition, the reverse stress test is based upon the premise that there is a fixed loss. The stress test process identifies which scenarios lead to this loss. The rationale behind the reverse stress test is to understand scenarios which are beyond normal business settings that could have contagion and systemic implications.
Stressed VAR and stress testing, together with reverse stress testing and the management of gap risk (see page 268), provide management with insights regarding the ‘tail risk’ beyond VAR. HSBC appetite for tail risk is limited.
267
Table of Contents
HSBC HOLDINGS PLC
Report of the Directors: Operating and Financial Review(continued)
Trading portfolios
(Audited)
Our control of market risk in the trading portfolios is based on a policy of restricting individual operations to trading within a list of permissible instruments authorised for each site by Group Risk, of enforcing new product approval procedures, and of restricting trading in the more complex derivative products only to offices with appropriate levels of product expertise and robust control systems.
Certain transactions are structured to render the risk to HSBC negligible under a wide range of market conditions or events, however, there exists a remote possibility that a gap event could lead to loss. A gap event could arise from a significant change in market price with no accompanying trading opportunity, with the result that the threshold is breached beyond which the risk profile changes from no risk to full exposure to the underlying structure. Such movements may occur, for example, when, in reaction to an adverse event or unexpected news announcement, the market for a specific investment becomes illiquid, making hedging impossible.
Given their characteristics, these transactions make little or no contribution to VAR or to traditional market risk sensitivity measures. We capture their risks within our stress testing scenarios and monitor gap risk on an ongoing basis. We regularly consider the probability of gap loss, and fair value adjustments are booked against this risk where significant.
Gap risk derived from certain transactions in legacy portfolios continued to be managed down during 2012. The residual exposure is immaterial. We did not incur any material gap loss in 2012.
The ABS/MBS exposures within the trading portfolios are managed within sensitivity and VAR limits as described on page 220, and are included within the stress testing scenarios described above.
Non-trading portfolios
(Audited)
The principal objective of market risk management of non-trading portfolios is to optimise net interest income.
Interest rate risk in non-trading portfolios arises principally from mismatches between the future yield on assets and their funding cost, as a result of interest rate changes. Analysis of this risk is complicated by having to make assumptions on embedded optionality within certain product areas such as the incidence of mortgage prepayments, and from behavioural assumptions regarding the economic duration of liabilities which are contractually repayable on demand such as current accounts.
Our control of market risk in the non-trading portfolios is based on transferring the risks to the books managed by Global Markets or the local ALCO. The net exposure is typically managed through the use of interest rate swaps within agreed limits. The VAR for these portfolios is included within the Group VAR.
Credit spread risk for available-for-sale debt instruments
The risk associated with movements in credit spreads is primarily managed through sensitivity limits, stress testing and VAR. The VAR shows the effect on income from a one-day movement in credit spreads over a two-year period, calculated to a 99% confidence interval.
Available for sale equity securities
Potential new commitments are subject to risk appraisal to ensure that industry and geographical concentrations remain within acceptable levels for the portfolio. Regular reviews are performed to substantiate the valuation of the investments within the portfolio and investments held to facilitate ongoing business, such as holdings in government-sponsored enterprises and local stock exchanges.
Structural foreign exchange exposures
(Unaudited)
Structural foreign exchange exposures represent net investments in subsidiaries, branches and associates, the
268
Table of Contents
HSBC HOLDINGS PLC
Report of the Directors: Operating and Financial Review(continued)
functional currencies of which are currencies other than the US dollar. An entity’s functional currency is that of the primary economic environment in which the entity operates.
Exchange differences on structural exposures are recognised in other comprehensive income. We use the US dollar as our presentation currency in our consolidated financial statements because the US dollar and currencies linked to it form the major currency bloc in which we transact and fund our business. Our consolidated balance sheet is, therefore, affected by exchange differences between the US dollar and all the non-US dollar functional currencies of underlying subsidiaries.
We hedge structural foreign exchange exposures only in limited circumstances. Our structural foreign exchange exposures are managed with the primary objective of ensuring, where practical, that our consolidated capital ratios and the capital ratios of individual banking subsidiaries are largely protected from the effect of changes in exchange rates. This is usually achieved by ensuring that, for each subsidiary bank, the ratio of structural exposures in a given currency to risk-weighted assets denominated in that currency is broadly equal to the capital ratio of the subsidiary in question.
We may also transact hedges where a currency in which we have structural exposures is considered likely to revalue adversely, and it is possible in practice to transact a hedge. Any hedging is undertaken using forward foreign exchange contracts which are accounted for under IFRSs as hedges of a net investment in a foreign operation, or by financing with borrowings in the same currencies as the functional currencies involved.
Sensitivity of net interest income
(Unaudited)
A principal part of our management of market risk in non-trading portfolios is to monitor the sensitivity of projected net interest income under varying interest rate scenarios (simulation modelling). We aim, through our management of market risk in non-trading portfolios, to mitigate the effect of prospective interest rate movements which could reduce future net interest income, while balancing the cost of such hedging activities on the current net revenue stream.
Entities apply a combination of scenarios and assumptions relevant to their local businesses, and standard scenarios which are required throughout HSBC. The latter are consolidated to illustrate the combined pro forma effect on our consolidated net interest income.
Projected net interest income sensitivity figures represent the effect of the pro forma movements in net interest income based on the projected yield curve scenarios and the Group’s current interest rate risk profile. This effect, however, does not incorporate actions which would probably be taken by Balance Sheet Management or in the business units to mitigate the effect of interest rate risk. In reality, Balance Sheet Management seeks proactively to change the interest rate risk profile to minimise losses and optimise net revenues. The net interest income sensitivity calculations assume that interest rates of all maturities move by the same amount in the up shock scenario. Rates are not assumed to become negative in the down shock scenario which may, in certain currencies, effectively result in non-parallel shock. In addition, the net interest income sensitivity calculations take account of the effect on net interest income of anticipated differences in changes between interbank interest rates and interest rates over which the entity has discretion in terms of the timing and extent of rate changes.
Defined benefit pension schemes
(Audited)
Market risk arises within our defined benefit pension schemes to the extent that the obligations of the schemes are not fully matched by assets with determinable cash flows. Pension scheme obligations fluctuate with changes in long-term interest rates, inflation, salary levels and the longevity of scheme members. Pension scheme assets include equities and debt securities, the cash flows of which change as equity prices and interest rates (and credit risk) vary. There is a risk that market movements in equity prices and interest rates could result in asset values which, taken together with regular ongoing contributions, are insufficient over time to cover the level of projected obligations and these, in turn, could increase with a rise in inflation and members living longer. Management, together with the trustees who act on behalf of the pension scheme beneficiaries, assess these risks using reports prepared by independent external actuaries, take action and, where appropriate, adjust investment strategies and contribution levels accordingly.
269
Table of Contents
HSBC HOLDINGS PLC
Report of the Directors: Operating and Financial Review(continued)
HSBC Holdings
(Audited)
As a financial services holding company, HSBC Holdings has limited market risk activity. Its activities predominantly involve maintaining sufficient capital resources to support the Group’s diverse activities; allocating these capital resources across our businesses; earning dividend and interest income on its investments in our businesses; providing dividend payments to HSBC Holdings’ equity shareholders and interest payments to providers of debt capital; and maintaining a supply of short-term cash resources. It does not take proprietary trading positions.
The main market risks to which HSBC Holdings is exposed are interest rate risk and foreign currency risk. Exposure to these risks arises from short-term cash balances, funding positions held, loans to subsidiaries, investments in long-term financial assets and financial liabilities including debt capital issued. The objective of HSBC Holdings’ market risk management strategy is to reduce exposure to these risks and minimise volatility in economic income, cash flows and distributable reserves. Market risk for HSBC Holdings is monitored by HSBC Holdings ALCO, which reviews foreign exchange VAR, repricing gap and net interest income and EVE sensitivities on a monthly basis.
HSBC Holdings has entered into a number of cross-currency swaps to manage the market risk arising on certain long-term debt capital issues for which hedge accounting has not been applied. Changes in the market values of these swaps are recognised directly in the income statement. HSBC Holdings expects that these swaps will be held to final maturity with the accumulated changes in market value consequently trending to zero.
Certain loans to subsidiaries of a capital nature that are not denominated in the functional currency of either the provider or the recipient are accounted for as financial assets. Changes in the carrying amount of these assets due to exchange differences are taken directly to the income statement. These loans, and the associated foreign exchange exposures, are eliminated on a Group consolidated basis.
(Unaudited)
The objective of our operational risk management is to manage and control operational risk in a cost effective manner within targeted levels of operational risk consistent with our risk appetite, as defined by the GMB.
Operational risk is organised as a specific risk discipline within Group Risk, and a formal governance structure provides oversight over its management. The Group Operational Risk function reports to the Group Chief Risk Officer and supports the Global Operational Risk and Control Committee. It is responsible for establishing and maintaining the operational risk management framework (‘ORMF’), monitoring the level of operational losses and the effectiveness of the control environment. It is also responsible for operational risk reporting at Group level, including the preparation of reports for consideration by the Risk Management Meeting and Group Risk Committee. The Global Operational Risk and Control Committee meets at least quarterly to discuss key risk issues and review the effective implementation of the ORMF.
The ORMF defines minimum standards and processes and the governance structure for the management of operational risk and internal control in our geographical regions, global businesses and global functions. The ORMF has been codified in a high level standards manual supplemented with detailed policies, which describe our approach to identifying, assessing, monitoring and controlling operational risk and give guidance on mitigating action to be taken when weaknesses are identified.
Business managers throughout the Group are responsible for maintaining an acceptable level of internal control, commensurate with the scale and nature of operations, and for identifying and assessing risks, designing controls and monitoring the effectiveness of these controls. The ORMF helps managers to fulfil these responsibilities by defining a standard risk assessment methodology and providing a tool for the systematic reporting of operational loss data.
A centralised database is used to record the results of the operational risk management process. Operational risk and control self-assessments are input and maintained by business units. Business and functional management and Business Risk and Control Managers monitor the progress of documented action plans to address shortcomings. To ensure that operational risk losses are consistently reported and monitored at Group level, all Group companies are required to report individual losses when the net loss is expected to exceed US$10,000, and to aggregate all other operational risk losses under US$10,000. Losses are entered into the operational risk system and are reported to the Group Operational Risk function quarterly.
For further details, see thePillar 3 Disclosures report as at 31 December 2012, page 61.
270
Table of Contents
HSBC HOLDINGS PLC
Report of the Directors: Operating and Financial Review(continued)
Compliance risk
(Unaudited)
Compliance risk falls within the definition of operational risk. All Group companies are required to observe the letter and spirit of all relevant laws, codes, rules, regulations and standards of good market practice. These rules, regulations, other standards and Group policies include those relating to anti-money laundering, anti-bribery and corruption, conduct of business, counter-terrorist financing and sanctions compliance.
The Global Compliance Function is a control function, working as part of our Global Risk Function. It is responsible for resourcing decisions, performance reviews, objectives, strategy, budget and accountability within the Compliance Function and is empowered to set standards and has the authority to ensure those standards are met. The Group’s Compliance Function is currently being reorganised under a Head of Group Financial Crime Compliance and a Global Head of Regulatory Compliance, each of whom reports to the Group Chief Risk Officer. There are compliance teams in all of the countries where we operate and in all global businesses lines. These compliance teams are principally overseen by Regional Compliance Officers located in Europe, the US, Canada, Latin America, the Middle East and North Africa and Asia-Pacific and each business line is supported by a Global Business Compliance Officer. There is an Assurance team within Compliance that reviews the effectiveness of the Regional and Global Business Compliance Officers.
Global Compliance policies and procedures require the prompt identification and escalation to Group Compliance of all actual or suspected breaches of any law, rule, regulation, policy or other relevant requirement. These escalation procedures are supplemented by a requirement for the submission of compliance certificates at the half-year and year-end by all Group companies detailing any known breaches as above. The contents of these escalation and certification processes are used for reporting to the Risk Management Meeting, the Group Risk Committee and the Board and disclosure in theAnnual Report and Accounts andInterim Report, if appropriate.
(Unaudited)
Each operating company is required to have processes and procedures in place to manage legal risk that conform to Group standards.
Legal risk falls within the definition of operational risk and includes:
| • | contractual risk, which is the risk that the rights and/or obligations of an HSBC company within a contractual relationship are defective; |
| • | dispute risk, which is made up of the risks that an HSBC company is subject to when it is involved in or managing a potential or actual dispute; |
| • | legislative risk, which is the risk that an HSBC company fails to adhere to the laws of the jurisdictions in which it operates; and |
| • | non-contractual rights risk, which is the risk that an HSBC company’s assets are not properly owned or are infringed by others, or an HSBC company infringes another party’s rights. |
We have a global legal function to assist management in controlling legal risk. There are legal departments in 58 of the countries in which we operate. There are also regional legal functions in each of Europe, North America, Latin America, the Middle East and North Africa and Asia-Pacific headed by Regional General Counsels as well as General Counsel responsible for each of the global businesses.
Global security and fraud risk
(Unaudited)
Security and fraud risk issues are managed at Group level by Global Security and Fraud Risk. This unit, which has responsibility for physical risk, fraud, information and contingency risk, and geopolitical risk and business intelligence is fully integrated within the central Group Risk function. This enables management to identify and mitigate the permutations of these and other non-financial risks to its business lines across the jurisdictions in which we operate.
The Fraud Risk function is responsible for ensuring that effective protection measures are in place against all forms of fraudulent activity, whether initiated internally or externally, and is available to support any part of the business. To achieve that and to attain the level of integration needed to face the threat, the management of all types
271
Table of Contents
HSBC HOLDINGS PLC
Report of the Directors: Operating and Financial Review(continued)
of fraud (e.g. card fraud, non-card fraud and internal fraud, including investigations), is established within one management structure and is part of the Global Risk function.
We use technology extensively to prevent and detect fraud. For example, customers’ credit and debit card spending is monitored continuously and suspicious transactions are highlighted for verification, internet banking sessions are reviewed and transactions monitored in a similar way and all new account applications are screened for fraud. We have a fraud systems strategy which is designed to provide minimum standards and allow easier sharing of best practices to detect fraud and minimise false alerts.
We have developed a holistic and effective anti-fraud strategy comprising fraud prevention policies and practices, the implementation of strong internal controls, an investigations response team and liaison with law enforcement where appropriate.
The Contingency Risk function is responsible for ensuring that in any circumstances where our employees, customers or buildings are exposed to a disaster or other catastrophic event, normal business operations can be restored promptly.
Within this wider risk, Business Continuity Management covers the pre-planning for the recovery, seeking to minimise the adverse effects of major business disruption, either globally, regionally or within country, against a range of actual or emerging risks. The pre-planning concentrates on the protection of customer services, our staff, revenue generation and the integrity of data and documents.
Each business has its own recovery plan, which is developed following the completion of a Business Impact Analysis. This determines how much time the business could sustain an outage before the level of losses becomes unacceptable, i.e. its criticality. These plans are reviewed and tested every year. The planning is undertaken against Group policy and standards and each business confirms in an annual compliance certificate that all have been met. Should there be exceptions, these are raised and their short-term resolution is overseen by Group and regional business continuity teams.
It is important that plans are dynamic and meet all risks, particularly those of an emerging nature such as possible pandemics and the eurozone crisis. The operational risk framework is used to measure our resilience to these risks, and is confirmed to Group and regional risk committees.
Resilience is managed through various risk mitigation measures. These include agreeing with IT acceptable recovery times of systems, ensuring our critical buildings have the correct infrastructure to enable ongoing operations, requiring critical vendors to have their own recovery plans and arranging with Group insurance appropriate cover for business interruption costs.
(Unaudited)
Systems risk is the risk of failure or other deficiency in the automated platforms that support the Group’s daily execution (application systems) and the systems infrastructure on which they reside (data centres, networks and distributed computers).
The management of systems risk is overseen globally by the HSBC Technology and Services (‘HTS’) organisation. Oversight is provided through monthly risk management committee meetings that provide a comprehensive overview of existing and emerging top risks.
HTS line management manages the control environment over systems risks using Risk and Control Assessments and Top Risk Analysis. Key risk indicators are used to assure a consistent basis of risk evaluation across geographic and line of business boundaries.
Business critical services have been identified through a central, global oversight body. Quantitative scorecards, called Risk Appetite Statements, have been established for each of these services.
(Unaudited)
Our vendor risk management (‘VRM’) is a global framework for managing risk with third party vendors, especially where we are reliant on outsourced agreements to provide critical services to our customers. VRM contains a rigorous process to identify material contracts and their key risks and ensure controls are in place to manage and mitigate these risks.
272
Table of Contents
HSBC HOLDINGS PLC
Report of the Directors: Operating and Financial Review(continued)
(Unaudited)
Business activities in which fiduciary risk is inherent should only be undertaken within designated lines of business. Fiduciary risk is managed within the designated businesses via a comprehensive policy framework and monitoring of key indicators. The Group’s principal fiduciary businesses (‘designated businesses’) are:
| • | HSBC Securities Services, where it is exposed to fiduciary risk via its Securities Services and Corporate Trust activities; |
| • | HSBC Asset Management, which is exposed to fiduciary risks via its investment activities on behalf of clients; |
| • | HSBC Private Banking, which is exposed to fiduciary risks via its Private Wealth Services division and discretionary investment management; and |
| • | HSBC Insurance, which is exposed to fiduciary risks via the investment management activities it undertakes when providing insurance products and services. |
The Group’s requirements for the management of fiduciary risk are laid down in the Fiduciary Functional Instruction Manual (‘Fiduciary FIM’), which is owned by Group Operational Risk. No business other than the designated businesses may undertake fiduciary activities without notifying Global Operational Risk and receiving specific dispensations from the relevant Fiduciary FIM requirements.
Other policies around the provision of advice, including investment advice and corporate advisory, and the management of potential conflicts of interest, also mitigate our fiduciary risks.
Risk management of insurance operations
Overview of insurance products
(Audited)
The main contracts we manufacture are listed below:
Life insurance business
| • | life insurance contracts with discretionary participation features (‘DPF’); |
| • | credit life insurance business; |
| • | annuities; |
| • | term assurance and critical illness policies; |
| • | linked life insurance; |
| • | investment contracts with DPF; |
| • | unit-linked investment contracts; and |
| • | other investment contracts (including pension contracts written in Hong Kong). |
Non-life insurance business
Non-life insurance contracts include motor, fire and other damage to property, accident and health, repayment protection and commercial insurance.
(Audited)
The majority of the risks in our Insurance business derive from manufacturing activities and can be categorised between insurance risk and financial risks; financial risks include market risk, credit risk and liquidity risk. Operational and sustainability risks are also present and are covered by the Group’s overall respective risk management processes.
The following sections describe how insurance risk and financial risks are managed. The assets of insurance manufacturing subsidiaries are included within the consolidated risk disclosures on pages 123 to 251, although separate disclosures in respect of insurance manufacturing subsidiaries are provided in the ‘Risk management of insurance operations’ section. The consolidated liquidity risk and market risk disclosures focus on banking entities and exclude insurance operations. Disclosures specific to the insurance manufacturing subsidiaries are provided in the ‘Risk management of insurance operations’ section on pages 232 to 245.
273
Table of Contents
HSBC HOLDINGS PLC
Report of the Directors: Operating and Financial Review(continued)
Insurance manufacturers set their own control procedures in addition to complying with guidelines issued by the Group Insurance Head Office. The control framework for monitoring risk includes the Group Insurance Risk Management Committee, which oversees the status of the significant risk categories in the insurance operations. Five sub-committees of this Committee focus on products and pricing, market and liquidity risk, credit risk, operational risk and insurance risk, respectively. The Group Insurance Risk Management Committee monitors the risk profile of the insurance operations against a risk appetite for insurance business agreed by the GMB. Any issues requiring escalation from the Group Insurance Risk Management Committee would be reported to the RBWM Risk Management Committee.
In addition, local ALCOs and Risk Management Committees monitor certain risk exposures, mainly for life business where the duration and cash flow matching of insurance assets and liabilities are reviewed.
All insurance products, whether manufactured internally or by a third party, are subjected to a product approval process prior to introduction. Approval by Group Insurance Head Office may be required depending on the type of product and its risk profile. The approval process is formalised through the Product and Pricing Committee, which comprises the heads of the relevant risk functions within insurance.
(Audited)
Insurance risk is the risk, other than financial risk, of loss transferred from the holder of the insurance contract to the issuer (HSBC). The principal risk we face in manufacturing insurance contracts is that, over time, the cost of acquiring and administering a contract, claims and benefits may exceed the aggregate amount of premiums received and investment income.
The cost of claims and benefits can be influenced by many factors, including mortality and morbidity experience, lapse and surrender rates and, if the policy has a savings element, the performance of the assets held to support the liabilities.
Life and non-life business insurance risks are controlled by high-level policies and procedures set both centrally and locally, taking into account where appropriate local market conditions and regulatory requirements. Formal underwriting, reinsurance and claims-handling procedures designed to ensure compliance with regulations are applied, supplemented with stress testing.
As well as exercising underwriting controls, we use reinsurance as a means of mitigating exposure to insurance risk. Where we manage our exposure to insurance risk through the use of third-party reinsurers, the associated revenue and manufacturing profit is ceded to the reinsurers. Although reinsurance provides a means of managing insurance risk, such contracts expose us to credit risk, the risk of default by the reinsurer.
The principal drivers of our insurance risk are described below. The liabilities for long-term contracts are set by reference to a range of assumptions around these drivers. These typically reflect the issuers’ own experiences. The type and quantum of insurance risk arising from life insurance depends on the type of business, and varies considerably.
| • | mortality and morbidity:the main contracts which generate exposure to these risks are term assurance, whole life products, critical illness and income protection contracts and annuities. The risks are monitored on a regular basis, and are primarily mitigated by underwriting controls and reinsurance and by retaining the ability in certain cases to amend premiums in the light of experience; |
| • | lapses and surrenders: the risks associated with this are generally mitigated by product design, the application of surrender charges and management actions, for example, managing the level of bonus payments to policyholders. A detailed persistency analysis at a product level is carried out at least on an annual basis; and |
| • | expense riskis mitigated by pricing, for example, retaining the ability in certain cases to amend premiums and/or policyholder charges based on experience, and cost management discipline. |
Liabilities are affected by changes in assumptions (see ‘Sensitivity analysis’ on page 245).
The main risks associated with non-life business are:
| • | underwriting: the risk that premiums are not appropriate for the cover provided; and |
| • | claims experience: the risk that claims exceed expectations. |
274
Table of Contents
HSBC HOLDINGS PLC
Report of the Directors: Operating and Financial Review(continued)
We manage these risks through pricing (for example, imposing restrictions and deductibles in the policy terms and conditions), product design, risk selection, claims handling and reinsurance policy. The majority of our non-life insurance contracts are renewable annually, providing added flexibility to the underwriting terms and conditions.
Financial risks
(Audited)
Our Insurance businesses are exposed to a range of financial risks, including market risk, credit risk and liquidity risk. Market risk includes interest rate, equity and foreign exchange risks. The nature and management of these risks is described below.
Manufacturing subsidiaries are exposed to financial risks when, for example, the proceeds from financial assets are not sufficient to fund the obligations arising from insurance and investment contracts. In many jurisdictions, local regulatory requirements prescribe the type, quality and concentration of assets that these subsidiaries must maintain to meet insurance liabilities. These requirements complement Group-wide policies.
Market risk
(Audited)
Description of market risk
The main features of products manufactured by our insurance manufacturing subsidiaries which generate market risk, and the market risk to which these features expose the subsidiaries, are discussed below.
Interest rate risk arises to the extent that yields on the assets are lower than the investment returns implied by the guarantees payable to policyholders by insurance manufacturing subsidiaries. When the asset yields are below guaranteed yields, products may be discontinued, repriced or restructured. A list of the different types of guarantees within our insurance contracts is outlined below.
Categories of guaranteed benefits
| • | annuities in payment; |
| • | deferred/immediate annuities: these consist of two phases – the savings and investing phase and the retirement income phase; |
| • | annual return: the annual return is guaranteed to be no lower than a specified rate. This may be the return credited to the policyholder every year, or the average annual return credited to the policyholder over the life of the policy, which may occur on the maturity date or the surrender date of the contract; and |
| • | capital: policyholders are guaranteed to receive no less than the premiums paid plus declared bonuses less expenses. |
The proceeds from insurance and investment products with DPF are primarily invested in bonds with a proportion allocated to other asset classes in order to provide customers with the potential for enhanced returns. Subsidiaries with portfolios of such products are exposed to the risk of falls in market prices which cannot be fully reflected in the discretionary bonuses. An increase in market volatility could also result in an increase in the value of the guarantee to the policyholder.
Long-term insurance and investment products typically permit the policyholder to surrender the policy or let it lapse at any time. When the surrender value is not linked to the value realised from the sale of the associated supporting assets, the subsidiary is exposed to market risk. In particular, when customers seek to surrender their policies when asset values are falling, assets may have to be sold at a loss to fund redemptions.
A subsidiary holding a portfolio of long-term insurance and investment products, especially with DPF, may attempt to reduce exposure to its local market by investing in assets in countries other than that in which it is based. These assets may be denominated in currencies other than the subsidiary’s local currency. Where the foreign exchange exposure associated with these assets is not hedged, for example because it is not cost effective to do so, this exposes the subsidiary to the risk of its local currency strengthening against the currency of the related assets.
For unit-linked contracts, market risk is substantially borne by the policyholder, but market risk exposure typically remains as fees earned for management are related to the market value of the linked assets.
Asset and liability matching
It is not always possible to match asset and liability durations, partly because there is uncertainty over policyholder behaviour, which introduces uncertainty over the receipt of all future premiums and the timing of claims, and partly
275
Table of Contents
HSBC HOLDINGS PLC
Report of the Directors: Operating and Financial Review(continued)
because the forecast payment dates of liabilities may exceed the duration of the longest dated investments available.
We use models to assess the effect of a range of future scenarios on the values of financial assets and associated liabilities, and ALCOs employ the outcomes in determining how to best structure asset holdings to support liabilities. The scenarios include stresses applied to factors which affect insurance risk such as mortality and lapse rates. Of particular importance is assessing the expected pattern of cash inflows against the benefits payable on the underlying contracts, which can extend for many years.
Our current portfolio of assets includes debt securities issued at a time when yields were higher than those observed in the current market. As a result, yields on extant holdings of debt securities exceed those available on current issues. We reduced short-term bonus rates paid to policyholders on certain participating contracts to manage the immediate strain on the business. Should interest rates and yield curves remain low further reductions may be necessary.
How market risk is managed
All our insurance manufacturing subsidiaries have market risk mandates which specify the investment instruments in which they are permitted to invest and the maximum quantum of market risk which they may retain. They manage market risk by using some or all of the techniques listed below, depending on the nature of the contracts they write.
Techniques for managing market risk
| • | for products with DPF, adjusting bonus rates to manage the liabilities to policyholders. The effect is that a significant portion of the market risk is borne by the policyholder; |
| • | structuring asset portfolios to support projected liability cash flows; |
| • | using derivatives, to a limited extent, to protect against adverse market movements or better match liability cash flows; |
| • | for new products with investment guarantees, considering the cost when determining the level of premiums or the price structure; |
| • | periodically reviewing products identified as higher risk, which contain investment guarantees and embedded optionality features linked to savings and investment products; |
| • | including features designed to mitigate market risk in new products, such as charging surrender penalties to recoup losses incurred when policyholders surrender their policies; |
| • | exiting, to the extent possible, investment portfolios whose risk is considered unacceptable; and |
| • | repricing of premiums charged to policyholders. |
In the product approval process, the risks embedded in new products are identified and assessed. When, for example, options and guarantees are embedded in new products, the due diligence process ensures that complete and appropriate risk management procedures are in place. For all but the simplest of guaranteed benefits the assessment is undertaken by Group Insurance Head Office. Management reviews certain exposures more frequently when markets are more volatile to ensure that any matters arising are dealt with in a timely fashion.
How the exposure to market risk is measured
Our insurance manufacturing subsidiaries monitor exposures against mandated limits regularly and report them to Group Insurance Head Office. Exposures are aggregated and reported on a quarterly basis to senior risk management forums in the Group, including the Group Insurance Market and Liquidity Risk Committee, Group Insurance Risk Management Committee and the Group Stress Test Review Group.
In addition, large insurance manufacturing subsidiaries perform a high-level monthly assessment of market risk exposure against risk appetite. This is submitted to Group Insurance Head Office and a global assessment presented to the RBWM RMC.
Standard measures for quantifying market risks
| • | for interest rate risk, the sensitivities of the net present values of asset and expected liability cash flows, in total and by currency, to a one basis point parallel shift in the discount curves used to calculate the net present values; |
| • | for equity price risk, the total market value of equity holdings and the market value of equity holdings by region and country; and |
| • | for foreign exchange risk, the total net short foreign exchange position and the net foreign exchange positions by currency. |
The standard measures are relatively straightforward to calculate and aggregate, but they have limitations. The most significant one is that a parallel shift in yield curves of one basis point does not capture the non-linear relationships between the values of certain assets and liabilities and interest rates. Non-linearity arises, for example, from
276
Table of Contents
HSBC HOLDINGS PLC
Report of the Directors: Operating and Financial Review(continued)
investment guarantees and product features which enable policyholders to surrender their policies. We bear the shortfall if the yields on investments held to support contracts with guaranteed benefits are less than the investment returns implied by the guaranteed benefits.
We recognise these limitations and augment our standard measures with stress tests which examine the effect of a range of market rate scenarios on the aggregate annual profits and total equity of our insurance manufacturing subsidiaries, after taking into consideration tax and accounting treatments where material and relevant. The results of these tests are reported to Group Insurance Head Office and risk committees every quarter.
See also ‘Sensitivity of HSBC’s insurance subsidiaries to market risk factors’ on page 240) which indicates the sensitivity of insurance manufacturers profit and total equity to market risk factors.
Credit risk
(Audited)
Description of credit risk
Credit risk arises in two main areas for our insurance manufacturers:
| i) | risk of default by debt security counterparties after investing premiums to generate a return for policyholders and shareholders; and |
| ii) | risk of default by reinsurance counterparties and non-reimbursement for claims made after ceding insurance risk. |
How credit risk is managed
Our insurance manufacturing subsidiaries are responsible for the credit risk, quality and performance of their investment portfolios. Our assessment of the creditworthiness of issuers and counterparties is based primarily upon internationally recognised credit ratings and other publicly available information.
Investment credit exposures are monitored against limits by our local insurance manufacturing subsidiaries, and are aggregated and reported to Group Credit Risk, the Group Insurance Credit Risk Committee and the Group Insurance Risk Management Committee. Stress testing is performed by Group Insurance Head Office on the investment credit exposures using credit spread sensitivities and default probabilities. The stresses are reported to the Group Insurance Credit Risk Meeting.
We use a number of tools to manage and monitor credit risk. These include a Credit Watch Report which contains a watch-list of investments with current credit concerns and is circulated fortnightly to senior management in Group Insurance Head Office and the individual Country Chief Risk Officers to identify investments which may be at risk of future impairment.
Liquidity risk
(Audited)
Description of liquidity risk
It is an inherent characteristic of almost all insurance contracts that there is uncertainty over the amount of claims liabilities that may arise and the timing of their settlement, and this creates liquidity risk.
There are three aspects to liquidity risk. The first arises in normal market conditions and is referred to as funding liquidity risk; specifically, the capacity to raise sufficient cash when needed to meet payment obligations. Secondly, market liquidity risk arises when the size of a particular holding may be so large that a sale cannot be completed around the market price. Finally, standby liquidity risk refers to the capacity to meet payment terms in abnormal conditions.
How liquidity risk is managed
Our insurance manufacturing subsidiaries primarily fund cash outflows arising from claim liabilities from the following sources of cash inflows:
| • | premiums from new business, policy renewals and recurring premium products; |
| • | interest and dividends on investments and principal repayments of maturing debt investments; |
| • | cash resources; and |
277
Table of Contents
HSBC HOLDINGS PLC
Report of the Directors: Operating and Financial Review(continued)
| • | the sale of investments. |
They manage liquidity risk by utilising some or all of the following techniques:
| • | matching cash inflows with expected cash outflows using specific cash flow projections or more general asset and liability matching techniques such as duration matching; |
| • | maintaining sufficient cash resources; |
| • | investing in good credit-quality investments with deep and liquid markets to the degree to which they exist; |
| • | monitoring investment concentrations and restricting them where appropriate, for example, by debt issues or issuers; and |
| • | establishing committed contingency borrowing facilities. |
Each of these techniques contributes to mitigating the three types of liquidity risk described above.
Every quarter, our insurance manufacturing subsidiaries are required to complete and submit liquidity risk reports to Group Insurance Head Office for collation and review by the Group Insurance Market and Liquidity Risk Committee. Liquidity risk is assessed in these reports by measuring changes in expected cumulative net cash flows under a series of stress scenarios designed to determine the effect of reducing expected available liquidity and accelerating cash outflows. This is achieved, for example, by assuming new business or renewals are lower, and surrenders or lapses are greater, than expected.
Reputational risk
(Unaudited)
We regularly review our policies and procedures for safeguarding against reputational risk. This is an evolutionary process which takes account of relevant developments, industry guidance, best practice and societal expectations.
We have always aspired to the highest standards of conduct and, as a matter of routine, take account of reputational risks to our business. Reputational risks can arise from a wide variety of causes. As a banking group, our good reputation depends not only upon the way in which we conduct our business, but also by the way in which clients, to whom we provide financial services, conduct themselves.
Group functions with responsibility for activities that attract reputational risk are represented at the Group Reputational Risk Policy Committee (‘GRRPC’), which is chaired by the Group Chairman. The primary role of the GRRPC is to consider areas and activities presenting significant reputational risk and, where appropriate, to make recommendations to the Global Standards Steering Committee for policy or procedural changes to mitigate such risk. Reputational Risk Policy Committees, which have been established in each of the Group’s geographical regions, are required to ensure that reputational risks are also considered at a regional level. Minutes from the regional committees are tabled at GRRPC.
Standards on all major aspects of business are set for HSBC and for individual subsidiaries, businesses and functions. Reputational risks, including environmental, social and governance matters, are considered and assessed by the Board, the GMB, the Risk Management Meeting, the Global Standards Steering Committee, subsidiary company boards, Board committees and senior management during the formulation of policy and the establishment of our standards. These policies, which form an integral part of the internal control system (see page 332), are communicated through manuals and statements of policy and are promulgated through internal communications and training. The policies set out our risk appetite and operational procedures in all areas of reputational risk, including money laundering deterrence, counter-terrorist financing, environmental impact, anti-bribery and corruption measures and employee relations. The policy manuals address risk issues in detail and co-operation between Group departments and businesses is required to ensure a strong adherence to our risk management system and our sustainability practices.
(Audited)
We operate a number of pension plans throughout the world, as described in Note 7 on the Financial Statements, the Pension risk section on page 224 and below. Some of them are defined benefit plans, of which the largest is the HSBC Bank (UK) Pension Scheme (‘the principal plan’).
In order to fund the benefits associated with these plans, sponsoring Group companies (and, in some instances, employees) make regular contributions in accordance with advice from actuaries and in consultation with the
278
Table of Contents
HSBC HOLDINGS PLC
Report of the Directors: Operating and Financial Review(continued)
scheme’s trustees (where relevant). The defined benefit plans invest these contributions in a range of investments designed to meet their long-term liabilities.
The level of these contributions has a direct impact on HSBC’s cash flow and would normally be set to ensure that there are sufficient funds to meet the cost of the accruing benefits for the future service of active members. However, higher contributions will be required when plan assets are considered insufficient to cover the existing pension liabilities. Contribution rates are typically revised annually or triennially, depending on the plan. The agreed contributions to the principal plan are revised triennially.
A deficit in a defined benefit plan may arise from a number of factors, including
| • | investments delivering a return below that required to provide the projected plan benefits. This could arise, for example, when there is a fall in the market value of equities, or when increases in long-term interest rates cause a fall in the value of fixed income securities held; |
| • | the prevailing economic environment leading to corporate failures, thus triggering write-downs in asset values (both equity and debt); |
| • | a change in either interest rates or inflation which causes an increase in the value of the scheme liabilities; and |
| • | scheme members living longer than expected (known as longevity risk). |
A plan’s investment strategy is determined after taking into consideration the market risk inherent in the investments and its consequential impact on potential future contributions. The long-term investment objectives of both HSBC and, where relevant and appropriate, the trustees are:
| • | to limit the risk of the assets failing to meet the liabilities of the plans over the long-term; and |
| • | to maximise returns consistent with an acceptable level of risk so as to control the long-term costs of the defined benefit plans. |
In pursuit of these long-term objectives, a benchmark is established for the allocation of the defined benefit plan assets between asset classes. In addition, each permitted asset class has its own benchmarks, such as stock market or property valuation indices and, where relevant, desired levels of out-performance. The benchmarks are reviewed at least triennially within 18 months of the date at which an actuarial valuation is made, or more frequently if required by local legislation or circumstances. The process generally involves an extensive asset and liability review.
Ultimate responsibility for investment strategy rests with either the trustees or, in certain circumstances, a Management Committee. The degree of independence of the trustees from HSBC varies in different jurisdictions.
The largest plan globally exists in the UK, where the HSBC Bank (UK) Pension Scheme (‘the Scheme’) covers employees of HSBC Bank plc and certain other employees of HSBC. This comprises a funded final salary defined benefit plan (‘the principal plan’), which is closed to new entrants, and a defined contribution plan which was established in July 1996 for new employees.
The principal plan, which accounts for approximately 70% of the obligations of our defined benefit pension plans, is overseen by a corporate trustee who has a fiduciary responsibility for the operation of the pension scheme. The Trustee is responsible for monitoring and managing the investment strategy and administration of scheme benefits.
The principal plan holds a diversified portfolio of investments to meet future cash flow liabilities arising from accrued benefits as they fall due to be paid. The trustee of the principal plan is required to produce a written Statement of Investment Principles which governs decision-making about how investments are made and the need for adequate diversification is taken into account in the choice of asset allocation and manager structure in the Defined Benefit Section.
Longevity risk in the principal plan is assessed as part of the measurement of the pension liability and managed through the funding process of the scheme.
In Hong Kong, the HSBC Group Hong Kong Local Staff Retirement Benefit Scheme covers employees of The Hongkong and Shanghai Banking Corporation and certain other employees of HSBC. The scheme comprises a funded defined benefit scheme and a defined contribution scheme. The defined benefit section of the scheme is a final salary lump sum scheme and therefore its exposure to longevity risk is limited; it was closed to new members from 1999.
279
Table of Contents
HSBC HOLDINGS PLC
Report of the Directors: Operating and Financial Review(continued)
The trustee assumes the overall responsibility for the scheme but a management committee and a number of sub-committees have also been established. These committees have been established to broaden the governance and manage the concomitant issues. The finance and investment sub-committee manages the various issues in relation to both assets and liabilities of the scheme.
Pension plans in North America
The HSBC North America (US) Retirement Income Plan covers all employees of HSBC Bank USA, HSBC Finance and other HSBC entities in the US who have reached the age of 21 and met the one year of service participation requirement. The Retirement Income Plan is a funded defined benefit plan which provides final average pay benefits to legacy participants and cash balance benefits to all other participants. Prior to 1 January 2013 all new employees participate in the cash balance section of the plan. In November 2009, the Board of Directors of HSBC North America Holdings, Inc. (‘HNAH’) approved actions to cease all future benefit accruals for legacy participants under the final average pay formula components of the HSBC North America Retirement Income Plan with effect from 1 January 2011.
The Plan is governed by the Employee Retirement Security Act of 1974 (‘ERISA’), ERISA regulations serve as guidance for the management of plan assets. In this regard, an Investment Committee (the ‘Committee’) for the Plan has been established and its members have been appointed by the Chief Executive Officer as authorized by the Board of Directors of HSBC North America. The Committee is responsible for establishing the funding policy and investment objectives supporting the Plan including allocating the assets of the Plan, monitoring the diversification of the Plan’s investments and investment performance, assuring the Plan does not violate any provisions of ERISA and the appointment, removal and monitoring of investment advisers and the trustee.
A key factor shaping the Committee’s attitude towards risk is the generally long-term nature of the underlying benefit obligations. The asset allocation decision reflects this long-term horizon as well as the ability and willingness to accept some short-term variability in the performance of the portfolio in exchange for the expectation of competitive long-term investment results for its participants.
Sustainability risk
(Unaudited)
Sustainability risks arise from the provision of financial services to companies or projects which run counter to the needs of sustainable development; in effect this risk arises when the environmental and social effects outweigh economic benefits. Within Group Head Office, a separate function, Group Corporate Sustainability, is mandated to manage these risks globally working through local offices as appropriate. Sustainability Risk Managers have regional or national responsibilities for advising on and managing environmental and social risks.
Group Corporate Sustainability’s risk management responsibilities include:
| • | formulating sustainability risk policies. This includes oversight of our sustainability risk standards, management of the Equator Principles for project finance lending, and sector-based sustainability policies covering those sectors with high environmental or social impacts (forestry, freshwater infrastructure, chemicals, energy, mining and metals, and defence-related lending); undertaking an independent review of transactions where sustainability risks are assessed to be high, and supporting our operating companies to assess similar risks of a lower magnitude; |
| • | building and implementing systems-based processes to ensure consistent application of policies, reduce the costs of sustainability risk reviews and capture management information to measure and report on the effect of our lending and investment activities on sustainable development; and |
| • | providing training and capacity building within our operating companies to ensure sustainability risks are identified and mitigated consistently to either our own standards, international standards or local regulations, whichever is higher. |
280
Table of Contents
HSBC HOLDINGS PLC
Report of the Directors: Operating and Financial Review(continued)
| Page | App1 | Tables | Page | |||||||||||
| 282 | Capital ratios | 282 | ||||||||||||
| 293 | ||||||||||||||
| 293 | ||||||||||||||
| 293 | ||||||||||||||
| 293 | ||||||||||||||
| 294 | ||||||||||||||
| 294 | ||||||||||||||
| 294 | ||||||||||||||
| 294 | ||||||||||||||
| 295 | ||||||||||||||
| 296 | ||||||||||||||
| 296 | ||||||||||||||
| 282 | RWAs by risk type | 282 | ||||||||||||
| Market risk RWAs | 282 | |||||||||||||
| RWAs by global businesses | 282 | |||||||||||||
| RWAs by geographical regions | 283 | |||||||||||||
| 283 | RWA movement by key driver – credit risk – IRB only | 283 | ||||||||||||
| 284 | RWA movement by key driver – counterparty credit risk – IRB only | 284 | ||||||||||||
| RWA movement by key driver – market risk – internal model based | 284 | |||||||||||||
| 285 | ||||||||||||||
RWA movement by key driver – basis of | 296 | |||||||||||||
| 296 | ||||||||||||||
| 298 | ||||||||||||||
| 285 | Source and application of total regulatory capital | 285 | ||||||||||||
| 286 | Composition of regulatory capital | 286 | ||||||||||||
| Regulatory impact of management actions | 287 | |||||||||||||
| Reconciliation of accounting and regulatory balance sheets | 287 | |||||||||||||
| 288 | ||||||||||||||
| 288 | ||||||||||||||
| 298 | Estimated effect of CRD IV end point rules applied to the 31 December 2012 position | 289 | ||||||||||||
Regulatory adjustments applied to core tier 1 in respect of amounts subject to CRD IV treatment | 298 | |||||||||||||
| 300 | ||||||||||||||
| 291 | ||||||||||||||
| 291 | ||||||||||||||
| 291 | ||||||||||||||
| 292 | ||||||||||||||
1 Appendix to Capital | ||||||||||||||
281
Table of Contents
HSBC HOLDINGS PLC
Report of the Directors: Operating and Financial Review(continued)
Our objective in the management of Group capital is to maintain appropriate levels of capital to support our business strategy and meet our regulatory requirements.
Capital highlights
| • | Core tier 1 capital ratio 12.3%, up from 10.1% in 2011, as a result of capital generation and management actions. |
| • | CRD IV, which implements Basel III in Europe, remains unfinalised and the timetable for implementation is uncertain. |
(Unaudited)
At 31 December | ||||||||||
| 2012 | 2011 | |||||||||
| % | % | |||||||||
Core tier 1 ratio | 12.3 | 10.1 | ||||||||
Tier 1 ratio | 13.4 | 11.5 | ||||||||
Total capital ratio | 16.1 | 14.1 | ||||||||
Our approach to managing Group capital has been to ensure that we exceed current, and are well placed to meet expected future, regulatory requirements. Within the remit of Pillar 2, the FSA has defined a common equity tier 1 (‘CET1’) capital resources floor for the Group. This is expressed as a minimum target CETI ratio calculated on a Basel III end point basis, to be achieved by December 2013. In effect this accelerates our full implementation date for Basel III even though there remains uncertainty around the precise requirements in Europe.
We currently manage our capital position to meet an internal target CET1 ratio in the range 9.5%-10.5% for 31 December 2013 and will review this on an ongoing basis.
The eligibility requirements in the UK for non-equity capital securities, under Basel III rules, remained under review so we did not issue any such capital securities during 2012.
| A summary of our policies and practices regarding capital management, measurement and allocation is provided in the Appendix to Capital on page 294. |
(Unaudited)
At 31 December | ||||||||||
2012 US$m | 2011 US$m | |||||||||
Credit risk | 898,416 | 958,189 | ||||||||
Standardised approach | 374,469 | 372,039 | ||||||||
IRB foundation approach | 10,265 | 8,549 | ||||||||
IRB advanced approach | 513,682 | 577,601 | ||||||||
Counterparty credit risk | 48,319 | 53,792 | ||||||||
Standardised approach1 | 2,645 | 3,163 | ||||||||
IRB approach | 45,674 | 50,629 | ||||||||
Market risk | 54,944 | 73,177 | ||||||||
Operational risk | 122,264 | 124,356 | ||||||||
Total | 1,123,943 | 1,209,514 | ||||||||
Of which: | ||||||||||
Run-off portfolios | 145,689 | 181,657 | ||||||||
Legacy credit in GB&M | 38,587 | 50,023 | ||||||||
US CML and Other | 107,102 | 131,634 | ||||||||
Card and Retail Services2 | 6,858 | 52,080 | ||||||||
For footnotes, see page 292.
(Unaudited)
| At 31 December | ||||||||||
2012 US$m | 2011 US$m | |||||||||
VAR | 7,616 | 11,345 | ||||||||
Stressed VAR | 11,048 | 19,117 | ||||||||
Incremental risk charge | 11,062 | 5,249 | ||||||||
Comprehensive risk measure | 3,387 | 6,013 | ||||||||
Other VAR and stressed VAR | 11,355 | 12,957 | ||||||||
Internal model based | 44,468 | 54,681 | ||||||||
FSA standard rules | 10,476 | 18,496 | ||||||||
| 54,944 | 73,177 | |||||||||
(Unaudited)
| At 31 December | ||||||||||
| 2012 US$bn | 2011 US$bn | |||||||||
Retail Banking and Wealth | 276.6 | 351.2 | ||||||||
Commercial Banking | 397.0 | 382.9 | ||||||||
Global Banking and Markets | 403.1 | 423.0 | ||||||||
Global Private Banking | 21.7 | 22.5 | ||||||||
Other | 25.5 | 29.9 | ||||||||
Total | 1,123.9 | 1,209.5 | ||||||||
282
Table of Contents
HSBC HOLDINGS PLC
Report of the Directors: Operating and Financial Review(continued)
(Unaudited)
| At 31 December | ||||||||||
| 2012 US$bn | 2011 US$bn | |||||||||
Total | 1,123.9 | 1,209.5 | ||||||||
Europe | 314.7 | 340.2 | ||||||||
Hong Kong | 111.9 | 105.7 | ||||||||
Rest of Asia-Pacific | 302.2 | 279.3 | ||||||||
MENA | 62.2 | 58.9 | ||||||||
North America | 253.0 | 337.3 | ||||||||
Latin America | 97.9 | 102.3 | ||||||||
For footnote, see page 292.
RWAs reduced by US$86bn to US$1,124bn in 2012, due to a combination of management actions and business growth.
(Unaudited)
Credit risk RWAs are calculated using three approaches as permitted by the UK regulator. For consolidated Group reporting we have adopted the advanced IRB approach for the majority of our business, with a small proportion on the foundation IRB approach and the remaining portfolios being on the standardised approach.
For portfolios treated under the standardised approach, credit risk RWA movements were
primarily due to the increase of US$30bn in our associates in mainland China, mainly from loan growth in BoCom and Industrial Bank. This was partially offset by the first tranche sale of Ping An, which resulted in its banking subsidiary no longer being included in the regulatory consolidation for RWAs. The remaining holding, at year end, was treated as a deduction from capital, giving a year-on-year reduction in RWAs of US$21bn. For further details see page 39.
In Europe, a reduction in standardised RWAs for CMB and GB&M of US$6.5bn reflected reduced corporate lending in selected eurozone countries and a movement to the IRB supervisory slotting approach for the shipping portfolio in Greece. In Latin America, corporate lending growth in the region was more than offset by the reduction in corporate exposure from the sale of operations in Costa Rica, El Salvador and Honduras, and the managing down of vehicle finance and payroll loan portfolios in Brazil.
Credit risk RWA movements by key driver for portfolios treated under the IRB approach are set out in the table below. For the basis of preparation, see the Appendix to Capital on page 298. Foreign exchange movements had an impact of US$6.2bn; the discussion of the remaining drivers excludes the effect of foreign exchange.
RWA movement by key driver – credit risk – IRB only
(Unaudited)
| Europe US$bn | Hong Kong | Rest of Pacific | MENA US$bn | North America US$bn | Latin America US$bn | Total US$bn | ||||||||||||||||||||||||||||||||||
RWAs at 1 January 2012 | 156.5 | 68.0 | 82.3 | 12.9 | 254.5 | 12.0 | 586.2 | |||||||||||||||||||||||||||||||||
Foreign exchange movement | 4.7 | 0.1 | 0.8 | (0.2 | ) | 0.7 | 0.1 | 6.2 | ||||||||||||||||||||||||||||||||
Acquisitions and disposals | – | – | (0.1 | ) | (0.7 | ) | (40.3 | ) | (0.9 | ) | (42.0 | ) | ||||||||||||||||||||||||||||
Book size | (1.8 | ) | 3.6 | 5.4 | 1.0 | (7.6 | ) | (0.6 | ) | – | ||||||||||||||||||||||||||||||
Book quality | (6.6 | ) | 1.5 | (1.1 | ) | (0.3 | ) | (17.9 | ) | 0.1 | (24.3 | ) | ||||||||||||||||||||||||||||
Model updates | 0.4 | – | – | 0.1 | – | – | 0.5 | |||||||||||||||||||||||||||||||||
Portfolios moving onto IRB approach | 1.4 | – | – | 0.1 | – | – | 1.5 | |||||||||||||||||||||||||||||||||
New/updated models | (1.0 | ) | – | – | – | – | – | (1.0 | ) | |||||||||||||||||||||||||||||||
Methodology and policy | (2.5 | ) | (3.0 | ) | 4.8 | (0.2 | ) | (2.3 | ) | 0.5 | (2.7 | ) | ||||||||||||||||||||||||||||
Internal updates | (1.3 | ) | (3.0 | ) | 4.8 | (0.2 | ) | (2.3 | ) | 0.5 | (1.5 | ) | ||||||||||||||||||||||||||||
External updates | (1.2 | ) | – | – | – | – | – | (1.2 | ) | |||||||||||||||||||||||||||||||
Total RWA movement | (5.8 | ) | 2.2 | 9.8 | (0.3 | ) | (67.4 | ) | (0.8 | ) | (62.3 | ) | ||||||||||||||||||||||||||||
RWAs at 31 December 2012 | 150.7 | 70.2 | 92.1 | 12.6 | 187.1 | 11.2 | 523.9 | |||||||||||||||||||||||||||||||||
Management actions in the North America RBWM business, most notably the disposal of the Card and Retail Services business and the non-strategic branches in upstate New York, reduced RWAs by US$40bn.
Movements in book quality in the RBWM North America retail business accounted for US$14bn of the US$18bn reduction in RWAs. These retail reductions were mainly due to a refinement in risk metrics for mortgage exposures with a US$6.1bn RWA impact attained through
283
Table of Contents
HSBC HOLDINGS PLC
Report of the Directors: Operating and Financial Review(continued)
recalibration with more recent data observations. Further reductions of US$7.4bn were due to positive credit quality migration and the progression of assets into default as a result of the challenging conditions in the US mortgage market. As assets approach and go into default, capital requirements are increasingly reflected in an expected loss deduction from capital, rather than having a direct effect on RWAs (see ‘Deductions’ within ‘Composition of regulatory capital’ on page 286). Additionally, RBWM continued to manage down the residual balances in our North America retail portfolios through a combination of run-off and write-off which resulted in a reduction in RWAs of US$12bn. In our North America wholesale portfolios, there was an increase in book size with RWA growth of US$4.9bn, mainly in our CMB and GB&M businesses. This was partially offset by favourable movements in book quality for those portfolios which reduced RWAs by US$4.5bn.
Corporate and commercial lending and trade finance activity in our CMB and GB&M businesses were the primary drivers of the book size RWA growth of US$9.0bn in Rest of Asia-Pacific and Hong Kong, while the book quality was relatively stable overall. Data enhancements in Rest of Asia-Pacific and Hong Kong allowed us to improve the quantification of exposure and risk metrics, and are reflected in internal methodology and policy updates.
In Europe, rating agency actions on ABSs held in GB&M business were one of the main drivers for the movement in book quality of a reduction of US$6.6bn in RWAs. Lower grade investments are deducted from capital rather than risk-weighted, such that the effect is reflected in reduced RWAs and increased capital deductions (see ‘Deductions’ within ‘Composition of regulatory capital’ on page 286). Other drivers of the movement in book quality included an improvement in the credit quality of the corporate portfolio in CMB and retail portfolios in RBWM. Reductions in the Europe IRB book size were from lower corporate and institutional exposures in GB&M, partly offset by corporate exposure growth in the top CMB markets. A change in methodology for the regulatory treatment of European Economic Area (‘EEA’) central bank exposures, to include them in the standardised approach, resulted in a reduction of US$1.2bn.
In the Middle East and Latin America, book size and book quality levels were stable, with the main credit risk RWA movements reflecting mergers and acquisitions, including purchases in Oman and the
UAE and disposals in Costa Rica, Honduras and El Salvador.
Counterparty credit risk and market risk RWAs
(Unaudited)
Trading portfolio movements for the modelled approaches to market risk and counterparty credit risk (‘CCR’) RWAs are outlined in the tables below. For the basis of preparation, see the Appendix to Capital on page 295.
RWA movement by key driver – counterparty credit risk – IRB only
(Unaudited)
| US$bn | ||||
RWAs at 1 January 2012 | 50.6 | |||
Book size | (0.8 | ) | ||
Book quality | 0.1 | |||
Model updates | (0.2 | ) | ||
Methodology and policy | (4.0 | ) | ||
Internal updates | (4.0 | ) | ||
External updates | – | |||
Total RWA movement | (4.9 | ) | ||
RWAs at 31 December 2012 | 45.7 | |||
CCR RWAs decreased by US$4.9bn during the year, primarily due to methodology and policy changes in GB&M. The main drivers of the change arose through the increased application of counterparty netting within the calculation and from counterparty data refinement which allowed us to apply lower potential future exposure add-on factors. There were reductions in book size in North America, due to a decrease in the GB&M legacy credit portfolio and from maturing trades, and in Latin America due to reduced repo activity with central banks and lower exposure in respect of derivative transactions.
RWA movement by key driver – market risk – internal model based
(Unaudited)
| US$bn | ||||
RWAs at 1 January 2012 | 54.7 | |||
Foreign exchange movement and other | (0.4 | ) | ||
Movement in risk levels | (7.4 | ) | ||
Model updates | – | |||
Methodology and policy | (2.4 | ) | ||
Internal updates | (2.4 | ) | ||
External updates | – | |||
Total RWA movement | (10.2 | ) | ||
RWAs at 31 December 2012 | 44.5 | |||
284
Table of Contents
HSBC HOLDINGS PLC
Report of the Directors: Operating and Financial Review(continued)
Market risk RWAs decreased by US$10bn in 2012 with the main driver being a reduction in risk levels of US$11bn in GB&M, primarily as a result of decreasing VAR due to reductions in exposure and improvements in market conditions. The factors affecting the reductions in VAR also drove the reductions in the levels of stressed VAR. The effect was partly offset by a US$4.0bn risk level increase in the incremental risk charge as a result of a recalibration of the sovereign correlation matrix. RWA changes due to methodology and policy of US$2.4bn were due to a reduction in the VAR multiplier in France.
Market risk RWA movements for portfolios not within scope of modelled approaches showed a reduction of US$8.0bn. This was mainly driven by management actions by GB&M to reduce legacy positions in North America.
(Unaudited)
Operational risk RWAs remained stable in 2012, being calculated on a three-year average of revenues.
Movement in total regulatory capital in 2012
(Audited)
Source and application of total regulatory capital
| At 31 December | ||||||||||
2012 US$m | 2011 US$m | |||||||||
Movement in total regulatory capital | ||||||||||
(Audited) | ||||||||||
Opening core tier 1 capital | 122,496 | 116,116 | ||||||||
Contribution to core tier 1 capital from profit for the year | 17,827 | 14,011 | ||||||||
Consolidated profits attributable to shareholders of the parent company | 14,027 | 16,797 | ||||||||
Removal of own credit spread net of tax | 3,800 | (2,786 | ) | |||||||
Net dividends | (5,613 | ) | (5,271 | ) | ||||||
Dividends | (8,042 | ) | (7,501 | ) | ||||||
Add back: shares issued in lieu of dividends | 2,429 | 2,230 | ||||||||
Decrease in goodwill and intangible assets deducted | 1,686 | 582 | ||||||||
Ordinary shares issued | 594 | 96 | ||||||||
Foreign currency translation differences | 989 | (2,705 | ) | |||||||
Other, including regulatory adjustments | 810 | (333 | ) | |||||||
Closing core tier 1 capital | 138,789 | 122,496 | ||||||||
Opening other tier 1 capital | 17,094 | 17,063 | ||||||||
Hybrid capital securities redeemed | (776 | ) | – | |||||||
Unconsolidated investments | (4,120 | ) | 71 | |||||||
Other, including regulatory adjustments | 61 | (40 | ) | |||||||
Closing tier 1 capital | 151,048 | 139,590 | ||||||||
Opening tier 2 capital | 30,744 | 34,376 | ||||||||
Redeemed capital | (1,483 | ) | (3,360 | ) | ||||||
Other, including regulatory adjustments | 497 | (272 | ) | |||||||
Closing total regulatory capital | 180,806 | 170,334 | ||||||||
We complied with the FSA’s capital adequacy requirements throughout 2011 and 2012. Internal capital generation contributed US$12bn to core tier 1 capital, being profits attributable to
shareholders of the parent company after regulatory adjustment for own credit spread and net of dividends. The table below sets out the composition of our capital under the current regulatory requirements.
285
Table of Contents
HSBC HOLDINGS PLC
Report of the Directors: Operating and Financial Review(continued)
Composition of regulatory capital
(Audited)
At 31 December | ||||||||||||||||
| Ref | 2012 US$m | 2011 US$m | ||||||||||||||
Tier 1 capital | ||||||||||||||||
Shareholders’ equity | 167,360 | 154,148 | ||||||||||||||
Shareholders’ equity per balance sheet4 | a | 175,242 | 158,725 | |||||||||||||
Preference share premium | b | (1,405 | ) | (1,405 | ) | |||||||||||
Other equity instruments | c | (5,851 | ) | (5,851 | ) | |||||||||||
Deconsolidation of special purpose entities5 | a | (626 | ) | 2,679 | ||||||||||||
Non-controlling interests | 4,348 | 3,963 | ||||||||||||||
Non-controlling interests per balance sheet | d | 7,887 | 7,368 | |||||||||||||
Preference share non-controlling interests | e | (2,428 | ) | (2,412 | ) | |||||||||||
Non-controlling interests transferred to tier 2 capital | f | (501 | ) | (496 | ) | |||||||||||
Non-controlling interests in deconsolidated subsidiaries | d | (610 | ) | (497 | ) | |||||||||||
Regulatory adjustments to the accounting basis | (2,437 | ) | (4,331 | ) | ||||||||||||
Unrealised losses on available-for-sale debt securities6 | 1,223 | 2,228 | ||||||||||||||
Own credit spread | 112 | (3,608 | ) | |||||||||||||
Defined benefit pension fund adjustment7 | g | (469 | ) | (368 | ) | |||||||||||
Reserves arising from revaluation of property and unrealised gains on available-for-sale equities | (3,290 | ) | (2,678 | ) | ||||||||||||
Cash flow hedging reserve | (13 | ) | 95 | |||||||||||||
Deductions | (30,482 | ) | (31,284 | ) | ||||||||||||
Goodwill and intangible assets | h | (25,733 | ) | (27,419 | ) | |||||||||||
50% of securitisation positions | (1,776 | ) | (1,207 | ) | ||||||||||||
50% of tax credit adjustment for expected losses | 111 | 188 | ||||||||||||||
50% of excess of expected losses over impairment allowances | i | (3,084 | ) | (2,846 | ) | |||||||||||
Core tier 1 capital | 138,789 | 122,496 | ||||||||||||||
Other tier 1 capital before deductions | 17,301 | 17,939 | ||||||||||||||
Preference share premium | b | 1,405 | 1,405 | |||||||||||||
Preference share non-controlling interests | e | 2,428 | 2,412 | |||||||||||||
Hybrid capital securities | j | 13,468 | 14,122 | |||||||||||||
Deductions | (5,042 | ) | (845 | ) | ||||||||||||
Unconsolidated investments8 | (5,153 | ) | (1,033 | ) | ||||||||||||
50% of tax credit adjustment for expected losses | 111 | 188 | ||||||||||||||
Tier 1 capital | 151,048 | 139,590 | ||||||||||||||
Tier 2 capital | ||||||||||||||||
Total qualifying tier 2 capital before deductions | 48,231 | 48,676 | ||||||||||||||
Reserves arising from revaluation of property and unrealised gains on available-for-sale equities | 3,290 | 2,678 | ||||||||||||||
Collective impairment allowances | k | 2,717 | 2,660 | |||||||||||||
Perpetual subordinated debt | l | 2,778 | 2,780 | |||||||||||||
Term subordinated debt | m | 39,146 | 40,258 | |||||||||||||
Non-controlling interests in tier 2 capital | f | 300 | 300 | |||||||||||||
Total deductions other than from tier 1 capital | (18,473 | ) | (17,932 | ) | ||||||||||||
Unconsolidated investments8 | (13,604 | ) | (13,868 | ) | ||||||||||||
50% of securitisation positions | (1,776 | ) | (1,207 | ) | ||||||||||||
50% of excess of expected losses over impairment allowances | i | (3,084 | ) | (2,846 | ) | |||||||||||
Other deductions | (9 | ) | (11 | ) | ||||||||||||
Total regulatory capital | 180,806 | 170,334 | ||||||||||||||
For footnotes, see page 292.
The references (a) – (m) identify balance sheet components on page 287 which are used in the calculation of regulatory capital.
286
Table of Contents
HSBC HOLDINGS PLC
Report of the Directors: Operating and Financial Review(continued)
Regulatory impact of management actions
(Unaudited)
| At 31 December 2012 | ||||||||||||||||||||||
| Risk- weighted assets | Core tier 1 capital | Tier 1 capital | Total regulatory capital | |||||||||||||||||||
Reported capital ratios before management actions | 12.3% | 13.4% | 16.1% | |||||||||||||||||||
Reported totals (US$m) | 1,123,943 | 138,789 | 151,048 | 180,806 | ||||||||||||||||||
Management actions completed in 2013 (US$m) | ||||||||||||||||||||||
Dilution of our shareholding in Industrial Bank and the subsequent change in | (38,073 | ) | 981 | (423 | ) | (1,827 | ) | |||||||||||||||
Completion of the second tranche of the sale of Ping An | – | 553 | 4,637 | 7,984 | ||||||||||||||||||
Estimated total after management actions completed in 2013 (US$m) | 1,085,870 | 140,323 | 155,262 | 186,963 | ||||||||||||||||||
Estimated capital ratios after management actions completed in 2013 | 12.9% | 14.3% | 17.2% | |||||||||||||||||||
Reconciliation of accounting and regulatory balance sheets
(Unaudited)
| At 31 December 2012 | ||||||||||||||||||||||||||
| Ref | Accounting US$m | Decon- solidation of insurance/ other entities | Consolidation of banking associates | Regulatory US$m | ||||||||||||||||||||||
Assets | ||||||||||||||||||||||||||
Trading assets | 408,811 | (144 | ) | 1,477 | 410,144 | |||||||||||||||||||||
Loans and advances to customers | 997,623 | (11,957 | ) | 119,698 | 1,105,364 | |||||||||||||||||||||
– impairment allowances on IRB portfolios | i | (10,255 | ) | – | – | (10,255 | ) | |||||||||||||||||||
– impairment allowances on STD portfolios | k | (5,857 | ) | – | (2,726 | ) | (8,583 | ) | ||||||||||||||||||
Financial investments | 421,101 | (50,256 | ) | 33,110 | 403,955 | |||||||||||||||||||||
Capital invested in insurance and other entities | – | 8,384 | – | 8,384 | ||||||||||||||||||||||
Interests in associates and joint ventures | 17,834 | – | (17,127 | ) | 707 | |||||||||||||||||||||
of which: | ||||||||||||||||||||||||||
– positive goodwill on acquisition | h | 670 | (640 | ) | 30 | |||||||||||||||||||||
Goodwill and intangible assets | h | 29,853 | (4,983 | ) | 687 | 25,557 | ||||||||||||||||||||
Other assets | 817,316 | (34,672 | ) | 82,469 | 865,113 | |||||||||||||||||||||
of which: | ||||||||||||||||||||||||||
– goodwill and intangible assets of disposal groups held for sale | h | 146 | (117 | ) | – | 29 | ||||||||||||||||||||
– retirement benefits assets | g | 2,846 | – | – | 2,846 | |||||||||||||||||||||
– impairment allowances on asset held for sale | (703 | ) | – | – | (703 | ) | ||||||||||||||||||||
of which: | ||||||||||||||||||||||||||
– IRB portfolios | i | (691 | ) | – | – | (691 | ) | |||||||||||||||||||
– STD portfolios | k | (12 | ) | – | – | (12 | ) | |||||||||||||||||||
Total assets | 2,692,538 | (93,628 | ) | 220,314 | 2,819,224 | |||||||||||||||||||||
287
Table of Contents
HSBC HOLDINGS PLC
Report of the Directors: Operating and Financial Review(continued)
| At 31 December 2012 | ||||||||||||||||||||||||||
| Ref | Accounting US$m | Decon- solidation of insurance/ other entities | Consolidation of banking associates | Regulatory US$m | ||||||||||||||||||||||
Liabilities and equity | ||||||||||||||||||||||||||
Deposits by banks | 107,429 | (202 | ) | 51,296 | 158,523 | |||||||||||||||||||||
Customer accounts | 1,340,014 | (652 | ) | 158,631 | 1,497,993 | |||||||||||||||||||||
Trading liabilities | 304,563 | (131 | ) | 119 | 304,551 | |||||||||||||||||||||
Financial liabilities designated at fair value | 87,720 | (12,437 | ) | – | 75,283 | |||||||||||||||||||||
of which: | ||||||||||||||||||||||||||
– term subordinated debt included in tier 2 capital | m | 16,863 | – | – | 16,863 | |||||||||||||||||||||
– hybrid capital securities included in tier 1 capital | j | 4,696 | – | – | 4,696 | |||||||||||||||||||||
Debt securities in issue | 119,461 | (11,390 | ) | 1,888 | 109,959 | |||||||||||||||||||||
Retirement benefits liabilities | g | 3,905 | (21 | ) | 52 | 3,936 | ||||||||||||||||||||
Subordinated liabilities | 29,479 | 3 | 2,953 | 32,435 | ||||||||||||||||||||||
of which: | ||||||||||||||||||||||||||
– hybrid capital securities included in tier 1 capital | j | 2,828 | – | – | 2,828 | |||||||||||||||||||||
– perpetual subordinated debt included in tier 2 capital | l | 2,778 | – | – | 2,778 | |||||||||||||||||||||
– term subordinated debt included in tier 2 capital | m | 23,873 | – | – | 23,873 | |||||||||||||||||||||
Other liabilities | 516,838 | (67,562 | ) | 5,375 | 454,651 | |||||||||||||||||||||
of which: | ||||||||||||||||||||||||||
– contingent liabilities and contractual commitments | 301 | – | – | 301 | ||||||||||||||||||||||
of which: | ||||||||||||||||||||||||||
– credit-related provisions on IRB portfolios | i | 267 | – | – | 267 | |||||||||||||||||||||
– credit-related provisions on STD portfolios | k | 34 | – | – | 34 | |||||||||||||||||||||
Total shareholders’ equity | a | 175,242 | (626 | ) | (0 | ) | 174,616 | |||||||||||||||||||
of which: | ||||||||||||||||||||||||||
– other equity instruments included in tier 1 capital | c, j | 5,851 | – | – | 5,851 | |||||||||||||||||||||
– preference share premium included in tier 1 capital | b | 1,405 | – | – | 1,405 | |||||||||||||||||||||
Non-controlling interests | d | 7,887 | (610 | ) | 0 | 7,277 | ||||||||||||||||||||
of which: | ||||||||||||||||||||||||||
– non-cumulative preference shares issued by subsidiaries included in tier 1 capital | e | 2,428 | – | – | 2,428 | |||||||||||||||||||||
– non-controlling interests included in tier 2 capital, cumulative preferred stock | f | 300 | – | – | 300 | |||||||||||||||||||||
– non-controlling interests attributable to holders of ordinary shares in subsidiaries included in tier 2 capital | f,m | 201 | – | – | 201 | |||||||||||||||||||||
Total liabilities and equity | 2,692,538 | (93,628 | ) | 220,314 | 2,819,224 | |||||||||||||||||||||
For footnote, see page 292.
The references (a) – (m) identify balance sheet components which are used in the calculation of regulatory capital on page 286.
Regulatory and accounting consolidations
(Unaudited)
The basis of consolidation for financial accounting purposes is described in Note 1 on the Financial Statements and differs from that used for regulatory purposes. The table above provides a reconciliation of the financial accounting balance sheet to the regulatory balance sheet. Not all items are reconcilable, due to regulatory adjustments that are applied, for example to non-core capital instruments before they can be included in the Group’s regulatory capital base. It is the regulatory balances, and not the financial accounting balance sheet, which form the basis for the regulatory capital calculations. Investments in banking associates are equity accounted in the financial accounting consolidation, whereas their assets and liabilities are proportionally consolidated for regulatory purposes. Subsidiaries and associates engaged in insurance and
non-financial activities are excluded from the regulatory consolidation and are deducted from regulatory capital. The regulatory consolidation does not include SPEs where significant risk has been transferred to third parties. Exposures to these SPEs are risk-weighted as securitisation positions for regulatory purposes. Entities in respect of which the basis of consolidation for financial accounting purposes differs from that used for regulatory purposes can be found in thePillar 3 Disclosures 2012 report.
Basel III and its implementation in Europe
(Unaudited)
In July 2011, the European Commission published proposals for a new Regulation and Directive, known collectively as CRD IV, to give effect to the Basel III framework in the EU. The majority of the Basel III proposals are in the Regulation, removing
288
Table of Contents
HSBC HOLDINGS PLC
Report of the Directors: Operating and Financial Review(continued)
national discretion. However, capital buffers such as those for countercyclical and capital conservation are in the Directive and are subject to transposition into national law by member states. CRD IV implementation has been delayed and the timetable for finalisation is uncertain.
In October 2012, the FSA wrote to large firms to set out the disclosures they are required to make of capital resources on a first year transitional basis under CRD IV. We have made these disclosures in appendix III of thePillar 3 Disclosures 2012 report.
Following the FSA’s setting of a Capital Resources Floor, and in order to manage our transition to Basel III under CRD IV, we provide below some insight for investors of the possible effects of these rules on our capital position. We have estimated our pro-forma CET1 ratio by applying
our interpretation of the CRD IV draft July 2011 text post the transition period (end point CRD IV) to our balance sheet position at 31 December 2012.
In managing our capital position to meet our internal CET1 target, we consider management actions resulting from our six filters strategy that we either have already taken or would take, if the CRD IV rules were to be finalised in the July 2011 form. These are reflected in the table below under ‘Estimated regulatory impact of management actions’. Other management actions could be taken depending upon the finalised rules and timing of implementation but, as such, have not been included.
The application of the CRD IV rules on this basis would translate into an estimated CET1 ratio of 9.0% before management actions and 10.3% after such actions, as detailed in the table below.
Estimated effect of CRD IV end point rules applied to the 31 December 2012 position
(Unaudited)
| At 31 December 2012 | ||||||||||
RWAs US$m | Capital US$m | |||||||||
Reported core tier 1 capital under the current regime | 138,789 | |||||||||
Regulatory adjustments applied to core tier 1 in respect of amounts subject to CRD IV treatment | ||||||||||
Investments in own shares through the holding of composite products of which HSBC is a component | (1,322 | ) | ||||||||
Surplus non-controlling interest disallowed in CET1 | (2,299 | ) | ||||||||
Removal of filters under current regime | ||||||||||
– Unrealised gains/(losses) on available-for-sale debt securities | (1,223 | ) | ||||||||
– Unrealised gains on available-for-sale equities | 2,088 | |||||||||
– Reserves arising from revaluation of property | 1,202 | |||||||||
– Defined benefit pension fund liabilities | (1,596 | ) | ||||||||
Excess of expected losses over impairment allowances deducted 100% from CET1 | (3,084 | ) | ||||||||
Removal of 50% of tax credit adjustment for expected losses | (111 | ) | ||||||||
Securitisations positions risk-weighted under CRD IV | 1,776 | |||||||||
Deferred tax liabilities on intangibles | 267 | |||||||||
Deferred tax assets that rely on future profitability (excluding those arising from temporary differences) | (456 | ) | ||||||||
Additional valuation adjustment (referred to as PVA) | (1,720 | ) | ||||||||
Debit valuation adjustment | (372 | ) | ||||||||
Individually immaterial holdings in CET1 capital of banks, financial institutions and insurance in aggregate above 10% of HSBC CET1 | (5,994 | ) | ||||||||
Deductions under threshold approach | ||||||||||
Amount exceeding the 10% threshold: | ||||||||||
– Significant investments in CET1 capital of banks, financial institutions and insurance | (6,697 | ) | ||||||||
Amount in aggregate exceeding the 15% threshold: | ||||||||||
– Significant investments in CET1 capital of banks, financial institutions and insurance | (2,265 | ) | ||||||||
– Deferred tax assets | (1,532 | ) | ||||||||
Estimated CET1 capital under CRD IV | 115,451 | |||||||||
Reported total RWAs | 1,123,943 | |||||||||
Changes to capital requirements introduced by CRD IV | ||||||||||
Credit valuation adjustment | 60,360 | |||||||||
Counterparty credit risk (other than credit valuation adjustment) | 25,682 | |||||||||
Amounts in aggregate below 15% threshold and therefore subject to 250% risk weight | 43,295 | |||||||||
Securitisation positions and free deliveries risk-weighted under CRD IV | 44,513 | |||||||||
Investments in commercial entities now risk-weighted | 393 | |||||||||
Deferred tax assets moved to threshold deduction under CRD IV | (8,976 | ) | ||||||||
Estimated total RWAs under CRD IV | 1,289,210 | |||||||||
Estimated CET1 ratio | 9.0% | |||||||||
289
Table of Contents
HSBC HOLDINGS PLC
Report of the Directors: Operating and Financial Review(continued)
| At 31 December 2012 | ||||||||||
RWAs US$m | Capital US$m | |||||||||
Estimated regulatory impact of management actions | ||||||||||
Management actions completed in 2013: | ||||||||||
Dilution of our shareholding in Industrial Bank and the subsequent change in accounting treatment | (38,880 | ) | (2,150 | ) | ||||||
Completion of the second tranche of the sale of Ping An | 3,522 | 9,393 | ||||||||
Estimated total after management actions completed in 2013 | 1,253,852 | 122,694 | ||||||||
Estimated CET1 ratio after management actions completed in 2013 | 9.8% | |||||||||
Planned short-term management actions if rules are finalised in their current form: | 2,645 | 7,052 | ||||||||
Estimated total after planned management actions | 1,256,497 | 129,746 | ||||||||
Estimated CET1 ratio after planned management actions | 10.3% | |||||||||
For the detailed basis of preparation, see page 298 of the Appendix to Capital.
The table above presents a reconciliation of our reported core tier 1 capital and RWAs position at 31 December 2012 to the pro-forma estimated CET1 end point capital and estimated RWAs based on our interpretation of the July 2011 draft CRD IV regulation, supplemented by FSA guidance and, in lieu of guidance, our expectation of how these draft rules will be updated following EU negotiations.
CRD IV is not yet in law and its provisions are subject to ongoing negotiation and amendment. As such, the finalised rules could have a materially different effect on CET1 and RWAs.
The CRD IV rule changes introduce a revised definition of regulatory capital, primarily focused on CET1 capital as the predominant form of going concern capital, with a greater quantum to be held by banks. There are increased capital deductions and new regulatory adjustments affecting this higher tier of capital. The new rules also introduce increased RWA requirements, mainly for CCR.
The largest impact on our CET1 capital is the deduction of unconsolidated significant investments in banks, financial institutions and insurance entities of US$9.0bn (shown as US$6.7bn and US$2.3bn in the table above). This results from a reallocation of current deductions to this higher tier of capital and new rules for calculating the amounts to be deducted.
Adding to the above, the regulatory treatment applied to immaterial unconsolidated investments in banks, financial institutions and insurance entities, whereby a maturity restriction does not recognise the netting of long and short positions when the short position is less than one year residual maturity, even though they are hedged from a market risk
perspective. This results in an estimated deduction of US$6.0bn. The effect on capital is exacerbated by its impact on the threshold for other deductions.
The rules are currently in draft and subject to ongoing negotiation. If they were to be finalised in their current form, the holdings of such positions would generate a disproportionate capital cost and potentially the relevant business could be curtailed, closed or our hedging would be adjusted to negate the impact.
Capital management initiatives and management actions already adopted by the Group, in accordance with our six filters strategic framework, have contributed to mitigating the effect of the future rules. In 2012, this included the continuing run-off of capital intensive portfolios including the US CML and the GB&M legacy credit portfolios and the sale of the Card and Retail Services business. Post year-end, we sold our remaining investment in Ping An and reduced our percentage holding in Industrial Bank following a private placement by the company.
Although the effect of the future CRD IV rules is shown above on an end point basis, the rules allow for a transition period of six years to phase in the new deductions and regulatory adjustments. On a CRD IV first year transitional basis our CET1 ratio, if applied to our year end 2012 position, would be 11.5% before management actions.
As a result of the capital resources floor, we currently manage our capital position to meet an internal target CET1 ratio on an end point basis for year end 2013. We will continue to manage our capital position to ensure that it exceeds current regulatory requirements and is well placed to meet expected future regulatory requirements. We will review our capital target ratios on an ongoing basis, reflecting any changes in the regulatory environment as they develop.
290
Table of Contents
HSBC HOLDINGS PLC
Report of the Directors: Operating and Financial Review(continued)
(Unaudited)
In parallel with the Basel III proposals, the Basel Committee issued a consultative document in July 2011, ‘Global systemically important banks: assessment methodology and the additional loss absorbency requirement’. In November 2011, it published its rules and the Financial Stability Board (‘FSB’) issued the initial list of global systemically important banks (‘G-SIB’s). This list, which included HSBC and 28 other major banks from around the world, will be re-assessed periodically through annual re-scoring of the individual banks and a triennial review of the methodology.
The requirements, initially for those banks identified in November 2014 as G-SIBs, will be phased in from 1 January 2016, becoming fully effective on 1 January 2019. National regulators have discretion to introduce higher thresholds than the minima. In November 2012, the FSB published a revised list of G-SIBs and their current assessment of the appropriate capital charge. HSBC was assigned an add-on of 2.5%.
(Unaudited)
The FSA supervises HSBC on a consolidated basis. However, the UK financial services regulatory structure is currently in the process of substantial reform. Legislation has been passed to abolish the FSA and establish three new regulatory bodies from 1 April 2013.
The three new bodies will comprise the Financial Policy Committee (‘FPC’) of the Bank of England, the Prudential Regulation Authority (‘PRA’) and the Financial Conduct Authority (‘FCA’). The FPC will not directly supervise firms, being responsible for macro-prudential regulation and considering systemic risk affecting economic and financial stability. The PRA and the FCA will inherit the majority of the FSA’s existing functions as the micro-prudential supervisors. Some subsidiaries such as HSBC Bank will be ‘dual-regulated’ firms, subject to prudential regulation by the PRA and to conduct regulation by the FCA. These reforms will endow the new regulatory bodies with additional powers. For example, under certain circumstances the PRA and FCA will be able to issue directions to unregulated qualifying parent undertakings such as HSBC Holdings.
In the case of the FPC, its January 2013 Draft Policy Statement, ‘The Financial Policy Committee’s power to supplement capital requirements’, states that
it will have two main powers: the first is to make recommendations, and the second is a power to direct the FCA and the PRA to adjust specific macro-prudential tools, namely the countercyclical capital buffer (‘CCB’) and sectoral capital requirements (‘SCR’s’). The UK Government is proposing to make the FPC responsible for setting the CCB, a Basel III global requirement applied to certain financial institutions in the UK. The CCB is a macro-prudential tool at the disposal of national authorities that can be deployed to protect the banking sector from future potential losses when the FPC judges that threats to financial stability have arisen in the UK which increase system-wide risk. Should a CCB be required, it is expected to be set in the range of 0-2.5%.
It is also planned under the new legislation to give the FPC ‘direction power’, over SCR’s. The SCR tool is more targeted and would allow the FPC to change capital requirements above minimum regulatory standards for exposures to three broad sectors judged to pose a risk to the system as a whole (residential property, including mortgages; commercial property; and other parts of the financial sector). However, on occasion this may be applied to more granular sub-sectors (for example, to mortgages with high loan to value or loan to income ratios at origination). This will include both banking book and trading book exposures and be irrespective of the domicile of the ultimate borrower.
The CCB and SCR tools are described as broad tools designed to reduce the likelihood and severity of financial crises, their primary purpose being to tackle cyclical risks. They provide the FPC with the means to increase the amount of capital that banks must hold when threats to financial stability are judged to be emerging. However, the scale of capital add-ons in respect of SCR has not been quantified.
There is also a proposal for a systemic risk buffer for the banking system as a whole (or a subset thereof) to mitigate structural macro-prudential risk.
Potential effect of regulatory proposals on HSBC’s capital requirements
Given the above it is uncertain what HSBC’s final capital requirement will be. However, quantified Pillar 1 capital requirements are as follows:
CET1 requirements from 1 January 2019 | ||||
Minimum CET1 | 4.5% | |||
Capital conservation buffer | 2.5% | |||
G-SIB buffer | 2.5% |
Against the backdrop of eurozone instability, on a temporary basis, the EBA recommended that
291
Table of Contents
HSBC HOLDINGS PLC
Report of the Directors: Operating and Financial Review(continued)
banks aim to reach a 9% EBA defined core tier 1 ratio by the end of June 2012. In October 2012 the EBA announced that they would no longer monitor the core tier 1 ratio but instead expect banks to hold an equivalent nominal amount of capital. This new EBA recommendation on capital conservation will require banks to maintain a nominal amount of core tier 1 capital corresponding to the level of 9% of RWAs at the end of June 2012. This equates to US$104bn for HSBC. We will continue to review our internal target CETI ratio of 9.5% to 10.5% as the applicable regulatory capital requirements evolve during the period until 1 January 2019.
We also hold additional capital in respect of Pillar 2, the process of internal capital adequacy assessment and supervisory review which leads to a final determination by the FSA of individual capital guidance and any capital planning buffer that may be required.
Complementing the above, and also within the Pillar 2 process, the FSA first advised the Group in 2012 of a capital resources floor. This is expressed as a minimum target CET1 ratio calculated on a Basel III end point basis, to be achieved by December 2013.
In 2013 the FSA will introduce new industry-wide capital measures. They will floor all sovereign loss given defaults (‘LGD’s) at 45% and we estimate the effect of this to be an increase of US$19bn RWAs. Additionally, a stringent supervisory slotting approach for our UK commercial real estate portfolio will be introduced. For HSBC, this will roll out across the relevant business during 2013. Furthermore, the FSA have informed HSBC of a
framework which will be used when assessing wholesale portfolios with a low number of defaults. This framework will impose LGD and exposure at default (‘EAD’) floors based on the foundation approach for portfolios with less than 20 events of default per country.
(Unaudited)
In September 2011, the Independent Commission on Banking (‘ICB’) recommended heightened capital requirements for UK banking groups. In June 2012, the UK Government published its consultation, ‘Banking reform: delivering stability and supporting a sustainable economy’, which set out its detailed proposals for implementing the ICB’s recommendations, such as ring-fencing and bail-in debt. In October 2012, the UK Government published draft primary legislation. This legislation was presented for pre-legislative scrutiny to the UK’s Parliamentary Commission on Banking Standards who presented their initial findings in December 2012. In February 2013, the UK Government responded to these findings and issued a revised Bill. The Government intends to enact the legislation by the end of this parliament in 2015 and to have reforms in place by 2019.
In October 2012, the Liikanen Report delivered its recommendations to the EC to reform the structure of the European banking sector. This also recommends ring-fencing, focused on isolating trading activities (rather than deposits as in the ICB recommendations) and, in principle, additional bail-in debt. We continue to monitor these developments.
Footnotes to Capital
| 1 | The value represents marked-to-market method only. |
| 2 | Operational risk RWAs, under the standardised approach, are calculated using an average of the last three years’ revenues. For business disposals, the operational risk RWAs are not released immediately on disposal, but diminish over a period of time. The RWAs for the Card and Retail Services business at 31 December 2012 represent the remaining operational risk RWAs for the business. |
| 3 | RWAs are non-additive across geographical regions due to market risk diversification effects within the Group. |
| 4 | Includes externally verified profits for the year ended 31 December 2012. |
| 5 | Mainly comprises unrealised gains/losses on available-for-sale debt securities related to SPEs. |
| 6 | Under FSA rules, unrealised gains/losses on debt securities net of tax must be excluded from capital resources. |
| 7 | Under FSA rules, any defined benefit asset is derecognised and a defined benefit liability may be substituted with the additional funding that will be paid into the relevant schemes over the following five-year period. |
| 8 | Mainly comprise investments in insurance entities and the AFS investment in Ping An. Due to the expiry of the transitional provision, with effect from 1 January 2013, material insurance holding companies acquired prior to 20 July 2006, will be deducted 50% from tier 1 and 50% from total capital. |
| 9 | This management action potentially arises only under rules on a CRD IV basis and has therefore not been included in the composition of regulatory capital table, which is drawn up on the basis of the current rules. |
292
Table of Contents
HSBC HOLDINGS PLC
Report of the Directors: Operating and Financial Review(continued)
| Appendix to Capital
Capital management, capital measurement and RWA movement |
(Audited)
Our approach to capital management is driven by our strategic and organisational requirements, taking into account the regulatory, economic and commercial environment in which we operate. Pre-tax return on risk-weighted assets (‘RoRWA’) is an operational metric by which the global businesses are managed on a day-to-day basis. The metric combines return on equity and regulatory capital efficiency objectives. It is our objective to maintain a strong capital base to support the risks inherent in our business and invest in accordance with our six filters framework, exceeding both consolidated and local regulatory capital requirements at all times.
Our policy on capital management is underpinned by a capital management framework which enables us to manage our capital in a consistent manner. The framework, which is approved by the GMB annually, incorporates a number of different capital measures including market capitalisation, invested capital, economic capital and regulatory capital. Following the FSA setting of a capital resources floor as a Basel III ratio, whilst also monitoring capital at a Group level on a Basel II basis, we set our internal target on an end point Basel III CET1 basis.
Capital measures
| • | market capitalisation is the stock market value of HSBC; |
| • | invested capital is the equity capital invested in HSBC by our shareholders, adjusted for certain reserves and goodwill previously amortised or written off; |
| • | economic capital is the internally calculated capital requirement which we deem necessary to support the risks to which we are exposed; and |
| • | regulatory capital is the capital which we are required to hold in accordance with the rules established by the FSA for the consolidated Group and by our local regulators for individual Group companies. |
Our assessment of capital adequacy is aligned to our assessment of risks, including: credit, market, operational, interest rate risk in the banking book, pension fund, insurance, structural foreign exchange risk and residual risks.
We incorporate stress testing in capital plans because it helps us to understand how sensitive the core assumptions in our capital plans are to the adverse effect of extreme but plausible events. Stress testing allows us to formulate our response and mitigate risk in advance of conditions exhibiting the identified stress scenarios. The actual market stresses which occurred throughout the financial system in recent years have been used to inform our capital planning process and enhance the stress scenarios we employ. In addition to our internal stress tests, others are undertaken, both at the request of regulators and by the regulators themselves using their prescribed assumptions. We take into account the results of all such regulatory stress testing when assessing our internal capital requirements.
Outside the stress-testing framework, a list of top and emerging risks is regularly evaluated for their effect on the core tier 1 capital ratio. In addition, there are risks identified that are technically not within the scope of this list, but which still have the potential to affect our RWAs and/or capital position. These risks are also included in the evaluation of risks to capital. The downside or upside scenarios are assessed against our capital management objectives and mitigating actions are assigned as necessary. The responsibility for global capital allocation principles and decisions rests with the GMB. Through our internal governance processes, we seek to maintain discipline over our investment and capital allocation decisions and seek to ensure that returns on investment are adequate after taking into account capital costs. Our strategy is to allocate capital to businesses and entities on the basis of their ability to achieve established RoRWA objectives and their regulatory and economic capital requirements.
293
Table of Contents
HSBC HOLDINGS PLC
Report of the Directors: Operating and Financial Review(continued)
Top-down RWA targets are established for the global business lines, in accordance with the Group’s strategic direction and risk appetite. As these targets are deployed to lower levels of management, action plans for implementation are developed. These may include growth strategies; active portfolio management; restructuring; business and/or customer-level reviews; RWA efficiency and optimisation initiatives and risk-mitigation. Our capital management process is articulated in the annual Group capital plan which is approved by the Board.
RWA targets are approved by the GMB on an annual basis and business performance against them is monitored through regular reporting to the Group ALCO. The management of capital deductions is also addressed in the RWA monitoring framework through additional notional charges for these items.
A range of analysis is employed in the RWA monitoring framework to identify the key drivers of movements in the position, such as book size and book quality. Particular attention is paid to identifying and segmenting items within the day-to-day control of the business and those items that are driven by changes in risk models or regulatory methodology.
HSBC Holdings is the primary provider of equity capital to its subsidiaries and also provides them with non-equity capital where necessary. These investments are substantially funded by HSBC Holdings’ own capital issuance and profit retention. As part of its capital management process, HSBC Holdings seeks to maintain a prudent balance between the composition of its capital and its investment in subsidiaries.
Capital measurement and allocation
(Unaudited)
The FSA supervises HSBC on a consolidated basis and therefore receives information on the capital adequacy of, and sets capital requirements for, the Group as a whole. Individual banking subsidiaries are directly regulated by their local banking supervisors, who set and monitor their capital adequacy requirements. In 2012, we calculated capital at a Group level using the Basel II framework as amended for CRD III, commonly known as Basel 2.5.
Our policy and practice in capital measurement and allocation at Group level is underpinned by the Basel II rules and Basel III proposals. However, local regulators are at different stages of implementation and some local reporting, notably in the US, is still on a Basel I basis. In most jurisdictions, non-banking financial subsidiaries are also subject to the supervision and capital requirements of local regulatory authorities.
Basel II is structured around three ‘pillars’: minimum capital requirements, supervisory review process and market discipline. The CRD implemented Basel II in the EU and the FSA then gave effect to the CRD by including the latter’s requirements in its own rulebooks.
For regulatory purposes, our capital base is divided into three main categories, namely core tier 1, other tier 1 and tier 2, depending on the degree of permanency and loss absorbency exhibited.
| • | core tier 1 capital comprises shareholders’ equity and related non-controlling interests. The book values of goodwill and intangible assets are deducted from core tier 1 capital and other regulatory adjustments are made for items reflected in shareholders’ equity which are treated differently for the purposes of capital adequacy; |
| • | qualifying capital instruments such as non-cumulative perpetual preference shares and hybrid capital securities are included in other tier 1 capital; and |
| • | tier 2 capital comprises qualifying subordinated loan capital, related non-controlling interests, allowable collective impairment allowances and unrealised gains arising on the fair valuation of equity instruments held as available for sale. Tier 2 capital also includes reserves arising from the revaluation of properties. |
To ensure the overall quality of the capital base, the FSA’s rules set restrictions on the amount of hybrid capital instruments that can be included in tier 1 capital relative to core tier 1 capital, and limits overall tier 2 capital to no more than tier 1 capital.
294
Table of Contents
HSBC HOLDINGS PLC
Report of the Directors: Operating and Financial Review(continued)
Pillar 1 covers the capital resources requirements for credit risk, market risk and operational risk. Credit risk includes counterparty credit risk and securitisation requirements. These requirements are expressed in terms of RWAs.
Credit risk capital requirements
Basel II applies three approaches of increasing sophistication to the calculation of Pillar 1 credit risk capital requirements. The most basic, the standardised approach, requires banks to use external credit ratings to determine the risk weightings applied to rated counterparties. Other counterparties are grouped into broad categories and standardised risk weightings are applied to these categories. The next level, the internal ratings-based (‘IRB’) foundation approach, allows banks to calculate their credit risk capital requirements on the basis of their internal assessment of a counterparty’s probability of default (‘PD’), but their estimates of exposure at default (‘EAD’) and loss given default (‘LGD’) are subject to standard supervisory parameters. Finally, the IRB advanced approach allows banks to use their own internal assessment in both determining PD and quantifying EAD and LGD.
The capital resources requirement, which is intended to cover unexpected losses, is derived from a formula specified in the regulatory rules which incorporates PD, LGD, EAD and other variables such as maturity and correlation. Expected losses under the IRB approaches are calculated by multiplying PD by EAD and LGD. Expected losses are deducted from capital to the extent that they exceed total accounting impairment allowances.
For credit risk we have adopted the IRB advanced approach for the majority of our portfolios, with the remainder on either IRB foundation or standardised approaches.
Under our Basel II rollout plans, a number of our Group companies and portfolios are in transition to advanced IRB approaches. At the end of 2012, portfolios in most of Europe, Hong Kong, Rest of Asia-Pacific and North America were on advanced IRB approaches. Others remain on the standardised or foundation approaches under Basel II, pending definition of local regulations or model approval, or under exemptions from IRB treatment.
| • | Counterparty credit risk |
CCR arises for OTC derivatives and securities financing transactions. It is calculated in both the trading and non-trading books and is the risk that the counterparty to a transaction may default before completing the satisfactory settlement of the transaction. Three approaches to calculating CCR and determining exposure values are defined by Basel II: standardised, mark-to-market and internal model method. These exposure values are used to determine capital requirements under one of the credit risk approaches: standardised, IRB foundation and IRB advanced.
We use the mark-to-market and internal model method approaches for CCR. Our longer-term aim is to migrate more positions from the mark-to-market to the internal model method approach.
| • | Securitisation |
Securitisation positions are held in both the trading and non-trading books. For non-trading book securitisation positions, Basel II specifies two methods for calculating credit risk requirements, the standardised and the IRB approaches. Both rely on the mapping of rating agency credit ratings to risk weights, which range from 7% to 1,250%. Positions that would otherwise be weighted at 1,250% are deducted from capital.
Within the IRB approach, we use the ratings-based method for the majority of our non-trading book securitisation positions, and the internal assessment approach for unrated liquidity facilities and programme-wide enhancements for asset-backed securitisations.
The majority of securitisation positions in the trading book are treated for capital purposes as if they are held in the non-trading book under the standardised or IRB approaches. Other traded securitisation positions, known as correlation trading, are treated under an internal model approach approved by the FSA.
Market risk capital requirement
The market risk capital requirement is measured using internal market risk models where approved by the FSA, or the FSA’s standard rules. Our internal market risk models comprise VAR, stressed VAR, incremental risk charge and correlation trading under the comprehensive risk measure.
295
Table of Contents
HSBC HOLDINGS PLC
Report of the Directors: Operating and Financial Review(continued)
Operational risk capital requirement
Basel II includes a capital requirement for operational risk, again utilising three levels of sophistication. The capital required under the basic indicator approach is a simple percentage of gross revenues, whereas under the standardised approach it is one of three different percentages of total operating income less insurance premiums allocated to each of eight defined business lines. Both these approaches use an average of the last three financial years’ revenues. Finally, the advanced measurement approach uses banks’ own statistical analysis and modelling of operational risk data to determine capital requirements. We have adopted the standardised approach in determining our operational risk capital requirements.
We conduct an Internal Capital Adequacy Assessment Process (‘ICAAP’) to determine a forward looking assessment of our capital requirements given our business strategy, risk profile, risk appetite and capital plan. This process incorporates the Group’s risk management processes and governance framework. A range of stress tests are applied to our base capital plan. These, coupled with our economic capital framework and other risk management practices, are used to assess our internal capital adequacy requirements.
The ICAAP is examined by the FSA as part of its Supervisory Review and Evaluation Process, which occurs periodically to enable the regulator to define the individual capital guidance or minimum capital requirements for HSBC and capital planning buffer where required.
Pillar 3 disclosure requirements
Pillar 3 of Basel II is related to market discipline and aims to make firms more transparent by requiring them to publish specific, prescribed details of their risks, capital and risk management under the Basel II framework at least annually. OurPillar 3 Disclosures 2012 report is published on the HSBC website, www.hsbc.com.
RWA movement by key driver - basis of preparation and supporting notes
(Unaudited)
Credit risk and counterparty credit risk drivers – definitions and quantification
The causal analysis of RWA movements splits the total movement in IRB RWAs into six drivers, described below. The first four relate to specific, identifiable and measurable changes. The remaining two, book size and book quality, are derived after accounting for movements in the first four specific drivers.
1. Foreign exchange movements
This is the movement in RWAs as a result of changes in the exchange rate between the functional currency of the HSBC company owning each portfolio and US dollars, being our presentation currency for consolidated reporting. Our structural foreign exchange exposures are managed with the primary objective of ensuring, where practical, that our consolidated capital ratios and the capital ratios of individual banking subsidiaries are largely protected from the effect of changes in exchange rates.
2. Acquisitions and disposals
This is the movement in RWAs as a result of the disposal or acquisition of business operations. This can be whole businesses or parts of a business. The movement in RWAs is quantified based on the credit risk exposures as at the end of the month preceding a disposal or following an acquisition.
3. Model updates
New/updated models
RWA movements arising from the implementation of new models and from changes to existing parameter models are allocated to this driver. This figure will also include changes which arise following review of modelling assumptions. Where a model recalibration reflects an update to more recent performance data, the resulting RWA changes are not assigned here, but instead reported under book quality.
RWA changes are estimated based on the impact assessments made in the testing phase prior to implementation. These values are used to simulate the impact of new or updated models on the portfolio at the point of
296
Table of Contents
HSBC HOLDINGS PLC
Report of the Directors: Operating and Financial Review(continued)
implementation, assuming there were no major changes in the portfolio from the testing phase to implementation phase.
Portfolios moving onto IRB approach
Where a portfolio moves from the standardised approach to the IRB approach, the RWA movement by key driver statement shows the increase in IRB RWAs, but does not show the corresponding reduction in standardised approach RWAs as its scope is limited to IRB only.
The movement in RWAs is quantified at the date at which the IRB approach is applied, and not during the testing phase as with a new/updated model.
4. Methodology and policy
Internal updates
This captures the RWA impact resulting from changing the internal treatment of exposures. This may include, but is not limited to, identification of netting and credit risk mitigation.
External updates
This specifies the impact resulting from additional or changing regulatory requirements. This includes, but is not limited to, regulatory-prescribed changes to the RWA calculation. The movement in RWAs is quantified by comparing the RWAs calculated for that portfolio under the old and the new requirements.
5. Book size
RWA movements attributed to this driver are those we would expect to experience for the given movement in exposure, as measured by EAD, assuming a stable risk profile. These RWA movements arise in the normal course of business, such as growth in credit exposures or reduction in book size from run-offs and write-offs.
The RWA movement is quantified as follows:
| • | RWA and EAD changes captured in the four drivers above are excluded from the total movements to create an adjusted movement in EAD and RWA for the period. |
| • | The average RWA to EAD percentage is calculated for the opening position and is applied to the adjusted movement in EAD. This results in an estimated book size RWA movement based on the assumption that the EAD to RWA percentage is constant throughout the period. |
As the calculation relies on averaging, the output is dependent upon the degree of portfolio aggregation and the number of discrete time periods for which the calculation is undertaken. For each quarter of 2012 this calculation was performed for each HSBC company with an IRB portfolio, split by the main Basel categories of credit exposures, as described in the table below:
| Basel categories of IRB credit exposures within HSBC | ||||
Central governments and central banks | Corporate foundation IRB | Qualifying revolving retail exposures | ||
Institutions | Other advanced IRB | Retail SME | ||
Corporate advanced IRB | Retail mortgages | Other retail | ||
The total of the results is shown in book size within the RWA movement by key driver table.
6. Book quality
This represents RWA movements resulting from changes in the underlying credit quality of customers. These are caused by changes to IRB risk parameters which arise from actions such as, but not limited to, model recalibration, change in counterparty external rating, or the influence of new lending on the average quality of the book. The change in RWAs attributable to book quality is calculated as the balance of RWA movements after taking account of all drivers described above.
The RWA movement by key driver statement includes only movements which are calculated under the IRB approach. Certain classes of credit risk exposure are treated as capital deductions and therefore reductions are not shown in this statement. If the treatment of a credit risk exposure changes from RWA to capital deduction in the period, then only the reduction in RWAs would appear in the RWA movement by key driver tables. In this instance, a reduction in RWAs does not necessarily indicate an improvement in the capital position.
297
Table of Contents
HSBC HOLDINGS PLC
Report of the Directors: Operating and Financial Review(continued)
Market risk drivers – definitions and quantification
The RWA movement by key driver for market risk combines the credit risk drivers 5 and 6 into a single driver called ‘Movements in risk levels’. The market risk RWA driver called ‘Foreign exchange movements and other’ includes foreign exchange movements and additional items which can not be reasonably assigned to any of the other drivers.
Basis of preparation of the estimated effect of the CRD IV end point applied to the 31 December 2012 position.
(Unaudited)
The table on page 289 presents a reconciliation of our reported core tier 1 and RWA position at 31 December 2012 to the pro-forma estimated CET1 and estimated RWAs based on the Group’s interpretation of the draft July 2011 CRD IV legislation and/or guidance provided by the FSA and, in lieu of guidance, our current expectation of how these draft 2011 rules will be updated by subsequent EU deliberations.
CRD IV has not yet become law and its provisions are subject to on-going negotiation and amendment. In addition, formal Implementing Technical Standards (‘ITS’) due for issue by the EBA are still to be drafted and finalised, leaving the CRD IV rules subject to significant interpretation. Despite the uncertainty around a number of areas in the rules, our disclosures are based on the draft July 2011 CRD IV text. Pending finalisation of CRD IV, we have not definitively upgraded the models and systems used to calculate capital numbers in a CRD IV environment which, as a consequence, are subject to change. Consequently, the final CRD IV impact on the Group’s CET1 and RWAs may be different from our current estimates.
The detailed basis of preparation is described below for items that are different from our current treatment under Basel II. For individual immaterial holdings in banks, financial institutions and insurance that are, in aggregate, above 10% of the Group’s CET1 capital, we have included specific short term management actions that could be taken to negate the capital deduction. For other CRD IV proposals, additional management actions could also be taken dependent upon the finalised rules and timing of implementation but, as such, have not been included.
Regulatory adjustments applied to core tier 1 in respect of amounts subject to CRD IV treatment
Investments in own shares through the holding of composite products of which HSBC is a component (exchange traded funds, derivatives, and index stock):the value of our holdings of own CET1 instruments, where it is not already deducted under IFRSs, is deducted from CET1. Under CRD IV, deduction comprises not only direct but also indirect, actual and contingent, banking and trading book gross long positions. Trading book positions are calculated net of short positions only where there is no counterparty credit risk on these short positions (this restriction does not apply to index positions). We have not recognised the benefit of non-index short positions, even where they are executed with central counterparties or are fully collateralised. Under current rules, there is no regulatory adjustment made on the amounts already deducted under IFRS rules.
Surplus non-controlling interest disallowed in CET1:non-controlling interests arising from the issue of common shares by our banking subsidiaries receive limited recognition. The excess over a minimum of 7% of the CET1 of the relevant subsidiary is not allowable in the Group’s CET1 to the extent it is attributable to minority shareholders. Under current rules, there is no regulatory restriction applied to these items.
Unrealised gains/(losses) on available-for-sale debt securities:under CRD IV, there is no adjustment to remove from CET1 capital unrealised gains and losses on available-for-sale debt securities. Under current FSA rules, these are removed from capital (net of tax).
Unrealised gains on available-for-sale equities and reserves arising from revaluation of property:there is no adjustment for unrealised gains and losses on reserves arising from the revaluation of property and on available-for-sale equities. Under current FSA rules, unrealised net gains on these items are included in tier 2 capital (net of deferred tax) and net losses are deducted from tier 1 capital.
Defined benefit pension fund liabilities:the amount of retirement benefit liabilities as reported on the balance sheet is fully recognised in CET1 rather than being replaced by any committed funding plans as current FSA rules permit.
Excess of expected losses over impairment allowances deducted 100% from CET1:the amount of excess expected loss over impairment allowance is deducted 100% from CET1. Under current FSA rules, this amount is deducted 50% from CT1 and 50% from total capital.
298
Table of Contents
HSBC HOLDINGS PLC
Report of the Directors: Operating and Financial Review(continued)
Removal of 50% of tax credit adjustment for expected losses:the amount of expected losses in excess of impairment allowances that is deducted from CET1 capital is not reduced for any related tax effects. Under current FSA rules, any related tax credit offset is recognised 50% in CT1 and 50% in tier 1 capital.
Securitisation positions risk-weighted under CRD IV:securitisation positions that were deducted from core tier 1 under current rules have been included in RWAs at 1,250%.
Deferred tax liabilities on intangibles:the amount of intangible assets deducted from CET1 has been reduced by the related deferred tax liability. Under current rules, the goodwill and intangibles are deducted at their accounting value.
Deferred tax assets that rely on future profitability (excluding those arising from temporary differences):the deferred tax assets that rely on future profitability and do not arise from temporary differences are deducted 100% from CET1. The deferred tax assets that rely on future profitability and arise from temporary differences are subject to the separate threshold deduction approach detailed separately. Under current rules, these items receive a risk weighting of 100%.
Additional valuation adjustment (referred to as prudent valuation adjustment or ‘PVA’):under current FSA rules, banks are required to comply with requirements for prudent and reliable valuation of any balance sheet position measured at market or fair value. Under CRD IV, all assets and derivatives measured at fair value are subject to specified standards for prudent valuation, covering uncertainty around the input factors into the fair value valuation models – namely, uncertainty around the mark to market of positions, model risk, valuation of less liquid positions and credit valuation adjustments (‘CVA’).
Where the accounting fair value calculated under IFRS is higher than the valuation amount resulting from the application of the prudential adjustments, this would result in an additional valuation adjustment or PVA deduction from common equity tier 1 capital.
Following FSA direction, we have included an estimate of the impact of PVA, although there is guidance outstanding following a recent consultation on a related EBA draft regulatory technical standard issued on 13 November 2012. Further clarity on the requirements following finalisation of the EBA process and discussions with our regulator could potentially change this figure.
Debit valuation adjustment (‘DVA’):the amount of gains and losses on OTC derivative liabilities that results from changes to our own credit spread are derecognised from CET1.
Individually immaterial holdings in CET1 capital of banks, financial institutions and insurance in aggregate above 10% of HSBC CET1:under CRD IV, the investments in CET1 instruments of banks, financial institutions and insurance entities, where we have a holding of not more than 10% of the CET1 instruments issued by those entities, are deducted from CET1, to the extent the aggregate amount of such holdings exceeds 10% of our CET1 (calculated before any threshold deductions).
The estimated deduction follows the draft July 2011 CRD IV rules and guidance provided by the FSA, which impose a restriction on the netting of long and short positions held in the trading book, whereby the maturity of the short positions has to match the maturity of the long position, or have a residual maturity of no less than a year.
While rules are in draft and this aspect is still being debated, we have disclosed the impact of the rules as written. However, a range of management actions from adjustment to the hedging strategy, curtailment or closure of the business could be applied to mitigate the capital deduction.
Deductions under threshold approach:under CRD IV, where we have a holding of more than 10% of the CET1 instruments issued by banks, financial institutions and insurance entities which is not part of our regulatory consolidation, that holding is subject to a threshold deduction approach. Under current rules, these exposures are deducted 50% from tier 1 capital and 50% from total capital, except for certain insurance holdings that met the requirements under the transitional provision of the current rules and until 31 December 2012 were allowed to be deducted 100% from total capital.
Deferred tax assets that rely on the future profitability of the bank to be realised and which arise from temporary differences are also subject to this threshold deduction approach. Under current rules, these assets would be subject to 100% risk weighting.
299
Table of Contents
HSBC HOLDINGS PLC
Report of the Directors: Operating and Financial Review(continued)
Under CRD IV, the amount of such deferred tax assets and significant investments which individually and in aggregate exceed 10% and 15%, respectively, of our CET1 are fully deducted from CET1 capital. Amounts falling below the 10% and 15% thresholds are risk weighted at 250%.
Changes to capital requirements introduced by CRD IV
Credit valuation adjustment:introduced as a new requirement under CRD IV rules, this is a capital charge to cover the risk of mark-to-market losses on expected counterparty risk and referred to as a regulatory CVA risk capital charge.
We have estimated our regulatory CVA risk capital charge based on the draft July 2011 CRD IV text, calculated on a full range of OTC derivative counterparties without exemptions that may be available under the final CRD IV text. Where we have both specific risk VAR approval and internal model method approval for a product, the CVA VAR approach has been used to calculate the CVA capital charge. Where we do not hold both approvals, the standardised approach has been applied.
Counterparty credit risk (other than credit valuation adjustment):the additional requirements introduced by CRD IV and included in the CCR charge include: the increase in the asset value correlation multiplier for financial counterparties, additional requirements for collateralised counterparties, margin period of risk and new requirements for exposures to central clearing counterparties (‘CCPs’).
In estimating the amount included for CCPs, we have assumed that all our CCPs are ‘qualifying’ under the requirements of CRD IV, although this will ultimately depend on confirmation from the competent regulatory authority of the CCP in question that the CCP complies with all the recommendations for CCPs published by the Committee on payment and settlement systems and by the technical committee of the International Organisation of Securities Commissions. Where we do not have full data disclosed for a given CCP, we have assumed full deduction of default fund exposures.
Amounts in aggregate below 15% threshold and therefore subject to 250% risk weight:as explained above, items that fall under the threshold approach treatment under CRD IV, and which are below the 10% and 15% thresholds, are risk-weighted at 250%.
Securitisation positions and free deliveries risk-weighted under CRD IV: securitisation positions which were deducted 50% from core tier 1 and 50% from total capital, and free deliveries that were deducted from total capital under current rules, are now included in RWAs at 1,250%.
Investment in commercial entities now risk-weighted:under CRDIV investments in commercial entities that are not qualifying holdings are risk weighted. These were deducted under the current rules.
Deferred tax assets moved to threshold approach or deduction under CRD IV: deferred tax assets, which were risk-weighted at 100% under the standardised approach under current rules, are treated as a capital deduction from CET1 to the extent they rely on the future profitability of the bank to be realised. Those that do not rely on future profitability shall continue to be risk weighted.
300
Table of Contents
HSBC HOLDINGS PLC
Report of the Directors: Corporate Governance
| Page | App1 | |||||||
| 301 | ||||||||
| 301 | ||||||||
| 302 | ||||||||
| 307 | ||||||||
| 307 | ||||||||
| 308 | ||||||||
| 309 | ||||||||
| 309 | ||||||||
| 316 | ||||||||
| 318 | ||||||||
| 318 | ||||||||
| 319 | ||||||||
| 323 | ||||||||
| 328 | ||||||||
| 329 | ||||||||
| 329 | ||||||||
| 330 | ||||||||
| 332 | ||||||||
| 334 | ||||||||
| 335 | ||||||||
| 335 | ||||||||
| 335 | ||||||||
| 335 | ||||||||
| 335 | ||||||||
| 335 | ||||||||
| 336 | ||||||||
| 336 | ||||||||
| 336 | ||||||||
| 336 | ||||||||
| 339 | ||||||||
| 340 | ||||||||
| 343 | ||||||||
| 344 | ||||||||
| 344 | ||||||||
| 339 | ||||||||
| 1 Appendix to Report of the Directors. | ||||||||
The statement of corporate governance practices set out on pages 301 to 370 and information incorporated by reference constitutes the Corporate Governance Report of HSBC Holdings. The reports of Board Committees are contained within the Corporate Governance Report.
Letter from the Group Chairman
Dear Shareholder
At HSBC, we are committed to the highest standards of corporate governance. This is more important than ever in light of developments and changes in regulatory policy for financial services, society’s view of the role of banks and the need to maintain investor confidence. We believe that a strong and transparent corporate governance framework is directly linked to the long-term success of the Group.
A values-led culture, high behavioural standards and robust procedures are fundamental to a strong corporate governance framework. As we reported to you last year, a renewed emphasis has been placed on values at HSBC, ensuring our employees are empowered to do the right thing and act with courageous integrity. The role played by HSBC Values in daily operating practice is fundamental to our culture and HSBC Values continue to be embedded in how we conduct our business.
In my statement to shareholders on pages 4 to 7 of the Annual Report and Accounts 2012, I outline the significant challenges faced by the Group, both during the year and in the future, and the way we endeavour to address these challenges. We now have the structure to help us reduce complexity and to run the Group more effectively on a global basis. We are formulating and implementing global standards to ensure that our conduct matches our values.
In this Corporate Governance Report, we outline the way in which the Group’s corporate governance framework operates, including the role and responsibilities of the Board and each of its Committees. We continue to review and develop this framework in light of changes in the Group’s businesses and the external environment, taking into account the views of external parties where appropriate. As in previous years, we have benefited from input from a third-party facilitator whose report was used by the Board in its annual review of its own effectiveness.
Ensuring there is an appropriate balance of skills, knowledge and experience on the Board is an important aspect of corporate governance. The expertise and experience of our Board was augmented in 2012 with the appointments of Joachim Faber, former Chief Executive Officer of Allianz Global Investors AG, and John Lipsky, former First Deputy Managing Director of the International Monetary Fund. It was augmented further in 2013 with the appointments of Renato Fassbind, former Chief Financial Officer of Credit
301
Table of Contents
HSBC HOLDINGS PLC
Report of the Directors: Corporate Governance(continued)
Suisse Group SA, and Jim Comey, former United States Deputy Attorney General.
We have also taken steps to strengthen non-executive oversight of matters relating to anti-money laundering, sanctions, terrorist financing and proliferations financing. A new Board committee, the Financial System Vulnerabilities Committee (‘FSVC’), will provide governance, oversight and policy guidance over the framework of controls and procedures designed to identify areas where HSBC may become exposed, and through that exposure, expose the financial system more broadly to financial crime or system abuse. The FSVC will use the knowledge and experience of its members to place the Group in a position of leadership in this area and will provide the Board with a forward-looking perspective on financial crime risk.
The executive committee structure has been enhanced during the year with the establishment of a regular separate meeting of the Group Management Board to focus on developing and implementing global standards reflecting best practices which must be adopted and adhered to consistently throughout the Group.
During the year, the Board adopted a Board diversity policy, which is consistent with the Group’s strategic focus on ethnicity, age and gender diversity for the employee base. At the 2011 Annual General Meeting, I stated the Board’s intention to exceed the aspirational target set by Lord Davies in his reportWomen on Boards of 25% female representation on the boards of FTSE 100 companies by 2015. Our policy re-states this intention.
We recognise that our strategy to be the world’s leading international bank relies on a foundation of good corporate governance and we endeavour to be at the forefront of this field in the coming years.
D J Flint,Group Chairman
4 March 2013
D J Flint, CBE, 57
Group Chairman
Skills and experience: extensive governance experience gained through membership of the Boards of HSBC and BP p.l.c.; considerable knowledge of finance and risk management in banking, multinational financial reporting, treasury and securities trading operations; honoured with a CBE in recognition of his services to the finance industry; member of the Institute of Chartered Accountants of Scotland and the Association of Corporate Treasurers. Fellow of The Chartered Institute of Management Accountants. Joined HSBC in 1995.
Appointed to the Board: 1995
Current appointments include: director of The Hong Kong Association; and Chairman of the Institute of International Finance since 6 June 2012. A member of the Mayor of Beijing’s International Business Leaders’ Advisory Council as well as the Mayor of Shanghai’s International Business Leaders’ Advisory Council; and a member of the International Advisory Board of the China Europe International Business School, Shanghai.
Former appointments include: Group Finance Director and Chief Financial Officer; and Executive Director, Risk and Regulation. Co-Chairman of the Counterparty Risk Management Policy Group III; Chairman of the Financial Reporting Council’s review of the Turnbull Guidance on Internal Control; member of the Accounting Standards Board and the Standards Advisory Council of the International Accounting Standards Board; served on the Large Business Forum on Tax and Competitiveness and the Consultative Committee of the Large Business Advisory Board of HM Revenue and Customs; partner in KPMG; and non-executive director and Chairman of the Audit Committee of BP p.l.c.
S T Gulliver, 53
Group Chief Executive
Skills and experience: a career banker with over 30 years’ international experience with HSBC; has held a number of key roles in the Group’s operations worldwide, including in London, Hong Kong, Tokyo, Kuala Lumpur and the United Arab Emirates; played a leading role in developing and expanding Global Banking and Markets, the wholesale banking
302
Table of Contents
HSBC HOLDINGS PLC
Report of the Directors: Corporate Governance(continued)
division of the Group with operations in over 65 countries and territories. Joined HSBC in 1980.
Appointed to the Board: 2008
Current appointments include: Chairman of The Hongkong and Shanghai Banking Corporation Limited; and Chairman of the Group Management Board. A member of the Monetary Authority of Singapore International Advisory Panel since 1 June 2012 and a member of the International Advisory Council of the China Banking Regulatory Commission since 10 July 2012.
Former appointments include:Chairman, Europe, Middle East and Global Businesses and Chairman of HSBC Bank plc, HSBC Bank Middle East Limited and HSBC Private Banking Holdings (Suisse) SA. Head of Global Banking and Markets; Co-Head of Global Banking and Markets; Head of Global Markets; Head of Treasury and Capital Markets in Asia-Pacific; Deputy Chairman of HSBC Trinkaus & Burkhardt AG and a member of its Supervisory Board. Ceased to be Chairman of HSBC France on 22 November 2012.
S A Catz†, 51
Skills and experience: a background in international business leadership, having helped transform Oracle into the largest producer of business management software and the world’s leading supplier of software for information management.
Appointed to the Board: 2008
Current appointments include: President and Chief Financial Officer of Oracle Corporation. Joined Oracle in 1999 and appointed to the board of directors in 2001.
Former appointments include:Managing Director of Donaldson, Lufkin & Jenrette.
L M L Cha†, GBS, 63
Member of the Corporate Sustainability Committee and, since 1 January 2013, Chairman.
Skills and experience: extensive regulatory and policy making experience in the finance and securities sector in Hong Kong and mainland China; formerly Vice Chairman of the China Securities Regulatory Commission, being the first person outside mainland China to join the Central Government of the People’s Republic of China at vice-ministerial rank; awarded Gold and Silver Bauhinia Stars by the Hong Kong Government for public service; formerly Deputy Chairman of the Securities and Futures Commission
in Hong Kong; and has worked in the US and Asia.
Appointed to the Board: 2011
Current appointments include:non-executive Deputy Chairman of The Hongkong and Shanghai Banking Corporation Limited; non-official member of the Executive Council of Hong Kong SAR; a Hong Kong Deputy to the 12th National People’s Congress of China; non-executive director of China Telecom Corporation Limited; member of the Advisory Board of the Yale School of Management; Senior International Advisor for Foundation Asset Management Sweden AB; member of the State Bar of California; and Chairman of the Financial Services Development Council of Hong Kong SAR since 17 January 2013. Appointed a non-executive director of Unilever PLC with effect from 14 May 2013.
Former appointments include:non-executive director of Bank of Communications Co., Ltd., Baoshan Iron and Steel Co. Limited; Johnson Electric Holdings Limited; and Chairman of the University Grants Committee in Hong Kong. Ceased to be a director of Hong Kong Exchanges and Clearing Limited on 24 April 2012; Tata Consultancy Services Limited on 29 June 2012; Chairman of the ICAC Advisory Committee on Corruption on 31 December 2012; and Chairman of the Task Force on the Financial Services Development Council of Hong Kong SAR on 17 January 2013.
M K T Cheung†, GBS, OBE, 65
Member of the Group Audit Committee.
Skills and experience:a background in international business and financial accounting, particularly in Greater China and the wider Asian economy; retired from KPMG Hong Kong in 2003 after more than 30 years; awarded the Gold Bauhinia Star by the Hong Kong Government. Fellow of the Institute of Chartered Accountants in England and Wales.
Appointed to the Board: 2009
Current appointments include:non-executive director of Hang Seng Bank Limited and HKR International Limited; non-executive Chairman of the Airport Authority Hong Kong and the Council of the Hong Kong University of Science and Technology; director of The Association of Former Council Members of The Stock Exchange of Hong Kong Limited and The Hong Kong International Film Festival Society Ltd; and a member of the Working Group on Transportation under the
303
Table of Contents
HSBC HOLDINGS PLC
Report of the Directors: Corporate Governance(continued)
Economic Development Commission of the Hong Kong SAR Government since 17 January 2013.
Former appointments include: non-executive director of Sun Hung Kai Properties Limited and Hong Kong Exchanges and Clearing Limited; Chairman and Chief Executive Officer of KPMG Hong Kong; and council member of the Open University of Hong Kong. Ceased to be a non-official member of the Executive Council of the Hong Kong SAR on 1 July 2012.
J B Comey†, 52
Member of the Financial System Vulnerabilities Committee on 4 March 2013.
Skills and experience:extensive experience in both the public and private sectors in the US federal and state justice systems and as General Counsel to leading international businesses. Former US Deputy Attorney General responsible for supervising operations of the US Department of Justice. As US Attorney for the Southern District of New York, oversaw the prosecution of corporate executives on fraud and securities-related charges and international drug cartels.
Appointed to the Board:4 March 2013
Current appointments include:Columbia University Law School, Senior Research Scholar and Hertog Fellow on National Security Law.
Former appointments include: General Counsel of Bridgewater Associates, LP; Senior Vice President and General Counsel of Lockheed Martin Corporation; US Deputy Attorney General; US Attorney for the Southern District of New York; and Assistant US Attorney for the Eastern District of Virginia.
J D Coombe†, 67
Chairman of the Group Audit Committee and member of the Group Risk Committee and Group Remuneration Committee.
Skills and experience: a background in international business, financial accounting and the pharmaceutical industry. Formerly Chief Financial Officer of GlaxoSmithKline plc with responsibility for the group’s financial operations globally. Fellow of the Institute of Chartered Accountants in England and Wales.
Appointed to the Board: 2005
Current appointments include:non-executive Chairman of Hogg Robinson Group plc and non-executive Chairman of Home Retail Group plc since 4 July 2012.
Former appointments include: executive director and Chief Financial Officer of GlaxoSmithKline plc; non-executive director of GUS plc; member of the Supervisory Board of Siemens AG; Chairman of The Hundred Group of Finance Directors; and member of the Accounting Standards Board. Ceased to be a council member of The Royal Academy of Arts on 18 September 2012.
J Faber†, 62
Member of the Group Risk Committee since 1 March 2012.
Skills and experience:a background in banking and asset management with significant international experience, having worked in Germany, Tokyo, New York and London. Former Chief Executive Officer of Allianz Global Investors AG and member of the management board of Allianz SE; 14 years’ experience with Citigroup Inc. holding positions in Trading and Project Finance and as Head of Capital Markets for Europe, North America and Japan. Has a doctorate from the University of Administrative Sciences in Speyer.
Appointed to the Board:1 March 2012
Current appointments include:Chairman of the supervisory board of Deutsche Börse AG; Chairman of the Shareholder Committee of Joh A. Benckiser SARL from 1 January 2012; independent director of Coty Inc.; director of Allianz France S.A., Allianz Investment Management GmbH and Allianz Climate Solutions GmbH; and member of the advisory boards of the Siemens Group Pension Board, the European School for Management and Technology and the German Council for Sustainable Development.
Former appointments include: Chairman of Allianz Global Investors Kapitalanlagegesellschaft and Allianz Global Investors Deutschland GmbH; Chairman of the board of Allianz Global Investors SGR; and member of the board of Allianz SpA and of the supervisory board of Bayerische Boerse AG.
304
Table of Contents
HSBC HOLDINGS PLC
Report of the Directors: Corporate Governance(continued)
R A Fairhead†, CBE, 51
Chairman of the Group Risk Committee and the Financial System Vulnerabilities Committee, and member of the Group Audit Committee and Nomination Committee.
Skills and experience:a background in international industry, publishing, finance and general management. Formerly Finance Director of Pearson plc with responsibility for overseeing the day-to-day running of the finance function and directly responsible for global financial reporting and control, tax and treasury. Has a Master’s in Business Administration from the Harvard Business School.
Appointed to the Board: 2004
Current appointments include: Chairman and director of Financial Times Group Limited; director of Pearson plc and non-executive director of The Economist Newspaper Limited. Will retire from these appointments on 27 April 2013. Non-executive member of the board of the UK Government’s Cabinet Office.
Former appointments include: Executive Vice President, Strategy and Group Control of Imperial Chemical Industries plc; Finance Director of Pearson plc; and Chairman and director of Interactive Data Corporation.
R Fassbind†, 57
Member of the Group Audit Committee and the Group Remuneration Committee since 1 March 2013.
Skills and experience:a background in financial accounting and international business. Formerly Chief Financial Officer of Credit Suisse Group SA and ABB Group. Has a Master’s in Business Administration and a PhD in Economics from the University of Zurich.
Appointed to the Board:1 January 2013
Current appointments include:Vice Chairman of the Supervisory Board and member of the audit and compensation committees of Swiss Reinsurance Company; member of the supervisory board and audit committee of Kühne + Nagel International AG; independent director of Oanda Corporation; and member of the supervisory board of the Swiss Federal Audit Oversight Authority.
Former appointments include: Chief Financial Officer of Credit Suisse Group AG; Senior Advisor to the Chief Executive, Credit Suisse Group AG;
Chief Executive Officer of Diethelm Keller Group; Chief Financial Officer of ABB Group; Chairman of ABB (Switzerland) AG and DKSH AG; and a member of the supervisory board of Winterthur Insurance Company.
J W J Hughes-Hallett†, CMG , SBS, 63
Member of the Nomination Committee and until 31 July 2012, the Group Risk Committee. Member of the Corporate Sustainability Committee since 1 January 2013.
Skills and experience: a background in financial accounting and experience of management of a broad range of international businesses, including aviation, insurance, property, shipping, manufacturing and trading in the Far East, UK, US and Australia. Awarded the Silver Bauhinia Star by the Hong Kong Government. Fellow of the Institute of Chartered Accountants in England and Wales.
Appointed to the Board: 2005
Current appointments include: Chairman of John Swire & Sons Limited; non-executive director of Cathay Pacific Airways Limited and Swire Pacific Limited; a trustee of the Esmée Fairbairn Foundation; member of The Hong Kong Association; and Chairman of the Governing Board of the Courtauld Institute of Art.
Former appointments include: non-executive director of The Hongkong and Shanghai Banking Corporation Limited and a trustee of the Dulwich Picture Gallery until 31 December 2012.
W S H Laidlaw†, 57
Member of the Group Remuneration Committee.
Skills and experience: significant international experience, particularly in the energy sector, having had responsibility for businesses in four continents. Qualified Solicitor and Master’s in Business Administration from INSEAD.
Appointed to the Board: 2008
Current appointments include: Chief Executive Officer of Centrica plc; and Lead Non-executive Board Member of the UK Department for Transport.
Former appointments include: Executive Vice President of Chevron Corporation; non-executive director of Hanson PLC; Chief Executive Officer of Enterprise Oil plc; and President and Chief Operating Officer of Amerada Hess Corporation. Ceased to be a member of the UK Prime Minister’s Business Advisory Group on 31 December 2012.
305
Table of Contents
HSBC HOLDINGS PLC
Report of the Directors: Corporate Governance(continued)
J P Lipsky†, 66
Member of the Group Risk Committee since 1 March 2012 and Nomination Committee since 24 May 2012.
Skills and experience: international experience having worked in Chile, New York, Washington and London and interacted with financial institutions, central banks and governments in many countries. Served at the International Monetary Fund as First Deputy Managing Director, Acting Managing Director and as Special Advisor. Has a PhD from Stanford University.
Appointed to the Board:1 March 2012
Current appointments include:Distinguished Visiting Scholar, International Economics Program at the Paul H. Nitze School of Advanced International Studies, Johns Hopkins University. Co-chairman of the Aspen Institute Program on the World Economy; director of the National Bureau of Economic Research; and member of the advisory board of the Stanford Institute for Economic Policy Research and the Council on Foreign Relations. A director of the Center for Global Development since 1 May 2012; and Global Policy Advisor for Anderson Global Macro, LLC since 4 February 2013.
Former appointments include: Vice Chairman J P Morgan Investment Bank; director of the American Council on Germany and the Japan Society; and a trustee of the Economic Club of New York.
J R Lomax†, 67
Member of the Group Audit Committee and Group Risk Committee.
Skills and experience:experience in both the public and private sectors and a deep knowledge of the operation of the UK government and financial system.
Appointed to the Board: 2008
Current appointments include:Chairman of the International Regulatory Strategy Group and a director of TheCityUK since 1 January 2013; non-executive director of The Scottish American Investment Company PLC, Reinsurance Group of America Inc., Arcus European Infrastructure Fund GP LLP and Heathrow Airport Holdings Limited (formerly BAA Limited); member of the Council of Imperial College, London; and President of the Institute of Fiscal Studies.
Former appointments include: Deputy Governor, Monetary Stability, at the Bank of England and member of the Monetary Policy Committee; Permanent Secretary at the UK Government Departments for Transport and Work and Pensions and the Welsh Office; and Vice President and Chief of Staff to the President of the World Bank.
I J Mackay, 51
Group Finance Director
Skills and experience: extensive financial and international experience, having worked in London, Paris, US and Asia. Member of the Institute of Chartered Accountants of Scotland. Joined HSBC in 2007.
Appointed to the Board: 2010
Current appointments include: member of the Group Management Board.
Former appointments include: director of Hang Seng Bank Limited; Chief Financial Officer, Asia-Pacific; and Chief Financial Officer, HSBC North America Holdings Inc; Vice President and Chief Financial Officer of GE Consumer Finance and Vice President and Chief Financial Officer of GE Healthcare – Global Diagnostic Imaging.
Sir Simon Robertson†, 72
Deputy Chairman and senior independent non-executive Director
Chairman of the Nomination Committee and member of the Financial System Vulnerabilities Committee.
Skills and experience:a background in international corporate advisory with a wealth of experience in mergers and acquisitions, merchant banking, investment banking and financial markets; honoured with a knighthood in recognition of his services to business; extensive international experience having worked in France, Germany, the UK and the US.
Appointed to the Board: 2006
Current appointments include: non-executive Chairman of Rolls-Royce Holdings plc until 2 May 2013. The founding member of Robertson Robey Associates LLP, formerly Simon Robertson Associates LLP; non-executive director of Berry Bros. & Rudd Limited, The Economist Newspaper Limited; and, since 8 May 2012, Troy Asset Management; partner of NewShore Partners LLP; and trustee of the Eden Project Trust and the Royal Opera House Endowment Fund.
306
Table of Contents
HSBC HOLDINGS PLC
Report of the Directors: Corporate Governance(continued)
Former appointments include:Managing Director of Goldman Sachs International and Chairman of Dresdner Kleinwort Benson. Ceased to be a non-executive director of Royal Opera House, Covent Garden Limited on 31 July 2012.
J L Thornton†, 59
Chairman of the Group Remuneration Committee.
Skills and experience:experience that bridges developed and developing economies and the public and private sectors. A deep knowledge of financial services and education systems, particularly in Asia. During his 23-year career with Goldman Sachs, he played a key role in the firm’s global development and was Chairman of Goldman Sachs Asia.
Appointed to the Board: 2008
Current appointments include: non-executive Chairman and director of HSBC North America Holdings Inc.; Director and Co-Chairman of Barrick Gold Corporation since 15 February 2012 and 5 June 2012 respectively; professor and director of the Global Leadership Program at the Tsinghua University School of Economics and Management; Chairman of the Brookings Institution Board of Trustees; non-executive director of Ford Motor Company and China Unicom (Hong Kong) Limited; director of National Committee on United States-China Relations; trustee of China Institute and the China Foreign Affairs University; and member of the Council on Foreign Relations and the China Securities Regulatory Commission International Advisory Committee.
Former appointments include: non-executive director of Industrial and Commercial Bank of China Limited and Intel Corporation, Inc.; trustee of Asia Society; and President of the Goldman Sachs Group, Inc. Ceased to be a non-executive director of News Corporation, Inc. on 30 November 2012.
†Independent non-executive Director.
R G Barber, 62
Group Company Secretary and Head of Corporate Governance
Joined HSBC in 1980. Group Company Secretary since 1986 and Company Secretary of HSBC Holdings plc since 1990. Appointed a Group General Manager in 2006. Chairman of the Disclosure Committee. A member of the Listing Authority Advisory Committee of the Financial Services Authority and of the Primary Markets Group of the London Stock Exchange. Fellow of the Institute of Chartered Secretaries and Administrators. Former HSBC appointments include: Corporation Secretary of The Hongkong and Shanghai Banking Corporation Limited and Company Secretary of HSBC Bank plc.
D J Shaw, 66
Adviser to the Board since 1998. Director of HSBC Bank Bermuda Limited. Ceased to be a director of HSBC Private Banking Holdings (Suisse) SA and HSBC Private Bank (Suisse) SA on 19 September 2012. An independent non-executive director of Kowloon Development Company Limited and Shui On Land Limited. A solicitor and formerly a partner in Norton Rose.
307
Table of Contents
HSBC HOLDINGS PLC
Report of the Directors: Corporate Governance(continued)
A Almeida, 56
Group Head of Human Resources and Corporate Sustainability
Joined HSBC in 1992. A Group Managing Director since 2008. Former HSBC appointments include: Global Head of Human Resources for Global Banking and Markets, Global Private Banking, Global Transaction Banking and HSBC Amanah.
S Assaf, 52
Chief Executive, Global Banking and Markets
Joined HSBC in 1994. A Group Managing Director since 2011. Chairman of HSBC France since 22 November 2012. A director of HSBC Trinkaus & Burkhardt AG. Former HSBC appointments include: director of HSBC Global Asset Management Limited; Head of Global Markets; and Head of Global Markets for Europe, Middle East and Africa. Ceased to be a director of HSBC Bank Egypt S.A.E. on 7 November 2012.
I M Dorner, 58
President and Chief Executive Officer of HSBC USA
Joined HSBC in 1986. A Group Managing Director since 1 February 2013. Chairman of HSBC Bank USA, National Association and HSBC USA Inc.; President and Chief Executive Officer of HSBC North America Inc. Former HSBC appointments include: Chairman of HSBC Amanah Malaysia Berhad and HSBC Amanah Takaful (Malaysia) Sendirian Berhad; Deputy Chairman and Chief Executive Officer of HSBC Bank Malaysia Berhad; Chief Operating Officer, Treasury and Capital Markets; General Manager of Marketing, General Manager of Human Resources; and General Manager of Premier and Wealth Management, HSBC Bank plc.
J M Flint, 44
Chief Executive, Retail Banking and Wealth Management
Joined HSBC in 1989. A Group Managing Director since 1 January 2013. A director of HSBC Bank Canada since 15 February 2012. Former HSBC appointments include: Chief of Staff to the Group Chief Executive and Group Head of Strategy and Planning; Chief Executive Officer, HSBC Global
Asset Management; Group Treasurer; and Deputy Head of Global Markets.
M P Kaur, 49
Group Head of Internal Audit
Will join HSBC and become a Group Managing Director on 1 April 2013. Former appointments include: Global Head of Group Audit for Deutsche Bank AG; Chief Financial Officer & Chief Operating Officer, Restructuring & Risk Division, Royal Bank of Scotland Group plc; Group Head of Compliance and Anti-Money Laundering, Lloyds TSB; and Global Director of Compliance, Global Consumer Group, Citigroup.
A M Keir, 54
Global Head of Commercial Banking
Joined HSBC in 1981. A Group Managing Director since 2011. Former HSBC appointments include: Group General Manager, Commercial Banking, Europe and Global Co-Head, Global Commercial Banking.
S A Levey, 49
Chief Legal Officer
Joined HSBC on 13 January 2012. A Group Managing Director since 18 January 2012. Former appointments include: Under Secretary for Terrorism and Financial Intelligence in the US Department of Treasury; Senior Fellow for National Security and Financial Integrity at the Council on Foreign Relations; Principal Associate Deputy Attorney General at the US Department of Justice; and Partner at Miller, Cassidy, Larroca & Lewin LLP and Baker Botts LLP.
A M Losada, 58
Chief Executive, Latin America and the Caribbean
Joined HSBC in 1973. A Group Managing Director since 1 December 2012. Chairman of HSBC Bank (Panama) S.A. since 6 February 2012. A director of HSBC Bank Argentina S.A. since 2 May 2012 and a director of HSBC Mexico, S.A., Institucion de Banca Multiple, Grupo Financiero HSBC and Grupo Financiero HSBC, S.A. de C.V. since 20 February 2012. Former HSBC appointments include: Chief Executive Officer, HSBC Argentina; and Deputy Head, Personal Financial Services, Brazil.
308
Table of Contents
HSBC HOLDINGS PLC
Report of the Directors: Corporate Governance(continued)
M M Moses, 55
Group Chief Risk Officer
Joined HSBC in 2005. A Group Managing Director since 2010. Director of HSBC Insurance (Bermuda) Limited. A director of HSBC Private Bank (Suisse) SA and HSBC Private Banking Holdings (Suisse) SA since 19 September 2012. Former HSBC appointments include Chief Financial and Risk Officer, Global Banking and Markets.
S P O’Sullivan, 57
Group Chief Operating Officer
Joined HSBC in 1980. A Group Managing Director since 2011. Former HSBC appointments include: Group Chief Technology and Services Officer; director and Chief Operating Officer of HSBC Bank plc; and Chief Operating Officer of HSBC Bank Canada.
B Robertson, 58
Chief Executive, HSBC Bank plc
Joined HSBC in 1975. A Group Managing Director since 2008. Chairman of HSBC Life (UK) Limited. Director of HSBC Bank Bermuda Limited since 1 January 2012. Former HSBC appointments include: Group Chief Risk Officer; Group General Manager, Group Credit and Risk; and Head of Global Banking and Markets for North America.
P T S Wong, 61
Chief Executive, The Hongkong and Shanghai Banking Corporation Limited
Joined HSBC in 2005. A Group Managing Director since 2010. Chairman of HSBC Bank (China) Company Limited and HSBC Bank Malaysia Berhad. Non-executive director of Hang Seng Bank Limited and Bank of Communications Co., Ltd. Independent non-executive director of Cathay Pacific Airways Limited. Former HSBC appointments include: director of HSBC Bank Australia Limited. Ceased to be Vice Chairman of HSBC Bank (Vietnam) Ltd on 16 January 2012 and a director of Ping An Insurance (Group) Company of China, Ltd on 7 December 2012.
The purpose of HSBC’s management structure, headed by the Board of Directors of HSBC Holdings (the ‘Board’) and led by the Group Chairman, is to promote the long-term success of the Company and deliver sustainable value to our shareholders. The Board sets the strategy and risk appetite for the Group and approves capital and operating plans presented by management for the achievement of the strategic objectives it has set. Implementation of the strategy set by the Board is delegated to the Group Management Board (‘GMB’) which is led by the Group Chief Executive.
HSBC Holdings has a unitary Board. The authority of the Directors is exercised in Board meetings where the Board acts collectively. At the time of approval of theAnnual Report and Accounts 2012 on 4 March 2013, the Board comprised the Group Chairman, Group Chief Executive, the Group Finance Director and 13 non-executive Directors whose names and brief biographical particulars are included on pages 302 to 307. The Group Chairman, Group Chief Executive and the Group Finance Director are HSBC employees. Non-executive Directors are not HSBC employees and do not participate in the daily business management of HSBC; they bring an external perspective, constructively challenge and help develop proposals on strategy, scrutinise the performance of management in meeting agreed goals and objectives and monitor the risk profile and the reporting of performance. The non-executive Directors bring experience from a number of industries and business sectors, including the leadership of large complex multinational enterprises.
Terms of appointment
The Board has determined the time commitment expected of non-executive Directors to be 30 to 36 days per annum. Time devoted to the Company could be considerably more, particularly if serving on Board committees.
Letters setting out the terms and conditions of appointment of each of the non-executive Directors, including the time commitment expected of each of them, are available for inspection at 8 Canada Square, London E14 5HQ and will be made available for 15 minutes before the Annual General Meeting and during the Meeting itself.
309
Table of Contents
HSBC HOLDINGS PLC
Report of the Directors: Corporate Governance(continued)
Powers of the Board
The Board is responsible for managing the business of HSBC Holdings and, in doing so, may exercise its powers, subject to any relevant laws and regulations and to the Articles of Association. In particular, the Board may exercise all the powers of the Company to borrow money and to mortgage or charge all or any part of the undertaking, property or assets (present or future) of HSBC Holdings and may also exercise any of the powers conferred on it by the Companies Act 2006 and/or by shareholders. The Board is able to delegate and confer on any Director holding executive office any of its powers, authorities and discretions (including the power to sub-delegate) for such time and on such terms as it thinks fits. In addition, the Board may establish any local or divisional boards or agencies for managing the business of HSBC Holdings in any specified locality and delegate and confer on any local or divisional board, manager or agent so appointed any of its powers, authorities and discretions (including the power to sub-delegate) for such time and on such terms as it thinks fit. The Board may also, by power of attorney or otherwise, appoint any person or persons to be the agent of HSBC Holdings and may delegate to any such person or persons any of its powers, authorities and discretions (including the power to sub-delegate) for such time and on such terms as it thinks fit.
The Board delegates the management and day-to-day running of HSBC to the GMB but retains to itself approval of certain matters including operating plans, risk appetite and performance targets, procedures for monitoring and controlling operations, the authority or the delegation of authority to approve credit, market risk limits, acquisitions, disposals, investments, capital expenditure or realisation or creation of a new venture, specified senior appointments and any substantial change in balance sheet management policy.
During 2012 the Board adopted terms of reference which are available at www.hsbc.com/1/2/ about/board-of-directors. The Board will review its terms of reference annually.
The Directors who served during the year were S A Catz, L M L Cha, M K T Cheung, J D Coombe, J Faber (appointed 1 March 2012), R A Fairhead, D J Flint, A A Flockhart (retired 31 July 2012), S T Gulliver, J W J Hughes-Hallett, W S H Laidlaw, J P Lipsky (appointed 1 March 2012), J R Lomax, I J Mackay, G Morgan (retired 25 May 2012), N R N Murthy (retired 31 December 2012), Sir Simon Robertson, J L Thornton and Sir Brian Williamson (retired 25 May 2012).
HSBC Holdings was registered in Hong Kong under part XI of the Companies Ordinance on 17 January 1991.
Board meetings
Eight Board meetings and a one-day strategy meeting were held in 2012. At least one Board meeting each year is held in a key strategic location outside the UK. During 2012, Board meetings were held in Hong Kong and Washington D.C.
The table below shows each Director’s attendance at meetings of the Board held while he or she was a Director during 2012. One meeting of the Board was held at short notice in 2012.
Twelve meetings of committees of the Board appointed to discharge specific business were held during 2012. These meetings are not shown in the table below.
During 2012, the non-executive Directors and the Group Chairman met twice without the other executive Directors. The non-executive Directors also met twice without the Group Chairman, including to appraise the Group Chairman’s performance.
Attendance record
Meetings attended | Meetings eligible to attend as a Director | |||||||
S A Catz | 8 | 8 | ||||||
L M L Cha | 8 | 8 | ||||||
M K T Cheung | 8 | 8 | ||||||
J D Coombe | 8 | 8 | ||||||
J Faber1,2 | 6 | 6 | ||||||
R A Fairhead3 | 6 | 8 | ||||||
D J Flint | 8 | 8 | ||||||
A A Flockhart4 | 4 | 5 | ||||||
S T Gulliver | 8 | 8 | ||||||
J W J Hughes-Hallett | 7 | 8 | ||||||
W S H Laidlaw | 8 | 8 | ||||||
J P Lipsky1 | 6 | 6 | ||||||
J R Lomax | 8 | 8 | ||||||
I J Mackay | 8 | 8 | ||||||
G Morgan5 | 4 | 4 | ||||||
N R N Murthy6 | 7 | 8 | ||||||
Sir Simon Robertson | 8 | 8 | ||||||
J L Thornton | 8 | 8 | ||||||
Sir Brian Williamson5 | 4 | 4 | ||||||
Meetings held in 2012 | 8 | |||||||
| 1 | Appointed a Director on 1 March 2012. |
| 2 | Also attended one meeting by invitation before becoming a Director. |
| 3 | Took a temporary leave of absence due to illness. |
| 4 | Retired as a Director on 31 July 2012. |
| 5 | Retired as a Director on 25 May 2012. |
| 6 | Retired as a Director on 31 December 2012. |
310
Table of Contents
HSBC HOLDINGS PLC
Report of the Directors: Corporate Governance(continued)
Group Chairman and Group Chief Executive
The roles of Group Chairman and Group Chief Executive are separate and held by experienced full-time Directors. There is a clear division of responsibilities at the head of the Company between the running of the Board and the executive responsibility for running HSBC’s business. The key responsibilities of the Group Chairman and the Group Chief Executive are set out below.
Key responsibilities
Group Chairman – D J Flint1
| • | Leads the Board and ensures its effectiveness. |
| • | Develops relationships with governments, regulators and investors. |
| • | Leads the Group’s interactions on matters of public policy and regulatory reform with regard to the banking and financial services industry. |
| • | Maintains corporate reputation and character. |
| • | Undertakes performance management of the Group Chief Executive. |
| 1 | Appointed Group Chairman in December 2010. |
Group Chief Executive – S T Gulliver1
| • | Develops, and delivers performance against, business plans. |
| • | Develops Group strategy, in agreement with the Group Chairman, for recommendation to the Board. |
| • | As Chairman of the GMB, drives performance within strategic goals and commercial objectives agreed by the Board. |
| 1 | Appointed Group Chief Executive in January 2011. |
The Group Chief Executive has an office in London and in Hong Kong.
Deputy Chairman and senior independent non-executive Director
The key responsibilities of the Deputy Chairman and senior independent non-executive Director are set out below.
Key responsibilities
Deputy Chairman and senior independent non-executive Director – Sir Simon Robertson1
| • | Deputises for the Group Chairman at meetings of the Board or shareholders. |
| • | Supports the Group Chairman in his role. |
| • | Acts as an intermediary for other non-executive Directors when necessary. |
| • | Leads the non-executive Directors in the oversight of the Group Chairman. |
| • | Ensures there is a clear division of responsibility between the Group Chairman and Group Chief Executive. |
| • | Is available to shareholders should they have concerns which contact through the normal channels cannot resolve or for which such contact would be inappropriate. |
| 1 | Appointed senior independent non-executive Director in 2007 and Deputy Chairman in December 2010. |
Board balance and independence of Directors
The Board includes a strong presence of both executive and non-executive Directors and no individual or small group can dominate its decision making. The size of the Board is appropriate given the complexity and geographical spread of our business and the significant time demands placed on the non-executive Directors, particularly those who serve as members of Board committees.
The Nomination Committee regularly reviews the structure, size and composition of the Board (including the skills, knowledge and experience required of Directors) necessary to address and challenge adequately key risks and issues that confront, or may confront, the Board and makes recommendations to the Board with regard to any changes.
During 2012, the Board adopted a Board diversity policy. Further information on this policy can be found on page 329.
The Board considers all of the non-executive Directors to be independent in character and judgement. The Board has determined S A Catz, L M L Cha, M K T Cheung, J B Comey, J D Coombe, J Faber, R A Fairhead, R Fassbind, J W J Hughes-Hallett, W S H Laidlaw, J P Lipsky, J R Lomax, Sir Simon Robertson and J L Thornton to be independent. When determining independence the Board considers that calculation of the length of service of a non-executive Director begins on the date of his or her first election by shareholders as a Director of HSBC Holdings. Given the complexity and geographical spread of our business, the experience of previous service on a HSBC subsidiary company board can be a considerable benefit and does not detract from a Director’s independence. In reaching its determination of each non-executive Director’s independence, the Board has concluded that there are no relationships or circumstances which are likely to affect a Director’s judgement and any relationships or circumstances which could appear to do so were considered not to be material. From the conclusion of the Annual General Meeting in 2013, R A Fairhead will have served on the Board for more than nine years and, in that respect only, will not meet the usual criteria for independence set out in the UK Corporate Governance Code.
In accordance with the Rules Governing the Listing of Securities on the Stock Exchange of Hong Kong Limited, each non-executive Director
311
Table of Contents
HSBC HOLDINGS PLC
Report of the Directors: Corporate Governance(continued)
determined by the Board to be independent has provided an annual confirmation of his or her independence to HSBC Holdings.
Information and support
The Board regularly reviews reports on progress against financial objectives, business developments and investor and external relations. The chairmen of Board committees and the Group Chief Executive report to each meeting of the Board on the activities of the committees since the previous Board meeting. The Board receives regular reports and presentations on strategy and developments in the global businesses and principal geographical areas. Regular reports are also provided to the Board and Board committees on the Group’s risk appetite profile, top and emerging risks, risk management, credit exposures and the Group’s loan portfolio, asset and liability management, liquidity, litigation, compliance and reputational issues. The agenda and supporting papers are distributed in advance of all Board and Board committee meetings to allow time for appropriate review and to facilitate full discussion at the meetings. All Directors have full and timely access to all relevant information and may take independent professional advice if necessary at the Company’s expense.
The Directors have free and open contact with management at all levels. When attending Board offsites and when travelling for other reasons, non-executive Directors are encouraged to take opportunities to see business operations at first hand and to meet management.
Non-executive Directors have an open invitation to attend meetings of the GMB to further enhance their understanding and awareness of our businesses and the senior leadership team.
Induction
Full, formal and tailored induction programmes, with particular emphasis on risk management and internal controls systems, are arranged for newly appointed Directors. The programmes consist of a series of meetings with other Directors and senior executives to enable new Directors to familiarise themselves with our strategy, risk appetite and risk management, operations and internal controls. Directors also receive comprehensive guidance on directors’ duties and liabilities. As part of the induction process the Group Company Secretary will coordinate a development programme based on an individual Director’s needs. Induction programmes are also arranged for newly appointed members of committees.
Training and Development
Focused in-house training sessions are arranged in conjunction with scheduled Board meetings. Unless otherwise indicated, all Directors1 attended Board Meetings in 2012 at which briefings on the following topics were given:
| • | Capital market perspectives on HSBC2,3 |
| • | CMB strategy2and business update |
| • | GB&M strategy2 and business update |
| • | RBWM strategy2and business update |
| • | GPB strategy2and business update3 |
| • | Macroeconomic outlook2 |
| • | Europe strategy2 |
| • | US strategy2 |
| • | China strategy2 |
| • | Outlook for Greater China2 |
| • | Marks and Spencer Bank |
| • | Latin America |
| • | Global geopolitics |
| • | IT infrastructure |
Except:
| 1 | R Fassbind and J B Comey who were not Directors at the time of the briefings. |
| 2 | J Faber and J P Lipsky who were not Directors at the time of the briefing. |
| 3 | R A Fairhead who was unable to attend the briefing. |
Executive Directors
In the performance of their roles as Group Chairman, Group Chief Executive and Group Finance Director, respectively, D J Flint, S T Gulliver and I J Mackay develop and refresh their skills and knowledge of the Group’s businesses and operations through day-to-day interactions and briefings with senior management of the Group’s businesses and functions; and presenting on the Group’s businesses to investors and analysts. They remain abreast of developments affecting the financial services sector, and banking in particular, by representing HSBC’s interests at conferences, advisory groups and other events and meetings with regulators and other authorities. During 2012, this included the activities set out below:
D J Flint
Chairman of the International Institute of Finance, including leading member’s meetings and giving keynote speeches. Participated in panel discussions and gave key note speeches on economic growth and financial regulation at a number of leading events including the International Monetary Conference, the Hong Kong Trade Development Council’s Think Asia Event, City Week 2012, a Chatham House conference, St. Gallen Symposium and The Salzburg Global Seminar. Gave theAileen Beattie Memorial
312
Table of Contents
HSBC HOLDINGS PLC
Report of the Directors: Corporate Governance(continued)
Lecture at the Institute of Chartered Accountants of Scotland on the opportunities to improve the financial services sector following the crisis. Presented to the Cambridge Executive Leadership Programme on leadership. Attended and participated in panel discussions at the World Economic Forum in Davos. Attended prudential regulation meetings with the FSA.
S T Gulliver
Gave keynote speeches at the Fung Global Institute annual forum and a Conservative Parliamentary China Group meeting on UK trade links with China. Gave presentations at several Asian-focussed events including the China Development Forum in Beijing, the China Investment Corporation global investment forum, the Association of Southeast Asian Nations Finance Minsters Investors Summit in Hong Kong and the International Advisory Council of the China Banking Regulatory Commission. Attended the World Economic Forum in Davos. Attended prudential regulation meetings with the FSA. Chaired the Group’s strategy day for investors in London. Gave the keynote speech at an HSBC-led international corporate and structured banking event for UK exporters.
I J Mackay
Participated in meetings of the European Chief Financial Officers Network, the FSA Chief Financial Officers Group and the Bank for International Settlements. Attended conferences focused on Asian investment and European finance. Attended prudential regulation meetings with the FSA and the Hong Kong Monetary Authority. Presented at the Group’s strategy day for investors in London and hosted regular meetings with investors in the UK, US and Hong Kong.
Non-executive Directors
A personalised approach to training and development of non-executive Directors is applied. Non-executive Directors are given opportunities to update and develop their skills and knowledge through briefings by senior executives and externally run seminars. Non-executive Directors have access to internal training and development resources. Development plans and records of training and development activities are maintained by the Group Company Secretary to facilitate the Group Chairman’s annual review of each non-executive Director.
In addition to the briefings given at Board Meetings of HSBC Holdings, the following non-
executive Directors undertook bespoke training sessions and other activities, including attending Board committee meetings at which briefings were given during 2012 to develop and refresh their knowledge and skills as set out below:
S A Catz
Attended bespoke briefings on managing operational and reputational risk and recovery and resolution planning.
L M L Cha
Gave keynote speeches at the Institute of Directors in Hong Kong on the need for a financial services development council and at the Hong Kong Economic Summit. Participated in the Global Agenda Council on Global Financial system at the World Economic Forum. Attended bespoke briefings from HSBC Holdings on: senior management succession planning and diversity; extraterritorial application of laws and their impact on HSBC’s global businesses; HSBC brand management and sponsorship portfolio; the Group’s compliance assurance model; regulation and its impact on risk; and the FSA’s ‘Three lines of defence’ operational risk model. As a director and Vice Chairman of The Hongkong and Shanghai Banking Corporation attended bespoke briefings or board meetings at which briefings were given on: the Group’s business in Asia-Pacific; international operations; information technology; CMB; financial regulation; GB&M; the Hong Kong SAR’s relationships with India and China; and RBWM in India. Participated in the annual forum for HSBC Group non-executive directors.
M K T Cheung
Attended events for independent non-executive directors organised by KPMG and Deloitte and a seminar on international financial reporting standards organised by the Hong Kong Institute of Certified Public Accountants. Attended meetings of the Group Audit Committee at which briefings were given on developments in regulatory and accounting requirements and the regulatory environment. As a director of Hang Seng Bank attended bespoke briefings or board meetings at which briefings were given on: Basel III requirements; RBWM strategy; the Hong Kong Competition Ordinance; supervisory requirements of the Hong Kong Monetary Authority; changes to the Hong Kong Stock Exchange Listing
313
Table of Contents
HSBC HOLDINGS PLC
Report of the Directors: Corporate Governance(continued)
Rules; obligations under the Hong Kong Securities and Futures Ordinance; and mechanisms for core risk appetite measures. Participated in the annual forum for HSBC Group non-executive directors.
J D Coombe
Attended events for non-executive directors run by Tapestry Networks and Ernst & Young on bank governance and by PricewaterhouseCoopers on updates in financial accounting. Attended bespoke briefings on prudential regulation, reform of the UK financial services industry regulatory authorities and managing operational risk in the Finance global function. Attended meetings of Board committees at which briefings were given on the regulatory environment and developments in accounting requirements, risk and executive remuneration, the risk control frameworks for the global businesses, Group recovery and resolution planning and legal reform. Chaired the annual forum for the chairmen of HSBC Group audit and risk committees. Participated in the annual forum for HSBC Group non-executive directors.
J Faber
Undertook a personal induction programme comprising bespoke briefings on: CMB and GB&M, with particular focus on operations in the UK and Europe; the structure and responsibilities of a number of the Group’s global functions, including: Strategy and Planning; Corporate Sustainability; Risk (including Compliance); Finance; and Legal; and corporate governance (including Directors’ duties and obligations, HSBC’s governance structure, Global Standards and Business Principles, international corporate governance codes and listing obligations). Attended bespoke briefings on prudential regulation and HSBC’s business in Germany. Attended meetings of the Group Risk Committee at which briefings were given on the risk control frameworks for the global businesses, Group recovery and resolution planning and legal and regulatory reform.
R A Fairhead
Attended bespoke briefings on prudential regulation. Attended meetings of committees of the Board at which briefings were given on the regulatory environment and developments in accounting requirements and risk, the risk control frameworks for the global businesses, Group recovery and resolution planning and legal and regulatory reform. Participated in a risk workshop co-hosted by HSBC and Cambridge University Centre for Risk Studies.
R Fassbind1
Undertook a personal induction programme comprising bespoke briefings on: each of the Group’s global businesses; the structure and responsibilities of a number of the Group’s global functions, including: Strategy and Planning; Corporate Sustainability; Risk; Finance; Human Resources; and Internal Audit; corporate governance (including Directors’ duties and obligations, HSBC’s governance structure, Global Standards and Business Principles, international corporate governance codes and listing obligations); IT and Operations; and the Group’s Insurance business.
J W J Hughes-Hallet
Attended meetings of the Group Risk Committee at which bespoke briefings were given on the risk control frameworks for the global businesses, Group recovery and resolution planning and legal and regulatory reform.
W S H Laidlaw
Attended bespoke briefings on individual liquidity adequacy assessment in the UK. Attended meetings of the Group Remuneration Committee at which briefings were given on regulatory developments in executive remuneration.
J P Lipsky
Undertook a personal induction programme comprising bespoke briefings on: GB&M; the structure and responsibilities of a number of the Group’s global functions, including: Strategy and Planning; Risk (including compliance); Finance ; Legal ; and governance (including Directors’ duties and obligations, HSBC’s governance structure, Global Standards and Business Principles, international corporate governance codes and listing obligations). Attended bespoke briefings on prudential regulation. Attended meetings of the Group Risk Committee at which briefings were given on the risk control frameworks for the global businesses, Group recovery and resolution planning and legal and regulatory reform. Participated in the annual forum for HSBC Group non-executive directors.
J R Lomax
Attended an event for non-executive directors run by Tapestry Networks and Ernst & Young on bank governance and the Trilateral Commission’s Europe conference in Helsinki. Attended meetings of
314
Table of Contents
HSBC HOLDINGS PLC
Report of the Directors: Corporate Governance(continued)
committees of the Board at which briefings were given on the regulatory environment and developments in regulatory and accounting requirements and risk, the risk control frameworks for the global businesses, Group recovery and resolution planning and legal and regulatory reform. Participated in a risk workshop co-hosted by HSBC and Cambridge University Centre for Risk Studies and in the annual forum for HSBC Group non-executive directors.
Sir Simon Robertson
Attended bespoke briefings on prudential regulation, GPB, GB&M, Legal (including US regulatory matters), and Strategy and Planning. Attended a briefing from the external auditor on its role in the Group’s financial reporting. Develops and refreshes knowledge of the Group’s businesses and operations through regular interactions with, and receipt of briefings from, the Group Chairman and Group Chief Executive. Participated in the annual forum for HSBC Group non-executive directors.
J L Thornton
Attended bespoke briefings on prudential regulation and anti-money laundering and compliance. Attended meetings of the Group Remuneration Committee at which briefings were given on regulatory developments in executive remuneration. As chairman of HSBC North America Holdings Inc. attended board meetings at which briefings were given on: the Dodd-Frank Act; key US strategic considerations comprising the transformation of the US business (including regulatory and remediation planning, business disposals and demise, core business re-engineering and changing the culture); and the Group’s global businesses in the US including, in particular, the US consumer and mortgage lending business.
Performance evaluation
In September 2012, Bvalco Ltd was commissioned to facilitate and report on the review of effectiveness of the Board, with particular focus on the effectiveness of committees and their interaction with the Board, the relationship and information flows between the subsidiaries and the Board, the balance of skills on the Board and the level of time commitment required from Directors. A legal firm which is engaged from time to time by the Company to provide legal services holds a 20% shareholding in Bvalco Ltd. Bvalco Ltd has confirmed that it does not have any other connection with the Company. Bvalco’s report was prepared following interviews with Directors and senior members of management
and a review of relevant documents. Factors assessed during Bvalco’s review included the Group’s culture, handling of reputational issues, composition of the Board, effectiveness of the Group Chairman, interaction between Board members and management, and Board Committee structure. Bvalco’s evaluation of the Board considered the balance of skills, experience, independence and knowledge of the Company on the Board, its diversity, including gender, how the Board works together as a unit and other factors relevant to its effectiveness.
The Bvalco report concluded that the Board operates effectively with a number of important strengths. The report is used by the Board in its annual evaluation of its own performance and that of its committees and by the Group Chairman in his review of the individual performance of Directors. The Board will monitor implementation of actions arising from its 2012 performance evaluation. All actions arising from the Board’s 2011 performance evaluation have been implemented.
It is the intention of the Board to continue to undertake an evaluation of its performance and that of its committees and individual Directors annually, with external input to the process at least every third year.
Formal evaluation of the individual performance of each Director is undertaken annually by the Group Chairman using the findings of the performance evaluation process undertaken by the Board and, as appropriate, the records of training and development activities undertaken by Directors. During this evaluation, the Group Chairman discusses the contribution of the Director and the time spent by them in performing their responsibilities. The Group Chairman has confirmed that all of the non-executive Directors continue to perform effectively and to demonstrate commitment to their roles.
The non-executive Directors, led by the Deputy Chairman and senior independent non-executive Director, are responsible for the evaluation of the performance of the Group Chairman.
Appointment, retirement and re-election of Directors
The Board may at any time appoint any person who is willing to act as a Director, either to fill a vacancy or as an addition to the existing Board, but the total number of Directors shall not exceed twenty-five. Any Director so appointed by the Board shall retire at the Annual General Meeting following his or her appointment and shall be eligible for re-election but would not be taken into account in determining the
315
Table of Contents
HSBC HOLDINGS PLC
Report of the Directors: Corporate Governance(continued)
number of Directors who are to retire by rotation at such meeting in accordance with the Articles of Association. The Board may appoint any Director to hold any employment or executive office and may revoke or terminate any such appointment. Shareholders may, by ordinary resolution, appoint a person a Director or remove any Director before the expiration of his period of office. On the recommendation of the Nomination Committee and in compliance with provision B.7.1 of the UK Corporate Governance Code, the Board has decided that all of the Directors should be subject to annual re-election by shareholders. Accordingly, all of the Directors will retire at the forthcoming Annual General Meeting and offer themselves for re-election. Each of the executive Directors is employed, on a rolling contract which requires 12 months’ notice to be given by either party. None of the non-executive Directors has a service contract with HSBC.
Relations with shareholders
All Directors are encouraged to develop an understanding of the views of major shareholders. Non-executive Directors are invited to attend analyst presentations and other meetings with institutional investors and their representative bodies. Directors also meet representatives of institutional shareholders annually to discuss corporate governance matters.
All executive Directors and certain other senior executives hold regular meetings with institutional investors. The Board receives a regular investor relations activity report which provides feedback from meetings with institutional shareholders and brokers, analysts’ forecasts, information from research reports and share price performance data. Twice each year the Board also receives a report from one of our corporate brokers on market views and investor relations.
On several occasions during 2012, non-executive Directors, including the senior independent non-executive Director, met or corresponded with institutional investors and their representatives to discuss governance and remuneration.
As senior independent non-executive Director, Sir Simon Robertson is available to shareholders should they have concerns which contact through the normal channels of Group Chairman, Group Chief Executive, Group Finance Director or other executives cannot resolve or for which such contact would be inappropriate. He may be contacted
through the Group Company Secretary at 8 Canada Square, London E14 5HQ.
During 2012, the Board established a shareholder communication policy which is available on www.hsbc.com.
Conflicts of interest, indemnification of Directors, relevant audit information and contracts of significance
The Board has authority to approve Directors’ conflicts and potential conflicts of interest and has adopted a policy and procedures for the determination of terms of authorisation for such situations. The Board’s powers to authorise conflicts are operating effectively and the procedures are being followed. A review of situational conflicts which have been authorised from time to time and the terms of those authorisations is undertaken by the Board annually.
Our Articles of Association provide that Directors are entitled to be indemnified out of the assets of HSBC Holdings against claims from third parties in respect of certain liabilities. Such indemnity provisions have been in place during the financial year but have not been utilised by the Directors.
Each person who is a Director at the time of approval of this report confirms that so far as he or she is aware, there is no relevant audit information of which the auditor is unaware and the Director has taken all the steps that he or she ought to have taken as a Director in order to make himself or herself aware of any relevant audit information and to establish that the auditor is aware of that information. This confirmation is given pursuant to section 418 of the Companies Act 2006 and should be interpreted in accordance therewith and subject to the provisions thereof.
None of the Directors had, during the year or at the end of the year, a material interest, directly or indirectly, in any contract of significance with any HSBC company.
HSBC is committed to high standards of corporate governance. HSBC has complied during 2012 with the applicable code provisions of: (i) The UK Corporate Governance Code issued by the Financial Reporting Council; (ii) the Code on Corporate Governance Practices set out in Appendix 14 to the Rules Governing the Listing of Securities on The Stock Exchange of Hong Kong Limited, from 1 January 2012 until its amendment and replacement
316
Table of Contents
HSBC HOLDINGS PLC
Report of the Directors: Corporate Governance(continued)
by the Hong Kong Corporate Governance Code on 1 April 2012; and (iii) the Hong Kong Corporate Governance Code from 1 April 2012 to 31 December 2012, save that the Group Risk Committee (all the members of which are independent non-executive Directors), which was established in accordance with the recommendations of the Report on Governance in UK banks and other financial industry entities, is responsible for the oversight of internal control (other than internal control over financial reporting) and risk management systems (Hong Kong Corporate Governance Code provision C.3.3 paragraphs (f), (g) and (h)). If there were no Group Risk Committee, these matters would be the responsibility of the Group Audit Committee. At its meeting on 24 May 2012, the Board adopted Terms of Reference and approved a shareholder communication policy as required under the Hong Kong Corporate Governance Code. The UK Corporate Governance Code is available at www.frc.org.uk and the Hong Kong Corporate Governance Code is available at www.hkex.com.hk.
The Board has adopted a code of conduct for transactions in HSBC Group securities by Directors. The code of conduct complies with The Model Code in the Listing Rules of the FSA and with The Model
Code for Securities Transactions by Directors of Listed Issuers (‘Hong Kong Model Code’) set out in the Rules Governing the Listing of Securities on The Stock Exchange of Hong Kong Limited, save that The Stock Exchange of Hong Kong Limited has granted certain waivers from strict compliance with the Hong Kong Model Code. The waivers granted by The Stock Exchange of Hong Kong Limited primarily take into account accepted practices in the UK, particularly in respect of employee share plans. Following specific enquiry, each Director has confirmed that he or she has complied with the code of conduct for transactions in HSBC Group securities throughout the year, save that, on 15 June 2012, an independent non-executive Director acquired an interest as beneficial owner in 3,950 retail bonds and as non-beneficial owner in 1,170 retail bonds of RMB10,000 each issued by HSBC Bank plc before giving notification and receiving written clearance to deal. On 10 January 2013, an independent non-executive Director disposed of an interest as beneficial owner in 500 units of euro-denominated preferred securities of EUR1,000 each issued by HSBC Capital Funding (Euro 2) L.P. before giving notification. All Directors have since been reminded of their obligations under the code of conduct for transactions in HSBC Group Securities.
317
Table of Contents
HSBC HOLDINGS PLC
Report of the Directors: Corporate Governance(continued)
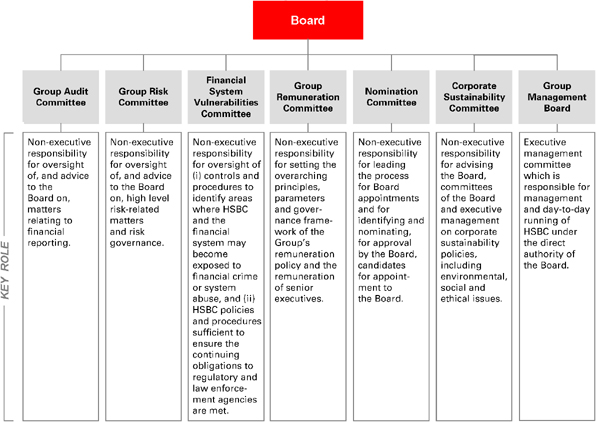
The Board has established a number of committees consisting of Directors, Group Managing Directors and, in the case of the Financial System Vulnerabilities Committee and Corporate Sustainability Committee, co-opted non-director members. The key roles of the principal committees are described above. The Chairman of each non-executive Board committee reports to each meeting of the Board on the activities of the committee since the previous Board meeting.
The terms of reference of the non-executive Board committees are available at www.hsbc.com/boardcommittees. Each non-executive Board committee reviews its terms of reference annually.
Appointments of Directors to each non-executive Board committee are made for periods of up to three years, extendable by no more than two additional three-year periods.
| Members1,2 | S T Gulliver (Chairman) and I J Mackay, who are executive Directors, and A Almeida, S Assaf, I M Dorner, J M Flint, A M Keir, S A Levey, A M Losada, M M Moses, S P O’Sullivan, B Robertson and P T S Wong, all of whom are Group Managing Directors. |
| 1 | As at 4 March 2013. |
| 2 | M P Kaur has been appointed a member with effect from 1 April 2013. |
The head of each global business and global function and the chief executive of each region attend GMB meetings, either as members or by invitation.
The GMB meets frequently and exercises the powers, authorities and discretions of the Board in so far as they concern the management and day-to-day running of HSBC Holdings. Matters reserved for approval by the Board are described on page 310.
318
Table of Contents
HSBC HOLDINGS PLC
Report of the Directors: Corporate Governance(continued)
The GMB is a key element of our management reporting and control structure such that all of our line operations are accountable either to a member of the GMB or directly to the Group Chief Executive, who in turn reports to the Group Chairman. The Board has set objectives and measures for the GMB. These align senior executives’ objectives and measures with the strategy and operating plans throughout HSBC.
The Group Chief Executive (who is Chairman of the GMB) reports to each meeting of the Board on the activities of the GMB.
Regular Risk Management Meetings of GMB, chaired by the Group Chief Risk Officer, are held to establish, maintain and periodically review the policy and guidelines for the management of risk within the Group.
Regular Global Standards Steering Meetings of the GMB, co-chaired by the Group Chief Risk Officer and Group Chief Legal Officer, are held to develop and implement global standards reflecting best practices which must be adopted and adhered to consistently throughout the Group.
The Group Audit Committee (‘GAC’) has non-executive responsibility for oversight of, and advice to, the Board on matters relating to financial
reporting and for non-executive oversight of internal controls over financial reporting.
Meetings attended | Meetings eligible to attend | |||||||
Members1 | ||||||||
J D Coombe (Chairman) | 5 | 5 | ||||||
M K T Cheung | 5 | 5 | ||||||
R A Fairhead | 5 | 5 | ||||||
J R Lomax | 5 | 5 | ||||||
Meetings held in 2012 | 5 | |||||||
| 1 | All members are independent non-executive Directors. |
R Fassbind was appointed a member of the GAC on 1 March 2013.
The Board has determined that M K T Cheung, J D Coombe, R A Fairhead, R Fassbind and J R Lomax are independent according to SEC criteria and may be regarded as audit committee financial experts for the purposes of section 407 of the Sarbanes-Oxley Act and have recent and relevant financial experience for the purposes of the UK Corporate Governance Code.
The governance structure for the oversight of financial reporting is set out below. Each major operating subsidiary has established a board committee with non-executive responsibility for oversight of matters relating to financial reporting.
Governance
| Authority | Membership | Responsibilities include: | ||
| Board | Executive and non-executive Directors | • Financial reporting • Appoints senior financial officers • Delegates authorities in relation to financial matters | ||
| GAC | Independent non-executive Directors | • Monitors the integrity of financial statements • Oversees the internal control systems over financial reporting, including reviewing their effectiveness • Monitors and reviews the effectiveness of the internal audit function • Reviews the Company’s financial and accounting policies and practices • Advises the Board on appointment of the external auditor and is responsible for oversight and remuneration of the external auditor | ||
Disclosure Committee | Representatives from global businesses, functions and certain Group companies | • Reviews the Group’s material communications with investors • Assists the Group Chief Executive and Group Finance Director to discharge their obligations relating to financial reporting under the Securities Exchange Act of 1934 • Monitors and reviews the effectiveness of controls and procedures established to ensure that information is disclosed appropriately and on a timely basis • Reports findings and makes recommendations to the Group Chief Executive, Group Finance Director and the GAC | ||
Subsidiary board committees responsible for oversight of financial reporting and global business audit committees | Independent non-executive directors and/or independent members, as appropriate | • Provide certification to the GAC or intermediate audit committee on financial statements and internal controls over financial reporting of relevant subsidiaries or businesses, as appropriate | ||
319
Table of Contents
HSBC HOLDINGS PLC
Report of the Directors: Corporate Governance(continued)
Committee activities
The GAC undertook the following activities in the discharge of its responsibilities:
| • | Financial reporting. The Committee advised the Board on meeting its external financial reporting obligations through its reviews of financial statements, interim reports and interim management statements prior to approval by the Board. The Committee also undertook the following: |
| — | endorsed the going concern statement and the statement of compliance with the UK Corporate Governance Code and Hong Kong Corporate Governance Code (formerly the Code on Corporate Governance Practices in Appendix 14 to the Rules Governing the Listing of Securities on The Stock Exchange of Hong Kong Limited) for inclusion in the financial statements; |
| — | advised the Board that the annual report and accounts, taken as a whole, is fair, balanced and understandable; |
| — | received reports on proposed changes to the Group’s disclosures in the financial statements and the adequacy of procedures to identify transactions and matters requiring disclosure under certain accounting standards; |
| — | reviewed accounting policies and practices, including approval of the critical accounting policies; |
| — | considered provisioning for, and disclosure of, certain litigation and regulatory matters with external legal counsel providing a status update on these matters; |
| — | received a presentation from the Global Head of Tax on current tax issues; |
| — | received a report on the European Banking Authority Capital Exercise 2012 to monitor adherence to recommended core tier 1 ratios; and |
| — | reviewed the procedures for the submission by employees of concerns regarding accounting and/or auditing matters. |
During 2012, the GAC considered the significant accounting issues described below. In addressing these issues the Committee considered the appropriateness of management’s judgements and estimates and, where appropriate, discussed these judgements and
estimates with the external auditor. The Committee considered:
| — | the circumstances leading to the recognition of a provision at 30 June 2012 relating to US regulatory and law enforcement investigations into inadequate compliance with anti-money laundering, US Bank Secrecy and sanctions laws. The Committee noted that management had considered the available information, recent developments, the opinions of external legal counsel and the outcome of past cases on similar matters. The Committee discussed the judgements exercised by management in forming a best estimate of the amount that might have been required to settle the matter, and agreed that a provision of US$700m should be made, while noting that this estimate was highly uncertain, and that the amount, when determined, could be higher, possibly significantly so. In the third quarter, the Committee considered the latest developments in this matter and discussed the possibility of a criminal prosecution being brought against one or more Group companies and the possible implications. The Committee agreed with management’s judgement that the provision should be increased to US$1.5bn, while continuing to note that the final amount could be significantly higher. Subsequently, the Committee noted the payments made in December 2012 under the agreements to achieve resolution with US and UK government agencies, and the terms of the Deferred Prosecution Agreement; |
| — | the developments in the industry investigations and reviews into the setting of Libor, Euribor and other benchmark interest and foreign exchange rates by various regulators and competition and enforcement authorities around the world. The Committee discussed the high degree of uncertainty as to the resolution of these regulatory investigations and reviews, including the timing and potential impact; |
| — | HSBC’s exposure to the payment of redress in respect of the possible mis-selling of payment protection insurance policies in the UK and the related provisions. The Committee considered the key assumptions which determine the provisions and the factors driving the increase during the year. Management’s assessment was that the amount of provision at 31 December 2012 |
320
Table of Contents
HSBC HOLDINGS PLC
Report of the Directors: Corporate Governance(continued)
of US$1.3bn is based on appropriate assumptions about future expected redress payments, while noting the sensitivity of the provision to different outcomes from those assumed;
| — | HSBC’s involvement in the sale of interest rate swaps to small and medium sized businesses in the UK and the potential costs of remediation. The Committee noted that the provision of US$598m at 31 December 2012 reflected the outcome of the FSA’s findings from the pilot reviews completed by banks on the selling of these products to customers; |
| — | the level of loan impairment allowances and charges throughout the year, discussing with management the reasons for significant increases, notably in Brazil as a result of economic conditions and strong growth in lending in recent periods. The Committee considered the judgements and estimates involved in applying roll rate methodologies and noted the recognition of an additional impairment allowance of US$225m in respect of the US mortgage lending portfolios to reflect a longer estimated average period of time from current status to write-off. In response to an industry letter from the FSA concerning the application of loan impairment methodologies to loan portfolios vulnerable to credit stresses, the Committee considered reports on the application of HSBC’s accounting policies and loan impairment methodologies. The Committee also considered a report on credit exposures and the extent of refinancing risk in HSBC’s UK corporate real estate lending portfolio, and how this is reflected in loan impairment allowances; |
| — | the recoverability of major deferred tax assets balances recognised, including the deferred tax asset balances recognised in the US, Mexico and Brazil; |
| — | management’s judgements involved in the change in estimation methodology for credit valuation adjustments and debit valuation adjustments on derivative financial instruments as at 31 December 2012 as a result of changing market practices; |
| — | the impairment test performed on HSBC’s investment in Bank of Communications Co., Limited as at 31 December 2012. During the year, the market value of the |
| investment was below the carrying amount for a period of approximately ten months, which gave rise to an indicator of impairment. The impairment test identified that, based on an assessment of the value in use of the investment, the investment is not impaired; and |
| — | management’s conclusion that goodwill relating to GB&M Europe is not impaired following reduced profitability in the second half of 2012 which triggered the re-testing of the related goodwill as at 31 December 2012. The Committee noted that disclosure has been made with regards to the extent to which a change in key assumptions would result in the recoverable amount to be equal to its carrying amount (see note 23 on the financial statements). |
| • | Internal controls over financial reporting. The Committee undertook an annual review of HSBC’s systems of internal controls over financial reporting. During 2012, the Committee monitored the effectiveness of such internal controls and reported regularly to the Board as described on page 334. The Committee received regular reports from the Group Finance Director, the Group Chief Accounting Officer, and the Group Head of Internal Audit. Minutes of the Group Risk Committee (‘GRC’) and executive committee meetings including the GMB and Risk Management Meetings were provided to the Committee members. The Committee also reviewed the adequacy of resources, qualifications and experience of staff in the Finance function. Reports were submitted to the Committee on internal control matters in relation to the Sarbanes-Oxley Act. The Group Finance Director, the Group Chief Risk Officer, the Group Head of Internal Audit, the Group Chief Accounting Officer, Group Company Secretary, external auditor and other senior executives attended Committee meetings. The Committee had regular discussions with the external auditor and the Group Head of Internal Audit, with an opportunity at each meeting for discussions to take place without management present. |
| • | Effectiveness of the internal audit function. The Committee satisfied itself that the internal audit function was effective and adequately resourced through regular meetings held with, and reports provided by, the Group Head of Internal Audit on internal audit issues, including the effectiveness and adequacy of resources. KPMG undertook a quality assurance review of |
321
Table of Contents
HSBC HOLDINGS PLC
Report of the Directors: Corporate Governance(continued)
| the internal audit function and concluded that overall, the internal audit function generally conformed to the Institute of Internal Auditors’ International Standards and Code of Ethics for the Professional Practice on Internal Auditing. The Committee received reports over the course of 2012 on the activities of the internal audit function and reviewed its planned activities for the following year. |
| • | Legal and regulatory environment.The Committee received regular reports on litigation and on the application of changes in law, regulation, accounting policies and practices and regulatory developments, including reports on developments in the programme to change International Financial Reporting Standards, Basel III, the recommendations of the Independent Commission on Banking, Dodd-Frank Act and changes in the UK Corporate Governance Code and Guidance on Audit Committees. |
| • | External auditor. The Committee provided oversight of the external auditor through regular meetings with the external auditor, including meetings without management present, and receiving reports on the external auditor’s strategy in relation to the audit of financial statements and the progress of the audit. The Committee monitored the effectiveness of the audit process through a review of the public report published by the Financial Reporting Council’s Audit Inspection Unit on the inspection of the external auditor, an assessment against a best practice checklist for evaluating external auditors, an external audit assessment questionnaire completed by the chief financial officers of the Group’s major geographical regions, a review of the relationship between the Group and the external auditor at a senior level and considered the results of feedback provided to the external auditor by members of the finance function throughout the Group. The Committee approved the remuneration and terms of engagement and recommended to the Board the re-appointment of the external auditor. |
| • | Terms of reference and effectiveness of the Committee.The Committee undertook an annual review of its terms of reference and of its own effectiveness. Changes were made to the Committee’s terms of reference to reflect changes to the requirements of the UK Corporate Governance Code applicable to financial years beginning on or after 1 October |
| 2012 and the Hong Kong Corporate Governance Code. |
In addition to the scheduled Committee meetings, the Chairman met regularly with the Group Finance Director, the Group Chief Accounting Officer, the Group Chief Risk Officer, the Group Head of Internal Audit, other senior executives and the external auditor.
Terms of reference and subsidiary company audit oversight
The GAC is responsible for non-executive oversight of internal controls over financial reporting.
To ensure consistency of scope and approach by subsidiary company audit committees, the GAC has established core terms of reference to guide subsidiary companies when adopting terms of reference for their audit committees. The Committee’s endorsement is required for any proposed material changes to subsidiary audit committee terms of reference and for appointments to such committees.
A forum for the chairmen of our principal subsidiary company committees with responsibility for non-executive oversight of financial reporting and risk-related matters was held in June 2012 to share understanding and to facilitate a consistent approach to the way in which these subsidiary company committees operate. The next forum will be held in June 2013.
Arrangements relating to the external auditor
The Committee has recommended to the Board that KPMG Audit Plc be reappointed as auditor at the forthcoming Annual General Meeting.
KPMG has been the Group’s auditor since 1991, when HSBC Holdings became the ultimate holding company of the Group, without a tender process for the external audit contract having taken place. It is our intention that a tender process for the external audit contract will be undertaken, with the successful audit firm being appointed by 2015.
The Board has approved, on the recommendation of the Committee, a policy for the employment by HSBC of former employees of KPMG. The Committee receives an annual report on such former employees who are employed and the number in senior positions. This report enables the Committee to consider whether there has been any impairment, or appearance of impairment, of the external auditor’s judgement, objectivity or independence in respect of the audit. The external
322
Table of Contents
HSBC HOLDINGS PLC
Report of the Directors: Corporate Governance(continued)
auditor provided written confirmation of its independence under industry standards.
The policies for the pre-approval of specific services that may be provided by the principal auditor are kept under review by the Committee and amended as necessary to meet the dual objectives of ensuring that we benefit in a cost effective manner from the cumulative knowledge and experience of our auditor, while also ensuring that our external auditor maintains the necessary degree of independence and objectivity. These pre-approval policies apply to all services where any HSBC company pays for the service, or is a beneficiary or addressee of the service, and has selected or influenced the choice of KPMG. All services provided by KPMG during 2012 were pre-approved by the Committee or were entered into under pre-approval policies established by the Committee.
The pre-approved services relate to regulatory reviews, agreed-upon procedures reports, other types of attestation reports, the provision of advice and other non-audit services allowed under SEC independence rules. The services fall into the categories of audit services, audit-related services, tax services and other services.
An analysis of the remuneration paid in respect of audit and non-audit services provided by KPMG for each of the past three years is disclosed in Note 8 on the Financial Statements.
The GRC is responsible for advising the Board on high-level risk-related matters and risk governance and for non-executive oversight of risk management and internal controls (other than over financial reporting).
Meetings attended | Meetings eligible to attend | |||||||
Members1 | ||||||||
R A Fairhead2 (Chairman) | 6 | 7 | ||||||
J D Coombe | 7 | 7 | ||||||
J Faber3 | 5 | 5 | ||||||
J W J Hughes-Hallett4 | 4 | 5 | ||||||
J P Lipsky3 | 5 | 5 | ||||||
J R Lomax | 7 | 7 | ||||||
Meetings held in 2012 | 7 | |||||||
| 1 | All members are independent non-executive Directors. |
| 2 | Took a temporary leave of absence due to illness. |
| 3 | Appointed a member of the Committee on 1 March 2012. |
| 4 | Retired as a member of the Committee on 31 July 2012. |
John Trueman, a non-executive director of HSBC Bank plc and Chairman of its risk and audit committees has continued to attend meetings of the GRC by invitation during 2012. Robert Herdman, a non-executive director of HSBC North America Holdings Inc. and HSBC Bank USA, has been invited by the GRC to attend its meetings from the beginning of 2013. Their experience of risk-related matters in the financial services industry is valued by the Committee.
Governance
All of HSBC’s activities involve, to varying degrees, the measurement, evaluation, acceptance and management of risk or combinations of risks. The Board, advised by the Committee, requires and encourages a strong risk governance culture which shapes the Group’s attitude to risk. The Board and the Committee oversee the maintenance and development of a strong risk management framework by continually monitoring the risk environment, top and emerging risks facing the Group and mitigating actions planned and taken.
The Committee monitors the effectiveness of the Group’s risk management and internal controls systems other than over financial reporting, which are monitored by the GAC.
The governance structure for the management of risk is set out in the following table. Each major operating subsidiary has established a board committee with non-executive responsibility for oversight of risk-related matters and an executive committee with responsibility for risk-related matters.
323
Table of Contents
HSBC HOLDINGS PLC
Report of the Directors: Corporate Governance(continued)
Governance structure for the management of risk | ||||
Authority | Membership | Responsibilities include: | ||
Board | Executive and non-executive Directors | • Approves risk appetite, strategy and performance targets for the Group • Approves appointment of senior risk officers • Delegates authority for risk management • Encourages a strong risk governance culture which shapes the Group’s attitude to risk | ||
GRC | Independent non-executive Directors | • Advises the Board on: – risk appetite and alignment with strategy – alignment of remuneration with risk appetite (through advice to the Group Remuneration Committee) – risks associated with proposed strategic acquisitions and disposals • Reviews the effectiveness of the Group’s systems of risk management and internal controls (other than over financial reporting) • Oversees the maintenance and development of a supportive culture in relation to the management of risk | ||
Financial System Vulnerabilities Committee | Executive Directors and co-opted non-director members | • Oversees controls and procedures designed to identify areas of exposure to financial crime or system abuse • Oversees matters relating to anti-money laundering, sanctions, terrorist financing and proliferation financing • Reviews policies and procedures to ensure continuing obligations to regulatory and law enforcement agencies are met | ||
Risk Management Meeting of the GMB
Global Standards Steering Meeting of the GMB | Group Chief Risk Officer Group Chief Legal Officer Group Chief Executive Group Finance Director All other Group Managing Directors Group Chief Risk Officer
Group Chief Legal Officer Group Chief Executive Group Finance Director All other Group Managing Directors | • Formulates high-level global risk policy • Exercises delegated risk management authority • Oversees implementation of risk appetite and controls • Monitors all categories of risk and determines appropriate mitigating action • Promotes a supportive Group culture in relation to risk management
• Develops and implements global standards reflecting best practices which must be adopted and adhered to throughout the Group • Oversees initiatives to ensure our conduct matches our values | ||
Global Risk Management Board | Group Chief Risk Officer Chief Risk Officers of HSBC’s global businesses and regions Heads of risk areas within the Global Risk Function | • Supports the Risk Management Meeting and the Group Chief Risk Officer in providing strategic direction for the Global Risk function, sets priorities and oversees their execution • Oversees consistent approach to accountability for, and mitigation of, risk across the Global Risk function | ||
| Subsidiary board committees responsible for risk-related matters and global business risk committees | Independent non-executive directors and/or other independent members, as appropriate | • Provides certification to the GRC or intermediate risk committee on risk-related matters and internal controls (other than over financial reporting) of relevant subsidiaries or businesses, as appropriate | ||
Risk reporting and monitoring
The GRC regularly monitors:
| • | the Group’s risk appetite and risk profile against key performance/risk indicators, as set out in the Group’s Risk Appetite Statement, on a Group-wide, global business and regional basis; |
| • | the top and emerging risks facing the Group; and |
| • | the risk profiles for separate categories of risk within the Group’s business identified in the |
Group’s Risk Appetite Statement, on a Group-wide, global business and regional basis; |
and reviews the mitigating actions proposed by management.
Reports on these items are presented at each meeting of the Committee. Regular reports from the Risk Management Meeting, which is the executive body responsible for overseeing risk, are also presented.
In carrying out its responsibilities the Committee is closely supported by the Group Chief
324
Table of Contents
HSBC HOLDINGS PLC
Report of the Directors: Corporate Governance(continued)
Risk Officer. The Committee also receives regular presentations from the Group Head of Compliance, Group Head of Internal Audit, the Chief Legal Officer and other business, function and risk heads.
Risk appetite
Risk appetite is a key component of our management of risk. The Board, advised by the GRC, approves the Group’s risk appetite, which describes the types and levels of risk that the Group is prepared to accept in executing our strategy and which is set out in the Group’s Risk Appetite Statement. Embedding risk appetite statements and the related monitoring and reporting framework across the Group has continued to be an area of significant focus in 2012 with initiatives undertaken to:
| • | further integrate consideration of risk appetite into the process for developing the Annual Operating Plan and to enhance alignment between Group strategy and risk appetite; and |
| • | continue to embed and develop risk appetite statements throughout the global businesses and functions. |
Our risk appetite framework is underpinned by the following core characteristics:
Risk appetite: core characteristics
| • | Risk must be commensurate with sustainable returns |
| • | Strong balance sheet |
| • | Healthy capital position |
| • | Conservative liquidity management |
| • | Strong brand |
| • | Robust Group structure of separate legal entities |
| • | The global businesses should produce sustainable long-term earnings growth |
| • | Risk diversification |
These core characteristics are applied to define the risk appetite statements on a Group-wide, global business and regional level. The relevant strategic and operational objectives, within which we expect businesses and regions to operate, are expressed quantitatively across the following dimensions:
Strategic and operational objectives | ||
| Earnings | 1. Generate sustainable economic profit commensurate with the risks taken | |
| ||
| Capital and liquidity | 2. Maintain capital in excess of regulatory and internal economic capital requirements | |
| ||
3. Maintain a strong tier 1 ratio comprising a high proportion of core tier 1 | ||
| ||
4. Maintain a well diversified funding structure with a particular focus on advances to core funding ratios | ||
| ||
5. Off-balance sheet vehicles should not be material in size relative to the total balance sheet | ||
| ||
| Impairments and expected losses | 6. Manage impairments and expected losses within the Group’s tolerance | |
| ||
| Risk category and diversification | 7. Manage all risk categories within the risk appetite | |
| ||
8. Harness benefits from business diversification to generate non-volatile and sustainable earnings | ||
| ||
9. Compete for business with international customers where market connectivity is critical, businesses with local customers where we have local scale and products where global scale is critical to effectiveness | ||
| ||
| Scenario and stress testing | 10. Use robust and appropriate scenario stress testing to assess the potential impact on the Group’s capital adequacy and strategic plans | |
Top and emerging risks
Identifying and monitoring top and emerging risks is integral to our approach to risk management. We define a ‘top risk’ as being a current, emerged risk which has arisen across any of our risk categories, regions or global businesses and has the potential to have a material impact on our financial results or our reputation and the sustainability of our long-term business model, and which may form and crystallise within a one year horizon. We consider an ‘emerging risk’ to be one which has large uncertain outcomes which may form and crystallise beyond a one-year horizon and, if it were to crystallise, could have a material effect on our long-term strategy.
The GRC discusses top and emerging risks with management at each of its meetings. Current top and emerging risks, which are summarised below, are viewed as falling into three broad categories: macroeconomic and geopolitical; macro-prudential, regulatory and legal risks to our business model; and risks related to our business operations, governance and internal control systems.
The following table shows the current top and emerging risks identified through our risk management processes:
325
Table of Contents
HSBC HOLDINGS PLC
Report of the Directors: Corporate Governance(continued)
Current top and emerging risks Categories | Top and emerging risks | |
| ||
| Macroeconomic and geopolitical risk | • Emerging market slow down • Macroeconomic risks within developed economies • Increased geopolitical risk in certain regions | |
| ||
| Macro-prudential, regulatory and legal risks to our business model | • Regulatory developments affecting our business model and Group profitability • Regulatory investigations, fines, sanctions and requirements relating to conduct of business and financial crime negatively affecting our results and brand • Dispute risk | |
| ||
| Risks related to our business operations, governance and internal control systems | • Regulatory commitments and consent orders including under the Deferred Prosecution Agreement • Challenges to achieving our strategy in a downturn • Internet crime and fraud • Level of change creating operational complexity and heightened operational risk • Information security risk • Model risk | |
| ||
Stress testing
Our stress testing and scenario analysis programme is central to the monitoring of top and emerging risks. It highlights the vulnerabilities of our business and capital plans to the adverse effects of extreme but plausible events.
The outcome of the testing and analysis is also used to assess the potential impact of the relevant scenarios on the demand for regulatory capital compared with its supply.
Management develops action plans to mitigate risks identified. The extent to which those action plans are implemented depends on management’s evaluation of the risks and their potential consequences, taking into account HSBC’s risk appetite.
Further information on scenario stress testing is set out on pages 127 and 128.
Stress tests and scenario tests fall into three main classifications: regulatory scenarios; Group-wide business scenarios; and specific business or exposure scenarios.
During the year, the GRC reviewed the outcome of a number of stress tests undertaken by the Group and the implementation of action plans to mitigate risks where appropriate; including stress tests on the Annual Operating Plan under mild and severe macroeconomic scenarios, a Group reverse liquidity stress test, a Group reverse solvency stress test and a eurozone break-up stress test.
Internal Audit has conducted a review of stress testing within the Group including model development, validation and use, and the methodology, governance and management of
enterprise-wide stress testing. The development of HSBC’s stress testing and scenario testing analysis programme will continue to be an area of focus for the Committee.
Committee activities
The GRC undertook the following key activities in the discharge of its responsibilities:
| • | Oversight of executive risk management.Regular reports and presentations were received from the Group Chief Risk Officer including at each meeting a presentation of a ‘risk map’, which provided analysis, on a Group-wide, global business and regional basis, of risk profiles for categories of risk identified in the Group Risk Appetite Statement, and a top and emerging risks report which summarised proposed mitigating actions for identified risks. |
| • | Legal and regulatory environment.Reports were received from the Chief Legal Officer on forward-looking legal risks, the Group Head of Compliance on forward-looking compliance risks and the Head of Group Performance and Reward. Regular updates were received on the investigations by US regulatory and law enforcement authorities and US dispute risk and compliance matters in the US and the steps taken to remediate these compliance issues. The Group Finance Director, Group Chief Risk Officer, Group Chief Accounting Officer, Group Company Secretary and the external auditor and other senior executives attended Committee meetings. |
| • | Stress testing.The Committee reviewed the outcome of certain stress tests referred to in the |
326
Table of Contents
HSBC HOLDINGS PLC
Report of the Directors: Corporate Governance(continued)
section headed ‘Stress Testing’ on pages 127 and 128. |
| • | Review of effectiveness of internal controls.The Committee undertook an annual review of HSBC’s systems of internal controls, other than over financial reporting. During 2012, the Committee monitored the effectiveness of such internal controls and reported regularly to the Board as described on page 334. A series of presentations were made, and reports submitted, by the Group Chief Risk Officer and other business and function heads to the Committee on the risk control framework in their respective business or function. Reports from the Group Head of Internal Audit on the internal audit process and weaknesses identified in internal controls (other than over financial reporting) were presented to the Committee, as well as reports from regulators relating to the internal control systems. |
| • | Risk appetite. The Committee reviewed the alignment of risk appetite and Group strategy. Regular reviews were undertaken of the Group’s risk profile against the key performance indicators set out in the risk appetite statement which considered the need for any adjustment to the risk appetite. Refinements to the 2012 Risk Appetite Statement were approved with the refined 2012 Risk Appetite Statement being used in the preparation of the Annual Operating Plan for 2013. Reports and presentations were received from the Group Chief Risk Officer, including on the results of HSBC’s stress testing and scenario analysis programme. |
| • | Alignment of remuneration with risk appetite. Presentations and reports were received on remuneration-related proposals to assist the Committee in giving advice to the Group Remuneration Committee on the alignment of remuneration with risk appetite. The GRC considered risk-related issues to have been appropriately taken into account by the Group Remuneration Committee, including when determining the total variable pay funding pool for the 2012 performance year and the proposed design of the performance scorecard for the 2013 performance year. The Committee received presentations on the procedure for determining individual variable pay awards, including the risk assessment process for identifying matters for which risk-related adjustments may be made to individual and team awards. The process by which an individual’s adherence to HSBC Values and the Group’s risk-related policies and procedures is |
taken into account in performance assessment and determination of variable pay was also reported to the Committee. The Committee provided advice and feedback on risk-related matters to the Group Remuneration Committee where appropriate. |
| • | Top and emerging risks.In monitoring top and emerging risks the Committee received reports from the Group Chief Risk Officer and the Group Head of Compliance as well as other members of senior management on risks identified and developments in the Group’s business, including the changing regulatory environment; the implications of regulatory investigations and global market risk such as the implications of an emerging market slowdown and the impact on trade and capital flows. |
| • | Acquisitions and disposals. The Committee received reports and presentations on risk issues relating to proposed strategic acquisitions and the risk management of disposals and advised the Board appropriately. The Group Head of Mergers and Acquisitions and other members of senior management involved in proposed acquisitions and disposals attended meetings of the Committee as appropriate. |
| • | Oversight of risk governance framework. Minutes of the GAC, Group Remuneration Committee and executive committee meetings including the GMB, the Risk Management Meeting and the Group Reputational Risk Policy Committee were provided to Committee members. From January 2013 the minutes of the Global Standards Steering Meeting and from February 2013 the minutes of the Financial System Vulnerabilities Committee will be made available to the Committee. |
| • | Terms of reference and Committee effectiveness.The Committee undertook a review of its terms of reference and of its own effectiveness. The Committee recommended to the Board a change to its terms of reference to maintain consistency with the terms of reference of the GAC which were amended to comply with changes to the requirements of the Hong Kong Corporate Governance Code. |
| • | In addition to the scheduled Committee meetings, the Chairman met regularly with the Group Chief Risk Officer, the Group Head of Internal Audit, the Group Finance Director, the Chief Legal Officer and other senior executives as required. |
327
Table of Contents
HSBC HOLDINGS PLC
Report of the Directors: Corporate Governance(continued)
Professional external advice on US compliance matters has been provided by Promontory Financial Group, US financial consultants.
Terms of reference and subsidiary company risk oversight
The GRC is responsible for non-executive oversight of risk management and internal controls, other than internal controls over financial reporting which is the responsibility of the GAC.
To ensure consistency of scope and approach by subsidiary company committees, the GRC has established core terms of reference to guide subsidiary companies when adopting terms of reference for their non-executive risk committees (or audit committees if those committees are also responsible for the oversight of risk related matters).
The Committee’s endorsement is required for any proposed material changes to subsidiary company risk committee terms of reference and for appointments to such committees.
A forum for the chairmen of HSBC’s principal subsidiary company committees with responsibility for non-executive oversight of financial reporting and risk-related matters was held in June 2012 to share understanding and to facilitate a consistent approach to the way in which these subsidiary committees operate. The next forum will be held in June 2013.
Financial System Vulnerabilities Committee
| Members1 | R A Fairhead (Chairman) |
J B Comey2 |
N Fishwick3 |
D Hartnett3, 4 |
W Hughes3 |
| Sir Simon Robertson |
L H Schrank3 |
J C Zarate3, 5 |
| 1 | All members appointed on 18 January 2013, unless otherwise indicated. |
| 2 | Appointed on 4 March 2013, being the date he became a Director. |
| 3 | Co-opted non-director member of the Committee. |
| 4 | Appointed on 1 February 2013. |
| 5 | Also provides advisory services to the board of HSBC North America Holdings Inc. |
The Financial System Vulnerabilities Committee, established by resolution of the Board in January 2013, has non-executive responsibility for governance, oversight and policy guidance over the framework of controls and procedures designed to identify areas where HSBC may become exposed and through that exposure, expose the financial system more broadly to financial crime or system abuse. The Committee will also have oversight of
matters relating to anti-money laundering, sanctions, terrorist financing and proliferation financing, including the establishment, implementation, maintenance and review of adequate policies and procedures sufficient to ensure the continuing obligations to regulatory and law enforcement agencies are met.
The Committee will oversee and report to the Board on implementation of the actions necessary to build assurance in these areas and will seek to provide the Board with a forward-looking perspective on financial crime risk.
The Committee will meet at least four times each year.
Co-opted non-director members
Five co-opted non-director members have been appointed advisers to the Committee to support its work. Brief biographical particulars are set out below:
N Fishwick, CMG: former senior official in the Foreign and Commonwealth Office (‘FCO’), specialising in security and counter-terrorism; seconded from 2001 to 2004 to HM Customs and Excise as Head of Intelligence (Law Enforcement), focusing on international counter-narcotics, tax and excise fraud; awarded the CMG in 2009.
D Hartnett, CB: former Permanent Secretary for Tax at HM Revenue and Customs; focused on tax policy development, compliance and enforcement and international tax issues during his 36-year career in tax administration; former deputy chairman of the Organisation for Economic Co-operation and Development’s Forum on Tax Administration.
W Hughes, CBE QPM: former head of the UK’s Serious Organised Crime Agency; international experience in the disruption, dismantling and criminal investigation of organised crime.
L H Schrank: former chief executive officer of SWIFT, the global financial messaging system which supplies secure standardised financial messaging services and interface software to financial institutions; oversaw SWIFT’s relationship with the US Treasury Department and other countries on counter-terrorism issues.
The Honourable J C Zarate: Senior Adviser at the Center for Strategic and International Studies; the Senior National Security Analyst for CBS News; a Visiting Lecturer of Law at the Harvard Law School; national security consultant; former Deputy Assistant
328
Table of Contents
HSBC HOLDINGS PLC
Report of the Directors: Corporate Governance(continued)
to the President and Deputy National Security Advisor for Combating Terrorism responsible for developing and implementing the US Government’s counter-terrorism strategy and policies related to transnational security threats; former Assistant Secretary of the Treasury for Terrorist Financing and Financial Crime; and former federal prosecutor who served on terrorism prosecution teams.
Meetings attended | Meetings eligible to attend | |||||||
Members1 | ||||||||
J L Thornton (Chairman) | 7 | 8 | ||||||
J D Coombe | 8 | 8 | ||||||
W S H Laidlaw | 8 | 8 | ||||||
G Morgan2 | 5 | 5 | ||||||
Meetings held in 2012 | 8 | |||||||
| 1 | All members are independent non-executive Directors. |
| 2 | Retired as a Director on 25 May 2012. |
R Fassbind has been appointed a member of the Committee since March 2013.
The Group Remuneration Committee is responsible for approving remuneration policy. As part of its role, it considers the terms of annual incentive plans, share plans, other long-term incentive plans and the individual remuneration packages of executive Directors and other senior Group employees, including all in positions of significant influence and those having an impact on our risk profile and in doing so takes into account the pay and conditions across the Group. No Directors are involved in deciding their own remuneration.
The Directors’ Remuneration Report is set out on pages 347 to 367.
Meetings attended | Meetings eligible to attend | |||||||
Members1 | ||||||||
Sir Simon Robertson (Chairman) | 4 | 4 | ||||||
R A Fairhead2 | 3 | 4 | ||||||
J W J Hughes-Hallett | 4 | 4 | ||||||
J P Lipsky3 | 2 | 2 | ||||||
Sir Brian Williamson4 | 1 | 2 | ||||||
Meetings held in 2012 | 4 | |||||||
| 1 | All members are independent non-executive Directors. |
| 2 | Took a temporary leave of absence due to illness. |
| 3 | Appointed a member of the Committee on 24 May 2012. |
| 4 | Retired as a Director on 25 May 2012. |
Committee activities
The Committee undertook the following key activities in the discharge of its responsibilities:
| • | Appointments of new Directors.The Committee oversaw the process for the appointments of J Faber, R Fassbind and J P Lipsky as Directors. An external search consultancy, MWM Consulting, was used in relation to these appointments. MWM Consulting has no other connection with HSBC. The Committee also oversaw the process for the appointment of J B Comey, who was introduced to us by a member of senior management. Having regard to his public and private sector roles neither external consultants nor advertising were considered necessary in relation to this appointment. |
| • | Board appointment process.The Committee leads the process for Board appointments, with the support of external consultants as appropriate. The Board has satisfied itself that the Committee has appropriate plans in place for orderly succession to the Board reflecting an appropriate balance of skills and experience on the Board. |
| • | Forward planning.The Committee adopts a forward-looking approach to potential candidates for appointment to the Board that takes into account the needs and development of the Group’s businesses and the expected retirement dates of current Directors. |
| • | Size, structure and composition.The Committee monitored the size, structure and composition of the Board through consideration of the skills, knowledge and experience required of the Board and the skills, knowledge and experience of the current Directors. The Committee considered the re-election of Directors at the Annual General Meeting and has recommended to the Board that all Directors should stand for re-election. |
| • | Diversity.During the year, the Board adopted a policy on Board diversity which is consistent with the Group’s strategic focus on ethnicity, age and gender diversity for the employee base. Board appointments will continue to be made based on merit and candidates will be considered against objective criteria, having due regard for the benefits of diversity on the Board, including gender. The Committee developed measurable objectives to implement this policy and monitored progress towards achieving these objectives. The Board diversity |
329
Table of Contents
HSBC HOLDINGS PLC
Report of the Directors: Corporate Governance(continued)
policy is available at www.hsbc.com/investor-relations/governance/corporate-governance-codes. The benefits of diversity continue to influence succession planning and are key criteria in the instructions to external search consultants. |
| • | Director training and development.The Committee reviewed and monitored the training and continuous professional development of Directors and senior management. |
| • | Time commitment and independence of non-executive Directors.The Committee made recommendations to the Board, having assessed the independence of, and time required from, the non-executive Directors. |
| • | Terms of reference and Committee effectiveness.The Committee undertook a review of its terms of reference and its own effectiveness including the Committee’s role in assessing the independence of the non-executive Directors as required following changes made to The Hong Kong Corporate Governance Code. |
Before recommending an appointment to the Board, the Committee evaluates the balance of skills, knowledge and experience of the Board and, in light of this, and taking into account the needs of the Group’s businesses, identifies the role and capabilities required for a particular appointment. Candidates are considered on merit against these criteria. Care is taken to ensure that appointees have enough time to devote to us. Prospective Directors are asked to identify any significant other commitments and confirm they have sufficient time to discharge what is expected of them.
Corporate Sustainability Committee
Meetings attended | Meetings eligible to attend | |||||||
Members | ||||||||
L M L Cha (Chairman)1 | 3 | 4 | ||||||
N R N Murthy2 | 4 | 4 | ||||||
G V I Davis3 | 3 | 4 | ||||||
Lord May4 | 4 | 4 | ||||||
Dame Mary Marsh4 | 4 | 4 | ||||||
Meetings held in 2012 | 4 | |||||||
| 1 | Appointed Chairman on 1 January 2013. |
| 2 | Retired as a Director and Chairman of the Committee on 31 December 2012. |
| 3 | Retired as a co-opted non-director member of the Committee on 29 November 2012. |
| 4 | Co-opted non-director member of the Committee. |
J W J Hughes-Hallett has been a member of the Committee since 1 January 2013.
Sustainability governance
The Corporate Sustainability Committee is responsible for advising the Board, committees of the Board and executive management on corporate sustainability policies across the Group including environmental, social and ethical issues.
Corporate Sustainability exists as a global function. Senior executives are charged with implementing sustainable business practice in all major regions through inclusion in the HSBC Global Standards Manuals; and, through induction and developmental training. Local teams are in charge of embedding corporate sustainability strategies within banking activities.
HSBC reports on its progress in developing and implementing its sustainability strategy annually in the HSBC Sustainability Report, which is independently verified and prepared using the Global Reporting Initiative framework. TheHSBC Sustainability Report 2012 will be issued on 24 May 2013 and will be available at www.hsbc.com/ sustainability.
Corporate sustainability
At HSBC, we understand that the success of our business is closely connected to the environmental, social and economic landscape. For us, corporate sustainability means achieving sustainable profit growth so that we can continue to reward shareholders and employees, build long-lasting relationships with customers and suppliers, pay taxes and duties in those countries where we operate, and invest in communities for future growth. The way we do business is as important as what we do: our responsibilities to our customers, employees and shareholders as well as to the countries and communities in which we operate go far wider than simply being profitable.
Our continuing financial success depends, in part, on our ability to identify and address environmental, social and ethical factors which present risks or opportunities for the business. These can affect our reputation, drive employee engagement, help manage the risks of lending, leverage savings through eco-efficiency and secure new revenue streams. They generally fall into one or more of the four broad areas discussed below.
Business finance
We aim to build long-term customer relationships around the world through the provision of a consistent and high-quality service and customer experience. We use the benefits of our scale,
330
Table of Contents
HSBC HOLDINGS PLC
Report of the Directors: Corporate Governance(continued)
financial strength, geographical reach and strong brand value to achieve this.
We aim to take advantage of the opportunities and manage the risks presented by emerging global trends by developing sustainable business models to address them. We understand that the world is changing and the threats of climate change and its impact on availability of natural resources are becoming ever more real. Increasing urbanisation, a growing population and rising commodity prices all raise concerns over potential resource constraints. For example, as recent HSBC research shows, climate change means that past hydrological trends are no longer indicative of future availability of freshwater; we face local water supply shortages as global demand increases.
HSBC continues to play a leading role in shaping the market response to these challenges, identifying how business can adapt in ways that bring both social and environmental benefits, while providing viable economic returns. Throughout 2012, our Climate Change Centre of Excellence has continued to research the likely effects that climate change, and the responses to it, will have on our business and those of our customers. In the past year, HSBC Global Research has published reports on ‘Water Stress – Analysing the global challenges’ and ‘Less Bread for your Dough – The impact of rising food prices on the global economy’.
HSBC’s Climate Business Council continues to support Global Businesses to identify customer opportunities arising from the shift to a low carbon economy. HSBC’s Global Banking and Markets teams played a leading role in some of the largest renewable energy projects announced in 2012. HSBC provided a range of financial services to the largest offshore wind project in Europe and the most powerful wind farm in Latin America. The two projects combined will provide over 666 megawatts of clean energy – equivalent of enough electricity to power over half a million homes. These deals highlight HSBC’s credentials in providing asset finance within the low carbon energy market and the strength of commercial teams working across several markets.
Operational environmental efficiency
We focus our environmental initiatives primarily on addressing and responding to issues associated with climate change, including energy use, water and waste management. This issue has the potential to affect materially our customers and, by extension, our long-term success, introducing new risks to business activity. We continue to focus on the ten
goals of our operational sustainability strategy, which we announced at the end of 2011. Between 2012 and 2020 we aim to reduce our annual employee carbon emissions by one tonne, from 3.5 to 2.5 tonnes.
HSBC’s carbon dioxide emissions
For the period 1 October 2011 to 30 September 2012, carbon dioxide emissions from HSBC’s global operations were 963,000 tonnes. This was 3% less than the 991,000 tonnes emitted in 2011. This figure is subject to independent verification. Further information on the Group’s carbon dioxide emissions will be given in theHSBC Sustainability Report 2012.
Community investment
We have a long-standing commitment to the communities in which we operate. Many of our key markets are emerging economies. Our operations bring benefits to our host countries through tax contributions, and to local people and businesses through employment, training, purchasing and investment. Beyond our core business, we aim to encourage social and economic opportunity through community investment activities. Our focus is on education and the environment because we believe they are essential building blocks for the development of communities and are prerequisites for economic growth. These philanthropic programmes aim to involve employees in the work of local non-government organisations (‘NGOs’) and charities. Our global education programmes focus on helping disadvantaged children, promoting financial literacy and international and cultural understanding.
In 2012, we launched our new flagship environmental programme, the HSBC Water Programme. This is a five-year, US$100m programme in partnership with three NGOs which rank amongst the world’s most respected environmental and development organisations. Together with Earthwatch, WaterAid and WWF, the Programme will deliver the powerful combination of water provision, protection, information and education; resulting in the most ground-breaking water programme committed to by a financial organisation. The Programme will benefit communities in need and enable economies to prosper, driving development and social-economic growth. Following the success of our previous HSBC Climate Partnership, this programme will create a community of employees and opportunities for employee involvement and volunteering.
In 2012, we donated a total of US$120m to community investment projects (2011: US$96m).
331
Table of Contents
HSBC HOLDINGS PLC
Report of the Directors: Corporate Governance(continued)
Employee issues
‘Employee engagement’ describes employees’ emotional and intellectual commitment to their organisation and its success and is critical to the long-term ability of the Group to deliver the highest quality of financial services. Our Global People Survey is carried out every other year and shows that employees value our commitment to sustainable business practices and view us as being a leader in this regard. In the latest survey, taken in 2011, 81% of colleagues said they were satisfied with the actions HSBC is taking to embed sustainability (e.g. environmental and social issues) into the way we run our business.
Sustainability risk
Our approach to managing sustainability risk is detailed in the Appendix to Risk on page 280.
The Directors are responsible for internal control in HSBC and for reviewing its effectiveness. Procedures have been designed for safeguarding assets against unauthorised use or disposal; for maintaining proper accounting records; and for the reliability and usefulness of financial information used within the business or for publication. Such procedures are designed to manage and mitigate the risk of failure to achieve business objectives and can only provide reasonable and not absolute assurance against material misstatement, errors, losses or fraud. The procedures also enable HSBC Holdings to discharge its obligations under the ‘Handbook of Rules and Guidance’ issued by the FSA, HSBC’s lead regulator.
The key procedures that the Directors have established are designed to provide effective internal control within HSBC and accord with the ‘Internal Control: Revised Guidance for Directors on the Combined Code’ issued by the Financial Reporting Council. Such procedures for the ongoing identification, evaluation and management of the significant risks faced by HSBC have been in place throughout the year and up to 4 March 2013, the date of approval of theAnnual Report and Accounts 2012. In the case of companies acquired during the year, the internal controls in place are being reviewed against HSBC’s benchmarks and integrated into HSBC’s processes.
HSBC’s key internal control procedures include the following:
| • | Global standards. Functional, operating, financial reporting and certain management reporting standards are established by global |
function management committees, for application throughout HSBC. These are supplemented by operating standards set by functional and local management as required for the type of business and geographical location of each subsidiary.
| • | Delegation of authority within limits set by the Board. Authority to operate the various subsidiaries and responsibilities for financial performance against plans and for capital expenditure are delegated to their respective chief executive officers within limits set by the Board. Delegation of authority from the Board to individuals requires those individuals to maintain a clear and appropriate apportionment of significant responsibilities and to oversee the establishment and maintenance of systems of control appropriate to the business. The appointment of executives to the most senior positions within HSBC requires the approval of the Board. |
| • | Risk identification and monitoring. Systems and procedures are in place in HSBC to identify, control and report on the major risks including credit, market, liquidity, capital, financial management, model, reputational, pension, strategic, sustainability, operational (including accounting, tax, legal, compliance, fiduciary, information, external fraud, internal fraud, political, physical, business continuity, systems operations, project and people risk) and Islamic finance risk. Exposure to these risks is monitored by risk management committees, asset and liability committees and executive committees in subsidiaries and, for the Group, in Risk Management Meetings (‘RMM’) of the GMB which are chaired by the Group Chief Risk Officer. RMM meets each month (except August) to address asset, liability and risk management issues. HSBC’s operational risk profile and the effective implementation of the Group’s operational risk management framework is monitored by the Global Operational Risk and Control Committee (‘GORCC’), which reports to the RMM. Model risks are monitored by the Model Oversight Committee which also reports to the RMM. The minutes of the GMB meetings and the RMM are provided to members of the GAC, the GRC and the Board. |
| • | Changes in market conditions/practices.Processes are in place to identify new risks arising from changes in market conditions/practices or customer behaviours, which could expose HSBC to heightened risk |
332
Table of Contents
HSBC HOLDINGS PLC
Report of the Directors: Corporate Governance(continued)
of loss or reputational damage. During 2012, attention was focused on:
| – | severe economic slowdown in mature economies impacting global growth; |
| – | eurozone members departure from the currency union; |
| – | increased geopolitical risk; |
| – | emerging market slowdown; |
| – | macroeconomic risks within developed economies; |
| – | regulatory developments affecting our business model and Group profitability; |
| – | regulatory investigations, fines, sanctions and requirements relating to conduct of business and financial crime negatively affecting our results and brand; |
| – | dispute risk; |
| – | regulatory commitments and consent orders including the Deferred Prosecution Agreements; |
| – | challenges to achieving our strategy in a downturn; |
| – | internet crime and fraud; |
| – | social media risk; |
| – | level of change creating operational complexity and heightened operational risk; |
| – | information risk; and |
| – | model risk. |
| • | Strategic plans. Periodic strategic plans are prepared for global businesses, global functions and certain geographical regions within the framework of the Group’s strategy. Annual Operating Plans, informed by detailed analysis of risk appetite describing the types and quantum of risk that we are prepared to take in executing our strategy, are prepared and adopted by all major HSBC operating companies and set out the key business initiatives and the likely financial effects of those initiatives. |
| • | Disclosure Committee. The Disclosure Committee reviews material public disclosures made by HSBC Holdings for any material errors, misstatements or omissions. The membership of the Disclosure Committee, which is chaired by the Group Company Secretary, includes the heads of Global Finance, Legal, Risk and Compliance, Communications, Investor Relations and Internal Audit functions and representatives from the principal regions and global businesses. The integrity of disclosures is underpinned by structures and processes within the Finance and Risk functions that support expert and rigorous analytical review of financial reporting complemented by certified reviews by heads of global businesses, |
global functions and certain legal entities.
| • | Financial reporting. The Group financial reporting process for preparing the consolidatedAnnual Report and Accounts 2012 is controlled using documented accounting policies and reporting formats, supported by a chart of accounts with detailed instructions and guidance on reporting requirements, issued by Group Finance to all reporting entities within the Group in advance of each reporting period end. The submission of financial information from each reporting entity to Group Finance is subject to certification by the responsible financial officer, and analytical review procedures at reporting entity and Group levels. |
| • | Responsibility for risk management. Management of global businesses and global functions are primarily accountable for managing, measuring and monitoring their risks and controls. Processes consistent with the Three Lines of Defence principle are in place to ensure weaknesses are escalated to senior management and addressed. |
| • | IT operations. Centralised functional control is exercised over all IT developments and operations. Common systems are employed for similar business processes wherever practicable. |
| • | Functional management.Global functional management is responsible for setting policies, procedures and standards for the following risks: credit, market, liquidity, capital, financial management, model, reputational, pension, strategic, sustainability and operational risk (including accounting, tax, legal, compliance, fiduciary, information security, security and fraud, systems and people risk). Authorities to enter into credit and market risk exposures are delegated with limits to line management of Group companies. The concurrence of the appropriate global function is required, however, to credit proposals with specified higher risk characteristics. Credit and market risks are measured and reported on in subsidiaries and aggregated for review of risk concentrations on a Group-wide basis. |
| • | CEO Attestation process. Global Operational Risk coordinate the annual CEO Attestation process under which the chief executive officer of each of the Group’s material subsidiaries confirms that the internal control framework applicable to that subsidiary has been assessed and any significant open issues have been identified, with action plans in place to address weaknesses. The remediation of these issues is |
333
Table of Contents
HSBC HOLDINGS PLC
Report of the Directors: Corporate Governance(continued)
monitored by the Operational Risk and Internal Control (‘ORIC’) teams for the relevant regions/global businesses and reports on progress are presented to their ORIC committees and quarterly to Global Operational Risk. An annual report and updates on identified issues and remediation plans are presented to the GRC and the GAC.
| • | Internal Audit. The establishment and maintenance of appropriate systems of internal control is primarily the responsibility of business management. The Global Internal Audit function, which is centrally controlled, provides independent assurance in respect of the design and operating effectiveness of the risk management and control frameworks across the Group, focusing on the areas of greatest risk to HSBC using a risk-based approach. The head of this function reports to the Group Chairman, the Group Chief Executive Officer, the GAC and the GRC on risk-related matters. |
| • | Internal Audit recommendations.Executive management is responsible for ensuring that recommendations made by the Internal Audit function are implemented within an appropriate and agreed timetable. Confirmation to this effect must be provided to Internal Audit. |
| • | Reputational risk.Policies to guide subsidiary companies and management at all levels in the conduct of business to safeguard the Group’s reputation are established by the Board and its committees, subsidiary company boards and their committees and senior management. Reputational risks can arise from a variety of causes including environmental, social and governance issues, as a consequence of operational risk events and as a result of employees acting in a manner inconsistent with HSBC’s Values. As a banking group, HSBC’s good reputation depends upon the way in which it conducts its business but it can also be affected by the way in which clients, to which it provides financial services, conduct their business or use financial products and services. |
The GAC has non-executive responsibility for oversight of internal controls over financial reporting and the GRC has non-executive responsibility for internal controls other than over financial reporting.
The GRC and the GAC have kept under review the effectiveness of this system of internal control and have reported regularly to the Board of Directors. In carrying out their reviews the GRC and the GAC receive regular business and operational risk assessments; regular reports from the Group
Chief Risk Officer and the Head of Global Internal Audit; reports on the annual reviews of the internal control framework of HSBC Holdings which cover all internal controls, both financial and non-financial; annual confirmations from chief executives of principal subsidiary companies as to whether there have been any material losses, contingencies or uncertainties caused by weaknesses in internal controls; internal audit reports; external audit reports; prudential reviews; and regulatory reports. The GRC monitors the status of top and emerging risks which impact or may impact the Group and considers whether the mitigating actions put in place are appropriate. In addition, when unexpected losses have arisen or when incidents have occurred which indicate gaps in the control framework or in adherence to Group policies, the GRC and the GAC review special reports, prepared at the instigation of management, which analyse the cause of the issue, the lessons learned and the actions proposed by management to address the issue.
The Directors, through the GRC and the GAC, have conducted an annual review of the effectiveness of our system of internal control covering all material controls, including financial, operational and compliance controls, risk management systems, the adequacy of resources, qualifications and experience of staff of the accounting and financial reporting function and the risk function, and their training programmes and budget. The review does not extend to joint ventures or associates. The GRC and the GAC have received confirmation that executive management has taken or is taking the necessary actions to remedy any failings or weaknesses identified through the operation of our framework of controls.
The financial statements are prepared on a going concern basis, as the Directors are satisfied that the Group and parent company have the resources to continue in business for the foreseeable future. In making this assessment, the Directors have considered a wide range of information relating to present and future conditions, including future projections of profitability, cash flows and capital resources. Further information relevant to the assessment is provided elsewhere in this report. In particular, HSBC’s principal activities, business and operating models, strategic direction and top and emerging risks are described in the ‘Overview’ section; a financial summary, including a review of the consolidated income statement and consolidated balance sheet, is provided in the ‘Operating and Financial Review’ section; HSBC’s objectives,
334
Table of Contents
HSBC HOLDINGS PLC
Report of the Directors: Corporate Governance(continued)
policies and processes for managing credit, liquidity and market risk are described in the ‘Risk’ section; and HSBC’s approach to capital management and allocation is described in the ‘Capital’ section.
At 31 December 2012 we had a total workforce of 270,000 full-time and part-time employees compared with 298,000 at the end of 2011 and 307,000 at the end of 2010. Our main centres of employment are the UK with approximately 48,000 employees, India 30,000, Hong Kong 28,000, Brazil 23,000, mainland China 18,000, Mexico 18,000, the US 17,000 and France 10,000.
In the context of the current global financial services operating environment, a high performance and values-led work force is critical. We encourage open and honest communication in decision making. Employment issues and financial, economic, regulatory and competitive factors affecting HSBC’s performance are regularly shared with our employees.
In 2012, quarterly Pulse Surveys were introduced to assess in a more timely way the understanding and execution of our Group strategy, our culture, our performance and the engagement of our people generally. Every three months, a quarter of the Group’s employees are randomly sampled and hence all employees are covered over the course of the year. A Global People Survey will take place biennially, the next one being in 2013.
Over 2012, the Group strategy index score improved by 2% to 54% in the fourth quarter and the average participation rate was 56%, which is around median for comparable surveys externally.
Our approach to reward is meritocratic and market competitive, underpinned by an ethical and values based performance culture which aligns the interests of our employees, shareholders, regulators and customers. See ‘Employee share plans’ on pages 336 to 337.
We negotiate and consult with recognised unions as appropriate. The five highest concentrations of union membership are in Argentina, Brazil, mainland China, Malta and Mexico. It is our policy to maintain well-developed communications and consultation programmes with all employee representative bodies and there have been no material disruptions to our operations from labour disputes during the past five years.
HSBC is committed to building a values-driven high performance culture where all employees are valued, respected and where their opinions count. We remain committed to meritocracy, which requires a diverse and inclusive culture where employees believe that their views are heard, their concerns are attended to and they work in an environment where bias, discrimination and harassment on any matter, including gender, age, ethnicity, religion, sexuality and disability are not tolerated and where advancement is based on objectivity. Our inclusive culture helps us respond to our diverse customer base, while developing and retaining a secure supply of skilled, committed employees. Our culture will be strengthened by employing the best people and optimising their ideas, abilities and differences.
Oversight of our diversity and inclusion agenda and related activities resides with executives on the Group Diversity Committee, complemented by the Group People Committee and local People/Diversity Committees.
The development of employees in both developed and emerging markets is essential to the future strength of our business. We have implemented a systematic approach to identifying, developing and deploying talented employees to ensure an appropriate supply of high calibre individuals with the values, skills and experience for current and future senior management positions.
In 2012, we continued to build global consistency across our learning curricula and to improve the relevance and quality of learning programmes. We have endeavoured to achieve a standard of excellence focusing on leadership, values and technical capability.
335
Table of Contents
HSBC HOLDINGS PLC
Report of the Directors: Corporate Governance(continued)
Employment of disabled persons
We believe in providing equal opportunities for all employees. The employment of disabled persons is included in this commitment and the recruitment, training, career development and promotion of disabled persons is based on the aptitudes and abilities of the individual. Should employees become disabled during their employment with us, efforts are made to continue their employment and, if necessary, appropriate training and reasonable equipment and facilities are provided.
The maintenance of appropriate health and safety standards remains a key responsibility of all managers and we are committed to proactively managing all health and safety risks associated with our business. Our objectives are to identify, remove, reduce or control material risks relating to fires and accidents or injuries to employees, customers and visitors.
Group policies, standards and guidance for the management of health and safety are set by global Corporate Real Estate. Achieving these in each country in which we operate is the responsibility of the Chief Operating Officer of that country with support and coordination provided by the Health and Safety Coordinator for that country.
In terms of physical and geopolitical risk, Global Security and Fraud Risk provide regular security risk assessments to assist management in judging the level of terrorist and violent criminal threat. Regional Security and Fraud Risk functions conduct regular security reviews of all Group buildings to ensure measures to protect our staff, buildings, assets and information are appropriate to the level of threat.
We remain committed to maintaining our preparedness and to ensuring the highest standards of health and safety wherever in the world we operate.
The quality and commitment of our human capital is fundamental to our success and accordingly the Board aims to attract, retain and motivate the very best people. As trust and relationships are vital in our business our goal is to recruit those who are committed to making a long-term career with the organisation.
HSBC’s reward strategy supports this objective through balancing of both short-term and sustainable performance. Our reward strategy aims to reward
success, not failure, and be properly aligned with our risk framework and related outcomes. In order to ensure alignment between remuneration and our business strategy, individual remuneration is determined through assessment of performance delivered against both annual and long-term objectives summarised in performance scorecards as well as adherence to the HSBC Values of being ‘open, connected and dependable’ and acting with ‘courageous integrity’. Altogether, performance is judged, not only on what is achieved over the short and long-term, but also on how it is achieved, as the latter contributes to the sustainability of the organisation.
The financial and non-financial measures incorporated in the annual and long-term scorecards are carefully considered to ensure alignment with the long-term strategy of the Group.
Further information on the Group’s approach to remuneration is given on page 347.
Share options and discretionary awards of shares granted under HSBC share plans align the interests of employees with those of shareholders. The tables on the following pages set out the particulars of outstanding options, including those held by employees working under employment contracts that are regarded as ‘continuous contracts’ for the purposes of the Hong Kong Employment Ordinance. The options were granted at nil consideration. No options have been granted to substantial shareholders, suppliers of goods or services, or in excess of the individual limit for each share plan. No options were cancelled by HSBC during the year.
A summary for each plan of the total number of the options which were granted, exercised or lapsed during 2012 is shown in the following tables. Further details required to be disclosed pursuant to Chapter 17 of the Rules Governing the Listing of Securities on The Stock Exchange of Hong Kong Limited are available on our website at www.hsbc.com by selecting ‘Investor Relations’, then ‘Governance’, then ‘Share Plans’, and on the website of The Stock Exchange of Hong Kong Limited at www.hkex.com.hk or can be obtained upon request from the Group Company Secretary, 8 Canada Square, London E14 5HQ. Particulars of options held by Directors of HSBC Holdings are set out on page 363.
Note 7 on the Financial Statements gives details on share-based payments, including discretionary awards of shares granted under HSBC share plans.
336
Table of Contents
HSBC HOLDINGS PLC
Report of the Directors: Corporate Governance(continued)
All-employee share option plans
All-employee share option plans have operated within the Group and employees on the first working day of the year were eligible to be granted options to acquire HSBC Holdings ordinary shares. Options under the plans are usually exercisable after one, three or five years. The exercise of options may be advanced to an earlier date in certain circumstances, for example on retirement, and may be extended in certain circumstances, for example on the death of a participant, the executors of the participant’s estate may exercise options up to six months beyond the
normal exercise period. The middle market closing price for HSBC Holdings ordinary shares quoted on the London Stock Exchange, as derived from the Daily Official List on 23 April 2012, the day before options were granted in 2012, was £5.46. A review of the plans will be undertaken in 2013 and there will be no grant of options while that review is ongoing.
The all-employee share option plans will terminate on 27 May 2015 unless the Directors resolve to terminate the plans at an earlier date.
HSBC Holdings All-employee Share Option Plans
| HSBC Holdings ordinary shares | ||||||||||||||||||||||||||||||||||||
| Dates of awards | Exercise price | Exercisable | At | Granted | Exercised | Lapsed | At | |||||||||||||||||||||||||||||
| from | to | from | to | from | to | 1 Jan 2012 | during year | during year | during year | 31 Dec 2012 | ||||||||||||||||||||||||||
Savings-Related Share Option Plan1 | ||||||||||||||||||||||||||||||||||||
26 Apr 2006 | 24 Apr 2012 | (£) 3.3116 | (£) 6.6870 | 1 Aug 2011 | 31 Jan 2018 | 68,499,109 | 20,726,298 | 25,390,031 | 8,859,311 | 54,976,065 | ||||||||||||||||||||||||||
Savings-Related Share Option Plan: International2 | ||||||||||||||||||||||||||||||||||||
26 Apr 2006 | 24 Apr 2012 | (£) 3.3116 | (£) 6.6870 | 1 Aug 2011 | 31 Jan 2018 | 26,615,253 | 8,549,570 | 12,032,666 | 5,663,420 | 17,468,737 | ||||||||||||||||||||||||||
26 Apr 2006 | 24 Apr 2012 | (US$) 4.8876 | (US$) 12.0958 | 1 Aug 2011 | 31 Jan 2018 | 9,752,066 | 2,666,374 | 3,440,522 | 2,489,024 | 6,488,894 | ||||||||||||||||||||||||||
26 Apr 2006 | 24 Apr 2012 | (€) 3.6361 | (€) 9.5912 | 1 Aug 2011 | 31 Jan 2018 | 3,176,265 | 827,832 | 1,407,390 | 416,444 | 2,180,263 | ||||||||||||||||||||||||||
26 Apr 2006 | 24 Apr 2012 | (HK$) 37.8797 | (HK$) 94.5057 | 1 Aug 2011 | 31 Jan 2018 | 45,422,511 | 12,098,312 | 21,684,534 | 4,198,449 | 31,637,840 | ||||||||||||||||||||||||||
| 1 | The weighted average closing price of the shares immediately before the dates on which options were exercised was £5.46. |
| 2 | The weighted average closing price of the shares immediately before the dates on which options were exercised was £5.45. |
Discretionary Share Option Plans
There have been no grants of discretionary share options under employee share plans since 30 September 2005.
| Exercise | HSBC Holdings ordinary shares | |||||||||||||||||||||||||||||||
| Dates of awards | price (£) | Exercisable | At | Exercised | Lapsed | At | ||||||||||||||||||||||||||
| from | to | from | to | from | to | 1 Jan 2012 | during year | during year | 31 Dec 2012 | |||||||||||||||||||||||
HSBC Holdings Group Share Option Plan1,2 | ||||||||||||||||||||||||||||||||
7 May 2002 | 20 Apr 2005 | 6.0216 | 7.9606 | 7 May 2005 | 20 Apr 2015 | 120,797,419 | 1,606,032 | 32,018,464 | 87,172,923 | |||||||||||||||||||||||
HSBC Share Plan | ||||||||||||||||||||||||||||||||
30 Sep 2005 | 7.9911 | 30 Sep 2008 | 30 Sep 2015 | 86,046 | – | – | 86,046 | |||||||||||||||||||||||||
| 1 | The HSBC Holdings Group Share Option Plan expired on 26 May 2005. No options have been granted under the Plan since that date. |
| 2 | The weighted average closing price of the shares immediately before the dates on which options were exercised was £6.43. |
Subsidiary company share plans
HSBC France
When it was acquired in 2000, HSBC France and certain of its subsidiary companies operated employee share option plans under which options could be granted over their respective shares.
Under the terms of the employee share option plan, holders of options to acquire shares of HSBC France were obliged to exchange the HSBC France shares they received on exercise of these options for HSBC Holdings ordinary shares. Details of options to acquire shares in HSBC France are set out in the following table. No further options will be granted under this share plan.
337
Table of Contents
HSBC HOLDINGS PLC
Report of the Directors: Corporate Governance(continued)
HSBC France
| HSBC France shares of €5 | ||||||||||||||||||||||||||||||||||||
| Exercise | Exercisable | At | Exercised | Lapsed | At | |||||||||||||||||||||||||||||||
| Date of award | price (€) | from | to | 1 Jan 20121 | during year | during year | 31 Dec 20121 | |||||||||||||||||||||||||||||
1 Oct 2002 | 142.84 | | 2 Oct 2005 | | | 1 Oct 2012 | | 22,645 | – | 22,645 | – | |||||||||||||||||||||||||
| 1 | If options over HSBC France Shares had been exercised, these options would have been exchanged for HSBC Holdings ordinary shares in the ratio of 13.499897 HSBC Holdings ordinary shares for each HSBC France share. At 31 December 2012, The CCF Employee Benefit Trust 2001 (Private Banking France) held 989,502 HSBC Holdings ordinary shares. |
HSBC Finance
Upon the acquisition of HSBC Finance in 2003, all outstanding options over, and rights to receive, HSBC Finance common shares were converted into options over, and rights to receive, HSBC Holdings ordinary shares in the same ratio as the share exchange offer for the acquisition of HSBC Finance (2.675 HSBC Holdings ordinary shares for each
HSBC Finance common share). The exercise price payable for each option was adjusted using the same exchange ratio.
Details of options to acquire shares in HSBC Holdings under the share plan of HSBC Finance are set out in the following table. No further options will be granted under this share plan.
HSBC Finance: 1996 Long-Term Executive Incentive Compensation Plan
| HSBC Holdings ordinary shares | ||||||||||||||||||||||||||||||||||||||
| Date of award | Exercise | Exercisable | At | Exercised | Lapsed | At | ||||||||||||||||||||||||||||||||
| price (US$) | from | to | 1 Jan 2012 | during year1 | during year | 31 Dec 20122 | ||||||||||||||||||||||||||||||||
20 Nov 2002 | 9.29 | 20 Nov 2003 | 20 Nov 2012 | 2,429,538 | 2,053,838 | 375,700 | – | |||||||||||||||||||||||||||||||
| 1 | The weighted average closing price of the shares immediately before the dates on which options were exercised was £6.06. |
| 2 | At 31 December 2012, the HSBC (Household) Employee Benefit Trust 2003 held 281,477 HSBC Holdings ordinary shares and 1,455 American Depositary Shares, each of which represents five HSBC Holdings ordinary shares. |
HSBC Bank Bermuda
Upon the acquisition of HSBC Bank Bermuda Limited (‘HSBC Bank Bermuda’) in 2004, all outstanding options over HSBC Bank Bermuda shares were converted into options to acquire HSBC Holdings ordinary shares using an exchange ratio calculated by dividing US$40 (being the consideration paid for each HSBC Bank Bermuda share) by the average price of HSBC Holdings
ordinary shares over the five day period to the completion of the acquisition. The exercise price payable for each option was adjusted using the same exchange ratio.
Details of options to acquire shares in HSBC Holdings under the share plans of HSBC Bank Bermuda are set out in the following table. No further options will be granted under the share plans of HSBC Bank Bermuda.
HSBC Bank Bermuda
| Exercise | HSBC Holdings ordinary shares | |||||||||||||||||||||||||||||||||||||||||
| Dates of awards | price (US$) | Exercisable | At | Exercised | Lapsed | At | ||||||||||||||||||||||||||||||||||||
| from | to | from | to | from | to | 1 Jan 2012 | during year | during year | 31 Dec 20121 | |||||||||||||||||||||||||||||||||
Share Option Plan 2000 | ||||||||||||||||||||||||||||||||||||||||||
30 Jan 2002 | 21 Apr 2003 | 9.32 | 14.02 |
| 30 Jan 2003 |
|
| 21 Apr 2013 |
| 1,014,026 | – | 864,102 | 149,924 | |||||||||||||||||||||||||||||
Directors’ Share Option Plan |
| |||||||||||||||||||||||||||||||||||||||||
3 Apr 2002 | 13.95 |
| 3 Apr 2003 |
|
| 3 Apr 2012 |
| 16,881 | – | 16,881 | – | |||||||||||||||||||||||||||||||
| 1 | At 31 December 2012, the HSBC (Bank of Bermuda) Employee Benefit Trust 2004 held 2,108,830 HSBC Holdings ordinary shares which may be used to satisfy the exercise of employee share options. |
338
Table of Contents
HSBC HOLDINGS PLC
Report of the Directors: Corporate Governance(continued)
Other required disclosures
Further information about share capital, directors’ interests, supplier payment policy, dividends and shareholders is set out in the Appendix to this section on pages 340 to 346.
Our Annual General Meeting in 2013 will be held at the Barbican Hall, Barbican Centre, London EC2 on 24 May 2013 at 11.00am.
An informal meeting of shareholders will be held at 1 Queen’s Road Central, Hong Kong on Monday 20 May 2013 at 4.30pm.
Resolutions to receive theAnnual Report and Accounts 2012, approve the Directors’ Remuneration Report, elect or re-elect Directors and reappoint KPMG Audit Plc as auditor will be submitted to the Annual General Meeting. KPMG Audit Plc has expressed its willingness to continue in office and
the Group Audit Committee and the Board has recommended that KPMG Audit Plc be reappointed. Resolutions will also be submitted to the Annual General Meeting to renew the authority for the allotment of shares, disapply pre-emption rights, renew the authority for the purchase of ordinary shares, and approve general meetings (other than Annual General Meetings) being called on a minimum of 14 clear days’ notice.
A live webcast of the Annual General Meeting will be available on www.hsbc.com. From shortly after the conclusion of the Annual General Meeting until 30 June 2013 a recording of the proceedings will be available on www.hsbc.com.
| On behalf of the Board | ||
| D J Flint,Group Chairman | 4 March 2013 | |
| HSBC Holdings plc | ||
| Registered number 617987 |
339
Table of Contents
HSBC HOLDINGS PLC
Report of the Directors: Corporate Governance(continued)
| Appendix to Report of the Directors
|
Issued share capital
The nominal value of our issued share capital paid up at 31 December 2012 was US$9,238,018,832 divided into 18,476,008,664 ordinary shares of US$0.50 each, 1,450,000 non-cumulative preference shares of US$0.01 each and 1 non-cumulative preference share of £0.01.
The percentage of the nominal value of our total issued share capital paid up at 31 December 2012 represented by the ordinary shares of US$0.50 each, non-cumulative preference shares of US$0.01 each and the non-cumulative preference share of £0.01 was approximately 99.9998%, 0.0002%, and 0%, respectively.
Rights and obligations attaching to shares
The rights and obligations attaching to each class of shares in our share capital are set out in our Articles of Association subject to certain rights and obligations that attach to each class of preference share as determined by the Board prior to allotment of the relevant preference shares. Set out below is a summary of the rights and obligations attaching to each class of shares with respect to voting, dividends, capital and, in the case of the preference shares, redemption.
To be registered, a transfer of shares must be in relation to shares which are fully paid up and on which we have no lien and to one class of shares denominated in the same currency. The transfer must be in favour of a single transferee or no more than four joint transferees and it must be duly stamped (if required). The transfer must be delivered to our registered office or our Registrars accompanied by the certificate to which it relates or such other evidence that proves the title of the transferor.
If a shareholder or any person appearing to be interested in our shares has been sent a notice under section 793 of the Companies Act 2006 (which confers upon public companies the power to require information from any person whom we know or have reasonable cause to believe to be interested in the shares) and has failed in relation to any shares (the ‘default shares’) to supply the information requested within the period set out in the notice, then the member, unless the Board otherwise determines, is not entitled to be present at or to vote the default shares at any general meeting or to exercise any other right conferred by being a shareholder. If the default shares represent at least 0.25% in nominal value of the issued shares of that class, unless the Board otherwise determines, any dividend shall be withheld by the Company without interest, no election may be made for any scrip dividend alternative, and no transfer of any shares held by the member will be registered except in limited circumstances.
Ordinary shares
Subject to the Companies Act 2006 and the Articles of Association, HSBC Holdings may, by ordinary resolution, declare dividends to be paid to the holders of ordinary shares, though no dividend shall exceed the amount recommended by the Board. The Board may pay interim dividends as appears to the Board to be justified by the profits available for distribution. All dividends shall be apportioned and paid proportionately to the percentage of the nominal amount paid up on the shares during any portion or portions of the period in respect of which the dividend is paid, but if any share is issued on terms providing that it shall rank for dividend as from a particular date, it shall rank for dividend accordingly. Subject to the Articles of Association, the Board may, with the prior authority of an ordinary resolution passed by the shareholders and subject to such terms and conditions as the Board may determine, offer to any holders of ordinary shares the right to elect to receive ordinary shares of the same or a different currency, credited as fully paid, instead of cash in any currency in respect of the whole (or some part, to be determined by the Board) of any dividend specified by the ordinary resolution. At the 2012 Annual General Meeting shareholders gave authority to the Directors to offer a scrip dividend alternative until the earlier of the conclusion of the Annual General Meeting in 2017 or 24 May 2017.
Preference shares
There are three classes of preference shares in the share capital of HSBC Holdings, non-cumulative preference shares of US$0.01 each (the ‘Dollar Preference Shares’), non-cumulative preference shares of £0.01 each (the
340
Table of Contents
HSBC HOLDINGS PLC
Report of the Directors: Corporate Governance(continued)
‘Sterling Preference Shares’) and non-cumulative preference shares of €0.01 (the ‘Euro Preference Shares’). The Dollar Preference Shares in issue are Series A Dollar Preference Shares and the Sterling Preference Share in issue is a Series A Sterling Preference Share. There are no Euro Preference Shares in issue.
Dollar Preference Shares
Holders of the Dollar Preference Shares are only entitled to attend and vote at general meetings if any dividend payable on the relevant preference shares in respect of such period as the Board shall determine prior to allotment thereof is not paid in full or in such other circumstances, and upon and subject to such terms, as the Board may determine prior to allotment of the relevant preference shares. In the case of the Dollar Preference Shares in issue at 4 March 2013 the relevant period determined by the Board is four consecutive dividend payment dates. Whenever holders of the Dollar Preference Shares are entitled to vote on a resolution at a general meeting, on a show of hands every such holder who is present in person or by proxy shall have one vote and on a poll every such holder who is present in person or by proxy shall have one vote per preference share held by him or her or such number of votes per share as the Board shall determine prior to allotment of such share.
Subject to the Articles of Association, holders of the Dollar Preference Shares have the right to a non-cumulative preferential dividend at such rate, on such dates and on such other terms and conditions as may be determined by the Board prior to allotment thereof in priority to the payment of any dividend to the holders of ordinary shares and any other class of shares of HSBC Holdings in issue (other than (i) the other preference shares in issue and any other shares expressed to rank pari passu therewith as regards income; and (ii) any shares which by their terms rank in priority to the relevant preference shares as regards income). A dividend of US$62 per annum is payable on each Dollar Preference Share in issue at 4 March 2013. The dividend is paid at the rate of US$15.50 per quarter at the sole and absolute discretion of the Board.
A dividend will not be declared or paid on the Dollar Preference Shares if payment of the dividend would cause HSBC Holdings not to meet the applicable capital adequacy requirements of the FSA or the profit of HSBC Holdings available for distribution as dividends is not sufficient to enable HSBC Holdings to pay in full both dividends on the relevant preference shares and dividends on any other shares that are scheduled to be paid on the same date and that have an equal right to dividends. Dividends will not be declared or paid on any class of shares of HSBC Holdings ranking lower in the right to dividends than the Dollar Preference Shares nor redeem nor purchase in any manner any of its other shares ranking equal with or lower than the Dollar Preference Shares unless it has paid in full, or set aside an amount to provide for payment in full, the dividends on the Dollar Preference Shares for the then-current dividend period.
The Dollar Preference Shares carry no rights to participate in the profits or assets of HSBC Holdings other than as set out in the Articles of Association and subject to the Companies Act 2006, do not confer any right to participate in any offer or invitation by way of rights or otherwise to subscribe for additional shares in HSBC Holdings, do not confer any right of conversion and do not confer any right to participate in any issue of bonus shares or shares issued by way of capitalisation of reserves.
Subject to the relevant insolvency laws and the Articles of Association of HSBC Holdings, holders of the Dollar Preference Shares have the right in a winding up of HSBC Holdings to receive out of the assets of HSBC Holdings available for distribution to its shareholders, in priority to any payment to the holders of the ordinary shares and any other class of shares of HSBC Holdings in issue (other than (i) the other relevant preference shares and any other shares expressed to rank pari passu therewith as regards repayment of capital; and (ii) any shares which by their terms rank in priority to the relevant preference shares as regards repayment of capital), a sum equal to any unpaid dividend on the Dollar Preference Shares which is payable as a dividend in accordance with or pursuant to the Articles of Association and the amount paid up or credited as paid up on the Dollar Preference Shares together with such premium (if any) as may be determined by the Board prior to allotment thereof. In the case of the Dollar Preference Shares in issue at 4 March 2013, the premium is US$999.99 per Dollar Preference Share.
The Dollar Preference Shares may be redeemed in accordance with the Articles of Association and the terms on which Dollar Preference Shares were issued and allotted. In the case of the Dollar Preference Shares in issue at 4 March 2013, HSBC Holdings may redeem such shares in whole at any time on or after 16 December 2010, subject to the prior consent of the FSA.
341
Table of Contents
HSBC HOLDINGS PLC
Report of the Directors: Corporate Governance(continued)
Sterling Preference Shares
The Sterling Preference Shares carry the same rights and obligations under the Articles of Association as the Dollar Preference Shares, save in respect of certain rights and obligations that attach to Sterling Preference Shares to be determined by the Board prior to allotment of the relevant preference shares and the timing and payment of proceeds from the redemption of each class of share. The one Sterling Preference Share in issue at 4 March 2013 carries the same rights and obligations as the Dollar Preference Shares in issue at 4 March 2013 to the extent described in the section above save as follows:
| 1. | the holder of the Sterling Preference Share is not entitled to attend or vote at general meetings; |
| 2. | the Sterling Preference Share may be redeemed in whole on any date as may be determined by the Board; and |
| 3. | the exceptions to the circumstances in which a dividend will not be declared or paid do not apply. |
A dividend of £0.04 per annum is payable on the Sterling Preference Share in issue at 4 March 2013. The dividend is paid at the rate of £0.01 per quarter at the sole and absolute discretion of the Board.
Euro Preference Shares
The Euro Preference Shares carry the same rights and obligations under the Articles of Association as the Dollar Preference Shares, save in respect of certain rights and obligations that attach to Euro Preference Shares which are to be determined by the Board prior to allotment of the relevant preference shares and the timing and payment of proceeds from the redemption of each class of share.
Share capital during 2012
The following events occurred during the year in relation to the ordinary share capital of HSBC Holdings:
Scrip dividends
| HSBC Holdings ordinary shares | Market value | |||||||||||||||||
| Issued in lieu of | In | Number | US$ | £ | ||||||||||||||
Third interim dividend for 2011 | January 2012 | 96,994,187 | 7.4224 | 4.7461 | ||||||||||||||
Fourth interim dividend for 2011 | May 2012 | 28,357,393 | 9.1170 | 5.7466 | ||||||||||||||
First interim dividend for 2012 | July 2012 | 91,127,385 | 8.2065 | 5.2022 | ||||||||||||||
Second interim dividend for 2012 | October 2012 | 87,820,228 | 8.9127 | 5.6560 | ||||||||||||||
Third interim dividend for 2012 | December 2012 | 65,036,059 | 9.8255 | 6.1138 | ||||||||||||||
All-Employee share plans
| Number | Exercise price | |||||||||||||||||||
| from | to | |||||||||||||||||||
HSBC Holdings savings-related share option plans | ||||||||||||||||||||
HSBC ordinary shares issued in £ | 37,422,697 | £ | 3.3116 | 6.1760 | ||||||||||||||||
HSBC ordinary shares issued in HK$ | 21,684,534 | HK$ | 37.8797 | 63.9864 | ||||||||||||||||
HSBC ordinary shares issued in US$ | 3,440,522 | US$ | 4.8876 | 8.7225 | ||||||||||||||||
HSBC ordinary shares issued in € | 1,407,390 | € | 3.6361 | 6.0657 | ||||||||||||||||
Options over HSBC ordinary shares lapsed | 21,626,648 | |||||||||||||||||||
Options over HSBC ordinary shares granted in response to approximately 53,000 applications from HSBC employees in over 60 countries and territories on 24 April 2012 | 44,868,386 | |||||||||||||||||||
Plan d’Epargne Entreprise | ||||||||||||||||||||
HSBC ordinary shares issued for the benefit of non-UK resident employees of HSBC France and its subsidiaries | 2,274,523 | € | 5.695 | |||||||||||||||||
Discretionary share incentive plans
| HSBC ordinary | Exercise price | Options | ||||||||||
| shares issued | (£) | lapsed | ||||||||||
Options exercised under: | ||||||||||||
The HSBC Holdings Group Share Option Plan | 1,606,032 | 6.0216 | 32,018,464 | |||||||||
342
Table of Contents
HSBC HOLDINGS PLC
Report of the Directors: Corporate Governance(continued)
Authority to allot shares
At the Annual General Meeting in 2012, shareholders renewed the general authority for the Directors to allot new shares. The general authority is to allot up to 3,624,050,000 ordinary shares, 15,000,000 non-cumulative preference shares of £0.01 each, 15,000,000 non-cumulative preference shares of US$0.01 each and 15,000,000 non-cumulative preference shares of €0.01 each. Within this, the Directors have authority to allot up to a maximum of 906,012,000 ordinary shares wholly for cash to persons other than existing shareholders.
Other than as described above, the Directors did not allot any shares during 2012.
Treasury shares
In accordance with the terms of a waiver granted by the Hong Kong Stock Exchange on 19 December 2005, HSBC Holdings will comply with the applicable law and regulation in the UK in relation to the holding of any shares in treasury and with the conditions of the waiver in connection with any shares it may hold in treasury. No shares are currently held in treasury.
Pursuant to the requirements of the UK Listing Rules and according to the register of Directors’ interests maintained by HSBC Holdings pursuant to section 352 of the Securities and Futures Ordinance of Hong Kong, the Directors of HSBC Holdings at 31 December 2012 had the following interests, all beneficial unless otherwise stated, in the shares and loan capital of HSBC Holdings and its associated corporations:
Directors’ interests – shares and loan capital
| At 31 December 2012 | ||||||||||||||||||||||||
At 1 January 2012 | Beneficial owner | Child under 18 or spouse | Jointly with another person | Trustee | Total interests1 | |||||||||||||||||||
HSBC Holdings ordinary shares | ||||||||||||||||||||||||
J D Coombe | 21,139 | 22,387 | – | – | – | 22,387 | ||||||||||||||||||
R A Fairhead | 21,300 | – | – | 21,300 | – | 21,300 | ||||||||||||||||||
D J Flint | 272,861 | 313,326 | – | – | 37,162 | 2 | 350,488 | |||||||||||||||||
S T Gulliver | 2,731,100 | 2,553,592 | 176,885 | – | – | 2,730,477 | ||||||||||||||||||
J W J Hughes-Hallett | 46,952 | – | – | – | – | – | ||||||||||||||||||
W S H Laidlaw | 31,872 | 32,252 | – | – | 1,416 | 2 | 33,668 | |||||||||||||||||
J P Lipsky3 | – | 15,000 | – | – | – | 15,000 | ||||||||||||||||||
I J Mackay | 133,648 | 118,813 | – | – | – | 118,813 | ||||||||||||||||||
Sir Simon Robertson | 176,709 | 9,486 | – | – | 167,750 | 2 | 177,236 | |||||||||||||||||
J L Thornton4 | 10,250 | – | 10,250 | – | – | 10,250 | ||||||||||||||||||
| US$000 | US$000 | US$000 | US$000 | US$000 | US$000 | |||||||||||||||||||
HSBC Holdings 6.5% Subordinated Notes 2036 | ||||||||||||||||||||||||
L M L Cha | 300 | 300 | – | – | – | 300 | ||||||||||||||||||
| RMBm | RMBm | RMBm | RMBm | RMBm | RMBm | |||||||||||||||||||
HSBC Bank 2.875% Notes 2015 | ||||||||||||||||||||||||
J Faber5 | – | 5.1 | – | – | – | 5.1 | ||||||||||||||||||
| 1 | Details of executive Directors’ other interests in HSBC Holdings ordinary shares arising from the HSBC Holdings savings-related share option plans, the HSBC Share Plan and the HSBC Share Plan 2011 are set out in the Directors’ Remuneration Report on page 363. At 31 December 2012, the aggregate interests under the Securities and Futures Ordinance of Hong Kong in HSBC Holdings ordinary shares, including interests arising through employee share plans were: D J Flint – 566,423; S T Gulliver – 5,178,992 and I J Mackay – 536,205. Each Director’s total interests represents less than 0.03% of the shares in issue. |
| 2 | Non-beneficial. |
| 3 | Interest in 3,000 listed American Depositary Shares (‘ADS’), which are categorised as equity derivatives under Part XV of the Securities and Futures Ordinance of Hong Kong. Each ADS represents five HSBC Holdings ordinary shares. |
| 4 | Interest of spouse in 2,050 listed ADS. |
| 5 | Non-beneficial interest in renminbi (RMB) 1.2m 2.875% Notes 2015. |
343
Table of Contents
HSBC HOLDINGS PLC
Report of the Directors: Corporate Governance(continued)
S T Gulliver ceased to have an interest as beneficial owner in one share of €5 in HSBC France (representing less than 0.01 per cent of the shares in issue), following his resignation as a director of that company on 22 November 2012. S T Gulliver had waived his rights to receive dividends on the share and had undertaken to transfer the share to HSBC on ceasing to be a director of HSBC France.
No Directors held any short position as defined in the Securities and Futures Ordinance of Hong Kong in the shares and loan capital of HSBC Holdings and its associated corporations. Save as stated above, none of the Directors had an interest in any shares or debentures of HSBC Holdings or any associated corporation at the beginning or at the end of the year, and none of the Directors or members of their immediate families were awarded or exercised any right to subscribe for any shares or debentures in any HSBC corporation during the year. Since the end of the year, the aggregate interests of the following Director has increased by the number of HSBC Holdings ordinary shares shown against his name:
HSBC Holdings ordinary shares | ||
| D J Flint (beneficial owner) | 351 |
| 1 | The acquisition of shares in the HSBC Holdings UK Share Incentive Plan through regular monthly contributions. |
Since the end of the year, the aggregate interests of the following Director have decreased by the number of debentures shown against his name.
| HSBC Capital Funding (Euro 2) L.P. 5.3687% Preferred Securities 2014 | EUR000 | |
| R Fassbind (beneficial owner) | 500 |
There have been no other changes in the share and loan capital interests of the Directors from 31 December 2012 to the date of this Report. Any subsequent changes up to the last practicable date before the publication of theNotice of Annual General Meeting will be set out in the notes to that Notice.
At 31 December 2012, non-executive Directors and senior management (being executive Directors and Group Managing Directors of HSBC Holdings) held, in aggregate, beneficial interests in 14,450,028 HSBC Holdings ordinary shares (0.08% of the issued ordinary shares).
At 31 December 2012, executive Directors and senior management held, in aggregate, options to subscribe for 357,509 of HSBC Holdings ordinary shares under the HSBC Holdings savings-related share option plans and HSBC Holdings Group Share Option Plan. These options are exercisable between 2012 and 2016 at prices ranging from £3.3116 to £7.2181 per ordinary share.
HSBC has signed up to the Government’s Prompt Payment Code (further information on, and copies of, the Code can be obtained by visiting www.promptpaymentcode.org.uk).
Our policy is to settle terms of payment with our suppliers when agreeing the terms of each transaction, to ensure that those suppliers are made aware of the terms of payment and to abide by the terms of payment.
The amount due to trade creditors at 31 December 2012 represented 39 days’ average daily purchases of goods and services received from such creditors, calculated in accordance with the Companies Act 2006, as amended by Statutory Instrument 2008 No. 410. The average amount due to trade creditors during 2012 represented 28 days’ average daily purchases of goods and services received from such creditors.
Dividends for 2012
First, second and third interim dividends for 2012, each of US$0.09 per ordinary share, were paid on 5 July 2012, 4 October 2012 and 12 December 2012 respectively. Note 10 on the Financial Statements gives more information on the dividends declared in 2012. On 4 March 2013, the Directors declared a fourth interim dividend for 2012 of US$0.18 per ordinary share in lieu of a final dividend, which will be payable on 8 May 2013 in cash in US dollars, or in sterling or Hong Kong dollars at exchange rates to be determined on 29 April 2013, with a scrip dividend alternative. As the fourth interim dividend for 2012 was declared after 31 December 2012 it has not been included
344
Table of Contents
HSBC HOLDINGS PLC
Report of the Directors: Corporate Governance(continued)
in the balance sheet of HSBC as a debt. The reserves available for distribution at 31 December 2012 were US$38,175m.
A quarterly dividend of US$15.50 per 6.20% non-cumulative US Dollar Preference Share, Series A (‘Series A Dollar Preference Share’), (equivalent to a dividend of US$0.3875 per Series A American Depositary Share, each of which represents one-fortieth of a Series A Dollar Preference Share), was paid on 15 March, 15 June, 17 September and 17 December 2012.
Dividends for 2013
The proposed timetable for interim dividends in respect of 2013 on the ordinary shares is set out in the Shareholder Information section on page 516.
Quarterly dividends of US$15.50 per Series A Dollar Preference Share (equivalent to a dividend of US$0.3875 per Series A American Depositary Share, each of which represents one-fortieth of a Series A Dollar Preference Share) and £0.01 per Series A Sterling Preference Share were declared on 7 February 2013 for payment on 15 March 2013.
Communication with shareholders
Communication with shareholders is given high priority. The Board has adopted a shareholder communication policy which is available on www.hsbc.com. Extensive information about our activities is provided to shareholders in theAnnual Report and Accounts, the Annual Review and theInterim Report which are available on www.hsbc.com. There is regular dialogue with institutional investors and enquiries from individuals on matters relating to their shareholdings and our business are welcomed and are dealt with in an informative and timely manner. All shareholders are encouraged to attend the Annual General Meeting or the informal meeting of shareholders held in Hong Kong to discuss our progress. Shareholders may send enquiries to the Board in writing to the Group Company Secretary, HSBC Holdings plc, 8 Canada Square, London E14 5HQ or by sending an email to shareholderquestions@hsbc.com.
Shareholders may require the Directors to call a general meeting, other than an annual general meeting as provided by the UK Companies Act 2006. Requests to call a general meeting may be made by members representing at least 5% of the paid-up capital of the Company as carries the right of voting at general meetings of the Company (excluding any paid-up capital held as treasury shares). A request must state the general nature of the business to be dealt with at the meeting and may include the text of a resolution that may properly be moved and is intended to be moved at the meeting. A resolution may properly be moved at a meeting unless it would, if passed, be ineffective (whether by reason of inconsistency with any enactment or the Company’s constitution or otherwise); it is defamatory of any person; or it is frivolous or vexatious. A request may be in hard copy form or in electronic form and must be authenticated by the person or persons making it. A request may be made in writing to the postal address referred to in the paragraph above or by sending an email to shareholderquestions@hsbc.com. At any meeting convened on such request no business shall be transacted except that stated by the requisition or proposed by the Board.
Notifiable interests in share capital
At 31 December 2012, we had received the following disclosures (which have not been subsequently changed) of major holdings of voting rights pursuant to the requirements of Rule 5 of the FSA Disclosure Rules and Transparency Rules:
| • | Legal & General Group Plc gave notice on 9 March 2010 that it had a direct interest on 8 March 2010 in 696,851,431 HSBC Holdings ordinary shares, representing 3.99% of the total voting rights at that date; and |
| • | BlackRock, Inc. gave notice on 9 December 2009 that on 7 December 2009 it had the following: an indirect interest in HSBC Holdings ordinary shares of 1,142,439,457; qualifying financial instruments with 705,100 voting rights that may be acquired if the instruments are exercised or converted; and financial instruments with similar economic effect to qualifying financial instruments which refer to 234,880 voting rights, each representing 6.56%, 0.0041% and 0.0013% respectively, of the total voting rights at that date. |
At 31 December 2012, according to the register maintained by HSBC Holdings pursuant to section 336 of the Securities and Futures Ordinance of Hong Kong:
| • | JPMorgan Chase & Co. gave notice on 7 November 2012 that on 30 October 2012 it had the following interests in HSBC Holdings ordinary shares: a long position of 1,261,592,952 shares; a short position of 71,252,702 |
345
Table of Contents
HSBC HOLDINGS PLC
Report of the Directors: Corporate Governance(continued)
shares; and a lending pool of 1,007,026,189 shares, each representing 6.85%, 0.39% and 5.47%, respectively, of the ordinary shares in issue at that date. Since 31 December 2012 and following interim notifications on 14, 17, 23 January and 13 February 2013, JPMorgan Chase & Co. gave notice on 15 February 2013 that on 12 February 2013 it had the following interests in HSBC Holdings ordinary shares: a long position of 1,294,366,810 shares; a short position of 64,591,997 shares; and a lending pool of 1,017,759,703 shares each representing 7.00%, 0.35% and 5.51% respectively, of the ordinary shares in issue at that date.
| • | BlackRock, Inc. gave notice on 10 November 2012 that on 7 November 2012 it had the following interests in HSBC Holdings ordinary shares: a long position of 1,103,721,816 shares and a short position of 35,922,568 shares, each representing 5.99% and 0.19%, respectively, of the ordinary shares in issue at that date. Since 31 December 2012 and following interim notifications on 3 and 4 January 2013, BlackRock, Inc. gave notice on 8 January 2013 that on 3 January 2013 it had the following interests in HSBC Holdings ordinary shares: a long position of 1,110,172,768 shares and a short position of 35,234,325 shares, each representing 6.00% and 0.19%, respectively, of the ordinary shares in issue at that date. |
In compliance with the Rules Governing the Listing of Securities on The Stock Exchange of Hong Kong Limited at least 25% of the total issued share capital has been held by the public at all times during 2012 and up to the date of this Report.
Dealings in HSBC Holdings shares
Except for dealings as intermediaries by HSBC Bank and The Hongkong and Shanghai Banking Corporation, which are members of a European Economic Area exchange, neither we nor any of our subsidiaries have purchased, sold or redeemed any of our listed securities during the year ended 31 December 2012.
346
Table of Contents
HSBC HOLDINGS PLC
Directors’ Remuneration Report(continued)
Report of the Group Remuneration Committee
| Page | App1 | |||||||
Summary letter from the Group Remuneration Committee Chairman | 347 | |||||||
| 351 | ||||||||
| 354 | ||||||||
| 361 | ||||||||
| 361 | ||||||||
| 362 | ||||||||
| 363 | ||||||||
| 363 | ||||||||
| 365 | ||||||||
| 366 | ||||||||
1 Appendix to Directors’ Remuneration Report |
| |||||||
Summary letter from the Group Remuneration Committee Chairman
Dear Shareholder
This report covers the reporting period from 1 January 2012 to 31 December 2012 and provides details of the Group Remuneration Committee (‘the Committee’) and remuneration policy of the Company.
This report has been prepared by the Committee with reference to the draft regulations put forward by the UK Government Department of Business, Innovation and Skills regarding the requirements for the content of a Directors’ Remuneration Report. The regulations will apply to all UK companies listed on a major stock exchange with financial years ending on or after October 2013, and this report is therefore prepared using the new standards on a voluntary basis, to meet best practice in reporting.
In line with this draft legislation, the report is provided in three sections: the summary of the report, a section outlining HSBC’s forward-looking remuneration policy and a section setting out remuneration outcomes for 2012. Additional disclosures as required under Schedule 8 of the Large and Medium-sized Companies and Groups (Accounts and Reports) Regulations 2008 and other disclosure requirements are provided at the end of the report in the appendix.
Remuneration strategy
The quality and commitment of our human capital is fundamental to our success and accordingly the Board aims to attract, retain and motivate the very best people. As trust and relationships are vital in
our business, our goal is to recruit those who are committed to maintaining a long-term career with the organisation.
HSBC’s reward strategy supports this objective through balancing both short-term and sustainable performance. Our reward strategy aims to reward success, not failure, and be properly aligned with our risk framework and risk outcomes.
In order to ensure alignment between remuneration and our business strategy, individual remuneration is determined through assessment of performance delivered against both annual and long-term objectives summarised in performance scorecards as well as adherence to the HSBC Values of being ‘open, connected and dependable’ and acting with ‘courageous integrity’. Altogether, performance is judged, not only on what is achieved over the short and long term, but also on how it is achieved, as the latter contributes to the sustainability of the organisation.
The financial and non-financial measures incorporated in the annual and long-term scorecards are carefully considered to ensure alignment with the long-term strategy of the Group.
Structure of remuneration
In order to simplify remuneration, elements are limited to the following:
| • | fixed pay; |
| • | benefits; |
| • | annual incentive; and |
| • | the Group Performance Share Plan. |
The Group Performance Share Plan (‘GPSP’) was developed to incentivise senior executives to deliver sustainable long-term business performance. A key feature of the GPSP is that participants are required to hold the awards, once they have vested, until retirement, thereby enhancing the alignment of interest between the senior executives of the Group and shareholders. Further details are given on page 351.
Executive Directors, Group Managing Directors and Group General Managers participate in both performance-related plans, namely the annual incentive and the GPSP. Other employees across the Group are eligible to participate in annual incentive arrangements. Both the annual incentive and long-term incentive awards are funded from a single annual variable pay pool from which individual awards are considered. Funding of the Group’s annual variable pay pool is determined in the context of Group profitability, capital strength, and shareholder returns. This approach ensures
347
Table of Contents
HSBC HOLDINGS PLC
Directors’ Remuneration Report(continued)
that performance related awards for any global business, global function, geography or level of staff are considered in a holistic fashion.
Overall performance summary of 2012
During 2012, management continued to execute the Board endorsed strategy to simplify, restructure and grow the Group. The Group announced 26 disposals or closures exiting non-strategic markets and selling businesses and non-core investments. The Group also recorded an additional US$2.0bn in sustainable cost savings, which takes total annualised savings to US$3.6bn. This surpasses the cumulative target of US$2.5bn to US$3.5bn on sustainable savings since 2011. A focus on positioning the business for growth delivered underlying revenue growth in most priority markets. The growth in these markets was a factor in generating a record reported profit before tax in CMB as HSBC maintained its position as the world’s largest global trade finance bank, as reported in theOliver Wyman Global Transaction Banking Survey 2012.
The following summarises the Group’s 2012 financial performance:
| • | reported profit before tax fell compared with 2011, but rose on an underlying basis; |
| • | underlying revenue grew by 7%, led by GB&M which recorded growth in the majority of its businesses, most notably in Credit and Rates, as spreads tightened and investor sentiment improved in Europe. CMB also recorded revenue growth as customer loans and advances increased in all regions, with over half of this growth coming from the faster-growing regions of Hong Kong, Rest of Asia-Pacific and Latin America, driven by higher trade-related lending. In Europe, lending balances increased, notably in the UK, despite muted demand for credit. In addition, RBWM experienced revenue growth in all faster-growing regions, in particular Hong Kong and Latin America; |
| • | loan impairment charges and other credit risk provisions reduced significantly, notably in North America, primarily reflecting the continued decline in lending balances and lower delinquency rates in CML; |
| • | notwithstanding the sustainable savings noted above, the cost efficiency ratio increased from 57.5% in 2011 to 62.8% in 2012 and remained outside the Group’s target range. This was primarily due to fines and penalties paid as part of the settlement of the investigations into our past inadequate compliance with anti-money laundering and sanctions laws, |
additional provisions in respect of UK customer redress programmes and a credit in 2011 relating to defined benefit pension obligations in the UK which did not recur. The increase also reflected inflationary pressures on wages and salaries in certain of our Latin American and Asian markets, investment in strategic initiatives, including certain business expansion projects, enhanced processes and technology capabilities, and increased investment in regulatory and compliance infrastructure, primarily in the US; |
| • | we maintained a strong balance sheet, with a ratio of customer advances to customer accounts of 74.4%; |
| • | return on average ordinary shareholders’ equity was 8.4%, down from 10.9% in 2011, primarily reflecting adverse movements in the fair value of our own debt attributable to credit spreads, a higher tax charge and higher average shareholders’ equity; |
| • | dividends in respect of 2012 to our shareholders were increased from US$0.41 per ordinary share in 2011 to US$0.45 per ordinary share; and |
| • | core tier 1 capital increased during 2012 through capital generation and the reduction of risk-weighted assets following business disposals. |
Group variable pay pool
(Unaudited)
The 2012 Group variable pay pool was considered in the context of the Group’s underlying profit before tax. This calculation of profit excludes movements in the fair value of own debt attributable to credit spread and the impact of acquisitions and disposals and includes the costs of the US regulatory and law enforcement fines and penalties and other items of redress arising in 2012. For the purposes of considering the variable pay pool the normal profits from the disposed businesses up to their actual disposal are included in the calculation.
Specific actions taken in respect of 2012
| • | In addition to the cost of fines and penalties and redress being taken into account in the initial determination of the variable pay pool through their impact on underlying profits, a further reduction was made to the overall 2012 pool by the Committee to reflect the reputational damage incurred from the US legal and regulatory fines and penalties and to shift a higher proportion of the impact to the variable pay pool. |
348
Table of Contents
HSBC HOLDINGS PLC
Directors’ Remuneration Report(continued)
| • | Additionally, for annual incentive awards in respect of 2012 for executive Directors, Group Managing Directors and Group General Managers, the deferred element of the 2012 incentive will be deferred for an extended period of five years and will vest subject to satisfactory completion of the Deferred Prosecution Agreements and subject to the terms of the GPSP. |
| • | The Committee has further exercised its discretion and reduced the performance outcome of the 2012 long-term scorecard. For further details see page 357. |
| • | Clawback has been exercised by the Committee during 2012 and 2013 principally in respect of the US regulatory and law enforcement fines and penalties. |
| Group | Global Banking and Markets | |||||||||||||||||||||
| 2012 | 2011 | 2012 | 2011 | |||||||||||||||||||
| US$m | US$m | US$m | US$m | |||||||||||||||||||
Total variable pay pool | 3,689 | 4,223 | 1,266 | 1,210 | ||||||||||||||||||
| % | % | % | % | |||||||||||||||||||
Variable compensation incentive pool as a percentage of underlying pre-tax profit (pre-variable pay)1 | 17 | 18 | 13 | 14 | ||||||||||||||||||
Proportion of incentive that is deferred | 17 | 16 | 28 | 27 | ||||||||||||||||||
| 1 | The 2012 Group pre-tax profit pre-variable pay calculation is described on page 348. The 2011 Group pre-tax profit pre-variable pay includes the add-back of restructuring costs incurred during the year, and the adjustment for movements in the fair value of own debt attributable to credit spread. |
Change in key metrics
(Unaudited)
The table and charts below show the percentage change in profit, dividends and overall expenditure on staff pay.
Underlying profit % | Dividend % | Overall expenditure | ||||||||||
Change: | ||||||||||||
2012 from 2011 | +18 | +10 | –3 | |||||||||
On a pro forma basis, attributable profits (excluding movements in the fair value of own debt and before variable pay distributions) are allocated in the proportions shown in the charts below.
Pro forma post-tax profits allocation
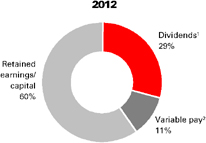 | 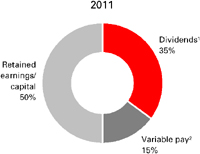 |
| 1 | Inclusive of dividends to holders of other equity instruments and net of scrip issuance. Dividends per ordinary share declared in respect of 2012 were US$0.45, an increase of 10% compared with 2011. |
| 2 | Total variable pay pool net of tax and portion to be delivered by the award of HSBC shares. |
Role, membership and activities of the Committee
Within the authority delegated by the Board, the Committee is responsible for approving the Group’s remuneration policy. The Committee also determines the remuneration of Directors, senior employees, employees in positions of significant influence and employees whose activities have or could have an impact on our risk profile and, in doing so, takes into
account the pay and conditions across the Group. No Directors are involved in deciding their own remuneration.
The members of the Committee during 2012 were J L Thornton (Chairman), J D Coombe, W S H Laidlaw and G Morgan (retired as a Director on 25 May 2012). R Fassbind was appointed a member of the Committee on 1 March 2013.
349
Table of Contents
HSBC HOLDINGS PLC
Directors’ Remuneration Report(continued)
There were eight meetings of the Committee during 2012. The table on page 329 gives details of Directors’ attendance at these meetings. The Committee has decided to not use external advisers except in exceptional circumstances. During 2012, Freshfields Bruckhaus Deringer were engaged to provide legal advice in connection with the clawback process. During the year, the Group Chief Executive provided regular briefings to the Committee and the Committee received advice from the Group Managing Director, Group Head of Human Resources and Corporate Sustainability,
A Almeida, the Group Head of Performance and Reward, T Roberts and the Group Chief Risk Officer, M M Moses, all of whom provided advice as part of their executive role as employees of HSBC. The Committee also received advice and feedback from the Group Risk Committee on risk-related matters relevant to remuneration and the alignment of remuneration with risk appetite.

J L Thornton
Chairman of the Group Remuneration Committee
4 March 2013
350
Table of Contents
HSBC HOLDINGS PLC
Directors’ Remuneration Report(continued)
Summary of remuneration policy
The following remuneration policy for Directors is subject to a binding shareholder vote every three
years commencing with the 2013 financial year. The section on service contracts and exit payments is also subject to the binding vote and can be found on page 359.
| Purpose and link to strategy | Operation and planned changes to policy | Opportunity and performance metrics | ||
Fixed pay Takes account of experience and personal contribution to the individual’s role. | No fixed pay increases are proposed for executive Directors in 2013. | n/a | ||
Benefits Takes account of local market practice. | Benefits include the provision of medical insurance, other insurance cover, tax return preparation and travel assistance. No changes were made to HSBC’s benefits policy during the year. | n/a | ||
Annual incentive1 Drives and rewards performance against annual financial and | Awards are delivered in the form of cash and shares with the structure and deferral meeting the FSA Remuneration Code requirements.
The total vesting period of deferred awards will be no less than 3 years as mandated under the FSA Remuneration Code. Where the total vesting period is three years the share awards will be subject to a six month retention period upon vesting. | Maximum incentive is three times fixed pay.
Performance is measured against an annual scorecard, based on a mixture of financial and non-financial measures. The scorecards vary by individual. Further detail on each scorecard for the most recent awards can be found on page 355. The policy for determining awards is set out on page 352. | ||
Group Performance Share Plan (‘GPSP’)1 Incentivises sustainable long-term performance and alignment with shareholder interests. | Award levels are determined by considering performance up to the date of grant against enduring performance measures set out in the long-term performance scorecard.
The award is subject to a five-year vesting period during which the Committee has the authority to claw back all or part of the award. See page 353 for more details on clawback.
On vesting, the shares (net of tax) must be retained until the participant retires. | Maximum award is six times fixed pay.
The long-term scorecard against which performance will be assessed in 2013 is detailed below. The 2013 scorecard remains consistent with 2012. Overall performance is to be judged on performance outcomes and adherence to HSBC Values being a gating mechanism. See page 356 for further details. | ||
| Pension | No pension changes proposed for 2013. | n/a | ||
| Non-executive Director | Non-executive Directors receive only fees and are not eligible to receive benefits, pension or any annual or long-term incentives.
The current fee, which was approved by shareholders in 2011, is £95,000 per annum. A fee of £45,000 per annum is payable to the senior independent non-executive Director. In addition, non-executive Directors received the following fees for service on Board Committees:
• Group Audit, Group Risk, Group Remuneration and Financial System Vulnerabilities Committees: – Chairman: £50,000 – Member: £30,000
• Nomination and Corporate Sustainability Committees: – Chairman: £40,000 – Member: £25,000 | n/a | ||
| 1 | This approach applies to all executive Directors with the exception of the Group Chairman, D J Flint, who, from 2011, is not eligible for an annual incentive and is not expected to be granted awards under the GPSP other than in exceptional circumstances. |
351
Table of Contents
HSBC HOLDINGS PLC
Directors’ Remuneration Report(continued)
Long-term Incentive Plan – Group Performance Share Plan 2013 long-term scorecard
| Measure | Long-term target range | Weighting | ||||||||
Return on equity | 12% – 15% | 15% | ||||||||
Cost efficiency ratio | 48% – 52% | 15% | ||||||||
Capital strength | >10% | 15% | ||||||||
Progressive dividend payout | 40% – 60% | 15% | ||||||||
Strategy | Judgement | 20% | ||||||||
Brand equity |
| Top 3 rating and improve US$bn value |
| 5% | ||||||
Compliance and reputation | Judgement | 10% | ||||||||
People | Judgement | 5% | ||||||||
| 100% | ||||||||||
Material factors taken into account when setting pay policy
The Committee takes into account a variety of factors when determining the remuneration policy for Directors. A summary of these factors is provided below.
Internal factors
Funding
HSBC considers pay across the Group when determining remuneration levels for its executive Directors. Eligibility for the GPSP is restricted to executive Directors, Group Managing Directors and Group General Managers. Other employees across the Group are also eligible to participate in annual incentive arrangements. Both the annual incentive and long-term incentive awards are funded from a single annual variable pay pool from which individual awards are considered.
The dilution limits set out in the HSBC share plans comply with the Association of British Insurers’ guidelines. Prior to 2012, all equity-settled awards of Performance Shares and Restricted Shares vesting under the HSBC Share Plans were satisfied by the transfer of existing shares held under a trust. To create additional core tier 1 capital and retain funds within HSBC, Restricted Share vestings since 2012 have been satisfied by a mixture of existing shares from the trust and new issue shares.
External factors
Regulation
There is still a wide divergence in how regulations operate globally and this presents significant challenges to HSBC, which operates in 81 countries and territories worldwide. In order to deliver long-term sustainable performance, it is important we
have market-competitive remuneration and equivalence of reward across geographical boundaries in order to attract, motivate and retain talented and committed employees around the world. We ensure our remuneration policies are aligned with both new regulatory practices and the interests of shareholders and confirm that HSBC is fully compliant with the Financial Stability Board and the FSA guidance and rules on remuneration.
Comparator group
The Committee considers market data for executive Directors’ remuneration packages from a defined remuneration comparator group. This group consists of nine global financial services companies, namely Banco Santander, Bank of America, Barclays, BNP Paribas, Citigroup, Deutsche Bank, JPMorgan Chase & Co, Standard Chartered and UBS. These companies were selected on the basis of their broadly similar business coverage, size and international scope, and are subject to annual review for continuing relevance.
Shareholder context
See page 360.
Variable pay pool determination
The Committee considers many factors in determining the Group’s variable pay pool funding.
The variable pay pool takes into account the performance of the Group which is considered within the context of its Risk Appetite Statement. This helps to ensure that the variable pay pool is shaped by risk considerations. The Risk Appetite Statement describes and measures the amount and types of risk that HSBC is prepared to take in executing its strategy. It shapes the integrated approach to business, risk and capital management and supports achievement of the Group’s objectives. The Group Chief Risk Officer regularly updates the Committee on the Group’s performance against the Risk Appetite Statement.
The Committee uses these updates when considering remuneration to ensure that return, risk and remuneration are aligned.
We use a counter-cyclical funding methodology which is categorised by both a floor and a ceiling and the payout ratio reduces as performance increases to avoid pro-cyclicality risk. The floor recognises that franchise protection is typically required irrespective of performance levels. The ceiling recognises that at higher levels of performance it is possible to limit reward as it is
352
Table of Contents
HSBC HOLDINGS PLC
Directors’ Remuneration Report(continued)
not necessary to continue to increase the variable pay pool, thereby limiting the risk of inappropriate behaviour to drive financial performance.
In addition, our funding methodology considers the relationship between capital, dividends and variable pay to ensure that the distribution of post-tax profits between these three elements is considered appropriate (see page 349 for the 2012 and the 2011 split). It is deemed fundamental to the Group that a majority of post-tax profit should be allocated to capital and to shareholders, particularly when a strong performance is delivered.
Finally, the commercial requirement to remain competitive in the market and overall affordability are considered.
Clawback
In order to reward genuine performance and not failure, individual awards are made on the basis of a risk-adjusted view of both financial and non-financial performance. However, if the assessment of performance subsequently proves to be inaccurate or incorrect, then unvested deferred awards made since 2010 can be clawed back by the Committee.
Individual awards
Individual awards are based on the achievement of both financial and non-financial objectives. These objectives, which are aligned with the Group’s strategy, are detailed in participants’ annual performance scorecards and the collective long-term performance scorecard of participants in the GPSP. Performance is then measured and reviewed against the objectives on a regular basis.
Overall performance under both scorecards is judged on outcomes but, most importantly, adherence to HSBC Values as described on page 347 is a prerequisite before any individual
can be considered for any variable pay. In other words, adherence with the values acts as a gating item. These values are key to the running of a sound, sustainable bank. Specifically, our most senior employees had a separate values rating for 2012 which directly influenced their overall performance rating and, accordingly, their variable pay.
In addition, the Global Risk and Compliance functions carry out annual reviews for senior executives and risk-takers (defined as HSBC Code Staff). These reviews determine whether there are any instances of non-compliance with Risk and Compliance procedures and expected behaviour. Instances of non-compliance are escalated to senior management for consideration in variable pay decisions, clawback and ongoing employment.
Group-wide thematic reviews of risk are also carried out to determine if there are any transgressions which could affect the amount of current year variable pay or any instances where clawback of previously awarded variable pay is required. Risk and Compliance input is a critical part of the assessment process in determining the performance of HSBC Code Staff (which includes the executive Directors) and in ensuring that their individual remuneration has been appropriately assessed with regard to risk.
We require a proportion of variable pay awards above certain thresholds to be deferred into awards of HSBC shares. This is to ensure that the Group’s interests and those of its employees are aligned with those of the Group’s shareholders, that the Group’s approach to risk management supports the interests of all stakeholders and that remuneration is consistent with effective risk management.
In considering individual awards, a comparison of the pay and employment conditions of our employees, Directors and senior executives is considered by the Committee.
353
Table of Contents
HSBC HOLDINGS PLC
Directors’ Remuneration Report(continued)
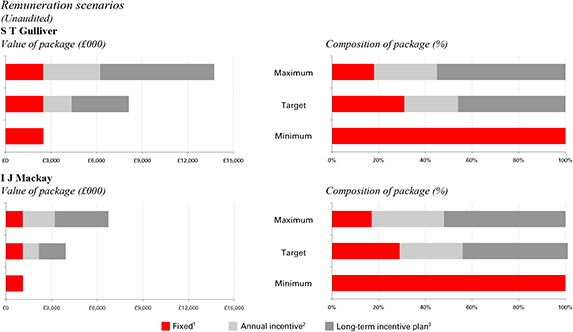
| 1 | Salary paid in the year for executive Directors,taxable benefits, pension and cash in lieu of pensions. |
| 2 | Maximum award level as stated in policy. Includes deferred portion of award. Target has been defined as 50% of the maximum award. |
| 3 | Maximum award level as stated in policy. Target has been defined as 50% of the maximum award. The GPSP scorecard has not been designed with a targeted or expected value of performance. For the purposes of the new regulations, 50% of the maximum award is deemed as target. |
The following Directors have not been included in the disclosure above: D J Flint, who has not been eligible for an annual incentive since 2011 and is not expected to be granted awards under the GPSP other
than in exceptional circumstances, and A A Flockhart, who ceased to be an executive Director on 30 April 2012. Non-executive Directors are not eligible to receive incentive awards.
Summary of 2012 remuneration outcomes
Single figure of remuneration for each executive Director
(Unaudited)
| Base salary | Benefits1 | Pension3 | Annual incentive | Long-term incentive | 2012 total | 2011 total | ||||||||||||||||||||||||||||||||||
| £000 | £000 | £000 | £000 | £000 | £000 | £000 | ||||||||||||||||||||||||||||||||||
| Executive Directors | ||||||||||||||||||||||||||||||||||||||||
D J Flint | 1,500 | 855 | – | – | – | 2,355 | 2,348 | |||||||||||||||||||||||||||||||||
A A Flockhart2 | 325 | 239 | 6 | – | – | 570 | 3,639 | |||||||||||||||||||||||||||||||||
S T Gulliver | 1,250 | 1,220 | 13 | 1,950 | 3,000 | 7,433 | 8,047 | |||||||||||||||||||||||||||||||||
I J Mackay | 700 | 421 | – | 1,348 | 1,400 | 3,869 | 3,213 | |||||||||||||||||||||||||||||||||
| 1 | The emoluments table on page 361 provides further details on the benefits included. |
| 2 | Ceased to be an executive Director on 30 April 2012. |
| 3 | As disclosed on page 358. |
| • | Base salary: salary paid in year for executive Directors. |
| • | Benefits: taxable benefits including cash in lieu of pension. |
| • | Annual incentive: annual incentive award cash and share payments (including deferred awards) for the 2012 performance year. The outcomes of the performance conditions which determined the award are described in the next section. Forty per cent of the annual incentive in respect |
of the 2012 performance year is non-deferred. The non-deferred incentive is split between 50% cash and 50% payable in HSBC Holdings Restricted Shares, which are subject to a six-month retention period. 60% of the full annual incentive award is deferred equally between cash and shares and vests 100% after five years subject to the successful completion of the Deferred Prosecution Agreements and subject to the terms of the Plan. |
354
Table of Contents
HSBC HOLDINGS PLC
Directors’ Remuneration Report(continued)
| • | Long-term incentives: long-term incentives include all other awards where final vesting is determined as a result of the achievement of performance conditions that end in the year being reported on. For 2012 this would only include the 2013 GPSP. |
The GPSP awards to be granted in 2013 in respect of 2012 were assessed against the 2012 long-term scorecard detailed on page 357. The award is subject to a five-year vesting period during which the Committee has the authority to claw back part or all of the award. On vesting, the net of tax shares must be retained until the participant retires.
Variable pay outcomes
(Unaudited)
| S T Gulliver | I J Mackay | |||||||||||||||||||||||||||||||||||||||
Maximum multiple | 2012 multiple | 2012 £000 | 2011 £000 | 2012 multiple | 2012 £000 | 2011 £000 | ||||||||||||||||||||||||||||||||||
Salary1 | �� | 1.00 | 1.00 | 1,250 | 1,250 | 1.00 | 700 | 700 | ||||||||||||||||||||||||||||||||
Annual incentive2 | 3.00 | 1.56 | 1,950 | 2,156 | 1.92 | 1,348 | 1,086 | |||||||||||||||||||||||||||||||||
GPSP awards3 | 6.00 | 2.40 | 3,000 | 3,750 | 2.00 | 1,400 | 700 | |||||||||||||||||||||||||||||||||
Total | 6,200 | 7,156 | 3,448 | 2,486 | ||||||||||||||||||||||||||||||||||||
| 1 | As disclosed in the Directors’ emoluments table on page 361. |
| 2 | 50% of the annual incentive is delivered in cash with the remaining 50% in shares. 60% of the annual incentive for 2012 is deferred for five years. 100% vests on the fifth anniversary of grant subject to the successful completion of the Deferred Prosecution Agreements. During the vesting period the Committee has the authority to claw back part or all of the award. |
| 3 | As disclosed in the 2012 long-term scorecard and performance outcome on page 357. The award is subject to a five-year vesting period during which the Committee has the authority to claw back part or all of the award. On vesting, the net of tax shares must be retained until the participant retires. |
Annual incentive
| Maximum face value of award | Performance outcome | Awards made | ||||||||||||||
Director | ||||||||||||||||
S T Gulliver | 300% | 52% | 156% | |||||||||||||
I J Mackay | 300% | 64% | 192% | |||||||||||||
Determining executive Directors’ performance
S T Gulliver
The annual incentive award made to S T Gulliver in respect of 2012 reflected the Committee’s assessment of the extent to which he had achieved the personal and corporate objectives set for him within his performance scorecard as agreed by the Board at the beginning of the year. This measurement took into account his performance against both the financial and non-financial measures which had been set to reflect the risk appetite and strategic priorities determined by the Board to be appropriate for 2012.
In order for any award of annual incentive to be made under the above performance scorecard, the Committee firstly had to satisfy itself that S T Gulliver had personally met and shown leadership in promoting HSBC Values. This over-riding test assessed behaviour around the HSBC Values principles of being ‘open, connected and
dependable’ and acting with ‘courageous integrity’. Independent feedback was taken from direct reports and others lower in the organisation as well as from the Group Chairman. Taking this into account as well as its own experience and observation, including noting how S T Gulliver had dealt with situations where HSBC Values had not been met, the Committee concluded that S T Gulliver had exhibited strong leadership and personal behaviour in this area and so met the required standard.
In aggregate, in assessing the calibration of S T Gulliver’s 2012 annual incentive against his theoretical maximum opportunity of three times base salary, an overall score of 52% (2011: 57.5%) of that maximum opportunity was judged to have been achieved. The achievement of the financial element of the scorecard was scored marginally higher than the non-financial measures. A summary of the assessment and rationale for the conclusions is set out below. Unless otherwise indicated, the figures in parentheses denote the opportunity within the scorecard.
355
Table of Contents
HSBC HOLDINGS PLC
Directors’ Remuneration Report(continued)
Financial (60% weighting – achieved 32%)
The Committee continued to judge Capital Strength (10%) and Dividend Payout (10%) as critically important reflections of financial performance as they encapsulate a number of key factors of importance to shareholders. In essence these elements demonstrate a combination of profit generation, control of capital usage, cash availability at the holding company and regulatory satisfaction with the preceding factors sufficient to support HSBC’s progressive dividend policy. In essence, these elements are important indicators of the sustainability of shareholder reward. Reflecting a higher dividend in 2012 and a stronger core tier 1 capital ratio, the Committee awarded full weighting of these elements of the scorecard.
An opportunity of 15% was available in respect of delivering pre-tax profit improvement (on the underlying basis described on page 348 used to assess management performance) and this was judged to have been substantially met with the Committee awarding 80% of the available opportunity (12% award). Driving this assessment were the strong performances across the faster-growing markets, particularly in Hong Kong, the turnaround in GB&M’s performance in Europe, the delivery of above-target sustainable cost savings and lower loan impairment charges driven by marked improvement in the US.
Return on Equity (15%) did not meet the benchmark return. The Cost Efficiency Ratio (10%) also fell outside the required measure, in large part attributable to the significant regulatory and law enforcement fines and penalties incurred in the US and customer redress costs suffered in the UK.
Non-financial (40% weighting – achieved 20%)
25% of the available opportunity in this area related to Strategy Execution and 80% was judged to have been achieved (20% awarded). This strong performance reflected a combination of growing capital deployment into targeted areas of opportunity, particularly into faster-growing markets, strategic cost efficiency initiatives successfully deployed, evidence of further benefits from global business integration, progress on building wealth management revenues and personal commitment to developing client relationships.
The final opportunity under non-financial measures (15%) related to Risk and Compliance and, in light of the US regulatory and law enforcement fines and penalties and further customer redress in the UK, no award was made under this element.
The same deliberations and assessments with regard to performance and adherence to HSBC Values were undertaken by the Committee with regard to the performance of I J Mackay. This is summarised below.
I J Mackay
The performance scorecard for I J Mackay was weighted 30% financial, 70% non-financial. In aggregate, in assessing the quantum of the 2012 annual incentive against the theoretical maximum opportunity of three times base salary, an overall score of 64% of that maximum opportunity was judged to have been achieved.
The Committee considered that performance against the financial targets of Cost Disciplines and Capital and Liquidity Management had been met or were in progress.
The Committee considered that performance against the non-financial targets including People, Reporting and Planning, Maintaining a Strong Control Environment and Regulatory Change had been met or were in progress. With regard to Compliance and Reputation, in light of the US regulatory and law enforcement fines and penalties and further customer redress in the UK, no award was made under this element of the scorecard.
Awards under the GPSP
Awards to be granted in 2013 in respect of 2012 were assessed against the 2012 long-term scorecard published in theAnnual Report and Accounts 2011 and reproduced below.
The performance assessment under the 2012 long-term scorecard took into account achievements under both financial and non-financial objectives, both of which were set within the context of the risk appetite and strategic direction agreed by the Board.
Notwithstanding the detail or extent of performance delivery against the objectives, an individual’s eligibility for a GPSP award requires confirmation of adherence to HSBC Values which acts in effect as a gating mechanism to GPSP participation. Within the GPSP, the weighting between financial and non-financial measures in respect of 2012 was set at 60% and 40%, respectively.
In aggregate in respect of the objectives set for 2012, and in light of the significance of the legal and regulatory fines and penalties incurred in 2012, an overall performance outcome of 40% (2011:50%) of the scorecard was judged to have been achieved; this outcome applies to all eligible participants in the
356
Table of Contents
HSBC HOLDINGS PLC
Directors’ Remuneration Report(continued)
GPSP. A summary of the assessment and rationale for the conclusions is set out below. Figures in
parentheses reflect the available opportunity under the GPSP.
| Measure | Long-term target range | Weighting | Actual 2012 performance | Outcome | ||||||||||||||||||
Return on equity | 12% – 15% | 15% | 8.4%¹ | 0% | ||||||||||||||||||
Cost efficiency ratio | 48% – 52% | 15% | 62.8%¹ | 0% | ||||||||||||||||||
Capital strength | > 10% | 15% | 12.3%¹ | 15.0% | ||||||||||||||||||
Dividends (payout ratio) | 40% – 60% | 15% | 55.4%¹ | 15.0% | ||||||||||||||||||
Strategy | Judgement | 20% | Judgement | 15.0% | ||||||||||||||||||
Brand equity |
| Top 3 rating and improve US$bn value |
| 5% |
| Top 3 rating but drop in value² |
| 0% | ||||||||||||||
Compliance and reputation | Judgement | 10% | Not met | 0% | ||||||||||||||||||
People and values | Judgement | 5% | Judgement | 3.75% | ||||||||||||||||||
Performance outcome | 100% | 48.75% | ||||||||||||||||||||
Committee discretion | 40.00% | |||||||||||||||||||||
| 1 | As reported in the Annual Report and Accounts 2012. |
| 2 | Based on results from The Brand Finance® Banking 500 2013survey. |
The performance outcome of 40% was then applied to maximum face values (expressed as a percentage
of salary) for each participant. The awards to be made in respect of 2012 are detailed below.
| Maximum face value of award | Performance outcome | Awards made | ||||||||||||||||
Director | ||||||||||||||||||
S T Gulliver | 600% | 40% | 240% | |||||||||||||||
I J Mackay | 500% | 40% | 200% | |||||||||||||||
Financial (60% weighting – achieved 30%)
The opportunity of 60% was equally split in 2012 between Capital Strength, Dividend Progression, Return on Equity and Cost Efficiency ratio.
While the annual assessment looked at point in time achievement of the same performance elements, under the long-term plan consideration was given to progress made towards stated targets where these had not been met in the short term and to the sustainability of positive short-term performance.
With regard to Capital Strength, the Committee considered favourably the steps taken to meet the Basel III targets in the accelerated timetable being required by the Group’s lead regulator. In addition to achieved and planned operating profit generation, the Committee noted favourably the extensive capital generated from business disposals, both from gains realised on sale and from release of risk-weighted assets. Further support for a positive view of performance accrued from actions noted as having been taken to reduce the capital drag from legacy assets and exit portfolios and from steps being taken to mitigate the impact of the more onerous capital requirements arising from regulatory changes yet to take effect. Having reviewed these factors the Committee awarded the full opportunity (15%).
On Dividend Progression, the Committee noted favourably the capacity to maintain a progressive policy, subject to performance, reflected in the
Group’s capital position, its distributable reserves, its cash position and its planning assumptions. The Committee also noted external commentary on dividend paying capacity and regulatory interactions around the Group’s capital position. Having considered these factors the Committee awarded the full opportunity (15%).
As noted in the assessment of the annual performance awards, the Group has not yet reached its target Return on Equity of 12-15%. The Committee deliberated on the benefits arising from the considerable restructuring and reshaping of the business which has been undertaken under the Group’s Six Filters framework, the delivery of sustainable cost savings ahead of target, the growth being achieved from investment in faster-growing markets and the progress made in run-off of the exit portfolios and in reducing legacy underperforming assets. The Committee also reflected on the additional costs that would be incurred and revenues foregone from the programme of strengthening controls and compliance which is underway and from applying global standards in all markets. There was also note made of the continuing uncertainties from an incomplete regulatory reform agenda, from contingent legal risks and from the continuing significant customer redress costs from legacy activities being borne. As a consequence, the Committee felt unable to make any award under this opportunity (15%).
357
Table of Contents
HSBC HOLDINGS PLC
Directors’ Remuneration Report(continued)
Similarly, under the Cost Efficiency Ratio (‘CER’) element of the scorecard, despite good progress on sustainable cost savings, the CER remains well above the target range of 48-52%. The Committee noted that a major element of the underperformance relates to legal and regulatory fines and penalties and customer redress costs which it cannot view as non-recurring. As a consequence the Committee judged that no award could be made under this opportunity (15%).
Non-financial (40% weighting – achieved 18.75%)
Half the opportunity in this section related to the execution of strategic priorities laid down by the Board (20%). In assessing performance the Committee noted but looked beyond the short-term deliverables of targeted disposals and investments to review the frameworks being established to improve capital deployment, establish and enforce Global Standards, improve cost efficiency while maintaining strong operational and risk controls and enhance global business co-operation and integration. The Committee concluded that it would be an appropriate reflection of management achievement to award 75% of the available opportunity, namely 15%.
A separate but connected appraisal was made of the human aspect of long-term strategy delivery where the Committee looked at recruitment of key personnel to fill critical roles, succession planning, values training and enforcement and the retention, motivation and collegiality of the senior management team in what had been a stressed environment. Once again the Committee awarded 75% of the available opportunity of 5%, adding 3.75% to the scorecard.
With regard to Compliance and Reputation (10%), given the legal and regulatory fines and penalties incurred in 2012 and the continuation of significant further customer redress costs in the UK, the Committee concluded no award could be contemplated.
This conclusion was followed through when assessing Brand Equity (5%), which technically scored 50% of the available opportunity as HSBC maintained a top three ranking in its peer group. The Committee used its discretion to reduce this award to nil in light of the reputational damage incurred from the US legal and regulatory fines and penalties.
This performance assessment resulted in an overall score of 48.75%. Notwithstanding this, taking into account the significance of the legal and regulatory fines and penalties incurred in 2012, the
Committee determined that the initial performance outcome should be reduced further to give a final performance outcome for 2012 of 40%.
Contributions and allowances in lieu of pension entitlements
D J Flint received an allowance of 50% of annual basic salary in lieu of personal pension arrangements. The allowance for 2012 amounted to £750,000.
A A Flockhart retired as an executive Director on 30 April 2012 and until that date received employer contributions of 1.8% of basic salary into a pension plan and an allowance of 48.2% of basic salary. The employer contributions and the allowance for 1 January 2012 to 30 April 2012 amounted to £162,500.
S T Gulliver received employer contributions of 4% of basic salary into a personal pension plan and an allowance of 46% of basic salary from 1 January 2012 to 31 March 2012. From 1 April 2012, S T Gulliver received an allowance of 50% of basic salary in lieu of personal pension arrangements. The employer contributions and the allowance for the whole of 2012 amounted to £625,000.
I J Mackay received an allowance of 50% of annual basic salary in lieu of personal pension arrangements. The allowance for 2012 amounted to £350,000.
TSR Chart
HSBC TSR and FTSE100 index
Pursuant to the Large and Medium-sized Companies and Groups (Accounts and Reports) Regulations 2008, the graph below shows the TSR performance against the FTSE 100 index for the five-year period ended 31 December 2012. The FTSE 100 index has been chosen as this is a recognised broad equity market index of which HSBC Holdings is a member.
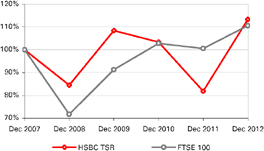
Source: International Data Corporation
358
Table of Contents
HSBC HOLDINGS PLC
Directors’ Remuneration Report(continued)
Service contracts and exit payments
Our policy is to employ executive Directors on one year rolling contracts although longer initial terms
may be approved by the Committee if considered appropriate. The Committee will, consistent with the best interests of the Group, seek to minimise termination payments.
| Director | Contract date (rolling) | Notice period (Director & HSBC) | Compensation on termination by the company without notice or cause | |||
| D J Flint | 14 February 2011 | 12 months | Payment in lieu of notice equal to fixed pay, pension entitlements and other benefits. | |||
| A A Flockhart¹ | 14 February 2011 | 12 months | Payment in lieu of notice equal to fixed pay, pension entitlements and other benefits. Eligible to be considered for a variable pay award upon termination of employment other than where the executive has resigned or the Company has terminated the executive’s employment with the contractual right to do so. | |||
| S T Gulliver2 | 10 February 2011 | 12 months | Payment in lieu of notice equal to fixed pay, pension entitlements and other benefits. Eligible to be considered for a variable pay award upon termination of employment other than where the executive has resigned or the Company has terminated the executive’s employment with the contractual right to do so. | |||
| I J Mackay | 4 February 2011 | 12 months | Payment in lieu of notice equal to fixed pay, pension entitlements and other benefits. Eligible to be considered for a variable pay award upon termination of employment other than where the executive has resigned or the Company has terminated the executive’s employment with the contractual right to do so. | |||
| 1 | Service contract terminated on 30 April 2012 – the date of retirement as an executive Director. |
| 2 | The other benefits as part of the payment in lieu of notice do not include the accommodation and car provided in Hong Kong. |
Exit payments made in year
A A Flockhart retired for health reasons as an executive of the Group and from his position as Chairman of Europe, Middle East, Africa, Latin America, Commercial Banking on 30 April 2012. A A Flockhart remained on the Board up to 31 July 2012 in a non-executive Director capacity. Upon retirement on 30 April 2012, A A Flockhart received no compensation for loss of office other than contractual retirement benefits and was granted good leaver status on his unvested deferred cash and share awards as per the HSBC Share Plan rules. Subject to the terms of the Plan, the awards will vest in line with the vesting schedule at time of grant.
Share ownership guidelines
To ensure appropriate alignment with our shareholders, we operate a formal share ownership policy, expressed as a number of shares, for executive Directors and Group Managing Directors. The Committee considers that material share ownership by executives creates a community of interest between senior management and shareholders.
Under the existing guidelines, the shareholding is expected to be achieved within five years of the executive’s appointment. All executive Directors exceed the expected holdings. Shareholding requirements for the Group executive Directors and Group Managing Directors are set out below. The Directors’ shareholdings at 31 December 2012 are also set out below. There are no shareholding requirements for non-executive Directors.
359
Table of Contents
HSBC HOLDINGS PLC
Directors’ Remuneration Report(continued)
At 31 December 2012 (or date of retirement) | ||||||||||||||||||||||||||||||||
Shares awarded subject to deferral | ||||||||||||||||||||||||||||||||
| | Shareholding requirement (number) | |
| Shares legally owned1 |
|
| without performance conditions2 |
| | with performance | |
| Total shareholding3 (number) |
| | Estimated value £000 | | |||||||||||||||
Executive Directors | ||||||||||||||||||||||||||||||||
D J Flint | 400,000 | 313,326 | 211,269 | – | 524,595 | 3,394 | ||||||||||||||||||||||||||
A A Flockhart4 | 200,000 | 978,077 | 4 | 568,973 | 4 | – | 1,547,050 | 4 | 10,008 | 5 | ||||||||||||||||||||||
S T Gulliver | 600,000 | 2,730,477 | 2,448,515 | – | 5,178,992 | 33,503 | ||||||||||||||||||||||||||
I J Mackay | 200,000 | 118,813 | 417,392 | – | 536,205 | 3,469 | ||||||||||||||||||||||||||
Group Managing Directors6 | 125,000 | n/a | n/a | n/a | n/a | n/a | ||||||||||||||||||||||||||
Non-executive Directors | ||||||||||||||||||||||||||||||||
J D Coombe | n/a | 22,387 | n/a | n/a | 22,387 | 145 | ||||||||||||||||||||||||||
R A Fairhead | n/a | 21,300 | n/a | n/a | 21,300 | 138 | ||||||||||||||||||||||||||
W S H Laidlaw | n/a | 32,252 | n/a | n/a | 32,252 | 209 | ||||||||||||||||||||||||||
J P Lipsky | n/a | 15,000 | 7 | n/a | n/a | 15,000 | 7 | 97 | 8 | |||||||||||||||||||||||
G Morgan | n/a | 84,347 | 9 | n/a | n/a | 84,347 | 9 | 546 | 10 | |||||||||||||||||||||||
Sir Simon Robertson | n/a | 9,486 | n/a | n/a | 9,486 | 61 | ||||||||||||||||||||||||||
J L Thornton | n/a | 10,250 | 11 | n/a | n/a | 10,250 | 11 | 66 | 8 | |||||||||||||||||||||||
Sir Brian Williamson | n/a | 40,164 | 9 | n/a | n/a | 40,164 | 9 | 260 | 10 | |||||||||||||||||||||||
| 1 | Includes interests held as beneficial owner and interests held by connected persons and excludes interests held non-beneficially as trustee. |
| 2 | Includes GPSP awards which are made following an assessment of performance over the prior year but are then awarded subject to a five-year vesting period. |
| 3 | For the purposes of our shareholding guidelines, unvested awards of Restricted Shares and GPSP awards are included. |
| 4 | Interests at 31 July 2012, the date of retirement as a Director. |
| 5 | Estimated value at 31 July 2012, the date of retirement as a Director. |
| 6 | All of the Group Managing Directors except one (who was appointed a Group Managing Director during 2012 and is therefore within the five years permitted to achieve the expected holding) exceed the expected holdings. |
| 7 | Interest in 3,000 listed American Depositary Shares (‘ADS’), which are categorised as equity derivatives under Part XV of the Securities and Futures Ordinance of Hong Kong. Each ADS represents five HSBC Holdings ordinary shares. |
| 8 | The ADS closing price on 31 December 2012 on the New York Stock Exchange was US$53.07. |
| 9 | Interests at 25 May 2012, the date of retirement as a Director. |
| 10 | Estimated value at 25 May 2012, the date of retirement as a Director. |
| 11 | Interest of spouse in 2,050 listed ADS. |
The Committee monitors compliance with the share ownership guidelines annually. The Committee has full discretion in determining any penalties in cases of non-compliance, which could include a reduction of future awards of GPSP and/or an increase in the proportion of the annual variable pay that is deferred into shares.
Shareholder context
During the year the Chairman of the Remuneration Committee met with institutional shareholders to collect their views on current and developing remuneration practices. The Group considers these meetings vital to ensure that our reward strategy continues to be aligned with the long-term interests of our shareholders.
The table below shows the advisory vote on the 2011 Directors’ Remuneration Report at the May 2012 Annual General Meeting.
| Number of votes cast | For | Against | Withheld | |||||||||||||||||||
Advisory vote on 2011 remuneration report | 8,467,146,094 | 7,603,837,582 | 863,308,512 | 342,947,482 | ||||||||||||||||||
| (89.80%) | (10.20%) | |||||||||||||||||||||
360
Table of Contents
HSBC HOLDINGS PLC
Directors’ Remuneration Report(continued)
| Appendix to Directors’ Remuneration Report
| |
This appendix provides disclosures required under Schedule 8 of the Large and Medium-sized Companies and Groups (Accounts and Reports) Regulations 2008, and by the FSA.
The following table shows the 2012 total remuneration of the Group Chairman and executive Directors of HSBC Holdings with annual incentives disclosed on a 2012 performance year basis, pursuant to the UK Listing Rules. Explanations of the constituent parts of the incentives calculated pursuant to the UK Companies Act 2006 and the UK Listing Rules are given in footnotes 4 and 5, respectively.
Directors’ remuneration
| D J Flint | A A Flockhart1 | S T Gulliver | I J Mackay | |||||||||||||||||||||||||||||||||||||||||||
| 2012 | 2011 | 2012 | 2011 | 2012 | 2011 | 2012 | 2011 | |||||||||||||||||||||||||||||||||||||||
| £000 | £000 | £000 | £000 | £000 | £000 | £000 | £000 | |||||||||||||||||||||||||||||||||||||||
Salary, allowances and benefits in kind | 2,355 | 2,348 | 564 | 1,578 | 2,470 | 2,043 | 1,121 | 1,427 | ||||||||||||||||||||||||||||||||||||||
Annual incentive2 | – | – | – | 1,926 | 1,950 | 2,156 | 1,348 | 1,086 | ||||||||||||||||||||||||||||||||||||||
Total remuneration | 2,355 | 2,348 | 564 | 3,504 | 4,420 | 4,199 | 2,469 | 2,513 | ||||||||||||||||||||||||||||||||||||||
US$000 | ||||||||||||||||||||||||||||||||||||||||||||||
Total remuneration | 3,732 | 3 | 3,763 | 894 | 5,616 | 7,004 | 6,729 | 3,913 | 4,027 | |||||||||||||||||||||||||||||||||||||
The following table shows the 2012 emoluments of the Group Chairman and executive Directors of HSBC Holdings, with annual incentives disclosed on an actual paid basis, pursuant to section 421 of the UK Companies Act 2006 and the Large and Medium-sized Companies and Groups (Accounts and Reports) Regulations 2008:
Directors’ emoluments
| D J Flint | A A Flockhart1 | S T Gulliver | I J Mackay | |||||||||||||||||||||||||||||||||||||||||||
| 2012 | 2011 | 2012 | 2011 | 2012 | 2011 | 2012 | 2011 | |||||||||||||||||||||||||||||||||||||||
| £000 | £000 | £000 | £000 | £000 | £000 | £000 | £000 | |||||||||||||||||||||||||||||||||||||||
Salary | 1,500 | 1,500 | 325 | 975 | 1,250 | 1,250 | 700 | 700 | ||||||||||||||||||||||||||||||||||||||
Allowances4 | 750 | 750 | 207 | 366 | 613 | 527 | 350 | 364 | ||||||||||||||||||||||||||||||||||||||
Benefits in kind5 | 105 | 98 | 32 | 237 | 607 | 266 | 71 | 363 | ||||||||||||||||||||||||||||||||||||||
Prior years deferred annual incentive now released6 | 1,364 | 1,054 | 218 | 857 | 5,648 | 3,697 | 275 | 12 | ||||||||||||||||||||||||||||||||||||||
Current year non-deferred annual incentive7 | – | – | – | 770 | 780 | 862 | 539 | 434 | ||||||||||||||||||||||||||||||||||||||
Total emoluments | 3,719 | 3,402 | 782 | 3,205 | 8,898 | 6,602 | 1,935 | 1,873 | ||||||||||||||||||||||||||||||||||||||
US$000 | ||||||||||||||||||||||||||||||||||||||||||||||
Total emoluments | 5,893 | 5,452 | 1,239 | 5,136 | 14,100 | 10,581 | 3,066 | 3,002 | ||||||||||||||||||||||||||||||||||||||
| 1 | Retired as an executive Director on 30 April 2012. |
| 2 | The annual incentive for 2012 comprises the deferred and non-deferred annual incentives. |
| 3 | The reduction in Total Remuneration in US$ between 2012 and 2011 is due to foreign exchange movements. |
| 4 | Allowances include an executive allowance paid to fund personal pension arrangements. |
| 5 | Benefits in kind include provision of medical insurance, other insurance cover, tax return preparation and travel assistance. S T Gulliver is also provided with HSBC-owned accommodation whilst in Hong Kong. In accordance with the Large and Medium-sized Companies and Groups (Accounts and Reports) Regulations 2008, the taxable rental value of the property is shown for the whole period notwithstanding that it is only occupied when S T Gulliver is in Hong Kong. |
| 6 | Where applicable, comprise, subject to the rules of the respective share plans: (i) the estimated monetary value of 33% of the award of HSBC Holdings Restricted Shares will vest on 12 March 2013 arising from the 2011 annual incentive awarded in March 2012 that was partly deferred into awards of HSBC Holdings Restricted Shares; (ii) the estimated monetary value of 33% of the award of HSBC Holdings Restricted Shares that will vest on 4 March 2013 arising from the 2010 annual incentive awarded in March 2011 that was partly deferred into awards of HSBC Holdings Restricted Shares; (iii) the estimated monetary value of the remainder of the award of HSBC Holdings Restricted Shares that will vest on 5 March 2013 arising from the 2009 annual incentive awarded in March 2010 that was fully deferred into awards of HSBC Restricted Shares; and (iv) 33% of the deferred cash award that will vest on 15 March 2013 arising from the 2010 annual incentive awarded in March 2011. |
| 7 | Comprises 40% of the annual incentive in respect of the 2012 performance year that is non-deferred. The non-deferred incentive is payable in HSBC Holdings Restricted Shares, 50% of which are subject to a six month retention period. |
361
Table of Contents
HSBC HOLDINGS PLC
Directors’ Remuneration Report(continued)
Non-executive Directors’ fees are regularly reviewed and compared with other large international companies of comparable complexity. The current fee, which was approved by shareholders in 2011, is £95,000 per annum. A fee of £45,000 per annum is payable to the senior independent non-executive Director. In addition, non-executive Directors received the following fees for service on Board Committees:
Board Committee annual fees
| Chairman | Member | Number of meetings held during | ||||||||||
| £000 | £000 | 2012 | ||||||||||
Group Audit Committee | 50 | 30 | 5 | |||||||||
Group Risk Committee | 50 | 30 | 7 | |||||||||
Group Remuneration Committee | 50 | 30 | 8 | |||||||||
Financial System Vulnerabilities Committee1 | 50 | 30 | – | |||||||||
Nomination Committee | 40 | 25 | 4 | |||||||||
Corporate Sustainability Committee | 40 | 25 | 4 | |||||||||
| 1 | Established on 18 January 2013. |
Fees paid to non-executive Directors
| 2012 | 2011 | |||||||||
| £000 | £000 | |||||||||
S A Catz | 95 | 95 | ||||||||
L M L Cha1 | 548 | 465 | ||||||||
M K T Cheung2 | 166 | 165 | ||||||||
J D Coombe | 205 | 205 | ||||||||
J Faber3 | 104 | – | ||||||||
R A Fairhead | 200 | 200 | ||||||||
A A Flockhart4 | 70 | – | ||||||||
J W J Hughes-Hallett | 138 | 150 | ||||||||
W S H Laidlaw | 125 | 125 | ||||||||
J P Lipsky3 | 119 | – | ||||||||
J R Lomax | 155 | 155 | ||||||||
G Morgan5 | 50 | 125 | ||||||||
N R N Murthy6 | 135 | 135 | ||||||||
Sir Simon Robertson | 180 | 166 | ||||||||
J L Thornton7 | 1,092 | 1,081 | ||||||||
Sir Brian Williamson5 | 48 | 120 | ||||||||
Total8 | 3,430 | 3,187 | ||||||||
Total (US$000)8 | 5,435 | 5,108 | ||||||||
| 1 | Includes fees as non-executive Director and Deputy Chairman of The Hongkong and Shanghai Banking Corporation Limited and a member of its nomination committee. |
| 2 | Includes fees as non-executive Director and member of the audit committee of Hang Seng Bank Limited. |
| 3 | Appointed on 1 March 2012. |
| 4 | A non-executive Director from 1 May to 31 July 2012. Includes fees as a non-executive Director and Chairman of HSBC Bank plc and a non-executive Director of HSBC Bank Middle East Limited from 1 May to 31 July 2012. |
| 5 | Retired on 25 May 2012. |
| 6 | Retired on 31 December 2012. |
| 7 | Includes fees as non-executive Chairman of HSBC North America Holdings Inc. |
| 8 | Total fees for 2011 and 2012 include the fees of non-executive Directors who retired in that year. |
Non-executive Directors are appointed for fixed terms not exceeding three years, subject to their re-election by shareholders at Annual General Meetings. Non-executive Directors have no service contract and are not eligible to participate in our share plans. Non-executive Directors’ current terms of appointment will expire as follows:
| • | in 2013, R A Fairhead; |
| • | in 2014, S A Catz, L M L Cha, J D Coombe, J W J Hughes-Hallett and W S H Laidlaw; and |
| • | in 2015, M K T Cheung, J Faber, J P Lipsky, J R Lomax, Sir Simon Robertson and J L Thornton. |
362
Table of Contents
HSBC HOLDINGS PLC
Directors’ Remuneration Report(continued)
Subject to their re-election by shareholders, the terms of appointment of R Fassbind and J B Comey will expire in 2016.
Executive Directors, if so authorised by either the Nomination Committee or the Board, may accept appointments as non-executive directors of suitable companies which are not part of HSBC. Approval will not be given for an executive Director to accept a non-executive directorship of more than one FTSE 100 company nor the chairmanship of such a company. When considering a non-executive appointment, the Nomination Committee or Board will take into account the expected time commitment of such appointment. The time commitment for executive Directors’ external appointments will be reviewed as part of the annual Board review. Any remuneration receivable in respect of an external appointment is normally paid to HSBC, unless otherwise approved by the Nomination Committee.
At 31 December 2012, the undernamed Directors held options and awards of Restricted Shares under the HSBC Share Plan and the HSBC Share Plan 2011 (including conditional awards of shares under the GPSP) to acquire the number of HSBC Holdings ordinary shares set against their respective names.
HSBC Holdings savings-related share option plans
HSBC Holdings ordinary shares
| Dates of | Exercise | Exercisable | At 1 Jan | At 31 Dec 2012 | ||||||||||||||||||||||||||||||
| award | price (£) | from1 | until | 2012 | retirement) | |||||||||||||||||||||||||||||
D J Flint | 25 Apr 2007 | 6.1760 | 1 Aug 2012 | 31 Jan 2013 | 2,650 | 2,650 | ||||||||||||||||||||||||||||
D J Flint | 24 Apr 2012 | 4.4621 | 1 Aug 2015 | 31 Jan 2016 | – | 2,016 | ||||||||||||||||||||||||||||
A A Flockhart | 29 Apr 2009 | 3.3116 | 1 Aug 2014 | 31 Jan 2015 | 4,529 | – | 2 | |||||||||||||||||||||||||||
| US$ | ||||||||||||||||||||||||||||||||||
I J Mackay | 30 Apr 2008 | 11.8824 | 1 Aug 2011 | 31 Jan 2012 | 1,531 | – | 3 | |||||||||||||||||||||||||||
The HSBC Holdings savings-related share option plans are all-employee share plans under which eligible employees may be granted options to acquire HSBC Holdings ordinary shares. Employees may make contributions of up to £250 (or equivalent) each month over a period of one, three or five years which may be used on the first, third or fifth anniversary of the commencement of the relevant savings contract, at the employee’s election, to exercise the options. The plans help align the interests of employees with the creation of shareholder value. The options were awarded for nil consideration and are exercisable at a 20% discount to the average market value of the ordinary shares on the five business days immediately preceding the invitation date. There are no performance criteria conditional upon which the outstanding options are exercisable and there have been no variations to the terms and conditions since the awards were made. The market value per ordinary share at 31 December 2012 was £6.47. The highest and lowest market values per ordinary share during the year were £6.55 and £4.91. Market value is the mid-market price derived from the London Stock Exchange Daily Official List on the relevant date. Under the Securities and Futures Ordinance of Hong Kong, the options are categorised as unlisted physically settled equity derivatives.
| 1 | May be advanced to an earlier date in certain circumstances, e.g. retirement. |
| 2 | Options lapsed on 31 October 2012 following the end of the six month period following retirement within which employees may exercise options under the HSBC Holdings savings-related share option plans. A A Flockhart retired as an employee on 30 April 2012. |
| 3 | Option lapsed on 31 January 2012 following the end of the exercise period. |
363
Table of Contents
HSBC HOLDINGS PLC
Directors’ Remuneration Report(continued)
Awards of Restricted Shares
HSBC Share Plan
HSBC Holdings ordinary shares
Year in which | Awards held at | Awards made during year | Awards vested during year | Awards 31 Dec 2012 | ||||||||||||||||||||||||||||||||||
| Date of award | awards may vest | 1 Jan 2012 | Number | Monetary value | Number | Monetary value | (or date of retirement)1 | |||||||||||||||||||||||||||||||
| £000 | £000 | |||||||||||||||||||||||||||||||||||||
D J Flint | 1 Mar 2010 | 2011-2013 | 2 | 220,201 | – | – | 111,340 | 3 | 617 | 116,700 | ||||||||||||||||||||||||||||
| 15 Mar 2011 | 2012-2014 | 2 | 133,280 | – | – | 44,516 | 4 | 256 | 94,569 | |||||||||||||||||||||||||||||
A A Flockhart5 | 2 Mar 2009 | 2012 | 535,162 | – | – | 541,651 | 6 | 3,028 | – | |||||||||||||||||||||||||||||
| 1 Mar 2010 | 2011-2013 | 2 | 212,927 | – | – | 107,662 | 3 | 596 | 110,704 | |||||||||||||||||||||||||||||
| 15 Mar 2011 | 2012-2014 | 2 | 86,062 | – | – | 28,745 | 4 | 165 | 59,906 | |||||||||||||||||||||||||||||
S T Gulliver | 1 Mar 2010 | 2011-2013 | 2 | 943,723 | – | – | 477,174 | 3 | 2,644 | 500,148 | ||||||||||||||||||||||||||||
| 15 Mar 2011 | 2012-2014 | 2 | 825,072 | – | – | 275,575 | 4 | 1,585 | 585,436 | |||||||||||||||||||||||||||||
I J Mackay | 2 Mar 2009 | 2012 | 104,244 | – | – | 105,508 | 6 | 590 | – | |||||||||||||||||||||||||||||
| 1 Mar 2010 | 2011-2013 | 2 | 41,263 | – | – | 20,864 | 3 | 116 | 21,868 | |||||||||||||||||||||||||||||
| 15 Mar 2011 | 2012-2014 | 2 | 35,954 | – | – | 12,008 | 4 | 69 | 25,513 | |||||||||||||||||||||||||||||
Vesting of Restricted Share awards is normally subject to the Director remaining an employee on the vesting date. The vesting date may be advanced to an earlier date in certain circumstances, e.g. death. Under the Securities and Futures Ordinance of Hong Kong, interests in Restricted Share awards are categorised as the interests of a beneficial owner.
| 1 | Includes additional shares arising from scrip dividends. |
| 2 | 33% of the award vests on each of the first and second anniversaries of the date of the award, with the balance vesting on the third anniversary of the date of the award. In the case of the awards granted on 15 March 2011 the shares (net of tax) are subject to a six month retention period following each vesting date. |
| 3 | At the date of vesting, 27 February 2012, the market value per share was £5.54. The market value per share on the date of the award, 1 March 2010, was £6.82. |
| 4 | At the date of vesting, 15 March 2012, the market value per share was £5.75. The market value per share on the date of the award, 15 March 2011, was £6.46. |
| 5 | Retired as an executive Director on 30 April 2012. The vesting of the awards will continue in line with the vesting schedule set at the date of grant and will also continue to accrue scrip dividends subject to the terms of the Plan. |
| 6 | At the date of vesting, 5 March 2012, the market value per share was £5.59. The market value per share on the date of the award, 2 March 2009, was £3.99. |
Awards of Restricted Shares
HSBC Share Plan 2011
HSBC Holdings ordinary shares
Year in which | Awards held at | Awards made during year | Awards vested during year | Awards 31 Dec 2012 | ||||||||||||||||||||||||||||||||||
| Date of award | awards may vest | 1 Jan 2012 | Number | Monetary value | Number | Monetary value | (or date of retirement)1 | |||||||||||||||||||||||||||||||
| £000 | £000 | |||||||||||||||||||||||||||||||||||||
A A Flockhart2 | 28 Feb 2012 | 3 | 2012 | – | 68,941 | 385 | 68,941 | 385 | – | |||||||||||||||||||||||||||||
| 12 Mar 2012 | 4 | 2013-2015 | – | 207,546 | 1,154 | – | – | 213,044 | ||||||||||||||||||||||||||||||
| 12 Mar 2012 | 5 | 2012 | – | 69,182 | 385 | 69,182 | 385 | – | ||||||||||||||||||||||||||||||
S T Gulliver | 28 Feb 2012 | 3 | 2012 | – | 77,167 | 431 | 77,167 | 431 | – | |||||||||||||||||||||||||||||
| 12 Mar 2012 | 4 | 2013-2015 | – | 232,312 | 1,292 | – | – | 243,078 | ||||||||||||||||||||||||||||||
| 12 Mar 2012 | 5 | 2012 | – | 77,437 | 431 | 77,437 | 431 | – | ||||||||||||||||||||||||||||||
I J Mackay | 28 Feb 2012 | 3 | 2012 | – | 38,854 | 217 | 38,854 | 217 | – | |||||||||||||||||||||||||||||
| 12 Mar 2012 | 4 | 2013-2015 | – | 116,968 | 650 | – | – | 122,390 | ||||||||||||||||||||||||||||||
| 12 Mar 2012 | 5 | 2012 | – | 38,989 | 217 | 38,989 | 217 | – | ||||||||||||||||||||||||||||||
Vesting of Restricted Share awards is normally subject to the Director remaining an employee on the vesting date. The vesting date may be advanced to an earlier date in certain circumstances, for example, death. Under the Securities and Futures Ordinance of Hong Kong, interests in Restricted Share awards are categorised as the interests of a beneficial owner.
364
Table of Contents
HSBC HOLDINGS PLC
Directors’ Remuneration Report(continued)
| 1 | Includes additional shares arising from scrip dividends. |
| 2 | Retired as an executive Director on 30 April 2012. The vesting of the awards will continue in line with the vesting schedule set at the date of grant and will also continue to accrue scrip dividends subject to the terms of the plan. |
| 3 | The non-deferred award vested immediately on 28 February 2012. At the date of vesting the market value per share was £5.59. |
| 4 | At the date of the award, 12 March 2012, the market value per share was £5.56. 50% of these deferred awards are subject to a six month retention period upon vesting. 33% of the awards vest on each of the first and second anniversaries of the date of the awards, with the balance vesting on the third anniversary of the date of the award. |
| 5 | The non-deferred award vested immediately on 12 March 2012 and the shares (net of tax) were subject to a six month retention period. At the date of vesting, the market value per share was £5.56. |
Conditional Awards under the GPSP
HSBC Share Plan 2011
HSBC Holdings ordinary shares
Year in which | Awards held at | Awards made during year1 | Awards held at 31 Dec 2012 | |||||||||||||||||||||||||||||||
| Date of award | awards may vest | 1 Jan 2012 | Number | Monetary value | (or date of retirement)2 | |||||||||||||||||||||||||||||
| £000 | ||||||||||||||||||||||||||||||||||
A A Flockhart3 | 23 Jun 2011 | 2016 | 178,373 | – | – | 185,319 | ||||||||||||||||||||||||||||
S T Gulliver | 23 Jun 2011 | 2016 | 392,119 | – | – | 415,270 | ||||||||||||||||||||||||||||
| 12 Mar 2012 | 2017 | – | 673,370 | 3,744 | 704,583 | |||||||||||||||||||||||||||||
I J Mackay | 23 Jun 2011 | 2016 | 109,626 | – | – | 116,099 | ||||||||||||||||||||||||||||
| 12 Mar 2012 | 2017 | – | 125,695 | 699 | 131,522 | |||||||||||||||||||||||||||||
The GPSP is the long-term incentive plan under the HSBC Share Plan 2011. Vesting of GPSP awards is normally subject to the Director remaining an employee on the vesting date. Any shares (net of tax) which the Director becomes entitled to on the vesting date are subject to a retention requirement until cessation of employment. Under the Securities and Futures Ordinance of Hong Kong, interests in awards are categorised as the interests of a beneficial owner.
| 1 | At the date of award, 12 March 2012, the market value per share was £5.56. |
| 2 | Includes additional shares arising from scrip dividends. |
| 3 | Retired as an executive Director on 30 April 2012. The vesting of the awards will continue in line with the vesting schedule set at the date of grant and will also continue to accrue scrip dividends. |
Defined Benefit Pension arrangements
Accrued annual 31 December | Increase in accrued pension during 2012 | Increase in for inflation | Transfer value of accrued pension at 31 December 20111 | Transfer value of accrued 20121 | Increase of in 20121 | Transfer value increase for inflation1 | ||||||||||||||||||||||
| £000 | £000 | £000 | £000 | £000 | £000 | £000 | ||||||||||||||||||||||
A A Flockhart2 | 339 | 32 | 15 | 5,638 | 6,105 | 467 | 251 | |||||||||||||||||||||
| 1 | The transfer value represents a liability of HSBC’s pension fund (the International Staff Retirement Benefits Scheme (‘ISRBS’)) and not a sum paid or due to the individual; it cannot therefore meaningfully be added to annual remuneration. |
| 2 | A A Flockhart ceased accrual of pension in the ISRBS on 30 November 2008 and he has deferred commencement of his pension. The ISRBS retains a liability for a contingent spouse’s pension of £140,000 per annum as at 31 December 2012. Although A A Flockhart retired as an executive Director on 30 April 2012, this does not affect his benefits within the ISRBS. |
The following table shows unfunded pension payments, in respect of which provision has been made, during 2012 to six former Directors of HSBC Holdings.
The payments in respect of R Delbridge and Sir Brian Pearse were made by HSBC Bank plc as former directors of that bank. The payment in respect of C F W de Croisset was made by HSBC France as a former director of that bank.
365
Table of Contents
HSBC HOLDINGS PLC
Directors’ Remuneration Report(continued)
Unfunded pension payments
(Audited)
2012 £ | 2011 £ | |||||||||
B H Asher | 111,763 | 106,441 | ||||||||
C F W de Croisset | 239,423 | 250,910 | ||||||||
R Delbridge | 160,754 | 153,099 | ||||||||
Lord Green | 42,174 | 40,946 | ||||||||
Sir Brian Pearse | 67,036 | 63,844 | ||||||||
Sir William Purves | 118,313 | 112,679 | ||||||||
| 739,463 | 727,919 | |||||||||
Employee compensation and benefits
Set out below are details of emoluments paid to senior management (being executive Directors and Group Managing Directors of HSBC Holdings) for the year ended 31 December 2012 or for the period of appointment as a Director or Group Managing Director.
Emoluments of senior management
Senior management £000 | ||||||
Basic salaries, allowances and benefits in kind | 15,461 | |||||
Pension contributions | 315 | |||||
Performance-related pay paid or receivable | 33,066 | |||||
Inducements to join paid or receivable | – | |||||
Compensation for loss of office | 715 | |||||
Total | 49,557 | |||||
Total (US$000) | 78,531 | |||||
The aggregate emoluments of senior management for the year ended 31 December 2012 was US$78,531,390. The emoluments of senior management were within the following bands:
Number senior management | ||||||
£0 – £1,000,000 | 3 | |||||
£1,000,001 – £2,000,000 | 1 | |||||
£2,000,001 – £3,000,000 | 5 | |||||
£3,000,001 – £4,000,000 | 4 | |||||
£4,000,001 – £5,000,000 | 1 | |||||
£7,000,001 – £8,000,000 | 2 | |||||
The aggregate amount set aside or accrued to provide pension, retirement or similar benefits for executive Directors and senior management for the year ended 31 December 2012 was US$499,285.
Set out below are details of remuneration paid to the five individuals whose emoluments were the highest in HSBC (including two executive Directors and two Group Managing Directors of HSBC Holdings), for the year ended 31 December 2012.
Emoluments of the five highest paid employees
5 highest paid employees £000 | ||||||
Basic salaries, allowances and benefits in kind | 6,112 | |||||
Pension contributions | 155 | |||||
Performance-related pay paid or receivable | 21,513 | |||||
Inducements to join paid or receivable | – | |||||
Compensation for loss of office | – | |||||
Total | 27,780 | |||||
Total (US$000) | 44,022 | |||||
366
Table of Contents
HSBC HOLDINGS PLC
Directors’ Remuneration Report(continued)
The emoluments of the five highest paid employees were within the following bands:
Number of 5 highest paid employees | ||||||
£3,800,001 – £3,900,000 | 1 | |||||
£4,600,001 – £4,700,000 | 1 | |||||
£4,800,001 – £4,900,000 | 1 | |||||
£7,000,001 – £7,100,000 | 1 | |||||
£7,400,001 – £7,500,000 | 1 | |||||
Remuneration of eight highest paid senior executives (members of the GMB, but not Directors of HSBC Holdings)
| Employee | ||||||||||||||||||||||||||||||||||||||||||||||
| 1 | 2 | 3 | 4 | 5 | 6 | 7 | 8 | |||||||||||||||||||||||||||||||||||||||
| £000 | £000 | £000 | £000 | £000 | £000 | £000 | £000 | |||||||||||||||||||||||||||||||||||||||
Fixed | ||||||||||||||||||||||||||||||||||||||||||||||
Cash based | 650 | 632 | 650 | 650 | 650 | 650 | 851 | 488 | ||||||||||||||||||||||||||||||||||||||
Total fixed | 650 | 632 | 650 | 650 | 650 | 650 | 851 | 488 | ||||||||||||||||||||||||||||||||||||||
Annual incentive1 | ||||||||||||||||||||||||||||||||||||||||||||||
Cash | 955 | 331 | 262 | 340 | 277 | 272 | 227 | 180 | ||||||||||||||||||||||||||||||||||||||
Non-deferred shares2 | 955 | 331 | 262 | 340 | 277 | 272 | 227 | 180 | ||||||||||||||||||||||||||||||||||||||
Deferred cash3 | 1,433 | 496 | 393 | 510 | 415 | 407 | 341 | 270 | ||||||||||||||||||||||||||||||||||||||
Deferred shares3 | 1,433 | 496 | 393 | 510 | 415 | 407 | 341 | 270 | ||||||||||||||||||||||||||||||||||||||
| Total annual incentive | 4,776 | 1,654 | 1,310 | 1,700 | 1,384 | 1,358 | 1,136 | 900 | ||||||||||||||||||||||||||||||||||||||
Long-term incentive plan (GPSP) | ||||||||||||||||||||||||||||||||||||||||||||||
Deferred shares | 1,560 | 1,517 | 1,560 | 1,040 | 780 | 780 | 681 | 976 | ||||||||||||||||||||||||||||||||||||||
Total variable pay | 6,336 | 3,171 | 2,870 | 2,740 | 2,164 | 2,138 | 1,817 | 1,876 | ||||||||||||||||||||||||||||||||||||||
Total remuneration | 6,986 | 3,803 | 3,520 | 3,390 | 2,814 | 2,788 | 2,668 | 2,364 | ||||||||||||||||||||||||||||||||||||||
US$000 | ||||||||||||||||||||||||||||||||||||||||||||||
Total remuneration | 11,070 | 6,026 | 5,578 | 5,372 | 4,459 | 4,418 | 4,228 | 3,746 | ||||||||||||||||||||||||||||||||||||||
| 1 | Annual incentive in respect of performance year 2012. |
| 2 | Awards vested, subject to a six month retention period. |
| 3 | Awards vest 100% after five years subject to the successful completion of the Deferred Prosecution Agreements and subject to the terms of the Plan. |
367
Table of Contents
This page is intentionally left blank.
368
Table of Contents
HSBC HOLDINGS PLC
Report of Independent Registered Public Accounting Firm to the Board of Directors and Shareholders of HSBC Holdings plc
We have audited the accompanying consolidated financial statements of HSBC Holdings plc and its subsidiary undertakings (together HSBC) on pages 372 to 515 which comprise the consolidated balance sheets as of 31 December 2012 and 2011, and the related consolidated income statements, consolidated statements of cash flows, consolidated statements of comprehensive income and consolidated statements of changes in equity, for each of the years in the three-year period ended 31 December 2012, including the disclosures marked ‘audited’ within the critical accounting policies on pages 54 to 57, the ‘Report of the Directors: Risk’ section on pages 123 to 280 and the ‘Report of the Directors: Capital’ section on page 281 to 300. We have also audited HSBC’s internal control over financial reporting as of 31 December 2012, based on the framework for Directors’ internal control evaluation contained withinInternal control: Revised guidance for directors on the Combined Code (Turnbull Guidance), and the criteria established inInternal Control – Integrated Framework issued by the Committee of Sponsoring Organisations of the Treadway Commission (‘COSO’). HSBC’s management is responsible for these consolidated financial statements, for maintaining effective internal control over financial reporting, and for its assessment of the effectiveness of internal control over financial reporting, included in the accompanying ‘Management’s Assessment of Internal Controls’. Our responsibility is to express an opinion on these consolidated financial statements and an opinion on the effectiveness of HSBC’s internal control over financial reporting based on our audits.
We conducted our audits in accordance with the standards of the Public Company Accounting Oversight Board (United States). Those standards require that we plan and perform the audits to obtain reasonable assurance about whether the financial statements are free of material misstatement and whether effective internal control over financial reporting was maintained in all material respects. Our audits of the consolidated financial statements included examining, on a test basis, evidence supporting the amounts and disclosures in the financial statements, assessing the accounting principles used and significant estimates made by management, and evaluating the overall financial statement presentation. Our audit of internal control over financial reporting included obtaining an understanding of internal control over financial reporting, assessing the risk that a material weakness exists, and testing and evaluating the design and operating effectiveness of internal control based on assessed risk. Our audits also included performing other such procedures as we considered necessary in the circumstances. We believe that our audits provide a reasonable basis for our opinions.
A company’s internal control over financial reporting is a process designed to provide reasonable assurance regarding the reliability of financial reporting and the preparation of financial statements for external purposes in accordance with generally accepted accounting principles. A company’s internal control over financial reporting includes those policies and procedures that (1) pertain to the maintenance of records that, in reasonable detail, accurately and fairly reflect the transactions and dispositions of the assets of the company; (2) provide reasonable assurance that transactions are recorded as necessary to permit preparation of financial statements in accordance with generally accepted accounting principles, and that receipts and expenditures of the company are being made only in accordance with authorisations of management and directors of the company; and (3) provide reasonable assurance regarding prevention or timely detection of unauthorised acquisition, use, or disposition of the company’s assets that could have a material effect on the financial statements.
Because of its inherent limitations, internal control over financial reporting may not prevent or detect misstatements. Also, projections of any evaluation of effectiveness to future periods are subject to the risk that controls may become inadequate because of changes in conditions, or that the degree of compliance with the policies or procedures may deteriorate.
In our opinion, the consolidated financial statements referred to above present fairly, in all material respects, the financial position of HSBC as of 31 December 2012 and 2011, and the results of its operations and its cash flows for each of the years in the three-year period ended 31 December 2012, in conformity with International Financial Reporting Standards (‘IFRSs’) as adopted by the European Union (‘EU’) and IFRSs as issued by the International Accounting Standards Board (‘IASB’). Also, in our opinion, HSBC maintained, in all material respects, effective internal control over financial reporting as of 31 December 2012, based on the framework for Directors’ internal control evaluation contained withinInternal control: Revised guidance for directors on the Combined Code (Turnbull Guidance), and the criteria established inInternal Control – Integrated Framework issued by the Committee of Sponsoring Organisations of the Treadway Commission (‘COSO’).
KPMG Audit Plc
London, England
4 March 2013
369
Table of Contents
This page is intentionally left blank
370
Table of Contents
HSBC HOLDINGS PLC
Financial Statements and Notes on the Financial Statements
| Page | ||||||
Financial Statements |
| |||||
| 372 | ||||||
| 373 | ||||||
| 374 | ||||||
| 375 | ||||||
| 376 | ||||||
| 379 | ||||||
| 380 | ||||||
| 381 | ||||||
| ||||||
1 | 383 | |||||
2 | 387 | |||||
3 | Net income/(expense) from financial instruments designated at fair value | 406 | ||||
4 | 407 | |||||
5 | Net insurance claims incurred and movement in liabilities to policyholders | 407 | ||||
6 | 408 | |||||
7 | 409 | |||||
8 | 419 | |||||
9 | 421 | |||||
10 | 425 | |||||
11 | 426 | |||||
12 | 426 | |||||
13 | Analysis of financial assets and liabilities by measurement basis | 432 | ||||
14 | 436 | |||||
15 | 437 | |||||
16 | Fair values of financial instruments not carried at fair value | 447 | ||||
17 | 450 | |||||
| Page | ||||||
18 | 451 | |||||
19 | 452 | |||||
20 | 456 | |||||
21 | 458 | |||||
22 | 460 | |||||
23 | 463 | |||||
24 | 467 | |||||
25 | 469 | |||||
26 | 471 | |||||
27 | 473 | |||||
28 | 473 | |||||
29 | 474 | |||||
30 | Liabilities of disposal groups held for sale and other liabilities | 475 | ||||
31 | 475 | |||||
32 | 478 | |||||
33 | 480 | |||||
34 | Maturity analysis of assets, liabilities and off-balance sheet commitments | 485 | ||||
35 | 493 | |||||
36 | Assets charged as security for liabilities and collateral accepted as security for assets | 493 | ||||
37 | 494 | |||||
38 | 495 | |||||
39 | 498 | |||||
40 | Contingent liabilities, contractual commitments and guarantees | 500 | ||||
41 | 501 | |||||
42 | 502 | |||||
43 | 506 | |||||
44 | 512 | |||||
45 | 515 | |||||
46 | 515 | |||||
371
Table of Contents
HSBC HOLDINGS PLC
Financial Statements(continued)
Consolidated income statement for the year ended 31 December 2012
| Notes | 2012 US$m | 2011 US$m | 2010 US$m | |||||||||||||||||
Interest income | 56,702 | 63,005 | 58,345 | |||||||||||||||||
Interest expense | (19,030 | ) | (22,343 | ) | (18,904 | ) | ||||||||||||||
Net interest income | 37,672 | 40,662 | 39,441 | |||||||||||||||||
Fee income | 20,149 | 21,497 | 21,117 | |||||||||||||||||
Fee expense | (3,719 | ) | (4,337 | ) | (3,762 | ) | ||||||||||||||
Net fee income | 16,430 | 17,160 | 17,355 | |||||||||||||||||
Trading income excluding net interest income | 4,408 | 3,283 | 4,680 | |||||||||||||||||
Net interest income on trading activities | 2,683 | 3,223 | 2,530 | |||||||||||||||||
Net trading income | 7,091 | 6,506 | 7,210 | |||||||||||||||||
Changes in fair value of long-term debt issued and related derivatives | (4,327 | ) | 4,161 | (258 | ) | |||||||||||||||
Net income/(expense) from other financial instruments designated at fair value | 2,101 | (722 | ) | 1,478 | ||||||||||||||||
Net income/(expense) from financial instruments designated at fair value | 3 | (2,226 | ) | 3,439 | 1,220 | |||||||||||||||
Gains less losses from financial investments | 1,189 | 907 | 968 | |||||||||||||||||
Dividend income | 221 | 149 | 112 | |||||||||||||||||
Net earned insurance premiums | 4 | 13,044 | 12,872 | 11,146 | ||||||||||||||||
Gains on disposal of US branch network, US cards business and Ping An Insurance (Group) Company of China, Limited | 26 | 7,024 | – | – | ||||||||||||||||
Other operating income | 2,100 | 1,766 | 2,562 | |||||||||||||||||
Total operating income | 82,545 | 83,461 | 80,014 | |||||||||||||||||
Net insurance claims incurred and movement in liabilities to policyholders | 5 | (14,215 | ) | (11,181 | ) | (11,767 | ) | |||||||||||||
Net operating income before loan impairment charges and other credit risk provisions | 68,330 | 72,280 | 68,247 | |||||||||||||||||
Loan impairment charges and other credit risk provisions | 6 | (8,311 | ) | (12,127 | ) | (14,039 | ) | |||||||||||||
Net operating income | 60,019 | 60,153 | 54,208 | |||||||||||||||||
Employee compensation and benefits | 7 | (20,491 | ) | (21,166 | ) | (19,836 | ) | |||||||||||||
General and administrative expenses | (19,983 | ) | (17,459 | ) | (15,156 | ) | ||||||||||||||
Depreciation and impairment of property, plant and equipment | 24 | (1,484 | ) | (1,570 | ) | (1,713 | ) | |||||||||||||
Amortisation and impairment of intangible assets | 23 | (969 | ) | (1,350 | ) | (983 | ) | |||||||||||||
Total operating expenses | (42,927 | ) | (41,545 | ) | (37,688 | ) | ||||||||||||||
Operating profit | 6 | 17,092 | 18,608 | 16,520 | ||||||||||||||||
Share of profit in associates and joint ventures | 22 | 3,557 | 3,264 | 2,517 | ||||||||||||||||
Profit before tax | 20,649 | 21,872 | 19,037 | |||||||||||||||||
Tax expense | 9 | (5,315 | ) | (3,928 | ) | (4,846 | ) | |||||||||||||
Profit for the year | 15,334 | 17,944 | 14,191 | |||||||||||||||||
Profit attributable to shareholders of the parent company | 14,027 | 16,797 | 13,159 | |||||||||||||||||
Profit attributable to non-controlling interests | 1,307 | 1,147 | 1,032 | |||||||||||||||||
| US$ | US$ | US$ | ||||||||||||||||||
Basic earnings per ordinary share | 11 | 0.74 | 0.92 | 0.73 | ||||||||||||||||
Diluted earnings per ordinary share | 11 | 0.74 | 0.91 | 0.72 | ||||||||||||||||
The accompanying notes on pages 383 to 515 form an integral part of these financial statements1.
For footnote, see page 382.
372
Table of Contents
HSBC HOLDINGS PLC
Financial Statements(continued)
Consolidated statement of comprehensive income for the year ended 31 December 2012
2012 US$m | 2011 US$m | 2010 US$m | ||||||||||||||
Profit for the year | 15,334 | 17,944 | 14,191 | |||||||||||||
Other comprehensive income/(expense) | ||||||||||||||||
Available-for-sale investments | 5,070 | 674 | 5,835 | |||||||||||||
– fair value gains2 | 6,396 | 1,279 | 6,368 | |||||||||||||
– fair value gains transferred to the income statement on disposal | (1,872 | ) | (820 | ) | (1,174 | ) | ||||||||||
– amounts transferred to the income statement in respect of impairment losses | 1,002 | 583 | 1,118 | |||||||||||||
– income taxes | (456 | ) | (368 | ) | (477 | ) | ||||||||||
Cash flow hedges | 109 | 187 | (271 | ) | ||||||||||||
– fair value gains/(losses) | 552 | (581 | ) | (178 | ) | |||||||||||
– fair value (gains)/losses transferred to the income statement | (423 | ) | 788 | (164 | ) | |||||||||||
– income taxes | (20 | ) | (20 | ) | 71 | |||||||||||
Actuarial gains/(losses) on defined benefit plans | (195 | ) | 1,009 | (61 | ) | |||||||||||
– before income taxes | (391 | ) | 1,267 | (60 | ) | |||||||||||
– income taxes | 196 | (258 | ) | (1 | ) | |||||||||||
Share of other comprehensive income/(expense) of associates and joint ventures | 533 | (710 | ) | 107 | ||||||||||||
– share for the year | 311 | (710 | ) | 107 | ||||||||||||
– reclassified to income statement on disposal | 222 | – | – | |||||||||||||
Exchange differences | 1,017 | (2,865 | ) | (567 | ) | |||||||||||
– foreign exchange gains reclassified to income statement on disposal of a foreign operation | (1,128 | ) | – | – | ||||||||||||
– other exchange difference | 2,145 | (2,865 | ) | (567 | ) | |||||||||||
Income tax attributable to exchange differences | – | 165 | – | |||||||||||||
Other comprehensive income for the year, net of tax | 6,534 | (1,540 | ) | 5,043 | ||||||||||||
Total comprehensive income for the year | 21,868 | 16,404 | 19,234 | |||||||||||||
Total comprehensive income for the year attributable to: | ||||||||||||||||
– shareholders of the parent company | 20,455 | 15,366 | 18,087 | |||||||||||||
– non-controlling interests | 1,413 | 1,038 | 1,147 | |||||||||||||
| 21,868 | 16,404 | 19,234 | ||||||||||||||
The accompanying notes on pages 383 to 515 form an integral part of these financial statements1.
For footnote, see page 382.
373
Table of Contents
HSBC HOLDINGS PLC
Financial Statements(continued)
Consolidated balance sheet at 31 December 2012
| Notes | 2012 US$m | 2011 US$m | ||||||||||||
Assets | ||||||||||||||
Cash and balances at central banks | 141,532 | 129,902 | ||||||||||||
Items in the course of collection from other banks | 7,303 | 8,208 | ||||||||||||
Hong Kong Government certificates of indebtedness | 22,743 | 20,922 | ||||||||||||
Trading assets | 14 | 408,811 | 330,451 | |||||||||||
Financial assets designated at fair value | 18 | 33,582 | 30,856 | |||||||||||
Derivatives | 19 | 357,450 | 346,379 | |||||||||||
Loans and advances to banks | 152,546 | 180,987 | ||||||||||||
Loans and advances to customers | 997,623 | 940,429 | ||||||||||||
Financial investments | 20 | 421,101 | 400,044 | |||||||||||
Assets held for sale | 26 | 19,269 | 39,558 | |||||||||||
Other assets | 26 | 54,716 | 48,699 | |||||||||||
Current tax assets | 515 | 1,061 | ||||||||||||
Prepayments and accrued income | 9,502 | 10,059 | ||||||||||||
Interests in associates and joint ventures | 22 | 17,834 | 20,399 | |||||||||||
Goodwill and intangible assets | 23 | 29,853 | 29,034 | |||||||||||
Property, plant and equipment | 24 | 10,588 | 10,865 | |||||||||||
Deferred tax assets | 9 | 7,570 | 7,726 | |||||||||||
Total assets | 2,692,538 | 2,555,579 | ||||||||||||
Liabilities and equity | ||||||||||||||
Liabilities | ||||||||||||||
Hong Kong currency notes in circulation | 22,742 | 20,922 | ||||||||||||
Deposits by banks | 107,429 | 112,822 | ||||||||||||
Customer accounts | 1,340,014 | 1,253,925 | ||||||||||||
Items in the course of transmission to other banks | 7,138 | 8,745 | ||||||||||||
Trading liabilities | 27 | 304,563 | 265,192 | |||||||||||
Financial liabilities designated at fair value | 28 | 87,720 | 85,724 | |||||||||||
Derivatives | 19 | 358,886 | 345,380 | |||||||||||
Debt securities in issue | 29 | 119,461 | 131,013 | |||||||||||
Liabilities of disposal groups held for sale | 30 | 5,018 | 22,200 | |||||||||||
Other liabilities | 30 | 33,862 | 27,967 | |||||||||||
Current tax liabilities | 1,452 | 2,117 | ||||||||||||
Liabilities under insurance contracts | 31 | 68,195 | 61,259 | |||||||||||
Accruals and deferred income | 13,184 | 13,106 | ||||||||||||
Provisions | 32 | 5,252 | 3,324 | |||||||||||
Deferred tax liabilities | 9 | 1,109 | 1,518 | |||||||||||
Retirement benefit liabilities | 7 | 3,905 | 3,666 | |||||||||||
Subordinated liabilities | 33 | 29,479 | 30,606 | |||||||||||
Total liabilities | 2,509,409 | 2,389,486 | ||||||||||||
Equity | ||||||||||||||
Called up share capital | 38 | 9,238 | 8,934 | |||||||||||
Share premium account | 10,084 | 8,457 | ||||||||||||
Other equity instruments | 5,851 | 5,851 | ||||||||||||
Other reserves | 29,722 | 23,615 | ||||||||||||
Retained earnings | 120,347 | 111,868 | ||||||||||||
Total shareholders’ equity | 175,242 | 158,725 | ||||||||||||
Non-controlling interests | 37 | 7,887 | 7,368 | |||||||||||
Total equity | 183,129 | 166,093 | ||||||||||||
Total equity and liabilities | 2,692,538 | 2,555,579 | ||||||||||||
The accompanying notes on pages 383 to 515 form an integral part of these financial statements1.
For footnote, see page 382.

D J Flint,Group Chairman
374
Table of Contents
HSBC HOLDINGS PLC
Financial Statements(continued)
Consolidated statement of cash flows for the year ended 31 December 2012
| Notes | 2012 US$m | 2011 US$m | 2010 US$m | |||||||||||||||||
Cash flows from operating activities | ||||||||||||||||||||
Profit before tax | 20,649 | 21,872 | 19,037 | |||||||||||||||||
Adjustments for: | ||||||||||||||||||||
– net gain from investing activities | (2,094 | ) | (1,196 | ) | (1,698 | ) | ||||||||||||||
– share of profits in associates and joint ventures | (3,557 | ) | (3,264 | ) | (2,517 | ) | ||||||||||||||
– gain on disposal of US branch network, US cards business and Ping An Insurance (Group) Company of China, Limited | (7,024 | ) | – | – | ||||||||||||||||
– other non-cash items included in profit before tax | 39 | 19,778 | 19,878 | 18,887 | ||||||||||||||||
– change in operating assets | 39 | (116,521 | ) | (7,412 | ) | (13,267 | ) | |||||||||||||
– change in operating liabilities | 39 | 89,070 | 44,012 | 42,272 | ||||||||||||||||
– elimination of exchange differences3 | (3,626 | ) | 10,840 | (1,799 | ) | |||||||||||||||
– dividends received from associates | 489 | 304 | 441 | |||||||||||||||||
– contributions paid to defined benefit plans | (733 | ) | (1,177 | ) | (3,321 | ) | ||||||||||||||
– tax paid | (5,587 | ) | (4,095 | ) | (2,293 | ) | ||||||||||||||
Net cash (used in)/generated from operating activities | (9,156 | ) | 79,762 | 55,742 | ||||||||||||||||
Cash flows from investing activities | ||||||||||||||||||||
Purchase of financial investments | (342,974 | ) | (319,008 | ) | (341,202 | ) | ||||||||||||||
Proceeds from the sale and maturity of financial investments | 329,926 | 311,702 | 321,846 | |||||||||||||||||
Purchase of property, plant and equipment | (1,318 | ) | (1,505 | ) | (2,533 | ) | ||||||||||||||
Proceeds from the sale of property, plant and equipment | 241 | 300 | 4,373 | |||||||||||||||||
Proceeds from the sale of loan portfolios | – | – | 4,243 | |||||||||||||||||
Net purchase of intangible assets | (1,008 | ) | (1,571 | ) | (1,179 | ) | ||||||||||||||
Net cash outflow from acquisition of subsidiaries | – | – | (86 | ) | ||||||||||||||||
Net cash inflow from disposal of US branch network and US cards business | 20,905 | – | – | |||||||||||||||||
Net cash inflow/(outflow) from disposal of other subsidiaries and businesses | (863 | ) | 216 | 466 | ||||||||||||||||
Net cash outflow from acquisition of or increase in stake of associates | (1,804 | ) | (90 | ) | (1,589 | ) | ||||||||||||||
Net cash outflow from the deconsolidation of funds | – | – | (19,566 | ) | ||||||||||||||||
Proceeds from disposal of Ping An Insurance (Group) Company of China Limited | 1,954 | – | – | |||||||||||||||||
Proceeds from disposal of other associates and joint ventures | 594 | 25 | 254 | |||||||||||||||||
Net cash generated/(used) in investing activities | 5,653 | (9,931 | ) | (34,973 | ) | |||||||||||||||
Cash flows from financing activities | ||||||||||||||||||||
Issue of ordinary share capital | 594 | 96 | 180 | |||||||||||||||||
Issue of other equity instruments | – | – | 3,718 | |||||||||||||||||
Net sales/(purchases) of own shares for market-making and investment purposes | (25 | ) | (225 | ) | 163 | |||||||||||||||
Net sales/(purchases) of own shares to meet share awards and share option awards | – | (136 | ) | 11 | ||||||||||||||||
On exercise of share options | – | – | 2 | |||||||||||||||||
Subordinated loan capital issued | 37 | 7 | 4,481 | |||||||||||||||||
Subordinated loan capital repaid | (1,754 | ) | (3,777 | ) | (2,475 | ) | ||||||||||||||
Net cash inflow/(outflow) from change in stake in subsidiaries | (14 | ) | 104 | (229 | ) | |||||||||||||||
Dividends paid to shareholders of the parent company | (5,925 | ) | (5,014 | ) | (3,441 | ) | ||||||||||||||
Dividends paid to non-controlling interests | (572 | ) | (568 | ) | (595 | ) | ||||||||||||||
Dividends paid to holders of other equity instruments | (573 | ) | (573 | ) | (413 | ) | ||||||||||||||
Net cash generated from/(used in) financing activities | (8,232 | ) | (10,086 | ) | 1,402 | |||||||||||||||
Net increase/(decrease) in cash and cash equivalents | (11,735 | ) | 59,745 | 22,171 | ||||||||||||||||
Cash and cash equivalents at 1 January | 325,449 | 274,076 | 250,766 | |||||||||||||||||
Exchange differences in respect of cash and cash equivalents | 1,594 | (8,372 | ) | 1,139 | ||||||||||||||||
Cash and cash equivalents at 31 December | 39 | 315,308 | 325,449 | 274,076 | ||||||||||||||||
The accompanying notes on pages 383 to 515 form an integral part of these financial statements1.
For footnote, see page 382.
375
Table of Contents
HSBC HOLDINGS PLC
Financial Statements(continued)
Consolidated statement of changes in equity for the year ended 31 December 2012
| 2012 | ||||||||||||||||||||||||||||||||||||||||||||||||||||||||||||||||
| Other reserves | ||||||||||||||||||||||||||||||||||||||||||||||||||||||||||||||||
| Called up share capital US$m | Share Premium4 | Other equity instru- ments US$m | Retained 5,6,7 | Available- for-sale fair value reserve US$m | Cash flow hedging reserve8 | Foreign exchange reserve US$m | Merger Reserve5,9 | Total share- holders’ equity US$m | Non- interests | Total equity US$m | ||||||||||||||||||||||||||||||||||||||||||||||||||||||
At 1 January | 8,934 | 8,457 | 5,851 | 111,868 | (3,361 | ) | (95 | ) | (237 | ) | 27,308 | 158,725 | 7,368 | 166,093 | ||||||||||||||||||||||||||||||||||||||||||||||||||
Profit for the year | – | – | – | 14,027 | – | – | – | – | 14,027 | 1,307 | 15,334 | |||||||||||||||||||||||||||||||||||||||||||||||||||||
Other comprehensive income (net of tax) | – | – | – | 321 | 5,010 | 108 | 989 | – | 6,428 | 106 | 6,534 | |||||||||||||||||||||||||||||||||||||||||||||||||||||
Available-for-sale investments | – | – | – | – | 5,010 | – | – | – | 5,010 | 60 | 5,070 | |||||||||||||||||||||||||||||||||||||||||||||||||||||
Cash flow hedges | – | – | – | – | – | 108 | – | – | 108 | 1 | 109 | |||||||||||||||||||||||||||||||||||||||||||||||||||||
Actuarial gains/(losses) on defined benefit plans | – | – | – | (212 | ) | – | – | – | – | (212 | ) | 17 | (195 | ) | ||||||||||||||||||||||||||||||||||||||||||||||||||
Share of other comprehensive income of associates and joint ventures | 533 | 533 | 533 | |||||||||||||||||||||||||||||||||||||||||||||||||||||||||||||
Exchange differences | – | – | – | – | – | – | 989 | – | 989 | 28 | 1,017 | |||||||||||||||||||||||||||||||||||||||||||||||||||||
| ||||||||||||||||||||||||||||||||||||||||||||||||||||||||||||||||
Total comprehensive income for the year | – | – | – | 14,348 | 5,010 | 108 | 989 | – | 20,455 | 1,413 | 21,868 | |||||||||||||||||||||||||||||||||||||||||||||||||||||
Shares issued under employee remuneration and share plans | 119 | 1,812 | – | (1,337 | ) | – | – | – | – | 594 | – | 594 | ||||||||||||||||||||||||||||||||||||||||||||||||||||
Shares issued in lieu of dividends and amounts arising thereon4 | 185 | (185 | ) | – | 2,429 | – | – | – | – | 2,429 | – | 2,429 | ||||||||||||||||||||||||||||||||||||||||||||||||||||
Dividends to shareholders10 | – | – | – | (8,042 | ) | – | – | – | – | (8,042 | ) | (707 | ) | (8,749 | ) | |||||||||||||||||||||||||||||||||||||||||||||||||
Tax credit on distributions | – | – | – | 32 | – | – | – | – | 32 | – | 32 | |||||||||||||||||||||||||||||||||||||||||||||||||||||
Own shares adjustment | – | – | – | 2 | – | – | – | – | 2 | – | 2 | |||||||||||||||||||||||||||||||||||||||||||||||||||||
Cost of share-based payment arrangements | – | – | – | 988 | – | – | – | – | 988 | – | 988 | |||||||||||||||||||||||||||||||||||||||||||||||||||||
Income taxes on share-based payments | – | – | – | 42 | – | – | – | – | 42 | – | 42 | |||||||||||||||||||||||||||||||||||||||||||||||||||||
Other movements | – | – | – | (26 | ) | – | – | – | – | (26 | ) | (20 | ) | (46 | ) | |||||||||||||||||||||||||||||||||||||||||||||||||
Acquisition and disposal of subsidiaries | – | – | – | – | – | – | – | – | – | (108 | ) | (108 | ) | |||||||||||||||||||||||||||||||||||||||||||||||||||
Changes in ownership interests in subsidiaries that did not result in loss of control | – | – | – | 43 | – | – | – | – | 43 | (59 | ) | (16 | ) | |||||||||||||||||||||||||||||||||||||||||||||||||||
At 31 December | 9,238 | 10,084 | 5,851 | 120,347 | 1,649 | 13 | 752 | 27,308 | 175,242 | 7,887 | 183,129 | |||||||||||||||||||||||||||||||||||||||||||||||||||||
376
Table of Contents
HSBC HOLDINGS PLC
Financial Statements(continued)
Consolidated statement of changes in equity for the year ended 31 December 2012(continued)
| 2011 | ||||||||||||||||||||||||||||||||||||||||||||||||||||||||||||||||
| Other reserves | ||||||||||||||||||||||||||||||||||||||||||||||||||||||||||||||||
| Called up share capital US$m | Share Premium4 | Other equity instru- ments US$m | Retained earnings 5,6,7 US$m | Available- for-sale fair value reserve US$m | Cash flow hedging reserve8 | Foreign exchange reserve US$m | Merger Reserve5,9 | Total share- holders’ equity US$m | Non- interests | Total equity US$m | ||||||||||||||||||||||||||||||||||||||||||||||||||||||
At 1 January | 8,843 | 8,454 | 5,851 | 99,105 | (4,077 | ) | (285 | ) | 2,468 | 27,308 | 147,667 | 7,248 | 154,915 | |||||||||||||||||||||||||||||||||||||||||||||||||||
Profit for the year | – | – | – | 16,797 | – | – | – | – | 16,797 | 1,147 | 17,944 | |||||||||||||||||||||||||||||||||||||||||||||||||||||
Other comprehensive income (net of tax) | – | – | – | 368 | 716 | 190 | (2,705 | ) | – | (1,431 | ) | (109 | ) | (1,540 | ) | |||||||||||||||||||||||||||||||||||||||||||||||||
Available-for-sale investments | – | – | – | – | 716 | – | – | – | 716 | (42 | ) | 674 | ||||||||||||||||||||||||||||||||||||||||||||||||||||
Cash flow hedges | – | – | – | – | – | 190 | – | – | 190 | (3 | ) | 187 | ||||||||||||||||||||||||||||||||||||||||||||||||||||
Actuarial gains/(losses) on defined benefit plans | – | – | – | 1,078 | – | – | – | – | 1,078 | (69 | ) | 1,009 | ||||||||||||||||||||||||||||||||||||||||||||||||||||
Share of other comprehensive income of associates and joint ventures | – | – | – | (710 | ) | – | – | – | – | (710 | ) | – | (710 | ) | ||||||||||||||||||||||||||||||||||||||||||||||||||
Exchange differences | – | – | – | – | – | (2,705 | ) | – | (2,705 | ) | 5 | (2,700 | ) | |||||||||||||||||||||||||||||||||||||||||||||||||||
| ||||||||||||||||||||||||||||||||||||||||||||||||||||||||||||||||
Total comprehensive income for the year | – | – | – | 17,165 | 716 | 190 | (2,705 | ) | – | 15,366 | 1,038 | 16,404 | ||||||||||||||||||||||||||||||||||||||||||||||||||||
Shares issued under employee share plans | 6 | 90 | – | – | – | – | – | – | 96 | – | 96 | |||||||||||||||||||||||||||||||||||||||||||||||||||||
Shares issued in lieu of dividends and amounts arising thereon4 | 85 | (87 | ) | – | 2,232 | – | – | – | – | 2,230 | – | 2,230 | ||||||||||||||||||||||||||||||||||||||||||||||||||||
Dividends to shareholders10 | – | – | – | (7,501 | ) | – | – | – | – | (7,501 | ) | (815 | ) | (8,316 | ) | |||||||||||||||||||||||||||||||||||||||||||||||||
Tax credit on distributions | – | – | – | 128 | – | – | – | – | 128 | 128 | ||||||||||||||||||||||||||||||||||||||||||||||||||||||
Own shares adjustment | – | – | – | (361 | ) | – | – | – | – | (361 | ) | – | (361 | ) | ||||||||||||||||||||||||||||||||||||||||||||||||||
Cost of share-based payment arrangements | – | – | – | 1,154 | – | – | – | – | 1,154 | – | 1,154 | |||||||||||||||||||||||||||||||||||||||||||||||||||||
Income taxes on share-based payments | – | – | – | 21 | – | – | – | – | 21 | – | 21 | |||||||||||||||||||||||||||||||||||||||||||||||||||||
Other movements | – | – | – | (75 | ) | – | – | – | – | (75 | ) | 28 | (47 | ) | ||||||||||||||||||||||||||||||||||||||||||||||||||
Acquisition and disposal of subsidiaries | – | – | – | – | – | – | – | – | – | (252 | ) | (252 | ) | |||||||||||||||||||||||||||||||||||||||||||||||||||
Changes in ownership interests in subsidiaries that did not result in loss of control | – | – | – | – | – | – | – | – | – | 121 | 121 | |||||||||||||||||||||||||||||||||||||||||||||||||||||
At 31 December | 8,934 | 8,457 | 5,851 | 111,868 | (3,361 | ) | (95 | ) | (237 | ) | 27,308 | 158,725 | 7,368 | 166,093 | ||||||||||||||||||||||||||||||||||||||||||||||||||
377
Table of Contents
HSBC HOLDINGS PLC
Financial Statements(continued)
Consolidated statement of changes in equity for the year ended 31 December 2012(continued)
| 2010 | ||||||||||||||||||||||||||||||||||||||||||||||||||||||||||||||||
| Other reserves | ||||||||||||||||||||||||||||||||||||||||||||||||||||||||||||||||
| Called up share capital US$m | Share Premium4 | Other equity instru- ments US$m | Retained 5,6,7 | Available- for-sale fair value reserve US$m | Cash flow hedging reserve8 | Foreign exchange reserve US$m | Merger Reserve5,9 | Total share- holders’ equity US$m | Non- interests | Total equity US$m | ||||||||||||||||||||||||||||||||||||||||||||||||||||||
At 1 January | 8,705 | 8,413 | 2,133 | 88,737 | (9,965 | ) | (26 | ) | 2,994 | 27,308 | 128,299 | 7,362 | 135,661 | |||||||||||||||||||||||||||||||||||||||||||||||||||
Profit for the year | – | – | – | 13,159 | – | – | – | – | 13,159 | 1,032 | 14,191 | |||||||||||||||||||||||||||||||||||||||||||||||||||||
Other comprehensive income (net of tax) | – | – | – | 49 | 5,671 | (266 | ) | (526 | ) | – | 4,928 | 115 | 5,043 | |||||||||||||||||||||||||||||||||||||||||||||||||||
Available-for-sale investments | – | – | – | – | 5,671 | – | – | – | 5,671 | 164 | 5,835 | |||||||||||||||||||||||||||||||||||||||||||||||||||||
Cash flow hedges | – | – | – | – | – | (266 | ) | – | – | (266 | ) | (5 | ) | (271 | ) | |||||||||||||||||||||||||||||||||||||||||||||||||
Actuarial losses on defined benefit plans | – | – | – | (58 | ) | – | – | – | – | (58 | ) | (3 | ) | (61 | ) | |||||||||||||||||||||||||||||||||||||||||||||||||
Share of other comprehensive income of associates and joint ventures | – | – | – | 107 | – | – | – | – | 107 | – | 107 | |||||||||||||||||||||||||||||||||||||||||||||||||||||
Exchange differences | – | – | – | – | – | – | (526 | ) | – | (526 | ) | (41 | ) | (567 | ) | |||||||||||||||||||||||||||||||||||||||||||||||||
| ||||||||||||||||||||||||||||||||||||||||||||||||||||||||||||||||
Total comprehensive income for the year | – | – | – | 13,208 | 5,671 | (266 | ) | (526 | ) | – | 18,087 | 1,147 | 19,234 | |||||||||||||||||||||||||||||||||||||||||||||||||||
Shares issued under employee share plans | 12 | 168 | – | – | – | – | – | – | 180 | – | 180 | |||||||||||||||||||||||||||||||||||||||||||||||||||||
Shares issued in lieu of dividends and amounts arising thereon4 | 126 | (127 | ) | – | 2,524 | – | – | – | – | 2,523 | – | 2,523 | ||||||||||||||||||||||||||||||||||||||||||||||||||||
Capital securities issued11 | – | – | 3,718 | – | – | – | – | – | 3,718 | – | 3,718 | |||||||||||||||||||||||||||||||||||||||||||||||||||||
Dividends to shareholders10 | – | – | – | (6,350 | ) | – | – | – | – | (6,350 | ) | (725 | ) | (7,075 | ) | |||||||||||||||||||||||||||||||||||||||||||||||||
Tax credit on distributions | – | – | – | 122 | – | – | – | – | 122 | – | 122 | |||||||||||||||||||||||||||||||||||||||||||||||||||||
Own shares adjustment | – | – | – | 174 | – | – | – | – | 174 | – | 174 | |||||||||||||||||||||||||||||||||||||||||||||||||||||
Cost of share-based payment arrangements | – | – | – | 812 | – | – | – | – | 812 | – | 812 | |||||||||||||||||||||||||||||||||||||||||||||||||||||
Income taxes on share-based payments | – | – | – | (14 | ) | – | – | – | – | (14 | ) | – | (14 | ) | ||||||||||||||||||||||||||||||||||||||||||||||||||
Other movements | – | – | – | (58 | ) | 217 | 7 | – | – | 166 | 3 | 169 | ||||||||||||||||||||||||||||||||||||||||||||||||||||
Acquisition and disposal of subsidiaries | – | – | – | – | – | – | – | – | – | (436 | ) | (436 | ) | |||||||||||||||||||||||||||||||||||||||||||||||||||
Changes in ownership interests in subsidiaries that did not result in loss of control | – | – | – | (50 | ) | – | – | – | – | (50 | ) | (103 | ) | (153 | ) | |||||||||||||||||||||||||||||||||||||||||||||||||
At 31 December | 8,843 | 8,454 | 5,851 | 99,105 | (4,077 | ) | (285 | ) | 2,468 | 27,308 | 147,667 | 7,248 | 154,915 | |||||||||||||||||||||||||||||||||||||||||||||||||||
The accompanying notes on pages 383 to 515 form an integral part of these financial statements1.
For footnotes, see page 382.
378
Table of Contents
HSBC HOLDINGS PLC
Financial Statements(continued)
HSBC Holdings balance sheet at 31 December 2012
| Notes | 2012 US$m | 2011 US$m | ||||||||||||
Assets | ||||||||||||||
Cash at bank and in hand: | ||||||||||||||
– balances with HSBC undertakings | 353 | 316 | ||||||||||||
Derivatives | 19 | 3,768 | 3,568 | |||||||||||
Loans and advances to HSBC undertakings | 41,675 | 28,048 | ||||||||||||
Financial investments | 1,208 | 1,078 | ||||||||||||
Current tax assets | 147 | 104 | ||||||||||||
Prepayments and accrued income | 82 | 32 | ||||||||||||
Investments in subsidiaries | 25 | 92,234 | 90,621 | |||||||||||
Property, plant and equipment | 3 | 4 | ||||||||||||
Deferred tax assets | 9 | 14 | 91 | |||||||||||
Total assets | 139,484 | 123,862 | ||||||||||||
Liabilities and equity | ||||||||||||||
Liabilities | ||||||||||||||
Amounts owed to HSBC undertakings | 12,856 | 2,479 | ||||||||||||
Financial liabilities designated at fair value | 28 | 23,195 | 21,151 | |||||||||||
Derivatives | 19 | 760 | 1,067 | |||||||||||
Debt securities in issue | 29 | 2,691 | 2,613 | |||||||||||
Other liabilities | 30 | 30 | 911 | |||||||||||
Accruals and deferred income | 1,018 | 1,008 | ||||||||||||
Subordinated liabilities | 33 | 11,907 | 12,450 | |||||||||||
Total liabilities | 52,457 | 41,679 | ||||||||||||
Equity | ||||||||||||||
Called up share capital | 38 | 9,238 | 8,934 | |||||||||||
Share premium account | 10,084 | 8,457 | ||||||||||||
Other equity instruments | 5,828 | 5,828 | ||||||||||||
Other reserves | 37,170 | 36,849 | ||||||||||||
Retained earnings | 24,707 | 22,115 | ||||||||||||
Total equity | 87,027 | 82,183 | ||||||||||||
Total equity and liabilities | 139,484 | 123,862 | ||||||||||||
The accompanying notes on pages 383 to 515 form an integral part of these financial statements1.
For footnote, see page 382.

D J Flint,Group Chairman
379
Table of Contents
HSBC HOLDINGS PLC
Financial Statements(continued)
HSBC Holdings statement of cash flows for the year ended 31 December 2012
| Notes | 2012 US$m | 2011 US$m | ||||||||||||
Cash flows from operating activities | ||||||||||||||
Profit before tax | 8,679 | 5,758 | ||||||||||||
Adjustments for: | ||||||||||||||
– non-cash items included in profit before tax | 39 | 535 | 77 | |||||||||||
– change in operating assets | 39 | (4,011 | ) | (5,489 | ) | |||||||||
– change in operating liabilities | 39 | 2,951 | (414 | ) | ||||||||||
– net loss from investing activities | – | 570 | ||||||||||||
– tax paid | (549 | ) | (57 | ) | ||||||||||
Net cash generated from operating activities | 7,605 | 445 | ||||||||||||
Cash flows from investing activities | ||||||||||||||
Proceeds from sale of financial investments | – | 941 | ||||||||||||
Net cash outflow from acquisition of or increase in stake of subsidiaries | (1,973 | ) | (626 | ) | ||||||||||
Net cash from/(used in) investing activities | (1,973 | ) | 315 | |||||||||||
Cash flows from financing activities | ||||||||||||||
Issue of ordinary share capital | 1,905 | 96 | ||||||||||||
Sales of own shares to meet share awards and share option awards | 178 | – | ||||||||||||
Subordinated loan capital repaid | (760 | ) | (750 | ) | ||||||||||
Debt securities issued | 2,000 | 5,338 | ||||||||||||
Debt securities repaid | (2,420 | ) | – | |||||||||||
Dividends paid | (5,925 | ) | (5,014 | ) | ||||||||||
Dividends paid to holders of other equity instruments | (573 | ) | (573 | ) | ||||||||||
Net cash used in financing activities | (5,595 | ) | (903 | ) | ||||||||||
Net increase/(decrease) in cash and cash equivalents | 37 | (143 | ) | |||||||||||
Cash and cash equivalents at 1 January | 316 | 459 | ||||||||||||
Cash and cash equivalents at 31 December | 39 | 353 | 316 | |||||||||||
The accompanying notes on pages 383 to 515 form an integral part of these financial statements1.
For footnote, see page 382.
380
Table of Contents
HSBC HOLDINGS PLC
Financial Statements(continued)
HSBC Holdings statement of changes in equity for the year ended 31 December 2012
| Other reserves | ||||||||||||||||||||||||||||||||||||||||||||||||
| Called up share capital US$m | Share Premium4 | Other equity instru- ments US$m | Retained earnings 12 US$m | Available- for-sale fair value reserve US$m | Other capital13 | Merger Reserves9 | Total share- holders’ equity US$m | |||||||||||||||||||||||||||||||||||||||||
At 1 January 2012 | 8,934 | 8,457 | 5,828 | 22,115 | 12 | 1,710 | 35,127 | 82,183 | ||||||||||||||||||||||||||||||||||||||||
Profit for the year | – | – | – | 8,082 | – | – | – | 8,082 | ||||||||||||||||||||||||||||||||||||||||
Other comprehensive income (net of tax) | – | – | – | – | 102 | – | – | 102 | ||||||||||||||||||||||||||||||||||||||||
Available-for-sale investments | – | – | – | – | 129 | – | – | 129 | ||||||||||||||||||||||||||||||||||||||||
Income tax | – | – | – | – | (27 | ) | – | – | (27 | ) | ||||||||||||||||||||||||||||||||||||||
| ||||||||||||||||||||||||||||||||||||||||||||||||
Total comprehensive income for the year | – | – | – | 8,082 | 102 | – | – | 8,184 | ||||||||||||||||||||||||||||||||||||||||
Shares issued under employee share plans | 119 | 1,812 | – | (26 | ) | – | – | – | 1,905 | |||||||||||||||||||||||||||||||||||||||
Shares issued in lieu of dividends and amounts arising thereon4 | 185 | (185 | ) | – | 2,429 | – | – | – | 2,429 | |||||||||||||||||||||||||||||||||||||||
Dividends to shareholders10 | – | – | – | (8,042 | ) | – | – | – | (8,042 | ) | ||||||||||||||||||||||||||||||||||||||
Tax credit on distributions | – | – | – | 32 | – | – | – | 32 | ||||||||||||||||||||||||||||||||||||||||
Own shares adjustment | – | – | – | 379 | – | – | – | 379 | ||||||||||||||||||||||||||||||||||||||||
Exercise and lapse of share options | – | – | – | (219 | ) | – | 219 | – | – | |||||||||||||||||||||||||||||||||||||||
Cost of share-based payment arrangements | – | – | – | 55 | – | – | – | 55 | ||||||||||||||||||||||||||||||||||||||||
Income taxes on share-based payments | – | – | – | 10 | – | – | – | 10 | ||||||||||||||||||||||||||||||||||||||||
Equity investments granted to employees of subsidiaries under employee share plans | – | – | – | (108 | ) | – | – | – | (108 | ) | ||||||||||||||||||||||||||||||||||||||
At 31 December 2012 | 9,238 | 10,084 | 5,828 | 24,707 | 114 | 1,929 | 35,127 | 87,027 | ||||||||||||||||||||||||||||||||||||||||
At 1 January 2011 | 8,843 | 8,454 | 5,828 | 21,440 | 56 | 1,583 | 35,127 | 81,331 | ||||||||||||||||||||||||||||||||||||||||
Profit for the year | – | – | – | 5,471 | – | – | – | 5,471 | ||||||||||||||||||||||||||||||||||||||||
Other comprehensive income (net of tax) | – | – | – | – | (44 | ) | – | – | (44 | ) | ||||||||||||||||||||||||||||||||||||||
Available-for-sale investments | – | – | – | – | (61 | ) | – | – | (61 | ) | ||||||||||||||||||||||||||||||||||||||
Income tax | – | – | – | – | 17 | – | – | 17 | ||||||||||||||||||||||||||||||||||||||||
| ||||||||||||||||||||||||||||||||||||||||||||||||
Total comprehensive income for the year | – | – | – | 5,471 | (44 | ) | – | – | 5,427 | |||||||||||||||||||||||||||||||||||||||
Shares issued under employee share plans | 6 | 90 | – | – | – | – | – | 96 | ||||||||||||||||||||||||||||||||||||||||
Shares issued in lieu of dividends and amounts arising thereon4 | 85 | (87 | ) | – | 2,232 | – | – | – | 2,230 | |||||||||||||||||||||||||||||||||||||||
Dividends to shareholders10 | – | – | – | (7,501 | ) | – | – | – | (7,501 | ) | ||||||||||||||||||||||||||||||||||||||
Tax credit on distributions | – | – | – | 128 | – | – | – | 128 | ||||||||||||||||||||||||||||||||||||||||
Own shares adjustment | – | – | – | (265 | ) | – | – | – | (265 | ) | ||||||||||||||||||||||||||||||||||||||
Exercise and lapse of share options | – | – | – | (127 | ) | – | 127 | – | – | |||||||||||||||||||||||||||||||||||||||
Cost of share-based payment arrangements | – | – | – | 57 | – | – | – | 57 | ||||||||||||||||||||||||||||||||||||||||
Equity investments granted to employees of subsidiaries under employee share plans | – | – | – | 674 | – | – | – | 674 | ||||||||||||||||||||||||||||||||||||||||
Other movements | – | – | – | 6 | – | – | – | 6 | ||||||||||||||||||||||||||||||||||||||||
At 31 December 2011 | 8,934 | 8,457 | 5,828 | 22,115 | 12 | 1,710 | 35,127 | 82,183 | ||||||||||||||||||||||||||||||||||||||||
Dividends per ordinary share at 31 December 2012 were US$0.41 (2011: US$0.39; 2010: US$0.34).
The accompanying notes on pages 383 to 515 form an integral part of these financial statements1.
For footnotes, see page 382.
381
Table of Contents
HSBC HOLDINGS PLC
Financial Statements(continued)
Footnotes to Financial Statements
| 1 | The ‘Critical accounting policies’ on pages 54 to 57, the audited sections of ‘Risk’ on pages 123 to 280 and the audited sections of ‘Capital’ on pages 281 to 300 are also an integral part of these financial statements. |
| 2 | Fair value gains in available-for-sale investments for 2012 include US$737m relating to the investment in Ping An classified as assets held for sale. |
| 3 | Adjustment to bring changes between opening and closing balance sheet amounts to average rates. This is not done on a line-by-line basis, as details cannot be determined without unreasonable expense. |
| 4 | Share premium includes a nil deduction in respect of issuance costs incurred during the year (2011: US$2m; 2010: US$1m). |
| 5 | Cumulative goodwill amounting to US$5,138m has been charged against reserves in respect of acquisitions of subsidiaries prior to 1 January 1998, including US$3,469m charged against the merger reserve arising on the acquisition of HSBC Bank plc. The balance of US$1,669m has been charged against retained earnings. |
| 6 | Retained earnings include 86,394,826 (US$874m) of own shares held within HSBC’s Insurance business, retirement funds for the benefit of policyholders or beneficiaries within employee trusts for the settlement of shares expected to be delivered under employee share schemes or bonus plans, and the market-making activities in Global Markets (2011: 98,498,019 (US$1,320m); 2010: 123,331,979 (US$1,799m)). |
| 7 | The movement in reserves relating to equity-settled share-based payment arrangement is recognised in ‘Retained earnings’ in the ‘Consolidated Statement of change in equity’ with effect from 1 January 2011. Previously it was disclosed separately in a ‘Share-based payment reserve’ within ‘Other reserves’. Comparative data have been restated accordingly. The adjustment reduced ‘Other reserves’ and increased ‘Retained earnings’ by US$1,982m at 31 December 2012 (2011: US$2,274m; 2010: US$1,755m). There was no effect on basic or diluted earnings per share following this change. |
| 8 | Amounts transferred to the income statement in respect of cash flow hedges include US$43m gain (2011: US$104m gain; 2010: US$605m gain) taken to ‘Net interest income’ and US$380m gain (2011: US$893m loss; 2010: US$441m loss) taken to ‘Net trading income’. |
| 9 | Statutory share premium relief under Section 131 of the Companies Act 1985 (the ‘Act’) was taken in respect of the acquisition of HSBC Bank plc in 1992, HSBC France in 2000 and HSBC Finance Corporation in 2003 and the shares issued were recorded at their nominal value only. In HSBC’s consolidated financial statements the fair value differences of US$8,290m in respect of HSBC France and US$12,768m in respect of HSBC Finance Corporation were recognised in the merger reserve. The merger reserve created on the acquisition of HSBC Finance Corporation subsequently became attached to HSBC Overseas Holdings (UK) Limited (‘HOHU’), following a number of intra-group reorganisations. During 2009, pursuant to Section 131 of the Companies Act 1985, statutory share premium relief was taken in respect of the rights issue and US$15,796m was recognised in the merger reserve. The merger reserve includes the deduction of US$614m in respect of costs relating to the rights issue, of which US$149m was subsequently transferred to the income statement. Of this US$149m, US$121m was a loss arising from accounting for the agreement with the underwriters as a contingent forward contract. The merger reserve excludes the loss of US$344m on a forward foreign exchange contract associated with hedging the proceeds of the rights issue. |
| 10 | Including distributions paid on preference shares and capital securities classified as equity. |
| 11 | During June 2010, HSBC Holdings issued US$3,800m of Perpetual Subordinated Capital Securities, Series 2 (‘capital securities’) on which there were US$82m of external issuance costs and US$23m of intra-group issuance costs which are classified as equity under IFRSs. The capital securities are exchangeable at HSBC Holdings’ option into non-cumulative US dollar preference shares on any coupon payment date. Interest on the captial securities is paid quarterly and may be deferred at the discretion of HSBC Holdings. The capital securities may only be redeemed at the option of HSBC Holdings. |
| 12 | Retained earnings include 3,903,901 (US$57m) of own shares held to fund employee share plans (2011: 33,557,764 (US$563m)). |
| 13 | Other paid-in capital arises from the exercise and lapse of share options granted to employees of HSBC Holdings subsidiaries. |
382
Table of Contents
HSBC HOLDINGS PLC
Notes on the Financial Statements
| 1 | Basis of preparation |
| (a) | Compliance with International Financial Reporting Standards |
The consolidated financial statements of HSBC and the separate financial statements of HSBC Holdings have been prepared in accordance with International Financial Reporting Standards (‘IFRSs’) as issued by the International Accounting Standards Board (‘IASB’) and as endorsed by the EU. EU-endorsed IFRSs may differ from IFRSs as issued by the IASB if, at any point in time, new or amended IFRSs have not been endorsed by the EU.
At 31 December 2012, there were no unendorsed standards effective for the year ended 31 December 2012 affecting these consolidated and separate financial statements, and there was no difference between IFRSs endorsed by the EU and IFRSs issued by the IASB in terms of their application to HSBC. Accordingly, HSBC’s financial statements for the year ended 31 December 2012 are prepared in accordance with IFRSs as issued by the IASB.
IFRSs comprise accounting standards issued by the IASB and its predecessor body as well as interpretations issued by the IFRS Interpretations Committee (‘IFRIC’) and its predecessor body.
As a result of changing market practices in response to regulatory and accounting changes, as well as general market developments, HSBC revised its methodology for estimating the credit valuation adjustment (‘CVA’) for derivatives at 31 December 2012. Previously, the probability of default (‘PD’) used in the CVA calculation was based on HSBC’s internal credit rating for the counterparty taking into account how credit ratings may deteriorate over the duration of the exposure based on historical rating transition matrices. The revised methodology maximises the use of the PDs based on market-observable data, such as credit default swap (‘CDS’) spreads. Where CDS spreads are not available, PDs are estimated having regard to market practice, considering relevant data including both CDS indices and historical rating transition matrices. In addition, HSBC aligned its methodology for estimating the debit valuation adjustment (‘DVA’) to be consistent with that applied for CVA as at 31 December 2012. Historically, HSBC considered that a zero spread was appropriate in respect of own credit risk and consequently did not adjust derivative liabilities for its own credit risk.
At 31 December 2012, the effect of the changes in fair value estimates as a result of the revisions to methodology was to reduce derivative liabilities by US$518m and to reduce derivative assets by US$899m resulting in a reduction in net trading income of US$381m. It is impracticable to estimate the effect of the changes in fair value estimates on future periods. See Note 15 for further information on CVA and DVA methodologies.
During 2012, HSBC adopted a number of interpretations and amendments to standards which had an insignificant effect on the consolidated financial statements of HSBC and the separate financial statements of HSBC Holdings.
| (b) | Differences between IFRSs and Hong Kong Financial Reporting Standards |
There are no significant differences between IFRSs and Hong Kong Financial Reporting Standards in terms of their application to HSBC and consequently there would be no significant differences had the financial statements been prepared in accordance with Hong Kong Financial Reporting Standards. The Notes on the Financial Statements, taken together with the Report of the Directors, include the aggregate of all disclosures necessary to satisfy IFRSs and Hong Kong reporting requirements.
| (c) | Presentation of information |
Disclosures under IFRS 4 ‘Insurance Contracts’ and IFRS 7 ‘Financial Instruments: Disclosures’ concerning the nature and extent of risks relating to insurance contracts and financial instruments have been included in the audited sections of the ‘Report of the Directors: Risk’ on pages 123 to 280.
Capital disclosures under IAS 1 ‘Presentation of Financial Statements’ have been included in the audited sections of ‘Report of the Directors: Capital’ on pages 281 to 300.
Disclosures relating to HSBC’s securitisation activities and structured products have been included in the audited section of ‘Report of the Directors: Risk’ on pages 123 to 280.
In accordance with HSBC’s policy to provide disclosures that help investors and other stakeholders understand
383
Table of Contents
HSBC HOLDINGS PLC
Notes on the Financial Statements(continued)
the Group’s performance, financial position and changes thereto, the information provided in the Notes on the Financial Statements and the Report of the Directors goes beyond the minimum levels required by accounting standards, statutory and regulatory requirements and listing rules. In particular, HSBC has provided additional disclosures following the issue of the Enhanced Disclosures Task Force (‘EDTF’) report ‘Enhancing the Risk Disclosures of Banks’ in 2012 and will further enhance its risk disclosures in 2013. The report aims to help financial institutions identify areas that investors had highlighted needed better and more transparent information about banks’ risks, and how these risks relate to performance measurement and reporting. The recommendations for disclosure improvement focused on the principal risks faced by the banking industry, and included disclosures about risk governance, capital adequacy, liquidity, funding, credit risk, market risk and other risks. In addition, HSBC follows the British Bankers’ Association Code for Financial Reporting Disclosure (‘the BBA Code’). The BBA Code aims to increase the quality and comparability of UK banks’ disclosures and sets out five disclosure principles together with supporting guidance. In line with the principles of the BBA Code, HSBC assesses good practice recommendations issued from time to time by relevant regulators and standard setters and will assess the applicability and relevance of such guidance, enhancing disclosures where appropriate.
In publishing the parent company financial statements here together with the Group financial statements, HSBC Holdings has taken advantage of the exemption in section 408(3) of the Companies Act 2006 not to present its individual income statement and related notes that form a part of these financial statements.
HSBC’s consolidated financial statements are presented in US dollars which is also HSBC Holdings’ functional currency. HSBC Holdings’ functional currency is the US dollar because the US dollar and currencies linked to it are the most significant currencies relevant to the underlying transactions, events and conditions of its subsidiaries, as well as representing a significant proportion of its funds generated from financing activities. HSBC uses the US dollar as its presentation currency in its consolidated financial statements because the US dollar and currencies linked to it form the major currency bloc in which HSBC transacts and funds its business.
| (d) | Use of estimates and assumptions |
The preparation of financial information requires the use of estimates and assumptions about future conditions. The use of available information and the application of judgement are inherent in the formation of estimates; actual results in the future may differ from estimates upon which financial information is prepared. Management believes that HSBC’s critical accounting policies where judgement is necessarily applied are those which relate to impairment of loans and advances, goodwill impairment, the valuation of financial instruments, deferred tax assets and provisions for liabilities. See ‘Critical accounting policies’ on pages 54 to 57, which form an integral part of these financial statements.
Further information about key assumptions concerning the future, and other key sources of estimation uncertainty, are set out in the Notes on the Financial Statements.
| (e) | Consolidation |
The consolidated financial statements of HSBC comprise the financial statements of HSBC Holdings and its subsidiaries made up to 31 December, with the exception of the banking and insurance subsidiaries of HSBC Bank Argentina, whose financial statements are made up to 30 June annually to comply with local regulations. Accordingly, HSBC uses their audited interim financial statements, drawn up to 31 December annually.
Subsidiaries are consolidated from the date that HSBC gains control. The acquisition method of accounting is used when subsidiaries are acquired by HSBC. The cost of an acquisition is measured at the fair value of the consideration, including contingent consideration, given at the date of exchange. Acquisition-related costs are recognised as an expense in the income statement in the period in which they are incurred. The acquired identifiable assets, liabilities and contingent liabilities are generally measured at their fair values at the date of acquisition. Goodwill is measured as the excess of the aggregate of the consideration transferred, the amount of non-controlling interest and the fair value of HSBC’s previously held equity interest, if any, over the net of the amounts of the identifiable assets acquired and the liabilities assumed. The amount of non-controlling interest is measured either at fair value or at the non-controlling interest’s proportionate share of the acquiree’s identifiable net assets. In a business combination achieved in stages, the previously held equity interest is remeasured at the acquisition-date fair value with the resulting gain or loss recognised in the income statement. In the event that the amount of net assets acquired is in excess of the aggregate of the consideration transferred, the amount of non-controlling interest and the fair value of HSBC’s previously held equity interest, the difference is recognised immediately in the income statement.
384
Table of Contents
HSBC HOLDINGS PLC
Notes on the Financial Statements(continued)
Changes in a parent’s ownership interest in a subsidiary that do not result in a loss of control are treated as transactions between equity holders and are reported in equity.
Entities that are controlled by HSBC are consolidated until the date that control ceases.
In the context of Special Purpose Entities (‘SPE’s), the following circumstances may indicate a relationship in which, in substance, HSBC controls and consequently consolidates an SPE:
| • | the activities of the SPE are being conducted on behalf of HSBC according to its specific business needs so that HSBC obtains benefits from the SPE’s operation; |
| • | HSBC has the decision-making powers to obtain the majority of the benefits of the activities of the SPE or, by setting up an ‘autopilot’ mechanism, HSBC has delegated these decision-making powers; |
| • | HSBC has rights to obtain the majority of the benefits of the SPE and therefore may be exposed to risks incidental to the activities of the SPE; or |
| • | HSBC retains the majority of the residual or ownership risks related to the SPE or its assets in order to obtain benefits from its activities. |
HSBC performs a re-assessment of consolidation whenever there is a change in the substance of the relationship between HSBC and an SPE.
All intra-HSBC transactions are eliminated on consolidation.
The consolidated financial statements of HSBC also include the attributable share of the results and reserves of joint ventures and associates. These are based on financial statements made up to 31 December, with the exception of BoCom, Ping An and Industrial Bank which are included on the basis of financial statements made up for the twelve months to 30 September. These are equity accounted three months in arrears in order to meet the requirements of the Group’s reporting timetable. HSBC takes into account the effect of significant transactions or events that occur between the period from 1 October to 31 December that would have a material effect on its results. As discussed further in Note 26, HSBC announced disposal of its entire shareholding in Ping An. As a result of the disposal of the first tranche of shares on 7 December 2012, HSBC no longer had significant influence over Ping An at 31 December 2012 and ceased to account for it as an associate.
| (f) | Future accounting developments |
At 31 December 2012, a number of standards and amendments to standards had been issued by the IASB which are not effective for these consolidated financial statements. In addition to the projects to complete financial instrument accounting, the IASB is continuing to work on projects on insurance, revenue recognition and lease accounting which, together with the standards described below, could represent significant changes to accounting requirements in the future.
Amendments issued by the IASB
Standards applicable in 2013
In May 2011, the IASB issued IFRS 10 ‘Consolidated Financial Statements,’ IFRS 11 ‘Joint Arrangements’ and IFRS 12 ‘Disclosure of Interests in Other Entities.’ In June 2012, the IASB issued amendments to IFRS 10, IFRS 11 and IFRS 12 ‘Transition Guidance’. The standards and amendments are effective for annual periods beginning on or after 1 January 2013 with early adoption permitted. IFRSs 10 and 11 are required to be applied retrospectively.
Under IFRS 10, there is one approach for determining consolidation for all entities, based on the concept of power, variability of returns and their linkage. This replaced the approach which applies to these financial statements which emphasises legal control or exposure to risks and rewards, depending on the nature of the entity. IFRS 11 places more focus on the investors’ rights and obligations than on the structure of the arrangement, and introduces the concept of a joint operation. IFRS 12 is a comprehensive standard on disclosure requirements for all forms of interests in other entities, including for unconsolidated structured entities.
We do not expect the overall effect of IFRS 10 and IFRS 11 on the financial statements to be material.
385
Table of Contents
HSBC HOLDINGS PLC
Notes on the Financial Statements(continued)
In May 2011, the IASB also issued IFRS 13 ‘Fair Value Measurement.’ This standard is effective for annual periods beginning on or after 1 January 2013 with early adoption permitted. IFRS 13 is required to be applied prospectively from the beginning of the first annual period in which it is applied. The disclosure requirements of IFRS 13 do not require comparative information to be provided for periods prior to initial application.
IFRS 13 establishes a single source of guidance for all fair value measurements required or permitted by IFRSs. The standard clarifies the definition of fair value as an exit price, which is defined as a price at which an orderly transaction to sell the asset or to transfer the liability would take place between market participants at the measurement date under current market conditions, and enhances disclosures about fair value measurement.
The effect of IFRS 13 is not expected to be material to HSBC.
In June 2011, the IASB issued amendments to IAS 19 ‘Employee Benefits’ (‘IAS 19 revised’). The revised standard is effective for annual periods beginning on or after 1 January 2013 with early adoption permitted. IAS 19 revised is required to be applied retrospectively.
The most significant amendment for HSBC is the replacement of interest cost and expected return on plan assets by a finance cost component comprising the net interest on the net defined benefit liability or asset. This finance cost component is determined by applying the same discount rate used to measure the defined benefit obligation to the net defined benefit liability or asset. The difference between the actual return on plan assets and the return included in the finance cost component in the income statement will be presented in other comprehensive income. The effect of this change is to increase the pension expense by the difference between the current expected return on plan assets and the return calculated by applying the relevant discount rate.
Based on our estimate of the effect of this particular amendment on the 2012 consolidated financial statements, the change would have an immaterial effect on pre-tax profit and total operating expenses, with no effect on the pension liability. Therefore, the effect at the date of adoption on 1 January 2013 was not material to HSBC.
In December 2011, the IASB issued amendments to IFRS 7 ‘Disclosures – Offsetting Financial Assets and Financial Liabilities’ which requires the disclosures about the effect or potential effects of offsetting financial assets and financial liabilities and related arrangements on an entity’s financial position. The amendments are effective for annual periods beginning on or after 1 January 2013 and interim periods within those annual periods. The amendments are required to be applied retrospectively.
Standards applicable in 2014
In December 2011, the IASB issued amendments to IAS 32 ‘Offsetting Financial Assets and Financial Liabilities’ which clarify the requirements for offsetting financial instruments and address inconsistencies in current practice when applying the offsetting criteria in IAS 32 ‘Financial Instruments: Presentation’. The amendments are effective for annual periods beginning on or after 1 January 2014 and are required to be applied retrospectively.
Based on our initial assessment, we do not expect the amendments to IAS 32 to have a material effect on HSBC’s financial statements.
In October 2012, the IASB issued amendments to IFRS 10, IFRS 12 and IAS 27 ‘Investment Entities’, which introduced an exception to the principle that all subsidiaries shall be consolidated. The amendments require a parent that is an investment entity to measure its investments in particular subsidiaries at fair value through profit or loss instead of consolidating all subsidiaries in its consolidated and separate financial statements. The amendments are effective from 1 January 2014 with early adoption permitted. Based on our initial assessment, we do not expect the amendments to have a material effect on HSBC’s consolidated financial statements.
Standards applicable in 2015
In November 2009, the IASB issued IFRS 9 ‘Financial Instruments’ which introduced new requirements for the classification and measurement of financial assets. In October 2010, the IASB issued an amendment to IFRS 9 incorporating requirements for financial liabilities. Together, these changes represent the first phase in the IASB’s planned replacement of IAS 39 ‘Financial Instruments: Recognition and Measurement.’
Following the IASB’s decision in December 2011 to defer the effective date, the standard is effective for annual periods beginning on or after 1 January 2015 with early adoption permitted. IFRS 9 is required to be applied retrospectively but prior periods need not be restated.
386
Table of Contents
HSBC HOLDINGS PLC
Notes on the Financial Statements(continued)
The second and third phases in the IASB’s project to replace IAS 39 will address the impairment of financial assets and hedge accounting.
The IASB is in the process of amending the requirements for classification and measurement in IFRS 9 to address practice and other issues.
The final IFRS 9 requirements for classification and measurement and impairment remain uncertain and so HSBC remains unable to provide a date by which it will apply IFRS 9 as a whole and it remains impracticable to quantify the effect of IFRS 9 as at the date of the publication of these financial statements.
EU endorsement
All the standards applicable in 2013 and 2014 have been endorsed for use in the EU, except for the amendments to IFRS 10, IFRS 11 and IFRS 12 ‘Transition Guidance’ and the amendments to IFRS 10, IFRS 12 and IAS 27 ‘Investment Entities’. Until these amendments are endorsed, the relief they provide for comparatives disclosures in accordance with IFRS 12 will not be available for use in the EU.
| 2 | Summary of significant accounting policies |
| (a) | Interest income and expense |
Interest income and expense for all financial instruments except for those classified as held for trading or designated at fair value (except for debt securities issued by HSBC and derivatives managed in conjunction with those debt securities) are recognised in ‘Interest income’ and ‘Interest expense’ in the income statement using the effective interest method. The effective interest method is a way of calculating the amortised cost of a financial asset or a financial liability (or groups of financial assets or financial liabilities) and of allocating the interest income or interest expense over the relevant period.
The effective interest rate is the rate that exactly discounts estimated future cash receipts or payments through the expected life of the financial instrument or, where appropriate, a shorter period, to the net carrying amount of the financial asset or financial liability. When calculating the effective interest rate, HSBC estimates cash flows considering all contractual terms of the financial instrument but excluding future credit losses. The calculation includes all amounts paid or received by HSBC that are an integral part of the effective interest rate of a financial instrument, including transaction costs and all other premiums or discounts.
Interest on impaired financial assets is recognised using the rate of interest used to discount the future cash flows for the purpose of measuring the impairment loss.
| (b) | Non-interest income |
Fee income is earned from a diverse range of services provided by HSBC to its customers. Fee income is accounted for as follows:
| – | income earned on the execution of a significant act is recognised as revenue when the act is completed (for example, fees arising from negotiating, or participating in the negotiation of, a transaction for a third party, such as an arrangement for the acquisition of shares or other securities); |
| – | income earned from the provision of services is recognised as revenue as the services are provided (for example, asset management, portfolio and other management advisory and service fees); and |
| – | income which forms an integral part of the effective interest rate of a financial instrument is recognised as an adjustment to the effective interest rate (for example, certain loan commitment fees) and recorded in ‘Interest income’. |
Net trading income comprises all gains and losses from changes in the fair value of financial assets and financial liabilities held for trading, together with the related interest income, expense and dividends.
Net income from financial instruments designated at fair valueincludes all gains and losses from changes in the fair value of financial assets and financial liabilities designated at fair value through profit or loss. Interest income and expense and dividend income arising on these financial instruments are also included, except for interest arising from debt securities issued by HSBC, and derivatives managed in conjunction with those debt securities, which is recognised in ‘Interest expense’ (Note 2a).
387
Table of Contents
HSBC HOLDINGS PLC
Notes on the Financial Statements(continued)
Dividend incomeis recognised when the right to receive payment is established. This is the ex-dividend date for listed equity securities, and usually the date when shareholders have approved the dividend for unlisted equity securities.
| (c) | Operating segments |
Due to the nature of the Group, HSBC’s chief operating decision-maker regularly reviews operating activity on a number of bases, including by geographical region and by global business. HSBC considers that geographical operating segments represent the most appropriate information for the users of the financial statements to best evaluate the nature and financial effects of the business activities in which HSBC engages, and the economic environments in which it operates. This reflects the importance of geographic factors on business strategy and performance, the allocation of capital resources, and the role of geographical regional management in executing strategy. As a result, HSBC’s operating segments are considered to be geographical regions.
Measurement of segmental assets, liabilities, income and expenses is in accordance with the Group’s accounting policies. Segmental income and expenses include transfers between segments and these transfers are conducted on arm’s length terms and conditions. Shared costs are included in segments on the basis of the actual recharges made. The expense of the UK bank levy is included in the Europe geographical region as HSBC regards the levy as a cost of being headquartered in the UK.
| (d) | Valuation of financial instruments |
All financial instruments are recognised initially at fair value. In the normal course of business, the fair value of a financial instrument on initial recognition is the transaction price (that is, the fair value of the consideration given or received). In certain circumstances, however, the fair value will be based on other observable current market transactions in the same instrument, without modification or repackaging, or on a valuation technique whose variables include only data from observable markets, such as interest rate yield curves, option volatilities and currency rates. When such evidence exists, HSBC recognises a trading gain or loss on inception of the financial instrument, being the difference between the transaction price and the fair value. When unobservable market data have a significant impact on the valuation of financial instruments, the entire initial difference in fair value from the transaction price as indicated by the valuation model is not recognised immediately in the income statement. Instead, it is recognised over the life of the transaction on an appropriate basis, when the inputs become observable, the transaction matures or is closed out, or when HSBC enters into an offsetting transaction.
Subsequent to initial recognition, the fair values of financial instruments measured at fair value are measured in accordance with HSBC’s valuation methodologies, which are described in Notes 15 and 16.
| (e) | Reclassification of financial assets |
Non-derivative financial assets (other than those designated at fair value through profit or loss upon initial recognition) may be reclassified out of the fair value through profit or loss category in the following circumstances:
| – | financial assets that would have met the definition of loans and receivables at initial recognition (if the financial asset had not been required to be classified as held for trading) may be reclassified out of the fair value through profit or loss category if there is the intention and ability to hold the financial asset for the foreseeable future or until maturity; and |
| – | financial assets (except financial assets that would have met the definition of loans and receivables at initial recognition) may be reclassified out of the fair value through profit or loss category and into another category in rare circumstances. |
When a financial asset is reclassified as described in the above circumstances, the financial asset is reclassified at its fair value on the date of reclassification. Any gain or loss already recognised in the income statement is not reversed. The fair value of the financial asset on the date of reclassification becomes its new cost or amortised cost, as applicable.
388
Table of Contents
HSBC HOLDINGS PLC
Notes on the Financial Statements(continued)
| (f) | Loans and advances to banks and customers |
Loans and advances to banks and customers include loans and advances originated by HSBC which are not classified as held for trading or designated at fair value. Loans and advances are recognised when cash is advanced to a borrower. They are derecognised when either the borrower repays its obligations, or the loans are sold or written off, or substantially all the risks and rewards of ownership are transferred. They are initially recorded at fair value plus any directly attributable transaction costs and are subsequently measured at amortised cost using the effective interest method, less any reduction from impairment or uncollectibility. Where exposures are hedged by derivatives designated and qualifying as fair value hedges, the carrying value of the loans and advances so hedged includes a fair value adjustment relating only to the hedged risk.
Loans and advances are reclassified to ‘Assets held for sale’ when their carrying amounts are to be recovered principally through sale, they are available for sale in their present condition and their sale is highly probable (Note 2ac); however, such loans and advances continue to be measured in accordance with the policy described above.
HSBC may commit to underwrite loans on fixed contractual terms for specified periods of time, where the drawdown of the loan is contingent upon certain future events outside the control of HSBC. Where the loan arising from the lending commitment is expected to be held for trading, the commitment to lend is recorded as a derivative and measured at fair value through profit or loss. On drawdown, the loan is classified as held for trading and measured at fair value through profit or loss. Where it is not HSBC’s intention to trade but hold the loan, a provision on the loan commitment is only recorded where it is probable that HSBC will incur a loss. This may occur, for example, where a loss of principal is probable or the interest rate charged on the loan is lower than the cost of funding. On inception of the loan, the loan to be held is recorded at its fair value and subsequently measured at amortised cost using the effective interest method. For certain transactions, such as leveraged finance and syndicated lending activities, the cash advanced is not necessarily the best evidence of the fair value of the loan. For these loans, where the initial fair value is lower than the cash amount advanced (for example, due to the rate of interest charged on the loan being below the market rate of interest), the write-down is charged to the income statement. The write-down will be recovered over the life of the loan, through the recognition of interest income using the effective interest method, unless the loan becomes impaired. The write-down is recorded as a reduction to other operating income.
Financial assets which have been reclassified into the loans and receivables category are initially recorded at the fair value at the date of reclassification and are subsequently measured at amortised cost, using the effective interest rate determined at the date of reclassification.
| (g) | Impairment of loans and advances |
Losses for impaired loans are recognised promptly when there is objective evidence that impairment of a loan or portfolio of loans has occurred. Impairment allowances are calculated on individual loans and on groups of loans assessed collectively. Impairment losses are recorded as charges to the income statement. The carrying amount of impaired loans on the balance sheet is reduced through the use of impairment allowance accounts. Losses which may arise from future events are not recognised.
Individually assessed loans and advances
The factors considered in determining whether a loan is individually significant for the purposes of assessing impairment include:
| – | the size of the loan; |
| – | the number of loans in the portfolio; and |
| – | the importance of the individual loan relationship, and how this is managed. |
Loans that meet the above criteria will be individually assessed for impairment, except when volumes of defaults and losses are sufficient to justify treatment under a collective assessment methodology.
Loans considered as individually significant are typically to corporate and commercial customers and are for larger amounts, which are managed on an individual relationship basis. Retail lending portfolios are generally assessed for impairment on a collective basis as the portfolios generally consist of large pools of homogeneous loans.
389
Table of Contents
HSBC HOLDINGS PLC
Notes on the Financial Statements(continued)
For all loans that are considered individually significant, HSBC assesses on a case-by-case basis at each balance sheet date whether there is any objective evidence that a loan is impaired. The criteria used by HSBC to determine that there is such objective evidence include:
| – | known cash flow difficulties experienced by the borrower; |
| – | contractual payments of either principal or interest being past due for more than 90 days; |
| – | the probability that the borrower will enter bankruptcy or other financial realisation; |
| – | a concession granted to the borrower for economic or legal reasons relating to the borrower’s financial difficulty that results in forgiveness or postponement of principal, interest or fees, where the concession is not insignificant; and |
| – | there has been deterioration in the financial condition or outlook of the borrower such that its ability to repay is considered doubtful. |
For those loans where objective evidence of impairment exists, impairment losses are determined considering the following factors:
| – | HSBC’s aggregate exposure to the customer; |
| – | the viability of the customer’s business model and their capacity to trade successfully out of financial difficulties and generate sufficient cash flow to service debt obligations; |
| – | the amount and timing of expected receipts and recoveries; |
| – | the likely dividend available on liquidation or bankruptcy; |
| – | the extent of other creditors’ commitments ranking ahead of, or pari passu with, HSBC and the likelihood of other creditors continuing to support the company; |
| – | the complexity of determining the aggregate amount and ranking of all creditor claims and the extent to which legal and insurance uncertainties are evident; |
| – | the realisable value of security (or other credit mitigants) and likelihood of successful repossession; |
| – | the likely deduction of any costs involved in recovery of amounts outstanding; |
| – | the ability of the borrower to obtain, and make payments in, the currency of the loan if not denominated in local currency; and |
| – | when available, the secondary market price of the debt. |
The realisable value of security is determined based on the current market value when the impairment assessment is performed. The value is not adjusted for expected future changes in market prices; however, adjustments are made to reflect local conditions such as forced sale discounts.
Impairment losses are calculated by discounting the expected future cash flows of a loan, which includes expected future receipts of contractual interest, at the loan’s original effective interest rate and comparing the resultant present value with the loan’s current carrying amount. The impairment allowances on individually significant accounts are reviewed at least quarterly and more regularly when circumstances require. This normally encompasses re-assessment of the enforceability of any collateral held and the timing and amount of actual and anticipated receipts. Individually assessed impairment allowances are only released when there is reasonable and objective evidence of a reduction in the established loss estimate.
Collectively assessed loans and advances
Impairment is assessed on a collective basis in two circumstances:
| – | to cover losses which have been incurred but have not yet been identified on loans subject to individual assessment; and |
| – | for homogeneous groups of loans that are not considered individually significant. |
390
Table of Contents
HSBC HOLDINGS PLC
Notes on the Financial Statements(continued)
Incurred but not yet identified impairment
Individually assessed loans for which no evidence of impairment has been specifically identified on an individual basis are grouped together according to their credit risk characteristics for the purpose of calculating an estimated collective impairment. These credit risk characteristics may include country of origination, type of business involved, type of products offered, security obtained or other relevant factors. This reflects impairment losses that HSBC has incurred as a result of events occurring before the balance sheet date, which HSBC is not able to identify on an individual loan basis, and that can be reliably estimated. These losses will only be individually identified in the future. As soon as information becomes available which identifies losses on individual loans within the group, those loans are removed from the group and assessed on an individual basis for impairment.
The collective impairment allowance is determined after taking into account:
| – | historical loss experience in portfolios of similar credit risk characteristics (for example, by industry sector, loan grade or product); |
| – | the estimated period between impairment occurring and the loss being identified and evidenced by the establishment of an appropriate allowance against the individual loan; and |
| – | management’s experienced judgement as to whether current economic and credit conditions are such that the actual level of inherent losses at the balance sheet date is likely to be greater or less than that suggested by historical experience. |
The period between a loss occurring and its identification is estimated by local management for each identified portfolio. The factors that may influence this estimation include economic and market conditions, customer behaviour, portfolio management information, credit management techniques and collection and recovery experiences in the market. As it is assessed empirically on a periodic basis the estimated period between a loss occurring and its identification may vary over time as these factors change.
Homogeneous groups of loans and advances
Statistical methods are used to determine impairment losses on a collective basis for homogeneous groups of loans that are not considered individually significant, because individual loan assessment is impracticable. Losses in these groups of loans are recorded on an individual basis when individual loans are written off, at which point they are removed from the group. Two alternative methods are used to calculate allowances on a collective basis:
| – | When appropriate empirical information is available, HSBC utilises roll rate methodology. This methodology employs statistical analyses of historical data and experience of delinquency and default to estimate the amount of loans that will eventually be written off as a result of the events occurring before the balance sheet date which HSBC is not able to identify on an individual loan basis, and that can be reliably estimated. Under this methodology, loans are grouped into ranges according to the number of days past due and statistical analysis is used to estimate the likelihood that loans in each range will progress through the various stages of delinquency, and ultimately prove irrecoverable. In addition to the delinquency groupings, loans are segmented according to their credit characteristics as described above. Current economic conditions are also evaluated when calculating the appropriate level of allowance required to cover inherent loss. The estimated loss is the difference between the present value of expected future cash flows, discounted at the original effective interest rate of the portfolio, and the carrying amount of the portfolio. In certain highly developed markets, sophisticated models also take into account behavioural and account management trends as revealed in, for example, bankruptcy and rescheduling statistics. |
| – | When the portfolio size is small or when information is insufficient or not reliable enough to adopt a roll rate methodology, HSBC adopts a basic formulaic approach based on historical loss rate experience. The period between a loss occurring and its identification is explicitly estimated by local management, and is typically between six and twelve months. |
The inherent loss within each portfolio is assessed on the basis of statistical models using historical data observations, which are updated periodically to reflect recent portfolio and economic trends. When the most recent trends arising from changes in economic, regulatory or behavioural conditions are not fully reflected in
391
Table of Contents
HSBC HOLDINGS PLC
Notes on the Financial Statements(continued)
the statistical models, they are taken into account by adjusting the impairment allowances derived from the statistical models to reflect these changes as at the balance sheet date.
These additional portfolio risk factors may include recent loan portfolio growth and product mix, unemployment rates, bankruptcy trends, geographic concentrations, loan product features (such as the ability of borrowers to repay adjustable-rate loans where reset interest rates give rise to increases in interest charges), economic conditions such as national and local trends in housing markets and interest rates, portfolio seasoning, account management policies and practices, current levels of write-offs, adjustments to the period of time between loss identification and write-off, changes in laws and regulations and other factors which can affect customer payment patterns on outstanding loans, such as natural disasters. These risk factors, where relevant, are taken into account when calculating the appropriate level of impairment allowances by adjusting the impairment allowances derived solely from historical loss experience.
Roll rates, loss rates and the expected timing of future recoveries are regularly benchmarked against actual outcomes to ensure they remain appropriate.
Write-off of loans and advances
Loans (and the related impairment allowance accounts) are normally written off, either partially or in full, when there is no realistic prospect of recovery. Where loans are secured, this is generally after receipt of any proceeds from the realisation of security. In circumstances where the net realisable value of any collateral has been determined and there is no reasonable expectation of further recovery, write-off may be earlier.
Reversals of impairment
If the amount of an impairment loss decreases in a subsequent period, and the decrease can be related objectively to an event occurring after the impairment was recognised, the excess is written back by reducing the loan impairment allowance account accordingly. The write-back is recognised in the income statement.
Reclassified loans and advances
Where financial assets have been reclassified out of the fair value through profit or loss category to the loans and receivables category, the effective interest rate determined at the date of reclassification is used to calculate any impairment losses.
Following reclassification, where there is a subsequent increase in the estimates of future cash receipts as a result of increased recoverability of those cash receipts, the effect of that increase is recognised as an adjustment to the effective interest rate from the date of change in the estimate rather than as an adjustment to the carrying amount of the asset at the date of change in the estimate.
Assets acquired in exchange for loans
Non-financial assets acquired in exchange for loans as part of an orderly realisation are recorded as assets held for sale and reported in ‘Other assets’ if the carrying amounts of the assets are recovered principally through sale, the assets are available for sale in their present condition and their sale is highly probable. The asset acquired is recorded at the lower of its fair value less costs to sell and the carrying amount of the loan (net of impairment allowance) at the date of exchange. No depreciation is charged in respect of assets held for sale. Any subsequent write-down of the acquired asset to fair value less costs to sell is recognised in the income statement, in ‘Other operating income’. Any subsequent increase in the fair value less costs to sell, to the extent this does not exceed the cumulative write-down, is also recognised in ‘Other operating income’, together with any realised gains or losses on disposal.
Renegotiated loans
Loans subject to collective impairment assessment whose terms have been renegotiated are no longer considered past due, but are treated as up to date loans for measurement purposes once a minimum number of payments required have been received. Loans subject to collective impairment assessment whose terms have been renegotiated are segregated from other parts of the loan portfolio for the purposes of collective impairment assessment, to reflect their risk profile. Loans subject to individual impairment assessment, whose terms have been renegotiated, are subject to ongoing review to determine whether they remain impaired. The carrying amounts of loans that have been classified as renegotiated retain this classification until maturity or derecognition.
392
Table of Contents
HSBC HOLDINGS PLC
Notes on the Financial Statements(continued)
A loan that is renegotiated is derecognised if the existing agreement is cancelled and a new agreement made on substantially different terms, or if the terms of an existing agreement are modified, such that the renegotiated loan is substantially a different financial instrument.
| (h) | Trading assets and trading liabilities |
Treasury bills, debt securities, equity securities, loans, deposits, debt securities in issue, and short positions in securities are classified as held for trading if they have been acquired or incurred principally for the purpose of selling or repurchasing in the near term, or they form part of a portfolio of identified financial instruments that are managed together and for which there is evidence of a recent pattern of short-term profit-taking. These financial assets or financial liabilities are recognised on trade date, when HSBC enters into contractual arrangements with counterparties to purchase or sell the financial instruments, and are normally derecognised when either sold (assets) or extinguished (liabilities). Measurement is initially at fair value, with transaction costs taken to the income statement. Subsequently, the fair values are remeasured, and gains and losses from changes therein are recognised in the income statement in ‘Net trading income’.
| (i) | Financial instruments designated at fair value |
Financial instruments, other than those held for trading, are classified in this category if they meet one or more of the criteria set out below, and are so designated by management. HSBC may designate financial instruments at fair value when the designation:
| – | eliminates or significantly reduces measurement or recognition inconsistencies that would otherwise arise from measuring financial assets or financial liabilities, or recognising gains and losses on them, on different bases. Under this criterion, the main classes of financial instruments designated by HSBC are: |
Long-term debt issues. The interest payable on certain fixed rate long-term debt securities issued has been matched with the interest on ‘receive fixed/pay variable’ interest rate swaps as part of a documented interest rate risk management strategy. An accounting mismatch would arise if the debt securities issued were accounted for at amortised cost, because the related derivatives are measured at fair value with changes in the fair value recognised in the income statement. By designating the long-term debt at fair value, the movement in the fair value of the long-term debt will also be recognised in the income statement.
Financial assets and financial liabilities under unit-linked insurance and unit-linked investment contracts. Liabilities to customers under linked contracts are determined based on the fair value of the assets held in the linked funds, with changes recognised in the income statement. If no designation was made for the assets relating to the customer liabilities they would be classified as available for sale and the changes in fair value would be recorded in other comprehensive income. These financial instruments are managed on a fair value basis and management information is also prepared on this basis. Designation at fair value of the financial assets and liabilities under investment contracts allows the changes in fair values to be recorded in the income statement and presented in the same line;
| – | applies to groups of financial assets, financial liabilities or combinations thereof that are managed, and their performance evaluated, on a fair value basis in accordance with a documented risk management or investment strategy, and where information about the groups of financial instruments is reported to management on that basis. Under this criterion, certain financial assets held to meet liabilities under non-linked insurance contracts are the main class of financial instrument so designated. HSBC has documented risk management and investment strategies designed to manage such assets at fair value, taking into consideration the relationship of assets to liabilities in a way that mitigates market risks. Reports are provided to management on the fair value of the assets. Fair value measurement is also consistent with the regulatory reporting requirements under the appropriate regulations for these insurance operations; and |
| – | relates to financial instruments containing one or more embedded derivatives that significantly modify the cash flows resulting from those financial instruments, including certain debt issues and debt securities held. |
The fair value designation, once made, is irrevocable. Designated financial assets and financial liabilities are recognised when HSBC enters into the contractual provisions of the arrangements with counterparties, which is generally on trade date, and are normally derecognised when either sold (assets) or extinguished (liabilities).
393
Table of Contents
HSBC HOLDINGS PLC
Notes on the Financial Statements(continued)
Measurement is initially at fair value, with transaction costs taken to the income statement. Subsequently, the fair values are remeasured, and gains and losses from changes therein are recognised in the income statement in ‘Net income from financial instruments designated at fair value’.
| (j) | Financial investments |
Treasury bills, debt securities and equity securities intended to be held on a continuing basis, other than those designated at fair value, are classified as available for sale or held to maturity. Financial investments are recognised on trade date when HSBC enters into contractual arrangements with counterparties to purchase securities, and are normally derecognised when either the securities are sold or the borrowers repay their obligations.
| (i) | Available-for-sale financial assets are initially measured at fair value plus direct and incremental transaction costs. They are subsequently remeasured at fair value, and changes therein are recognised in other comprehensive income in ‘Available-for-sale investments – fair value gains/(losses)’ until the financial assets are either sold or become impaired. When available-for-sale financial assets are sold, cumulative gains or losses previously recognised in other comprehensive income are recognised in the income statement as ‘Gains less losses from financial investments’. |
Interest income is recognised on available-for-sale debt securities using the effective interest rate, calculated over the asset’s expected life. Premiums and/or discounts arising on the purchase of dated investment securities are included in the calculation of their effective interest rates. Dividends are recognised in the income statement when the right to receive payment has been established.
At each balance sheet date an assessment is made of whether there is any objective evidence of impairment in the value of a financial asset. Impairment losses are recognised if, and only if, there is objective evidence of impairment as a result of one or more events that occurred after the initial recognition of the financial asset (a ‘loss event’) and that loss event (or events) has an impact on the estimated future cash flows of the financial asset that can be reliably estimated.
If the available-for-sale financial asset is impaired, the difference between the financial asset’s acquisition cost (net of any principal repayments and amortisation) and the current fair value, less any previous impairment loss recognised in the income statement, is removed from other comprehensive income and recognised in the income statement.
Impairment losses for available-for-sale debt securities are recognised within ‘Loan impairment charges and other credit risk provisions’ in the income statement and impairment losses for available-for-sale equity securities are recognised within ‘Gains less losses from financial investments’ in the income statement. The impairment methodologies for available-for-sale financial assets are set out in more detail below.
| – | Available-for-sale debt securities. When assessing available-for-sale debt securities for objective evidence of impairment at the reporting date, HSBC considers all available evidence, including observable data or information about events specifically relating to the securities which may result in a shortfall in recovery of future cash flows. These events may include a significant financial difficulty of the issuer, a breach of contract such as a default, bankruptcy or other financial reorganisation, or the disappearance of an active market for the debt security because of financial difficulties relating to the issuer. |
These types of specific event and other factors such as information about the issuers’ liquidity, business and financial risk exposures, levels of and trends in default for similar financial assets, national and local economic trends and conditions, and the fair value of collateral and guarantees may be considered individually, or in combination, to determine if there is objective evidence of impairment of a debt security.
In addition, when assessing available-for-sale asset-backed securities (‘ABS’s) for objective evidence of impairment, HSBC considers the performance of underlying collateral and the extent and depth of market price declines. Changes in credit ratings are considered but a downgrade of a security’s credit rating is not, of itself, evidence of impairment. The primary indicators of potential impairment are considered to be adverse fair value movements and the disappearance of an active market for a security. ABS impairment methodologies are described in more detail in ‘Impairment methodologies’ on page 260.
394
Table of Contents
HSBC HOLDINGS PLC
Notes on the Financial Statements(continued)
| – | Available-for-sale equity securities. Objective evidence of impairment for available-for sale equity securities may include specific information about the issuer as detailed above, but may also include information about significant changes in technology, markets, economics or the law that provides evidence that the cost of the equity securities may not be recovered. |
A significant or prolonged decline in the fair value of the asset below its cost is also objective evidence of impairment. In assessing whether it is significant, the decline in fair value is evaluated against the original cost of the asset at initial recognition. In assessing whether it is prolonged, the decline is evaluated against the period in which the fair value of the asset has been below its original cost at initial recognition.
Once an impairment loss has been recognised on an available-for-sale financial asset, the subsequent accounting treatment for changes in the fair value of that asset differs depending on the nature of the available-for-sale financial asset concerned:
| – | for an available-for-sale debt security, a subsequent decline in the fair value of the instrument is recognised in the income statement when there is further objective evidence of impairment as a result of further decreases in the estimated future cash flows of the financial asset. Where there is no further objective evidence of impairment, the decline in the fair value of the financial asset is recognised in other comprehensive income. If the fair value of a debt security increases in a subsequent period, and the increase can be objectively related to an event occurring after the impairment loss was recognised in the income statement, the impairment loss is reversed through the income statement. If there is no longer objective evidence that the debt security is impaired, the impairment loss is also reversed through the income statement; |
| – | for an available-for-sale equity security, all subsequent increases in the fair value of the instrument are treated as a revaluation and are recognised in other comprehensive income. Impairment losses recognised on the equity security are not reversed through the income statement. Subsequent decreases in the fair value of the available-for-sale equity security are recognised in the income statement, to the extent that further cumulative impairment losses have been incurred in relation to the acquisition cost of the equity security. |
| (ii) | Held-to-maturity investments are non-derivative financial assets with fixed or determinable payments and fixed maturities that HSBC positively intends, and is able, to hold to maturity. Held-to-maturity investments are initially recorded at fair value plus any directly attributable transaction costs, and are subsequently measured at amortised cost using the effective interest rate method, less any impairment losses. |
| (k) | Sale and repurchase agreements (including stock lending and borrowing) |
When securities are sold subject to a commitment to repurchase them at a predetermined price (‘repos’), they remain on the balance sheet and a liability is recorded in respect of the consideration received. Securities purchased under commitments to sell (‘reverse repos’) are not recognised on the balance sheet and the consideration paid is recorded in ‘Loans and advances to banks’, ‘Loans and advances to customers’ or ‘Trading assets’ as appropriate. The difference between the sale and repurchase price is treated as interest and recognised over the life of the agreement for loans and advances to banks and customers, and as net trading income for trading assets.
Securities lending and borrowing transactions are generally secured, with collateral taking the form of securities or cash advanced or received. The transfer of securities to counterparties under these agreements is not normally reflected on the balance sheet. Cash collateral advanced or received is recorded as an asset or a liability respectively.
Securities borrowed are not recognised on the balance sheet. If they are sold on to third parties, an obligation to return the securities is recorded as a trading liability and measured at fair value, and any gains or losses are included in ‘Net trading income’.
| (l) | Derivatives and hedge accounting |
Derivatives are recognised initially, and are subsequently remeasured, at fair value. Fair values of exchange-traded derivatives are obtained from quoted market prices. Fair values of over-the-counter derivatives are obtained using valuation techniques, including discounted cash flow models and option pricing models.
395
Table of Contents
HSBC HOLDINGS PLC
Notes on the Financial Statements(continued)
Derivatives may be embedded in other financial instruments, for example, a convertible bond with an embedded conversion option. Embedded derivatives are treated as separate derivatives when their economic characteristics and risks are not clearly and closely related to those of the host contract; the terms of the embedded derivative would meet the definition of a stand-alone derivative if they were contained in a separate contract; and the combined contract is not held for trading or designated at fair value. These embedded derivatives are measured at fair value with changes therein recognised in the income statement.
Derivatives are classified as assets when their fair value is positive, or as liabilities when their fair value is negative. Derivative assets and liabilities arising from different transactions are only offset if the transactions are with the same counterparty, a legal right of offset exists, and the parties intend to settle the cash flows on a net basis.
The method of recognising fair value gains and losses depends on whether derivatives are held for trading or are designated as hedging instruments, and if the latter, the nature of the risks being hedged. All gains and losses from changes in the fair value of derivatives held for trading are recognised in the income statement. When derivatives are designated as hedges, HSBC classifies them as either: (i) hedges of the change in fair value of recognised assets or liabilities or firm commitments (‘fair value hedges’); (ii) hedges of the variability in highly probable future cash flows attributable to a recognised asset or liability, or a forecast transaction (‘cash flow hedges’); or (iii) a hedge of a net investment in a foreign operation (‘net investment hedges’). Hedge accounting is applied to derivatives designated as hedging instruments in a fair value, cash flow or net investment hedge provided certain criteria are met.
Hedge accounting
At the inception of a hedging relationship, HSBC documents the relationship between the hedging instruments and the hedged items, its risk management objective and its strategy for undertaking the hedge. HSBC also requires a documented assessment, both at hedge inception and on an ongoing basis, of whether or not the hedging instruments, primarily derivatives, that are used in hedging transactions are highly effective in offsetting the changes attributable to the hedged risks in the fair values or cash flows of the hedged items. Interest on designated qualifying hedges is included in ‘Net interest income’.
Fair value hedge
Changes in the fair value of derivatives that are designated and qualify as fair value hedging instruments are recorded in the income statement, along with changes in the fair value of the hedged assets, liabilities or group thereof that are attributable to the hedged risk.
If a hedging relationship no longer meets the criteria for hedge accounting, the cumulative adjustment to the carrying amount of the hedged item is amortised to the income statement based on a recalculated effective interest rate over the residual period to maturity, unless the hedged item has been derecognised, in which case, it is released to the income statement immediately.
Cash flow hedge
The effective portion of changes in the fair value of derivatives that are designated and qualify as cash flow hedges is recognised in other comprehensive income within ‘Cash flow hedges – fair value gains/(losses)’. Any gain or loss in fair value relating to an ineffective portion is recognised immediately in the income statement.
The accumulated gains and losses recognised in other comprehensive income are reclassified to the income statement in the periods in which the hedged item will affect profit or loss. However, when the forecast transaction that is hedged results in the recognition of a non-financial asset or a non-financial liability, the gains and losses previously recognised in other comprehensive income are removed from equity and included in the initial measurement of the cost of the asset or liability.
When a hedging instrument expires or is sold, or when a hedge no longer meets the criteria for hedge accounting, any cumulative gain or loss recognised in other comprehensive income at that time remains in equity until the forecast transaction is eventually recognised in the income statement. When a forecast transaction is no longer expected to occur, the cumulative gain or loss that was recognised in other comprehensive income is immediately reclassified to the income statement.
396
Table of Contents
HSBC HOLDINGS PLC
Notes on the Financial Statements(continued)
Net investment hedge
Hedges of net investments in foreign operations are accounted for in a similar way to cash flow hedges. A gain or loss on the effective portion of the hedging instrument is recognised in other comprehensive income; a gain or loss on the ineffective portion is recognised immediately in the income statement. Gains and losses previously recognised in other comprehensive income are reclassified to the income statement on the disposal, or part disposal, of the foreign operation.
Hedge effectiveness testing
To qualify for hedge accounting, HSBC requires that at the inception of the hedge and throughout its life, each hedge must be expected to be highly effective (prospective effectiveness), and demonstrate actual effectiveness (retrospective effectiveness) on an ongoing basis.
The documentation of each hedging relationship sets out how the effectiveness of the hedge is assessed. The method adopted by an entity to assess hedge effectiveness will depend on its risk management strategy.
For prospective effectiveness, the hedging instrument must be expected to be highly effective in offsetting changes in fair value or cash flows attributable to the hedged risk during the period for which the hedge is designated. For actual effectiveness to be achieved, the changes in fair value or cash flows must offset each other in the range of 80% to 125%.
Hedge ineffectiveness is recognised in the income statement in ‘Net trading income’.
Derivatives that do not qualify for hedge accounting
All gains and losses from changes in the fair values of derivatives that do not qualify for hedge accounting are recognised immediately in the income statement. These gains and losses are reported in ‘Net trading income’, except where derivatives are managed in conjunction with financial instruments designated at fair value (other than derivatives managed in conjunction with debt securities issued by HSBC), in which case gains and losses are reported in ‘Net income from financial instruments designated at fair value’. The interest on derivatives managed in conjunction with debt securities issued by HSBC which are designated at fair value is recognised in ‘Interest expense’. All other gains and losses on these derivatives are reported in ‘Net income from financial instruments designated at fair value’.
Derivatives that do not qualify for hedge accounting include non-qualifying hedges entered into as part of documented interest rate management strategies for which hedge accounting was not, or could not, be applied. The size and direction of changes in fair value of non-qualifying hedges can be volatile from year to year, but do not alter the cash flows expected as part of the documented management strategies for both the non-qualifying hedge instruments and the assets and liabilities to which the documented interest rate strategies relate. Non-qualifying hedges therefore operate as economic hedges of the related assets and liabilities.
| (m) | Derecognition of financial assets and liabilities |
Financial assets are derecognised when the contractual right to receive cash flows from the assets has expired; or when HSBC has transferred its contractual right to receive the cash flows of the financial assets, and either:
| – | substantially all the risks and rewards of ownership have been transferred; or |
| – | HSBC has neither retained nor transferred substantially all the risks and rewards, but has not retained control. |
Financial liabilities are derecognised when they are extinguished, that is when the obligation is discharged, cancelled, or expires.
| (n) | Offsetting financial assets and financial liabilities |
Financial assets and financial liabilities are offset and the net amount is reported in the balance sheet when there is a legally enforceable right to offset the recognised amounts and there is an intention to settle on a net basis, or realise the asset and settle the liability simultaneously.
397
Table of Contents
HSBC HOLDINGS PLC
Notes on the Financial Statements(continued)
| (o) | Subsidiaries, associates and joint ventures |
HSBC classifies investments in entities which it controls as subsidiaries. Where HSBC is a party to a contractual arrangement whereby, together with one or more parties, it undertakes an economic activity that is subject to joint control, HSBC classifies its interest in the venture as a joint venture. HSBC classifies investments in entities over which it has significant influence, and that are neither subsidiaries nor joint ventures, as associates. For the purpose of determining this classification, control is considered to be the power to govern the financial and operating policies of an entity so as to obtain benefits from its activities.
HSBC Holdings’ investments in subsidiaries are stated at cost less any impairment losses. An impairment loss recognised in prior periods shall be reversed through the income statement if, and only if, there has been a change in the estimates used to determine the recoverable amount of the investment in subsidiary since the last impairment loss was recognised.
Investments in associates and interests in joint ventures are recognised using the equity method. Under this method, such investments are initially stated at cost, including attributable goodwill, and are adjusted thereafter for the post-acquisition change in HSBC’s share of net assets.
| (p) | Goodwill and intangible assets |
| (i) | Goodwill arises on the acquisition of subsidiaries, when the aggregate of the fair value of the consideration transferred, the amount of any non-controlling interest and the fair value of any previously held equity interest in the acquiree exceed the amount of the identifiable assets and liabilities acquired. If the amount of the identifiable assets and liabilities acquired is greater, the difference is recognised immediately in the income statement. Goodwill arises on the acquisition of interests in joint ventures and associates when the cost of investment exceeds HSBC’s share of the net fair value of the associate’s or joint venture’s identifiable assets and liabilities. |
Intangible assets are recognised separately from goodwill when they are separable or arise from contractual or other legal rights, and their fair value can be measured reliably.
Goodwill is allocated to cash-generating units (‘CGU’) for the purpose of impairment testing, which is undertaken at the lowest level at which goodwill is monitored for internal management purposes. HSBC’s cash-generating units are based on geographical regions subdivided by global business. Impairment testing is performed at least annually, and whenever there is an indication that the CGU may be impaired, by comparing the recoverable amount of a CGU with its carrying amount. The carrying amount of a CGU is based on the assets and liabilities of each CGU, including attributable goodwill. The recoverable amount of an asset is the higher of its fair value less cost to sell, and its value in use. Value in use is the present value of the expected future cash flows from a cash-generating unit. If the recoverable amount is less than the carrying value, an impairment loss is charged to the income statement. Goodwill is stated at cost less accumulated impairment losses.
Goodwill on acquisitions of interests in joint ventures and associates is included in ‘Interests in associates and joint ventures’ and is not tested separately for impairment.
At the date of disposal of a business, attributable goodwill is included in HSBC’s share of net assets in the calculation of the gain or loss on disposal.
Goodwill is included in a disposal group if the disposal group is a CGU to which goodwill has been allocated or it is an operation within such a CGU. The amount of goodwill included in a disposal group is measured on the basis of the relative values of the operation disposed of and the portion of the CGU retained.
| (ii) | Intangible assets include the present value of in-force long-term insurance business, computer software, trade names, mortgage servicing rights, customer lists, core deposit relationships, credit card customer relationships and merchant or other loan relationships. Computer software includes both purchased and internally generated software. The cost of internally generated software comprises all directly attributable costs necessary to create, produce and prepare the software to be capable of operating in the manner intended by management. Costs incurred in the ongoing maintenance of software are expensed immediately as incurred. |
398
Table of Contents
HSBC HOLDINGS PLC
Notes on the Financial Statements(continued)
Intangible assets are subject to impairment review if there are events or changes in circumstances that indicate that the carrying amount may not be recoverable. Where:
| – | intangible assets have an indefinite useful life, or are not yet ready for use, they are tested for impairment annually. This impairment test may be performed at any time during the year, provided it is performed at the same time every year. An intangible asset recognised during the current period is tested before the end of the current year; and |
| – | intangible assets have a finite useful life, except for the present value of in-force long-term insurance business, they are stated at cost less amortisation and accumulated impairment losses and are amortised over their estimated useful lives. Estimated useful life is the lower of legal duration and expected useful life. The amortisation of mortgage servicing rights is included within ‘Net fee income’. |
For the accounting policy governing the present value of in-force long-term insurance business (see Note 2y).
| (iii) | Intangible assets with finite useful lives are amortised, generally on a straight-line basis, over their useful lives as follows: |
| Trade names | 10 years | |
| Mortgage servicing rights | generally between 5 and 12 years | |
| Internally generated software | between 3 and 5 years | |
| Purchased software | between 3 and 5 years | |
| Customer/merchant relationships | between 3 and 10 years | |
| Other | generally 10 years |
| (q) | Property, plant and equipment |
Land and buildings are stated at historical cost, or fair value at the date of transition to IFRSs (‘deemed cost’), less any impairment losses and depreciation calculated to write-off the assets over their estimated useful lives as follows:
| – | freehold land is not depreciated; |
| – | freehold buildings are depreciated at the greater of 2% per annum on a straight-line basis or over their remaining useful lives; and |
| – | leasehold land and buildings are depreciated over the shorter of their unexpired terms of the leases or their remaining useful lives. |
Equipment, fixtures and fittings (including equipment on operating leases where HSBC is the lessor) are stated at cost less any impairment losses and depreciation, is calculated on a straight-line basis to write-off the assets over their useful lives, which run to a maximum of 35 years but are generally between 5 years and 20 years.
Property, plant and equipment is subject to an impairment review if there are events or changes in circumstances which indicate that the carrying amount may not be recoverable.
HSBC holds certain properties as investments to earn rentals or for capital appreciation, or both. Investment properties are included in the balance sheet at fair value with changes in fair value recognised in the income statement. Fair values are determined by independent professional valuers who apply recognised valuation techniques.
| (r) | Finance and operating leases |
Agreements which transfer to counterparties substantially all the risks and rewards incidental to the ownership of assets, but not necessarily legal title, are classified as finance leases. When HSBC is a lessor under finance leases the amounts due under the leases, after deduction of unearned charges, are included in ‘Loans and advances to banks’ or ‘Loans and advances to customers’, as appropriate. The finance income receivable is recognised in ‘Net interest income’ over the periods of the leases so as to give a constant rate of return on the net investment in the leases.
When HSBC is a lessee under finance leases, the leased assets are capitalised and included in ‘Property, plant and equipment’ and the corresponding liability to the lessor is included in ‘Other liabilities’. A finance lease and its corresponding liability are recognised initially at the fair value of the asset or, if lower, the present value of
399
Table of Contents
HSBC HOLDINGS PLC
Notes on the Financial Statements(continued)
the minimum lease payments. Finance charges payable are recognised in ‘Net interest income’ over the period of the lease based on the interest rate implicit in the lease so as to give a constant rate of interest on the remaining balance of the liability.
All other leases are classified as operating leases. When acting as lessor, HSBC includes the assets subject to operating leases in ‘Property, plant and equipment’ and accounts for them accordingly. Impairment losses are recognised to the extent that residual values are not fully recoverable and the carrying value of the assets is thereby impaired. When HSBC is the lessee, leased assets are not recognised on the balance sheet. Rentals payable and receivable under operating leases are accounted for on a straight-line basis over the periods of the leases and are included in ‘General and administrative expenses’ and ‘Other operating income’, respectively.
| (s) | Income tax |
Income tax comprises current tax and deferred tax. Income tax is recognised in the income statement except to the extent that it relates to items recognised in other comprehensive income or directly in equity, in which case it is recognised in the same statement in which the related item appears.
Current tax is the tax expected to be payable on the taxable profit for the year, calculated using tax rates enacted or substantively enacted by the balance sheet date, and any adjustment to tax payable in respect of previous years. HSBC provides for potential current tax liabilities that may arise on the basis of the amounts expected to be paid to the tax authorities. Current tax assets and liabilities are offset when HSBC intends to settle on a net basis and the legal right to offset exists.
Deferred tax is recognised on temporary differences between the carrying amounts of assets and liabilities in the balance sheet and the amounts attributed to such assets and liabilities for tax purposes. Deferred tax liabilities are generally recognised for all taxable temporary differences and deferred tax assets are recognised to the extent that it is probable that future taxable profits will be available against which deductible temporary differences can be utilised.
Deferred tax is calculated using the tax rates expected to apply in the periods in which the assets will be realised or the liabilities settled, based on tax rates and laws enacted, or substantively enacted, by the balance sheet date. Deferred tax assets and liabilities are offset when they arise in the same tax reporting group and relate to income taxes levied by the same taxation authority, and when HSBC has a legal right to offset.
Deferred tax relating to actuarial gains and losses on post-employment benefits is recognised in other comprehensive income. Deferred tax relating to share-based payment transactions is recognised directly in equity to the extent that the amount of the estimated future tax deduction exceeds the amount of the related cumulative remuneration expense. Deferred tax relating to fair value re-measurements of available-for-sale investments and cash flow hedging instruments which are charged or credited directly to other comprehensive income, is also charged or credited to other comprehensive income and is subsequently recognised in the income statement when the deferred fair value gain or loss is recognised in the income statement.
| (t) | Pension and other post-employment benefits |
HSBC operates a number of pension and other post-employment benefit plans throughout the world. These plans include both defined benefit and defined contribution plans and various other post-employment benefits such as post-employment healthcare.
Payments to defined contribution plans and state-managed retirement benefit plans, where HSBC’s obligations under the plans are equivalent to a defined contribution plan, are charged as an expense as the employees render service.
The defined benefit pension costs and the present value of defined benefit obligations are calculated at the reporting date by the schemes’ actuaries using the Projected Unit Credit Method. The net charge to the income statement mainly comprises the current service cost, plus the unwinding of the discount rate on plan liabilities, less the expected return on plan assets, and is presented in operating expenses. Past service costs are charged immediately to the income statement to the extent that the benefits have vested, and are otherwise recognised on a straight-line basis over the average period until the benefits vest. Actuarial gains and losses comprise experience adjustments (the effects of differences between the previous actuarial assumptions and what has actually occurred), as well as the effects of changes in actuarial assumptions. Actuarial gains and losses are recognised in other comprehensive income in the period in which they arise.
400
Table of Contents
HSBC HOLDINGS PLC
Notes on the Financial Statements(continued)
The defined benefit liability recognised in the balance sheet represents the present value of defined benefit obligations adjusted for unrecognised past service costs and reduced by the fair value of plan assets. Any net defined benefit surplus is limited to unrecognised past service costs plus the present value of available refunds and reductions in future contributions to the plan.
The cost of obligations arising from other post-employment defined benefit plans, such as defined benefit health-care plans, are accounted for on the same basis as defined benefit pension plans.
| (u) | Share-based payments |
HSBC enters into both equity-settled and cash-settled share-based payment arrangements with its employees as compensation for services provided by employees. Equity-settled share-based payment arrangements entitle employees to receive equity instruments of HSBC. Cash-settled share-based payment arrangements entitle employees to receive cash or other assets based on the price or value of the equity instruments of HSBC.
The cost of equity-settled share-based payment arrangements with employees is measured by reference to the fair value of equity instruments on the date they are granted and recognised as an expense on a straight-line basis over the vesting period, with a corresponding credit to ‘Retained earnings’. The vesting period is the period during which all the specified vesting conditions of the arrangement are to be satisfied. The fair value of equity instruments that are made available immediately, with no vesting period attached to the award, are expensed immediately.
For cash-settled share-based payment arrangements, the services acquired and liability incurred are measured at the fair value of the liability, as the employees render service. Until settlement, the fair value of the liability is remeasured, with changes in fair value recognised in the income statement.
Fair value is determined by using appropriate valuation models, taking into account the terms and conditions of the award. Vesting conditions include service conditions and performance conditions; any other features of the arrangement are non-vesting conditions. Market performance conditions and non-vesting conditions are taken into account when estimating the fair value of the award at the date of grant, so that an award is treated as vesting irrespective of whether these conditions are satisfied, provided all other vesting conditions are satisfied.
Vesting conditions, other than market performance conditions, are not taken into account in the initial estimate of the fair value at the grant date. They are taken into account by adjusting the number of equity instruments included in the measurement of the transaction, so that the amount recognised for services received as consideration for the equity instruments granted shall be based on the number of equity instruments that eventually vest. On a cumulative basis, no expense is recognised for equity instruments that do not vest because of a failure to satisfy non-market performance or service conditions.
Where an award has been modified, as a minimum, the expense of the original award continues to be recognised as if it had not been modified. Where the effect of a modification is to increase the fair value of an award or increase the number of equity instruments, the incremental fair value of the award of the extra equity instruments is recognised in addition to the expense of the original grant, measured at the date of modification, over the modified vesting period.
A cancellation that occurs during the vesting period is treated as an acceleration of vesting, and recognised immediately for the amount that would otherwise have been recognised for services over the vesting period.
Where HSBC Holdings enters into share-based payment arrangements involving employees of subsidiaries, the cost is recognised in ‘Investment in subsidiaries’ and credited to the ‘Retained earnings’ over the vesting period. When a subsidiary funds the share-based payment arrangement, ‘Investment in subsidiaries’ is reduced by the fair value of the equity instruments.
| (v) | Foreign currencies |
Items included in the financial statements of each of HSBC’s entities are measured using the currency of the primary economic environment in which the entity operates (‘the functional currency’). HSBC’s consolidated financial statements are presented in US dollars which is also HSBC Holdings’ functional currency.
Transactions in foreign currencies are recorded in the functional currency at the rate of exchange prevailing on the date of the transaction. Monetary assets and liabilities denominated in foreign currencies are translated into the functional currency at the rate of exchange ruling at the balance sheet date. Any resulting exchange
401
Table of Contents
HSBC HOLDINGS PLC
Notes on the Financial Statements(continued)
differences are included in the income statement. Non-monetary assets and liabilities that are measured at historical cost in a foreign currency are translated into the functional currency using the rate of exchange at the date of the initial transaction. Non-monetary assets and liabilities measured at fair value in a foreign currency are translated into the functional currency using the rate of exchange at the date the fair value was determined. Any exchange component of a gain or loss on a non-monetary item is recognised in other comprehensive income if the gain or loss on the non-monetary item is recognised in other comprehensive income. Any exchange component of a gain or loss on a non-monetary item is recognised in the income statement if the gain or loss on the non-monetary item is recognised in the income statement.
In the consolidated financial statements, the assets, including related goodwill where applicable, and liabilities of branches, subsidiaries, joint ventures and associates whose functional currency is not US dollars, are translated into the Group’s presentation currency at the rate of exchange ruling at the balance sheet date. The results of branches, subsidiaries, joint ventures and associates whose functional currency is not US dollars are translated into US dollars at the average rates of exchange for the reporting period. Exchange differences arising from the retranslation of opening foreign currency net assets, and exchange differences arising from retranslation of the result for the reporting period from the average rate to the exchange rate prevailing at the period end, are recognised in other comprehensive income. Exchange differences on a monetary item that is part of a net investment in a foreign operation are recognised in the income statement of the separate financial statements. In consolidated financial statements these exchange differences are recognised in other comprehensive income. On disposal of a foreign operation, exchange differences relating thereto and previously recognised in other comprehensive income are reclassified to the income statement as a reclassification adjustment when the gain or loss on disposal is recognised.
| (w) | Provisions |
Provisions are recognised when it is probable that an outflow of economic benefits will be required to settle a current legal or constructive obligation, which has arisen as a result of past events, and for which a reliable estimate can be made of the amount of the obligation.
Contingent liabilities, which include certain guarantees and letters of credit pledged as collateral security, are possible obligations that arise from past events whose existence will be confirmed only by the occurrence, or non-occurrence, of one or more uncertain future events not wholly within the control of HSBC; or are present obligations that have arisen from past events but are not recognised because it is not probable that settlement will require the outflow of economic benefits, or because the amount of the obligations cannot be reliably measured. Contingent liabilities are not recognised in the financial statements but are disclosed unless the probability of settlement is remote.
| (x) | Financial guarantee contracts |
Liabilities under financial guarantee contracts which are not classified as insurance contracts are recorded initially at their fair value, which is generally the fee received or receivable. Subsequently, financial guarantee liabilities are measured at the higher of the initial fair value, less cumulative amortisation, and the best estimate of the expenditure required to settle the obligations.
HSBC Holdings has issued financial guarantees and similar contracts to other Group entities. Where it has previously asserted explicitly that it regards such contracts as insurance contracts and has used accounting applicable to insurance contracts, HSBC may elect to account for guarantees as an insurance contract in HSBC Holdings’ financial statements. This election is made on a contract by contract basis, but the election for each contract is irrevocable. Where these guarantees have been classified as insurance contracts, they are measured and recognised as insurance liabilities.
| (y) | Insurance contracts |
Through its insurance subsidiaries, HSBC issues contracts to customers that contain insurance risk, financial risk or a combination thereof. A contract under which HSBC accepts significant insurance risk from another party by agreeing to compensate that party on the occurrence of a specified uncertain future event, is classified as an insurance contract. An insurance contract may also transfer financial risk, but is accounted for as an insurance contract if the insurance risk is significant.
402
Table of Contents
HSBC HOLDINGS PLC
Notes on the Financial Statements(continued)
While investment contracts with discretionary participation features are financial instruments, they continue to be treated as insurance contracts as permitted by IFRS 4.
Insurance premiums
Premiums for life insurance contracts are accounted for when receivable, except in unit-linked insurance contracts where premiums are accounted for when liabilities are established.
Gross insurance premiums for non-life insurance business are reported as income over the term of the insurance contracts based on the proportion of risks borne during the accounting period. The unearned premium (the proportion of the business underwritten in the accounting year relating to the period of risk after the balance sheet date) is calculated on a daily or monthly pro rata basis.
Reinsurance premiums are accounted for in the same accounting period as the premiums for the direct insurance contracts to which they relate.
Insurance claims and reinsurance recoveries
Gross insurance claims for life insurance contracts reflect the total cost of claims arising during the year, including claim handling costs and any policyholder bonuses allocated in anticipation of a bonus declaration. Claims arising during the year include maturities, surrenders and death claims.
Maturity claims are recognised when due for payment. Surrenders are recognised when paid or at an earlier date on which, following notification, the policy ceases to be included within the calculation of the related insurance liabilities. Death claims are recognised when notified.
Gross insurance claims for non-life insurance contracts include paid claims and movements in outstanding claims liabilities.
Reinsurance recoveries are accounted for in the same period as the related claim.
Liabilities under insurance contracts
Liabilities under non-linked life insurance contracts are calculated by each life insurance operation based on local actuarial principles. Liabilities under unit-linked life insurance contracts are at least equivalent to the surrender or transfer value which is calculated by reference to the value of the relevant underlying funds or indices.
Outstanding claims liabilities for non-life insurance contracts are based on the estimated ultimate cost of all claims incurred but not settled at the balance sheet date, whether reported or not, together with related claim-handling costs and a reduction for the expected value of salvage and other recoveries. Liabilities for claims incurred but not reported are made on an estimated basis, using appropriate statistical techniques.
A liability adequacy test is carried out on insurance liabilities to ensure that the carrying amount of the liabilities is sufficient in the light of current estimates of future cash flows. When performing the liability adequacy test, all contractual cash flows are discounted and compared with the carrying value of the liability. When a shortfall is identified it is charged immediately to the income statement.
Future profit participation on insurance contracts with discretionary participation features
Where contracts provide discretionary profit participation benefits to policyholders, liabilities for these contracts include provisions for the future discretionary benefits to policyholders. These provisions reflect actual performance of the investment portfolio to date and management expectation on the future performance in connection with the assets backing the contracts, as well as other experience factors such as mortality, lapses and operational efficiency, where appropriate. This benefit may arise from the contractual terms, regulation, or past distribution policy.
Investment contracts
Unit linked and non-linked
Customer liabilities under linked and certain non-linked investment contracts and the corresponding financial assets are designated at fair value. Movements in fair value are recognised in ‘Net income from financial
403
Table of Contents
HSBC HOLDINGS PLC
Notes on the Financial Statements(continued)
investments designated at fair value’. Premiums receivable and amounts withdrawn are accounted for as increases or decreases in the liability recorded in respect of investment contracts.
Liabilities under linked investment contracts are at least equivalent to the surrender or transfer value which is calculated by reference to the value of the relevant underlying funds or indices.
Investment management fees receivable are recognised in the income statement over the period of the provision of the investment management services, in ‘Net fee income’.
The incremental costs directly related to the acquisition of new investment contracts or renewing existing investment contracts are deferred and amortised over the period during which the investment management services are provided.
Investment contracts with discretionary participation features
While investment contracts with discretionary participation features are financial instruments, they continue to be treated as insurance contracts as permitted by IFRS 4. The Group therefore recognises the premiums for those contracts as revenue and recognises as an expense the resulting increase in the carrying amount of the liability.
In the case of net unrealised investment gains on these contracts, whose discretionary benefits principally reflect the actual performance of the investment portfolio, the corresponding increase in the liabilities is recognised in either the income statement or other comprehensive income, following the treatment of the unrealised gains on the relevant assets. In the case of net unrealised losses, a deferred participating asset is recognised only to the extent that its recoverability is highly probable. Movements in the liabilities arising from realised gains and losses on relevant assets are recognised in the income statement.
Present value of in-force long-term insurance business
The value placed on insurance contracts that are classified as long-term insurance business or long-term investment contracts with discretionary participating features (‘DPF’) and are in force at the balance sheet date is recognised as an asset. The asset represents the present value of the equity holders’ interest in the issuing insurance companies’ profits expected to emerge from these contracts written at the balance sheet date.
The present value of in-force long-term insurance business and long-term investment contracts with DPF, referred to as ‘PVIF’, is determined by discounting the equity holders’ interest in future profits expected to emerge from business currently in force using appropriate assumptions in assessing factors such as future mortality, lapse rates and levels of expenses, and a risk discount rate that reflects the risk premium attributable to the respective contracts. The PVIF incorporates allowances for both non-market risk and the value of financial options and guarantees. The PVIF asset is presented gross of attributable tax in the balance sheet and movements in the PVIF asset are included in ‘Other operating income’ on a gross of tax basis.
| (z) | Debt securities issued and deposits by customers and banks |
Financial liabilities are recognised when HSBC enters into the contractual provisions of the arrangements with counterparties, which is generally on trade date, and initially measured at fair value, which is normally the consideration received, net of directly attributable transaction costs incurred. Subsequent measurement of financial liabilities, other than those measured at fair value through profit or loss and financial guarantees, is at amortised cost, using the effective interest method to amortise the difference between proceeds received, net of directly attributable transaction costs incurred, and the redemption amount over the expected life of the instrument.
| (aa) | Share capital |
Shares are classified as equity when there is no contractual obligation to transfer cash or other financial assets. Incremental costs directly attributable to the issue of equity instruments are shown in equity as a deduction from the proceeds, net of tax.
HSBC Holdings plc shares held by HSBC are recognised in equity as a deduction from retained earnings until they are cancelled. When such shares are subsequently sold, reissued or otherwise disposed of, any consideration received is included in equity, net of any directly attributable incremental transaction costs and related income tax effects.
404
Table of Contents
HSBC HOLDINGS PLC
Notes on the Financial Statements(continued)
| (ab) | Cash and cash equivalents |
For the purpose of the statement of cash flows, cash and cash equivalents include highly liquid investments that are readily convertible to known amounts of cash and which are subject to an insignificant risk of change in value. Such investments are normally those with less than three months’ maturity from the date of acquisition. Cash and cash equivalents include cash and balances at central banks, treasury bills and other eligible bills, loans and advances to banks, items in the course of collection from or in transmission to other banks, and certificates of deposit.
| (ac) | Assets held for sale |
Non-current assets and disposal groups (including both the assets and liabilities of the disposal groups) are classified as held for sale when their carrying amounts will be recovered principally through sale, they are available for sale in their present condition and their sale is highly probable. Non-current assets held for sale and disposal groups are measured at the lower of their carrying amount and fair value less cost to sell, except for those assets and liabilities that are not within the scope of the measurement requirements of IFRS 5 ‘Non-current Assets Held for Sale and Discontinued Operations’ such as deferred taxes, financial instruments, investment properties, insurance contracts and assets and liabilities arising from employee benefits. These are measured in accordance with the accounting policies described above. Immediately before the initial classification as held for sale, the carrying amounts of the asset (or assets and liabilities in the disposal group) are measured in accordance with applicable IFRSs. On subsequent remeasurement of a disposal group, the carrying amounts of the assets and liabilities noted above that are not within the scope of the measurement requirements of IFRS 5 are remeasured in accordance with applicable IFRSs before the fair value less costs to sell of the disposal group is determined.
Income earned and expenses incurred on assets held for sale and liabilities of disposal groups held for sale continue to be recognised in the appropriate line items in the income statement until the transaction is complete. Loan impairment charges incurred on assets held for sale continue to be recognised in ‘Loan impairment charges and other credit risk provisions’ and interest income and expense continue to be recognised in ‘Net interest income’. Once classified as held for sale, movements arising from the initial measurement or subsequent remeasurement of the non-current assets (or disposal groups) are recognised in ‘Other operating income’.
405
Table of Contents
HSBC HOLDINGS PLC
Notes on the Financial Statements(continued)
| 3 | Net income/(expense) from financial instruments designated at fair value |
Net income/(expense) from financial instruments designated at fair value includes:
| • | all gains and losses from changes in the fair value of financial assets and liabilities designated at fair value, including liabilities under investment contracts; |
| • | all gains and losses from changes in the fair value of derivatives that are managed in conjunction with financial assets and liabilities designated at fair value; and |
| • | interest income, interest expense and dividend income in respect of: |
| – | financial assets and liabilities designated at fair value; and |
| – | derivatives managed in conjunction with the above, |
except for interest arising from HSBC’s issued debt securities and derivatives managed in conjunction with those debt securities, which is recognised in ‘Interest expense’.
Net income/(expense) from financial instruments designated at fair value
| 2012 | 2011 | 2010 | ||||||||||||||
| US$m | US$m | US$m | ||||||||||||||
Net income/(expense) arising on: | ||||||||||||||||
– financial assets held to meet liabilities under insurance and investment contracts | 2,980 | (933 | ) | 2,349 | ||||||||||||
– other financial assets designated at fair value | 83 | 1,050 | 230 | |||||||||||||
– derivatives managed in conjunction with other financial assets designated at fair value | 35 | (182 | ) | (149 | ) | |||||||||||
| 3,098 | (65 | ) | 2,430 | |||||||||||||
– liabilities to customers under investment contracts | (996 | ) | 231 | (946 | ) | |||||||||||
– HSBC’s long-term debt issued and related derivatives | (4,327 | ) | 4,161 | (258 | ) | |||||||||||
– changes in own credit spread on long-term debt | (5,215 | ) | 3,933 | (63 | ) | |||||||||||
– derivatives managed in conjunction with HSBC’s issued debt securities | 431 | 3,165 | (275 | ) | ||||||||||||
– other changes in fair value | 457 | (2,937 | ) | 80 | ||||||||||||
– other financial liabilities designated at fair value | (23 | ) | (911 | ) | (18 | ) | ||||||||||
– derivatives managed in conjunction with other financial liabilities designated at fair value | 22 | 23 | 12 | |||||||||||||
| (5,324 | ) | 3,504 | (1,210 | ) | ||||||||||||
| (2,226 | ) | 3,439 | 1,220 | |||||||||||||
HSBC Holdings
Net income/(expense) arising on HSBC Holdings long-term debt issued and related derivatives
| 2012 | 2011 | 2010 | ||||||||||||||
| US$m | US$m | US$m | ||||||||||||||
Net income/(expense) arising on: | ||||||||||||||||
– changes in own credit spread on long-term debt | (2,260 | ) | 1,657 | 248 | ||||||||||||
– derivatives managed in conjunction with HSBC Holdings issued debt securities | 456 | 1,368 | (482 | ) | ||||||||||||
– other changes in fair value | (474 | ) | (1,113 | ) | 373 | |||||||||||
| (2,278 | ) | 1,912 | 139 | |||||||||||||
406
Table of Contents
HSBC HOLDINGS PLC
Notes on the Financial Statements(continued)
| 4 | Net earned insurance premiums |
| Non-life insurance | Life (non-linked) | Life (linked) | Investment with DPF1 | Total | ||||||||||||||||||||||||||
| US$m | US$m | US$m | US$m | US$m | ||||||||||||||||||||||||||
2012 | ||||||||||||||||||||||||||||||
Gross earned premiums | 716 | 6,862 | 3,325 | 2,699 | 13,602 | |||||||||||||||||||||||||
– gross written premiums | 760 | 6,815 | 3,325 | 2,699 | 13,599 | |||||||||||||||||||||||||
– movement in unearned premiums | (44 | ) | 47 | – | – | 3 | ||||||||||||||||||||||||
Reinsurers’ share of gross earned premiums | (107 | ) | (443 | ) | (8 | ) | – | (558 | ) | |||||||||||||||||||||
– gross written premiums ceded to reinsurers | (104 | ) | (408 | ) | (8 | ) | – | (520 | ) | |||||||||||||||||||||
– reinsurers’ share of movement in unearned premiums | (3 | ) | (35 | ) | – | – | (38 | ) | ||||||||||||||||||||||
| ||||||||||||||||||||||||||||||
| 609 | 6,419 | 3,317 | 2,699 | 13,044 | ||||||||||||||||||||||||||
2011 | ||||||||||||||||||||||||||||||
Gross earned premiums | 1,144 | 6,238 | 2,801 | 3,155 | 13,338 | |||||||||||||||||||||||||
– gross written premiums | 1,175 | 6,207 | 2,804 | 3,155 | 13,341 | |||||||||||||||||||||||||
– movement in unearned premiums | (31 | ) | 31 | (3 | ) | – | (3 | ) | ||||||||||||||||||||||
Reinsurers’ share of gross earned premiums | (180 | ) | (278 | ) | (8 | ) | – | (466 | ) | |||||||||||||||||||||
– gross written premiums ceded to reinsurers | (182 | ) | (255 | ) | (8 | ) | – | (445 | ) | |||||||||||||||||||||
– reinsurers’ share of movement in unearned premiums | 2 | (23 | ) | – | – | (21 | ) | |||||||||||||||||||||||
| ||||||||||||||||||||||||||||||
| 964 | 5,960 | 2,793 | 3,155 | 12,872 | ||||||||||||||||||||||||||
2010 | ||||||||||||||||||||||||||||||
Gross earned premiums | 1,275 | 5,427 | 1,956 | 2,951 | 11,609 | |||||||||||||||||||||||||
– gross written premiums | 1,192 | 5,357 | 1,956 | 2,951 | 11,456 | |||||||||||||||||||||||||
– movement in unearned premiums | 83 | 70 | – | – | 153 | |||||||||||||||||||||||||
Reinsurers’ share of gross earned premiums | (160 | ) | (289 | ) | (14 | ) | – | (463 | ) | |||||||||||||||||||||
– gross written premiums ceded to reinsurers | (172 | ) | (266 | ) | (8 | ) | – | (446 | ) | |||||||||||||||||||||
– reinsurers’ share of movement in unearned premiums | 12 | (23 | ) | (6 | ) | – | (17 | ) | ||||||||||||||||||||||
| ||||||||||||||||||||||||||||||
| 1,115 | 5,138 | 1,942 | 2,951 | 11,146 | ||||||||||||||||||||||||||
| 1 | Discretionary participation features. |
| 5 | Net insurance claims incurred and movement in liabilities to policyholders |
| Non-life insurance | Life (non-linked) | Life (linked) | Investment with DPF1 | Total | ||||||||||||||||||||||||||
| US$m | US$m | US$m | US$m | US$m | ||||||||||||||||||||||||||
2012 | ||||||||||||||||||||||||||||||
Gross claims incurred and movement in liabilities | 342 | 6,558 | 3,984 | 3,645 | 14,529 | |||||||||||||||||||||||||
– claims, benefits and surrenders paid | 339 | 1,566 | 1,810 | 2,525 | 6,240 | |||||||||||||||||||||||||
– movement in liabilities | 3 | 4,992 | 2,174 | 1,120 | 8,289 | |||||||||||||||||||||||||
Reinsurers’ share of claims incurred and movement in liabilities | (58 | ) | (479 | ) | 223 | – | (314 | ) | ||||||||||||||||||||||
– claims, benefits and surrenders paid | (57 | ) | (160 | ) | (681 | ) | – | (898 | ) | |||||||||||||||||||||
– movement in liabilities | (1 | ) | (319 | ) | 904 | – | 584 | |||||||||||||||||||||||
| ||||||||||||||||||||||||||||||
| 284 | 6,079 | 4,207 | 3,645 | 14,215 | ||||||||||||||||||||||||||
407
Table of Contents
HSBC HOLDINGS PLC
Notes on the Financial Statements(continued)
Net insurance claims incurred and movement in liabilities to shareholders (continued)
| Non-life insurance | Life (non-linked) | Life (linked) | Investment with DPF1 | Total | ||||||||||||||||||||||||||
| US$m | US$m | US$m | US$m | US$m | ||||||||||||||||||||||||||
2011 | ||||||||||||||||||||||||||||||
Gross claims incurred and movement in liabilities | 435 | 5,729 | 2,462 | 3,005 | 11,631 | |||||||||||||||||||||||||
– claims, benefits and surrenders paid | 631 | 1,793 | 1,129 | 2,628 | 6,181 | |||||||||||||||||||||||||
– movement in liabilities | (196 | ) | 3,936 | 1,333 | 377 | 5,450 | ||||||||||||||||||||||||
Reinsurers’ share of claims incurred and movement in liabilities | (85 | ) | (254 | ) | (111 | ) | – | (450 | ) | |||||||||||||||||||||
– claims, benefits and surrenders paid | (81 | ) | (164 | ) | (56 | ) | – | (301 | ) | |||||||||||||||||||||
– movement in liabilities | (4 | ) | (90 | ) | (55 | ) | – | (149 | ) | |||||||||||||||||||||
| ||||||||||||||||||||||||||||||
| 350 | 5,475 | 2,351 | 3,005 | 11,181 | ||||||||||||||||||||||||||
2010 | ||||||||||||||||||||||||||||||
Gross claims incurred and movement in liabilities | 625 | 5,108 | 2,520 | 3,716 | 11,969 | |||||||||||||||||||||||||
– claims, benefits and surrenders paid | 815 | 1,355 | 507 | 2,023 | 4,700 | |||||||||||||||||||||||||
– movement in liabilities | (190 | ) | 3,753 | 2,013 | 1,693 | 7,269 | ||||||||||||||||||||||||
Reinsurers’ share of claims incurred and movement in liabilities | (100 | ) | (201 | ) | 99 | – | (202 | ) | ||||||||||||||||||||||
– claims, benefits and surrenders paid | (114 | ) | (143 | ) | (45 | ) | – | (302 | ) | |||||||||||||||||||||
– movement in liabilities | 14 | (58 | ) | 144 | – | 100 | ||||||||||||||||||||||||
| ||||||||||||||||||||||||||||||
| 525 | 4,907 | 2,619 | 3,716 | 11,767 | ||||||||||||||||||||||||||
| 1 | Discretionary participation features. |
| 6 | Operating profit |
Operating profit is stated after the following items of income, expense, gains and losses:
| 2012 | 2011 | 2010 | ||||||||||||||
| US$m | US$m | US$m | ||||||||||||||
Income | ||||||||||||||||
Interest recognised on impaired financial assets1 | 1,261 | 1,604 | 516 | |||||||||||||
Fees earned on financial assets or liabilities not held for trading nor designated at fair value, other than fees included in effective interest rate calculations on these types of assets and liabilities | 10,042 | 11,318 | 11,445 | |||||||||||||
Fees earned on trust and other fiduciary activities where HSBC holds or invests assets on behalf of its customers | 2,897 | 3,072 | 3,074 | |||||||||||||
Income from listed investments | 5,850 | 8,283 | 7,418 | |||||||||||||
Income from unlisted investments | 7,677 | 8,031 | 7,187 | |||||||||||||
Gain arising from dilution of interests in associates and joint ventures | – | 208 | 188 | |||||||||||||
Expense | ||||||||||||||||
Interest on financial instruments, excluding interest on financial liabilities held for trading or designated at fair value | (17,625 | ) | (20,965 | ) | (17,549 | ) | ||||||||||
Fees payable on financial assets or liabilities not held for trading nor designated at fair value, other than fees included in effective interest rate calculations on these types of assets and liabilities | (1,501 | ) | (1,697 | ) | (1,529 | ) | ||||||||||
Fees payable relating to trust and other fiduciary activities where HSBC holds or invests assets on behalf of its customers | (170 | ) | (182 | ) | (151 | ) | ||||||||||
UK bank levy | (472 | ) | (570 | ) | – | |||||||||||
Auditors’ remuneration (see Note 8) | (49 | ) | (51 | ) | (51 | ) | ||||||||||
Gains/(losses) | ||||||||||||||||
Gain on disposal or settlement of loans and advances | 24 | 116 | 121 | |||||||||||||
Impairment of available-for-sale equity securities | (420 | ) | (177 | ) | (105 | ) | ||||||||||
Gains on disposal of property, plant and equipment, intangible assets and non-financial investments | 187 | 57 | 701 | |||||||||||||
Loan impairment charges and other credit risk provisions | (8,311 | ) | (12,127 | ) | (14,039 | ) | ||||||||||
Net impairment charge on loans and advances | (8,160 | ) | (11,505 | ) | (13,548 | ) | ||||||||||
Impairment of available-for-sale debt securities | (99 | ) | (631 | ) | (472 | ) | ||||||||||
Release/(impairment) in respect of other credit risk provisions | (52 | ) | 9 | (19 | ) | |||||||||||
408
Table of Contents
HSBC HOLDINGS PLC
Notes on the Financial Statements(continued)
| 1 | During 2011 the Group adopted a more stringent treatment for impaired loans for geographical regions with significant levels of forbearance. As a result loans and advances have been classified as impaired that under the previous disclosure convention would otherwise have been classified as neither past due nor impaired or past due but not impaired. The effect of this change on 2011 reported numbers was to increase interest earned on impaired loans from US$0.3bn to US$1.5bn. Restatement of comparative data prior to 31 December 2010 is impracticable (see page 162, ‘Impaired loans disclosure’, for further details). |
| 7 | Employee compensation and benefits |
| 2012 | 2011 | 2010 | ||||||||||||||
| US$m | US$m | US$m | ||||||||||||||
Wages and salaries | 17,780 | 18,923 | 17,193 | |||||||||||||
Social security costs | 1,633 | 1,754 | 1,567 | |||||||||||||
Post-employment benefits | 1,078 | 489 | 1,076 | |||||||||||||
| 20,491 | 21,166 | 19,836 | ||||||||||||||
Average number of persons employed by HSBC during the year
| ||||||||||||||||
| 2012 | 2011 | 2010 | ||||||||||||||
Europe | 77,204 | 81,263 | 79,902 | |||||||||||||
Hong Kong | 28,764 | 30,323 | 29,105 | |||||||||||||
Rest of Asia-Pacific | 88,015 | 92,685 | 89,737 | |||||||||||||
Middle East and North Africa | 8,645 | 8,816 | 8,983 | |||||||||||||
North America | 27,396 | 34,871 | 36,822 | |||||||||||||
Latin America | 54,162 | 58,026 | 57,778 | |||||||||||||
Total | 284,186 | 305,984 | 302,327 | |||||||||||||
Included in ‘Wages and salaries’ above are share-based payment arrangements, as follows:
Share-based payments income statement charge
| ||||||||||||||||
| 2012 | 2011 | 2010 | ||||||||||||||
| US$m | US$m | US$m | ||||||||||||||
Restricted and performance share awards1 | 912 | 1,041 | 685 | |||||||||||||
Savings-related and other share option plans | 96 | 121 | 127 | |||||||||||||
| 1,008 | 1,162 | 812 | ||||||||||||||
Equity-settled share-based payments | 988 | 1,154 | 812 | |||||||||||||
Cash-settled share-based payments | 20 | 8 | – | |||||||||||||
| 1 | Restricted share awards include awards granted under the Group Performance Share Plan (‘GPSP’). |
The share-based payment income statement charge above includes US$837m (2011: US$974m; 2010: US$610m) relating to deferred share awards. These awards are generally granted to employees early in the year following the year to which the award relates. The charge for these awards is recognised from the start of the period to which the service relates to the end of the vesting period. The vesting period is the period over which the employee satisfies certain service conditions in order to become entitled to the award. Due to the staggered vesting profile of certain deferred share awards, the employee becomes entitled to a portion of the award at the end of each year during the vesting period. The income statement charge reflects this vesting profile.
In addition, wages and salaries also includes US$111m (2011: US$88m; 2010: US$15m) in respect of deferred cash awards for current and prior performance years. The reconciliation of total incentive awards (both deferred and non-deferred) to income statement charge is as follows:
409
Table of Contents
HSBC HOLDINGS PLC
Notes on the Financial Statements(continued)
Reconciliation of total incentive awards granted to incentive awards in employee compensation and benefits
| 2012 | 2011 | 2010 | ||||||||||||||
| US$m | US$m | US$m | ||||||||||||||
Total incentive awards approved and granted for the current year1 | 3,689 | 3,966 | 4,297 | |||||||||||||
Less: deferred bonuses awarded for the current year but not amortised | (355 | ) | (369 | ) | (778 | ) | ||||||||||
Total incentives awarded and recognised in the current year | 3,334 | 3,597 | 3,519 | |||||||||||||
Current year charges for deferred bonuses from previous years | 671 | 897 | 625 | |||||||||||||
Other2 | (28 | ) | (261 | ) | (109 | ) | ||||||||||
Total incentive awards for the current year included in employee compensation and benefits | 3,977 | 4,233 | 4,035 | |||||||||||||
| 1 | This represents the amount of the Group variable pay pool that has been approved and granted. The total amount of Group variable pay pool approved by the Group Remuneration Committee is disclosed in the Directors’ Remuneration Report on page 347. |
| 2 | This mainly comprises incentive awards paid to employees acting as selling agents, which form an integral part of the effective interest of a financial instrument, recognised as an adjustment to the effective interest rate and recorded in ‘Interest income’. |
The following table identifies the charge recognised in the current year, or expected to be recognised in future years, in relation to deferred bonus awards from the current year and prior year bonus pools.
Income statement charge for current and prior year bonus pools
Current year bonus pool1 | Prior year bonus pools | Total | ||||||||||||||
| US$m | US$m | US$m | ||||||||||||||
2012 | ||||||||||||||||
Charge recognised in 2012 | 277 | 671 | 948 | |||||||||||||
Deferred share awards | 224 | 613 | 837 | |||||||||||||
Deferred cash awards | 53 | 58 | 111 | |||||||||||||
Charge expected to be recognised in 2013 or later | 355 | 376 | 731 | |||||||||||||
Deferred share awards | 315 | 335 | 650 | |||||||||||||
Deferred cash awards | 40 | 41 | 81 | |||||||||||||
2011 | ||||||||||||||||
Charge recognised in 2011 | 165 | 897 | 1,062 | |||||||||||||
Deferred share awards | 131 | 843 | 974 | |||||||||||||
Deferred cash awards | 34 | 54 | 88 | |||||||||||||
Charge expected to be recognised in 2012 or later | 369 | 731 | 1,100 | |||||||||||||
Deferred share awards | 289 | 652 | 941 | |||||||||||||
Deferred cash awards | 80 | 79 | 159 | |||||||||||||
2010 | ||||||||||||||||
Charge recognised in 2010 | – | 625 | 625 | |||||||||||||
Deferred share awards | – | 610 | 610 | |||||||||||||
Deferred cash awards | – | 15 | 15 | |||||||||||||
Charge expected to be recognised in 2011 or later | 778 | 802 | 1,580 | |||||||||||||
Deferred share awards | 759 | 801 | 1,560 | |||||||||||||
Deferred cash awards | 19 | 1 | 20 | |||||||||||||
| 1 | Current year bonus pool relates to the bonus pool declared for the reporting period (2012 for the current year, 2011 for the 2011 comparatives and 2010 for the 2010 comparatives). |
410
Table of Contents
HSBC HOLDINGS PLC
Notes on the Financial Statements(continued)
Share-based payments
HSBC share awards
| Award | Policy | Purpose | ||
Restricted share awards (including GPSP awards) | • Vesting of awards generally subject to continued employment with HSBC.
• Vesting is generally staggered over three years. GPSP awards vest after five years.
• Certain shares subject to a retention requirement post-vesting. In the case of GPSP awards retention applies until cessation of employment.
• Awards generally not subject to performance conditions.
• Awards granted from 2010 onwards are subject to clawback provision prior to vesting. | • Rewards employee performance and potential and supports retention of key employees.
• To defer variable pay. | ||
Movement on HSBC share awards
| Restricted share awards1 | Performance share awards2 | |||||||||||||||||||||
| 2012 | 2011 | 2012 | 2011 | |||||||||||||||||||
| Number (000s) | Number (000s) | Number (000s) | Number (000s) | |||||||||||||||||||
Outstanding at 1 January | 262,241 | 229,092 | – | 4,425 | ||||||||||||||||||
Additions during the year | 107,928 | 100,819 | – | 154 | ||||||||||||||||||
Released in the year | (193,692 | ) | (56,301 | ) | – | (883 | ) | |||||||||||||||
Forfeited in the year | (10,888 | ) | (11,369 | ) | – | (3,696 | ) | |||||||||||||||
Outstanding at 31 December | 165,589 | 262,241 | – | – | ||||||||||||||||||
Weighted average fair value of awards granted (US$) | 8.93 | 10.11 | – | – | ||||||||||||||||||
| 1 | Restricted share awards include awards granted under the Group Performance Share Plan (‘GPSP’). |
| 2 | Additions during 2011 comprised reinvested dividend equivalents. The last award of performance shares was made in 2008, and shares under the plan were released in March 2011. |
HSBC share option plans
| Main plans | Policy | Purpose | ||
| Savings-related share option plans | • Exercisable within three months following the first anniversary of the commencement of a one-year savings contract or within six months following either the third or fifth anniversaries of the commencement of three-year or five-year contracts, respectively.
• The exercise price is set at a 20% (2011: 20%) discount to the market value immediately preceding the date of invitation (except for the one-year options granted under the US sub-plan where a 15% discount is applied). | • Eligible employees save up to £250 per month (or its equivalent in US dollars, Hong Kong dollars or euros), with the option to use the savings to acquire shares.
• To align the interests of all employees with the creation of shareholder value. | ||
| HSBC Holdings Group share option plan | • Plan ceased in May 2005.
• Exercisable between third and tenth anniversaries of the date of grant. | • Long-term incentive plan between 2000 and 2005 during which certain HSBC employees were awarded share options. | ||
The table on page 412 shows the movement on HSBC share option plans during the year.
Calculation of fair values
The fair values of share options at the date of grant of the option are calculated using a Black-Scholes model.
The fair value of a share award is based on the share price at the date of the grant. The fair value of a share option is inherently subjective and uncertain due to the assumptions made and the limitations of the model used.
411
Table of Contents
HSBC HOLDINGS PLC
Notes on the Financial Statements(continued)
Significant weighted average assumptions used to estimate the fair value of options granted
| Savings-related share option plans | ||||||||||||
| 1-year plan | 3-year plans | 5-year plans | ||||||||||
2012 | ||||||||||||
Risk-free interest rate1 (%) | 0.4 | 0.6 | 1.2 | |||||||||
Expected life (years) | 1 | 3 | 5 | |||||||||
Expected volatility2 (%) | 25 | 25 | 25 | |||||||||
Share price at grant date (£) | 5.46 | 5.46 | 5.46 | |||||||||
2011 | ||||||||||||
Risk-free interest rate1 (%) | 0.8 | 1.7 | 2.5 | |||||||||
Expected life (years) | 1 | 3 | 5 | |||||||||
Expected volatility2 (%) | 25 | 25 | 25 | |||||||||
Share price at grant date (£) | 6.37 | 6.37 | 6.37 | |||||||||
2010 | ||||||||||||
Risk-free interest rate1 (%) | 0.7 | 1.9 | 2.9 | |||||||||
Expected life (years) | 1 | 3 | 5 | |||||||||
Expected volatility2 (%) | 30 | 30 | 30 | |||||||||
Share price at grant date (£) | 6.82 | 6.82 | 6.82 | |||||||||
| 1 | The risk-free rate was determined from the UK gilts yield curve. A similar yield curve was used for the HSBC Holdings Savings-Related Share Option Plan: International. |
| 2 | Expected volatility is estimated by considering both historic average share price volatility and implied volatility derived from traded options over HSBC Holdings ordinary shares of similar maturity to those of the employee options. |
The expected US dollar denominated dividend yield was determined to be 5.0% per annum in line with consensus analyst forecasts (2011: 4.5%; 2010: 4.5%).
HSBC subsidiary company share option plans
There are a number of employee share option plans relating to HSBC France, HSBC Finance and HSBC Bank Bermuda as a result of the acquisition of these entities.
Options granted prior to public announcement of the acquisitions vested on acquisition and are not included in the table below. HSBC France and HSBC Finance granted share options after announcement of the acquisition which vested in subsequent years. Of these, at 31 December 2012, none remained outstanding (2011: 2.4m). Full details of all options outstanding under these plans can be found in Note 38.
Movement on HSBC share option plans
Savings-related share option plans | HSBC Holdings Group share option plan | HSBC Finance share option plan | ||||||||||||||||||||||||||||||||
Number (000s) | WAEP1 £ | Number (000s) | WAEP1 £ | Number (000s) | WAEP1 US$ | |||||||||||||||||||||||||||||
2012 | ||||||||||||||||||||||||||||||||||
Outstanding at 1 January | 153,465 | 3.80 | 120,792 | 7.02 | 2,429 | 9.29 | ||||||||||||||||||||||||||||
Granted during the year2 | 44,868 | 4.44 | – | – | – | – | ||||||||||||||||||||||||||||
Exercised during the year3 | (63,954 | ) | 3.47 | (1,606 | ) | 6.02 | (2,054 | ) | 9.29 | |||||||||||||||||||||||||
Expired during the year | (21,627 | ) | 4.82 | (32,013 | ) | 7.29 | (375 | ) | 9.29 | |||||||||||||||||||||||||
Outstanding at 31 December | 112,752 | 4.04 | 87,173 | 6.94 | – | – | ||||||||||||||||||||||||||||
At 31 December 2012 | ||||||||||||||||||||||||||||||||||
Exercise price range (£): | ||||||||||||||||||||||||||||||||||
3.00 – 4.50 | 95,333 | – | – | |||||||||||||||||||||||||||||||
4.51 – 6.00 | 16,129 | – | – | |||||||||||||||||||||||||||||||
6.01 – 7.50 | 1,290 | 82,278 | – | |||||||||||||||||||||||||||||||
7.51 – 7.96 | – | 4,895 | – | |||||||||||||||||||||||||||||||
Of which exercisable | 4,538 | 87,173 | – | |||||||||||||||||||||||||||||||
Weighted average remaining contractual life (years) | 2.26 | 1.11 | – | |||||||||||||||||||||||||||||||
2011 | ||||||||||||||||||||||||||||||||||
Outstanding at 1 January | 157,855 | 3.87 | 152,758 | 7.12 | 2,429 | 9.29 | ||||||||||||||||||||||||||||
Granted during the year2 | 23,199 | 5.11 | – | – | – | – | ||||||||||||||||||||||||||||
Exercised during the year3 | (7,439 | ) | 5.27 | (646 | ) | 6.06 | – | – | ||||||||||||||||||||||||||
Expired during the year | (20,150 | ) | 4.71 | (31,320 | ) | 7.56 | – | – | ||||||||||||||||||||||||||
Outstanding at 31 December | 153,465 | 3.80 | 120,792 | 7.02 | 2,429 | 9.29 | ||||||||||||||||||||||||||||
412
Table of Contents
HSBC HOLDINGS PLC
Notes on the Financial Statements(continued)
Savings-related share option plans | HSBC Holdings Group share option plan | HSBC Finance share option plan | ||||||||||||||||||||
| Number (000s) | WAEP1 £ | Number (000s) | WAEP1 £ | Number (000s) | WAEP1 US$ | |||||||||||||||||
At 31 December 2011 | ||||||||||||||||||||||
Exercise price range (£): | ||||||||||||||||||||||
3.00 – 4.50 | 117,387 | – | – | |||||||||||||||||||
4.51 – 6.00 | 32,778 | – | – | |||||||||||||||||||
6.01 – 7.50 | 2,341 | 115,901 | – | |||||||||||||||||||
7.51 – 9.29 | 959 | 4,891 | 2,429 | |||||||||||||||||||
Of which exercisable | 3,209 | 120,792 | 2,429 | |||||||||||||||||||
Weighted average remaining contractual life (years) | 2.04 | 1.66 | 0.89 | |||||||||||||||||||
| 1 | Weighted average exercise price. |
| 2 | The weighted average fair value of options granted during the year was US$1.63 (2011: US$2.11). |
| 3 | The weighted average share price at the date the options were exercised was US$8.78 (2011: US$8.65) and US$9.00 (2011: US$9.51) for the savings-related share option plans and HSBC Holdings Group share option plan, respectively. |
Post-employment benefit plans
Income statement charge
| 2012 | 2011 | 2010 | ||||||||||||||
| US$m | US$m | US$m | ||||||||||||||
Defined benefit pension plans | 427 | (172 | ) | 468 | ||||||||||||
– HSBC Bank (UK) Pension Scheme | 169 | (428 | ) | 308 | ||||||||||||
– other plans | 258 | 256 | 160 | |||||||||||||
Defined contribution pension plans | 599 | 626 | 545 | |||||||||||||
| 1,026 | 454 | 1,013 | ||||||||||||||
Defined benefit healthcare plans | 49 | 32 | 58 | |||||||||||||
Defined contribution healthcare plans | 3 | 3 | 5 | |||||||||||||
| 1,078 | 489 | 1,076 | ||||||||||||||
Net assets/(liabilities) recognised on balance sheet in respect of defined benefit plans
2012 US$m | 2011 US$m | |||||||||
Defined benefit pension plans | ||||||||||
HSBC Bank (UK) Pension Scheme | 2,617 | 2,237 | ||||||||
– fair value of plan assets | 29,092 | 26,604 | ||||||||
– present value of defined benefit obligations | (26,475 | ) | (24,367 | ) | ||||||
Other plans | (2,585 | ) | (2,445 | ) | ||||||
– fair value of plan assets | 9,015 | 8,232 | ||||||||
– present value of defined benefit obligations | (11,600 | ) | (10,680 | ) | ||||||
– effect of limit on plan surpluses | (19 | ) | (18 | ) | ||||||
– unrecognised past service cost | 19 | 21 | ||||||||
| ||||||||||
Total | 32 | (208 | ) | |||||||
Defined benefit healthcare plans | ||||||||||
– fair value of plan assets | 189 | 151 | ||||||||
– present value of defined benefit obligations | (1,261 | ) | (1,091 | ) | ||||||
– unrecognised past service cost | (19 | ) | (21 | ) | ||||||
Total | (1,091 | ) | (961 | ) | ||||||
Fair value of plan assets | 38,296 | 34,987 | ||||||||
Present value of defined benefit obligations | (39,336 | ) | (36,138 | ) | ||||||
Effect of limit on plan surpluses | (19 | ) | (18 | ) | ||||||
| (1,059 | ) | (1,169 | ) | |||||||
Retirement benefit liabilities | (3,905 | ) | (3,666 | ) | ||||||
Retirement benefit assets | 2,846 | 2,497 | ||||||||
413
Table of Contents
HSBC HOLDINGS PLC
Notes on the Financial Statements(continued)
Cumulative actuarial gains/(losses) recognised in other comprehensive income
2012 US$m | 2011 US$m | 2010 US$m | ||||||||||||||
At 1 January | (3,453 | ) | (4,720 | ) | (4,660 | ) | ||||||||||
HSBC Bank (UK) Pension Scheme | 208 | 1,945 | 321 | |||||||||||||
Other plans | (440 | ) | (642 | ) | (275 | ) | ||||||||||
Healthcare plans | (154 | ) | (61 | ) | (112 | ) | ||||||||||
Change in the effect of limit on plan surpluses1 | (5 | ) | 25 | 6 | ||||||||||||
Total actuarial gains/(losses) recognised in other comprehensive income | (391 | ) | 1,267 | (60 | ) | |||||||||||
At 31 December2 | (3,844 | ) | (3,453 | ) | (4,720 | ) | ||||||||||
| 1 | Excludes exchange loss of US$4m (2011: US$4m loss; 2010: US$6m gain) |
| 2 | Includes cumulative movements related to the limit on plan surpluses. This limit was US$19m at 31 December 2012 (2011: US$18m; 2010: US$47m) |
HSBC pension plans
| 2012 | 2011 | 2010 | ||||||||||||||
Number of plans worldwide | 225 | 230 | 218 | |||||||||||||
| % | % | % | ||||||||||||||
Percentage of HSBC employees: | ||||||||||||||||
– enrolled in defined contribution plans | 62 | 64 | 63 | |||||||||||||
– enrolled in defined benefit plans | 23 | 25 | 27 | |||||||||||||
– covered by HSBC pension plans | 85 | 89 | 90 | |||||||||||||
HSBC has been progressively offering all new employees membership of defined contribution plans.
The majority of the Group’s defined benefit plans are funded plans. The assets of most of the larger plans are held in trusts or similar funds separate from HSBC. The plans are reviewed at least annually or in accordance with local practice and regulations by qualified actuaries. The actuarial assumptions used to calculate the defined benefit obligations and related current service costs vary according to the economic conditions of the countries in which the plans are situated.
At 31 December 2012, the present values of the defined benefit obligations of The HSBC Bank (UK) Pension Scheme was US$26,475m (2011: US$24,367m), The HSBC Group Hong Kong Local Staff Retirement Benefit Scheme was US$1,476m (2011:US$1,523m) and the HSBC North America (US) Retirement Income Plan was US$4,374m (2011: US$3,895m). These defined benefit pension plans covered 12% of HSBC’s employees and represented 82% of the Group’s present value of defined benefit obligations. The Pension Risk section on page 246 and the Appendix to Risk on page 252 contain details about the characteristics and risks and amount, timing and uncertainty of future cash flows and policies and practices associated with these three schemes.
The determinations described in the Pension Risk section on page 246 for actuarial funding valuation purposes are based on different methods and assumptions from those used for financial reporting purposes, and as a result should neither be compared nor related to other determinations included in these financial statements. There is no actuarial deficit in the Principal plan.
HSBC healthcare benefits plans
HSBC also provides post-employment healthcare benefits under plans in the UK, the US, Bermuda, Canada, Mexico and Brazil, the majority of which are unfunded. The majority of post-employment healthcare benefits plans are defined benefit plans and are accounted for in the same manner as defined benefit pension plans. The plans are reviewed at least annually or in accordance with local practice and regulations by qualified actuaries. The actuarial assumptions used to calculate the defined benefit obligation and related current service cost vary according to the economic conditions of the countries in which they are situated.
At 31 December 2012, the present value of the defined benefit obligation of HSBC’s healthcare benefit plans was US$1,261m (2011: US$1,091m). In aggregate, healthcare benefit plans comprised 3% of HSBC’s present value of defined benefit obligations.
414
Table of Contents
HSBC HOLDINGS PLC
Notes on the Financial Statements(continued)
Defined benefit pension plans
Net asset/(liability) under defined benefit pension plans
| HSBC Bank (UK) Pension Scheme | Other plans | |||||||||||||||||||||
2012 US$m | 2011 US$m | 2012 US$m | 2011 US$m | |||||||||||||||||||
Fair value of plan assets | ||||||||||||||||||||||
At 1 January | 26,604 | 22,236 | 8,232 | 7,559 | ||||||||||||||||||
Expected return on plan assets | 1,245 | 1,325 | 486 | 481 | ||||||||||||||||||
Contributions by HSBC | 238 | 600 | 475 | 565 | ||||||||||||||||||
– normal | 238 | 314 | 191 | 176 | ||||||||||||||||||
– special | – | 286 | 284 | 389 | ||||||||||||||||||
Contributions by employees | 37 | 34 | 20 | 22 | ||||||||||||||||||
Experience gains | 680 | 3,426 | 410 | 200 | ||||||||||||||||||
Benefits paid | (907 | ) | (803 | ) | (630 | ) | (495 | ) | ||||||||||||||
Assets distributed on settlements | – | – | (16 | ) | (25 | ) | ||||||||||||||||
Exchange differences | 1,195 | (214 | ) | 38 | (75 | ) | ||||||||||||||||
At 31 December | 29,092 | 26,604 | 9,015 | 8,232 | ||||||||||||||||||
Present value of defined benefit obligations | ||||||||||||||||||||||
At 1 January | (24,367 | ) | (22,858 | ) | (10,680 | ) | (9,785 | ) | ||||||||||||||
Current service cost | (236 | ) | (251 | ) | (310 | ) | (299 | ) | ||||||||||||||
Interest cost | (1,178 | ) | (1,233 | ) | (404 | ) | (456 | ) | ||||||||||||||
Contributions by employees | (36 | ) | (34 | ) | (21 | ) | (22 | ) | ||||||||||||||
Actuarial losses | (472 | ) | (1,481 | ) | (850 | ) | (842 | ) | ||||||||||||||
Benefits paid | 906 | 804 | 743 | 569 | ||||||||||||||||||
Past service cost – vested immediately | – | 587 | (47 | ) | (40 | ) | ||||||||||||||||
Past service cost – unvested benefits | – | – | 2 | 2 | ||||||||||||||||||
Reduction in liabilities resulting from curtailments | – | – | 11 | 59 | ||||||||||||||||||
Liabilities extinguished on settlements | – | – | 26 | 29 | ||||||||||||||||||
Exchange differences | (1,092 | ) | 99 | (70 | ) | 105 | ||||||||||||||||
At 31 December | (26,475 | ) | (24,367 | ) | (11,600 | ) | (10,680 | ) | ||||||||||||||
Funded | (26,475 | ) | (24,367 | ) | (10,956 | ) | (10,074 | ) | ||||||||||||||
Unfunded | – | – | (644 | ) | (606 | ) | ||||||||||||||||
Effect of limit on plan surpluses | – | – | (19 | ) | (18 | ) | ||||||||||||||||
Unrecognised past service cost | – | – | 19 | 21 | ||||||||||||||||||
Net asset/(liability) | 2,617 | 2,237 | (2,585 | ) | (2,445 | ) | ||||||||||||||||
Retirement benefit liabilities recognised in the balance sheet | – | – | (2,814 | ) | (2,705 | ) | ||||||||||||||||
Retirement benefit assets recognised in the balance sheet | 2,617 | 2,237 | 229 | 260 | ||||||||||||||||||
Plan assets of the Group’s pension schemes included US$20m (2011: US$45m) of equities and no bonds (2011: nil) issued by HSBC and US$292m (2011: US$1,228m) of other assets placed or transacted with HSBC. The fair value of plan assets included derivatives entered into with HSBC Bank plc by the HSBC Bank (UK) Pension Scheme with a positive fair value of US$5,226m at 31 December 2012 (2011: US$5,560m positive fair value) and US$328m positive fair value (2011: US$297m positive fair value) in respect of the HSBC International Staff Retirement Benefits Scheme. Further details of these swap arrangements are included in Note 44.
In December 2011, HSBC Bank plc made a £184m (US$286m) special contribution to the HSBC Bank (UK) Pension Scheme. Following the contribution the Scheme purchased asset-backed securities from HSBC at an arm’s length value, determined by the Scheme’s independent third-party advisers.
The special contributions of US$284m to other plans include an additional contribution of US$181m to the HSBC North America (US) Retirement Income Plan which was made to maintain a minimum funding level.
The actual return on plan assets for the year ended 31 December 2012 was a positive return of US$2,784m (2011: positive US$5,432m).
HSBC expects to make US$604m of contributions to defined benefit pension plans during 2013. Benefits expected to be paid from the plans to retirees over each of the next five years, and in aggregate for the five years thereafter, are as follows:
415
Table of Contents
HSBC HOLDINGS PLC
Notes on the Financial Statements(continued)
Benefits expected to be paid from plans
| 2013 | 2014 | 2015 | 2016 | 2017 | 2018-2022 | |||||||||||||||||||||||||||||
| US$m | US$m | US$m | US$m | US$m | US$m | |||||||||||||||||||||||||||||
HSBC Bank (UK) Pension Scheme | 745 | 776 | 810 | 849 | 899 | 5,411 | ||||||||||||||||||||||||||||
Other plans | 556 | 541 | 557 | 577 | 624 | 3,595 | ||||||||||||||||||||||||||||
| Total (income)/expense recognised in the income statement in ‘Employee compensation and benefits’ | ||||||||||||||||||||||||||||||||||
| HSBC Bank (UK) Pension Scheme | Other plans | |||||||||||||||||||||||||||||||||
| 2012 | 2011 | 2010 | 2012 | 2011 | 2010 | |||||||||||||||||||||||||||||
| US$m | US$m | US$m | US$m | US$m | US$m | |||||||||||||||||||||||||||||
Current service cost | 236 | 251 | 252 | 310 | 299 | 300 | ||||||||||||||||||||||||||||
Interest cost | 1,178 | 1,233 | 1,148 | 404 | 456 | 438 | ||||||||||||||||||||||||||||
Expected return on plan assets | (1,245 | ) | (1,325 | ) | (1,092 | ) | (486 | ) | (481 | ) | (437 | ) | ||||||||||||||||||||||
Past service cost | – | (587 | ) | – | 51 | 45 | 12 | |||||||||||||||||||||||||||
Gains on curtailments | – | – | – | (11 | ) | (59 | ) | (151 | ) | |||||||||||||||||||||||||
Gains on settlements | – | – | – | (10 | ) | (4 | ) | (2 | ) | |||||||||||||||||||||||||
Total (income)/expense | 169 | (428 | ) | 308 | 258 | 256 | 160 | |||||||||||||||||||||||||||
Summary
| HSBC Bank (UK) Pension Scheme | ||||||||||||||||||||||||||||
| 2012 | 2011 | 2010 | 2009 | 2008 | ||||||||||||||||||||||||
| US$m | US$m | US$m | US$m | US$m | ||||||||||||||||||||||||
Present value of defined benefit obligation | (26,475 | ) | (24,367 | ) | (22,858 | ) | (21,523 | ) | (15,257 | ) | ||||||||||||||||||
Fair value of plan assets | 29,092 | 26,604 | 22,236 | 17,701 | 14,865 | |||||||||||||||||||||||
Net surplus/(deficit) | 2,617 | 2,237 | (622 | ) | (3,822 | ) | (392 | ) | ||||||||||||||||||||
Experience gains/(losses) on plan liabilities | 880 | (383 | ) | (327 | ) | (234 | ) | (49 | ) | |||||||||||||||||||
Experience gains/(losses) on plan assets | 680 | 3,426 | 1,772 | 871 | (2,861 | ) | ||||||||||||||||||||||
Gains/(losses) from changes in actuarial assumptions | (1,352 | ) | (1,098 | ) | (1,124 | ) | (4,329 | ) | 3,081 | |||||||||||||||||||
Total net actuarial gains/(losses) | 208 | 1,945 | 321 | (3,692 | ) | 171 | ||||||||||||||||||||||
| Other plans | ||||||||||||||||||||||||||||
| 2012 | 2011 | 2010 | 2009 | 2008 | ||||||||||||||||||||||||
| US$m | US$m | US$m | US$m | US$m | ||||||||||||||||||||||||
Present value of defined benefit obligation | (11,600 | ) | (10,680 | ) | (9,785 | ) | (9,109 | ) | (8,787 | ) | ||||||||||||||||||
Fair value of plan assets | 9,015 | 8,232 | 7,559 | 6,822 | 6,024 | |||||||||||||||||||||||
Net deficit | (2,585 | ) | (2,448 | ) | (2,226 | ) | (2,287 | ) | (2,763 | ) | ||||||||||||||||||
Experience gains/(losses) on plan liabilities | 56 | (78 | ) | (73 | ) | 20 | (52 | ) | ||||||||||||||||||||
Experience gains/(losses) on plan assets | 410 | 200 | 394 | 65 | (1,452 | ) | ||||||||||||||||||||||
Gains/(losses) from changes in actuarial assumptions | (906 | ) | (764 | ) | (596 | ) | 94 | (306 | ) | |||||||||||||||||||
Total net actuarial gains/(losses) | (440 | ) | (642 | ) | (275 | ) | 179 | (1,810 | ) | |||||||||||||||||||
416
Table of Contents
HSBC HOLDINGS PLC
Notes on the Financial Statements(continued)
Post-employment defined benefit plans’ principal actuarial financial assumptions
The principal actuarial financial assumptions used to calculate the Group’s obligations for the largest defined benefit pension plans at 31 December for each period, and used as the basis for measuring periodic costs under the plans in the following periods, were as follows:
Principal actuarial assumptions
Discount % | Inflation rate % | Rate of increase for pensions % | Rate of pay increase % | |||||||||||||||||||
At 31 December 2012 | ||||||||||||||||||||||
UK1 | 4.50 | 3.10 | 2.90 | 3.60 | ||||||||||||||||||
Hong Kong | 0.60 | n/a | n/a | 4.00 | ||||||||||||||||||
US | 3.95 | 2.50 | n/a | 2.75 | ||||||||||||||||||
At 31 December 2011 | ||||||||||||||||||||||
UK1 | 4.80 | 3.20 | 3.10 | 3.70 | ||||||||||||||||||
Hong Kong | 1.47 | n/a | n/a | 5.00 | ||||||||||||||||||
US | 4.60 | 2.50 | n/a | 2.75 | ||||||||||||||||||
At 31 December 2010 | ||||||||||||||||||||||
UK1 | 5.40 | 3.70 | 3.50 | 4.20 | ||||||||||||||||||
Hong Kong | 2.85 | n/a | n/a | 5.00 | ||||||||||||||||||
US | 5.41 | 2.50 | n/a | 2.75 | ||||||||||||||||||
| 1 | Rate of increase for pensions in the UK is for pensions in payment only, capped at 5%. Deferred pensions are projected to increase in line with the CPI, capped at 5%. For 2010, deferred pensions were projected to increase in line with the RPI, capped at 5%. |
HSBC determines the discount rates to be applied to its obligations in consultation with the plans’ local actuaries, on the basis of current average yields of high quality (AA rated or equivalent) debt instruments, with maturities consistent with those of the defined benefit obligations. In countries where there is not a deep market in corporate bonds, government bond yields have been used. The yield curve has been extrapolated where the term of the liabilities is longer than the duration of available bonds and the discount rate used then takes into account the term of the liabilities and the shape of the yield curve. When determining the discount rate with reference to a bond index, an appropriate index for the specific region has been used.
Mortality tables and average life expectancy at age 65
| Mortality table | Life expectancy at age 65 for a male member currently: | Life expectancy at age 65 for a female member currently: | ||||||||||||||||||||||||
| Aged 65 | Aged 45 | Aged 65 | Aged 45 | |||||||||||||||||||||||
At 31 December 2012 | ||||||||||||||||||||||||||
UK | SAPS S11 | 23.9 | 25.6 | 25.4 | 27.7 | |||||||||||||||||||||
Hong Kong2 | n/a | n/a | n/a | n/a | n/a | |||||||||||||||||||||
US | RP 2000 fully generational3 | 21.1 | 23.1 | 23.2 | 25.0 | |||||||||||||||||||||
At 31 December 2011 | ||||||||||||||||||||||||||
UK | SAPS MC4 | 22.5 | 24.4 | 23.5 | 25.4 | |||||||||||||||||||||
Hong Kong2 | n/a | n/a | n/a | n/a | n/a | |||||||||||||||||||||
US | RP 2000 fully generational3 | 19.4 | 20.9 | 21.3 | 22.2 | |||||||||||||||||||||
| 1 | SAPS S1 with Continuous Mortality Investigation 2011 improvements and a 1.25% long-term allowance improvement. Light table with 1.01 rating for male pensioners and 1.02 rating for female pensioners. |
| 2 | The significant plans in Hong Kong are lump sum plans which do not use a post-retirement mortality table. |
| 3 | The projections scale applied to the mortality rates has changed from AA at 31 December 2011 to BB at 31 December 2012, to better reflect observed mortality improvements. |
| 4 | SAPS MC projections with 1% minimum improvement beyond 2002. Light table with 1.08 rating for male pensioners and standard table with 1.06 rating for female pensioners. |
417
Table of Contents
HSBC HOLDINGS PLC
Notes on the Financial Statements(continued)
Expected rates of return
| 2012 | 2011 | |||||||||||||||||||||
Expected rates of return1 | Value US$m | Expected rates of return1 | Value US$m | |||||||||||||||||||
HSBC Bank (UK) Pension Scheme | ||||||||||||||||||||||
Fair value of plan assets | 29,092 | 26,604 | ||||||||||||||||||||
Equities | 7.1 | 3,899 | 7.2 | 3,190 | ||||||||||||||||||
Bonds | 4.0 | 22,258 | 4.1 | 20,737 | ||||||||||||||||||
Property | 6.7 | 1,583 | 6.7 | 1,524 | ||||||||||||||||||
Other | 3.1 | 1,352 | 2.8 | 1,153 | ||||||||||||||||||
Other plans | ||||||||||||||||||||||
Fair value of plan assets | 9,015 | 8,232 | ||||||||||||||||||||
Equities | 7.9 | 2,688 | 7.7 | 2,184 | ||||||||||||||||||
Bonds | 4.1 | 4,963 | 4.7 | 4,659 | ||||||||||||||||||
Property | 5.0 | 107 | 4.6 | 106 | ||||||||||||||||||
Other | 3.6 | 1,257 | 4.0 | 1,283 | ||||||||||||||||||
| 1 | The expected rates of return are used to measure the net defined benefit pension costs in each subsequent year, and weighted on the basis of the fair value of the plan assets. In 2013 the basis will change as described on page 386. |
The expected return on plan assets represents the best estimate of long-term future asset returns, which takes into account historical market returns plus additional factors such as the current rate of inflation and interest rates.
Actuarial assumption sensitivities
The discount rate is sensitive to changes in market conditions arising during the reporting period. The mortality rates used are sensitive to experience from the plan member profile. The following table shows the effect of changes in these and the other key assumptions on the principal defined benefit pension plan:
The effect of changes in key assumptions on the principal plan
| HSBC Bank (UK) Pension Scheme | ||||||||||
2012 US$m | 2011 US$m | |||||||||
Discount rate | ||||||||||
Change in pension obligation at year end from a 25bps increase | (1,191 | ) | (980 | ) | ||||||
Change in pension obligation at year end from a 25bps decrease | 1,275 | 1,045 | ||||||||
Change in 2013 pension cost from a 25bps increase1 | (78 | ) | 2 | |||||||
Change in 2013 pension cost from a 25bps decrease1 | 76 | (2 | ) | |||||||
Rate of inflation | ||||||||||
Change in pension obligation at year end from a 25bps increase | 881 | 1,026 | ||||||||
Change in pension obligation at year end from a 25bps decrease | (842 | ) | (978 | ) | ||||||
Change in 2013 pension cost from a 25bps increase1 | 48 | 57 | ||||||||
Change in 2013 pension cost from a 25bps decrease1 | (47 | ) | (54 | ) | ||||||
Rate of increase for pensions in payment and deferred pensions | ||||||||||
Change in pension obligation at year end from a 25bps increase | 719 | 876 | ||||||||
Change in pension obligation at year end from a 25bps decrease | (692 | ) | (841 | ) | ||||||
Change in 2013 pension cost from a 25bps increase1 | 36 | 43 | ||||||||
Change in 2013 pension cost from a 25bps decrease1 | (34 | ) | (42 | ) | ||||||
Rate of pay increase | ||||||||||
Change in pension obligation at year end from a 25bps increase | 175 | 248 | ||||||||
Change in pension obligation at year end from a 25bps decrease | (173 | ) | (240 | ) | ||||||
Change in 2013 pension cost from a 25bps increase1 | 15 | 19 | ||||||||
Change in 2013 pension cost from a 25bps decrease1 | (13 | ) | (15 | ) | ||||||
Investment return | ||||||||||
Change in 2013 pension cost from a 25bps increase1 | – | (65 | ) | |||||||
Change in 2013 pension cost from a 25bps decrease1 | – | 67 | ||||||||
Mortality | ||||||||||
Change in pension obligation from each additional year of longevity assumed | 663 | 619 | ||||||||
| 1 | The change in 2013 pension cost from a 25bps increase/decrease was calculated based on the requirements of IAS 19 revised, which will be adopted from 1 January 2013. The comparative numbers, which show the change in 2012 pension cost from a 25bps increase/decrease, were calculated in accordance with the accounting policy set out in Note 2(t). |
418
Table of Contents
HSBC HOLDINGS PLC
Notes on the Financial Statements(continued)
The effect of changes in the discount rate and in mortality rates on plans other than the principal plan
| Other plans | ||||||||||
2012 US$m | 2011 US$m | |||||||||
Change in defined benefit obligation at year end from a 25bps increase in discount rate | (379 | ) | (325 | ) | ||||||
Change in 2013 pension cost from a 25bps increase in discount rate1 | (17 | ) | – | |||||||
Increase in defined benefit obligation from each additional year of longevity assumed | 174 | 144 | ||||||||
| 1 | The change in 2013 pension cost from a 25bps increase/decrease was calculated based on the requirements of IAS 19 revised, which will be adopted from 1 January 2013. The comparative numbers, which show the change in 2012 pension cost from a 25bps increase/decrease, were calculated in accordance with the accounting policy set out in Note 2(t). |
HSBC Holdings
Employee compensation and benefit expense in respect of HSBC Holdings’ employees in 2012 amounted to US$439m (2011: US$413m). The average number of persons employed by HSBC Holdings during 2012 was 1,323 (2011: 1,212).
Employees of HSBC Holdings who are members of defined benefit pension plans are principally members of either the HSBC Bank (UK) Pension Scheme or the HSBC International Staff Retirement Benefits Scheme. HSBC Holdings pays contributions to such plans for its own employees in accordance with the schedules of contributions determined by the Trustees of the plan.
Directors’ emoluments
The aggregate emoluments of the Directors of HSBC Holdings, computed in accordance with the Companies Act 2006 and the Large and Medium-sized Companies and Groups (Accounts and Reports) Regulations 2008 were:
2012 US$000 | 2011 US$000 | 2010 US$000 | ||||||||||||||
Fees | 5,435 | 5,108 | 3,597 | |||||||||||||
Salaries and other emoluments | 10,316 | 12,906 | 12,841 | |||||||||||||
Annual incentives | 13,983 | 12,516 | 14,294 | |||||||||||||
Total | 29,734 | 30,530 | 30,732 | |||||||||||||
Vesting of long-term incentive awards | 5,733 | 2,596 | 8,523 | |||||||||||||
In addition, there were payments under retirement benefit agreements with former Directors of US$1,171,796 (2011: US$1,166,580). The provision at 31 December 2012 in respect of unfunded pension obligations to former Directors amounted to US$19,285,971 (2011: US$18,006,894).
During the year, aggregate contributions to pension schemes in respect of Directors were US$29,078 (2011: US$373,310). Discretionary annual incentives for Directors are based on a combination of individual and corporate performance and are determined by the Group Remuneration Committee. Details of Directors’ remuneration, share options and awards under the HSBC Share Plan and HSBC Share Plan 2011 are included in the ‘Directors’ Remuneration Report’ on pages 347 to 367.
| 8 | Auditors’ remuneration |
| 2012 US$m | 2011 US$m | 2010 US$m | ||||||||||||||
Audit fees payable to KPMG1 | 47.2 | 48.8 | 49.1 | |||||||||||||
Audit fees payable to non-KPMG entities | 1.4 | 1.9 | 2.3 | |||||||||||||
Total auditors’ remuneration | 48.6 | 50.7 | 51.4 | |||||||||||||
| 1 | Fees payable to KPMG for HSBC Holdings’ statutory audit and audit of HSBC’s subsidiaries, pursuant to legislation. |
The following fees were payable by HSBC to the Group’s principal auditor, KPMG Audit Plc and its associates (together ‘KPMG’):
419
Table of Contents
HSBC HOLDINGS PLC
Notes on the Financial Statements(continued)
Fees payable by HSBC to KPMG
| 2012 US$m | 2011 US$m | 2010 US$m | ||||||||||||||
Fees for HSBC Holdings’ statutory audit1 | 13.2 | 12.7 | 11.8 | |||||||||||||
– relating to current year | 12.8 | 12.4 | 11.8 | |||||||||||||
– relating to prior year | 0.4 | 0.3 | – | |||||||||||||
Fees for other services provided to HSBC | 67.3 | 74.4 | 66.5 | |||||||||||||
Audit of HSBC’s subsidiaries2 | 34.0 | 36.1 | 37.3 | |||||||||||||
Audit-related assurance services3 | 23.6 | 25.7 | 20.8 | |||||||||||||
Taxation-related services: | ||||||||||||||||
– taxation compliance services | 2.1 | 2.8 | 1.5 | |||||||||||||
– taxation advisory services | 1.3 | 1.5 | 0.9 | |||||||||||||
Other assurance services | 1.1 | 1.3 | 1.4 | |||||||||||||
Other non-audit services4 | 5.2 | 7.0 | 4.6 | |||||||||||||
| ||||||||||||||||
Total fees payable | 80.5 | 87.1 | 78.3 | |||||||||||||
| 1 | Fees payable to KPMG for the statutory audit of the consolidated financial statements of HSBC and the separate financial statements of HSBC Holdings. They include amounts payable for services relating to HSBC Holdings’ subsidiaries consolidation returns which are clearly identifiable as being in support of the Group audit opinion, with effect from 1 January 2012. Previously these fees were included in ‘Fees for other services provided to HSBC’. Comparative information has been updated accordingly. The adjustment reduced ‘Fees for other services provided to HSBC’ and increased ‘Fees for HSBC Holdings’ statutory audit’ by US$11.0m in 2012 (2011: US$10.5m; 2010: US$9.4m). There was no effect on basic or diluted earnings per share following the change. |
| 2 | Fees payable for the statutory audit of HSBC’s subsidiaries financial statements. |
| 3 | Including services for assurance and other services that relate to statutory and regulatory filings, including comfort letters and interim reviews. |
| 4 | Including valuation and actuarial services, translation services, ad-hoc accounting advice, review of financial models, advice on IT security and business continuity, corporate finance transactions and performing agreed-upon IT testing procedures. |
No fees were payable by HSBC to KPMG for the following types of services: internal audit services, services related to litigation and recruitment and remuneration.
Fees payable by HSBC’s associated pension schemes to KPMG
2012 US$000 | 2011 US$000 | 2010 US$000 | ||||||||||||||
Audit of HSBC’s associated pension schemes | 256 | 248 | 384 | |||||||||||||
Taxation-related services | – | 11 | – | |||||||||||||
– taxation compliance services | – | – | – | |||||||||||||
– taxation advisory services | – | 11 | – | |||||||||||||
| ||||||||||||||||
Total fees payable | 256 | 259 | 384 | |||||||||||||
No fees were payable by HSBC’s associated pension schemes to KPMG for the following types of services: audit related assurance services, internal audit services, other assurance services, services related to corporate finance transactions, valuation and actuarial services, litigation, recruitment and remuneration, and information technology.
In addition to the above, KPMG estimate they have been paid fees of US$3.3m (2011: US$8.6m; 2010: US$14.9m) by parties other than HSBC but where HSBC is connected with the contracting party and therefore may be involved in appointing KPMG. These fees arise from services such as auditing mutual funds managed by HSBC and reviewing the financial position of corporate concerns which borrow from HSBC.
Fees payable to KPMG for non-audit services for HSBC Holdings are not disclosed separately because such fees are disclosed on a consolidated basis for HSBC Group.
420
Table of Contents
HSBC HOLDINGS PLC
Notes on the Financial Statements(continued)
| 9 | Tax |
Tax charged to the income statement
| 2012 US$m | 2011 US$m | 2010 US$m | ||||||||||||||
Current tax | ||||||||||||||||
UK corporation tax | 250 | 820 | 383 | |||||||||||||
– for this year | 60 | 462 | 404 | |||||||||||||
– adjustments in respect of prior years | 190 | 358 | (21 | ) | ||||||||||||
Overseas tax1 | 5,560 | 4,255 | 3,328 | |||||||||||||
– for this year | 5,421 | 4,155 | 3,235 | |||||||||||||
– adjustments in respect of prior years | 139 | 100 | 93 | |||||||||||||
| ||||||||||||||||
| 5,810 | 5,075 | 3,711 | ||||||||||||||
Deferred tax | (495 | ) | (1,147 | ) | 1,135 | |||||||||||
Origination and reversal of temporary differences | (269 | ) | (1,178 | ) | 1,176 | |||||||||||
Effect of changes in tax rates | 66 | (3 | ) | 31 | ||||||||||||
Adjustments in respect of prior years | (292 | ) | 34 | (72 | ) | |||||||||||
| ||||||||||||||||
Total tax charged to the income statement | 5,315 | 3,928 | 4,846 | |||||||||||||
| 1 | Overseas tax included Hong Kong profits tax of US$1,049m (2011: US$997m; 2010: US$962m). The Hong Kong tax rate applying to the profits of subsidiaries assessable in Hong Kong was 16.5% (2011: 16.5%; 2010: 16.5%). Other overseas subsidiaries and overseas branches provided for taxation at the appropriate rates in the countries in which they operate. |
Tax reconciliation
The tax charged to the income statement differs to the tax charge that would apply if all profits had been taxed at the UK corporation tax rate as follows:
| 2012 | 2011 | 2010 | ||||||||||||||||||||||||||||||||
| US$m | % | US$m | % | US$m | % | |||||||||||||||||||||||||||||
Profit before tax | 20,649 | 21,872 | 19,037 | |||||||||||||||||||||||||||||||
Tax at 24.5% (2011: 26.5%; 2010: 28.0%) | 5,057 | 24.5 | 5,796 | 26.5 | 5,330 | 28.0 | ||||||||||||||||||||||||||||
Impact of differently taxed overseas profits | (57 | ) | (0.3 | ) | (492 | ) | (2.2 | ) | (744 | ) | (3.9 | ) | ||||||||||||||||||||||
Adjustments in respect of prior period liabilities | 37 | 0.2 | 495 | 2.3 | – | – | ||||||||||||||||||||||||||||
Deferred tax temporary differences not recognised/(previously not recognised) | 374 | 1.8 | (923 | ) | (4.2 | ) | (6 | ) | – | |||||||||||||||||||||||||
Effect of profits in associates and joint ventures | (872 | ) | (4.3 | ) | (865 | ) | (4.0 | ) | (758 | ) | (4.0 | ) | ||||||||||||||||||||||
Tax impact of intra-group transfer of subsidiary | – | – | – | – | 1,216 | 6.4 | ||||||||||||||||||||||||||||
Tax impact of disposal of Ping An | (204 | ) | (1.0 | ) | – | – | – | – | ||||||||||||||||||||||||||
Non taxable income and gains | (542 | ) | (2.6 | ) | (613 | ) | (2.8 | ) | (700 | ) | (3.7 | ) | ||||||||||||||||||||||
Permanent disallowables | 1,092 | 5.3 | 467 | 2.1 | 355 | 1.9 | ||||||||||||||||||||||||||||
Change in tax rates | 78 | 0.4 | (3 | ) | – | 31 | 0.2 | |||||||||||||||||||||||||||
Local taxes and overseas withholding taxes | 581 | 2.8 | 267 | 1.2 | 224 | 1.2 | ||||||||||||||||||||||||||||
Other items | (229 | ) | (1.1 | ) | (201 | ) | (0.9 | ) | (102 | ) | (0.6 | ) | ||||||||||||||||||||||
Total tax charged to the income statement | 5,315 | 25.7 | 3,928 | 18.0 | 4,846 | 25.5 | ||||||||||||||||||||||||||||
The effective tax rate for the year was 25.7% compared with 18.0% for 2011. The higher effective tax rate in 2012 reflects the non tax deductible effect of fines and penalties as part of the settlement of investigations into past inadequate compliance with anti-money laundering and sanction laws, together with the non-recognition of the tax benefit in respect of the accounting charge associated with negative fair value movements on own debt. The lower effective tax rate in 2011 included the benefit of deferred tax of US$0.9bn in respect of foreign tax credits in the US.
The UK corporation tax rate applying to HSBC Holdings and its subsidiaries was 24.5% (2011: 26.5%; 2010: 28%).
The UK Government announced that the main rate of corporation tax for the year beginning 1 April 2012 will reduce from 26% to 24% to be followed by a 1% reduction to 23% for the year beginning 1 April 2013 and a further 2% reduction to 21% for the year beginning 1 April 2014. The reduction in the corporate tax rate to 24% was substantively enacted in the first half of 2012 and this results in a weighted average rate of 24.5% for 2012
421
Table of Contents
HSBC HOLDINGS PLC
Notes on the Financial Statements(continued)
(2011: 26.5%). The reduction to 23% was enacted through the 2012 Finance Act in July and the reduction to 21% announced in the 2012 Autumn Statement is expected to be enacted through the 2013 Finance Act. It is not expected that the proposed future rate reductions will have a significant effect on the Group.
The Group’s legal entities are subject to routine review and audit by tax authorities in the territories in which the Group operates. The Group provides for potential tax liabilities that may arise on the basis of the amounts expected to be paid to the tax authorities. The amounts ultimately paid may differ materially from the amounts provided depending on the ultimate resolution of such matters. A substantial proportion of the material open issues related to the UK of which the principal matter concerned the application of the UK Controlled Foreign Company (‘CFC’) rules. Following further discussion with Her Majesty’s Revenue and Customs, the CFC and certain other open UK issues have now been resolved.
Deferred taxation
The table overleaf shows the gross deferred tax assets and liabilities recognised in the balance sheet and the related amounts recognised in the income statement, other comprehensive income and directly in equity.
The amounts presented in the balance sheet are different from the amounts disclosed in the table overleaf as they are presented after offsetting asset and liability balances where HSBC has the legal right to set-off and intends to settle on a net basis.
US
Of the total net deferred tax assets of US$6.5bn at 31 December 2012 (2011: US$6.2bn), the net deferred tax asset relating to HSBC’s operations in the US was US$4.6bn (2011: US$5.2bn). The deferred tax assets included in this total reflected the carry forward of no tax losses and tax credits (2011: US$1.2bn), deductible temporary differences in respect of loan impairment allowances of US$2.0bn (2011: US$2.7bn) and other temporary differences of US$2.6bn (2011: US$1.3bn).
Deductions for loan impairments for US tax purposes generally occur when the impaired loan is charged off, often in the period subsequent to that in which the impairment is recognised for accounting purposes. As a result, the amount of the associated deferred tax asset should generally move in line with the impairment allowance balance. The taxable gains on the disposal of the US branch network and Card and Retail Services business has resulted in a reduction in the amount of deferred tax assets related to carried forward tax losses and tax credits. This was offset in part by the reversal of deferred tax liabilities as a result of these disposals.
On the evidence available, including historical levels of profitability, management projections of future income and HSBC Holdings’ commitment to continue to invest sufficient capital in North America to recover the deferred tax asset, it is expected that there will be sufficient taxable income generated by the business to realise these assets. Management projections of profits from the US operations are prepared for a 10-year period and include assumptions about future house prices and US economic conditions, including unemployment levels.
The current level of the deferred tax asset in respect of loan impairment allowances is projected to reduce over the 10-year period in line with the reduction in the Consumer and Mortgage Lending portfolio.
As there has been a recent history of losses in HSBC’s US operations, management’s analysis of the recognition of these deferred tax assets significantly discounts any future expected profits from the US operations and relies to a greater extent on capital support from HSBC Holdings, including tax planning strategies in relation to such support. The principal strategy involves generating future taxable profits through the retention of capital in the US in excess of normal regulatory requirements in order to reduce deductible funding expenses or otherwise deploy such capital to increase levels of taxable income.
422
Table of Contents
HSBC HOLDINGS PLC
Notes on the Financial Statements(continued)
Movement of deferred tax assets and liabilities before offsetting balances within countries
Retirement benefits | Loan impairment provisions | Unused tax losses and tax credits | Accelerated capital allowances | Available- for-sale investments | Cash flow hedges | Share- based payments | Assets leased to customers | Revaluation of property US$m | Fee income US$m | Other US$m | Total US$m | |||||||||||||||||||||||||||||||||||||||||||||||||||||||||||
2012 | ||||||||||||||||||||||||||||||||||||||||||||||||||||||||||||||||||||||
Assets | 742 | 4,448 | 1,328 | 117 | – | 487 | 286 | 14 | – | – | 1,709 | 9,131 | ||||||||||||||||||||||||||||||||||||||||||||||||||||||||||
Liabilities | (107 | ) | – | – | – | (557 | ) | (137 | ) | – | (595 | ) | (227 | ) | (737 | ) | (563 | ) | (2,923 | ) | ||||||||||||||||||||||||||||||||||||||||||||||||||
At 1 January | 635 | 4,448 | 1,328 | 117 | (557 | ) | 350 | 286 | (581 | ) | (227 | ) | (737 | ) | 1,146 | 6,208 | ||||||||||||||||||||||||||||||||||||||||||||||||||||||
Acquisitions and disposals | – | – | – | – | – | – | – | – | – | – | 3 | 3 | ||||||||||||||||||||||||||||||||||||||||||||||||||||||||||
Income statement | (313 | ) | (590 | ) | (692 | ) | 168 | (270 | ) | (9 | ) | (52 | ) | 569 | 111 | 616 | 957 | 495 | ||||||||||||||||||||||||||||||||||||||||||||||||||||
Other comprehensive income | 174 | – | (33 | ) | – | (395 | ) | (90 | ) | – | – | – | – | – | (344 | ) | ||||||||||||||||||||||||||||||||||||||||||||||||||||||
Equity | – | – | – | – | – | – | 45 | – | – | – | – | 45 | ||||||||||||||||||||||||||||||||||||||||||||||||||||||||||
Foreign exchange and other adjustments | (27 | ) | 54 | 14 | (50 | ) | 19 | (10 | ) | 26 | 24 | 19 | 16 | (31 | ) | 54 | ||||||||||||||||||||||||||||||||||||||||||||||||||||||
At 31 December | 469 | 3,912 | 617 | 235 | (1,203 | ) | 241 | 305 | 12 | (97 | ) | (105 | ) | 2,075 | 6,461 | |||||||||||||||||||||||||||||||||||||||||||||||||||||||
Assets | 469 | 3,912 | 617 | 289 | – | 285 | 305 | 184 | – | – | 2,965 | 9,026 | ||||||||||||||||||||||||||||||||||||||||||||||||||||||||||
Liabilities | – | – | – | (54 | ) | (1,203 | ) | (44 | ) | – | (172 | ) | (97 | ) | (105 | ) | (890 | ) | (2,565 | ) | ||||||||||||||||||||||||||||||||||||||||||||||||||
2011 | ||||||||||||||||||||||||||||||||||||||||||||||||||||||||||||||||||||||
Assets | 1,538 | 4,799 | 351 | 109 | 11 | 352 | 241 | – | – | – | 957 | 8,358 | ||||||||||||||||||||||||||||||||||||||||||||||||||||||||||
Liabilities | – | – | (3 | ) | (126 | ) | (135 | ) | (88 | ) | – | (707 | ) | (225 | ) | (756 | ) | (400 | ) | (2,440 | ) | |||||||||||||||||||||||||||||||||||||||||||||||||
At 1 January | 1,538 | 4,799 | 348 | (17 | ) | (124 | ) | 264 | 241 | (707 | ) | (225 | ) | (756 | ) | 557 | 5,918 | |||||||||||||||||||||||||||||||||||||||||||||||||||||
Acquisitions and disposals | 3 | – | 11 | – | (3 | ) | (5 | ) | 1 | – | 22 | – | (6 | ) | 23 | |||||||||||||||||||||||||||||||||||||||||||||||||||||||
Income statement | (437 | ) | (224 | ) | 945 | 137 | 10 | 14 | 1 | 93 | (36 | ) | 17 | 627 | 1,147 | |||||||||||||||||||||||||||||||||||||||||||||||||||||||
Other comprehensive income | (322 | ) | – | – | – | (533 | ) | 53 | – | – | – | – | – | (802 | ) | |||||||||||||||||||||||||||||||||||||||||||||||||||||||
Equity | – | – | – | – | – | – | 27 | – | – | – | – | 27 | ||||||||||||||||||||||||||||||||||||||||||||||||||||||||||
Foreign exchange and other adjustments | (147 | ) | (127 | ) | 24 | (3 | ) | 93 | 24 | 16 | 33 | 12 | 2 | (32 | ) | (105 | ) | |||||||||||||||||||||||||||||||||||||||||||||||||||||
At 31 December | 635 | 4,448 | 1,328 | 117 | (557 | ) | 350 | 286 | (581 | ) | (227 | ) | (737 | ) | 1,146 | 6,208 | ||||||||||||||||||||||||||||||||||||||||||||||||||||||
Assets | 742 | 4,448 | 1,328 | 117 | – | 487 | 286 | 14 | – | – | 1,709 | 9,131 | ||||||||||||||||||||||||||||||||||||||||||||||||||||||||||
Liabilities | (107 | ) | – | – | – | (557 | ) | (137 | ) | – | (595 | ) | (227 | ) | (737 | ) | (563 | ) | (2,923 | ) | ||||||||||||||||||||||||||||||||||||||||||||||||||
423
Table of Contents
HSBC HOLDINGS PLC
Notes on the Financial Statements(continued)
Brazil
The net deferred tax asset relating to HSBC’s operations in Brazil was US$0.9bn (2011: US$0.7bn). The deferred tax assets included in this total arose primarily in relation to deductible temporary differences in respect of loan impairment allowances. Deductions for loan impairments for Brazilian tax purposes generally occur in periods subsequent to those in which they are recognised for accounting purposes and, as a result, the amount of the associated deferred tax assets move in line with the impairment allowance balance.
Loan impairment deductions are recognised for tax purposes typically within 24 months of accounting recognition. On the evidence available, including historic levels of profitability, management projections of income and the state of the Brazilian economy, it is anticipated that there will be sufficient taxable income generated by the business to realise these assets when deductible for tax purposes.
There were no material carried forward tax losses or tax credits recognised within the Group’s deferred tax assets in Brazil.
Mexico
The net deferred tax asset relating to HSBC’s operations in Mexico was US$0.6bn (2011: US$0.5bn). The deferred tax assets included in this total related primarily to deductible temporary differences in respect of accounting provisions for impaired loans, including losses realised on sales of impaired loans. The annual deduction for loan impairments is capped under Mexican legislation at 2.5% of the average qualifying loan portfolio. The balance is carried forward to future years without expiry but with the annual deduction subject to the 2.5% cap.
On the evidence available, including historic and projected levels of loan portfolio growth, loan impairment rates and profitability, it is anticipated that the business will realise these assets within the next 15 years. The projections assume that loan impairment rates will remain at levels consistently below the annual 2.5% cap over the medium term.
There were no material carried forward tax losses or tax credits recognised within the Group’s deferred tax assets in Mexico.
UK
The net deferred tax asset relating to HSBC’s operations in the UK was US$0.3bn (2011: liability US$0.2bn). The deferred tax assets included in this total relate primarily to the carry forward of tax losses.
On the evidence available, including historical levels of profitability and management projections of future income it is anticipated that there will be sufficient taxable income generated by the business to recover the deferred tax asset over the next 12 months.
Unrecognised deferred tax
The amount of temporary differences, unused tax losses and tax credits for which no deferred tax asset is recognised in the balance sheet was US$16.6bn (2011: US$14.7bn). These amounts included unused state losses arising in our US operations of US$12.6bn (2011: US$12.5bn).
Of the total amounts unrecognised, US$3.9bn (2011: US$2.4bn) had no expiry date, US$0.3bn (2011: US$0.1bn) was scheduled to expire within 10 years (2011: 10 years) and the remaining will expire after 10 years.
Deferred tax is not recognised in respect of the Group’s investments in subsidiaries and branches where remittance or other realisation is not probable, and for those associates and interests in joint ventures where it has been determined that no additional tax will arise. No amount is disclosed for the unrecognised deferred tax or the 2012 and 2011 temporary differences associated with such investments as it is impracticable to determine the amount of income taxes that would be payable when any temporary differences reverse. Deferred tax of US$0.3bn (2011: US$0.2bn) has, however, been provided in respect of distributable reserves of associates that, on distribution, would attract withholding tax.
424
Table of Contents
HSBC HOLDINGS PLC
Notes on the Financial Statements(continued)
HSBC Holdings
Movement of deferred tax assets
Accelerated capital allowances | Short-term timing differences | Available- for-sale investments | Fair valued assets and liabilities | Share- based payments | Unused tax losses | Total | ||||||||||||||||||||||||||||||||||
| US$m | US$m | US$m | US$m | US$m | US$m | US$m | ||||||||||||||||||||||||||||||||||
2012 | ||||||||||||||||||||||||||||||||||||||||
At 1 January | – | – | (4 | ) | 46 | 9 | 40 | 91 | ||||||||||||||||||||||||||||||||
Income statement | 2 | – | – | (15 | ) | (7 | ) | (40 | ) | (60 | ) | |||||||||||||||||||||||||||||
Other comprehensive income | – | – | (27 | ) | – | – | – | (27 | ) | |||||||||||||||||||||||||||||||
Equity | – | – | – | – | 10 | – | 10 | |||||||||||||||||||||||||||||||||
At 31 December | 2 | – | (31 | ) | 31 | 12 | – | 14 | ||||||||||||||||||||||||||||||||
2011 | ||||||||||||||||||||||||||||||||||||||||
At 1 January | – | 1 | (21 | ) | 61 | 16 | – | 57 | ||||||||||||||||||||||||||||||||
Income statement | – | (1 | ) | – | (15 | ) | (7 | ) | 40 | 17 | ||||||||||||||||||||||||||||||
Other comprehensive income | – | – | 17 | – | – | – | 17 | |||||||||||||||||||||||||||||||||
At 31 December | – | – | (4 | ) | 46 | 9 | 40 | 91 | ||||||||||||||||||||||||||||||||
The amount of unused tax losses for which no deferred tax asset is recognised in the balance sheet was US$1,775m (2011: US$8m) of which US$9m (2011: US$8m) relate to capital losses. The losses have no expiry date.
| 10 | Dividends |
Dividends to shareholders of the parent company
| 2012 | 2011 | 2010 | ||||||||||||||||||||||||||||||||||||||||||||||||||
| Per share US$ | Total US$m | Settled in scrip | Per share US$ | Total US$m | Settled in scrip | Per share US$ | Total US$m | Settled in scrip | ||||||||||||||||||||||||||||||||||||||||||||
Dividends declared on ordinary shares | ||||||||||||||||||||||||||||||||||||||||||||||||||||
In respect of previous year: | ||||||||||||||||||||||||||||||||||||||||||||||||||||
– fourth interim dividend | 0.14 | 2,535 | 259 | 0.12 | 2,119 | 1,130 | 0.10 | 1,733 | 838 | |||||||||||||||||||||||||||||||||||||||||||
In respect of current year: | ||||||||||||||||||||||||||||||||||||||||||||||||||||
– first interim dividend | 0.09 | 1,633 | 748 | 0.09 | 1,601 | 204 | 0.08 | 1,394 | 746 | |||||||||||||||||||||||||||||||||||||||||||
– second interim dividend | 0.09 | 1,646 | 783 | 0.09 | 1,603 | 178 | 0.08 | 1,402 | 735 | |||||||||||||||||||||||||||||||||||||||||||
– third interim dividend | 0.09 | 1,655 | 639 | 0.09 | 1,605 | 720 | 0.08 | 1,408 | 205 | |||||||||||||||||||||||||||||||||||||||||||
| 0.41 | 7,469 | 2,429 | 0.39 | 6,928 | 2,232 | 0.34 | 5,937 | 2,524 | ||||||||||||||||||||||||||||||||||||||||||||
Quarterly dividends on preference shares classified as equity | ||||||||||||||||||||||||||||||||||||||||||||||||||||
March dividend | 15.50 | 22 | 15.50 | 22 | 15.50 | 22 | ||||||||||||||||||||||||||||||||||||||||||||||
June dividend | 15.50 | 23 | 15.50 | 23 | 15.50 | 23 | ||||||||||||||||||||||||||||||||||||||||||||||
September dividend | 15.50 | 22 | 15.50 | 22 | 15.50 | 22 | ||||||||||||||||||||||||||||||||||||||||||||||
December dividend | 15.50 | 23 | 15.50 | 23 | 15.50 | 23 | ||||||||||||||||||||||||||||||||||||||||||||||
| 62.00 | 90 | 62.00 | 90 | 62.00 | 90 | |||||||||||||||||||||||||||||||||||||||||||||||
Quarterly coupons on capital securities classified as equity1
| 2012 | 2011 | 2010 | ||||||||||||||||||||||||||||||||
| Per share | Total | Per share | Total | Per share | Total | |||||||||||||||||||||||||||||
| US$ | US$m | US$ | US$m | US$ | US$m | |||||||||||||||||||||||||||||
January coupon | 0.508 | 44 | 0.508 | 44 | 0.508 | 44 | ||||||||||||||||||||||||||||
March coupon | 0.500 | 76 | 0.500 | 76 | – | – | ||||||||||||||||||||||||||||
April coupon | 0.508 | 45 | 0.508 | 45 | 0.508 | 45 | ||||||||||||||||||||||||||||
June coupon | 0.500 | 76 | 0.500 | 76 | – | – | ||||||||||||||||||||||||||||
July coupon | 0.508 | 45 | 0.508 | 45 | 0.508 | 45 | ||||||||||||||||||||||||||||
September coupon | 0.500 | 76 | 0.500 | 76 | 0.450 | 68 | ||||||||||||||||||||||||||||
October coupon | 0.508 | 45 | 0.508 | 45 | 0.508 | 45 | ||||||||||||||||||||||||||||
December coupon | 0.500 | 76 | 0.500 | 76 | 0.500 | 76 | ||||||||||||||||||||||||||||
| 4.032 | 483 | 4.032 | 483 | 2.982 | 323 | |||||||||||||||||||||||||||||
| 1 | HSBC Holdings issued Perpetual Subordinated Capital Securities of US$3,800m in June 2010 and US$2,200m in April 2008, which are classified as equity under IFRSs. |
425
Table of Contents
HSBC HOLDINGS PLC
Notes on the Financial Statements(continued)
The Directors declared after the end of the year a fourth interim dividend in respect of the financial year ended 31 December 2012 of US$0.18 per ordinary share, a distribution of approximately US$3,327m. The fourth interim dividend will be payable on 8 May 2013 to holders of record on 21 March 2013 on the Hong Kong Overseas Branch Register and 22 March 2013 on the Principal Register in the UK or the Bermuda Overseas Branch Register. No liability is recorded in the financial statements in respect of the fourth interim dividend for 2012.
On 15 January 2013, HSBC paid a further coupon on the capital securities of US$0.508 per security, a distribution of US$44m. No liability is recorded in the balance sheet at 31 December 2012 in respect of this coupon payment.
| 11 | Earnings per share |
Basic earnings per ordinary share was calculated by dividing the profit attributable to ordinary shareholders of the parent company by the weighted average number of ordinary shares outstanding, excluding own shares held. Diluted earnings per ordinary share was calculated by dividing the basic earnings, which require no adjustment for the effects of dilutive potential ordinary shares, by the weighted average number of ordinary shares outstanding, excluding own shares held, plus the weighted average number of ordinary shares that would be issued on conversion of dilutive potential ordinary shares.
Profit attributable to the ordinary shareholders of the parent company
| 2012 | 2011 | 2010 | ||||||||||||||||
| US$m | US$m | US$m | ||||||||||||||||
Profit attributable to shareholders of the parent company | 14,027 | 16,797 | 13,159 | |||||||||||||||
Dividend payable on preference shares classified as equity | (90 | ) | (90 | ) | (90 | ) | ||||||||||||
Coupon payable on capital securities classified as equity | (483 | ) | (483 | ) | (323 | ) | ||||||||||||
Profit attributable to the ordinary shareholders of the parent company | 13,454 | 16,224 | 12,746 | |||||||||||||||
Basic and diluted earnings per share
| 2012 | 2011 | 2010 | ||||||||||||||||||||||||||||||||||||||||||||||||||
| Profit US$m | Number of shares (millions) | Per share US$ | Profit US$m | Number of shares (millions) | Per share US$ | Profit US$m | Number of shares (millions) | Per share US$ | ||||||||||||||||||||||||||||||||||||||||||||
Basic1 | 13,454 | 18,125 | 0.74 | 16,224 | 17,700 | 0.92 | 12,746 | 17,404 | 0.73 | |||||||||||||||||||||||||||||||||||||||||||
Effect of dilutive potential ordinary shares | 146 | 222 | 229 | |||||||||||||||||||||||||||||||||||||||||||||||||
– Savings-related Share Option Plan | 23 | 45 | 55 | |||||||||||||||||||||||||||||||||||||||||||||||||
– Other plans | 123 | 177 | 174 | |||||||||||||||||||||||||||||||||||||||||||||||||
| ||||||||||||||||||||||||||||||||||||||||||||||||||||
Diluted1 | 13,454 | 18,271 | 0.74 | 16,224 | 17,922 | 0.91 | 12,746 | 17,633 | 0.72 | |||||||||||||||||||||||||||||||||||||||||||
| 1 | Weighted average number of ordinary shares outstanding (basic) or assuming dilution (diluted). |
The weighted average number of dilutive potential ordinary shares excluded 103m employee share options that were anti-dilutive (2011: 151m; 2010: 150m).
| 12 | Segmental analysis |
HSBC’s operating segments are organised into six geographical regions, Europe, Hong Kong, Rest of Asia-Pacific, Middle East and North Africa (‘MENA’), North America and Latin America.
Geographical information is classified by the location of the principal operations of the subsidiary or, for The Hongkong and Shanghai Banking Corporation, HSBC Bank, HSBC Bank Middle East and HSBC Bank USA, by the location of the branch responsible for reporting the results or advancing the funds.
HSBC’s chief operating decision-maker is the Group Management Board (‘GMB’) which operates as a general management committee under the direct authority of the Board. Information provided to GMB to make decisions about allocating resources to, and assessing the performance of, operating segments is measured in accordance with IFRSs. The financial information shown below includes the effects of intra-HSBC transactions between operating segments which are conducted on an arm’s length basis and are eliminated in arriving at the total. Shared costs are included in operating segments on the basis of the actual recharges made.
426
Table of Contents
HSBC HOLDINGS PLC
Notes on the Financial Statements(continued)
Products and services
HSBC provides a comprehensive range of banking and related financial services to its customers in its six geographical regions. The products and services offered to customers are organised by global business.
| • | Retail Banking and Wealth Management (‘RBWM’) offers a broad range of products and services to meet the personal banking and wealth management needs of individual customers. Typically, customer offerings include personal banking products (current and savings accounts, mortgages and personal loans, credit cards, debit cards and local and international payment services) and wealth management services (insurance and investment products, global asset management services and financial planning services). |
| • | Commercial Banking (‘CMB’) offers a broad range of products and services to serve the needs of our commercial customers, including small and medium sized enterprises, mid-market enterprises and corporates. These include credit and lending, international trade and receivables finance, treasury management and liquidity solutions (payments and cash management and commercial cards), commercial insurance and investments. We also offer our customers access to products and services offered by other global businesses, for example Global Banking & Markets (‘GB&M’) which include foreign exchange products, raising capital on debt and equity markets and advisory services. |
| • | GB&M provides tailored financial solutions to major government, corporate and institutional clients and private investors worldwide. The client-focused business lines deliver a full range of banking capabilities including financing, advisory and transaction services, a markets business that provides services in credit, rates, foreign exchange, money markets and securities services, and principal investment activities. |
| • | Global Private Banking (‘GPB’) provides a range of services to high net worth individuals and families with complex and international needs. |
Financial information
In the following segmental analysis, the benefit of shareholders’ funds impacts the analysis only to the extent that these funds are actually allocated to businesses in the segment by way of intra-HSBC capital and funding structures.
427
Table of Contents
HSBC HOLDINGS PLC
Notes on the Financial Statements(continued)
Profit/(loss) for the year
| Europe US$m | Hong Kong | Rest of Asia- Pacific | MENA US$m | North America | Latin America | Intra- HSBC items | Total US$m | |||||||||||||||||||||||||||||||||||||||
2012 | ||||||||||||||||||||||||||||||||||||||||||||||
Net interest income | 10,394 | 5,316 | 5,391 | 1,470 | 8,117 | 6,984 | – | 37,672 | ||||||||||||||||||||||||||||||||||||||
Net fee income | 6,169 | 3,335 | 2,083 | 595 | 2,513 | 1,735 | – | 16,430 | ||||||||||||||||||||||||||||||||||||||
Net trading income/(expense) | 2,707 | 1,463 | 1,053 | 390 | 507 | 971 | – | 7,091 | ||||||||||||||||||||||||||||||||||||||
Gains on disposal of US branch network, US cards business and Ping An | – | – | 3,012 | – | 4,012 | – | – | 7,024 | ||||||||||||||||||||||||||||||||||||||
Other income | (1,662 | ) | 2,308 | 2,045 | (25 | ) | (456 | ) | 1,261 | (3,358 | ) | 113 | ||||||||||||||||||||||||||||||||||
Net operating income1 | 17,608 | 12,422 | 13,584 | 2,430 | 14,693 | 10,951 | (3,358 | ) | 68,330 | |||||||||||||||||||||||||||||||||||||
Loan impairment charges and other credit risk provisions | (1,921 | ) | (74 | ) | (436 | ) | (286 | ) | (3,457 | ) | (2,137 | ) | – | (8,311 | ) | |||||||||||||||||||||||||||||||
Net operating income | 15,687 | 12,348 | 13,148 | 2,144 | 11,236 | 8,814 | (3,358 | ) | 60,019 | |||||||||||||||||||||||||||||||||||||
Employee compensation and benefits | (8,070 | ) | (2,572 | ) | (3,140 | ) | (652 | ) | (3,243 | ) | (2,814 | ) | – | (20,491 | ) | |||||||||||||||||||||||||||||||
General and administrative expenses | (10,059 | ) | (1,860 | ) | (2,433 | ) | (459 | ) | (5,413 | ) | (3,117 | ) | 3,358 | (19,983 | ) | |||||||||||||||||||||||||||||||
Depreciation and impairment of property, plant and equipment | (597 | ) | (236 | ) | (191 | ) | (44 | ) | (195 | ) | (221 | ) | – | (1,484 | ) | |||||||||||||||||||||||||||||||
Amortisation and impairment of intangible assets | (369 | ) | (180 | ) | (42 | ) | (11 | ) | (89 | ) | (278 | ) | – | (969 | ) | |||||||||||||||||||||||||||||||
Total operating expenses | (19,095 | ) | (4,848 | ) | (5,806 | ) | (1,166 | ) | (8,940 | ) | (6,430 | ) | 3,358 | (42,927 | ) | |||||||||||||||||||||||||||||||
Operating profit | (3,408 | ) | 7,500 | 7,342 | 978 | 2,296 | 2,384 | – | 17,092 | |||||||||||||||||||||||||||||||||||||
Share of profit in associates and joint ventures | (6 | ) | 82 | 3,106 | 372 | 3 | – | – | 3,557 | |||||||||||||||||||||||||||||||||||||
Profit before tax | (3,414 | ) | 7,582 | 10,448 | 1,350 | 2,299 | 2,384 | – | 20,649 | |||||||||||||||||||||||||||||||||||||
Tax income/(expense) | (173 | ) | (1,095 | ) | (1,616 | ) | (254 | ) | (1,313 | ) | (864 | ) | – | (5,315 | ) | |||||||||||||||||||||||||||||||
Profit for the year | (3,587 | ) | 6,487 | 8,832 | 1,096 | 986 | 1,520 | – | 15,334 | |||||||||||||||||||||||||||||||||||||
2011 | ||||||||||||||||||||||||||||||||||||||||||||||
Net interest income | 11,001 | 4,691 | 5,102 | 1,432 | 11,480 | 6,956 | – | 40,662 | ||||||||||||||||||||||||||||||||||||||
Net fee income | 6,236 | 3,097 | 2,111 | 627 | 3,308 | 1,781 | – | 17,160 | ||||||||||||||||||||||||||||||||||||||
Net trading income/(expense) | 2,161 | 1,189 | 1,658 | 482 | (362 | ) | 1,378 | – | 6,506 | |||||||||||||||||||||||||||||||||||||
Other income | 4,848 | 1,705 | 1,842 | 66 | 1,574 | 1,338 | (3,421 | ) | 7,952 | |||||||||||||||||||||||||||||||||||||
Net operating income1 | 24,246 | 10,682 | 10,713 | 2,607 | 16,000 | 11,453 | (3,421 | ) | 72,280 | |||||||||||||||||||||||||||||||||||||
Loan impairment charges and other credit risk provisions | (2,512 | ) | (156 | ) | (267 | ) | (293 | ) | (7,016 | ) | (1,883 | ) | – | (12,127 | ) | |||||||||||||||||||||||||||||||
Net operating income | 21,734 | 10,526 | 10,446 | 2,314 | 8,984 | 9,570 | (3,421 | ) | 60,153 | |||||||||||||||||||||||||||||||||||||
Employee compensation and benefits | (7,621 | ) | (2,610 | ) | (3,179 | ) | (659 | ) | (3,928 | ) | (3,169 | ) | – | (21,166 | ) | |||||||||||||||||||||||||||||||
General and administrative expenses | (8,473 | ) | (1,724 | ) | (2,378 | ) | (458 | ) | (4,404 | ) | (3,443 | ) | 3,421 | (17,459 | ) | |||||||||||||||||||||||||||||||
Depreciation and impairment of property, plant and equipment | (581 | ) | (245 | ) | (198 | ) | (36 | ) | (261 | ) | (249 | ) | – | (1,570 | ) | |||||||||||||||||||||||||||||||
Amortisation and impairment of intangible assets | (394 | ) | (179 | ) | (51 | ) | (6 | ) | (326 | ) | (394 | ) | – | (1,350 | ) | |||||||||||||||||||||||||||||||
Total operating expenses | (17,069 | ) | (4,758 | ) | (5,806 | ) | (1,159 | ) | (8,919 | ) | (7,255 | ) | 3,421 | (41,545 | ) | |||||||||||||||||||||||||||||||
Operating profit | 4,665 | 5,768 | 4,640 | 1,155 | 65 | 2,315 | – | 18,608 | ||||||||||||||||||||||||||||||||||||||
Share of profit in associates and joint ventures | 6 | 55 | 2,831 | 337 | 35 | – | – | 3,264 | ||||||||||||||||||||||||||||||||||||||
Profit before tax | 4,671 | 5,823 | 7,471 | 1,492 | 100 | 2,315 | – | 21,872 | ||||||||||||||||||||||||||||||||||||||
Tax income/(expense) | (1,589 | ) | (1,043 | ) | (1,315 | ) | (266 | ) | 958 | (673 | ) | – | (3,928 | ) | ||||||||||||||||||||||||||||||||
Profit for the year | 3,082 | 4,780 | 6,156 | 1,226 | 1,058 | 1,642 | – | 17,944 | ||||||||||||||||||||||||||||||||||||||
428
Table of Contents
HSBC HOLDINGS PLC
Notes on the Financial Statements(continued)
| Europe | Hong Kong | Rest of Asia- Pacific | MENA | North America | Latin America | Intra- HSBC items | Total | |||||||||||||||||||||||||||||||||||||||
| US$m | US$m | US$m | US$m | US$m | US$m | US$m | US$m | |||||||||||||||||||||||||||||||||||||||
2010 | ||||||||||||||||||||||||||||||||||||||||||||||
Net interest income | 11,250 | 4,246 | 3,828 | 1,367 | 12,439 | 6,311 | – | 39,441 | ||||||||||||||||||||||||||||||||||||||
Net fee income | 6,371 | 2,962 | 1,932 | 677 | 3,664 | 1,749 | – | 17,355 | ||||||||||||||||||||||||||||||||||||||
Net trading income | 2,863 | 1,312 | 1,618 | 370 | 314 | 733 | – | 7,210 | ||||||||||||||||||||||||||||||||||||||
Other income/(expense) | 2,266 | 1,682 | 1,854 | (4 | ) | 630 | 938 | (3,125 | ) | 4,241 | ||||||||||||||||||||||||||||||||||||
Net operating income1 | 22,750 | 10,202 | 9,232 | 2,410 | 17,047 | 9,731 | (3,125 | ) | 68,247 | |||||||||||||||||||||||||||||||||||||
Loan impairment charges and other credit risk provisions | (3,020 | ) | (114 | ) | (439 | ) | (627 | ) | (8,295 | ) | (1,544 | ) | – | (14,039 | ) | |||||||||||||||||||||||||||||||
Net operating income | 19,730 | 10,088 | 8,793 | 1,783 | 8,752 | 8,187 | (3,125 | ) | 54,208 | |||||||||||||||||||||||||||||||||||||
Employee compensation and benefits | (7,875 | ) | (2,341 | ) | (2,719 | ) | (579 | ) | (3,672 | ) | (2,650 | ) | – | (19,836 | ) | |||||||||||||||||||||||||||||||
General and administrative expenses | (6,499 | ) | (1,686 | ) | (2,181 | ) | (450 | ) | (4,179 | ) | (3,286 | ) | 3,125 | (15,156 | ) | |||||||||||||||||||||||||||||||
Depreciation and impairment of property, plant and equipment | (719 | ) | (237 | ) | (189 | ) | (42 | ) | (288 | ) | (238 | ) | – | (1,713 | ) | |||||||||||||||||||||||||||||||
Amortisation and impairment of intangible assets | (352 | ) | (167 | ) | (54 | ) | (7 | ) | (183 | ) | (220 | ) | – | (983 | ) | |||||||||||||||||||||||||||||||
Total operating expenses | (15,445 | ) | (4,431 | ) | (5,143 | ) | (1,078 | ) | (8,322 | ) | (6,394 | ) | 3,125 | (37,688 | ) | |||||||||||||||||||||||||||||||
Operating profit | 4,285 | 5,657 | 3,650 | 705 | 430 | 1,793 | – | 16,520 | ||||||||||||||||||||||||||||||||||||||
Share of profit in associates and joint ventures | 17 | 35 | 2,252 | 187 | 24 | 2 | – | 2,517 | ||||||||||||||||||||||||||||||||||||||
Profit before tax | 4,302 | 5,692 | 5,902 | 892 | 454 | 1,795 | – | 19,037 | ||||||||||||||||||||||||||||||||||||||
Tax income/(expense) | (1,006 | ) | (987 | ) | (962 | ) | (138 | ) | (1,180 | ) | (573 | ) | – | (4,846 | ) | |||||||||||||||||||||||||||||||
Profit/(loss) for the year | 3,296 | 4,705 | 4,940 | 754 | (726 | ) | 1,222 | – | 14,191 | |||||||||||||||||||||||||||||||||||||
| 1 | Net operating income before loan impairment charges and other credit risk provisions. |
429
Table of Contents
HSBC HOLDINGS PLC
Notes on the Financial Statements(continued)
Other information about the profit/(loss) for the year
| Europe | Hong Kong | Rest of Asia- Pacific | MENA | North America | Latin America | Intra- HSBC items | Total | |||||||||||||||||||||||||||||||||||||||
| US$m | US$m | US$m | US$m | US$m | US$m | US$m | US$m | |||||||||||||||||||||||||||||||||||||||
2012 | ||||||||||||||||||||||||||||||||||||||||||||||
Net operating income | 15,687 | 12,348 | 13,148 | 2,144 | 11,236 | 8,814 | (3,358 | ) | 60,019 | |||||||||||||||||||||||||||||||||||||
External | 14,484 | 11,233 | 12,150 | 2,169 | 11,109 | 8,874 | – | 60,019 | ||||||||||||||||||||||||||||||||||||||
Inter-segment | 1,203 | 1,115 | 998 | (25 | ) | 127 | (60 | ) | (3,358 | ) | – | |||||||||||||||||||||||||||||||||||
Profit for the year includes the following significant non-cash items: | ||||||||||||||||||||||||||||||||||||||||||||||
Depreciation, amortisation and impairment | 966 | 416 | 233 | 55 | 363 | 499 | – | 2,532 | ||||||||||||||||||||||||||||||||||||||
Loan impairment losses gross of recoveries and other credit risk provisions | 2,329 | 105 | 586 | 361 | 3,587 | 2,489 | – | 9,457 | ||||||||||||||||||||||||||||||||||||||
Impairment of financial investments | 420 | (21 | ) | 83 | 1 | 32 | 4 | – | 519 | |||||||||||||||||||||||||||||||||||||
Changes in fair value of long-term debt and related derivatives | (3,091 | ) | – | (4 | ) | (13 | ) | (1,219 | ) | – | – | (4,327 | ) | |||||||||||||||||||||||||||||||||
Restructuring costs | 292 | 21 | 107 | 27 | 219 | 94 | – | 760 | ||||||||||||||||||||||||||||||||||||||
2011 | ||||||||||||||||||||||||||||||||||||||||||||||
Net operating income | 21,734 | 10,526 | 10,446 | 2,314 | 8,984 | 9,570 | (3,421 | ) | 60,153 | |||||||||||||||||||||||||||||||||||||
External | 20,676 | 9,442 | 9,396 | 2,316 | 8,744 | 9,579 | – | 60,153 | ||||||||||||||||||||||||||||||||||||||
Inter-segment | 1,058 | 1,084 | 1,050 | (2 | ) | 240 | (9 | ) | (3,421 | ) | – | |||||||||||||||||||||||||||||||||||
Profit for the year includes the following significant non-cash items: | ||||||||||||||||||||||||||||||||||||||||||||||
Depreciation, amortisation and impairment | 975 | 424 | 249 | 42 | 802 | 643 | – | 3,135 | ||||||||||||||||||||||||||||||||||||||
Loan impairment losses gross of recoveries and other credit risk provisions | 3,085 | 202 | 453 | 395 | 7,147 | 2,271 | – | 13,553 | ||||||||||||||||||||||||||||||||||||||
Impairment of financial investments | 705 | 55 | 25 | 13 | 9 | 1 | – | 808 | ||||||||||||||||||||||||||||||||||||||
Changes in fair value of long-term debt and related derivatives | 3,180 | – | 4 | 10 | 967 | – | – | 4,161 | ||||||||||||||||||||||||||||||||||||||
Restructuring costs | 357 | 47 | 34 | 27 | 73 | 259 | – | 797 | ||||||||||||||||||||||||||||||||||||||
2010 | ||||||||||||||||||||||||||||||||||||||||||||||
Net operating income | 19,730 | 10,088 | 8,793 | 1,783 | 8,752 | 8,187 | (3,125 | ) | 54,208 | |||||||||||||||||||||||||||||||||||||
External | 18,881 | 9,170 | 7,728 | 1,774 | 8,504 | 8,151 | – | 54,208 | ||||||||||||||||||||||||||||||||||||||
Inter-segment | 849 | 918 | 1,065 | 9 | 248 | 36 | (3,125 | ) | – | |||||||||||||||||||||||||||||||||||||
Profit for the year includes the following significant non-cash items: | ||||||||||||||||||||||||||||||||||||||||||||||
Depreciation, amortisation and impairment | 1,071 | 404 | 243 | 49 | 576 | 458 | – | 2,801 | ||||||||||||||||||||||||||||||||||||||
Loan impairment losses gross of recoveries and other credit risk provisions | 3,303 | 169 | 615 | 684 | 8,476 | 1,812 | – | 15,059 | ||||||||||||||||||||||||||||||||||||||
Impairment of financial investments | 33 | 41 | 4 | 5 | 21 | 1 | – | 105 | ||||||||||||||||||||||||||||||||||||||
Changes in fair value of long-term debt and related derivatives | (365 | ) | (2 | ) | (2 | ) | – | 111 | – | – | (258 | ) | ||||||||||||||||||||||||||||||||||
Restructuring costs | 86 | 15 | 36 | 5 | 13 | 3 | – | 158 | ||||||||||||||||||||||||||||||||||||||
430
Table of Contents
HSBC HOLDINGS PLC
Notes on the Financial Statements(continued)
Balance sheet information
| Europe | Hong Kong | Rest of Asia- Pacific | MENA | North America | Latin America | Intra- HSBC items | Total | |||||||||||||||||||||||||
| US$m | US$m | US$m | US$m | US$m | US$m | US$m | US$m | |||||||||||||||||||||||||
At 31 December 2012 | ||||||||||||||||||||||||||||||||
Loans and advances to customers (net) | 463,440 | 173,613 | 138,119 | 28,086 | 140,756 | 53,609 | – | 997,623 | ||||||||||||||||||||||||
Interests in associates and joint ventures | 178 | 224 | 15,085 | 2,262 | 85 | – | – | 17,834 | ||||||||||||||||||||||||
Total assets | 1,389,240 | 518,334 | 342,269 | 62,605 | 490,247 | 131,277 | (241,434 | ) | 2,692,538 | |||||||||||||||||||||||
Customer accounts | 555,009 | 346,208 | 183,621 | 39,583 | 149,037 | 66,556 | – | 1,340,014 | ||||||||||||||||||||||||
Total liabilities | 1,327,487 | 496,640 | 308,815 | 53,498 | 450,480 | 113,923 | (241,434 | ) | 2,509,409 | |||||||||||||||||||||||
Capital expenditure incurred1 | 925 | 336 | 208 | 102 | 248 | 458 | – | 2,277 | ||||||||||||||||||||||||
At 31 December 2011 | ||||||||||||||||||||||||||||||||
Loans and advances to customers (net) | 434,336 | 157,665 | 123,868 | 25,875 | 142,747 | 55,938 | – | 940,429 | ||||||||||||||||||||||||
Interests in associates and joint ventures | 150 | 196 | 17,916 | 2,036 | 101 | – | – | 20,399 | ||||||||||||||||||||||||
Total assets | 1,281,945 | 473,024 | 317,816 | 57,464 | 504,302 | 144,889 | (223,861 | ) | 2,555,579 | |||||||||||||||||||||||
Customer accounts | 493,404 | 315,345 | 174,012 | 36,422 | 155,982 | 78,760 | – | 1,253,925 | ||||||||||||||||||||||||
Total liabilities | 1,224,386 | 458,179 | 288,485 | 49,005 | 464,990 | 128,302 | (223,861 | ) | 2,389,486 | |||||||||||||||||||||||
Capital expenditure incurred1 | 1,177 | 432 | 207 | 29 | 342 | 951 | – | 3,138 | ||||||||||||||||||||||||
At 31 December 2010 | ||||||||||||||||||||||||||||||||
Loans and advances to customers (net) | 435,799 | 140,691 | 108,731 | 24,626 | 190,532 | 57,987 | – | 958,366 | ||||||||||||||||||||||||
Interests in associates and joint ventures | 186 | 207 | 15,035 | 1,661 | 104 | 5 | – | 17,198 | ||||||||||||||||||||||||
Total assets | 1,249,527 | 429,565 | 278,062 | 52,757 | 492,487 | 139,938 | (187,647 | ) | 2,454,689 | |||||||||||||||||||||||
Customer accounts | 491,563 | 297,484 | 158,155 | 33,511 | 158,486 | 88,526 | – | 1,227,725 | ||||||||||||||||||||||||
Total liabilities | 1,189,996 | 422,101 | 246,989 | 45,379 | 459,301 | 123,655 | (187,647 | ) | 2,299,774 | |||||||||||||||||||||||
Capital expenditure incurred1 | 865 | 836 | 168 | 46 | 774 | 788 | – | 3,477 | ||||||||||||||||||||||||
| 1 | Expenditure incurred on property, plant and equipment and other intangible assets. Excludes assets acquired as part of business combinations and goodwill. |
431
Table of Contents
HSBC HOLDINGS PLC
Notes on the Financial Statements(continued)
Other financial information
Net operating income by global business
| RBWM1 | CMB | GB&M1 | GPB | Other2 | Intra- HSBC items | Total | ||||||||||||||||||||||||||||||||||
| US$m | US$m | US$m | US$m | US$m | US$m | US$m | ||||||||||||||||||||||||||||||||||
2012 | ||||||||||||||||||||||||||||||||||||||||
Net operating income3 | 33,861 | 16,551 | 18,273 | 3,172 | 2,332 | (5,859 | ) | 68,330 | ||||||||||||||||||||||||||||||||
External | 31,980 | 17,295 | 20,410 | 2,413 | (3,768 | ) | – | 68,330 | ||||||||||||||||||||||||||||||||
Internal | 1,881 | (744 | ) | (2,137 | ) | 759 | 6,100 | (5,859 | ) | – | ||||||||||||||||||||||||||||||
2011 | ||||||||||||||||||||||||||||||||||||||||
Net operating income3 | 33,533 | 15,611 | 17,057 | 3,292 | 9,145 | (6,358 | ) | 72,280 | ||||||||||||||||||||||||||||||||
External | 32,024 | 15,362 | 19,881 | 2,207 | 2,806 | – | 72,280 | |||||||||||||||||||||||||||||||||
Internal | 1,509 | 249 | (2,824 | ) | 1,085 | 6,339 | (6,358 | ) | – | |||||||||||||||||||||||||||||||
2010 | ||||||||||||||||||||||||||||||||||||||||
Net operating income3 | 33,611 | 13,834 | 18,912 | 3,093 | 4,660 | (5,863 | ) | 68,247 | ||||||||||||||||||||||||||||||||
External | 32,056 | 13,224 | 21,812 | 2,182 | (1,027 | ) | – | 68,247 | ||||||||||||||||||||||||||||||||
Internal | 1,555 | 610 | (2,900 | ) | 911 | 5,687 | (5,863 | ) | – | |||||||||||||||||||||||||||||||
| 1 | With effect from 1 March 2011, our Global Asset Management business was moved from Global Banking and Markets to Retail Banking and Wealth Management. |
| 2 | The main items reported in the ‘Other’ category are certain property activities, unallocated investment activities, centrally held investment companies, movements in fair value of own debt and HSBC’s holding company and financing operations. The ‘Other’ category also includes gains and losses on the disposal of certain significant subsidiaries or business units. |
| 3 | Net operating income before loan impairment charges and other credit risk provisions, also referred to as revenue. The table previously reported net operating income after loan impairment charges and other credit risk provisions. |
Information by country
| 2012 | 2011 | 2010 | ||||||||||||||||||||||||||||||||
External net operating income1,2 US$m | Non- current assets3 US$m | External net operating income1,2 US$m | Non- current assets3 US$m | External net operating income1,2 US$m | Non- current assets3 US$m | |||||||||||||||||||||||||||||
UK | 9,149 | 18,391 | 16,058 | 21,414 | 14,171 | 19,661 | ||||||||||||||||||||||||||||
Hong Kong | 11,307 | 11,657 | 9,600 | 6,257 | 9,282 | 4,630 | ||||||||||||||||||||||||||||
USA | 11,779 | 6,718 | 12,972 | 3,830 | 14,032 | 6,669 | ||||||||||||||||||||||||||||
France | 2,881 | 11,074 | 2,747 | 10,790 | 3,345 | 10,914 | ||||||||||||||||||||||||||||
Brazil | 6,395 | 2,017 | 6,637 | 2,149 | 5,408 | 2,025 | ||||||||||||||||||||||||||||
Other countries | 26,819 | 30,078 | 24,266 | 31,590 | 22,009 | 29,747 | ||||||||||||||||||||||||||||
| 68,330 | 79,935 | 72,280 | 76,030 | 68,247 | 73,646 | |||||||||||||||||||||||||||||
| 1 | External net operating income is attributed to countries on the basis of the location of the branch responsible for reporting the results or advancing the funds. |
| 2 | Net operating income before loan impairment charges and other credit risk provisions, also referred to as revenue. The table previously reported net operating income after loan impairment charges and other credit risk provisions. |
| 3 | Non-current assets consist of property, plant and equipment, goodwill, other intangible assets, interests in associates and joint ventures and certain other assets expected to be recovered more than twelve months after the reporting period. |
| 13 | Analysis of financial assets and liabilities by measurement basis |
Financial assets and financial liabilities are measured on an ongoing basis either at fair value or at amortised cost. The summary of significant accounting policies in Note 2 describes how the classes of financial instruments are measured, and how income and expenses, including fair value gains and losses, are recognised. The following table analyses the carrying amounts of the financial assets and liabilities by category as defined in IAS 39 and by balance sheet heading.
432
Table of Contents
HSBC HOLDINGS PLC
Notes on the Financial Statements(continued)
Analysis of financial assets and liabilities be measurement basis
|
| |||||||||||||||||||||||||||||||||||||||||||||
HSBC
| ||||||||||||||||||||||||||||||||||||||||||||||
| At 31 December 2012 | ||||||||||||||||||||||||||||||||||||||||||||||
| Held for trading US$m | Designated at fair value US$m | Held-to- maturity securities US$m | Available- for-sale securities US$m | Financial US$m | Derivatives designated as fair value hedging instruments US$m | Derivatives designated as cash flow hedging instruments US$m | Total US$m | |||||||||||||||||||||||||||||||||||||||
Financial assets | ||||||||||||||||||||||||||||||||||||||||||||||
Cash and balances at central banks | – | – | – | – | 141,532 | – | – | 141,532 | ||||||||||||||||||||||||||||||||||||||
Items in the course of collection from other banks | – | – | – | – | 7,303 | – | – | 7,303 | ||||||||||||||||||||||||||||||||||||||
Hong Kong Government certificates of indebtedness | – | – | – | – | 22,743 | – | – | 22,743 | ||||||||||||||||||||||||||||||||||||||
Trading assets | 408,811 | – | – | – | – | – | – | 408,811 | ||||||||||||||||||||||||||||||||||||||
Financial assets designated at fair value | – | 33,582 | – | – | – | – | – | 33,582 | ||||||||||||||||||||||||||||||||||||||
Derivatives | 353,803 | – | – | – | – | 199 | 3,448 | 357,450 | ||||||||||||||||||||||||||||||||||||||
Loans and advances to banks | – | – | – | – | 152,546 | – | – | 152,546 | ||||||||||||||||||||||||||||||||||||||
Loans and advances to customers | – | – | – | – | 997,623 | – | – | 997,623 | ||||||||||||||||||||||||||||||||||||||
Financial investments | – | – | 23,413 | 397,688 | – | – | – | 421,101 | ||||||||||||||||||||||||||||||||||||||
Assets held for sale | 9 | 72 | – | 10,700 | 7,341 | – | – | 18,122 | ||||||||||||||||||||||||||||||||||||||
Other assets | – | – | – | – | 23,584 | – | – | 23,584 | ||||||||||||||||||||||||||||||||||||||
Accrued income | – | – | – | – | 8,540 | – | – | 8,540 | ||||||||||||||||||||||||||||||||||||||
Total financial assets | 762,623 | 33,654 | 23,413 | 408,388 | 1,361,212 | 199 | 3,448 | 2,592,937 | ||||||||||||||||||||||||||||||||||||||
Financial liabilities | ||||||||||||||||||||||||||||||||||||||||||||||
Hong Kong currency notes in circulation | – | – | – | – | 22,742 | – | – | 22,742 | ||||||||||||||||||||||||||||||||||||||
Deposits by banks | – | – | – | – | 107,429 | – | – | 107,429 | ||||||||||||||||||||||||||||||||||||||
Customer accounts | – | – | – | – | 1,340,014 | – | – | 1,340,014 | ||||||||||||||||||||||||||||||||||||||
Items in the course of transmission to other banks | – | – | – | – | 7,138 | – | – | 7,138 | ||||||||||||||||||||||||||||||||||||||
Trading liabilities | 304,563 | – | – | – | – | – | – | 304,563 | ||||||||||||||||||||||||||||||||||||||
Financial liabilities designated at fair value | – | 87,720 | – | – | – | – | – | 87,720 | ||||||||||||||||||||||||||||||||||||||
Derivatives | 352,195 | – | – | – | – | 4,450 | 2,241 | 358,886 | ||||||||||||||||||||||||||||||||||||||
Debt securities in issue | – | – | – | – | 119,461 | – | – | 119,461 | ||||||||||||||||||||||||||||||||||||||
Liabilities of disposal groups held for sale | 8 | 23 | – | – | 3,772 | – | – | 3,803 | ||||||||||||||||||||||||||||||||||||||
Other liabilities | – | – | – | – | 32,417 | – | – | 32,417 | ||||||||||||||||||||||||||||||||||||||
Accruals | – | – | – | – | 11,663 | – | – | 11,663 | ||||||||||||||||||||||||||||||||||||||
Subordinated liabilities | – | – | – | – | 29,479 | – | – | 29,479 | ||||||||||||||||||||||||||||||||||||||
Total financial liabilities | 656,766 | 87,743 | – | – | 1,674,115 | 4,450 | 2,241 | 2,425,315 | ||||||||||||||||||||||||||||||||||||||
433
Table of Contents
HSBC HOLDINGS PLC
Notes on the Financial Statements(continued)
Analysis of financial assets and liabilities be measurement basis (continued)
HSBC | ||||||||||||||||||||||||||||||||||||||||||||||
| At 31 December 2011 | ||||||||||||||||||||||||||||||||||||||||||||||
| Held for trading US$m | Designated at fair value US$m | Held-to- maturity securities US$m | Available- for-sale securities US$m | Financial US$m | Derivatives designated as fair value hedging instruments US$m | Derivatives designated as cash flow hedging instruments US$m | Total US$m | |||||||||||||||||||||||||||||||||||||||
Financial assets | ||||||||||||||||||||||||||||||||||||||||||||||
Cash and balances at central banks | – | – | – | – | 129,902 | – | – | 129,902 | ||||||||||||||||||||||||||||||||||||||
Items in the course of collection from other banks | – | – | – | – | 8,208 | – | – | 8,208 | ||||||||||||||||||||||||||||||||||||||
Hong Kong Government certificates of indebtedness | – | – | – | – | 20,922 | – | – | 20,922 | ||||||||||||||||||||||||||||||||||||||
Trading assets | 330,451 | – | – | – | – | – | – | 330,451 | ||||||||||||||||||||||||||||||||||||||
Financial assets designated at fair value | – | 30,856 | – | – | – | – | – | 30,856 | ||||||||||||||||||||||||||||||||||||||
Derivatives | 342,914 | – | – | – | – | 446 | 3,019 | 346,379 | ||||||||||||||||||||||||||||||||||||||
Loans and advances to banks | – | – | – | – | 180,987 | – | – | 180,987 | ||||||||||||||||||||||||||||||||||||||
Loans and advances to customers | – | – | – | – | 940,429 | – | – | 940,429 | ||||||||||||||||||||||||||||||||||||||
Financial investments | – | – | 21,199 | 378,845 | – | – | – | 400,044 | ||||||||||||||||||||||||||||||||||||||
Assets held for sale | 308 | – | – | 482 | 37,018 | – | – | 37,808 | ||||||||||||||||||||||||||||||||||||||
Other assets | – | – | – | – | 24,040 | – | – | 24,040 | ||||||||||||||||||||||||||||||||||||||
Accrued income | – | – | – | – | 8,951 | – | – | 8,951 | ||||||||||||||||||||||||||||||||||||||
Total financial assets | 673,673 | 30,856 | 21,199 | 379,327 | 1,350,457 | 446 | 3,019 | 2,458,977 | ||||||||||||||||||||||||||||||||||||||
Financial liabilities | ||||||||||||||||||||||||||||||||||||||||||||||
Hong Kong currency notes in circulation | – | – | – | – | 20,922 | – | – | 20,922 | ||||||||||||||||||||||||||||||||||||||
Deposits by banks | – | – | – | – | 112,822 | – | – | 112,822 | ||||||||||||||||||||||||||||||||||||||
Customer accounts | – | – | – | – | 1,253,925 | – | – | 1,253,925 | ||||||||||||||||||||||||||||||||||||||
Items in the course of transmission to other banks | – | – | – | – | 8,745 | – | – | 8,745 | ||||||||||||||||||||||||||||||||||||||
Trading liabilities | 265,192 | – | – | – | – | – | – | 265,192 | ||||||||||||||||||||||||||||||||||||||
Financial liabilities designated at fair value | – | 85,724 | – | – | – | – | – | 85,724 | ||||||||||||||||||||||||||||||||||||||
Derivatives | 338,788 | – | – | – | – | 4,332 | 2,260 | 345,380 | ||||||||||||||||||||||||||||||||||||||
Debt securities in issue | – | – | – | – | 131,013 | – | – | 131,013 | ||||||||||||||||||||||||||||||||||||||
Liabilities of disposal groups held for sale | 803 | 16 | – | – | 21,181 | – | – | 22,000 | ||||||||||||||||||||||||||||||||||||||
Other liabilities | – | – | – | – | 25,911 | – | – | 25,911 | ||||||||||||||||||||||||||||||||||||||
Accruals | – | – | – | – | 11,799 | – | – | 11,799 | ||||||||||||||||||||||||||||||||||||||
Subordinated liabilities | – | – | – | – | 30,606 | – | – | 30,606 | ||||||||||||||||||||||||||||||||||||||
Total financial liabilities | 604,783 | 85,740 | – | – | 1,616,924 | 4,332 | 2,260 | 2,314,039 | ||||||||||||||||||||||||||||||||||||||
434
Table of Contents
HSBC HOLDINGS PLC
Notes on the Financial Statements(continued)
HSBC Holdings
Held for trading | Designated at fair value | Loans and receivables | Available- for-sale securities | Other financial assets and liabilities at amortised cost | Total | |||||||||||||||||||||||||||||
| US$m | US$m | US$m | US$m | US$m | US$m | |||||||||||||||||||||||||||||
At 31 December 2012 | ||||||||||||||||||||||||||||||||||
Financial assets | ||||||||||||||||||||||||||||||||||
Cash at bank and in hand | – | – | – | – | 353 | 353 | ||||||||||||||||||||||||||||
Derivatives | 3,768 | – | – | – | – | 3,768 | ||||||||||||||||||||||||||||
Loans and advances to HSBC undertakings | – | – | 41,675 | – | – | 41,675 | ||||||||||||||||||||||||||||
Financial investments | – | – | – | 1,208 | – | 1,208 | ||||||||||||||||||||||||||||
Other assets | – | – | – | – | 4 | 4 | ||||||||||||||||||||||||||||
Total financial assets | 3,768 | – | 41,675 | 1,208 | 357 | 47,008 | ||||||||||||||||||||||||||||
Financial liabilities | ||||||||||||||||||||||||||||||||||
Amounts owed to HSBC undertakings | – | – | – | – | 12,856 | 12,856 | ||||||||||||||||||||||||||||
Financial liabilities designated at fair value | – | 23,195 | – | – | – | 23,195 | ||||||||||||||||||||||||||||
Derivatives | 760 | – | – | – | – | 760 | ||||||||||||||||||||||||||||
Debt securities in issue | – | – | – | – | 2,691 | 2,691 | ||||||||||||||||||||||||||||
Accruals | – | – | – | – | 605 | 605 | ||||||||||||||||||||||||||||
Subordinated liabilities | – | – | – | – | 11,907 | 11,907 | ||||||||||||||||||||||||||||
Total financial liabilities | 760 | 23,195 | – | – | 28,059 | 52,014 | ||||||||||||||||||||||||||||
At 31 December 2011 | ||||||||||||||||||||||||||||||||||
Financial assets | ||||||||||||||||||||||||||||||||||
Cash at bank and in hand | – | – | – | – | 316 | 316 | ||||||||||||||||||||||||||||
Derivatives | 3,568 | – | – | – | – | 3,568 | ||||||||||||||||||||||||||||
Loans and advances to HSBC undertakings | – | – | 28,048 | – | – | 28,048 | ||||||||||||||||||||||||||||
Financial investments | – | – | – | 1,078 | – | 1,078 | ||||||||||||||||||||||||||||
Other assets | – | – | – | – | 1 | 1 | ||||||||||||||||||||||||||||
Total financial assets | 3,568 | – | 28,048 | 1,078 | 317 | 33,011 | ||||||||||||||||||||||||||||
Financial liabilities | ||||||||||||||||||||||||||||||||||
Amounts owed to HSBC undertakings | – | – | – | – | 2,479 | 2,479 | ||||||||||||||||||||||||||||
Financial liabilities designated at fair value | – | 21,151 | – | – | – | 21,151 | ||||||||||||||||||||||||||||
Derivatives | 1,067 | – | – | – | – | 1,067 | ||||||||||||||||||||||||||||
Debt securities in issue | – | – | – | – | 2,613 | 2,613 | ||||||||||||||||||||||||||||
Other liabilities | – | – | – | – | 885 | 885 | ||||||||||||||||||||||||||||
Accruals | – | – | – | – | 575 | 575 | ||||||||||||||||||||||||||||
Subordinated liabilities | – | – | – | – | 12,450 | 12,450 | ||||||||||||||||||||||||||||
Total financial liabilities | 1,067 | 21,151 | – | – | 19,002 | 41,220 | ||||||||||||||||||||||||||||
435
Table of Contents
HSBC HOLDINGS PLC
Notes on the Financial Statements(continued)
| 14 | Trading assets |
2012 US$m | 2011 US$m | |||||||||
Trading assets: | ||||||||||
– not subject to repledge or resale by counterparties | 305,312 | 235,916 | ||||||||
– which may be repledged or resold by counterparties | 103,499 | 94,535 | ||||||||
| 408,811 | 330,451 | |||||||||
Treasury and other eligible bills | 26,282 | 34,309 | ||||||||
Debt securities | 144,677 | 130,487 | ||||||||
Equity securities | 41,634 | 21,002 | ||||||||
Trading assets at fair value | 212,593 | 185,798 | ||||||||
Loans and advances to banks | 78,271 | 75,525 | ||||||||
Loans and advances to customers | 117,947 | 69,128 | ||||||||
| 408,811 | 330,451 | |||||||||
Trading assets valued at fair value1
| ||||||||||
| Fair value | ||||||||||
2012 US$m | 2011 US$m | |||||||||
US Treasury and US Government agencies2 | 28,405 | 15,686 | ||||||||
UK Government | 11,688 | 12,917 | ||||||||
Hong Kong Government | 6,228 | 8,844 | ||||||||
Other government | 91,498 | 90,816 | ||||||||
Asset-backed securities3 | 2,896 | 2,913 | ||||||||
Corporate debt and other securities | 30,244 | 33,620 | ||||||||
Equity securities | 41,634 | 21,002 | ||||||||
| 212,593 | 185,798 | |||||||||
| 1 | Included within these figures are debt securities issued by banks and other financial institutions of US$20,274m (2011: US$24,956m), of which US$3,469m (2011: US$5,269m) are guaranteed by various governments. |
| 2 | Includes securities that are supported by an explicit guarantee issued by the US Government. |
| 3 | Excludes asset-backed securities included under US Treasury and US Government agencies. |
Trading assets listed on a recognised exchange and unlisted
Treasury and other eligible bills | Debt securities | Equity securities | Total | |||||||||||||||||||
| US$m | US$m | US$m | US$m | |||||||||||||||||||
Fair value at 31 December 2012 | ||||||||||||||||||||||
Listed on a recognised exchange1 | 606 | 82,732 | 39,945 | 123,283 | ||||||||||||||||||
Unlisted2 | 25,676 | 61,945 | 1,689 | 89,310 | ||||||||||||||||||
| 26,282 | 144,677 | 41,634 | 212,593 | |||||||||||||||||||
Fair value at 31 December 2011 | ||||||||||||||||||||||
Listed on a recognised exchange1 | 789 | 78,760 | 19,994 | 99,543 | ||||||||||||||||||
Unlisted2 | 33,520 | 51,727 | 1,008 | 86,255 | ||||||||||||||||||
| 34,309 | 130,487 | 21,002 | 185,798 | |||||||||||||||||||
| 1 | Included within listed investments are US$2,828m (2011: US$2,836m) of investments listed in Hong Kong. |
| 2 | Unlisted treasury and other eligible bills primarily comprise treasury bills not listed on a recognised exchange but for which there is a liquid market. |
Loans and advances to banks held for trading
2012 US$m | 2011 US$m | |||||||||
Reverse repos | 45,015 | 45,490 | ||||||||
Settlement accounts | 6,324 | 7,555 | ||||||||
Stock borrowing | 5,361 | 5,531 | ||||||||
Other | 21,571 | 16,949 | ||||||||
| 78,271 | 75,525 | |||||||||
436
Table of Contents
HSBC HOLDINGS PLC
Notes on the Financial Statements(continued)
Loans and advances to customers held for trading
| 2012 US$m | 2011 US$m | |||||||||
Reverse repos | 73,666 | 34,358 | ||||||||
Settlement accounts | 8,186 | 5,804 | ||||||||
Stock borrowing | 10,710 | 3,928 | ||||||||
Other | 25,385 | 25,038 | ||||||||
| 117,947 | 69,128 | |||||||||
| 15 | Fair values of financial instruments carried at fair value |
The classification of financial instruments is determined in accordance with the accounting policies set out in Note 2. The use of assumptions and estimation in valuing financial instruments is described on page 56.
Fair value is the amount for which an asset could be exchanged, or a liability settled, between knowledgeable, willing parties in an arm’s length transaction.
Financial instruments carried at fair value and bases of valuation1
| Valuation techniques | ||||||||||||||||||||||
Quoted market price Level 1 | Using observable inputs Level 2 | With significant unobservable inputs Level 3 | Total | |||||||||||||||||||
| US$m | US$m | US$m | US$m | |||||||||||||||||||
At 31 December 2012 | ||||||||||||||||||||||
Assets | ||||||||||||||||||||||
Trading assets | 198,843 | 205,590 | 4,378 | 408,811 | ||||||||||||||||||
Financial assets designated at fair value | 25,575 | 7,594 | 413 | 33,582 | ||||||||||||||||||
Derivatives | 1,431 | 352,960 | 3,059 | 357,450 | ||||||||||||||||||
Financial investments: available for sale | 253,246 | 135,931 | 8,511 | 397,688 | ||||||||||||||||||
Liabilities | ||||||||||||||||||||||
Trading liabilities | 116,550 | 180,543 | 7,470 | 304,563 | ||||||||||||||||||
Financial liabilities designated at fair value | 10,703 | 77,017 | – | 87,720 | ||||||||||||||||||
Derivatives | 1,506 | 354,375 | 3,005 | 358,886 | ||||||||||||||||||
At 31 December 2011 | ||||||||||||||||||||||
Assets | ||||||||||||||||||||||
Trading assets | 180,043 | 145,628 | 4,780 | 330,451 | ||||||||||||||||||
Financial assets designated at fair value | 22,496 | 7,644 | 716 | 30,856 | ||||||||||||||||||
Derivatives | 1,262 | 340,668 | 4,449 | 346,379 | ||||||||||||||||||
Financial investments: available for sale | 217,788 | 151,936 | 9,121 | 378,845 | ||||||||||||||||||
Liabilities | ||||||||||||||||||||||
Trading liabilities | 98,208 | 159,157 | 7,827 | 265,192 | ||||||||||||||||||
Financial liabilities designated at fair value | 27,461 | 57,696 | 567 | 85,724 | ||||||||||||||||||
Derivatives | 1,991 | 340,260 | 3,129 | 345,380 | ||||||||||||||||||
| 1 | The above table does not include financial instruments within the Assets held for sale and Liabilities of disposal groups held for sale categorisations. |
The increase in Level 1 trading assets and liabilities reflects an increase in equity securities and settlement account balances, the latter varying considerably in proportion with the level of trading activity. The increase in Level 2 assets reflects higher reverse repo balances used to cover short positions and an increase in repo balances contributed to the growth in Level 2 liabilities.
As described on page 446, HSBC Holdings transferred financial liabilities designated at fair value from Level 1 to Level 2. There were no other material transfers between Level 1 and Level 2 in the year. An analysis of the movements of Level 3 financial instruments is provided on page 447.
437
Table of Contents
HSBC HOLDINGS PLC
Notes on the Financial Statements(continued)
Control framework
Fair values are subject to a control framework designed to ensure that they are either determined or validated by a function independent of the risk-taker.
For all financial instruments where fair values are determined by reference to externally quoted prices or observable pricing inputs to models, independent price determination or validation is utilised. In inactive markets, direct observation of a traded price may not be possible. In these circumstances, HSBC will source alternative market information to validate the financial instrument’s fair value, with greater weight given to information that is considered to be more relevant and reliable. The factors that are considered in this regard are,inter alia:
| • | the extent to which prices may be expected to represent genuine traded or tradeable prices; |
| • | the degree of similarity between financial instruments; |
| • | the degree of consistency between different sources; |
| • | the process followed by the pricing provider to derive the data; |
| • | the elapsed time between the date to which the market data relates and the balance sheet date; and |
| • | the manner in which the data was sourced. |
For fair values determined using a valuation model, the control framework may include, as applicable, development or validation by independent support functions of (i) the logic within valuation models; (ii) the inputs to those models; (iii) any adjustments required outside the valuation models; and (iv) where possible, model outputs. Valuation models are subject to a process of due diligence and calibration before becoming operational and are calibrated against external market data on an ongoing basis.
The fair value governance structure is as follows:
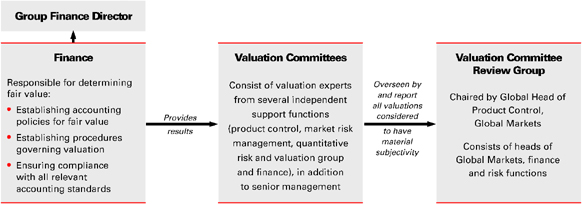
Determination of fair value
Fair values are determined according to the following hierarchy:
| • | Level 1 – quoted market price: financial instruments with quoted prices for identical instruments in active markets. |
| • | Level 2 – valuation technique using observable inputs: financial instruments with quoted prices for similar instruments in active markets or quoted prices for identical or similar instruments in inactive markets and financial instruments valued using models where all significant inputs are observable. |
| • | Level 3 – valuation technique with significant unobservable inputs: financial instruments valued using valuation techniques where one or more significant inputs are unobservable. |
The best evidence of fair value is a quoted price in an actively traded market. The fair values of financial instruments that are quoted in active markets are based on bid prices for assets held and offer prices for liabilities issued. Where a financial instrument has a quoted price in an active market and it is part of a portfolio, the fair value of the portfolio is calculated as the product of the number of units and quoted price. In the event that the market for a financial instrument is not active, a valuation technique is used.
The judgement as to whether a market is active may include, but is not restricted to, the consideration of factors such as the magnitude and frequency of trading activity, the availability of prices and the size of bid/offer spreads. The
438
Table of Contents
HSBC HOLDINGS PLC
Notes on the Financial Statements(continued)
bid/offer spread represents the difference in prices at which a market participant would be willing to buy compared with the price at which they would be willing to sell. In inactive markets, obtaining assurance that the transaction price provides evidence of fair value or determining the adjustments to transaction prices that are necessary to measure the fair value of the instrument requires additional work during the valuation process.
Valuation techniques incorporate assumptions about factors that other market participants would use in their valuations, including interest rate yield curves, exchange rates, volatilities, and prepayment and default rates. For swaps with collateralised counterparties and in significant major currencies, HSBC uses a discounting curve that reflects the overnight interest rate (‘OIS discounting’).
The majority of valuation techniques employ only observable market data. However, certain financial instruments are valued on the basis of valuation techniques that feature one or more significant market inputs that are unobservable, and for them the measurement of fair value is more judgemental. An instrument in its entirety is classified as valued using significant unobservable inputs if, in the opinion of management, a significant proportion of the instrument’s inception profit (‘day 1 gain or loss’) or greater than 5% of the instrument’s carrying value is driven by unobservable inputs. ‘Unobservable’ in this context means that there is little or no current market data available from which to determine the price at which an arm’s length transaction would be likely to occur. It generally does not mean that there is no data available at all upon which to base a determination of fair value (consensus pricing data may, for example, be used).
In certain circumstances, HSBC records its own debt in issue at fair value, based on quoted prices in an active market for the specific instrument concerned, where available. An example of this is where own debt in issue is hedged with interest rate derivatives. When quoted market prices are unavailable, the own debt in issue is valued using valuation techniques, the inputs for which are either based upon quoted prices in an inactive market for the instrument, or are estimated by comparison with quoted prices in an active market for similar instruments. In both cases, the fair value includes the effect of applying the credit spread which is appropriate to HSBC’s liabilities. The change in fair value of issued debt securities attributable to the Group’s own credit spread is computed as follows: for each security at each reporting date, an externally verifiable price is obtained or a price is derived using credit spreads for similar securities for the same issuer. Then, using discounted cash flow, each security is valued using a Libor-based discount curve. The difference in the valuations is attributable to the Group’s own credit spread. This methodology is applied consistently across all securities.
Structured notes issued and certain other hybrid instrument liabilities are included within trading liabilities and are measured at fair value. The credit spread applied to these instruments is derived from the spreads at which HSBC issues structured notes.
Gains and losses arising from changes in the credit spread of liabilities issued by HSBC reverse over the contractual life of the debt, provided that the debt is not repaid at a premium or a discount.
Fair value adjustments
Fair value adjustments are adopted when HSBC considers that there are additional factors that would be considered by a market participant that are not incorporated within the valuation model. The magnitude of fair value adjustments depends upon many entity-specific factors, and therefore fair value adjustments may not be comparable across the banking industry.
HSBC classifies fair value adjustments as either ‘risk-related’ or ‘model-related’. The majority of these adjustments relate to GB&M.
Movements in the level of fair value adjustments do not necessarily result in the recognition of profits or losses within the income statement. For example, as models are enhanced, fair value adjustments may no longer be required. Similarly, fair value adjustments will decrease when the related positions are unwound, but this may not result in profit or loss.
439
Table of Contents
HSBC HOLDINGS PLC
Notes on the Financial Statements(continued)
Global Banking and Markets fair value adjustments
| At 31 December | ||||||||||
| 2012 US$m | 2011 US$m | |||||||||
Type of adjustment | ||||||||||
Risk-related | 2,013 | 1,899 | ||||||||
Bid-offer | 638 | 695 | ||||||||
Uncertainty | 142 | 154 | ||||||||
Credit valuation adjustment | 1,747 | 1,050 | ||||||||
Debit valuation adjustment | (518 | ) | – | |||||||
Other | 4 | – | ||||||||
Model-related | 162 | 567 | ||||||||
Model limitation | 161 | 567 | ||||||||
Other | 1 | – | ||||||||
Inception profit (Day 1 P&L reserves) (Note 19) | 181 | 200 | ||||||||
| 2,356 | 2,666 | |||||||||
The increase in credit valuation adjustment and debit valuation adjustment reflects a refinement in methodology, described on page 441. The decrease in model limitation adjustments reflects the inclusion of OIS discounting within the modelled value of many interest rate derivatives such that an adjustment is no longer required outside the model, in addition to market movements and the unwind or maturity of certain legacy credit structures.
Risk-related adjustments
Bid-offer
IAS 39 requires that financial instruments are marked at bid or offer, as appropriate. Valuation models will typically generate mid-market values. The bid-offer adjustment reflects the cost that would be incurred if substantially all residual net portfolio market risks were closed using available hedging instruments or by disposing of or unwinding the actual position.
Uncertainty
Certain model inputs may be less readily determinable from market data, and/or the choice of model itself may be more subjective. In these circumstances, there exists a range of possible values that the financial instrument or market parameter may assume and an adjustment may be necessary to reflect the likelihood that in estimating the fair value of the financial instrument, market participants would adopt more conservative values for uncertain parameters and/or model assumptions than those used in the valuation model.
Credit valuation adjustment
The credit valuation adjustment is an adjustment to the valuation of OTC derivative contracts to reflect within fair value the possibility that the counterparty may default and that HSBC may not receive the full market value of the transactions.
Debit valuation adjustment
The debit valuation adjustment is an adjustment to the valuation of OTC derivative contracts to reflect within fair value the possibility that HSBC may default, and that HSBC may not pay full market value of the transactions.
Model-related adjustments
Model limitation
Models used for portfolio valuation purposes may be based upon a simplifying set of assumptions that do not capture all material market characteristics. Additionally, markets evolve, and models that were adequate in the past may require development to capture all material market characteristics in current market conditions. In these circumstances, model limitation adjustments are adopted. As model development progresses, model limitations are addressed within the valuation models and a model limitation adjustment is no longer needed.
440
Table of Contents
HSBC HOLDINGS PLC
Notes on the Financial Statements(continued)
Inception profit (Day 1 P&L reserves)
Inception profit adjustments are adopted where the fair value estimated by a valuation model is based on one or more significant unobservable inputs. The accounting for inception profit adjustments is discussed on page 388. An analysis of the movement in the deferred Day 1 P&L reserve is provided on page 454.
Credit valuation adjustment/debit valuation adjustment methodology
HSBC calculates a separate credit valuation adjustment (‘CVA’) and debit valuation adjustment (‘DVA’) for each HSBC legal entity, and within each entity for each counterparty to which the entity has exposure. The calculation of the monoline CVA is described on page 189.
HSBC calculates the CVA by applying the probability of default (‘PD’) of the counterparty conditional on the non-default of HSBC, to the expected positive exposure of HSBC to the counterparty, and multiplying the result by the loss expected in the event of default. Conversely, HSBC calculates the DVA by applying the PD of HSBC, conditional on the non-default of the counterparty, to the expected positive exposure of the counterparty to HSBC, and multiplying by the loss expected in the event of default. Both calculations are performed over the life of the potential exposure.
As set out on page 383, from 31 December 2012 HSBC revised its methodology for estimating the CVA and the DVA for derivatives. The CVA calculation maximises the use of PD based on relevant, observable market data, such as credit default swap (‘CDS’) spreads. Where CDS spreads are not available, PDs are estimated having regard to market practice, considering relevant data including both CDS indices and historical rating transition matrices. HSBC aligned its methodology for estimating the DVA to be consistent with that applied for the CVA as at 31 December 2012. Historically, HSBC considered that a zero spread was appropriate in respect of own credit risk and consequently did not adjust derivative liabilities for its own credit risk.
For most products, to calculate the expected positive exposure to a counterparty, HSBC uses a simulation methodology to incorporate the range of potential exposures across the portfolio of transactions with the counterparty over the life of an instrument. The simulation methodology includes credit mitigants such as counterparty netting agreements and collateral agreements with the counterparty. A standard loss given default assumption of 60% is generally adopted for developed market exposures, and 75% for emerging market exposures. Alternative loss given default assumptions may be adopted where both the nature of the exposure and the available data support this.
For certain types of exotic derivatives where the products are not currently supported by the simulation, or for derivative exposures in smaller trading locations where the simulation tool is not yet available, HSBC adopts alternative methodologies. These may involve mapping to the results for similar products from the simulation tool or where such a mapping approach is not appropriate, a simplified methodology is used, generally following the same principles as the simulation methodology. The calculation is applied at a trade level, with more limited recognition of credit mitigants such as netting or collateral agreements than used in the simulation methodology described previously.
The methodologies do not, in general, account for ‘wrong-way risk’. Wrong-way risk arises where the underlying value of the derivative prior to any CVA is positively correlated to the probability of default of the counterparty. Where there is significant wrong-way risk, a trade-specific approach is applied to reflect the wrong-way risk within the valuation.
With the exception of certain central clearing parties, HSBC includes all third-party counterparties in the CVA and DVA calculations and does not net these calculations across HSBC Group entities.
441
Table of Contents
HSBC HOLDINGS PLC
Notes on the Financial Statements(continued)
Fair value valuation bases
Financial instruments measured at fair value using a valuation technique with significant unobservable inputs – Level 3
| Assets | Liabilities | |||||||||||||||||||||||||||||||||||||||
| Available for sale US$m | Held for trading US$m | Designated through profit or loss | Derivatives US$m | Held for trading US$m | Designated at fair value through profit or loss | Derivatives US$m | ||||||||||||||||||||||||||||||||||
At 31 December 2012 | ||||||||||||||||||||||||||||||||||||||||
Private equity including strategic investments | 3,582 | 92 | 377 | – | – | – | – | |||||||||||||||||||||||||||||||||
Asset-backed securities | 2,288 | 652 | – | – | – | – | – | |||||||||||||||||||||||||||||||||
Loans held for securitisation | – | 547 | – | – | – | – | – | |||||||||||||||||||||||||||||||||
Structured notes | – | 23 | – | – | 6,987 | – | – | |||||||||||||||||||||||||||||||||
Derivatives with monolines | – | – | – | 630 | – | – | – | |||||||||||||||||||||||||||||||||
Other derivatives | – | – | – | 2,429 | – | – | 3,005 | |||||||||||||||||||||||||||||||||
Other portfolios | 2,641 | 3,064 | 36 | – | 483 | – | – | |||||||||||||||||||||||||||||||||
| 8,511 | 4,378 | 413 | 3,059 | 7,470 | – | 3,005 | ||||||||||||||||||||||||||||||||||
At 31 December 2011 | ||||||||||||||||||||||||||||||||||||||||
Private equity including strategic investments | 4,565 | 88 | 432 | – | – | – | – | |||||||||||||||||||||||||||||||||
Asset-backed securities | 2,584 | 710 | – | – | – | – | – | |||||||||||||||||||||||||||||||||
Loans held for securitisation | – | 682 | – | – | – | – | 7 | |||||||||||||||||||||||||||||||||
Structured notes | – | 92 | – | – | 7,340 | – | – | |||||||||||||||||||||||||||||||||
Derivatives with monolines | – | – | – | 940 | – | – | – | |||||||||||||||||||||||||||||||||
Other derivatives | – | – | – | 3,509 | – | – | 3,122 | |||||||||||||||||||||||||||||||||
Other portfolios | 1,972 | 3,208 | 284 | – | 487 | 567 | – | |||||||||||||||||||||||||||||||||
| 9,121 | 4,780 | 716 | 4,449 | 7,827 | 567 | 3,129 | ||||||||||||||||||||||||||||||||||
Private equity and strategic investments
HSBC’s private equity and strategic investments are generally classified as available for sale and are not traded in active markets. In the absence of an active market, an investment’s fair value is estimated on the basis of an analysis of the investee’s financial position and results, risk profile, prospects and other factors, as well as by reference to market valuations for similar entities quoted in an active market, or the price at which similar companies have changed ownership.
Asset-backed securities
While quoted market prices are generally used to determine the fair value of these securities, valuation models are used to substantiate the reliability of the limited market data available and to identify whether any adjustments to quoted market prices are required. For ABSs including residential MBSs, the valuation uses an industry standard model and the assumptions relating to prepayment speeds, default rates and loss severity based on collateral type, and performance, as appropriate. The valuations output is benchmarked for consistency against observable data for securities of a similar nature.
Loans, including leveraged finance and loans held for securitisation
Loans held at fair value are valued from broker quotes and/or market data consensus providers when available. In the absence of an observable market, the fair value is determined using valuation techniques. These techniques include discounted cash flow models, which incorporate assumptions regarding an appropriate credit spread for the loan, derived from other market instruments issued by the same or comparable entities.
Structured notes
The fair value of structured notes valued using a valuation technique is derived from the fair value of the underlying debt security, and the fair value of the embedded derivative is determined as described in the paragraph below on derivatives.
442
Table of Contents
HSBC HOLDINGS PLC
Notes on the Financial Statements(continued)
Trading liabilities valued using a valuation technique with significant unobservable inputs principally comprised equity-linked structured notes, which are issued by HSBC and provide the counterparty with a return that is linked to the performance of certain equity securities, and other portfolios. The notes are classified as Level 3 due to the unobservability of parameters such as long-dated equity volatilities and correlations between equity prices, between equity prices and interest rates and between interest rates and foreign exchange rates.
Derivatives
OTC (i.e. non-exchange traded) derivatives are valued using valuation models. Valuation models calculate the present value of expected future cash flows, based upon ‘no-arbitrage’ principles. For many vanilla derivative products, such as interest rate swaps and European options, the modelling approaches used are standard across the industry. For more complex derivative products, there may be some differences in market practice. Inputs to valuation models are determined from observable market data wherever possible, including prices available from exchanges, dealers, brokers or providers of consensus pricing. Certain inputs may not be observable in the market directly, but can be determined from observable prices via model calibration procedures or estimated from historical data or other sources. Examples of inputs that may be unobservable include volatility surfaces, in whole or in part, for less commonly traded option products, and correlations between market factors such as foreign exchange rates, interest rates and equity prices. The valuation of derivatives with monolines is discussed on page 189.
Derivative products valued using valuation techniques with significant unobservable inputs included certain types of correlation products, such as foreign exchange basket options, equity basket options, foreign exchange interest rate hybrid transactions and long-dated option transactions. Examples of the latter are equity options, interest rate and foreign exchange options and certain credit derivatives. Credit derivatives include certain tranched CDS transactions.
Reconciliation of fair value measurements in Level 3 of the fair value hierarchy
The following table provides a reconciliation of the movement between opening and closing balances of Level 3 financial instruments, measured at fair value using a valuation technique with significant unobservable inputs:
Movement in Level 3 financial instruments
| Assets | Liabilities | |||||||||||||||||||||||||||||||||||||||
| Available for sale US$m | Held for trading US$m | Designated through profit or loss | Derivatives US$m | Held for trading US$m | Designated at fair value through profit or loss | Derivatives US$m | ||||||||||||||||||||||||||||||||||
2012 | ||||||||||||||||||||||||||||||||||||||||
At 1 January | 9,121 | 4,780 | 716 | 4,449 | 7,827 | 567 | 3,129 | |||||||||||||||||||||||||||||||||
Total gains/(losses) recognised in profit or loss | (414 | ) | 356 | 10 | (974 | ) | 319 | – | 10 | |||||||||||||||||||||||||||||||
Total gains/(losses) recognised in other comprehensive income1 | 472 | 78 | (32 | ) | 92 | 143 | – | 84 | ||||||||||||||||||||||||||||||||
Purchases | 1,738 | 942 | 113 | – | (368 | ) | – | – | ||||||||||||||||||||||||||||||||
New issuances | – | – | – | – | 2,852 | – | – | |||||||||||||||||||||||||||||||||
Sales | (840 | ) | (1,408 | ) | (69 | ) | – | – | – | – | ||||||||||||||||||||||||||||||
Settlements | (367 | ) | (617 | ) | (25 | ) | (14 | ) | (1,604 | ) | – | 18 | ||||||||||||||||||||||||||||
Transfers out | (2,944 | ) | (298 | ) | (350 | ) | (571 | ) | (1,901 | ) | (567 | ) | (291 | ) | ||||||||||||||||||||||||||
Transfers in | 1,745 | 545 | 50 | 77 | 202 | – | 55 | |||||||||||||||||||||||||||||||||
At 31 December | 8,511 | 4,378 | 413 | 3,059 | 7,470 | – | 3,005 | |||||||||||||||||||||||||||||||||
Total gains/(losses) recognised in profit or loss relating to assets and liabilities held on 31 December: | 166 | 339 | 9 | (1,294 | ) | 384 | – | (395 | ) | |||||||||||||||||||||||||||||||
– net interest income | 44 | – | – | – | – | – | – | |||||||||||||||||||||||||||||||||
– trading income excluding net interest income | – | 326 | – | (1,294 | ) | 396 | – | (395 | ) | |||||||||||||||||||||||||||||||
– net interest income on trading activities | – | 13 | – | – | (12 | ) | – | – | ||||||||||||||||||||||||||||||||
– net income from other financial instruments designated at fair value | – | – | 9 | – | – | – | – | |||||||||||||||||||||||||||||||||
– dividend income | 122 | – | – | – | – | – | – | |||||||||||||||||||||||||||||||||
443
Table of Contents
HSBC HOLDINGS PLC
Notes on the Financial Statements(continued)
Movement in Level 3 financial instruments(continued)
| Assets | Liabilities | |||||||||||||||||||||||||||||||||||||||
Available for sale US$m | Held for trading US$m | Designated at fair value through profit or loss US$m | Derivatives US$m | Held for trading US$m | Designated at fair value through profit or loss US$m | Derivatives US$m | ||||||||||||||||||||||||||||||||||
2011 | ||||||||||||||||||||||||||||||||||||||||
At 1 January | 8,237 | 5,689 | 587 | 3,961 | 11,393 | 570 | 3,806 | |||||||||||||||||||||||||||||||||
Total gains/(losses) recognised in profit or loss | 222 | (330 | ) | 11 | 767 | 36 | 8 | 628 | ||||||||||||||||||||||||||||||||
Total gains/(losses) recognised in other comprehensive income1 | (179 | ) | (12 | ) | (15 | ) | (16 | ) | 11 | (11 | ) | – | ||||||||||||||||||||||||||||
Purchases | 1,858 | 1,483 | 242 | – | (1,843 | ) | – | – | ||||||||||||||||||||||||||||||||
New issuances | – | – | – | – | 4,569 | – | – | |||||||||||||||||||||||||||||||||
Sales | (756 | ) | (2,578 | ) | (69 | ) | – | – | – | – | ||||||||||||||||||||||||||||||
Settlements | (1,088 | ) | (199 | ) | (7 | ) | (33 | ) | (1,528 | ) | – | (1,083 | ) | |||||||||||||||||||||||||||
Transfers out | (1,891 | ) | (569 | ) | (173 | ) | (410 | ) | (5,266 | ) | – | (608 | ) | |||||||||||||||||||||||||||
Transfers in | 2,718 | 1,296 | 140 | 180 | 455 | – | 386 | |||||||||||||||||||||||||||||||||
At 31 December | 9,121 | 4,780 | 716 | 4,449 | 7,827 | 567 | 3,129 | |||||||||||||||||||||||||||||||||
Total gains/(losses) recognised in profit or loss relating to assets and liabilities held on 31 December: | 134 | (237 | ) | 36 | 617 | 101 | 8 | 80 | ||||||||||||||||||||||||||||||||
– net interest income | 105 | – | – | – | – | – | – | |||||||||||||||||||||||||||||||||
– trading income/(expense) excluding net interest income | – | (265 | ) | – | 617 | 119 | – | 80 | ||||||||||||||||||||||||||||||||
– net interest income/(expense) on trading activities | – | 28 | – | – | (18 | ) | – | – | ||||||||||||||||||||||||||||||||
– net income from other financial instruments designated at fair value | – | – | 36 | – | – | 8 | – | |||||||||||||||||||||||||||||||||
– dividend income | 29 | – | – | – | – | – | – | |||||||||||||||||||||||||||||||||
| 1 | Included in ‘Available-for-sale investments: Fair value gains/losses’ and ‘Exchange differences’ in the consolidated statement of comprehensive income. |
Available-for-sale securities: Purchases of Level 3 AFS assets relate principally to Emerging Market corporate bonds. Sales of Level 3 AFS assets relate principally to private equity disposals. Transfers in and out of Level 3 relate principally to ABS securities, and the excess of transfers out over transfers in reflects some improvement in ABS liquidity over the year.
Derivatives: The reduction in Level 3 derivative assets predominantly reflected reductions in the fair value of legacy structured credit assets as credit spreads narrowed and the unwind or maturity of certain other structured derivatives.
Trading liabilities:Movements in Level 3 trading liability balances primarily reflect issue and redemption of structured notes, particularly equity-linked notes. Transfers out reflect structured notes, particularly equity linked notes, becoming observable as their residual maturity decreased.
Effect of changes in significant unobservable assumptions to reasonably possible alternatives
As discussed above, the fair value of financial instruments are, in certain circumstances, measured using valuation techniques that incorporate assumptions that are not evidenced by prices from observable current market transactions in the same instrument and are not based on observable market data. The following table shows the sensitivity of these fair values to reasonably possible alternative assumptions:
Sensitivity of fair values to reasonably possible alternative assumptions
| Reflected in profit or loss | Reflected in other comprehensive income | |||||||||||||||||||||
Favourable changes | Unfavourable changes US$m | Favourable changes | Unfavourable changes | |||||||||||||||||||
At 31 December 2012 | ||||||||||||||||||||||
Derivatives, trading assets and trading liabilities1 | 465 | (384 | ) | – | – | |||||||||||||||||
Financial assets and liabilities designated at fair value | 41 | (41 | ) | – | – | |||||||||||||||||
Financial investments: available for sale | – | – | 680 | (710 | ) | |||||||||||||||||
| 506 | (425 | ) | 680 | (710 | ) | |||||||||||||||||
444
Table of Contents
HSBC HOLDINGS PLC
Notes on the Financial Statements(continued)
| Reflected in profit or loss | Reflected in other comprehensive income | |||||||||||||||||||||
Favourable changes | Unfavourable changes US$m | Favourable changes | Unfavourable changes | |||||||||||||||||||
At 31 December 2011 | ||||||||||||||||||||||
Derivatives, trading assets and trading liabilities1 | 369 | (436 | ) | – | – | |||||||||||||||||
Financial assets and liabilities designated at fair value | 72 | (72 | ) | – | – | |||||||||||||||||
Financial investments: available for sale | – | – | 814 | (818 | ) | |||||||||||||||||
| 441 | (508 | ) | 814 | (818 | ) | |||||||||||||||||
| 1 | Derivatives, trading assets and trading liabilities are presented as one category to reflect the manner in which these financial instruments are risk-managed. |
In derivatives, trading assets and trading liabilities greater pricing certainty has arisen during the year in respect of legacy structured credit assets, as narrowing credit spreads have reduced exposures. This has been offset by greater pricing uncertainty in some other areas, most notably in certain interest rate derivative products and the pricing of the derivative representing the forward sale of Ping An.
The reduction in pricing uncertainty in available-for-sale securities reflects greater liquidity in the ABS market.
Sensitivity of fair values to reasonably possible alternative assumptions by Level 3 instrument type
| Reflected in profit or loss | Reflected in other comprehensive income | |||||||||||||||||||||
Favourable changes US$m | Unfavourable changes US$m | Favourable changes US$m | Unfavourable changes US$m | |||||||||||||||||||
At 31 December 2012 | ||||||||||||||||||||||
Private equity investments | 62 | (62 | ) | 353 | (353 | ) | ||||||||||||||||
Asset-backed securities | 41 | (27 | ) | 143 | (139 | ) | ||||||||||||||||
Loans held for securitisation | 3 | (3 | ) | – | – | |||||||||||||||||
Structured notes | 4 | (5 | ) | – | – | |||||||||||||||||
Derivatives with monolines | 36 | (20 | ) | – | – | |||||||||||||||||
Other derivatives | 320 | (267 | ) | – | – | |||||||||||||||||
Other portfolios | 40 | (41 | ) | 184 | (218 | ) | ||||||||||||||||
| 506 | (425 | ) | 680 | (710 | ) | |||||||||||||||||
At 31 December 2011 | ||||||||||||||||||||||
Private equity investments | 123 | (83 | ) | 451 | (451 | ) | ||||||||||||||||
Asset-backed securities | 3 | (3 | ) | 183 | (175 | ) | ||||||||||||||||
Loans held for securitisation | 4 | (4 | ) | – | – | |||||||||||||||||
Structured notes | 6 | (6 | ) | – | – | |||||||||||||||||
Derivatives with monolines | 76 | (178 | ) | – | – | |||||||||||||||||
Other derivatives | 145 | (154 | ) | – | – | |||||||||||||||||
Other portfolios | 84 | (80 | ) | 180 | (192 | ) | ||||||||||||||||
| 441 | (508 | ) | 814 | (818 | ) | |||||||||||||||||
Favourable and unfavourable changes are determined on the basis of changes in the value of the instrument as a result of varying the levels of the unobservable parameters using statistical techniques. When parameters are not amenable to statistical analysis, quantification of uncertainty is judgemental.
When the fair value of a financial instrument is affected by more than one unobservable assumption, the above table reflects the most favourable or most unfavourable change from varying the assumptions individually.
In respect of private equity investments, in many of the methodologies, the principal assumption is the valuation multiple to be applied to the main financial indicators. This may be determined with reference to multiples for comparable listed companies and includes discounts for marketability.
For ABSs, the principal assumptions in the models are based on benchmark information about prepayment speeds, default rates, loss severities and the historical performance of the underlying assets.
For leveraged finance, loans held for securitisation and derivatives with monolines, the principal assumption concerns the appropriate value to be attributed to the counterparty credit risk. This requires estimation of exposure at default, probability of default and recovery in the event of default. For loan transactions, assessment of exposure at default is straightforward. For derivative transactions, a future exposure profile is generated on the basis of current market data.
445
Table of Contents
HSBC HOLDINGS PLC
Notes on the Financial Statements(continued)
Probabilities of default and recovery levels are estimated using available evidence, which may include financial information, historical experience, CDS spreads and consensus recovery levels.
For structured notes and other derivatives, principal assumptions concern the value to be attributed to future volatility of asset values and the future correlation between asset values. These principal assumptions include credit volatilities and correlations used in the valuation of structured credit derivatives (including leveraged credit derivatives). For such unobservable assumptions, estimates are based on available market data, which may include the use of a proxy method to derive a volatility or a correlation from comparable assets for which market data is more readily available, and/or an examination of historical levels.
HSBC Holdings
The following table provides an analysis of the basis for valuing financial assets and financial liabilities measured at fair value in the financial statements:
Bases of valuing HSBC Holdings’ financial assets and liabilities measured at fair value
| Valuation techniques | ||||||||||||||||
Quoted market price Level 1 US$m | Using observable inputs Level 2 US$m | With significant unobservable inputs Level 3 US$m | Total US$m | |||||||||||||
At 31 December 2012 | ||||||||||||||||
Assets | ||||||||||||||||
Derivatives | – | 3,768 | – | 3,768 | ||||||||||||
Available for sale | – | 1,208 | – | 1,208 | ||||||||||||
Liabilities | ||||||||||||||||
Designated at fair value | – | 23,195 | – | 23,195 | ||||||||||||
Derivatives | – | 760 | – | 760 | ||||||||||||
At 31 December 2011 | ||||||||||||||||
Assets | ||||||||||||||||
Derivatives | – | 3,568 | – | 3,568 | ||||||||||||
Available for sale | – | – | 1,078 | 1,078 | ||||||||||||
Liabilities | ||||||||||||||||
Designated at fair value | 17,196 | 3,955 | – | 21,151 | ||||||||||||
Derivatives | – | 1,067 | – | 1,067 | ||||||||||||
Liabilities designated at fair value: Transfers out of Level 1 were to bring these instruments in line with the classification methodology adopted for other corporate bonds within the Group.
Available for sale securities: Transfers out of Level 3 reflect increased observability in prices and improved market liquidity for these financial investments.
Financial instruments measured at fair value – Level 3
Financial investments measured using a valuation technique with significant unobservable inputs (Level 3) comprise fixed-rate preferred securities and senior notes purchased from HSBC undertakings. The unobservable elements of the valuation technique include the use of implied credit spreads and simplified bond pricing assumptions.
446
Table of Contents
HSBC HOLDINGS PLC
Notes on the Financial Statements(continued)
Movement in Level 3 financial instruments available for sale
2012 US$m | 2011 US$m | |||||||||
At 1 January | 1,078 | 2,025 | ||||||||
Total gains or losses: | ||||||||||
– recognised in profit or loss | – | 55 | ||||||||
– recognised in other comprehensive income | 130 | (61 | ) | |||||||
Settlements | – | (941 | ) | |||||||
Transfers out | (1,208 | ) | – | |||||||
At 31 December | – | 1,078 | ||||||||
Total gains or losses recognised in profit or loss relating to those assets and liabilities held on 31 December | – | 18 | ||||||||
In certain circumstances, the fair value of financial instruments are measured using valuation models that incorporate assumptions that are not supported by prices from observable current market transactions in the same instrument and are not based on observable market data. The following table shows the sensitivity of non-derivative financial instruments to reasonably possible alternative assumptions:
Effect of changes in significant unobservable assumptions to reasonably possible alternatives
| Reflected in equity | ||||||||||
Favourable changes US$m | Unfavourable changes US$m | |||||||||
Financial investments: available for sale | ||||||||||
At 31 December 2012 | – | – | ||||||||
At 31 December 2011 | 69 | (77 | ) | |||||||
| 16 | Fair values of financial instruments not carried at fair value |
The classification of financial instruments is determined in accordance with the accounting policies set out in Note 2.
Fair values of financial instruments which are not carried at fair value on the balance sheet
| At 31 December 2012 | At 31 December 2011 | |||||||||||||||||||||
Carrying amount | Fair value US$m | Carrying amount US$m | Fair value US$m | |||||||||||||||||||
Assets and liabilities not held for sale | ||||||||||||||||||||||
Assets | ||||||||||||||||||||||
Loans and advances to banks | 152,546 | 152,823 | 180,987 | 181,302 | ||||||||||||||||||
Loans and advances to customers | 997,623 | 973,741 | 940,429 | 914,485 | ||||||||||||||||||
Financial investments: debt securities | 23,413 | 25,458 | 21,018 | 22,500 | ||||||||||||||||||
Financial investments: treasury and other eligible bills | – | – | 181 | 181 | ||||||||||||||||||
Liabilities | ||||||||||||||||||||||
Deposits by banks | 107,429 | 107,392 | 112,822 | 112,848 | ||||||||||||||||||
Customer accounts | 1,340,014 | 1,340,521 | 1,253,925 | 1,254,313 | ||||||||||||||||||
Debt securities in issue | 119,461 | 120,779 | 131,013 | 130,914 | ||||||||||||||||||
Subordinated liabilities | 29,479 | 32,159 | 30,606 | 29,351 | ||||||||||||||||||
Loans and advances and customer accounts held for sale | ||||||||||||||||||||||
Loans and advances to banks and customers | 6,632 | 6,387 | 35,720 | 37,832 | ||||||||||||||||||
Customer accounts | 2,990 | 2,990 | 20,138 | 19,130 | ||||||||||||||||||
| 1 | Including financial instruments within disposal groups held for sale. |
447
Table of Contents
HSBC HOLDINGS PLC
Notes on the Financial Statements(continued)
The following is a list of financial instruments whose carrying amount is a reasonable approximation of fair value because, for example, they are short-term in nature or reprice to current market rates frequently:
Assets
Cash and balances at central banks
Items in the course of collection from other banks
Hong Kong Government certificates of indebtedness
Endorsements and acceptances
Short-term receivables within ‘Other assets’
Accrued income
Liabilities
Hong Kong currency notes in circulation
Items in the course of transmission to other banks
Investment contracts with discretionary participation features within ‘Liabilities under insurance contracts’
Endorsements and acceptances
Short-term payables within ‘Other liabilities’
Accruals
Analysis of loans and advances to customers by geographical segment
| At 31 December 2012 | At 31 December 2011 | |||||||||||||||||||||
Carrying amount | Fair value | Carrying amount | Fair value | |||||||||||||||||||
Loans and advances to customers | ||||||||||||||||||||||
Europe | 463,440 | 453,382 | 434,336 | 426,039 | ||||||||||||||||||
Hong Kong | 173,613 | 171,926 | 157,665 | 154,054 | ||||||||||||||||||
Rest of Asia-Pacific | 138,119 | 138,015 | 123,868 | 123,662 | ||||||||||||||||||
Middle East and North Africa | 28,086 | 27,954 | 25,875 | 25,758 | ||||||||||||||||||
North America | 140,756 | 128,637 | 142,747 | 128,608 | ||||||||||||||||||
Latin America | 53,609 | 53,827 | 55,938 | 56,364 | ||||||||||||||||||
| 997,623 | 973,741 | 940,429 | 914,485 | |||||||||||||||||||
Valuation
The calculation of fair value incorporates HSBC’s estimate of the amount at which financial assets could be exchanged, or financial liabilities settled, between knowledgeable, willing parties in an arm’s length transaction. It does not reflect the economic benefits and costs that HSBC expects to flow from the instruments’ cash flows over their expected future lives. Other reporting entities may use different valuation methodologies and assumptions in determining fair values for which no observable market prices are available.
The fair values of loans and advances to customers in the US are substantially lower than their carrying amount, reflecting the market conditions at the balance sheet date. The secondary market demand and estimated value for US loans and advances has been heavily influenced by the challenging economic conditions during the past number of years, including house price depreciation, rising unemployment, changes in consumer behaviour, changes in discount rates and the lack of financing options available to support the purchase of loans and advances. Many investors are non-bank financial institutions or hedge funds with high equity levels and a high cost of debt. For certain consumer loans, investors take a more conservative view of future performance than HSBC. As a result, third parties are likely to assume higher charge-off levels and/or slower voluntary prepayment speeds than HSBC believes will ultimately be the case. The investor discount rates reflect this difference in the overall cost of capital as well as the potential volatility in the underlying cash flow assumptions, the combination of which may yield a significant pricing discount from HSBC’s intrinsic value.
There was a modest decrease year on year in the fair value of loans and advances to customers in Europe relative to their carrying amount, largely in the UK mortgage portfolio which is sensitive to changes in market pricing between the balance sheet dates given its size and the competitive UK market. We also enhanced fair value estimation processes for mortgage and corporate lending in the UK to reflect risk factors, product characteristics and prepayment estimates at a more granular level. This overall decrease was mitigated by higher valuations of ABSs classified as loans and receivables following improved market appetite for such securities.
448
Table of Contents
HSBC HOLDINGS PLC
Notes on the Financial Statements(continued)
The fair values of loans and advances to customers in Latin America are higher than their carrying amount, primarily driven by a decrease in market interest rates, and in particular for the mortgage portfolios.
Fair values of the assets and liabilities set out below are estimated for the purpose of disclosure as follows:
Loans and advances to banks and customers
The fair value of loans and advances is based on observable market transactions, where available. In the absence of observable market transactions, fair value is estimated using valuation models that incorporate a range of input assumptions. These assumptions may include value estimates from third party brokers which reflect over-the-counter trading activity; forward looking discounted cash flow models using assumptions which HSBC believes are consistent with those which would be used by market participants in valuing such loans; and trading inputs from other market participants which includes observed primary and secondary trades.
Loans are grouped, as far as possible, into homogeneous groups and stratified by loans with similar characteristics to improve the accuracy of estimated valuation outputs. The stratification of a loan book considers all material factors, including vintage, origination period, estimates of future interest rates, prepayment speeds, delinquency rates, loan-to-value ratios, the quality of collateral, default probability, and internal credit risk ratings.
Valuation techniques are calibrated on a regular basis and tested for validity using prices from observable current market transactions in the same instrument, without modification or repackaging, or are based on any available observable market data.
The fair value of a loan reflects both loan impairments at the balance sheet date and estimates of market participants’ expectations of credit losses over the life of the loans, and the fair value impact of repricing between origination and the balance sheet date. For impaired loans, fair value is estimated by discounting the future cash flows over the time period they are expected to be recovered.
Financial investments
The fair values of listed financial investments are determined using bid market prices. The fair values of unlisted financial investments are determined using valuation techniques that take into consideration the prices and future earnings streams of equivalent quoted securities.
Deposits by banks and customer accounts
For the purpose of estimating fair value, deposits by banks and customer accounts are grouped by remaining contractual maturity. Fair values are estimated using discounted cash flows, applying current rates offered for deposits of similar remaining maturities. The fair value of a deposit repayable on demand is assumed to be the amount payable on demand at the balance sheet date.
Debt securities in issue and subordinated liabilities
Fair values are determined using quoted market prices at the balance sheet date where available, or by reference to quoted market prices for similar instruments.
The fair values in this note are stated at a specific date and may be significantly different from the amounts which will actually be paid on the maturity or settlement dates of the instruments. In many cases, it would not be possible to realise immediately the estimated fair values given the size of the portfolios measured. Accordingly, these fair values do not represent the value of these financial instruments to HSBC as a going concern.
HSBC Holdings
The methods used by HSBC Holdings to determine fair values of financial instruments for the purpose of measurement and disclosure are described above.
The following table provides an analysis of the fair value of financial instruments not carried at fair value on the balance sheet:
449
Table of Contents
HSBC HOLDINGS PLC
Notes on the Financial Statements(continued)
Fair values of HSBC Holdings’ financial instruments not carried at fair value on the balance sheet
| At 31 December 2012 | At 31 December 2011 | |||||||||||||||||||||
Carrying amount | Fair value | Carrying amount | Fair value | |||||||||||||||||||
Assets | ||||||||||||||||||||||
Loans and advances to HSBC undertakings | 41,675 | 42,843 | 28,048 | 27,562 | ||||||||||||||||||
Liabilities | ||||||||||||||||||||||
Amounts owed to HSBC undertakings | 12,856 | 13,133 | 2,479 | 2,485 | ||||||||||||||||||
Debt securities in issue | 2,691 | 3,188 | 2,613 | 2,922 | ||||||||||||||||||
Subordinated liabilities | 11,907 | 14,865 | 12,450 | 13,052 | ||||||||||||||||||
| 17 | Reclassification of financial assets |
In 2008, HSBC reclassified US$15.3bn and US$2.6bn of financial assets from the held-for-trading category to the loans and receivables and available-for-sale classifications, respectively, as permitted by the relevant amendment to IAS 39 and explained in Note 2(e) on the Financial Statements. No further reclassifications were undertaken.
Reclassification of HSBC’s financial assets
| At 31 December 2012 | At 31 December 2011 | |||||||||||||||||||||
Carrying amount US$m | Fair value US$m | Carrying amount US$m | Fair value US$m | |||||||||||||||||||
Reclassification to loans and receivables | 6,378 | 5,616 | 7,867 | 6,651 | ||||||||||||||||||
Reclassification to available for sale | 12 | 12 | 33 | 33 | ||||||||||||||||||
| 6,390 | 5,628 | 7,900 | 6,684 | |||||||||||||||||||
The following table shows the fair value gains and losses, income and expense recognised in the income statement in respect of reclassified assets and the gains and losses that would have been recognised if no reclassification had taken place:
Effect of reclassifying and not reclassifying financial assets
2012 US$m | 2011 US$m | 2010 US$m | ||||||||||||||
Reclassification to loans and receivables | ||||||||||||||||
Recorded in the income statement1 | 179 | 318 | 610 | |||||||||||||
Assuming no reclassification2 | 653 | 317 | 1,260 | |||||||||||||
Net income statement effect of reclassification | (474 | ) | 1 | (650 | ) | |||||||||||
Reclassification to available for sale | ||||||||||||||||
Recorded in the income statement1 | – | 1 | 56 | |||||||||||||
Assuming no reclassification2 | 1 | (2 | ) | 59 | ||||||||||||
Net income statement effect of reclassification | (1 | ) | 3 | (3 | ) | |||||||||||
| 1 | ‘Income and expense’ recorded in the income statement include the accrual of the effective interest rate and, for 2012, includes US$84m in respect of impairment (2011: US$69m; 2010: US$6m). |
| 2 | Effect on the income statement during the year had the reclassification not occurred. |
450
Table of Contents
HSBC HOLDINGS PLC
Notes on the Financial Statements(continued)
| 18 | Financial assets designated at fair value |
| At 31 December | ||||||||||
2012 US$m | 2011 US$m | |||||||||
Financial assets designated at fair value: | ||||||||||
– not subject to repledge or resale by counterparties | 33,562 | 30,738 | ||||||||
– which may be repledged or resold by counterparties | 20 | 118 | ||||||||
| 33,582 | 30,856 | |||||||||
Treasury and other eligible bills | 54 | 123 | ||||||||
Debt securities | 12,551 | 11,834 | ||||||||
Equity securities | 20,868 | 17,930 | ||||||||
Securities designated at fair value | 33,473 | 29,887 | ||||||||
Loans and advances to banks | 55 | 119 | ||||||||
Loans and advances to customers | 54 | 850 | ||||||||
| 33,582 | 30,856 | |||||||||
Securities designated at fair value1
| At 31 December | ||||||||||
2012 US$m | 2011 US$m | |||||||||
Fair value | ||||||||||
US Treasury and US Government agencies2 | 37 | 35 | ||||||||
UK Government | 625 | 812 | ||||||||
Hong Kong Government | 135 | 151 | ||||||||
Other government | 4,508 | 3,964 | ||||||||
Asset-backed securities3 | 158 | 201 | ||||||||
Corporate debt and other securities | 7,142 | 6,794 | ||||||||
Equities | 20,868 | 17,930 | ||||||||
| 33,473 | 29,887 | |||||||||
| 1 | Included within these figures are debt securities issued by banks and other financial institutions of US$3,509m (2011: US$3,497m), of which US$5m (2011: US$40m) are guaranteed by various governments. |
| 2 | Includes securities that are supported by an explicit guarantee issued by the US Government. |
| 3 | Excludes asset-backed securities included under US Treasury and US Government agencies. |
Securities listed on a recognised exchange and unlisted
Treasury and other eligible bills US$m | Debt securities US$m | Equity securities US$m | Total US$m | |||||||||||||||||||
Fair value at 31 December 2012 | ||||||||||||||||||||||
Listed on a recognised exchange1 | – | 3,007 | 14,063 | 17,070 | ||||||||||||||||||
Unlisted | 54 | 9,544 | 6,805 | 16,403 | ||||||||||||||||||
| 54 | 12,551 | 20,868 | 33,473 | |||||||||||||||||||
Fair value at 31 December 2011 | ||||||||||||||||||||||
Listed on a recognised exchange1 | 4 | 3,607 | 11,859 | 15,470 | ||||||||||||||||||
Unlisted | 119 | 8,227 | 6,071 | 14,417 | ||||||||||||||||||
| 123 | 11,834 | 17,930 | 29,887 | |||||||||||||||||||
| 1 | Included within listed investments are US$931m of investments listed in Hong Kong (2011: US$631m). |
451
Table of Contents
HSBC HOLDINGS PLC
Notes on the Financial Statements(continued)
| 19 | Derivatives |
Fair values of derivatives by product contract type held by HSBC
| Assets | Liabilities | |||||||||||||||||||||||||||||||||
| Trading US$m | Hedging US$m | Total US$m | Trading US$m | Hedging US$m | Total US$m | |||||||||||||||||||||||||||||
At 31 December 2012 | ||||||||||||||||||||||||||||||||||
Foreign exchange | 68,277 | 1,227 | 69,504 | 70,944 | 239 | 71,183 | ||||||||||||||||||||||||||||
Interest rate | 628,162 | 2,417 | 630,579 | 618,808 | 6,491 | 625,299 | ||||||||||||||||||||||||||||
Equity | 15,413 | – | 15,413 | 19,889 | – | 19,889 | ||||||||||||||||||||||||||||
Credit | 12,740 | – | 12,740 | 13,508 | – | 13,508 | ||||||||||||||||||||||||||||
Commodity and other | 1,443 | – | 1,443 | 1,236 | – | 1,236 | ||||||||||||||||||||||||||||
Gross total fair values | 726,035 | 3,644 | 729,679 | 724,385 | 6,730 | 731,115 | ||||||||||||||||||||||||||||
Netting | (372,229 | ) | (372,229 | ) | ||||||||||||||||||||||||||||||
Total | 357,450 | 358,886 | ||||||||||||||||||||||||||||||||
At 31 December 2011 | ||||||||||||||||||||||||||||||||||
Foreign exchange | 74,958 | 1,026 | 75,984 | 75,077 | 371 | 75,448 | ||||||||||||||||||||||||||||
Interest rate | 510,652 | 2,439 | 513,091 | 502,906 | 6,221 | 509,127 | ||||||||||||||||||||||||||||
Equity | 15,262 | – | 15,262 | 19,363 | – | 19,363 | ||||||||||||||||||||||||||||
Credit | 25,694 | – | 25,694 | 25,800 | – | 25,800 | ||||||||||||||||||||||||||||
Commodity and other | 2,198 | – | 2,198 | 1,492 | – | 1,492 | ||||||||||||||||||||||||||||
Gross total fair values | 628,764 | 3,465 | 632,229 | 624,638 | 6,592 | 631,230 | ||||||||||||||||||||||||||||
Netting | (285,850 | ) | (285,850 | ) | ||||||||||||||||||||||||||||||
Total | 346,379 | 345,380 | ||||||||||||||||||||||||||||||||
The 3% increase in the fair value of derivative assets during 2012 was driven by increased interest rate derivative fair values as major currency yield curves continued to decline, in particular, the euro. This drove both the increase in gross fair values and the increase in the netting adjustment.
Fair values of derivatives by product contract type held by HSBC Holdings with subsidiaries
| At 31 December 2012 | At 31 December 2011 | |||||||||||||||||||||
Trading assets US$m | Trading liabilities US$m | Trading assets US$m | Trading liabilities US$m | |||||||||||||||||||
Foreign exchange | 1,636 | 760 | 1,546 | 1,067 | ||||||||||||||||||
Interest rate | 2,132 | – | 2,022 | – | ||||||||||||||||||
| 3,768 | 760 | 3,568 | 1,067 | |||||||||||||||||||
Derivatives are financial instruments that derive their value from the price of underlying items such as equities, bonds, interest rates, foreign exchange, credit spreads, commodities and equity or other indices. Derivatives enable users to increase, reduce or alter exposure to credit or market risks.
Derivatives are carried at fair value and shown in the balance sheet as separate totals of assets and liabilities. A description of how the fair value of derivatives is derived is set out on page 443. Derivative assets and liabilities on different transactions are only set off (netted) if the transactions are with the same counterparty, a legal right of set-off exists and the cash flows are intended to be settled on a net basis.
Use of derivatives
HSBC transacts derivatives for three primary purposes: to create risk management solutions for clients, to manage the portfolio risks arising from client business and to manage and hedge HSBC’s own risks. Derivatives (except for derivatives which are designated as effective hedging instruments as defined in IAS 39) are held for trading. Within the held-for-trading classification are two types of derivatives: those used in sales and trading activities, and those used for risk management purposes but which for various reasons do not meet the qualifying criteria for hedge accounting. The second category includes derivatives managed in conjunction with financial instruments designated at fair value. These activities are described more fully below.
HSBC’s derivative activities give rise to significant open positions in portfolios of derivatives. These positions are managed constantly to ensure that they remain within acceptable risk levels. When entering into derivative
452
Table of Contents
HSBC HOLDINGS PLC
Notes on the Financial Statements(continued)
transactions, HSBC employs the same credit risk management framework to assess and approve potential credit exposures that is used for traditional lending.
Trading derivatives
Most of HSBC’s derivative transactions relate to sales and trading activities. Sales activities include the structuring and marketing of derivative products to customers to enable them to take, transfer, modify or reduce current or expected risks. Trading activities in derivatives are entered into principally for the purpose of generating profits from short-term fluctuations in price or margin and for the risk management of exposure arising from customer activities. Positions may be traded actively or be held over a period of time to benefit from expected changes in exchange rates, interest rates, equity prices or other market parameters. Trading includes market-making, positioning and arbitrage activities. Market-making entails quoting bid and offer prices to other market participants for the purpose of generating revenues based on spread and volume; positioning means managing market risk positions in the expectation of benefiting from favourable movements in prices, rates or indices; arbitrage involves identifying and profiting from price differentials between markets and products.
As mentioned above, other derivatives classified as held for trading include non-qualifying hedging derivatives, ineffective hedging derivatives and the components of hedging derivatives that are excluded from assessing hedge effectiveness. Non-qualifying hedging derivatives are entered into for risk management purposes but do not meet the criteria for hedge accounting. Trading derivatives also include derivatives managed in conjunction with financial instruments designated at fair value.
Gains and losses from changes in the fair value of derivatives, including the contractual interest, that do not qualify for hedge accounting are reported in ‘Net trading income’ except for derivatives managed in conjunction with financial instruments designated at fair value, where gains and losses are reported in ‘Net income from financial instruments designated at fair value’ together with the gains and losses on the economically hedged items. Where the derivatives are managed with debt securities in issue, the contractual interest is shown in ‘Interest expense’ together with the interest payable on the issued debt. Substantially all of HSBC Holdings’ derivatives entered into with HSBC undertakings are managed in conjunction with financial liabilities designated at fair value.
The notional contract amounts of derivatives held for trading purposes indicate the nominal value of transactions outstanding at the balance sheet date; they do not represent amounts at risk. The 9% increase in the notional contract amounts of HSBC’s derivatives during 2012 was primarily driven by an increase in the trading volumes of interest rate contracts.
Notional contract amounts of derivatives held for trading purposes by product type
| HSBC | HSBC Holdings | |||||||||||||||||||||
At US$m | At 2011 US$m | At 31 December US$m | At US$m | |||||||||||||||||||
Foreign exchange | 4,435,729 | 3,945,774 | 17,576 | 18,942 | ||||||||||||||||||
Interest rate | 21,355,749 | 19,788,710 | 11,554 | 10,954 | ||||||||||||||||||
Equity | 495,668 | 265,577 | – | – | ||||||||||||||||||
Credit | 901,507 | 1,049,147 | – | – | ||||||||||||||||||
Commodity and other | 80,219 | 76,487 | – | – | ||||||||||||||||||
| 27,268,872 | 25,125,695 | 29,130 | 29,896 | |||||||||||||||||||
Credit derivatives
HSBC trades credit derivatives through its principal dealing operations and acts as a principal counterparty to a broad range of users, structuring transactions to produce risk management products for its customers, or making markets in certain products. Risk is typically controlled through entering into offsetting credit derivative contracts with other counterparties.
HSBC manages the credit risk arising on buying and selling credit derivative protection by including the related credit exposures within its overall credit limit structure for the relevant counterparty. Trading of credit derivatives is restricted to a small number of offices within the major centres which have the control infrastructure and market skills to manage effectively the credit risk inherent in the products.
453
Table of Contents
HSBC HOLDINGS PLC
Notes on the Financial Statements(continued)
Credit derivatives are also deployed to a limited extent for the risk management of the Group’s loan portfolios. The notional contract amount of credit derivatives of US$901,507m (2011: US$1,049,147m) consisted of protection bought of US$446,410m (2011: US$517,737m) and protection sold of US$455,097m (2011: US$531,410m). The credit derivative business operates within the market risk management framework described on page 265.
Derivatives valued using models with unobservable inputs
The difference between the fair value at initial recognition (the transaction price) and the value that would have been derived had valuation techniques used for subsequent measurement been applied at initial recognition, less subsequent releases, is as follows:
Unamortised balance of derivatives valued using models with significant unobservable inputs
| 2012 US$m | 2011 US$m | |||||||||
Unamortised balance at 1 January | 200 | 250 | ||||||||
Deferral on new transactions | 149 | 234 | ||||||||
Recognised in the income statement during the period: | ||||||||||
– amortisation | (112 | ) | (143 | ) | ||||||
– subsequent to unobservable inputs becoming observable | (1 | ) | (71 | ) | ||||||
– maturity, termination or offsetting derivative | (46 | ) | (60 | ) | ||||||
– risk hedged | (11 | ) | (8 | ) | ||||||
Exchange differences | 2 | (2 | ) | |||||||
Unamortised balance at 31 December1 | 181 | 200 | ||||||||
| 1 | This amount is yet to be recognised in the consolidated income statement. |
Hedge accounting derivatives
HSBC uses derivatives (principally interest rate swaps) for hedging purposes in the management of its own asset and liability portfolios and structural positions. This enables HSBC to optimise the overall cost to the Group of accessing debt capital markets, and to mitigate the market risk which would otherwise arise from structural imbalances in the maturity and other profiles of its assets and liabilities.
The accounting treatment of hedge transactions varies according to the nature of the instrument hedged and the type of hedge transactions. Derivatives may qualify as hedges for accounting purposes if they are fair value hedges, cash flow hedges, or hedges of net investment in foreign operations. These are described under the relevant headings below.
The notional contract amounts of derivatives held for hedge accounting purposes indicate the nominal value of transactions outstanding at the balance sheet date; they do not represent amounts at risk.
Notional contract amounts of derivatives held for hedge accounting purposes by product type
| At 31 December 2012 | At 31 December 2011 | |||||||||||||||||||||
Cash flow hedge US$m | Fair value hedge US$m | Cash flow hedge US$m | Fair value hedge US$m | |||||||||||||||||||
Foreign exchange | 16,716 | 112 | 12,078 | 1,363 | ||||||||||||||||||
Interest rate | 182,688 | 75,505 | 228,052 | 76,950 | ||||||||||||||||||
| 199,404 | 75,617 | 240,130 | 78,313 | |||||||||||||||||||
Fair value hedges
HSBC’s fair value hedges principally consist of interest rate swaps that are used to protect against changes in the fair value of fixed-rate long-term financial instruments due to movements in market interest rates. For fair value hedges, all changes in the fair value of the derivative and in the fair value of the item in relation to the risk being hedged are recognised in the income statement. If the hedge relationship is terminated, the fair value adjustment to the hedged item continues to be reported as part of the basis of the item and is amortised to the income statement as a yield adjustment over the remainder of the hedging period.
454
Table of Contents
HSBC HOLDINGS PLC
Notes on the Financial Statements(continued)
Fair value of derivatives designated as fair value hedges
| At 31 December 2012 | At 31 December 2011 | |||||||||||||||||||||
Assets US$m | Liabilities US$m | Assets US$m | Liabilities US$m | |||||||||||||||||||
Foreign exchange | – | – | 77 | 1 | ||||||||||||||||||
Interest rate | 199 | 4,450 | 369 | 4,331 | ||||||||||||||||||
| 199 | 4,450 | 446 | 4,332 | |||||||||||||||||||
Gains or losses arising from fair value hedges
2012 US$m | 2011 US$m | 2010 US$m | ||||||||||||||
Gains/(losses): | ||||||||||||||||
– on hedging instruments | (898 | ) | (4,082 | ) | (830 | ) | ||||||||||
– on the hedged items attributable to the hedged risk | 871 | 3,858 | 868 | |||||||||||||
| (27 | ) | (224 | ) | 38 | ||||||||||||
The gains and losses on ineffective portions of fair value hedges are recognised immediately in ‘Net trading income’.
Cash flow hedges
HSBC’s cash flow hedges consist principally of interest rate swaps, futures and cross-currency swaps that are used to protect against exposures to variability in future interest cash flows on non-trading assets and liabilities which bear interest at variable rates or which are expected to be re-funded or reinvested in the future. The amounts and timing of future cash flows, representing both principal and interest flows, are projected for each portfolio of financial assets and liabilities on the basis of their contractual terms and other relevant factors, including estimates of prepayments and defaults. The aggregate principal balances and interest cash flows across all portfolios over time form the basis for identifying gains and losses on the effective portions of derivatives designated as cash flow hedges of forecast transactions. Gains and losses are initially recognised in other comprehensive income, and accumulated in the cash flow hedging reserve, and are transferred to the income statement when the forecast cash flows affect the income statement.
Fair value of derivatives designated as cash flow hedges
| At 31 December 2012 | At 31 December 2011 | |||||||||||||||||||||
Assets US$m | Liabilities US$m | Assets US$m | Liabilities US$m | |||||||||||||||||||
Foreign exchange | 1,230 | 200 | 949 | 370 | ||||||||||||||||||
Interest rate | 2,218 | 2,041 | 2,070 | 1,890 | ||||||||||||||||||
| 3,448 | 2,241 | 3,019 | 2,260 | |||||||||||||||||||
Forecast principal balances on which interest cash flows are expected to arise
3 months or less US$m | More than 3 months but less than 1 year US$m | 5 years or less but more than 1 year US$m | More than 5 years US$m | |||||||||||||||||||
At 31 December 2012 | ||||||||||||||||||||||
Assets | 112,846 | 93,072 | 72,557 | 5,055 | ||||||||||||||||||
Liabilities | (68,534 | ) | (43,800 | ) | (29,401 | ) | (4,777 | ) | ||||||||||||||
Net cash inflows exposure | 44,312 | 49,272 | 43,156 | 278 | ||||||||||||||||||
At 31 December 2011 | ||||||||||||||||||||||
Assets | 139,701 | 110,960 | 66,383 | 4,460 | ||||||||||||||||||
Liabilities | (77,898 | ) | (50,480 | ) | (36,296 | ) | (4,693 | ) | ||||||||||||||
Net cash inflows/(outflows) exposure | 61,803 | 60,480 | 30,087 | (233 | ) | |||||||||||||||||
This table reflects the interest rate repricing profile of the underlying hedged items.
455
Table of Contents
HSBC HOLDINGS PLC
Notes on the Financial Statements(continued)
The gains and losses on ineffective portions of such derivatives are recognised immediately in ‘Net trading income’. During the year to 31 December 2012 a gain of US$35m (2011: gain of US$26m; 2010: loss of US$9m) was recognised due to hedge ineffectiveness.
Hedges of net investments in foreign operations
The Group applies hedge accounting in respect of certain consolidated net investments. Hedging is undertaken using forward foreign exchange contracts or by financing with currency borrowings.
At 31 December 2012, the fair values of outstanding financial instruments designated as hedges of net investments in foreign operations were assets of US$3m (2011: US$121m) and liabilities of US$50m (2011: US$36m) and notional contract values of US$2,654m (2011: US$3,920m).
The ineffectiveness recognised in ‘Net trading income’ in the year ended 31 December 2012 that arose from hedges in foreign operations was nil (2011 and 2010: nil).
| 20 | Financial investments |
| At 31 December | ||||||||||
2012 US$m | 2011 US$m | |||||||||
Financial investments: | ||||||||||
– not subject to repledge or resale by counterparties | 399,613 | 364,906 | ||||||||
– which may be repledged or resold by counterparties | 21,488 | 35,138 | ||||||||
| 421,101 | 400,044 | |||||||||
Carrying amount and fair value of financial investments
| At 31 December 2012 | At 31 December 2011 | |||||||||||||||||||||
Carrying amount US$m | Fair value US$m | Carrying amount US$m | Fair value US$m | |||||||||||||||||||
Treasury and other eligible bills | 87,550 | 87,550 | 65,223 | 65,223 | ||||||||||||||||||
– available for sale | 87,550 | 87,550 | 65,042 | 65,042 | ||||||||||||||||||
– held to maturity | – | – | 181 | 181 | ||||||||||||||||||
Debt securities | 327,762 | 329,807 | 327,611 | 329,093 | ||||||||||||||||||
– available for sale | 304,349 | 304,349 | 306,593 | 306,593 | ||||||||||||||||||
– held to maturity | 23,413 | 25,458 | 21,018 | 22,500 | ||||||||||||||||||
Equity securities | 5,789 | 5,789 | 7,210 | 7,210 | ||||||||||||||||||
– available for sale | 5,789 | 5,789 | 7,210 | 7,210 | ||||||||||||||||||
| ||||||||||||||||||||||
Total financial investments | 421,101 | 423,146 | 400,044 | 401,526 | ||||||||||||||||||
Financial investments at amortised cost and fair value
Amortised cost1 US$m | Fair value2 US$m | |||||||||
At 31 December 2012 | ||||||||||
US Treasury | 60,657 | 61,925 | ||||||||
US Government agencies3 | 22,579 | 23,500 | ||||||||
US Government sponsored entities3 | 5,262 | 5,907 | ||||||||
UK Government | 17,018 | 17,940 | ||||||||
Hong Kong Government | 42,687 | 42,711 | ||||||||
Other government | 146,507 | 149,179 | ||||||||
Asset-backed securities4 | 29,960 | 26,418 | ||||||||
Corporate debt and other securities | 86,099 | 89,777 | ||||||||
Equities | 4,284 | 5,789 | ||||||||
| 415,053 | 423,146 | |||||||||
456
Table of Contents
HSBC HOLDINGS PLC
Notes on the Financial Statements(continued)
Amortised cost1 US$m | Fair value2 US$m | |||||||||
At 31 December 2011 | ||||||||||
US Treasury | 43,848 | 45,283 | ||||||||
US Government agencies3 | 25,079 | 26,093 | ||||||||
US Government sponsored entities3 | 4,425 | 5,056 | ||||||||
UK Government | 32,165 | 33,603 | ||||||||
Hong Kong Government | 33,359 | 33,374 | ||||||||
Other government | 125,623 | 127,049 | ||||||||
Asset-backed securities4 | 35,096 | 28,625 | ||||||||
Corporate debt and other securities | 94,110 | 95,233 | ||||||||
Equities | 5,122 | 7,210 | ||||||||
| 398,827 | 401,526 | |||||||||
At 31 December 2010 | ||||||||||
US Treasury | 37,380 | 37,255 | ||||||||
US Government agencies3 | 20,895 | 21,339 | ||||||||
US Government sponsored entities3 | 5,029 | 5,267 | ||||||||
UK Government | 31,069 | 31,815 | ||||||||
Hong Kong Government | 29,770 | 29,793 | ||||||||
Other government | 108,947 | 109,806 | ||||||||
Asset-backed securities4 | 39,845 | 33,175 | ||||||||
Corporate debt and other securities | 124,704 | 125,311 | ||||||||
Equities | 5,605 | 7,983 | ||||||||
| 403,244 | 401,744 | |||||||||
| 1 | Represents the amortised cost or cost basis of the financial investment. |
| 2 | Included within these figures are debt securities issued by banks and other financial institutions of US$59,908m (2011: US$68,334m; 2010: US$99,733m), of which US$6,916m (2011: US$17,079m; 2010: US$38,862m) are guaranteed by various governments. The fair value of the debt securities issued by banks and other financial institutions was US$60,616m (2011: US$68,765m; 2010: US$100,070m). |
| 3 | Includes securities that are supported by an explicit guarantee issued by the US Government. |
| 4 | Excludes asset-backed securities included under US Government agencies and sponsored entities. |
Financial investments listed on a recognised exchange and unlisted
Treasury and other eligible bills available for sale US$m | Treasury and other eligible bills held to maturity US$m | Debt securities available for sale US$m | Debt securities held to maturity US$m | Equity securities available for sale US$m | Total US$m | |||||||||||||||||||||||||||||
Carrying amount at 31 December 2012 | ||||||||||||||||||||||||||||||||||
Listed on a recognised exchange1 | 3,284 | – | 113,399 | 5,599 | 536 | 122,818 | ||||||||||||||||||||||||||||
Unlisted2 | 84,266 | – | 190,950 | 17,814 | 5,253 | 298,283 | ||||||||||||||||||||||||||||
| 87,550 | – | 304,349 | 23,413 | 5,789 | 421,101 | |||||||||||||||||||||||||||||
Carrying amount at 31 December 2011 | ||||||||||||||||||||||||||||||||||
Listed on a recognised exchange1 | 4,077 | – | 121,303 | 4,370 | 535 | 130,285 | ||||||||||||||||||||||||||||
Unlisted2 | 60,965 | 181 | 185,290 | 16,648 | 6,675 | 269,759 | ||||||||||||||||||||||||||||
| 65,042 | 181 | 306,593 | 21,018 | 7,210 | 400,044 | |||||||||||||||||||||||||||||
| 1 | The fair value of listed held-to-maturity debt securities as at 31 December 2012 was US$6,123m (2011: US$4,641m). Included within listed investments were US$3,512m (2011: US$3,544m) of investments listed in Hong Kong. |
| 2 | Unlisted treasury and other eligible bills available for sale primarily comprise treasury bills not listed on a recognised exchange but for which there is a liquid market. |
457
Table of Contents
HSBC HOLDINGS PLC
Notes on the Financial Statements(continued)
Maturities of investments in debt securities at their carrying amount
| At 31 December | ||||||||||
2012 US$m | 2011 US$m | |||||||||
Remaining contractual maturity of total debt securities: | ||||||||||
1 year or less | 67,268 | 87,080 | ||||||||
5 years or less but over 1 year | 157,075 | 128,192 | ||||||||
10 years or less but over 5 years | 47,123 | 52,251 | ||||||||
Over 10 years | 56,296 | 60,088 | ||||||||
| 327,762 | 327,611 | |||||||||
Remaining contractual maturity of debt securities available for sale: | ||||||||||
1 year or less | 65,500 | 85,821 | ||||||||
5 years or less but over 1 year | 149,195 | 120,763 | ||||||||
10 years or less but over 5 years | 39,498 | 44,946 | ||||||||
Over 10 years | 50,156 | 55,063 | ||||||||
| 304,349 | 306,593 | |||||||||
Remaining contractual maturity of debt securities held to maturity: | ||||||||||
1 year or less | 1,768 | 1,259 | ||||||||
5 years or less but over 1 year | 7,880 | 7,429 | ||||||||
10 years or less but over 5 years | 7,625 | 7,305 | ||||||||
Over 10 years | 6,140 | 5,025 | ||||||||
| 23,413 | 21,018 | |||||||||
Contractual maturities and weighted average yields of investment debt securities at 31 December 2012
| Within one year | After one year but within five years | After five years but within ten years | After ten years | |||||||||||||||||||||||||||||||||||||||||||
| Amount | Yield | Amount | Yield | Amount | Yield | Amount | Yield | |||||||||||||||||||||||||||||||||||||||
| US$m | % | US$m | % | US$m | % | US$m | % | |||||||||||||||||||||||||||||||||||||||
Available for sale | ||||||||||||||||||||||||||||||||||||||||||||||
US Treasury | 12,306 | 0.4 | 30,334 | 0.5 | 6,113 | 2.0 | 2,237 | 3.5 | ||||||||||||||||||||||||||||||||||||||
US Government agencies | 6 | 2.6 | 7 | 5.3 | 94 | 1.9 | 22,128 | 2.9 | ||||||||||||||||||||||||||||||||||||||
US Government-sponsored agencies | 5 | 2.0 | 360 | 2.6 | 2,968 | 3.1 | 807 | 3.7 | ||||||||||||||||||||||||||||||||||||||
UK Government | 162 | 0.2 | 13,793 | 1.5 | 1,286 | 5.9 | 634 | 5.1 | ||||||||||||||||||||||||||||||||||||||
Hong Kong Government | 946 | 0.5 | 686 | 2.0 | – | – | – | – | ||||||||||||||||||||||||||||||||||||||
Other governments | 38,327 | 2.5 | 60,048 | 2.7 | 10,198 | 4.4 | 2,112 | 3.8 | ||||||||||||||||||||||||||||||||||||||
Asset-backed securities | 336 | 0.1 | 2,682 | 0.4 | 7,643 | 0.2 | 19,181 | 0.2 | ||||||||||||||||||||||||||||||||||||||
Corporate debt and other securities | 13,312 | 3.2 | 39,667 | 2.5 | 8,123 | 3.5 | 3,325 | 5.1 | ||||||||||||||||||||||||||||||||||||||
Total amortised cost | 65,400 | 147,577 | 36,425 | 50,424 | ||||||||||||||||||||||||||||||||||||||||||
Total carrying value | 65,500 | 149,195 | 39,498 | 50,156 | ||||||||||||||||||||||||||||||||||||||||||
Held to maturity | ||||||||||||||||||||||||||||||||||||||||||||||
US Treasury | 22 | 4.2 | 21 | 4.4 | 50 | 4.8 | 143 | 4.4 | ||||||||||||||||||||||||||||||||||||||
US Government agencies | – | – | 1 | 7.6 | 3 | 7.7 | 338 | 6.5 | ||||||||||||||||||||||||||||||||||||||
US Government-sponsored agencies | 1 | 8.1 | 6 | 7.8 | 1 | 7.8 | 1,113 | 6.2 | ||||||||||||||||||||||||||||||||||||||
Hong Kong Government | – | – | 30 | 0.4 | 10 | 4.1 | 3 | 1.2 | ||||||||||||||||||||||||||||||||||||||
Other governments | 71 | 2.8 | 480 | 3.8 | 254 | 5.2 | 562 | 5.1 | ||||||||||||||||||||||||||||||||||||||
Asset-backed securities | – | – | – | – | – | – | 118 | 6.3 | ||||||||||||||||||||||||||||||||||||||
Corporate debt and other securities | 1,674 | 4.4 | 7,342 | 3.8 | 7,307 | 4.2 | 3,863 | 4.2 | ||||||||||||||||||||||||||||||||||||||
Total amortised cost | 1,768 | 7,880 | 7,625 | 6,140 | ||||||||||||||||||||||||||||||||||||||||||
Total carrying value | 1,768 | 7,880 | 7,625 | 6,140 | ||||||||||||||||||||||||||||||||||||||||||
The maturity distributions of asset-backed securities are presented in the above table on the basis of contractual maturity dates. The weighted average yield for each range of maturities is calculated by dividing the annualised interest income for the year ended 31 December 2012 by the book amount of available-for-sale debt securities at that date. The yields do not include the effect of related derivatives.
| 21 | Transfers of financial assets |
HSBC enters into transactions in the normal course of business by which it transfers financial assets to third parties including SPEs. Depending on the circumstances these transfers may either result in these financial assets being derecognised or continuing to be recognised.
458
Table of Contents
HSBC HOLDINGS PLC
Notes on the Financial Statements(continued)
| • | Full derecognition occurs when HSBC transfers its contractual right to receive cash flows from the financial assets, or retains the right but assumes an obligation to pass on the cash flows from the asset, and transfers substantially all the risks and rewards of ownership. The risks include credit, interest rate, foreign currency, prepayment and other price risks. |
| • | Derecognition does not occur when HSBC transfers its contractual right to receive cash flows from the financial assets, or retains the right but assumes an obligation to pass on the cash flows from the asset, but either: |
| i) | retains substantially all of the risks and rewards of ownership of the transferred asset; or |
| ii) | neither retains nor transfers substantially all of the risks and rewards of ownership but has retained control of the financial asset. In this situation the financial assets are recognised on the balance sheet to the extent of HSBC’s continuing involvement. |
The majority of transferred financial assets that do not qualify for derecognition are (i) debt securities held by counterparties as collateral under repurchase agreements or (ii) equity securities lent under securities lending agreements.
As the substance of these transactions is secured borrowings the asset collateral continues to be recognised in full and the related liability reflecting the Group’s obligation to repurchase the transferred assets for a fixed price at a future date is recognised in deposits from banks or customers as appropriate. As a result of these transactions, the Group is unable to use, sell or pledge the transferred assets for the duration of the transaction. The Group remains exposed to interest rate risk and credit risk on these pledged instruments. The counterparty’s recourse is not limited to the transferred assets.
Other transactions where the counterparty’s recourse is only to the transferred asset includes a Canadian government sponsored securitisation programme, where HSBC Bank Canada assigns ownership and its right to sell or pledge residential mortgages. HSBC Bank Canada remains exposed to credit and interest rate risk on the assigned residential mortgages, which continue to be recorded as loans and advances. Third party funds received by HSBC Bank Canada under the programme are accounted for as secured borrowings and presented as debt securities in issue on the consolidated balance sheet.
In a small number of securitisation transactions, HSBC has neither transferred nor retained substantially all the risks and rewards of ownership of the transferred assets, and has retained control of the transferred assets. Circumstances in which HSBC has continuing involvement in the transferred assets may include retention of servicing rights over the transferred assets, entering into a derivative transaction with the securitisation vehicle or retaining an interest in the securitisation vehicle. Where HSBC has continuing involvement it continues to recognise the transferred assets to the extent of its continuing involvement and recognises an associated liability. The net carrying amount of the transferred assets and associated liabilities reflects the rights and obligations that HSBC has retained.
The following table analyses the carrying amount of financial assets that did not qualify for derecognition and their associated financial liabilities, including those that are recognised to the extent of HSBC’s continuing involvement and the associated liabilities.
Financial assets not qualifying for full derecognition and associated financial liabilities1
Carrying amount of assets before transfer | Carrying amount of transferred assets | Carrying amount of associated liabilities | Fair value of transferred assets | Fair value of associated liabilities | Net position | |||||||||||||||||||
| US$m | US$m | US$m | US$m | US$m | US$m | |||||||||||||||||||
At 31 December 2012 | ||||||||||||||||||||||||
Repurchase agreements | 122,130 | 121,589 | ||||||||||||||||||||||
Securities lending agreements | 5,891 | 5,820 | ||||||||||||||||||||||
Other sales (recourse to transferred asset only) | 9,727 | 9,733 | 9,767 | 9,856 | (89 | ) | ||||||||||||||||||
Securitisations recognised to the extent of continuing involvement | 17,427 | 12 | 6 | 12 | 6 | 6 | ||||||||||||||||||
| 1 | The disclosure for 2012 reflects amendments made to IFRS 7 that are effective prospectively for annual reporting periods beginning on or after 1 July 2011. |
459
Table of Contents
HSBC HOLDINGS PLC
Notes on the Financial Statements(continued)
At 31 December 2011, the carrying amount of transferred assets and associated liabilities for repurchase agreements were US$124,982m and US$124,413m respectively, and for securities lending agreements were US$7,129m and US$7,039m, respectively.
At 31 December 2011, the carrying amount of transferred assets and associated liabilities for securitisations recognised to the extent of continuing involvement were US$22m and US$11m, respectively. The carrying amount of these assets before transfer was US$17,427m.
Financial assets qualifying for full derecognition and associated financial liabilities1
| At 31 December 2012 | 2012 | |||||||||||||||||||||||||||||||||||
| Carrying amount | Gain or | Income/ | ||||||||||||||||||||||||||||||||||
| of continuing | Fair value of | loss | Income/ | (expenses) | ||||||||||||||||||||||||||||||||
| involvement in | continuing | Maximum | recognised | (expenses) | recognised | |||||||||||||||||||||||||||||||
| the balance sheet | involvement | exposure | at transfer | recognised | cumulat- | |||||||||||||||||||||||||||||||
| Assets | Liabilities | Assets | Liabilities | to loss | date | in year | ively | |||||||||||||||||||||||||||||
| US$m | US$m | US$m | US$m | US$m | US$m | US$m | US$m | |||||||||||||||||||||||||||||
Type of continuing involvement | ||||||||||||||||||||||||||||||||||||
Interest in SPEs | 393 | – | 354 | – | 393 | 10 | 8 | 58 | ||||||||||||||||||||||||||||
| 1 | The disclosure for 2012 reflects amendments made to IFRS 7 that are effective prospectively for annual reporting periods beginning on or after 1 July 2011. |
The assets in the table above represent our continuing involvement in securitisations where HSBC has transferred assets to an unconsolidated SPE, but has retained some of the notes issued by the SPE. These notes are reported in loans and advances to customers. The maximum exposure to loss is the carrying amount of the notes.
| 22 | Interests in associates and joint ventures |
Associates
Principal associates of HSBC
| At 31 December 2012 | At 31 December 2011 | |||||||||||||||||||||
Carrying amount US$m | Fair value US$m | Carrying amount US$m | Fair value US$m | |||||||||||||||||||
Listed | �� | |||||||||||||||||||||
Bank of Communications Co., Limited | 11,770 | 10,633 | 8,507 | 8,234 | ||||||||||||||||||
Industrial Bank Co., Limited | 2,851 | 3,665 | 2,214 | 2,743 | ||||||||||||||||||
Ping An Insurance (Group) Company of China, Limited | – | – | 6,373 | 8,110 | ||||||||||||||||||
The Saudi British Bank | 2,135 | 3,189 | 1,886 | 3,256 | ||||||||||||||||||
| 16,756 | 17,487 | 18,980 | 22,343 | |||||||||||||||||||
| At 31 December 2012 | ||||||||||||
Country of incorporation | HSBC’s interest in equity capital | Issued equity capital | ||||||||||
Listed | ||||||||||||
Bank of Communications Co., Limited | PRC | 1 | 19.03% | RMB74,263m | ||||||||
Industrial Bank Co., Limited | PRC | 1 | 12.80% | RMB10,786m | ||||||||
The Saudi British Bank | Saudi Arabia | 40.00% | SR10,000m | |||||||||
Unlisted | ||||||||||||
Barrowgate Limited2 | Hong Kong | 24.64% | – | |||||||||
Vietnam Technological and Commercial Joint Stock Bank | Vietnam | 19.48% | VND8,848,079m | |||||||||
Yantai Bank Co., Limited3 | PRC | 1 | 20.00% | RMB2,000m | ||||||||
| 1 | People’s Republic of China. |
| 2 | Issued equity capital is less than HK$1m. |
| 3 | The investment is held through Hang Seng Bank Limited, a 62.14% owned subsidiary of HSBC. |
All the above investments in associates are owned by subsidiaries of HSBC Holdings.
Details of all HSBC associates and joint ventures, as required under Section 409 Companies Act 2006, will be annexed to the next Annual Return of HSBC Holdings filed with the UK Registrar of Companies.
HSBC had US$11,770m (2011: US$14,880m) of investments in associates and joint ventures listed in Hong Kong.
460
Table of Contents
HSBC HOLDINGS PLC
Notes on the Financial Statements(continued)
For the year ended 31 December 2012, HSBC’s share of associates and joint ventures’ tax on profit was US$959m (2011: US$890m), which is included within ‘Share of profit in associates and joint ventures’ in the income statement.
Summarised aggregate financial information on associates
| At 31 December | ||||||||||
2012 US$m | 2011 US$m | |||||||||
HSBC’s share of: | ||||||||||
– assets | 237,338 | 249,461 | ||||||||
– liabilities | 220,455 | 230,902 | ||||||||
– revenues | 14,206 | 12,009 | ||||||||
– profit after tax | 3,521 | 3,221 | ||||||||
HSBC’s investment in Bank of Communications Co., Limited (‘BoCom’) was equity accounted with effect from August 2004. HSBC’s significant influence in BoCom was established as a result of representation on the Board of Directors, and in accordance with the Technical Support and Assistance Agreements, HSBC is assisting in the maintenance of financial and operating policies and a number of staff have been seconded to assist in this process. During 2012, the market value of the investment in BoCom was below the carrying amount for a period of approximately ten months. As a result, we performed impairment tests on the carrying amount of the investment in BoCom. The result confirmed that there was no impairment. The impairment test was performed by comparing the recoverable amount of BoCom, determined by a value in use (‘VIU’) calculation, with its carrying amount. The calculation of VIU used discounted cash flow projections based on management’s estimates. Cash flows beyond the next five years were then extrapolated in perpetuity using a long-term growth rate. The discount rate used was based on a cost of capital used to evaluate investments in mainland China. Management judgement is required in estimating the future cash flows of BoCom which are sensitive to the cash flows projected in the short- and medium-term, and also to the key assumptions regarding the long-term sustainable cash flows thereafter. The key assumptions are consistent with external sources of information.
HSBC’s investment in Industrial Bank Co., Limited (‘Industrial Bank’) was equity accounted with effect from May 2004. HSBC’s significant influence has been established as a result of representation on the Board of Directors. In January 2013 HSBC was no longer in a position to exercise significant influence over Industrial Bank and ceased to account for it as an associate. For further details, see Note 45.
HSBC’s investment in Ping An Insurance (Group) Company of China Limited (‘Ping An’) was equity accounted with effect from August 2005, reflecting HSBC’s significant influence over this associate. HSBC’s significant influence was established as a result of representation on the Board of Directors. In June 2011, following a further issue of shares by Ping An to a third party, HSBC’s holding was diluted to 15.57% and a dilution gain of US$181m was recognised in ‘Other operating income’.
In July 2011, Ping An increased its ownership interest in Shenzhen Development Bank (‘SDB’) from 29.99% to 52.38%. As a result, the status of its investment in SDB changed from an interest in an associate to an investment in subsidiary. As a result of this transaction, Ping An recognised a re-measurement loss; HSBC’s share of this re-measurement loss was US$48m.
In December 2012 approximately 20.8% of HSBC’s holding in Ping An was disposed of. Following the disposal, HSBC no longer has significant influence over Ping An and has ceased to account for Ping An as an associate. For further details on investment in Ping An, see Note 26.
The statutory accounting reference date of BoCom, Ping An and Industrial Bank is 31 December. For the year ended 31 December 2012, these companies were included on the basis of financial statements made up for the twelve months to 30 September 2012, taking into account changes in the subsequent period from 1 October 2012 to 31 December 2012 that would have materially affected their results.
HSBC acquired 15% of Vietnam Technological & Commercial Joint Stock Bank in October 2007. This investment was equity accounted from that date due to HSBC’s representation on the Board of Directors and involvement in the Technical Support and Assistance Agreement. In December 2007, as a result of a rights issue in which HSBC did not
461
Table of Contents
HSBC HOLDINGS PLC
Notes on the Financial Statements(continued)
participate, HSBC’s equity interest was diluted to 14.44%. In September 2008, HSBC increased its equity interest to 20%. HSBC’s equity interest has been subsequently diluted to below 20% due to the issue of shares by the associate to its own employees.
Joint ventures
Principal interests in joint ventures
| At 31 December 2012 | ||||||||||||||||
Country of incorporation | Principal activity | HSBC’s interest capital | Issued equity capital | |||||||||||||
HSBC Saudi Arabia Limited | Saudi Arabia | Investment banking | 49.00% | SR500m | ||||||||||||
Vaultex UK Limited | England | Cash management | 50.00% | £10m | ||||||||||||
Hana HSBC Life Insurance Co., Ltd | South Korea | Insurance manufacturing | 49.99% | KRW110,201m | ||||||||||||
Canara HSBC Oriental Bank of Commerce Life Insurance Company Limited | India | Insurance manufacturing | 26.00% | INR9,500m | ||||||||||||
Summarised aggregate financial information on joint ventures
| At 31 December | ||||||||||
2012 US$m | 2011 US$m | |||||||||
HSBC’s share of: | ||||||||||
– current assets | 1,964 | 1,556 | ||||||||
– non-current assets | 202 | 196 | ||||||||
– current liabilities | 924 | 747 | ||||||||
– non-current liabilities | 961 | 715 | ||||||||
– income | 347 | 383 | ||||||||
– expenses | 311 | 339 | ||||||||
In December 2011, following the issue of shares by HSBC Saudi Arabia Limited to a third party, HSBC’s holding was diluted from 60% to 49% and a dilution gain of US$27m was recognised in ‘Other operating income’.
Associates and joint ventures
Movements in investments in associates and joint ventures
2012 US$m | 2011 US$m | |||||||||
At 1 January | 20,399 | 17,198 | ||||||||
Additions | 1,804 | 90 | ||||||||
Disposals | (7,580 | ) | (25 | ) | ||||||
Share of results | 3,557 | 3,264 | ||||||||
Dividends | (489 | ) | (304 | ) | ||||||
Exchange differences | 60 | 681 | ||||||||
Share of other comprehensive income/(expense) of associates and joint ventures | 311 | (710 | ) | |||||||
Other movements | (228 | ) | 205 | |||||||
At 31 December | 17,834 | 20,399 | ||||||||
Goodwill included in carrying amount of associates and joint ventures
2012 US$m | 2011 US$m | |||||||||
Gross amount | ||||||||||
At 1 January | 1,551 | 1,518 | ||||||||
Disposals | (874 | ) | ||||||||
Exchange differences | 3 | 57 | ||||||||
Other changes | (10 | ) | (24 | ) | ||||||
At 31 December1 | 670 | 1,551 | ||||||||
| 1 | Includes the carrying amount of goodwill arising from joint ventures of US$30m (2011: US$31m). |
462
Table of Contents
HSBC HOLDINGS PLC
Notes on the Financial Statements(continued)
| 23 | Goodwill and intangible assets |
| At 31 December | ||||||||||
2012 US$m | 2011 US$m | |||||||||
Goodwill | 21,390 | 21,338 | ||||||||
Present value of in-force long-term insurance business (‘PVIF’)1 | 4,847 | 4,092 | ||||||||
Other intangible assets | 3,616 | 3,604 | ||||||||
| 29,853 | 29,034 | |||||||||
| 1 | Disclosures on PVIF are provided on page 243. |
Goodwill
Reconciliation of goodwill
| Europe | Hong Kong | Rest of Pacific | MENA | North America | Latin America | Total | ||||||||||||||||||||||||||||||||||
| US$m | US$m | US$m | US$m | US$m | US$m | US$m | ||||||||||||||||||||||||||||||||||
Gross amount | ||||||||||||||||||||||||||||||||||||||||
At 1 January 2012 | 14,433 | 124 | 1,063 | 63 | 8,747 | 3,765 | 28,195 | |||||||||||||||||||||||||||||||||
Disposals | (2 | ) | (4 | ) | (5 | ) | – | – | (21 | ) | (32 | ) | ||||||||||||||||||||||||||||
Exchange differences | 229 | (6 | ) | (38 | ) | (3 | ) | – | 23 | 205 | ||||||||||||||||||||||||||||||
Reclassified to held for sale | – | – | – | – | (408 | ) | (121 | ) | (529 | ) | ||||||||||||||||||||||||||||||
At 31 December 2012 | 14,660 | 114 | 1,020 | 60 | 8,339 | 3,646 | 27,839 | |||||||||||||||||||||||||||||||||
Accumulated impairment losses | ||||||||||||||||||||||||||||||||||||||||
At 1 January 2012 | – | – | – | – | (6,857 | ) | – | (6,857 | ) | |||||||||||||||||||||||||||||||
Reclassified to held for sale | – | – | – | – | 408 | – | 408 | |||||||||||||||||||||||||||||||||
At 31 December 2012 | – | – | – | – | (6,449 | ) | – | (6,449 | ) | |||||||||||||||||||||||||||||||
Net carrying amount at 31 December 2012 | 14,660 | 114 | 1,020 | 60 | 1,890 | 3,646 | 21,390 | |||||||||||||||||||||||||||||||||
Gross amount | ||||||||||||||||||||||||||||||||||||||||
At 1 January 2011 | 14,885 | 124 | 1,115 | 65 | 12,465 | 4,316 | 32,970 | |||||||||||||||||||||||||||||||||
Disposals | (3 | ) | – | – | – | – | (46 | ) | (49 | ) | ||||||||||||||||||||||||||||||
Exchange differences | (449 | ) | – | (35 | ) | (2 | ) | (1 | ) | (272 | ) | (759 | ) | |||||||||||||||||||||||||||
Reclassified to held for sale | – | – | – | – | (3,717 | ) | (231 | ) | (3,948 | ) | ||||||||||||||||||||||||||||||
Other changes | – | – | (17 | ) | – | – | (2 | ) | (19 | ) | ||||||||||||||||||||||||||||||
At 31 December 2011 | 14,433 | 124 | 1,063 | 63 | 8,747 | 3,765 | 28,195 | |||||||||||||||||||||||||||||||||
Accumulated impairment losses | ||||||||||||||||||||||||||||||||||||||||
At 1 January 2011 | – | – | – | – | (10,564 | ) | – | (10,564 | ) | |||||||||||||||||||||||||||||||
Reclassified to held for sale | – | – | – | – | 3,707 | – | 3,707 | |||||||||||||||||||||||||||||||||
At 31 December 2011 | – | – | – | – | (6,857 | ) | – | (6,857 | ) | |||||||||||||||||||||||||||||||
Net carrying amount at 31 December 2011 | 14,433 | 124 | 1,063 | 63 | 1,890 | 3,765 | 21,338 | |||||||||||||||||||||||||||||||||
Impairment testing
Timing of impairment testing
HSBC’s impairment test in respect of goodwill allocated to each cash-generating unit (‘CGU’) is performed as at 1 July each year. In line with the accounting policy set out in Note 2(p), goodwill is also retested for impairment whenever there is an indication that it may be impaired. For the purpose of impairment testing, the Group’s CGUs are based on geographical regions subdivided by global business. The CGUs represent the lowest level at which goodwill is monitored for internal management purposes. The GB&M-Europe CGU experienced significantly reduced profitability in the second half of 2012 and was retested for impairment as at 31 December 2012. For other CGUs there was no indication of impairment in the period to 31 December 2012 and therefore goodwill has not been retested since 1 July 2012.
463
Table of Contents
HSBC HOLDINGS PLC
Notes on the Financial Statements(continued)
Basis of the recoverable amount – value in use or fair value less costs to sell
The recoverable amount of all CGUs to which goodwill has been allocated was equal to its VIU at each respective testing date for 2011 and 2012.
For each significant CGU, the VIU is calculated by discounting management’s cash flow projections for the CGU. The discount rate used is based on the cost of capital HSBC allocates to investments in the countries within which the CGU operates. The long-term growth rate is used to extrapolate the cash flows in perpetuity because of the long-term perspective within the Group of the business units making up the CGUs. In 2012, management’s cash flow projections until the end of 2014 were used.
Key assumptions in VIU calculation and management’s approach to determining the values assigned to each key assumption
| 2012 | 2011 | |||||||||||||||||||||||||||||
Goodwill at 1 July 2012 US$m | Discount % | Nominal growth rate beyond cash flow projections % | Goodwill at 1 July 2011 | Discount % | Nominal growth rate beyond cash flow projections % | |||||||||||||||||||||||||
Cash-generating unit | ||||||||||||||||||||||||||||||
Retail Banking and Wealth Management – Europe | 4,054 | 10.0 | 3.9 | 4,794 | 10.0 | 4.7 | ||||||||||||||||||||||||
Commercial Banking – Europe | 2,968 | 10.2 | 3.7 | 3,574 | 10.1 | 4.5 | ||||||||||||||||||||||||
Global Private Banking – Europe | 4,139 | 9.1 | 3.2 | 4,456 | 10.0 | 4.3 | ||||||||||||||||||||||||
Global Banking and Markets – Europe | 3,016 | 10.2 | 3.5 | 3,139 | 10.2 | 4.4 | ||||||||||||||||||||||||
Retail Banking and Wealth Management – Latin America | 1,994 | 15.3 | 8.7 | 2,537 | 16.0 | 9.3 | ||||||||||||||||||||||||
Total goodwill in the CGUs listed above | 16,171 | 18,500 | ||||||||||||||||||||||||||||
At 1 July 2012, aggregate goodwill of US$4,741m (1 July 2011: US$5,091m) had been allocated to CGUs that were not considered individually significant. These CGUs do not carry on their balance sheets any significant intangible assets with indefinite useful lives, other than goodwill.
Nominal long-term growth rate: this growth rate reflects GDP and inflation for the countries within which the CGU operates. The rates are based on IMF forecast growth rates as these rates are regarded as the most relevant estimate of likely future trends. The rates used for 2011 and 2012 do not exceed the long-term growth rate for the countries within which the CGU operates.
Discount rate: the discount rate used to discount the cash flows is based on the cost of capital assigned to each CGU, which is derived using a Capital Asset Pricing Model (‘CAPM’). The CAPM depends on inputs reflecting a number of financial and economic variables including the risk-free rate and a premium to reflect the inherent risk of the business being evaluated. These variables are based on the market’s assessment of the economic variables and management’s judgement. In addition, for the purposes of testing goodwill for impairment, management supplements this process by comparing the discount rates derived using the internally generated CAPM with cost of capital rates produced by external sources. HSBC uses externally-sourced cost of capital rates where, in management’s judgement, those rates reflect more accurately the current market and economic conditions. For 2012 and 2011, internal costs of capital rates were consistent with externally-sourced rates.
Management’s judgement in estimating the cash flows of a CGU: the cash flow projections for each CGU are based on plans approved by the Group Management Board. The key assumptions in addition to the discount rate and nominal long-term growth rate for each significant CGU are discussed below.
Retail Banking and Wealth Management – Europe and Commercial Banking – Europe: the assumptions included in the cash flow projections for RBWM – Europe and CMB – Europe reflect the economic environment and financial outlook of the European countries within these two CGUs. Key assumptions include the level of interest rates and the level and change in unemployment rates. While current economic conditions in Europe continue to be challenging, management’s cash flow projections are based primarily on these prevailing conditions. Risks include a further recession in the UK and an uncertain regulatory environment. RBWM – Europe specifically, is sensitive to further customer remediation costs in relation to PPI. Based on the conditions at the balance sheet date, management
464
Table of Contents
HSBC HOLDINGS PLC
Notes on the Financial Statements(continued)
determined that a reasonably possible change in any of the key assumptions described above would not cause an impairment to be recognised in respect of RBWM – Europe or CMB – Europe.
Global Private Banking – Europe: the revenues in GPB – Europe are predominately generated through HSBC’s client relationships. The cash flow forecast reflects current economic conditions and key assumptions include the level of interest rates and client risk appetite. Further economic deterioration could result in a decrease in assets under management and a reduction in fee and trading income through increased client risk aversion. Based on the conditions at the balance sheet date, management determined that a reasonably possible change in any of the key assumptions described above would not cause an impairment to be recognised in respect of GPB – Europe.
Global Banking and Markets – Europe: the key assumption included in the cash flow projection for GB&M – Europe is that European markets will continue to recover during 2013. Accordingly, European revenues are forecast to recover in 2013 and this recovery is assumed to continue over the projection period into 2014. Our ability to achieve the forecast cash flows for GB&M – Europe could be adversely impacted by regulatory change during the forecast period including but not limited to the extent that the recommendations set out in the Final Report by the Independent Commission on Banking are implemented.
Based on management’s value in use calculation, GB&M – Europe has an excess of recoverable amount over carrying amount (‘headroom’) of US$2.3bn as at 1 July 2012. Headroom was US$2.3bn as at 31 December 2012 based on goodwill at that point of US$3.1bn. The change in carrying value between 1 July 2012 and 31 December 2012 arises from retranslating goodwill into the presentation currency of the group. The same assumptions were used in the impairment tests as at 1 July 2012 and 31 December 2012. The following changes to the key assumptions used in the value in use calculation would be necessary in order to reduce headroom to nil:
| Key assumption | Change to key assumption to reduce headroom to nil | |
Discount rate | Increase by 64 basis points | |
Nominal growth rate beyond initial cash flow projection | Decrease by 69 basis points | |
Revenue compound annual growth rate | Decrease from 10.3% to 8.3% | |
Retail Banking and Wealth Management – Latin America: the assumptions included in the cash flow projections for RBWM – Latin America reflect the economic environment and financial outlook of the countries within this segment, with Brazil and Mexico being two of the largest countries included within this segment. Key assumptions include the growth in lending and deposit volumes and the credit quality of the loan portfolios. Mexico and Panama in particular are sensitive to economic conditions in the US which could constrain demand. Based on the conditions at the balance sheet date, management determined that a reasonably possible change in any of the key assumptions described above would not cause an impairment to be recognised in respect of RBWM – Latin America.
Other intangible assets
Movement of intangible assets excluding goodwill and the PVIF
Trade names | Mortgage servicing rights | Internally generated software | Purchased software | Customer/ merchant relation- ships | Other | Total | ||||||||||||||||||||||||||||||||||
| US$m | US$m | US$m | US$m | US$m | US$m | US$m | ||||||||||||||||||||||||||||||||||
Cost | ||||||||||||||||||||||||||||||||||||||||
At 1 January 2012 | 60 | 591 | 5,598 | 856 | 1,354 | 454 | 8,913 | |||||||||||||||||||||||||||||||||
Additions1 | 1 | 30 | 765 | 78 | 120 | 48 | 1,042 | |||||||||||||||||||||||||||||||||
Disposals | – | (123 | ) | (32 | ) | (61 | ) | (5 | ) | – | (221 | ) | ||||||||||||||||||||||||||||
Amount written off | – | – | (680 | ) | (21 | ) | (39 | ) | – | (740 | ) | |||||||||||||||||||||||||||||
Exchange differences | – | – | 62 | – | (48 | ) | 12 | 26 | ||||||||||||||||||||||||||||||||
Reclassified to held for sale | – | – | (26 | ) | (15 | ) | (7 | ) | (14 | ) | (62 | ) | ||||||||||||||||||||||||||||
Other changes | – | – | 16 | 78 | (8 | ) | 4 | 90 | ||||||||||||||||||||||||||||||||
At 31 December 2012 | 61 | 498 | 5,703 | 915 | 1,367 | 504 | 9,048 | |||||||||||||||||||||||||||||||||
465
Table of Contents
HSBC HOLDINGS PLC
Notes on the Financial Statements(continued)
Movement of intangible assets excluding goodwill and the PVIF (continued)
Trade names | Mortgage servicing rights US$m | Internally generated software US$m | Purchased software US$m | Customer/ merchant relation- ships US$m | Other US$m | Total US$m | ||||||||||||||||||||||||||||||||||
Accumulated amortisation | ||||||||||||||||||||||||||||||||||||||||
At 1 January 2012 | (51 | ) | (369 | ) | (3,437 | ) | (672 | ) | (649 | ) | (131 | ) | (5,309 | ) | ||||||||||||||||||||||||||
Charge for the year2 | (5 | ) | (78 | ) | (645 | ) | (103 | ) | (127 | ) | (21 | ) | (979 | ) | ||||||||||||||||||||||||||
Impairment | – | – | (63 | ) | (3 | ) | – | (2 | ) | (68 | ) | |||||||||||||||||||||||||||||
Disposals | 2 | 123 | 28 | 53 | 5 | – | 211 | |||||||||||||||||||||||||||||||||
Amount written off | – | – | 680 | 21 | 39 | – | 740 | |||||||||||||||||||||||||||||||||
Exchange differences | – | (2 | ) | (47 | ) | 1 | 15 | (1 | ) | (34 | ) | |||||||||||||||||||||||||||||
Reclassified to held for sale | – | – | 24 | 9 | 5 | 10 | 48 | |||||||||||||||||||||||||||||||||
Other changes | (1 | ) | – | (9 | ) | (41 | ) | 8 | 2 | (41 | ) | |||||||||||||||||||||||||||||
At 31 December 2012 | (55 | ) | (326 | ) | (3,469 | ) | (735 | ) | (704 | ) | (143 | ) | (5,432 | ) | ||||||||||||||||||||||||||
Net carrying amount at 31 December 2012 | 6 | 172 | 2,234 | 180 | 663 | 361 | 3,616 | |||||||||||||||||||||||||||||||||
Cost | ||||||||||||||||||||||||||||||||||||||||
At 1 January 2011 | 68 | 636 | 5,202 | 1,065 | 1,987 | 503 | 9,461 | |||||||||||||||||||||||||||||||||
Additions1 | – | 40 | 1,129 | 102 | 379 | 6 | 1,656 | |||||||||||||||||||||||||||||||||
Disposals | – | (91 | ) | (44 | ) | (102 | ) | (181 | ) | (1 | ) | (419 | ) | |||||||||||||||||||||||||||
Amount written off | – | – | (365 | ) | (133 | ) | – | (2 | ) | (500 | ) | |||||||||||||||||||||||||||||
Exchange differences | (6 | ) | – | (109 | ) | (40 | ) | (79 | ) | (14 | ) | (248 | ) | |||||||||||||||||||||||||||
Reclassified to held for sale | (2 | ) | – | (197 | ) | (22 | ) | (746 | ) | (46 | ) | (1,013 | ) | |||||||||||||||||||||||||||
Other changes | – | 6 | (18 | ) | (14 | ) | (6 | ) | 8 | (24 | ) | |||||||||||||||||||||||||||||
At 31 December 2011 | 60 | 591 | 5,598 | 856 | 1,354 | 454 | 8,913 | |||||||||||||||||||||||||||||||||
Accumulated amortisation | ||||||||||||||||||||||||||||||||||||||||
At 1 January 2011 | (52 | ) | (240 | ) | (2,958 | ) | (848 | ) | (1,143 | ) | (144 | ) | (5,385 | ) | ||||||||||||||||||||||||||
Charge for the year2 | (4 | ) | (215 | ) | (609 | ) | (106 | ) | (212 | ) | (29 | ) | (1,175 | ) | ||||||||||||||||||||||||||
Impairment | – | – | (386 | ) | (3 | ) | – | (1 | ) | (390 | ) | |||||||||||||||||||||||||||||
Disposals | – | 91 | 29 | 100 | 111 | 3 | 334 | |||||||||||||||||||||||||||||||||
Amount written off | – | – | 365 | 133 | – | 2 | 500 | |||||||||||||||||||||||||||||||||
Exchange differences | 3 | – | 44 | 31 | 29 | – | 107 | |||||||||||||||||||||||||||||||||
Reclassified to held for sale | 2 | – | 50 | 18 | 563 | 36 | 669 | |||||||||||||||||||||||||||||||||
Other changes | – | (5 | ) | 28 | 3 | 3 | 2 | 31 | ||||||||||||||||||||||||||||||||
At 31 December 2011 | (51 | ) | (369 | ) | (3,437 | ) | (672 | ) | (649 | ) | (131 | ) | (5,309 | ) | ||||||||||||||||||||||||||
Net carrying amount at 31 December 2011 | 9 | 222 | 2,161 | 184 | 705 | 323 | 3,604 | |||||||||||||||||||||||||||||||||
| 1 | At 31 December 2012, HSBC had no contractual commitments (2011: nil) to acquire intangible assets. |
| 2 | The amortisation charge for the year is recognised within the income statement under ‘Amortisation and impairment of intangible assets’, with the exception of the amortisation of mortgage servicing rights which is recognised in ‘Net fee income’. |
466
Table of Contents
HSBC HOLDINGS PLC
Notes on the Financial Statements(continued)
| 24 | Property, plant and equipment |
| Freehold land and buildings | Long leasehold land and buildings | Short leasehold land and buildings1 | Equipment, fixtures and | Equipment on operating leases | Total3 | |||||||||||||||||||||||||||||
| US$m | US$m | US$m | US$m | US$m | US$m | |||||||||||||||||||||||||||||
Cost or fair value | ||||||||||||||||||||||||||||||||||
At 1 January 2012 | 3,537 | 1,800 | 3,872 | 11,579 | 71 | 20,859 | ||||||||||||||||||||||||||||
Additions at cost4 | 135 | 89 | 209 | 1,016 | 50 | 1,499 | ||||||||||||||||||||||||||||
Fair value adjustments | (35 | ) | 31 | 76 | – | – | 72 | |||||||||||||||||||||||||||
Disposals | (141 | ) | – | (68) | (915) | (14 | ) | (1,138) | ||||||||||||||||||||||||||
Reclassified to held for sale | (10 | ) | (36 | ) | (6) | (70) | – | (122) | ||||||||||||||||||||||||||
Transfers | 59 | (7 | ) | (55) | 3 | – | – | |||||||||||||||||||||||||||
Exchange differences | (59 | ) | 10 | 40 | 195 | 4 | 190 | |||||||||||||||||||||||||||
Other changes | 9 | (23 | ) | – | (148) | – | (162) | |||||||||||||||||||||||||||
At 31 December 2012 | 3,495 | 1,864 | 4,068 | 11,660 | 111 | 21,198 | ||||||||||||||||||||||||||||
Accumulated depreciation and impairment | ||||||||||||||||||||||||||||||||||
At 1 January 2012 | (544 | ) | (332 | ) | (1,181) | (7,909) | (28 | ) | (9,994) | |||||||||||||||||||||||||
Depreciation charge for the year | (72 | ) | (57 | ) | (201) | (1,055) | (12 | ) | (1,397) | |||||||||||||||||||||||||
Disposals | 44 | – | 53 | 844 | 13 | 954 | ||||||||||||||||||||||||||||
Reclassified to held for sale | 13 | 1 | 1 | 27 | – | 42 | ||||||||||||||||||||||||||||
Transfers | (26 | ) | 1 | 22 | 3 | – | – | |||||||||||||||||||||||||||
Impairment losses recognised | (9 | ) | (4 | ) | (11) | (63) | – | (87) | ||||||||||||||||||||||||||
Exchange differences | (8 | ) | (2 | ) | (15) | (137) | (1 | ) | (163) | |||||||||||||||||||||||||
Other changes | (67 | ) | 3 | 12 | 84 | 3 | 35 | |||||||||||||||||||||||||||
At 31 December 2012 | (669 | ) | (390 | ) | (1,320) | (8,206) | (25 | ) | (10,610) | |||||||||||||||||||||||||
Net carrying amount at 31 December 2012 | 2,826 | 1,474 | 2,748 | 3,454 | 86 | 10,588 | ||||||||||||||||||||||||||||
Cost or fair value | ||||||||||||||||||||||||||||||||||
At 1 January 2011 | 3,952 | 1,673 | 4,004 | 12,529 | 53 | 22,211 | ||||||||||||||||||||||||||||
Additions at cost4 | 353 | 114 | 180 | 1,183 | 19 | 1,849 | ||||||||||||||||||||||||||||
Fair value adjustments | (15 | ) | 44 | 89 | – | – | 118 | |||||||||||||||||||||||||||
Disposals | (188 | ) | (19 | ) | (279) | (1,400) | – | (1,886) | ||||||||||||||||||||||||||
Reclassified to held for sale | (424 | ) | (19 | ) | (158) | (260) | – | (861) | ||||||||||||||||||||||||||
Transfers | (12 | ) | (35 | ) | 25 | 10 | – | (12) | ||||||||||||||||||||||||||
Exchange differences | (203 | ) | 1 | 15 | (395) | (1 | ) | (583) | ||||||||||||||||||||||||||
Other changes | 74 | 41 | (4) | (88) | – | 23 | ||||||||||||||||||||||||||||
At 31 December 2011 | 3,537 | 1,800 | 3,872 | 11,579 | 71 | 20,859 | ||||||||||||||||||||||||||||
Accumulated depreciation and impairment | ||||||||||||||||||||||||||||||||||
At 1 January 2011 | (586 | ) | (307 | ) | (1,268) | (8,506) | (23 | ) | (10,690) | |||||||||||||||||||||||||
Depreciation charge for the year | (88 | ) | (51 | ) | (211) | (1,157) | (9 | ) | (1,516) | |||||||||||||||||||||||||
Disposals | 60 | 2 | 262 | 1,319 | – | 1,643 | ||||||||||||||||||||||||||||
Reclassified to held for sale | 133 | 13 | 80 | 138 | – | 364 | ||||||||||||||||||||||||||||
Transfers | 5 | 35 | (34) | (6) | – | – | ||||||||||||||||||||||||||||
Impairment losses recognised | (13 | ) | – | (16) | (25) | – | (54) | |||||||||||||||||||||||||||
Exchange differences | 18 | (1 | ) | 8 | 260 | 1 | 286 | |||||||||||||||||||||||||||
Other changes | (73 | ) | (23 | ) | (2) | 68 | 3 | (27) | ||||||||||||||||||||||||||
At 31 December 2011 | (544 | ) | (332 | ) | (1,181) | (7,909) | (28 | ) | (9,994) | |||||||||||||||||||||||||
Net carrying amount at 31 December 2011 | 2,993 | 1,468 | 2,691 | 3,670 | 43 | 10,865 | ||||||||||||||||||||||||||||
| 1 | Including assets held on finance leases with a net book value of US$5m (2011: US$7m). |
| 2 | Including assets held on finance leases with a net book value of US$182m (2011: US$210m). |
| 3 | Including assets with a net book value of US$39m (2011: US$33m) pledged as security for liabilities. |
| 4 | At 31 December 2012, HSBC had US$412m (2011: US$517m) of contractual commitments to acquire property, plant and equipment. |
Leasehold land and buildings
Leasehold land and buildings are considered to be held under finance lease contracts where the value of the land cannot reliably be separated from the value of the lease and the respective contracts do not meet the criteria for classification as operating leases. Included within ‘Short leasehold land and buildings’ are the following amounts in respect of assets classed as improvements to buildings, which are carried at depreciated historical cost:
467
Table of Contents
HSBC HOLDINGS PLC
Notes on the Financial Statements(continued)
Leasehold land and buildings
| 2012 | 2011 | |||||||||||||||||||||
Cost US$m | Accumulated depreciation US$m | Cost US$m | Accumulated depreciation US$m | |||||||||||||||||||
At 1 January | 1,669 | (751 | ) | 1,944 | (933 | ) | ||||||||||||||||
Additions | 119 | – | 171 | – | ||||||||||||||||||
Disposals | (65 | ) | 47 | (269 | ) | 262 | ||||||||||||||||
Depreciation charge for the year | – | (133 | ) | – | (139 | ) | ||||||||||||||||
Impairment loss recognised | – | (6 | ) | – | (15 | ) | ||||||||||||||||
Exchange differences | 28 | (13 | ) | (13 | ) | 2 | ||||||||||||||||
Reclassified as held for sale | (10 | ) | (1 | ) | (154 | ) | 73 | |||||||||||||||
Other changes | (23 | ) | (9 | ) | (10 | ) | (1 | ) | ||||||||||||||
At 31 December | 1,718 | (866 | ) | 1,669 | (751 | ) | ||||||||||||||||
Net carrying amount at 31 December | 852 | 918 | ||||||||||||||||||||
Investment properties
Movement on the fair value of investment properties
| ||||||||||||||||||||||
Freehold land and buildings US$m | Long leasehold land and buildings US$m | Short leasehold land and buildings US$m | Total US$m | |||||||||||||||||||
Fair value | ||||||||||||||||||||||
At 1 January 2012 | 745 | 192 | 402 | 1,339 | ||||||||||||||||||
Additions at cost | 9 | – | – | 9 | ||||||||||||||||||
Fair value adjustments | (35 | ) | 31 | 76 | 72 | |||||||||||||||||
Reclassified to held for sale | – | (29 | ) | – | (29 | ) | ||||||||||||||||
Exchange differences | (64 | ) | – | 1 | (63 | ) | ||||||||||||||||
Other changes | (3 | ) | 1 | 8 | 6 | |||||||||||||||||
At 31 December 2012 | 652 | 195 | 487 | 1,334 | ||||||||||||||||||
Fair value | ||||||||||||||||||||||
At 1 January 2011 | 667 | 156 | 310 | 1,133 | ||||||||||||||||||
Additions at cost | 242 | – | – | 242 | ||||||||||||||||||
Fair value adjustments | (15 | ) | 44 | 89 | 118 | |||||||||||||||||
Disposals | (47 | ) | (17 | ) | – | (64 | ) | |||||||||||||||
Exchange differences | (22 | ) | 1 | 1 | (20 | ) | ||||||||||||||||
Other changes | (80 | ) | 8 | 2 | (70 | ) | ||||||||||||||||
At 31 December 2011 | 745 | 192 | 402 | 1,339 | ||||||||||||||||||
Investment properties are valued on a market value basis as at 31 December each year by independent professional valuers who have recent experience in the location and type of properties. Investment properties in Hong Kong, the Macau Special Administrative Region and mainland China, which represent more than 51% by value of HSBC’s investment properties subject to revaluation, were valued by DTZ Debenham Tie Leung Limited whose valuers are members of the Hong Kong Institute of Surveyors. Properties in other countries, which represent 49% by value of HSBC’s investment properties, were valued by different independent professionally qualified valuers.
HSBC Holdings had no investment properties at 31 December 2012 or 2011.
HSBC properties leased to customers
HSBC properties leased to customers included US$694m at 31 December 2012 (2011: US$618m) let under operating leases, net of accumulated depreciation of US$16m (2011: US$12m). None was held by HSBC Holdings.
At 31 December 2012, the classification of land and buildings in Hong Kong in accordance with Hong Kong Companies Ordinance requirements was freehold nil (2011: nil), long leasehold US$1,319m (2011: US$1,363m), medium leasehold US$1,600m (2011: US$1,484m) and short leasehold US$3m (2011: US$4m).
468
Table of Contents
HSBC HOLDINGS PLC
Notes on the Financial Statements(continued)
| 25 | Investments in subsidiaries |
Principal subsidiaries of HSBC Holdings
| At 31 December 2012 | ||||||||||||||
Country of incorporation or registration | HSBC’s interest in equity capital % | Issued equity capital | Share class | |||||||||||
Europe | ||||||||||||||
HSBC Asset Finance (UK) Limited | England | 100 | £265m | Ordinary £1 | ||||||||||
HSBC Bank A.S. | Turkey | 100 | TRL652m | A–Common TRL1 B–Common TRL1 | ||||||||||
HSBC Bank Malta p.l.c. | Malta | 70.03 | €88m | Ordinary €0.30 | ||||||||||
HSBC Bank plc | England | 100 | £797m | Ordinary £1 Preferred Ordinary £1 Series 2 Third Dollar Preference US$0.01 Third Dollar Preference US$0.01 | ||||||||||
HSBC France | France | 99.99 | €337m | Shares €5.00 | ||||||||||
HSBC Bank International Limited | Jersey | 100 | £1m | Ordinary £1 | ||||||||||
HSBC Life (UK) Limited | England | 100 | £94m | Ordinary £1 | ||||||||||
HSBC Private Banking Holdings (Suisse) SA | Switzerland | 100 | CHF1,363m | Ordinary CHF1,000 | ||||||||||
HSBC Trinkaus & Burkhardt AG | Germany | 80.62 | €28m | Shares of no par value | ||||||||||
Marks and Spencer Retail Financial Services Holdings Limited | England | 100 | £67m | Ordinary £1 | ||||||||||
Hong Kong | ||||||||||||||
Hang Seng Bank Limited1 | Hong Kong | 62.14 | HK$9,559m | Ordinary HK$5.00 | ||||||||||
HSBC Insurance (Asia) Limited | Hong Kong | 100 | HK$2,798m | Ordinary HK$1,000 | ||||||||||
HSBC Life (International) Limited | Bermuda | 100 | HK$2,778m | Ordinary HK$1.00 | ||||||||||
The Hongkong and Shanghai Banking Corporation Limited | Hong Kong | 100 | HK$58,969m | Ordinary HK$2.50 CIP2 US$1.00 CRP3 US$1.00 NIP4 US$1.00 | ||||||||||
Rest of Asia-Pacific | ||||||||||||||
HSBC Bank Australia Limited | Australia | 100 | A$751m | Ordinary no par value | ||||||||||
| A$60m | Pref shares of no par value | |||||||||||||
HSBC Bank (China) Company Limited | PRC | 5 | 100 | RMB12,400m | Ordinary CNY1.00 | |||||||||
HSBC Bank Malaysia Berhad | Malaysia | 100 | RM115m | Ordinary RM0.50 | ||||||||||
Middle East and North Africa | ||||||||||||||
HSBC Bank Middle East Limited | Jersey | 100 | US$931m | Ordinary US$1.00 CRP3 US$1.00 | ||||||||||
HSBC Bank Egypt S.A.E. | Egypt | 94.53 | EGP2,079m | Ordinary EGP84.00 | ||||||||||
North America | ||||||||||||||
HSBC Bank Bermuda Limited | Bermuda | 100 | BMD30m | Common BMD1.00 | ||||||||||
HSBC Bank Canada | Canada | 100 | C$1,571m | Class 1 Pref of NPV6 Class 2 Pref of NPV6 Common of NPV6 | ||||||||||
HSBC Bank USA, N.A. | US | 100 | US$2m | Common US$100 | ||||||||||
HSBC Finance Corporation | US | 100 | –7 | Common US$0.01 | ||||||||||
HSBC Securities (USA) Inc. | US | 100 | –7 | Common US$0.05 | ||||||||||
Latin America | ||||||||||||||
HSBC Bank Argentina S.A. | Argentina | 99.99 | ARS1,244m | Ordinary–A ARS1.00 Ordinary–B ARS1.00 | ||||||||||
HSBC Bank Brasil S.A. – Banco Múltiplo | Brazil | 100 | BRL5,994m | Shares of no par value | ||||||||||
HSBC Mexico, S.A., Institución de Banca Múltiple, Grupo Financiero HSBC | Mexico | 99.99 | MXN5,261m | Ordinary MXN2.00 | ||||||||||
HSBC Bank (Panama) S.A. | Panama | 100 | US$10m | Ordinary PAB1.00 | ||||||||||
| 1 Listed in Hong Kong. | 5 People’s Republic of China. | |
| 2 Cumulative Irredeemable Preference shares. | 6 Preference shares of nil par value. | |
| 3 Cumulative Redeemable Preference shares. | 7 Issued equity capital is less than US$1m. | |
| 4 Non-cumulative Irredeemable Preference shares. |
Details of the debt, subordinated debt and preference shares issued by the principal subsidiaries to parties external to the Group are included in the Notes 29 ‘Debt securities in issue’, 33 ‘Subordinated liabilities’ and 37 ‘Non-controlling interests’, respectively.
All the above subsidiaries are included in the HSBC consolidated financial statements.
469
Table of Contents
HSBC HOLDINGS PLC
Notes on the Financial Statements(continued)
Details of all HSBC subsidiaries will be annexed to the next Annual Return of HSBC Holdings filed with the UK Registrar of Companies.
All the above make their financial statements up to 31 December except for HSBC Bank Argentina S.A., whose financial statements are made up to 30 June annually.
The principal countries of operation are the same as the countries of incorporation except for HSBC Bank Middle East Limited which operates mainly in the Middle East and North Africa and HSBC Life (International) Limited which operates mainly in Hong Kong.
In February 2013, we announced an agreement to sell HSBC Bank (Panama) S.A. to Bancolombia S.A. For further details see Note 45.
During 2012 and 2011, none of the Group’s subsidiaries experienced significant restrictions on paying dividends or repaying loans and advances.
Acquisitions
In June 2012, HSBC merged its operations in Oman with the Oman International Bank S.A.O.G. for total consideration of US$0.2bn. HSBC owns 51% of the combined entity, HSBC Bank Oman S.A.O.G., which had net assets of US$0.8bn immediately following the merger.
In October 2012, HSBC acquired the onshore retail and commercial banking business of Lloyds Banking Group in the United Arab Emirates for a total consideration of US$0.1bn. As a result of the transaction HSBC acquired net assets of US$0.2bn.
SPEs consolidated by HSBC where HSBC owns less than 50% of the voting rights
Carrying value of total consolidated assets | Nature of SPE | |||||||||||||
2012 US$bn | 2011 US$bn | |||||||||||||
Barion Funding Limited | 3.9 | 3.8 | Securities investment conduit | |||||||||||
Bryant Park Funding LLC | 0.9 | 2.8 | Conduit | |||||||||||
HSBC Home Equity Loan Corporation I | 2.0 | 2.1 | Securitisation | |||||||||||
HSBC Home Equity Loan Corporation II | 2.2 | 2.4 | Securitisation | |||||||||||
HSBC Receivables Funding, Inc. II | – | 1.9 | Securitisation | |||||||||||
Malachite Funding Limited | 3.4 | 3.6 | Securities investment conduit | |||||||||||
Mazarin Funding Limited | 8.0 | 8.0 | Securities investment conduit | |||||||||||
Metrix Funding Ltd | – | 0.7 | Securitisation | |||||||||||
Metrix Securities plc | – | 0.4 | Securitisation | |||||||||||
Regency Assets Limited | 10.1 | 7.5 | Conduit | |||||||||||
Solitaire Funding Ltd | 11.3 | 12.5 | Securities investment conduit | |||||||||||
In addition to the above, HSBC consolidates a number of individually insignificant SPEs with total assets of US$17bn. For further details, see Note 42.
In each of the above cases, HSBC has less than 50% of the voting rights, but consolidates because it has the majority of risks and rewards of ownership of the SPE, or the substance of the relationship with the SPE is such that its activities are conducted on behalf of HSBC according to its specific business needs so that HSBC obtains benefit from the SPE’s operation. The consolidation of SPEs sponsored by HSBC is discussed on page 384.
470
Table of Contents
HSBC HOLDINGS PLC
Notes on the Financial Statements(continued)
| 26 | Assets held for sale and other assets |
Assets held for sale
2012 US$m | 2011 US$m | |||||||||
Disposal groups | 5,797 | 38,903 | ||||||||
Non-current assets held for sale: | 13,472 | 655 | ||||||||
– property, plant and equipment | 500 | 589 | ||||||||
– investment in Ping An | 8,168 | – | ||||||||
– loans and advances to customers | 3,893 | – | ||||||||
– other | 911 | 66 | ||||||||
| ||||||||||
| 19,269 | 39,558 | |||||||||
Disposal groups
At 31 December 2012, the following businesses represented the majority of disposal groups held for sale:
| • | Latin American businesses, which include banking operations in Peru, Colombia and Paraguay. |
| • | US life insurance businesses. |
The following significant businesses that were held for sale at 31 December 2011 were sold in 2012:
| • | The sale of the US Card and Retail Services business that was completed on 1 May 2012 with a gain on disposal of US$3.1bn. |
| • | The sale of 195 US branches were completed in several stages in 2012. 138 branches were sold on 18 May 2012, recognising a gain of US$661m. The remaining branches were sold in the third quarter of 2012 with a gain of US$203m. |
| • | Central American businesses, which include banking operations in Costa Rica, El Salvador and Honduras were sold in November and December 2012 with a loss on disposal of US$62m. |
The major classes of assets and associated liabilities of disposal groups held for sale were as follows:
| At 31 December 2012 | ||||||||||||||||||||||
South America businesses US$m | US life insurance businesses US$m | Other US$m | Total US$m | |||||||||||||||||||
Assets of disposal groups held for sale | ||||||||||||||||||||||
Trading assets | 4 | – | – | 4 | ||||||||||||||||||
Loans and advances to banks | 344 | – | 164 | 508 | ||||||||||||||||||
Loans and advances to customers | 1,929 | – | 302 | 2,231 | ||||||||||||||||||
Financial investments | 364 | 1,396 | 229 | 1,989 | ||||||||||||||||||
Prepayments and accrued income | 27 | 15 | 5 | 47 | ||||||||||||||||||
Goodwill and intangible assets | 33 | 53 | 60 | 146 | ||||||||||||||||||
Other assets of disposal groups | 622 | 109 | 141 | 872 | ||||||||||||||||||
Total assets | 3,323 | 1,573 | 901 | 5,797 | ||||||||||||||||||
Liabilities of disposal groups held for sale(Note 30) | ||||||||||||||||||||||
Deposits by banks | 26 | – | 10 | 36 | ||||||||||||||||||
Customer accounts | 2,154 | – | 836 | 2,990 | ||||||||||||||||||
Debt securities in issue | 566 | – | (1 | ) | 565 | |||||||||||||||||
Liabilities under insurance contracts | – | 998 | 162 | 1,160 | ||||||||||||||||||
Other liabilities of disposal groups | 132 | 39 | 96 | 267 | ||||||||||||||||||
Total liabilities | 2,878 | 1,037 | 1,103 | 5,018 | ||||||||||||||||||
Net unrealised losses recognised in ‘other operating income’ as a result of reclassification to held for sale | (96 | ) | – | – | (96 | ) | ||||||||||||||||
Expected date of completion | Q4 2013 | Q1 2013 | ||||||||||||||||||||
Operating segment | Latin America | North America | ||||||||||||||||||||
471
Table of Contents
HSBC HOLDINGS PLC
Notes on the Financial Statements(continued)
Property, plant and equipment
The property, plant and equipment classified as held for sale is the result of repossession of property that had been pledged as collateral by customers. Substantially all of these assets are disposed of within 12 months of acquisition. The majority arose within the North America operating segment.
Investment in Ping An
On 5 December 2012, we entered into an agreement to dispose of our entire 15.57% shareholding in Ping An for US$9.4bn. The disposal was carried out in two tranches, an initial tranche of 256,694,218 shares representing 3.24% of Ping An’s issued share capital, then the remaining 976,121,395 shares representing 12.33% of Ping An’s issued share capital. The selling price for both the tranches was fixed at HK$59 per share.
The first tranche of shares was disposed on 7 December 2012. Following this disposal, HSBC no longer had significant influence over Ping An and ceased to account for it as an associate. The gain from the disposal of the first tranche of shares and the gain from the consequent discontinuance of associate accounting for the remaining 12.33% shareholding in Ping An totalled US$3bn, and was recognised in the income statement. The remaining 12.33% shareholding was recognised as an available-for-sale investment, measured initially at fair value on the date of discontinuance of associate accounting, and thereafter carried at fair value with unrealised gains or losses recorded in other comprehensive income.
The fixing of the sale price gave rise to a contingent forward sale contract, the fair value of which at year end was based on the difference between the agreed sale price and the market price for the shares, adjusted for an assessment of the probability of the transaction being completed. The adverse fair value of this contract was US$553m at 31 December 2012, recorded in net trading income.
At 31 December 2012, the fair value of our 12.33% shareholding in Ping An was US$8.2bn included within ‘Assets held for sale’ above, with US$737m accumulated unrealised gains in other comprehensive income which arose after the date of the agreement and represent the difference between Ping An’s share price at the year-end and the share price on the date of recognition as an available-for-sale investment.
The sale of the second tranche was completed on 6 February 2013 where the net impact of the change in fair value of the contingent forward sale contract to the point of delivery of the shares and the derecognition of the available-for-sale investment resulted in an income statement gain before tax in 2013 of US$553m.
Loans and advances to customers
Loans and advances to customers held for sale at 31 December 2012 include US personal loan balances of US$3.4bn, net of impairment allowances.
Other assets
| At 31 December | ||||||||||
2012 US$m | 2011 US$m | |||||||||
Bullion | 26,508 | 19,824 | ||||||||
Reinsurers’ share of liabilities under insurance contracts (Note 31) | 1,407 | 1,801 | ||||||||
Endorsements and acceptances | 12,032 | 11,010 | ||||||||
Retirement benefit assets | 2,846 | 2,497 | ||||||||
Other accounts | 11,923 | 13,567 | ||||||||
| 54,716 | 48,699 | |||||||||
472
Table of Contents
HSBC HOLDINGS PLC
Notes on the Financial Statements(continued)
| 27 | Trading liabilities |
| At 31 December | ||||||||||
2012 US$m | 2011 US$m | |||||||||
Deposits by banks | 61,686 | 47,506 | ||||||||
Customer accounts | 150,705 | 123,344 | ||||||||
Other debt securities in issue (Note 29) | 31,198 | 29,987 | ||||||||
Other liabilities – net short positions in securities | 60,974 | 64,355 | ||||||||
| �� | 304,,563 | 265,192 | ||||||||
At 31 December 2012, the cumulative amount of change in fair value attributable to changes in HSBC credit risk was a loss of US$29m (2011: gain of US$599m).
Deposits by banks held for trading
| At 31 December | ||||||||||
2012 US$m | 2011 US$m | |||||||||
Repos | 26,740 | 16,687 | ||||||||
Settlement accounts | 7,647 | 7,221 | ||||||||
Stock lending | 4,523 | 2,821 | ||||||||
Other | 22,776 | 20,777 | ||||||||
| 61,686 | 47,506 | |||||||||
Customer accounts held for trading
| At 31 December | ||||||||||
2012 US$m | 2011 US$m | |||||||||
Repos | 103,483 | 70,151 | ||||||||
Settlement accounts | 9,461 | 6,909 | ||||||||
Stock lending | 2,295 | 1,774 | ||||||||
Other | 35,466 | 44,510 | ||||||||
| 150,705 | 123,344 | |||||||||
| 28 | Financial liabilities designated at fair value |
HSBC
| At 31 December | ||||||||||
2012 US$m | 2011 US$m | |||||||||
Deposits by banks and customer accounts | 496 | 517 | ||||||||
Liabilities to customers under investment contracts | 12,456 | 11,399 | ||||||||
Debt securities in issue (Note 29) | 53,209 | 52,197 | ||||||||
Subordinated liabilities (Note 33) | 16,863 | 17,503 | ||||||||
Preferred securities (Note 33) | 4,696 | 4,108 | ||||||||
| 87,720 | 85,724 | |||||||||
The carrying amount at 31 December 2012 of financial liabilities designated at fair value was US$7,032m more than the contractual amount at maturity (2011: US$1,377m more). The cumulative amount of the change in fair value attributable to changes in credit risk was a loss of US$88m (2011: gain of US$5,118m).
473
Table of Contents
HSBC HOLDINGS PLC
Notes on the Financial Statements(continued)
HSBC Holdings
| At 31 December | ||||||||||
2012 US$m | 2011 US$m | |||||||||
Debt securities in issue (Note 29): | ||||||||||
– owed to third parties | 8,577 | 5,753 | ||||||||
Subordinated liabilities (Note 33): | ||||||||||
– owed to third parties | 10,358 | 11,443 | ||||||||
– owed to HSBC undertakings | 4,260 | 3,955 | ||||||||
| 23,195 | 21,151 | |||||||||
The carrying amount at 31 December 2012 of financial liabilities designated at fair value was US$3,199m more than the contractual amount at maturity (2011: US$722m more). The cumulative amount of the change in fair value attributable to changes in credit risk was a loss of US$164m (2011: gain of US$2,096m).
| 29 | Debt securities in issue |
| At 31 December | ||||||||||
2012 US$m | 2011 US$m | |||||||||
Bonds and medium-term notes | 155,661 | 151,367 | ||||||||
Other debt securities in issue | 48,207 | 61,830 | ||||||||
| 203,868 | 213,197 | |||||||||
Of which debt securities in issue reported as: | ||||||||||
– trading liabilities (Note 27) | (31,198 | ) | (29,987 | ) | ||||||
– financial liabilities designated at fair value (Note 28) | (53,209 | ) | (52,197 | ) | ||||||
| 119,461 | 131,013 | |||||||||
Certain debt securities in issue are managed on a fair value basis as part of HSBC’s interest rate risk management policies. The debt securities being hedged are presented within the balance sheet caption ‘Financial liabilities designated at fair value’, with the remaining debt securities included within ‘Trading liabilities’. The following table analyses the carrying amount of bonds and medium-term notes in issue at 31 December with original maturities greater than one year:
Bonds and medium-term notes
HSBC
| At 31 December | ||||||||||
2012 US$m | 2011 US$m | |||||||||
Fixed rate | ||||||||||
Secured financing: | ||||||||||
0.01% to 3.99%: until 2056 | 7,514 | 8,259 | ||||||||
4.00% to 4.99%: until 2013 | 231 | 1,307 | ||||||||
5.00% to 5.99%: until 2019 | 189 | 332 | ||||||||
8.00% to 9.99%: until 2028 | 252 | 276 | ||||||||
Other fixed rate senior debt: | ||||||||||
0.01% to 3.99%: until 2078 | 48,620 | 38,346 | ||||||||
4.00% to 4.99%: until 2046 | 18,722 | 15,515 | ||||||||
5.00% to 5.99%: until 2041 | 14,766 | 17,525 | ||||||||
6.00% to 6.99%: until 2046 | 5,207 | 7,056 | ||||||||
7.00% to 7.99%: until 2026 | 713 | 3,083 | ||||||||
8.00% to 9.99%: until 2036 | 199 | 379 | ||||||||
10.00% or higher: until 2028 | 108 | 437 | ||||||||
| 96,521 | 92,515 | |||||||||
Variable interest rate | ||||||||||
Secured financings – 0.01% to 13.99%: until 2068 | 7,897 | 7,279 | ||||||||
FHLB advances – 0.01% to 0.99%: until 2036 | 1,000 | 1,000 | ||||||||
Other variable interest rate senior debt – 0.01% to 12.99%: until 2057 | 43,104 | 47,393 | ||||||||
| 52,001 | 55,672 | |||||||||
474
Table of Contents
HSBC HOLDINGS PLC
Notes on the Financial Statements(continued)
| At 31 December | ||||||||||
2012 US$m | 2011 US$m | |||||||||
Brought forward | 148,522 | 148,187 | ||||||||
Structured notes | ||||||||||
Interest rate, equity, equity index or credit-linked | �� | 7,139 | 3,180 | |||||||
| 155,661 | 151,367 | |||||||||
HSBC Holdings
| At 31 December | ||||||||||
2012 US$m | 2011 US$m | |||||||||
Debt securities | 11,268 | 8,366 | ||||||||
Of which debt securities in issue reported as: | ||||||||||
– financial liabilities designated at fair value (Note 28) | (8,577 | ) | (5,753 | ) | ||||||
| 2,691 | 2,613 | |||||||||
Fixed rate senior debt, unsecured | ||||||||||
3.00% to 3.99%: until 2016 | 1,258 | 1,177 | ||||||||
4.00% to 4.99%: until 2022 | 4,945 | 2,573 | ||||||||
5.00% to 5.99%: until 2021 | 2,990 | 2,730 | ||||||||
6.00% to 6.99%: until 2042 | 2,075 | 1,886 | ||||||||
| 11,268 | 8,366 | |||||||||
| 30 | Liabilities of disposal groups held for sale and other liabilities |
Liabilities of disposal groups held for sale
| HSBC | ||||||||||
2012 US$m | 2011 US$m | |||||||||
Liabilities of disposal groups held for sale1 | 5,018 | 22,200 | ||||||||
| 1 | An analysis of liabilities of disposal groups held for sale is provided on page 471. |
Other liabilities
| HSBC | HSBC Holdings | |||||||||||||||||||||
2012 US$m | 2011 US$m | 2012 US$m | 2011 US$m | |||||||||||||||||||
Amounts due to investors in funds consolidated by HSBC | 564 | 720 | – | – | ||||||||||||||||||
Obligations under finance leases (Note 41) | 304 | 428 | – | – | ||||||||||||||||||
Dividend declared and payable by HSBC Holdings (Note 10) | – | 885 | – | 885 | ||||||||||||||||||
Endorsements and acceptances | 12,031 | 11,009 | – | – | ||||||||||||||||||
Other liabilities | 20,963 | 14,925 | 30 | 26 | ||||||||||||||||||
| 33,862 | 27,967 | 30 | 911 | |||||||||||||||||||
| 31 | Liabilities under insurance contracts |
Gross US$m | Reinsurers’ share US$m | Net US$m | ||||||||||||||
At 31 December 2012 | ||||||||||||||||
Non-life insurance liabilities | ||||||||||||||||
Unearned premium provision | 34 | (6 | ) | 28 | ||||||||||||
Notified claims | 29 | (6 | ) | 23 | ||||||||||||
Claims incurred but not reported | 12 | – | 12 | |||||||||||||
Other | 6 | (2 | ) | 4 | ||||||||||||
| 81 | (14 | ) | 67 | |||||||||||||
475
Table of Contents
HSBC HOLDINGS PLC
Notes on the Financial Statements(continued)
Liabilities under insurance contracts (continued)
Gross US$m | Reinsurers’ share US$m | Net US$m | ||||||||||||||
Brought forward | 81 | (14 | ) | 67 | ||||||||||||
Life insurance liabilities to policyholders | ||||||||||||||||
Life (non-linked) | 30,684 | (938 | ) | 29,746 | ||||||||||||
Investment contracts with discretionary participation features1 | 24,374 | – | 24,374 | |||||||||||||
Life (linked) | 13,056 | (455 | ) | 12,601 | ||||||||||||
| 68,114 | (1,393 | ) | 66,721 | |||||||||||||
| 68,195 | (1,407 | ) | 66,788 | |||||||||||||
At 31 December 2011 | ||||||||||||||||
Non-life insurance liabilities | ||||||||||||||||
Unearned premium provision | 621 | (112 | ) | 509 | ||||||||||||
Notified claims | 510 | (91 | ) | 419 | ||||||||||||
Claims incurred but not reported | 449 | (51 | ) | 398 | ||||||||||||
Other | 55 | 4 | 59 | |||||||||||||
| 1,635 | (250 | ) | 1,385 | |||||||||||||
Life insurance liabilities to policyholders | ||||||||||||||||
Life (non-linked) | 26,926 | (649 | ) | 26,277 | ||||||||||||
Investment contracts with discretionary participation features1 | 21,488 | – | 21,488 | |||||||||||||
Life (linked) | 11,210 | (903 | ) | 10,307 | ||||||||||||
| 59,624 | (1,552 | ) | 58,072 | |||||||||||||
| 61,259 | (1,802 | ) | 59,457 | |||||||||||||
| 455 | Though investment contracts with discretionary participation features are financial instruments, HSBC treats them as insurance contracts as permitted by IFRS 4. |
Movement on non-life insurance liabilities
Gross US$m | Reinsurers’ share US$m | Net US$m | ||||||||||||||
2012 | ||||||||||||||||
Unearned premium reserve (‘UPR’) | ||||||||||||||||
At 1 January | 621 | (112 | ) | 509 | ||||||||||||
Changes in UPR recognised as (income)/expense | 44 | 3 | 47 | |||||||||||||
Gross written premiums | 760 | (104 | ) | 656 | ||||||||||||
Gross earned premiums | (716 | ) | 107 | (609 | ) | |||||||||||
Disposals | (497 | ) | 91 | (406 | ) | |||||||||||
Exchange differences and other movements | (134 | ) | 12 | (122 | ) | |||||||||||
At 31 December | 34 | (6 | ) | 28 | ||||||||||||
Notified and incurred but not reported claims | ||||||||||||||||
At 1 January | 959 | (142 | ) | 817 | ||||||||||||
Notified claims | 510 | (91 | ) | 419 | ||||||||||||
Claims incurred but not reported | 449 | (51 | ) | 398 | ||||||||||||
Claims paid in current year | (339 | ) | 57 | (282 | ) | |||||||||||
Claims incurred in respect of current year | 341 | (53 | ) | 288 | ||||||||||||
Claims incurred in respect of prior years | 1 | (5 | ) | (4 | ) | |||||||||||
Disposals | (486 | ) | 137 | (349 | ) | |||||||||||
Exchange differences and other movements | (435 | ) | – | (435 | ) | |||||||||||
At 31 December | 41 | (6 | ) | 35 | ||||||||||||
Notified claims | 29 | (6 | ) | 23 | ||||||||||||
Claims incurred but not reported | 12 | – | 12 | |||||||||||||
Other | 6 | (2 | ) | 4 | ||||||||||||
Total non-life insurance liabilities | 81 | (14 | ) | 67 | ||||||||||||
476
Table of Contents
HSBC HOLDINGS PLC
Notes on the Financial Statements(continued)
Gross US$m | Reinsurers’ share US$m | Net US$m | ||||||||||||||
2011 | ||||||||||||||||
Unearned premium reserve (‘UPR’) | ||||||||||||||||
At 1 January | 727 | (129 | ) | 598 | ||||||||||||
Changes in UPR recognised as (income)/expense | 31 | (2 | ) | 29 | ||||||||||||
Gross written premiums | 1,175 | (182 | ) | 993 | ||||||||||||
Gross earned premiums | (1,144 | ) | 180 | (964 | ) | |||||||||||
Exchange differences and other movements | (137 | ) | 19 | (118 | ) | |||||||||||
At 31 December | 621 | (112 | ) | 509 | ||||||||||||
Notified and incurred but not reported claims | ||||||||||||||||
At 1 January | 1,624 | (305 | ) | 1,319 | ||||||||||||
Notified claims | 879 | (230 | ) | 649 | ||||||||||||
Claims incurred but not reported | 745 | (75 | ) | 670 | ||||||||||||
Claims paid in current year | (631 | ) | 81 | (550 | ) | |||||||||||
Claims incurred in respect of current year | 481 | (99 | ) | 382 | ||||||||||||
Claims incurred in respect of prior years | (46 | ) | 14 | (32 | ) | |||||||||||
Disposals | (317 | ) | 129 | (188 | ) | |||||||||||
Exchange differences and other movements | (152 | ) | 38 | (114 | ) | |||||||||||
At 31 December | 959 | (142 | ) | 817 | ||||||||||||
Notified claims | 510 | (91 | ) | 419 | ||||||||||||
Claims incurred but not reported | 449 | (51 | ) | 398 | ||||||||||||
Other | 55 | 4 | 59 | |||||||||||||
Total non-life insurance liabilities | 1,635 | (250 | ) | 1,385 | ||||||||||||
Life insurance liabilities to policyholders
| ||||||||||||||||
Gross US$m | Reinsurers’ share US$m | Net US$m | ||||||||||||||
2012 | ||||||||||||||||
Life (non-linked) | ||||||||||||||||
At 1 January | 26,926 | (649 | ) | 26,277 | ||||||||||||
Benefits paid | (1,566 | ) | 160 | (1,406 | ) | |||||||||||
Increase in liabilities to policyholders | 6,558 | (479 | ) | 6,079 | ||||||||||||
Exchange differences and other movements | (1,234 | ) | 30 | (1,204 | ) | |||||||||||
At 31 December | 30,684 | (938 | ) | 29,746 | ||||||||||||
Investment contracts with discretionary participation features | ||||||||||||||||
At 1 January | 21,488 | – | 21,488 | |||||||||||||
Benefits paid | (2,525 | ) | – | (2,525 | ) | |||||||||||
Increase in liabilities to policyholders | 3,645 | – | 3,645 | |||||||||||||
Exchange differences and other movements1 | 1,766 | – | 1,766 | |||||||||||||
At 31 December | 24,374 | – | 24,374 | |||||||||||||
Life (linked) | ||||||||||||||||
At 1 January | 11,210 | (903 | ) | 10,307 | ||||||||||||
Benefits paid | (1,810 | ) | 681 | (1,129 | ) | |||||||||||
Increase in liabilities to policyholders | 3,984 | 223 | 4,207 | |||||||||||||
Exchange differences and other movements2 | (328 | ) | (456 | ) | (784 | ) | ||||||||||
At 31 December | 13,056 | (455 | ) | 12,601 | ||||||||||||
Total liabilities to policyholders | 68,114 | (1,393 | ) | 66,721 | ||||||||||||
477
Table of Contents
HSBC HOLDINGS PLC
Notes on the Financial Statements(continued)
Life insurance liabilities to policyholders (continued)
| Gross US$m | Reinsurers’ share | Net US$m | ||||||||||||||
2011 | ||||||||||||||||
Life (non-linked) | ||||||||||||||||
At 1 January | 23,583 | (673 | ) | 22,910 | ||||||||||||
Benefits paid | (1,793 | ) | 164 | (1,629 | ) | |||||||||||
Increase in liabilities to policyholders | 5,729 | (254 | ) | 5,475 | ||||||||||||
Exchange differences and other movements | (593 | ) | 114 | (479 | ) | |||||||||||
At 31 December | 26,926 | (649 | ) | 26,277 | ||||||||||||
Investment contracts with discretionary participation features | ||||||||||||||||
At 1 January | 22,074 | – | 22,074 | |||||||||||||
Benefits paid | (2,628 | ) | – | (2,628 | ) | |||||||||||
Increase in liabilities to policyholders | 3,005 | – | 3,005 | |||||||||||||
Exchange differences and other movements1 | (963 | ) | – | (963 | ) | |||||||||||
At 31 December | 21,488 | – | 21,488 | |||||||||||||
Life (linked) | ||||||||||||||||
At 1 January | 10,496 | (760 | ) | 9,736 | ||||||||||||
Benefits paid | (1,129 | ) | 56 | (1,073 | ) | |||||||||||
Increase in liabilities to policyholders | 2,462 | (111 | ) | 2,351 | ||||||||||||
Exchange differences and other movements2 | (619 | ) | (88 | ) | (707 | ) | ||||||||||
At 31 December | 11,210 | (903 | ) | 10,307 | ||||||||||||
Total liabilities to policyholders | 59,624 | (1,552 | ) | 58,072 | ||||||||||||
| 1 | Includes movement in liabilities relating to discretionary profit participation benefits due to policyholders arising from net unrealised investment gains recognised in other comprehensive income. |
| 2 | Includes amounts arising under reinsurance agreements. |
The increase in liabilities to policyholders represents the aggregate of all events giving rise to additional liabilities to policyholders in the year. The key factors contributing to the movement in liabilities to policyholders include death claims, surrenders, lapses, liabilities to policyholders created at the initial inception of the policies, the declaration of bonuses and other amounts attributable to policyholders.
| 32 | Provisions |
Restruc- turing costs | Contingent liabilities and | Legal proceedings and regulatory matters | Customer remediation | Other provisions | Total US$m | |||||||||||||||||||||||||||||
At 1 January 2012 | 169 | 206 | 1,473 | 1,067 | 409 | 3,324 | ||||||||||||||||||||||||||||
Additional provisions/increase in provisions | 434 | 73 | 2,779 | 2,473 | 376 | 6,135 | ||||||||||||||||||||||||||||
Provisions utilised | (320 | ) | (2 | ) | (2,510 | ) | (1,022 | ) | (153 | ) | (4,007 | ) | ||||||||||||||||||||||
Amounts reversed | (89 | ) | (58 | ) | (104 | ) | (137 | ) | (63 | ) | (451 | ) | ||||||||||||||||||||||
Unwinding of discounts | – | – | 42 | 1 | 5 | 48 | ||||||||||||||||||||||||||||
Exchange differences and other movements | 57 | 82 | (13 | ) | 5 | 72 | 203 | |||||||||||||||||||||||||||
At 31 December 2012 | �� | 251 | 301 | 1,667 | 2,387 | 646 | 5,252 | |||||||||||||||||||||||||||
At 1 January 2011 | 21 | 405 | 969 | 442 | 301 | 2,138 | ||||||||||||||||||||||||||||
Additional provisions/increase in provisions | 221 | 14 | 896 | 1,078 | 184 | 2,393 | ||||||||||||||||||||||||||||
Provisions utilised | (58 | ) | (5 | ) | (367 | ) | (386 | ) | (71 | ) | (887 | ) | ||||||||||||||||||||||
Amounts reversed | (14 | ) | (41 | ) | (28 | ) | (87 | ) | (86 | ) | (256 | ) | ||||||||||||||||||||||
Unwinding of discounts | – | 1 | 56 | – | 5 | 62 | ||||||||||||||||||||||||||||
Exchange differences and other movements | (1 | ) | (168 | ) | (53 | ) | 20 | 76 | (126 | ) | ||||||||||||||||||||||||
At 31 December 2011 | 169 | 206 | 1,473 | 1,067 | 409 | 3,324 | ||||||||||||||||||||||||||||
478
Table of Contents
HSBC HOLDINGS PLC
Notes on the Financial Statements(continued)
Further details of legal proceedings and regulatory matters are set out in Note 43. Legal proceedings include civil court, arbitration or tribunal proceedings brought against HSBC companies (whether by way of claim or counterclaim) or civil disputes that may, if not settled, result in court, arbitration or tribunal proceedings. Regulatory matters refer to investigations, reviews and other actions carried out by, or in response to the actions of, regulators or law enforcement agencies in connection with alleged wrongdoing by HSBC. In December 2012, HSBC made payments totalling US$1,921m to US authorities in relation to investigations regarding inadequate compliance with anti-money laundering and sanctions laws. Further details of the agreements reached with the US authorities are set out on page 510.
Customer remediation refers to activities carried out by HSBC to compensate customers for losses or damages associated with a failure to comply with regulations or to treat customers fairly. Customer remediation is initiated by HSBC in response to customer complaints and/or industry developments in sales practices, and not necessarily initiated by regulatory action.
Payment protection insurance
An increase in provisions of US$1,681m was recognised during the year 2012 in respect of the estimated liability for redress regarding the mis-selling of payment protection insurance (‘PPI’) policies in previous years. Cumulative provisions made since the Judicial Review ruling in 2011 amount to US$2,397m, of which US$957m has been paid in 2012 (2011: US$325m). At 31 December 2012, the provision amounted to US$1,321m (2011: US$506m).
The estimated liability for redress is calculated based on the total premiums paid by the customer plus simple interest of 8% per annum (or the rate inherent in the related loan product where higher). The basis for calculating the redress liability is the same for single premium and regular premium policies. Future estimated redress levels are based on historically observed redress per policy.
A total of 5.4 million PPI policies have been sold by HSBC since 2000, which generated estimated revenues of US$4.1bn at 2012 average exchange rates. The gross written premiums on these polices was approximately US$5.1bn at 2012 average exchange rates. At 31 December 2012, the estimated total complaints expected to be received was 1.4 million, representing 25% of total policies sold. It is estimated that contact will be made with regard to 1.8 million policies, representing 33% of total policies sold. This estimate includes inbound complaints as well as HSBC’s proactive contact exercise on certain policies (‘outbound contact’).
During 2012, we increased the estimate of the total number of policies to be ultimately redressed, as the level of complaints received was higher in volume and over a more sustained period than previously assumed. This change in assumptions contributed approximately US$1.2bn to the increased provision for the year with the balance consisting of US$0.2bn attributable to regulatory changes and US$0.3bn other assumption and model changes.
The following table details the cumulative number of complaints received at 31 December 2012 and the number of claims expected in the future:
Cumulative to 31 December 2012 | Future expected | |||||||||
Inbound complaints1 (000s of policies) | 801 | 348 | ||||||||
Outbound contact (000s of policies) | 43 | 547 | ||||||||
Response rate to outbound contact | 37% | 38% | ||||||||
Average uphold rate per claim2 | 78% | 79% | ||||||||
Average redress per claim (US$) | 2,325 | 2,290 | ||||||||
| 1 | Excludes invalid claims where the complainant has not held a PPI policy. |
| 2 | Claims include inbound and responses to outbound contact. |
The main assumptions involved in calculating the redress liability are the volume of inbound complaints, the projected period of inbound complaints, the decay rate of complaint volumes, the population identified as systemically mis-sold and the number of policies per customer complaint. The main assumptions are likely to evolve over time as root cause analysis continues, more experience is available regarding customer initiated complaint volumes received, and we handle responses to our ongoing outbound contact.
A 100,000 increase/decrease in the total inbound complaints would increase/decrease the redress provision by approximately US$180m. Each 1% increase/decrease in the response rate to our outbound contact exercise would increase/decrease the redress provision by approximately US$10m.
479
Table of Contents
HSBC HOLDINGS PLC
Notes on the Financial Statements(continued)
In addition to these factors and assumptions, the extent of the required redress will also depend on the facts and circumstances of each individual customer’s case. For these reasons, there is currently a high degree of uncertainty as to the eventual costs of redress for this matter.
Interest rate derivatives
A provision of US$598m was recognised relating to the estimated liability for redress in respect of the possible mis-selling of interest rate derivatives in the UK. Of this provision, US$272m related to the estimated redress payable to customers in respect of historical payments under derivative contracts, US$254m covered the expected write-off by the bank of open derivative contracts balances, and US$72m covers estimated project costs.
Following an FSA review of the sale of interest rate derivatives, HSBC agreed to pay redress to customers where mis-selling of these products has occurred under the FSA’s criteria. On 31 January 2013, the FSA announced the findings from their review of pilot cases completed by the banks. Following its review, the FSA clarified the eligibility criteria to ensure the programme is focused on those small businesses that were unlikely to understand the risks associated with those products. HSBC has also been working with the FSA and an independent ‘skilled person’ adviser to clarify the standards against which it should assess sales, and how redress should be calculated (for example, when it would be appropriate to assume a customer would have taken an alternative interest rate product).
The extent to which HSBC is required to pay redress depends on the responses of contacted and other customers during the review period and the facts and circumstances of each individual case. For these reasons, there is currently a high degree of uncertainty as to the eventual costs of redress related to this programme.
Brazilian labour, civil and fiscal claims
Within ‘legal proceedings and regulatory matters’ above are labour, civil and fiscal litigation provisions of US$506m (2011: US$481m) which includes provisions in respect of labour and overtime litigation claims brought by past employees against HSBC operations in Brazil following their departure from the bank. The main assumptions involved in estimating the liability are the expected number of departing employees, individual salary levels and the facts and circumstances of each individual case.
| 33 | Subordinated liabilities |
HSBC
| At 31 December | ||||||||||
| 2012 US$m | 2011 US$m | |||||||||
Subordinated liabilities | ||||||||||
At amortised cost | 29,479 | 30,606 | ||||||||
– subordinated liabilities | 25,119 | 25,543 | ||||||||
– preferred securities | 4,360 | 5,063 | ||||||||
Designated at fair value (Note 28) | 21,559 | 21,611 | ||||||||
– subordinated liabilities | 16,863 | 17,503 | ||||||||
– preferred securities | 4,696 | 4,108 | ||||||||
| 51,038 | 52,217 | |||||||||
Subordinated liabilities | ||||||||||
HSBC Holdings | 20,569 | 21,456 | ||||||||
Other HSBC | 30,469 | 30,761 | ||||||||
| 51,038 | 52,217 | |||||||||
Subordinated liabilities are capital securities which have been included in the capital base of HSBC and were issued in accordance with the rules and guidance in the FSA’s General Prudential Sourcebook (‘GENPRU’). Where applicable, these capital securities may be called and redeemed by HSBC subject to prior notification to the FSA and, where relevant, the consent of the local banking regulator. If not redeemed at the first call date, interest coupons payable may step-up or become floating rate related to interbank rates, and in some cases may be subject to a floor.
Interest rates on the floating rate capital securities are generally related to interbank offered rates. On the remaining capital securities, interest is payable at fixed rates of up to 10.176%.
480
Table of Contents
HSBC HOLDINGS PLC
Notes on the Financial Statements(continued)
The balance sheet amounts disclosed below are presented on an IFRSs basis and do not reflect the amount that the instruments contribute to regulatory capital. The IFRSs accounting and regulatory treatments differ due to the inclusion of issuance costs and regulatory amortisation.
HSBC’s subordinated liabilities
Tier 1 capital securities
Tier 1 capital securities are perpetual subordinated securities on which investors are entitled, subject to certain conditions, to receive distributions which are non-cumulative. Such securities do not generally carry voting rights but rank above ordinary shares for coupon payments and in the event of a winding-up.
HSBC has the following qualifying tier 1 capital securities in issue which are accounted for as liabilities:
| At 31 December | ||||||||||||||||||
First call date | 2012 US$m | 2011 US$m | ||||||||||||||||
Tier 1 capital securities guaranteed by HSBC Holdings1 | ||||||||||||||||||
€600m | 8.03% non-cumulative step-up perpetual preferred securities2 | Jun 2012 | – | 776 | ||||||||||||||
US$1,250m | 4.61% non-cumulative step-up perpetual preferred securities | Jun 2013 | 1,250 | 1,163 | ||||||||||||||
€1,400m | 5.3687% non-cumulative step-up perpetual preferred securities | Mar 2014 | 1,933 | 1,693 | ||||||||||||||
£500m | 8.208% non-cumulative step-up perpetual preferred securities | Jun 2015 | 806 | 771 | ||||||||||||||
€750m | 5.13% non-cumulative step-up perpetual preferred securities | Mar 2016 | 1,033 | 872 | ||||||||||||||
US$900m | 10.176% non-cumulative step-up perpetual preferred securities, series 2 | Jun 2030 | 891 | 891 | ||||||||||||||
| 5,913 | 6,166 | |||||||||||||||||
Tier 1 capital securities guaranteed by HSBC Bank plc1 | ||||||||||||||||||
£300m | 5.862% non-cumulative step-up perpetual preferred securities | Apr 2020 | 480 | 378 | ||||||||||||||
£700m | 5.844% non-cumulative step-up perpetual preferred securities | Nov 2031 | 1,131 | 1,084 | ||||||||||||||
| 1,611 | 1,462 | |||||||||||||||||
| 1 | See paragraph below, ‘Guaranteed by HSBC Holdings or HSBC Bank plc’. |
| 2 | In June 2012, HSBC redeemed these securities at par. |
Guaranteed by HSBC Holdings or HSBC Bank plc
The five capital securities guaranteed, on a subordinated basis, by HSBC Holdings and the two capital securities guaranteed, on a subordinated basis, by HSBC Bank are non-cumulative step-up perpetual preferred securities issued by Jersey limited partnerships. The proceeds of the issues were on-lent to the respective guarantor by the limited partnerships in the form of subordinated notes. The above preferred securities qualify as tier 1 capital for HSBC Group and the two capital securities guaranteed by HSBC Bank also qualify as tier 1 capital for HSBC Bank (on a solo and consolidated basis).
These preferred securities, together with the guarantee, are intended to provide investors with rights to income and capital distributions, and distributions upon liquidation of the relevant issuer that are equivalent to the rights that they would have had if they had purchased non-cumulative perpetual preference shares of the relevant issuer.
There are limitations on the payment of distributions if such payments are prohibited under UK banking regulations or other requirements, if a payment would cause a breach of HSBC’s capital adequacy requirements, or if HSBC Holdings or HSBC Bank has insufficient distributable reserves (as defined) respectively.
HSBC Holdings and HSBC Bank have individually covenanted that if prevented under certain circumstances from paying distributions on the preferred securities in full, they will not pay dividends or other distributions in respect of its ordinary shares, or effect repurchases or redemptions of its ordinary shares, until the distribution on preferred securities has been paid in full.
With respect to preferred securities guaranteed by HSBC Holdings – if (i) HSBC’s total capital ratio falls below the regulatory minimum ratio required, or (ii) the Directors expect that, in view of the deteriorating financial condition of HSBC Holdings, that (i) will occur in the near term, then the preferred securities will be substituted by preference shares of HSBC Holdings which have economic terms which are in all material respects equivalent to those of the preferred securities and the guarantee taken together.
With respect to preferred securities guaranteed by HSBC Bank – if (i) any of the two issues of preferred securities are outstanding in April 2049 or November 2048, respectively, or (ii) the total capital ratio of HSBC Bank on a solo and
481
Table of Contents
HSBC HOLDINGS PLC
Notes on the Financial Statements(continued)
consolidated basis falls below the regulatory minimum ratio required, or (iii) in view of the deteriorating financial condition of HSBC Bank, the Directors expect (ii) to occur in the near term, then the preferred securities will be substituted by preference shares of HSBC Bank having economic terms which are in all material respects equivalent to those of the preferred securities and the guarantee taken together.
Upper tier 2 capital securities
Upper tier 2 capital securities are perpetual subordinated securities on which there is an obligation to pay coupons. Such securities rank below lower tier 2 securities for coupon payments and in the event of a winding-up.
HSBC has the following qualifying upper tier 2 securities in issue:
| At 31 December | ||||||||||||||||||
| First call date | 2012 US$m | 2011 US$m | ||||||||||||||||
HSBC Bank plc | ||||||||||||||||||
US$750m | Undated floating rate primary capital notes | Jun 1990 | 750 | 750 | ||||||||||||||
US$500m | Undated floating rate primary capital notes | Sep 1990 | 499 | 500 | ||||||||||||||
US$300m | Undated floating rate primary capital notes, series 3 | Jun 1992 | 301 | 300 | ||||||||||||||
| 1,550 | 1,550 | |||||||||||||||||
The Hongkong and Shanghai Banking Corporation Ltd | ||||||||||||||||||
US$400m | Primary capital undated floating rate notes | Aug 1990 | 405 | 406 | ||||||||||||||
US$400m | Primary capital undated floating rate notes (second series) | Dec 1990 | 402 | 403 | ||||||||||||||
US$400m | Primary capital undated floating rate notes (third series) | Aug 1991 | 400 | 400 | ||||||||||||||
| 1,207 | 1,209 | |||||||||||||||||
Other HSBC subsidiaries | ||||||||||||||||||
| Other perpetual subordinated loan capital less than US$100m | 21 | 21 | ||||||||||||||||
Lower tier 2 capital securities
Lower tier 2 capital securities are dated securities on which there is an obligation to pay coupons. In accordance with the FSA’s GENPRU, the capital contribution of lower tier 2 securities is amortised for regulatory purposes on a straight-line basis in their final five years before maturity.
HSBC has the following qualifying lower tier 2 securities in issue:
| At 31 December | ||||||||||||||||||||||
First call date | Maturity date | 2012 US$m | 2011 US$m | |||||||||||||||||||
HSBC Bank plc | ||||||||||||||||||||||
£350m | Callable subordinated variable coupon notes1 | Jun 2012 | Jun 2017 | – | 550 | |||||||||||||||||
£500m | 4.75% callable subordinated notes2 | Sep 2015 | Sep 2020 | 844 | 759 | |||||||||||||||||
£350m | 5.00% callable subordinated notes3 | Mar 2018 | Mar 2023 | 630 | 533 | |||||||||||||||||
£300m | 6.50% subordinated notes | – | Jul 2023 | 483 | 463 | |||||||||||||||||
£350m | 5.375% callable subordinated step-up notes4 | Nov 2025 | Nov 2030 | 630 | 493 | |||||||||||||||||
£500m | 5.375% subordinated notes | – | Aug 2033 | 925 | 678 | |||||||||||||||||
£225m | 6.25% subordinated notes | – | Jan 2041 | 362 | 346 | |||||||||||||||||
£600m | 4.75% subordinated notes | – | Mar 2046 | 958 | 917 | |||||||||||||||||
€500m | Callable subordinated floating rate notes5 | Sep 2015 | Sep 2020 | 606 | 550 | |||||||||||||||||
US$300m | 7.65% subordinated notes | – | May 2025 | 394 | 374 | |||||||||||||||||
| 5,832 | 5,663 | |||||||||||||||||||||
Hang Seng Bank Limited | ||||||||||||||||||||||
US$300m | Callable subordinated floating rate notes1 | Jul 2012 | Jul 2017 | – | 300 | |||||||||||||||||
| – | 300 | |||||||||||||||||||||
HSBC Bank Australia Limited | ||||||||||||||||||||||
AUD200m | Callable subordinated floating rate notes | Nov 2015 | Nov 2020 | 207 | 203 | |||||||||||||||||
AUD42m | Callable subordinated floating rate notes6 | Mar 2013 | Mar 2018 | 44 | 42 | |||||||||||||||||
| 251 | 245 | |||||||||||||||||||||
HSBC Bank Malaysia Berhad | ||||||||||||||||||||||
MYR500m | 4.35% subordinated bonds | Jun 2017 | Jun 2022 | 164 | 158 | |||||||||||||||||
MYR500m | 5.05% subordinated bonds | Nov 2022 | Nov 2027 | 168 | 162 | |||||||||||||||||
| 332 | 320 | |||||||||||||||||||||
482
Table of Contents
HSBC HOLDINGS PLC
Notes on the Financial Statements(continued)
| At 31 December | ||||||||||||||||||||||
First call date | Maturity date | 2012 US$m | 2011 US$m | |||||||||||||||||||
HSBC USA Inc. | ||||||||||||||||||||||
US$200m | 7.808% capital securities | Dec 2006 | Dec 2026 | 200 | 200 | |||||||||||||||||
US$200m | 8.38% capital securities | May 2007 | May 2027 | 200 | 200 | |||||||||||||||||
US$150m | 9.50% subordinated debt | – | Apr 2014 | 152 | 154 | |||||||||||||||||
US$150m | 7.75% Capital Trust pass through securities | Nov 2016 | Nov 2026 | 150 | 150 | |||||||||||||||||
US$750m | 5.00% subordinated notes | – | Sep 2020 | 745 | 744 | |||||||||||||||||
US$250m | 7.20% subordinated debentures | – | Jul 2097 | 214 | 214 | |||||||||||||||||
| Other subordinated liabilities each less than US$150m | 302 | 394 | ||||||||||||||||||||
| 1,963 | 2,056 | |||||||||||||||||||||
HSBC Bank USA, N.A. | ||||||||||||||||||||||
US$1,000m | 4.625% subordinated notes | – | Apr 2014 | 1,002 | 1,009 | |||||||||||||||||
US$500m | 6.00% subordinated notes | – | Aug 2017 | 516 | 505 | |||||||||||||||||
US$1,250m | 4.875% subordinated notes | – | Aug 2020 | 1,263 | 1,259 | |||||||||||||||||
US$1,000m | 5.875% subordinated notes | – | Nov 2034 | 1,151 | 951 | |||||||||||||||||
US$750m | 5.625% subordinated notes | – | Aug 2035 | 864 | 712 | |||||||||||||||||
US$700m | 7.00% subordinated notes | – | Jan 2039 | 694 | 681 | |||||||||||||||||
| 5,490 | 5,117 | |||||||||||||||||||||
HSBC Finance Corporation | ||||||||||||||||||||||
US$1,000m | 5.911% trust preferred securities7 | Nov 2015 | Nov 2035 | 995 | 994 | |||||||||||||||||
US$2,939m | 6.676% senior subordinated notes8 | – | Jan 2021 | 2,180 | 2,177 | |||||||||||||||||
| 3,175 | 3,171 | |||||||||||||||||||||
HSBC Bank Brazil S.A. | ||||||||||||||||||||||
BRL383m | Subordinated certificates of deposit | – | Feb 2015 | 289 | 206 | |||||||||||||||||
BRL500m | Subordinated floating rate certificates of deposit | – | Dec 2016 | 464 | 268 | |||||||||||||||||
| Other subordinated liabilities each less than US$150m9 | 491 | 1,156 | ||||||||||||||||||||
| 1,244 | 1,630 | |||||||||||||||||||||
HSBC Mexico, S.A. | ||||||||||||||||||||||
MXN1,818m | Non-convertible subordinated obligations10 | – | Sep 2018 | 139 | 130 | |||||||||||||||||
MXN2,273m | Non-convertible subordinated obligations10 | – | Dec 2018 | 173 | 162 | |||||||||||||||||
US$300m | Non-convertible subordinated obligations10,11 | – | Jun 2019 | 240 | 232 | |||||||||||||||||
| 552 | 524 | |||||||||||||||||||||
HSBC Bank Canada | ||||||||||||||||||||||
CAD400m | 4.80% subordinated notes | Apr 2017 | Apr 2022 | 438 | 417 | |||||||||||||||||
CAD200m | 4.94% subordinated debentures | – | Mar 2021 | 201 | 195 | |||||||||||||||||
CAD39m | Floating rate debentures | – | Nov 2083 | 39 | 39 | |||||||||||||||||
| 678 | 651 | |||||||||||||||||||||
Other HSBC subsidiaries | ||||||||||||||||||||||
| Other subordinated liabilities each less than US$200m9 | 650 | 676 | ||||||||||||||||||||
| 650 | 676 | |||||||||||||||||||||
Total of subordinated liabilities issued by HSBC subsidiaries | 30,469 | 30,761 | ||||||||||||||||||||
Amounts owed to third parties by HSBC Holdings (page 480) | 20,569 | 21,456 | ||||||||||||||||||||
| 51,038 | 52,217 | |||||||||||||||||||||
| 1 | In June2012 and July 2012, HSBC redeemed its £350m callable subordinated variable coupon note and its US$300m callable subordinated floating rate notes respectively at par. |
| 2 | The interest rate payable after September 2015 is the sum of the three-month sterling Libor plus 0.82%. |
| 3 | The interest rate payable after March 2018 is the sum of the gross redemption yield of the then prevailing five-year UK gilt plus 1.80%. |
| 4 | The interest rate payable after November 2025 is the sum of the three-month sterling Libor plus 1.50%. |
| 5 | The interest margin increases by 0.5% from September 2015. |
| 6 | In February 2013, HSBC gave notice that it will call and redeem the notes at par in March 2013. |
| 7 | The distributions change in November 2015 to three-month dollar Libor plus 1.926%. |
| 8 | Approximately 25% of the senior subordinated notes is held by HSBC Holdings. |
| 9 | Some securities included here are ineligible for inclusion in the capital base of HSBC in accordance with guidance in FSA’s GENPRU. |
| 10 | These securities are ineligible for inclusion in the capital base of HSBC in accordance with FSA’s GENPRU. |
| 11 | Approximately US$60m of the subordinated obligations are held by HSBC Holdings. |
483
Table of Contents
HSBC HOLDINGS PLC
Notes on the Financial Statements(continued)
HSBC Holdings
| At 31 December | ||||||||||||||||||||||
2012 US$m | 2011 US$m | |||||||||||||||||||||
Subordinated liabilities: | ||||||||||||||||||||||
– at amortised cost | 11,907 | 12,450 | ||||||||||||||||||||
– designated at fair value (Note 28) | 14,618 | 15,398 | ||||||||||||||||||||
| 26,525 | 27,848 | |||||||||||||||||||||
HSBC Holdings’ subordinated liabilities
|
| |||||||||||||||||||||
| At 31 December | ||||||||||||||||||||||
First call date | Maturity date | 2012 US$m | 2011 US$m | |||||||||||||||||||
Amounts owed to third parties1 | ||||||||||||||||||||||
US$1,400m | 5.25% subordinated notes | – | Dec 2012 | – | 1,438 | |||||||||||||||||
US$488m | 7.625% subordinated notes | – | May 2032 | 579 | 578 | |||||||||||||||||
US$222m | 7.35% subordinated notes | – | Nov 2032 | 258 | 257 | |||||||||||||||||
US$2,000m | 6.5% subordinated notes | – | May 2036 | 2,034 | 2,048 | |||||||||||||||||
US$2,500m | 6.5% subordinated notes | – | Sep 2037 | 3,202 | 2,634 | |||||||||||||||||
US$1,500m | 6.8% subordinated notes | – | Jun 2038 | 1,486 | 1,486 | |||||||||||||||||
£250m | 9.875% subordinated bonds2 | Apr 2013 | Apr 2018 | 442 | 445 | |||||||||||||||||
£900m | 6.375% callable subordinated notes3 | Oct 2017 | Oct 2022 | 1,648 | 1,416 | |||||||||||||||||
£650m | 5.75% subordinated notes | – | Dec 2027 | 1,210 | 926 | |||||||||||||||||
£650m | 6.75% subordinated notes | – | Sep 2028 | 1,041 | 997 | |||||||||||||||||
£750m | 7.0% subordinated notes | – | Apr 2038 | 1,264 | 1,205 | |||||||||||||||||
£900m | 6.0% subordinated notes | – | Mar 2040 | 1,431 | 1,369 | |||||||||||||||||
€1,000m | 5.375% subordinated notes | – | Dec 2012 | – | 1,327 | |||||||||||||||||
€1,600m | 6.25% subordinated notes | – | Mar 2018 | 2,118 | 2,073 | |||||||||||||||||
€1,750m | 6.0% subordinated notes | – | Jun 2019 | 2,882 | 2,388 | |||||||||||||||||
€700m | 3.625% callable subordinated notes4 | Jun 2015 | Jun 2020 | 974 | 869 | |||||||||||||||||
| 20,569 | 21,456 | |||||||||||||||||||||
Amounts owed to HSBC undertakings | ||||||||||||||||||||||
€600m | 8.03% subordinated step-up cumulative notes5 | Jun 2012 | Jun 2040 | – | 775 | |||||||||||||||||
US$1,250m | 4.61% fixed/floating subordinated notes | Jun 2013 | Jun 2043 | 1,264 | 1,223 | |||||||||||||||||
€1,400m | 5.3687% fixed/floating subordinated notes | Mar 2014 | Dec 2043 | 1,952 | 1,791 | |||||||||||||||||
£500m | 8.208% subordinated step-up cumulative notes | Jun 2015 | Jun 2040 | 806 | 771 | |||||||||||||||||
€750m | 5.13% fixed/floating subordinated notes | Mar 2016 | Dec 2044 | 1,043 | 941 | |||||||||||||||||
US$900m | 10.176% subordinated step-up cumulative notes | Jun 2030 | Jun 2040 | 891 | 891 | |||||||||||||||||
| 5,956 | 6,392 | |||||||||||||||||||||
| 26,525 | 27,848 | |||||||||||||||||||||
| 1 | Amounts owed to third parties represent securities included in the capital base of HSBC as lower tier 2 securities in accordance with guidance in the FSA’s GENPRU. |
| 2 | In February 2013, HSBC Holdings gave notice that it will call and redeem the bonds at par in April 2013. |
| 3 | The interest rate payable after October 2017 is the sum of the three-month sterling Libor plus 1.3%. |
| 4 | The interest rate payable after June 2015 is the sum of the three-month Euribor plus 0.93%. |
| 5 | In June 2012, HSBC Holdings redeemed its €600m 8.03% subordinated step-up cumulative notes at par. |
484
Table of Contents
HSBC HOLDINGS PLC
Notes on the Financial Statements(continued)
| 34 | Maturity analysis of assets, liabilities and off-balance sheet commitments |
The table on page 486 provides an analysis of consolidated total assets, liabilities and off-balance sheet commitments by residual contractual maturity at the balance sheet date. Asset and liability balances are included in the maturity analysis as follows:
| • | except for reverse repos, repos and debt securities in issue, trading assets and liabilities (including trading derivatives) are included in the ‘Due less than one month’ time bucket, and not by contractual maturity because trading balances are typically held for short periods of time; |
| • | financial assets and liabilities with no contractual maturity (such as equity securities) are included in the ‘Due over five years’ time bucket. Undated or perpetual instruments are classified based on the contractual notice period which the counterparty of the instrument is entitled to give. Where there is no contractual notice period, undated or perpetual contracts are included in the ‘Due over five years’ time bucket; |
| • | non financial assets and liabilities with no contractual maturity (such as property, plant and equipment, goodwill and intangible assets, current and deferred tax assets and liabilities and retirement benefit liabilities) are included in the ‘Due over five years’ time bucket; |
| • | financial instruments included within assets and liabilities of disposal groups held for sale are classified on the basis of the contractual maturity of the underlying instruments and not on the basis of the disposal transaction; and |
| • | liabilities under insurance contracts are included in the ‘Due over five years’ time bucket. Liabilities under investment contracts are classified in accordance with their contractual maturity. Undated investment contracts are classified based on the contractual notice period investors are entitled to give. Where there is no contractual notice period, undated contracts are included in the ‘Due over five years’ time bucket. |
Loan and other credit-related commitments are classified on the basis of the earliest date they can be drawn down.
485
Table of Contents
HSBC HOLDINGS PLC
Notes on the Financial Statements(continued)
HSBC
Maturity analysis of assets and liabilities
| At 31 December 2012 | ||||||||||||||||||||||||||||||||||||||||||||||||||||
Due less than 1 month | Due between 1 and 3 months | Due between 3 and 6 months | Due between 6 and 9 months | Due between 9 months and 1 year | Due between 1 and 2 years | Due between 2 and 5 years | Due over 5 years | Total | ||||||||||||||||||||||||||||||||||||||||||||
| US$m | US$m | US$m | US$m | US$m | US$m | US$m | US$m | US$m | ||||||||||||||||||||||||||||||||||||||||||||
Financial assets | ||||||||||||||||||||||||||||||||||||||||||||||||||||
Cash and balances at central banks | 141,532 | – | – | – | – | – | – | – | 141,532 | |||||||||||||||||||||||||||||||||||||||||||
Items in the course of collection from other banks | 7,303 | – | – | – | – | – | – | – | 7,303 | |||||||||||||||||||||||||||||||||||||||||||
Hong Kong Government certificates of indebtedness | 22,743 | – | – | – | – | – | – | – | 22,743 | |||||||||||||||||||||||||||||||||||||||||||
Trading assets | 382,654 | 12,506 | 9,829 | 248 | 3,169 | 405 | – | – | 408,811 | |||||||||||||||||||||||||||||||||||||||||||
– Reverse repos | 92,525 | 12,506 | 9,829 | 248 | 3,169 | 405 | – | – | 118,682 | |||||||||||||||||||||||||||||||||||||||||||
– Other trading assets | 290,129 | – | – | – | – | – | – | – | 290,129 | |||||||||||||||||||||||||||||||||||||||||||
Financial assets designated at fair value | 437 | 576 | 425 | 526 | 239 | 2,462 | 3,545 | 25,372 | 33,582 | |||||||||||||||||||||||||||||||||||||||||||
Derivatives | 354,222 | 65 | 252 | 22 | 227 | 596 | 1,127 | 939 | 357,450 | |||||||||||||||||||||||||||||||||||||||||||
– Trading | 353,803 | – | – | – | – | – | – | – | 353,803 | |||||||||||||||||||||||||||||||||||||||||||
– Non-trading | 419 | 65 | 252 | 22 | 227 | 596 | 1,127 | 939 | 3,647 | |||||||||||||||||||||||||||||||||||||||||||
Loans and advances to banks | 104,397 | 22,683 | 5,859 | 2,292 | 5,032 | 6,238 | 2,027 | 4,018 | 152,546 | |||||||||||||||||||||||||||||||||||||||||||
– Reverse repos | 28,833 | 3,101 | 2,071 | 356 | 963 | 138 | – | – | 35,462 | |||||||||||||||||||||||||||||||||||||||||||
– Other loans and advances to banks: | 75,564 | 19,582 | 3,788 | 1,936 | 4,069 | 6,100 | 2,027 | 4,018 | 117,084 | |||||||||||||||||||||||||||||||||||||||||||
Loans and advances to customers | 221,242 | 69,709 | 47,507 | 29,659 | 71,928 | 59,100 | 194,147 | 304,331 | 997,623 | |||||||||||||||||||||||||||||||||||||||||||
– Personal | 49,042 | 8,578 | 7,242 | 6,763 | 9,547 | 17,696 | 66,684 | 241,329 | 406,881 | |||||||||||||||||||||||||||||||||||||||||||
– Corporate and commercial | 138,999 | 49,166 | 35,463 | 19,334 | 53,766 | 38,070 | 119,330 | 55,910 | 510,038 | |||||||||||||||||||||||||||||||||||||||||||
– Financial | 33,201 | 11,965 | 4,802 | 3,562 | 8,615 | 3,334 | 8,133 | 7,092 | 80,704 | |||||||||||||||||||||||||||||||||||||||||||
Of which: | ||||||||||||||||||||||||||||||||||||||||||||||||||||
– Reverse repos | 19,847 | 10,640 | 2,310 | 1,050 | 554 | 250 | – | – | 34,651 | |||||||||||||||||||||||||||||||||||||||||||
Financial investments | 28,085 | 51,339 | 33,996 | 14,072 | 26,478 | 61,443 | 93,127 | 112,561 | 421,101 | |||||||||||||||||||||||||||||||||||||||||||
Assets held for sale | 4,953 | 298 | 515 | 125 | 669 | 519 | 1,079 | 9,964 | 18,122 | |||||||||||||||||||||||||||||||||||||||||||
Accrued income | 2,776 | 2,325 | 739 | 493 | 542 | 164 | 217 | 1,284 | 8,540 | |||||||||||||||||||||||||||||||||||||||||||
Other financial assets | 13,383 | 3,486 | 1,759 | 337 | 745 | 332 | 372 | 3,170 | 23,584 | |||||||||||||||||||||||||||||||||||||||||||
Total financial assets | 1,283,727 | 162,987 | 100,881 | 47,774 | 109,029 | 131,259 | 295,641 | 461,639 | 2,592,937 | |||||||||||||||||||||||||||||||||||||||||||
Non financial assets | – | – | – | – | – | – | – | 99,601 | 99,601 | |||||||||||||||||||||||||||||||||||||||||||
Total assets | 1,283,727 | 162,987 | 100,881 | 47,774 | 109,029 | 131,259 | 295,641 | 561,240 | 2,692,538 | |||||||||||||||||||||||||||||||||||||||||||
486
Table of Contents
HSBC HOLDINGS PLC
Notes on the Financial Statements(continued)
| At 31 December 2012 | ||||||||||||||||||||||||||||||||||||||||||||||||||||
Due less than 1 month | Due between 1 and 3 months | Due between 3 and 6 months | Due between 6 and 9 months | Due between 9 months and 1 year | Due between 1 and 2 years | Due between 2 and 5 years | Due over 5 years | Total | ||||||||||||||||||||||||||||||||||||||||||||
| US$m | US$m | US$m | US$m | US$m | US$m | US$m | US$m | US$m | ||||||||||||||||||||||||||||||||||||||||||||
Financial liabilities | ||||||||||||||||||||||||||||||||||||||||||||||||||||
Hong Kong currency notes in circulation | 22,742 | – | – | – | – | – | – | – | 22,742 | |||||||||||||||||||||||||||||||||||||||||||
Deposits by banks | 79,100 | 12,029 | 1,957 | 437 | 2,155 | 1,695 | 9,440 | 616 | 107,429 | |||||||||||||||||||||||||||||||||||||||||||
– Repos | 6,593 | 4,645 | 711 | – | – | – | – | – | 11,949 | |||||||||||||||||||||||||||||||||||||||||||
– Other deposits by banks | 72,507 | 7,384 | 1,246 | 437 | 2,155 | 1,695 | 9,440 | 616 | 95,480 | |||||||||||||||||||||||||||||||||||||||||||
Customer accounts1 | 1,193,736 | 67,638 | 34,010 | 11,939 | 16,019 | 7,034 | 8,985 | 653 | 1,340,014 | |||||||||||||||||||||||||||||||||||||||||||
– Personal | 539,792 | 35,260 | 21,939 | 7,900 | 11,100 | 4,687 | 3,916 | 307 | 624,901 | |||||||||||||||||||||||||||||||||||||||||||
– Corporate and commercial | 473,370 | 24,018 | 9,044 | 2,925 | 3,354 | 1,069 | 1,193 | 305 | 515,278 | |||||||||||||||||||||||||||||||||||||||||||
– Financial | 180,574 | 8,360 | 3,027 | 1,114 | 1,565 | 1,278 | 3,876 | 41 | 199,835 | |||||||||||||||||||||||||||||||||||||||||||
Of which: repos | 22,446 | 3,869 | 1,047 | 345 | 567 | 344 | – | – | 28,618 | |||||||||||||||||||||||||||||||||||||||||||
Items in the course of transmission to other banks | 7,131 | 7 | – | – | – | – | – | – | 7,138 | |||||||||||||||||||||||||||||||||||||||||||
Trading liabilities | 240,212 | 29,003 | 4,707 | 1,820 | 5,197 | 3,867 | 9,736 | 10,021 | 304,563 | |||||||||||||||||||||||||||||||||||||||||||
– Repos | 96,690 | 27,002 | 3,319 | 985 | 2,227 | – | – | – | 130,223 | |||||||||||||||||||||||||||||||||||||||||||
– Debt securities in issue | 380 | 2,001 | 1,388 | 835 | 2,970 | 3,867 | 9,736 | 10,021 | 31,198 | |||||||||||||||||||||||||||||||||||||||||||
– Other trading liabilities | 143,142 | – | – | – | – | – | – | – | 143,142 | |||||||||||||||||||||||||||||||||||||||||||
Financial liabilities designated at fair value | 427 | 81 | 2,068 | 2,163 | 1,605 | 2,916 | 28,902 | 49,558 | 87,720 | |||||||||||||||||||||||||||||||||||||||||||
– Debt securities in issue: covered bonds | – | – | – | – | – | – | 4,633 | – | 4,633 | |||||||||||||||||||||||||||||||||||||||||||
– Debt securities in issue: otherwise secured | – | 8 | 2,023 | – | 22 | 2,040 | 228 | 221 | 4,542 | |||||||||||||||||||||||||||||||||||||||||||
– Debt securities in issue: unsecured | 392 | 49 | 1 | 2,117 | 1,357 | 690 | 23,495 | 15,933 | 44,034 | |||||||||||||||||||||||||||||||||||||||||||
– Subordinated liabilities and preferred securities | – | – | – | – | – | – | 21 | 21,538 | 21,559 | |||||||||||||||||||||||||||||||||||||||||||
– Other | 35 | 24 | 44 | 46 | 226 | 186 | 525 | 11,866 | 12,952 | |||||||||||||||||||||||||||||||||||||||||||
Derivatives | 352,696 | 75 | 43 | 29 | 2,408 | 628 | 1,212 | 1,795 | 358,886 | |||||||||||||||||||||||||||||||||||||||||||
– Trading | 352,195 | – | – | – | – | – | – | – | 352,195 | |||||||||||||||||||||||||||||||||||||||||||
– Non-trading | 501 | 75 | 43 | 29 | 2,408 | 628 | 1,212 | 1,795 | 6,691 | |||||||||||||||||||||||||||||||||||||||||||
Debt securities in issue | 23,738 | 12,368 | 6,355 | 2,840 | 27,992 | 11,992 | 29,100 | 5,076 | 119,461 | |||||||||||||||||||||||||||||||||||||||||||
– Covered bonds | – | – | 1,133 | 422 | 757 | 2,328 | 1,920 | 486 | 7,046 | |||||||||||||||||||||||||||||||||||||||||||
– Otherwise secured | 14,598 | 1,894 | – | 184 | 753 | 1,634 | 5,779 | 950 | 25,792 | |||||||||||||||||||||||||||||||||||||||||||
– Unsecured | 9,140 | 10,474 | 5,222 | 2,234 | 26,482 | 8,030 | 21,401 | 3,640 | 86,623 | |||||||||||||||||||||||||||||||||||||||||||
Liabilities of disposal groups held for sale | 2,475 | 242 | 433 | 254 | 188 | 166 | 45 | – | 3,803 | |||||||||||||||||||||||||||||||||||||||||||
Accruals | 3,369 | 4,173 | 907 | 521 | 1,200 | 232 | 419 | 842 | 11,663 | |||||||||||||||||||||||||||||||||||||||||||
Subordinated liabilities | 32 | 44 | – | 10 | – | 1,481 | 1,516 | 26,396 | 29,479 | |||||||||||||||||||||||||||||||||||||||||||
Other financial liabilities | 19,837 | 4,881 | 2,115 | 519 | 867 | 599 | 1,409 | 2,190 | 32,417 | |||||||||||||||||||||||||||||||||||||||||||
Total financial liabilities | 1,945,495 | 130,541 | 52,595 | 20,532 | 57,631 | 30,610 | 90,764 | 97,147 | 2,425,315 | |||||||||||||||||||||||||||||||||||||||||||
Non financial liabilities | – | – | – | – | – | – | – | 84,094 | 84,094 | |||||||||||||||||||||||||||||||||||||||||||
Total liabilities | 1,945,495 | 130,541 | 52,595 | 20,532 | 57,631 | 30,610 | 90,764 | 181,241 | 2,509,409 | |||||||||||||||||||||||||||||||||||||||||||
487
Table of Contents
HSBC HOLDINGS PLC
Notes on the Financial Statements(continued)
Maturity analysis of assets and liabilities (continued)
| At 31 December 2011 | ||||||||||||||||||||||||||||||||||||||||||||||||||||
Due less than 1 month | Due between 1 and 3 months | Due between 3 and 6 months | Due between 6 and 9 months | Due between 9 months and 1 year | Due between 1 and 2 years | Due between 2 and 5 years | Due over 5 years | Total | ||||||||||||||||||||||||||||||||||||||||||||
| US$m | US$m | US$m | US$m | US$m | US$m | US$m | US$m | US$m | ||||||||||||||||||||||||||||||||||||||||||||
Financial assets | ||||||||||||||||||||||||||||||||||||||||||||||||||||
Cash and balances at central banks | 129,902 | – | – | – | – | – | – | – | 129,902 | |||||||||||||||||||||||||||||||||||||||||||
Items in the course of collection from other banks | 8,208 | – | – | – | – | – | – | – | 8,208 | |||||||||||||||||||||||||||||||||||||||||||
Hong Kong Government certificates of indebtedness | 20,922 | – | – | – | – | – | – | – | 20,922 | |||||||||||||||||||||||||||||||||||||||||||
Trading assets | 318,031 | 7,432 | 1,712 | 225 | 3,033 | 18 | – | – | 330,451 | |||||||||||||||||||||||||||||||||||||||||||
– Reverse repos | 67,428 | 7,432 | 1,712 | 225 | 3,033 | 18 | – | – | 79,848 | |||||||||||||||||||||||||||||||||||||||||||
– Other trading assets | 250,603 | – | – | – | – | – | – | – | 250,603 | |||||||||||||||||||||||||||||||||||||||||||
Financial assets designated at fair value | 595 | 565 | 687 | 595 | 139 | 2,748 | 4,145 | 21,382 | 30,856 | |||||||||||||||||||||||||||||||||||||||||||
Derivatives | 343,980 | 155 | 275 | 136 | 423 | 606 | 605 | 199 | 346,379 | |||||||||||||||||||||||||||||||||||||||||||
– Trading | 342,914 | – | – | – | – | – | – | – | 342,914 | |||||||||||||||||||||||||||||||||||||||||||
– Non-trading | 1,066 | 155 | 275 | 136 | 423 | 606 | 605 | 199 | 3,465 | |||||||||||||||||||||||||||||||||||||||||||
Loans and advances to banks | 123,370 | 25,288 | 5,460 | 2,573 | 14,441 | 3,120 | 3,346 | 3,389 | 180,987 | |||||||||||||||||||||||||||||||||||||||||||
– Reverse repos | 35,372 | 3,854 | – | 1,047 | 135 | 1,301 | 201 | – | 41,910 | |||||||||||||||||||||||||||||||||||||||||||
– Other loans and advances to banks | 87,998 | 21,434 | 5,460 | 1,526 | 14,306 | 1,819 | 3,145 | 3,389 | 139,077 | |||||||||||||||||||||||||||||||||||||||||||
Loans and advances to customers | 211,680 | 70,941 | 45,294 | 28,769 | 53,251 | 63,518 | 186,601 | 280,375 | 940,429 | |||||||||||||||||||||||||||||||||||||||||||
– Personal | 47,609 | 8,314 | 6,912 | 5,975 | 7,674 | 19,005 | 66,525 | 221,851 | 383,865 | |||||||||||||||||||||||||||||||||||||||||||
– Corporate and commercial | 123,130 | 49,856 | 34,082 | 17,304 | 38,875 | 39,467 | 112,270 | 56,061 | 471,045 | |||||||||||||||||||||||||||||||||||||||||||
– Financial | 40,941 | 12,771 | 4,300 | 5,490 | 6,702 | 5,046 | 7,806 | 2,463 | 85,519 | |||||||||||||||||||||||||||||||||||||||||||
Of which: | ||||||||||||||||||||||||||||||||||||||||||||||||||||
– Reverse repos | 23,704 | 10,450 | 2,306 | 3,710 | – | 250 | 1,000 | – | 41,420 | |||||||||||||||||||||||||||||||||||||||||||
Financial investments | 25,546 | 50,070 | 39,698 | 14,879 | 21,902 | 45,266 | 90,953 | 111,730 | 400,044 | |||||||||||||||||||||||||||||||||||||||||||
Assets held for sale | 4,922 | 5,767 | 4,427 | 3,233 | 2,934 | 7,223 | 7,064 | 2,238 | 37,808 | |||||||||||||||||||||||||||||||||||||||||||
Accrued income | 2,787 | 2,479 | 765 | 393 | 361 | 231 | 339 | 1,596 | 8,951 | |||||||||||||||||||||||||||||||||||||||||||
Other financial assets | 8,878 | 3,403 | 2,084 | 785 | 2,771 | 513 | 140 | 5,466 | 24,040 | |||||||||||||||||||||||||||||||||||||||||||
Total financial assets | 1,198,821 | 166,100 | 100,402 | 51,588 | 99,255 | 123,243 | 293,193 | 426,375 | 2,458,977 | |||||||||||||||||||||||||||||||||||||||||||
Non financial assets | – | – | – | – | – | – | – | 96,602 | 96,602 | |||||||||||||||||||||||||||||||||||||||||||
Total assets | 1,198,821 | 166,100 | 100,402 | 51,588 | 99,255 | 123,243 | 293,193 | 522,977 | 2,555,579 | |||||||||||||||||||||||||||||||||||||||||||
488
Table of Contents
HSBC HOLDINGS PLC
Notes on the Financial Statements(continued)
| At 31 December 2011 | ||||||||||||||||||||||||||||||||||||||||||||||||||||
Due less than 1 month | Due between 1 and 3 months | Due between 3 and 6 months | Due between 6 and 9 months | Due between 9 months and 1 year | Due between 1 and 2 years | Due between 2 and 5 years | Due over 5 years | Total | ||||||||||||||||||||||||||||||||||||||||||||
| US$m | US$m | US$m | US$m | US$m | US$m | US$m | US$m | US$m | ||||||||||||||||||||||||||||||||||||||||||||
Financial liabilities | ||||||||||||||||||||||||||||||||||||||||||||||||||||
Hong Kong currency notes in circulation | 20,922 | – | – | – | – | – | – | – | 20,922 | |||||||||||||||||||||||||||||||||||||||||||
Deposits by banks | 84,091 | 12,056 | 2,145 | 1,406 | 1,673 | 1,681 | 8,938 | 832 | 112,822 | |||||||||||||||||||||||||||||||||||||||||||
– Repos | 16,301 | 336 | – | 979 | – | – | – | – | 17,616 | |||||||||||||||||||||||||||||||||||||||||||
– Other deposits by banks | 67,790 | 11,720 | 2,145 | 427 | 1,673 | 1,681 | 8,938 | 832 | 95,206 | |||||||||||||||||||||||||||||||||||||||||||
Customer accounts1 | 1,054,843 | 84,853 | 35,792 | 16,650 | 22,052 | 12,982 | 25,362 | 1,391 | 1,253,925 | |||||||||||||||||||||||||||||||||||||||||||
– Personal | 488,966 | 40,522 | 19,917 | 6,433 | 14,057 | 6,214 | 12,260 | 723 | 589,092 | |||||||||||||||||||||||||||||||||||||||||||
– Corporate and commercial | 405,015 | 32,088 | 12,754 | 9,148 | 3,933 | 5,484 | 8,272 | 599 | 477,293 | |||||||||||||||||||||||||||||||||||||||||||
– Financial | 160,862 | 12,243 | 3,121 | 1,069 | 4,062 | 1,284 | 4,830 | 69 | 187,540 | |||||||||||||||||||||||||||||||||||||||||||
Of which: repos | 13,299 | 6,921 | 3,444 | 5,330 | 1,412 | 379 | – | – | 30,785 | |||||||||||||||||||||||||||||||||||||||||||
Items in the course of transmission to other banks | 8,745 | – | – | – | – | – | – | – | 8,745 | |||||||||||||||||||||||||||||||||||||||||||
Trading liabilities | 228,365 | 7,757 | 1,782 | 726 | 6,794 | 4,185 | 8,418 | 7,165 | 265,192 | |||||||||||||||||||||||||||||||||||||||||||
– Repos | 77,900 | 6,056 | 716 | – | 2,160 | 6 | – | – | 86,838 | |||||||||||||||||||||||||||||||||||||||||||
– Debt securities in issue | 2,098 | 1,701 | 1,066 | 726 | 4,634 | 4,179 | 8,418 | 7,165 | 29,987 | |||||||||||||||||||||||||||||||||||||||||||
– Other trading liabilities | 148,367 | – | – | – | – | – | – | – | 148,367 | |||||||||||||||||||||||||||||||||||||||||||
Financial liabilities designated at fair value | 39 | 22 | 2,846 | 430 | 5,923 | 4,575 | 24,857 | 47,032 | 85,724 | |||||||||||||||||||||||||||||||||||||||||||
– Debt securities in issue: covered bonds | – | – | – | – | 2 | – | 2,263 | 374 | 2,639 | |||||||||||||||||||||||||||||||||||||||||||
– Debt securities in issue: otherwise secured | – | – | – | – | – | 2,164 | 2,013 | 109 | 4,286 | |||||||||||||||||||||||||||||||||||||||||||
– Debt securities in issue: unsecured | – | – | 2,802 | 385 | 3,115 | 2,093 | 20,091 | 16,786 | 45,272 | |||||||||||||||||||||||||||||||||||||||||||
– Subordinated liabilities and preferred securities | – | – | – | – | 2,765 | 1 | 17 | 18,828 | 21,611 | |||||||||||||||||||||||||||||||||||||||||||
– Other | 39 | 22 | 44 | 45 | 41 | 317 | 473 | 10,935 | 11,916 | |||||||||||||||||||||||||||||||||||||||||||
Derivatives | 339,092 | 103 | 68 | 19 | 144 | 389 | 1,202 | 4,363 | 345,380 | |||||||||||||||||||||||||||||||||||||||||||
– Trading | 338,788 | – | – | – | – | – | – | – | 338,788 | |||||||||||||||||||||||||||||||||||||||||||
– Non-trading | 304 | 103 | 68 | 19 | 144 | 389 | 1,202 | 4,363 | 6,592 | |||||||||||||||||||||||||||||||||||||||||||
Debt securities in issue | 31,806 | 15,900 | 4,920 | 5,577 | 15,926 | 14,438 | 36,120 | 6,326 | 131,013 | |||||||||||||||||||||||||||||||||||||||||||
– Covered bonds | 4 | 627 | 383 | 52 | 1,548 | 2,277 | 4,133 | 1,119 | 10,143 | |||||||||||||||||||||||||||||||||||||||||||
– Otherwise secured | 17,869 | 5,293 | 273 | 387 | 392 | 704 | 3,894 | 2,171 | 30,983 | |||||||||||||||||||||||||||||||||||||||||||
– Unsecured | 13,933 | 9,980 | 4,264 | 5,138 | 13,986 | 11,457 | 28,093 | 3,036 | 89,887 | |||||||||||||||||||||||||||||||||||||||||||
Liabilities of disposal groups held for sale | 16,412 | 1,164 | 462 | 225 | 2,536 | 343 | 297 | 561 | 22,000 | |||||||||||||||||||||||||||||||||||||||||||
Accruals | 3,141 | 4,921 | 1,142 | 443 | 707 | 415 | 384 | 646 | 11,799 | |||||||||||||||||||||||||||||||||||||||||||
Subordinated liabilities | 129 | – | – | 300 | 381 | 10 | 3,026 | 26,760 | 30,606 | |||||||||||||||||||||||||||||||||||||||||||
Other financial liabilities | 12,403 | 5,415 | 2,419 | 835 | 1,576 | 814 | 626 | 1,823 | 25,911 | |||||||||||||||||||||||||||||||||||||||||||
Total financial liabilities | 1,799,988 | 132,191 | 51,576 | 26,611 | 57,712 | 39,832 | 109,230 | 96,899 | 2,314,039 | |||||||||||||||||||||||||||||||||||||||||||
Non financial liabilities | – | – | – | – | – | – | – | 75,447 | 75,447 | |||||||||||||||||||||||||||||||||||||||||||
Total liabilities | 1,799,988 | 132,191 | 51,576 | 26,611 | 57,712 | 39,832 | 109,230 | 172,346 | 2,389,486 | |||||||||||||||||||||||||||||||||||||||||||
| 1 | Includes US$366,203m (2011: US$387,655m) insured by guarantee schemes |
489
Table of Contents
HSBC HOLDINGS PLC
Notes on the Financial Statements(continued)
Maturity analysis of off-balance sheet commitments received
Due less than 1 month | Due between 1 and 3 months | Due between 3 and 6 months | Due between 6 and 9 months | Due between 9 months and 1 year | Due between 1 and 2 years | Due between 2 and 5 years | Due over 5 years | Total | ||||||||||||||||||||||||||||||||||||||||||||
| US$m | US$m | US$m | US$m | US$m | US$m | US$m | US$m | US$m | ||||||||||||||||||||||||||||||||||||||||||||
At 31 December 2012 | ||||||||||||||||||||||||||||||||||||||||||||||||||||
Loan and other credit-related commitments | 2,455 | 3 | 8 | 5 | 8 | 25 | 75 | 98 | 2,677 | |||||||||||||||||||||||||||||||||||||||||||
At 31 December 2011 | ||||||||||||||||||||||||||||||||||||||||||||||||||||
Loan and other credit-related commitments | 5,280 | 2 | 36 | 3 | 6 | 19 | 508 | 143 | 5,997 | |||||||||||||||||||||||||||||||||||||||||||
Maturity analysis of off-balance sheet commitments given
| ||||||||||||||||||||||||||||||||||||||||||||||||||||
Due less than 1 month | Due between 1 and 3 months | Due between 3 and 6 months | Due between 6 and 9 months | Due between 9 months and 1 year | Due between 1 and 2 years | Due between 2 and 5 years | Due over 5 years | Total | ||||||||||||||||||||||||||||||||||||||||||||
| US$m | US$m | US$m | US$m | US$m | US$m | US$m | US$m | US$m | ||||||||||||||||||||||||||||||||||||||||||||
At 31 December 2012 | ||||||||||||||||||||||||||||||||||||||||||||||||||||
Loan and other credit-related commitments | 408,815 | 43,394 | 8,389 | 5,191 | 37,751 | 11,598 | 45,910 | 18,421 | 579,469 | |||||||||||||||||||||||||||||||||||||||||||
Of which: | ||||||||||||||||||||||||||||||||||||||||||||||||||||
– Personal | 153,255 | 6,999 | 704 | 185 | 19,049 | 1,216 | 1,616 | 8,159 | 191,183 | |||||||||||||||||||||||||||||||||||||||||||
– Corporate and commercial | 225,899 | 34,368 | 6,365 | 4,951 | 15,412 | 9,488 | 37,179 | 8,593 | 342,255 | |||||||||||||||||||||||||||||||||||||||||||
– Financial | 29,661 | 2,027 | 1,320 | 55 | 3,290 | 894 | 7,115 | 1,669 | 46,031 | |||||||||||||||||||||||||||||||||||||||||||
At 31 December 2011 | ||||||||||||||||||||||||||||||||||||||||||||||||||||
Loan and other credit-related commitments | 373,426 | 47,187 | 20,076 | 35,673 | 38,368 | 32,230 | 78,831 | 29,113 | 654,904 | |||||||||||||||||||||||||||||||||||||||||||
Of which: | ||||||||||||||||||||||||||||||||||||||||||||||||||||
– Personal | 246,570 | 7,569 | 2,124 | 4,848 | 4,431 | 7,507 | 12,262 | 7,706 | 293,017 | |||||||||||||||||||||||||||||||||||||||||||
– Corporate and commercial | 114,741 | 36,866 | 15,289 | 19,589 | 25,890 | 20,767 | 57,853 | 18,281 | 309,276 | |||||||||||||||||||||||||||||||||||||||||||
– Financial | 12,115 | 2,752 | 2,663 | 11,236 | 8,047 | 3,956 | 8,716 | 3,126 | 52,611 | |||||||||||||||||||||||||||||||||||||||||||
490
Table of Contents
HSBC HOLDINGS PLC
Notes on the Financial Statements(continued)
HSBC Holdings
Maturity analysis of assets, liabilities and off-balance sheet commitments
| At 31 December 2012 | ||||||||||||||||||||||||||||||||||||||||||||||||||||
Due less than 1 month | Due between 1 and 3 months | Due between 3 and 6 months | Due between 6 and 9 months | Due between 9 months and 1 year | Due between 1 and 2 years | Due between 2 and 5 years | Due over 5 years | Total | ||||||||||||||||||||||||||||||||||||||||||||
| US$m | US$m | US$m | US$m | US$m | US$m | US$m | US$m | US$m | ||||||||||||||||||||||||||||||||||||||||||||
Financial assets | ||||||||||||||||||||||||||||||||||||||||||||||||||||
Cash at bank and in hand: | ||||||||||||||||||||||||||||||||||||||||||||||||||||
– balances with HSBC undertakings | 353 | – | – | – | – | – | – | – | 353 | |||||||||||||||||||||||||||||||||||||||||||
Derivatives | 3,768 | – | – | – | – | – | – | – | 3,768 | |||||||||||||||||||||||||||||||||||||||||||
Loans and advances to HSBC undertakings | 6,275 | 2,395 | 3,992 | – | 15 | 35 | 635 | 28,328 | 41,675 | |||||||||||||||||||||||||||||||||||||||||||
Financial investments | 23 | – | 8 | – | – | – | – | 1,177 | 1,208 | |||||||||||||||||||||||||||||||||||||||||||
Other financial assets | 4 | – | – | – | – | – | – | – | 4 | |||||||||||||||||||||||||||||||||||||||||||
Total financial assets | 10,423 | 2,395 | 4,000 | – | 15 | 35 | 635 | 29,505 | 47,008 | |||||||||||||||||||||||||||||||||||||||||||
Non financial assets | – | – | – | – | – | – | – | 92,476 | 92,476 | |||||||||||||||||||||||||||||||||||||||||||
Total assets | 10,423 | 2,395 | 4,000 | – | 15 | 35 | 635 | 121,981 | 139,484 | |||||||||||||||||||||||||||||||||||||||||||
Financial liabilities | ||||||||||||||||||||||||||||||||||||||||||||||||||||
Amounts owing to HSBC undertakings | 3,576 | 19 | 980 | – | – | – | 1,333 | 6,948 | 12,856 | |||||||||||||||||||||||||||||||||||||||||||
Financial liabilities designated at fair value | – | – | – | – | – | 1,258 | 21,937 | 23,195 | ||||||||||||||||||||||||||||||||||||||||||||
– Debt securities in issue | – | – | – | – | – | – | 1,258 | 7,319 | 8,577 | |||||||||||||||||||||||||||||||||||||||||||
– Subordinated liabilities and preferred securities | – | – | – | – | – | – | – | 14,618 | 14,618 | |||||||||||||||||||||||||||||||||||||||||||
Derivatives | 760 | – | – | – | – | – | – | – | 760 | |||||||||||||||||||||||||||||||||||||||||||
Debt securities in issue | – | – | – | – | – | 1,646 | – | 1,045 | 2,691 | |||||||||||||||||||||||||||||||||||||||||||
Accruals | 223 | 171 | 190 | 21 | – | – | – | – | 605 | |||||||||||||||||||||||||||||||||||||||||||
Subordinated liabilities | – | – | – | – | – | – | – | 11,907 | 11,907 | |||||||||||||||||||||||||||||||||||||||||||
Total financial liabilities | 4,559 | 190 | 1,170 | 21 | – | 1,646 | 2,591 | 41,837 | 52,014 | |||||||||||||||||||||||||||||||||||||||||||
Non financial liabilities | – | – | – | – | – | – | – | 443 | 443 | |||||||||||||||||||||||||||||||||||||||||||
Total liabilities | 4,559 | 190 | 1,170 | 21 | – | 1,646 | 2,591 | 42,280 | 52,457 | |||||||||||||||||||||||||||||||||||||||||||
Off-balance sheet commitments given | ||||||||||||||||||||||||||||||||||||||||||||||||||||
Undrawn formal standby facilities, credit lines and other commitments to lend | 1,200 | – | – | – | – | – | – | – | 1,200 | |||||||||||||||||||||||||||||||||||||||||||
491
Table of Contents
HSBC HOLDINGS PLC
Notes on the Financial Statements(continued)
Maturity analysis of assets, liabilities and off-balance sheet commitments (continued)
| At 31 December 2011 | ||||||||||||||||||||||||||||||||||||||||||||||||||||
Due less than 1 month | Due between 1 and 3 months | Due between 3 and 6 months | Due between 6 and 9 months | Due between 9 months and 1 year | Due between 1 and 2 years | Due between 2 and 5 years | Due over 5 years | Total | ||||||||||||||||||||||||||||||||||||||||||||
| US$m | US$m | US$m | US$m | US$m | US$m | US$m | US$m | US$m | ||||||||||||||||||||||||||||||||||||||||||||
Financial assets | ||||||||||||||||||||||||||||||||||||||||||||||||||||
Cash at bank and in hand: | ||||||||||||||||||||||||||||||||||||||||||||||||||||
– balances with HSBC undertakings | 316 | – | – | – | – | – | – | – | 316 | |||||||||||||||||||||||||||||||||||||||||||
Derivatives | 3,568 | – | – | – | – | – | – | – | 3,568 | |||||||||||||||||||||||||||||||||||||||||||
Loans and advances to HSBC undertakings | 5,518 | 973 | 4,028 | 366 | 1,312 | – | 1,994 | 13,857 | 28,048 | |||||||||||||||||||||||||||||||||||||||||||
Financial investments | 22 | – | 9 | – | – | – | – | 1,047 | 1,078 | |||||||||||||||||||||||||||||||||||||||||||
Other financial assets | 1 | – | – | – | – | – | – | – | 1 | |||||||||||||||||||||||||||||||||||||||||||
Total financial assets | 9,425 | 973 | 4,037 | 366 | 1,312 | – | 1,994 | 14,904 | 33,011 | |||||||||||||||||||||||||||||||||||||||||||
Non financial assets | – | – | – | – | – | – | – | 90,851 | 90,851 | |||||||||||||||||||||||||||||||||||||||||||
Total assets | 9,425 | 973 | 4,037 | 366 | 1,312 | – | 1,994 | 105,755 | 123,862 | |||||||||||||||||||||||||||||||||||||||||||
Financial liabilities | �� | |||||||||||||||||||||||||||||||||||||||||||||||||||
Amounts owing to HSBC undertakings | 1,101 | – | 64 | – | – | – | 1,314 | – | 2,479 | |||||||||||||||||||||||||||||||||||||||||||
Financial liabilities designated at fair value | – | – | – | – | 2,765 | – | 1,177 | 17,209 | 21,151 | |||||||||||||||||||||||||||||||||||||||||||
– Debt securities in issue | – | – | – | – | – | – | 1,177 | 4,576 | 5,753 | |||||||||||||||||||||||||||||||||||||||||||
– Subordinated liabilities and preferred securities | – | – | – | – | 2,765 | – | – | 12,633 | 15,398 | |||||||||||||||||||||||||||||||||||||||||||
Derivatives | 1,067 | – | – | – | – | – | – | – | 1,067 | |||||||||||||||||||||||||||||||||||||||||||
Debt securities in issue | – | – | – | – | – | – | 1,612 | 1,001 | 2,613 | |||||||||||||||||||||||||||||||||||||||||||
Accruals | 200 | 167 | 188 | 20 | – | – | – | – | 575 | |||||||||||||||||||||||||||||||||||||||||||
Subordinated liabilities | – | – | – | – | – | – | – | 12,450 | 12,450 | |||||||||||||||||||||||||||||||||||||||||||
Other financial liabilities | 885 | – | – | – | – | – | – | – | 885 | |||||||||||||||||||||||||||||||||||||||||||
Total financial liabilities | 3,253 | 167 | 252 | 20 | 2,765 | – | 4,103 | 30,660 | 41,220 | |||||||||||||||||||||||||||||||||||||||||||
Non financial liabilities | – | – | – | – | – | – | – | 459 | 459 | |||||||||||||||||||||||||||||||||||||||||||
Total liabilities | 3,253 | 167 | 252 | 20 | 2,765 | – | 4,103 | 31,119 | 41,679 | |||||||||||||||||||||||||||||||||||||||||||
Off-balance sheet commitments given | ||||||||||||||||||||||||||||||||||||||||||||||||||||
Undrawn formal standby facilities, credit lines and other commitments to lend | 1,810 | – | – | – | – | – | – | – | 1,810 | |||||||||||||||||||||||||||||||||||||||||||
492
Table of Contents
HSBC HOLDINGS PLC
Notes on the Financial Statements(continued)
| 35 | Foreign exchange exposures |
Structural foreign exchange exposures
HSBC’s structural foreign exchange exposures are represented by the net asset value of its foreign exchange equity and subordinated debt investments in subsidiaries, branches, joint ventures and associates with non-US dollar functional currencies. Gains or losses on structural foreign exchange exposures are recognised in other comprehensive income. HSBC’s management of its structural foreign exchange exposures is discussed on page 268.
In its separate financial statements, HSBC Holdings recognises its foreign exchange gains and losses on structural foreign exchange exposures in the income statement.
Net structural foreign exchange exposures
| At 31 December | ||||||||||
2012 US$m | 2011 US$m | |||||||||
Currency of structural exposure | ||||||||||
Pound sterling | 27,305 | 22,668 | ||||||||
Euro | 23,945 | 22,400 | ||||||||
Chinese renminbi | 19,060 | 21,234 | ||||||||
Hong Kong dollars | 14,466 | 4,828 | ||||||||
Brazilian reais | 6,279 | 6,097 | ||||||||
Mexican pesos | 5,948 | 5,319 | ||||||||
Canadian dollars | 5,024 | 4,848 | ||||||||
Indian rupees | 3,967 | 3,967 | ||||||||
Swiss francs | 2,925 | 2,133 | ||||||||
UAE dirhams | 2,807 | 2,650 | ||||||||
Saudi riyals | 2,219 | 1,965 | ||||||||
Malaysian ringgit | 2,165 | 1,829 | ||||||||
Turkish lira | 1,787 | 1,565 | ||||||||
Australian dollars | 1,602 | 1,455 | ||||||||
Korean won | 1,520 | 1,411 | ||||||||
Taiwanese dollars | 1,513 | 1,457 | ||||||||
Indonesian rupiah | 1,317 | 1,235 | ||||||||
Argentine pesos | 1,054 | 984 | ||||||||
Egyptian pounds | 699 | 692 | ||||||||
Vietnamese dong | 762 | 686 | ||||||||
Singapore dollars | 874 | 670 | ||||||||
Philippine pesos | 787 | 663 | ||||||||
Thailand baht | 653 | 484 | ||||||||
Qatari rial | 599 | 608 | ||||||||
Others, each less than US$500m | 4,169 | 4,167 | ||||||||
Total | 133,446 | 116,015 | ||||||||
Shareholders’ equity would decrease by US$2,562m (2011: US$2,146m) if euro and sterling foreign currency exchange rates weakened by 5% relative to the US dollar.
| 36 | Assets charged as security for liabilities and collateral accepted as security for assets |
Financial assets pledged to secure liabilities
| Assets pledged at 31 December | ||||||||||
2012 US$m | 2011 US$m | |||||||||
Treasury bills and other eligible securities | 4,381 | 5,185 | ||||||||
Loans and advances to banks | 22,074 | 19,247 | ||||||||
Loans and advances to customers | 81,333 | 81,570 | ||||||||
Debt securities | 198,671 | 210,255 | ||||||||
Equity shares | 6,255 | 6,916 | ||||||||
Other | 1,090 | 1,003 | ||||||||
| 313,804 | 324,176 | |||||||||
The table above shows assets over which a legal charge has been granted to secure liabilities. The amount of such assets may be greater than the book value of assets utilised as collateral for funding purposes or to cover liabilities. This is the case for securitisations and covered bonds where the amount of liabilities issued, plus any mandatory over-collateralisation, is less than the book value of financial assets available for funding or collateral purposes in the
493
Table of Contents
HSBC HOLDINGS PLC
Notes on the Financial Statements(continued)
relevant pool of assets. This is also the case where financial assets are placed with a custodian or settlement agent, which has a floating charge over all the financial assets placed to secure any liabilities under settlement accounts.
These transactions are conducted under terms that are usual and customary to collateralised transactions, including, where relevant, standard securities lending and repurchase agreements.
Collateral accepted as security for assets
The fair value of assets accepted as collateral that HSBC is permitted to sell or repledge in the absence of default is US$295,709m (2011: US$302,285m). The fair value of any such collateral that has been sold or repledged was US$202,662m (2011: US$188,682m). HSBC is obliged to return equivalent securities.
These transactions are conducted under terms that are usual and customary to standard securities borrowing and reverse repurchase agreements.
| 37 | Non-controlling interests |
| At 31 December | ||||||||||
2012 US$m | 2011 US$m | |||||||||
Non-controlling interests attributable to holders of ordinary shares in subsidiaries | 5,159 | 4,656 | ||||||||
Preferred securities issued by subsidiaries | 2,728 | 2,712 | ||||||||
| 7,887 | 7,368 | |||||||||
Preferred securities issued by subsidiaries
Preferred securities are securities for which there is no obligation to pay a dividend and, if not paid, the dividend may not be cumulative. Such securities do not generally carry voting rights but rank higher than ordinary shares for dividend payments and in the event of a winding-up. These securities have no stated maturity date but may be called and redeemed by the issuer, subject to prior notification to the FSA and, where relevant, the consent of the local banking regulator. Dividends on the floating rate preferred securities are generally related to interbank offer rates.
Included in the capital base of HSBC are non-cumulative preferred securities classified as tier 1 capital and cumulative preferred securities classified as tier 2 capital in accordance with the rules and guidance in the FSA’s GENPRU.
HSBC’s subsidiaries have the following preferred securities in issue:
| At 31 December | ||||||||||||||||
First call date | 2012 US$m | 2011 US$m | ||||||||||||||
| HSBC USA Inc. | ||||||||||||||||
| US$150m | Depositary shares each representing 25% interest in a share of adjustable-rate cumulative preferred stock, series D | Jul 1999 | 150 | 150 | ||||||||||||
| US$150m | Cumulative preferred stock | Oct 2007 | 150 | 150 | ||||||||||||
| US$518m | Floating rate non-cumulative preferred stock, series F | Apr 2010 | 518 | 518 | ||||||||||||
| US$374m | Floating rate non-cumulative preferred stock, series G | Jan 2011 | 374 | 374 | ||||||||||||
| US$374m | 6.50% non-cumulative preferred stock, series H | Jul 2011 | 374 | 374 | ||||||||||||
| HSBC Finance Corporation | ||||||||||||||||
| US$575m | 6.36% non-cumulative preferred stock, series B | Jun 2010 | 559 | 559 | ||||||||||||
| HSBC Bank Canada | ||||||||||||||||
| CAD175m | Non-cumulative redeemable class 1 preferred shares, series C | Jun 2010 | 176 | 171 | ||||||||||||
| CAD175m | Non-cumulative class 1 preferred shares, series D | Dec 2010 | 176 | 171 | ||||||||||||
| CAD250m | Non-cumulative 5 year rate reset class 1 preferred shares, series E | Jun 2014 | 251 | 245 | ||||||||||||
| 2,728 | 2,712 | |||||||||||||||
494
Table of Contents
HSBC HOLDINGS PLC
Notes on the Financial Statements(continued)
| 38 | Called up share capital and other equity instruments |
Issued and fully paid
| At 31 December | ||||||||||
2012 US$m | 2011 US$m | |||||||||
HSBC Holdings ordinary shares1 | 9,238 | 8,934 | ||||||||
| Number | US$m | |||||||||
HSBC Holdings ordinary shares of US$0.50 each | ||||||||||
At 1 January 2012 | 17,868,085,646 | 8,934 | ||||||||
Shares issued under HSBC employee share plans | 238,587,766 | 119 | ||||||||
Shares issued in lieu of dividends | 369,335,252 | 185 | ||||||||
At 31 December 2012 | 18,476,008,664 | 9,238 | ||||||||
At 1 January 2011 | 17,686,155,902 | 8,843 | ||||||||
Shares issued under HSBC employee share plans | 11,354,577 | 6 | ||||||||
Shares issued in lieu of dividends | 170,575,167 | 85 | ||||||||
At 31 December 2011 | 17,868,085,646 | 8,934 | ||||||||
| Number | US$m | |||||||||
HSBC Holdings non-cumulative preference shares of US$0.01 each | ||||||||||
At 1 January 2012 and 31 December 20122 | 1,450,000 | – | ||||||||
At 1 January 2011 and 31 December 2011 | 1,450,000 | – | ||||||||
| 1 | All HSBC Holdings ordinary shares in issue confer identical rights in respect of capital, dividends, voting and otherwise. |
| 2 | Included in the capital base of HSBC as tier 1 capital in accordance with the rules and guidance in GENPRU. |
Dividends on the HSBC Holdings non-cumulative dollar preference shares in issue (‘dollar preference shares’) are paid quarterly at the sole and absolute discretion of the Board of Directors. The Board of Directors will not declare a dividend on the dollar preference shares if payment of the dividend would cause HSBC Holdings not to meet the applicable capital adequacy requirements of the FSA or the profit of HSBC Holdings available for distribution as dividends is not sufficient to enable HSBC Holdings to pay in full both dividends on the dollar preference shares and dividends on any other shares that are scheduled to be paid on the same date and that have an equal right to dividends. HSBC Holdings may not declare or pay dividends on any class of its shares ranking lower in the right to dividends than the dollar preference shares nor redeem nor purchase in any manner any of its other shares ranking equal with or lower than the dollar preference shares unless it has paid in full, or set aside an amount to provide for payment in full, the dividends on the dollar preference shares for the then-current dividend period. The dollar preference shares carry no rights to conversion into ordinary shares of HSBC Holdings. Holders of the dollar preference shares will only be entitled to attend and vote at general meetings of shareholders of HSBC Holdings if the dividend payable on the dollar preference shares has not been paid in full for four consecutive dividend payment dates. In such circumstances, holders of the dollar preference shares will be entitled to vote on all matters put to general meetings until such time as HSBC Holdings has paid a full dividend on the dollar preference shares. HSBC Holdings may redeem the dollar preference shares in whole at any time on or after 16 December 2010, subject to prior notification to the FSA.
HSBC Holdings non-cumulative preference shares of £0.01 each
The one non-cumulative sterling preference share of £0.01 in issue (‘sterling preference share’) has been in issue since 29 December 2010 and is held by a subsidiary of HSBC Holdings. Dividends on the sterling preference share are paid quarterly at the sole and absolute discretion of the Board. The sterling preference share carries no rights of conversion into ordinary shares of HSBC Holdings and no rights to attend and vote at general meetings of shareholders of HSBC Holdings. HSBC Holdings may redeem it in whole at any time at the option of the Company.
Other equity instruments
Other equity instruments which have been included in the capital base of HSBC were issued in accordance with the rules and guidance in the FSA’s GENPRU. These securities may be called and redeemed by HSBC subject to prior notification to the FSA. If not redeemed at the first call date interest coupons remain unchanged.
495
Table of Contents
HSBC HOLDINGS PLC
Notes on the Financial Statements(continued)
Tier 1 capital securities
Tier 1 capital securities are perpetual subordinated securities on which coupon payments may be deferred at the discretion of HSBC Holdings. While any coupon payments are unpaid or deferred, HSBC Holdings will not declare, pay dividends or make distributions or similar periodic payments in respect of, or repurchase, redeem or otherwise acquire any securities of lower or equal rank. Such securities do not generally carry voting rights but rank higher than ordinary shares for coupon payments and in the event of a winding-up.
At HSBC Holdings’ discretion, and subject to certain conditions being satisfied, the capital securities may be exchanged on any coupon payment date for non-cumulative preference shares to be issued by HSBC Holdings and which would rankpari passuwith the dollar and sterling preference shares in issue. The preference shares will be issued at a nominal value of US$0.01 per share and a premium of US$24.99 per share, with both such amounts being subscribed and fully paid.
HSBC has the following qualifying tier 1 capital securities in issue which are accounted for in equity:
| At 31 December | ||||||||||||||||
First call date | 2012 US$m | 2011 US$m | ||||||||||||||
| US$2,200m | 8.125% perpetual subordinated capital securities | Apr 2013 | 2,133 | 2,133 | ||||||||||||
| US$3,800m | 8.00% perpetual subordinated capital securities, Series 2 | Dec 2015 | 3,718 | 3,718 | ||||||||||||
| 5,851 | 5,851 | |||||||||||||||
Shares under option
Details of the options outstanding to subscribe for HSBC Holdings ordinary shares under the HSBC Holdings Group Share Option Plan, the HSBC Share Plan and HSBC Holdings savings-related share option plans are given in Note 7.
Aggregate options outstanding under these plans
Number of HSBC Holdings | Period of exercise | Exercise price | ||||||||||
31 December 2012 | 159,703,771 | 2013 to 2018 | £3.3116 – 7.9911 | |||||||||
| 31,637,840 | 2013 to 2018 | HK$37.8797 – 94.5057 | ||||||||||
| 2,180,263 | 2013 to 2018 | €3.6361 – 9.5912 | ||||||||||
| 6,488,894 | 2013 to 2018 | US$4.8876 – 12.0958 | ||||||||||
31 December 2011 | 216,078,250 | 2012 to 2017 | £3.3116 – 7.9911 | |||||||||
| 45,422,511 | 2012 to 2017 | HK$37.8797 – 94.5057 | ||||||||||
| 3,176,265 | 2012 to 2017 | €3.6361 – 9.5912 | ||||||||||
| 9,752,066 | 2012 to 2017 | US$4.8876 – 12.0958 | ||||||||||
31 December 2010 | 249,242,968 | 2011 to 2016 | £3.3116 – 8.4024 | |||||||||
| 47,428,892 | 2011 to 2016 | HK$37.8797 – 94.5057 | ||||||||||
| 3,128,508 | 2011 to 2016 | €3.6361 – 9.5912 | ||||||||||
| 10,899,415 | 2011 to 2016 | US$4.8876 – 12.0958 | ||||||||||
HSBC France plan
When it was acquired in 2000, HSBC France and certain of its subsidiary companies, including HSBC Private Bank France, operated employee share option plans under which options could be granted over their respective shares. There were outstanding options over the shares of HSBC Private Bank France, a subsidiary of HSBC France. On exercise of those options, the HSBC Private Bank France shares were exchangeable for HSBC Holdings ordinary shares at the ratio of 2.099984 HSBC Holdings ordinary shares for each HSBC Private Bank France share.
On 31 October 2011, HSBC Private Bank France merged with HSBC France. Options held over shares of HSBC Private Bank France were converted into options over shares of HSBC France, at an exchange ratio of 7 HSBC France shares for 45 HSBC Private Bank France shares. The options outstanding at 31 October 2011 were adjusted to reflect the option exchange ratio. On exercise of these options, HSBC France shares would have been exchanged for HSBC Holdings ordinary shares in the ratio of 13.499897 HSBC Holdings ordinary shares for each HSBC France share.
496
Table of Contents
HSBC HOLDINGS PLC
Notes on the Financial Statements(continued)
During 2011 and 2012 there were no HSBC Private Bank France shares issued and no shares were exchanged for HSBC Holdings ordinary shares. During 2012, 22,645 options over HSBC France shares lapsed (2011: 141,525). At 31 December 2012 no options over HSBC France shares were outstanding.
At 31 December 2012, The CCF Employee Benefit Trust 2001 (Private Banking France) held 989,502 (2011: 989,502) HSBC Holdings ordinary shares.
HSBC France options outstanding over HSBC Holdings ordinary shares
Number of HSBC France shares exchangeable for HSBC Holdings ordinary shares | Period of exercise | Exercise price | ||||||||||
31 December 2012 | – | 2012 | €142.84 | |||||||||
31 December 20111 | 22,645 | 2012 | €142.84 | |||||||||
31 December 2010 | 287,100 | 2011 to 2012 | €20.80 – 22.22 | |||||||||
| 1 | These options replaced the options over shares in HSBC Private Bank France which were outstanding on 31 October 2011 prior to the merger taking place. |
HSBC Finance
Upon the acquisition of HSBC Finance in 2003, all outstanding options over, and rights to receive, HSBC Finance common shares were converted into options over, and rights to receive, HSBC Holdings ordinary shares in the same ratio as the share exchange offer for the acquisition of HSBC Finance (2.675 HSBC Holdings ordinary shares for each HSBC Finance common share). The exercise price payable for each option was adjusted using the same ratio.
During 2012, 2,053,838 (2011: nil) options were exercised over HSBC Holdings ordinary shares and 2,053,838 (2011: nil) HSBC Holdings ordinary shares were delivered from The HSBC (Household) Employee Benefit Trust 2003. During 2012, options over 375,700 (2011: 8,688,288) HSBC Holdings ordinary shares lapsed. At 31 December 2012 no options over HSBC Holdings ordinary share were outstanding.
At 31 December 2012, The HSBC (Household) Employee Benefit Trust 2003 held a total of 281,477 (2011: 2,335,315) HSBC Holdings ordinary shares and 1,455 (2011: 1,455) ADSs. Each ADS represents five HSBC Holdings ordinary shares.
Options outstanding over HSBC Holdings ordinary shares under the HSBC Finance share plan
Number of HSBC Holdings | Period of exercise | Exercise price | ||||||||||
31 December 2012 | – | 2012 | US$9.29 | |||||||||
31 December 2011 | 2,429,538 | 2012 | US$9.29 | |||||||||
31 December 2010 | 11,117,826 | 2011 to 2012 | US$9.29 – 18.62 | |||||||||
HSBC Bank Bermuda plans
Upon the acquisition of HSBC Bank Bermuda Limited (‘HSBC Bank Bermuda’) in 2004, all outstanding options over HSBC Bank Bermuda shares were converted into options to acquire HSBC Holdings ordinary shares using an exchange ratio calculated by dividing US$40 (being the consideration paid for each HSBC Bank Bermuda Share) by the average price of HSBC Holdings ordinary shares over the five-day period to the completion of the acquisition. The exercise price payable for each option was adjusted using the same exchange ratio.
During 2011 and 2012 there were no options exercised over HSBC Holdings ordinary shares and no shares were delivered from the HSBC (Bank of Bermuda) Employee Benefit Trust 2004. During 2012, options over 880,983 (2011: 2,108,830) HSBC Holdings ordinary shares lapsed.
At 31 December 2012, the HSBC (Bank of Bermuda) Employee Benefit Trust 2004 held 2,108,830 (2011: 2,108,830) HSBC Holdings ordinary shares which may be used to satisfy the exercise of employee options.
497
Table of Contents
HSBC HOLDINGS PLC
Notes on the Financial Statements(continued)
Options outstanding over HSBC Holdings ordinary shares under the HSBC Bank Bermuda share plan
| Number of HSBC Holdings ordinary shares | Period of exercise | Exercise price | ||||||||||
31 December 2012 | 149,924 | 2013 | US$9.32 – 10.33 | |||||||||
31 December 2011 | 1,030,907 | 2012 to 2013 | US$9.32 – 15.99 | |||||||||
31 December 2010 | 2,339,033 | 2011 to 2013 | US$9.32 – 15.99 | |||||||||
Maximum obligation to deliver HSBC Holdings ordinary shares
At 31 December 2012, the maximum obligation to deliver HSBC Holdings ordinary shares under all of the above option arrangements, together with GPSP awards and restricted share awards granted under the HSBC Share Plan and/or the HSBC Share Plan 2011, was 364,082,766 (2011: 538,265,410). The total number of shares at 31 December 2012 held by employee benefit trusts that may be used to satisfy such obligations to deliver HSBC Holdings ordinary shares was 18,009,459 (2011: 31,840,893).
| 39 | Notes on the statement of cash flows |
Other non-cash items included in profit before tax
| HSBC | HSBC Holdings | |||||||||||||||||||||||||||
2012 US$m | 2011 US$m | 2010 US$m | 2012 US$m | 2011 US$m | ||||||||||||||||||||||||
Depreciation, amortisation and impairment | 2,531 | 3,135 | 2,801 | 457 | 1 | |||||||||||||||||||||||
Gains arising from dilution of interests in associates | – | (208 | ) | (188 | ) | – | – | |||||||||||||||||||||
Revaluations on investment property | (72 | ) | (118 | ) | (93 | ) | – | – | ||||||||||||||||||||
Share-based payment expense | 988 | 1,162 | 812 | 55 | 57 | |||||||||||||||||||||||
Loan impairment losses gross of recoveries and other credit risk provisions | 9,358 | 13,553 | 15,059 | – | – | |||||||||||||||||||||||
Provisions | 5,732 | 2,199 | 680 | – | – | |||||||||||||||||||||||
Impairment of financial investments | 519 | 808 | 105 | – | – | |||||||||||||||||||||||
Charge/(credit) for defined benefit plans | 476 | (140 | ) | 526 | – | – | ||||||||||||||||||||||
Accretion of discounts and amortisation of premiums | 246 | (513 | ) | (815 | ) | 23 | 19 | |||||||||||||||||||||
| 19,778 | 19,878 | 18,887 | 535 | 77 | ||||||||||||||||||||||||
| Change in operating assets | ||||||||||||||||||||||||||||
| HSBC | HSBC Holdings | |||||||||||||||||||||||||||
2012 US$m | 2011 US$m | 2010 US$m | 2012 US$m | 2011 US$m | ||||||||||||||||||||||||
Change in loans to HSBC undertakings | – | – | – | (3,451 | ) | (4,548 | ) | |||||||||||||||||||||
Change in prepayments and accrued income | 557 | 1,907 | 457 | (5 | ) | 96 | ||||||||||||||||||||||
Change in net trading securities and net derivatives | (36,829 | ) | 27,058 | 60,337 | (507 | ) | (1,001 | ) | ||||||||||||||||||||
Change in loans and advances to banks | 1,083 | 2,618 | 5,213 | – | – | |||||||||||||||||||||||
Change in loans and advances to customers | (72,619 | ) | (30,853 | ) | (79,283 | ) | – | – | ||||||||||||||||||||
Change in financial assets designated at fair value | (2,698 | ) | (583 | ) | 154 | – | – | |||||||||||||||||||||
Change in other assets | (6,015 | ) | (7,559 | ) | (145 | ) | (48 | ) | (36 | ) | ||||||||||||||||||
| (116,521 | ) | (7,412 | ) | (13,267 | ) | (4,011 | ) | (5,489 | ) | |||||||||||||||||||
| Change in operating liabilities | ||||||||||||||||||||||||||||
| HSBC | HSBC Holdings | |||||||||||||||||||||||||||
2012 US$m | 2011 US$m | 2010 US$m | 2012 US$m | 2011 US$m | ||||||||||||||||||||||||
Change in accruals and deferred income | 78 | (800 | ) | 716 | 10 | 258 | ||||||||||||||||||||||
Change in deposits by banks | (5,393 | ) | 2,238 | (14,288 | ) | – | – | |||||||||||||||||||||
Change in customer accounts | 90,071 | 48,401 | 68,691 | – | – | |||||||||||||||||||||||
Change in debt securities in issue | (11,552 | ) | (14,388 | ) | (1,495 | ) | 86 | (45 | ) | |||||||||||||||||||
Change in financial liabilities designated at fair value | 2,549 | 5,468 | 5,659 | 2,464 | (475 | ) | ||||||||||||||||||||||
Change in other liabilities | 13,317 | 3,093 | (17,011 | ) | 391 | (152 | ) | |||||||||||||||||||||
| 89,070 | 44,012 | 42,272 | 2,951 | (414 | ) | |||||||||||||||||||||||
498
Table of Contents
HSBC HOLDINGS PLC
Notes on the Financial Statements(continued)
| Cash and cash equivalents | ||||||||||||||||||||||||||||
| HSBC | HSBC Holdings | |||||||||||||||||||||||||||
| 2012 US$m | 2011 US$m | 2010 US$m | 2012 US$m | 2011 US$m | ||||||||||||||||||||||||
Cash at bank with HSBC undertakings | – | – | – | 353 | 316 | |||||||||||||||||||||||
Cash and balances at central banks | 141,532 | 129,902 | 57,383 | – | – | |||||||||||||||||||||||
Items in the course of collection from other banks | 7,303 | 8,208 | 6,072 | – | – | |||||||||||||||||||||||
Loans and advances to banks of one month or less | 148,232 | 169,858 | 189,197 | – | – | |||||||||||||||||||||||
Treasury bills, other bills and certificates of deposit less than three months | 25,379 | 26,226 | 28,087 | – | – | |||||||||||||||||||||||
Less: items in the course of transmission to other banks | (7,138 | ) | (8,745 | ) | (6,663 | ) | – | – | ||||||||||||||||||||
| 315,308 | 325,449 | 274,076 | 353 | 316 | ||||||||||||||||||||||||
| Interest and dividends | ||||||||||||||||||||||||||||
| HSBC | HSBC Holdings | |||||||||||||||||||||||||||
2012 US$m | 2011 US$m | 2010 US$m | 2012 US$m | 2011 US$m | ||||||||||||||||||||||||
Interest paid | (18,412 | ) | (23,125 | ) | (21,405 | ) | (2,661 | ) | (2,392 | ) | ||||||||||||||||||
Interest received | 61,112 | 66,734 | 63,696 | 1,759 | 1,559 | |||||||||||||||||||||||
Dividends received | 766 | 602 | 563 | 13,709 | 6,874 | |||||||||||||||||||||||
The amount of cash and cash equivalents not available for use by HSBC at 31 December 2012 was US$32,368m (2011: US$39,345m), of which US$20,464m (2011: US$25,819m) related to mandatory deposits at central banks.
Disposal of subsidiaries and businesses
US cards business | US branch network | Other disposals | Total | |||||||||||||||||||
| US$m | US$m | US$m | US$m | |||||||||||||||||||
Assets | ||||||||||||||||||||||
Loans and advances to banks | – | – | 799 | 799 | ||||||||||||||||||
Loans and advances to customers | 26,748 | 2,091 | 3,632 | 32,471 | ||||||||||||||||||
Financial investments | – | – | 924 | 924 | ||||||||||||||||||
Prepayments and accrued income | 572 | – | 53 | 625 | ||||||||||||||||||
Goodwill and intangible assets | 318 | 7 | 276 | 601 | ||||||||||||||||||
Other assets | 369 | 68 | 1,618 | 2,055 | ||||||||||||||||||
Total assets excluding cash and cash equivalents | 28,007 | 2,166 | 7,302 | 37,475 | ||||||||||||||||||
Liabilities | ||||||||||||||||||||||
Deposits by banks | – | – | 385 | 385 | ||||||||||||||||||
Customer accounts | – | 13,199 | 5,986 | 19,185 | ||||||||||||||||||
Liabilities under insurance contracts | – | – | 1,080 | 1,080 | ||||||||||||||||||
Other liabilities | 161 | 7 | 1,012 | 1,180 | ||||||||||||||||||
Total liabilities | 161 | 13,206 | 8,463 | 21,830 | ||||||||||||||||||
Aggregate net assets at date of disposal, excluding cash and cash equivalents | 27,846 | (11,040 | ) | (1,161 | ) | 15,645 | ||||||||||||||||
Non-controlling interests disposed | – | – | (81 | ) | (81 | ) | ||||||||||||||||
Gain on disposal including costs to sell | 3,148 | 864 | 355 | 4,367 | ||||||||||||||||||
Add back: costs to sell | 72 | 15 | 56 | 143 | ||||||||||||||||||
Selling price | 31,066 | (10,161 | ) | (831 | ) | 20,074 | ||||||||||||||||
Satisfied by: | ||||||||||||||||||||||
Cash and cash equivalents received/(paid) as consideration | 31,066 | (10,091 | ) | (542 | ) | 20,433 | ||||||||||||||||
Cash and cash equivalents sold | – | (70 | ) | (321 | ) | (391 | ) | |||||||||||||||
Cash consideration received/(paid) up to 31 December 2012 | 31,066 | (10,161 | ) | (863 | ) | 20,042 | ||||||||||||||||
Cash still to be received at 31 December 2012 | – | – | 32 | 32 | ||||||||||||||||||
Total cash consideration | 31,066 | (10,161 | ) | (831 | ) | 20,074 | ||||||||||||||||
499
Table of Contents
HSBC HOLDINGS PLC
Notes on the Financial Statements(continued)
The completed US branch network disposal represents the sale of 195 US branches that were held for sale at 31 December 2011. HSBC received a total cash consideration of US$20,905m during 2012, which is included in the cash flow statement under the line ‘Net cash inflow from disposal of US branch network and US cards business on page 375. For further details refer to page 471.
| 40 | Contingent liabilities, contractual commitments and guarantees |
| HSBC | HSBC Holdings | |||||||||||||||||||||
2012 US$m | 2011 US$m | 2012 US$m | 2011 US$m | |||||||||||||||||||
Guarantees and contingent liabilities | ||||||||||||||||||||||
Guarantees | 80,364 | 75,672 | 49,402 | 49,402 | ||||||||||||||||||
Other contingent liabilities | 209 | 259 | – | – | ||||||||||||||||||
| 80,573 | 75,931 | 49,402 | 49,402 | |||||||||||||||||||
Commitments | ||||||||||||||||||||||
Documentary credits and short-term trade-related transactions | 13,359 | 13,498 | – | – | ||||||||||||||||||
Forward asset purchases and forward forward deposits placed | 419 | 87 | – | – | ||||||||||||||||||
Undrawn formal standby facilities, credit lines and other commitments to lend | 565,691 | 641,319 | 1,200 | 1,810 | ||||||||||||||||||
| 579,469 | 654,904 | 1,200 | 1,810 | |||||||||||||||||||
The above table discloses the nominal principal amounts of commitments excluding capital commitments, which are separately disclosed below, and guarantees and other contingent liabilities, which are mainly credit-related instruments including both financial and non-financial guarantees and commitments to extend credit. Contingent liabilities arising from legal proceedings and regulatory matters against Group companies are disclosed in Note 43. Nominal principal amounts represent the amounts at risk should the contracts be fully drawn upon and clients default. The amount of the loan commitments shown above reflects, where relevant, the expected level of take-up of pre-approved loan offers made by mailshots to personal customers. As a significant portion of guarantees and commitments is expected to expire without being drawn upon, the total of the nominal principal amounts is not indicative of future liquidity requirements.
Guarantees
HSBC provides guarantees and similar undertakings on behalf of both third-party customers and other entities within the HSBC Group. These guarantees are generally provided in the normal course of HSBC’s banking business. The principal types of guarantees provided, and the maximum potential amount of future payments which HSBC could be required to make at 31 December 2012, were as follows:
| At 31 December 2012 | At 31 December 2011 | |||||||||||||||||||||
Guarantees in favour of third parties US$m | Guarantees by HSBC Holdings in favour of other HSBC Group entities US$m | Guarantees in favour of third parties US$m | Guarantees by HSBC Holdings in favour of other HSBC Group entities US$m | |||||||||||||||||||
Guarantee type1 | ||||||||||||||||||||||
Financial guarantees2 | 32,036 | 36,800 | 26,830 | 36,800 | ||||||||||||||||||
Credit-related guarantees3 | 12,957 | 12,602 | 12,494 | 12,602 | ||||||||||||||||||
Other guarantees | 35,371 | – | 36,348 | – | ||||||||||||||||||
| 80,364 | 49,402 | 75,672 | 49,402 | |||||||||||||||||||
| 1 | The balances have been grouped by major category of guarantee, revised from prior periods to present financial guarantees separately. |
| 2 | Financial guarantees are contracts that require the issuer to make specified payments to reimburse the holder for a loss incurred because a specified debtor fails to make payment when due in accordance with the original or modified terms of a debt instrument. |
| 3 | Credit related guarantees are contracts that have similar features to financial guarantee contracts but fail to meet the definition of a financial guarantee contracts under IAS 39. |
The amounts disclosed in the above table are nominal principal amounts and reflect HSBC’s maximum exposure under a large number of individual guarantee undertakings. The risks and exposures arising from guarantees are captured and managed in accordance with HSBC’s overall credit risk management policies and procedures.
500
Table of Contents
HSBC HOLDINGS PLC
Notes on the Financial Statements(continued)
Approximately half of the above guarantees have a term of less than one year. Guarantees with terms of more than one year are subject to HSBC’s annual credit review process.
Financial Services Compensation Scheme
At 31 December 2012, HSBC recognised an accrual of US$157m in respect of its share of the estimated Financial Services Compensation Scheme (‘FSCS’) levy (31 December 2011: US$87m).
The FSCS confirmed in February 2013 that the first of three annual instalments of approximately £363m (US$587m) will be levied in total on participating financial institutions in Scheme Year 2013/14 to repay the balance of the loan principal that is not expected to be recovered. The accrual recognised at 31 December 2012 represents HSBC’s share of the interest on the borrowings outstanding and also its share of the principal to be levied over each of the next three years. The interest rate to be applied on outstanding borrowings increased from 12-month Libor plus 30 basis points to 12-month Libor plus 100 basis points from 1 April 2012.
Commitments
In addition to the commitments disclosed on page 500, at 31 December 2012 HSBC had US$607m (2011: US$715m) of capital commitments contracted but not provided for and US$197m (2011: US$272m) of capital commitments authorised but not contracted for.
Associates
HSBC’s share of associates’ contingent liabilities amounted to US$46,148m at 31 December 2012 (2011: US$34,311m). No matters arose where HSBC was severally liable.
| 41 | Lease commitments |
Finance lease commitments
HSBC leases land and buildings (including branches) and equipment from third parties under finance lease arrangements to support its operations.
| At 31 December 2012 | At 31 December 2011 | |||||||||||||||||||||||||||||||||
| Total future minimum payments US$m | Future interest charges US$m | Present value of finance lease commitments | Total future minimum payments US$m | Future interest charges US$m | Present value of finance lease commitments US$m | |||||||||||||||||||||||||||||
Lease commitments: | ||||||||||||||||||||||||||||||||||
– no later than one year | 81 | (21 | ) | 60 | 98 | (26 | ) | 72 | ||||||||||||||||||||||||||
– later than one year and no | 153 | (71 | ) | 82 | 216 | (99 | ) | 117 | ||||||||||||||||||||||||||
– later than five years | 196 | (34 | ) | 162 | 362 | (92 | ) | 270 | ||||||||||||||||||||||||||
| 430 | (126 | ) | 304 | 676 | (217 | ) | 459 | |||||||||||||||||||||||||||
At 31 December 2012, future minimum sublease payments of US$244m (2011: US$413m) are expected to be received under non-cancellable subleases at the balance sheet date.
Operating lease commitments
At 31 December 2012, HSBC was obligated under a number of non-cancellable operating leases for properties, plant and equipment on which the future minimum lease payments extend over a number of years.
| At 31 December 2012 | At 31 December 2011 | |||||||||||||||||||||
Land and buildings US$m | Equipment US$m | Land and buildings US$m | Equipment US$m | |||||||||||||||||||
Future minimum lease payments under non-cancellable operating leases: | ||||||||||||||||||||||
– no later than one year | 943 | 23 | 1,130 | 18 | ||||||||||||||||||
– later than one year and no later than five years | 2,495 | 23 | 2,656 | 18 | ||||||||||||||||||
– later than five years | 2,246 | – | 2,496 | – | ||||||||||||||||||
| 5,684 | 46 | 6,282 | 36 | |||||||||||||||||||
501
Table of Contents
HSBC HOLDINGS PLC
Notes on the Financial Statements(continued)
At 31 December 2012, future minimum sublease payments of US$14m (2011: US$17m) are expected to be received under non-cancellable subleases at the balance sheet date.
In 2012, US$1,166m (2011: US$973m; 2010: US$888m) was charged to ‘General and administrative expenses’ in respect of lease and sublease agreements, of which US$1,149m (2011: US$952m; 2010: US$869m) related to minimum lease payments, US$17m (2011: US$20m; 2010: US$18m) to contingent rents, and US$0.4m (2011: US$1m; 2010: US$1m) to sublease payments.
The contingent rent represents escalation payments made to landlords for operating, tax and other escalation expenses.
Finance lease receivables
HSBC leases a variety of assets to third parties under finance leases, including transport assets (such as aircraft), property and general plant and machinery. At the end of lease terms, assets may be sold to third parties or leased for further terms. Lessees may participate in any sales proceeds achieved. Lease rentals arising during the lease terms will either be fixed in quantum or be varied to reflect changes in, for example, tax or interest rates. Rentals are calculated to recover the cost of assets less their residual value, and earn finance income.
| At 31 December 2012 | At 31 December 2011 | |||||||||||||||||||||||||||||||||
Total future payments | Unearned finance income | Present value | Total future payments | Unearned finance income | Present value | |||||||||||||||||||||||||||||
Lease receivables: | ||||||||||||||||||||||||||||||||||
– no later than one year | 3,712 | (379 | ) | 3,333 | 3,766 | (459 | ) | 3,307 | ||||||||||||||||||||||||||
– later than one year and no later than five years | 8,414 | (966 | ) | 7,448 | 8,618 | (1,055 | ) | 7,563 | ||||||||||||||||||||||||||
– later than five years | 5,277 | (951 | ) | 4,326 | 5,969 | (1,204 | ) | 4,765 | ||||||||||||||||||||||||||
| 17,403 | (2,296 | ) | 15,107 | 18,353 | (2,718 | ) | 15,635 | |||||||||||||||||||||||||||
At 31 December 2012, unguaranteed residual values of US$253m (2011: US$267m) had been accrued, and the accumulated allowance for uncollectible minimum lease payments receivable amounted to US$(3)m (2011: US$25m). No contingent rents were received in 2012 (2011: nil).
| 42 | Special purpose entities |
HSBC enters into certain transactions with customers in the ordinary course of business which involve the establishment of special purpose entities (‘SPE’s) to facilitate or secure customer transactions. HSBC structures that utilise SPEs are authorised centrally when they are established, to ensure appropriate purpose and governance. The activities of SPEs administered by HSBC are closely monitored by senior management.
SPEs are assessed for consolidation in accordance with the accounting policy set out in Note 1e.
Total consolidated assets held by SPEs by balance sheet classification
| Conduits US$bn | Securit- isations | Money market funds | Non-money market investment funds | Total US$bn | ||||||||||||||||||||||||
At 31 December 2012 | ||||||||||||||||||||||||||||
Cash | 0.6 | – | – | 0.2 | 0.8 | |||||||||||||||||||||||
Trading assets | – | 0.5 | – | 1.5 | 2.0 | |||||||||||||||||||||||
Financial assets designated at fair value | 0.1 | – | – | 7.4 | 7.5 | |||||||||||||||||||||||
Derivatives | – | – | – | 0.2 | 0.2 | |||||||||||||||||||||||
Loans and advances to banks | – | 1.5 | – | – | 1.5 | |||||||||||||||||||||||
Loans and advances to customers | 11.3 | 7.0 | – | – | 18.3 | |||||||||||||||||||||||
Financial investments | 25.0 | – | – | – | 25.0 | |||||||||||||||||||||||
Other assets | 1.4 | – | – | 1.6 | 3.0 | |||||||||||||||||||||||
| 38.4 | 9.0 | – | 10.9 | 58.3 | ||||||||||||||||||||||||
502
Table of Contents
HSBC HOLDINGS PLC
Notes on the Financial Statements(continued)
| Conduits US$bn | Securit- isations | Money market funds | Non-money market investment funds US$bn | Total US$bn | ||||||||||||||||||||||||
At 31 December 2011 | ||||||||||||||||||||||||||||
Cash | 0.8 | 0.3 | – | 0.3 | 1.4 | |||||||||||||||||||||||
Trading assets | 0.1 | 0.5 | 0.2 | 0.4 | 1.2 | |||||||||||||||||||||||
Financial assets designated at fair value | 0.1 | – | – | 6.5 | 6.6 | |||||||||||||||||||||||
Derivatives | – | 0.1 | – | – | 0.1 | |||||||||||||||||||||||
Loans and advances to banks | – | 1.2 | – | – | 1.2 | |||||||||||||||||||||||
Loans and advances to customers | 10.5 | 8.0 | – | – | 18.5 | |||||||||||||||||||||||
Financial investments | 25.8 | – | – | – | 25.8 | |||||||||||||||||||||||
Other assets | 1.6 | – | – | – | 1.6 | |||||||||||||||||||||||
| 38.9 | 10.1 | 0.2 | 7.2 | 56.4 | ||||||||||||||||||||||||
HSBC’s maximum exposure to SPEs
The following table shows the total assets of the various types of SPEs and the amount of funding provided by HSBC to these SPEs. The table also shows HSBC’s maximum exposure to the SPEs and, within that exposure, the liquidity and credit enhancements provided by HSBC. The maximum exposures to SPEs represent HSBC’s maximum possible risk exposure that could occur as a result of the Group’s arrangements and commitments to SPEs. The maximum amounts are contingent in nature, and may arise as a result of drawdowns under liquidity facilities, where these have been provided, and any other funding commitments, or as a result of any loss protection provided by HSBC to the SPEs. The conditions under which such exposure might arise differ depending on the nature of each SPE and HSBC’s involvement with it.
Total assets of consolidated and unconsolidated SPEs and HSBC’s funding and maximum exposure
| Consolidated SPEs | Unconsolidated SPEs | |||||||||||||||||||||||||||||||||||||||
Total assets | Funding provided by HSBC | Liquidity and credit enchance- ments | HSBC’s maximum exposure | Total assets | Funding provided by HSBC | HSBC’s maximum exposure | ||||||||||||||||||||||||||||||||||
At 31 December 2012 | ||||||||||||||||||||||||||||||||||||||||
Conduits | 38.4 | 28.9 | 32.4 | 43.1 | – | – | – | |||||||||||||||||||||||||||||||||
Securities investment conduits | 26.6 | 28.8 | 18.1 | 28.8 | – | – | – | |||||||||||||||||||||||||||||||||
Multi-seller conduits | 11.8 | 0.1 | 14.3 | 14.3 | – | – | – | |||||||||||||||||||||||||||||||||
Securitisations | 9.0 | 2.6 | – | 4.7 | 6.8 | – | – | |||||||||||||||||||||||||||||||||
Money market funds | – | – | – | – | 64.2 | 1.7 | 1.7 | |||||||||||||||||||||||||||||||||
Constant net asset value funds | – | – | – | – | 51.7 | 0.8 | 0.8 | |||||||||||||||||||||||||||||||||
Other | – | – | – | – | 12.5 | 0.9 | 0.9 | |||||||||||||||||||||||||||||||||
Non-money market investment funds | 10.9 | 10.2 | – | 10.2 | 303.3 | 5.9 | 5.9 | |||||||||||||||||||||||||||||||||
Other | – | – | – | – | 20.0 | 5.2 | 5.3 | |||||||||||||||||||||||||||||||||
| 58.3 | 41.7 | 32.4 | 58.0 | 394.3 | 12.8 | 12.9 | ||||||||||||||||||||||||||||||||||
At 31 December 2011 | ||||||||||||||||||||||||||||||||||||||||
Conduits | 38.9 | 27.7 | 37.1 | 48.5 | – | – | – | |||||||||||||||||||||||||||||||||
Securities investment conduits | 27.9 | 27.4 | 22.1 | 33.5 | – | – | – | |||||||||||||||||||||||||||||||||
Multi-seller conduits | 11.0 | 0.3 | 15.0 | 15.0 | – | – | – | |||||||||||||||||||||||||||||||||
Securitisations | 10.1 | 1.6 | 0.1 | 3.8 | 8.1 | – | – | |||||||||||||||||||||||||||||||||
Money market funds | 0.2 | 0.2 | – | 0.2 | 73.9 | 0.9 | 0.9 | |||||||||||||||||||||||||||||||||
Constant net asset value funds | – | – | – | – | 54.4 | 0.7 | 0.7 | |||||||||||||||||||||||||||||||||
Other | 0.2 | 0.2 | – | 0.2 | 19.5 | 0.2 | 0.2 | |||||||||||||||||||||||||||||||||
Non-money market investment funds | 7.2 | 6.9 | – | 6.9 | 260.8 | 1.7 | 1.7 | |||||||||||||||||||||||||||||||||
Other | – | – | – | – | 19.4 | 3.7 | 4.6 | |||||||||||||||||||||||||||||||||
| 56.4 | 36.4 | 37.2 | 59.4 | 362.2 | 6.3 | 7.2 | ||||||||||||||||||||||||||||||||||
503
Table of Contents
HSBC HOLDINGS PLC
Notes on the Financial Statements(continued)
Conduits
HSBC sponsors and manages two types of conduits: securities investment conduits (‘SIC’s) and multi-seller conduits.
Securities investment conduits
Solitaire, HSBC’s principal SIC, holds asset-backed securities (‘ABS’s) on behalf of HSBC. At 31 December 2012, Solitaire held US$10.0bn of ABSs (2011: US$10.6bn). These are included within the disclosures of ABS ‘held through consolidated SPEs’ on page 187. HSBC’s other SICs, Mazarin, Barion Funding Limited (‘Barion’) and Malachite Funding Limited (‘Malachite’), evolved from the restructuring of HSBC’s sponsored structured investment vehicles (‘SIV’s) in 2008.
Solitaire
During the year Solitaire redeemed the commercial paper (‘CP’) held by third parties, and is currently funded entirely by CP issued to HSBC. Although HSBC continues to provide a liquidity facility, Solitaire has no need to draw on it so long as HSBC purchases the CP issued, which it intends to do for the foreseeable future. Accordingly, there were no amounts drawn under the liquidity facility provided by HSBC at 31 December 2012 (2011: US$9.3bn).
At 31 December 2012, HSBC held US$13.0bn of CP, which represented HSBC’s maximum exposure. At 31 December 2011, maximum exposure of US$15.6bn was represented by liquidity facility including undrawn amounts.
Mazarin
HSBC is exposed to the par value of Mazarin’s assets through the provision of a liquidity facility equal to the lower of the amortised cost of issued senior debt and the amortised cost of non-defaulted assets. At 31 December 2012, this amounted to US$8.4bn (2011: US$9.5bn). First loss protection is provided through the capital notes issued by Mazarin, which are substantially all held by third parties.
At 31 December 2012, HSBC held 1.3% of Mazarin’s capital notes (2011: 1.3%) which have a par value of US$17m (2011: US$17m) and a carrying amount of nil (2011: nil).
Barion and Malachite
HSBC’s primary exposure to these SICs is represented by the amortised cost of the debt required to support the non-cash assets of the vehicles. At 31 December 2012, this amounted to US$7.4bn (2011: US$8.4bn). First loss protection is provided through the capital notes issued by these vehicles, which are substantially all held by third parties.
At 31 December 2012, HSBC held 3.7% of the capital notes issued by these vehicles (2011: 3.7%) which have a par value of US$36m (2011: US$35m) and a carrying amount of US$1.7m (2011: US$1.1m).
Multi-seller conduits
These vehicles were established for the purpose of providing access to flexible market-based sources of finance for HSBC’s clients.
HSBC’s maximum exposure is equal to the transaction-specific liquidity facilities offered to the multi-seller conduits. First loss protection is provided by the originator of the assets, and not by HSBC, through transaction-specific credit enhancements. A layer of secondary loss protection is provided by HSBC in the form of programme-wide enhancement facilities.
The following table sets out the weighted average life of the asset portfolios for the above mentioned conduits.
Weighted average life of portfolios
| Solitaire | Other SICs | Total SICs | Total multi- seller conduits | |||||||||||||
| Weighted average life (years) | ||||||||||||||||
At 31 December 2012 | 6.1 | 4.5 | 5.2 | 2.8 | ||||||||||||
At 31 December 2011 | 5.9 | 4.1 | 4.9 | 2.0 | ||||||||||||
504
Table of Contents
HSBC HOLDINGS PLC
Notes on the Financial Statements(continued)
Securitisations
HSBC uses SPEs to securitise customer loans and advances that it has originated in order to diversify its sources of funding for asset origination and for capital efficiency purposes. The loans and advances are transferred by HSBC to the SPEs for cash, and the SPEs issue debt securities to investors to fund the cash purchases.
HSBC’s maximum exposure is the aggregate of any holdings of notes issued by these vehicles and the reserve account positions intended to provide credit support under certain pre-defined circumstances to senior note holders.
In addition, HSBC uses SPEs to mitigate the capital absorbed by some of the customer loans and advances it has originated. Credit derivatives are used to transfer the credit risk associated with these customer loans and advances to an SPE, using securitisations commonly known as synthetic securitisations by which the SPE writes credit default swap protection to HSBC. The SPE is funded by the issuance of notes with the cash held as collateral against the credit default protection. From a UK regulatory perspective, the credit protection issued by the SPE in respect of the customer loans allows the risk weight of the loans to be replaced by the risk weight of the collateral in the SPE and as a result mitigates the capital absorbed by the customer loans. Any notes issued by the SPE and held by HSBC attract the appropriate risk weight under the relevant regulatory regime. These SPEs are consolidated when HSBC is exposed to the majority of risks and rewards of ownership.
Money market funds
HSBC has established and manages a number of money market funds which provide customers with tailored investment opportunities within narrow and well-defined objectives.
HSBC’s maximum exposure to money market funds is represented by HSBC’s investment in the units of each fund, which at 31 December 2012 amounted to US$1.7bn (2011: US$1.1bn).
Non-money market investment funds
HSBC has established a large number of non-money market investment funds to enable customers to invest in a range of assets, typically equities and debt securities.
HSBC’s maximum exposure to non-money market investment funds is represented by its investment in the units of each fund which at 31 December 2012 amounted to US$16.1bn (2011: US$8.6bn).
Other
HSBC also establishes SPEs in the normal course of business for a number of purposes, for example, structured transactions for customers, to provide finance to public and private sector infrastructure projects, and for asset and structured finance transactions.
In certain transactions HSBC is exposed to risk often referred to as gap risk. Gap risk typically arises in transactions where the aggregate potential claims against the SPE by HSBC pursuant to one or more derivatives could be greater than the value of the collateral held by the SPE and securing such derivatives. HSBC often mitigates such gap risk by incorporating in the SPE transaction features which allow for deleveraging, a managed liquidation of the portfolio, or other mechanisms including trade restructuring or unwinding the trade. Following the inclusion of such risk reduction mechanisms, HSBC has, in certain circumstances, retained all or a portion of the underlying exposure in the transaction. In these circumstances, HSBC assesses whether the exposure retained causes a requirement under IFRSs to consolidate the SPE. When this retained exposure represents ABSs, it has been included in ‘Nature of HSBC’s exposures’ on page 259.
Third-party sponsored SPEs
Through standby liquidity facility commitments, HSBC has exposure to third-party sponsored SIVs, conduits and securitisations under normal banking arrangements on standard market terms. These exposures are not considered significant to HSBC’s operations.
Additional off-balance sheet arrangements and commitments
Additional off-balance sheet commitments such as financial guarantees, letters of credit and commitments to lend are disclosed in Note 41.
505
Table of Contents
HSBC HOLDINGS PLC
Notes on the Financial Statements(continued)
Leveraged finance transactions
Loan commitments in respect of leveraged finance transactions are accounted for as derivatives where it is HSBC’s intention to sell the loan after origination. Further information is provided on page 190.
| 43 | Legal proceedings and regulatory matters |
HSBC is party to legal proceedings, investigations and regulatory matters in a number of jurisdictions arising out of its normal business operations. Apart from the matters described below, HSBC considers that none of these matters is material, either individually or in the aggregate. HSBC recognises a provision for a liability in relation to these matters when it is probable that an outflow of economic benefits will be required to settle an obligation which has arisen as a result of past events, and for which a reliable estimate can be made of the amount of the obligation. While the outcome of these matters is inherently uncertain, management believes that, based on the information available to it, appropriate provisions have been made in respect of legal proceedings and regulatory matters as at 31 December 2012 (see Note 32).
Securities litigation
As a result of an August 2002 restatement of previously reported consolidated financial statements and other corporate events, including the 2002 settlement with 46 State Attorneys General relating to real estate lending practices, Household International (now HSBC Finance) and certain former officers were named as defendants in a class action law suit, Jaffe v Household International Inc, et al No 2. C 5893 (N.D.Ill, filed 19 August 2002). The complaint asserted claims under the US Securities Exchange Act of 1934. Ultimately, a class was certified on behalf of all persons who acquired and disposed of Household International common stock between 30 July 1999 and 11 October 2002. The claims alleged that the defendants knowingly or recklessly made false and misleading statements of material fact relating to Household’s Consumer Lending operations, including collections, sales and lending practices, some of which ultimately led to the 2002 State settlement agreement, and facts relating to accounting practices evidenced by the restatement.
A jury trial concluded in April 2009, which was decided partly in favour of the plaintiffs. Following post-trial briefing, the District Court ruled that various legal challenges to the verdict, including as to loss causation and other matters, would not be considered until after a second phase of the proceedings addressing issues of reliance and the submission of claims by class members had been completed. The District Court ruled on 22 November 2010 that claim forms should be mailed to class members to ascertain which class members may have claims for damages arising from reliance on the misleading statements found by the jury. The District Court also set out a method for calculating damages for class members who filed claims. As previously reported, lead plaintiffs, in court filings in March 2010, estimated that damages could range ‘somewhere between US$2.4bn to US$3.2bn to class members’, before pre-judgement interest.
In December 2011, the report of the court-appointed claims administrator to the District Court stated that the total number of claims that generated an allowed loss was 45,921, and that the aggregate amount of these claims was approximately US$2.23bn. Defendants filed legal challenges asserting that the presumption of reliance was defeated as to the class and raising various objections with respect to compliance with the claims form requirements as to certain claims.
In September 2012, the District Court rejected defendants’ arguments that the presumption of reliance generally had been defeated either as to the class or as to particular institutional claimants. In addition, the District Court has made various rulings with respect to the validity of specific categories of claims, and held certain categories of claims valid, certain categories of claims invalid, and directed further proceedings before a court-appointed Special Master to address objections regarding certain other claim submission issues. In light of those rulings and through various agreements of the parties, currently there is approximately US$1.37bn in claims as to which there remain no unresolved objections relating to the claims form submissions. In addition, approximately US$800m in claims remain to be addressed before the Special Master with respect to various claims form objections, with a small portion of those potentially subject to further trial proceedings. Therefore, based upon proceedings to date, the current range of a possible final judgement, prior to imposition of pre-judgement interest (if any), is between approximately US$1.37bn and US$2.17bn. With the imposition of pre-judgement interest calculated through 31 December 2012, the top-end of a possible final judgement is approximately US$2.7bn. The District Court may wait for a resolution of all disputes as to all claims before entering final judgement, or the District Court may enter a partial judgement on fewer
506
Table of Contents
HSBC HOLDINGS PLC
Notes on the Financial Statements(continued)
than all claims pending resolution of disputes as to the remaining claims. Post-verdict legal challenges remain to be addressed by the District Court.
Despite the jury verdict and the various rulings of the District Court, HSBC continues to believe that it has meritorious grounds for appeal of one or more of the rulings in the case, and intends to appeal the District Court’s final judgement, partial or otherwise. Upon final judgement, partial or otherwise, HSBC Finance will be required to provide security for the judgement in order to suspend its execution while the appeal is on-going by either depositing cash in an interest-bearing escrow account or posting an appeal bond in the amount of the judgement (including any pre-judgement interest awarded).
Given the complexity and uncertainties associated with the actual determination of damages, including the outcome of any appeals, there is a wide range of possible damages. HSBC believes it has meritorious grounds for appeal on matters of both liability and damages and will argue on appeal that damages should be nil or a relatively insignificant amount. If the Appeals Court rejects or only partially accepts HSBC’s arguments, the amount of damages, based upon the claims submitted and the potential application of pre-judgement interest may lie in a range from a relatively insignificant amount to somewhere in the region of US$2.7bn (or higher should plaintiffs successfully cross-appeal certain issues related to the validity of specific claims).
Bernard L. Madoff Investment Securities LLC
In December 2008, Bernard L. Madoff (‘Madoff’) was arrested for running a Ponzi scheme and a trustee was appointed for the liquidation of his firm, Bernard L. Madoff Investment Securities LLC (‘Madoff Securities’), an SEC-registered broker-dealer and investment adviser. Since his appointment, the trustee has been recovering assets and processing claims of Madoff Securities customers. Madoff subsequently pleaded guilty to various charges and is serving a 150 year prison sentence. He has acknowledged, in essence, that while purporting to invest his customers’ money in securities and, upon request, return their profits and principal, he in fact never invested in securities and used other customers’ money to fulfil requests for the return of profits and principal. The relevant US authorities are continuing their investigations into his fraud, and have brought charges against others, including certain former employees and the former auditor of Madoff Securities.
Various non-US HSBC companies provided custodial, administration and similar services to a number of funds incorporated outside the US whose assets were invested with Madoff Securities. Based on information provided by Madoff Securities, as at 30 November 2008, the purported aggregate value of these funds was US$8.4bn, an amount that includes fictitious profits reported by Madoff. Based on information available to HSBC to date, HSBC estimates that the funds’ actual transfers to Madoff Securities minus their actual withdrawals from Madoff Securities during the time that HSBC serviced the funds totalled approximately US$4bn.
Plaintiffs (including funds, fund investors, and the Madoff Securities trustee) have commenced Madoff-related proceedings against numerous defendants in a multitude of jurisdictions. Various HSBC companies have been named as defendants in suits in the US, Ireland, Luxembourg and other jurisdictions. Certain suits (which included four US putative class actions) allege that the HSBC defendants knew or should have known of Madoff’s fraud and breached various duties to the funds and fund investors.
In November 2011, the US District Court Judge overseeing three related putative class actions in the Southern District of New York dismissed all claims against the HSBC defendants onforum non conveniens grounds, but temporarily stayed this ruling as to one of the actions against the HSBC defendants – the claims of investors in Thema International Fund plc – in light of a proposed amended settlement agreement, pursuant to which, subject to various conditions, the HSBC defendants had agreed to pay from US$52.5m up to a maximum of US$62.5m. In December 2011, the court lifted this temporary stay and dismissed all remaining claims against the HSBC defendants, and declined to consider preliminary approval of the settlement. In light of the court’s decisions, HSBC terminated the settlement agreement. The Thema plaintiff contests HSBC’s right to terminate. Plaintiffs in all three actions have filed notices of appeal to the US Court of Appeals for the Second Circuit. Briefing in that appeal was completed in September 2012; oral argument is expected in early 2013.
In November and December 2012, HSBC settled two of the individual claims commenced by investors in Thema International Fund plc against HSBC in the Irish High Court.
In December 2010, the Madoff Securities trustee commenced suits against various HSBC companies in the US Bankruptcy Court and in the English High Court. The US action (which also names certain funds, investment managers, and other entities and individuals) sought US$9bn in damages and additional recoveries from HSBC and
507
Table of Contents
HSBC HOLDINGS PLC
Notes on the Financial Statements(continued)
the various co-defendants. It sought damages against HSBC for allegedly aiding and abetting Madoff’s fraud and breach of fiduciary duty. In July 2011, after withdrawing the case from the Bankruptcy Court in order to decide certain threshold issues, the US District Court Judge dismissed the trustee’s various common law claims on the grounds that the trustee lacks standing to assert them. In December 2011, the trustee filed a notice of appeal to the US Court of Appeals for the Second Circuit. Briefing in that appeal was completed in April 2012, and oral argument was held in November 2012. A decision is expected in 2013.
The District Court returned the remaining claims to the US Bankruptcy Court for further proceedings. Those claims seek, pursuant to US bankruptcy law, recovery of unspecified amounts received by HSBC from funds invested with Madoff, including amounts that HSBC received when it redeemed units HSBC held in the various funds. HSBC acquired those fund units in connection with financing transactions HSBC had entered into with various clients. The trustee’s US bankruptcy law claims also seek recovery of fees earned by HSBC for providing custodial, administration and similar services to the funds. Between September 2011 and April 2012, the HSBC defendants and certain other defendants moved again to withdraw the case from the Bankruptcy Court. The District Court granted those withdrawal motions as to certain issues, and briefing and oral arguments on the merits of the withdrawn issues are now complete. The District Court has issued rulings on two of the withdrawn issues, but decisions with respect to all other issues are still pending and are expected in early 2013.
The trustee’s English action seeks recovery of unspecified transfers of money from Madoff Securities to or through HSBC, on the grounds that the HSBC defendants actually or constructively knew of Madoff’s fraud. HSBC has not been served with the trustee’s English action.
Between October 2009 and April 2012, Fairfield Sentry Limited, Fairfield Sigma Limited and Fairfield Lambda Limited (‘Fairfield’), funds whose assets were directly or indirectly invested with Madoff Securities, commenced multiple suits in the British Virgin Islands (‘BVI’) and the US against numerous fund shareholders, including various HSBC companies that acted as nominees for clients of HSBC’s private banking business and other clients who invested in the Fairfield funds. The Fairfield actions seek restitution of amounts paid to the defendants in connection with share redemptions, on the ground that such payments were made by mistake, based on inflated values resulting from Madoff’s fraud, and some actions also seek recovery of the share redemptions under BVI insolvency law. The actions in the US are currently stayed in the Bankruptcy Court pending developments in related appellate litigation in the BVI.
There are many factors which may affect the range of possible outcomes, and the resulting financial impact, of the various Madoff-related proceedings, including but not limited to the circumstances of the fraud, the multiple jurisdictions in which the proceedings have been brought and the number of different plaintiffs and defendants in such proceedings. For these reasons, among others, it is not practicable at this time for HSBC to estimate reliably the aggregate liabilities, or ranges of liabilities, that might arise as a result of all such claims but they could be significant. In any event, HSBC considers that it has good defences to these claims and will continue to defend them vigorously.
US mortgage-related investigations
In April 2011, HSBC Bank USA entered into a consent cease and desist order with the Office of the Comptroller of the Currency and HSBC Finance and HSBC North America Holdings Inc. (‘HNAH’) entered into a similar consent order with the Federal Reserve Board following completion of a broad horizontal review of industry residential mortgage foreclosure practices. These consent orders require prescribed actions to address the deficiencies noted in the joint examination and described in the consent orders. HSBC Bank USA, HSBC Finance and HNAH continue to work with the Office of the Comptroller of the Currency and the Federal Reserve Board to align their processes with the requirements of the consent orders and are implementing operational changes as required.
These consent orders required an independent review of foreclosures (the ‘Independent Foreclosure Review’) pending or completed between January 2009 and December 2010 to determine if any customer was financially injured as a result of an error in the foreclosure process. As required by the consent orders, an independent consultant was retained to conduct that review.
On 28 February 2013, HSBC Bank USA entered into an agreement with the Office of the Comptroller of the Currency, and HSBC Finance and HNAH entered into an agreement with the Federal Reserve Board, pursuant to which the Independent Foreclosure Review will cease and we will make a cash payment of US$96m into a fund that will be used to make payments to borrowers that were in active foreclosure during 2009 and 2010, and in addition, will provide other assistance (e.g. loan modifications) to help eligible borrowers. These actions form HSBC’s portion
508
Table of Contents
HSBC HOLDINGS PLC
Notes on the Financial Statements(continued)
of a larger agreement announced by the Federal Reserve Board and the Office of the Comptroller of the Currency in January 2013 involving HSBC and twelve other mortgage servicers subject to foreclosure consent orders pursuant to which the mortgage servicers would pay, in the aggregate, in excess of US$9.3bn in cash payments and other assistance to help eligible borrowers. Pursuant to these agreements, the Independent Foreclosure Reviews will cease and be replaced by a broader framework under which all eligible borrowers will receive compensation regardless of whether they filed a request for independent review of their foreclosure and regardless of whether the borrower was financially injured as a result of an error in the foreclosure process. Borrowers who receive compensation will not be required to execute a release or waiver of rights and will not be precluded from pursuing litigation concerning foreclosure or other mortgage servicing practices. For participating servicers, including HSBC Bank USA and HSBC Finance, fulfilment of the terms of these agreements will satisfy the Independent Foreclosure Review requirements of these consent orders. These consent orders do not preclude additional enforcement actions against HSBC Bank USA, HSBC Finance or HNAH by bank regulatory, governmental or law enforcement agencies, such as the US Department of Justice (‘DoJ’) or State Attorneys General, which could include the imposition of civil money penalties and other sanctions relating to the activities that are the subject of the consent orders. Pursuant to the agreement with the Office of the Comptroller of the Currency, however, the Office of the Comptroller of the Currency has agreed that it will not assess civil money penalties or initiate any further enforcement action with respect to past mortgage servicing and foreclosure-related practices addressed in the consent orders, provided the terms of the agreement are fulfilled. The Office of the Comptroller of the Currency’s agreement not to assess civil money penalties is further conditioned on HSBC North America making payments or providing borrower assistance pursuant to any agreement that may be entered into with the DoJ in connection with the servicing of residential mortgage loans within two years. The Federal Reserve Board has agreed that any assessment of civil money penalties by the Federal Reserve Board will reflect a number of adjustments, including amounts expended in consumer relief and payments made pursuant to any agreement that may be entered into with the DoJ in connection with the servicing of residential mortgage loans. In addition, the agreement does not preclude private litigation concerning these practices.
Separate from the consent orders and settlement related to the Independent Foreclosure Review discussed above, it has been announced that the five largest US mortgage servicers (not including HSBC Group companies) have reached a settlement with the DoJ, the US Department of Housing and Urban Development and State Attorneys General of 49 states with respect to foreclosure and other mortgage servicing practices. HNAH, HSBC Bank USA and HSBC Finance have had discussions with US bank regulators and other governmental agencies regarding a potential resolution, although the timing of any settlement is not presently known. HSBC recognised provisions of US$257m in 2011 to reflect the estimated liability associated with a proposed settlement of this matter. Any such settlement, however, may not completely preclude other enforcement actions by state or federal agencies, regulators or law enforcement bodies related to foreclosure and other mortgage servicing practices, including, but not limited to matters relating to the securitisation of mortgages for investors. In addition, such a settlement would not preclude private litigation concerning these practices.
Participants in the US mortgage securitisation market that purchased and repackaged whole loans have been the subject of lawsuits and governmental and regulatory investigations and inquiries, which have been directed at groups within the US mortgage market, such as servicers, originators, underwriters, trustees or sponsors of securitisations, and at particular participants within these groups. As the industry’s residential mortgage foreclosure issues continue, HSBC Bank USA has taken title to an increasing number of foreclosed homes as trustee on behalf of various securitisation trusts. As nominal record owner of these properties, HSBC Bank USA has been sued by municipalities and tenants alleging various violations of law, including laws regarding property upkeep and tenants’ rights. While HSBC believes and continues to maintain that the obligations at issue and the related liability are properly those of the servicer of each trust, HSBC continues to receive significant and adverse publicity in connection with these and similar matters, including foreclosures that are serviced by others in the name of ‘HSBC, as trustee’.
HSBC Bank USA and HSBC Securities (USA) Inc. have been named as defendants in a number of actions in connection with residential mortgage-backed securities (‘RMBS’) offerings, which generally allege that the offering documents for securities issued by securitisation trusts contained material misstatements and omissions, including statements regarding the underwriting standards governing the underlying mortgage loans. These include an action filed in September 2011 by the Federal Housing Finance Agency (‘FHFA’). This action is one of a series of similar actions filed against 17 financial institutions alleging violations of federal and state securities laws in connection with the sale of private-label RMBS purchased by Fannie Mae and Freddie Mac, primarily from 2005 to 2008. This action, along with all of the similar FHFA RMBS actions, was transferred to a single judge, who directed the defendant in the first-filed matter to file a motion to dismiss. In May 2012, the District Court filed its decision denying the motion to dismiss FHFA’s securities law claims and granting the motion to dismiss FHFA’s negligent misrepresentation
509
Table of Contents
HSBC HOLDINGS PLC
Notes on the Financial Statements(continued)
claims. The District Court’s ruling will form the basis for rulings on the other matters, including the action filed against HSBC Bank USA and HSBC Securities (USA) Inc. Subsequently, the defendant in the first-filed matter sought leave to appeal to the US Court of Appeals for the Second Circuit on certain issues raised in the motion to dismiss. The District Court and the Court of Appeals granted the request for leave to appeal, and this appeal is pending before the Court of Appeals. In December 2012, the District Court directed the parties to schedule mediation with the Magistrate Judge assigned to this action. However, mediation has not yet been scheduled.
In 2012, HSBC Finance received notice of several claims from claimants related to its activities as sponsor and the activities of its subsidiaries as originators in connection with RMBSs purchased between 2005 and 2007. The claims are currently being evaluated and discussions continue to be held with the claimants, but it has not been concluded that these claims are procedurally or substantively valid. In December 2010 and February 2011, HSBC Bank USA has received subpoenas from the SEC seeking production of documents and information relating to its involvement and the involvement of its affiliates in specified private label RMBS transactions as an issuer, sponsor, underwriter, depositor, trustee, custodian or servicer. HSBC Bank USA has also had preliminary contacts with other government authorities exploring the role of trustees in private label RMBS transactions. In February 2011, HSBC Bank USA also received a subpoena from the US Attorney’s Office, Southern District of New York seeking production of documents and information relating to loss mitigation efforts with respect to residential mortgages in the State of New York. In January 2012, HSBC Securities (USA) Inc. was served with a Civil Investigative Demand from the Massachusetts State Attorney General seeking documents, information and testimony related to the sale of RMBS to public and private customers in the State of Massachusetts from January 2005 to the present.
HSBC expects this level of focus will continue and, potentially, intensify, so long as the US real estate markets continue to be distressed. As a result, HSBC Group companies may be subject to additional claims, litigation and governmental and regulatory scrutiny related to its participation in the US mortgage securitisation market, either individually or as a member of a group. HSBC is unable to estimate reliably the financial effect of any action or litigation relating to these matters. As situations develop it is possible that any related claims could be significant.
Anti-money laundering and sanctions-related
In October 2010, HSBC Bank USA entered into a consent cease and desist order with the Office of the Comptroller of the Currency and the indirect parent of that company, HNAH, entered into a consent cease and desist order with the Federal Reserve Board (the ‘Orders’). These Orders required improvements to establish an effective compliance risk management programme across the Group’s US businesses, including various issues relating to US Bank Secrecy Act (‘BSA’) and anti-money laundering (‘AML’) compliance. Steps continue to be taken to address the requirements of the Orders to ensure compliance, and that effective policies and procedures are maintained.
In addition, in December 2012, HSBC, HNAH and HSBC Bank USA entered into agreements to achieve a resolution with US and UK government agencies that have investigated HSBC’s conduct related to inadequate compliance with anti-money laundering, BSA and sanctions laws, including the previously reported investigations by the DoJ, the Federal Reserve, the Office of the Comptroller of the Currency and the US Department of Treasury’s Financial Crimes Enforcement Network (‘FinCEN’) in connection with AML/BSA compliance, including cross-border transactions involving our cash handling business in Mexico and banknotes business in the US, and the DoJ, the New York County District Attorney’s Office, the Office of Foreign Assets Control (‘OFAC’), the Federal Reserve and the Office of the Comptroller of the Currency regarding historical transactions involving Iranian parties and other parties subject to OFAC economic sanctions. As part of the resolution, HSBC entered into a deferred prosecution agreement among HSBC, HSBC Bank USA, the DoJ, the United States Attorney’s Office for the Eastern District of New York, and the United States Attorney’s Office for the Northern District of West Virginia (the ‘US DPA’), and a deferred prosecution agreement with the New York County District Attorney, and consented to a cease and desist order and, along with HNAH, consented to a monetary penalty order with the Federal Reserve. In addition, HSBC Bank USA entered into the US DPA, an agreement and consent orders with the Office of the Comptroller of the Currency, and a consent order with FinCEN. HSBC also entered into an undertaking with the UK Financial Services Authority (‘FSA’) to comply with certain forward-looking obligations with respect to anti-money laundering and sanctions requirements over a five-year term.
Under these agreements, HSBC and HSBC Bank USA made payments totalling US$1,921m to US authorities and will continue to cooperate fully with US and UK regulatory and law enforcement authorities and take further action to strengthen their compliance policies and procedures. Over the five-year term of the agreement with the DoJ and FSA, an independent monitor (who will, for FSA purposes, be a ‘skilled person’ under Section 166 of the Financial Services and Markets Act (‘FSMA’)) will evaluate HSBC’s progress in fully implementing these and other measures
510
Table of Contents
HSBC HOLDINGS PLC
Notes on the Financial Statements(continued)
it recommends, and will produce regular assessments of the effectiveness of HSBC’s compliance function. If HSBC fulfils all of the requirements imposed by the US DPA and other agreements, the DOJ’s charges against it will be dismissed at the end of the five-year period. The US DPA remains subject to certain proceedings before the United States District Court for the Eastern District of New York. The DoJ or the New York County District Attorney’s Office may prosecute HSBC in relation to the matters which are the subject of the US DPA if HSBC breaches the terms of the US DPA.
Steps continue to be taken to address the requirements of the US DPA and the FSA undertaking to ensure compliance, and that effective policies and procedures are maintained. In addition, the settlement with regulators does not preclude private litigation relating to, among other things, HSBC’s compliance with applicable anti-money laundering, BSA and sanctions laws.
In July 2012, HSBC Mexico paid a fine imposed by the Mexican National Banking and Securities Commission amounting to 379m Mexican pesos (approximately US$28m), in connection with non-compliance with anti-money laundering systems and controls.
US tax and broker-dealer investigations
HSBC continues to cooperate in ongoing investigations by the DoJ and the US Internal Revenue Service regarding whether certain Group companies and employees acted appropriately in relation to certain customers who had US tax reporting requirements. In connection with these investigations, HSBC Private Bank Suisse SA, with due regard for Swiss law, has produced records and other documents to the DoJ and is cooperating with the investigation. Other HSBC entities are also cooperating with the relevant US authorities, including with respect to US-based clients of an HSBC Group company in India.
In April 2011, HSBC Bank USA received a summons from the US Internal Revenue Service directing HSBC Bank USA to produce records with respect to US-based clients of an HSBC Group company in India. HSBC Bank USA has cooperated fully by providing responsive documents in its possession in the US to the US Internal Revenue Service.
Also in April 2011, HSBC Bank USA received a subpoena from the SEC directing HSBC Bank USA to produce records in the US related to, among other things, HSBC Private Bank Suisse SA’s cross-border policies and procedures and adherence to US broker-dealer and investment adviser rules and regulations when dealing with US resident clients. HSBC Bank USA continues to cooperate with the SEC. HSBC Private Bank Suisse SA has also produced records and other documents to the SEC and is cooperating with the SEC’s investigation.
Based on the facts currently known in respect of each of these investigations, there is a high degree of uncertainty as to the terms on which the ongoing investigations will be resolved and the timing of such resolution, including the amounts of any fines and/or penalties. As matters progress, it is possible that any fines and/or penalties could be significant.
Investigations and reviews into the setting of London interbank offered rates, European interbank offered rates and other benchmark interest and foreign exchange rates
Various regulators and competition and enforcement authorities around the world including in the UK, the US, Canada, the EU, Switzerland and Asia, are conducting investigations and reviews related to certain past submissions made by panel banks and the processes for making submissions in connection with the setting of London interbank offered rates (‘Libor’), European interbank offered rates (‘Euribor’) and other benchmark interest and foreign exchange rates. Several of these panel banks have reached settlements with various regulatory authorities. As certain HSBC entities are members of such panels, HSBC and/or its subsidiaries have been the subject of regulatory demands for information and are cooperating with those investigations and reviews. Based on the facts currently known, there is a high degree of uncertainty as to the resolution of these regulatory investigations and reviews, including the timing. The potential impact and size of any fines or penalties that could be imposed on HSBC cannot be measured reliably.
In addition, HSBC and other panel banks have been named as defendants in private lawsuits filed in the US with respect to the setting of Libor, including putative class action lawsuits which have been consolidated before the US District Court for the Southern District of New York. The complaints in those actions assert claims against HSBC and other panel banks under various US laws including US antitrust laws, the US Commodities Exchange Act, and
511
Table of Contents
HSBC HOLDINGS PLC
Notes on the Financial Statements(continued)
state law. Based on the facts currently known, it is not practicable at this time for HSBC to predict the resolution of these private lawsuits, including the timing and potential impact on HSBC.
| 44 | Related party transactions |
Related parties of the Group and HSBC Holdings include subsidiaries, associates, joint ventures, post-employment benefit plans for HSBC employees, Key Management Personnel, close family members of Key Management Personnel and entities which are controlled or jointly controlled by Key Management Personnel or their close family members.
Key Management Personnel are defined as those persons having authority and responsibility for planning, directing and controlling the activities of HSBC Holdings, being the Directors and Group Managing Directors of HSBC Holdings.
Compensation of Key Management Personnel
| HSBC | ||||||||||||||||
2012 US$m | 2011 US$m | 2010 US$m | ||||||||||||||
Short-term employee benefits | 37 | 34 | 39 | |||||||||||||
Post-employment benefits | 1 | 2 | 3 | |||||||||||||
Other long-term employee benefits | 10 | 7 | 1 | |||||||||||||
Share-based payments | 43 | 53 | 49 | |||||||||||||
| 91 | 96 | 92 | ||||||||||||||
Transactions, arrangements and agreements involving related parties
Particulars of advances (loans and quasi-loans), credits and guarantees entered into by subsidiaries of HSBC Holdings during 2012 with Directors, disclosed pursuant to section 413 of the Companies Act 2006, are shown below:
| At 31 December | ||||||||||
2012 US$m | 2011 US$m | |||||||||
Advances and credits | 7 | 8 | ||||||||
Particulars of transactions with related parties, disclosed pursuant to the requirements of IAS 24, are shown below. The disclosure of the year-end balance and the highest amounts outstanding during the year in the table below is considered to be the most meaningful information to represent the amount of the transactions and the amount of outstanding balances during the year.
| 2012 | 2011 | |||||||||||||||||
Balance at 31 December US$m | Highest amounts outstanding during year US$m | Balance at 31 December US$m | Highest amounts outstanding during year US$m | |||||||||||||||
Key Management Personnel1 | ||||||||||||||||||
Advances and credits | 153 | 242 | 112 | 120 | ||||||||||||||
Guarantees | 8 | 12 | 12 | 12 | ||||||||||||||
| 1 | Includes Key Management Personnel, close family members of Key Management Personnel and entities which are controlled or jointly controlled by Key Management Personnel or their close family members. |
Some of the transactions were connected transactions, as defined by the Rules Governing The Listing of Securities on The Stock Exchange of Hong Kong Limited but were exempt from any disclosure requirements under the provisions of those rules. The above transactions were made in the ordinary course of business and on substantially the same terms, including interest rates and security, as for comparable transactions with persons of a similar standing or, where applicable, with other employees. The transactions did not involve more than the normal risk of repayment or present other unfavourable features.
512
Table of Contents
HSBC HOLDINGS PLC
Notes on the Financial Statements(continued)
Shareholdings, options and other securities of Key Management Personnel
| At 31 December | ||||||||||
2012 (000s) | 2011 (000s) | |||||||||
Number of options held over HSBC Holdings ordinary shares under employee share plans | 358 | 545 | ||||||||
Number of HSBC Holdings ordinary shares held beneficially and non-beneficially | 14,713 | 15,384 | ||||||||
Number of HSBC Holdings 6.5% Subordinated Notes 2036 held beneficially and non-beneficially | 300 | 300 | ||||||||
Number of HSBC Bank 2.875% Notes 2015 held beneficially and non-beneficially | 5 | – | ||||||||
| 15,376 | 16,229 | |||||||||
Transactions with other related parties of HSBC
Associates and joint ventures
The Group provides certain banking and financial services to associates and joint ventures, including loans, overdrafts, interest and non-interest bearing deposits and current accounts. Details of the interests in associates and joint ventures are given in Note 22. Transactions and balances during the year with associates and joint ventures were as follows:
| 2012 | 2011 | |||||||||||||||||||||
Highest the year1 | Balance at 31 December1 | Highest the year1 | Balance at 31 December1 | |||||||||||||||||||
Amounts due from joint ventures: | ||||||||||||||||||||||
– subordinated | 5 | 1 | 6 | 5 | ||||||||||||||||||
– unsubordinated | 391 | 210 | 459 | 441 | ||||||||||||||||||
Amounts due from associates: | ||||||||||||||||||||||
– unsubordinated | 3,554 | 2,736 | 3,117 | 2,569 | ||||||||||||||||||
| 3,950 | 2,947 | 3,582 | 3,015 | |||||||||||||||||||
Amounts due to joint ventures | 135 | 1 | 195 | 133 | ||||||||||||||||||
Amounts due to associates | 854 | 264 | 587 | 475 | ||||||||||||||||||
| 989 | 265 | 782 | 608 | |||||||||||||||||||
Commitments | 326 | 45 | 184 | 92 | ||||||||||||||||||
| 1 | The disclosure of the year-end balance and the highest balance during the year is considered the most meaningful information to represent transactions during the year. |
The above outstanding balances arose from the ordinary course of business and on substantially the same terms, including interest rates and security, as for comparable transactions with third-party counterparties.
Post-employment benefit plans
At 31 December 2012, US$5bn (2011: US$4.6bn) of HSBC post-employment benefit plan assets were under management by HSBC companies. Fees of US$20m (2011: US$20m) were earned by HSBC companies for these management services provided to its post-employment benefit plans. HSBC’s post-employment benefit plans had placed deposits of US$285m (2011: US$1.2bn) with its banking subsidiaries, on which interest payable to the schemes amounted to US$1.9m (2011: US$3m). The above outstanding balances arose from the ordinary course of business and on substantially the same terms, including interest rates and security, as for comparable transactions with third-party counterparties.
HSBC Bank (UK) Pension Scheme entered into swap transactions with HSBC as part of the management of the inflation and interest rate sensitivity of its liabilities. At 31 December 2012, the gross notional value of the swaps was US$31bn (2011: US$25bn), the swaps had a positive fair value of US$5.2bn (2011: positive fair value of US$5.6bn) to the scheme and HSBC had delivered collateral of US$7.1bn (2011: US$6.9bn) to the scheme in respect of these swaps, on which HSBC earned no interest (2011: nil). All swaps were executed at prevailing market rates and within standard market bid/offer spreads.
In order to satisfy diversification requirements, there are special collateral provisions for the swap transactions between HSBC and the scheme. The collateral agreement stipulates that the scheme never posts collateral to HSBC. Collateral is posted to the scheme by HSBC at an amount that provides the Trustee with a high level of confidence
513
Table of Contents
HSBC HOLDINGS PLC
Notes on the Financial Statements(continued)
that would be sufficient to replace the swaps in the event of default by HSBC Bank plc. With the exception of the special collateral arrangements detailed above, all other aspects of the swap transactions between HSBC and the scheme are on substantially the same terms as comparable transactions with third-party counterparties.
In December 2011, HSBC Bank plc made a £184m (US$286m) contribution to the HSBC Bank (UK) Pension Scheme. Following the contribution the Scheme purchased asset-backed securities from HSBC at an arm’s length value, determined by the Scheme’s independent third-party advisers.
In December 2011 HSBC International Staff Retirements Benefits Scheme (‘ISRBS’) purchased asset-backed securities from HSBC at an arm’s length value of US$34m, determined by the Scheme’s independent third party advisers. This followed an agreement by HSBC Asia Holdings BV to make a contribution of the same amount to ISRBS. No gain or loss arose on the transaction.
ISRBS entered into swap transactions with HSBC to manage the inflation and interest rate sensitivity of the liabilities and selected assets. At 31 December 2012, the gross notional value of the swaps was US$1.8bn (2011: US$1.7bn) and the swaps had a net positive fair value of US$328m to the scheme (2011: US$297m). All swaps were executed at prevailing market rates and within standard market bid/offer spreads.
HSBC Holdings
Details of HSBC Holdings’ principal subsidiaries are shown in Note 25. Transactions and balances during the year with subsidiaries were as follows:
| 2012 | 2011 | |||||||||||||||||||||
Highest the year1 | Balance at 31 December1 | Highest the year1 | Balance at 31 December1 | |||||||||||||||||||
Assets | ||||||||||||||||||||||
Cash at bank | 429 | 353 | 471 | 316 | ||||||||||||||||||
Derivatives | 4,122 | 3,768 | 4,220 | 3,568 | ||||||||||||||||||
Loans and advances | 41,675 | 41,675 | 28,821 | 28,048 | ||||||||||||||||||
Financial investments | 1,208 | 1,208 | 2,093 | 1,078 | ||||||||||||||||||
Investments in subsidiaries | 92,234 | 92,234 | 93,008 | 90,621 | ||||||||||||||||||
Total related party assets | 139,668 | 139,238 | 128,613 | 123,631 | ||||||||||||||||||
Liabilities | ||||||||||||||||||||||
Amounts owed to HSBC undertakings | 12,856 | 12,856 | 3,129 | 2,479 | ||||||||||||||||||
Derivatives | 1,536 | 760 | 1,181 | 1,067 | ||||||||||||||||||
Subordinated liabilities: | ||||||||||||||||||||||
– at amortised cost | 2,493 | 1,696 | 2,609 | 2,437 | ||||||||||||||||||
– designated at fair value | 4,271 | 4,260 | 4,627 | 3,955 | ||||||||||||||||||
Total related party liabilities | 21,156 | 19,572 | 11,546 | 9,938 | ||||||||||||||||||
Guarantees | 49,560 | 49,402 | 49,527 | 49,402 | ||||||||||||||||||
Commitments | 1,811 | 1,200 | 2,753 | 1,810 | ||||||||||||||||||
| 1 | The disclosure of the year-end balance and the highest month-end balance during the year is considered the most meaningful information to represent transactions during the year. The above outstanding balances arose in the ordinary course of business and were on substantially the same terms, including interest rates and security, as for comparable transactions with third-party counterparties. There were no exceptions (2011: US$63m) in respect of loans to HSBC subsidiaries from HSBC Holdings made at an agreed zero per cent interest rate. |
Some employees of HSBC Holdings are members of the HSBC Bank (UK) Pension Scheme, which is sponsored by a separate Group company. HSBC Holdings incurs a charge for these employees equal to the contributions paid into the scheme on their behalf. Disclosure in relation to the scheme is made in Note 7 to the accounts.
514
Table of Contents
HSBC HOLDINGS PLC
Notes on the Financial Statements(continued)
| 45 | Events after the balance sheet date |
On 7 January 2013, Industrial Bank Co., Ltd. (‘Industrial Bank’), a principal associate, completed a private placement of additional share capital to a number of third parties, thereby diluting the Group’s equity holding from 12.8% to 10.9%. As a result of this and other factors, the Group considers it is no longer in a position to exercise significant influence over Industrial Bank and ceased to account for the investment as an associate from that date, giving rise to an accounting gain of HKD9.5bn or US$1.2bn. Thereafter, the holding is recognised as an available-for-sale financial investment.
The disposal of the second tranche of shares in Ping An was completed on 6 February 2013. A description of this disposal is provided in Note 26.
On 19 February 2013, we announced an agreement to sell HSBC Bank Panama S.A., recorded as part of our Latin America segment, to Bancolombia S.A. for a total consideration of US$2.1bn in cash. The transaction is subject to regulatory approvals and other conditions and is expected to complete by the third quarter of 2013. The assets and liabilities of these operations were not classified as held for sale at 31 December 2012 as the sale was not yet considered highly probable at that time.
On 28 February 2013, HSBC Bank USA entered into an agreement with the Office of the Comptroller of the Currency, and HSBC Finance and HNAH entered into an agreement with the Federal Reserve Board in relation to the Independent Foreclosure Review. Additional information is provided in Note 43.
A fourth interim dividend for 2012 of US$0.18 per ordinary share (a distribution of approximately US$3,327m) was declared by the Directors after 31 December 2012.
These accounts were approved by the Board of Directors on 4 March 2013 and authorised for issue.
| 46 | Non-statutory accounts |
The information set out in these accounts does not constitute the company’s statutory accounts for the years ended 31 December 2012 or 2011. Those accounts have been reported on by the company’s auditors: their reports were unqualified and did not contain a statement under section 498 (2) or (3) of the Companies Act 2006. The accounts for 2011 have been delivered to the Registrar of Companies and those for 2012 will be delivered in due course.
515
Table of Contents
HSBC HOLDINGS PLC
| Page | ||||
| 516 | ||||
| 516 | ||||
| 517 | ||||
| 517 | ||||
| 518 | ||||
| 518 | ||||
| 519 | ||||
| 519 | ||||
| 520 | ||||
| 521 | ||||
| 522 | ||||
Information about the enforceability of judgements made in the US | 524a | |||
| Page | ||||
Exchange controls and other limitations affecting equity security holders | 524a | |||
| 524a | ||||
| 524a | ||||
| 524b | ||||
| 524c | ||||
| 524d | ||||
Differences in HSBC Holdings/New York Stock Exchange corporate governance practices | 524e | |||
| 528 | ||||
| 529 | ||||
| 532 | ||||
Fourth interim dividend for 2012
The Directors have declared a fourth interim dividend for 2012 of US$0.18 per ordinary share. Information on the scrip dividend scheme and currencies in which shareholders may elect to have the cash dividend paid will be sent to shareholders on or about 3 April 2013. The timetable for the dividend is:
Announcement | 4 March 2013 | |||
Shares quoted ex-dividend in London, Hong Kong, Paris and Bermuda | 20 March 2013 | |||
ADSs quoted ex-dividend in New York | 20 March 2013 | |||
Record date in Hong Kong | 21 March 2013 | |||
Record date in London, New York, Paris and Bermuda1 | 22 March 2013 | |||
Mailing ofAnnual Report and Accounts 2012and/orAnnual Review 2012, Notice of Annual General Meeting and dividend documentation | 3 April 2013 | |||
Final date for receipt by registrars of forms of election, Investor Centre electronic instructions and revocations of standing instructions for scrip dividends | 25 April 2013 | |||
Exchange rate determined for payment of dividends in sterling and Hong Kong dollars | 29 April 2013 | |||
Payment date: dividend warrants, new share certificates or transaction advices and notional tax vouchers mailed and shares credited to stock accounts in CREST | 8 May 2013 |
| 1 | Removals to and from the Overseas Branch register of shareholders in Hong Kong will not be permitted on this date. |
The Board has adopted a policy of paying quarterly interim dividends on the ordinary shares. Under this policy it is intended to have a pattern of three equal interim dividends with a variable fourth interim dividend. It is envisaged that the first interim dividend in respect of 2013 will be US$0.10 per ordinary share. The proposed timetables for the dividends in respect of 2013 are:
| Interim dividends for 2013 | ||||||||||||||||
| First | Second | Third | Fourth | |||||||||||||
Announcement | 7 May 2013 | 5 August 2013 | 7 October 2013 | 24 February 2014 | ||||||||||||
Shares quoted ex-dividend in London, Hong Kong, Paris and Bermuda | 22 May 2013 | 21 August 2013 | 23 October 2013 | 12 March 2014 | ||||||||||||
ADSs quoted ex-dividend in New York | 22 May 2013 | 21 August 2013 | 23 October 2013 | 12 March 2014 | ||||||||||||
Record date in Hong Kong | 23 May 2013 | 22 August 2013 | 24 October 2013 | 13 March 2014 | ||||||||||||
Record date in London, New York, Paris and Bermuda1 | 24 May 2013 | 23 August 2013 | 25 October 2013 | 14 March 2014 | ||||||||||||
Payment date | 11 July 2013 | 9 October 2013 | 11 December 2013 | 30 April 2014 | ||||||||||||
| 1 | Removals to and from the Overseas Branch Register of shareholders in Hong Kong will not be permitted on these dates. |
Dividends are declared in US dollars and, at the election of the shareholder, paid in cash in one of, or in a combination of, US dollars, sterling and Hong Kong dollars, or, subject to the Board’s determination that a scrip
516
Table of Contents
HSBC HOLDINGS PLC
Shareholder Information(continued)
dividend is to be offered in respect of that dividend, may be satisfied in whole or in part by the issue of new shares in lieu of a cash dividend.
At 31 December 2012 the share register recorded the following details:
| Ordinary shares held | Number of shareholders | Total shares held | ||||||||
1-100 | 35,872 | 1,075,355 | ||||||||
101-400 | 30,307 | 7,425,370 | ||||||||
401-500 | 7,833 | 3,538,962 | ||||||||
501-1,000 | 31,490 | 23,056,605 | ||||||||
1,001-5,000 | 72,523 | 170,851,837 | ||||||||
5,001-10,000 | 18,840 | 133,212,606 | ||||||||
10,001-20,000 | 10,978 | 153,114,553 | ||||||||
20,001-50,000 | 6,673 | 204,789,957 | ||||||||
50,001-200,000 | 3,271 | 301,012,906 | ||||||||
200,001-500,000 | 721 | 223,700,082 | ||||||||
500,001 and above | 1,050 | 17,254,230,431 | ||||||||
Total | 219,558 | 18,476,008,664 | ||||||||
All Directors listed on pages 302 to 307 attended the 2012 Annual General Meeting with the exception of G Morgan who was unable to attend and R Fassbind and J Comey who were appointed Directors on 1 January 2013 and 4 March 2013, respectively. G Morgan ceased to be a Director from the conclusion of the 2012 Annual General Meeting.
All resolutions considered at the 2012 Annual General Meeting held at 11.00am on 25 May 2012 at The Barbican Centre, London EC2 were passed on a poll as follows:
| Total votes | ||||||||||||||
| Resolution | For1 | Against | Vote withheld2 | |||||||||||
1 | To receive the Report and Accounts for 2011 | 8,674,241,734 | 135,201,316 | 7,347,647 | ||||||||||
2 | To approve the Directors’ Remuneration Report for 2011 | 7,603,837,582 | 863,308,512 | 342,947,482 | ||||||||||
3 | To elect or re-elect the following as Directors: | |||||||||||||
| (a) S A Catz | 8,804,928,221 | 9,610,127 | 5,875,570 | |||||||||||
| (b) L M L Cha | 8,648,658,349 | 47,870,917 | 123,714,457 | |||||||||||
| (c) M K T Cheung | 8,802,099,054 | 12,615,523 | 5,630,308 | |||||||||||
| (d) J D Coombe | 8,628,180,910 | 186,062,475 | 5,852,946 | |||||||||||
| (e) J Faber | 8,796,984,821 | 17,580,853 | 5,861,373 | |||||||||||
| (f) R A Fairhead | 8,743,788,851 | 118,900,468 | 5,802,585 | |||||||||||
| (g) D J Flint | 8,619,018,008 | 168,004,948 | 33,368,432 | |||||||||||
| (h) A A Flockhart | 8,774,240,102 | 40,569,601 | 5,687,412 | |||||||||||
| (i) S T Gulliver | 8,775,424,304 | 39,522,674 | 5,558,005 | |||||||||||
| (j) J W J Hughes-Hallett | 8,771,227,801 | 43,514,682 | 5,732,794 | |||||||||||
| (k) W S H Laidlaw | 8,749,103,878 | 65,588,171 | 5,762,796 | |||||||||||
| (l) J P Lipsky | 8,804,822,657 | 9,552,202 | 5,949,328 | |||||||||||
| (m) J R Lomax | 8,694,903,617 | 21,801,654 | 103,551,962 | |||||||||||
| (n) I J Mackay | 8,780,813,350 | 33,915,545 | 5,752,704 | |||||||||||
| (o) N R N Murthy | 8,799,839,273 | 14,888,406 | 5,752,109 | |||||||||||
| (p) Sir Simon Robertson | 8,637,007,606 | 48,054,956 | 123,743,083 | |||||||||||
| (q) J L Thornton | 8,248,542,395 | 336,922,956 | 233,310,057 | |||||||||||
4 | To reappoint the Auditor at remuneration to be determined by the Group Audit Committee | 8,658,879,219 | 145,175,480 | 16,773,808 | ||||||||||
5 | To authorise the Directors to allot shares | 8,598,678,631 | 214,223,057 | 6,232,394 | ||||||||||
6 | To disapply pre-emption rights (Special Resolution) | 8,613,126,301 | 195,480,323 | 12,092,143 | ||||||||||
7 | To authorise the Company to purchase its own shares | 8,775,533,630 | 39,890,867 | 5,250,428 | ||||||||||
8 | To authorise the Directors to offer a scrip dividend alternative | 8,805,094,483 | 5,763,369 | 9,412,655 | ||||||||||
9 | To approve general meetings (other than annual general meetings) being called on 14 clear days’ notice | 7,876,386,438 | 937,298,004 | 6,966,206 | ||||||||||
| 1 | Includes discretionary votes. |
| 2 | A ‘Vote Withheld’ is not a ‘vote’ in law and is not counted in the calculation of the votes ‘For’ and ‘Against’ the resolution. |
517
Table of Contents
HSBC HOLDINGS PLC
Shareholder Information(continued)
Interim Management Statements and Interim Results
Interim Management Statements are expected to be issued on or around 7 May 2013 and 4 November 2013. The Interim Results for the six months to 30 June 2013 are expected to be issued on 5 August 2013.
Shareholder enquiries and communications
Enquiries
Any enquiries relating to shareholdings on the share register, for example transfers of shares, change of name or address, lost share certificates or dividend cheques, should be sent to the Registrars at the address given below. The Registrars offer an online facility, Investor Centre, which enables shareholders to manage their shareholding electronically.
| Principal Register: | Hong Kong Overseas Branch Register: | Bermuda Overseas Branch Register: | ||
Computershare Investor Services PLC The Pavilions Bridgwater Road Bristol BS99 6ZZ United Kingdom Telephone: 44 (0) 870 702 0137 Email via website: www.investorcentre.co.uk/contactus | Computershare Hong Kong Investor Services Limited Rooms 1712-1716, 17thFloor Hopewell Centre 183 Queen’s Road East Hong Kong Telephone: 852 2862 8555 Email: hsbc.ecom@computershare.com.hk | Investors Relations Team HSBC Bank Bermuda Limited 6 Front Street Hamilton HM 11 Bermuda Telephone: 1 441 299 6737 Email: hbbm.shareholder.services@hsbc.bm | ||
Investor Centre: www.investorcentre.co.uk | Investor Centre: www.computershare.com/hk/investors | Investor Centre: www.computershare.com/investor/bm | ||
Any enquiries relating to ADSs should be sent to the depositary:
The Bank of New York Mellon
Depositary Receipts
PO Box 43006
Providence, RI 02940-3006
USA
Telephone (US): 1 877 283 5786
Telephone (International): 1 201 680 6825
Email: shrrelations@bnymellon.com
Website: www.bnymellon.com/shareowner
Any enquiries relating to shares held through Euroclear France, the settlement and central depositary system for NYSE Euronext Paris, should be sent to the paying agent:
HSBC France
103, avenue des Champs Elysées
75419 Paris Cedex 08
France
Telephone: 33 1 40 70 22 56
Email: ost-agence-des-titres-hsbc-reims.hbfr-do@hsbc.fr
Website: www.hsbc.fr
If you have been nominated to receive general shareholder communications directly from HSBC Holdings, it is important to remember that your main contact for all matters relating to your investment remains the registered shareholder, or perhaps custodian or broker, who administers the investment on your behalf. Therefore any changes or queries relating to your personal details and holding (including any administration thereof) must continue to be directed to your existing contact at your investment manager or custodian. HSBC Holdings cannot guarantee dealing with matters directed to it in error.
518
Table of Contents
HSBC HOLDINGS PLC
Shareholder Information(continued)
Further copies of thisAnnual Report and Accounts 2012 may be obtained by writing to the following departments:
| For those in Europe, the Middle East and Africa: | For those in Asia-Pacific: | For those in the Americas: | ||
Global Communications HSBC Holdings plc 8 Canada Square London E14 5HQ United Kingdom | Communications (Asia) The Hongkong and Shanghai Banking Corporation Limited 1 Queen’s Road Central Hong Kong | Global Publishing Services HSBC – North America 26525 N Riverwoods Boulevard Mettawa, Illinois 60045 USA | ||
Electronic communications
Shareholders may at any time choose to receive corporate communications in printed form or to receive a notification of their availability on HSBC’s website. To receive future notifications of the availability of a corporate communication on HSBC’s website by email, or revoke or amend an instruction to receive such notifications by email, go to www.hsbc.com/ecomms. If you provide an email address to receive electronic communications from HSBC, we will also send notifications of your dividend entitlements by email. If you received a notification of the availability of this document on HSBC’s website and would like to receive a printed copy of it, or if you would like to receive future corporate communications in printed form, please write or send an email to the appropriate Registrars at the address given above. Printed copies will be provided without charge.
Chinese translation
A Chinese translation of thisAnnual Report and Accounts 2012 is available upon request after 3 April 2013 from the Registrars:
Computershare Hong Kong Investor Services Limited Rooms 1712-1716, 17th Floor Hopewell Centre 183 Queen’s Road East Hong Kong | Computershare Investor Services PLC The Pavilions Bridgwater Road Bristol BS99 6ZZ United Kingdom |
Please also contact the Registrars if you wish to receive Chinese translations of future documents or if you have received a Chinese translation of this document and do not wish to receive such translations in future.

HSBC Holdings ordinary shares trade under the following stock symbols:
London Stock Exchange | HSBA | Euronext Paris | HSB | |||
Hong Kong Stock Exchange | 5 | Bermuda Stock Exchange | HSBC | |||
New York Stock Exchange (ADS) | HBC |
Enquiries relating to HSBC’s strategy or operations may be directed to:
Manager Investor Relations HSBC Holdings plc 8 Canada Square London E14 5HQ United Kingdom | SVP Investor Relations HSBC North America Holdings Inc. 26525 N Riverwoods Boulevard Mettawa, Illinois 60045 USA | Head of Investor Relations, Asia-Pacific The Hongkong and Shanghai Banking Corporation Limited 1 Queen’s Road Central Hong Kong | ||
Telephone: 44 020 7991 8041 | 1 224 880 8008 | 852 2822 4908 | ||
Facsimile: 44 0845 587 0225 | 1 847 383 3331 | 852 3418 4469 | ||
Email: investorrelations@hsbc.com | investor.relations.usa@us.hsbc.com | investorrelations@hsbc.com.hk |
519
Table of Contents
HSBC HOLDINGS PLC
Shareholder Information(continued)
Where more information about HSBC is available
ThisAnnual Report and Accounts 2012, and other information on HSBC, may be viewed on HSBC’s website: www.hsbc.com.
Reports, statements and information that HSBC Holdings files with the Securities and Exchange Commission are available at www.sec.gov. Investors can also request hard copies of these documents upon payment of a duplicating fee, by writing to the SEC at the Office of Investor Education and Advocacy, 100 F Street N.E., Washington, DC 20549-0123 or by emailing PublicInfo@sec.gov. Investors should call the Commission at (202) 551 8090 if they require further assistance. Investors may also obtain the reports and other information that HSBC Holdings files at www.nyse.com (telephone number (1) 212 656 3000).
520
Table of Contents
HSBC HOLDINGS PLC
Shareholder Information(continued)
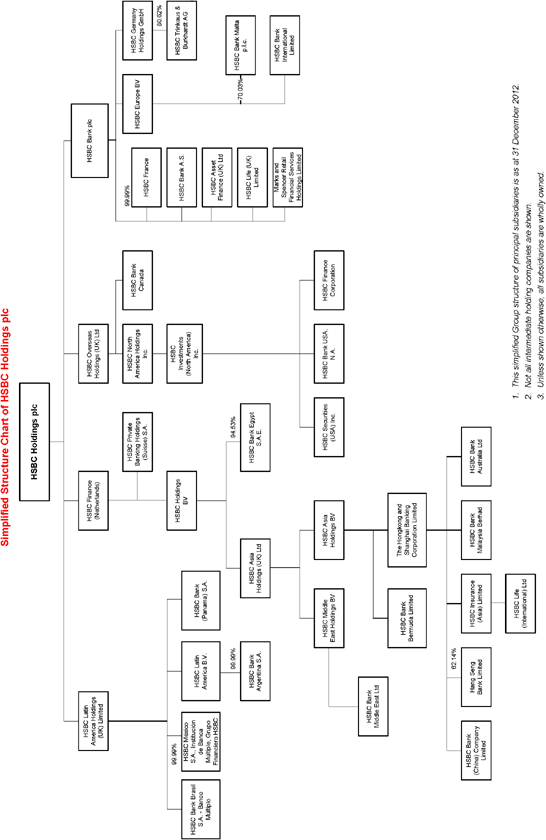
521
Table of Contents
HSBC HOLDINGS PLC
Shareholder Information(continued)
Taxation of shares and dividends
Taxation – UK residents
The following is a summary, under current law, of certain UK tax considerations that are likely to be material to the ownership and disposition of shares. The summary does not purport to be a comprehensive description of all the tax considerations that may be relevant to a holder of shares. In particular, the summary deals principally with shareholders who are resident solely in the UK for UK tax purposes and only with holders who hold the shares as investments and who are the beneficial owners of the shares, and does not address the tax treatment of certain classes of holders such as dealers in securities. Holders and prospective purchasers should consult their own advisers regarding the tax consequences of an investment in shares in light of their particular circumstances, including the effect of any national, state or local laws.
Taxation of dividends
Currently no tax is withheld from dividends paid by HSBC Holdings. However, dividends are paid with an associated tax credit which is available for set-off by certain shareholders against any liability they may have to UK income tax. Currently, the associated tax credit is equivalent to 10% of the combined cash dividend and tax credit, i.e. one-ninth of the cash dividend.
For individual shareholders who are resident in the UK for taxation purposes and liable to UK income tax at the basic rate, no further UK income tax liability arises on the receipt of a dividend from HSBC Holdings. Individual shareholders who are liable to UK income tax at the higher rate or additional rate are taxed on the combined amount of the dividend and the tax credit at the dividend upper rate (currently 32.5%) and the dividend additional rate (currently 42.5%), respectively. The UK Government has announced that the dividend additional rate will be reduced from 42.5% to 37.5%, with effect on and after 6 April 2013. The tax credit is available for set-off against the dividend upper rate and the dividend additional rate liability. Individual UK resident shareholders are not entitled to any tax credit repayment.
Although non-UK resident shareholders are generally not entitled to any repayment of the tax credit in respect of any UK dividend received, some such shareholders may be so entitled under the provisions of a double taxation agreement between their country of residence and the UK. However, in
most cases no amount of the tax credit is, in practice, repayable.
Information on the taxation consequences of the HSBC Holdings scrip dividends offered in lieu of the 2011 fourth interim dividend and the first, second and third interim dividends for 2012 was set out in the Secretary’s letters to shareholders of 27 March, 29 May, 29 August and 7 November 2012. In no case, was the difference between the cash dividend foregone and the market value of the scrip dividend in excess of 15% of the market value. Accordingly, the amount of the dividend income chargeable to tax, and, the acquisition price of HSBC Holdings US$0.50 ordinary shares (the ‘shares’) for UK capital gains tax purposes, was the cash dividend foregone.
Taxation of capital gains
The computation of the capital gains tax liability arising on disposals of shares in HSBC Holdings by shareholders subject to UK tax on capital gains can be complex, partly depending on whether, for example, the shares were purchased since April 1991, acquired in 1991 in exchange for shares in The Hongkong and Shanghai Banking Corporation Limited, or acquired subsequent to 1991 in exchange for shares in other companies.
For capital gains tax purposes, the acquisition cost for ordinary shares is adjusted to take account of subsequent rights and capitalisation issues. Any capital gain arising on a disposal by a UK company may also be adjusted to take account of indexation allowance. If in doubt, shareholders are recommended to consult their professional advisers.
Stamp duty and stamp duty reserve tax
Transfers of shares by a written instrument of transfer generally will be subject to UK stamp duty at the rate of 0.5% of the consideration paid for the transfer, and such stamp duty is generally payable by the transferee.
An agreement to transfer shares, or any interest therein, normally will give rise to a charge to stamp duty reserve tax at the rate of 0.5% of the consideration. However, provided an instrument of transfer of the shares is executed pursuant to the agreement and duly stamped before the date on which the stamp duty reserve tax becomes payable, under the current practice of UK HM Revenue and Customs it will not be necessary to pay the stamp duty reserve tax, nor to apply for such tax to be cancelled. Stamp duty reserve tax is generally payable by the transferee.
522
Table of Contents
HSBC HOLDINGS PLC
Shareholder Information(continued)
Paperless transfers of shares within CREST, the UK’s paperless share transfer system, are liable to stamp duty reserve tax at the rate of 0.5% of the consideration. In CREST transactions, the tax is calculated and payment made automatically. Deposits of shares into CREST generally will not be subject to stamp duty reserve tax, unless the transfer into CREST is itself for consideration. Following the case HSBC pursued before the European Court of Justice (Case C-569/07 HSBC Holdings plc and Vidacos Nominees Ltd v The Commissioners for HM Revenue & Customs) and a subsequent case in relation to depositary receipts, HMRC now accepts that the charge to stamp duty reserve tax at 1.5% on the issue of shares to a depositary receipt issuer or a clearance service is prohibited.
Taxation – US residents
The following is a summary, under current law, of the principal UK tax and US federal income tax considerations that are likely to be material to the ownership and disposition of shares or American Depositary Shares (‘ADS’s) by a holder that is a resident of the US for US federal income tax purposes (a ‘US holder’) and who is not resident (while it remains relevant to the charge to UK capital gains tax) ordinarily resident in the UK for UK tax purposes. Holders and prospective purchasers should note that the UK Government has announced that ordinary residence will cease to be relevant to the charge to UK capital gains tax for the tax year 2013-14 and subsequent tax years.
The summary does not purport to be a comprehensive description of all of the tax considerations that may be relevant to a holder of shares or ADSs. In particular, the summary deals only with US holders that hold shares or ADSs as capital assets, and does not address the tax treatment of holders that are subject to special tax rules, such as banks, tax-exempt entities, insurance companies, dealers in securities or currencies, persons that hold shares or ADSs as part of an integrated investment (including a ‘straddle’) comprised of a share or ADS and one or more other positions, and persons that own, directly or indirectly, 10% or more of the voting stock of HSBC Holdings. This discussion is based on laws, treaties, judicial decisions and regulatory interpretations in effect on the date hereof, all of which are subject to change.
Holders and prospective purchasers should consult their own advisers regarding the tax consequences of an investment in shares or ADSs in light of their particular circumstances, including the effect of any national, state or local laws.
Any US federal tax advice included in thisAnnual Report and Accounts is for informational purposes only; it was not intended or written to be used, and cannot be used, for the purpose of avoiding US federal tax penalties.
Taxation of dividends
Currently no tax is withheld from dividends paid by HSBC Holdings. A US holder must include cash dividends paid on the shares or ADSs in ordinary income on the date that such holder or the ADS depositary receives them, translating dividends paid in UK pounds sterling into US dollars using the exchange rate in effect on the date of receipt. A US holder that elects to receive shares in lieu of a cash dividend must include in ordinary income the fair market value of such shares on the dividend payment date, and the tax basis of those shares will equal such fair market value.
Subject to certain exceptions for positions that are held for less than 61 days or are hedged, and subject to a foreign corporation being considered a ‘qualified foreign corporation’ (which includes not being classified for US federal income tax purposes as a passive foreign investment company), certain dividends (‘qualified dividends’) received by an individual US holder generally will be subject to US taxation at maximum rates. Based on the company’s audited financial statements and relevant market and shareholder data, HSBC Holdings does not anticipate being classified as a passive foreign investment company. Accordingly, dividends paid on the shares or ADSs generally should be treated as qualified dividends.
Taxation of capital gains
Gains realised by a US holder on the sale or other disposition of shares or ADSs normally will not be subject to UK taxation unless at the time of the sale or other disposition the holder carries on a trade, profession or vocation in the UK through a branch or agency or permanent establishment and the shares or ADSs are or have been used, held or acquired for the purposes of such trade, profession, vocation, branch or agency or permanent establishment. Such gains will be included in income for US tax purposes, and will be long-term capital gains if the shares or ADSs were held for more than one year. A long-term capital gain realised by an individual holder generally will be subject to US tax at preferential rates.
523
Table of Contents
HSBC HOLDINGS PLC
Shareholder Information(continued)
Inheritance tax
Shares or ADSs held by an individual whose domicile is determined to be the US for the purposes of the United States-United Kingdom Double Taxation Convention relating to estate and gift taxes (the ‘Estate Tax Treaty’) and who is not for such purposes a national of the UK will not, provided any US federal estate or gift tax chargeable has been paid, be subject to UK inheritance tax on the individual’s death or on a lifetime transfer of shares or ADSs except in certain cases where the shares or ADSs (i) are comprised in a settlement (unless, at the time of the settlement, the settlor was domiciled in the US and was not a national of the UK), (ii) is part of the business property of a UK permanent establishment of an enterprise, or (iii) pertains to a UK fixed base of an individual used for the performance of independent personal services. In such cases, the Estate Tax Treaty generally provides a credit against US federal tax liability for the amount of any tax paid in the UK in a case where the shares or ADSs are subject to both UK inheritance tax and to US federal estate or gift tax.
Stamp duty and stamp duty reserve tax – ADSs
If shares are transferred to a clearance service or American Depositary Receipt (‘ADR’) issuer (which will include a transfer of shares to the Depositary) under the current HMRC practice UK stamp duty and/or stamp duty reserve tax will be payable. The stamp duty or stamp duty reserve tax is generally payable on the consideration for the transfer and is payable at the aggregate rate of 1.5%.
The amount of stamp duty reserve tax payable on such a transfer will be reduced by any stamp duty paid in connection with the same transfer.
No stamp duty will be payable on the transfer of, or agreement to transfer, an ADS, provided that the ADR and any separate instrument of transfer or written agreement to transfer remain at all times outside the UK, and provided further that any such transfer or written agreement to transfer is not executed in the UK. No stamp duty reserve tax will be payable on a transfer of, or agreement to transfer, an ADS effected by the transfer of an ADR.
US backup withholding tax and information reporting
Distributions made on shares or ADSs and proceeds from the sale of shares or ADSs that are paid within the US, or through certain financial intermediaries to US holders, are subject to information reporting and may be subject to a US ‘backup’ withholding tax unless, in general, the US holder complies with certain certification procedures or is a corporation or other person exempt from such withholding. Holders that are not US persons generally are not subject to information reporting or backup withholding tax, but may be required to comply with applicable certification procedures to establish that they are not US persons in order to avoid the application of such information reporting requirements or backup withholding tax to payments received within the US or through certain financial intermediaries.
524
Table of Contents
HSBC HOLDINGS PLC
Shareholder Information(continued)
Information about the enforceability of judgements made in the US
HSBC Holdings is a public limited company incorporated in England and Wales. Most of the Directors and executive officers live outside the US. As a result, it may not be possible to serve process on such persons or HSBC Holdings in the US or to enforce judgements obtained in US courts against them or HSBC Holdings based on civil liability provisions of the securities laws of the US. There is doubt as to whether English courts would enforce:
| • | civil liabilities under US securities laws in original actions; or |
| • | judgements of US courts based upon these civil liability provisions. |
In addition, awards of punitive damages in actions brought in the US or elsewhere may be unenforceable in the UK. The enforceability of any judgement in the UK will depend on the particular facts of the case as well as the laws and treaties in effect at the time.
Exchange controls and other limitations affecting equity security holders
Other than certain economic sanctions which may be in force from time to time, there are currently no UK laws, decrees or regulations which would prevent the import or export of capital or remittance of distributable profits by way of dividends and other payments to holders of HSBC Holdings’ equity securities who are not residents of the UK. There are also no restrictions under the laws of the UK or the terms of the Memorandum and Articles of Association concerning the right of non-resident or foreign owners to hold HSBC Holdings’ equity securities or, when entitled to vote, to do so.
Dividends on the ordinary shares of HSBC Holdings
HSBC Holdings has paid dividends on its ordinary shares every year without interruption since it became the HSBC Group holding company by a scheme of arrangement in 1991. The dividends declared, per ordinary share, in respect of each of the last five years were:
| First interim | Second interim | Third interim | Fourth interim1 | Total2 | ||||||||||||||||||
2012 | US$ | 0.090 | 0.090 | 0.090 | 0.180 | 0.450 | ||||||||||||||||
| £ | 0.058 | 0.056 | 0.056 | 0.111 | 0.281 | |||||||||||||||||
| HK$ | 0.698 | 0.698 | 0.698 | 1.395 | 3.489 | |||||||||||||||||
2011 | US$ | 0.090 | 0.090 | 0.090 | 0.140 | 0.410 | ||||||||||||||||
| £ | 0.056 | 0.058 | 0.058 | 0.090 | 0.262 | |||||||||||||||||
| HK$ | 0.701 | 0.702 | 0.699 | 1.088 | 3.190 | |||||||||||||||||
2010 | US$ | 0.080 | 0.080 | 0.080 | 0.120 | 0.360 | ||||||||||||||||
| £ | 0.053 | 0.051 | 0.051 | 0.077 | 0.232 | |||||||||||||||||
| HK$ | 0.622 | 0.621 | 0.622 | 0.933 | 2.798 | |||||||||||||||||
2009 | US$ | 0.080 | 0.080 | 0.080 | 0.100 | 0.340 | ||||||||||||||||
| £ | 0.048 | 0.050 | 0.048 | 0.062 | 0.208 | |||||||||||||||||
| HK$ | 0.620 | 0.620 | 0.620 | 0.775 | 2.635 | |||||||||||||||||
2008 | US$ | 0.180 | 0.180 | 0.180 | 0.100 | 0.640 | ||||||||||||||||
| £ | 0.090 | 0.100 | 0.124 | 0.069 | 0.383 | |||||||||||||||||
| HK$ | 1.403 | 1.398 | 1.395 | 0.775 | 4.971 | |||||||||||||||||
| 1 | The fourth interim dividend for 2012 of US$0.18 per share has been translated into pounds sterling and Hong Kong dollars at the closing rate on 31 December 2012. The dividend will be paid on 8 May 2013. |
| 2 | The above dividends declared are accounted for as disclosed in Note 10 on the Financial Statements. |
A holder of HSBC Holdings’ American Depositary Shares (‘ADS’s) may have to pay, either directly or indirectly (via the intermediary through whom their ADSs are held) fees to the Bank of New York Mellon as depositary. Fees may be paid or recovered
in several ways: by deduction from amounts distributed; by selling a portion of distributable property; by deduction from dividend distributions, by directly invoicing the holder, or by charging the intermediaries who act for them. The fees for which the holders of the HSBC ADSs will be responsible include:
524a
Table of Contents
HSBC HOLDINGS PLC
Shareholder Information(continued)
| For: | HSBC ADS holders must pay: | |
Each issuance of HSBC ADSs, including as a result of a distribution of shares (including through a stock dividend, stock split or distribution of rights or other property)
| US$5.00 (or less) per 100 HSBC ADSs or portion thereof | |
Each cancellation of HSBC ADSs, including if the deposit agreement terminates
|
US$5.00 (or less) per 100 HSBC ADSs or portion thereof | |
Transfer and registration of shares on our share register to/from the holder’s name to/from the name of The Bank of New York Mellon or its agent when the holder deposits or withdraws shares
|
Registration or transfer fees (of which there currently are none) | |
Conversion of non-US currency to US dollars |
Charges and expenses incurred by The Bank of New York Mellon with respect to the conversion
| |
Each cash distribution to HSBC ADS holders
|
US$0.02 or less per ADS
| |
Transfers of HSBC ordinary shares to the depositary in exchange for HSBC ADSs
|
Any applicable taxes and/or other governmental charges
| |
Each issuance of HSBC ADSs, including as a result of a distribution of shares (including through a stock dividend, stock split or distribution of rights or other property)
|
US$5.00 (or less) per 100 HSBC ADSs or portion thereof | |
Distribution of securities by the Depository to HSBC ADS holders |
A fee equivalent to the fee that would be payable if securities distributed to you had been shares and those shares had been deposited for issuance of ADSs
| |
Any other charges incurred by the depositary or its agents for servicing shares or other securities deposited
|
As applicable | |
The depositary may generally refuse to provide fee-attracting services until its fees for those services are paid.
The depositary has agreed to reimburse us for expenses we incur, and to pay certain out-of-pocket expenses and waive certain fees, in connection with the administration, servicing and maintenance of our ADS programme. There are limits on the amount of
expenses for which the depositary will reimburse us. The amount of reimbursement available is not tied to the amount of fees the depositary collects from holders of ADSs. During the year ended 31 December 2012, the depositary reimbursed, paid and/or waived fees and expenses totalling US$679,802 in connection with the administration, servicing and maintenance of the programme, as detailed below:
| Category of expense/fees | 2012 US$ | |||
Stock exchange listing fees | 207,633 | |||
Fulfilment costs | 219,446 | |||
– shareholder meeting costs (printing and distribution of materials and vote tabulation) | 31,598 | |||
– beneficial holder searches | 187,848 | |||
Fees and expenses paid and/or waived including: account servicing fees, postage and envelopes for mailing annual and interim financial reports, dividend warrants, electronic filing of US Federal tax information, mailing required tax forms, stationery, postage, facsimile and telephone calls | 252,723 | |||
Total | 679,802 | |||
HSBC Holdings ordinary shares are listed or admitted to trading on the London Stock Exchange, the Hong Kong Stock Exchange (‘HKSE’), Euronext Paris, the Bermuda Stock Exchange, and the New York Stock Exchange (‘NYSE’) in the form of ADSs. HSBC Holdings maintains its principal share register in England and overseas branch share registers in Hong Kong and Bermuda (collectively, the ‘share register’).
As at 31 December 2012, there were a total of 219,558 holders of record of HSBC Holdings ordinary shares on the share register.
As at 31 December 2012, a total of 20,499,189 of the HSBC Holdings ordinary shares were registered in the HSBC Holdings’ share register in the name of 14,326 holders of record with addresses in the US. These shares represented 0.11% of the total HSBC Holdings ordinary shares in issue.
As at 31 December 2012, there were 8,601 holders of record of ADSs holding approximately
524b
Table of Contents
HSBC HOLDINGS PLC
Shareholder Information(continued)
147.7m ADSs, representing approximately 738.5m HSBC Holdings ordinary shares. 7,890 of these holders had addresses in the US, holding approximately 147.6m ADSs, representing 738m HSBC Holdings ordinary shares. As at 31 December 2012, approximately 4% of the HSBC Holdings ordinary shares were represented by ADSs held by holders of record with addresses in the US.
The following table shows, for the years, calendar quarters and months indicated, the highest
and lowest prices for the HSBC Holdings ordinary shares and ADSs. These are based on mid-market prices at close of business on the London Stock Exchange, HKSE, Euronext Paris, NYSE and the Bermuda Stock Exchange, as adjusted for the 5-for-12 rights issue completed in April 2009.
Past share price performance should not be regarded as a guide to future performance.
High and low mid-market closing prices
| London | Hong Kong | New York | Paris | Bermuda | ||||||||||||||||||||||||||||||||||||
| US$0.50 shares | US$0.50 shares | ADSs1 | US$0.50 shares | US$0.50 shares | ||||||||||||||||||||||||||||||||||||
| High | Low | High | Low | High | Low | High | Low | High | Low | |||||||||||||||||||||||||||||||
| pence | pence | HK$ | HK$ | US$ | US$ | euro | euro | US$ | US$ | |||||||||||||||||||||||||||||||
2012 | 655 | 491 | 82.0 | 59.5 | 53.1 | 38.3 | 8.0 | 5.8 | 10.5 | 7.6 | ||||||||||||||||||||||||||||||
2011 | 731 | 464 | 91.8 | 56.1 | 59.0 | 35.8 | 8.7 | 5.4 | 11.8 | 7.0 | ||||||||||||||||||||||||||||||
2010 | 740 | 596 | 92.4 | 69.6 | 59.3 | 44.4 | 8.3 | 7.2 | 11.6 | 8.8 | ||||||||||||||||||||||||||||||
2009 | 761 | 304 | 98.0 | 30.6 | 64.0 | 22.0 | 8.6 | 3.3 | 12.5 | 4.7 | ||||||||||||||||||||||||||||||
2008 | 809 | 534 | 125.4 | 67.4 | 79.5 | 41.3 | 10.3 | 5.5 | 15.9 | 8.0 | ||||||||||||||||||||||||||||||
2012 | ||||||||||||||||||||||||||||||||||||||||
4th Quarter | 655 | 581 | 82.0 | 72.6 | 53.1 | 47.0 | 8.0 | 7.3 | 10.5 | 9.4 | ||||||||||||||||||||||||||||||
3rd Quarter | 588 | 511 | 74.1 | 62.1 | 47.7 | 39.7 | 7.4 | 6.5 | 9.4 | 8.3 | ||||||||||||||||||||||||||||||
2nd Quarter | 573 | 503 | 71.6 | 60.2 | 46.0 | 38.7 | 7.1 | 6.2 | 9.2 | 8.1 | ||||||||||||||||||||||||||||||
1st Quarter | 582 | 491 | 71.7 | 59.5 | 45.9 | 38.3 | 7.0 | 5.8 | 9.3 | 7.6 | ||||||||||||||||||||||||||||||
2011 | ||||||||||||||||||||||||||||||||||||||||
4th Quarter | 565 | 464 | 70.1 | 56.1 | 45.4 | 35.8 | 6.4 | 5.4 | 8.6 | 7.0 | ||||||||||||||||||||||||||||||
3rd Quarter | 629 | 486 | 78.3 | 59.5 | 50.5 | 37.6 | 7.0 | 5.6 | 10.0 | 7.9 | ||||||||||||||||||||||||||||||
2nd Quarter | 667 | 601 | 85.2 | 75.2 | 54.7 | 48.2 | 7.6 | 6.8 | 11.0 | 9.6 | ||||||||||||||||||||||||||||||
1st Quarter | 731 | 623 | 91.8 | 79.0 | 59.0 | 50.0 | 8.7 | 7.2 | 11.8 | 9.7 | ||||||||||||||||||||||||||||||
2013 | ||||||||||||||||||||||||||||||||||||||||
January | 724 | 647 | 88.3 | 81.3 | 57.1 | 53.1 | 8.5 | 7.9 | 11.4 | 10.5 | ||||||||||||||||||||||||||||||
2012 | ||||||||||||||||||||||||||||||||||||||||
December | 655 | 636 | 82.0 | 78.3 | 53.1 | 51.0 | 8.0 | 7.7 | 10.5 | 10.1 | ||||||||||||||||||||||||||||||
November | 638 | 596 | 78.8 | 73.7 | 51.1 | 47.5 | 7.9 | 7.4 | 10.1 | 9.7 | ||||||||||||||||||||||||||||||
October | 618 | 581 | 76.6 | 72.6 | 49.8 | 47.0 | 7.7 | 7.3 | 9.8 | 9.4 | ||||||||||||||||||||||||||||||
September | 588 | 541 | 74.1 | 66.2 | 47.7 | 43.1 | 7.4 | 6.8 | 9.4 | 8.5 | ||||||||||||||||||||||||||||||
August | 570 | 539 | 69.5 | 65.6 | 44.8 | 41.9 | 7.3 | 6.8 | 8.9 | 8.3 | ||||||||||||||||||||||||||||||
July | 570 | 511 | 69.5 | 62.1 | 44.9 | 39.7 | 7.2 | 6.5 | 8.9 | 8.5 | ||||||||||||||||||||||||||||||
| 1 | In New York each ADS represents five underlying ordinary shares. |
Memorandum and Articles of Association
The disclosure under the caption ‘Memorandum and Articles of Association’ contained on Form 20-F for the years ended 31 December 2000 and 2001 is incorporated by reference herein, together with the disclosure below.
Directors’ interests
Subject to the provisions of the Companies Act 2006 and provided that the Articles are complied with, a Director, notwithstanding his office:
| • | may enter into or otherwise be interested in any contract, arrangement, transaction or proposal |
with HSBC Holdings or in which HSBC Holdings is otherwise interested; |
| • | may hold any other office or place of profit under HSBC Holdings (except that of auditor or auditor of a subsidiary of HSBC Holdings) in conjunction with the office of Director and may act by himself or through his firm in a professional capacity for HSBC Holdings, and in any such case on such terms as to remuneration and otherwise as the Board may arrange; |
| • | may be a director or other officer, or employed by, or a party to any transaction or arrangement with or otherwise interested in, any company promoted by HSBC Holdings or in which HSBC Holdings is otherwise interested or as regards which HSBC Holdings has any powers of appointment; and |
524c
Table of Contents
HSBC HOLDINGS PLC
Shareholder Information(continued)
| • | shall not be liable to account to HSBC Holdings for any profit, remuneration or other benefit realised by any such office, employment, contract, arrangement, transaction or proposal or from any interest in any body corporate and no such contract, arrangement, transaction, proposal or interest shall be avoided on the grounds of any such interest or benefit nor shall the receipt of any such profit, remuneration or any other benefit constitute a breach of his or her duty under the Companies Act 2006 not to accept benefits from third parties. |
Since 1 October 2008, the Board may authorise any matter proposed to it which would, if not so authorised, involve a breach by a Director of his or her duty to avoid conflicts of interest under the Companies Act 2006, including, without limitation, any matter which relates to a situation in which a Director has, or can have, an interest which conflicts, or possibly may conflict, with the interest of HSBC Holdings (including the exploitation of any property, information or opportunity, whether or not HSBC Holdings could take advantage of it, but excluding any situation which cannot reasonably be regarded as likely to give rise to a conflict of interest). Any such authorisation will be effective only if:
| • | any requirement as to quorum at the meeting at which the matter is considered is met without counting the Director in question or any other interested Director; and |
| • | the matter was agreed to without their voting or would have been agreed to if their votes had not been counted. |
The Board may (whether at the time of the giving of the authorisation or subsequently) make any such authorisation subject to any limits or conditions it expressly imposes but such authorisation is otherwise given to the fullest extent permitted. The Board may vary or terminate any such authorisation at any time.
A Director shall be under no duty to HSBC Holdings with respect to any information which he obtains or has obtained otherwise than as a Director of HSBC Holdings and in respect of which he has a duty of confidentiality to another person.
Retirement
There is no mandatory retirement age for Directors of HSBC Holdings.
History and development of HSBC
| 1865 | The founding member of the HSBC Group, The Hongkong and Shanghai Banking Corporation, is established in both Hong Kong and Shanghai. | |
| 1959 | The Mercantile Bank of India Limited and The British Bank of the Middle East, now HSBC Bank Middle East Limited, are purchased. | |
| 1965 | We acquire a 51% interest (subsequently increased to 62.14%) in Hang Seng Bank Limited. Hang Seng Bank is the fourth-largest listed bank in Hong Kong by market capitalisation. | |
| 1980 | We acquire a 51% interest in Marine Midland Banks, Inc., now HSBC USA, Inc, (with the remaining interest acquired in 1987). | |
| 1981 | The Hongkong and Shanghai Banking Corporation incorporates its then existing Canadian operations. HSBC Bank Canada subsequently makes numerous acquisitions, expanding rapidly to become the largest foreign-owned bank in Canada. | |
| 1987 | We purchase a 14.9% interest in Midland Bank plc, now HSBC Bank plc, one of the UK’s principal clearing banks. | |
| 1991 | HSBC Holdings plc is established as the parent company of the HSBC Group. | |
| 1992 | We purchase the remaining interest in Midland Bank plc. | |
| 1993 | As a consequence of the Midland acquisition, our Head Office is transferred from Hong Kong to London in January. | |
| 1997 | We assume selected assets, liabilities and subsidiaries of Banco Bamerindus do Brasil S.A., now HSBC Bank Brazil, following the intervention of the Central Bank of Brazil, and in Argentina completes the acquisition of Grupo Roberts, now part of HSBC Bank Argentina S.A. | |
| 1999 | We acquire Republic New York Corporation, subsequently merged with HSBC USA, Inc., and Safra Republic Holdings S.A. | |
| 2000 | We complete our acquisition of 99.99% of the issued share capital of Crédit Commercial de France S.A., now HSBC France. | |
| 2002 | We acquire 99.59% of Grupo Financiero Bital, S.A. de C.V., the holding company of what is now HSBC Mexico. | |
| 2003 | We acquire Household International, Inc., now HSBC Finance Corporation. | |
| 2003 | We acquire Banco Lloyds TSB S.A.–Banco Múltiplo in Brazil and the country’s leading consumer finance company, Losango Promotora de Vendas Limitada. | |
| 2004 | HSBC Bank USA, Inc. merges with HSBC Bank & Trust (Delaware) N.A. to form HSBC Bank USA, N.A. | |
| 2004 | We complete the acquisition of The Bank of Bermuda Limited. | |
| 2004 | We acquire Marks and Spencer Retail Financial Services Holdings Limited, which trades as Marks and Spencer Money (‘M&S Money’) in the UK. | |
| 2004 | We acquire 19.9% of Bank of Communications, and Hang Seng Bank acquires 15.98% of Industrial Bank. | |
524d
Table of Contents
HSBC HOLDINGS PLC
Shareholder Information(continued)
| 2005 | We increase our holding in Ping An to 19.9%, having made our initial investment in 2002. Ping An is the second-largest life insurer and the third-largest property and casualty insurer in mainland China. | |
| 2005 | HSBC Finance completes the acquisition of Metris Companies Inc., making HSBC the fifth-largest issuer of MasterCard and Visa cards in the USA. | |
| 2006 | We acquire Grupo Banistmo S.A. (‘Banistmo’), the leading banking group in Central America, through a tender offer to acquire 99.98% of the outstanding shares of Banistmo. | |
| 2007 | Our three associates in mainland China, Industrial Bank, Ping An and Bank of Communications, issue new shares. We do not subscribe and, as a result, our interests in the associates’ equity decrease. | |
| 2008 | We acquire the assets, liabilities and operations of The Chinese Bank in Taiwan. | |
| 2008 | We complete the sale of our seven French regional banks. | |
| 2009 | We complete the acquisition of 88.89% of PT Bank Ekonomi Raharja Tbk in Indonesia. | |
| 2012 | In May, we complete the sale of our US Card and Retail Services business, together with certain real estate and other assets and liabilities. | |
| 2012 | In May, we complete the sale of 138 retail branches in upstate New York. The disposal of a further 57 branches is completed in August. | |
| 2012 | In December, we complete the sale we announced in January of our businesses in Costa Rica, El Salvador and Honduras to the Columbian banking group, Banco Davivienda, for US$801m. | |
| 2012 | In December, we announce the disposal of our shares in Ping An to Charoen Pokphand Group Company for approximately US$9,385m in cash. | |
| 2012 | In December, we announce an agreement to sell our 18% shareholding in Bao Viet Holdings to Sumitomo Life Insurance Company for US$340m in cash. | |
| 2013 | In February, we announce an agreement to sell HSBC Bank (Panama) S.A. to Bancolombia S.A. for US$2.1bn in cash. | |
Differences in HSBC Holdings/New York Stock Exchange corporate governance practices
Under the NYSE’s corporate governance rules for listed companies and the applicable rules of the SEC, as a NYSE-listed foreign private issuer, HSBC Holdings must disclose any significant ways in which its corporate governance practices differ from those followed by US companies subject to NYSE listing standards. HSBC Holdings believes the following to be the significant differences between its corporate governance practices and NYSE corporate governance rules applicable to US companies.
US companies listed on the NYSE are required to adopt and disclose corporate governance guidelines. The Listing Rules of the FSA require each listed company incorporated in the UK to
include in itsAnnual Report and Accounts a statement of how it has applied the principles of The UK Corporate Governance Code and a statement as to whether or not it has complied with the code provisions of The UK Corporate Governance Code throughout the accounting period covered by theAnnual Report and Accounts. A company that has not complied with the Code provisions, or complied with only some of the Code provisions or (in the case of provisions whose requirements are of a continuing nature) complied for only part of an accounting period covered by the report, must specify the Code provisions with which it has not complied, and (where relevant) for what part of the reporting period such non-compliance continued, and give reasons for any non-compliance. As stated above, HSBC Holdings complied throughout 2012 with the applicable code provisions of The UK Corporate Governance Code. The UK Corporate Governance Code does not require HSBC Holdings to disclose the full range of corporate governance guidelines with which it complies.
Under NYSE standards, companies are required to have a nominating/corporate governance committee composed entirely of directors determined to be independent in accordance with the NYSE’s corporate governance rules. All of the members of the Nomination Committee during 2012 were independent non-executive Directors, as determined in accordance with the UK Corporate Governance Code. The terms of reference of our Nomination Committee, which comply with the UK Corporate Governance Code, require a majority of members to be independent. In addition to identifying individuals qualified to become Board members, a nominating/ corporate governance committee must develop and recommend to the Board a set of corporate governance principles. The Nomination Committee’s terms of reference do not require it to develop and recommend corporate governance principles for HSBC Holdings. As stated above, HSBC Holdings is subject to the corporate governance principles of The UK Corporate Governance Code. The Board of Directors is responsible under its terms of reference for the development and review of Group policies and practices on corporate governance.
Under the NYSE standards, companies are required to have a compensation committee composed entirely of directors determined to be independent in accordance with the NYSE’s corporate governance rules. All of the members of the Group Remuneration Committee during 2012 were independent non-executive Directors, as determined in accordance with the UK Corporate Governance Code. The terms of reference of our
524e
Table of Contents
HSBC HOLDINGS PLC
Shareholder Information(continued)
Group Remuneration Committee, which comply with the UK Corporate Governance Code, require at least three members to be independent. A compensation committee must review and approve corporate goals and objectives relevant to chief executive officer compensation and evaluate a chief executive officer’s performance in light of these goals and objectives. The Group Remuneration Committee’s terms of reference require it to review and approve performance-based remuneration of the Directors by reference to corporate goals and objectives which are set by the Board of Directors.
Pursuant to NYSE listing standards, non-management directors must meet on a regular basis without management present and independent directors must meet separately at least once per year.
During 2012, the non-executive Directors and the Group Chairman met twice without the other executive Directors. The non-executive Directors also met twice without the Group Chairman, including to appraise the Group Chairman’s performance. HSBC Holdings’ practice, in this regard, complies with The UK Corporate Governance Code.
In accordance with the requirements of the UK Corporate Governance Code, HSBC Holdings discloses in its annual report how the Board, its committees and the Directors are evaluated (on page 355) and provides extensive information regarding Directors’ compensation in the Directors’ Remuneration Report (on pages 347 to 367). The terms of reference of HSBC Holdings’ Audit, Nomination, Remuneration and Risk Committees are available at www.hsbc.com/boardcommittees.
NYSE listing standards require US companies to adopt a code of business conduct and ethics for directors, officers and employees, and promptly disclose any waivers of the code for directors or executive officers. In 2009, the Board endorsed three HSBC Values statements underpinned by the continued use of our Business Principles, in replacement of the Group Business Principles and Values. In addition to the HSBC Values statements and Business Principles (and previously the Group Business Principles and Values), which apply to the employees of all our companies, pursuant to the requirements of the Sarbanes-Oxley Act the Board of HSBC Holdings has adopted a Code of Ethics applicable to the Group Chairman and the Group Chief Executive, as the principal executive officers, and to the Group Finance Director and Group Chief Accounting Officer. HSBC Holdings’ Code of Ethics is available on www.hsbc.com/codeofethics or from the Group Company Secretary at 8 Canada Square,
London E14 5HQ. If the Board amends or waives the provisions of the Code of Ethics, details of the amendment or waiver will appear at the same website address. During 2012, HSBC Holdings made no amendments to its Code of Ethics and granted no waivers from its provisions. The references to the standards to be followed by all employees reflect the Board’s endorsement of HSBC Values statements underpinned by the continued use of our Business Principles. The HSBC Values statements and Business Principles are available on www.hsbc.com/groupvalues.
Under NYSE listing rules applicable to US companies, independent directors must comprise a majority of the board of directors. Currently, more than three-quarters of HSBC Holdings’ Directors are independent.
Under The UK Corporate Governance Code the HSBC Holdings Board determines whether a Director is independent in character and judgement and whether there are relationships or circumstances which are likely to affect, or could appear to affect, the Director’s judgement. Under the NYSE rules a director cannot qualify as independent unless the board affirmatively determines that the director has no material relationship with the listed company; in addition the NYSE rules prescribe a list of circumstances in which a director cannot be independent. The UK Corporate Governance Code requires a company’s board to assess director independence by affirmatively concluding that the director is independent of management and free from any business or other relationship that could materially interfere with the exercise of independent judgement. Lastly, a chief executive officer of a US company listed on the NYSE must annually certify that he or she is not aware of any violation by the company of NYSE corporate governance standards. In accordance with NYSE listing rules applicable to foreign private issuers, HSBC Holdings’ Group Chief Executive is not required to provide the NYSE with this annual compliance certification. However, in accordance with rules applicable to both US companies and foreign private issuers, the Group Chief Executive is required promptly to notify the NYSE in writing after any executive officer becomes aware of any material non-compliance with the NYSE corporate governance standards applicable to HSBC Holdings.
HSBC Holdings is required to submit annual and interim written affirmations of compliance with applicable NYSE corporate governance standards, similar to the affirmations required of NYSE-listed US companies.
524f
Table of Contents
| 2012 HSBC 20-F Reconciliation Table | ||||
| Form 20-F Item Number and Caption | Location | Page | ||
PART I | ||||
| 1. Identity of Directors, Senior Management and Advisers | Not required for Annual Report | — | ||
| 2. Offer Statistics and Expected Timetable | Not required for Annual Report | — | ||
| 3. Key Information | ||||
| A. Selected Financial Data | Consolidated income statement, Consolidated balance sheet, Shareholder information | 29, 45, 516 | ||
| B. Capitalisation and Indebtedness | Not required for Annual Report | — | ||
| C. Reasons for the Offer and use of Proceeds | Not required for Annual Report | — | ||
| D. Risk Factors | Overview | 20-21l | ||
| 4. Information on the Company | ||||
| A. History and Development of the Company | Overview | 13-19 | ||
| Operating and Financial Review | 25-122h | |||
| Shareholder Information | 516-7, 524d-e | |||
| Shareholder Information | 542 | |||
| B. Business Overview | Overview | 13-19 | ||
| Operating and Financial Review: Regulation and Supervision | 122i -s | |||
| Operating and Financial Review | 25-122h | |||
| C. Organisational Structure | Note 25 – Notes on the Financial Statements | 469 | ||
| Overview | 15-16 | |||
| Organisational Structure Chart | 521 | |||
| D. Property, Plants and Equipment | Property | 118 | ||
| Note 24 – Notes on the Financial Statement | 467-468 | |||
| 4 A. Unresolved Staff Comments | Not Applicable | — | ||
| 5. Operating and Financial Review and Prospects | ||||
| A. Operating Results | Operating and Financial Review | 25-122h | ||
| B. Liquidity and Capital Resources | Operating and Financial Review: Liquidity and funding | 203-216 | ||
| Operating and Financial Review: Risk management of insurance operations | 242-243 | |||
| Operating and Financial Review: Appendix to Risk | 261-265 | |||
| C. Research and Development, Patents and Licences, etc. | Not applicable | — | ||
| D. Trend Information | Overview | 17-19 | ||
| Operating and Financial Review | 25-122h | |||
| E. Off-Balance Sheet Arrangements | Note 34 – Notes on the Financial Statements | 485-492 | ||
| Note 40 – Notes on the Financial Statements | 500-501 | |||
| Note 42 – Special Purpose Entities | 502-506 | |||
| F. Tabular disclosure of Contractual Obligations | Operating and Financial Review | 49k | ||
| 6. Directors, Senior Management and Employees | ||||
| A. Directors and Senior Management | Report of the Directors: Corporate Governance | 302-309 | ||
| B. Compensation | Directors’ Remuneration Report | 351-367 | ||
| C. Board Practices | Report of the Directors : Corporate Governance | 301-307, 309, 319-323, 329 | ||
| Directors’ Remuneration Report | 349-350, 359 | |||
525
Table of Contents
| 2012 HSBC 20-F Reconciliation Table | ||||
| Form 20-F Item Number and Caption | Location | Page | ||
| D. Employees | Report of the Directors: Corporate Governance | 335 | ||
| E. Share Ownership | Report of the Directors: Corporate Governance | 336-338, 343-344 | ||
| Directors’ Remuneration Report | 351-360, 363 -365, 411- 413, 496 -498 | |||
| 7. Major Shareholders and Related Party Transactions | ||||
| A. Major Shareholders | Corporate Governance | 345-346 | ||
| B. Related Party Transactions | Note 44 - Notes on the Financial Statements | 512-515 | ||
| C. Interests of Experts and Counsel | Not required for Annual Report | — | ||
| 8. Financial Information | ||||
| A. Consolidated Statements and Other Financial Information | Financial Statements | 369-515 | ||
| Shareholder Information | 516 | |||
| B. Significant Changes | Not Applicable | — | ||
| 9. The Offer and Listing | ||||
| A. Offer and Listing Details | Shareholder Information | 524b-524c | ||
| B. Plan of Distribution | Not required for Annual Report | — | ||
| C. Markets | Shareholder Information | 524b-524c | ||
| D. Selling Shareholders | Not required for Annual Report | |||
| E. Dilution | Not required for Annual Report | |||
| F. Expenses of the Issue | Not required for Annual Report | |||
| 10. Additional Information | ||||
| A. Share Capital | Not required for Annual Report | |||
| B. Memorandum and Articles of Association | Shareholder Information | 524c-524d | ||
| C. Material Contracts | Note 43 to the Financial Statements | 510-511 | ||
| D. Exchange Controls | Shareholder Information | 524a | ||
| E. Taxation | Shareholder Information | 522-524 | ||
| F. Dividends and Paying Agents | Not required for Annual Report | — | ||
| G. Statements by Experts | Not required for Annual Report | — | ||
| H. Documents on Display | Shareholder Information | 520 | ||
| I. Subsidiary Information | Not Applicable | — | ||
| 11. Quantitative and Qualitative Disclosures About Market Risk | Management of Risk | 217-226, | ||
| Note 19 and 25 – Notes on the Financial Statements | 452-456, 493 | |||
| 12. Description of Securities Other than Equity Securities | ||||
| A. Debt Securities | Not required for Annual Report | — | ||
| B. Warrants and Rights | Not required for Annual Report | — | ||
| C. Other Securities | Not required for Annual Report | — | ||
| D. American Depositary Shares | Shareholder Information | 524a-b | ||
| PART II | ||||
| 13. Defaults, Dividends Arrearages and Delinquencies | Not Applicable | — | ||
| 14. Material Modifications to the Rights of Securities Holders and Use of Proceeds | Not Applicable | — | ||
| 15. Controls and Procedures | Report of Independent Registered Public Accounting Firm to the Board of Directors and Shareholders of HSBC Holdings plc | 369 | ||
526
Table of Contents
| 2012 HSBC 20-F Reconciliation Table | ||||
| Form 20-F Item Number and Caption | Location | Page | ||
Operating and Financial Review: Disclosure controls, Management’s assessment of internal controls over financial reporting | 119a | |||
| 16. [Reserved] | ||||
| 16A. Audit Committee Financial Expert | Report of the Directors: Corporate Governance | 319 | ||
| 16B. Code of Ethics | Report of the Directors: Corporate Governance | 524f | ||
| 16C. Principal Accountant Fees and Services | Report of the Directors: Corporate Governance | 322-323 | ||
| Note 8 – Notes on the Financial Statements | 419-420 | |||
| 16D. Exemptions from the Listing Standards for Audit Committees | Not Applicable | — | ||
| 16E. Purchases of Equity Securities by the Issuer and Affiliated Purchasers | Report of the Directors | 346 | ||
| 16F. Change in Registrant’s Certifying Accountant | Not Applicable | — | ||
| 16G. Corporate Governance | Shareholder Information | 524e-f | ||
| 16H. Mine Safety Disclosure | Not Applicable | — | ||
| PART III | ||||
| 17. Financial Statements | Not Applicable | — | ||
| 18. Financial Statements | Financial Statements | 369-515 | ||
| 19. Exhibits (including Certifications) | * | * | ||
527
Table of Contents
HSBC HOLDINGS PLC
Shareholder Information(continued)
Glossary of accounting terms and US equivalents
| Accounting term | US equivalent or brief description | |
Accounts | Financial Statements | |
Articles of Association | Articles of incorporation | |
Called up share capital | Shares issued and fully paid | |
Creditors | Payables | |
Debtors | Receivables | |
Deferred tax | Deferred income tax | |
Finance lease | Capital lease | |
Freehold | Ownership with absolute rights in perpetuity | |
Interests in associates and joint ventures | Interests in entities over which we have significant influence or joint control, which are accounted for using the equity method. | |
Loans and advances | Loans | |
Loan capital | Long-term debt | |
Nominal value | Par value | |
One-off | Non-recurring | |
Ordinary shares | Common stock | |
Overdraft | A line of credit, contractually repayable on demand unless a fixed-term has been agreed, established through a customer’s current account | |
Preference shares | Preferred stock | |
Premises | Property | |
Provisions | Liabilities of uncertain timing or amount | |
Share premium account | Additional paid-in capital | |
Shares in issue | Shares outstanding | |
Write-offs | Charge-offs | |
528
Table of Contents
HSBC HOLDINGS PLC
Shareholder Information(continued)
| Abbreviation | Brief description | |
| A | ||
| A$ | Australian dollar | |
| ABS1 | Asset-backed security | |
| ADR | American Depositary Receipt | |
| ADS | American Depositary Share | |
| ALCM | Asset and Liability Capital Management | |
| ALCO | Asset and Liability Management Committee | |
| AML | Anti-money laundering | |
| ARM1 | Adjustable-rate mortgage | |
| ARS | Argentinian peso | |
| B | ||
| Basel Committee | Basel Committee on Banking Supervision | |
| Basel I | 1988 Basel Capital Accord | |
| Basel II1 | 2006 Basel Capital Accord | |
| Basel III1 | Basel Committee’s reforms to strengthen global capital and liquidity rules | |
| BMD | Bermudan dollar | |
| BoCom | Bank of Communications Co., Limited, mainland China’s fourth largest bank by market capitalisation | |
| Bps1 | Basis points. One basis point is equal to one hundredth of a percentage point | |
| BRL | Brazilian real | |
| BSA | Bank Secrecy Act, US | |
| BSM | Balance Sheet Management | |
| C | ||
| C$ | Canadian dollar | |
| CCP1 | Central counterparty | |
| CCR1 | Counterparty credit risk | |
| CD | Certificate of deposit | |
| CDO1 | Collateralised debt obligation | |
| CDS1 | Credit default swap | |
| CDPC | Credit derivative product company | |
| CET11 | Common equity tier 1 ratio | |
| CGU | Cash-generating unit | |
| CHF | Swiss franc | |
| CMB | Commercial Banking, a global business | |
| CML1 | Consumer and Mortgage Lending portfolio in the US, comprising Consumer Lending and Mortgage Services businesses | |
| CNY | Chinese yuan | |
| CP1 | Commercial paper | |
| CPI | Consumer price index | |
| CRD1 | Capital Requirements Directive | |
| CRR1 | Customer risk rating | |
| CVA1 | Credit valuation adjustment | |
| D | ||
| Dodd-Frank | The Dodd-Frank Wall Street Reform & Consumer Protection Act, US | |
| DoJ | Department of Justice, US | |
| DPA | The Deferred Prosecution Agreement with DoJ and, if the context so requires, the Deferred Prosecution Agreement with the New York County District Attorney’s Office, in each case entered into in December 2012 | |
| DPF | Discretionary participation feature of insurance and investment contracts | |
| DVA1 | Debit valuation adjustment | |
| E | ||
| EAD1 | Exposure at default | |
| EBA | European Banking Authority | |
| ECB | European Central Bank | |
| EDTF | Enhanced Disclosure Task Force | |
| EGP | Egyptian pound | |
| EL1 | Expected loss | |
| EU | European Union | |
| Euribor | European Interbank Offered Rates | |
| F | ||
| Fannie Mae | Federal National Mortgage Association, US | |
| FCA | Financial Conduct Authority, UK | |
| FHFA | Federal Housing Finance Agency | |
| first direct | first direct is a division of HSBC Bank plc | |
| FPC | Financial Policy Committee, UK | |
| Freddie Mac | Federal Home Loan Mortgage Corporation, US | |
529
Table of Contents
HSBC HOLDINGS PLC
Shareholder Information(continued)
| Abbreviation | Brief description | |
| FSA | Financial Services Authority, UK | |
| FSMA | Financial Services and Markets Act 2000, UK | |
| FTE | Full time equivalent staff | |
| FTSE | Financial Times – Stock Exchange index | |
| G | ||
| G20 | Leaders, Finance Ministers and Central Bank Governors of the Group of Twenty | |
| GAC | Group Audit Committee | |
| GB&M | Global Banking and Markets, a global business | |
| GDP | Gross domestic product | |
| GENPRU | The FSA’s General Prudential Sourcebook of rules and guidance | |
| Ginnie Mae | Government National Mortgage Association, US | |
| Global Markets | HSBC’s treasury and capital markets services in GB&M | |
| GMB | Group Management Board | |
| GPB | Global Private Banking, a global business | |
| GPSP | Group Performance Share Plan | |
| GRC | Group Risk Committee | |
| Group | HSBC Holdings together with its subsidiary undertakings | |
| G-SIB1 | Global Systemically Important Bank | |
| H | ||
| Hang Seng Bank | Hang Seng Bank Limited, one of Hong Kong’s largest banks | |
| HK$ | Hong Kong dollar | |
| HNAH | HSBC North America Holdings Inc. | |
| Hong Kong | The Hong Kong Special Administrative Region of the People’s Republic of China | |
| HSBC | HSBC Holdings together with its subsidiary undertakings | |
| HSBC Afore | HSBC Afore S.A. de C.V. | |
| HSBC Bank | HSBC Bank plc, formerly Midland Bank plc | |
| HSBC Bank Argentina | HSBC Bank Argentina S.A. | |
| HSBC Bank Bermuda | HSBC Bank Bermuda Limited formerly The Bank of Bermuda Limited | |
| HSBC Bank Malaysia | HSBC Bank Malaysia Berhad | |
| HSBC Bank Middle East | HSBC Bank Middle East Limited, formerly The British Bank of the Middle East | |
| HSBC Bank USA | HSBC’s retail bank in the US, HSBC Bank USA, N.A. (formerly HSBC Bank USA, Inc.) | |
| HSBC Canada | The sub-group, HSBC Bank Canada, HSBC Trust Company Canada, HSBC Mortgage Corporation Canada, HSBC Securities Canada and HSBC Financial Co. Canada, consolidated for liquidity purposes | |
| HSBC Finance | HSBC Finance Corporation, the US consumer finance company (formerly Household International, Inc.) | |
| HSBC France | HSBC’s French banking subsidiary, formerly CCF S.A. | |
| HSBC Holdings | HSBC Holdings plc, the parent company of HSBC | |
| HSBC Mexico | HSBC México S.A., the commercial banking subsidiary of Grupo Financiero HSBC, S.A. de C.V. | |
| HSBC Premier | HSBC’s premium global banking service | |
| HSBC Private Bank (Suisse) | HSBC Private Bank (Suisse) SA, HSBC’s private bank in Switzerland | |
| HSBC USA | The sub-group, HSBC USA Inc (the holding company of HSBC Bank USA) and HSBC Bank USA, consolidated for liquidity purposes | |
| HTCD | HSBC Trust Company (Delaware), N.A. | |
| I | ||
| IAS | International Accounting Standard | |
| IASB | International Accounting Standards Board | |
| ICB | Independent Commission on Banking, UK | |
| IFRIC | International Financial Reporting Interpretations Committee | |
| IFRSs | International Financial Reporting Standards | |
| IMM1 | Internal model method | |
| Industrial Bank | Industrial Bank Co. Limited, a national joint-stock bank in mainland China in which Hang Seng Bank has a shareholding | |
| INR | Indian rupee | |
| IRB1 | Internal ratings-based | |
| ISDA | International Swaps and Derivatives Association | |
| K | ||
| KPI | Key performance indicator | |
| KPMG | KPMG Audit Plc and its affiliates | |
| KRW | South Korean won | |
| L | ||
| LFRF | Liquidity and funding risk management framework | |
| LGD1 | Loss given default | |
| Libor | London Interbank Offer Rate | |
| LIC | Loan impairment charge and other credit risk provision | |
| LTV1 | Loan to value ratio | |
| M | ||
| Mainland China | People’s Republic of China excluding Hong Kong | |
| Mazarin | Mazarin Funding Limited, an asset-backed CP conduit | |
530
Table of Contents
HSBC HOLDINGS PLC
Shareholder Information(continued)
| Abbreviation | Brief description | |
| MENA | Middle East and North Africa | |
| Monoline1 | Monoline insurance company | |
| MSCI | Morgan Stanley Capital International index | |
| MXN | Mexican peso | |
| N | ||
| NYSE | New York Stock Exchange | |
| O | ||
| OFAC | Office of Foreign Assets Control, USA | |
| OIB | Oman International Bank S.A.O.G. | |
| OIS | Overnight index swap | |
| ORMF | Operational risk management framework | |
| OTC1 | Over-the-counter | |
| P | ||
| PAB | Panamanian balboa | |
| PD1 | Probability of default | |
| Performance Shares1 | Awards of HSBC Holdings ordinary shares under employee share plans that are subject to corporate performance conditions | |
| Ping An | Ping An Insurance (Group) Company of China, Ltd, the second-largest life insurer in the PRC | |
| PPI | Payment protection insurance product | |
| PRC | People’s Republic of China | |
| Premier | See HSBC Premier | |
| PVIF | Present value of in-force long-term insurance business | |
| R | ||
| RBWM | Retail Banking and Wealth Management, a global business | |
| Repo1 | Sale and repurchase transaction | |
| Restricted Shares | Awards of Restricted Shares define the number of HSBC Holdings ordinary shares to which the employee will become entitled, generally between one and three years from the date of the award, and normally subject to the individual remaining in employment | |
| Reverse repo | Security purchased under commitments to sell | |
| Risk Management Meeting | The Risk Management Meeting of the Group Management Board | |
| RM | Malaysian ringgit | |
| RMB | Renminbi | |
| RMC | Risk Management Committee | |
| RoRWA | Return on average risk-weighted assets | |
| RPI | Retail price index (UK) | |
| RRP | Recovery and resolution plan | |
| RWA1 | Risk-weighted asset | |
| S | ||
| S&P | Standard and Poor’s rating agency | |
| SEC | Securities and Exchange Commission, US | |
| SIC | Securities investment conduit | |
| SIV1 | Structured investment vehicle | |
| SME | Small and medium-sized enterprise | |
| Solitaire | Solitaire Funding Limited, a special purpose entity managed by HSBC | |
| SPE1 | Special purpose entity | |
| SR | Saudi Arabian riyal | |
| T | ||
The Hongkong and Shanghai Banking Corporation | The Hongkong and Shanghai Banking Corporation Limited, the founding member of the HSBC Group | |
| TRL | Turkish lira | |
| TSR | Total shareholder return | |
| U | ||
| UAE | United Arab Emirates | |
| UK | United Kingdom | |
| US$ | United States dollar | |
| US | United States of America | |
| US run-off portfolio | Includes our CML, vehicle finance and Taxpayer Financial Services businesses and insurance, commercial, corporate and treasury activities in HSBC Finance on an IFRSs management basis | |
| V | ||
| VAR1 | Value at risk | |
| Visa | Visa Inc. | |
| VIU | Value in use | |
| VND | Vietnamese dong | |
| 1 | Full definition included in Glossary on page 529. |
531
Table of Contents
HSBC HOLDINGS PLC
Shareholder Information(continued)
| Term | Definition | |
| A | ||
Adjustable-rate mortgages (‘ARM’s) | Mortgage loans in the US on which the interest rate is periodically changed based on a reference price. These are included within ‘affordability mortgages’. | |
Affordability mortgages | Mortgage loans where the customer’s monthly payments are set out at a low initial rate, either variable or fixed, before resetting to a higher rate once the introductory period is over. | |
Agency exposures | Exposures to near or quasi-government agencies including public sector entities fully owned by government carrying out non-commercial activities, provincial and local government authorities, development banks and funds set up by government. | |
Alt-A | A US description for loans regarded as lower risk than sub-prime, but with higher risk characteristics than lending under normal criteria. | |
Arrears | Customers are said to be in arrears (or in a state of delinquency) when they are behind in fulfilling their obligations, with the result that an outstanding loan is unpaid or overdue. When a customer is in arrears, the total outstanding loans on which payments are overdue are described as delinquent. | |
Asset-backed securities (‘ABS’s) | Securities that represent an interest in an underlying pool of referenced assets. The referenced pool can comprise any assets which attract a set of associated cash flows but are commonly pools of residential or commercial mortgages. | |
| B | ||
Back-testing | A statistical technique used to monitor and assess the accuracy of a model, and how that model would have performed had it been applied in the past. | |
Bail-inable debt | Bail-in refers to imposition of losses at the point of non viability (but before insolvency) on bank liabilities (bail-inable debt) that are not exposed to losses while the institution remains a viable, going concern. Whether by way of write-down or conversion into equity, this has the effect of recapitalising the bank (although it does not provide any new funding). | |
Bank levy | A levy that applies to UK banks, building societies and the UK operations of foreign banks from 1 January 2011. The amount payable is based on a percentage of the group’s consolidated liabilities and equity as at 31 December 2011 after deducting certain items the most material of which are those related to insured deposit balances, tier 1 capital, insurance liabilities, high quality liquid assets and items subject to a legally enforceable net settlement agreement. | |
Basel II | The capital adequacy framework issued by the Basel Committee on Banking Supervision in June 2006 in the form of the ‘International Convergence of Capital Measurement and Capital Standards’, amended by subsequent changes to the capital requirements for market risk and re-securitisations, commonly known as Basel 2.5, which took effect 31 December 2011. | |
Basel III | In December 2010, the Basel Committee issued ‘Basel III rules: A global regulatory framework for more resilient banks and banking systems’ and ‘International framework for liquidity risk measurement, standards and monitoring’. Together these documents present the Basel Committee’s reforms to strengthen global capital and liquidity rules with the goal of promoting a more resilient banking sector. In June 2011, the Basel Committee issued a revision to the former document setting out the finalised capital treatment for counterparty credit risk in bilateral trades. The Basel III requirements will be phased in starting on 1 January 2013 with full implementation by 1 January 2019. | |
Basis point (‘Bps’) | One hundredth of a per cent (0.01%), so 100 basis points is 1%. Used in quoting movements in interest rates or yields on securities. | |
| C | ||
Capital conservation buffer | A capital buffer, prescribed by regulators under Basel III, and designed to ensure banks build up capital buffers outside periods of stress which can be drawn down as losses are incurred. Should a bank’s capital levels fall within the capital conservation buffer range, capital distributions will be constrained by the regulators. | |
Capital planning buffer | A capital buffer, prescribed by the FSA under Basel II, and designed to ensure banks build up capital buffers outside periods of stress which can be drawn down as losses are incurred. Should a bank’s capital levels fall within the capital planning buffer range, a period of heightened regulatory interaction would be triggered. | |
Capital requirements directive (‘CRD’) | A capital adequacy legislative package issued by the European Commission and adopted by member states. The first CRD legislative package gave effect to the Basel II proposals in the EU and came into force on 20 July 2006. CRD II, which came into force on 31 December 2010, subsequently updated the requirements for capital instruments, large exposure, liquidity risk and securitisation. A further amendment, CRD III updated market risk capital and additional securitisation requirements and came into force on 31 December 2011. | |
CRD IV package comprises a recast Capital Requirements Directive and a new Capital Requirements Regulation. The package implements the Basel III capital proposals together with transitional arrangements for some of its requirements. CRD IV proposals are in draft and yet to have legal effect. | ||
Central counterparty (‘CCP’) | An intermediary between a buyer and a seller (generally a clearing house). | |
Collateralised debt obligation (‘CDO’) | A security issued by a third-party which references ABSs and/or certain other related assets purchased by the issuer. CDOs may feature exposure to sub-prime mortgage assets through the underlying assets. | |
532
Table of Contents
HSBC HOLDINGS PLC
Shareholder Information(continued)
| Term | Definition | |
Collectively assessed impairment | Impairment assessment on a collective basis for homogeneous groups of loans that are not considered individually significant and to cover losses which have been incurred but have not yet been identified on loans subject to individual assessment. | |
Commercial paper (‘CP’) | An unsecured, short-term debt instrument issued by a corporation, typically for the financing of accounts receivable, inventories and meeting short-term liabilities. The debt is usually issued at a discount, reflecting prevailing market interest rates. | |
Commercial real estate | Any real estate investment, comprising buildings or land, intended to generate a profit, either from capital gain or rental income. | |
Common equity tier 1 capital (‘CET1’) | The highest quality form of regulatory capital under Basel III that comprises common shares issued and related share premium, retained earnings and other reserves excluding the cash flow hedging reserve, less specified regulatory adjustments. | |
Common reporting (‘COREP’) | Harmonised European reporting framework established in the Capital Requirements Directives, to be mandated by the European Banking Authority. | |
Compliance risk | The risk that the Group fails to observe the letter and spirit of all relevant laws, codes, rules, regulations and standards of good market practice, and incurs fines and penalties and suffers damage to its business as a consequence. | |
Conduits | HSBC sponsors and manages multi-seller conduits and securities investment conduits (‘SIC’s). The multi-seller conduits hold interests in diversified pools of third-party assets such as vehicle loans, trade receivables and credit card receivables funded through the issuance of short-dated commercial paper and supported by a liquidity facility. The SICs hold predominantly asset-backed securities referencing such items as commercial and residential mortgages, vehicle loans and credit card receivables funded through the issuance of both long-term and short-term debt. | |
Constant currency | A non-GAAP financial measure that adjusts for the year-on-year effects of foreign currency translation differences by comparing reported results for the reported period with reported results for comparative period retranslated at exchange rates for the reported period. The foreign currency translation differences reflect the movements of the US dollar against most major currencies during the reported period. | |
Constant net asset value fund | A fund that prices its assets on an amortised cost basis, subject to the amortised book value of the portfolio remaining within 50 basis points of its market value. | |
Consumer Mortgage and Lending (‘CML’) | In the US, the CML portfolio consists of our Consumer Lending and Mortgage Services businesses, which are in | |
The Consumer Lending business offered secured and unsecured loan products, such as first and second lien mortgage loans, open-ended home equity loans and personal non-credit card loans through branch locations and direct mail. The majority of the mortgage lending products were for refinancing and debt consolidation rather than home purchases. In the first quarter of 2009, we discontinued all originations by our Consumer Lending business. | ||
Prior to the first quarter of 2007, when we ceased new purchase activity, the Mortgage Services business purchased non-conforming first and second lien real estate secured loans from unaffiliated third parties. The business also included the operations of Decision One Mortgage Company (‘Decision One’), which historically originated mortgage loans sourced by independent mortgage brokers and sold these to secondary market purchasers. Decision One ceased originations in September 2007. | ||
Contractual maturities | The date on which the final payment (principal or interest) of any financial instrument is due to be paid, at which point all the remaining outstanding principal and interest have been repaid. | |
Core tier 1 capital | The highest quality form of regulatory capital, under Basel II, that comprises total shareholders’ equity and related non-controlling interests, less goodwill and intangible assets and certain other regulatory adjustments. | |
Countercyclical capital buffer (‘CCB’) | A capital buffer, prescribed by regulators under Basel III, which aims to ensure that capital requirements take account of the macro-financial environment in which banks operate. This will provide the banking sector with additional capital to protect it against potential future losses, when excess credit growth in the financial system as a whole is associated with an increase in system-wide risk. | |
Counterparty credit risk (‘CCR’) | Counterparty credit risk, in both the trading and non-trading books, is the risk that the counterparty to a transaction may default before completing the satisfactory settlement of the transaction. | |
Credit default swap | A derivative contract whereby a buyer pays a fee to a seller in return for receiving a payment in the event of a defined credit event (e.g. bankruptcy, payment default on a reference asset or assets, or downgrades by a rating agency) on an underlying obligation (which may or may not be held by the buyer). | |
Credit derivative product companies (‘CDPC’s) | Independent companies that specialise in selling credit default protection on corporate exposures in the form of credit derivatives. | |
Credit enhancements | Facilities used to enhance the creditworthiness of financial obligations and cover losses due to asset default. | |
Credit risk | Risk of financial loss if a customer or counterparty fails to meet an obligation under a contract. It arises mainly from direct lending, trade finance and leasing business, but also from products such as guarantees, derivatives and debt securities. | |
Credit valuation adjustment (‘CVA’) | An adjustment to the valuation of OTC derivative contracts to reflect the creditworthiness of OTC derivative counterparties. Formerly described as Credit Risk Adjustment. | |
533
Table of Contents
HSBC HOLDINGS PLC
Shareholder Information(continued)
| Term | Definition | |
Credit risk mitigation | A technique to reduce the credit risk associated with an exposure by application of credit risk mitigants such as collateral, guarantee and credit protection. | |
Credit risk spread | The premium over the benchmark or risk-free rate required by the market to accept a lower credit quality. The yield spread between securities with the same coupon rate and maturity structure but with different associated credit risks. The yield spread rises as the credit rating worsens. | |
Credit spread risk | The risk that movements in credit spreads will affect the value of financial instruments. | |
Customer deposits | Money deposited by account holders. Such funds are recorded as liabilities. | |
Customer remediation | Customer remediation refers to activities carried out by HSBC to compensate customers for losses or damages associated with a failure to comply with regulations. Customer remediation is initiated by HSBC in response to customer complaints, and not specifically initiated by regulatory action. | |
Customer risk rating (‘CRR’) | A scale of 23 grades measuring internal obligor probability of default. | |
| D | ||
Debit valuation adjustment (‘DVA’) | An adjustment made by an entity to the valuation of OTC derivative liabilities to reflect within fair value the entity’s own credit risk. | |
Debt restructuring | A restructuring by which the terms and provisions of outstanding debt agreements are changed. This is often done in order to improve cash flow and the ability of the borrower to repay the debt. It can involve altering the repayment schedule as well as debt or interest charge reduction. | |
Debt securities | Assets on the Group’s balance sheet representing certificates of indebtedness of credit institutions, public bodies or other undertakings, excluding those issued by Central Banks. | |
Debt securities in issue | Transferable certificates of indebtedness of the Group to the bearer of the certificates. These are liabilities of the Group and include certificates of deposits. | |
Deed-in-lieu | An arrangement in which a borrower surrenders the deed for a property to the lender without going through foreclosure proceedings and is subsequently released from any further obligations on the loan. | |
Defined benefit obligation | The present value of expected future payments required to settle the obligations of a defined benefit plan resulting from employee service. | |
Delinquency | See ‘Arrears’. | |
Deposits by banks | All deposits received from domestic and foreign banks, excluding deposits or liabilities in the form of debt securities or for which transferable certificates have been issued. | |
| E | ||
Economic capital | The internally calculated capital requirement which is deemed necessary by HSBC to support the risks to which it is exposed. | |
Economic profit | The difference between the return on financial capital invested by shareholders and the cost of that capital. Economic profit may be expressed as a whole number or as a percentage. | |
Economic value of equity (‘EVE’) sensitivity | Considers all re-pricing mismatches in the current balance sheet and calculates the change in market value that would result from a set of defined interest rate shocks. | |
Encumbered assets | Assets on our balance sheet which have been pledged as collateral against an existing liability. | |
Equity risk | The risk arising from positions, either long or short, in equities or equity-based instruments, which create exposure to a change in the market price of the equities or equity instruments. | |
Eurozone | Represents the 17 European Union countries that have adopted the euro as their common currency. The 17 countries are Austria, Belgium, Cyprus, Estonia, Finland, France, Germany, Greece, Ireland, Italy, Luxembourg, Malta, Netherlands, Portugal, Slovakia, Slovenia and Spain. | |
Expected loss (‘EL’) | A regulatory calculation of the amount expected to be lost on an exposure using a 12 month time horizon and downturn loss estimates. EL is calculated by multiplying the Probability of Default (a percentage) by the Exposure at Default (an amount) and Loss Given Default (a percentage). | |
Exposure | A claim, contingent claim or position which carries a risk of financial loss. | |
Exposure at default (‘EAD’) | The amount expected to be outstanding after any credit risk mitigation, if and when the counterparty defaults. EAD reflects drawn balances as well as allowance for undrawn amounts of commitments and contingent exposures. | |
| F | ||
Fair value adjustment | An adjustment to the fair value of a financial instrument which is determined using a valuation technique (level 2 and level 3) to include additional factors that would be considered by a market participant that are not incorporated within the valuation model. | |
Fiduciary risk | The risk to the Group of breaching its fiduciary duties where it acts in a fiduciary capacity as trustee, investment manager or as mandated by law or regulation. | |
Financial Reporting (‘FINREP’) | Harmonised European financial reporting framework, proposed by the European Union, which will be used to obtain a comprehensive view of a firm’s risk profile. | |
First lien | A security interest granted over an item of property to secure the repayment of a debt that places its holder first in line to collect repayment from the sale of the underlying collateral in the event of a default on the debt. | |
534
Table of Contents
HSBC HOLDINGS PLC
Shareholder Information(continued)
| Term | Definition | |
Forbearance strategies | Strategies that are employed in order to improve the management of customer relationships, maximise collection opportunities and, if possible, avoid default, foreclosure or repossession. Such arrangements include extended payment terms, a reduction in interest or principal repayments, approved external debt management plans, debt consolidations, the deferral of foreclosures, other modifications and re-ages. | |
FSA standard rules | The method prescribed by the FSA for calculating market risk capital requirements in the absence of VAR model approval. | |
Funded exposures | A funded exposure is one where the notional amount of a contract is or has been exchanged. | |
Funding risk | A form of liquidity risk arising when the liquidity needed to fund illiquid asset positions cannot be obtained at the expected terms and when required. | |
| G | ||
Gap risk | The risk of financial loss arising from a significant change in market price with no accompanying trading opportunity. | |
Global Systemically Important Bank | A bank that meets the criteria defined in the Basel Committee’s final rules set out in their 4 November 2011 document ‘Global systemically important banks: Assessment methodology and the additional loss absorbency requirement’. The latest official list of such banks comprised the 28 names, which include HSBC, published by the Financial Stability Board in November 2012. The Financial Stability Board is co-ordinating, on behalf of the G20 Group of Governors and Heads of Supervision (‘GHOS’), the overall set of measures to reduce the moral hazard and risks to the global financial system posed by global systemically important financial institutions (‘G-SIFI’s) of all kinds. | |
Government-sponsored enterprises (‘GSE’s) | A group of financial services enterprises created by the US Congress. Their function is to reduce the cost of capital for certain borrowing sectors of the economy, and to make them more efficient and transparent. Examples in the residential mortgage borrowing segment are Freddie Mac and Fannie Mae. GSEs carry the implicit backing, but are not direct obligations, of the US Government. | |
GPSP Awards | Awards that define the number of HSBC Holdings ordinary shares to which the employee will become entitled, generally five years from the date of the award, and normally subject to individual remaining in employment. The shares to which the employee becomes entitled are subject to a retention requirement until cessation of employment. | |
Guarantee | An undertaking by a party to pay a creditor should a debtor fail to do so. | |
| H | ||
Haircuts | A discount applied by management when determining the amount at which an asset can be realised. The discount takes into account the method of realisation including the extent to which an active market for the asset exists. | |
Historical rating transition matrices (‘HRTM’) | HRTMs show the probability of a counterparty with a particular rating moving to a different rating over a defined time horizon. | |
Home Equity Lines of Credit (‘HELoC’s) | A form of revolving credit facility provided to US customers, which is supported in the majority of cases by a second lien or lower ranking charge over residential property. Holdings of HELoCs are classified as sub-prime. | |
| I | ||
Impaired loans | Loans where the Group does not expect to collect all the contractual cash flows or expects to collect them later than they are contractually due. | |
Impairment allowances | Management’s best estimate of losses incurred in the loan portfolios at the balance sheet date. | |
Individually assessed impairment | Exposure to loss is assessed on all individually significant accounts and all other accounts that do not qualify for collective assessment. | |
Insurance risk | A risk, other than a financial risk, transferred from the holder of a contract to the insurance provider. The principal insurance risk is that, over time, the combined cost of claims, administration and acquisition of the contract may exceed the aggregate amount of premiums received and investment income. | |
Internal Capital Adequacy Assessment Process | The Group’s own assessment of the levels of capital that it needs to hold through an examination of its risk profile from regulatory and economic capital viewpoints. | |
Internal Model Method (‘IMM’) | One of three approaches defined by Basel II to determine exposure values for counterparty credit risk. | |
Internal ratings-based approach (‘IRB’) | A method of calculating credit risk capital requirements using internal, rather than supervisory, estimates of risk parameters. | |
Invested capital | Equity capital invested in HSBC by its shareholders, adjusted for certain reserves and goodwill previously amortised or written off. | |
Investment grade | Represents a risk profile similar to a rating of BBB- or better, as defined by an external rating agency. | |
IRB advanced approach | A method of calculating credit risk capital requirements using internal PD, LGD and EAD models. | |
IRB foundation approach | A method of calculating credit risk capital requirements using internal PD models but with supervisory estimates of LGD and conversion factors for the calculation of EAD. | |
ISDA Master agreement | Standardised contract developed by ISDA used as an umbrella under which bilateral derivatives contracts are entered into. | |
535
Table of Contents
HSBC HOLDINGS PLC
Shareholder Information(continued)
| Term | Definition | |
| K | ||
Key management personnel | Directors and Group Managing Directors of HSBC Holdings. | |
| L | ||
Legacy credit in GB&M | A separately identifiable, discretely managed business comprising Solitaire Funding Limited, the securities investment conduits, the asset-backed securities trading portfolios and credit correlation portfolios, derivative transactions entered into directly with monoline insurers, and certain other structured credit transactions. | |
Legal proceedings | Legal proceedings include civil court, arbitration or tribunal proceedings brought against HSBC companies (whether by way of claim or counterclaim) or civil disputes that may, if not settled, result in court, arbitration or tribunal proceedings. | |
Legal risk | The risk of financial loss, sanction and/or reputational damage resulting from contractual risk (the risk that the rights and/or obligations of a Group member within a contractual relationship are defective); dispute risk (the risk when involved in or managing potential or actual disputes); legislative risk (the risk that a Group member fails to adhere to laws of the jurisdiction in which it operates); and non contractual rights risk (the risk that a Group member’s assets are not properly owned or are infringed by others or the infringement by a Group member of another party’s rights). | |
Level 1 – quoted market price | Financial instruments with quoted prices for identical instruments in active markets. | |
Level 2 – valuation technique using observable inputs | Financial instruments with quoted prices for similar instruments in active markets or quoted prices for identical or similar instruments in inactive markets and financial instruments valued using models where all significant inputs are observable. | |
Level 3 – valuation technique with significant unobservable inputs | Financial instruments valued using valuation techniques where one or more significant inputs are unobservable. | |
Leveraged finance | Funding provided for entities with higher than average indebtedness, which typically arises from sub-investment grade acquisitions or event-driven financing. | |
Leverage ratio | A measure, prescribed by regulators under Basel III, which is the ratio of tier 1 capital to total exposures. Total exposures include on-balance sheet items, off-balance sheet items and derivatives, and should generally follow the accounting measure of exposure. This supplementary measure to the risk-based capital requirements is intended to constrain the build-up of excess leverage in the banking sector. | |
Liquidity coverage ratio (‘LCR’) | The ratio of the stock of high quality liquid assets to expected net cash outflows over the following 30 days. High quality liquid assets should be unencumbered, liquid in markets during a time of stress and, ideally, be central bank eligible. The Basel III rules require this ratio to be at least 100% with effect from 2015. The LCR is still subject to an observation period and review to address any unintended consequences. | |
Liquidity risk | The risk that HSBC does not have sufficient financial resources to meet its obligations as they fall due, or will have to do so at an excessive cost. This risk arises from mismatches in the timing of cash flows. | |
Loan modification | An account management action that results in a change to the original terms and conditions of a loan either temporarily or permanently without resetting its delinquency status, except in case of a ‘modification re-age’ where delinquency status is also reset to up-to-date. Account modifications may include revisions to one or more terms of the loan including, but not limited to, a change in interest rate, extension of the amortisation period, reduction in payment amount and partial forgiveness or deferment of principal. | |
Loan re-age | An account management action that results in the resetting of the contractual delinquency status of an account to up-to-date upon fulfilment of certain requirements which indicate that payments are expected to be made in accordance with the contractual terms. | |
Loans past due | Loans on which repayments are overdue. | |
Loan to value ratio (‘LTV’) | A mathematical calculation that expresses the amount of the loan as a percentage of the value of security. A high LTV indicates that there is less cushion to protect the lender against house price falls or increases in the loan if repayments are not made and interest is added to the outstanding loan balance. | |
Loss given default (‘LGD’) | The estimated ratio (percentage) of the loss on an exposure to the amount outstanding at default (EAD) upon default of a counterparty. | |
Loss severity | The realised amount of losses incurred (including ancillary amounts owed) when a loan is foreclosed or disposed of through the arrangement with the borrower. The loss severity is represented as a percentage of the outstanding loan balance. | |
| M | ||
Market risk | The risk that movements in market risk factors, including foreign exchange rates and commodity prices, interest rates, credit spreads and equity prices will reduce income or portfolio values. | |
Medium term notes (‘MTN’s) | Notes issued by corporates across a range of maturities. MTNs are frequently issued by corporates under MTN Programmes whereby notes are offered on a regular and continuous basis to investors. | |
Monoline insurers (‘monolines’) | Entities which specialise in providing credit protection to the holders of debt instruments in the event of default by the debt security counterparty. This protection is typically held in the form of derivatives such as CDSs referencing the underlying exposures held. | |
536
Table of Contents
HSBC HOLDINGS PLC
Shareholder Information(continued)
| Term | Definition | |
Mortgage-backed securities (‘MBS’s) | Securities that represent interests in groups of mortgages, which may be on residential or commercial properties. Investors in these securities have the right to cash received from future mortgage payments (interest and/or principal). When the MBS references mortgages with different risk profiles, the MBS is classified according to the highest risk class. | |
Mortgage-related assets | Assets which are referenced to underlying mortgages. | |
Mortgage vintage | The year a mortgage was originated. | |
| N | ||
Negative equity mortgages | Equity is the value of the asset less the outstanding balance on the loan. Negative equity arises when the value of the property purchased is below the balance outstanding on the loan. | |
Net asset value per share | Total shareholders’ equity, less non-cumulative preference shares and capital securities, divided by the number of ordinary shares in issue. | |
Net interest income | The amount of interest received or receivable on assets net of interest paid or payable on liabilities. | |
Net interest income sensitivity | Considers all re-pricing mismatches in the current balance sheet, with suitable assumptions for balance sheet growth in the future, and calculates the change in net interest income that would result from a set of defined interest rate shocks. | |
Net principal exposure | The gross principal amount of a financial asset after taking account of credit protection purchased but excluding the effect of any counterparty credit valuation adjustment to that protection. It includes assets that benefit from monoline protection, except where this protection is purchased with a CDS. | |
Net stable funding ratio (‘NSFR’) | The ratio of available stable funding to required stable funding over a one year time horizon, assuming a stressed scenario. Available stable funding would include items such as equity capital, preferred stock with a maturity of over one year and liabilities with an assessed maturity of over one year. The Basel III rules require this ratio to be over 100% with effect from 2018. The NSFR is still subject to an observation period and review to address any unintended consequences. | |
Non-conforming mortgages | US mortgages that do not meet normal lending criteria. Examples include mortgages where the expected level of documentation is not provided (such as with income self-certification), or where poor credit history increases the risk and results in pricing at a higher than normal lending rate. | |
Non-trading portfolios | Portfolios that comprise positions that primarily arise from the interest rate management of our retail and commercial banking assets and liabilities, financial investments designated as available for sale and held to maturity, and exposures arising from our insurance operations. | |
Non-trading risk | The market risk arising from non-trading portfolios. | |
| O | ||
Offset mortgages | A flexible type of mortgage where a borrower’s savings balance(s) held at the same institution can be used to offset the mortgage balance owing. The borrower pays interest on the net balance which is calculated by subtracting the credit balance(s) from the debit balance. As part of the offset mortgage a total facility limit is agreed and the borrower may redraw past capital repayments up this agreed limit. | |
Overnight Index Swap (‘OIS’) discounting | A method of valuing collateralised interest rate derivatives which uses a discount curve that reflects the overnight interest rate typically earned or paid in respect of collateral received. | |
Operational risk | The risk of loss resulting from inadequate or failed internal processes, people and systems or from external events, including legal risk. | |
Over-the-counter (‘OTC’) | A bilateral transaction (e.g. derivatives) that is not exchange traded and that is valued using valuation models. | |
| P | ||
Pension risk | The risk that contributions from Group companies and members fail to generate sufficient funds to meet the cost of accruing benefits for the future service of active members, and the risk that the performance of assets held in pension funds is insufficient to cover existing pension liabilities. | |
Performance Shares | Awards of HSBC Holdings ordinary shares under employee share plans that are subject to the achievement of corporate performance conditions. | |
Personal lending | See ‘Retail loans’. | |
Prime | A US description for mortgages granted to the most creditworthy category of borrowers. | |
Private equity investments | Equity securities in operating companies not quoted on a public exchange, often involving the investment of capital in private companies or the acquisition of a public company that results in its delisting. | |
Probability of default (‘PD’) | The probability that an obligor will default within a one-year time horizon. | |
| R | ||
Refi rate | The refi (or refinancing) rate is set by the European Central Bank (‘ECB’) and is the price banks pay to borrow from ECB. | |
Regulatory capital | The capital which HSBC holds, determined in accordance with rules established by the FSA for the consolidated Group and by local regulators for individual Group companies. | |
Regulatory matters | Regulatory matters refer to investigations, reviews and other actions carried out by, or in response to the actions of, regulators or law enforcement agencies in connection with alleged wrongdoing by HSBC. | |
537
Table of Contents
HSBC HOLDINGS PLC
Shareholder Information(continued)
| Term | Definition | |
Renegotiated loans | Loans for which the contractual terms have been changed because of significant concerns about the borrower’s ability to meet the contractual payments when due. | |
Repo (or Sale and repurchase agreement) | A repo is a short-term funding agreement that allows a borrower to create a collateralised loan by selling a financial asset to a lender. As part of the agreement the borrower commits to repurchase the security at a date in the future repaying the proceeds of the loan. For the party on the other end of the transaction (buying the security and agreeing to sell in the future) it is reverse repurchase agreement or a reverse repo. | |
Reputational risk | The risk that illegal, unethical or inappropriate behaviour by the Group itself, members of staff or clients or representatives of the Group will damage HSBC’s reputation, leading, potentially, to a loss of business, fines or penalties. | |
Residential mortgage | A loan to purchase a residential property which is then used as collateral to guarantee repayment of the loan. The borrower gives the lender a lien against the property, and the lender can foreclose on the property if the borrower does not repay the loan per the agreed terms. | |
Restricted Shares | Awards that define the number of HSBC Holdings ordinary shares to which the employee will become entitled, generally between one and three years from the date of the award, and normally subject to the individual remaining in employment. The shares to which the employee becomes entitled may be subject to retention requirement. | |
Retail loans | Money lent to individuals rather than institutions. This includes both secured and unsecured loans such as mortgages and credit card balances. | |
Return on equity | Profit attributable to shareholders of the parent company divided by average ordinary shareholders’ equity. | |
Risk appetite | An assessment of the types and quantum of risks to which HSBC wishes to be exposed. | |
Risk-weighted assets (‘RWA’s) | Calculated by assigning a degree of risk expressed as a percentage (risk weight) to an exposure in accordance with the applicable Standardised or IRB approach rules. | |
Run-off portfolios | Legacy credit in GB&M, the US CML portfolio and other US run-off portfolios, including the treasury services related to the US CML businesses and commercial operations in run-off. Origination of new business in the run-off portfolios has been discontinued and balances are being managed down through attrition and sale. | |
| S | ||
Sale and repurchase agreement | See repo above. | |
Seasoning | The emergence of credit loss patterns in portfolios over time. | |
Second lien | A security interest granted over an item of property to secure the repayment of a debt that is issued against the same collateral as a first lien but that is subordinate to it. In the case of default, repayment for this debt will only be received after the first lien has been repaid. | |
Securitisation | A transaction or scheme whereby the credit risk associated with an exposure, or pool of exposures, is tranched and where payments to investors in the transaction or scheme are dependent upon the performance of the exposure or pool of exposures. A traditional securitisation involves the transfer of the exposures being securitised to an SPE which issues securities. In a synthetic securitisation, the tranching is achieved by the use of credit derivatives and the exposures are not removed from the balance sheet of the originator. | |
Short sale | In relation to credit risk management, a ‘short sale’ is an arrangement in which a bank permits the borrower to sell the property for less than the amount outstanding under a loan agreement. The proceeds are used to reduce the outstanding loan balance and the borrower is subsequently released from any further obligations on the loan. | |
Single-issuer liquidity facility | A liquidity or stand-by line provided to a corporate customer which is different from a similar line provided to a conduit funding vehicle. | |
Six filters | An internal measure designed to improve capital deployment across the Group. This examines the strategic relevance of each business in each country, in terms of connectivity and economic development, and the current returns, in terms of profitability, cost efficiency and liquidity. The sixth filter requires adherence to global risk standards. | |
Sovereign exposures | Exposures to governments, ministries, departments of governments, embassies, consulates and exposures on account of cash balances and deposits with central banks. | |
Special purpose entities (‘SPE’s) | A corporation, trust or other non-bank entity, established for a narrowly defined purpose, including for carrying on securitisation activities. The structure of the SPE and its activities are intended to isolate its obligations from those of the originator and the holders of the beneficial interests in the securitisation. | |
Standardised approach | In relation to credit risk, a method for calculating credit risk capital requirements using External Credit Assessment Institutions (‘ECAI’) ratings and supervisory risk weights. In relation to operational risk, a method of calculating the operational capital requirement by the application of a supervisory defined percentage charge to the gross income of eight specified business lines. | |
Stressed VAR | A market risk measure based on potential market movements for a continuous one-year period of stress for a trading portfolio | |
538
Table of Contents
HSBC HOLDINGS PLC
Shareholder Information(continued)
| Term | Definition | |
Structured finance/notes | An instrument whose return is linked to the level of a specified index or the level of a specified asset. The return on a structured note can be linked to equities, interest rates, foreign exchange, commodities or credit. Structured notes may or may not offer full or partial capital protection in the event of a decline in the underlying index or asset. | |
Structured Investment Vehicles (‘SIV’s) | Special purpose entities which invest in diversified portfolios of interest-earning assets, generally funded through issues of commercial paper, medium-term notes and other senior debt to take advantage of the spread differentials between the assets in the SIV and the funding cost. | |
Student loan-related assets | Securities with collateral relating to student loans. | |
Subordinated liabilities | Liabilities which rank after the claims of other creditors of the issuer in the event of insolvency or liquidation. | |
Sub-prime | A US description for customers with high credit risk, for example those who have limited credit histories, modest incomes, high debt-to-income ratios, high loan-to-value ratios (for real estate secured products) or have experienced credit problems caused by occasional delinquencies, prior charge-offs, bankruptcy or other credit-related problems. | |
Sustainability risk | The risk that the environmental and social effects of providing financial services outweigh the economic benefits. | |
Sustainable cost savings | Permanent cost reductions at a given level of business activity. Sustainable cost savings exclude cost avoidance and revenue and loan impairment charge benefits as these do not represent operational expense reductions. Cost savings resulting from business disposals are not classified as sustainable. | |
Systems risk | The risk of failure or other deficiency in the automated platforms that support the Group’s daily execution and the systems infrastructure on which they reside, including data centres, networks and distributed computers. | |
| T | ||
Tier 1 capital | A component of regulatory capital, comprising core tier 1 and other tier 1 capital. Other tier 1 capital includes qualifying capital instruments such as non-cumulative perpetual preference shares and hybrid capital securities. | |
Tier 2 capital | A component of regulatory capital, comprising qualifying subordinated loan capital, related non-controlling interests, allowable collective impairment allowances and unrealised gains arising on the fair valuation of equity instruments held as available-for-sale. Tier 2 capital also includes reserves arising from the revaluation of properties. | |
Total compensation ratio | The total compensation ratio represents the proportion of total employee expenses to operating income net of impairment charges. | |
Trading portfolios | Portfolios that comprise positions arising from market-making and warehousing of customer-derived positions. | |
Trading risk | The market risk arising from trading portfolios. | |
Troubled debt restructuring | A US description for restructuring a debt whereby the creditor for economic or legal reasons related to a debtor’s financial difficulties grants a concession to the debtor that it would not otherwise consider. | |
| U | ||
Unencumbered assets | Assets on our balance sheet which have not been pledged as collateral against an existing liability. | |
Unfunded exposures | An exposure where the notional amount of a contract has not been exchanged. | |
US Government agency and US Government sponsored enterprises mortgage-related assets | Securities that are guaranteed by US Government agencies such as Ginnie Mae, or by US Government sponsored entities including Fannie Mae and Freddie Mac. | |
| V | ||
Value-at-risk (‘VAR’) | A measure of the loss that could occur on risk positions as a result of adverse movements in market risk factors (e.g. rates, prices, volatilities) over a specified time horizon and to a given level of confidence. | |
| W | ||
Wholesale loans | Money lent to sovereign borrowers, banks, non-bank financial institutions and corporate entities. | |
Write-down | Reduction in the carrying value of an asset due to impairment or fair value movements. | |
Wrong-way risk | An adverse correlation between the counterparty’s probability of default and the mark-to-market value of the underlying transaction. | |
539
Table of Contents
HSBC HOLDINGS PLC
Shareholder Information(continued)
A
Abbreviations 526
Accounting
developments (future) 385
policies (critical) 54
policies (significant) 387
Accounts
approval 515
basis of preparation 58, 383
consolidation 372, 384
presentation of information 383
use of estimates 384
Acquisitions and disposals 27, 59, 80
Actuarial assumptions 417
Advances to core funding ratio 205
American Depositary Shares 524a
Annual General Meeting 339, 517
Anti-money laundering and sanctions 122e, 122q, 510
Areas of special interest 128
Asset-backed securities 185, 268
Assets 46
average balance sheet 33, 49a
by country 432
by geographical region 49g, 79
by global business 58
charged as security 493
constant currency/reported reconciliation 48
deferred tax 422
encumbered/unencumbered 211
five years 45
held for sale 143, 471
accounting policy 405
held in custody and under administration 118
intangible 465
Interest-earning 49c
liquid assets of principal operating entities 263
maturity analysis 485
other 472
risk-weighted 2, 59, 79, 254, 296
trading 436
Associates and joint ventures
interests in 460
share of profit in 43, 44i
Auditor
arrangements 322
remuneration 419
report 369
B
Balance sheet
average 33, 49a
consolidated 45, 374
constant currency/reported reconciliation 48
data 45, 76, 86, 91, 97, 102, 108, 115, 431
HSBC Holdings 379
insurance manufacturing subsidiaries 235
movement in 2012 46
Balance Sheet Management 185, 222
Bancassurance 233
Basel 288
Board of Directors 309
balance and independence 311
changes 6
committees 318
information and support 312
meetings 310
powers 310
Brand 24
Brazilian labour claims 480
Business model 14, 185
C
Calendar (dividends) 516
Capital 281
future developments 291; generation 294; management 293; measurement and allocation 294; movement in regulatory capital in 2012 285; overview 282; ratio 2, 23; regulatory 294; regulatory and accounting 288; resources 45; return on average invested capital 3; risk 293; structure 286
Capital and performance ratios 2, 23
Carbon dioxide emissions 331
Cash flow
accounting policy 405
consolidated statement 375
HSBC Holdings 380
notes 498
Cautionary statement regarding forward-looking
statements 3a
Certificates of deposit 50a
Client assets 118
Collateral and credit enhancements 163, 493
management 212
Commercial Banking 60, 65 204, 432
constant currency/reported profit 26, 75c
underlying/reported profit 75i
Commercial real estate 128
Committees (Board) 318
Communication with shareholders 345, 518
Compliance risk 125, 128, 230
Concentration of exposure 178, 259
Conduits 504
Constant currency 25
Contentsinside front cover
Contingent liabilities and contractual commitments 208, 500
Contractual maturity of financial liabilities 214
Contractual obligations 49k
Core tier 1 capital 2, 286
Corporate and commercial lending 154, 165
Corporate governance 301
codes report 316
differences between HSBC and the New York Stock
Exchange 524e
Corporate Sustainability Committee 330
Cost efficiency ratio 2, 23, 43, 81, 88, 93, 99, 104, 111
Counterparty credit risk 284
Country distribution of outstandings and cross-border
exposures 183a
CRD IV 298
Credit cards 152
Credit coverage ratios 3
Credit exposure 144
Credit quality 151, 154
classifications 253
Credit risk
in 2012 139
insurance 240, 277
management thereof 124, 252
risk-weighted assets 283
Credit valuation adjustment 56, 441
Critical accounting policies 54
Cross-border exposures 259
Customer accounts 49e, 49j, 49n, 50
Customer deposit markets 204
Customer lending and deposit (combined) 49
Customer recommendation 24
D
Daily distribution of revenues 220
Daily trading/non-trading VAR 219, 220, 221
Dealings in HSBC Holdings plc shares 346
Debit valuation adjustment 56, 441
540
Table of Contents
HSBC HOLDINGS PLC
Shareholder Information(continued)
Debt securities in issue 49e, 474
accounting policy 404
Defined termsinside front cover
Deposits 449
accounting policy 404
average balances and average rates 33, 49m
by banks 49d
Derivatives 145, 167, 179, 189, 452
accounting policy 395
Directors
annual incentives 355
appointments and re-election 316
biographies 302
Board of Directors 309
conflicts of interest 316
emoluments 361, 419
executive 312
exit payments 359
fees 362
interests 343
non-executive 313
other directorships 363
pensions 365
performance evaluation 315
relations with shareholders 316
remuneration (executive) 354, 361
service contracts 359
terms of appointment 309
Disclosure controls 117a
Disclosure philosophy 12
Disposal groups 471, 475
Disposals 18, 27, 52, 78, 117, 499
Diversity and inclusion 335
Dividends 344, 425, 516, 523, 524a
payout ratio 29
per share 2, 24
E
Earnings per share 2, 23, 29, 426
Economic background
Europe 81, 85b; Hong Kong 88, 90b; Latin America 111,
114b; Middle East and North Africa 99, 191b;
North America 104, 107b; Rest of Asia-Pacific 93, 96b
Economic profit/(loss) 44i, 51
Efficiency and revenue mix ratios 2
Employees 335
compensation and benefits 366, 409
disabled 336
diversity and inclusion 335
engagement 22
issues 331
numbers 42, 335, 409
relations 335
remuneration policy 336
reward 335
Encumbered assets 211
Enforceability of judgements made in the US 524a
Enhanced Disclosure Task Force 12, 119
Enquiries (from shareholders) 518
Equity 47
Equity securities 222
Europe
balance sheet data 86, 431
collateral 164-167
constant currency/reported reconciliation 85a, 178
customer accounts 50
economic background 81, 85b
lending 140, 141, 142, 147, 149, 153, 157, 158, 163, 167, 172, 181
loan impairment charges/allowances 169, 170
operating expenses 85
pension plans 248, 279
principal operations 81
profit/(loss) 81, 86, 428
profit/(loss) by country 82
review of performance 81, 85b
risk-weighted assets 79
underlying/reported profit 85e
Eurozone 129
exposures 192
Events after the balance sheet date 515
Exchange controls 524a
Exposures 185, 186
F
Fair value 438
accounting policy 393
adjustments 439
control framework 438
movements 80
valuation bases 441, 442
Fee income (net) 35, 44c
Fiduciary risk 126, 231, 273
Filters (six) 18
Financial assets
accounting policy 397
designated at fair value 451
not qualifying for de-recognition 459
reclassification 388, 450
transfers 458
Financial assets and liabilities
accounting policy 397
by measurement basis 432
Financial guarantee contracts
accounting policy 402
Financial highlights 2
Financial instruments
accounting policy (fair value) 393
accounting policy (valuation) 56, 388, 448
at fair value 37, 44e, 437
credit quality 154, 253
net income from 406
not at fair value 447
Financial investments 49, 49b, 49i, 145, 179, 456
accounting policy 394
gains less losses from 38, 44e
Financial liabilities designated at fair value 49d, 49j, 473
contractual maturities 214
Financial risks (insurance) 238, 275
Financial Services Compensation Scheme 501
Financial System Vulnerabilities Committee 328
Financial statements 371
Five-year comparison 29, 45
Footnotes 120, 249, 382
Forbearance 158
Foreclosures 151
Foreign currencies/exchange
accounting policy 401
exposures 493
rates 29, 45
Funding sources (diversity) 209
Funds under management 118
G
Gains on disposal of US branch network, US cards
and Ping An 39
Geographical regions 16, 79
Global businesses 16, 58
Global Banking and Markets 18, 60, 68, 204, 432
balance sheet data 75f
constant currency/reported profit 26, 75d
underlying/reported profit 75j
Global functions 16
Global People Survey 335
Global Private Banking 19, 60, 72, 204, 432
constant currency/reported profit 26, 75g
underlying/reported profit 75j
Glossary 529
541
Table of Contents
HSBC HOLDINGS PLC
Shareholder Information(continued)
accounting terms and US equivalents 525
Going concern 334
Goodwill
accounting policy 55, 398
and intangible assets 463
Governance codes 316
Group Audit Committee 319
Group CEO’s Business Review 8
Group Chairman’s Statement 4, (letter) 301
Group Management Board 318
Group Remuneration Committee 329, 347
Group Risk Committee 323
Growing HSBC 19
H
Health and safety 336
Held for sale 52, 78, 117, 471
Highlights 1
History and development of HSBC 524d
Hong Kong
balance sheet data 91, 431
collateral 164-167
constant currency/reported reconciliation 90a, 178
customer accounts 50
economic background 88, 90b
lending 140-142, 147, 149, 153, 157, 158, 163-167, 172, 181
loan impairment charges/allowances 169, 170
pension plans 248, 279
principal operations 88
profit/(loss) 88, 89, 91, 428
regulation and supervision 122k
review of performance 88, 90b
risk-weighted assets 79
underlying/reported profit 90d
HSBC Finance
foreclosures 151
funding 211
loan modifications 158
share plans 338
underlying/reported reconciliation 75b
HSBC Holdings plc
balance sheet 379; cash flow 216, 380; credit risk 184; deferred tax 424; dividends 425; employee compensation 419; financial assets and liabilities 435, 446, 474; financial instruments not at fair value 449; liquidity and funding 216, 265; market risk 270; maturity analysis of assets and liabilities 491; net income from financial instruments 406; share plans 363; statement of changes in equity 381; structural foreign exchange exposures 493; subordinated liabilities 484
I
Impairment
accounting policy 54, 389
allowances 168, 172
assessment 258
charges 28, 41, 44g
constant currency/reported reconciliation 177
goodwill 55
impaired loans and advances 143, 162
losses as percentage of loans and advances 176
methodologies 186, 260
movement by industry and geographical region 163, 172
Income statement (consolidated) 29, 44a, 372
Information on HSBC (availability thereof) 520
Insurance
accounting policy 402
balance sheet of manufacturing subsidiaries 235
claims incurred (net) and movements in liabilities to policyholders 40, 44f, 407
economic/non-economic assumptions 245
in 2012 233
liabilities under contracts issued 242, 475
net earned premiums 38, 44f, 407
products 273
PVIF business 124
risk management 125, 233, 273
Interest income/expense (net) 33, 44b, 406
accounting policy 387
average balance sheet 33, 49a
changes 49h, 49i
sensitivity 223, 225, 269
Interest rate derivatives 480
Interim management statements 518
Interim results 518
Internal control 332
Internet crime 135
IFRSs and Hong Kong Financial Reporting Standards
comparison 383
Investment properties 39, 236, 399, 468
Investor relations 519
J
Joint ventures 43, 460
K
Key performance indicators 22
L
Latin America 115, 431
balance sheet data 115, 431
collateral 164-167
constant currency/reported reconciliation 114a, 178
customer accounts 50
economic background 111, 114b
lending 140-142, 147, 149, 153, 157, 158, 163-167, 172, 181
loan impairment charges/allowances 169, 170
principal operations 111
profit/(loss) 111, 115, 428
profit/(loss) by country 112
review of performance 111, 114b
risk-weighted assets 79
underlying/reported profit 114b
Lease commitments 501
accounting policy 399
Legal
proceedings and regulatory matters 122a, 506
risk 271
Leveraged finance transactions 190
Liabilities 47
average balance sheet 33
by geographical region 431
constant currency/reported reconciliation 48
deferred tax 422
five years 45
interest-bearing 49f
maturity analysis 485
of disposal groups 475
other 475
retirement benefit 413
subordinated 480
trading 473
Life insurance business 234, 273, 477
Liquidity and funding 203
assets 206
in 2012 204
insurance 242, 277
management of risk 124, 261
net contractual cash flows 207
policies and procedures 261
primary sources of funding 261
regulation 216
Loans and advances 2, 139, 144, 179
accounting policy 389
by country 182
collateral 163
concentration of exposure 178
credit quality of 142
542
Table of Contents
HSBC HOLDINGS PLC
Shareholder Information(continued)
delinquency in the US 152
impairment 2, 162
maturity and interest sensitivity 491
past due but not impaired 156
renegotiated 158
to banks 49a, 49h
by geographical region 167, 182
to customers 49b, 49h
by industry sector and geographical region 153, 158, 179, 181
write-off 259
M
Madoff 122b, 507
Management’s assessment of internal controls over
financial reporting 117a
Market Capitalisation 3
Market risk 125, 217, 265
in 2012 218
insurance 239, 275
sensitivity analysis 266
Maturity analysis of assets and liabilities 485
Maximum exposure to credit risk 139, 144, 184
Memorandum and Articles of Association 524c
Middle East and North Africa
balance sheet data 102, 431
collateral 164-167
constant currency/reported reconciliation 101a, 178
customer accounts 50
economic background 99, 101b
lending 140-142, 147, 149, 153, 157, 158, 163-167, 172, 181
loan impairment charges/allowances 169, 170
principal operations 99
profit/(loss) 99, 102, 428
profit/(loss) by country 100
review of performance 99, 101b
risk-weighted assets 79
underlying/reported profit 101d
Model risk 136
Money market funds 505
Monoline insurers 189
Mortgages
lending 148, 150
mortgage-backed securities 122c, 184, 259
US mortgage-related investigations 508
N
Nature of trading market 524b
Nomination Committee 329
Non-controlling interests 494
Non-GAAP measures 25
Non-interest income
accounting policy 387
Non-life insurance business 234, 273, 476
Non-money market investment funds 505
Non-trading portfolios 221, 268
Non-statutory accounts 515
North America
balance sheet data 108, 431
collateral 164-167
constant currency/reported reconciliation 107a, 178
customer accounts 50
economic background 104, 107b
lending 140-142, 147, 149, 153, 158, 163-167, 172, 181
loan impairment charges/allowances 169, 170
mortgage lending 150
pension plans 249, 280
personal lending 151
principal operations 104
profit/(loss) 104, 108, 428
profit/(loss) by country 105
review of performance 105, 107b
risk-weighted assets 79
underlying/reported profit 107e
Notable items 31, 32
O
Operating expenses 28, 42, 44h, 85
Operating income 2, 39, 44f
Operating profit 408
Operating model 15
Operational risk 125, 227, 270
in 2012 228
losses/incidents 229, 230
Ordinary shares 45
Organisational structure chart 521
Other 74, 75h, 75k, 432
Outlook 7, 11
P
Payment protection insurance 479
Pension plans
accounting policy 400
defined benefit plans 246, 269, 365, 413, 415
for directors 365
risk 126, 224, 246, 279
Performance 9, 81, 85b, 88, 90b, 94, 96b, 99, 101b, 105, 107b, 111, 114b, 348
Personal lending 130, 140, 147, 164
Pillar I, II and III 295
Ping An 472
Preference shares 340
Preferred securities 480
Principal activities 13
Products and services 60, 427
Profit before tax
by country 82, 88, 94, 100, 105, 112
by geographical region 79, 81, 88, 97, 99, 104, 111, 428
by global business 58, 76, 86, 91, 97, 102, 108, 115
consolidated 29, 372
constant currency/reported reconciliation 26
data 2
underlying 2
underlying/reported reconciliation 44a
Property plant and equipment 118, 467
accounting policy 399
Provisions 478
accounting policy 57, 402
Prudential and other regulatory developments 122o
PVIF 243
R
Ratios
advances to core funding 23; capital 2; core tier 1 (CET 1) 2, 23; cost efficiency 2, 23, 43; credit coverage 2; customer accounts 2; dividend payout 29; dividends per share 2; earnings per share 2, 23, 29; earnings to fixed charges 53a; key performance indicators 22; net assets per share 2, 45; performance 2; risk adjusted revenue growth 24; return on average ordinary shareholders’ equity 2, 23, 29; return on average total assets 29; stressed coverage ratios, 205, 262; total equity 2
Reconciliation of reported and underlying items 28
Reconciliation of RoRWA 52
Redenomination risk 201
Regulation and supervision 122h
Regulatory reform 5
Related party transactions 512
Remuneration
clawback 353; committee 329; in 2012 354; key metrics 348; letter 347; ; members 349; policy 336, 351; report 347; reward strategy 335, 347 ; structure 347; variable pay pool 348, 352
Renegotiated loans 158, 254
Representations and warranties 191
Repricing gap 226
Reputational risk 126, 246, 278
543
Table of Contents
HSBC HOLDINGS PLC
Shareholder Information(continued)
Rest of Asia-Pacific
balance sheet data 97, 431
collateral 164-167
constant currency/reported reconciliation 178
customer accounts 50
economic background 73, 96b
lending 140-142, 147, 149, 153, 157, 158, 163-167, 172, 181
loan impairment charges/allowances 169, 170
principal operations 93
profit/(loss) 93, 97, 428
profit/(loss) by country 94
review of performance 95, 96b
underlying/reported profit 96d
Restructuring HSBC 18
Retail Banking and Wealth Management 60, 62, 204, 432
constant currency/reported profit 26, 75a
underlying/reported profit 75i
Revenue 28
Reward 335
Risk
appetite 126; business activities 20; business operations 134; capital 293; committee 323; compliance 125, 230, 271; contingent liquidity 208, 265; counterparty 284; credit 124, 137, 240, 252, 283, 296; credit spread 221, 277; cross-currency 265; description 124; dispute 134; economic 131; elements in the loan portfolio 191a; eurozone 192; factors 20; fiduciary 126, 231, 273: financial (insurance) 238, 275; foreign exchange 225; gap risk 268; geopolitical 131; governance 252; information security 136; insurance operations 125, 232, 233, 273; interest rate 222; internet crime 135; legal 271; liquidity and funding 124, 205, 261, 273; management of 124; market 125, 239, 265, 275; model 136; operational 125, 227, 270; pension 126, 224, 246, 279; policies and practices 252; profile 123, 126; redenomination 201; regulatory 132; reputational 126, 246, 278; scenario stress testing 127; security and fraud 271; sustainability 126, 249, 280, 332; systems 272; top and emerging 22, 130, 325; vendor 272
Risk-weighted assets 2, 59, 79, 294, 296
movement in 2012 282
RoRWA (reconciliation of measures) 52
Run-off portfolios 52, 78, 117
S
Sale and repurchase agreements
accounting policy 395
Section 13(r) of the Securities Exchange Act 122r
Securities litigation 122a, 506
Securitisations 184, 259, 505
Security and fraud risk 271
Segmental analysis 426
accounting policy 388
Senior management
biographies 308, 309
emoluments 366
Share-based payments 411
accounting policy 401
Share capital 340, 495
accounting policy 404
in 2012 342
notifiable interests in 345
ownership guidelines 359
rights and obligations 340
Share information 2, 45
Share plans
for directors 363
for employees 336
HSBC Bank Bermuda plans 338, 497
HSBC Finance plans 338, 497
HSBC France plans 337, 496
Performance Shares and Restricted Share awards 352
Share ownership guidelines 359
Shareholder (communications with) 345
profile 517
Short-term borrowings 49k
Simplifying HSBC 17
Social contribution 7
Special purpose entities 470, 502
Staff development 335
Staff numbers 42, 335
Statement of changes in equity 376
Statement of comprehensive income 373
Stock symbols 519
Strategic direction 17, 62, 65, 68, 72
Stressed coverage ratios 205, 262
Stress testing 127, 266, 293, 326
Structural banking reform 292
Structural foreign exchange exposure 222, 268
Subsidiaries 469
accounting policy 398
Supplier payment policy 344
Sustainability
committee governance risk 330
risk 126, 249, 280
Systemically important banks 291
Systems risk 272
T
Tax
accounting policy 57, 400
deferred tax 422
expense 44, 44i
of shares and dividends 522
reconciliation 421
tax and broker-dealer investigations 122f, 511
Tier 1 capital (core) 282
Total shareholder return 2, 358
Trading assets 145, 178, 268, 436
accounting policy 393
Trading income (net) 36, 44d
Trading liabilities 473
accounting policy 393
Trading portfolios 218, 220
U
UK regulation and supervision 122h
UK regulatory reform 291
Underlying performance 26
US regulation and supervision 122l
V
Value at risk 219, 266
Values (HSBC) 13
Vendor risk management 272
Vision (HSBC) 13
W
Wholesale funding 205, 210, 264
Wholesale lending 141, 152
544
Table of Contents
HSBC HOLDINGS PLC
Shareholder Information(continued)
HSBC HOLDINGS PLC
Incorporated in England on 1 January 1959 with limited liability under the UK Companies Act
Registered in England: number 617987
REGISTERED OFFICE AND
GROUP HEAD OFFICE
8 Canada Square
London E14 5HQ
United Kingdom
Telephone: 44 020 7991 8888
Facsimile: 44 020 7992 4880
Web: www.hsbc.com
REGISTRARS
Principal Register
Computershare Investor Services PLC
The Pavilions
Bridgwater Road
Bristol BS99 6ZZ
United Kingdom
Telephone: 44 0870 702 0137
Email: via website
Web: www.investorcentre.co.uk/contactus
Hong Kong Overseas Branch Register
Computershare Hong Kong Investor Services Limited
Rooms 1712-1716, 17th floor
Hopewell Centre
183 Queen’s Road East
Hong Kong
Telephone: 852 2862 8555
Email: hsbc.ecom@computershare.com.hk
Web: www.computershare.com/hk/investors
ADR Depositary
The Bank of New York Mellon
Depositary Receipts
P.O. Box 43006
Providence, RI 02940-3006
USA
Telephone (US): 1 877 283 5786
Telephone (International): 1 201 680 6825
Email: shrrelations@bnymellon.com
Web: www.bnymellon.com/shareowner
Bermuda Overseas Branch Register
Investor Relations Team
HSBC Bank Bermuda Limited
6 Front Street
Hamilton HM11
Bermuda
Telephone: 1 441 299 6737
Email: hbbm.shareholder.services@hsbc.bm
Web: www.computershare.com/investor/bm
Paying Agent (France)
HSBC France
103 avenue des Champs Elysées
75419 Paris Cedex 08
France
Telephone: 33 1 40 70 22 56
Email: ost-agence-des-titres-hsbc-reims.hbfr-do@hsbc.fr
Web: www.hsbc.fr
STOCKBROKERS
Goldman Sachs International
Peterborough Court
133 Fleet Street
London EC4A 2BB
United Kingdom
HSBC Bank plc
8 Canada Square
London E14 5HQ
United Kingdom
Credit Suisse Securities (Europe) Limited
1 Cabot Square
London E14 4QT
United Kingdom
545
Table of Contents
Item 19. Exhibits
Documents filed as exhibits to this Form 20-F:
Exhibit Number | Description | |
| 1.1 | Memorandum and Articles of Association of HSBC Holdings plc (incorporated by reference to Exhibit 1.1 to HSBC Holdings plc’s Form 20-F filed with the Securities and Exchange Commission on March 8, 2011). | |
| 2.1 | The total amount of long-term debt securities of HSBC Holdings plc authorized under any instrument does not exceed 10 percent of the total assets of the Group on a consolidated basis. HSBC Holdings plc hereby agrees to furnish to the Commission, upon its request, a copy of any instrument defining the rights of holders of long-term debt of HSBC Holdings plc or of its subsidiaries for which consolidated or unconsolidated financial statements are required to be filed. | |
| 4.1 | Service Agreement dated February 14, 2011 between HSBC Holdings plc and Douglas Jardine Flint (incorporated by reference to Exhibit 4.1 to HSBC Holdings plc’s Form 20-F filed with the Securities and Exchange Commission on March 8, 2011). | |
| 4.2 | Service Agreement dated February 4, 2011 between HSBC Holdings plc and Iain Mackay (incorporated by reference to Exhibit 4.4 to HSBC Holdings plc’s Form 20-F filed with the Securities and Exchange Commission on March 8, 2011). | |
| 4.3 | Service Agreement dated February 10, 2011 between HSBC Asia Holdings B.V. and Stuart Gulliver (incorporated by reference to Exhibit 4.7 to HSBC Holdings plc’s Form 20-F filed with the Securities and Exchange Commission on March 8, 2011). | |
| 4.4 | Deferred Prosecution Agreement dated December 11, 2012, between HSBC Holdings plc, HSBC Bank USA, N.A., HSBC North America Holdings, Inc., the United States Department of Justice, the United States Attorney’s Office for the Eastern District of New York and the United States Attorney’s Office for the Northern District of West Virginia (incorporated by reference to Exhibit 99.1 to HSBC Holdings plc’s Form 6-K filed with the Securities and Exchange Commission on December 12, 2012). | |
| 4.5 | Consent to the Assessment of a Civil Money Penalty dated December 11, 2012, of the United States Department of Treasury Financial Crimes Enforcement Network in the Matter of HSBC Bank USA, N.A. (incorporated by reference to Exhibit 99.2 to HSBC Holdings plc’s Form 6-K filed with the Securities and Exchange Commission on December 12, 2012). | |
| 4.6 | Undertaking by HSBC Holdings plc to the Financial Services Authority (incorporated by reference to Exhibit 99.3 to HSBC Holdings plc’s Form 6-K filed with the Securities and Exchange Commission on December 12, 2012). | |
| 4.7 | Deferred Prosecution Agreement between HSBC Holdings plc and the District Attorney of the County of New York (incorporated by reference to Exhibit 99.4 to HSBC Holdings plc’s Form 6-K filed with the Securities and Exchange Commission on December 12, 2012). | |
| 4.8 | Cease and Desist Order issued by the Board of Governors of the United States Federal Reserve System in the Matter of HSBC Holdings plc (incorporated by reference to Exhibit 99.5 to HSBC Holdings plc’s Form 6-K filed with the Securities and Exchange Commission on December 12, 2012). | |
| 4.9 | Order of Assessment of a Civil Money Penalty Issued Upon Consent Issued by the Board of Governors of the U.S. Federal Reserve System in the Matter of HSBC Holdings plc and HSBC North America Holdings, Inc. (incorporated by reference to Exhibit 99.6 to HSBC Holdings plc’s Form 6-K filed with the Securities and Exchange Commission on December 12, 2012). | |
| 4.10 | Settlement Agreement between HSBC Holdings plc, and the United States Department of the Treasury’s Office of Foreign Assets Control (incorporated by reference to Exhibit 99.7 to HSBC Holdings plc’s Form 6-K filed with the Securities and Exchange Commission on December 12, 2012). | |
| 4.11 | Consent Order dated December 11, 2012, of the Comptroller of the Currency of the United States in the Matter of HSBC Bank USA, N.A. (incorporated by reference to Exhibit 99.8 to HSBC Holdings plc’s Form 6-K filed with the Securities and Exchange Commission on December 12, 2012). | |
| 4.12 | Consent Order for the Assessment of a Civil Money Penalty dated December 11, 2012, of the Comptroller of the Currency of the United States in the Matter of HSBC Bank USA, N.A. (incorporated by reference to Exhibit 99.9 to HSBC Holdings plc’s Form 6-K filed with the Securities and Exchange Commission on December 12, 2012). | |
| 4.13 | Agreement by and between HSBC Bank USA, N.A. McLean, Virginia and the Office of the Comptroller of the Currency dated December 11, 2012 (incorporated by reference to Exhibit 99.10 to HSBC Holdings plc’s Form 6-K filed with the Securities and Exchange Commission on December 12, 2012). | |
| 7.1 | Computation of ratios of earnings to combined fixed charges (and preference share dividends). | |
| 8.1 | Subsidiaries of HSBC Holdings plc (set forth in Note 25 to the consolidated financial statements included in this Form 20-F). | |
| 12.1 | Certificate of HSBC Holdings plc’s Group Chief Executive pursuant to Section 302 of the Sarbanes-Oxley Act of 2002. | |
| 12.2 | Certificate of HSBC Holdings plc’s Group Finance Director pursuant to Section 302 of the Sarbanes-Oxley Act of 2002. | |
| 13.1 | Annual Certification of HSBC Holdings plc’s Group Chief Executive and Group Finance Director pursuant to Section 906 of the Sarbanes-Oxley Act of 2002. | |
| 15.1 | Consent of KPMG Audit plc. | |
Table of Contents
Exhibit Number | Description | |
| 15.2 | Pages of HSBC Holdings plc’s 2000 Form 20-F/A dated February 26, 2001 relating to the Memorandum and Articles of Association of HSBC Holdings plc (incorporated by reference to Exhibit 14.2 to HSBC Holdings plc’s Form 20-F filed with the Securities and Exchange Commission on March 20, 2006). | |
| 15.3 | Pages of HSBC Holdings plc’s 2001 Form 20-F dated March 13, 2002 relating to the Memorandum and Articles of Association of HSBC Holdings plc (incorporated by reference to Exhibit 14.3 to HSBC Holdings plc’s Form 20-F filed with the Securities and Exchange Commission on March 20, 2006). | |
| 15.4 | Consent of Jennifer Jakubowski. | |
| 15.5 | Consent of Wing Lui. | |
| 15.6 | Consent of CG Singer. | |
2
Table of Contents
SIGNATURES
The registrant hereby certifies that it meets all of the requirements for filing on Form 20-F and that it has duly caused and authorized the undersigned to sign this annual report on its behalf.
| HSBC Holdings plc | ||
| By: | /s/ Iain J Mackay | |
| Name: Iain J Mackay | ||
| Title: Group Finance Director | ||
Dated: 12 March 2013