As filed with the Securities and Exchange Commission on March 8, 2011.
SECURITIES AND EXCHANGE COMMISSION
WASHINGTON, D.C. 20549
FORM 20-F
| | | |
| o | | REGISTRATION STATEMENT PURSUANT TO SECTION 12(b) OR 12(g) OF THE SECURITIES EXCHANGE ACT OF 1934 |
| |
| Or |
| |
| þ | | ANNUAL REPORT PURSUANT TO SECTION 13 OR 15(d) OF THE SECURITIES EXCHANGE ACT OF 1934 |
For the fiscal year ended December 31, 2010
Or
| | | |
| o | | TRANSITION REPORT PURSUANT TO SECTION 13 OR 15(d) OF THE SECURITIES EXCHANGE ACT OF 1934 |
Or
| | | |
| o | | SHELL COMPANY REPORT PURSUANT TO SECTION 13 OR 15(d) OF THE SECURITIES EXCHANGE ACT OF 1934 |
| | | |
| | | Date of event requiring this shell company report ________ |
For the transition period from N/A to N/A
Commission file number: 1-14930
HSBC Holdings plc
(Exact name of Registrant as specified in its charter)
| | | |
|
| N/A | | United Kingdom |
| (Translation of Registrant’s name into English) | | (Jurisdiction of incorporation or organisation) |
8 Canada Square
London E14 5HQ
United Kingdom
(Address of principal executive offices)
Russell C Picot
8 Canada Square
London E14 5HQ
United Kingdom
Tel +44 (0) 20 7991 8888
Fax +44 (0) 20 7992 4880
(Name, Telephone, Email and/or Facsimile number and Address of Company Contact Person)
Securities registered or to be registered pursuant to Section 12(b) of the Securities Exchange Act of 1934:
| | | |
| Title of each class | | Name of each exchange on which registered |
| Ordinary Shares, nominal value US$0.50 each. | | London Stock Exchange |
| | | Hong Kong Stock Exchange |
| | | Euronext Paris |
| | | Bermuda Stock Exchange |
| | | New York Stock Exchange* |
| American Depository Shares, each representing 5 | | New York Stock Exchange |
| Ordinary Shares of nominal value US$0.50 each. | | |
| 6.20% Non-Cumulative Dollar Preference Shares, | | New York Stock Exchange* |
| Series A | | |
| American Depositary Shares, each representing one- | | New York Stock Exchange |
| fortieth of a Share of 6.20% Non-Cumulative Dollar | | |
| Preference Shares, Series A | | |
| 5.25% Subordinated Notes 2012 | | New York Stock Exchange |
| 6.5% Subordinated Notes 2036 | | New York Stock Exchange |
| 6.5% Subordinated Notes 2037 | | New York Stock Exchange |
| 6.8% Subordinated Notes Due 2038 | | New York Stock Exchange |
| 8.125% Perpetual Subordinated Capital Securities | | New York Stock Exchange |
| Exchangeable at the Issuer’s Option into Non- | | |
| Cumulative Dollar Preference Shares | | |
Securities registered or to be registered pursuant to Section 12(g) of the Securities Exchange Act of 1934: None
Securities for which there is a reporting obligation pursuant to Section 15(d) of the Securities Exchange Act of 1934: None
Indicate the number of outstanding shares of each of the issuer’s classes of capital or common stock as of the close of the period covered by the annual report:
Ordinary Shares, nominal value US$0.50 each 17,686,155,902
Indicate by check mark if the registrant is a well-known seasoned issuer, as defined in Rule 405 of the Securities Act.
þ Yeso No
If this report is an annual or transition report, indicate by check mark if the registrant is not required to file reports pursuant to Section 13 or 15(d) of the Securities Exchange Act of 1934.
o Yesþ No.
Indicate by check mark whether the registrant (1) has filed all reports required to be filed by Section 13 or 15(d) of the Securities Exchange Act of 1934 during the preceding 12 months (or for such shorter period that the registrant was required to file such reports), and (2) has been subject to such filing requirements for the past 90 days.
þ Yeso No
Indicate by check mark whether the registrant is a large accelerated filer, an accelerated filer, or a non-accelerated filer. See definition of “accelerated filer and large accelerated filer” in Rule 12b-2 of the Exchange Act. (Check one):
| | | | |
| | | | | |
| Large accelerated filerþ | | Accelerated filero | | Non-accelerated filero |
| | | | | (Do not check if a smaller reporting company) |
Indicate by check mark which basis of accounting the registrant has used to prepare the financial statements included in this filing:
| | | | | |
|
U.S. GAAPo | | International Financial Reporting Standards as issued by the | | Othero |
| | | International Accounting Standards Boardþ |
If “Other” has been checked in response to the previous question indicate by check mark which financial statement item the registrant has elected to follow.
o Item 17o Item 18
If this is an annual report, indicate by check mark whether the registrant is a shell company (as defined in Rule 12b-2 of the Exchange Act).
o Yesþ No
| | |
| * | | Not for trading, but only in connection with the registration of American Depositary Shares. |
Annual Report and Accounts 2010
Unless the context requires otherwise, ‘HSBC Holdings’ means HSBC Holdings plc and ‘HSBC’, the ‘Group’, ‘we’, ‘us’ and ‘our’ refers to HSBC Holdings together with its subsidiaries. Within this document the Hong Kong Special Administrative Region of the People’s Republic of China is referred to as ‘Hong Kong’. When used in the terms ‘shareholders’ equity’ and ‘total shareholders’ equity’, ‘shareholders’ means holders of HSBC Holdings ordinary shares and those preference shares classified as equity. The abbreviations ‘US$m’ and ‘US$bn’ represent millions and billions (thousands of millions) of US dollars, respectively.
The consolidated financial statements of HSBC and the separate financial statements of HSBC Holdings have been prepared in accordance with International Financial Reporting Standards (‘IFRSs’) as issued by the International Accounting Standards Board (‘IASB’) and as endorsed by the European Union (‘EU’). EU-endorsed IFRSs may differ from IFRSs as issued by the IASB if, at any point in time, new or amended IFRSs have not been endorsed by the EU. At 31 December 2010, there were no unendorsed standards effective for the year ended 31 December 2010 affecting these consolidated and separate financial statements, and there was no difference between IFRSs endorsed by the EU and IFRSs issued by the IASB in terms of their application to HSBC. Accordingly, HSBC’s financial statements for the year ended 31 December 2010 are prepared in accordance with IFRSs as issued by the IASB.
We use the US dollar as our presentation currency because the US dollar and currencies linked to it form the major currency bloc in which we transact and fund our business. Unless otherwise stated, the information presented in this document has been prepared in accordance with IFRSs.
When reference to ‘underlying’ or ‘underlying basis’ is made in tables or commentaries, comparative information has been expressed at constant currency (see page 14), eliminating the impact of fair value movements in respect of credit spread changes on HSBC’s own debt and adjusting for the effects of acquisitions and disposals. A reconciliation of reported and underlying profit before tax is presented on page 15.
The information set out in the Report of the Directors on pages 2 to 219 does not constitute the directors’ report included in the Company’s Annual Report and Accounts for the year ended 31 December 2010 under Section 415 of the Companies Act 2006 as it includes certain supplementary information and explanations.
Contents
| | |
| 1 | | Detailed contents are provided on the referenced pages. |
Report of the Directors: Overview
Overview
Headquartered in London, HSBC is one of the world’s largest banking and financial services organisations and one of the industry’s most valuable brands. We provide a comprehensive range of financial services to around 95 million customers through two customer groups, Personal Financial Services (including consumer finance), and Commercial Banking, and two global businesses, Global Banking and Markets, and Global Private Banking.
Our international network covers 87 countries and territories in six geographical regions; Europe, Hong Kong, Rest of Asia-Pacific, the Middle East, North America and Latin America.
With listings on the London, Hong Kong, New York, Paris and Bermuda stock exchanges, shares in HSBC Holdings plc are held by over 221,000 shareholders in 127 countries and territories.
Highlights
| • | | Pre-tax profit more than doubled to US$19bn on a reported basis. |
| |
| • | | Underlying pre-tax profit up by almost US$5bn or 36% to US$18.4bn. |
| |
| • | | Profitable in every customer group and region, including North America, for the first time since 2006. |
| |
| • | | Dividends declared in respect of 2010 totalled US$6.3bn, or US$0.36 per ordinary share, with a fourth interim dividend for 2010 of US$0.12 per ordinary share. |
| |
| • | | Continued capital generation – core tier 1 ratio increased to 10.5% from 9.4%. |
| |
| • | | Customer lending up 8% to US$958bn; deposits up 7% to US$1.2 trillion on an underlying basis. |
Cover theme
An evening view of the Central Elevated Walkway in Hong Kong’s business district. Used by tens of thousands of commuters every day, this walkway forms a vital artery through the heart of Asia’s pre-eminent financial centre, which hosts over 190 banks and deposit-taking companies from all over the world.
1
Report of the Directors: Overview(continued)
| | | | | |
For the year | | | | |
| | | | | |
Profit before taxation | | Underlying profit before taxation | | Total operating income |
| | | | | |
US$19,037m– up 169% | | US$18,366m– up 36% | | US$80,014m– up 2% |
| | | | | |
| 2009: US$7,079m | | 2009: US$13,482m | | 2009: US$78,631m |
| 2008: US$9,307m | | | | 2008: US$88,571m |
| | | | | |
Net operating income before loan | | | | |
impairment charges and other credit | | Profit attributable to shareholders of | | |
risk provisions | | the parent company | | |
| | | | | |
US$68,247m– up 3% | | US$13,159m– up 126% | | |
| | | | | |
| 2009: US$66,181m | | 2009: US$5,834m | | |
| 2008: US$81,682m | | 2008: US$5,728m | | |
| | | | | |
| | | | | |
| |
| Earnings per share and dividends per share | | |
| | | | | |
Earnings per share | | Dividends per share1 | | |
| | | | | |
US$0.73– up 115% | | US$0.34 | | |
| | | | | |
| 2009: US$0.34 | | 2009: US$0.34 | | |
| 2008: US$0.41 | | 2008: US$0.93 | | |
| | | | | |
| | | | | |
| |
At the year-end | | | | |
| | | | | |
Loans and advances to | | | | Ratio of customer advances to |
customers | | Customer accounts | | customer accounts |
| | | | | |
US$958bn– up 7% | | US$1,228bn– up 6% | | 78.1% |
| | | | | |
| 2009: US$896bn | | 2009: US$1,159bn | | 2009: 77.3% |
| 2008: US$933bn | | 2008: US$1,115bn | | 2008: 83.6% |
| | | | | |
| | | Average total shareholders’ equity | | |
Total equity | | to average total assets | | Risk-weighted assets |
| | | | | |
US$155bn– up 14% | | 5.5% | | US$1,103bn– down 3% |
| | | | | |
| 2009: US$136bn | | 2009: 4.7% | | 2009: US$1,133bn |
| 2008: US$100bn | | 2008: 4.9% | | 2008: US$1,148bn |
| | | | | |
| | | | | |
| |
Capital ratios | | | | |
| | | | | |
Core tier 1 ratio | | Tier 1 ratio | | Total capital ratio |
| | | | | |
| 10.5% | | 12.1% | | 15.2% |
| | | | | |
| 2009: 9.4% | | 2009: 10.8% | | 2009: 13.7% |
| 2008: 7.0% | | 2008: 8.3% | | 2008: 11.4% |
2
Report of the Directors: Overview(continued)
| | | | | |
Performance ratios | | | | |
| | | | | |
| Credit coverage ratios | | | | |
| | | | | |
Loan impairment charges to | | Loan impairment charges to | | Total impairment allowances to |
total operating income | | average gross customer advances | | impaired loans at year-end |
| | | | | |
| 16.9% | | 1.5% | | 71.6% |
| | | | | |
| 2009: 31.7% | | 2009: 2.8% | | 2009: 83.2% |
| 2008: 27.2% | | 2008: 2.5% | | 2008: 94.3% |
| | | | | | | |
| Return ratios | | | | | | |
| | | | | | | |
Return on average | | Return on average | | Post-tax return on | | Post-tax return on average |
invested capital2 | | shareholders’ equity3, | | average total assets | | risk-weighted assets |
| | | | | | | |
| 8.7% | | 9.5% | | 0.6% | | 1.3% |
| | | | | | | |
| 2009: 4.1% | | 2009: 5.1% | | 2009: 0.3% | | 2009: 0.6% |
| 2008: 4.0% | | 2008: 4.7% | | 2008: 0.3% | | 2008: 0.6% |
| | | | | | | |
| Efficiency and revenue mix ratios | | | | | | |
| | | | | | | |
| | | Net interest income to | | Net fee income to | | Net trading income to |
Cost efficiency ratio4 | | total operating income | | total operating income | | total operating income |
| | | | | | | |
| 55.2% | | 49.3% | | 21.7% | | 9.0% |
| | | | | | | |
| 2009: 52.0% | | 2009: 51.8% | | 2009: 22.5% | | 2009: 12.5% |
| 2008: 60.1% | | 2008: 48.1% | | 2008: 22.6% | | 2008: 7.4% |
| | | | | | | |
| | | | | | | |
| |
Share information at the year-end
| | | | | | | | | |
| | | | | Closing market price |
| | | | | | | | | |
US$0.50 ordinary | | Market | | | | | | American |
shares in issue | | capitalisation | | London | | Hong Kong | | Depositary Share5 |
| | | | | | | | | |
| 17,686m | | US$180bn | | £6.51 | | HK$79.70 | | US$51.04 |
| | | | | | | | | |
| 2009: 17,408m | | 2009: US$199bn | | 2009: £7.09 | | 2009: HK$89.40 | | 2009: US$57.09 |
| 2008: 12,105m | | 2008: US$114bn | | 2008: £5.77 | | 2008: HK$67.81 | | 2008: US$44.15 |
| | | | | | | | | |
| | | | | | | | | |
| | | | | Total shareholder return6
|
| | | | | |
| | | | | Over 1 year | | Over 3 years | | Over 5 years |
| | | | | | | | | |
| To 31 December 2010 | | 95.3 | | 103.4 | | 103.4 |
| Benchmarks: | | | | | | |
| – FTSE 1007 | | 112.6 | | 102.8 | | 126.3 |
| – MSCI World7 | | 115.9 | | 111.0 | | 127.0 |
| – MSCI Banks7 | | 103.7 | | 81.9 | | 79.0 |
| | |
| For footnotes, see page 83. |
3
Report of the Directors: Overview(continued)
Cautionary statement regarding
forward-looking statements
TheAnnual Report and Accounts 2010contains certain forward-looking statements with respect to HSBC’s financial condition, results of operations and business.
Statements that are not historical facts, including statements about HSBC’s beliefs and expectations, are forward-looking statements. Words such as ‘expects’, ‘anticipates’, ‘intends’, ‘plans’, ‘believes’, ‘seeks’, ‘estimates’, ‘potential’ and ‘reasonably possible’, variations of these words and similar expressions are intended to identify forward-looking statements. These statements are based on current plans, estimates and projections, and therefore undue reliance should not be placed on them. Forward-looking statements speak only as of the date they are made, and it should not be assumed that they have been revised or updated in the light of new information or future events.
Written and/or oral forward-looking statements may also be made in the periodic reports to the US Securities and Exchange Commission, summary financial statements to shareholders, proxy statements, offering circulars and prospectuses, press releases and other written materials, and in oral statements made by HSBC’s Directors, officers or employees to third parties, including financial analysts.
Forward-looking statements involve inherent risks and uncertainties. Readers are cautioned that a number of factors could cause actual results to differ, in some instances materially, from those anticipated or implied in any forward-looking statement. These include, but are not limited to:
| • | | changes in general economic conditions in the markets in which we operate, such as continuing or deepening recessions and fluctuations in employment beyond those factored into consensus forecasts; changes in foreign exchange rates and interest rates; volatility in equity markets; lack of liquidity in wholesale funding markets; illiquidity and downward price pressure in national real estate markets; adverse changes in central banks’ policies with respect to the provision of liquidity support to financial markets; heightened market concerns over sovereign creditworthiness in over-indebted countries; adverse changes in the funding status |
| | | of public or private defined benefit pensions; and consumer perception as to the continuing availability of credit and price competition in the market segments we serve; |
| • | | changes in government policy and regulation, including the monetary, interest rate and other policies of central banks and other regulatory authorities; initiatives to change the size, scope of activities and interconnectedness of financial institutions in connection with the implementation of stricter regulation of financial institutions in key markets worldwide; revised capital and liquidity benchmarks which could serve to deleverage bank balance sheets and lower returns available from the current business model and portfolio mix; imposition of levies or taxes designed to change business mix and risk appetite; the practices, pricing or responsibilities of financial institutions serving their consumer markets; expropriation, nationalisation, confiscation of assets and changes in legislation relating to foreign ownership; changes in bankruptcy legislation in the principal markets in which we operate and the consequences thereof; general changes in government policy that may significantly influence investor decisions; extraordinary government actions as a result of current market turmoil; other unfavourable political or diplomatic developments producing social instability or legal uncertainty which in turn may affect demand for our products and services; the costs, effects and outcomes of product regulatory reviews, actions or litigation, including any additional compliance requirements; and the effects of competition in the markets where we operate including increased competition from non-bank financial services companies, including securities firms; and |
| |
| • | | factors specific to HSBC, including our success in adequately identifying the risks we face, such as the incidence of loan losses or delinquency, and managing those risks (through account management, hedging and other techniques). Effective risk management depends on, among other things, our ability through stress testing and other techniques to prepare for events that cannot be captured by the statistical models it uses; and our success in addressing operational, legal and regulatory, and litigation challenges. |
3(a)
Report of the Directors: Overview(continued)
Group Chairman’s Statement
When I took on the role of Chairman less than 90 days ago, I was acutely aware of the challenges facing our industry. I was conscious too of the need to demonstrate to all of our stakeholders that HSBC understands the responsibilities that accompany the systemic significance which continued success has built for HSBC in many of the markets in which we operate, not least those in Asia, given their historical significance to the Group. 145 years after we were founded, Hong Kong and the rest of Asia remain at the heart of HSBC’s strength and identity and our commitment to the region is unwavering.
I fully acknowledge that our scale, the trust that our depositors place in us and our relevance to our personal and corporate clients – for their financing, banking, investment and risk management needs – all depend upon our maintaining our reputation and our integrity.
I also understand how important it is for you, our shareholders, that HSBC builds sustainable long-term value that is reflected through the share price and rebuilds, as quickly as competing regulatory demands allow, the dividend that was reduced during the financial crisis.
I firmly believe that HSBC has the people, the financial strength and the organisational structure best able to deliver all of the above and it is a privilege to have the opportunity to serve as Group Chairman as we enter a fresh chapter in our history.
Before I go any further, I want to pay tribute to both Stephen Green and Michael Geoghegan, who stepped down at the end of last year from their roles as Group Chairman and Group Chief Executive after, respectively, 28 and 37 years’ service to HSBC. It fell to them to be at the helm as HSBC
navigated its way through the worst financial crisis since the 1930s. Mike led from the front in addressing the problems in our consumer finance subsidiary in the United States and in reshaping HSBC’s organisational structure and operational practices in order to better and more efficiently serve an increasingly interconnected world. Stephen’s personal reputation for integrity and probity stood out and distinguished HSBC during a period of intense disaffection with the banking industry. For their contribution over many years we owe them a deep debt of gratitude and wish them both well.
The Group Chief Executive’s Business Review sets out clearly how HSBC delivered a much improved balance of profits in 2010. It is reassuring to see our Personal Financial Services businesses returning to profitability in aggregate and Commercial Banking growing significantly, largely in emerging markets. These achievements augmented another year of strong performance in Global Banking and Markets.
Earnings per share improved strongly, rising by 115% to reach US$0.73 per share.
The Group’s capital position also strengthened with the core tier 1 ratio, the ratio most favoured by regulators as it comprises equity capital after regulatory adjustments and deductions, increasing from 9.4% to 10.5%, largely due to profit retention throughout the year.
As a consequence of this strong capital generation, together with greater clarity on the direction of regulatory reform of capital requirements and an improving economic backdrop in the developed world – particularly in the United States – the Board has approved increases in both the final dividend payment in respect of 2010 and the planned quarterly dividends for 2011. The final dividend for 2010, payable on 5 May 2011 to shareholders on the register on 17 March 2011, will be 12 cents per ordinary share, up from 10 cents at the same point last year. For the remainder of 2011 we plan to pay quarterly dividends of nine cents for each of the first three quarters compared with eight cents in respect of the equivalent quarters of 2010.
We enter 2011 with a new leadership team, but only in the sense of changed roles. Everyone has worked together over many years and there is immense experience to draw on both from within HSBC and from earlier careers at peer organisations. Stuart Gulliver is leading the management team as Group Chief Executive. His clear objective is to deliver
4
Report of the Directors: Overview(continued)
sustainable long-term value for shareholders consistently in a manner that maintains the confidence of all other key stakeholders in our businesses including depositors, counterparties, long-term creditors, customers, employees, regulators and governments. His review on pages 7 to 9 gives an insight into his immediate priorities.
Everything we do is governed by the imperative of upholding HSBC’s corporate reputation and character at the highest level and adding further strength to our brand; we deeply regret that a number of weaknesses in regulatory compliance were highlighted in 2010 and we are resolved to remedy these and reinforce the high standards we demand of ourselves.
For my part, I shall be focusing on engaging at the highest level in the regulatory reform debates that will, in large part, shape our future. I shall also lead the Board in the stewardship and review of performance of our financial and human resources.
In the interest of full transparency, we have today published on our website the respective roles and responsibilities of the Group Chairman, the Deputy Chairman and Senior Independent Director and the Group Chief Executive.
I have already paid tribute to the contributions of Stephen Green and Michael Geoghegan. Vincent Cheng has indicated that he will step down at the next AGM and on behalf of the Board I want to thank him for his immense contribution in many roles over 33 years. Vincent will retain an association with the Group by taking on an advisory role to the Group Chief Executive on regional matters. Laura Cha will join the Board on 1 March; Laura has been Deputy Chair of The Hongkong and Shanghai Banking Corporation Limited for four years and brings a wealth of experience of China; fuller details of her background and experience are set out in the Directors’ Report.
There was much progress made during 2010 on the regulatory reform agenda. Although there is still a great deal to do, the shape of capital requirements was broadly clarified and an implementation timetable stretching out to 2019 was agreed to allow time for the industry to adjust progressively. A minimum common equity tier 1 ratio of 7%, including a capital conservation buffer, has been agreed. HSBC already meets this threshold requirement. The Group Chief Executive’s Business Review addresses how these revised requirements
will impact our targeted return on equity.
During 2011, the debate will be dominated by consideration of the calibration of minimum liquidity standards. Although it is clear that liquidity and funding weaknesses were key elements contributing to the crisis, HSBC agrees with the industry consensus that the revised requirements in these areas are overly conservative and could lead to unnecessary deleveraging at a time of fragile economic recovery in much of the developed world. It will be a near impossibility for the industry to expand business lending at the same time as increasing the amount of deposits deployed in government bonds while, for many banks but not HSBC, reducing dependency on central bank liquidity support arrangements. It is to be hoped that the observation period, which starts this year and precedes the formal introduction of the new requirements, will inform a recalibration of these minimum liquidity standards.
A second debate of importance to HSBC’s shareholders in 2011 will concern the designation of ‘Systemically Important Financial Institutions’ (‘SIFI’s). Consideration is being given in the regulatory community to mandating higher capital requirements, together with more intense supervision, for institutions classified as SIFIs. We agree with heightened supervision but it is not clear that the reduced shareholder returns that would follow the imposition of incremental capital would be compensated for by improved stability. Classification as a SIFI with a requirement to hold incremental capital would, however, probably lead others to favour SIFIs as counterparties, and may therefore have the unintended consequence of further concentrating the industry.
HSBC’s position is that systemic importance should not be determined by size alone. It is clear, however, that, on almost any basis, HSBC would be classified as systemically important. For this reason we are engaging fully in the debate around the consequences of designation as a SIFI. In particular, we draw attention to the benefits of our corporate organisation through separate subsidiaries in mitigation against the imposition of incremental capital for SIFIs based on size alone.
In October 2010, the UK government confirmed its intention to raise the sum of £2.5bn (US$3.9bn) through a levy on bank balance sheets, and recently announced it will accelerate the full impact of this levy to 2011. We take no issue with the right of the UK government to raise a levy on the banking industry, particularly when having had to risk taxpayers’ money to rescue a number of important UK institutions. However, as the proposed levy is to
5
Report of the Directors: Overview(continued)
be applied to the consolidated balance sheet, it applies beyond the legal boundary of the domestic institution to include overseas operations conducted through separately capitalised subsidiaries. This therefore constitutes an additional cost of basing a growing multinational banking group in the UK.
We intend to clarify in each set of results going forward the impact of the levy, split between UK and overseas operations, and Stuart Gulliver covers this in more detail in his review. We regard the levy, which is not tax deductible, as akin to a distribution of profits. For this reason, we intend to add to future shareholder dividends that would otherwise be paid, any amount saved in the event that the levy is restructured or relieved in due course.
The role of banks in society
The recent crisis has caused a proper introspection as to the role that banks play in society and at HSBC we welcome this. Banking is not simply about money. It is about helping individuals and organisations within society to meet personal and corporate objectives by facilitating access to financial capital and protecting value for those who make capital available. Payment mechanisms, the provision of long-term credit, trade finance, hedging and other risk management products, deposit, investment and retirement services are but a few of the activities through which banking groups contribute to today’s financial system. Society cannot function without an effective financial system that delivers value to those it serves at an intermediation cost that is proportionate to the value created. Somehow, many participants and not just banks, lost sight of this basic principle in the run-up to the recent financial crisis and the consequences for all have, inevitably, been far reaching. There is no doubt that the scale of regulatory reform will bring many challenges, but it will also open new opportunities.
At HSBC, we shall not forget what happened to precipitate the scale of reform now underway. Although the financial turmoil arising from the events of 2007-2008 has largely moderated, in large part as a result of co-ordinated government action and support to the financial system, we enter 2011 with humility, ready to apply right across HSBC all of the lessons learned, notwithstanding that HSBC itself neither sought nor received support from any government.
Society has a right to ask if banks ‘get it’. At HSBC, we do – and we are focused on embedding the necessary changes in our business model for long-term sustainable value creation. But we also do not forget that value creation depends upon HSBC recruiting, training and retaining the right talent in
order to manage the risks we accept through intermediating customer flows; design solutions to address complex financial problems; build enduring relationships with core customers; build confidence in the Group’s financial strength; and create the strategic options that offer the next generation fresh opportunities to continue building sustainable value.
In this globalised world, there is intense competition for the best people and, given our long history within and connections into the faster-growing developing markets, our best people are highly marketable. It would be irresponsible to allow our comparative advantages to wither by ignoring the market forces that exist around compensation, even though we understand how sensitive this subject is. Reform in this area can only be achieved if there is concerted international agreement on limiting the quantum of pay as well as harmonising pay structures but there appears to be no appetite to take the initiative on this. Our duty to shareholders is to build sustainable value in the economic and competitive environment in which we operate and our principal resource for achieving this is human talent. Under the governance of the Board, we will continue to operate and apply remuneration policies and practices that take full recognition of best practice and are aligned with the long-term interests of shareholders.
Finally, I want to pay tribute to my 307,000 colleagues. So many of HSBC’s people have exemplified commitment and endeavour again in 2010, helping our customers and clients to meet their financial objectives while taking on the additional burden of preparing for regulatory change. This has been done against a backdrop of continuing broad-based fiscal support to many economies, with public opinion consistently and highly critical of our industry. As I look forward, it is the combination of the capabilities of HSBC’s people, their determination to do the right thing for our customers and their deep sense of responsibility to the communities they serve that makes me confident that HSBC will play a leading role in rebuilding the trust that our industry has lost and, by doing so, will build sustainable value for you, our shareholders.
D J Flint,Group Chairman
28 February 2011
6
Report of the Directors: Overview(continued)
Group Chief Executive’s
Business Review
Underlying financial performance continued to improve in 2010 and shareholders continued to benefit from HSBC’s universal banking model. All regions and customer groups were profitable, as Personal Financial Services and North America returned to profit. Commercial Banking made an increased contribution to underlying earnings and Global Banking and Markets also remained strongly profitable, albeit behind 2009’s record performance, reflecting a well-balanced and diversified business.
Credit experience continued to improve, as a result of a stronger global economy and our actions to reduce balance sheet risk. As a globally-connected bank with a growing presence across the world’s faster-growing regions, HSBC also benefited from higher trade volumes and strong momentum in emerging economies, especially in Asia. Asia contributed the largest proportion to underlying pre-tax profits, while the contributions made by Latin America and the Middle East also increased. Together with our conservative management of the balance sheet, this improved performance allowed us to concentrate on serving our customers and to further strengthen our capital position.
Group performance headlines1
| • | | Profit before tax improved year on year. On a reported basis, profits increased by nearly US$12bn from US$7.1bn to US$19bn. On an underlying basis, profits increased by 36%, or almost US$5bn, from US$13.5bn to US$18.4bn. |
| | |
| 1 | | All figures are discussed on a reported basis and all references to profits are profits before tax unless otherwise stated. |
| • | | In a period of sustained low interest rates, revenues remained constrained, reflecting four principal factors: reducing loan balances in our US business; lower trading income in Global Banking and Markets resulting from lower client activity; adverse fair value movements on non-qualifying hedges; and a reduced contribution from Balance Sheet Management in line with earlier guidance. |
| |
| • | | Strong asset growth in Commercial Banking, particularly in Asia, higher trade-related revenues generally, and expansion of our wealth management business, again most notably in Asia, partially offset these revenue pressures. |
| |
| • | | Loan impairment charges reduced by almost half to US$14.0bn. All regions and customer groups improved. The US experienced the greatest improvement, largely in the cards and consumer finance portfolios. Loan impairment charges also declined significantly in Latin America and the Middle East. |
| |
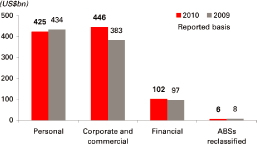
| • | | In Global Banking and Markets, loan impairment charges fell significantly, notably in Europe as economic conditions improved. Credit risk provisions reduced by US$1bn to US$0.4bn in the available-for-sale asset-backed-securities portfolios due to a slowing in the rate of anticipated losses on underlying assets, in line with previous guidance. The associated available for sale reserve declined to US$6.4bn from US$12.2bn. |
| |
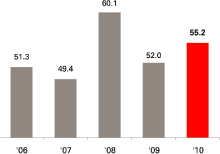
| • | | The cost efficiency ratio rose to 55.2%, which is above our target range and unacceptable to me. The causes were constrained revenues and, in part, investment in strategic growth initiatives across the business together with higher staff costs. It additionally reflected one-off payroll taxes of US$0.3bn paid in 2010 in respect of the previous year and a pension accounting credit of US$0.5bn in 2009 and US$0.1bn in 2010. However, it is also clear that we need to re-engineer the business to remove inefficiencies. |
| |
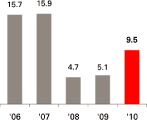
| • | | Return on average total shareholders’ equity rose from 5.1% to 9.5%, reflecting increased profit generation during the year. |
| |
| • | | HSBC continued to grow its capital base and strengthen its capital ratios further. The core tier 1 ratio increased from 9.4% to 10.5%, as a result of capital generation and lower risk weighted assets. |
7
Report of the Directors: Overview(continued)
| • | | Total loans and advances to customers increased by 7% to US$958bn while deposits rose by 6% to US$1.2 trillion. |
Impact of the evolving regulatory
environment on the business
Much of the detail around the potential impact of change for banks remains uncertain. However, analysis of what we know confirms that our ability to generate capital and manage our risk-weighted assets positions HSBC strongly – and competitively – within the industry as the pace of change intensifies.
HSBC fully supports the rationale of the Basel III proposals which require banks to hold more capital. This is absolutely core to ensuring that governments and taxpayers are better protected in future than they have been in the past.
Certain aspects of the Basel III rules remain uncertain as to interpretation and application by national regulators. Notably, this includes any capital requirements which may be imposed on the Group over the implementation period in respect of the countercyclical capital buffer and any additional regulatory requirements for SIFIs. However, we believe that ultimately the level for the common equity tier 1 ratio of the Group may lie in the range 9.5 to 10.5%. This exceeds the minimum requirement for common equity tier 1 capital plus the capital conservation buffer.
We have estimated the pro forma common equity tier 1 ratio of the Group based on our interpretation of the new Basel III rules as they will apply from 1 January 2019, based on the position of the Group at year-end 2010. The rules will be phased in from 2013 with a gradual impact and we have estimated that their full application, on a proforma basis, would result in a common equity tier 1 ratio which is lower than the Basel II core tier 1 ratio by some 250–300 basis points. The changes relate to increased capital deductions, new regulatory adjustments and increases in risk-weighted assets. However, as the changes will progressively take effect over six years leading up to 2019 and as HSBC has a strong track record of capital generation and actively manages its risk-weighted assets, we are confident in our ability to mitigate the effect of the new rules before they come into force.
Last year, HSBC committed to reviewing its target shareholder return on equity once the effects of new regulation became clearer. Now that we have better visibility on the impact of increased capital requirements, we believe that higher costs of the
evolving regulatory framework will, all other things being equal, depress returns for shareholders of banks. We will therefore target a return on average shareholders’ equity of 12-15% in the future.
As Group Chief Executive, it is right that, in managing the business and developing Group strategy, my principal office should be in Hong Kong – a global financial hub of growing importance at the centre of HSBC’s strategically most important region. However, the company is headquartered in London and we hope to remain there. London’s pre-eminence as an international financial services centre is widely recognised and well-deserved and reflects successful government policy over decades to build that position. It is therefore important to us that the UK’s competitive position is protected and sustained. Appropriate supervision is an important part of the larger equation. Policymakers should continue to legislate and regulate, but they must not destroy London’s competitive position in the process.
As the Group Chairman has outlined, new legislation is expected to be enacted in the UK, effective from the start of 2011, one curious consequence of which is an explicit incremental cost of being headquartered in the UK for any global bank. Had this been applied for 2010, this annual charge would have amounted to approximately US$0.6bn in HSBC’s case. Moreover, the overseas balance sheet would account for the majority of the annual charge, with the UK balance sheet accounting for approximately one third of the total.
We have been closely watching events unfold in parts of the Middle East and North Africa. Our primary concern is for the security of our 12,000 staff across the region and we continue to work to ensure their safety. We have also activated robust continuity plans so that we can also stay open for business and support the needs of our customers. As a strongly capitalised global bank, HSBC’s financial performance has not been materially affected by events to date. HSBC has been present in the Middle East for more than 50 years and we remain absolutely committed to its future. We also believe that the region’s economies have a number of structural strengths which leave us positive on the longer-term outlook.
In the short term, risks to global growth remain, not least from an elevated oil price. We therefore expect cyclical volatility to continue – including in emerging markets – and progress is unlikely to be linear. In the longer term, we believe that growth
8
Report of the Directors: Overview(continued)
rates in many Western markets will continue to significantly underperform those of the emerging world. Emerging markets are no longer simply leading the recovery from a Western crisis; the growth gap has become a sustained secular trend.
The global economy’s structural position also requires fundamental readjustment. Many Western economies must still deal with a large overhang of household and government debt and weak growth and high unemployment will make this a slow and painful process. As faster-growing nations seek to limit the effect of Western monetary policy on their own economies, we cannot discount the risk of increased tension over exchange rate and trade issues.
HSBC’s balance sheet remains strongly positioned to benefit from future interest rate rises. We are realistic that, in many developed countries at least, historically low rates may continue to constrain income growth in the near-term. Nevertheless, maintaining a conservative liquidity position is core to our proposition and to our funding strength. In our risk appetite statement approved by the Board we have set a maximum advances-to-deposits ratio for the Group of 90%. This underlines our continuing commitment to a high level of liquidity and reflects our philosophy that HSBC should not be reliant on wholesale markets for funding. Even with a ratio currently slightly below 80%, we have capacity for further lending growth.
In the short-term, we expect the benefits of asset growth achieved in 2010 to continue to flow into revenues. In the medium-term, we will continue to target growth in the most strategically attractive markets for HSBC and build our capabilities in connectivity, one of our distinctive strengths as a globally-connected bank.
At the same time, with demand in many developed markets constrained and interest spreads
remaining compressed, we fully recognise the importance of ever more robust cost management discipline and the need to continue re-engineering the business to improve efficiency.
Furthermore, capital is becoming a scarcer resource and, as a new regulatory environment evolves, I am committed to making capital allocation a more disciplined and rigorous process at HSBC in order to drive the correct investment decisions for the future.
We will talk more to investors about each of these initiatives later in the spring. However, as a result of this focus, we are committed to delivering a cost efficiency ratio and a return on average shareholders’ equity within our published target range.
We also recognise the importance of reliable dividend income for our shareholders and I believe it should be possible to benchmark a payout ratio of between 40-60% of attributable profits under normal market conditions.
In closing, I would like to acknowledge the huge contribution that my predecessor, Mike Geoghegan, made to HSBC in his five years as Group Chief Executive – not least during 2010 – and I wish him well for the future.
Finally, I am pleased to report that we have had a good start to the year, with continued momentum in lending, mainly in emerging markets and in respect of global trade.
S T Gulliver,Group Chief Executive
28 February 2011
9
Report of the Directors: Overview(continued)
HSBC is one of the largest banking and financial services organisations in the world, with a market capitalisation of US$180bn at 31 December 2010. We are headquartered in London.
As ‘The world’s local bank’, we combine the largest global emerging markets banking business and a uniquely cosmopolitan customer base with an extensive international network and substantial financial strength.
HSBC operates through long-established businesses and has an international network of some 7,500 offices in 87 countries and territories in six geographical regions; Europe, Hong Kong, Rest of Asia-Pacific, the Middle East, North America and Latin America.
Our products and services are delivered through two customer groups, Personal Financial Services (‘PFS’) and Commercial Banking (‘CMB’), and two global businesses, Global Banking and Markets (‘GB&M’), and Global Private Banking (‘GPB’). PFS incorporates the Group’s consumer finance businesses, the largest of which is HSBC Finance Corporation (‘HSBC Finance’).
Taken together, our five largest customers do not account for more than 1% of our income.
We have contractual and other arrangements with numerous third parties in support of our business activities. None of the arrangements is individually considered to be essential to the business of the Group.
There were no significant acquisitions during the year (for details of acquisitions see page 340).
Our objective is to deliver sustainable long-term value to shareholders through consistent earnings and superior risk-adjusted returns.
Our strategy is to be the world’s leading international bank, by:
| • | | leveraging the HSBC brand and our network of businesses which covers the world’s most relevant geographies. This network provides access to the world’s fastest growing economies, for example Greater China. We serve companies as they grow and become more international and individuals as they become wealthier and require more sophisticated financial services, such as wealth management; and |
| |
| • | | competing as a universal bank across the full financial services spectrum only where we have scale and can achieve appropriate returns. This implies building scale in attractive geographical regions and businesses where we can be competitive and reviewing businesses which do not meet our financial hurdles. |
The strategy reflects the key trends which are shaping the global economy. In particular, we recognise that over the long term, developing markets are growing faster than mature economies and connectivity continues to increase as world trade is expanding at a greater rate than gross domestic product, generating increased demand for financial services. We are, therefore, continuing to direct incremental investment primarily to the faster growing markets and client segments which have international connectivity. In order to deliver this strategy we pursue a series of initiatives, reflected in the Group’s key performance indicators:
| • | | enhance efficiency by taking full advantage of local, regional and global economies of scale, in particular by adopting a common systems architecture wherever possible; |
| |
| • | | maintain capital strength and a strong liquidity position. Capital and liquidity are critical for our strategy and are the foundation of decisions about the pace and direction of investment; and |
| |
| • | | align objectives and incentives to motivate and reward staff for being fully engaged in delivering the strategy. |
10
Report of the Directors: Overview(continued)
All of our activities involve, to varying degrees, the measurement, evaluation, acceptance and management of risk or combinations of risks. We classify risks as ‘top’ and ‘emerging’. A ‘top risk’ is a current, visible risk with the potential to have a material effect on our financial results or our reputation. An ‘emerging risk’ is one which has large unknown components which could have a material impact on our long-term strategy. Top and emerging risks are viewed as falling under the following four broad categories:
| • | | challenges to our business operations; |
| |
| • | | challenges to our governance and internal control systems; |
| |
| • | | macro-economic and geopolitical risk; and |
| |
| • | | macro-prudential and regulatory risks to our business model. |
The top and emerging risks are summarised below:
Challenges to our business operations
| • | | Challenges to our operating model in an economic downturn (in developed countries) and rapid growth (in emerging markets) |
| |
| • | | Internet crime and fraud |
Challenges to our governance and internal control systems
| • | | Level of change creating operational complexity |
| |
| • | | Information security risk |
Macro-economic and geopolitical risk
| • | | Potential emerging markets asset bubble |
| |
| • | | Increased geopolitical risk in Asia-Pacific and Middle East regions |
Macro-prudential and regulatory risks to our business model
| • | | Regulatory change impacting our business model and Group profitability |
| |
| • | | Regulatory requirements affecting conduct of business |
Key performance indicators
The Board of Directors and the Group Management Board (‘GMB’) monitor HSBC’s progress against its strategic objectives. Progress is assessed by comparison with our strategy, our operating plan targets and our historical performance using both financial and non-financial measures.
Following a review of our high-level key performance indicators (‘KPI’s), the GMB decided to make the following changes to the Group’s published indicators in order to restrict their number to those which most accurately reflect its management priorities. The Group now has seven financial and three non-financial KPIs.
| • | | the ratio of advances to core funding has been added to highlight the relationship between loans and advances to customers and core customer deposits in our principal banking entities; |
| |
| • | | tier 1 capital has been added as a primary indicator of the strength of our capital base, and its ability to support the growth of the business and meet regulatory capital requirements; |
| |
| • | | revenue growth, revenue mix factors and credit performance as measured by risk-adjusted margin have been replaced with risk-adjusted revenue growth; |
| |
| • | | the GMB will prioritise return on average total shareholders’ equity in place of return on average invested capital, which has therefore been excluded; and |
| |
| • | | customer transactions processed and percentage of information technology (‘IT’) services meeting targets form part of management information within our IT function. However, the GMB decided that these measures, which we have previously disclosed, were not appropriate proxies for assessing efficiencies and progress with implementing standard systems architecture. |
11
Report of the Directors: Overview(continued)
| | | | | |
| Strategic | | Enhance efficiency using | | Motivate staff to |
| objectives | | economies of scale | | deliver strategy |
| | | Cost efficiency | | Employee engagement |
Key Performance Indicators | | | | |
| |  | |  |
| | | | |
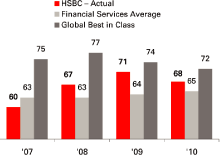
| | Measure: (percentage) total operating expenses divided by net operating income before loan impairment and other credit risk provisions. | | Measure:(percentage) measure of employee’s emotional and rational attachment to HSBC, a combination of advocacy, satisfaction, commitment and pride. |
| | | | |
| | | Target:to be between 48% and 52%, a range within which business is expected to remain to accommodate both returns to shareholders and the need for continued investment in support of future business growth. | | Target:to achieve a 72% global rating in 2010, with progressive improvement to best in class by 2011. |
| | | | | |
| | | Outcome:the ratio was outside the target range in part due to one-off costs, but also increased investment in operational infrastructure and strategic initiatives. | | Outcome:68%, mirroring the fall in global best in class but remaining well above the financial services average. |
12
Report of the Directors: Overview(continued)
| | | | | | | |
| | | | | | | Strategic |
| Maintain capital strength and strong liquidity | | objectives |
| Return on average | | | | | | |
| total shareholders’ equity | | Tier 1 capital | | Advances to core funding ratio | | |
| | | | | | | Key Performance Indicators |
| |  | |  | |
| | | | | | |
Measure:(percentage) profit attributable to ordinary shareholders divided by average total shareholders’ equity. | | Measure:component of regulatory capital comprising core tier 1 and other tier 1 capital. | | Measure:current loans and advances to customers as a percentage of the total of core customer deposits and term funding with a remaining term to maturity in excess of one year. | |
| | | | | | |
Target:to maintain a return in the medium term of between 15% and 19%. In 2011, we intend to replace the target with one in the 12% to 15% range over the normal cycle. | | Target:to maintain a strong capital base to support the development of the business and meet regulatory capital requirements at all times. | | Target:to maintain an advances to core funding ratio below limits set for each entity. | | |
| | | | | | | |
Outcome:return on equity was below the target range, but 4.4 percentage points higher than in 2009. | | Outcome:the increase in tier 1 capital to 12.1% reflected the contribution of profit to capital, the issue of hybrid capital securities during the year and careful management of RWAs. | | Outcome:ratio within the limits set by the Risk Management Meeting for each site. | | |
| | |
| For footnotes, see page 83. |
13
Report of the Directors: Operating and Financial Review
Financial summary
| | | | | |
| | | | Page |
| | | | | |
| | | 14 | |
| | | 16 | |
| | | 18 | |
| | | 18 | |
| | | 19 | |
| | | 20 | |
| | | 21 | |
| | | 22 | |
| | | 22 | |
| | | 23 | |
| | | 24 | |
| | | 24 | |
| | | 26 | |
| | | 28 | |
| | | 28 | |
| | | 28 | (a) |
| | | 29 | |
| | | 30 | |
| | | 31 | (b) |
| | | 31 | (b) |
| | | 31 | (i) |
| | | 31 | (l) |
| | | 31 | (l) |
| | | 31 | (l) |
| | | 31 | (m) |
| | | 31 | (n) |
| | | 31 | (p) |
| | | 32 | |
| | | 33 | |
The management commentary included in the Report of the Directors: ‘Overview’ and ‘Operating and Financial Review’, together with the ‘Employees’ and ‘Corporate sustainability’ sections of ‘Governance’ and the ‘Directors’ Remuneration Report’ is presented in compliance with the IFRS Practice StatementManagement Commentaryissued by the IASB.
Reconciliation of reported and
underlying profit before tax
We measure our performance internally on a like-for-like basis by eliminating the effects of foreign currency translation differences, acquisitions and disposals of subsidiaries and businesses, and fair value movements on own debt attributable to credit spread where the net result of such movements will be zero upon maturity of the debt; all of which distort year-on-year comparisons. We refer to this as our underlying performance.
Reported results include the effects of the above items. They are excluded when monitoring progress against operating plans and past results because
management believes that the underlying basis more accurately reflects operating performance.
Constant currency
Constant currency comparatives for 2009 referred to in the commentaries are computed by retranslating into US dollars for non-US dollar branches, subsidiaries, joint ventures and associates:
| • | | the income statements for 2009 at the average rates of exchange for 2010; and |
| |
| • | | the balance sheet at 31 December 2009 at the prevailing rates of exchange on 31 December 2010. |
Constant currency comparatives for 2008 referred to in the 2009 commentaries are computed on the same basis, by applying average rates of exchange for 2009 to the 2008 income statement and rates of exchange on 31 December 2009 to the balance sheet at 31 December 2008.
No adjustment has been made to the exchange rates used to translate foreign currency denominated assets and liabilities into the functional currencies of any HSBC branches, subsidiaries, joint ventures or associates. When reference is made to ‘constant currency’ in tables or commentaries, comparative data reported in the functional currencies of HSBC’s operations have been translated at the appropriate exchange rates applied in the current period on the basis described above.
The tables below compare our underlying performance in 2010 and 2009 with reported profits in those years.
The foreign currency translation differences reflect the relative strengthening of the US dollar against the euro and sterling, which offset its relative weakness against currencies in Asia, Mexico and Brazil during 2010.
The following acquisitions and disposals affected both comparisons:
| • | | the acquisition of PT Bank Ekonomi Raharja Tbk (‘Bank Ekonomi’) in May 2009; |
| |
| • | | the gain on sale of our 49% interest in a joint venture for a UK merchant acquiring business in June 2009 of US$280m; |
| |
| • | | the gain of US$62m on reclassification of Bao Viet Holdings (‘Bao Viet’) from an available-for-sale asset to an associate in January 2010; |
| |
| • | | the gain on sale of our stake in Wells Fargo HSBC Trade Bank in March 2010 of US$66m; |
| |
| • | | the gain on disposal of HSBC Insurance Brokers Limited of US$107m in April 2010; |
| |
| • | | the dilution gain of US$188m which arose on our holding in Ping An Insurance (Group) Company of China, Limited (‘Ping An Insurance’) following the issue of shares by the company in May 2010; |
14
Report of the Directors: Operating and Financial Review(continued)
| • | | the loss of US$42m on the completion of the sale of our investment in British Arab Commercial Bank plc in October 2010; |
| |
| • | | the gain on sale of Eversholt Rail Group of US$255m in December 2010; and |
| • | | the gain of US$74m on the deconsolidation of private equity funds following the management buy-out of Headland Capital Partners Ltd (formally known as HSBC Private Equity (Asia) Ltd) in November 2010. |
Reconciliation of reported and underlying profit before tax
| | | | | | | | | | | | | | | | | | | | | | | | | | | | | | | | | | | | | |
| | | 2010 compared with 2009 |
| | | | | | | | | | | | | | | 2009 | | | | | | | | | | | | | | | | | |
| | | 2009 | | | 2009 | | | | | | | at 2010 | | | 2010 | | | 2010 | | | 2010 | | | Re- | | | Under- | |
| | | as | | | adjust- | | | Currency | | | exchange | | | as | | | adjust- | | | under- | | | ported | | | lying | |
| | | reported | | | ments | 10 | | translation | 11 | | rates | 12 | | reported | | | ments | 10 | | lying | | | change | 13 | | change | 13 |
| HSBC | | US$m | | | US$m | | | US$m | | | US$m | | | US$m | | | US$m | | | US$m | | | % | | | % | |
| | | | | | | | | | | | | | | | | | | | | | | | | | | | | | | | | | | | | |
| Net interest income | | | 40,730 | | | | (1 | ) | | | 642 | | | | 41,371 | | | | 39,441 | | | | (31 | ) | | | 39,410 | | | | (3 | ) | | | (5 | ) |
| Net fee income | | | 17,664 | | | | (210 | ) | | | 182 | | | | 17,636 | | | | 17,355 | | | | (3 | ) | | | 17,352 | | | | (2 | ) | | | (2 | ) |
Changes in fair value14 | | | (6,533 | ) | | | 6,533 | | | | – | | | | – | | | | (63 | ) | | | 63 | | | | – | | | | 99 | | | | – | |
| Other income | | | 14,320 | | | | (283 | ) | | | 228 | | | | 14,265 | | | | 11,514 | | | | (719 | ) | | | 10,795 | | | | (20 | ) | | | (24 | ) |
| | | | | | | | | | | | | | | | | | | | | | | |
| | | | | | | | | | | | | | | | | | | | | | | | | | | | | | | | | | | | | |
Net operating income15 | | | 66,181 | | | | 6,039 | | | | 1,052 | | | | 73,272 | | | | 68,247 | | | | (690 | ) | | | 67,557 | | | | 3 | | | | (8 | ) |
| | | | | | | | | | | | | | | | | | | | | | | | | | | | | | | | | | | | | |
| Loan impairment charges and other credit risk provisions | | | (26,488 | ) | | | – | | | | (330 | ) | | | (26,818 | ) | | | (14,039 | ) | | | – | | | | (14,039 | ) | | | 47 | | | | 48 | |
| | | | | | | | | | | | | | | | | | | | | | | |
| | | | | | | | | | | | | | | | | | | | | | | | | | | | | | | | | | | | | |
Net operating income | | | 39,693 | | | | 6,039 | | | | 722 | | | | 46,454 | | | | 54,208 | | | | (690 | ) | | | 53,518 | | | | 37 | | | | 15 | |
| | | | | | | | | | | | | | | | | | | | | | | | | | | | | | | | | | | | | |
| Operating expenses | | | (34,395 | ) | | | 200 | | | | (568 | ) | | | (34,763 | ) | | | (37,688 | ) | | | 19 | | | | (37,669 | ) | | | (10 | ) | | | (8 | ) |
| | | | | | | | | | | | | | | | | | | | | | | |
| | | | | | | | | | | | | | | | | | | | | | | | | | | | | | | | | | | | | |
Operating profit | | | 5,298 | | | | 6,239 | | | | 154 | | | | 11,691 | | | | 16,520 | | | | (671 | ) | | | 15,849 | | | | 212 | | | | 36 | |
| | | | | | | | | | | | | | | | | | | | | | | | | | | | | | | | | | | | | |
| Income from associates | | | 1,781 | | | | (1 | ) | | | 11 | | | | 1,791 | | | | 2,517 | | | | – | | | | 2,517 | | | | 41 | | | | 41 | |
| | | | | | | | | | | | | | | | | | | | | | | |
| | | | | | | | | | | | | | | | | | | | | | | | | | | | | | | | | | | | | |
Profit before tax | | | 7,079 | | | | 6,238 | | | | 165 | | | | 13,482 | | | | 19,037 | | | | (671 | ) | | | 18,366 | | | | 169 | | | | 36 | |
| | | | | | | | | | | | | | | | | | | | | | | |
| | | | | | | | | | | | | | | | | | | | | | | | | | | | | | | | | | | | | |
By geographical region | | | | | | | | | | | | | | | | | | | | | | | | | | | | | | | | | | | | |
| | | | | | | | | | | | | | | | | | | | | | | | | | | | | | | | | | | | | |
| Europe | | | 4,009 | | | | 2,546 | | | | (152 | ) | | | 6,403 | | | | 4,302 | | | | (164 | ) | | | 4,138 | | | | 7 | | | | (35 | ) |
| Hong Kong | | | 5,029 | | | | 1 | | | | (10 | ) | | | 5,020 | | | | 5,692 | | | | (130 | ) | | | 5,562 | | | | 13 | | | | 11 | |
| Rest of Asia-Pacific | | | 4,200 | | | | 3 | | | | 205 | | | | 4,408 | | | | 5,902 | | | | (211 | ) | | | 5,691 | | | | 41 | | | | 29 | |
| Middle East | | | 455 | | | | – | | | | (2 | ) | | | 453 | | | | 892 | | | | 42 | | | | 934 | | | | 96 | | | | 106 | |
| North America | | | (7,738 | ) | | | 3,688 | | | | 46 | | | | (4,004 | ) | | | 454 | | | | (208 | ) | | | 246 | | | | | | | | | |
| Latin America | | | 1,124 | | | | – | | | | 78 | | | | 1,202 | | | | 1,795 | | | | – | | | | 1,795 | | | | 60 | | | | 49 | |
| | | | | | | | | | | | | | | | | | | | | | | |
| | | | | | | | | | | | | | | | | | | | | | | | | | | | | | | | | | | | | |
Profit before tax | | | 7,079 | | | | 6,238 | | | | 165 | | | | 13,482 | | | | 19,037 | | | | (671 | ) | | | 18,366 | | | | 169 | | | | 36 | |
| | | | | | | | | | | | | | | | | | | | | | | |
| | | | | | | | | | | | | | | | | | | | | | | | | | | | | | | | | | | | | |
By customer group and global business | | | | | | | | | | | | | | | | | | | | | | | | | | | | | | | | | | | | |
| | | | | | | | | | | | | | | | | | | | | | | | | | | | | | | | | | | | | |
| Personal Financial Services | | | (2,065 | ) | | | (2 | ) | | | (70 | ) | | | (2,137 | ) | | | 3,518 | | | | (10 | ) | | | 3,508 | | | | | | | | | |
| Commercial Banking | | | 4,275 | | | | (306 | ) | | | 64 | | | | 4,033 | | | | 6,090 | | | | (133 | ) | | | 5,957 | | | | 42 | | | | 48 | |
| Global Banking and Markets | | | 10,481 | | | | 13 | | | | 173 | | | | 10,667 | | | | 9,536 | | | | (342 | ) | | | 9,194 | | | | (9 | ) | | | (14 | ) |
| Global Private Banking | | | 1,108 | | | | – | | | | 1 | | | | 1,109 | | | | 1,054 | | | | 1 | | | | 1,055 | | | | (5 | ) | | | (5 | ) |
| Other | | | (6,720 | ) | | | 6,533 | | | | (3 | ) | | | (190 | ) | | | (1,161 | ) | | | (187 | ) | | | (1,348 | ) | | | 83 | | | | (609 | ) |
| | | | | | | | | | | | | | | | | | | | | | | |
| | | | | | | | | | | | | | | | | | | | | | | | | | | | | | | | | | | | | |
Profit before tax | | | 7,079 | | | | 6,238 | | | | 165 | | | | 13,482 | | | | 19,037 | | | | (671 | ) | | | 18,366 | | | | 169 | | | | 36 | |
| | | | | | | | | | | | | | | | | | | | | | | |
| | |
| For footnotes, see page 83. |
Additional information is available on pages 47(a) to 47(f) and 80(b) to 80(g).
15
Report of the Directors: Operating and Financial Review(continued)
Consolidated income statement
Five-year summary consolidated income statement
| | | | | | | | | | | | | | | | | | | | | |
| | | 2010 | | | 2009 | | | 2008 | | | 2007 | | | 2006 | |
| | | US$m | | | US$m | | | US$m | | | US$m | | | US$m | |
| | | | | | | | | | | | | | | | | | | | | |
| Net interest income | | | 39,441 | | | | 40,730 | | | | 42,563 | | | | 37,795 | | | | 34,486 | |
| Net fee income | | | 17,355 | | | | 17,664 | | | | 20,024 | | | | 22,002 | | | | 17,182 | |
| Net trading income | | | 7,210 | | | | 9,863 | | | | 6,560 | | | | 9,834 | | | | 8,222 | |
Net income/(expense) from financial instruments
designated at fair value | | | 1,220 | | | | (3,531 | ) | | | 3,852 | | | | 4,083 | | | | 657 | |
| Gains less losses from financial investments | | | 968 | | | | 520 | | | | 197 | | | | 1,956 | | | | 969 | |
| Gains arising from dilution of interests in associates | | | 188 | | | | – | | | | – | | | | 1,092 | | | | – | |
| Dividend income | | | 112 | | | | 126 | | | | 272 | | | | 324 | | | | 340 | |
| Net earned insurance premiums | | | 11,146 | | | | 10,471 | | | | 10,850 | | | | 9,076 | | | | 5,668 | |
| Gains on disposal of French regional banks | | | – | | | | – | | | | 2,445 | | | | – | | | | – | |
| Other operating income | | | 2,374 | | | | 2,788 | | | | 1,808 | | | | 1,439 | | | | 2,546 | |
| | | | | | | | | | | |
| | | | | | | | | | | | | | | | | | | | | |
Total operating income | | | 80,014 | | | | 78,631 | | | | 88,571 | | | | 87,601 | | | | 70,070 | |
| | | | | | | | | | | | | | | | | | | | | |
| Net insurance claims incurred and movement in liabilities to policyholders | | | (11,767 | ) | | | (12,450 | ) | | | (6,889 | ) | | | (8,608 | ) | | | (4,704 | ) |
| | | | | | | | | | | |
| | | | | | | | | | | | | | | | | | | | | |
Net operating income before loan impairment charges
and other credit risk provisions | | | 68,247 | | | | 66,181 | | | | 81,682 | | | | 78,993 | | | | 65,366 | |
| | | | | | | | | | | | | | | | | | | | | |
| Loan impairment charges and other credit risk provisions | | | (14,039 | ) | | | (26,488 | ) | | | (24,937 | ) | | | (17,242 | ) | | | (10,573 | ) |
| | | | | | | | | | | |
| | | | | | | | | | | | | | | | | | | | | |
Net operating income | | | 54,208 | | | | 39,693 | | | | 56,745 | | | | 61,751 | | | | 54,793 | |
| | | | | | | | | | | | | | | | | | | | | |
Total operating expenses17 | | | (37,688 | ) | | | (34,395 | ) | | | (49,099 | ) | | | (39,042 | ) | | | (33,553 | ) |
| | | | | | | | | | | |
| | | | | | | | | | | | | | | | | | | | | |
Operating profit | | | 16,520 | | | | 5,298 | | | | 7,646 | | | | 22,709 | | | | 21,240 | |
| | | | | | | | | | | | | | | | | | | | | |
| Share of profit in associates and joint ventures | | | 2,517 | | | | 1,781 | | | | 1,661 | | | | 1,503 | | | | 846 | |
| | | | | | | | | | | |
| | | | | | | | | | | | | | | | | | | | | |
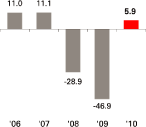
Profit before tax | | | 19,037 | | | | 7,079 | | | | 9,307 | | | | 24,212 | | | | 22,086 | |
| | | | | | | | | | | | | | | | | | | | | |
| Tax expense | | | (4,846 | ) | | | (385 | ) | | | (2,809 | ) | | | (3,757 | ) | | | (5,215 | ) |
| | | | | | | | | | | |
| | | | | | | | | | | | | | | | | | | | | |
Profit for the year | | | 14,191 | | | | 6,694 | | | | 6,498 | | | | 20,455 | | | | 16,871 | |
| | | | | | | | | | | |
| | | | | | | | | | | | | | | | | | | | | |
| Profit attributable to shareholders of the parent company | | | 13,159 | | | | 5,834 | | | | 5,728 | | | | 19,133 | | | | 15,789 | |
| Profit attributable to non-controlling interests | | | 1,032 | | | | 860 | | | | 770 | | | | 1,322 | | | | 1,082 | |
| | | | | | | | | | | | | | | | | | | | | |
Five-year financial information | | | | | | | | | | | | | | | | | | | | |
| | | | | | | | | | | | | | | | | | | | | |
| | | US$ | | | US$ | | | US$ | | | US$ | | | US$ | |
| | | | | | | | | | | | | | | | | | | | | |
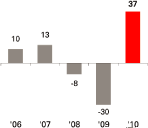
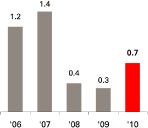
Basic earnings per share18 | | | 0.73 | | | | 0.34 | | | | 0.41 | | | | 1.44 | | | | 1.22 | |
Diluted earnings per share18 | | | 0.72 | | | | 0.34 | | | | 0.41 | | | | 1.42 | | | | 1.21 | |
Dividends per share1 | | | 0.34 | | | | 0.34 | | | | 0.93 | | | | 0.87 | | | | 0.76 | |
| | | | | | | | | | | | | | | | | | | | | |
| | | | % | | | | % | | | | % | | | | % | | | | % | |
| | | | | | | | | | | | | | | | | | | | | |
Dividend payout ratio19 | | | 46.6 | | | | 100.0 | | | | 226.8 | | | | 60.4 | | | | 62.3 | |
| Post-tax return on average total assets | | | 0.57 | | | | 0.27 | | | | 0.26 | | | | 0.97 | | | | 1.00 | |
| Return on average total shareholders’ equity | | | 9.5 | | | | 5.1 | | | | 4.7 | | | | 15.9 | | | | 15.7 | |
| | | | | | | | | | | | | | | | | | | | | |
| Average foreign exchange translation rates to US$: | | | | | | | | | | | | | | | | | | | | |
| US$1: £ | | | 0.648 | | | | 0.641 | | | | 0.545 | | | | 0.500 | | | | 0.543 | |
| US$1: € | | | 0.755 | | | | 0.719 | | | | 0.684 | | | | 0.731 | | | | 0.797 | |
| | |
| For footnotes, see page 83. |
16
Report of the Directors: Operating and Financial Review(continued)
Reported profit before tax of US$19.0bn in 2010 was 169% higher than in 2009, and 36% higher on an underlying basis. The difference between reported and underlying results is explained on page 14. Except where stated otherwise, the commentaries in the Financial Summary are on an underlying basis and references to HSBC Finance and HSBC Bank USA are on a management basis, rather than a legal entity basis (for details see page 37).
Net operating income before loan impairment charges and other credit risk provisions (‘revenue’) was lower than in 2009, notably due to a decline in balances in North America, lower trading income from adverse movements on non-qualifying hedges and a fall in revenue from GB&M. In the former, we continued to reposition our core businesses and we remained focused on managing down our run-off portfolios. As a consequence, revenue fell, reflecting declining balances in the run-off portfolios and in the Card and Retail Services business, where revenue was also adversely affected by new regulations. In GB&M, lower revenue was generated in Balance Sheet Management as higher yielding positions matured and funds were invested in lower yielding assets. Trading income declined driven by increased competition and reduced margins across core products, and less favourable market conditions caused by the European sovereign debt crisis. These factors were partly offset by increased CMB revenue from balance sheet growth, particularly in Asia, and higher trade-related fees.
Loan impairment charges were significantly lower than in 2009, with decreases across all regions and customer groups as economic conditions improved. The most significant decline in loan impairment charges was in North America, reflecting lower balances due to increased repayments, an improvement in delinquency rates in Card and Retail Services, and the continued run-off of balances in the Consumer Finance business. There were also marked declines in the Middle East and in
Latin America, primarily in Mexico and Brazil, reflecting a reduction in personal lending balances as selected portfolios were managed down, and an improvement in credit quality as origination criteria were tightened and collection practices improved. In GB&M, loan impairment charges were significantly lower, reflecting the improvement in the credit environment which resulted in fewer significant charges than those taken in 2009 in relation to a small number of clients, notably in Europe and other credit risk provisions fell in the available-for-sale asset-backed securities (‘ABS’) portfolio due to a slowing in the rate of anticipated losses in the underlying collateral pools.
Underlying profit before tax rose by 36% as a significant fall in impairment charges offset a decline in revenue.
Operating expenses were higher than in 2009, in part due to specific one-off items such as a US$0.3bn charge for UK bank payroll tax in 2010 and the non-recurrence of a pension accounting gain of US$0.5bn in 2009 relating to the treatment of staff benefits. Excluding these items, operating expenses rose in support of strategic growth initiatives in our target markets to invest in operational infrastructure and the selective recruitment of customer-facing staff.
Income from associates increased, driven by strong results in Asia which reflected robust economic growth in mainland China.
In 2010, taxable profits were achieved in the US, principally as the result of a gain from an internal reorganisation that was not recognised for accounting purposes which increased the effective tax rate by 6.4 percentage points. If this were excluded, the effective tax rate would be 19.1% which is in line with our geographical range of business activities. Reported profit after tax was US$7.5bn higher than in 2009.
17
Report of the Directors: Operating and Financial Review(continued)
Group performance by income and expense item
| | | | | | | | | | | | | |
| | | 2010 | | | 2009 | | | 2008 | |
| | | US$m | | | US$m | | | US$m | |
| | | | | | | | | | | | | |
| Interest income | | | 58,345 | | | | 62,096 | | | | 91,301 | |
| Interest expense | | | (18,904 | ) | | | (21,366 | ) | | | (48,738 | ) |
| | | | | | | |
| | | | | | | | | | | | | |
Net interest income20 | | | 39,441 | | | | 40,730 | | | | 42,563 | |
| | | | | | | |
| | | | | | | | | | | | | |
| Average interest-earning assets | | | 1,472,294 | | | | 1,384,705 | | | | 1,466,622 | |
Gross interest yield21 | | | 3.96% | | | | 4.48% | | | | 6.23% | |
Net interest spread22 | | | 2.55% | | | | 2.90% | | | | 2.87% | |
Net interest margin23 | | | 2.68% | | | | 2.94% | | | | 2.90% | |
Summary of interest income by type of asset
| | | | | | | | | | | | | | | | | | | | | | | | | | | | | | | | | | | | | |
| | | 2010 | | 2009 | | 2008 |
| | | Average | | | Interest | | | | | | | Average | | | Interest | | | | | | | Average | | | Interest | | | | |
| | | balance | | | income | | | Yield | | | balance | | | income | | | Yield | | | balance | | | income | | | Yield | |
| | | US$m | | | US$m | | | % | | | US$m | | | US$m | | | % | | | US$m | | | US$m | | | % | |
| | | | | | | | | | | | | | | | | | | | | | | | | | | | | | | | | | | | | |
| Short-term funds and loans and advances to banks | | | 236,742 | | | | 4,555 | | | | 1.92 | | | | 192,578 | | | | 4,199 | | | | 2.18 | | | | 240,111 | | | | 9,646 | | | | 4.02 | |
| Loans and advances to customers | | | 858,499 | | | | 44,186 | | | | 5.15 | | | | 870,057 | | | | 48,301 | | | | 5.55 | | | | 943,662 | | | | 68,722 | | | | 7.28 | |
| Financial investments | | | 378,971 | | | | 9,375 | | | | 2.47 | | | | 322,880 | | | | 9,425 | | | | 2.92 | | | | 264,396 | | | | 12,618 | | | | 4.77 | |
Other interest-earning assets24 | | | (1,918 | ) | | | 229 | | | | (11.94 | ) | | | (810 | ) | | | 171 | | | | (21.11 | ) | | | 18,453 | | | | 315 | | | | 1.71 | |
| | | | | | | | | | | | | | | | | | | | | | | | | |
| | | | | | | | | | | | | | | | | | | | | | | | | | | | | | | | | | | | | |
| Total interest-earning assets | | | 1,472,294 | | | | 58,345 | | | | 3.96 | | | | 1,384,705 | | | | 62,096 | | | | 4.48 | | | | 1,466,622 | | | | 91,301 | | | | 6.23 | |
Trading assets25 | | | 332,511 | | | | 6,027 | | | | 1.81 | | | | 357,504 | | | | 7,614 | | | | 2.13 | | | | 428,539 | | | | 16,742 | | | | 3.91 | |
Financial assets designated at fair value26 | | | 52,692 | | | | 1,033 | | | | 1.96 | | | | 62,143 | | | | 1,032 | | | | 1.66 | | | | 37,303 | | | | 1,108 | | | | 2.97 | |
| Impairment provisions | | | (22,905 | ) | | | | | | | | | | | (26,308 | ) | | | | | | | | | | | (20,360 | ) | | | | | | | | |
| Non-interest-earning assets | | | 664,308 | | | | | | | | | | | | 667,942 | | | | | | | | | | | | 596,885 | | | | | | | | | |
| | | | | | | | | | | | | | | | | | | | | | | | | |
| | | | | | | | | | | | | | | | | | | | | | | | | | | | | | | | | | | | | |
| Total assets and interest income | | | 2,498,900 | | | | 65,405 | | | | 2.62 | | | | 2,445,986 | | | | 70,742 | | | | 2.89 | | | | 2,508,989 | | | | 109,151 | | | | 4.35 | |
| | | | | | | | | | | | | | | | | | | | | | | | | |
Summary of interest expense by type of liability and equity
| | | | | | | | | | | | | | | | | | | | | | | | | | | | | | | | | | | | | |
| | | 2010 | | 2009 | | 2008 |
| | | Average | | | Interest | | | | | | | Average | | | Interest | | | | | | | Average | | | Interest | | | | |
| | | balance | | | expense | | | Cost | | | balance | | | expense | | | Cost | | | balance | | | expense | | | Cost | |
| | | US$m | | | US$m | | | % | | | US$m | | | US$m | | | % | | | US$m | | | US$m | | | % | |
| | | | | | | | | | | | | | | | | | | | | | | | | | | | | | | | | | | | | |
Deposits by banks27 | | | 111,443 | | | | 1,136 | | | | 1.02 | | | | 117,847 | | | | 1,659 | | | | 1.41 | | | | 135,747 | | | | 4,959 | | | | 3.65 | |
Financial liabilities designated at fair
value – own debt issued28 | | | 66,706 | | | | 1,271 | | | | 1.91 | | | | 60,221 | | | | 1,558 | | | | 2.59 | | | | 63,835 | | | | 3,133 | | | | 4.91 | |
Customer accounts29 | | | 962,613 | | | | 10,778 | | | | 1.12 | | | | 940,918 | | | | 11,346 | | | | 1.21 | | | | 950,854 | | | | 27,989 | | | | 2.94 | |
| Debt securities in issue | | | 189,898 | | | | 4,931 | | | | 2.60 | | | | 225,657 | | | | 5,901 | | | | 2.62 | | | | 286,827 | | | | 11,982 | | | | 4.18 | |
| Other interest-bearing liabilities | | | 8,730 | | | | 788 | | | | 9.03 | | | | 8,640 | | | | 902 | | | | 10.44 | | | | 14,579 | | | | 675 | | | | 4.63 | |
| | | | | | | | | | | | | | | | | | | | | | | | | |
| | | | | | | | | | | | | | | | | | | | | | | | | | | | | | | | | | | | | |
| Total interest-bearing liabilities | | | 1,339,390 | | | | 18,904 | | | | 1.41 | | | | 1,353,283 | | | | 21,366 | | | | 1.58 | | | | 1,451,842 | | | | 48,738 | | | | 3.36 | |
| Trading liabilities | | | 258,348 | | | | 3,497 | | | | 1.35 | | | | 205,670 | | | | 3,987 | | | | 1.94 | | | | 277,940 | | | | 11,029 | | | | 3.97 | |
| Financial liabilities designated at fair value (excluding own debt issued) | | | 17,456 | | | | 283 | | | | 1.62 | | | | 15,688 | | | | 293 | | | | 1.87 | | | | 21,266 | | | | 345 | | | | 1.62 | |
| Non-interest bearing current accounts | | | 142,579 | | | | | | | | | | | | 123,271 | | | | | | | | | | | | 98,193 | | | | | | | | | |
| Total equity and other non-interest bearing liabilities | | | 741,127 | | | | | | | | | | | | 748,074 | | | | | | | | | | | | 659,747 | | | | | | | | | |
| | | | | | | | | | | | | | | | | | | | | | | | | |
| | | | | | | | | | | | | | | | | | | | | | | | | | | | | | | | | | | | | |
| Total equity and liabilities | | | 2,498,900 | | | | 22,684 | | | | 0.91 | | | | 2,445,986 | | | | 25,646 | | | | 1.05 | | | | 2,508,988 | | | | 60,112 | | | | 2.40 | |
| | | | | | | | | | | | | | | | | | | | | | | | | |
| | |
| For footnotes, see page 83. |
Reported net interest income fell by 3% to US$39bn; the decline was 5% on an underlying basis. This was driven by the exceptionally low interest rate environment and by the effect of repositioning our customer assets towards secured lending as we reduced our higher risk and higher yielding portfolios.
Revenues in Balance Sheet Management decreased, as expected, from the strong levels of 2009 as higher yielding positions taken in prior years matured and opportunities for reinvestment at equivalent yields were limited by the prevailing low interest rates and flatter yield curves.
18
Report of the Directors: Operating and Financial Review(continued)
The fall in income from interest-earning assets was driven by declining yields on loans and advances to customers following the Group’s decision to reposition the lending portfolio towards higher quality assets. Higher yielding unsecured lending balances decreased, particularly in North America, where the run-off portfolios continued to diminish and credit card balances fell as the number of active accounts declined and repayments by customers increased. Certain higher risk portfolios were also managed down in Latin America, Asia and the Middle East. This reduction was partly offset by commercial lending growth in CMB and GB&M, and growth in secured lending in the UK in residential mortgages.
The interest expense on debt issued by the Group fell, largely due to a decline in average balances in debt securities in issue as HSBC Finance’s funding requirements continued to decrease in line with the run-off of the residual balances in Mortgage Services and Consumer
Lending and the sale of the vehicle finance portfolios.
Net interest income includes the expense of the internal funding of trading assets, while related revenue is reported in trading income. The cost of funding these assets declined as a result of the low interest rates. In reporting our customer group results, this cost is included within net trading income.
Net interest spread decreased due to lower yields on loans and advances to customers, partly as a result of the greater focus on secured lending. In addition, returns on financial investments and deposit spreads remained constrained due to low interest rates. Our net interest margin fell by a lesser amount due to the benefit from an increase in net free funds as customers held more funds in liquid non-interest bearing current accounts in the current low interest rate environment.
| | | | | | | | | | | | | |
| | | 2010 | | | 2009 | | | 2008 | |
| | | US$m | | | US$m | | | US$m | |
| | | | | | | | | | | | | |
| Cards | | | 3,801 | | | | 4,625 | | | | 5,844 | |
| Account services | | | 3,632 | | | | 3,592 | | | | 4,353 | |
| Funds under management | | | 2,511 | | | | 2,172 | | | | 2,757 | |
| Broking income | | | 1,789 | | | | 1,617 | | | | 1,738 | |
| Credit facilities | | | 1,635 | | | | 1,479 | | | | 1,313 | |
| Insurance | | | 1,147 | | | | 1,421 | | | | 1,771 | |
| Imports/exports | | | 991 | | | | 897 | | | | 1,014 | |
| Global custody | | | 700 | | | | 988 | | | | 1,311 | |
| Remittances | | | 680 | | | | 613 | | | | 610 | |
| Underwriting | | | 623 | | | | 746 | | | | 325 | |
| Unit trusts | | | 560 | | | | 363 | | | | 502 | |
| Corporate finance | | | 440 | | | | 396 | | | | 381 | |
| Trust income | | | 291 | | | | 278 | | | | 325 | |
| Mortgage servicing | | | 118 | | | | 124 | | | | 120 | |
| Maintenance income on operating leases | | | 99 | | | | 111 | | | | 130 | |
| Taxpayer financial services | | | 73 | | | | 87 | | | | 168 | |
| Other | | | 2,027 | | | | 1,894 | | | | 2,102 | |
| | | | | | | |
| | | | | | | | | | | | | |
| Fee income | | | 21,117 | | | | 21,403 | | | | 24,764 | |
| | | | | | | | | | | | | |
| Less: fee expense | | | (3,762 | ) | | | (3,739 | ) | | | (4,740 | ) |
| | | | | | | |
| | | | | | | | | | | | | |
| Net fee income | | | 17,355 | | | | 17,664 | | | | 20,024 | |
| | | | | | | |
Net fee income marginally decreased compared with 2009 on both a reported and an underlying basis. The significant decrease in fee income in North America, primarily in Card and Retail Services, was mostly offset by higher investment-related fees in Asia and Europe and an increase in trade-related fee income in Asia.
The significant fall in fee income from cards occurred primarily in North America, driven by lower volumes, improved delinquency rates and the revision to charging practices following the implementation of the Credit Card Accountability, Responsibility and Disclosure Act (‘CARD Act’).
Insurance fee income was markedly down. In the US, the decline resulted from lower sales of credit protection products associated with the cards business. In the UK, income was lower on a reported basis due to the sale of the insurance brokerage business in the first half of 2010.
Overall, underwriting fee income declined, particularly in Europe as a result of reduced capital market activity in the uncertain economic environment, although in Asia underwriting fees increased following several notable transactions.
19
Report of the Directors: Operating and Financial Review(continued)
Net fee income from sales of investment products in Asia and Europe increased, driven by a stronger investment performance in funds and improved customer sentiment which led to higher volumes.
Credit facilities fees also rose, notably in Asia, as a result of an increase in loan syndication transactions completed during the year.
Net fee income from trade finance also increased, particularly in Asia, reflecting a rise in trade activity.
| | | | | | | | | | | | | |
| | | 2010 | | | 2009 | | | 2008 | |
| | | US$m | | | US$m | | | US$m | |
| | | | | | | | | | | | | |
| Trading activities | | | 5,708 | | | | 5,312 | | | | 2,988 | |
| Net interest income on trading activities | | | 2,530 | | | | 3,627 | | | | 5,713 | |
| Other trading income – hedge ineffectiveness: | | | | | | | | | | | | |
| – on cash flow hedges | | | (9 | ) | | | 90 | | | | (40 | ) |
| – on fair value hedges | | | 38 | | | | (45 | ) | | | 5 | |
| Non-qualifying hedges | | | (1,057 | ) | | | 951 | | | | (1,122 | ) |
| Losses on Bernard L. Madoff Investment Securities LLC fraud | | | – | | | | (72 | ) | | | (984 | ) |
| | | | | | | |
| | | | | | | | | | | | | |
Net trading income30,31 | | | 7,210 | | | | 9,863 | | | | 6,560 | |
| | | | | | | |
| | |
| For footnotes, see page 83. |
Reported net trading income was US$7.2bn, 27% lower than in 2009. On an underlying basis, net trading income declined by 28% due to adverse movements on non-qualifying hedges and lower income from trading activities.
A US$1.1bn adverse fair value movement was reported on non-qualifying hedges compared with a favourable fair value movement of US$954m in 2009. These instruments are derivatives entered into as part of a documented interest rate management strategy for which hedge accounting was not, or could not be, applied. They are principally cross-currency and interest rate swaps used to economically hedge fixed rate debt issued by HSBC Holdings, floating rate debt issued by HSBC Finance and certain operating leased assets. The loss recognised on non-qualifying hedges was a result of fair value losses on these instruments, driven by the decrease in long-term US interest rates relative to sterling and euro rates. In HSBC Finance, the volume of non-qualifying hedge positions also increased as the duration of the mortgage book lengthened and swaps were used to align more closely the duration of the funding liabilities. The size and direction of the changes in fair value of non-qualifying hedges which are recognised in the income statement can be volatile from year to year, but do not alter the cash flows expected as part of the documented interest rate management strategy for both the instruments and the underlying economically hedged assets and liabilities.
The remaining decline in net trading income was driven by increased competition and reduced margins across core products. European sovereign debt concerns and increased economic uncertainty resulted in less favourable market conditions
compared with 2009.
In the Credit business, corporate bond trading volumes remained robust following investment in electronic trading capabilities, though revenues were affected as margins declined and credit spread movements were more favourable in 2009. This was partly offset by gains on the legacy portfolio which included a net release of write-downs on legacy positions and monoline credit exposures of US$429m. This compared with a reported write-down of US$331m in 2009.
Rates income decreased, reflecting reduced margins and increased risk aversion from customers due to economic uncertainty. Turmoil in the eurozone led to sovereign debt downgrades and falling asset prices in certain European countries, leading to lower revenues in the trading portfolio. These factors were partly offset by a small favourable fair value movement on structured liabilities, compared with an adverse movement in 2009.
Lower net trading income was driven by a US$2.0bn adverse movement on non-qualifying hedges from 2009.
Performance in the Foreign Exchange business remained strong, although was affected by a competitive trading environment and tighter bid-offer spreads as competitors sought to rebuild their businesses. In addition, revenues fell as market volatility declined from the exceptional levels seen in early 2009.
The Equities business continued to increase market share in its target markets, following
20
Report of the Directors: Operating and Financial Review(continued)
investment in the equities platform. However, core revenues fell, as overall market volumes and margins declined.
Trading income benefited from foreign exchange gains on trading assets held as economic hedges of foreign currency debt designated at fair value compared with losses on these instruments in 2009. These gains were largely offset by
corresponding losses reported in ‘Net income from financial instruments designated at fair value’.
Net interest income earned on trading activities decreased by 30%, driven by reduced holdings of debt securities. The cost of internally funding these assets also declined, but this interest expense is reported under ‘Net interest income’ and excluded from net trading income.
Net income/(expense) from financial instruments designated at fair value
| | | | | | | | | | | | | |
| | | 2010 | | | 2009 | | | 2008 | |
| | | US$m | | | US$m | | | US$m | |
| | | | | | | | | | | | | |
| Net income/(expense) arising from: | | | | | | | | | | | | |
– financial assets held to meet liabilities under insurance and investment contracts | | | 2,349 | | | | 3,793 | | | | (5,064 | ) |
| – liabilities to customers under investment contracts | | | (946 | ) | | | (1,329 | ) | | | 1,751 | |
| | | | | | | | | | | | | |
| – HSBC’s long-term debt issued and related derivatives | | | (258 | ) | | | (6,247 | ) | | | 6,679 | |
| | | | | | | |
| Change in own credit spread on long-term debt | | | (63) | | | | (6,533 | ) | | | 6,570 | |
Other changes in fair value32 | | | (195) | | | | 286 | | | | 109 | |
| | | | | | | |
| | | | | | | | | | | | | |
| – other instruments designated at fair value and related derivatives | | | 75 | | | | 252 | | | | 486 | |
| | | | | | | |
| | | | | | | | | | | | | |
| Net income/(expense) from financial instruments designated at fair value | | | 1,220 | | | | (3,531 | ) | | | 3,852 | |
| | | | | | | |
Assets and liabilities from which net income/(expense) from financial instruments designated at fair value arose
| | | | | | | | | | | | | |
| | | 2010 | | | 2009 | | | 2008 | |
| | | US$m | | | US$m | | | US$m | |
| | | | | | | | | | | | | |
| Financial assets designated at fair value at 31 December | | | 37,011 | | | | 37,181 | | | | 28,533 | |
| Financial liabilities designated at fair value at 31 December | | | 88,133 | | | | 80,092 | | | | 74,587 | |
| | | | | | | | | | | | | |
| Including: | | | | | | | | | | | | |
| Financial assets held to meet liabilities under: | | | | | | | | | | | | |
– insurance contracts and investment contracts with DPF33 | | | 7,167 | | | | 6,097 | | | | 5,556 | |
| – unit-linked insurance and other insurance and investment contracts | | | 19,725 | | | | 16,982 | | | | 12,758 | |
| Long-term debt issues designated at fair value | | | 69,906 | | | | 62,641 | | | | 58,686 | |
| | |
| For footnotes, see page 83. |
The accounting policies for the designation of financial instruments at fair value and the treatment of the associated income and expenses are described in Notes 2i and 2b on the Financial Statements, respectively.
The majority of the financial liabilities designated at fair value relate to certain fixed-rate long-term debt issues whose rate profile has been changed to floating through interest rate swaps as part of a documented interest rate management strategy. The movement in fair value of these long-term debt issues includes the effect of our credit spread changes and any ineffectiveness in the economic relationship between the related swaps and own debt. As credit spreads widen or narrow, accounting profits or losses, respectively, are booked. The size and direction of the changes in the credit spread on our debt and ineffectiveness, which are recognised in the income statement, can be volatile from year to year, but do not alter the cash flows envisaged as part of the documented interest
rate management strategy. As a consequence, fair value movements arising from changes in our own credit spread on long-term debt and other fair value movements on the debt and related derivatives are not regarded internally as part of managed performance and are therefore not allocated to customer groups, but are reported in ‘Other’. Credit spread movements on own debt are excluded from underlying results, and related fair value movements are not included in the calculation of regulatory capital.
We reported net income from financial instruments designated at fair value of US$1.2bn in 2010 compared with a net expense of US$3.5bn in 2009. On an underlying basis, the equivalent figures were income of US$1.3bn in 2010 and US$2.9bn in 2009. The difference between the reported and underlying results arises from the exclusion from the latter of the credit spread-related movements in the fair value of our own long-term debt, on which we reported adverse fair value movements of US$63m
21
Report of the Directors: Operating and Financial Review(continued)
in 2010 and US$6.5bn in 2009. In North America, a small favourable fair value movement was reported in 2010 as credit spreads widened marginally, in contrast with a significant adverse fair value movement in 2009. In Europe, significantly lower adverse fair value movements were reported in 2010 as credit spreads tightened, but to a lesser extent than in the previous year.
Income arising from financial assets held to meet liabilities under insurance and investment contracts reflected lower investment gains as the growth in equity markets was less than that of 2009. This predominantly affected the value of assets held to support unit-linked contracts in the UK, Hong Kong, Singapore and Brazil and participating contracts in France.
For investment gains or losses related to assets held to back investment contracts, the corresponding movement in liabilities to customers is also recorded under ‘Net income from financial instruments designated at fair value’.
Investment gains or losses related to assets held to back insurance contracts or investment contracts with discretionary participation features (‘DPF’) are offset by a corresponding change in ‘Net insurance claims incurred and movement in liabilities to policyholders’ to reflect the extent to which unit-linked policyholders, in particular, participate in the investment performance of the associated asset portfolios.
Gains less losses from financial investments
| | | | | | | | | | | | | |
| | | 2010 | | | 2009 | | | 2008 | |
| | | US$m | | | US$m | | | US$m | |
| | | | | | | | | | | | | |
| Net gains/(losses) from disposal of: | | | | | | | | | | | | |
| – debt securities | | | 564 | | | | 463 | | | | 19 | |
| – equity securities | | | 516 | | | | 407 | | | | 1,216 | |
| – other financial investments | | | (7 | ) | | | 8 | | | | 4 | |
| | | | | | | |
| | | | | | | | | | | | | |
| | | | 1,073 | | | | 878 | | | | 1,239 | |
| Impairment of available-for-sale equity securities | | | (105 | ) | | | (358 | ) | | | (1,042 | ) |
| | | | | | | |
| | | | | | | | | | | | | |
| Gains less losses from financial investments | | | 968 | | | | 520 | | | | 197 | |
| | | | | | | |
Reported gains less losses from financial investments increased by US$448m to US$968m. On an underlying basis, excluding an accounting gain arising from the reclassification of Bao Viet as an associate following our purchase of additional shares, they increased by 69%. This was driven by a decrease in the level of impairments on available-for-sale equity investments as market values improved, along with an increase in gains on the disposal of equity and debt securities.
Impairments on equity investments declined markedly compared with 2009 as the improving economic situation resulted in a reduction in the level of write-downs required on private equity and other strategic equity investments.
Higher net gains were reported in Balance Sheet Management on disposals of available-for-sale debt securities, mainly in Europe and Asia. These were partly offset by a decrease in North America, where net gains realised from the sale of mortgage-backed securities and other ABSs in 2009 did not recur.
Net gains on the disposal of equity securities increased, primarily in our private equity portfolio in Europe, as the market offered greater opportunities for divestment. This was partly offset by the non-recurrence of the gain on disposal of our holdings of Visa Inc. shares in 2009.
Net earned insurance premiums
| | | | | | | | | | | | | |
| | | 2010 | | | 2009 | | | 2008 | |
| | | US$m | | | US$m | | | US$m | |
| | | | | | | | | | | | | |
| Gross insurance premium income | | | 11,609 | | | | 10,991 | | | | 12,547 | |
| Reinsurance premiums | | | (463 | ) | | | (520 | ) | | | (1,697 | ) |
| | | | | | | |
| | | | | | | | | | | | | |
| Net earned insurance premiums | | | 11,146 | | | | 10,471 | | | | 10,850 | |
| | | | | | | |
Net earned insurance premiums increased by 6% to US$11.1bn on both a reported and an underlying basis.
Growth was largely attributable to the continued strong performance of life insurance products in Asia. Successful sales campaigns and the
22
Report of the Directors: Operating and Financial Review(continued)
recruitment of additional insurance sales managers increased net earned premiums in Hong Kong, particularly from deferred annuity and unit-linked products, and a life insurance product designed for high net worth individuals. Higher sales were also reported in Malaysia, Taiwan and mainland China, primarily from successful product launches and marketing campaigns.
Net earned premiums in Latin America increased marginally in the improved economic conditions, driven by higher sales in Brazil, Argentina and Mexico and repricing initiatives in Argentina.
In France, an increase in sales of investment
contracts with DPF drove higher net earned premiums. Strong sales activity also led to higher net earned premiums in our UK life insurance business.
This growth was partly offset by a reduction in non-life insurance premiums, primarily due to the run-off of the legacy motor book in the UK, which was closed during the second half of 2009, and the decision taken during 2010 not to renew certain contracts in the Irish business.
Net earned premiums in North America also decreased, reflecting a decline in sales of payment protection products following the discontinuation of mortgage originations in HSBC Finance.
| | | | | | | | | | | | | |
| | | 2010 | | | 2009 | | | 2008 | |
| | | US$m | | | US$m | | | US$m | |
| | | | | | | | | | | | | |
| Rent received | | | 535 | | | | 547 | | | | 606 | |
| Losses recognised on assets held for sale | | | (263 | ) | | | (115 | ) | | | (130 | ) |
| Valuation gains/(losses) on investment properties | | | 93 | | | | (24 | ) | | | (92 | ) |
| Gain on disposal of property, plant and equipment, intangible assets and non-financial investments | | | 889 | | | | 1,033 | | | | 881 | |
| Change in present value of in-force long-term insurance business | | | 705 | | | | 605 | | | | 286 | |
| Other | | | 603 | | | | 742 | | | | 257 | |
| | | | | | | |
| | | | | | | | | | | | | |
| Other operating income | | | 2,562 | | | | 2,788 | | | | 1,808 | |
| | | | | | | |
Reported other operating income of US$2.6bn was 8% lower than in 2009. Income in 2010 included gains of US$188m following the dilution of our holding in Ping An Insurance, US$107m from the sale of HSBC Insurance Brokers, US$66m from the disposal of our interest in the Wells Fargo HSBC Trade Bank and US$255m from the sale of Eversholt Rail Group. In addition, we reported a gain of US$74m resulting from the sale of HSBC Private Equity (Asia) Ltd, partly offset by a loss of US$42m on the disposal of our shareholding in British Arab Commercial Bank plc. Reported results in 2009 included a gain of US$280m from the sale of the remaining stake in the card merchant-acquiring business in the UK.
On an underlying basis, excluding the items referred to above, other operating income decreased by 23%, primarily because gains on the sale of properties in London and Hong Kong in 2009 did not recur.
Net losses recognised on assets held for sale increased, reflecting a US$207m loss on the sale of the US vehicle finance servicing operation and associated US$5.3bn loan portfolio.
Net investment valuation gains on investment properties contrasted with losses in 2009. This reflected improvements in the property markets in Hong Kong and the UK which led to net valuation gains on investment properties, compared with net valuation losses in 2009.
A loss on sale of the US vehicle finance business contributed to a fall in Other operating income.
We recognised gains of US$194m and US$56m in 2010 on the sale and leaseback of our Paris and New York headquarters buildings, respectively. These compared with more substantial underlying gains of US$667m (US$686m as reported) on the sale and leaseback of 8 Canada Square and the sale of a property in Hong Kong in 2009.
Strong sales of life insurance products, notably in Hong Kong, resulted in favourable movements in the present value of in-force (‘PVIF’) long-term insurance business. These were offset in part by the non-recurrence of gains recognised in 2009 following the refinement of the income recognition methodology in HSBC Finance.
23
Report of the Directors: Operating and Financial Review(continued)
Net insurance claims incurred and movement in liabilities to policyholders
| | | | | | | | | | | | | |
| | | 2010 | | | 2009 | | | 2008 | |
| | | US$m | | | US$m | | | US$m | |
| | | | | | | | | | | | | |
| Insurance claims incurred and movement in liabilities to policyholders: | | | | | | | | | | | | |
| – gross | | | 11,969 | | | | 12,560 | | | | 9,206 | |
| – reinsurers’ share | | | (202 | ) | | | (110 | ) | | | (2,317 | ) |
| | | | | | | |
| | | | | | | | | | | | | |
– net34 | | | 11,767 | | | | 12,450 | | | | 6,889 | |
| | | | | | | |
| | |
| For footnote, see page 83. |
Net insurance claims incurred and movement in liabilities to policyholders decreased by 5% and 4% on a reported and an underlying basis, respectively.
Lower investment returns than in 2009, particularly in Asia, Europe and Brazil, led to a decrease in the movement in liabilities to policyholders on unit-linked insurance contracts and, to a certain extent, participating contracts, whose policyholders share in the investment performance of the assets supporting their policies. The gains or losses experienced on the financial assets designated at fair value held to support insurance contract liabilities and investment contracts with DPF are reported in ‘Net income from financial instruments designated at fair value’.
In Asia, the effect of the lower investment returns was more than offset by additional reserves established for new business written, consistent with the increase in net insurance premiums earned, particularly in Hong Kong, as a result of successful sales campaigns and the recruitment of additional insurance sales managers.
In addition, the increase in reserves in 2009 on the now closed UK motor insurance book, which reflected the rising incidence and severity of claims at that time, did not recur. The decision taken in 2010 not to renew certain contracts in our Irish business resulted in a further decrease in net insurance claims incurred and movement in liabilities to policyholders.
Loan impairment charges and other credit risk provisions
| | | | | | | | | | | | | |
| | | 2010 | | | 2009 | | | 2008 | |
| | | US$m | | | US$m | | | US$m | |
| Loan impairment charges | | | | | | | | | | | | |
| New allowances net of allowance releases | | | 14,568 | | | | 25,832 | | | | 24,965 | |
| Recoveries of amounts previously written off | | | (1,020 | ) | | | (890 | ) | | | (834 | ) |
| | | | | | | |
| | | | | | | | | | | | | |
| | | | 13,548 | | | | 24,942 | | | | 24,131 | |
| | | | | | | | | | | | | |
| | | | | | | |
| Individually assessed allowances | | | 2,625 | | | | 4,458 | | | | 2,064 | |
| Collectively assessed allowances | | | 10,923 | | | | 20,484 | | | | 22,067 | |
| | | | | | | |
| | | | | | | | | | | | | |
| Impairment of available-for-sale debt securities | | | 472 | | | | 1,474 | | | | 737 | |
| Other credit risk provisions | | | 19 | | | | 72 | | | | 69 | |
| | | | | | | |
| | | | | | | | | | | | | |
| Loan impairment charges and other credit risk provisions | | | 14,039 | | | | 26,488 | | | | 24,937 | |
| | | | | | | |
| | | | | | | | | | | | | |
| | | | % | | | | % | | | | % | |
| | | | | | | | | | | | | |
| – as a percentage of net operating income excluding the effect of fair value movements in respect of credit spread on own debt and before loan impairment charges and other credit risk provisions | | | 20.6 | | | | 36.4 | | | | 33.2 | |
| Impairment charges on loans and advances to customers as a percentage of gross average loans and advances to customers | | | 1.5 | | | | 2.8 | | | | 2.5 | |
| | | | | | | | | | | | | |
| | | US$m | | | US$m | | | US$m | |
| | | | | | | | | | | | | |
| Customer impaired loans | | | 28,091 | | | | 30,606 | | | | 25,352 | |
| Customer loan impairment allowances | | | 20,083 | | | | 25,542 | | | | 23,909 | |
On a reported basis, loan impairment charges and other credit risk provisions were US$14bn, a decline of 47% compared with 2009 and 48% on an underlying basis. There was improvement across all regions and in all customer groups.
At 31 December 2010, the aggregate balance of customer loan impairment allowances was US$20.1bn. This represented 2.2% of gross loans and advances to customers (net of reverse repos and settlement accounts) compared with 3.0% at 31 December 2009.
24
Report of the Directors: Operating and Financial Review(continued)
We actively managed down some of our higher risk portfolios in all regions and enhanced credit quality through tighter underwriting and increased focus on the sale of secured products to customers where we already held a banking relationship. Loan impairment charges in our CMB and GB&M businesses fell as economic conditions improved and we recognised fewer large loan impairment charges against specific clients than in 2009.
Loan impairment charges and other credit risk provisions of US$14bn were 48% or US$12.8bn lower than in 2009.
Impairments on available-for-sale debt securities declined markedly to US$472m from the US$1.5bn reported in 2009, mainly reflecting a slowing in the rate of anticipated losses in the underlying collateral pools.
The most significant decline in loan impairment charges was in our HSBC Finance portfolios inthe US, where lending balances reduced and delinquency levels improved.
Loan impairment charges and other credit risk provisions in the US declined by 48% to US$7.9bn, the lowest level since 2006, representing 57% of the Group’s total reduction compared with 2009. This mainly occurred in the US PFS business, where loan impairment charges declined by US$6.1bn to US$8.0bn, primarily in the Card and Retail Services business of HSBC Finance and, to a lesser extent, in the run-off consumer finance portfolios.
In Cards and Retail Services, loan impairment charges declined by 57% to US$2.2bn. This improvement reflected the continuing effects of additional steps taken from the fourth quarter of 2007 to manage risk, including tightening underwriting criteria, lowering credit limits and reducing the number of active cards. An increased focus by our customers on reducing outstanding credit card debt helped improve delinquency levels.
Loan impairment charges in our Consumer Lending and Mortgage Services businesses declined by 29% to US$5.7bn, due to the continued run-off of lending balances in these portfolios and lower delinquency balances. Total loss severities on foreclosed loans improved compared with 2009, reflecting an increase in the number of properties for which we accepted a deed in lieu of foreclosure or a short sale, both of which result in lower losses compared with loans which are subject to a formal foreclosure process.
During 2010, state and federal prosecutors announced investigations into foreclosure practices
of certain mortgage service providers. As a result, we expect that the scrutiny of documents will increase, and in some states additional verification of information will be required. If these trends continue there may be delays in their processing. See page 83 for more information on the investigation into US foreclosure practices.
In HSBC Bank USA, loan impairment charges in PFS fell by 92% to US$50m, reflecting lower lending balances and improved credit quality in the residential mortgage portfolio.
In GB&M in the US, a net release of loan impairment charges and other credit risk provisions reflected the improved credit environment and a release of impairments of available-for-sale ABSs as mentioned previously. In CMB, loan impairment charges declined by US$194m as the improved economic conditions resulted in credit upgrades on certain accounts, and fewer downgrades across all business lines.
Inthe UK, loan impairment charges in PFS and CMB declined as economic conditions improved and interest rates remained at low levels, resulting in an improvement in delinquency levels. In PFS, loan impairment charges fell by 35% to US$1.1bn as we actively reduced our exposure to unsecured lending, while collections increased mainly due to programmes implemented to improve performance. In the UK secured lending book, credit quality continued to be high and loan impairment charges remained at low levels. In CMB, loan impairment charges declined by US$159m due to strengthened credit risk management and improved collections, notably in the UK property, retail and service sectors.
Loan impairment charges and other credit provisions fell markedly in GB&M reflecting the improved credit outlook, loan restructuring activity and the non-recurrence of significant charges against a small number of clients in the financial and property sectors. Credit risk provisions on certain available-for-sale ABSs also reduced.
Loan impairment charges and other credit risk provisions inLatin Americadeclined by 44% to US$1.5bn. In PFS, loan impairment charges of US$1.2bn were 45% lower, mainly in Mexico due to a reduction in balances and improved delinquency rates in our credit card portfolio. In Brazil, they also declined as we managed down the size of certain consumer finance portfolios and economic conditions improved. In 2010, initiatives taken in the region to improve the quality of the loan portfolios continued. These steps included the tightening of underwriting criteria, reducing and, in some
25
Report of the Directors: Operating and Financial Review(continued)
instances, eliminating the use of higher risk, non-branch sales channels, and continued investment in our collections infrastructure. In our CMB portfolios, loan impairment charges and other credit risk provisions declined by 50% to US$293m, as improved economic conditions and credit quality resulted in lower specific impairment charges in all sectors.
In theMiddle East, loan impairment charges and other credit risk provisions fell by 53% to US$627m as lower loan impairment charges in both PFS and CMB were partly offset by an increase in GB&M following restructuring activities. In our PFS business, loan impairment charges declined by 61% to US$227m, reflecting a marked decline in delinquency levels and lower lending balances, particularly in our credit card and unsecured personal lending book, as a result of managing down higher risk portfolios. Credit limits were tightened and our customer acquisition strategy was revised in the region to concentrate on Premier and Advance customers. This resulted in an improvement in credit quality. In CMB, lower loan impairment charges
reflected a reduction in collective impairment charges and fewer specific loan impairment charges as economic conditions improved.
InRest of Asia-Pacific, loan impairment charges declined as the credit environment improved. In India, loan impairment charges fell by 83% to US$82m, mainly in PFS as certain unsecured lending portfolios and the higher risk elements of the credit card portfolio were managed down, and economic conditions improved. Impairment charges also declined in CMB, due to the non-recurrence of charges against specific technology-related exposures in 2009. Partly offsetting these increases were higher specific loan impairment charges in GB&M.
InHong Kong, loan impairment charges fell by 77% to US$114m, as economic conditions improved and fewer large specific loan impairment charges were reported against the CMB and GB&M portfolios. Loan impairment charges fell in PFS too, mainly on unsecured lending as unemployment and bankruptcy levels reduced.
Operating expenses
| | | | | | | | | | | | | |
| | | 2010 | | | 2009 | | | 2008 | |
| | | US$m | | | US$m | | | US$m | |
| | | | | | | | | | | | | |
By expense category | | | | | | | | | | | | |
| Employee compensation and benefits | | | 19,836 | | | | 18,468 | | | | 20,792 | |
| Premises and equipment (excluding depreciation and impairment) | | | 4,348 | | | | 4,099 | | | | 4,305 | |
| General and administrative expenses | | | 10,808 | | | | 9,293 | | | | 10,955 | |
| | | | | | | |
| | | | | | | | | | | | | |
| Administrative expenses | | | 34,992 | | | | 31,860 | | | | 36,052 | |
| Depreciation and impairment of property, plant and equipment | | | 1,713 | | | | 1,725 | | | | 1,750 | |
| Amortisation and impairment of intangible assets | | | 983 | | | | 810 | | | | 733 | |
| Goodwill impairment | | | – | | | | – | | | | 10,564 | |
| | | | | | | |
| | | | | | | | | | | | | |
| Operating expenses | | | 37,688 | | | | 34,395 | | | | 49,099 | |
| | | | | | | |
Staff numbers (full time equivalents)
| | | | | | | | | | | | | |
| | | At 31 December |
| | | 2010 | | | 2009 | | | 2008 | |
| | | | | | | | | | | | | |
| Europe | | | 75,698 | | | | 76,703 | | | | 82,093 | |
| Hong Kong | | | 29,171 | | | | 27,614 | | | | 29,330 | |
| Rest of Asia-Pacific | | | 91,607 | | | | 87,141 | | | | 89,706 | |
| Middle East | | | 8,676 | | | | 8,281 | | | | 8,453 | |
| North America | | | 33,865 | | | | 35,458 | | | | 44,725 | |
| Latin America | | | 56,044 | | | | 54,288 | | | | 58,559 | |
| | | | | | | |
| | | | | | | | | | | | | |
| Staff numbers | | | 295,061 | | | | 289,485 | | | | 312,866 | |
| | | | | | | |
Operating expenses increased by 10% to US$37.7bn on a reported basis and by 8% on an underlying basis. Significant one-off items included aggregate payroll taxes of US$324m levied on 2009 bonuses in the UK and France, and the curtailment of certain benefits delivered through pension schemes, which generated accounting credits of US$148m in the US and US$480m (US$499m as reported) in the UK in
2010 and 2009, respectively. Excluding these items, expenses grew by 6% as we continued to invest in our operational infrastructure, customer-facing and support staff, and GB&M’s capabilities and platforms.
Employee compensation and benefitsincreased by 7%, partly due to the net effect of the curtailment gains and the payroll tax referred to above.
26
Report of the Directors: Operating and Financial Review(continued)
Excluding these items, staff costs rose by 3%. Performance-related costs increased, primarily in Asia, reflecting improved business performance and increased staff numbers. While year-end staff numbers increased as the pace of recruitment accelerated in the second half of the year, average staff numbers remained below 2009 levels. The growth in staff numbers in Asia encompassed both customer-facing and back-office staff supporting business growth and increased operational capacity. In Latin America, staff costs grew following union-agreed salary increases and the recruitment of customer-facing and regional support staff, primarily in the latter part of the year. We also increased resources in our Global Service Centres as we continued to move processes there.
Staff costs declined in the US due to the non-recurrence of restructuring costs associated with the closure of the Consumer Lending branch network in 2009. Also, headcount fell due to the sale of the vehicle finance portfolio and related servicing platform. Similarly, reported staff numbers fell in Europe due to the sale of the insurance broking business in the UK and business reorganisation in France, though this was partly offset by higher numbers of customer-facing staff in the UK and Turkey.
Premises and equipment costsincreased as rental costs in the UK, the US and France rose
following the sale and leaseback of 8 Canada Square, London and our headquarters buildings in the US and France, combined with business expansion in Asia and Europe and refurbishment costs in Europe and Latin America. This was partly offset by lower costs in the US following the closure of the Consumer Lending branch offices and the non-recurrence of the related restructuring costs.
General and administrative expensesrose, reflecting in part higher marketing and advertising costs. These grew in North America in Card and Retail Services, partly from complying with the CARD Act. Marketing costs also rose in Asia and Latin America in support of the launch of Advance and sales campaigns for credit cards and investment products. Project costs increased from various initiatives to enhance operational capabilities, in connection with which consultancy and contractors’ fees rose, primarily in the UK as GB&M continued to invest in strategic initiatives to drive future revenue growth. These included the development of Prime Services and equity market capabilities, and the expansion of the Rates and foreign exchange e-commerce platforms.
Travel costs increased as we increased our focus on international connectivity and business growth. Costs also increased due to litigation provisions in North America and Europe.
Cost efficiency ratios
| | | | | | | | | | | | | |
| | | 2010 | | | 2009 | | | 2008 | |
| | | % | | | % | | | % | |
| | | | | | | | | | | | | |
HSBC | | | 55.2 | | | | 52.0 | | | | 60.1 | |
| | | | | | | | | | | | | |
Personal Financial Services | | | 57.7 | | | | 51.7 | | | | 76.4 | |
| | | | | | | |
| Europe | | | 67.4 | | | | 68.7 | | | | 62.7 | |
| Hong Kong | | | 35.3 | | | | 34.9 | | | | 32.2 | |
| Rest of Asia-Pacific | | | 85.1 | | | | 81.2 | | | | 81.5 | |
| Middle East | | | 62.2 | | | | 53.5 | | | | 53.2 | |
| North America | | | 46.9 | | | | 38.1 | | | | 106.8 | |
| Latin America | | | 72.1 | | | | 66.7 | | | | 59.7 | |
| | | | | | | |
| | | | | | | | | | | | | |
Commercial Banking | | | 49.4 | | | | 46.4 | | | | 43.0 | |
| | | | | | | | | | | | | |
| | | | | | | |
| Europe | | | 51.9 | | | | 47.4 | | | | 44.2 | |
| Hong Kong | | | 32.2 | | | | 33.7 | | | | 26.2 | |
| Rest of Asia-Pacific | | | 49.2 | | | | 47.0 | | | | 45.9 | |
| Middle East | | | 36.4 | | | | 33.8 | | | | 32.0 | |
| North America | | | 46.6 | | | | 47.7 | | | | 46.1 | |
| Latin America | | | 65.7 | | | | 57.0 | | | | 55.0 | |
| | | | | | | |
| | | | | | | | | | | | | |
Global Banking and Markets | | | 49.9 | | | | 39.1 | | | | 67.3 | |
| | | | | | | | | | | | | |
Global Private Banking | | | 65.8 | | | | 60.5 | | | | 58.3 | |
Our cost efficiency ratio worsened by 3.2 percentage points on a reported basis and by 8.4 percentage points to 55.8% on an underlying basis.
In PFS, there was a deterioration of 5.7 percentage points in the cost efficiency ratio. Operating expenses remained broadly unchanged as a rise in costs in
27
Report of the Directors: Operating and Financial Review(continued)
Asia in support of business expansion was broadly offset by strict cost control across the Group and lower costs in the US. Revenue fell, largely in the run-off portfolio and in Card and Retail Services in North America.
In CMB, the cost efficiency ratio deteriorated by 2.9 percentage points as we continued to invest for future revenue growth in those markets that we see as central to international connectivity. Revenue grew in all regions, albeit at a slower pace, resulting in a deterioration in the cost efficiency ratio, with the exception of Hong Kong where strong revenue growth led to an improvement of 1.5 percentage points.
In GB&M, the cost efficiency ratio deteriorated by 12.1 percentage points reflecting the one-off payroll and bonus taxes in the UK and France. Excluding them, the ratio deteriorated by 10.5 percentage points following a rise in costs related to higher support costs and continued investment in strategic initiatives being undertaken to drive future revenue growth. Revenue fell during 2010 mainly due to lower net interest income in Balance Sheet Management and lower trading income.
In GPB, the cost efficiency ratio deteriorated by 5.3 percentage points as costs increased, reflecting the hiring of front-line staff, investment in systems and higher compliance costs coupled with lower revenue in the low interest rate environment.
Share of profit in associates and joint ventures
| | | | | | | | | | | | | |
| | | 2010 | | | 2009 | | | 2008 | |
| | | US$m | | | US$m | | | US$m | |
| | | | | | | | | | | | | |
| Associates | | | | | | | | | | | | |
| Bank of Communications Co., Limited | | | 987 | | | | 754 | | | | 741 | |
| Ping An Insurance (Group) Company of China, Limited | | | 848 | | | | 551 | | | | 324 | |
| Industrial Bank Co., Limited | | | 327 | | | | 216 | | | | 221 | |
| The Saudi British Bank | | | 161 | | | | 172 | | | | 251 | |
| Other | | | 156 | | | | 42 | | | | 63 | |
| | | | | | | |
| | | | | | | | | | | | | |
| Share of profit in associates | | | 2,479 | | | | 1,735 | | | | 1,600 | |
| Share of profit in joint ventures | | | 38 | | | | 46 | | | | 61 | |
| | | | | | | |
| | | | | | | | | | | | | |
| Share of profit in associates and joint ventures | | | 2,517 | | | | 1,781 | | | | 1,661 | |
| | | | | | | |
The share of profit from associates and joint ventures increased by 41% to US$2.5bn on both a reported and an underlying basis as our associates in mainland China capitalised on the improved economic conditions in region.
Our share of profits in Ping An Insurance increased due to strong insurance sales performance, while fee income and lending growth resulted in
higher profits from the Bank of Communications Co., Limited (‘Bank of Communciations’) and from Industrial Bank Co., Limited (‘Industrial Bank’).
These results were partly offset by a decrease in our share of profits from The Saudi British Bank as revenue declined amidst challenging economic conditions.
Tax expense
| | | | | | | | | | | | | |
| | | 2010 | | | 2009 | | | 2008 | |
| | | US$m | | | US$m | | | US$m | |
| | | | | | | | | | | | | |
| Profit before tax | | | 19,037 | | | | 7,079 | | | | 9,307 | |
| Tax expense | | | (4,846 | ) | | | (385 | ) | | | (2,809 | ) |
| | | | | | | |
| | | | | | | | | | | | | |
| Profit after tax | | | 14,191 | | | | 6,694 | | | | 6,498 | |
| | | | | | | |
| | | | | | | | | | | | | |
| Effective tax rate | | | 25.5 | % | | | 5.4 | % | | | 30.2 | % |
The most significant factor influencing the year on year changes to the effective tax rate is the changing geographical split of profits, including the relative proportion of tax on the share of profits in associates and joint ventures included within profit before tax. The impact of the tax on profit on associates and joint ventures included within pre-tax profits was a reduction in the effective tax rate of 3.7% in 2010 and 7.1% in 2009.
In 2010 HSBC’s US operations achieved taxable profits, principally as a result of realising a taxable gain from an internal reorganisation which increased the effective tax rate by 6.4%. If this was excluded the effective tax rate would be 19.1% which is in line with the geographic profile of the Group.
28
Report of the Directors: Operating and Financial Review(continued)
Reconciliation of reported and underlying profit before tax
| | | | | | | | | | | | | | | | | | | | | | | | | | | | | | | | | | | | | |
| | | 2009 compared with 2008 | |
| | | | | | | | | | | | | | | 2008 | | | | | | | | | | | | | | | | |
| | | 2008 | | | 2008 | | | | | | | at 2009 | | | 2009 | | | 2009 | | | 2009 | | | Re- | | | Under- | |
| | | as | | | adjust- | | | Currency | | | exchange | | | as | | | adjust- | | | under- | | | ported | | | lying | |
| | | reported | | | ments | 10 | | translation | 11 | | rates | 16 | | reported | | | ments | 10 | | lying | | | change | 13 | | change | 13 |
| HSBC | | US$m | | | US$m | | | US$m | | | US$m | | | US$m | | | US$m | | | US$m | | | % | | | % | |
| | | | | | | | | | | | | | | | | | | | | | | | | | | | | | | | | | | | | |
| Net interest income | | | 42,563 | | | | (65 | ) | | | (2,062 | ) | | | 40,436 | | | | 40,730 | | | | (53 | ) | | | 40,677 | | | | (4 | ) | | | 1 | |
| Net fee income | | | 20,024 | | | | (58 | ) | | | (1,315 | ) | | | 18,651 | | | | 17,664 | | | | (6 | ) | | | 17,658 | | | | (12 | ) | | | (5 | ) |
Changes in fair value14 | | | 6,570 | | | | (6,570 | ) | | | – | | | | – | | | | (6,533 | ) | | | 6,533 | | | | – | | | | | | | | | |
| Gains on disposal of French regional banks | | | 2,445 | | | | (2,445 | ) | | | – | | | | – | | | | – | | | | – | | | | – | | | | (100 | ) | | | | |
| Other income | | | 10,080 | | | | (680 | ) | | | (1,597 | ) | | | 7,803 | | | | 14,320 | | | | (298 | ) | | | 14,022 | | | | 42 | | | | 80 | |
| | | | | | | | | | | | | | | | | | | | | | | |
| | | | | | | | | | | | | | | | | | | | | | | | | | | | | | | | | | | | | |
Net operating income15 | | | 81,682 | | | | (9,818 | ) | | | (4,974 | ) | | | 66,890 | | | | 66,181 | | | | 6,176 | | | | 72,357 | | | | (19 | ) | | | 8 | |
| | | | | | | | | | | | | | | | | | | | | | | | | | | | | | | | | | | | | |
| Loan impairment charges and other credit risk provisions | | | (24,937 | ) | | | 6 | | | | 709 | | | | (24,222 | ) | | | (26,488 | ) | | | – | | | | (26,488 | ) | | | (6 | ) | | | (9 | ) |
| | | | | | | | | | | | | | | | | | | | | | | |
| | | | | | | | | | | | | | | | | | | | | | | | | | | | | | | | | | | | | |
| Net operating income | | | 56,745 | | | | (9,812 | ) | | | (4,265 | ) | | | 42,668 | | | | 39,693 | | | | 6,176 | | | | 45,869 | | | | (30 | ) | | | 8 | |
| | | | | | | | | | | | | | | | | | | | | | | | | | | | | | | | | | | | | |
| Operating expenses (excluding goodwill impairment) | | | (38,535 | ) | | | 68 | | | | 2,655 | | | | (35,812 | ) | | | (34,395 | ) | | | 31 | | | | (34,364 | ) | | | 11 | | | | 4 | |
| | | | | | | | | | | | | | | | | | | | | | | | | | | | | | | | | | | | | |
| Goodwill impairment | | | (10,564 | ) | | | – | | | | – | | | | (10,564 | ) | | | – | | | | – | | | | – | | | | 100 | | | | 100 | |
| | | | | | | | | | | | | | | | | | | | | | | |
| | | | | | | | | | | | | | | | | | | | | | | | | | | | | | | | | | | | | |
| Operating profit | | | 7,646 | | | | (9,744 | ) | | | (1,610 | ) | | | (3,708 | ) | | | 5,298 | | | | 6,207 | | | | 11,505 | | | | (31 | ) | | | | |
| | | | | | | | | | | | | | | | | | | | | | | | | | | | | | | | | | | | | |
| Income from associates | | | 1,661 | | | | – | | | | 25 | | | | 1,686 | | | | 1,781 | | | | – | | | | 1,781 | | | | 7 | | | | 6 | |
| | | | | | | | | | | | | | | | | | | | | | | |
| | | | | | | | | | | | | | | | | | | | | | | | | | | | | | | | | | | | | |
| Profit before tax | | | 9,307 | | | | (9,744 | ) | | | (1,585 | ) | | | (2,022 | ) | | | 7,079 | | | | 6,207 | | | | 13,286 | | | | (24 | ) | | | | |
| | | | | | | | | | | | | | | | | | | | | | | |
| | | | | | | | | | | | | | | | | | | | | | | | | | | | | | | | | | | | | |
| By geographical region | | | | | | | | | | | | | | | | | | | | | | | | | | | | | | | | | | | | |
| | | | | | | | | | | | | | | | | | | | | | | | | | | | | | | | | | | | | |
| Europe | | | 10,869 | | | | (6,221 | ) | | | (1,054 | ) | | | 3,594 | | | | 4,009 | | | | 2,561 | | | | 6,570 | | | | (63 | ) | | | 83 | |
| Hong Kong | | | 5,461 | | | | (5 | ) | | | 20 | | | | 5,476 | | | | 5,029 | | | | 1 | | | | 5,030 | | | | (8 | ) | | | (8 | ) |
| Rest of Asia-Pacific | | | 4,722 | | | | (3 | ) | | | (184 | ) | | | 4,535 | | | | 4,200 | | | | (43 | ) | | | 4,157 | | | | (11 | ) | | | (8 | ) |
| Middle East | | | 1,746 | | | | – | | | | (7 | ) | | | 1,739 | | | | 455 | | | | – | | | | 455 | | | | (74 | ) | | | (74 | ) |
| North America | | | (15,528 | ) | | | (3,444 | ) | | | (67 | ) | | | (19,039 | ) | | | (7,738 | ) | | | 3,688 | | | | (4,050 | ) | | | 50 | | | | 79 | |
| Latin America | | | 2,037 | | | | (71 | ) | | | (293 | ) | | | 1,673 | | | | 1,124 | | | | – | | | | 1,124 | | | | (45 | ) | | | (33 | ) |
| | | | | | | | | | | | | | | | | | | | | | | |
| | | | | | | | | | | | | | | | | | | | | | | | | | | | | | | | | | | | | |
| Profit before tax | | | 9,307 | | | | (9,744 | ) | | | (1,585 | ) | | | (2,022 | ) | | | 7,079 | | | | 6,207 | | | | 13,286 | | | | (24 | ) | | | | |
| | | | | | | | | | | | | | | | | | | | | | | |
| | | | | | | | | | | | | | | | | | | | | | | | | | | | | | | | | | | | | |
| By customer group and global business | | | | | | | | | | | | | | | | | | | | | | | | | | | | | | | | | | | | |
| | | | | | | | | | | | | | | | | | | | | | | | | | | | | | | | | | | | | |
| Personal Financial Services | | | (10,974 | ) | | | (148 | ) | | | (457 | ) | | | (11,579 | ) | | | (2,065 | ) | | | (3 | ) | | | (2,068 | ) | | | 81 | | | | 82 | |
| Commercial Banking | | | 7,194 | | | | (486 | ) | | | (665 | ) | | | 6,043 | | | | 4,275 | | | | (318 | ) | | | 3,957 | | | | (41 | ) | | | (35 | ) |
| Global Banking and Markets | | | 3,483 | | | | – | | | | (479 | ) | | | 3,004 | | | | 10,481 | | | | (5 | ) | | | 10,476 | | | | 201 | | | | 249 | |
| Global Private Banking | | | 1,447 | | | | – | | | | (48 | ) | | | 1,399 | | | | 1,108 | | | | – | | | | 1,108 | | | | (23 | ) | | | (21 | ) |
| Other | | | 8,157 | | | | (9,110 | ) | | | 64 | | | | (889 | ) | | | (6,720 | ) | | | 6,533 | | | | (187 | ) | | | | | | | 79 | |
| | | | | | | | | | | | | | | | | | | | | | | |
| | | | | | | | | | | | | | | | | | | | | | | | | | | | | | | | | | | | | |
| Profit before tax | | | 9,307 | | | | (9,744 | ) | | | (1,585 | ) | | | (2,022 | ) | | | 7,079 | | | | 6,207 | | | | 13,286 | | | | (24 | ) | | | | |
| | | | | | | | | | | | | | | | | | | | | | | |
Consolidated income statement
Our reported pre-tax profits in 2009 fell by 24% to US$7.1bn and earnings per share declined to US$0.34. Return on average shareholders’ equity remained broadly at 2008 levels at 5.1% (2008: 4.7%).
On an underlying basis, our profit before tax increased by US$15.3bn compared with 2008. The difference between reported and underlying results is
explained on page 14. Except where otherwise stated, the commentaries in the Financial Summary are on an underlying basis.
Profit before tax on an underlying basis and excluding the goodwill impairment charge of US$10.6bn in 2008, was 56% or US$4.7bn higher.
28(a)
Report of the Directors: Operating and Financial Review(continued)
The increase in profit before tax was driven by strong growth in net operating income in GB&M, in part reflecting the absence of significant write-downs in securities and structured credit positions which had affected results in 2008. More significantly, the business benefited from market share gains in core activities and the effect of early positioning by Balance Sheet Management, in anticipation of the low interest rate environment. Results in 2009 also reflected lower loan impairment charges in North America, partly offset by an increase in loan impairment charges and other credit risk provisions elsewhere.
Although our business in North America continued to record a loss, performance improved as write-downs in GB&M reduced and loan impairment charges in PFS decreased. This resulted from steps taken to curtail origination in 2007 and 2008, which culminated in the closure of the Consumer Lending branch network in the second quarter of 2009, and from our decision to place all consumer finance portfolios other than credit cards into run-off. The closure of the branch network fed through to lower operating expenses during the remainder of the year.
In Hong Kong, economic performance remained robust despite continuing challenges, with our results underpinned by a market-leading share in deposits, residential mortgages, cards and insurance. Overall profitability declined, however, as revenue was driven lower by compressed deposit spreads in the low interest rate environment. Loan impairment charges improved on 2008, remaining low, and operating expenses reflected a disciplined approach to cost management.
In the Rest of Asia-Pacific region, the economic challenges faced were similar to those in Hong Kong and their impact was reflected in lower income and higher loan impairment charges. Income from associates, primarily in mainland China, made a significant positive contribution to the region’s performance. We continued to expand our presence in Rest of Asia-Pacific through organic growth and strategic investment.
Our Middle East operations suffered from a combination of factors: a severe contraction in the economy of Dubai, a fall in oil revenues for much of the year and investment losses incurred by many regional investors. This led to a decline in profit before tax of 74%, primarily due to a significant increase in loan impairment charges. The regional economic downturn and continuing uncertainty affected both retail and corporate customers, particularly in the United Arab Emirates (‘UAE’) where the downturn was most pronounced.
In Europe, we reported an increase in profit before tax on an underlying basis, driven by GB&M in London and Paris. This resulted from a strong performance in Rates and Balance Sheet Management, coupled with the benefit of stabilisation of asset prices and general tightening of credit spreads and lower write-downs in the credit trading business. This was partly offset by a reduction in deposit spreads in PFS and CMB as interest rates fell, and an increase in loan impairment charges in Global Banking, reflecting a deterioration in the credit position of a small number of clients.
The increase in profit before tax was driven by strong growth in GB&M.
In Latin America, the decline in pre-tax profits was driven by an increase in loan impairment charges in PFS and CMB and lower revenues in PFS, partly offset by a strong performance in trading and Balance Sheet Management in GB&M. The lower revenues in PFS were in part due to the continued curtailment of personal unsecured credit exposures, following our adverse experience in 2008, with net interest income also adversely affected by declining interest rates and narrowing spreads.
With the exception of PFS, which continued to be heavily affected by the consumer finance losses in North America, all customer groups remained profitable.
The following items are significant to a comparison of reported results with 2008:
| • | | the non-recurrence of the US$10.6bn goodwill impairment charge in North America recorded in 2008; |
| |
| • | | the non-recurrence of a US$2.4bn gain on the sale of French regional banks in 2008; |
| |
| • | | fair value losses relating to own credit spreads of US$6.5bn in 2009 compared with gains of US$6.6bn in 2008; |
| |
| • | | a US$72m fraud loss relating to Bernard L Madoff Investment Securities LLC (‘Madoff Securities’) in 2009, which was in addition to the US$984m charge reported in 2008; |
| |
| • | | loss from write-downs in legacy securities and structured credit positions amounting to US$0.3bn in 2009 compared with US$5.4bn in 2008; |
| |
| • | | the acquisition in 2008 of the subsidiary, Project Maple II B.V., which owned our headquarters at 8 Canada Square, London E14 5HQ and the subsequent sale of the company and leaseback of |
28(b)
Report of the Directors: Operating and Financial Review(continued)
| | | the property in 2009, resulting in gains of US$0.6bn in 2009 and US$0.4bn in 2008; |
| |
| • | | the sale of the card merchant-acquiring business in the UK, resulting in gains of US$0.3bn in 2009 and US$0.4bn in 2008; |
| |
| • | | the change in the basis of delivering long-term employee benefits in the UK, which generated a one-off accounting gain of US$0.5bn in 2009; and |
| |
| • | | the tax expense of US$0.3bn in 2009, which was lower than in previous years as a result of the geographic distribution of income. We generated profits in low tax rate jurisdictions, principally Asia, and incurred losses in high tax rate jurisdictions, principally the US, which when mixed produced a low overall rate. |
Group performance by income and expense item
Net interest income
Our reported net interest income of US$40.7bn fell by 4% compared with 2008, but was marginally higher on an underlying basis.
Reported net interest income includes the expense of the internal funding of trading assets, while related revenue is reported in trading income. The cost of internally funding these assets declined significantly as a result of the low interest rate environment. In our customer group reporting, this cost is included within trading income.
Deposit spreads were squeezed by the exceptionally low interest rates, although this was partly offset by the reduced cost of funding trading activities. Strong revenues in Balance Sheet Management reflected positions taken in 2008 ahead of the reduction in major currency interest rates. As these positions began to mature, the revenue from Balance Sheet Management’s activities reduced but remained strong in the second half of 2009.
Average interest-earning assets fell slightly due to a decline in term lending, mainly from the run-off portfolios in North America and the decline in consumer credit appetite globally.
Average interest-bearing liabilities also decreased, due to a decline in debt securities in issue as funding requirements for HSBC Finance fell as certain portfolios were managed down. This was largely offset by a rise in current account balances, driven by growth in customer demand for more liquid assets. The very low interest rates led to clients holding an increasing proportion of funds in liquid current accounts rather than in savings and deposit
accounts as they positioned for rising interest rates or prospective investment opportunities.
Competition for deposits and exceptionally low interest rates squeezed deposit margins.
The net interest spread rose slightly. As a result of continuing deposit inflows, we sourced an increasing proportion of our funding from customer accounts, and consequently reduced our reliance on relatively more expensive debt securities. The benefit of this was largely offset, however, by a decline in customer lending, particularly higher yielding personal lending, which reduced the average yield on assets.
Net fee income
Reported net fee income decreased by 12% to US$17.7bn, 5% lower on an underlying basis.
Lower credit card fees and weaker equity markets led to a decline in net fee income.
Credit card fees fell significantly, mainly in North America, reflecting lower transaction volumes, a reduction in cards in issue and changes in customer behaviour which led to lower cash advance, interchange, late and overlimit fees. In the UK, the decrease primarily arose from the disposal of the card-acquiring business to a joint venture in June 2008.
Weaker equity markets and subdued investor sentiment for higher risk products led to a reduction in both the volume and the value of equity-related products. This resulted in a decrease in fees generated from funds under management, global custody and unit trusts, though fees grew from equity capital markets products in GB&M. The impact was particularly marked in the first half of 2009, though market-related fees recovered somewhat in the second half of the year as market values rose and investor appetite for equity products increased.
Account services fees fell, predominantly in North America as the result of a decline in credit card volumes and changes in customer behaviour, and in GPB due to a decrease in fiduciary deposit commissions as lower interest rates drove down balances.
Insurance broking fees also fell, mainly due to lower origination volumes of credit-related products, principally in the US consumer finance business, and reduced payment protection business in the UK.
Corporate credit facility and underwriting fees increased strongly on the back of higher debt originations in Europe and North America which
28(c)
Report of the Directors: Operating and Financial Review(continued)
accompanied the considerable reconstruction and refinancing of corporate balance sheets in 2009.
Net trading income
Reported net trading income increased by 50% to US$9.9bn, 83% higher on an underlying basis.
Reported trading income excludes the interest expense of the internal funding of trading assets. As noted in ‘Net interest income’, the cost of internally funding these assets declined significantly as a result of the low interest rate environment.
The Credit business benefited from a general tightening of credit spreads following a return of liquidity to much of the market, and the write-downs on legacy positions in Credit trading declined significantly following the stabilisation of asset prices.
Net trading income rose by 83% on an underlying basis.
An increase in Rates revenues, particularly in the first half of the year, reflected increased market share and client trading volumes, wider bid-offer spreads and early positioning for interest rate movements. Partly offsetting these gains, fair value losses were recorded on our structured liabilities as a result of credit spreads tightening, compared with gains in this area in 2008.
Equities benefited from the non-recurrence of the US$984m charge reported in 2008 in respect of Madoff Securities. The core Equities business also took advantage of a changed competitive landscape to capture a greater share of business in strategic markets from key institutional clients.
Foreign exchange trading revenues were well ahead of 2007, but fell short of the record year in 2008. This reflected a combination of reduced customer volumes from lower trade flows and investment activity, and relatively lower market volatility.
Tightening credit spreads led to losses of US$429m on credit default swap transactions in parts of the Global Banking portfolio. In 2008, gains of US$912m were reported on these credit default swaps as a result of widening credit spreads.
A reduction in net interest income on trading activities reflected the sharp fall in interest rates at the end of 2008 but was partly compensated for by a reduction in the internal funding cost of trading activities, which is reported in ‘Net interest income’.
Income from non-qualifying hedges related to mark-to-market gains on cross-currency swaps as the
US dollar depreciated against sterling, and on interest rate swaps as US dollar long and medium term interest rates increased over the year. In 2008, appreciation of the US dollar and a fall in interest rates led to mark-to-market losses on these instruments.
During the second half of 2008, we reclassified US$17.9bn of assets from ‘held for trading’ to ‘loans and receivables’ and ‘available for sale’ following the IASB’s amendment to International Accounting Standard (‘IAS’) 39. Had these reclassifications not taken place and the assets had continued to be accounted for on a fair value basis, we would have recorded additional gains of US$1.5bn in 2009 (2008: losses of US$3.5bn).
Net income from financial instruments designated at fair value
We designate certain financial instruments at fair value to remove or reduce accounting mismatches in measurement or recognition, or where financial instruments are managed and their performance is evaluated together on a fair value basis. All income and expense from financial instruments designated at fair value are included in this line except for interest arising from our issued debt securities and related derivatives managed in conjunction with those debt securities, which is recognised in ‘Interest expense’.
We principally use the fair value designation in the following instances (for which all numbers are ‘reported’):
| • | | for certain fixed-rate long-term debt issues whose rate profile has been changed to floating through interest rate swaps as part of a documented interest rate management strategy. Approximately US$63bn (2008: US$59bn) of our debt issues have been accounted for using the fair value option. |
| |
| | | The movement in fair value of these debt issues includes the effect of own credit spread changes and any ineffectiveness in the economic relationship between the related swaps and own debt. As credit spreads widen or narrow, accounting profits or losses, respectively, are booked. The size and direction of the accounting consequences of changes in own credit spread and ineffectiveness can be volatile from year to year, but do not alter the cash flows envisaged as part of the documented interest rate management strategy. As a consequence, gains and losses arising from changes in own credit spread on long-term debt are not regarded internally as part of managed performance and are excluded from underlying results. Similarly, such gains and |
28(d)
Report of the Directors: Operating and Financial Review(continued)
| | | losses are ignored in the calculation of regulatory capital; |
| |
| • | | for US$15bn (2008: US$11bn) of financial assets held to meet liabilities under insurance contracts, and certain liabilities under investment contracts with discretionary participation features; and |
| |
| • | | for US$8bn (2008: US$7bn) of financial assets held to meet liabilities under unit-linked and other investment contracts, as well as the associated liabilities. |
A net expense from financial instruments designated at fair value of US$3.5bn was reported compared with income of US$3.9bn in 2008.
A significant change in credit spread on our own debt in 2009 reversed the movement in 2008.
On an underlying basis, we reported income of US$3.0bn in 2009 compared with an expense of US$2.6bn in 2008. The large difference between the reported and underlying results is due to the exclusion of the effect of credit spread-related movements in the fair value of our own long-term debt from underlying performance.
Income of US$3.8bn was recorded due to a fair value movement on assets held to back insurance and investment contracts, compared with an expense of US$4.8bn in 2008. This reflected investment gains in the current year driven by improved market performance, predominantly affecting the value of assets held in unit-linked and participating funds in Hong Kong, the UK and France.
| • | | To the extent that the investment gains related to assets held to back investment contracts, the expense associated with the corresponding increase in liabilities to customers was also recorded under net income from financial instruments designated at fair value. This expense amounted to US$1.3bn in 2009 compared with an income of US$1.5bn in 2008 when liabilities fell in line with declining asset markets. |
| |
| • | | To the extent that the investment gains related to assets held to back insurance contracts, they were offset by a corresponding increase in ‘Net insurance claims and movement in liabilities to policyholders’ to reflect the extent to which unit-linked policyholders, in particular, participate in the investment performance experienced in the associated asset portfolios. |
Gains less losses from financial investments
Reported gains less losses from financial investments increased by US$323m to US$520m. On an underlying basis, they increased by US$546m.
Net gains on the disposal of debt securities increased significantly, due to gains recorded on the sale of mortgage-backed securities in North America. They were supplemented by smaller gains, principally on the disposal of available-for-sale bonds in Latin America and the UK.
Sales of Visa shares contributed significant gains during 2008, with additional gains from further sales in 2009. Other gains recognised during 2008, including those recorded on the sale of MasterCard shares, were not repeated in 2009.
A significantly lower level of impairments on equity investments was recognised in 2009 than in 2008 in Asia, Europe and North America, reflecting the improvement in the economic situation and equity markets. Of the investments on which material impairments were recognised in 2008, a significant amount reversed during 2009 due to share price appreciation, notably in India and, to a lesser extent, Vietnam; however, under IFRSs all subsequent increases in the fair value are treated as a revaluation and are recognised in other comprehensive income rather than the income statement.
Net earned insurance premiums
Reported net earned insurance premiums amounted to US$10.5bn, a decrease of 3% compared with 2008. On an underlying basis, net earned insurance premiums increased by 3%. Growth was recorded in Asia, Brazil and France, but this was largely offset by significant declines in the UK and the US.
Net earned insurance premiums continued to grow in Asia, mainly from the launch of new products including a life insurance product designed for high net worth individuals and a guaranteed savings product. In Hong Kong, we retained our position as the leading bancassurer and increased net earned insurance premiums as a result of higher sales of unit-linked and whole life products.
Growth in insurance premiums in Asia, Brazil and France was largely offset by declines in the UK and US.
In Latin America, premium growth was driven by higher sales of pension and life products in Brazil, partly due to a number of customers switching their personal pension annuities to us.
28(e)
Report of the Directors: Operating and Financial Review(continued)
In France, growth was significantly influenced by a large one-off reinsurance transaction in June 2008, which passed insurance premiums to a third-party reinsurance provider. Adjusting for this, net earned insurance premiums were ahead of 2008 despite a significant reduction in the distribution network following the disposal of the French regional banks in July 2008.
In the UK, demand for the Guaranteed Income Bond savings product declined as HSBC offered more favourable rates on an alternative deposit product. As the deposit product was a savings bond rather than an insurance contract, its income was recorded under net interest income, while the associated fall in sales of insurance products led to a US$1.1bn reduction in insurance premium income with an equivalent decrease in ‘Net insurance claims incurred and movement in liabilities to policyholders’, as described below.
The reduction in origination volumes in the consumer finance business in North America also led to correspondingly lower sales of credit protection insurance as the consumer finance business was closed.
Other operating income
Reported other operating income of US$2.8bn was 54% higher than in 2008. This included a US$280m gain related to the sale of the remaining stake in the card merchant-acquiring business in the UK, compared with a US$425m gain in 2008 from the sale of the first tranche. In 2008, results also included gains of US$71m related to the sale of our stake in Financiera Independencia. On an underlying basis, other operating income rose by 163%, driven mainly by an increase in insurance-related income in Hong Kong, a rise in gains on property disposals and lower losses on foreclosed properties.
Increased insurance income in Hong Kong, higher gains on property disposals and lower losses on foreclosed properties in the US helped drive an underlying US$1.5bn rise in other operating income.
Losses recognised on assets held for sale declined as losses on foreclosed properties in HSBC Finance decreased, partly due to lower inventory levels following delays in the foreclosure process and partly due to some stabilisation in real estate prices.
Property gains of US$576m were recognised in respect of the sale and leaseback of 8 Canada Square, London which was effected through the disposal of our entire shareholding in Project Maple II B.V. (‘PMII’) to the National Pension Service of Korea.
In 2008, we reported a gain of US$416m in respect of the purchase of PMII.
An increase in insurance sales to new customers in Hong Kong resulted in positive movements in the present value of in-force (‘PVIF’) long-term insurance business. Further positive movements arose from refining the income recognition methodology used in respect of long-term insurance contracts in HSBC Finance. In 2008, a similar refinement in Brazil and our introduction of enhanced benefits to existing pension products in the UK, resulted in favourable movements in PVIF.
In Hong Kong, a gain of US$110m was recognised in respect of a property disposal, and in Argentina a gain was realised on the sale of the head office building.
Other operating income includes higher gains on the sale of prime residential mortgage portfolios in the US, gains from the extinguishment of certain debt issued by our mortgage securitisation vehicles in the UK and lower costs associated with the provision of support to certain money market funds.
Net insurance claims incurred and movement in liabilities to policyholders
Reported net insurance claims incurred and movement in liabilities to policyholders increased by 81% to US$12.5bn. On an underlying basis, they increased by 94%.
The increase in net insurance claims incurred and movement in liabilities to policyholders mainly reflected the improvement in investment market performance compared with 2008 described above under ‘Financial instruments designated at fair value’. Higher investment gains were broadly matched by movement in liabilities to policyholders on unit-linked and, to a certain extent, participating policies whose policyholders share in the investment performance of the supporting assets. The gains generated on the assets held to support insurance contract liabilities are reported in ‘Net income from financial instruments designated at fair value’.
New business growth in a number of regions during 2009, particularly Hong Kong and Singapore, also contributed to an increase in the movement in liabilities to policyholders, as did the non-recurrence of a large one-off reinsurance transaction in France in 2008. The decline in sales of a Guaranteed Income Bond noted above had a corresponding effect on movement in liabilities to policyholders in the UK.
As a consequence of a rising incidence and severity of claims, aggregate charges of US$310m were made to strengthen reserves in the UK motor
28(f)
Report of the Directors: Operating and Financial Review(continued)
book and the Irish reinsurance business during 2009. The UK motor insurance business was placed into run-off in September 2009.
Loan impairment charges and other credit risk provisions
Reported loan impairment charges and other credit risk provisions were US$26.5bn in 2009, an increase of 6% over 2008, 9% on an underlying basis. Within this, collectively assessed impairment allowances declined while individually assessed impairment allowances continued to increase.
Our aggregate outstanding customer loan impairment allowances at 31 December 2009 of US$25.5bn represented 3% of gross customer advances (net of reverse repos and settlement accounts) compared with 2.6% at the end of 2008.
Loan impairment charges declined in certain businesses, notably PFS in North America and CMB in Hong Kong, but this was more than offset by increases elsewhere, primarily on individually significant loans within GB&M and more broadly on CMB exposures outside Hong Kong as the global economic downturn adversely affected the ability of many customers to service their loan commitments. As a consequence, loan impairment charges rose despite an underlying 9% decline in gross loans and advances to customers which was driven mainly by the run-off of the US consumer finance portfolios.
In our US PFS business, loan impairment charges declined by 11% to US$14.2bn, as additional delinquencies due to the continued deterioration in the US economy were more than offset by the effect of lower balances in the run-off portfolios in HSBC Finance.
In HSBC Finance, loan impairment charges decreased by 12%. The reduction arose in most portfolios, but mainly in Mortgage Services as the portfolio continued to run off. In Consumer Lending, loan impairment charges increased, particularly in the unsecured personal lending portfolio, due to a deterioration in the 2006 and 2007 vintages and, to a lesser extent, first lien real estate secured loans, which was partly offset by lower loan impairment charges in the real estate secured portfolio. Loan impairment charges in the Card and Retail Services portfolio decreased despite the state of the US economy and higher levels of unemployment and personal bankruptcy. The main reason was the decline in card balances following actions taken to manage risk beginning in the fourth quarter of 2007 and continuing through 2009, and stable credit conditions.
In HSBC Bank USA, increased loan impairment charges in the personal lending portfolios were due to additional delinquencies which resulted in increased write-offs in the prime first lien mortgage loan portfolios as house prices continued to deteriorate in certain markets.
Loan impairment charges and other credit risk provisions increased significantly in GB&M. Loan impairment charges increased, reflecting the impairment of a small number of exposures in the financial and property sectors in Europe and the Middle East. Further impairments were also recognised in respect of certain asset-backed securities held in the available-for-sale portfolio, reflecting mark-to-market losses which we judged to be significantly in excess of the likely ultimate cash losses.
Loan impairment charges declined in PFS in the US but rose in CMB outside Hong Kong and in GB&M.
In the UK, loan impairment charges rose in both the CMB and PFS portfolios. However, despite the contraction in the economy, charges remained a low proportion of the portfolio. In CMB, loan impairment charges largely reflected economic weakness in a broad range of sectors.
In UK PFS, loan impairment charges also increased as unemployment rose. This was seen primarily in the credit card and unsecured personal loan portfolios. In the residential mortgage portfolios, delinquency rates decreased as we continued to benefit from very limited exposure to buy-to-let and self-certified mortgages. Our mortgage exposure continued to be well secured, with an average loan-to-value ratio for new UK business in HSBC Bank’s mortgage portfolio, excluding First Direct, of under 55% in 2009, compared with 59% in 2008.
In the Middle East, our loan impairment charges increased markedly from US$280m to US$1.3bn as the region experienced a significant economic contraction in activity, predominantly in real estate and construction, which particularly affected the UAE. CMB recorded a number of specific loan impairment charges and a significant increase in collective loan impairment charges. Lower employment in the region, largely driven by the decline in construction activity, led to a rise in loan impairment charges in PFS, particularly in the credit card and personal lending portfolios.
In Latin America, our portfolios were affected by the weaker economic environment for much of the year. In PFS, loan impairment charges rose by 12% to US$2.0bn, with increased delinquencies in
28(g)
Report of the Directors: Operating and Financial Review(continued)
credit cards, mortgages, vehicle finance and payroll loans due to higher unemployment. In the Brazilian CMB portfolios, higher delinquencies were experienced primarily in the business banking and mid-market segments. In Mexico, action taken in 2008 to curtail originations and increase collection resources held loan impairment charges broadly unchanged notwithstanding the deterioration in the economy and the impact of the H1N1 virus.
In India, as in Mexico, curtailment of origination activity in unsecured personal lending slowed the increase in loan impairment charges in the unsecured credit card and personal lending portfolios in PFS. In CMB, a higher number of corporate failures including a number of fraud-related losses, led to increased loan impairment charges.
Loan impairment charges and other credit risk provisions in Hong Kong decreased by 35% to US$500m as the economic environment improved in 2009, credit conditions recovered and international trade volumes improved.
In GPB, loan impairment charges increased from a very low level, largely attributable to a specific charge relating to a single client relationship in the US.
Operating expenses
Reported operating expenses fell by US$14.7bn to US$34.4bn, with the most significant feature being the non-recurrence of the goodwill impairment charge of US$10.6bn in 2008 to fully write off goodwill in PFS in North America. Excluding this and on an underlying basis, operating expenses fell by 4%.
Underlying operating expenses excluding goodwill impairment fell by 4%.
Employee compensation and benefitsfell by 4% as costs in the US declined following the closure of the branch-based consumer finance business in the first quarter of 2009. Average headcount in most regions was lower and this was reflected in lower costs. In the UK, a change in the basis of delivering death-in-service, ill health and early retirement benefits for some UK employees generated a one-off accounting gain of US$499m which was partly offset by increased regular pension costs. There were higher performance-related costs in GB&M reflecting its results. The UK and French governments announced one-off taxes in late 2009 in respect of certain bonuses payable by banks and banking groups. In both countries there is uncertainty over the interpretation of the draft proposals, and detailed analysis of individual awards
in the context of the final legislation will be required to determine the precise effect of the taxes. The estimated tax payable under the proposals as currently drafted is US$355m in the UK and US$45m in France. The taxes will be payable and accounted for in 2010 once the legislation is enacted.
Premises and equipment costsincreased marginally with higher rental costs reflecting the sale and leaseback of a number of properties in 2008. One-off costs incurred due to the closure of the Consumer Lending branch network in the US were partly offset by savings resulting from the closure.
General and administrative expensesfell as we focused on managing costs tightly and increasing efficiency. Marketing and advertising costs fell across the Group, most notably in Card and Retail Services in North America, and in the UK. Travel and entertainment costs, and expenditure related to services contracted to third parties, fell, primarily in Europe and North America. Better use of direct channels, increased automation of manual processes, enhanced utilisation of global service centres and elimination of redundant systems continued to be driven through our One HSBC programme. In North America, cost savings also resulted in the Consumer Lending Business from the discontinuation of loan originations and the closure of branches.
Share of profit in associates and joint ventures
The share of profit in associates and joint ventures was US$1.8bn, an increase of 7% on 2008, and 6% on an underlying basis.
Our share of profits from Ping An Insurance increased by 62% as a result of the non-recurrence of its impairment of its investment in Fortis SA/NV and Fortis N.V. (‘Fortis’) in 2008 and an increase in new business sales and investment returns which were boosted by a recovery in equity markets during 2009. This was partly offset by the non-recurrence of favourable changes to investment assumptions in the first half of 2008.
6% underlying increase in share of profit in associates and joint ventures.
Our share of profits from the Bank of Communications remained in line with 2008 as higher fee and trading income and a lower tax charge were broadly offset by a decline in net interest income and higher loan impairment charges.
Profits from The Saudi British Bank were lower than in 2008 as an increase in loan impairment charges was only partly offset by increased operating income.
28(h)
Report of the Directors: Operating and Financial Review(continued)
The share of profits from joint ventures fell due to a decline in the profitability of HSBC Saudi Arabia Ltd as a result of a slowdown in initial public offerings (‘IPO’s) and a decline in assets under management. This was partly offset by an increase in profits from HSBC Merchant Services UK Ltd in the first half of 2009 compared with the second half of 2008. HSBC Merchant Services UK Ltd was created in June 2008 and sold in June 2009.
Tax expense
The most significant factor influencing the year on year changes to the effective tax rate is the changing geographical split of profits, including the relative proportion of tax on the share of profits in associates and joint ventures included within profit before tax. The impact of the tax on profit on associates and joint ventures included within pre-tax profits was a reduction in the effective tax rate of 7.1% in 2009 and 5.1% in 2008.
In 2009 the losses in HSBC’s US operations were tax effected at the local tax rate of 35.4%, while the profits in the rest of the HSBC Group were taxed at their local rates which averaged 18.8%. The combination of these two rates produced an overall tax effect of 5.44%.
The tax expense and effective tax rate also fell in 2009 due to the non-recurrence of the US$10.6bn goodwill impairment charge in North America which, for tax purposes, was non-deductible and hence increased the effective tax rate by some 16% in 2008.
28(i)
Report of the Directors: Operating and Financial Review(continued)
Consolidated balance sheet
Five-year summary consolidated balance sheet and selected financial information
| | | | | | | | | | | | | | | | | | | | | |
| | | At 31 December |
| | | 2010 | | | 2009 | | | 2008 | | | 2007 | | | 2006 | |
| | | US$m | | | US$m | | | US$m | | | US$m | | | US$m | |
| | | | | | | | | | | | | | | | | | | | | |
ASSETS | | | | | | | | | | | | | | | | | | | | |
| Cash and balances at central banks | | | 57,383 | | | | 60,655 | | | | 52,396 | | | | 21,765 | | | | 12,732 | |
| Trading assets | | | 385,052 | | | | 421,381 | | | | 427,329 | | | | 445,968 | | | | 328,147 | |
| Financial assets designated at fair value | | | 37,011 | | | | 37,181 | | | | 28,533 | | | | 41,564 | | | | 20,573 | |
| Derivatives | | | 260,757 | | | | 250,886 | | | | 494,876 | | | | 187,854 | | | | 103,702 | |
| Loans and advances to banks | | | 208,271 | | | | 179,781 | | | | 153,766 | | | | 237,366 | | | | 185,205 | |
Loans and advances to customers35 | | | 958,366 | | | | 896,231 | | | | 932,868 | | | | 981,548 | | | | 868,133 | |
| Financial investments | | | 400,755 | | | | 369,158 | | | | 300,235 | | | | 283,000 | | | | 204,806 | |
| Other assets | | | 147,094 | | | | 149,179 | | | | 137,462 | | | | 155,201 | | | | 137,460 | |
| | | | | | | | | | | | |
| | | | | | | | | | | | | | | | | | | | | |
| Total assets | | | 2,454,689 | | | | 2,364,452 | | | | 2,527,465 | | | | 2,354,266 | | | | 1,860,758 | |
| | | | | | | | | | | | |
| | | | | | | | | | | | | | | | | | | | | |
LIABILITIES AND EQUITY | | | | | | | | | | | | | | | | | | | | |
Liabilities | | | | | | | | | | | | | | | | | | | | |
| Deposits by banks | | | 110,584 | | | | 124,872 | | | | 130,084 | | | | 132,181 | | | | 99,694 | |
| Customer accounts | | | 1,227,725 | | | | 1,159,034 | | | | 1,115,327 | | | | 1,096,140 | | | | 896,834 | |
| Trading liabilities | | | 300,703 | | | | 268,130 | | | | 247,652 | | | | 314,580 | | | | 226,608 | |
| Financial liabilities designated at fair value | | | 88,133 | | | | 80,092 | | | | 74,587 | | | | 89,939 | | | | 70,211 | |
| Derivatives | | | 258,665 | | | | 247,646 | | | | 487,060 | | | | 183,393 | | | | 101,478 | |
| Debt securities in issue | | | 145,401 | | | | 146,896 | | | | 179,693 | | | | 246,579 | | | | 230,325 | |
| Liabilities under insurance contracts | | | 58,609 | | | | 53,707 | | | | 43,683 | | | | 42,606 | | | | 17,670 | |
| Other liabilities | | | 109,954 | | | | 148,414 | | | | 149,150 | | | | 113,432 | | | | 103,010 | |
| | | | | | | | | | | | |
| | | | | | | | | | | | | | | | | | | | | |
| Total liabilities | | | 2,299,774 | | | | 2,228,791 | | | | 2,427,236 | | | | 2,218,850 | | | | 1,745,830 | |
| | | | | | | | | | | | |
| | | | | | | | | | | | | | | | | | | | | |
Equity | | | | | | | | | | | | | | | | | | | | |
| Total shareholders’ equity | | | 147,667 | | | | 128,299 | | | | 93,591 | | | | 128,160 | | | | 108,352 | |
| Non-controlling interests | | | 7,248 | | | | 7,362 | | | | 6,638 | | | | 7,256 | | | | 6,576 | |
| | | | | | | | | | | | |
| | | | | | | | | | | | | | | | | | | | | |
| Total equity | | | 154,915 | | | | 135,661 | | | | 100,229 | | | | 135,416 | | | | 114,928 | |
| | | | | | | | | | | | |
| | | | | | | | | | | | | | | | | | | | | |
| Total equity and liabilities | | | 2,454,689 | | | | 2,364,452 | | | | 2,527,465 | | | | 2,354,266 | | | | 1,860,758 | |
| | | | | | | | | | | | |
| | | | | | | | | | | | | | | | | | | | | |
Five-year selected financial information | | | | | | | | | | | | | | | | | | | | |
| | | | | | | | | | | | | | | | | | | | | |
| Called up share capital | | | 8,843 | | | | 8,705 | | | | 6,053 | | | | 5,915 | | | | 5,786 | |
Capital resources36,37 | | | 167,555 | | | | 155,729 | | | | 131,460 | | | | 152,640 | | | | 127,074 | |
| Undated subordinated loan capital | | | 2,781 | | | | 2,785 | | | | 2,843 | | | | 2,922 | | | | 3,219 | |
Preferred securities and dated subordinated loan capital38 | | | 54,421 | | | | 52,126 | | | | 50,307 | | | | 49,472 | | | | 42,642 | |
| | | | | | | | | | | | | | | | | | | | | |
Risk weighted assets and capital ratios36 | | | | | | | | | | | | | | | | | | | | |
| Risk weighted assets | | | 1,103,113 | | | | 1,133,168 | | | | 1,147,974 | | | | 1,123,782 | | | | 938,678 | |
| | | | | | | | | | | | | | | | | | | | | |
| | | | % | | | | % | | | | % | | | | % | | | | % | |
| | | | | | | | | | | | | | | | | | | | | |
| Tier 1 ratio | | | 12.1 | | | | 10.8 | | | | 8.3 | | | | 9.3 | | | | 9.4 | |
| Total capital ratio | | | 15.2 | | | | 13.7 | | | | 11.4 | | | | 13.6 | | | | 13.5 | |
| | | | | | | | | | | | | | | | | | | | | |
Financial statistics | | | | | | | | | | | | | | | | | | | | |
| Loans and advances to customers as a percentage of customer accounts | | | 78.1 | | | | 77.3 | | | | 83.6 | | | | 89.5 | | | | 96.8 | |
| Average total shareholders’ equity to average total assets | | | 5.53 | | | | 4.72 | | | | 4.87 | | | | 5.69 | | | | 5.97 | |
| | | | | | | | | | | | | | | | | | | | | |
Net asset value per ordinary share at year-end39 (US$) | | | 7.94 | | | | 7.17 | | | | 7.44 | | | | 10.72 | | | | 9.24 | |
| Number of US$0.50 ordinary shares in issue (millions) | | | 17,686 | | | | 17,408 | | | | 12,105 | | | | 11,829 | | | | 11,572 | |
| | | | | | | | | | | | | | | | | | | | | |
| Closing foreign exchange translation rates to US$: | | | | | | | | | | | | | | | | | | | | |
| US$1: £ | | | 0.644 | | | | 0.616 | | | | 0.686 | | | | 0.498 | | | | 0.509 | |
| US$1: € | | | 0.748 | | | | 0.694 | | | | 0.717 | | | | 0.679 | | | | 0.759 | |
For footnotes, see page 83.
A more detailed consolidated balance sheet is contained in the Financial Statements on page 240.
29
Report of the Directors: Operating and Financial Review(continued)
Total assets amounted to US$2.5 trillion, 4% higher than at 31 December 2009. Excluding the effect of currency movements, underlying total assets increased by 5%. This reflected higher mortgage lending in Hong Kong and the UK, strong demand for commercial loans and a rise in trading assets in North America and Asia as a result of customer demand, supported by improved liquidity generated by higher deposits and our debt issuance programme.
The Group’s reported tier 1 ratio increased from 10.8% to 12.1% due to the contribution from profits attributable to shareholders for the year net of dividends paid, the issue of hybrid capital securities net of redemptions, and a reduction in the reported level of risk-weighted assets (‘RWA’s). The latter was driven by a decline in some retail portfolio exposures in North America as a result of run-off, partly offset by the effect of lending growth in Asia. Market risk RWAs decreased as a result of reduced volatility and continuing exposure management. For more details of capital and RWAs, see page 177.
The following commentary is on an underlying basis.
Assets
Cash and balances at central banksdecreased by 4% as a result of lower year-end cash balances in North America as excess liquidity was redeployed into highly-rated government debt securities. This was partly offset by higher year-end cash balances in Europe.
Trading assetsfell by 6%, due to the deconsolidation of the Constant Net Asset Value (‘CNAV’) funds totalling US$44bn (see Note 43 on the Financial Statements). This was offset, in part, by higher issuance of and customer demand for government and government agency debt securities, particularly in North America and Asia, and an increase in holdings of equities to hedge derivative positions arising from a rise in client trading activity. Higher customer-driven trading volumes also resulted in an increase in reverse repo balances in North America; this was partly offset by a reduction in reverse repo balances in Europe due to market uncertainty.
Strong increase in loans and advances to customers and customer accounts, notably in Asia, drove balance sheet growth.
Financial assets designated at fair valuegrew by 3% due to an increase in volumes in equity funds and a rise in the fair value of equity securities held
within the insurance business, particularly in Europe and Hong Kong, as market values recovered and client risk appetite returned. This was partly offset by the sale of European government debt securities by Balance Sheet Management.
Derivative assetsrose by 8%. This was driven by increases in the fair value of interest rate contracts as a result of downward shifts of major yield curves, offset by higher netting from increased trading with clearing houses. The notional value of outstanding contracts also rose, reflecting an increase in the number of open transactions compared with 2009.
Loans and advances to banksincreased by 16% due to higher placements with commercial and central banks in Europe and Latin America.
Loans and advances to customersgrew by 8% as we targeted commercial loans and, in the improved economic conditions, demand grew from customers, notably in Asia. The increase in demand for credit, along with competitive pricing, also drove continued growth in mortgage lending in Hong Kong and the UK, though mortgage balances declined in North America as the Consumer Lending and Mortgage Services portfolios continued to run off and credit card lending fell.
Financial investmentsrose by 9%, mainly in North America and Europe, as Balance Sheet Management redeployed cash into available-for-sale treasury bills and government agency debt securities. This was partly offset by a decline in financial investments in Asia, as a result of disposals and debt securities that matured and were not replaced to support growth in commercial lending.
Liabilities
Deposits by banksdecreased by 8%, reflecting a notable decline in central bank deposits in Europe which was partly offset by an increase in central bank deposits in Asia.
Customer accountswere 7% higher, driven by an overall increase in savings and current accounts across most regions, particularly in Asia and Europe. Growth in Premier and online savings contributed to a significant increase in current account balances as customers responded well to targeted promotional campaigns.
Trading liabilitiesincreased by 16%. Higher repo balances in North America were reported as a result of increased trading volumes of treasury and corporate bonds driven by market volatility in the bond market. In Europe, short bond and equity
30
Report of the Directors: Operating and Financial Review(continued)
positions used to hedge derivative transactions increased, reflecting higher client demand.
Financial liabilities designated at fair valuerose by 12% due to debt issuances by HSBC entities in Europe during 2010.
Derivative businesses are managed within market risk limits and, as a consequence, the increase in the value ofderivative liabilitiesbroadly matched that of derivative assets.
Debt securities in issuewere in line with 2009, as new issuances of medium-term notes by HSBC entities in Europe during 2010 were offset by lower funding requirements in North America as the consumer finance portfolios in run-off declined.
Liabilities under insurance contractsgrew by 12%. This was driven by strong life insurance sales
in Hong Kong following the launch of several new products, and gains on unit-linked products as investment market values improved.
Other liabilitieswere 26% lower than at 31 December 2009 due to the deconsolidation of the CNAV funds (see ‘Trading assets’ above).
Equity
Total shareholders’ equityincreased by 17%, driven by profits generated during the year and the issue of Perpetual Subordinated Capital Securities, a form of tier 1 hybrid capital securities, in June 2010. In addition, the negative balance on the available-for-sale reserve declined from US$10.0bn at 31 December 2009 to US$4.1bn at 31 December 2010, largely reflecting improvements in the market value of assets.
Reconciliation of reported and underlying assets and liabilities
| | | | | | | | | | | | | | | | | | | | | | | | | | | | | |
| | | 31 December 2010 compared with 31 December 2009 |
| | | | | | | | | | | 31 Dec 09 | | | | | | | | | | | | | | |
| | | 31 Dec 09 | | | | | | | at 31 Dec 10 | | | Under- | | | 31 Dec 10 | | | | | | | Under- | |
| | | as | | | Currency | | | exchange | | | lying | | | as | | | Reported | | | lying | |
| | | reported | | | Translation | 40 | | rates | | | change | | | reported | | | change | | | change | |
| HSBC | | US$m | | | US$m | | | US$m | | | US$m | | | US$m | | | % | | | % | |
| | | | | | | | | | | | | | | | | | | | | | | | | | | | | |
| Cash and balances at central banks | | | 60,655 | | | | (731 | ) | | | 59,924 | | | | (2,541 | ) | | | 57,383 | | | | (5 | ) | | | (4 | ) |
| Trading assets | | | 421,381 | | | | (12,483 | ) | | | 408,898 | | | | (23,846 | ) | | | 385,052 | | | | (9 | ) | | | (6 | ) |
| Financial assets designated at fair value | | | 37,181 | | | | (1,134 | ) | | | 36,047 | | | | 964 | | | | 37,011 | | | | – | | | | 3 | |
| Derivative assets | | | 250,886 | | | | (9,285 | ) | | | 241,601 | | | | 19,156 | | | | 260,757 | | | | 4 | | | | 8 | |
| Loans and advances to banks | | | 179,781 | | | | (5 | ) | | | 179,776 | | | | 28,495 | | | | 208,271 | | | | 16 | | | | 16 | |
| Loans and advances to customers | | | 896,231 | | | | (10,788 | ) | | | 885,443 | | | | 72,923 | | | | 958,366 | | | | 7 | | | | 8 | |
| Financial investments | | | 369,158 | | | | (268 | ) | | | 368,890 | | | | 31,865 | | | | 400,755 | | | | 9 | | | | 9 | |
| | | | | | | | | | | | | | | | | | | | | | | | | | | | | |
| Other assets | | | 149,179 | | | | (1,826 | ) | | | 147,353 | | | | (259 | ) | | | 147,094 | | | | (1 | ) | | | – | |
| | | | | | | | | | | | | | | | | | | |
| | | | | | | | | | | | | | | | | | | | | | | | | | | | | |
| Total assets | | | 2,364,452 | | | | (36,520 | ) | | | 2,327,932 | | | | 126,757 | | | | 2,454,689 | | | | 4 | | | | 5 | |
| | | | | | | | | | | | | | | | | | | |
| | | | | | | | | | | | | | | | | | | | | | | | | | | | | |
| Deposits by banks | | | 124,872 | | | | (4,182 | ) | | | 120,690 | | | | (10,106 | ) | | | 110,584 | | | | (11 | ) | | | (8 | ) |
| Customer accounts | | | 1,159,034 | | | | (8,064 | ) | | | 1,150,970 | | | | 76,755 | | | | 1,227,725 | | | | 6 | | | | 7 | |
| Trading liabilities | | | 268,130 | | | | (8,660 | ) | | | 259,470 | | | | 41,233 | | | | 300,703 | | | | 12 | | | | 16 | |
| Financial liabilities designated at fair value | | | 80,092 | | | | (1,570 | ) | | | 78,522 | | | | 9,611 | | | | 88,133 | | | | 10 | | | | 12 | |
| Derivative liabilities | | | 247,646 | | | | (9,262 | ) | | | 238,384 | | | | 20,281 | | | | 258,665 | | | | 4 | | | | 9 | |
| | | | | | | | | | | | | | | | | | | | | | | | | | | | | |
| Debt securities in issue | | | 146,896 | | | | (1,066 | ) | | | 145,830 | | | | (429 | ) | | | 145,401 | | | | (1 | ) | | | – | |
| Liabilities under insurance contracts | | | 53,707 | | | | (1,593 | ) | | | 52,114 | | | | 6,495 | | | | 58,609 | | | | 9 | | | | 12 | |
| Other liabilities | | | 148,414 | | | | (431 | ) | | | 147,983 | | | | (38,029 | ) | | | 109,954 | | | | (26 | ) | | | (26 | ) |
| | | | | | | | | | | | | | | | | | | |
| | | | | | | | | | | | | | | | | | | | | | | | | | | | | |
| Total liabilities | | | 2,228,791 | | | | (34,828 | ) | | | 2,193,963 | | | | 105,811 | | | | 2,299,774 | | | | 3 | | | | 5 | |
| | | | | | | | | | | | | | | | | | | |
| | | | | | | | | | | | | | | | | | | | | | | | | | | | | |
| Total shareholders’ equity | | | 128,299 | | | | (1,679 | ) | | | 126,620 | | | | 21,047 | | | | 147,667 | | | | 15 | | | | 17 | |
| Non-controlling interests | | | 7,362 | | | | (13 | ) | | | 7,349 | | | | (101 | ) | | | 7,248 | | | | (2 | ) | | | (1 | ) |
| | | | | | | | | | | | | | | | | | | |
| | | | | | | | | | | | | | | | | | | | | | | | | | | | | |
| Total equity | | | 135,661 | | | | (1,692 | ) | | | 133,969 | | | | 20,946 | | | | 154,915 | | | | 14 | | | | 16 | |
| | | | | | | | | | | | | | | | | | | |
| | | | | | | | | | | | | | | | | | | | | | | | | | | | | |
| Total equity and liabilities | | | 2,364,452 | | | | (36,520 | ) | | | 2,327,932 | | | | 126,757 | | | | 2,454,689 | | | | 4 | | | | 5 | |
| | | | | | | | | | | | | | | | | | | |
For footnote, see page 83.
In 2010, the effect of acquisitions was not material.
31
Report of the Directors: Operating and Financial Review(continued)
Reconciliation of reported and underlying loans and advances to customers and customer accounts by geographical region
| | | | | | | | | | | | | | | | | | | | | | | | | | | | | |
| | | 31 December 2010 compared with 31 December 2009 |
| | | | | | | | | | | 31 Dec 09 | | | | | | | | | | | | | | |
| | | 31 Dec 09 | | | | | | | at 31 Dec 10 | | | Under- | | | 31 Dec 10 | | | | | | | Under- | |
| | | as | | | Currency | | | exchange | | | lying | | | as | | | Reported | | | lying | |
| | | reported | | | translation | 11 | | rates | | | change | | | reported | | | change | | | change | |
| | | US$m | | | US$m | | | US$m | | | US$m | | | US$m | | | % | | | % | |
| | | | | | | | | | | | | | | | | | | | | | | | | | | | | |
Loans and advances to customers (net) | | | | | | | | | | | | | | | | | | | | | | | | | | | | |
| Europe | | | 439,481 | | | | (20,778 | ) | | | 418,703 | | | | 17,096 | | | | 435,799 | | | | (1 | ) | | | 4 | |
| Hong Kong | | | 99,381 | | | | (92 | ) | | | 99,289 | | | | 41,402 | | | | 140,691 | | | | 42 | | | | 42 | |
| Rest of Asia-Pacific | | | 80,043 | | | | 5,802 | | | | 85,845 | | | | 22,886 | | | | 108,731 | | | | 36 | | | | 27 | |
| Middle East | | | 22,844 | | | | (139 | ) | | | 22,705 | | | | 1,921 | | | | 24,626 | | | | 8 | | | | 8 | |
| North America | | | 206,853 | | | | 2,562 | | | | 209,415 | | | | (18,883 | ) | | | 190,532 | | | | (8 | ) | | | (9 | ) |
| Latin America | | | 47,629 | | | | 1,857 | | | | 49,486 | | | | 8,501 | | | | 57,987 | | | | 22 | | | | 17 | |
| | | | | | | | | | | | | | | | | | | |
| | | | | | | | | | | | | | | | | | | | | | | | | | | | | |
| | | | 896,231 | | | | (10,788 | ) | | | 885,443 | | | | 72,923 | | | | 958,366 | | | | 7 | | | | 8 | |
| | | | | | | | | | | | | | | | | | | |
| | | | | | | | | | | | | | | | | | | | | | | | | | | | | |
Customer accounts | | | | | | | | | | | | | | | | | | | | | | | | | | | | |
| Europe | | | 495,019 | | | | (21,560 | ) | | | 473,459 | | | | 18,104 | | | | 491,563 | | | | (1 | ) | | | 4 | |
| Hong Kong | | | 275,441 | | | | (474 | ) | | | 274,967 | | | | 22,517 | | | | 297,484 | | | | 8 | | | | 8 | |
| Rest of Asia-Pacific | | | 133,999 | | | | 8,938 | | | | 142,937 | | | | 15,218 | | | | 158,155 | | | | 18 | | | | 11 | |
| Middle East | | | 32,529 | | | | (320 | ) | | | 32,209 | | | | 1,302 | | | | 33,511 | | | | 3 | | | | 4 | |
| North America | | | 149,157 | | | | 2,259 | | | | 151,416 | | | | 7,070 | | | | 158,486 | | | | 6 | | | | 5 | |
| Latin America | | | 72,889 | | | | 3,093 | | | | 75,982 | | | | 12,544 | | | | 88,526 | | | | 21 | | | | 17 | |
| | | | | | | | | | | | | | | | | | | |
| | | | | | | | | | | | | | | | | | | | | | | | | | | | | |
| | | | 1,159,034 | | | | (8,064 | ) | | | 1,150,970 | | | | 76,755 | | | | 1,227,725 | | | | 6 | | | | 7 | |
| | | | | | | | | | | | | | | | | | | |
Reconciliation of reported and underlying loans and advances to customers and customer accounts by customer groups and global businesses
| | | | | | | | | | | | | | | | | | | | | | | | | | | | | |
| | | 31 December 2010 compared with 31 December 2009 |
| | | | | | | | | | | 31 Dec 09 | | | | | | | | | | | | | | |
| | | 31 Dec 09 | | | | | | | at 31 Dec 10 | | | Under- | | | 31 Dec 10 | | | | | | | Under- | |
| | | as | | | Currency | | | exchange | | | lying | | | as | | | Reported | | | lying | |
| | | reported | | | translation | 11 | | rates | | | change | | | reported | | | change | | | change | |
| | | US$m | | | US$m | | | US$m | | | US$m | | | US$m | | | % | | | % | |
| | | | | | | | | | | | | | | | | | | | | | | | | | | | | |
Loans and advances to customers (net) | | | | | | | | | | | | | | | | | | | | | | | | | | | | |
| Personal Financial Services | | | 399,460 | | | | (2,176 | ) | | | 397,284 | | | | (6,327 | ) | | | 390,957 | | | | (2 | ) | | | (2 | ) |
| Commercial Banking | | | 199,674 | | | | (1,493 | ) | | | 198,181 | | | | 41,105 | | | | 239,286 | | | | 20 | | | | 21 | |
| Global Banking and Markets | | | 256,956 | | | | (6,622 | ) | | | 250,334 | | | | 34,169 | | | | 284,503 | | | | 11 | | | | 14 | |
| Global Private Banking | | | 37,031 | | | | (431 | ) | | | 36,600 | | | | 4,065 | | | | 40,665 | | | | 10 | | | | 11 | |
| Other | | | 3,110 | | | | (66 | ) | | | 3,044 | | | | (89 | ) | | | 2,955 | | | | (5 | ) | | | (3 | ) |
| | | | | | | | | | | | | | | | | | | |
| | | | | | | | | | | | | | | | | | | | | | | | | | | | | |
| | | | 896,231 | | | | (10,788 | ) | | | 885,443 | | | | 72,923 | | | | 958,366 | | | | 7 | | | | 8 | |
| | | | | | | | | | | | | | | | | | | |
| | | | | | | | | | | | | | | | | | | | | | | | | | | | | |
Customer accounts | | | | | | | | | | | | | | | | | | | | | | | | | | | | |
| Personal Financial Services | | | 499,109 | | | | (1,710 | ) | | | 497,399 | | | | 27,785 | | | | 525,184 | | | | 5 | | | | 6 | |
| Commercial Banking | | | 267,388 | | | | (1,537 | ) | | | 265,851 | | | | 20,156 | | | | 286,007 | | | | 7 | | | | 8 | |
| Global Banking and Markets | | | 284,727 | | | | (4,711 | ) | | | 280,016 | | | | 28,437 | | | | 308,453 | | | | 8 | | | | 10 | |
| Global Private Banking | | | 106,533 | | | | (108 | ) | | | 106,425 | | | | 705 | | | | 107,130 | | | | 1 | | | | 1 | |
| Other | | | 1,277 | | | | 2 | | | | 1,279 | | | | (328 | ) | | | 951 | | | | (26 | ) | | | (26 | ) |
| | | | | | | | | | | | | | | | | | | |
| | | | | | | | | | | | | | | | | | | | | | | | | | | | | |
| | | | 1,159,034 | | | | (8,064 | ) | | | 1,150,970 | | | | 76,755 | | | | 1,227,725 | | | | 6 | | | | 7 | |
| | | | | | | | | | | | | | | | | | | |
For footnote, see page 83.
In 2010, the effect of acquisitions was not material.
31(a)
Report of the Directors: Operating and Financial Review(continued)
Average balance sheet and net interest income
Average balances and related interest are shown for the domestic operations of our principal commercial banks by geographical region. ‘Other operations’ comprise the operations of our principal commerical banking and consumer finance entities outside their domestic markets and all other banking operations, including investment banking balances and transactions.
Average balances are based on daily averages for the principal areas of our banking activities with monthly or less frequent averages used elsewhere.
Balances and transactions with fellow subsidiaries are reported gross in the principal commercial banking and consumer finance entities within ‘Other interest-earning assets’ and ‘Other interest-bearing liabilities’ as appropriate and the elimination entries are included within ‘Other operations’ in those two categories.
Net interest margin numbers are calculated by dividing net interest income as reported in the income statement by the average interest-earning assets from which interest income is reported within the ‘Net interest income’ line of the income statement. Interest income and interest expense arising from trading assets and liabilities and the funding thereof is included within ‘Net trading income’ in the income statement.
Assets
| | | | | | | | | | | | | | | | | | | | | | | | | | | | | | | | | | | | | | | |
| | | | | 2010 | | | 2009 | | | 2008 | |
| | | | | Average | | | Interest | | | | | | | Average | | | Interest | | | | | | | Average | | | Interest | | | | |
| | | | | balance | | | income | | | Yield | | | balance | | | income | | | Yield | | | balance | | | income | | | Yield | |
| | | | | US$m | | | US$m | | | % | | | US$m | | | US$m | | | % | | | US$m | | | US$m | | | % | |
| | | | | | | | | | | | | | | | | | | | | | | | | | | | | | | | | | | | | | | |
| Summary | | | | | | | | | | | | | | | | | | | | | | | | | | | | | | | | | | | | |
| | | | | �� | | | | | | | | | | | | | | | | | | | | | | | | | | | | | | | | | | |
| Total interest-earning assets (itemised below) | | | 1,472,294 | | | | 58,345 | | | | 3.96 | | | | 1,384,705 | | | | 62,096 | | | | 4.48 | | | | 1,466,622 | | | | 91,301 | | | | 6.23 | |
| Trading assets63 | | | 332,511 | | | | 6,027 | | | | 1.81 | | | | 357,504 | | | | 7,614 | | | | 2.13 | | | | 428,539 | | | | 16,742 | | | | 3.91 | |
| Financial assets designated at fair value64 | | | 52,692 | | | | 1,033 | | | | 1.96 | | | | 62,143 | | | | 1,032 | | | | 1.66 | | | | 37,303 | | | | 1,108 | | | | 2.97 | |
| Impairment provisions | | | (22,905 | ) | | | | | | | | | | | (26,308 | ) | | | | | | | | | | | (20,360 | ) | | | | | | | | |
| Non-interest-earning assets | | | 664,308 | | | | | | | | | | | | 667,942 | | | | | | | | | | | | 596,885 | | | | | | | | | |
| | | | | | | | | | | | | | | | | | | | | | | | | | | |
| | | | | | | | | | | | | | | | | | | | | | | | | | | | | | | | | | | | | | | |
| Total assets and interest income | | | 2,498,900 | | | | 65,405 | | | | 2.62 | | | | 2,445,986 | | | | 70,742 | | | | 2.89 | | | | 2,508,989 | | | | 109,151 | | | | 4.35 | |
| | | | | | | | | | | | | | | | | | | | | | | | | | | |
| | | | | | | | | | | | | | | | | | | | | | | | | | | | | | | | | | | | | | | |
Short-term funds and loans and advances to banks | | | | | | | | | | | | | | | | | | | | | | | | | | | | | | | | | | | | |
| | | | | | | | | | | | | | | | | | | | | | | | | | | | | | | | | | | | | | | |
| Europe | | HSBC Bank | | | 47,741 | | | | 1,290 | | | | 2.70 | | | | 38,455 | | | | 1,379 | | | | 3.59 | | | | 46,703 | | | | 2,187 | | | | 4.68 | |
| | | HSBC Private Banking Holdings (Suisse) | | | 2,603 | | | | 15 | | | | 0.58 | | | | 4,451 | | | | 43 | | | | 0.97 | | | | 8,040 | | | | 333 | | | | 4.14 | |
| | | HSBC France | | | 47,094 | | | | 337 | | | | 0.72 | | | | 37,239 | | | | 440 | | | | 1.18 | | | | 35,801 | | | | 1,495 | | | | 4.18 | |
| | | | | | | | | | | | | | | | | | | | | | | | | | | | | | | | | | | | | | | |
| Hong Kong | | Hang Seng Bank | | | 14,884 | | | | 222 | | | | 1.49 | | | | 16,626 | | | | 202 | | | | 1.21 | | | | 17,402 | | | | 587 | | | | 3.37 | |
| | | The Hongkong and Shanghai Banking Corporation | | | 16,544 | | | | 117 | | | | 0.71 | | | | 27,903 | | | | 182 | | | | 0.65 | | | | 47,244 | | | | 1,344 | | | | 2.84 | |
| | | | | | | | | | | | | | | | | | | | | | | | | | | | | | | | | | | | | | | |
| Rest of Asia-Pacific | | The Hongkong and Shanghai Banking Corporation | | | 30,288 | | | | 464 | | | | 1.53 | | | | 23,107 | | | | 326 | | | | 1.41 | | | | 27,907 | | | | 881 | | | | 3.16 | |
| | | HSBC Bank Malaysia | | | 5,113 | | | | 126 | | | | 2.46 | | | | 3,776 | | | | 81 | | | | 2.15 | | | | 4,659 | | | | 165 | | | | 3.54 | |
| | | | | | | | | | | | | | | | | | | | | | | | | | | | | | | | | | | | | | | |
| Middle East | | HSBC Bank Middle East | | | 5,335 | | | | 60 | | | | 1.12 | | | | 4,312 | | | | 52 | | | | 1.21 | | | | 6,028 | | | | 188 | | | | 3.12 | |
| | | | | | | | | | | | | | | | | | | | | | | | | | | | | | | | | | | | | | | |
| North America | | HSBC Bank USA | | | 28,653 | | | | 103 | | | | 0.36 | | | | 2,338 | | | | 94 | | | | 4.02 | | | | 9,595 | | | | 328 | | | | 3.42 | |
| | | HSBC Bank Canada | | | 3,823 | | | | 16 | | | | 0.42 | | | | 2,934 | | | | 10 | | | | 0.34 | | | | 3,354 | | | | 107 | | | | 3.19 | |
| | | | | | | | | | | | | | | | | | | | | | | | | | | | | | | | | | | | | | | |
| Latin America | | HSBC Mexico | | | 3,238 | | | | 129 | | | | 3.98 | | | | 3,722 | | | | 149 | | | | 4.00 | | | | 3,682 | | | | 247 | | | | 6.71 | |
| | | Brazilian operations65 | | | 16,102 | | | | 1,525 | | | | 9.47 | | | | 10,490 | | | | 1,003 | | | | 9.56 | | | | 7,959 | | | | 951 | | | | 11.95 | |
| | | HSBC Bank Panama | | | 959 | | | | 8 | | | | 0.83 | | | | 1,187 | | | | 10 | | | | 0.84 | | | | 1,133 | | | | 30 | | | | 2.65 | |
| | | HSBC Bank Argentina | | | 169 | | | | 20 | | | | 11.83 | | | | 256 | | | | 29 | | | | 11.33 | | | | 612 | | | | 43 | | | | 7.03 | |
| | | | | | | | | | | | | | | | | | | | | | | | | | | | | | | | | | | | | | | |
| Other operations | | | 14,196 | | | | 123 | | | | 0.87 | | | | 15,782 | | | | 199 | | | | 1.26 | | | | 19,992 | | | | 760 | | | | 3.80 | |
| | | | | | | | | | | | | | | | | | | | | | | | | | | |
| | | | | | | | | | | | | | | | | | | | | | | | | | | | | | | | | | | | | | | |
| | | | | | 236,742 | | | | 4,555 | | | | 1.92 | | | | 192,578 | | | | 4,199 | | | | 2.18 | | | | 240,111 | | | | 9,646 | | | | 4.02 | |
| | | | | | | | | | | | | | | | | | | | | | | | | | | |
31(b)
Report of the Directors: Operating and Financial Review(continued)
| | | | | | | | | | | | | | | | | | | | | | | | | | | | | | | | | | | | | | | |
| | | | | 2010 | | | 2009 | | | 2008 | |
| | | | | Average | | | Interest | | | | | | | Average | | | Interest | | | | | | | Average | | | Interest | | | | |
| | | | | balance | | | income | | | Yield | | | balance | | | income | | | Yield | | | balance | | | income | | | Yield | |
| | | | | US$m | | | US$m | | | % | | | US$m | | | US$m | | | % | | | US$m | | | US$m | | | % | |
| | | | | | | | | | | | | | | | | | | | | | | | | | | | | | | | | | | | | | | |
| Loans and advances to customers | | | | | | | | | | | | | | | | | | | | | | | | | | | | | | | | | | | | |
| | | | | | | | | | | | | | | | | | | | | | | | | | | | | | | | | | | | | | | |
| Europe | | HSBC Bank | | | 265,163 | | | | 9,761 | | | | 3.68 | | | | 276,602 | | | | 10,898 | | | | 3.94 | | | | 288,214 | | | | 18,587 | | | | 6.45 | |
| | | HSBC Private Banking Holdings (Suisse) | | | 11,987 | | | | 191 | | | | 1.59 | | | | 9,993 | | | | 176 | | | | 1.76 | | | | 12,355 | | | | 494 | | | | 4.00 | |
| | | HSBC France | | | 66,910 | | | | 1,684 | | | | 2.52 | | | | 71,048 | | | | 1,932 | | | | 2.72 | | | | 73,455 | | | | 3,604 | | | | 4.91 | |
| | | HSBC Finance | | | 2,251 | | | | 198 | | | | 8.80 | | | | 3,094 | | | | 319 | | | | 10.31 | | | | 4,808 | | | | 505 | | | | 10.50 | |
| | | | | | | | | | | | | | | | | | | | | | | | | | | | | | | | | | | | | | | |
| Hong Kong | | Hang Seng Bank | | | 51,028 | | | | 1,313 | | | | 2.57 | | | | 42,619 | | | | 1,194 | | | | 2.80 | | | | 42,304 | | | | 1,589 | | | | 3.76 | |
| | | The Hongkong and Shanghai Banking Corporation | | | 65,226 | | | | 1,755 | | | | 2.69 | | | | 55,287 | | | | 1,757 | | | | 3.18 | | | | 54,628 | | | | 2,291 | | | | 4.19 | |
| | | | | | | | | | | | | | | | | | | | | | | | | | | | | | | | | | | | | | | |
| Rest of Asia-Pacific | | The Hongkong and Shanghai Banking Corporation | | | 81,080 | | | | 3,928 | | | | 4.84 | | | | 66,262 | | | | 3,668 | | | | 5.54 | | | | 77,741 | | | | 5,163 | | | | 6.64 | |
| | | HSBC Bank Malaysia | | | 9,614 | | | | 531 | | | | 5.52 | | | | 8,113 | | | | 455 | | | | 5.61 | | | | 8,407 | | | | 553 | | | | 6.58 | |
| | | | | | | | | | | | | | | | | | | | | | | | | | | | | | | | | | | | | | | |
| Middle East | | HSBC Bank Middle East | | | 21,193 | | | | 1,303 | | | | 6.15 | | | | 22,612 | | | | 1,593 | | | | 7.04 | | | | 23,697 | | | | 1,549 | | | | 6.54 | |
| | | | | | | | | | | | | | | | | | | | | | | | | | | | | | | | | | | | | | | |
| North America | | HSBC Bank USA | | | 78,556 | | | | 4,582 | | | | 5.83 | | | | 98,422 | | | | 5,541 | | | | 5.63 | | | | 93,088 | | | | 5,758 | | | | 6.19 | |
| | | HSBC Finance | | | 78,105 | | | | 7,741 | | | | 9.91 | | | | 101,132 | | | | 9,941 | | | | 9.83 | | | | 140,957 | | | | 15,835 | | | | 11.23 | |
| | | HSBC Bank Canada | | | 46,360 | | | | 1,643 | | | | 3.54 | | | | 43,072 | | | | 1,499 | | | | 3.48 | | | | 48,331 | | | | 2,455 | | | | 5.08 | |
| | | | | | | | | | | | | | | | | | | | | | | | | | | | | | | | | | | | | | | |
| Latin America | | HSBC Mexico | | | 12,309 | | | | 1,571 | | | | 12.76 | | | | 12,185 | | | | 1,708 | | | | 14.02 | | | | 17,252 | | | | 2,565 | | | | 14.87 | |
| | | Brazilian operations65 | | | 23,366 | | | | 5,118 | | | | 21.90 | | | | 18,704 | | | | 4,494 | | | | 24.03 | | | | 19,642 | | | | 4,879 | | | | 24.84 | |
| | | HSBC Bank Panama | | | 9,348 | | | | 815 | | | | 8.72 | | | | 9,302 | | | | 864 | | | | 9.29 | | | | 8,620 | | | | 810 | | | | 9.40 | |
| | | HSBC Bank Argentina | | | 2,460 | | | | 367 | | | | 14.92 | | | | 1,940 | | | | 357 | | | | 18.40 | | | | 2,136 | | | | 378 | | | | 17.70 | |
| | | | | | | | | | | | | | | | | | | | | | | | | | | | | | | | | | | | | | | |
| Other operations | | | 33,543 | | | | 1,685 | | | | 5.02 | | | | 29,670 | | | | 1,905 | | | | 6.42 | | | | 28,027 | | | | 1,707 | | | | 6.09 | |
| | | | | | | | | | | | | | | | | | | | | | | | | | | |
| | | | | | | | | | | | | | | | | | | | | | | | | | | | | | | | | | | | | | | |
| | | | | | 858,499 | | | | 44,186 | | | | 5.15 | | | | 870,057 | | | | 48,301 | | | | 5.55 | | | | 943,662 | | | | 68,722 | | | | 7.28 | |
| | | | | | | | | | | | | | | | | | | | | | | | | | | |
| | | | | | | | | | | | | | | | | | | | | | | | | | | | | | | | | | | | | | | |
| Financial investments | | | | | | | | | | | | | | | | | | | | | | | | | | | | | | | | | | | | |
| | | | | | | | | | | | | | | | | | | | | | | | | | | | | | | | | | | | | | | |
| Europe | | HSBC Bank | | | 85,206 | | | | 1,725 | | | | 2.02 | | | | 79,763 | | | | 2,321 | | | | 2.91 | | | | 83,725 | | | | 3,840 | | | | 4.59 | |
| | | HSBC Private Banking Holdings (Suisse) | | | 17,013 | | | | 287 | | | | 1.69 | | | | 15,602 | | | | 363 | | | | 2.33 | | | | 12,018 | | | | 553 | | | | 4.60 | |
| | | HSBC France | | | 4,017 | | | | 102 | | | | 2.54 | | | | 5,327 | | | | 141 | | | | 2.65 | | | | 14,862 | | | | 795 | | | | 5.35 | |
| | | | | | | | | | | | | | | | | | | | | | | | | | | | | | | | | | | | | | | |
| Hong Kong | | Hang Seng Bank | | | 30,334 | | | | 541 | | | | 1.78 | | | | 24,594 | | | | 630 | | | | 2.56 | | | | 24,031 | | | | 1,063 | | | | 4.42 | |
| | | The Hongkong and Shanghai Banking Corporation | | | 65,256 | | | | 477 | | | | 0.73 | | | | 52,965 | | | | 644 | | | | 1.22 | | | | 15,361 | | | | 563 | | | | 3.67 | |
| | | | | | | | | | | | | | | | | | | | | | | | | | | | | | | | | | | | | | | |
| Rest of Asia-Pacific | | The Hongkong and Shanghai Banking Corporation | | | 37,833 | | | | 1,161 | | | | 3.07 | | | | 34,056 | | | | 1,039 | | | | 3.05 | | | | 31,992 | | | | 1,507 | | | | 4.71 | |
| | | HSBC Bank Malaysia | | | 911 | | | | 28 | | | | 3.07 | | | | 1,218 | | | | 37 | | | | 3.04 | | | | 937 | | | | 36 | | | | 3.84 | |
| | | | | | | | | | | | | | | | | | | | | | | | | | | | | | | | | | | | | | | |
| Middle East | | HSBC Bank Middle East | | | 8,086 | | | | 126 | | | | 1.56 | | | | 6,996 | | | | 118 | | | | 1.69 | | | | 5,671 | | | | 144 | | | | 2.54 | |
| | | | | | | | | | | | | | | | | | | | | | | | | | | | | | | | | | | | | | | |
| North America | | HSBC Bank USA | | | 38,541 | | | | 1,156 | | | | 3.00 | | | | 27,253 | | | | 969 | | | | 3.56 | | | | 25,089 | | | | 1,232 | | | | 4.91 | |
| | | HSBC Finance | | | 2,834 | | | | 116 | | | | 4.09 | | | | 2,426 | | | | 120 | | | | 4.95 | | | | 2,908 | | | | 143 | | | | 4.92 | |
| | | HSBC Bank Canada | | | 14,310 | | | | 257 | | | | 1.80 | | | | 10,282 | | | | 205 | | | | 1.99 | | | | 7,037 | | | | 197 | | | | 2.80 | |
| | | | | | | | | | | | | | | | | | | | | | | | | | | | | | | | | | | | | | | |
| Latin America | | HSBC Mexico | | | 7,177 | | | | 388 | | | | 5.41 | | | | 3,916 | | | | 227 | | | | 5.80 | | | | 3,470 | | | | 244 | | | | 7.03 | |
| | | Brazilian operations65 | | | 9,564 | | | | 1,089 | | | | 11.39 | | | | 6,930 | | | | 820 | | | | 11.83 | | | | 6,758 | | | | 853 | | | | 12.62 | |
| | | HSBC Bank Panama | | | 996 | | | | 38 | | | | 3.82 | | | | 604 | | | | 39 | | | | 6.46 | | | | 618 | | | | 47 | | | | 7.61 | |
| | | HSBC Bank Argentina | | | 370 | | | | 58 | | | | 15.68 | | | | 181 | | | | 35 | | | | 19.34 | | | | 287 | | | | 47 | | | | 16.38 | |
| | | | | | | | | | | | | | | | | | | | | | | | | | | | | | | | | | | | | | | |
| Other operations | | | 56,523 | | | | 1,826 | | | | 3.23 | | | | 50,767 | | | | 1,717 | | | | 3.38 | | | | 29,632 | | | | 1,354 | | | | 4.57 | |
| | | | | | | | | | | | | | | | | | | | | | | | | | | |
| | | | | | | | | | | | | | | | | | | | | | | | | | | | | | | | | | | | | | | |
| | | | | | 378,971 | | | | 9,375 | | | | 2.47 | | | | 322,880 | | | | 9,425 | | | | 2.92 | | | | 264,396 | | | | 12,618 | | | | 4.77 | |
| | | | | | | | | | | | | | | | | | | | | | | | | | | |
31(c)
Report of the Directors: Operating and Financial Review(continued)
Assets(continued)
| | | | | | | | | | | | | | | | | | | | | | | | | | | | | | | | | | | | | | | |
| | | | | 2010 | | | 2009 | | | 2008 | |
| | | | | Average | | | Interest | | | | | | | Average | | | Interest | | | | | | | Average | | | Interest | | | | |
| | | | | balance | | | income | | | Yield | | | balance | | | income | | | Yield | | | balance | | | income | | | Yield | |
| | | | | US$m | | | US$m | | | % | | | US$m | | | US$m | | | % | | | US$m | | | US$m | | | % | |
| | | | | | | | | | | | | | | | | | | | | | | | | | | | | | | | | | | | | | | |
| Other interest-earning assets | | | | | | | | | | | | | | | | | | | | | | | | | | | | | | | | | | | | |
| | | | | | | | | | | | | | | | | | | | | | | | | | | | | | | | | | | | | | | |
| Europe | | HSBC Bank | | | 14,255 | | | | 100 | | | | 0.70 | | | | 17,406 | | | | 188 | | | | 1.08 | | | | 25,885 | | | | 630 | | | | 2.43 | |
| | | HSBC Private Banking Holdings (Suisse) | | | 17,738 | | | | 241 | | | | 1.36 | | | | 21,450 | | | | 360 | | | | 1.68 | | | | 21,189 | | | | 875 | | | | 4.13 | |
| | | HSBC France | | | 9,954 | | | | 93 | | | | 0.93 | | | | 11,867 | | | | 172 | | | | 1.45 | | | | 23,414 | | | | 630 | | | | 2.69 | |
| | | | | | | | | | | | | | | | | | | | | | | | | | | | | | | | | | | | | | | |
| Hong Kong | | Hang Seng Bank | | | 1,077 | | | | 13 | | | | 1.21 | | | | 2,618 | | | | 32 | | | | 1.22 | | | | 1,629 | | | | 48 | | | | 2.95 | |
| | | The Hongkong and Shanghai Banking Corporation | | | 27,112 | | | | 260 | | | | 0.96 | | | | 26,657 | | | | 214 | | | | 0.80 | | | | 33,571 | | | | 949 | | | | 2.83 | |
| | | | | | | | | | | | | | | | | | | | | | | | | | | | | | | | | | | | | | | |
| Rest of Asia-Pacific | | The Hongkong and Shanghai Banking Corporation | | | 18,476 | | | | 55 | | | | 0.30 | | | | 19,917 | | | | 106 | | | | 0.53 | | | | 24,492 | | | | 352 | | | | 1.44 | |
| | | HSBC Bank Malaysia | | | 745 | | | | 14 | | | | 1.88 | | | | 407 | | | | 6 | | | | 1.47 | | | | 212 | | | | 7 | | | | 3.30 | |
| | | | | | | | | | | | | | | | | | | | | | | | | | | | | | | | | | | | | | | |
| Middle East | | HSBC Bank Middle East | | | 1,272 | | | | 46 | | | | 3.62 | | | | 541 | | | | 46 | | | | 8.50 | | | | 843 | | | | 63 | | | | 7.47 | |
| | | | | | | | | | | | | | | | | | | | | | | | | | | | | | | | | | | | | | | |
| North America | | HSBC Bank USA | | | 3,467 | | | | 58 | | | | 1.67 | | | | 3,327 | | | | 71 | | | | 2.13 | | | | 3,091 | | | | 188 | | | | 6.08 | |
| | | HSBC Finance | | | 2,895 | | | | 7 | | | | 0.24 | | | | 2,995 | | | | 6 | | | | 0.20 | | | | 2,638 | | | | 63 | | | | 2.39 | |
| | | HSBC Bank Canada | | | 1,287 | | | | 20 | | | | 1.55 | | | | 773 | | | | 9 | | | | 1.16 | | | | 1,025 | | | | 25 | | | | 2.44 | |
| | | | | | | | | | | | | | | | | | | | | | | | | | | | | | | | | | | | | | | |
| Latin America | | HSBC Mexico | | | 158 | | | | 9 | | | | 5.70 | | | | 138 | | | | – | | | | – | | | | 193 | | | | 2 | | | | 1.04 | |
| | | Brazilian operations65 | | | 1,170 | | | | 80 | | | | 6.84 | | | | 1,074 | | | | 46 | | | | 4.28 | | | | 1,438 | | | | 147 | | | | 10.22 | |
| | | HSBC Bank Panama | | | 1,234 | | | | 12 | | | | 0.97 | | | | 1,372 | | | | 9 | | | | 0.66 | | | | 1,807 | | | | 23 | | | | 1.27 | |
| | | HSBC Bank Argentina | | | 87 | | | | – | | | | – | | | | 51 | | | | – | | | | – | | | | 58 | | | | 1 | | | | 1.72 | |
| | | | | | | | | | | | | | | | | | | | | | | | | | | | | | | | | | | | | | | |
| Other operations | | | (102,845 | ) | | | (779 | ) | | | | | | | (111,403 | ) | | | (1,094 | ) | | | | | | | (123,032 | ) | | | (3,688 | ) | | | | |
| | | | | | | | | | | | | | | | | | | | | | | | | | | |
| | | | | | | | | | | | | | | | | | | | | | | | | | | | | | | | | | | | | | | |
| | | | | | (1,918 | ) | | | 229 | | | | (11.94 | ) | | | (810 | ) | | | 171 | | | | (21.11 | ) | | | 18,453 | | | | 315 | | | | 1.71 | |
| | | | | | | | | | | | | | | | | | | | | | | | | | | |
| | | | | | | | | | | | | | | | | | | | | | | | | | | | | | | | | | | | | | | |
| Total interest-earning assets | | | | | | | | | | | | | | | | | | | | | | | | | | | | | | | | | | | | |
| | | | | | | | | | | | | | | | | | | | | | | | | | | | | | | | | | | | | | | |
| Europe | | HSBC Bank | | | 412,365 | | | | 12,876 | | | | 3.12 | | | | 412,226 | | | | 14,786 | | | | 3.59 | | | | 444,527 | | | | 25,244 | | | | 5.68 | |
| | | HSBC Private Banking Holdings (Suisse) | | | 49,341 | | | | 734 | | | | 1.49 | | | | 51,496 | | | | 942 | | | | 1.83 | | | | 53,602 | | | | 2,255 | | | | 4.21 | |
| | | HSBC France | | | 127,975 | | | | 2,216 | | | | 1.73 | | | | 125,481 | | | | 2,685 | | | | 2.14 | | | | 147,532 | | | | 6,524 | | | | 4.42 | |
| | | HSBC Finance | | | 2,251 | | | | 198 | | | | 8.80 | | | | 3,094 | | | | 319 | | | | 10.31 | | | | 4,808 | | | | 505 | | | | 10.50 | |
| | | | | | | | | | | | | | | | | | | | | | | | | | | | | | | | | | | | | | | |
| Hong Kong | | Hang Seng Bank | | | 97,323 | | | | 2,089 | | | | 2.15 | | | | 86,457 | | | | 2,058 | | | | 2.38 | | | | 85,366 | | | | 3,287 | | | | 3.85 | |
| | | The Hongkong and Shanghai Banking Corporation | | | 174,138 | | | | 2,609 | | | | 1.50 | | | | 162,812 | | | | 2,797 | | | | 1.72 | | | | 150,804 | | | | 5,147 | | | | 3.41 | |
| | | | | | | | | | | | | | | | | | | | | | | | | | | | | | | | | | | | | | | |
| Rest of Asia-Pacific | | The Hongkong and Shanghai Banking Corporation | | | 167,677 | | | | 5,608 | | | | 3.34 | | | | 143,342 | | | | 5,139 | | | | 3.59 | | | | 162,132 | | | | 7,903 | | | | 4.87 | |
| | | HSBC Bank Malaysia | | | 16,383 | | | | 699 | | | | 4.27 | | | | 13,514 | | | | 579 | | | | 4.28 | | | | 14,215 | | | | 761 | | | | 5.35 | |
| | | | | | | | | | | | | | | | | | | | | | | | | | | | | | | | | | | | | | | |
| Middle East | | HSBC Bank Middle East | | | 35,886 | | | | 1,535 | | | | 4.28 | | | | 34,461 | | | | 1,809 | | | | 5.25 | | | | 36,239 | | | | 1,944 | | | | 5.36 | |
| | | | | | | | | | | | | | | | | | | | | | | | | | | | | | | | | | | | | | | |
| North America | | HSBC Bank USA | | | 149,217 | | | | 5,899 | | | | 3.95 | | | | 131,340 | | | | 6,675 | | | | 5.08 | | | | 130,863 | | | | 7,506 | | | | 5.74 | |
| | | HSBC Finance | | | 83,834 | | | | 7,864 | | | | 9.38 | | | | 106,553 | | | | 10,067 | | | | 9.45 | | | | 146,503 | | | | 16,041 | | | | 10.95 | |
| | | HSBC Bank Canada | | | 65,780 | | | | 1,936 | | | | 2.94 | | | | 57,061 | | | | 1,723 | | | | 3.02 | | | | 59,747 | | | | 2,784 | | | | 4.66 | |
| | | | | | | | | | | | | | | | | | | | | | | | | | | | | | | | | | | | | | | |
| Latin America | | HSBC Mexico | | | 22,882 | | | | 2,097 | | | | 9.16 | | | | 19,961 | | | | 2,084 | | | | 10.44 | | | | 24,597 | | | | 3,058 | | | | 12.43 | |
| | | Brazilian operations65 | | | 50,202 | | | | 7,812 | | | | 15.56 | | | | 37,198 | | | | 6,363 | | | | 17.11 | | | | 35,797 | | | | 6,830 | | | | 19.08 | |
| | | HSBC Bank Panama | | | 12,537 | | | | 873 | | | | 6.96 | | | | 12,465 | | | | 922 | | | | 7.40 | | | | 12,178 | | | | 910 | | | | 7.47 | |
| | | HSBC Bank Argentina | | | 3,086 | | | | 445 | | | | 14.42 | | | | 2,428 | | | | 421 | | | | 17.34 | | | | 3,093 | | | | 469 | | | | 15.16 | |
| | | | | | | | | | | | | | | | | | | | | | | | | | | | | | | | | | | | | | | |
| Other operations | | | 1,417 | | | | 2,855 | | | | | | | | (15,184 | ) | | | 2,727 | | | | | | | | (45,381 | ) | | | 133 | | | | | |
| | | | | | | | | | | | | | | | | | | | | | | | | | | |
| | | | | | | | | | | | | | | | | | | | | | | | | | | | | | | | | | | | | | | |
| | | | | | 1,472,294 | | | | 58,345 | | | | 3.96 | | | | 1,384,705 | | | | 62,096 | | | | 4.48 | | | | 1,466,622 | | | | 91,301 | | | | 6.23 | |
| | | | | | | | | | | | | | | | | | | | | | | | | | | |
For footnotes, see page 83.
31(d)
Report of the Directors: Operating and Financial Review(continued)
Equity and liabilities
| | | | | | | | | | | | | | | | | | | | | | | | | | | | | | | | | | | | | | | |
| | | | | 2010 | | | 2009 | | | 2008 | |
| | | | | Average | | | Interest | | | | | | Average | | | Interest | | | | | | Average | | | Interest | | | | |
| | | | | balance | | | expense | | | Cost | | | balance | | | expense | | | Cost | | | balance | | | expense | | | Cost | |
| | | | | US$m | | | US$m | | | % | | | US$m | | | US$m | | | % | | | US$m | | | US$m | | | % | |
| | | | | | | | | | | | | | | | | | | | | | | | | | | | | | | | | | | | | | | |
| Summary | | | | | | | | | | | | | | | | | | | | | | | | | | | | | | | | | | | | |
| | | | | | | | | | | | | | | | | | | | | | | | | | | | | | | | | | | | | | | |
| Total interest-bearing liabilities (itemised below) | | | 1,339,390 | | | | 18,904 | | | | 1.41 | | | | 1,353,283 | | | | 21,366 | | | | 1.58 | | | | 1,451,842 | | | | 48,738 | | | | 3.36 | |
| Trading liabilities | | | 258,348 | | | | 3,497 | | | | 1.35 | | | | 205,670 | | | | 3,987 | | | | 1.94 | | | | 277,940 | | | | 11,029 | | | | 3.97 | |
| Financial liabilities designated at fair value (excluding own debt issued) | | | 17,456 | | | | 283 | | | | 1.62 | | | | 15,688 | | | | 293 | | | | 1.87 | | | | 21,266 | | | | 345 | | | | 1.62 | |
| Non-interest bearing current accounts | | | 142,579 | | | | | | | | | | | | 123,271 | | | | | | | | | | | | 98,193 | | | | | | | | | |
| Total equity and other non-interest bearing liabilities | | | 741,127 | | | | | | | | | | | | 748,074 | | | | | | | | | | | | 659,747 | | | | | | | | | |
| | | | | | | | | | | | | | | | | | | | | | | | | | | |
| | | | | | | | | | | | | | | | | | | | | | | | | | | | | | | | | | | | | | | |
| Total equity and liabilities | | | 2,498,900 | | | | 22,684 | | | | 0.91 | | | | 2,445,986 | | | | 25,646 | | | | 1.05 | | | | 2,508,988 | | | | 60,112 | | | | 2.40 | |
| | | | | | | | | | | | | | | | | | | | | | | | | | | |
| | | | | | | | | | | | | | | | | | | | | | | | | | | | | | | | | | | | | | | |
| Deposits by banks66 | | | | | | | | | | | | | | | | | | | | | | | | | | | | | | | | | | | | |
| | | | | | | | | | | | | | | | | | | | | | | | | | | | | | | | | | | | | | | |
| Europe | | HSBC Bank | | | 32,850 | | | | 260 | | | | 0.79 | | | | 35,207 | | | | 553 | | | | 1.57 | | | | 48,167 | | | | 1,875 | | | | 3.89 | |
| | | HSBC Private Banking Holdings (Suisse) | | | 964 | | | | 2 | | | | 0.21 | | | | 1,063 | | | | 1 | | | | 0.09 | | | | 4,493 | | | | 105 | | | | 2.34 | |
| | | HSBC France | | | 42,399 | | | | 340 | | | | 0.80 | | | | 43,682 | | | | 536 | | | | 1.23 | | | | 37,851 | | | | 1,672 | | | | 4.42 | |
| | | | | | | | | | | | | | | | | | | | | | | | | | | | | | | | | | | | | | | |
| Hong Kong | | Hang Seng Bank | | | 1,456 | | | | 4 | | | | 0.27 | | | | 1,051 | | | | 5 | | | | 0.48 | | | | 1,696 | | | | 55 | | | | 3.24 | |
| | | The Hongkong and Shanghai Banking | | | 5,691 | | | | 10 | | | | 0.18 | | | | 6,892 | | | | 9 | | | | 0.13 | | | | 3,665 | | | | 70 | | | | 1.91 | |
| | | Corporation | | | | | | | | | | | | | | | | | | | | | | | | | | | | | | | | | | | | |
| | | | | | | | | | | | | | | | | | | | | | | | | | | | | | | | | | | | | | | |
| Rest of Asia-Pacific | | The Hongkong and Shanghai Banking | | | 9,540 | | | | 131 | | | | 1.37 | | | | 10,710 | | | | 165 | | | | 1.54 | | | | 16,232 | | | | 450 | | | | 2.77 | |
| | | Corporation | | | | | | | | | | | | | | | | | | | | | | | | | | | | | | | | | | | | |
| | | HSBC Bank Malaysia | | | 164 | | | | 4 | | | | 2.44 | | | | 110 | | | | 2 | | | | 1.82 | | | | 338 | | | | 10 | | | | 2.96 | |
| | | | | | | | | | | | | | | | | | | | | | | | | | | | | | | | | | | | | | | |
| Middle East | | HSBC Bank Middle East | | | 762 | | | | 6 | | | | 0.79 | | | | 773 | | | | 9 | | | | 1.16 | | | | 1,680 | | | | 29 | | | | 1.73 | |
| | | | | | | | | | | | | | | | | | | | | | | | | | | | | | | | | | | | | | | |
| North America | | HSBC Bank USA | | | 8,693 | | | | 26 | | | | 0.30 | | | | 8,381 | | | | 9 | | | | 0.11 | | | | 11,015 | | | | 220 | | | | 2.00 | |
| | | HSBC Bank Canada | | | 946 | | | | 5 | | | | 0.53 | | | | 1,405 | | | | 8 | | | | 0.57 | | | | 1,391 | | | | 41 | | | | 2.95 | |
| | | | | | | | | | | | | | | | | | | | | | | | | | | | | | | | | | | | | | | |
| Latin America | | HSBC Mexico | | | 1,002 | | | | 51 | | | | 5.09 | | | | 1,462 | | | | 49 | | | | 3.35 | | | | 822 | | | | 32 | | | | 3.89 | |
| | | Brazilian operations65 | | | 3,610 | | | | 247 | | | | 6.84 | | | | 3,292 | | | | 241 | | | | 7.32 | | | | 2,790 | | | | 190 | | | | 6.81 | |
| | | HSBC Bank Panama | | | 612 | | | | 18 | | | | 2.94 | | | | 908 | | | | 26 | | | | 2.86 | | | | 1,016 | | | | 43 | | | | 4.23 | |
| | | HSBC Bank Argentina | | | 17 | | | | 1 | | | | 5.88 | | | | 12 | | | | 1 | | | | 8.33 | | | | 27 | | | | 1 | | | | 3.70 | |
| | | | | | | | | | | | | | | | | | | | | | | | | | | | | | | | | | | | | | | |
| Other operations | | | 2,737 | | | | 31 | | | | 1.13 | | | | 2,899 | | | | 45 | | | | 1.55 | | | | 4,564 | | | | 166 | | | | 3.64 | |
| | | | | | | | | | | | | | | | | | | | | | | | | | | |
| | | | | | | | | | | | | | | | | | | | | | | | | | | | | | | | | | | | | | | |
| | | | | | 111,443 | | | | 1,136 | | | | 1.02 | | | | 117,847 | | | | 1,659 | | | | 1.41 | | | | 135,747 | | | | 4,959 | | | | 3.65 | |
| | | | | | | | | | | | | | | | | | | | | | | | | | | |
| | | | | | | | | | | | | | | | | | | | | | | | | | | | | | | | | | | | | | | |
| Financial liabilities designated at fair value – own debt issued67 | | | | | | | | | | | | | | | | | | | | | | | | | | | | | | | | | | | | |
| | | | | | | | | | | | | | | | | | | | | | | | | | | | | | | | | | | | | | | |
| Europe | | HSBC Holdings | | | 16,577 | | | | 308 | | | | 1.86 | | | | 17,887 | | | | 369 | | | | 2.06 | | | | 18,675 | | | | 721 | | | | 3.86 | |
| | | HSBC Bank | | | 15,169 | | | | 270 | | | | 1.78 | | | | 7,932 | | | | 196 | | | | 2.47 | | | | 8,805 | | | | 529 | | | | 6.01 | |
| | | HSBC France | | | 7,154 | | | | 113 | | | | 1.58 | | | | 5,108 | | | | 128 | | | | 2.51 | | | | 1,515 | | | | 79 | | | | 5.21 | |
| | | | | | | | | | | | | | | | | | | | | | | | | | | | | | | | | | | | | | | |
| Hong Kong | | Hang Seng Bank | | | 63 | | | | – | | | | – | | | | 130 | | | | 2 | | | | 1.54 | | | | 127 | | | | 6 | | | | 4.72 | |
| | | | | | | | | | | | | | | | | | | | | | | | | | | | | | | | | | | | | | | |
| North America | | HSBC Bank USA | | | 1,721 | | | | 25 | | | | 1.45 | | | | 1,615 | | | | 30 | | | | 1.86 | | | | 1,504 | | | | 67 | | | | 4.45 | |
| | | HSBC Finance | | | 24,740 | | | | 528 | | | | 2.13 | | | | 26,628 | | | | 871 | | | | 3.27 | | | | 32,126 | | | | 1,563 | | | | 4.87 | |
| | | | | | | | | | | | | | | | | | | | | | | | | | | | | | | | | | | | | | | |
| Other operations | | | 1,282 | | | | 27 | | | | 2.11 | | | | 921 | | | | (38 | ) | | | (4.13 | ) | | | 1,083 | | | | 168 | | | | 15.51 | |
| | | | | | | | | | | | | | | | | | | | | | | | | | | |
| | | | | | | | | | | | | | | | | | | | | | | | | | | | | | | | | | | | | | | |
| | | | | | 66,706 | | | | 1,271 | | | | 1.91 | | | | 60,221 | | | | 1,558 | | | | 2.59 | | | | 63,835 | | | | 3,133 | | | | 4.91 | |
| | | | | | | | | | | | | | | | | | | | | | | | | | | |
31(e)
Report of the Directors: Operating and Financial Review(continued)
Equity and liabilities(continued)
| | | | | | | | | | | | | | | | | | | | | | | | | | | | | | | | | | | | | | | |
| | | | | 2010 | | | 2009 | | | 2008 | |
| | | | | Average | | | Interest | | | | | | | Average | | | Interest | | | | | | | Average | | | Interest | | | | |
| | | | | balance | | | expense | | | Cost | | | Balance | | | expense | | | Cost | | | balance | | | expense | | | Cost | |
| | | | | US$m | | | US$m | | | % | | | US$m | | | US$m | | | % | | | US$m | | | US$m | | | % | |
| | | | | | | | | | | | | | | | | | | | | | | | | | | | | | | | | | | | | | | |
| Customer accounts68 | | | | | | | | | | | | | | | | | | | | | | | | | | | | | | | | | | | | |
| | | | | | | | | | | | | | | | | | | | | | | | | | | | | | | | | | | | | | | |
| Europe | | HSBC Bank | | | 275,153 | | | | 2,042 | | | | 0.74 | | | | 274,949 | | | | 2,407 | | | | 0.88 | | | | 305,702 | | | | 10,092 | | | | 3.30 | |
| | | HSBC Private Banking Holdings (Suisse) | | | 20,530 | | | | 144 | | | | 0.70 | | | | 27,250 | | | | 256 | | | | 0.94 | | | | 37,778 | | | | 1,349 | | | | 3.57 | |
| | | HSBC France | | | 50,096 | | | | 377 | | | | 0.75 | | | | 61,465 | | | | 645 | | | | 1.05 | | | | 39,428 | | | | 1,583 | | | | 4.01 | |
| | | | | | | | | | | | | | | | | | | | | | | | | | | | | | | | | | | | | | | |
| Hong Kong | | Hang Seng Bank | | | 76,708 | | | | 205 | | | | 0.27 | | | | 71,140 | | | | 200 | | | | 0.28 | | | | 66,142 | | | | 914 | | | | 1.38 | |
| | | The Hongkong and Shanghai Banking Corporation | | | 160,794 | | | | 146 | | | | 0.09 | | | | 150,520 | | | | 211 | | | | 0.14 | | | | 139,169 | | | | 1,365 | | | | 0.98 | |
| | | | | | | | | | | | | | | | | | | | | | | | | | | | | | | | | | | | | | | |
| Rest of Asia-Pacific | | The Hongkong and Shanghai Banking Corporation | | | 104,648 | | | | 1,696 | | | | 1.62 | | | | 92,305 | | | | 1,494 | | | | 1.62 | | | | 96,476 | | | | 2,869 | | | | 2.97 | |
| | | HSBC Bank Malaysia | | | 11,213 | | | | 220 | | | | 1.96 | | | | 9,658 | | | | 191 | | | | 1.98 | | | | 10,266 | | | | 295 | | | | 2.87 | |
| | | | | | | | | | | | | | | | | | | | | | | | | | | | | | | | | | | | | | | |
| Middle East | | HSBC Bank Middle East | | | 15,906 | | | | 284 | | | | 1.79 | | | | 18,726 | | | | 432 | | | | 2.31 | | | | 19,922 | | | | 422 | | | | 2.12 | |
| | | | | | | | | | | | | | | | | | | | | | | | | | | | | | | | | | | | | | | |
| North America | | HSBC Bank USA | | | 85,946 | | | | 540 | | | | 0.63 | | | | 85,007 | | | | 975 | | | | 1.15 | | | | 86,701 | | | | 2,069 | | | | 2.39 | |
| | | HSBC Bank Canada | | | 41,153 | | | | 304 | | | | 0.74 | | | | 35,051 | | | | 385 | | | | 1.10 | | | | 34,090 | | | | 967 | | | | 2.84 | |
| | | | | | | | | | | | | | | | | | | | | | | | | | | | | | | | | | | | | | | |
| Latin America | | HSBC Mexico | | | 14,127 | | | | 398 | | | | 2.82 | | | | 11,636 | | | | 391 | | | | 3.36 | | | | 14,612 | | | | 561 | | | | 3.84 | |
| | | Brazilian operations65 | | | 36,727 | | | | 3,502 | | | | 9.54 | | | | 28,605 | | | | 2,946 | | | | 10.30 | | | | 26,288 | | | | 3,110 | | | | 11.83 | |
| | | HSBC Bank Panama | | | 8,771 | | | | 321 | | | | 3.66 | | | | 8,592 | | | | 353 | | | | 4.11 | | | | 7,761 | | | | 296 | | | | 3.81 | |
| | | HSBC Bank Argentina | | | 2,538 | | | | 97 | | | | 3.82 | | | | 2,151 | | | | 99 | | | | 4.60 | | | | 2,266 | | | | 145 | | | | 6.40 | |
| | | | | | | | | | | | | | | | | | | | | | | | | | | | | | | | | | | | | | | |
| Other operations | | | 58,303 | | | | 502 | | | | 0.86 | | | | 63,863 | | | | 361 | | | | 0.57 | | | | 64,253 | | | | 1,952 | | | | 3.04 | |
| | | | | | | | | | | | | | | | | | | | | | | | | | | |
| | | | | | | | | | | | | | | | | | | | | | | | | | | | | | | | | | | | | | | |
| | | | | | 962,613 | | | | 10,778 | | | | 1.12 | | | | 940,918 | | | | 11,346 | | | | 1.21 | | | | 950,854 | | | | 27,989 | | | | 2.94 | |
| | | | | | | | | | | | | | | | | | | | | | | | | | | |
| | | | | | | | | | | | | | | | | | | | | | | | | | | | | | | | | | | | | | | |
| Debt securities in issue | | | | | | | | | | | | | | | | | | | | | | | | | | | | | | | | | | | | |
| | | | | | | | | | | | | | | | | | | | | | | | | | | | | | | | | | | | | | | |
| Europe | | HSBC Bank | | | 62,735 | | | | 1,130 | | | | 1.80 | | | | 72,955 | | | | 1,305 | | | | 1.79 | | | | 86,216 | | | | 4,001 | | | | 4.64 | |
| | | HSBC France | | | 20,686 | | | | 160 | | | | 0.77 | | | | 25,065 | | | | 330 | | | | 1.32 | | | | 30,815 | | | | 1,447 | | | | 4.70 | |
| | | HSBC Finance | | | – | | | | – | | | | – | | | | – | | | | – | | | | – | | | | 215 | | | | 8 | | | | 3.72 | |
| | | | | | | | | | | | | | | | | | | | | | | | | | | | | | | | | | | | | | | |
| Hong Kong | | Hang Seng Bank | | | 1,034 | | | | 13 | | | | 1.26 | | | | 1,220 | | | | 21 | | | | 1.72 | | | | 1,685 | | | | 57 | | | | 3.38 | |
| | | | | | | | | | | | | | | | | | | | | | | | | | | | | | | | | | | | | | | |
| Rest of Asia-Pacific | | The Hongkong and Shanghai Banking Corporation | | | 5,558 | | | | 218 | | | | 3.92 | | | | 5,409 | | | | 218 | | | | 4.03 | | | | 8,995 | | | | 640 | | | | 7.12 | |
| | | HSBC Bank Malaysia | | | 389 | | | | 15 | | | | 3.86 | | | | 403 | | | | 16 | | | | 3.97 | | | | 475 | | | | 20 | | | | 4.21 | |
| | | | | | | | | | | | | | | | | | | | | | | | | | | | | | | | | | | | | | | |
| Middle East | | HSBC Bank Middle East | | | 3,940 | | | | 63 | | | | 1.60 | | | | 2,988 | | | | 62 | | | | 2.07 | | | | 2,650 | | | | 90 | | | | 3.40 | |
| | | | | | | | | | | | | | | | | | | | | | | | | | | | | | | | | | | | | | | |
| North America | | HSBC Bank USA | | | 12,680 | | | | 375 | | | | 2.96 | | | | 20,968 | | | | 590 | | | | 2.81 | | | | 21,922 | | | | 852 | | | | 3.89 | |
| | | HSBC Finance | | | 48,561 | | | | 1,766 | | | | 3.64 | | | | 63,563 | | | | 2,510 | | | | 3.95 | | | | 98,096 | | | | 3,765 | | | | 3.84 | |
| | | HSBC Bank Canada | | | 13,205 | | | | 343 | | | | 2.60 | | | | 12,825 | | | | 322 | | | | 2.51 | | | | 16,957 | | | | 604 | | | | 3.56 | |
| | | | | | | | | | | | | | | | | | | | | | | | | | | | | | | | | | | | | | | |
| Latin America | | HSBC Mexico | | | 922 | | | | 51 | | | | 5.53 | | | | 1,460 | | | | 67 | | | | 4.59 | | | | 2,693 | | | | 243 | | | | 9.02 | |
| | | Brazilian operations65 | | | 2,112 | | | | 151 | | | | 7.15 | | | | 1,568 | | | | 86 | | | | 5.48 | | | | 1,859 | | | | 156 | | | | 8.39 | |
| | | HSBC Bank Panama | | | 771 | | | | 40 | | | | 5.19 | | | | 487 | | | | 34 | | | | 6.98 | | | | 556 | | | | 33 | | | | 5.94 | |
| | | HSBC Bank Argentina | | | 4 | | | | – | | | | – | | | | 1 | | | | – | | | | – | | | | 2 | | | | – | | | | – | |
| | | | | | | | | | | | | | | | | | | | | | | | | | | | | | | | | | | | | | | |
| Other operations | | | 17,301 | | | | 606 | | | | 3.50 | | | | 16,745 | | | | 340 | | | | 2.03 | | | | 13,691 | | | | 66 | | | | 0.48 | |
| | | | | | | | | | | | | | | | | | | | | | | | | | | |
| | | | | | | | | | | | | | | | | | | | | | | | | | | | | | | | | | | | | | | |
| | | | | | 189,898 | | | | 4,931 | | | | 2.60 | | | | 225,657 | | | | 5,901 | | | | 2.62 | | | | 286,827 | | | | 11,982 | | | | 4.18 | |
| | | | | | | | | | | | | | | | | | | | | | | | | | | |
31(f)
Report of the Directors: Operating and Financial Review(continued)
| | | | | | | | | | | | | | | | | | | | | | | | | | | | | | | | | | | | | | | |
| | | | | 2010 | | | 2009 | | | 2008 | |
| | | | | Average | | | Interest | | | | | | | Average | | | Interest | | | | | | | Average | | | Interest | | | | |
| | | | | balance | | | expense | | | Cost | | | balance | | | expense | | | Cost | | | balance | | | expense | | | Cost | |
| | | | | US$m | | | US$m | | | % | | | US$m | | | US$m | | | % | | | US$m | | | US$m | | | % | |
| | | | | | | | | | | | | | | | | | | | | | | | | | | | | | | | | | | | | | | |
| Other interest-bearing liabilities | | | | | | | | | | | | | | | | | | | | | | | | | | | | | | | | | | | | |
| | | | | | | | | | | | | | | | | | | | | | | | | | | | | | | | | | | | | | | |
| Europe | | HSBC Bank | | | 28,269 | | | | 434 | | | | 1.54 | | | | 50,247 | | | | 655 | | | | 1.30 | | | | 38,906 | | | | 1,134 | | | | 2.91 | |
| | | HSBC Private Banking Holdings (Suisse) | | | 2,921 | | | | 7 | | | | 0.24 | | | | 3,892 | | | | 18 | | | | 0.46 | | | | 4,203 | | | | 135 | | | | 3.21 | |
| | | HSBC France | | | 16,668 | | | | 78 | | | | 0.47 | | | | 24,699 | | | | 187 | | | | 0.76 | | | | 33,920 | | | | 1,361 | | | | 4.01 | |
| | | HSBC Finance | | | 1,595 | | | | 15 | | | | 0.94 | | | | 2,363 | | | | 59 | | | | 2.50 | | | | 3,712 | | | | 191 | | | | 5.15 | |
| | | | | | | | | | | | | | | | | | | | | | | | | | | | | | | | | | | | | | | |
| Hong Kong | | Hang Seng Bank | | | 829 | | | | 5 | | | | 0.60 | | | | 789 | | | | 5 | | | | 0.63 | | | | 1,258 | | | | 41 | | | | 3.26 | |
| | | The Hongkong and Shanghai Banking Corporation | | | 8,580 | | | | 55 | | | | 0.64 | | | | 12,815 | | | | 105 | | | | 0.82 | | | | 10,557 | | | | 288 | | | | 2.73 | |
| | | | | | | | | | | | | | | | | | | | | | | | | | | | | | | | | | | | | | | |
| Rest of Asia-Pacific | | The Hongkong and Shanghai Banking Corporation | | | 34,027 | | | | 248 | | | | 0.73 | | | | 19,447 | | | | 177 | | | | 0.91 | | | | 23,685 | | | | 466 | | | | 1.97 | |
| | | HSBC Bank Malaysia | | | 706 | | | | 8 | | | | 1.13 | | | | 266 | | | | 2 | | | | 0.75 | | | | 338 | | | | 7 | | | | 2.07 | |
| | | | | | | | | | | | | | | | | | | | | | | | | | | | | | | | | | | | | | | |
| Middle East | | HSBC Bank Middle East | | | 1,496 | | | | 63 | | | | 4.21 | | | | 1,748 | | | | 68 | | | | 3.89 | | | | 1,918 | | | | 89 | | | | 4.64 | |
| | | | | | | | | | | | | | | | | | | | | | | | | | | | | | | | | | | | | | | |
| North America | | HSBC Bank USA | | | 14,669 | | | | 609 | | | | 4.15 | | | | 9,754 | | | | 368 | | | | 3.77 | | | | 10,490 | | | | 468 | | | | 4.46 | |
| | | HSBC Finance | | | 3,487 | | | | 102 | | | | 2.93 | | | | 4,051 | | | | 102 | | | | 2.52 | | | | 4,670 | | | | 141 | | | | 3.02 | |
| | | HSBC Bank Canada | | | 1,806 | | | | 3 | | | | 0.17 | | | | 1,149 | | | | 6 | | | | 0.52 | | | | 1,306 | | | | 19 | | | | 1.45 | |
| | | HSBC Markets Inc | | | 1,266 | | | | 25 | | | | 1.97 | | | | 1,716 | | | | 36 | | | | 2.10 | | | | 10,349 | | | | 78 | | | | 0.75 | |
| | | | | | | | | | | | | | | | | | | | | | | | | | | | | | | | | | | | | | | |
| Latin America | | HSBC Mexico | | | 804 | | | | 13 | | | | 1.62 | | | | 301 | | | | 11 | | | | 3.65 | | | | 187 | | | | 20 | | | | 10.70 | |
| | | Brazilian operations65 | | | 2,803 | | | | 316 | | | | 11.27 | | | | 1,496 | | | | 130 | | | | 8.69 | | | | 2,340 | | | | 207 | | | | 8.85 | |
| | | HSBC Bank Panama | | | 108 | | | | 1 | | | | 0.93 | | | | 192 | | | | 2 | | | | 1.04 | | | | 917 | | | | 3 | | | | 0.33 | |
| | | HSBC Bank Argentina | | | 4 | | | | – | | | | – | | | | 36 | | | | 1 | | | | 2.78 | | | | 92 | | | | 6 | | | | 6.52 | |
| | | | | | | | | | | | | | | | | | | | | | | | | | | | | | | | | | | | | | | |
| Other operations | | | (111,308 | ) | | | (1,194 | ) | | | | | | | (126,321 | ) | | | (1,030 | ) | | | | | | | (134,269 | ) | | | (3,979 | ) | | | | |
| | | | | | | | | | | | | | | | | | | | | | | | | | | |
| | | | | | | | | | | | | | | | | | | | | | | | | | | | | | | | | | | | | | | |
| | | | | | 8,730 | | | | 788 | | | | 9.03 | | | | 8,640 | | | | 902 | | | | 10.44 | | | | 14,579 | | | | 675 | | | | 4.63 | |
| | | | | | | | | | | | | | | | | | | | | | | | | | | |
| | | | | | | | | | | | | | | | | | | | | | | | | | | | | | | | | | | | | | | |
| Total interest-bearing liabilities | | | | | | | | | | | | | | | | | | | | | | | | | | | | | | | | | | | | |
| | | | | | | | | | | | | | | | | | | | | | | | | | | | | | | | | | | | | | | |
| Europe | | HSBC Bank | | | 414,176 | | | | 4,136 | | | | 1.00 | | | | 441,290 | | | | 5,116 | | | | 1.16 | | | | 487,796 | | | | 17,631 | | | | 3.61 | |
| | | HSBC Private Banking Holdings (Suisse) | | | 24,415 | | | | 153 | | | | 0.63 | | | | 32,205 | | | | 275 | | | | 0.85 | | | | 46,474 | | | | 1,589 | | | | 3.42 | |
| | | HSBC France | | | 137,003 | | | | 1,068 | | | | 0.78 | | | | 160,019 | | | | 1,826 | | | | 1.14 | | | | 143,529 | | | | 6,142 | | | | 4.28 | |
| | | HSBC Finance | | | 1,595 | | | | 15 | | | | 0.94 | | | | 2,363 | | | | 59 | | | | 2.50 | | | | 3,927 | | | | 199 | | | | 5.07 | |
| | | | | | | | | | | | | | | | | | | | | | | | | | | | | | | | | | | | | | | |
| Hong Kong | | Hang Seng Bank | | | 80,090 | | | | 227 | | | | 0.28 | | | | 74,330 | | | | 233 | | | | 0.31 | | | | 70,908 | | | | 1,073 | | | | 1.51 | |
| | | The Hongkong and Shanghai Banking Corporation | | | 175,065 | | | | 211 | | | | 0.12 | | | | 170,227 | | | | 325 | | | | 0.19 | | | | 153,391 | | | | 1,723 | | | | 1.12 | |
| | | | | | | | | | | | | | | | | | | | | | | | | | | | | | | | | | | | | | | |
| Rest of Asia-Pacific | | The Hongkong and Shanghai Banking Corporation | | | 153,773 | | | | 2,293 | | | | 1.49 | | | | 127,871 | | | | 2,054 | | | | 1.61 | | | | 145,388 | | | | 4,425 | | | | 3.04 | |
| | | HSBC Bank Malaysia | | | 12,472 | | | | 247 | | | | 1.98 | | | | 10,437 | | | | 211 | | | | 2.02 | | | | 11,417 | | | | 332 | | | | 2.91 | |
| | | | | | | | | | | | | | | | | | | | | | | | | | | | | | | | | | | | | | | |
| Middle East | | HSBC Bank Middle East | | | 22,104 | | | | 416 | | | | 1.88 | | | | 24,235 | | | | 571 | | | | 2.36 | | | | 26,170 | | | | 630 | | | | 2.41 | |
| | | | | | | | | | | | | | | | | | | | | | | | | | | | | | | | | | | | | | | |
| North America | | HSBC Bank USA | | | 123,709 | | | | 1,575 | | | | 1.27 | | | | 125,725 | | | | 1,972 | | | | 1.57 | | | | 131,632 | | | | 3,676 | | | | 2.79 | |
| | | HSBC Finance | | | 76,788 | | | | 2,396 | | | | 3.12 | | | | 94,242 | | | | 3,483 | | | | 3.70 | | | | 134,892 | | | | 5,469 | | | | 4.05 | |
| | | HSBC Bank Canada | | | 57,110 | | | | 655 | | | | 1.15 | | | | 50,430 | | | | 721 | | | | 1.43 | | | | 53,744 | | | | 1,631 | | | | 3.03 | |
| | | HSBC Markets Inc | | | 1,266 | | | | 25 | | | | 1.97 | | | | 1,716 | | | | 36 | | | | 2.10 | | | | 10,349 | | | | 78 | | | | 0.75 | |
| | | | | | | | | | | | | | | | | | | | | | | | | | | | | | | | | | | | | | | |
| Latin America | | HSBC Mexico | | | 16,855 | | | | 513 | | | | 3.04 | | | | 14,859 | | | | 518 | | | | 3.49 | | | | 18,314 | | | | 856 | | | | 4.67 | |
| | | Brazilian operations65 | | | 45,252 | | | | 4,216 | | | | 9.32 | | | | 34,961 | | | | 3,403 | | | | 9.73 | | | | 33,277 | | | | 3,663 | | | | 11.01 | |
| | | HSBC Bank Panama | | | 10,262 | | | | 379 | | | | 3.69 | | | | 10,179 | | | | 415 | | | | 4.08 | | | | 10,250 | | | | 375 | | | | 3.66 | |
| | | HSBC Bank Argentina | | | 2,563 | | | | 98 | | | | 3.82 | | | | 2,200 | | | | 101 | | | | 4.59 | | | | 2,387 | | | | 152 | | | | 6.37 | |
| | | | | | | | | | | | | | | | | | | | | | | | | | | | | | | | | | | | | | | |
| Other operations | | | (15,108 | ) | | | 281 | | | | | | | | (24,006 | ) | | | 47 | | | | | | | | (32,003 | ) | | | (906 | ) | | | | |
| | | | | | | | | | | | | | | | | | | | | | | | | | | |
| | | | | | | | | | | | | | | | | | | | | | | | | | | | | | | | | | | | | | | |
| | | | | | 1,339,390 | | | | 18,904 | | | | 1.41 | | | | 1,353,283 | | | | 21,366 | | | | 1.58 | | | | 1,451,842 | | | | 48,738 | | | | 3.36 | |
| | | | | | | | | | | | | | | | | | | | | | | | | | | |
For footnotes, see page 83.
31(g)
Report of the Directors: Operating and Financial Review(continued)
Net interest margin69
| | | | | | | | | | | | | | | |
| | | | | 2010 | | | 2009 | | | 2008 | |
| | | | | % | | | % | | | % | |
| | | | | | | | | | | | | | | |
| Total | | | 2.68 | | | | 2.94 | | | | 2.90 | |
| | | | | | | | | |
| | | | | | | | | | | | | | | |
| Europe | | HSBC Bank | | | 2.12 | | | | 2.35 | | | | 1.71 | |
| | | HSBC Private Banking Holdings (Suisse) | | | 1.18 | | | | 1.30 | | | | 1.24 | |
| | | HSBC France | | | 0.90 | | | | 0.68 | | | | 0.26 | |
| | | HSBC Finance | | | 8.13 | | | | 8.40 | | | | 6.36 | |
| | | | | | | | | | | | | | | |
| Hong Kong | | Hang Seng Bank | | | 1.91 | | | | 2.11 | | | | 2.59 | |
| | | The Hongkong and Shanghai Banking Corporation | | | 1.38 | | | | 1.52 | | | | 2.27 | |
| | | | | | | | | | | | | | | |
| Rest of Asia-Pacific | | The Hongkong and Shanghai Banking Corporation | | | 1.98 | | | | 2.15 | | | | 2.15 | |
| | | HSBC Bank Malaysia | | | 2.76 | | | | 2.72 | | | | 3.02 | |
| | | | | | | | | | | | | | | |
| Middle East | | HSBC Bank Middle East | | | 3.12 | | | | 3.59 | | | | 3.63 | |
| | | | | | | | | | | | | | | |
| North America | | HSBC Bank USA | | | 2.90 | | | | 3.58 | | | | 2.93 | |
| | | HSBC Finance | | | 6.52 | | | | 6.18 | | | | 7.22 | |
| | | HSBC Bank Canada | | | 1.95 | | | | 1.76 | | | | 1.93 | |
| | | | | | | | | | | | | | | |
| Latin America | | HSBC Mexico | | | 6.92 | | | | 7.85 | | | | 8.95 | |
| | | Brazilian operations65 | | | 7.16 | | | | 7.96 | | | | 8.85 | |
| | | HSBC Bank Panama | | | 3.94 | | | | 4.07 | | | | 4.39 | |
| | | HSBC Bank Argentina | | | 11.24 | | | | 13.18 | | | | 10.25 | |
| | | | | | | | | | | | | | | |
| Distribution of average total assets | | | | | | | | | | | | |
| | | | | | | | | | | | | | | |
| | | | | 2010 | | | 2009 | | | 2008 | |
| | | | | % | | | % | | | % | |
| | | | | | | | | | | | | | | |
| Europe | | HSBC Bank | | | 37.5 | | | | 36.7 | | | | 36.7 | |
| | | HSBC Private Banking Holdings (Suisse) | | | 2.2 | | | | 2.3 | | | | 2.3 | |
| | | HSBC France | | | 12.9 | | | | 15.0 | | | | 13.8 | |
| | | HSBC Finance | | | 0.1 | | | | – | | | | 0.2 | |
| | | | | | | | | | | | | | | |
| Hong Kong | | Hang Seng Bank | | | 4.5 | | | | 4.2 | | | | 3.9 | |
| | | The Hongkong and Shanghai Banking Corporation | | | 10.7 | | | | 10.5 | | | | 9.5 | |
| | | | | | | | | | | | | | | |
| Rest of Asia-Pacific | | The Hongkong and Shanghai Banking Corporation | | | 9.4 | | | | 8.5 | | | | 8.8 | |
| | | HSBC Bank Malaysia | | | 0.7 | | | | 0.6 | | | | 0.6 | |
| | | | | | | | | | | | | | | |
| Middle East | | HSBC Bank Middle East | | | 1.6 | | | | 1.6 | | | | 1.8 | |
| | | | | | | | | | | | | | | |
| North America | | HSBC Bank USA | | | 9.7 | | | | 11.0 | | | | 11.2 | |
| | | HSBC Finance | | | 3.6 | | | | 4.5 | | | | 6.2 | |
| | | HSBC Bank Canada | | | 3.0 | | | | 2.7 | | | | 2.9 | |
| | | | | | | | | | | | | | | |
| Latin America | | HSBC Mexico | | | 1.4 | | | | 1.4 | | | | 1.5 | |
| | | Brazilian operations65 | | | 2.6 | | | | 2.1 | | | | 2.1 | |
| | | HSBC Bank Panama | | | 0.6 | | | | 0.6 | | | | 0.6 | |
| | | HSBC Bank Argentina | | | 0.2 | | | | 0.2 | | | | 0.2 | |
| | | | | | | | | | | | | | | |
| Other operations (including consolidation adjustments) | | | (0.7 | ) | | | (1.9 | ) | | | (2.3 | ) |
| | | | | | | | | |
| | | | | | | | | | | | | | | |
| | | | | | 100.0 | | | | 100.0 | | | | 100.0 | |
| | | | | | | | | |
For footnotes, see page 83.
31(h)
Report of the Directors: Operating and Financial Review(continued)
Analysis of changes in net interest income and net interest expense
The following tables allocate changes in net interest income and net interest expense between volume and rate for 2010 compared with 2009, and for 2009 compared with 2008.
Interest income
| | | | | | | | | | | | | | | | | | | | | | | | | | | | | | | |
| | | | | | | | | Increase/(decrease) | | | | | | | Increase/(decrease) | | | | |
| | | | | | | | | in 2010 compared | | | | | | | in 2009 compared | | | | |
| | | | | | | | | with 2009 | | | | | | | with 2008 | | | | |
| | | | | 2010 | | | Volume | | | Rate | | | 2009 | | | Volume | | | Rate | | | 2008 | |
| | | | | US$m | | | US$m | | | US$m | | | US$m | | | US$m | | | US$m | | | US$m | |
| | | | | | | | | | | | | | | | | | | | | | | | | | | | | | | |
| Short–term funds and loans and advances to banks | | | | | | | | | | | | | | | | | | | | | | | | | | | | |
| | | | | | | | | | | | | | | | | | | | | | | | | | | | | | | |
| Europe | | HSBC Bank | | | 1,290 | | | | 333 | | | | (422 | ) | | | 1,379 | | | | (386 | ) | | | (422 | ) | | | 2,187 | |
| | | HSBC Private Banking Holdings (Suisse) | | | 15 | | | | (18 | ) | | | (10 | ) | | | 43 | | | | (149 | ) | | | (141 | ) | | | 333 | |
| | | HSBC France | | | 337 | | | | 116 | | | | (219 | ) | | | 440 | | | | 60 | | | | (1,115 | ) | | | 1,495 | |
| | | | | | | | | | | | | | | | | | | | | | | | | | | | | | | |
| Hong Kong | | Hang Seng Bank | | | 222 | | | | (21 | ) | | | 41 | | | | 202 | | | | (26 | ) | | | (359 | ) | | | 587 | |
| | | The Hongkong and Shanghai Banking Corporation | | | 117 | | | | (74 | ) | | | 9 | | | | 182 | | | | (549 | ) | | | (613 | ) | | | 1,344 | |
| | | | | | | | | | | | | | | | | | | | | | | | | | | | | | | |
| Rest of Asia-Pacific | | The Hongkong and Shanghai Banking Corporation | | | 464 | | | | 101 | | | | 37 | | | | 326 | | | | (152 | ) | | | (403 | ) | | | 881 | |
| | | HSBC Bank Malaysia | | | 126 | | | | 29 | | | | 16 | | | | 81 | | | | (31 | ) | | | (53 | ) | | | 165 | |
| | | | | | | | | | | | | | | | | | | | | | | | | | | | | | | |
| Middle East | | HSBC Bank Middle East | | | 60 | | | | 12 | | | | (4 | ) | | | 52 | | | | (54 | ) | | | (82 | ) | | | 188 | |
| | | | | | | | | | | | | | | | | | | | | | | | | | | | | | | |
| North America | | HSBC Bank USA | | | 103 | | | | 1,058 | | | | (1,049 | ) | | | 94 | | | | (248 | ) | | | 14 | | | | 328 | |
| | | HSBC Bank Canada | | | 16 | | | | 3 | | | | 3 | | | | 10 | | | | (13 | ) | | | (84 | ) | | | 107 | |
| | | | | | | | | | | | | | | | | | | | | | | | | | | | | | | |
| Latin America | | HSBC Mexico | | | 129 | | | | (19 | ) | | | (1 | ) | | | 149 | | | | 3 | | | | (101 | ) | | | 247 | |
| | | Brazilian operations65 | | | 1,525 | | | | 537 | | | | (15 | ) | | | 1,003 | | | | 302 | | | | (250 | ) | | | 951 | |
| | | HSBC Bank Panama | | | 8 | | | | (2 | ) | | | – | | | | 10 | | | | 1 | | | | (21 | ) | | | 30 | |
| | | HSBC Bank Argentina | | | 20 | | | | (10 | ) | | | 1 | | | | 29 | | | | (25 | ) | | | 11 | | | | 43 | |
| | | | | | | | | | | | | | | | | | | | | | | | | | | | | | | |
| Other operations | | | 123 | | | | (20 | ) | | | (56 | ) | | | 199 | | | | (160 | ) | | | (401 | ) | | | 760 | |
| | | | | | | | | | | | | | | | | | | | | | | | | |
| | | | | | | | | | | | | | | | | | | | | | | | | | | | | | | |
| | | | | | 4,555 | | | | 963 | | | | (607 | ) | | | 4,199 | | | | (1,911 | ) | | | (3,536 | ) | | | 9,646 | |
| | | | | | | | | | | | | | | | | | | | | | | | | |
| | | | | | | | | | | | | | | | | | | | | | | | | | | | | | | |
| Loans and advances to customers | | | | | | | | | | | | | | | | | | | | | | | | | | | | |
| | | | | | | | | | | | | | | | | | | | | | | | | | | | | | | |
| Europe | | HSBC Bank | | | 9,761 | | | | (451 | ) | | | (686 | ) | | | 10,898 | | | | (749 | ) | | | (6,940 | ) | | | 18,587 | |
| | | HSBC Private Banking Holdings (Suisse) | | | 191 | | | | 35 | | | | (20 | ) | | | 176 | | | | (94 | ) | | | (224 | ) | | | 494 | |
| | | HSBC France | | | 1,684 | | | | (113 | ) | | | (135 | ) | | | 1,932 | | | | (118 | ) | | | (1,554 | ) | | | 3,604 | |
| | | HSBC Finance | | | 198 | | | | (87 | ) | | | (34 | ) | | | 319 | | | | (180 | ) | | | (6 | ) | | | 505 | |
| | | | | | | | | | | | | | | | | | | | | | | | | | | | | | | |
| Hong Kong | | Hang Seng Bank | | | 1,313 | | | | 235 | | | | (116 | ) | | | 1,194 | | | | 12 | | | | (407 | ) | | | 1,589 | |
| | | The Hongkong and Shanghai Banking Corporation | | | 1,755 | | | | 316 | | | | (318 | ) | | | 1,757 | | | | 28 | | | | (562 | ) | | | 2,291 | |
| | | | | | | | | | | | | | | | | | | | | | | | | | | | | | | |
| Rest of Asia-Pacific | | The Hongkong and Shanghai Banking Corporation | | | 3,928 | | | | 821 | | | | (561 | ) | | | 3,668 | | | | (762 | ) | | | (733 | ) | | | 5,163 | |
| | | HSBC Bank Malaysia | | | 531 | | | | 84 | | | | (8 | ) | | | 455 | | | | (19 | ) | | | (79 | ) | | | 553 | |
| | | | | | | | | | | | | | | | | | | | | | | | | | | | | | | |
| Middle East | | HSBC Bank Middle East | | | 1,303 | | | | (100 | ) | | | (190 | ) | | | 1,593 | | | | (71 | ) | | | 115 | | | | 1,549 | |
| | | | | | | | | | | | | | | | | | | | | | | | | | | | | | | |
| North America | | HSBC Bank USA | | | 4,582 | | | | (1,118 | ) | | | 159 | | | | 5,541 | | | | 330 | | | | (547 | ) | | | 5,758 | |
| | | HSBC Finance | | | 7,741 | | | | (2,264 | ) | | | 64 | | | | 9,941 | | | | (4,472 | ) | | | (1,422 | ) | | | 15,835 | |
| | | HSBC Bank Canada | | | 1,643 | | | | 114 | | | | 30 | | | | 1,499 | | | | (267 | ) | | | (689 | ) | | | 2,455 | |
| | | | | | | | | | | | | | | | | | | | | | | | | | | | | | | |
| Latin America | | HSBC Mexico | | | 1,571 | | | | 17 | | | | (154 | ) | | | 1,708 | | | | (753 | ) | | | (104 | ) | | | 2,565 | |
| | | Brazilian operations65 | | | 5,118 | | | | 1,120 | | | | (496 | ) | | | 4,494 | | | | (233 | ) | | | (152 | ) | | | 4,879 | |
| | | HSBC Bank Panama | | | 815 | | | | 4 | | | | (53 | ) | | | 864 | | | | 64 | | | | (10 | ) | | | 810 | |
| | | HSBC Bank Argentina | | | 367 | | | | 96 | | | | (86 | ) | | | 357 | | | | (35 | ) | | | 14 | | | | 378 | |
| | | | | | | | | | | | | | | | | | | | | | | | | | | | | | | |
| Other operations | | | 1,685 | | | | 249 | | | | (469 | ) | | | 1,905 | | | | 100 | | | | 98 | | | | 1,707 | |
| | | | | | | | | | | | | | | | | | | | | | | | | |
| | | | | | | | | | | | | | | | | | | | | | | | | | | | | | | |
| | | | | | 44,186 | | | | (641 | ) | | | (3,474 | ) | | | 48,301 | | | | (5,358 | ) | | | (15,063 | ) | | | 68,722 | |
| | | | | | | | | | | | | | | | | | | | | | | | | |
31(i)
Report of the Directors: Operating and Financial Review(continued)
Interest income(continued)
| | | | | | | | | | | | | | | | | | | | | | | | | | | | | | | |
| | | | | | | | | Increase/(decrease) in | | | | | | | Increase/(decrease) | | | | |
| | | | | | | | | 2010 compared with | | | | | | | in 2009 compared with | | | | |
| | | | | | | | | 2009 | | | | | | | 2008 | | | | |
| | | | | 2010 | | | Volume | | | Rate | | | 2009 | | | Volume | | | Rate | | | 2008 | |
| | | | | US$m | | | US$m | | | US$m | | | US$m | | | US$m | | | US$m | | | US$m | |
| | | | | | | | | | | | | | | | | | | | | | | | | | | | | | | |
| Financial investments | | | | | | | | | | | | | | | | | | | | | | | | | | | | |
| | | | | | | | | | | | | | | | | | | | | | | | | | | | | | | |
| Europe | | HSBC Bank | | | 1,725 | | | | 158 | | | | (754 | ) | | | 2,321 | | | | (182 | ) | | | (1,337 | ) | | | 3,840 | |
| | | HSBC Private Banking Holdings (Suisse) | | | 287 | | | | 33 | | | | (109 | ) | | | 363 | | | | 165 | | | | (355 | ) | | | 553 | |
| | | HSBC France | | | 102 | | | | (35 | ) | | | (4 | ) | | | 141 | | | | (510 | ) | | | (144 | ) | | | 795 | |
| | | | | | | | | | | | | | | | | | | | | | | | | | | | | | | |
| Hong Kong | | Hang Seng Bank | | | 541 | | | | 147 | | | | (236 | ) | | | 630 | | | | 25 | | | | (458 | ) | | | 1,063 | |
| | | The Hongkong and Shanghai Banking Corporation | | | 477 | | | | 150 | | | | (317 | ) | | | 644 | | | | 1,380 | | | | (1,299 | ) | | | 563 | |
| | | | | | | | | | | | | | | | | | | | | | | | | | | | | | | |
| Rest of Asia-Pacific | | The Hongkong and Shanghai Banking Corporation | | | 1,161 | | | | 115 | | | | 7 | | | | 1,039 | | | | 97 | | | | (565 | ) | | | 1,507 | |
| | | HSBC Bank Malaysia | | | 28 | | | | (9 | ) | | | – | | | | 37 | | | | 11 | | | | (10 | ) | | | 36 | |
| | | | | | | | | | | | | | | | | | | | | | | | | | | | | | | |
| Middle East | | HSBC Bank Middle East | | | 126 | | | | 18 | | | | (10 | ) | | | 118 | | | | 34 | | | | (60 | ) | | | 144 | |
| | | | | | | | | | | | | | | | | | | | | | | | | | | | | | | |
| North America | | HSBC Bank USA | | | 1,156 | | | | 402 | | | | (215 | ) | | | 969 | | | | 106 | | | | (369 | ) | | | 1,232 | |
| | | HSBC Finance | | | 116 | | | | 20 | | | | (24 | ) | | | 120 | | | | (24 | ) | | | 1 | | | | 143 | |
| | | HSBC Bank Canada | | | 257 | | | | 80 | | | | (28 | ) | | | 205 | | | | 91 | | | | (83 | ) | | | 197 | |
| | | | | | | | | | | | | | | | | | | | | | | | | | | | | | | |
| Latin America | | HSBC Mexico | | | 388 | | | | 189 | | | | (28 | ) | | | 227 | | | | 31 | | | | (48 | ) | | | 244 | |
| | | Brazilian operations65 | | | 1,089 | | | | 312 | | | | (43 | ) | | | 820 | | | | 22 | | | | (55 | ) | | | 853 | |
| | | HSBC Bank Panama | | | 38 | | | | 25 | | | | (26 | ) | | | 39 | | | | (1 | ) | | | (7 | ) | | | 47 | |
| | | HSBC Bank Argentina | | | 58 | | | | 37 | | | | (14 | ) | | | 35 | | | | (17 | ) | | | 5 | | | | 47 | |
| | | | | | | | | | | | | | | | | | | | | | | | | | | | | | | |
| Other operations | | | 1,826 | | | | 195 | | | | (86 | ) | | | 1,717 | | | | 966 | | | | (603 | ) | | | 1,354 | |
| | | | | | | | | | | | | | | | | | | | | | | | | |
| | | | | | | | | | | | | | | | | | | | | | | | | | | | | | | |
| | | | | | 9,375 | | | | 1,638 | | | | (1,688 | ) | | | 9,425 | | | | 2,790 | | | | (5,983 | ) | | | 12,618 | |
| | | | | | | | | | | | | | | | | | | | | | | | | |
| | | | | | | | | | | | | | | | | | | | | | | | | | | | | | | |
| For footnotes, see page 83. | | | | | | | | | | | | | | | | | | | | | | | | | | | | |
| | | | | | | | | | | | | | | | | | | | | | | | | | | | | | | |
| Interest expense | | | | | | | | | | | | | | | | | | | | | | | | | | | | |
| | | | | | | | | | | | | | | | | | | | | | | | | | | | | | | |
| | | | | | | | | Increase/(decrease) in | | | | | | | Increase/(decrease) | | | | |
| | | | | | | | | 2010 compared with | | | | | | | in 2009 compared with | | | | |
| | | | | | | | | 2009 | | | | | | | 2008 | | | | |
| | | | | 2010 | | | Volume | | | Rate | | | 2009 | | | Volume | | | Rate | | | 2008 | |
| | | | | US$m | | | US$m | | | US$m | | | US$m | | | US$m | | | US$m | | | US$m | |
| | | | | | | | | | | | | | | | | | | | | | | | | | | | | | | |
| Deposits by banks | | | | | | | | | | | | | | | | | | | | | | | | | | | | |
| | | | | | | | | | | | | | | | | | | | | | | | | | | | | | | |
| Europe | | HSBC Bank | | | 260 | | | | (37 | ) | | | (256 | ) | | | 553 | | | | (504 | ) | | | (818 | ) | | | 1,875 | |
| | | HSBC Private Banking Holdings (Suisse) | | | 2 | | | | – | | | | 1 | | | | 1 | | | | (80 | ) | | | (24 | ) | | | 105 | |
| | | HSBC France | | | 340 | | | | (16 | ) | | | (180 | ) | | | 536 | | | | 258 | | | | (1,394 | ) | | | 1,672 | |
| | | | | | | | | | | | | | | | | | | | | | | | | | | | | | | |
| Hong Kong | | Hang Seng Bank | | | 4 | | | | 2 | | | | (3 | ) | | | 5 | | | | (21 | ) | | | (29 | ) | | | 55 | |
| | | The Hongkong and Shanghai Banking Corporation | | | 10 | | | | (2 | ) | | | 3 | | | | 9 | | | | 62 | | | | (123 | ) | | | 70 | |
| | | | | | | | | | | | | | | | | | | | | | | | | | | | | | | |
| Rest of Asia-Pacific | | The Hongkong and Shanghai Banking Corporation | | | 131 | | | | (18 | ) | | | (16 | ) | | | 165 | | | | (153 | ) | | | (132 | ) | | | 450 | |
| | | HSBC Bank Malaysia | | | 4 | | | | 1 | | | | 1 | | | | 2 | | | | (7 | ) | | | (1 | ) | | | 10 | |
| | | | | | | | | | | | | | | | | | | | | | | | | | | | | | | |
| Middle East | | HSBC Bank Middle East | | | 6 | | | | – | | | | (3 | ) | | | 9 | | | | (16 | ) | | | (4 | ) | | | 29 | |
| | | | | | | | | | | | | | | | | | | | | | | | | | | | | | | |
| North America | | HSBC Bank USA | | | 26 | | | | – | | | | 17 | | | | 9 | | | | (53 | ) | | | (158 | ) | | | 220 | |
| | | HSBC Bank Canada | | | 5 | | | | (3 | ) | | | – | | | | 8 | | | | – | | | | (33 | ) | | | 41 | |
| | | | | | | | | | | | | | | | | | | | | | | | | | | | | | | |
| Latin America | | HSBC Mexico | | | 51 | | | | (15 | ) | | | 17 | | | | 49 | | | | 25 | | | | (8 | ) | | | 32 | |
| | | Brazilian operations65 | | | 247 | | | | 23 | | | | (17 | ) | | | 241 | | | | 34 | | | | 17 | | | | 190 | |
| | | HSBC Bank Panama | | | 18 | | | | (8 | ) | | | – | | | | 26 | | | | (5 | ) | | | (12 | ) | | | 43 | |
| | | HSBC Bank Argentina | | | 1 | | | | – | | | | – | | | | 1 | | | | (1 | ) | | | 1 | | | | 1 | |
| | | | | | | | | | | | | | | | | | | | | | | | | | | | | | | |
| Other operations | | | 31 | | | | (3 | ) | | | (11 | ) | | | 45 | | | | (61 | ) | | | (60 | ) | | | 166 | |
| | | | | | | | | | | | | | | | | | | | | | | | | |
| | | | | | 1,136 | | | | (90 | ) | | | (433 | ) | | | 1,659 | | | | (653 | ) | | | (2,647 | ) | | | 4,959 | |
| | | | | | | | | | | | | | | | | | | | | | | | | |
31(j)
Report of the Directors: Operating and Financial Review(continued)
| | | | | | | | | | | | | | | | | | | | | | | | | | | | | | | |
| | | | | | | | | Increase/(decrease) | | | | | | | Increase/(decrease) | | | | |
| | | | | | | | | in 2010 compared | | | | | | | in 2009 compared | | | | |
| | | | | | | | | with 2009 | | | | | | | with 2008 | | | | |
| | | | | 2010 | | | Volume | | | Rate | | | 2009 | | | Volume | | | Rate | | | 2008 | |
| | | | | US$m | | | US$m | | | US$m | | | US$m | | | US$m | | | US$m | | | US$m | |
| | | | | | | | | | | | | | | | | | | | | | | | | | | | | | | |
| Customer accounts | | | | | | | | | | | | | | | | | | | | | | | | | | | | |
| | | | | | | | | | | | | | | | | | | | | | | | | | | | | | | |
| Europe | | HSBC Bank | | | 2,042 | | | | 2 | | | | (367 | ) | | | 2,407 | | | | (1,015 | ) | | | (6,670 | ) | | | 10,092 | |
| | | HSBC Private Banking Holdings (Suisse) | | | 144 | | | | (63 | ) | | | (49 | ) | | | 256 | | | | (376 | ) | | | (717 | ) | | | 1,349 | |
| | | HSBC France | | | 377 | | | | (119 | ) | | | (149 | ) | | | 645 | | | | 884 | | | | (1,822 | ) | | | 1,583 | |
| | | | | | | | | | | | | | | | | | | | | | | | | | | | | | | |
| Hong Kong | | Hang Seng Bank | | | 205 | | | | 16 | | | | (11 | ) | | | 200 | | | | 69 | | | | (783 | ) | | | 914 | |
| | | The Hongkong and Shanghai Banking Corporation | | | 146 | | | | 14 | | | | (79 | ) | | | 211 | | | | 111 | | | | (1,265 | ) | | | 1,365 | |
| | | | | | | | | | | | | | | | | | | | | | | | | | | | | | | |
| Rest of Asia-Pacific | | The Hongkong and Shanghai Banking Corporation | | | 1,696 | | | | 200 | | | | 2 | | | | 1,494 | | | | (124 | ) | | | (1,251 | ) | | | 2,869 | |
| | | HSBC Bank Malaysia | | | 220 | | | | 31 | | | | (2 | ) | | | 191 | | | | (17 | ) | | | (87 | ) | | | 295 | |
| | | | | | | | | | | | | | | | | | | | | | | | | | | | | | | |
| Middle East | | HSBC Bank Middle East | | | 284 | | | | (65 | ) | | | (83 | ) | | | 432 | | | | (25 | ) | | | 35 | | | | 422 | |
| | | | | | | | | | | | | | | | | | | | | | | | | | | | | | | |
| North America | | HSBC Bank USA | | | 540 | | | | 11 | | | | (446 | ) | | | 975 | | | | (40 | ) | | | (1,054 | ) | | | 2,069 | |
| | | HSBC Bank Canada | | | 304 | | | | 67 | | | | (148 | ) | | | 385 | | | | 27 | | | | (609 | ) | | | 967 | |
| | | | | | | | | | | | | | | | | | | | | | | | | | | | | | | |
| Latin America | | HSBC Mexico | | | 398 | | | | 84 | | | | (77 | ) | | | 391 | | | | (114 | ) | | | (56 | ) | | | 561 | |
| | | Brazilian operations65 | | | 3,502 | | | | 837 | | | | (281 | ) | | | 2,946 | | | | 274 | | | | (438 | ) | | | 3,110 | |
| | | HSBC Bank Panama | | | 321 | | | | 7 | | | | (39 | ) | | | 353 | | | | 32 | | | | 25 | | | | 296 | |
| | | HSBC Bank Argentina | | | 97 | | | | 18 | | | | (20 | ) | | | 99 | | | | (7 | ) | | | (39 | ) | | | 145 | |
| | | | | | | | | | | | | | | | | | | | | | | | | | | | | | | |
| Other operations | | | 502 | | | | (32 | ) | | | 173 | | | | 361 | | | | (12 | ) | | | (1,579 | ) | | | 1,952 | |
| | | | | | | | | | | | | | | | | | | | | | | | | |
| | | | | | | | | | | | | | | | | | | | | | | | | | | | | | | |
| | | | | | 10,778 | | | | 263 | | | | (831 | ) | | | 11,346 | | | | (292 | ) | | | (16,351 | ) | | | 27,989 | |
| | | | | | | | | | | | | | | | | | | | | | | | | |
| | | | | | | | | | | | | | | | | | | | | | | | | | | | | | | |
| Financial liabilities designated at fair value – own debt issued | | | 1,271 | | | | 168 | | | | (455 | ) | | | 1,558 | | | | (177 | ) | | | (1,398 | ) | | | 3,133 | |
| | | | | | | | | | | | | | | | | | | | | | | | | |
| | | | | | | | | | | | | | | | | | | | | | | | | | | | | | | |
| Debt securities in issue | | | | | | | | | | | | | | | | | | | | | | | | | | | | |
| | | | | | | | | | | | | | | | | | | | | | | | | | | | | | | |
| Europe | | HSBC Bank | | | 1,130 | | | | (183 | ) | | | 8 | | | | 1,305 | | | | (615 | ) | | | (2,081 | ) | | | 4,001 | |
| | | HSBC France | | | 160 | | | | (58 | ) | | | (112 | ) | | | 330 | | | | (270 | ) | | | (847 | ) | | | 1,447 | |
| | | HSBC Finance | | | – | | | | – | | | | – | | | | – | | | | (8 | ) | | | – | | | | 8 | |
| | | | | | | | | | | | | | | | | | | | | | | | | | | | | | | |
| Hong Kong | | Hang Seng Bank | | | 13 | | | | (3 | ) | | | (5 | ) | | | 21 | | | | (16 | ) | | | (20 | ) | | | 57 | |
| | | | | | | | | | | | | | | | | | | | | | | | | | | | | | | |
| Rest of Asia-Pacific | | The Hongkong and Shanghai Banking Corporation | | | 218 | | | | 6 | | | | (6 | ) | | | 218 | | | | (255 | ) | | | (167 | ) | | | 640 | |
| | | HSBC Bank Malaysia | | | 15 | | | | (1 | ) | | | – | | | | 16 | | | | (3 | ) | | | (1 | ) | | | 20 | |
| | | | | | | | | | | | | | | | | | | | | | | | | | | | | | | |
| Middle East | | HSBC Bank Middle East | | | 63 | | | | 20 | | | | (19 | ) | | | 62 | | | | 11 | | | | (39 | ) | | | 90 | |
| | | | | | | | | | | | | | | | | | | | | | | | | | | | | | | |
| North America | | HSBC Bank USA | | | 375 | | | | (233 | ) | | | 18 | | | | 590 | | | | (37 | ) | | | (225 | ) | | | 852 | |
| | | HSBC Finance | | | 1,766 | | | | (593 | ) | | | (151 | ) | | | 2,510 | | | | (1,326 | ) | | | 71 | | | | 3,765 | |
| | | HSBC Bank Canada | | | 343 | | | | 10 | | | | 11 | | | | 322 | | | | (147 | ) | | | (135 | ) | | | 604 | |
| | | | | | | | | | | | | | | | | | | | | | | | | | | | | | | |
| Latin America | | HSBC Mexico | | | 51 | | | | (25 | ) | | | 9 | | | | 67 | | | | (111 | ) | | | (65 | ) | | | 243 | |
| | | Brazilian operations65 | | | 151 | | | | 30 | | | | 35 | | | | 86 | | | | (24 | ) | | | (46 | ) | | | 156 | |
| | | HSBC Bank Panama | | | 40 | | | | 20 | | | | (14 | ) | | | 34 | | | | (4 | ) | | | 5 | | | | 33 | |
| | | | | | | | | | | | | | | | | | | | | | | | | | | | | | | |
| Other operations | | | 606 | | | | 11 | | | | 255 | | | | 340 | | | | 15 | | | | 259 | | | | 66 | |
| | | | | | | | | | | | | | | | | | | | | | | | | |
| | | | | | | | | | | | | | | | | | | | | | | | | | | | | | | |
| | | | | | 4,931 | | | | (937 | ) | | | (33 | ) | | | 5,901 | | | | (2,557 | ) | | | (3,524 | ) | | | 11,982 | |
| | | | | | | | | | | | | | | | | | | | | | | | | |
For footnotes, see page 83.
31(k)
Report of the Directors: Operating and Financial Review(continued)
We include short-term borrowings within customer accounts, deposits by banks and debt securities in issue and do not show short-term borrowings separately on the balance sheet. Short-term borrowings are defined by the US Securities and
Exchange Commission as Federal funds purchased and securities sold under agreements to repurchase, commercial paper and other short-term borrowings. Our only significant short-term borrowings are securities sold under agreements to repurchase and certain debt securities in issue. Additional information on these is provided in the table below.
Repos and short-term bonds
| | | | | | | | | | | | | |
| | | 2010 | | | 2009 | | | 2008 | |
| | | US$ | | | US$m | | | US$m | |
Securities sold under agreements to repurchase | | | | | | | | | | | | |
| Outstanding at 31 December | | | 159,256 | | | | 152,218 | | | | 145,180 | |
| Average amount outstanding during the year | | | 175,955 | | | | 170,671 | | | | 177,256 | |
| Maximum quarter-end balance outstanding during the year | | | 193,319 | | | | 157,778 | | | | 190,651 | |
| | | | | | | | | | | | | |
| Weighted average interest rate during the year | | | 0.5% | | | | 0.8% | | | | 3.8% | |
| Weighted average interest rate at the year-end | | | 0.9% | | | | 0.4% | | | | 2.9% | |
| | | | | | | | | | | | | |
Short-term bonds | | | | | | | | | | | | |
| Outstanding at 31 December | | | 44,152 | | | | 38,776 | | | | 40,279 | |
| Average amount outstanding during the year | | | 37,981 | | | | 33,010 | | | | 45,330 | |
| Maximum quarter-end balance outstanding during the year | | | 44,152 | | | | 38,776 | | | | 55,842 | |
| | | | | | | | | | | | | |
| Weighted average interest rate during the year | | | 2.9% | | | | 3.2% | | | | 5.0% | |
| Weighted average interest rate at the year-end | | | 4.5% | | | | 0.6% | | | | 3.1% | |
The table below provides details of our material contractual obligations as at 31 December 2010.
| | | | | | | | | | | | | | | | | |
| | | Payments due by period |
| | | | | | | Less than | | | | | | | More than | |
| | | Total | | | 1 year | | | 1 – 5 years | | | 5 years | |
| | | US$m | | | US$m | | | US$m | | | US$m | |
| | | | | | | | | | | | | | | | | |
| Long-term debt obligations | | | 236,144 | | | | 71,913 | | | | 90,284 | | | | 73,947 | |
| Term deposits and certificates of deposit | | | 207,805 | | | | 193,131 | | | | 10,643 | | | | 4,031 | |
| Capital (finance) lease obligations | | | 684 | | | | 107 | | | | 187 | | | | 390 | |
| Operating lease obligations | | | 6,257 | | | | 943 | | | | 2,700 | | | | 2,614 | |
| Purchase obligations | | | 1,071 | | | | 657 | | | | 414 | | | | – | |
| Short positions in debt securities and equity shares | | | 102,615 | | | | 74,979 | | | | 8,412 | | | | 19,224 | |
| Current tax liability | | | 1,804 | | | | 1,804 | | | | – | | | | – | |
| Pension/healthcare obligation | | | 16,643 | | | | 1,304 | | | | 5,700 | | | | 9,639 | |
| | | | | | | | | |
| | | | | | | | | | | | | | | | | |
| | | | 573,023 | | | | 344,838 | | | | 118,340 | | | | 109,845 | |
| | | | | | | | | |
Ratios of earnings to combined fixed charges (and preference share dividends)
| | | | | | | | | | | | | | | | | | | | | |
| | | 2010 | | | 2009 | | | 2008 | | | 2007 | | | 2006 | |
Ratios of earnings to combined fixed charges and preference share dividends:70 | | | | | | | | | | | | | | | | | | | | |
| – excluding interest on deposits | | | 5.89 | | | | 2.64 | | | | 2.97 | | | | 6.96 | | | | 7.22 | |
| – including interest on deposits | | | 1.69 | | | | 1.20 | | | | 1.13 | | | | 1.34 | | | | 1.40 | |
| | | | | | | | | | | | | | | | | | | | | |
Ratios of earnings to combined fixed charges:70 | | | | | | | | | | | | | | | | | | | | |
| – excluding interest on deposits | | | 7.10 | | | | 2.99 | | | | 3.17 | | | | 7.52 | | | | 7.93 | |
| – including interest on deposits | | | 1.73 | | | | 1.22 | | | | 1.14 | | | | 1.34 | | | | 1.41 | |
For footnote, see page 83.
31(l)
Report of the Directors: Operating and Financial Review(continued)
Loan maturity and interest sensitivity analysis
At 31 December 2010, the geographical analysis of loan maturity and interest sensitivity by loan type on a contractual repayment basis was as follows:
| | | | | | | | | | | | | | | | | | | | | | | | | | | | | |
| | | | | | | | | | | Rest | | | | | | | | | | | | | |
| | | | | | | Hong | | | of Asia- | | | Middle | | | North | | | Latin | | | | |
| | | Europe | | | Kong | | | Pacific | | | East | | | America | | | America | | | Total | |
| | | US$m | | | US$m | | | US$m | | | US$m | | | US$m | | | US$m | | | US$m | |
Maturity of 1 year or less | | | | | | | | | | | | | | | | | | | | | | | | | | | | |
| Loans and advances to banks | | | 75,280 | | | | 32,974 | | | | 40,116 | | | | 9,034 | | | | 18,820 | | | | 24,032 | | | | 200,256 | |
| | | | | | | | | | | | | | | |
| | | | | | | | | | | | | | | | | | | | | | | | | | | | | |
| Commercial loans to customers | | | | | | | | | | | | | | | | | | | | | | | | | | | | |
| Commercial, industrial and international trade | | | 72,108 | | | | 25,889 | | | | 34,536 | | | | 8,139 | | | | 7,242 | | | | 14,215 | | | | 162,129 | |
| Real estate and other property related | | | 16,040 | | | | 10,739 | | | | 5,753 | | | | 1,635 | | | | 5,892 | | | | 1,851 | | | | 41,910 | |
| Non-bank financial institutions | | | 64,313 | | | | 1,994 | | | | 1,641 | | | | 785 | | | | 13,126 | | | | 1,137 | | | | 82,996 | |
| Governments | | | 1,432 | | | | 38 | | | | 178 | | | | 1,170 | | | | 41 | | | | 513 | | | | 3,372 | |
| Other commercial | | | 31,377 | | | | 4,383 | | | | 6,759 | | | | 1,830 | | | | 5,641 | | | | 3,440 | | | | 53,430 | |
| | | | | | | | | | | | | | | |
| | | | 185,270 | | | | 43,043 | | | | 48,867 | | | | 13,559 | | | | 31,942 | | | | 21,156 | | | | 343,837 | |
| | | | | | | | | | | | | | | | | | | | | | | | | | | | | |
| Hong Kong Government Home Ownership Scheme | | | – | | | | 370 | | | | – | | | | – | | | | – | | | | – | | | | 370 | |
| Residential mortgages and other personal loans | | | 29,904 | | | | 15,337 | | | | 12,161 | | | | 2,819 | | | | 31,174 | | | | 9,190 | | | | 100,585 | |
| | | | | | | | | | | | | | | |
| Loans and advances to customers | | | 215,174 | | | | 58,750 | | | | 61,028 | | | | 16,378 | | | | 63,116 | | | | 30,346 | | | | 444,792 | |
| | | | | | | | | | | | | | | |
| | | | 290,454 | | | | 91,724 | | | | 101,144 | | | | 25,412 | | | | 81,936 | | | | 54,378 | | | | 645,048 | |
| | | | | | | | | | | | | | | |
| | | | | | | | | | | | | | | | | | | | | | | | | | | | | |
Maturity after 1 year but within 5 years | | | | | | | | | | | | | | | | | | | | | | | | | | | | |
| Loans and advances to banks | | | 2,499 | | | | 204 | | | | 285 | | | | 234 | | | | 626 | | | | 487 | | | | 4,335 | |
| | | | | | | | | | | | | | | |
| | | | | | | | | | | | | | | | | | | | | | | | | | | | | |
| Commercial loans to customers | | | | | | | | | | | | | | | | | | | | | | | | | | | | |
| Commercial, industrial and international trade | | | 29,641 | | | | 6,920 | | | | 6,178 | | | | 2,371 | | | | 7,859 | | | | 6,086 | | | | 59,055 | |
| Real estate and other property related | | | 13,901 | | | | 16,940 | | | | 7,630 | | | | 1,202 | | | | 6,057 | | | | 1,524 | | | | 47,254 | |
| Non-bank financial institutions | | | 4,866 | | | | 748 | | | | 362 | | | | 540 | | | | 6,689 | | | | 1,161 | | | | 14,366 | |
| Governments | | | 309 | | | | 2,188 | | | | 159 | | | | 165 | | | | 40 | | | | 843 | | | | 3,704 | |
| Other commercial | | | 13,573 | | | | 4,509 | | | | 4,306 | | | | 1,692 | | | | 2,113 | | | | 2,821 | | | | 29,014 | |
| | | | | | | | | | | | | | | |
| | | | | | | | | | | | | | | | | | | | | | | | | | | | | |
| | | | 62,290 | | | | 31,305 | | | | 18,635 | | | | 5,970 | | | | 22,758 | | | | 12,435 | | | | 153,393 | |
| | | | | | | | | | | | | | | | | | | | | | | | | | | | | |
| Hong Kong Government Home Ownership Scheme | | | – | | | | 1,228 | | | | – | | | | – | | | | – | | | | – | | | | 1,228 | |
| Residential mortgages and other personal loans | | | 33,732 | | | | 10,922 | | | | 8,301 | | | | 1,741 | | | | 38,223 | | | | 6,572 | | | | 99,491 | |
| | | | | | | | | | | | | | | |
| | | | | | | | | | | | | | | | | | | | | | | | | | | | | |
| Loans and advances to customers | | | 96,022 | | | | 43,455 | | | | 26,936 | | | | 7,711 | | | | 60,981 | | | | 19,007 | | | | 254,112 | |
| | | | | | | | | | | | | | | |
| | | | | | | | | | | | | | | | | | | | | | | | | | | | | |
| | | | 98,521 | | | | 43,659 | | | | 27,221 | | | | 7,945 | | | | 61,607 | | | | 19,494 | | | | 258,447 | |
| | | | | | | | | | | | | | | |
| | | | | | | | | | | | | | | | | | | | | | | | | | | | | |
| Interest rate sensitivity of loans and advances to banks and commercial loans to customers | | | | | | | | | | | | | | | | | | | | | | | | | | | | |
| Fixed interest rate | | | 17,263 | | | | 78 | | | | 1,233 | | | | 1,358 | | | | 8,209 | | | | 3,432 | | | | 31,573 | |
| Variable interest rate | | | 47,526 | | | | 31,431 | | | | 17,687 | | | | 4,846 | | | | 15,175 | | | | 9,490 | | | | 126,155 | |
| | | | | | | | | | | | | | | |
| | | | | | | | | | | | | | | | | | | | | | | | | | | | | |
| | | | 64,789 | | | | 31,509 | | | | 18,920 | | | | 6,204 | | | | 23,384 | | | | 12,922 | | | | 157,728 | |
| | | | | | | | | | | | | | | |
| | | | | | | | | | | | | | | | | | | | | | | | | | | | | |
Maturity after 5 years | | | | | | | | | | | | | | | | | | | | | | | | | | | | |
| Loans and advances to banks | | | 460 | | | | 407 | | | | 36 | | | | 67 | | | | 33 | | | | 2,835 | | | | 3,838 | |
| | | | | | | | | | | | | | | |
| | | | | | | | | | | | | | | | | | | | | | | | | | | | | |
| Commercial loans to customers | | | | | | | | | | | | | | | | | | | | | | | | | | | | |
| Commercial, industrial and international trade | | | 10,231 | | | | 642 | | | | 560 | | | | 663 | | | | 1,636 | | | | 2,778 | | | | 16,510 | |
| Real estate and other property related | | | 7,089 | | | | 7,231 | | | | 775 | | | | 33 | | | | 1,928 | | | | 498 | | | | 17,554 | |
| Non-bank financial institutions | | | 840 | | | | 82 | | | | 55 | | | | 10 | | | | 1,294 | | | | 520 | | | | 2,801 | |
| Governments | | | 548 | | | | 113 | | | | 78 | | | | 10 | | | | 8 | | | | 761 | | | | 1,518 | |
| Other commercial | | | 13,477 | | | | 1,596 | | | | 536 | | | | 662 | | | | 1,019 | | | | 226 | | | | 17,516 | |
| | | | | | | | | | | | | | | |
| | | | | | | | | | | | | | | | | | | | | | | | | | | | | |
| | | | 32,185 | | | | 9,664 | | | | 2,004 | | | | 1,378 | | | | 5,885 | | | | 4,783 | | | | 55,899 | |
| | | | | | | | | | | | | | | | | | | | | | | | | | | | | |
| Hong Kong Government Home Ownership Scheme | | | – | | | | 1,939 | | | | – | | | | – | | | | – | | | | – | | | | 1,939 | |
| Residential mortgages and other personal loans | | | 98,081 | | | | 27,512 | | | | 19,722 | | | | 811 | | | | 69,720 | | | | 5,861 | | | | 221,707 | |
| | | | | | | | | | | | | | | |
| Loans and advances to customers | | | 130,266 | | | | 39,115 | | | | 21,726 | | | | 2,189 | | | | 75,605 | | | | 10,644 | | | | 279,545 | |
| | | | | | | | | | | | | | | |
| | | | | | | | | | | | | | | | | | | | | | | | | | | | | |
| | | | 130,726 | | | | 39,522 | | | | 21,762 | | | | 2,256 | | | | 75,638 | | | | 13,479 | | | | 283,383 | |
| | | | | | | | | | | | | | | |
| | | | | | | | | | | | | | | | | | | | | | | | | | | | | |
| Interest rate sensitivity of loans and advances to banks and commercial loans to customers | | | | | | | | | | | | | | | | | | | | | | | | | | | | |
| Fixed interest rate | | | 8,326 | | | | 412 | | | | 108 | | | | 855 | | | | 1,669 | | | | 2,369 | | | | 13,739 | |
| Variable interest rate | | | 24,319 | | | | 9,659 | | | | 1,932 | | | | 590 | | | | 4,249 | | | | 5,249 | | | | 45,998 | |
| | | | | | | | | | | | | | | |
| | | | | | | | | | | | | | | | | | | | | | | | | | | | | |
| | | | 32,645 | | | | 10,071 | | | | 2,040 | | | | 1,445 | | | | 5,918 | | | | 7,618 | | | | 59,737 | |
| | | | | | | | | | | | | | | |
31(m)
Report of the Directors: Operating and Financial Review(continued)
Deposits
The following tables summarise the average amount of bank deposits, customer deposits and certificates of deposit (‘CD’s) and other money market instruments (which are included within ‘Debt securities in issue’ in the balance sheet), together
with the average interest rates paid thereon for each of the past three years. The geographical analysis of average deposits is based on the location of the office in which the deposits are recorded and excludes balances with HSBC companies. The ‘Other’ category includes securities sold under agreements to repurchase.
Deposits by banks
| | | | | | | | | | | | | | | | | | | | | | | | | |
| | | 2010 | | | 2009 | | | 2008 | |
| | | Average | | | Average | | | Average | | | Average | | | Average | | | Average | |
| | | balance | | | rate | | | balance | | | rate | | | balance | | | rate | |
| | | US$m | | | % | | | US$m | | | % | | | US$m | | | % | |
| | | | | | | | | | | | | | | | | | | | | | | | | |
| Europe | | | 85,973 | | | | | | | | 87,677 | | | | | | | | 99,228 | | | | | |
| | | | | | | | | | | | | | | | | | | |
| Demand and other – non-interest bearing | | | 8,298 | | | | – | | | | 6,415 | | | | – | | | | 5,231 | | | | – | |
| Demand – interest bearing | | | 13,783 | | | | 0.6 | | | | 14,259 | | | | 1.0 | | | | 19,204 | | | | 3.2 | |
| Time | | | 28,337 | | | | 0.9 | | | | 30,367 | | | | 1.6 | | | | 43,695 | | | | 3.9 | |
| Other | | | 35,555 | | | | 0.8 | | | | 36,636 | | | | 1.3 | | | | 31,098 | | | | 4.4 | |
| | | | | | | | | | | | | | | | | | | |
| | | | | | | | | | | | | | | | | | | | | | | | | |
| Hong Kong | | | 10,000 | | | | | | | | 10,725 | | | | | | | | 5,916 | | | | | |
| | | | | | | | | | | | | | | | | | | |
| Demand and other – non-interest bearing | | | 2,860 | | | | – | | | | 2,975 | | | | – | | | | 1,375 | | | | – | |
| Demand – interest bearing | | | 4,787 | | | | 0.2 | | | | 5,526 | | | | 0.1 | | | | 2,780 | | | | 2.0 | |
| Time | | | 1,803 | | | | 0.3 | | | | 1,637 | | | | 0.3 | | | | 1,583 | | | | 2.7 | |
| Other | | | 550 | | | | 0.7 | | | | 587 | | | | 0.5 | | | | 178 | | | | 3.4 | |
| | | | | | | | | | | | | | | | | | | |
| | | | | | | | | | | | | | | | | | | | | | | | | |
Rest of Asia-Pacific | | | 11,476 | | | | | | | | 12,467 | | | | | | | | 18,203 | | | | | |
| | | | | | | | | | | | | | | | | | | |
| Demand and other – non-interest bearing | | | 1,746 | | | | – | | | | 1,605 | | | | – | | | | 1,546 | | | | – | |
| Demand – interest bearing | | | 4,937 | | | | 1.2 | | | | 4,097 | | | | 1.2 | | | | 4,317 | | | | 2.3 | |
| Time | | | 3,626 | | | | 1.5 | | | | 4,682 | | | | 1.9 | | | | 9,103 | | | | 3.5 | |
| Other | | | 1,167 | | | | 2.0 | | | | 2,083 | | | | 1.4 | | | | 3,237 | | | | 3.8 | |
| | | | | | | | | | | | | | | | | | | |
| | | | | | | | | | | | | | | | | | | | | | | | | |
Middle East | | | 1,250 | | | | | | | | 1,317 | | | | | | | | 2,151 | | | | | |
| | | | | | | | | | | | | | | | | | | |
| Demand and other – non-interest bearing | | | 484 | | | | – | | | | 539 | | | | – | | | | 365 | | | | – | |
| Demand – interest bearing | | | 9 | | | | – | | | | 18 | | | | – | | | | 15 | | | | – | |
| Time | | | 685 | | | | 0.6 | | | | 691 | | | | 1.2 | | | | 1,239 | | | | 2.7 | |
| Other | | | 72 | | | | 1.2 | | | | 69 | | | | 1.4 | | | | 532 | | | | 0.2 | |
| | | | | | | | | | | | | | | | | | | |
| | | | | | | | | | | | | | | | | | | | | | | | | |
| North America | | | 13,324 | | | | | | | | 13,203 | | | | | | | | 14,835 | | | | | |
| | | | | | | | | | | | | | | | | | | |
| Demand and other – non-interest bearing | | | 2,493 | | | | – | | | | 1,755 | | | | – | | | | 761 | | | | – | |
| Demand – interest bearing | | | 3,386 | | | | 0.1 | | | | 4,770 | | | | 0.1 | | | | 5,684 | | | | 1.7 | |
| Time | | | 4,716 | | | | 0.4 | | | | 5,422 | | | | 0.2 | | | | 7,941 | | | | 2.3 | |
| Other | | | 2,729 | | | | 0.5 | | | | 1,256 | | | | 0.7 | | | | 449 | | | | 1.6 | |
| | | | | | | | | | | | | | | | | | | |
| | | | | | | | | | | | | | | | | | | | | | | | | |
| Latin America | | | 5,523 | | | | | | | | 5,959 | | | | | | | | 5,058 | | | | | |
| | | | | | | | | | | | | | | | | | | |
| Demand and other – non-interest bearing | | | 222 | | | | – | | | | 212 | | | | – | | | | 366 | | | | – | |
| Demand – interest bearing | | | 322 | | | | 4.3 | | | | 219 | | | | 0.9 | | | | 81 | | | | 2.5 | |
| Time | | | 2,246 | | | | 5.5 | | | | 4,171 | | | | 5.0 | | | | 3,357 | | | | 5.6 | |
| Other | | | 2,733 | | | | 6.6 | | | | 1,357 | | | | 8.1 | | | | 1,254 | | | | 7.8 | |
| | | | | | | | | | | | | | | | | | | |
| | | | | | | | | | | | | | | | | | | | | | | | | |
| | | | | | | | | | | | | | | | | | | |
| | | | | | | | | | | | | | | | | | | | | | | | | |
| Total | | | 127,546 | | | | | | | | 131,348 | | | | | | | | 145,391 | | | | | |
| | | | | | | | | | | | | | | | | | | |
| Demand and other – non-interest bearing | | | 16,103 | | | | – | | | | 13,501 | | | | – | | | | 9,644 | | | | – | |
| Demand – interest bearing | | | 27,224 | | | | 0.6 | | | | 28,889 | | | | 0.7 | | | | 32,081 | | | | 2.7 | |
| Time | | | 41,413 | | | | 1.1 | | | | 46,970 | | | | 1.7 | | | | 66,918 | | | | 3.7 | |
| Other | | | 42,806 | | | | 1.3 | | | | 41,988 | | | | 1.6 | | | | 36,748 | | | | 4.5 | |
| | | | | | | | | | | | | | | | | | | |
31(n)
Report of the Directors: Operating and Financial Review(continued)
Customer accounts
| | | | | | | | | | | | | | | | | | | | | | | | | |
| | | 2010 | | | 2009 | | | 2008 | |
| | | Average | | | Average | | | Average | | | Average | | | Average | | | Average | |
| | | balance | | | rate | | | balance | | | rate | | | balance | | | rate | |
| | | US$m | | | % | | | US$m | | | % | | | US$m | | | % | |
| | | | | | | | | | | | | | | | | | | | | | | | | |
| Europe | | | 424,561 | | | | | | | | 440,450 | | | | | | | | 447,982 | | | | | |
| | | | | | | | | | | | | | | | | | | |
| Demand and other – non-interest bearing | | | 62,869 | | | | – | | | | 55,751 | | | | – | | | | 39,610 | | | | – | |
| Demand – interest bearing | | | 203,727 | | | | 0.4 | | | | 212,178 | | | | 0.4 | | | | 225,034 | | | | 2.9 | |
| Savings | | | 51,793 | | | | 1.8 | | | | 57,344 | | | | 2.2 | | | | 73,479 | | | | 4.3 | |
| Time | | | 60,140 | | | | 1.2 | | | | 67,045 | | | | 1.4 | | | | 83,208 | | | | 3.8 | |
| Other | | | 46,032 | | | | 0.5 | | | | 48,132 | | | | 0.8 | | | | 26,651 | | | | 3.9 | |
| | | | | | | | | | | | | | | | | | | |
| | | | | | | | | | | | | | | | | | | | | | | | | |
| Hong Kong | | | 280,733 | | | | | | | | 261,703 | | | | | | | | 236,109 | | | | | |
| | | | | | | | | | | | | | | | | | | |
| Demand and other — non-interest bearing | | | 27,412 | | | | – | | | | 22,056 | | | | – | | | | 15,620 | | | | – | |
| Demand – interest bearing | | | 202,330 | | | | – | | | | 171,846 | | | | 0.1 | | | | 126,199 | | | | 0.4 | |
| Savings | | | 37,119 | | | | 0.5 | | | | 45,537 | | | | 0.6 | | | | 65,068 | | | | 2.4 | |
| Time | | | 12,793 | | | | 0.7 | | | | 20,901 | | | | 0.6 | | | | 27,659 | | | | 2.3 | |
| Other | | | 1,079 | | | | 0.2 | | | | 1,363 | | | | 0.1 | | | | 1,563 | | | | 1.2 | |
| | | | | | | | | | | | | | | | | | | |
| | | | | | | | | | | | | | | | | | | | | | | | | |
Rest of Asia-Pacific | | | 142,807 | | | | | | | | 126,144 | | | | | | | | 128,381 | | | | | |
| | | | | | | | | | | | | | | | | | | |
| Demand and other – non-interest bearing | | | 16,418 | | | | – | | | | 13,425 | | | | – | | | | 11,872 | | | | – | |
| Demand – interest bearing | | | 63,033 | | | | 1.0 | | | | 53,108 | | | | 0.8 | | | | 49,329 | | | | 2.0 | |
| Savings | | | 51,757 | | | | 2.4 | | | | 46,137 | | | | 2.5 | | | | 52,849 | | | | 3.8 | |
| Time | | | 10,734 | | | | 0.9 | | | | 12,542 | | | | 1.2 | | | | 13,342 | | | | 3.3 | |
| Other | | | 865 | | | | 2.2 | | | | 932 | | | | 1.8 | | | | 989 | | | | 3.6 | |
| | | | | | | | | | | | | | | | | | | |
| | | | | | | | | | | | | | | | | | | | | | | | | |
Middle East | | | 32,747 | | | | | | | | 33,211 | | | | | | | | 35,546 | | | | | |
| | | | | | | | | | | | | | | | | | | |
| Demand and other – non-interest bearing | | | 11,873 | | | | – | | | | 9,865 | | | | – | | | | 10,849 | | | | – | |
| Demand – interest bearing | | | 6,315 | | | | 1.5 | | | | 6,364 | | | | 1.4 | | | | 6,324 | | | | 1.6 | |
| Savings | | | 13,774 | | | | 2.8 | | | | 15,005 | | | | 3.4 | | | | 16,119 | | | | 3.1 | |
| Time | | | 604 | | | | 2.6 | | | | 1,424 | | | | 2.7 | | | | 1,884 | | | | 2.9 | |
| Other | | | 181 | | | | 0.1 | | | | 553 | | | | 0.2 | | | | 370 | | | | 0.5 | |
| | | | | | | | | | | | | | | | | | | |
| | | | | | | | | | | | | | | | | | | | | | | | | |
| North America | | | 157,361 | | | | | | | | 145,820 | | | | | | | | 144,982 | | | | | |
| | | | | | | | | | | | | | | | | | | |
| Demand and other – non-interest bearing | | | 22,235 | | | | – | | | | 18,350 | | | | – | | | | 16,759 | | | | – | |
| Demand – interest bearing | | | 28,569 | | | | 0.2 | | | | 25,870 | | | | 0.2 | | | | 18,261 | | | | 1.6 | |
| Savings | | | 78,040 | | | | 0.8 | | | | 69,296 | | | | 1.4 | | | | 87,001 | | | | 2.5 | |
| Time | | | 17,975 | | | | 0.8 | | | | 25,164 | | | | 1.3 | | | | 17,838 | | | | 3.2 | |
| Other | | | 10,542 | | | | 0.6 | | | | 7,140 | | | | 0.8 | | | | 5,123 | | | | 2.4 | |
| | | | | | | | | | | | | | | | | | | |
| | | | | | | | | | | | | | | | | | | | | | | | | |
| Latin America | | | 77,618 | | | | | | | | 63,635 | | | | | | | | 65,071 | | | | | |
| | | | | | | | | | | | | | | | | | | |
| Demand and other – non-interest bearing | | | 12,407 | | | | – | | | | 10,598 | | | | – | | | | 12,507 | | | | – | |
| Demand – interest bearing | | | 6,270 | | | | 1.2 | | | | 4,734 | | | | 1.1 | | | | 4,994 | | | | 1.9 | |
| Savings | | | 41,784 | | | | 8.5 | | | | 33,091 | | | | 8.5 | | | | 31,442 | | | | 10.3 | |
| Time | | | 15,716 | | | | 3.9 | | | | 14,244 | | | | 4.8 | | | | 15,179 | | | | 5.2 | |
| Other | | | 1,441 | | | | 7.5 | | | | 968 | | | | 6.4 | | | | 949 | | | | 8.2 | |
| | | | | | | | | | | | | | | | | | | |
| | | | | | | | | | | | | | | | | | | | | | | | | |
| | | | | | | | | | | | | | | | | | | |
| | | | | | | | | | | | | | | | | | | | | | | | | |
| Total | | | 1,115,827 | | | | | | | | 1,070,963 | | | | | | | | 1,058,071 | | | | | |
| | | | | | | | | | | | | | | | | | | |
| Demand and other – non-interest bearing | | | 153,214 | | | | – | | | | 130,045 | | | | – | | | | 107,217 | | | | – | |
| Demand – interest bearing | | | 510,244 | | | | 0.3 | | | | 474,100 | | | | 0.3 | | | | 430,141 | | | | 1.9 | |
| Savings | | | 274,267 | | | | 2.5 | | | | 266,410 | | | | 2.6 | | | | 325,958 | | | | 3.9 | |
| Time | | | 117,962 | | | | 1.4 | | | | 141,320 | | | | 1.6 | | | | 159,110 | | | | 3.6 | |
| Other | | | 60,140 | | | | 0.7 | | | | 59,088 | | | | 0.9 | | | | 35,645 | | | | 3.6 | |
| | | | | | | | | | | | | | | | | | | |
31(o)
Report of the Directors: Operating and Financial Review(continued)
Certificates of deposit and other money market instruments
| | | | | | | | | | | | | | | | | | | | | | | | | |
| | | 2010 | | | 2009 | | | 2008 | |
| | | Average | | | Average | | | Average | | | Average | | | Average | | | Average | |
| | | balance | | | rate | | | balance | | | rate | | | balance | | | rate | |
| | | US$m | | | % | | | US$m | | | % | | | US$m | | | % | |
| | | | | | | | | | | | | | | | | | | | | | | | | |
| Europe | | | 57,018 | | | | 0.4 | | | | 65,151 | | | | 0.9 | | | | 74,007 | | | | 4.5 | |
| Hong Kong | | | 213 | | | | 3.8 | | | | 278 | | | | 3.6 | | | | 745 | | | | 3.0 | |
| Rest of Asia-Pacific | | | 3,529 | | | | 3.4 | | | | 3,536 | | | | 3.7 | | | | 6,966 | | | | 6.6 | |
| Middle East | | | 68 | | | | 0.5 | | | | 265 | | | | 6.4 | | | | 648 | | | | 4.6 | |
| North America | | | 10,607 | | | | 0.5 | | | | 14,218 | | | | 1.1 | | | | 22,278 | | | | 3.3 | |
| Latin America | | | 1,126 | | | | 4.0 | | | | 1,227 | | | | 3.6 | | | | 3,036 | | | | 7.8 | |
| | | | | | | | | | | | | | | | | | | |
| | | | | | | | | | | | | | | | | | | | | | | | | |
| | | | 72,561 | | | | 0.6 | | | | 84,675 | | | | 1.2 | | | | 107,680 | | | | 4.5 | |
| | | | | | | | | | | | | | | | | | | |
Certificates of deposit and other time deposits
The maturity analysis of certificates of deposit (‘CD’s) and other wholesale time deposits is expressed by remaining maturity. The majority of CDs and time deposits are in amounts of US$100,000 and over or the equivalent in other currencies.
| | | | | | | | | | | | | | | | | | | | | |
| | | At 31 December 2010 | |
| | | | | | | After | | | After | | | | | | | |
| | | | | | | 3 months | | | 6 months | | | | | | | |
| | | 3 months | | | but within | | | but within | | | After | | | | |
| | | or less | | | 6 months | | | 12 months | | | 12 months | | | Total | |
| | | US$m | | | US$m | | | US$m | | | US$m | | | US$m | |
| | | | | | | | | | | | | | | | | | | | | |
| Europe | | | 98,113 | | | | 14,977 | | | | 15,726 | | | | 7,587 | | | | 136,403 | |
| | | | | | | | | | | |
| Certificates of deposit | | | 14,153 | | | | 7,660 | | | | 6,018 | | | | – | | | | 27,831 | |
| Time deposits: | | | | | | | | | | | | | | | | | | | | |
| – banks | | | 25,183 | | | | 2,530 | | | | 1,671 | | | | 2,221 | | | | 31,605 | |
| – customers | | | 58,777 | | | | 4,787 | | | | 8,037 | | | | 5,366 | | | | 76,967 | |
| | | | | | | | | | | |
| | | | | | | | | | | | | | | | | | | | | |
| Hong Kong | | | 12,420 | | | | 564 | | | | 1,289 | | | | 722 | | | | 14,995 | |
| | | | | | | | | | | |
| Certificates of deposit | | | 87 | | | | 45 | | | | 6 | | | | 314 | | | | 452 | |
| Time deposits: | | | | | | | | | | | | | | | | | | | | |
| – banks | | | 2,234 | | | | 10 | | | | 65 | | | | 24 | | | | 2,333 | |
| – customers | | | 10,099 | | | | 509 | | | | 1,218 | | | | 384 | | | | 12,210 | |
| | | | | | | | | | | |
| | | | | | | | | | | | | | | | | | | | | |
Rest of Asia-Pacific | | | 15,375 | | | | 877 | | | | 542 | | | | 1,530 | | | | 18,324 | |
| | | | | | | | | | | |
| Certificates of deposit | | | 3,347 | | | | 370 | | | | 373 | | | | 559 | | | | 4,649 | |
| Time deposits: | | | | | | | | | | | | | | | | | | | | |
| – banks | | | 1,777 | | | | 34 | | | | 2 | | | | 107 | | | | 1,920 | |
| – customers | | | 10,251 | | | | 473 | | | | 167 | | | | 864 | | | | 11,755 | |
| | | | | | | | | | | |
| | | | | | | | | | | | | | | | | | | | | |
Middle East | | | 507 | | | | 113 | | | | 120 | | | | 568 | | | | 1,308 | |
| | | | | | | | | | | |
| Certificates of deposit | | | – | | | | – | | | | – | | | | – | | | | – | |
| Time deposits: | | | | | | | | | | | | | | | | | | | | |
| – banks | | | 364 | | | | – | | | | 2 | | | | 340 | | | | 706 | |
| – customers | | | 143 | | | | 113 | | | | 118 | | | | 228 | | | | 602 | |
| | | | | | | | | | | |
| | | | | | | | | | | | | | | | | | | | | |
| North America | | | 12,220 | | | | 1,979 | | | | 1,977 | | | | 1,152 | | | | 17,328 | |
| | | | | | | | | | | |
| Time deposits: | | | | | | | | | | | | | | | | | | | | |
| – banks | | | 2,501 | | | | 13 | | | | 3 | | | | 204 | | | | 2,721 | |
| – customers | | | 9,719 | | | | 1,966 | | | | 1,974 | | | | 948 | | | | 14,607 | |
| | | | | | | | | | | |
| | | | | | | | | | | | | | | | | | | | | |
| Latin America | | | 13,213 | | | | 1,446 | | | | 1,673 | | | | 3,115 | | | | 19,447 | |
| | | | | | | | | | | |
| Certificates of deposit | | | 183 | | | | 53 | | | | 447 | | | | 382 | | | | 1,065 | |
| Time deposits: | | | | | | | | | | | | | | | | | | | | |
| – banks | | | 1,855 | | | | 290 | | | | 163 | | | | 305 | | | | 2,613 | |
| – customers | | | 11,175 | | | | 1,103 | | | | 1,063 | | | | 2,428 | | | | 15,769 | |
| | | | | | | | | | | |
| | | | | | | | | | | | | | | | | | | | | |
| | | | | | | | | | | |
| | | | | | | | | | | | | | | | | | | | | |
| Total | | | 151,848 | | | | 19,956 | | | | 21,327 | | | | 14,674 | | | | 207,805 | |
| | | | | | | | | | | |
| Certificates of deposit | | | 17,770 | | | | 8,128 | | | | 6,844 | | | | 1,255 | | | | 33,997 | |
| Time deposits: | | | | | | | | | | | | | | | | | | | | |
| – banks | | | 33,914 | | | | 2,877 | | | | 1,906 | | | | 3,201 | | | | 41,898 | |
| – customers | | | 100,164 | | | | 8,951 | | | | 12,577 | | | | 10,218 | | | | 131,910 | |
| | | | | | | | | | | |
31(p)
Report of the Directors: Operating and Financial Review(continued)
Economic profit
Our internal performance measures include economic profit/(loss), a calculation which compares the return on financial capital invested in HSBC by our shareholders with the cost of that capital. We price our cost of capital internally and the difference between that cost and the post-tax profit attributable to ordinary shareholders represents the amount of economic profit/(loss) generated. Economic profit/(loss) generated is used by management as one input in deciding where to allocate capital and other resources.
In order to concentrate on external factors rather than measurement bases, we emphasise the trend in economic profit/(loss) ahead of absolute amounts within business units. Our long-term cost of capital is reviewed annually and for 2010 it was revised to 11% from the 10% used in 2009. We use a Capital Asset Pricing Model to determine our cost of capital. The main drivers of the increase were an increase in the risk free rate and an increase in the betas used in
the calculation. The following commentary is on a reported basis.
Our economic loss decreased by US$4.7bn to US$3.3bn as a result of an increase in profit attributable to shareholders. This was predominantly driven by lower loan impairment charges across all regions and customer groups, notably in the US due to lower balances and decreased delinquency rates in Card and Retail Services, and the run-off of the Consumer Lending and mortgage services portfolio.
The increase in average invested capital reflected higher retained earnings and a significant decrease in reserves representing unrealised losses on available-for-sale securities due to a slowing in the rate of anticipated losses in the underlying collateral pools.
The return on invested capital increased by 4.6 percentage points, although it remained below our benchmark cost of capital. The economic spread improved by 3.6 percentage points, the result of an increase in return on invested capital, partly offset by the rise in the cost of capital in 2010.
| | | | | | | | | | | | | | | | | |
| | | 2010 | | 2009 | |
| | | US$m | | | %41 | | US$m | | | %40 | |
| | | | | | | | | | | | | | | | | |
| Average total shareholders’ equity | | | 138,224 | | | | | | | | 115,431 | | | | | |
| Adjusted by: | | | | | | | | | | | | | | | | |
| Goodwill previously amortised or written off | | | 8,123 | | | | | | | | 8,123 | | | | | |
| Property revaluation reserves | | | (813 | ) | | | | | | | (799 | ) | | | | |
| Reserves representing unrealised losses on effective cash flow hedges | | | 100 | | | | | | | | 385 | | | | | |
| Reserves representing unrealised losses on available-for-sale securities | | | 6,129 | | | | | | | | 16,189 | | | | | |
| Preference shares and other equity instruments | | | (5,473 | ) | | | | | | | (3,538 | ) | | | | |
| | | | | | | | | | | | | | |
| | | | | | | | | | | | | | | | | |
Average invested capital42 | | | 146,290 | | | | | | | | 135,791 | | | | | |
| | | | | | | | | | | | | | |
| | | | | | | | | | | | | | | | | |
Return on invested capital43 | | | 12,746 | | | | 8.7 | | | | 5,565 | | | | 4.1 | |
| | | | | | | | | | | | | | | | | |
| Benchmark cost of capital | | | (16,092 | ) | | | (11.0 | ) | | | (13,579 | ) | | | (10.0 | ) |
| | | | | | | | | | | |
| | | | | | | | | | | | | | | | | |
| Economic loss and spread | | | (3,346 | ) | | | (2.3 | ) | | | (8,014 | ) | | | (5.9 | ) |
| | | | | | | | | | | |
For footnotes, see page 83.
32
Report of the Directors: Operating and Financial Review(continued)
Critical accounting policies
(Audited)
Introduction
The results of HSBC are sensitive to the accounting policies, assumptions and estimates that underlie the preparation of our consolidated financial statements. The significant accounting policies are described in Note 2 on the Financial Statements.
When preparing the financial statements, it is the Directors’ responsibility under UK company law to select suitable accounting policies and to make judgements and estimates that are reasonable and prudent. The accounting policies that are deemed critical to our results and financial position, in terms of the materiality of the items to which the policies are applied and the high degree of judgement involved, including the use of assumptions and estimation, are discussed below.
Impairment of loans and advances
Our accounting policy for losses arising from the impairment of customer loans and advances is described in Note 2g on the Financial Statements. Loan impairment allowances represent management’s best estimate of losses incurred in the loan portfolios at the balance sheet date.
Management is required to exercise judgement in making assumptions and estimations when calculating loan impairment allowances on both individually and collectively assessed loans and advances. Of the Group’s total loans and advances to customers before impairment allowances of US$978bn (2009: US$922bn), US$15bn or 2% (2009: US$15bn; 2%) were individually assessed for impairment, and US$963bn or 98% (2009: US$907bn; 98%) were collectively assessed for impairment.
The most significant judgemental area is the calculation of collective impairment allowances. The geographical area with most exposure to collectively assessed loans and advances is North America, which comprised US$198bn or 21% (2009: US$219bn; 24%) of the total. Collective impairment allowances in North America were US$9bn, representing 64% (2009: US$13bn; 68%) of the total collectively assessed loan impairment allowance.
The methods used to calculate collective impairment allowances on homogeneous groups of loans and advances that are not considered individually significant are disclosed in Note 2g on the Financial Statements. They are subject to estimation uncertainty, in part because it is not practicable to identify losses on an individual loan
basis because of the large number of individually insignificant loans in the portfolio.
The methods involve the use of statistically assessed historical information which is supplemented with significant management judgement to assess whether current economic and credit conditions are such that the actual level of inherent losses is likely to be greater or less than that suggested by historical experience. In normal circumstances, historical experience provides the most objective and relevant information from which to assess inherent loss within each portfolio, though sometimes it provides less relevant information about the inherent loss in a given portfolio at the balance sheet date, for example, when there have been changes in economic, regulatory or behavioural conditions which result in the most recent trends in portfolio risk factors being not fully reflected in the statistical models. In these circumstances, the risk factors are taken into account by adjusting the impairment allowances derived solely from historical loss experience.
Risk factors include loan portfolio growth, product mix, unemployment rates, bankruptcy trends, geographical concentrations, loan product features, economic conditions such as national and local trends in housing markets, the level of interest rates, portfolio seasoning, account management policies and practices, changes in laws and regulations, and other influences on customer payment patterns. Different factors are applied in different regions and countries to reflect local economic conditions, laws and regulations. The methodology and the assumptions used in calculating impairment losses are reviewed regularly in the light of differences between loss estimates and actual loss experience. For example, roll rates, loss rates and the expected timing of future recoveries are regularly benchmarked against actual outcomes to ensure they remain appropriate.
However, the exercise of judgement requires the use of assumptions which are highly subjective and very sensitive to the risk factors, in particular to changes in economic and credit conditions across a large number of geographical areas. Many of the factors have a high degree of interdependency and there is no single factor to which our loan impairment allowances as a whole are sensitive. They are particularly sensitive to general economic and credit conditions in North America, however. For example, a 10% increase in impairment allowances on collectively assessed loans and advances in North America would increase loan impairment allowances by US$0.9bn at 31 December 2010 (2009: US$1.3bn). It is possible that the outcomes within the next
33
Report of the Directors: Operating and Financial Review(continued)
financial year could differ from the assumptions built into the models, resulting in a material adjustment to the carrying amount of loans and advances.
Goodwill impairment
Our accounting policy for goodwill is described in Note 2p on the Financial Statements. Note 24 on the Financial Statements lists our cash generating units (‘CGU’s) by geographical region and global business. HSBC’s total goodwill amounted to US$22bn at 31 December 2010 (2009: US$23bn).
The review of goodwill impairment reflects management’s best estimate of the following factors:
| • | | the future cash flows of the CGUs are sensitive to the cash flows projected for the periods for which detailed forecasts are available and to assumptions regarding the long-term pattern of sustainable cash flows thereafter. Forecasts are compared with actual performance and verifiable economic data, but they necessarily and appropriately reflect management’s view of future business prospects at the time of the assessment; and |
| |
| • | | the rates used to discount future expected cash flows are based on the costs of capital assigned to individual CGUs and can have a significant effect on their valuation. The cost of capital percentage is generally derived from a Capital Asset Pricing Model, which incorporates inputs reflecting a number of financial and economic variables, including the risk-free interest rate in the country concerned and a premium for the inherent risk of the business being evaluated. These variables are subject to fluctuations in external market rates and economic conditions beyond our control and therefore require the exercise of significant judgement and are consequently subject to uncertainty. |
A decline in a CGU’s expected cash flows and/or an increase in its cost of capital reduces the CGU’s estimated recoverable amount. If this is lower than the carrying value of the CGU, a charge for impairment of goodwill is recognised in our income statement for the year.
The accuracy of forecast cash flows is subject to a high degree of uncertainty in volatile market conditions. In such market conditions, management retests goodwill for impairment more frequently than annually to ensure that the assumptions on which the cash flow forecasts are based continue to reflect current market conditions and management’s best estimate of future business prospects.
During 2010, no impairment of goodwill was identified (2009: nil). In addition to the annual impairment test which was performed as at 1 July 2010, management reviewed the current and expected performance of the CGUs as at 31 December 2010 and determined that there was no indication of potential impairment of the goodwill allocated to them. However, in the event of a significant deterioration in economic and credit conditions compared with those reflected by management in the cash flow forecasts for the CGUs, a material adjustment to a CGU’s recoverable amount may occur which may result in the recognition of an impairment charge in the income statement.
Note 24 on the Financial Statements includes details of the CGU’s with significant balances of goodwill, states the key assumptions used to assess the goodwill in each of those CGUs for impairment and provides a discussion of the sensitivity of the carrying value of goodwill to changes in key assumptions.
Valuation of financial instruments
Our accounting policy for determining the fair value of financial instruments is described in Note 2d on the Financial Statements.
The best evidence of fair value is a quoted price in an actively traded market. In the event that the market for a financial instrument is not active, a valuation technique is used. The majority of valuation techniques employ only observable market data and so the reliability of the fair value measurement is high. However, certain financial instruments are valued on the basis of valuation techniques that feature one or more significant market inputs that are unobservable. Valuation techniques that rely to a greater extent on unobservable inputs require a higher level of management judgement to calculate a fair value than those based wholly on observable inputs.
Valuation techniques used to calculate fair values are discussed in Note 16 on the Financial Statements. The main assumptions and estimates which management consider when applying a model with valuation techniques are:
| • | | the likelihood and expected timing of future cash flows on the instrument. These cash flows are usually governed by the terms of the instrument, although judgement may be required when the ability of the counterparty to service the instrument in accordance with the contractual terms is in doubt. Future cash flows may be sensitive to changes in market rates; |
34
Report of the Directors: Operating and Financial Review(continued)
| • | | selecting an appropriate discount rate for the instrument. The determination of this rate is based on an assessment of what a market participant would regard as the appropriate spread of the rate for the instrument over the appropriate risk-free rate; and |
| |
| • | | judgement to determine what model to use to calculate fair value in areas where the choice of valuation model is particularly subjective, for example, when valuing complex derivative products. |
When applying a model with unobservable inputs, estimates are made to reflect uncertainties in fair values resulting from a lack of market data inputs, for example, as a result of illiquidity in the market. For these instruments, the fair value measurement is less reliable. Inputs into valuations based on unobservable data are inherently uncertain because there is little or no current market data available from which to determine the level at which an arm’s length transaction would occur under normal business conditions. However, in most cases there is some market data available on which to base a determination of fair value, for example historical data, and the fair values of most financial instruments are based on some market observable inputs even when unobservable inputs are significant.
The value of financial assets and liabilities measured at fair value using a valuation technique was US$599bn (2009: US$599bn) and US$499bn (2009: US$447bn), respectively or 56% (2009: 56%) of total financial assets and 77% (2009: 75%) of total financial liabilities measured at fair value.
Disclosures of the types and amounts of adjustments made in determining the fair value of financial instruments measured at fair value using valuation techniques, and a sensitivity analysis of fair values for financial instruments with significant unobservable inputs to reasonably possible alternative assumptions can be found in Note 16 on the Financial Statements. Given the uncertainty and subjective nature of valuing financial instruments at fair value, it is possible that the outcomes in the next financial year could differ from the assumptions used, and this could result in a material adjustment to the carrying amount of financial instruments measured at fair value.
Impairment of available-for-sale financial assets
Our accounting policy for impairment of available-for-sale financial assets is described in Note 2j on the Financial Statements.
At 31 December 2010, our total available-for-sale financial assets amounted to US$381bn (2009: US$352bn), of which US$373bn or 98% (2009: US$342bn; 97%) were debt securities. The available-for-sale fair value reserve relating to debt securities amounted to a deficit of US$6.2bn (2009: deficit of US$11.4bn). A deficit in the available-for-sale fair value reserve occurs on debt securities when the fair value of a relevant security is less than its acquisition cost (net of any principal repayments and amortisation) after deducting any previous impairment loss recognised in the income statement, but where there is no evidence of any impairment or, if an impairment was previously recognised, any subsequent impairment.
Management is required to exercise judgement in determining whether there is objective evidence that an impairment loss has occurred. Once an impairment has been identified, the amount of impairment loss is measured with reference to the fair value of the asset. More information on assumptions and estimates requiring management judgement relating to the determination of fair values of financial instruments is provided above in ‘Valuation of financial instruments’.
Deciding whether an available-for-sale debt security is impaired requires objective evidence of both the occurrence of a loss event and a related decrease in estimated future cash flows. The degree of judgement involved is less when cash flows are readily determinable, but increases when estimating future cash flows requires consideration of a number of variables, some of which may be unobservable in current market conditions.
There is no single factor to which the Group’s charge for impairment of available-for-sale debt securities is particularly sensitive, because of the various types of securities we hold, the range of geographical areas in which those securities are held, and the wide range of factors which can affect the occurrence of loss events and the cash flows of securities, including different types of collateral.
The most significant judgements concern more complex instruments, such as ABSs, where it is necessary to consider factors such as the estimated future cash flows on underlying pools of collateral including prepayment speeds, the extent and depth of market price declines and changes in credit ratings. The review of estimated future cash flows on underlying collateral is subject to uncertainties when the assessment is based on historical information on pools of assets, and judgement is required to determine whether historical performance remains
35
Report of the Directors: Operating and Financial Review(continued)
representative of current economic and credit conditions.
Further details of the nature and extent of our exposures to ABSs classified as available-for-sale and a more detailed description of the assumptions and estimates used in assessing these securities for impairment, together with a discussion of those assets which are most sensitive to possible future impairment, are provided in ‘Securitisation exposures and other structured products’ on page 128.
It is possible that outcomes in the next financial year could be different from those modelled when seeking to identify impairment on available-for-sale debt securities. In this event, impairment may be identified in available-for-sale debt securities which had previously been determined not to be impaired, potentially resulting in the recognition of material impairment losses in the next financial year.
Deferred tax assets
Our accounting policy for the recognition of deferred tax assets is described in Note 2s on the Financial Statements. The recognition of a deferred tax asset relies on an assessment of the probability and sufficiency of future taxable profits, future reversals of existing taxable temporary differences and ongoing tax planning strategies.
The most significant judgements concern the US deferred tax assets, given the recent history of losses in our US operations. Net US deferred tax assets amounted to US$4bn or 58% (2009: US$5.1bn; 59%) of deferred tax assets recognised on the Group’s balance sheet.
Recognition of US deferred tax assets is based on the evidence available about conditions at the balance sheet date, and requires significant judgements to be made regarding projections of loan impairment charges and the timing of recovery in the US economy. These judgements take into consideration the effect of both positive and negative
evidence, including historical financial performance, projections of future taxable income, future reversals of existing taxable temporary differences, tax planning strategies and the availability of loss carrybacks.
Projections of future taxable income in the US are based on business plans, future capital requirements and ongoing tax planning strategies. These projections include assumptions about future house prices, US economic conditions, including unemployment levels and their impact on loan impairment charges, and capital support from HSBC Holdings. These forecasts are consistent with the assumption that it is probable that the results of future operations will generate sufficient taxable income to support the deferred tax assets. In management’s judgement, recent market conditions, which have resulted in losses being incurred in the US, will create significant downward pressure and volatility regarding the profit or loss before tax in the next few years. To reflect this, the assessment of recoverability of the deferred tax assets in the US significantly discounts any future expected taxable income and relies to a greater extent on capital support to the US operations from HSBC Holdings, including tax planning strategies implemented in relation to such support.
The most significant tax planning strategy is the investment of capital in our US operations to ensure the realisation of the deferred tax assets. The transfer of a subsidiary as part of an internal reorganisation on 31 January 2010 provided substantial support for the recoverability of the US deferred tax assets. Management expects that, with support, our US operations will continue to execute their business strategies and plans until they return to profitability. If HSBC Holdings were to decide not to provide ongoing support, the full recovery of the deferred tax asset may no longer be probable and could result in a significant reduction of the deferred tax asset which would be recognised as a charge in the income statement.
36
Report of the Directors: Operating and Financial Review(continued)
Customer groups and global businesses
| | | | | |
| | | | Page |
| | | 37 | |
| |
| | | 38 | |
| |
| | | 40 | |
| |
| | | 42 | |
| |
| | | 44 | |
| |
| | | 46 | |
| |
| | | 47 | |
| |
| | | 47 | (a) |
| |
| | | 48 | |
Basis of preparation
The results are presented in accordance with the accounting policies used in the preparation of HSBC’s consolidated financial statements. Our operations are closely integrated and, accordingly, the presentation of customer group and global business data includes internal allocations of certain items of income and expense. These allocations include the costs of certain support services and GMO functions, to the extent that these can be meaningfully attributed to operational business lines. While such allocations have been made on a systematic and consistent basis, they necessarily involve a degree of subjectivity.
Where relevant, income and expense amounts presented include the results of inter-segment funding as well as inter-company and inter-business line transactions. All such transactions are undertaken on arm’s length terms.
Summary
HSBC’s senior management reviews operating activity on a number of bases, including by geographical region and by customer group and global business. Capital resources are allocated and performance is assessed primarily by geographical region, as presented on page 50.
The commentaries below present customer groups and global businesses followed by
geographical regions. Performance is discussed in this order because certain strategic themes, business initiatives and trends affect more than one geographical region. All commentaries are on an underlying basis (see page 14) unless stated otherwise. All references to HSBC Finance and HSBC Bank USA are also on a management basis as loans referred to HSBC Bank USA from HSBC Finance are managed by the latter and all costs and benefits accrue thereto.
Profit/(loss) before tax
| | | | | | | | | | | | | | | | | | | | | | | | | |
| | | 2010 | | | 2009 | | | 2008 | |
| | | US$m | | | % | | | US$m | | | % | | | US$m | | | % | |
| | | | | | | | | | | | | | | | | | | | | | | | | |
| Personal Financial Services | | | 3,518 | | | | 18.5 | | | | (2,065 | ) | | | (29.2 | ) | | | (10,974 | ) | | | (117.9 | ) |
| Commercial Banking | | | 6,090 | | | | 32.0 | | | | 4,275 | | | | 60.4 | | | | 7,194 | | | | 77.3 | |
| Global Banking and Markets | | | 9,536 | | | | 50.1 | | | | 10,481 | | | | 148.1 | | | | 3,483 | | | | 37.4 | |
| Global Private Banking | | | 1,054 | | | | 5.5 | | | | 1,108 | | | | 15.6 | | | | 1,447 | | | | 15.6 | |
Other44 | | | (1,161 | ) | | | (6.1 | ) | | | (6,720 | ) | | | (94.9 | ) | | | 8,157 | | | | 87.6 | |
| | | | | | | | | | | | | |
| | | | | | | | | | | | | | | | | | | | | | | | | |
| | | | 19,037 | | | | 100.0 | | | | 7,079 | | | | 100.0 | | | | 9,307 | | | | 100.0 | |
| | | | | | | | | | | | | |
Total assets45
| | | | | | | | | | | | | | | | | |
| | | At 31 December | |
| | | 2010 | | | 2009 | |
| | | US$m | | | % | | | US$m | | | % | |
| | | | | | | | | | | | | | | | | |
| Personal Financial Services | | | 527,698 | | | | 21.5 | | | | 554,074 | | | | 23.4 | |
| Commercial Banking | | | 296,797 | | | | 12.1 | | | | 251,143 | | | | 10.6 | |
| Global Banking and Markets | | | 1,758,315 | | | | 71.6 | | | | 1,683,672 | | | | 71.2 | |
| Global Private Banking | | | 116,846 | | | | 4.8 | | | | 116,148 | | | | 4.9 | |
| Other | | | 161,458 | | | | 6.6 | | | | 150,983 | | | | 6.4 | |
| Intra-HSBC items | | | (406,425 | ) | | | (16.6 | ) | | | (391,568 | ) | | | (16.5 | ) |
| | | | | | | | | |
| | | | | | | | | | | | | | | | | |
| | | | 2,454,689 | | | | 100.0 | | | | 2,364,452 | | | | 100.0 | |
| | | | | | | | | |
For footnotes, see page 83.
37
Report of the Directors: Operating and Financial Review(continued)
Products and services
Products and services
| | | |
Personal Financial Services
PFS offers its products and services to customers based on their individual needs. Premier and Advance services are targeted at mass affluent and emerging affluent customers who value international connectivity and benefit from our global reach and scale. For customers who have simpler everyday banking needs, we offer a full range of banking products and services reflecting local requirements.
In addition, we are one of the largest card issuers in the world, offering HSBC branded cards, co-branded cards with selected partners and private label (store) cards.
Typically, customer offerings include personal banking products (current and savings accounts, mortgages and personal loans, credit cards, debit cards and local and international payment services) and wealth management services (insurance and investment products and financial planning services). | | • HSBC Premier provides preferential banking services and global recognition to our high net worth customers and their immediate families with a dedicated relationship manager, specialist wealth advice and tailored solutions. Customers can access emergency travel assistance, priority telephone banking and an online ‘global view’ of their Premier accounts around the world with free money transfers between them. • HSBC Advance provides a range of preferential products and services customised to meet local needs. With a dedicated telephone service, access to wealth advice and online tools to support financial planning, it gives customers an online ‘global view’ of their Advance accounts with money transfers between them. • Wealth Solutions & Financial Planning: a financial planning process designed around individual customer needs to help our clients to protect, grow and manage their wealth through best-in-class investment and wealth insurance products manufactured by in-house partners (Global Asset Management, Global Markets and HSBC Insurance) and by selected third party providers.
Customers can transact with the bank via a range of channels such as internet banking and self-service terminals in addition to traditional and automated branches and telephone service centres.
|
| |
| | | |
Commercial Banking
We segment our CMB business into Corporate, to serve both Corporate and Mid-Market companies with more sophisticated financial needs and Business Banking, to serve the small and medium-sized enterprises (‘SME’s) sector. This enables the development of tailored customer propositions while adopting a broader view of the entire commercial banking sector, from sole proprietors to large corporations. This allows us to provide continuous support to companies as they expand both domestically and internationally, and ensures a clear focus on the business banking segments, which are typically the key to innovation and growth in market economies.
We place particular emphasis on international connectivity to meet our business customers’ needs and aim to be recognised as the leading international bank in all our markets and the best bank for business in our largest markets. | | • Financing: we offer a broad range of financing, both domestic and cross-border, including overdrafts, receivables finance, term loans and syndicated, leveraged, acquisition and project finance. Asset finance is offered in selected sites, focused on leasing and instalment finance for vehicles, plant and equipment. • Payments and cash management: we are a leading provider of domestic and cross-border payments and collections, liquidity management and account services worldwide, delivered through our e-platform, HSBC net. • International trade: we provide various international trade products and services, to both buyers and suppliers such as export finance, guarantees, documentary collections and forfeiting to improve efficiency and help mitigate risk throughout the supply chain. • Treasury: CMB customers are volume users of our foreign exchange, derivatives and structured products. • Capital markets & advisory: capital raising on debt and equity markets and advisory services are available as required. • Commercial cards: card issuing helps customers enhance cash management, credit control and purchasing. Card acquiring services enable merchants to accept credit and debit card payments in person or remotely. • Insurance: CMB offers key person, employee benefits and a variety of commercial risk insurance such as property, cargo and trade credit. • Direct channels: these include online and direct banking offerings such as telephone banking, HSBCnet and Business Internet Banking.
|
| |
38
Report of the Directors: Operating and Financial Review(continued)
| | | |
Global Banking and Markets
GB&M provides tailored financial solutions to major government, corporate and institutional clients and private investors worldwide. Managed as a global business, GB&M operates a long-term relationship management approach to build a full understanding of clients’ financial requirements. Sector-focused client service teams comprising relationship managers and product specialists develop financial solutions to meet individual client needs. With dedicated offices in over 65 countries and access to HSBC’s worldwide presence and capabilities, this business serves subsidiaries and offices of our clients on a global basis.
GB&M is managed as four principal business lines: Global Markets, Global Banking, Global Asset Management and Principal Investments. This structure allows us to focus on relationships and sectors that best fit the Group’s footprint and facilitate seamless delivery of our products and services to clients. | | • Global Markets operations consist of treasury and capital markets services. Products include foreign exchange; currency, interest rate, bond, credit, equity and other derivatives; government and non-government fixed income and money market instruments; precious metals and exchange-traded futures; equity services; distribution of capital markets instruments; and securities services, including custody and clearing services and funds administration to both domestic and cross-border investors. • Global Banking offers financing, advisory and transaction services. Products include: – capital raising, advisory services, bilateral and syndicated lending, leveraged and acquisition finance, structured and project finance, lease finance and non-retail deposit taking; – international, regional and domestic payments and cash management services; and trade services for large corporate clients. • Global Asset Management offers investment solutions to institutions, financial intermediaries and individual investors globally. |
| | | • Principal Investments includes our strategic relationships with third-party private equity managers and other investments.
|
| |
| | | |
Global Private Banking
HSBC Private Bank is the principal marketing name of our international private banking business, Global Private Banking (‘GPB’). Utilising the most suitable products from the marketplace, GPB works with its clients to offer both traditional and innovative ways to manage and preserve wealth while optimising returns.
GPB accesses expertise in six major advisory centres in Hong Kong, Singapore, Geneva, New York, Paris and London to identify opportunities which meet clients’ needs and investment strategies. | | • Private Banking services comprise multi-currency deposit accounts and fiduciary deposits, credit and specialist lending, treasury trading services, cash management, securities custody and clearing. GPB works to ensure that its clients have full access to other products and services available in HSBC such as credit cards, internet banking, corporate banking and investment banking. • Private Wealth Management comprises both advisory and discretionary investment services. A wide range of investment vehicles is covered, including bonds, equities, derivatives, options, futures, structured products, mutual funds and alternatives (hedge funds, private equity and real estate). – Corporate Finance Solutions helps provide clients with cross border solutions for their companies, working in conjunction with GB&M. |
| | | • Private Wealth Solutions comprise inheritance planning, trustee and other fiduciary services designed to protect wealth and preserve it for future generations through structures tailored to meet the individual needs of each family. Areas of expertise include trusts, foundation and company administration, charitable trusts and foundations, insurance, family office advisory and philanthropy.
|
| |
39
Report of the Directors: Operating and Financial Review(continued)
Personal Financial Services
PFS provides 92 million individual and self-employed customers with financial services in over 60 markets worldwide.
| | | | | | | | | | | | | |
| | | 2010 | | | 2009 | | | 2008 | |
| | | US$m | | | US$m | | | US$m | |
| | | | | |
| Net interest income | | | 24,161 | | | | 25,107 | | | | 29,419 | |
| Net fee income | | | 7,336 | | | | 8,238 | | | | 10,107 | |
| Other income | | | 1,079 | | | | 2,070 | | | | 1,963 | |
| | | | | | | |
Net operating income46 | | | 32,576 | | | | 35,415 | | | | 41,489 | |
| | | | | |
Impairment charges47 | | | (11,259 | ) | | | (19,902 | ) | | | (21,220 | ) |
| | | | | | | |
Net operating income | | | 21,317 | | | | 15,513 | | | | 20,269 | |
| | | | | |
| Total operating expenses | | | (18,805 | ) | | | (18,292 | ) | | | (31,704 | ) |
| | | | | | | |
Operating profit/(loss) | | | 2,512 | | | | (2,779 | ) | | | (11,435 | ) |
| | | | | |
Income from associates48 | | | 1,006 | | | | 714 | | | | 461 | |
| | | | | | | |
Profit/(loss) before tax | | | 3,518 | | | | (2,065 | ) | | | (10,974 | ) |
| | | | | | | |
Return to profitability in PFS
as credit quality
improved
HSBC Advance
launched in
34
markets in its first year
Significant increase
in mortgage lending
in Hong Kong and the UK
Strategic direction
Our strategy for PFS is to use our global reach and scale to grow profitably in selected markets by providing relationship banking and wealth management services. PFS employs two globally consistent propositions in Premier and Advance and focuses on deepening customer relationships and increasing the penetration of wealth management services. In markets where we already have scale or where scale can be built over time, we provide services to all customer segments. In other markets, we participate more selectively, targeting mass affluent customers which have strong international connectivity or where our global scale is crucial.
For footnotes, see page 83.
Review of performance
| • | | PFS reported a profit before tax of US$3.5bn compared with a reported and underlying loss of US$2.1bn in 2009. This was largely attributable to a decline in loan impairment charges in the US and the managed reduction of certain higher risk portfolios in Latin America, Asia and the Middle East. Performance improved in all regions as the credit quality of our lending portfolios generally rose and revenue grew in Asia and Europe, reflecting higher investment-related income, increased insurance revenue in Hong Kong and mortgage lending growth combined with wider spreads in the UK. Income from associates, particularly Ping An Insurance, increased, driven by strong sales growth. |
| • | | Revenue fell, largely in HSBC Finance, due to lower lending balances in both the run-off portfolio and in the Card and Retail Services business. Card fees also decreased in North America following the implementation of the CARD Act. Revenue was further affected by an adverse fair value movement related to the non-qualifying hedges recorded in HSBC Finance compared with a favourable movement in 2009, as long-term interest rates declined. |
| • | | We continued to invest in our business by hiring new relationship managers, investing in systems and infrastructure and developing our product offerings. Operating expenses remained broadly unchanged as a rise in costs in Asia from increased headcount and higher marketing expenditure in support of business expansion was broadly offset by strict cost control across the Group and lower costs associated with the reduced scope of the business in the US. |
| • | | Loan impairment charges and other credit risk provisions fell by 44% in the improved economic conditions, reflecting a decline in lending balances, enhanced collection processes and tighter lending criteria. The decline in lending was significant in the US as the run-off of the non-core portfolio continued and balances fell in the Card and Retail Services business, where there were fewer active accounts and customers reduced their credit card debt. In addition, certain higher risk portfolios in Latin America, Asia and the Middle East were managed down and repositioned to higher quality assets, resulting in an improvement in credit quality. |
| • | | In the UK, we increased our market share of mortgage lending, while maintaining a conservative loan to value ratio on new business. We grew mortgage lending in Asia, |
40
Report of the Directors: Operating and Financial Review(continued)
| | | significantly in Hong Kong, where the introduction of HIBOR-linked mortgages drove volume growth and enabled us to maintain our market leadership. In Australia, Singapore and Malaysia we were able to grow mortgage volumes through targeted marketing campaigns. Customer account balances also grew, largely on the back of increased customer numbers in Asia and the UK. |
| • | | HSBC Premier, our flagship global customer proposition, was available in 47 markets and had grown to 4.4m customers at the end of 2010. We attracted over 980,000 net new customers in 2010, of whom over 50% were new to HSBC. |
| • | | We made further progress in standardising our various offerings across the Group for emerging mass affluent customers with the continued transition of eligible customers to HSBC Advance, our second globally consistent proposition. At 31 December 2010, Advance had a customer base of 4.6m and was available in 34 markets. |
| • | | During 2010, HSBC’s Global View and Global Transfer online capabilities were extended to our Advance customer base. These services allow Premier and Advance customers to access and manage all their accounts through one single logon and transfer funds between their overseas accounts online. Both the volume and the value of transfers increased strongly during the year as our target customer base and general awareness of these services grew. |
| • | | Our World Selection global investment offering continued to grow and is now available in 26 markets with total assets under management of US$7.2bn at 31 December 2010. |
| • | | We further enhanced our services and made banking easier for our customers with initiatives such as increased Saturday branch opening in the UK, the launch of retail renminbi wealth management products, mobile banking and online real time bond trading in Hong Kong, and the upgrading of the US automatic teller machine (‘ATM’) network to accept deposits. |
41
Report of the Directors: Operating and Financial Review(continued)
Commercial Banking
CMB offers a full range of commercial financial services and tailored propositions to 3.6m customers ranging from sole proprietors to publicly quoted companies in 65 countries.
| | | | | | | | | | | | | |
| | | 2010 | | | 2009 | | | 2008 | |
| | | US$m | | | US$m | | | US$m | |
| | | | | |
| Net interest income | | | 8,487 | | | | 7,883 | | | | 9,494 | |
| Net fee income | | | 3,964 | | | | 3,702 | | | | 4,097 | |
| Other income | | | 1,383 | | | | 1,268 | | | | 1,726 | |
| | | | | | | |
Net operating income46 | | | 13,834 | | | | 12,853 | | | | 15,317 | |
| | | | | |
Impairment charges47 | | | (1,805 | ) | | | (3,282 | ) | | | (2,173 | ) |
| | | | | | | |
Net operating income | | | 12,029 | | | | 9,571 | | | | 13,144 | |
| | | | | |
| Total operating expenses | | | (6,831 | ) | | | (5,963 | ) | | | (6,581 | ) |
| | | | | | | |
Operating profit | | | 5,198 | | | | 3,608 | | | | 6,563 | |
| | | | | |
Income from associates48 | | | 892 | | | | 667 | | | | 631 | |
| | | | | | | |
Profit before tax | | | 6,090 | | | | 4,275 | | | | 7,194 | |
| | | | | | | |
Strong balance sheet growth with
21%
rise in lending to US$239bn
Significant-pre-tax profit
contribution from
emerging markets at
67%
First international bank to
complete renminbi trade
settlements across six continents
Strategic direction
| |
| CMB’s core strategy is focused on two key initiatives: |
| • | | to be the leading international business bank in all our markets, leveraging HSBC’s extensive geographical network together with its product expertise in payments, trade, receivables finance and foreign exchange to actively support customers who are trading and investing internationally; and |
| |
| • | | to be the best bank for small- and medium-sized enterprises in our largest markets. |
For footnotes, see page 83.
Review of performance
| • | | In 2010, CMB reported profit before tax of US$6.1bn, 42% higher than in 2009 with growth across all regions. Excluding the gains from the sales in 2010 of HSBC Insurance Brokers and our stake in the Wells Fargo HSBC Trade Bank, and similar non-recurring items in 2009, (see page 14), profit before tax increased by 48%. The rise in profit reflected an improvement in the credit environment and strong growth in world trade. |
| |
| • | | Revenue grew by 8% to US$13.7bn, mainly in Asia, where we expanded customer lending significantly and increased our fee income from remittances, trade and investments. Our insurance operations also performed strongly in Asia, with an increased uptake of our life insurance products in Hong Kong. In North America, repricing initiatives led to a notable increase in revenue. |
| |
| • | | Loan impairment charges and other credit risk provisions declined by 46% to US$1.8bn with favourable variances in all regions as the credit environment improved and our exposure to higher risk portfolios was managed down. |
| |
| • | | Excluding CMB’s share of the non-recurring accounting gains related to the change in the UK pension scheme, (see page 26), operating expenses increased by 11% to US$6.8bn as we continued to invest for future revenue growth in those markets that we see as central to international connectivity. We hired more relationship managers in France, Brazil, Mexico and Hong Kong, and continued to invest in systems to improve our customer experience. As a result, our cost efficiency ratio rose to 49.8% in 2010. |
| |
| • | | CMB’s share of income from associates grew by 33% to US$892m, notably in mainland China. |
| |
| • | | Customer lending balances rose by 21% to US$239bn, driven by increased demand in Asia as market sentiment improved, and growth in key developed markets such as France and the UK, where we actively supported corporates and SMEs in response to changes in the economy. Our corporate segment increased lending by 25% to US$183bn, notably in Hong Kong and mainland China. |
| |
| • | | CMB attracted over half a million new customers in 2010, taking the total to 3.6m, and we grew customer account balances by 8%, with significant growth in Asia where HSBC was |
42
Report of the Directors: Operating and Financial Review(continued)
| | | ranked as the best cash management bank in 2010 byEuromoney. |
| |
| • | | In line with our strategy to be the leading international business bank, we continued to pursue opportunities to expand our customer base of businesses that trade and invest internationally. In 2010, we opened CMB’s first corporate branch in Switzerland to enable our Swiss-based customers to access our international banking services, particularly in faster growing markets. In the UK, we recruited 139 new International Commercial Managers to support the international expansion plans of UK businesses. |
| |
| • | | Our geographical presence across both developed and emerging markets allowed us to capitalise on the rising levels of international trade flows, notably in Asia and Europe, where we gained export market share in 2010. In the Middle East, we increased our lending to exporters in the region by 69%. In the United Arab Emirates (‘UAE’) specifically, our average lending to exporters more than doubled in 2010 to US$700m. |
| |
| • | | The number of successful cross-border referrals increased by 77% compared with 2009, with a total transaction value in 2010 of almost US$15bn. Significantly, successful intra-Asia referrals doubled from 2009, while referrals from mainland China more than doubled reflecting the increased appetite of Chinese business to explore international opportunities. |
| |
| • | | CMB continued to demonstrate connectivity with other customer groups within HSBC. Our partnership with GB&M allowed us to support our customers in accessing capital markets to help them grow and expand internationally. Successful referrals from CMB represented 51% of total net new money generated from internal referrals to GPB in 2010, while 5% of new Premier accounts were referred from CMB. |
| |
| • | | CMB has a diverse suite of products to support businesses that trade internationally. We are the second largest export factor globally and, in |
| | | 2010, we launched our Receivables Finance proposition in Germany, Europe’s largest economy, which has rapidly growing export ties with Asia. In the UK, we increased international trade finance by 13%. In addition, we successfully piloted the Supplier Invoice Finance Scheme, a reverse factoring product, in India, mainland China and Hong Kong. |
| |
| • | | We became the first international bank to provide renminbi-denominated trade settlements across six continents in 2010 and we are one of the largest international banks in Hong Kong to offer renminbi products, with total transactions exceeding US$6.7bn in 2010. |
| |
| • | | Our Business Banking propositions are focused on better serving SMEs, especially those that trade internationally. At the end of 2010, we had over 3.4m customers worldwide in the Business Banking segment, representing 55% of CMB’s total deposit balances and providing an important source of funding for our Corporate segment. |
| |
| • | | We continue to recognise the importance of SMEs to sustained economic recovery and provided working capital finance for this sector throughout 2010. In Hong Kong, we maintained our active participation in the Government Special Loan Guarantee Scheme, through which we provided US$1.5bn in SME financing in 2010. In the UK, we increased new lending to SMEs by 19% in 2010, opened accounts for over 125,000 customers starting new businesses and added over 170 extra local business managers. |
| |
| • | | We continued to develop and improve our direct channels through enhanced telephone-based relationship management services in key markets, including the launch of smartphone services in Hong Kong. In the UK, we also launched straight-through foreign exchange services. Notably, we are now the leading direct bank in Europe with over one million SME business customers using our Business Internet Banking platform. |
43
Report of the Directors: Operating and Financial Review(continued)
Global Banking and Markets
GB&M is a global business which provides tailored financial solutions to major government, corporate and institutional clients worldwide.
| | | | | | | | | | | | | |
| | | 2010 | | | 2009 | | | 2008 | |
| | | US$m | | | US$m | | | US$m | |
| | | | | |
| Net interest income | | | 7,348 | | | | 8,610 | | | | 8,541 | |
| Net fee income | | | 4,725 | | | | 4,363 | | | | 4,291 | |
Net trading income49 | | | 5,831 | | | | 6,875 | | | | 481 | |
Other income | | | 2,043 | | | | 1,972 | | | | 205 | |
| | | | | | | |
Net operating income46 | | | 19,947 | | | | 21,820 | | | | 13,518 | |
| | | | | |
Impairment charges47 | | | (990 | ) | | | (3,168 | ) | | | (1,471 | ) |
| | | | | | | |
Net operating income | | | 18,957 | | | | 18,652 | | | | 12,047 | |
| | | | | |
| Total operating expenses | | | (9,962 | ) | | | (8,537 | ) | | | (9,092 | ) |
| | | | | | | |
Operating profit | | | 8,995 | | | | 10,115 | | | | 2,955 | |
| | | | | |
Income from associates48 | | | 541 | | | | 366 | | | | 528 | |
| | | | | | | |
Profit before tax | | | 9,536 | | | | 10,481 | | | | 3,483 | |
| | | | | | | |
Employee expenses (including
payroll and bonus taxes)
in operating expenses
US$4,737m
(2009: US$4,335m: 2008: US$4,263m)
Strong contribution from
emerging markets
| | | |
Best Global Emerging
Markets Bank
Best Global Emerging
Markets Debt House
Best Debt House
in Asia
Euromoney Awards
for Excellence 2010 | |
Emerging Markets
Bond House of the Year
International Financing
Review Awards 2010 |
Strategic direction
In 2010, GB&M continued to pursue its now well-established ‘emerging markets-led and financing-focused’ strategy, encompassing HSBC’s objective to be a leading wholesale bank by:
| • | | utilising the Group’s extensive distribution network; |
| • | | developing GB&M’s hub-and-spoke business model; and |
| • | | continuing to build capabilities in major hubs to support the delivery of an advanced suite of services to major government, corporate and institutional clients across the HSBC network. |
This combination of product depth and distribution strength is fundamental to meeting the needs of existing and new clients and allowing GB&M to achieve its strategic goals.
For footnotes, see page 83.
Review of performance
| • | | GB&M reported profit before tax of US$9.5bn, 9% lower than in 2009. On an underlying basis, which excludes the gains resulting from the sale of Eversholt Rail Group and HSBC Private Equity (Asia) Ltd in 2010, profit before tax declined by 14%, driven by lower income from Balance Sheet Management and Credit and Rates trading and higher operating costs. Profitability benefited from a significant reduction in loan impairment charges and other credit risk provisions. Operating results remained well diversified across our businesses with a strong contribution from emerging markets, where we continued to support existing and anticipated new business, including introducing a ‘China desk’ in the Middle East and a ‘Latam desk’ in Hong Kong. |
| |
| • | | Net operating income before loan impairment charges and other credit risk provisions decreased by 11%, mainly due to lower net interest income in Balance Sheet Management from the maturing of higher yielding positions, low interest rates and flattening yield curves. Lower trading income largely reflected uncertainty in the eurozone, particularly in the second half of 2010. This was offset in part by a net release of US$429m largely relating to legacy positions in Credit trading and monoline Credit exposures, compared with a reported write-down of US$331m in 2009, following a general improvement in ABS prices. Trading income also benefited from a small favourable fair value movement on structured liabilities, compared with an adverse fair value movement in 2009, resulting in a reported favourable movement of US$466m. |
| |
| • | | Loan impairment charges and other credit risk provisions decreased by US$2.2bn. A US$1.2bn reduction in loan impairment charges to US$500m was driven by a general improvement in the credit environment and the non-recurrence of significant charges taken in relation to a small number of clients in 2009. Credit risk provisions on the available-for-sale portfolio decreased by US$981m to US$490m, of which US$444m related to ABSs, significantly lower than the US$1.5bn impairment reported in 2009, due to a slowing in the rate of anticipated losses in the underlying collateral pools. |
| |
| • | | Higher operating expenses in 2010 reflected the one-off payroll and bonus taxes in the UK and France on certain bonuses paid in respect of 2009 totalling US$309m, the non-recurrence of an accounting gain related to a change in the |
44
Report of the Directors: Operating and Financial Review(continued)
Management view of total operating income
| | | | | | | | | | | | | |
| | | 2010 | | | 2009 | | | 2008 | |
| | | US$m | | | US$m | | | US$m | |
| | | | | |
Global Markets50 | | | 9,173 | | | | 10,364 | | | | 2,676 | |
| | | | | | | |
| Credit | | | 1,649 | | | | 2,330 | | | | (5,502 | ) |
| Rates | | | 2,052 | | | | 2,648 | | | | 2,033 | |
| Foreign Exchange | | | 2,752 | | | | 2,979 | | | | 3,842 | |
| Equities | | | 755 | | | | 641 | | | | (64 | ) |
Securities Services51 | | | 1,511 | | | | 1,420 | | | | 2,116 | |
| Asset and Structured Finance | | | 454 | | | | 346 | | | | 251 | |
| | | | | | | |
| Global Banking | | | 4,621 | | | | 4,630 | | | | 5,718 | |
| | | | | | | |
| Financing and Equity Capital Markets | | | 2,852 | | | | 3,070 | | | | 3,572 | |
Payments and Cash Management52 | | | 1,133 | | | | 1,053 | | | | 1,665 | |
Other transaction services53 | | | 636 | | | | 507 | | | | 481 | |
| | | | | | | |
Balance Sheet Management54 | | | 4,102 | | | | 5,390 | | | | 3,618 | |
| Global Asset Management | | | 1,077 | | | | 939 | | | | 934 | |
| Principal Investments | | | 319 | | | | 42 | | | | (415 | ) |
Other55 | | | 655 | | | | 455 | | | | 987 | |
| | | | | | | |
| | | | | | | | | | | | | |
| Total operating income | | | 19,947 | | | | 21,820 | | | | 13,518 | |
| | | | | | | |
Comparative information has been adjusted to reflect the current management view.
For footnotes, see page 83.
| | | delivery of certain staff benefits in the main UK pension scheme in 2009, higher support costs and continued investment in strategic initiatives being undertaken to drive future revenue growth. These included the development of Prime Services and equity market capabilities and the expansion of the Rates and Foreign Exchange e-commerce platforms. The percentage of total reported compensation pool allocated in respect of performance in 2010 to revenues net of loan impairment charges (excluding payroll taxes levied on 2009 bonuses) remained consistent with 2009 on a reported basis. |
| |
| • | | Global Markets’ revenues were second only to the results recorded in 2009, demonstrating the continuing strength of our client-facing businesses. Trading income declined, driven by increased competition and reduced margins across core products. Credit and Rates were adversely affected by less favourable market conditions as European sovereign debt concerns resulted in increased economic uncertainty in the eurozone. Foreign Exchange revenues were lower, reflecting spread compression in the more competitive trading environment and a decline in market volatility. Investment in the Equities business, particularly the enhancement |
| | of the sales and trading platforms, led to increased market share in our target markets despite lower market volumes and increased competition. Securities Services income grew by 4%, with particularly strong performances in Asia driven by increasing market values and Latin America due to higher interest income. Asset and Structured Finance reported higher revenues from increased deal activity during the year. |
| |
| • | | Global Banking produced a robust performance as it continued the strategy of focusing on key client relationships to drive market share growth in event-driven and other ancillary businesses. A decrease in revenues from Financing and Equity Capital Markets was due to the adverse effect of continued spread compression. Higher project and export finance revenues were driven by increased deal volumes, while growth in revenue and market share was achieved in the advisory business. Equity Capital Markets revenues fell as total deal values declined due to a reduction in client activity. Despite the adverse effect of the continued low interest rate environment, Payments and Cash Management delivered a 6% increase in revenue driven by strong growth in transaction-driven fee income and customer account balances in Asia. |
| |
| • | | Revenues in Balance Sheet Management remained high by historical standards but, as expected, declined in 2010 as higher-yielding positions matured and the opportunity for reinvestment was limited by the prevailing low interest rate environment and flatter yield curves. |
| |
| • | | Robust revenue growth was reported in Global Asset Management. Higher management fee income was recorded across all regions, most notably in our emerging markets businesses. Funds under management (‘FuM’) reached a year-end high of US$439bn at 31 December 2010 of which emerging markets FuM, in countries outside North America, Western Europe, Japan and Australia, were US$145bn. Total FuM grew by 4% compared with 2009, benefiting from positive net inflows of US$16bn and strengthening market performance. New funds launched in the year included the Global High Income Fund and the MultiAlpha Global High Yield Bond Fund. |
| |
| • | | Principal Investments reported an increase in revenues as improved market conditions resulted in higher gains on sale and a reduction in impairments. |
45
Report of the Directors: Operating and Financial Review(continued)
Global Private Banking
GPB works with our high net worth clients to offer both traditional and innovative ways to manage and preserve wealth while optimising returns.
| | | | | | | | | | | | | |
| | | 2010 | | | 2009 | | | 2008 | |
| | | US$m | | | US$m | | | US$m | |
| | | | | |
| Net interest income | | | 1,345 | | | | 1,474 | | | | 1,612 | |
| Net fee income | | | 1,299 | | | | 1,236 | | | | 1,476 | |
| Other income | | | 449 | | | | 402 | | | | 543 | |
| | | | | | | |
Net operating income46 | | | 3,093 | | | | 3,112 | | | | 3,631 | |
| | | | | |
Impairment (charges)/ recoveries47 | | | 12 | | | | (128 | ) | | | (68 | ) |
| | | | | | | |
Net operating income | | | 3,105 | | | | 2,984 | | | | 3,563 | |
| | | | | |
| Total operating expenses | | | (2,035 | ) | | | (1,884 | ) | | | (2,116 | ) |
| | | | | | | |
Operating profit | | | 1,070 | | | | 1,100 | | | | 1,447 | |
| | | | | |
Income from associates48 | | | (16 | ) | | | 8 | | | | – | |
| | | | | | | |
| | | | | |
Profit before tax | | | 1,054 | | | | 1,108 | | | | 1,447 | |
| | | | | | | |
Client assets over 6% up at
US$390bn
2009: US$367bn; 2008: US$352bn
Higher investment in GPB
operations in Asia,
Latin America and the Middle East
Best Global Wealth Manager
Euromoney Awards for Excellence 2010
| | | |
Best Private Bank in
Asia
Euromoney 2011 Private
Banking Survey | | Outstanding Private
Bank – Middle East
Private Banker International
Awards 2010 |
Strategic direction
GPB strives to be the world’s leading international private bank, recognised for excellent client experience and global connections.
Our brand, capital strength, extensive global network and positioning provide a strong foundation from which GPB continues to attract and retain clients. Product and service leadership in areas such as alternative investments, foreign exchange, estate planning, credit and investment advice helps us meet the complex international financial needs of individuals and families.
We are well-positioned for sustainable long-term growth through continuing investment in our people, integrated IT solutions and emerging markets-focused domestic operations, along with ensuring our cross-border business meets high standards in the evolving regulatory environment.
For footnotes, see page 83.
Review of performance
| • | | Reported profit before tax was US$1.1bn, 5% below 2009 on a reported and an underlying basis, driven by lower net interest income as the persistent low interest rate environment continued to affect deposit spreads and higher operating expenses. Loan impairment charges fell following the non-recurrence of a single specific impairment charge in North America in 2009 and the release of several charges made in previous years as markets recovered. |
| |
| • | | Net fee income and trading income rose, notably in Asia, as improved client risk appetite led to higher levels of activity, an increase in transaction volumes and positive net inflows of client assets. |
| |
| • | | Operating expenses increased, reflecting the hiring of front-line staff to cover emerging markets as part of a long-term strategy to further strengthen our international network to better serve clients, along with investment in systems and higher compliance costs resulting from the evolving regulatory environment. |
Client assets
| | | | | | | | | |
| | | 2010 | | | 2009 | |
| | | US$bn | | | US$bn | |
| | | | | |
| At 1 January | | | 367 | | | | 352 | |
| Net new money | | | 13 | | | | (7 | ) |
| Value change | | | 13 | | | | 27 | |
| Exchange and other | | | (3 | ) | | | (5 | ) |
| | | | | |
| | | | | | | | | |
| At 31 December | | | 390 | | | | 367 | |
| | | | | |
| • | | Reported client assets, which include funds under management and cash deposits, increased by US$23bn due to net new money inflows compared with outflows in 2009, and favourable market movements. Net inflows benefited from our strength in emerging markets, newly recruited key relationship managers, and cross-business referrals which generated US$8bn in 2010. This also resulted in an increase in ‘total client assets’, the equivalent to many industry definitions of assets under management which includes some non-financial assets held in client trusts, from US$460bn to US$499bn. Investor demand for alternatives, including real estate investments, also attracted strong inflows into HSBC Alternative Investments Limited. |
| |
| • | | The Family Office Partnership had a number of successes in its first full year, producing a complete range of corporate and personal solutions for top tier clients and strengthening its links with GB&M. |
46
Report of the Directors: Operating and Financial Review(continued)
Other
‘Other’ contains the results of certain property transactions, unallocated investment activities, centrally held investment companies, movements in fair value of own debt, HSBC’s holding company and financing operations.
| | | | | | | | | | | | | |
| | | 2010 | | | 2009 | | | 2008 | |
| | | US$m | | | US$m | | | US$m | |
| | | | | |
| Net interest expense | | | (998 | ) | | | (1,035 | ) | | | (956 | ) |
| Net trading income/ (expense) | | | (311 | ) | | | 279 | | | | (530 | ) |
| Net income/(expense) from financial instruments designated at fair value | | | (216 | ) | | | (6,443 | ) | | | 7,426 | |
| Other income | | | 6,185 | | | | 5,176 | | | | 6,355 | |
| | | | | | | |
Net operating income/(expense)46 | | | 4,660 | | | | (2,023 | ) | | | 12,295 | |
| | | | | |
Impairment (charges)/ recoveries47 | | | 3 | | | | (8 | ) | | | (5 | ) |
| | | | | | | | | | | |
Net operating income/(expense) | | | 4,663 | | | | (2,031 | ) | | | 12,290 | |
| | | | | |
| Total operating expenses | | | (5,918 | ) | | | (4,715 | ) | | | (4,174 | ) |
| | | | | | | |
Operating profit/(loss) | | | (1,255 | ) | | | (6,746 | ) | | | 8,116 | |
| | | | | |
Income from associates48 | | | 94 | | | | 26 | | | | 41 | |
| | | | | | | |
Profit/(loss) before tax | | | (1,161 | ) | | | (6,720 | ) | | | 8,157 | |
| | | | | | | |
US$250m
gain on sale and leaseback of Paris
and New York headquarters buildings
US$6.5bn
reduction in adverse fair value
movements on own debt
Investment in
Group Service Centres
as migrated activities increase
For footnotes, see page 83.
Notes
| • | | Reported loss before tax of US$1.2bn compared with a loss before tax of US$6.7bn in 2009. This included adverse movements of US$63m on the fair value of our own debt attributable to movements in credit spreads in 2010, compared with adverse movements of US$6.5bn in 2009. In addition, 2010 included gains of US$188m following the dilution of our holding in Ping An Insurance and US$62m on the reclassification of Bao Viet to an associate following the purchase of an additional 8% stake. On an underlying basis, the loss before tax increased by US$1.2bn to US$1.3bn. The main items reported under ‘Other’, are described in footnote 44 on page 85. |
| • | | Net trading expense of US$311m compared with income of US$276m in 2009. This change was largely attributable to fair value movements on cross-currency swaps used to economically hedge fixed rate long-term debt issued by HSBC Holdings. The adverse fair value movements of US$304m, which were driven by a decline in long-term US interest rates relative to sterling and euro rates, compared with favourable fair value movements of US$748m on these instruments in 2009. This was partly offset by the non-recurrence of fair value losses arising from the implied contingent forward contract entered into with the underwriters of our rights issue in 2009 and forward foreign exchange contracts associated with the rights issue, which were accounted as derivatives with fair value taken to profit or loss in 2009. |
| • | | We recognised gains of US$194m and US$56m, respectively, from the sale and leaseback of our headquarters buildings in Paris and New York. These compared with more substantial underlying gains totalling US$667m (US$686m as reported) on the sale and leaseback of 8 Canada Square, London and the sale of a property in Hong Kong in 2009. |
| • | | Operating expenses rose by 24% to US$5.9bn as an increasing number of operational activities were centralised, notably in the US. These costs were previously incurred directly by customer groups, but are now recorded in ‘Other’ and charged to customer groups through a recharge mechanism with income reported as ‘Other operating income’. In addition, costs at our Group Service Centres rose by 6% as the number of migrated activities increased in line with our Global Resourcing model. |
47
Report of the Directors: Operating and Financial Review(continued)
Reconciliation of reported and underlying profit/(loss) before tax
Personal Financial Services
2010 compared with 2009
| | | | | | | | | | | | | | | | | | | | | | | | | | | | | | | | | | | | | |
| | | | | | | | | | | | | | | 2009 | | | | | | | | | | | | | | | | |
| | | 2009 | | | 2009 | | | | | | | at 2010 | | | 2010 | | | 2010 | | | 2010 | | | Re- | | | Under- | |
| | | as | | | adjust- | | | Currency | | | exchange | | | as | | | adjust- | | | under- | | | ported | | | lying | |
| | | reported | | | ments | 10 | | translation | 11 | | rates | 12 | | reported | | | ments | 10 | | lying | | | change | 13 | | change | 13 |
| | | US$m | | | US$m | | | US$m | | | US$m | | | US$m | | | US$m | | | US$m | | | % | | | % | |
| | | | | | | | | | | | | | | | | | | | | | | | | | | | | | | | | | | | | |
| Net interest income | | | 25,107 | | | | – | | | | 419 | | | | 25,526 | | | | 24,161 | | | | (8 | ) | | | 24,153 | | | | (4 | ) | | | (5 | ) |
| Net fee income | | | 8,238 | | | | (8 | ) | | | 115 | | | | 8,345 | | | | 7,336 | | | | (1 | ) | | | 7,335 | | | | (11 | ) | | | (12 | ) |
| Other income | | | 2,070 | | | | – | | | | 101 | | | | 2,171 | | | | 1,079 | | | | (5 | ) | | | 1,074 | | | | (48 | ) | | | (51 | ) |
| | | | | | | | | | | | | | | | | | | | | | | |
| | | | | | | | | | | | | | | | | | | | | | | | | | | | | | | | | | | | | |
Net operating income15 | | | 35,415 | | | | (8 | ) | | | 635 | | | | 36,042 | | | | 32,576 | | | | (14 | ) | | | 32,562 | | | | (8 | ) | | | (10 | ) |
| | | | | | | | | | | | | | | | | | | | | | | | | | | | | | | | | | | | | |
| Loan impairment charges and other credit risk provisions | | | (19,902 | ) | | | – | | | | (271 | ) | | | (20,173 | ) | | | (11,259 | ) | | | – | | | | (11,259 | ) | | | 43 | | | | 44 | |
| | | | | | | | | | | | | | | | | | | | | | | |
| | | | | | | | | | | | | | | | | | | | | | | | | | | | | | | | | | | | | |
Net operating income | | | 15,513 | | | | (8 | ) | | | 364 | | | | 15,869 | | | | 21,317 | | | | (14 | ) | | | 21,303 | | | | 37 | | | | 34 | |
| | | | | | | | | | | | | | | | | | | | | | | | | | | | | | | | | | | | | |
| Operating expenses | | | (18,292 | ) | | | 6 | | | | (440 | ) | | | (18,726 | ) | | | (18,805 | ) | | | 4 | | | | (18,801 | ) | | | (3 | ) | | | – | |
| | | | | | | | | | | | | | | | | | | | | | | |
| | | | | | | | | | | | | | | | | | | | | | | | | | | | | | | | | | | | | |
Operating profit/(loss) | | | (2,779 | ) | | | (2 | ) | | | (76 | ) | | | (2,857 | ) | | | 2,512 | | | | (10 | ) | | | 2,502 | | | | | | | | | |
| | | | | | | | | | | | | | | | | | | | | | | | | | | | | | | | | | | | | |
| Income from associates | | | 714 | | | | – | | | | 6 | | | | 720 | | | | 1,006 | | | | – | | | | 1,006 | | | | 41 | | | | 40 | |
| | | | | | | | | | | | | | | | | | | | | | | |
| | | | | | | | | | | | | | | | | | | | | | | | | | | | | | | | | | | | | |
Profit/(loss) before tax | | | (2,065 | ) | | | (2 | ) | | | (70 | ) | | | (2,137 | ) | | | 3,518 | | | | (10 | ) | | | 3,508 | | | | | | | | | |
| | | | | | | | | | | | | | | | | | | | | | | |
2009 compared with 2008
| | | | | | | | | | | | | | | | | | | | | | | | | | | | | | | | | | | | | |
| | | | | | | | | | | | | | | 2008 | | | | | | | | | | | | | | | | |
| | | 2008 | | | 2008 | | | | | | | at 2009 | | | 2009 | | | 2009 | | | 2009 | | | Re- | | | Under- | |
| | | as | | | adjust- | | | Currency | | | exchange | | | as | | | adjust- | | | under- | | | ported | | | lying | |
| | | reported | | | ments | 10 | | translation | 11 | | rates | 16 | | reported | | | ments | 10 | | lying | | | change | 13 | | change | 13 |
| | | US$m | | | US$m | | | US$m | | | US$m | | | US$m | | | US$m | | | US$m | | | % | | | % | |
| | | | | | | | | | | | | | | | | | | | | | | | | | | | | | | | | | | | | |
| Net interest income | | | 29,419 | | | | (36 | ) | | | (1,534 | ) | | | 27,849 | | | | 25,107 | | | | (3 | ) | | | 25,104 | | | | (15 | ) | | | (10 | ) |
| Net fee income | | | 10,107 | | | | (32 | ) | | | (645 | ) | | | 9,430 | | | | 8,238 | | | | – | | | | 8,238 | | | | (18 | ) | | | (13 | ) |
| Other income | | | 1,963 | | | | (121 | ) | | | (258 | ) | | | 1,584 | | | | 2,070 | | | | (1 | ) | | | 2,069 | | | | 5 | | | | 31 | |
| | | | | | | | | | | | | | | | | | | | | | | |
| | | | | | | | | | | | | | | | | | | | | | | | | | | | | | | | | | | | | |
Net operating income15 | | | 41,489 | | | | (189 | ) | | | (2,437 | ) | | | 38,863 | | | | 35,415 | | | | (4 | ) | | | 35,411 | | | | (15 | ) | | | (9 | ) |
| | | | | | | | | | | | | | | | | | | | | | | | | | | | | | | | | | | | | |
| Loan impairment charges and other credit risk provisions | | | (21,220 | ) | | | 3 | | | | 595 | | | | (20,622 | ) | | | (19,902 | ) | | | – | | | | (19,902 | ) | | | 6 | | | | 3 | |
| | | | | | | | | | | | | | | | | | | | | | | |
| | | | | | | | | | | | | | | | | | | | | | | | | | | | | | | | | | | | | |
| Net operating income | | | 20,269 | | | | (186 | ) | | | (1,842 | ) | | | 18,241 | | | | 15,513 | | | | (4 | ) | | | 15,509 | | | | (23 | ) | | | (15 | ) |
| | | | | | | | | | | | | | | | | | | | | | | | | | | | | | | | | | | | | |
| Operating expenses (excluding goodwill impairment) | | | (21,140 | ) | | | 38 | | | | 1,372 | | | | (19,730 | ) | | | (18,292 | ) | | | 1 | | | | (18,291 | ) | | | 13 | | | | 7 | |
| Goodwill impairment | | | (10,564 | ) | | | – | | | | – | | | | (10,564 | ) | | | – | | | | – | | | | – | | | | 100 | | | | 100 | |
| | | | | | | | | | | | | | | | | | | | | | | |
| | | | | | | | | | | | | | | | | | | | | | | | | | | | | | | | | | | | | |
| Operating loss | | | (11,435 | ) | | | (148 | ) | | | (470 | ) | | | (12,053 | ) | | | (2,779 | ) | | | (3 | ) | | | (2,782 | ) | | | 76 | | | | 77 | |
| | | | | | | | | | | | | | | | | | | | | | | | | | | | | | | | | | | | | |
| Income from associates | | | 461 | | | | – | | | | 13 | | | | 474 | | | | 714 | | | | – | | | | 714 | | | | 55 | | | | 51 | |
| | | | | | | | | | | | | | | | | | | | | | | |
| | | | | | | | | | | | | | | | | | | | | | | | | | | | | | | | | | | | | |
| Loss before tax | | | (10,974 | ) | | | (148 | ) | | | (457 | ) | | | (11,579 | ) | | | (2,065 | ) | | | (3 | ) | | | (2,068 | ) | | | 81 | | | | 82 | |
| | | | | | | | | | | | | | | | | | | | | | | |
| | |
| For footnotes, see page 83. |
47(a)
Report of the Directors: Operating and Financial Review(continued)
2010 compared with 2009
| | | | | | | | | | | | | | | | | | | | | | | | | | | | | | | | | | | | | |
| | | | | | | | | | | | | | | 2009 | | | | | | | | | | | | | | | | |
| | | 2009 | | | 2009 | | | | | | | at 2010 | | | 2010 | | | 2010 | | | 2010 | | | Re- | | | Under- | |
| | | as | | | adjust- | | | Currency | | | exchange | | | as | | | adjust- | | | under- | | | ported | | | lying | |
| | | reported | | | ments | 10 | | translation | 11 | | rates | 12 | | reported | | | ments | 10 | | lying | | | change | 13 | | change | 13 |
| | | US$m | | | US$m | | | US$m | | | US$m | | | US$m | | | US$m | | | US$m | | | % | | | % | |
| | | | | | | | | | | | | | | | | | | | | | | | | | | | | | | | | | | | | |
| Net interest income | | | 7,883 | | | | (1 | ) | | | 193 | | | | 8,075 | | | | 8,487 | | | | (20 | ) | | | 8,467 | | | | 8 | | | | 5 | |
| Net fee income | | | 3,702 | | | | (164 | ) | | | 51 | | | | 3,589 | | | | 3,964 | | | | (2 | ) | | | 3,962 | | | | 7 | | | | 10 | |
| Other income | | | 1,268 | | | | (283 | ) | | | 12 | | | | 997 | | | | 1,383 | | | | (124 | ) | | | 1,259 | | | | 9 | | | | 26 | |
| | | | | | | | | | | | | | | | | | | | | | | |
| | | | | | | | | | | �� | | | | | | | | | | | | | | | | | | | | | | | | | | |
Net operating income15 | | | 12,853 | | | | (448 | ) | | | 256 | | | | 12,661 | | | | 13,834 | | | | (146 | ) | | | 13,688 | | | | 8 | | | | 8 | |
| Loan impairment charges and other credit risk provisions | | | (3,282 | ) | | | – | | | | (73 | ) | | | (3,355 | ) | | | (1,805 | ) | | | – | | | | (1,805 | ) | | | 45 | | | | 46 | |
| | | | | | | | | | | | | | | | | | | | | | | |
| | | | | | | | | | | | | | | | | | | | | | | | | | | | | | | | | | | | | |
Net operating income | | | 9,571 | | | | (448 | ) | | | 183 | | | | 9,306 | | | | 12,029 | | | | (146 | ) | | | 11,883 | | | | 26 | | | | 28 | |
| | | | | | | | | | | | | | | | | | | | | | | | | | | | | | | | | | | | | |
| Operating expenses | | | (5,963 | ) | | | 143 | | | | (122 | ) | | | (5,942 | ) | | | (6,831 | ) | | | 13 | | | | (6,818 | ) | | | (15 | ) | | | (15 | ) |
| | | | | | | | | | | | | | | | | | | | | | | |
| | | | | | | | | | | | | | | | | | | | | | | | | | | | | | | | | | | | | |
Operating profit | | | 3,608 | | | | (305 | ) | | | 61 | | | | 3,364 | | | | 5,198 | | | | (133 | ) | | | 5,065 | | | | 44 | | | | 51 | |
| | | | | | | | | | | | | | | | | | | | | | | | | | | | | | | | | | | | | |
| Income from associates | | | 667 | | | | (1 | ) | | | 3 | | | | 669 | | | | 892 | | | | – | | | | 892 | | | | 34 | | | | 33 | |
| | | | | | | | | | | | | | | | | | | | | | | |
| | | | | | | | | | | | | | | | | | | | | | | | | | | | | | | | | | | | | |
Profit before tax | | | 4,275 | | | | (306 | ) | | | 64 | | | | 4,033 | | | | 6,090 | | | | (133 | ) | | | 5,957 | | | | 42 | | | | 48 | |
| | | | | | | | | | | | | | | | | | | | | | | |
2009 compared with 2008
| | | | | | | | | | | | | | | | | | | | | | | | | | | | | | | | | | | | | |
| | | | | | | | | | | | | | | 2008 | | | | | | | | | | | | | | | | |
| | | 2008 | | | 2008 | | | | | | | at 2009 | | | 2009 | | | 2009 | | | 2009 | | | Re- | | | Under- | |
| | | as | | | adjust- | | | Currency | | | exchange | | | as | | | adjust- | | | under- | | | ported | | | lying | |
| | | reported | | | ments | 10 | | translation | 11 | | rates | 16 | | reported | | | ments | 10 | | lying | | | change | 13 | | change | 13 |
| | | US$m | | | US$m | | | US$m | | | US$m | | | US$m | | | US$m | | | US$m | | | % | | | % | |
| | | | | | | | | | | | | | | | | | | | | | | | | | | | | | | | | | | | | |
| Net interest income | | | 9,494 | | | | (29 | ) | | | (697 | ) | | | 8,768 | | | | 7,883 | | | | (45 | ) | | | 7,838 | | | | (17 | ) | | | (11 | ) |
| Net fee income | | | 4,097 | | | | (26 | ) | | | (367 | ) | | | 3,704 | | | | 3,702 | | | | (5 | ) | | | 3,697 | | | | (10 | ) | | | – | |
| Other income | | | 1,726 | | | | (464 | ) | | | (213 | ) | | | 1,049 | | | | 1,268 | | | | (295 | ) | | | 973 | | | | (27 | ) | | | (7 | ) |
| | | | | �� | | | | | | | | | | | | | | | | | | |
| | | | | | | | | | | | | | | | | | | | | | | | | | | | | | | | | | | | | |
Net operating income15 | | | 15,317 | | | | (519 | ) | | | (1,277 | ) | | | 13,521 | | | | 12,853 | | | | (345 | ) | | | 12,508 | | | | (16 | ) | | | (7 | ) |
| Loan impairment charges and other credit risk provisions | | | (2,173 | ) | | | 3 | | | | 68 | | | | (2,102 | ) | | | (3,282 | ) | | | – | | | | (3,282 | ) | | | (51 | ) | | | (56 | ) |
| | | | | | | | | | | | | | | | | | | | | | | |
| | | | | | | | | | | | | | | | | | | | | | | | | | | | | | | | | | | | | |
| Net operating income | | | 13,144 | | | | (516 | ) | | | (1,209 | ) | | | 11,419 | | | | 9,571 | | | | (345 | ) | | | 9,226 | | | | (27 | ) | | | (19 | ) |
| | | | | | | | | | | | | | | | | | | | | | | | | | | | | | | | | | | | | |
| Operating expenses | | | (6,581 | ) | | | 30 | | | | 537 | | | | (6,014 | ) | | | (5,963 | ) | | | 27 | | | | (5,936 | ) | | | 9 | | | | 1 | |
| | | | | | | | | | | | | | | | | | | | | | | |
| | | | | | | | | | | | | | | | | | | | | | | | | | | | | | | | | | | | | |
| Operating profit | | | 6,563 | | | | (486 | ) | | | (672 | ) | | | 5,405 | | | | 3,608 | | | | (318 | ) | | | 3,290 | | | | (45 | ) | | | (39 | ) |
| | | | | | | | | | | | | | | | | | | | | | | | | | | | | | | | | | | | | |
| Income from associates | | | 631 | | | | – | | | | 7 | | | | 638 | | | | 667 | | | | – | | | | 667 | | | | 6 | | | | 5 | |
| | | | | | | | | | | | | | | | | | | | | | | |
| | | | | | | | | | | | | | | | | | | | | | | | | | | | | | | | | | | | | |
| Profit before tax | | | 7,194 | | | | (486 | ) | | | (665 | ) | | | 6,043 | | | | 4,275 | | | | (318 | ) | | | 3,957 | | | | (41 | ) | | | (35 | ) |
| | | | | | | | | | | | | | | | | | | | | | | |
| | |
| For footnotes, see page 83. |
47(b)
Report of the Directors: Operating and Financial Review(continued)
Global Banking and Markets
2010 compared with 2009
| | | | | | | | | | | | | | | | | | | | | | | | | | | | | | | | | | | | | |
| | | | | | | | | | | | | | | 2009 | | | | | | | | | | | | | | | | |
| | | 2009 | | | 2009 | | | | | | | at 2010 | | | 2010 | | | 2010 | | | 2010 | | | Re- | | | Under- | |
| | | as | | | adjust- | | | Currency | | | exchange | | | as | | | adjust- | | | under- | | | ported | | | lying | |
| | | reported | | | ments | 10 | | translation | 11 | | rates | 12 | | reported | | | ments | 10 | | lying | | | change | 13 | | change | 13 |
| | | US$m | | | US$m | | | US$m | | | US$m | | | US$m | | | US$m | | | US$m | | | % | | | % | |
| | | | | | | | | | | | | | | | | | | | | | | | | | | | | | | | | | | | | |
| Net interest income | | | 8,610 | | | | – | | | | 60 | | | | 8,670 | | | | 7,348 | | | | (3 | ) | | | 7,345 | | | | (15 | ) | | | (15 | ) |
| Net fee income | | | 4,363 | | | | (38 | ) | | | 20 | | | | 4,345 | | | | 4,725 | | | | – | | | | 4,725 | | | | 8 | | | | 9 | |
| Net trading income | | | 6,875 | | | | – | | | | 103 | | | | 6,978 | | | | 5,831 | | | | – | | | | 5,831 | | | | (15 | ) | | | (16 | ) |
| Other income | | | 1,972 | | | | – | | | | – | | | | 1,972 | | | | 2,043 | | | | (341 | ) | | | 1,702 | | | | 4 | | | | (14 | ) |
| | | | | | | | | | | | | | | | | | | | | | | |
| | | | | | | | | | | | | | | | | | | | | | | | | | | | | | | | | | | | | |
Net operating income15 | | | 21,820 | | | | (38 | ) | | | 183 | | | | 21,965 | | | | 19,947 | | | | (344 | ) | | | 19,603 | | | | (9 | ) | | | (11 | ) |
| Loan impairment charges and other credit risk provisions | | | (3,168 | ) | | | – | | | | 13 | | | | (3,155 | ) | | | (990 | ) | | | – | | | | (990 | ) | | | 69 | | | | 69 | |
| | | | | | | | | | | | | | | | | | | | | | | |
| | | | | | | | | | | | | | | | | | | | | | | | | | | | | | | | | | | | | |
Net operating income | | | 18,652 | | | | (38 | ) | | | 196 | | | | 18,810 | | | | 18,957 | | | | (344 | ) | | | 18,613 | | | | 2 | | | | (1 | ) |
| | | | | | | | | | | | | | | | | | | | | | | | | | | | | | | | | | | | | |
| Operating expenses | | | (8,537 | ) | | | 51 | | | | (25 | ) | | | (8,511 | ) | | | (9,962 | ) | | | 2 | | | | (9,960 | ) | | | (17 | ) | | | (17 | ) |
| | | | | | | | | | | | | | | | | | | | | | | |
| | | | | | | | | | | | | | | | | | | | | | | | | | | | | | | | | | | | | |
Operating profit | | | 10,115 | | | | 13 | | | | 171 | | | | 10,299 | | | | 8,995 | | | | (342 | ) | | | 8,653 | | | | (11 | ) | | | (16 | ) |
| | | | | | | | | | | | | | | | | | | | | | | | | | | | | | | | | | | | | |
| Income from associates | | | 366 | | | | – | | | | 2 | | | | 368 | | | | 541 | | | | – | | | | 541 | | | | 48 | | | | 47 | |
| | | | | | | | | | | | | | | | | | | | | | | |
| | | | | | | | | | | | | | | | | | | | | | | | | | | | | | | | | | | | | |
Profit before tax | | | 10,481 | | | | 13 | | | | 173 | | | | 10,667 | | | | 9,536 | | | | (342 | ) | | | 9,194 | | | | (9 | ) | | | (14 | ) |
| | | | | | | | | | | | | | | | | | | | | | | |
2009 compared with 2008
| | | | | | | | | | | | | | | | | | | | | | | | | | | | | | | | | | | | | |
| | | | | | | | | | | | | | | 2008 | | | | | | | | | | | | | | | | |
| | | 2008 | | | 2008 | | | | | | | at 2009 | | | 2009 | | | 2009 | | | 2009 | | | Re- | | | Under- | |
| | | as | | | adjust- | | | Currency | | | exchange | | | as | | | adjust- | | | under- | | | ported | | | lying | |
| | | reported | | | ments | 10 | | translation | 11 | | rates | 16 | | reported | | | ments | 10 | | lying | | | change | 13 | | change | 13 |
| | | US$m | | | US$m | | | US$m | | | US$m | | | US$m | | | US$m | | | US$m | | | % | | | % | |
| | | | | | | | | | | | | | | | | | | | | | | | | | | | | | | | | | | | | |
| Net interest income | | | 8,541 | | | | – | | | | (451 | ) | | | 8,090 | | | | 8,610 | | | | (5 | ) | | | 8,605 | | | | 1 | | | | 6 | |
| Net fee income | | | 4,291 | | | | – | | | | (267 | ) | | | 4,024 | | | | 4,363 | | | | (1 | ) | | | 4,362 | | | | 2 | | | | 8 | |
| Net trading income | | | 481 | | | | – | | | | (404 | ) | | | 77 | | | | 6,875 | | | | – | | | | 6,875 | | | | 1,329 | | | | 8,829 | |
| Other income | | | 205 | | | | – | | | | (151 | ) | | | 54 | | | | 1,972 | | | | (2 | ) | | | 1,970 | | | | 862 | | | | 3,548 | |
| | | | | | | | | | | | | | | | | | | | | | | |
| | | | | | | | | | | | | | | | | | | | | | | | | | | | | | | | | | | | | |
Net operating income15 | | | 13,518 | | | | – | | | | (1,273 | ) | | | 12,245 | | | | 21,820 | | | | (8 | ) | | | 21,812 | | | | 61 | | | | 78 | |
| Loan impairment charges and other credit risk provisions | | | (1,471 | ) | | | – | | | | 45 | | | | (1,426 | ) | | | (3,168 | ) | | | – | | | | (3,168 | ) | | | (115 | ) | | | (122 | ) |
| | | | | | | | | | | | | | | | | | | | | | | | | | | | | | | | | | | |
| | | | | | | | | | | | | | | | | | | | | | | | | | | | | | | | | | | | | |
| Net operating income | | | 12,047 | | | | – | | | | (1,228 | ) | | | 10,819 | | | | 18,652 | | | | (8 | ) | | | 18,644 | | | | 55 | | | | 72 | |
| | | | | | | | | | | | | | | | | | | | | | | | | | | | | | | | | | | | | |
| Operating expenses | | | (9,092 | ) | | | – | | | | 743 | | | | (8,349 | ) | | | (8,537 | ) | | | 3 | | | | (8,534 | ) | | | 6 | | | | (2 | ) |
| | | | | | | | | | | | | | | | | | | | | | | |
| | | | | | | | | | | | | | | | | | | | | | | | | | | | | | | | | | | | | |
| Operating profit | | | 2,955 | | | | – | | | | (485 | ) | | | 2,470 | | | | 10,115 | | | | (5 | ) | | | 10,110 | | | | 242 | | | | 309 | |
| | | | | | | | | | | | | | | | | | | | | | | | | | | | | | | | | | | | | |
| Income from associates | | | 528 | | | | – | | | | 6 | | | | 534 | | | | 366 | | | | – | | | | 366 | | | | (31 | ) | | | (31 | ) |
| | | | | | | | | | | | | | | | | | | | | | | |
| | | | | | | | | | | | | | | | | | | | | | | | | | | | | | | | | | | | | |
| Profit before tax | | | 3,483 | | | | – | | | | (479 | ) | | | 3,004 | | | | 10,481 | | | | (5 | ) | | | 10,476 | | | | 201 | | | | 249 | |
| | | | | | | | | | | | | | | | | | | | | | | |
47(c)
Report of the Directors: Operating and Financial Review(continued)
Balance sheet data significant to Global Banking and Markets
| | | | | | | | | | | | | | | | | | | | | | | | | | | | | |
| | | | | | | | | | | Rest of | | | | | | | | | | | | | |
| | | | | | | Hong | | | Asia- | | | Middle | | | North | | | Latin | | | | |
| | | Europe | | | Kong | | | Pacific | | | East | | | America | | | America | | | Total | |
| | | US$m | | | US$m | | | US$m | | | US$m | | | US$m | | | US$m | | | US$m | |
At 31 December 2010 | | | | | | | | | | | | | | | | | | | | | | | | | | | | |
Trading assets71 | | | 232,918 | | | | 32,023 | | | | 18,256 | | | | 958 | | | | 87,120 | | | | 6,459 | | | | 377,734 | |
Derivative assets72 | | | 199,654 | | | | 21,644 | | | | 17,135 | | | | 832 | | | | 65,153 | | | | 3,955 | | | | 308,373 | |
| Trading liabilities | | | 178,861 | | | | 8,650 | | | | 3,846 | | | | 122 | | | | 91,980 | | | | 2,702 | | | | 286,161 | |
Derivative liabilities72 | | | 199,751 | | | | 22,622 | | | | 17,121 | | | | 845 | | | | 66,323 | | | | 3,913 | | | | 310,575 | |
| | | | | | | | | | | | | | | | | | | | | | | | | | | | | |
| At 31 December 2009 | | | | | | | | | | | | | | | | | | | | | | | | | | | | |
Trading assets71 | | | 294,951 | | | | 25,742 | | | | 15,960 | | | | 511 | | | | 67,466 | | | | 6,283 | | | | 410,913 | |
Derivative assets72 | | | 190,900 | | | | 16,937 | | | | 15,660 | | | | 668 | | | | 61,192 | | | | 2,820 | | | | 288,177 | |
| Trading liabilities | | | 169,814 | | | | 10,720 | | | | 3,040 | | | | 13 | | | | 69,302 | | | | 2,875 | | | | 255,764 | |
Derivative liabilities72 | | | 191,480 | | | | 16,619 | | | | 15,500 | | | | 651 | | | | 60,178 | | | | 3,270 | | | | 287,698 | |
| | | | | | | | | | | | | | | | | | | | | | | | | | | | | |
| At 31 December 2008 | | | | | | | | | | | | | | | | | | | | | | | | | | | | |
Trading assets71 | | | 281,089 | | | | 45,398 | | | | 19,192 | | | | 414 | | | | 74,498 | | | | 5,004 | | | | 425,595 | |
Derivative assets72 | | | 349,035 | | | | 34,146 | | | | 29,124 | | | | 1,014 | | | | 156,056 | | | | 9,618 | | | | 578,993 | |
| Trading liabilities | | | 144,759 | | | | 13,056 | | | | 3,633 | | | | 54 | | | | 72,325 | | | | 2,546 | | | | 236,373 | |
Derivative liabilities72 | | | 345,970 | | | | 35,693 | | | | 29,097 | | | | 1,016 | | | | 152,907 | | | | 9,088 | | | | 573,771 | |
| | |
| For footnotes, see page 83. |
47(d)
Report of the Directors: Operating and Financial Review(continued)
2010 compared with 2009
| | | | | | | | | | | | | | | | | | | | | | | | | | | | | | | | | | | | | |
| | | | | | | | | | | | | | | 2009 | | | | | | | | | | | | | | | | |
| | | 2009 | | | 2009 | | | | | | | at 2010 | | | 2010 | | | 2010 | | | 2010 | | | Re- | | | Under- | |
| | | as | | | adjust- | | | Currency | | | exchange | | | as | | | adjust- | | | under- | | | ported | | | lying | |
| | | reported | | | ments | 10 | | translation | 11 | | rates | 12 | | reported | | | ments | 10 | | lying | | | change | 13 | | change | 13 |
| | | US$m | | | US$m | | | US$m | | | US$m | | | US$m | | | US$m | | | US$m | | | % | | | % | |
| | | | | | | | | | | | | | | | | | | | | | | | | | | | | | | | | | | | | |
| Net interest income | | | 1,474 | | | | – | | | | (2 | ) | | | 1,472 | | | | 1,345 | | | | – | | | | 1,345 | | | | (9 | ) | | | (9 | ) |
| Net fee income | | | 1,236 | | | | – | | | | (1 | ) | | | 1,235 | | | | 1,299 | | | | – | | | | 1,299 | | | | 5 | | | | 5 | |
| Other income | | | 402 | | | | – | | | | – | | | | 402 | | | | 449 | | | | 1 | | | | 450 | | | | 12 | | | | 12 | |
| | | | | | | | | | | | | | | | | | | | | | | |
| | | | | | | | | | | | | | | | | | | | | | | | | | | | | | | | | | | | | |
Net operating income15 | | | 3,112 | | | | – | | | | (3 | ) | | | 3,109 | | | | 3,093 | | | | 1 | | | | 3,094 | | | | (1 | ) | | | – | |
| | | | | | | | | | | | | | | | | | | | | | | | | | | | | | | | | | | | | |
| Loan impairment charges and other credit risk provisions | | | (128 | ) | | | – | | | | 1 | | | | (127 | ) | | | 12 | | | | – | | | | 12 | | | | | | | | | |
| | | | | | | | | | | | | | | | | | | | | | | |
| | | | | | | | | | | | | | | | | | | | | | | | | | | | | | | | | | | | | |
Net operating income | | | 2,984 | | | | – | | | | (2 | ) | | | 2,982 | | | | 3,105 | | | | 1 | | | | 3,106 | | | | 4 | | | | 4 | |
| | | | | | | | | | | | | | | | | | | | | | | | | | | | | | | | | | | | | |
| Operating expenses | | | (1,884 | ) | | | – | | | | 3 | | | | (1,881 | ) | | | (2,035 | ) | | | – | | | | (2,035 | ) | | | (8 | ) | | | (8 | ) |
| | | | | | | | | | | | | | | | | | | | | | | |
| | | | | | | | | | | | | | | | | | | | | | | | | | | | | | | | | | | | | |
Operating profit | | | 1,100 | | | | – | | | | 1 | | | | 1,101 | | | | 1,070 | | | | 1 | | | | 1,071 | | | | (3 | ) | | | (3 | ) |
| | | | | | | | | | | | | | | | | | | | | | | | | | | | | | | | | | | | | |
| Income from associates | | | 8 | | | | – | | | | – | | | | 8 | | | | (16 | ) | | | – | | | | (16 | ) | | | | | | | | |
| | | | | | | | | | | | | | | | | | | | | | | |
| | | | | | | | | | | | | | | | | | | | | | | | | | | | | | | | | | | | | |
Profit before tax | | | 1,108 | | | | – | | | | 1 | | | | 1,109 | | | | 1,054 | | | | 1 | | | | 1,055 | | | | (5 | ) | | | (5 | ) |
| | | | | | | | | | | | | | | | | | | | | | | |
2009 compared with 2008
| | | | | | | | | | | | | | | | | | | | | | | | | | | | | | | | | | | | | |
| | | | | | | | | | | | | | | 2008 | | | | | | | | | | | | | | | | |
| | | 2008 | | | 2008 | | | | | | | at 2009 | | | 2009 | | | 2009 | | | 2009 | | | Re- | | | Under- | |
| | | as | | | adjust- | | | Currency | | | exchange | | | as | | | adjust- | | | under- | | | ported | | | lying | |
| | | reported | | | ments | 10 | | translation | 11 | | rates | 16 | | reported | | | ments | 10 | | lying | | | change | 13 | | change | 13 |
| | | US$m | | | US$m | | | US$m | | | US$m | | | US$m | | | US$m | | | US$m | | | % | | | % | |
| | | | | | | | | | | | | | | | | | | | | | | | | | | | | | | | | | | | | |
| Net interest income | | | 1,612 | | | | – | | | | (52 | ) | | | 1,560 | | | | 1,474 | | | | – | | | | 1,474 | | | | (9 | ) | | | (6 | ) |
| Net fee income | | | 1,476 | | | | – | | | | (33 | ) | | | 1,443 | | | | 1,236 | | | | – | | | | 1,236 | | | | (16 | ) | | | (14 | ) |
| Other income | | | 543 | | | | – | | | | (19 | ) | | | 524 | | | | 402 | | | | – | | | | 402 | | | | (26 | ) | | | (23 | ) |
| | | | | | | | | | | | | | | | | | | | | | | |
| | | | | | | | | | | | | | | | | | | | | | | | | | | | | | | | | | | | | |
Net operating income15 | | | 3,631 | | | | – | | | | (104 | ) | | | 3,527 | | | | 3,112 | | | | – | | | | 3,112 | | | | (14 | ) | | | (12 | ) |
| | | | | | | | | | | | | | | | | | | | | | | | | | | | | | | | | | | | | |
| Loan impairment charges and other credit risk provisions | | | (68 | ) | | | – | | | | 2 | | | | (66 | ) | | | (128 | ) | | | – | | | | (128 | ) | | | (88 | ) | | | (94 | ) |
| | | | | | | | | | | | | | | | | | | | | | | |
| | | | | | | | | | | | | | | | | | | | | | | | | | | | | | | | | | | | | |
| Net operating income | | | 3,563 | | | | – | | | | (102 | ) | | | 3,461 | | | | 2,984 | | | | – | | | | 2,984 | | | | (16 | ) | | | (14 | ) |
| | | | | | | | | | | | | | | | | | | | | | | | | | | | | | | | | | | | | |
| Operating expenses | | | (2,116 | ) | | | – | | | | 54 | | | | (2,062 | ) | | | (1,884 | ) | | | – | | | | (1,884 | ) | | | 11 | | | | 9 | |
| | | | | | | | | | | | | | | | | | | | | | | |
| | | | | | | | | | | | | | | | | | | | | | | | | | | | | | | | | | | | | |
| Operating profit | | | 1,447 | | | | – | | | | (48 | ) | | | 1,399 | | | | 1,100 | | | | – | | | | 1,100 | | | | (24 | ) | | | (21 | ) |
| | | | | | | | | | | | | | | | | | | | | | | | | | | | | | | | | | | | | |
| Income from associates | | | – | | | | – | | | | – | | | | – | | | | 8 | | | | – | | | | 8 | | | | | | | | | |
| | | | | | | | | | | | | | | | | | | | | | | |
| | | | | | | | | | | | | | | | | | | | | | | | | | | | | | | | | | | | | |
| Profit before tax | | | 1,447 | | | | – | | | | (48 | ) | | | 1,399 | | | | 1,108 | | | | – | | | | 1,108 | | | | (23 | ) | | | (21 | ) |
| | | | | | | | | | | | | | | | | | | | | | | |
| | |
| For footnotes, see page 83. |
47(e)
Report of the Directors: Operating and Financial Review(continued)
2010 compared with 2009
| | | | | | | | | | | | | | | | | | | | | | | | | | | | | | | | | | | | | |
| | | | | | | | | | | | | | | 2009 | | | | | | | | | | | | | | | | |
| | | 2009 | | | 2009 | | | | | | | at 2010 | | | 2010 | | | 2010 | | | 2010 | | | Re- | | | Under- | |
| | | as | | | adjust- | | | Currency | | | exchange | | | as | | | adjust- | | | under- | | | ported | | | lying | |
| | | reported | | | ments | 10 | | translation | 11 | | rates | 12 | | reported | | | ments | 10 | | lying | | | change | 13 | | change | 13 |
| | | US$m | | | US$m | | | US$m | | | US$m | | | US$m | | | US$m | | | US$m | | | % | | | % | |
| | | | | | | | | | | | | | | | | | | | | | | | | | | | | | | | | | | | | |
| Net interest expense | | | (1,035 | ) | | | – | | | | 21 | | | | (1,014 | ) | | | (998 | ) | | | – | | | | (998 | ) | | | 4 | | | | 2 | |
| Net fee income | | | 125 | | | | – | | | | (3 | ) | | | 122 | | | | 31 | | | | – | | | | 31 | | | | (75 | ) | | | (75 | ) |
Changes in fair value14 | | | (6,533 | ) | | | 6,533 | | | | – | | | | – | | | | (63 | ) | | | 63 | | | | – | | | | 99 | | | | – | |
| Other income | | | 5,420 | | | | – | | | | 29 | | | | 5,449 | | | | 5,690 | | | | (250 | ) | | | 5,440 | | | | 5 | | | | – | |
| | | | | | | | | | | | | | | | | | | | | | | |
| | | | | | | | | | | | | | | | | | | | | | | | | | | | | | | | | | | | | |
Net operating income/(expense)15 | | | (2,023 | ) | | | 6,533 | | | | 47 | | | | 4,557 | | | | 4,660 | | | | (187 | ) | | | 4,473 | | | | | | | | (2 | ) |
| Loan impairment (charges)/recoveries and other credit risk provisions | | | (8 | ) | | | – | | | | – | | | | (8 | ) | | | 3 | | | | – | | | | 3 | | | | | | | | | |
| | | | | | | | | | | | | | | | | | | | | | | |
| | | | | | | | | | | | | | | | | | | | | | | | | | | | | | | | | | | | | |
Net operating income/(expense) | | | (2,031 | ) | | | 6,533 | | | | 47 | | | | 4,549 | | | | 4,663 | | | | (187 | ) | | | 4,476 | | | | | | | | (2 | ) |
| | | | | | | | | | | | | | | | | | | | | | | | | | | | | | | | | | | | | |
| Operating expenses | | | (4,715 | ) | | | – | | | | (50 | ) | | | (4,765 | ) | | | (5,918 | ) | | | – | | | | (5,918 | ) | | | (26 | ) | | | (24 | ) |
| | | | | | | | | | | | | | | | | | | | | | | |
| | | | | | | | | | | | | | | | | | | | | | | | | | | | | | | | | | | | | |
Operating loss | | | (6,746 | ) | | | 6,533 | | | | (3 | ) | | | (216 | ) | | | (1,255 | ) | | | (187 | ) | | | (1,442 | ) | | | 81 | | | | (568 | ) |
| | | | | | | | | | | | | | | | | | | | | | | | | | | | | | | | | | | | | |
| Income from associates | | | 26 | | | | – | | | | – | | | | 26 | | | | 94 | | | | – | | | | 94 | | | | 262 | | | | 262 | |
| | | | | | | | | | | | | | | | | | | | | | | |
| | | | | | | | | | | | | | | | | | | | | | | | | | | | | | | | | | | | | |
Loss before tax | | | (6,720 | ) | | | 6,533 | | | | (3 | ) | | | (190 | ) | | | (1,161 | ) | | | (187 | ) | | | (1,348 | ) | | | 83 | | | | (609 | ) |
| | | | | | | | | | | | | | | | | | | | | | | |
2009 compared with 2008
| | | | | | | | | | | | | | | | | | | | | | | | | | | | | | | | | | | | | |
| | | | | | | | | | | | | | | 2008 | | | | | | | | | | | | | | | | |
| | | 2008 | | | 2008 | | | | | | | at 2009 | | | 2009 | | | 2009 | | | 2009 | | | Re- | | | Under- | |
| | | as | | | adjust- | | | Currency | | | exchange | | | as | | | adjust- | | | under- | | | ported | | | lying | |
| | | reported | | | ments | 10 | | translation | 11 | | rates | 16 | | reported | | | ments | 10 | | lying | | | change | 13 | | change | 13 |
| | | US$m | | | US$m | | | US$m | | | US$m | | | US$m | | | US$m | | | US$m | | | % | | | % | |
| | | | | | | | | | | | | | | | | | | | | | | | | | | | | | | | | | | | | |
| Net interest expense | | | (956 | ) | | | – | | | | 12 | | | | (944 | ) | | | (1,035 | ) | | | – | | | | (1,035 | ) | | | (8 | ) | | | (10 | ) |
| Net fee income | | | 53 | | | | – | | | | (3 | ) | | | 50 | | | | 125 | | | | – | | | | 125 | | | | 136 | | | | 150 | |
Changes in fair value14 | | | 6,570 | | | | (6,570 | ) | | | – | | | | – | | | | (6,533 | ) | | | 6,533 | | | | – | | | | | | | | | |
| Gains on disposal of French regional banks | | | 2,445 | | | | (2,445 | ) | | | – | | | | – | | | | – | | | | – | | | | – | | | | (100 | ) | | | | |
| Other income | | | 4,183 | | | | (95 | ) | | | (13 | ) | | | 4,075 | | | | 5,420 | | | | – | | | | 5,420 | | | | 30 | | | | 33 | |
| | | | | | | | | | | | | | | | | | | | | | | |
| | | | | | | | | | | | | | | | | | | | | | | | | | | | | | | | | | | | | |
Net operating income/(expense)15 | | | 12,295 | | | | (9,110 | ) | | | (4 | ) | | | 3,181 | | | | (2,023 | ) | | | 6,533 | | | | 4,510 | | | | | | | | 42 | |
| Loan impairment charges and other credit risk provisions | | | (5 | ) | | | – | | | | (1 | ) | | | (6 | ) | | | (8 | ) | | | – | | | | (8 | ) | | | (60 | ) | | | (33 | ) |
| | | | | | | | | | | | | | | | | | | | | | | |
| | | | | | | | | | | | | | | | | | | | | | | | | | | | | | | | | | | | | |
| Net operating income/(expense) | | | 12,290 | | | | (9,110 | ) | | | (5 | ) | | | 3,175 | | | | (2,031 | ) | | | 6,533 | | | | 4,502 | | | | | | | | 42 | |
| | | | | | | | | | | | | | | | | | | | | | | | | | | | | | | | | | | | | |
| Operating expenses | | | (4,174 | ) | | | – | | | | 70 | | | | (4,104 | ) | | | (4,715 | ) | | | – | | | | (4,715 | ) | | | (13 | ) | | | (15 | ) |
| | | | | | | | | | | | | | | | | | | | | | | |
| | | | | | | | | | | | | | | | | | | | | | | | | | | | | | | | | | | | | |
| Operating profit/(loss) | | | 8,116 | | | | (9,110 | ) | | | 65 | | | | (929 | ) | | | (6,746 | ) | | | 6,533 | | | | (213 | ) | | | | | | | 77 | |
| | | | | | | | | | | | | | | | | | | | | | | | | | | | | | | | | | | | | |
| Income from associates | | | 41 | | | | – | | | | (1 | ) | | | 40 | | | | 26 | | | | – | | | | 26 | | | | (37 | ) | | | (35 | ) |
| | | | | | | | | | | | | | | | | | | | | | | |
| | | | | | | | | | | | | | | | | | | | | | | | | | | | | | | | | | | | | |
| Profit/(loss) before tax | | | 8,157 | | | | (9,110 | ) | | | 64 | | | | (889 | ) | | | (6,720 | ) | | | 6,533 | | | | (187 | ) | | | | | | | 79 | |
| | | | | | | | | | | | | | | | | | | | | | | |
| | |
| For footnotes, see page 83. |
47(f)
Report of the Directors: Operating and Financial Review(continued)
Analysis by customer group and global business
HSBC profit/(loss) before tax and balance sheet data
| | | | | | | | | | | | | | | | | | | | | | | | | | | | | |
| | | 2010 |
| | | Personal | | | | | | | Global | | | Global | | | | | | | Inter- | | | | |
| | | Financial | | | Commercial | | | Banking & | | | Private | | | | | | | segment | | | | |
| | | Services | | | Banking | | | Markets | | | Banking | | | Other | 44 | | elimination | 56 | | Total | |
| | | US$m | | | US$m | | | US$m | | | US$m | | | US$m | | | US$m | | | US$m | |
| | | | | | | | | | | | | | | | | | | | | | | | | | | | | |
Profit/(loss) before tax | | | | | | | | | | | | | | | | | | | | | | | | | | | | |
| | | | | | | | | | | | | | | | | | | | | | | | | | | | | |
| Net interest income/(expense) | | | 24,161 | | | | 8,487 | | | | 7,348 | | | | 1,345 | | | | (998 | ) | | | (902 | ) | | | 39,441 | |
| | | | | | | | | | | | | | | | | | | | | | | | | | | | | |
| Net fee income | | | 7,336 | | | | 3,964 | | | | 4,725 | | | | 1,299 | | | | 31 | | | | – | | | | 17,355 | |
| | | | | | | | | | | | | | | | | | | | | | | | | | | | | |
| | | | | | | | | | | | | | | |
| Trading income/(expense) excluding net interest income | | | (107) | | | | 427 | | | | 4,327 | | | | 391 | | | | (358) | | | | – | | | | 4,680 | |
| Net interest income on trading activities | | | 28 | | | | 28 | | | | 1,504 | | | | 21 | | | | 47 | | | | 902 | | | | 2,530 | |
| | | | | | | | | | | | | | | |
| | | | | | | | | | | | | | | | | | | | | | | | | | | | | |
Net trading income/(expense)49 | | | (79 | ) | | | 455 | | | | 5,831 | | | | 412 | | | | (311 | ) | | | 902 | | | | 7,210 | |
| | | | | | | | | | | | | | | | | | | | | | | | | | | | | |
| | | | | | | | | | | | | | | |
| Changes in fair value of long- term debt issued and related derivatives | | | – | | | | – | | | | – | | | | – | | | | (258) | | | | – | | | | (258) | |
| Net income from other financial instruments designated at fair value | | | 1,210 | | | | 190 | | | | 36 | | | | – | | | | 42 | | | | – | | | | 1,478 | |
| | | | | | | | | | | | | | | |
| | | | | | | | | | | | | | | | | | | | | | | | | | | | | |
| Net income/(expense) from financial instruments designated at fair value | | | 1,210 | | | | 190 | | | | 36 | | | | – | | | | (216 | ) | | | – | | | | 1,220 | |
| Gains less losses from financial investments | | | 42 | | | | (1 | ) | | | 797 | | | | (6 | ) | | | 136 | | | | – | | | | 968 | |
| Dividend income | | | 27 | | | | 12 | | | | 48 | | | | 5 | | | | 20 | | | | – | | | | 112 | |
| Net earned insurance premiums | | | 9,737 | | | | 1,379 | | | | 41 | | | | – | | | | (11 | ) | | | – | | | | 11,146 | |
| Other operating income | | | 650 | | | | 585 | | | | 1,147 | | | | 38 | | | | 6,005 | | | | (5,863 | ) | | | 2,562 | |
| | | | | | | | | | | | | | | |
| | | | | | | | | | | | | | | | | | | | | | | | | | | | | |
Total operating income | | | 43,084 | | | | 15,071 | | | | 19,973 | | | | 3,093 | | | | 4,656 | | | | (5,863 | ) | | | 80,014 | |
| | | | | | | | | | | | | | | | | | | | | | | | | | | | | |
Net insurance claims57 | | | (10,508 | ) | | | (1,237 | ) | | | (26 | ) | | | – | | | | 4 | | | | – | | | | (11,767 | ) |
| | | | | | | | | | | | | | | |
| | | | | | | | | | | | | | | | | | | | | | | | | | | | | |
Net operating income46 | | | 32,576 | | | | 13,834 | | | | 19,947 | | | | 3,093 | | | | 4,660 | | | | (5,863 | ) | | | 68,247 | |
| | | | | | | | | | | | | | | | | | | | | | | | | | | | | |
| Loan impairment (charges)/recoveries and other credit risk provisions | | | (11,259 | ) | | | (1,805 | ) | | | (990 | ) | | | 12 | | | | 3 | | | | – | | | | (14,039 | ) |
| | | | | | | | | | | | | | | |
| | | | | | | | | | | | | | | | | | | | | | | | | | | | | |
Net operating income | | | 21,317 | | | | 12,029 | | | | 18,957 | | | | 3,105 | | | | 4,663 | | | | (5,863 | ) | | | 54,208 | |
| | | | | | | | | | | | | | | | | | | | | | | | | | | | | |
| | | | | | | | | | | | | | | |
Employee expenses58 | | | (5,388) | | | | (2,153) | | | | (4,735) | | | | (1,237) | | | | (6,323) | | | | – | | | | (19,836) | |
| Other operating expenses | | | (13,417) | | | | (4,678) | | | | (5,227) | | | | (798) | | | | 405 | | | | 5,863 | | | | (17,852) | |
| | | | | | | | | | | | | | | |
| | | | | | | | | | | | | | | | | | | | | | | | | | | | | |
| Total operating expenses | | | (18,805 | ) | | | (6,831 | ) | | | (9,962 | ) | | | (2,035 | ) | | | (5,918 | ) | | | 5,863 | | | | (37,688 | ) |
| | | | | | | | | | | | | | | |
| | | | | | | | | | | | | | | | | | | | | | | | | | | | | |
Operating profit/(loss) | | | 2,512 | | | | 5,198 | | | | 8,995 | | | | 1,070 | | | | (1,255 | ) | | | – | | | | 16,520 | |
| | | | | | | | | | | | | | | | | | | | | | | | | | | | | |
| Share of profit/(loss) in associates and joint ventures | | | 1,006 | | | | 892 | | | | 541 | | | | (16 | ) | | | 94 | | | | – | | | | 2,517 | |
| | | | | | | | | | | | | | | |
| | | | | | | | | | | | | | | | | | | | | | | | | | | | | |
Profit/(loss) before tax | | | 3,518 | | | | 6,090 | | | | 9,536 | | | | 1,054 | | | | (1,161 | ) | | | – | | | | 19,037 | |
| | | | | | | | | | | | | | | |
| | | | | | | | | | | | | | | | | | | | | | | | | | | | | |
| | | | % | | | | % | | | | % | | | | % | | | | % | | | | | | | | % | |
| Share of HSBC’s profit before tax | | | 18.5 | | | | 32.0 | | | | 50.1 | | | | 5.5 | | | | (6.1 | ) | | | | | | | 100.0 | |
| Cost efficiency ratio | | | 57.7 | | | | 49.4 | | | | 49.9 | | | | 65.8 | | | | 127.0 | | | | | | | | 55.2 | |
| | | | | | | | | | | | | | | | | | | | | | | | | | | | | |
Balance sheet data45 | | | | | | | | | | | | | | | | | | | | | | | | | | | | |
| | | US$m | | | US$m | | | US$m | | | US$m | | | US$m | | | | | | | US$m | |
| Loans and advances to customers (net) | | | 390,957 | | | | 239,286 | | | | 284,503 | | | | 40,665 | | | | 2,955 | | | | | | | | 958,366 | |
| Total assets | | | 527,698 | | | | 296,797 | | | | 1,758,315 | | | | 116,846 | | | | 161,458 | | | | (406,425 | ) | | | 2,454,689 | |
| Customer accounts | | | 525,184 | | | | 286,007 | | | | 308,453 | | | | 107,130 | | | | 951 | | | | | | | | 1,227,725 | |
48
Report of the Directors: Operating and Financial Review(continued)
| | | | | | | | | | | | | | | | | | | | | | | | | | | | | |
| | | 2009 |
| | | Personal | | | | | | | Global | | | Global | | | | | | | Inter- | | | | |
| | | Financial | | | Commercial | | | Banking & | | | Private | | | | | | | segment | | | | |
| | | Services | | | Banking | | | Markets | | | Banking | | | Other | 44 | | elimination | 56 | | Total | |
| | | US$m | | | US$m | | | US$m | | | US$m | | | US$m | | | US$m | | | US$m | |
| | | | | | | | | | | | | | | | | | | | | | | | | | | | | |
Profit/(loss) before tax | | | | | | | | | | | | | | | | | | | | | | | | | | | | |
| | | | | | | | | | | | | | | | | | | | | | | | | | | | | |
| Net interest income/(expense) | | | 25,107 | | | | 7,883 | | | | 8,610 | | | | 1,474 | | | | (1,035 | ) | | | (1,309 | ) | | | 40,730 | |
| | | | | | | | | | | | | | | | | | | | | | | | | | | | | |
| Net fee income | | | 8,238 | | | | 3,702 | | | | 4,363 | | | | 1,236 | | | | 125 | | | | – | | | | 17,664 | |
| | | | | | | | | | | | | | | | | | | | | | | | | | | | | |
| | | | | | | | | | | | | | | |
| Trading income excluding net interest income | | | 637 | | | | 332 | | | | 4,701 | | | | 322 | | | | 244 | | | | – | | | | 6,236 | |
| Net interest income on trading activities | | | 65 | | | | 22 | | | | 2,174 | | | | 22 | | | | 35 | | | | 1,309 | | | | 3,627 | |
| | | | | | | | | | | | | | | |
| | | | | | | | | | | | | | | | | | | | | | | | | | | | | |
Net trading income49 | | | 702 | | | | 354 | | | | 6,875 | | | | 344 | | | | 279 | | | | 1,309 | | | | 9,863 | |
| | | | | | | | | | | | | | | | | | | | | | | | | | | | | |
| | | | | | | | | | | | | | | |
| Changes in fair value of long- term debt issued and related derivatives | | | – | | | | – | | | | – | | | | – | | | | (6,247 | ) | | | – | | | | (6,247 | ) |
| Net income/(expense) from other financial instruments designated at fair value | | | 2,339 | | | | 100 | | | | 473 | | | | – | | | | (196 | ) | | | – | | | | 2,716 | |
| | | | | | | | | | | | | | | |
| | | | | | | | | | | | | | | | | | | | | | | | | | | | | |
| Net income/(expense) from financial instruments designated at fair value | | | 2,339 | | | | 100 | | | | 473 | | | | – | | | | (6,443 | ) | | | – | | | | (3,531 | ) |
| Gains less losses from financial investments | | | 224 | | | | 23 | | | | 265 | | | | 5 | | | | 3 | | | | – | | | | 520 | |
| Dividend income | | | 33 | | | | 8 | | | | 68 | | | | 5 | | | | 12 | | | | – | | | | 126 | |
| Net earned insurance premiums | | | 9,534 | | | | 886 | | | | 54 | | | | – | | | | (3 | ) | | | – | | | | 10,471 | |
| Other operating income | | | 809 | | | | 739 | | | | 1,146 | | | | 48 | | | | 5,042 | | | | (4,996 | ) | | | 2,788 | |
| | | | | | | | | | | | | | | |
| | | | | | | | | | | | | | | | | | | | | | | | | | | | | |
| Total operating income/(expense) | | | 46,986 | | | | 13,695 | | | | 21,854 | | | | 3,112 | | | | (2,020 | ) | | | (4,996 | ) | | | 78,631 | |
| | | | | | | | | | | | | | | | | | | | | | | | | | | | | |
Net insurance claims57 | | | (11,571 | ) | | | (842 | ) | | | (34 | ) | | | – | | | | (3 | ) | | | – | | | | (12,450 | ) |
| | | | | | | | | | | | | | | |
| | | | | | | | | | | | | | | | | | | | | | | | | | | | | |
Net operating income/(expense)46 | | | 35,415 | | | | 12,853 | | | | 21,820 | | | | 3,112 | | | | (2,023 | ) | | | (4,996 | ) | | | 66,181 | |
| | | | | | | | | | | | | | | | | | | | | | | | | | | | | |
| Loan impairment charges and other credit risk provisions | | | (19,902 | ) | | | (3,282 | ) | | | (3,168 | ) | | | (128 | ) | | | (8 | ) | | | – | | | | (26,488 | ) |
| | | | | | | | | | | | | | | |
| | | | | | | | | | | | | | | | | | | | | | | | | | | | | |
| Net operating income/(expense) | | | 15,513 | | | | 9,571 | | | | 18,652 | | | | 2,984 | | | | (2,031 | ) | | | (4,996 | ) | | | 39,693 | |
| | | | | | | | | | | | | | | | | | | | | | | | | | | | | |
| | | | | | | | | | | | | | | |
Employee expenses58 | | | (6,069 | ) | | | (2,072 | ) | | | (4,335 | ) | | | (1,198 | ) | | | (4,790 | ) | | | – | | | | (18,464 | ) |
| Other operating expenses | | | (12,223 | ) | | | (3,891 | ) | | | (4,202 | ) | | | (686 | ) | | | 75 | | | | 4,996 | | | | (15,931 | ) |
| | | | | | | | | | | | | | | |
| | | | | | | | | | | | | | | | | | | | | | | | | | | | | |
| Total operating expenses | | | (18,292 | ) | | | (5,963 | ) | | | (8,537 | ) | | | (1,884 | ) | | | (4,715 | ) | | | 4,996 | | | | (34,395 | ) |
| | | | | | | | | | | | | | | |
| | | | | | | | | | | | | | | | | | | | | | | | | | | | | |
| Operating profit/(loss) | | | (2,779 | ) | | | 3,608 | | | | 10,115 | | | | 1,100 | | | | (6,746 | ) | | | – | | | | 5,298 | |
| | | | | | | | | | | | | | | | | | | | | | | | | | | | | |
| Share of profit in associates and joint ventures | | | 714 | | | | 667 | | | | 366 | | | | 8 | | | | 26 | | | | – | | | | 1,781 | |
| | | | | | | | | | | | | | | |
| | | | | | | | | | | | | | | | | | | | | | | | | | | | | |
| Profit/(loss) before tax | | | (2,065 | ) | | | 4,275 | | | | 10,481 | | | | 1,108 | | | | (6,720 | ) | | | – | | | | 7,079 | |
| | | | | | | | | | | | | | | |
| | | | | | | | | | | | | | | | | | | | | | | | | | | | | |
| | | | % | | | | % | | | | % | | | | % | | | | % | | | | | | | | % | |
| Share of HSBC’s profit before tax | | | (29.2 | ) | | | 60.4 | | | | 148.1 | | | | 15.6 | | | | (94.9 | ) | | | | | | | 100.0 | |
| Cost efficiency ratio | | | 51.7 | | | | 46.4 | | | | 39.1 | | | | 60.5 | | | | (233.1 | ) | | | | | | | 52.0 | |
| | | | | | | | | | | | | | | | | | | | | | | | | | | | | |
Balance sheet data45 | | | | | | | | | | | | | | | | | | | | | | | | | | | | |
| | | US$m | | | US$m | | | US$m | | | US$m | | | US$m | | | | | | | US$m | |
| Loans and advances to customers (net) | | | 399,460 | | | | 199,674 | | | | 256,956 | | | | 37,031 | | | | 3,110 | | | | | | | | 896,231 | |
| Total assets | | | 554,074 | | | | 251,143 | | | | 1,683,672 | | | | 116,148 | | | | 150,983 | | | | (391,568 | ) | | | 2,364,452 | |
| Customer accounts | | | 499,109 | | | | 267,388 | | | | 284,727 | | | | 106,533 | | | | 1,277 | | | | | | | | 1,159,034 | |
| | |
| For footnotes, see page 83. |
49
Report of the Directors: Operating and Financial Review(continued)
Profit/(loss) before tax and balance sheet data (continued)
| | | | | | | | | | | | | | | | | | | | | | | | | | | | | |
| Total | | 2008 |
| | | Personal | | | | | | | Global | | | Global | | | | | | | Inter- | | | | |
| | | Financial | | | Commercial | | | Banking & | | | Private | | | | | | | segment | | | | |
| | | Services | | | Banking | | | Markets | | | Banking | | | Other | 44 | | elimination | 56 | | Total | |
| | | US$m | | | US$m | | | US$m | | | US$m | | | US$m | | | US$m | | | US$m | |
| | | | | | | | | | | | | | | | | | | | | | | | | | | | | |
Profit/(loss) before tax | | | | | | | | | | | | | | | | | | | | | | | | | | | | |
| | | | | | | | | | | | | | | | | | | | | | | | | | | | | |
| Net interest income/(expense) | | | 29,419 | | | | 9,494 | | | | 8,541 | | | | 1,612 | | | | (956 | ) | | | (5,547 | ) | | | 42,563 | |
| | | | | | | | | | | | | | | | | | | | | | | | | | | | | |
| Net fee income | | | 10,107 | | | | 4,097 | | | | 4,291 | | | | 1,476 | | | | 53 | | | | – | | | | 20,024 | |
| | | | | | | | | | | | | | | | | | | | | | | | | | | | | |
| | | | | | | | | | | | | | | |
| Trading income/(expense) excluding net interest income | | | 175 | | | | 369 | | | | 157 | | | | 408 | | | | (262 | ) | | | – | | | | 847 | |
| Net interest income/(expense) on trading activities | | | 79 | | | | 17 | | | | 324 | | | | 14 | | | | (268 | ) | | | 5,547 | | | | 5,713 | |
| | | | | | | | | | | | | | | |
| | | | | | | | | | | | | | | | | | | | | | | | | | | | | |
Net trading income/(expense)49 | | | 254 | | | | 386 | | | | 481 | | | | 422 | | | | (530 | ) | | | 5,547 | | | | 6,560 | |
| | | | | | | | | | | | | | | | | | | | | | | | | | | | | |
| | | | | | | | | | | | | | | |
| Changes in fair value of long- term debt issued and related derivatives | | | – | | | | – | | | | – | | | | – | | | | 6,679 | | | | – | | | | 6,679 | |
| Net income/(expense) from other financial instruments designated at fair value | | | (2,912 | ) | | | (224 | ) | | | (438 | ) | | | – | | | | 747 | | | | – | | | | (2,827 | ) |
| | | | | | | | | | | | | | | |
| | | | | | | | | | | | | | | | | | | | | | | | | | | | | |
| Net income/(expense) from financial instruments designated at fair value | | | (2,912 | ) | | | (224 | ) | | | (438 | ) | | | – | | | | 7,426 | | | | – | | | | 3,852 | |
| Gains less losses from financial investments | | | 663 | | | | 193 | | | | (327 | ) | | | 64 | | | | (396 | ) | | | – | | | | 197 | |
| Dividend income | | | 90 | | | | 88 | | | | 76 | | | | 8 | | | | 10 | | | | – | | | | 272 | |
| Net earned insurance premiums | | | 10,083 | | | | 679 | | | | 105 | | | | – | | | | (17 | ) | | | – | | | | 10,850 | |
| Gains on disposal of French regional banks | | | – | | | | – | | | | – | | | | – | | | | 2,445 | | | | – | | | | 2,445 | |
| Other operating income | | | 259 | | | | 939 | | | | 868 | | | | 49 | | | | 4,261 | | | | (4,568 | ) | | | 1,808 | |
| | | | | | | | | | | | | | | |
| | | | | | | | | | | | | | | | | | | | | | | | | | | | | |
| Total operating income | | | 47,963 | | | | 15,652 | | | | 13,597 | | | | 3,631 | | | | 12,296 | | | | (4,568 | ) | | | 88,571 | |
| | | | | | | | | | | | | | | | | | | | | | | | | | | | | |
Net insurance claims57 | | | (6,474 | ) | | | (335 | ) | | | (79 | ) | | | – | | | | (1 | ) | | | – | | | | (6,889 | ) |
| | | | | | | | | | | | | | | |
| | | | | | | | | | | | | | | | | | | | | | | | | | | | | |
Net operating income46 | | | 41,489 | | | | 15,317 | | | | 13,518 | | | | 3,631 | | | | 12,295 | | | | (4,568 | ) | | | 81,682 | |
| | | | | | | | | | | | | | | | | | | | | | | | | | | | | |
| Loan impairment charges and other credit risk provisions | | | (21,220 | ) | | | (2,173 | ) | | | (1,471 | ) | | | (68 | ) | | | (5 | ) | | | – | | | | (24,937 | ) |
| | | | | | | | | | | | | | | |
| | | | | | | | | | | | | | | | | | | | | | | | | | | | | |
| Net operating income | | | 20,269 | | | | 13,144 | | | | 12,047 | | | | 3,563 | | | | 12,290 | | | | (4,568 | ) | | | 56,745 | |
| | | | | | | | | | | | | | | | | | | | | | | | | | | | | |
| | | | | | | | | | | | | | | |
Employee expenses58 | | | (7,905 | ) | | | (2,549 | ) | | | (4,263 | ) | | | (1,308 | ) | | | (4,767 | ) | | | – | | | | (20,792 | ) |
| Goodwill impairment | | | (10,564 | ) | | | – | | | | – | | | | – | | | | – | | | | – | | | | (10,564 | ) |
| Other operating expenses | | | (13,235 | ) | | | (4,032 | ) | | | (4,829 | ) | | | (808 | ) | | | 593 | | | | 4,568 | | | | (17,743 | ) |
| | | | | | | | | | | | | | | |
| | | | | | | | | | | | | | | | | | | | | | | | | | | | | |
| Total operating expenses | | | (31,704 | ) | | | (6,581 | ) | | | (9,092 | ) | | | (2,116 | ) | | | (4,174 | ) | | | 4,568 | | | | (49,099 | ) |
| | | | | | | | | | | | | | | | | | | | | | | | | | | | | |
| Operating profit/(loss) | | | (11,435 | ) | | | 6,563 | | | | 2,955 | | | | 1,447 | | | | 8,116 | | | | – | | | | 7,646 | |
| | | | | | | | | | | | | | | | | | | | | | | | | | | | | |
| Share of profit in associates and joint ventures | | | 461 | | | | 631 | | | | 528 | | | | – | | | | 41 | | | | – | | | | 1,661 | |
| | | | | | | | | | | | | | | |
| | | | | | | | | | | | | | | | | | | | | | | | | | | | | |
| Profit/(loss) before tax | | | (10,974 | ) | | | 7,194 | | | | 3,483 | | | | 1,447 | | | | 8,157 | | | | – | | | | 9,307 | |
| | | | | | | | | | | | | | | |
| | | | | | | | | | | | | | | | | | | | | | | | | | | | | |
| | | | % | | | | % | | | | % | | | | % | | | | % | | | | | | | | % | |
| Share of HSBC’s profit before tax | | | (117.9 | ) | | | 77.3 | | | | 37.4 | | | | 15.6 | | | | 87.6 | | | | | | | | 100.0 | |
| Cost efficiency ratio | | | 76.4 | | | | 43.0 | | | | 67.3 | | | | 58.3 | | | | 33.9 | | | | | | | | 60.1 | |
| | | | | | | | | | | | | | | | | | | | | | | | | | | | | |
Balance sheet data45 | | | | | | | | | | | | | | | | | | | | | | | | | | | | |
| | | US$m | | | US$m | | | US$m | | | US$m | | | US$m | | | | | | | US$m | |
| Loans and advances to customers (net) | | | 401,402 | | | | 203,949 | | | | 287,306 | | | | 37,590 | | | | 2,621 | | | | | | | | 932,868 | |
| Total assets | | | 527,901 | | | | 249,218 | | | | 1,991,852 | | | | 133,216 | | | | 145,581 | | | | (520,303 | ) | | | 2,527,465 | |
| Customer accounts | | | 440,338 | | | | 235,879 | | | | 320,386 | | | | 116,683 | | | | 2,041 | | | | | | | | 1,115,327 | |
| | |
| For footnotes, see page 83. |
49a
Report of the Directors: Operating and Financial Review(continued)
Geographical regions
| | | | | |
| | | Page | |
| |
| | | 50 | |
| |
| | | 51 | |
| |
| | | 56 | |
| |
| | | 60 | |
| |
| | | 66 | |
| |
| | | 71 | |
| |
| | | 76 | |
| |
| | | 80(b) | |
Additional information on results in 2010 may be found in the ‘Financial Summary’ on pages 14 to 36.
In the analysis of profit by geographical regions that follows, operating income and operating expenses include intra-HSBC items of US$3,125m (2009: US$2,756m; 2008: US$2,492m).
Profit/(loss) before tax
| | | | | | | | | | | | | | | | | | | | | | | | | |
| | | 2010 | | 2009 | | 2008 |
| | | US$m | | | % | | | US$m | | | % | | | US$m | | | % | |
| | | | | | | | | | | | | | | | | | | | | | | | | |
| Europe | | | 4,302 | | | | 22.6 | | | | 4,009 | | | | 56.7 | | | | 10,869 | | | | 116.7 | |
| Hong Kong | | | 5,692 | | | | 29.9 | | | | 5,029 | | | | 71.0 | | | | 5,461 | | | | 58.7 | |
| Rest of Asia-Pacific | | | 5,902 | | | | 31.0 | | | | 4,200 | | | | 59.3 | | | | 4,722 | | | | 50.7 | |
| Middle East | | | 892 | | | | 4.7 | | | | 455 | | | | 6.4 | | | | 1,746 | | | | 18.8 | |
| North America | | | 454 | | | | 2.4 | | | | (7,738 | ) | | | (109.3 | ) | | | (15,528 | ) | | | (166.8 | ) |
| Latin America | | | 1,795 | | | | 9.4 | | | | 1,124 | | | | 15.9 | | | | 2,037 | | | | 21.9 | |
| | | | | | | | | | | | | |
| | | | | | | | | | | | | | | | | | | | | | | | | |
| | | | 19,037 | | | | 100.0 | | | | 7,079 | | | | 100.0 | | | | 9,307 | | | | 100.0 | |
| | | | | | | | | | | | | |
Total assets45
| | | | | | | | | | | | | | | | | |
| | | At 31 December |
| | | 2010 | | | 2009 |
| | | US$m | | | % | | | US$m | | | % | |
| | | | | | | | | | | | | | | | | |
| Europe | | | 1,249,527 | | | | 50.9 | | | | 1,268,600 | | | | 53.7 | |
| Hong Kong | | | 429,565 | | | | 17.5 | | | | 399,243 | | | | 16.9 | |
| Rest of Asia-Pacific | | | 278,062 | | | | 11.3 | | | | 222,139 | | | | 9.4 | |
| Middle East | | | 52,757 | | | | 2.1 | | | | 48,107 | | | | 2.0 | |
| North America | | | 492,487 | | | | 20.1 | | | | 475,014 | | | | 20.1 | |
| Latin America | | | 139,938 | | | | 5.7 | | | | 115,967 | | | | 4.9 | |
| Intra-HSBC items | | | (187,647 | ) | | | (7.6 | ) | | | (164,618 | ) | | | (7.0 | ) |
| | | | | | | | | |
| | | | | | | | | | | | | | | | | |
| | | | 2,454,689 | | | | 100.0 | | | | 2,364,452 | | | | 100.0 | |
| | | | | | | | | |
Risk-weighted assets59
| | | | | | | | | | | �� | | | | | | |
| | | At 31 December |
| | | 2010 | | 2009 |
| | | US$bn | | | % | | | US$bn | | | % | |
| | | | | | | | | | | | | | | | | |
| Total | | | 1,103.1 | | | | | | | | 1,133.2 | | | | | |
| | | | | | | | | | | | | |
| | | | | | | | | | | | | | | | | |
| Europe | | | 301.6 | | | | 27.2 | | | | 339.7 | | | | 29.8 | |
| Hong Kong | | | 106.9 | | | | 9.7 | | | | 119.5 | | | | 10.5 | |
| Rest of Asia-Pacific | | | 217.5 | | | | 19.6 | | | | 173.9 | | | | 15.3 | |
| Middle East | | | 54.1 | | | | 4.9 | | | | 54.3 | | | | 4.8 | |
| North America | | | 330.7 | | | | 29.9 | | | | 369.2 | | | | 32.4 | |
| Latin America | | | 95.9 | | | | 8.7 | | | | 81.7 | | | | 7.2 | |
| | |
| For footnote, see page 83. |
50
Report of the Directors: Operating and Financial Review(continued)
Europe
Our principal banking operations in Europe are HSBC Bank plc in the UK, HSBC France, HSBC Bank A.S. in Turkey, HSBC Bank Malta p.l.c., HSBC Private Bank (Suisse) S.A. and HSBC Trinkaus & Burkhardt AG. Through these operations we provide a wide range of banking, treasury and financial services to personal, commercial and corporate customers across Europe.
| | | | | | | | | | | | | |
| | | 2010 | | | 2009 | | | 2008 | |
| | | US$m | | | US$m | | | US$m | |
| | | | | | | | | | | | | |
| Net interest income | | | 11,250 | | | | 12,268 | | | | 9,696 | |
| Net fee income | | | 6,371 | | | | 6,267 | | | | 7,492 | |
| Net trading income | | | 2,863 | | | | 5,459 | | | | 5,357 | |
| Other income/(expense) | | | 2,266 | | | | (450 | ) | | | 8,134 | |
| | | | | | | |
| | | | | | | | | | | | | |
Net operating income46 | | | 22,750 | | | | 23,544 | | | | 30,679 | |
| | | | | | | | | | | | | |
Impairment charges47 | | | (3,020 | ) | | | (5,568 | ) | | | (3,754 | ) |
| | | | | | | |
| | | | | | | | | | | | | |
Net operating income | | | 19,730 | | | | 17,976 | | | | 26,925 | |
| | | | | | | | | | | | | |
| Total operating expenses | | | (15,445 | ) | | | (13,988 | ) | | | (16,072 | ) |
| | | | | | | |
| | | | | | | | | | | | | |
Operating profit | | | 4,285 | | | | 3,988 | | | | 10,853 | |
| | | | | | | | | | | | | |
Income from associates48 | | | 17 | | | | 21 | | | | 16 | |
| | | | | | | |
| | | | | | | | | | | | | |
Profit before tax | | | 4,302 | | | | 4,009 | | | | 10,869 | |
| | | | | | | |
| | | | | | | | | | | | | |
| Cost efficiency ratio | | | 67.9% | | | | 59.4% | | | | 52.4% | |
| | | | | | | | | | | | | |
| Year-end staff numbers | | | 75,698 | | | | 76,703 | | | | 82,093 | |
Reduction in
underlying impairment charges47
45%
Total UK mortgage
market share
5.2%
2009: 4.8%
Strong trade
revenue growth
| | |
| For footnotes, see page 83. |
| |
| The commentary on Europe is on an underlying basis unless stated otherwise. |
After falling by 4.9% in 2009,UKGross Domestic Product (‘GDP’) only partially recovered in 2010, rising 1.4%. This revival in activity was not reflected in a corresponding rise in employment, and the unemployment rate remained at 7.9% in the three months to November. Despite the general economic weakness, the annual rate of Consumer Price Index (‘CPI’) inflation rose during 2010, reaching 3.7% in December, partly because of the rise in value added tax to 17.5% in January, and increases in the price of food and energy following rapid gains in global commodity prices. Wage growth remained subdued, however, with average earnings rising just 2.0% in the year to December. The Bank of England chose to maintain Bank Rate at 0.5% throughout 2010.
Theeurozoneeconomy also partially recovered during the year, with GDP rising 1.7% in 2010 compared to 2009. The region benefited from the pick-up in the world economy and some improvement in domestic demand. Within the region, Germany recorded the strongest growth rate with its GDP rising 3.5% in the year as a whole. The unemployment rate in the eurozone increased slightly to 10.0% by the end of 2010. The large increases in government debt that emerged in certain parts of the region in recent years began to put upward pressure on government bond yields during 2010, and some governments encountered funding difficulties. In response, a temporary European support fund, the €440bn European Financial Stability Facility was created, and the EU set aside €60bn in a package named the European Financial Stabilisation Mechanism. Greece received a €110bn aid package provided jointly by the International Monetary Fund and eurozone governments. Ireland also drew on international assistance in December. The European Central Bank left its key interest rate at 1.0% throughout the year.
Our European operations reported a pre-tax profit of US$4.3bn, compared with US$4.0bn in 2009, an increase of 7%. In 2010, this included adverse fair value movements of US$198m due to the change in credit spreads on the Group’s own debt held at fair value, compared with adverse fair value movements of US$2.8bn in 2009. In addition, we made gains of US$107m on the disposal of the HSBC Insurance Brokers business and US$255m on the sale of Eversholt Rail Group. In 2009, we recorded a gain on the sale of the residual stake in our UK card merchant acquiring business. Excluding these items, underlying pre-tax profits decreased by 35%,
51
Report of the Directors: Operating and Financial Review(continued)
Profit/(loss) before tax by country within customer groups and global businesses
| | | | | | | | | | | | | | | | | | | | | | | | | |
| | | Personal | | | | | | | Global | | | Global | | | | | | | |
| | | Financial | | | Commercial | | | Banking & | | | Private | | | | | | | |
| | | Services | | | Banking | | | Markets | | | Banking | | | Other | | | Total | |
| | | US$m | | | US$m | | | US$m | | | US$m | | | US$m | | | US$m | |
| | | | | | | | | | | | | | | | | | | | | | | | | |
2010 | | | | | | | | | | | | | | | | | | | | | | | | |
| UK | | | 1,223 | | | | 827 | | | | 1,730 | | | | 223 | | | | (1,605 | ) | | | 2,398 | |
France60 | | | 109 | | | | 135 | | | | 405 | | | | 18 | | | | 26 | | | | 693 | |
| Germany | | | – | | | | 32 | | | | 267 | | | | 30 | | | | 4 | | | | 333 | |
| Malta | | | 35 | | | | 56 | | | | 19 | | | | – | | | | – | | | | 110 | |
| Switzerland | | | – | | | | (5 | ) | | | – | | | | 265 | | | | – | | | | 260 | |
| Turkey | | | 64 | | | | 80 | | | | 105 | | | | 1 | | | | – | | | | 250 | |
| Other | | | (142 | ) | | | 80 | | | | 200 | | | | 103 | | | | 17 | | | | 258 | |
| | | | | | | | | | | | | |
| | | | | | | | | | | | | | | | | | | | | | | | | |
| | | | 1,289 | | | | 1,205 | | | | 2,726 | | | | 640 | | | | (1,558 | ) | | | 4,302 | |
| | | | | | | | | | | | | |
| | | | | | | | | | | | | | | | | | | | | | | | | |
| 2009 | | | | | | | | | | | | | | | | | | | | | | | | |
| UK | | | 364 | | | | 1,026 | | | | 3,045 | | | | 252 | | | | (2,561 | ) | | | 2,126 | |
France60 | | | 54 | | | | 102 | | | | 894 | | | | 3 | | | | (429 | ) | | | 624 | |
| Germany | | | – | | | | 21 | | | | 255 | | | | 32 | | | | (18 | ) | | | 290 | |
| Malta | | | 33 | | | | 58 | | | | 9 | | | | – | | | | – | | | | 100 | |
| Switzerland | | | – | | | | – | | | | 5 | | | | 448 | | | | (3 | ) | | | 450 | |
| Turkey | | | 43 | | | | 97 | | | | 119 | | | | 2 | | | | – | | | | 261 | |
| Other | | | (182 | ) | | | (12 | ) | | | 218 | | | | 117 | | | | 17 | | | | 158 | |
| | | | | | | | | | | | | |
| | | | | | | | | | | | | | | | | | | | | | | | | |
| | | | 312 | | | | 1,292 | | | | 4,545 | | | | 854 | | | | (2,994 | ) | | | 4,009 | |
| | | | | | | | | | | | | |
| | | | | | | | | | | | | | | | | | | | | | | | | |
| 2008 | | | | | | | | | | | | | | | | | | | | | | | | |
| UK | | | 1,546 | | | | 2,361 | | | | (469 | ) | | | 250 | | | | 2,997 | | | | 6,685 | |
France60 | | | 139 | | | | 176 | | | | 273 | | | | 10 | | | | 2,242 | | | | 2,840 | |
| Germany | | | – | | | | 31 | | | | 184 | | | | 32 | | | | (22 | ) | | | 225 | |
| Malta | | | 59 | | | | 67 | | | | 16 | | | | – | | | | – | | | | 142 | |
| Switzerland | | | – | | | | – | | | | – | | | | 553 | | | | – | | | | 553 | |
| Turkey | | | 3 | | | | 91 | | | | 130 | | | | – | | | | – | | | | 224 | |
| Other | | | (89 | ) | | | (4 | ) | | | 61 | | | | 153 | | | | 79 | | | | 200 | |
| | | | | | | | | | | | | |
| | | | | | | | | | | | | | | | | | | | | | | | | |
| | | | 1,658 | | | | 2,722 | | | | 195 | | | | 998 | | | | 5,296 | | | | 10,869 | |
| | | | | | | | | | | | | |
| | |
| For footnote, see page 83. |
largely due to lower income from GB&M, whose exceptional results of 2009 were not repeated, and an unfavourable year on year movement in certain non-qualifying hedges of US$1.1bn.
GB&M results remained strong by historical standards. However, revenues decreased in 2010 due to less favourable market conditions caused by the impact of the European sovereign debt crisis, particularly in the second half of the year, and lower revenues, as forecast, in Balance Sheet Management.
In PFS, we continued to build long-term relationships through our Premier and Advance offerings, focusing on wealth management and secured lending. We increased our total UK mortgage market share to 5.2%, while maintaining a conservative new lending loan to value ratio of 54%.
In CMB, we made further progress on our strategy of becoming the leading international business bank. We also expanded our business in Germany and launched in Switzerland. In the UK, we increased new lending to SMEs by 19% in 2010.
Net interest incomedecreased by 7%. Balance Sheet Management revenues declined, as higher-yielding positions matured, interest rates remained low and yield curves flattened in 2010. In Global Banking, tighter spreads in the lending business and lower average lending balances as customers reduced their debt also contributed to the decrease. Customer deposit spreads were adversely affected by the low interest rate environment and competition for deposits. These reductions were offset in part by growth in mortgage lending in the UK and improved asset spreads in both PFS and CMB.
Net fee incomeincreased by 7%, reflecting higher management fees due to an increase in the average value of funds under management, which arose from net inflows and higher market performance. Fees were also received for management services we provided to certain of our Structured Investment Conduits. Partly offsetting these increases were reductions in the levels of debt and equity issuance in the market, compared with the significant volumes seen in 2009.
52
Report of the Directors: Operating and Financial Review(continued)
Net trading incomedecreased by 47% to US$2.9bn. Less favourable market conditions caused by the impact of the European sovereign debt crisis adversely affected Credit and Rates income. Spread compression from increased competition similarly affected foreign exchange revenues. In addition, net interest income earned on trading activities decreased, driven by reduced holdings of debt securities. These decreases were offset in part by lower net adverse fair value movements on structured liabilities.
Net trading income also included adverse fair value movements of US$304m on non-qualifying hedges used to economically hedge fixed-rate long-term debt issued by HSBC Holdings. These movements were driven by the decline in long-term US dollar interest rates relative to sterling and euro rates in 2010, and compared with favourable fair value movements of US$748m on these instruments in 2009.
Within our legacy Credit book, a net release of previous write-downs on ABSs and monoline exposures as asset prices improved was more than offset by the non-recurrence of gains in other parts of the business.
Net income from financial instruments designated at fair valuefell by US$808m. The growth in equity markets in 2010 was lower than in 2009, resulting in lower investment gains recognised on the fair value of assets held to meet liabilities under insurance and investment contracts. To the extent that these gains accrued to policyholders holding unit-linked insurance policies and insurance or investment contracts with DPF, there was a corresponding decrease in ‘Net insurance claims incurred and movement in liabilities to policyholders’. In addition, adverse foreign exchange movements were reported in the year on foreign currency debt designated at fair value, issued as part of our overall funding strategy with an offset from trading assets held as economic hedges reported in ‘Net trading income’.
Gains less losses from financial investmentsincreased by US$455m as improved market conditions led to gains on sale of private equity investments and lower impairment charges on certain available-for-sale investments.
Net earned insurance premiumswere in line with 2009. The decision in 2009 to place our UK motor insurance business into run-off resulted in no new premiums being written in 2010. In addition, a decision was taken during 2010 not to renew certain contracts in the Irish business. By contrast, we
generated strong sales activity in the UK life and French insurance businesses.
Other operating incomedecreased by US$193m because the gain on the sale and leaseback of our Paris headquarters building in 2010 was exceeded by the gain on the sale and leaseback of the Group’s London headquarters building in 2009.
Net insurance claims incurred and movement in liabilities to policyholdersdecreased by 11%. This was driven by lower investment gains compared with 2009 and by the non-recurrence of the strengthening of reserves in 2009 on the now-closed UK motor insurance book which reflected the rising incidence and severity of claims at that time. The decision not to renew certain contracts in the Irish business resulted in a further decrease in claims.
Loan impairment charges and other credit risk provisionsdecreased by 45% to US$3.0bn, reflecting the more stable credit environment and helped by mitigating actions taken by management. In GB&M, the improved credit outlook, loan restructuring activity, a release of previous collective impairments and lower specific impairment charges in 2010 contributed to a decline in loan impairment charges and other credit risk provisions. Credit risk provisions on certain available-for-sale ABSs also reduced due to a slowing in the rate of anticipated losses in the underlying collateral pools.
In CMB, the reduction in loan impairment charges and other credit risk provisions was largely due to an improvement in the UK property, retail and services sectors, with reductions also seen in our Continental European businesses. The improvement in economic conditions across the region and the effect of low interest rates also resulted in lower delinquencies in the PFS portfolios.
Operating expensesin 2010 included one-off payroll and bonus taxes in the UK and France on certain bonuses paid in respect of 2009 totalling US$324m, primarily in GB&M. Operating expenses in 2009 included an accounting gain of US$480m (US$499m as reported) related to a change in the delivery of certain staff benefits in the main UK pension scheme. Excluding these items, operating expenses were 8% higher than in 2009. This was driven by continued strategic investments in people and infrastructure to support our customers, drive future growth and deliver sustainable long-term reductions in our cost base by re-engineering business processes. In addition, rental expenses increased following the sale and leaseback of our headquarters buildings in London and Paris.
53
Report of the Directors: Operating and Financial Review(continued)
TheUKeconomy suffered a sharp contraction during the course of 2009, although evidence from the final months of the year suggested that some growth had resumed. Gross Domestic Product (‘GDP’) fell by 5% in 2009 – the sharpest contraction in over 60 years – after a 0.5% increase in 2008. Weakness affected most sectors of the economy, and the unemployment rate hit a 13-year high of 7.9% in July 2009, although some stabilisation of labour market conditions was apparent towards the end of the year. Consumer Price Index (‘CPI’) inflation reached a five-year low of 1.1% in September 2009 before moving towards the Bank of England’s 2% target by the end of the year. Nominal house prices appreciated modestly during the second half of 2009, although indicators of housing market activity remained at relatively weak levels. After reducing interest rates to just 0.5% in March 2009, the Bank of England launched the Asset Purchase Facility in an attempt to improve the circulation of credit throughout the economy and support expectations of future economic activity.
Theeurozoneeconomy also performed poorly during 2009, with GDP falling by 4% following a 0.5% expansion in 2008. Much of this weakness was concentrated in the early months of 2009 and growth resumed in the third quarter, helped by a variety of fiscal stimulus programmes and a rebuilding of inventory levels. Consumer spending proved relatively resilient in early 2009, boosted by a number of purchase incentive schemes, and some weakness was observed as these programmes expired. Unemployment rose to an 11-year high of 10% in December 2009, while CPI temporarily turned negative during the third quarter of the year. The European Central Bank cut interest rates by 150 basis points to finish the year at 1%.
Our European operations reported a pre-tax profit of US$4.0bn, compared with US$10.9bn in 2008. This decline was largely caused by movement in the fair value attributable to credit spread on our own debt. A US$2.8bn expense in 2009 following stabilisation in financial markets and a narrowing of credit spreads largely reversed the US$3.1bn income recognised in 2008, giving a US$5.9bn year on year movement. Also included within these results was a gain on the sale of the residual stake in the UK card merchant acquiring business to Global Payments Inc. of US$280m in June 2009. This followed a
US$425m gain realised in 2008 on the sale of the first tranche. Excluding these gains on sale, the profit on disposal of the French regional banks in July 2008 and the reversal of movements in the fair value of own debt, underlying pre-tax profits grew by US$3.0bn or 83%. This was driven by robust performances in our European GB&M businesses, in particular from the non-recurrence of significant credit-related write-downs taken in 2008 and outstanding results in Rates and Balance Sheet Management. Deterioration in the economic environment and higher unemployment levels led to a rise in loan impairment charges in both PFS and CMB. HSBC Bank continued to provide lending services to its customers while maintaining effective credit control and strengthening collection practices and systems.
Net interest incomeincreased by 43%, with Balance Sheet Management revenues in GB&M rising robustly. This resulted from the early positioning of our balance sheet in anticipation of decisions by central banks to maintain a low base rate environment. Net interest income also benefited from a reduction in the cost of funding trading activities as interest rates fell. Conversely, the PFS and CMB businesses and payments and cash management were adversely affected by continued margin compression following interest rate reductions in late 2008 and early 2009.
Mortgage balances increased as we gained market share in the UK through the success of a new Rate Matcher mortgage promotion and other campaigns launched in line with our secured lending growth strategy. In 2009, our UK bank more than met its commitment to make £15bn (US$24.7bn) of new mortgage lending available to borrowers. In CMB, net lending fell compared with 2008 as a result of muted customer demand. Utilisation of committed overdraft facilities provided by HSBC in the UK to commercial customers was only 40% at the end of 2009, illustrating the potential availability of credit when customer demand resumes. Across most businesses, asset balances declined reflecting reduced customer demand for credit, increased debt issuance as the bond markets reopened in 2009 and our diminished appetite for unsecured lending in Europe. Asset spreads widened, most notably in the UK and Turkey, as funding costs fell in the low interest rate environment and market pricing of corporate lending increased.
Throughout 2009, we worked to retain and build on the personal and commercial banking deposit bases gained in the last quarter of 2008 in the face of fierce competition and the narrowing of spreads across the region following interest rate cuts.
53(a)
Report of the Directors: Operating and Financial Review(continued)
Net fee incomefell by 4%. The overall reduction in fees was a consequence of the part-disposal of the UK card merchant acquiring business to a joint venture in 2008 and lower insurance income following the closure of our consumer finance branch network in the UK and reduced sales of discontinued products. In GPB, lower equity brokerage commissions and reduced performance and management fees reflected subdued investor sentiment for risk and structured products; this, together with stock market declines, reduced the average value of funds under management during the year.
We generated higher underwriting fees than in 2008 from increased government and corporate debt issuances, and by taking market share in equity capital markets issues as corporates and financial institutions restructured their balance sheets by raising share capital. As part of our wealth management strategy, we continued to grow our Premier customer base and successfully launched the World Selection fund in the UK which raised US$1.5bn. In France, the Premier customer base grew by over 10% as HSBC brand awareness increased.
Trading incomeincreased by 23% to US$5.5bn due to strong revenues across core businesses. Rates reported a significant increase in income driven by a growth in market share, higher client trading volumes and wider bid-offer spreads. Similarly, revenue in the Credit trading business also rose as credit prices improved and client activity increased with the return of liquidity to the market. Foreign exchange revenue fell, however, reflecting a combination of reduced customer volumes and relatively low market volatility when compared with the exceptional experience of 2008.
Trading income also benefited from significantly lower write-downs on legacy positions in Credit trading, leveraged and acquisition financing and monoline exposures, and from the non-recurrence of a reported US$854m loss in 2008 following the fraud at Madoff Securities. These benefits were partly offset by losses on structured liabilities as credit spreads narrowed (compared with gains in 2008) and a reduction in net interest income on trading activities. This was due to the decline in interest rates, which also contributed to the reduction in the cost of funding trading activities as reported in ‘Net interest income’. The tightening of credit spreads also led to a reduction in the carrying value of credit default swap transactions held as hedges in parts of the Global Banking portfolio. In 2008, gains were reported on these credit default swaps following widening credit spreads.
We incurred a net expense of US$1.4bn onfinancial instruments designated at fair value, compared with income in 2008. Gains on the fair value of assets held to meet liabilities under insurance and investment contracts were recognised as equity markets recovered from declines sustained in 2008. To the extent that these gains were attributed to policyholders holding either insurance contracts or investment contracts with DPF, there was a corresponding increase innet insurance claims incurred and movement in liabilities to policyholders.
Gains less losses from financial investmentswere US$192m lower than in 2008 due to the non-recurrence of certain disposals in that year, including MasterCard shares, private equity investments and the remaining stake in the Hermitage Fund.
Net earned insurance premiumsdecreased by 12%. In the UK demand for the insurance-linked Guaranteed Income Bond fell as we offered more favourable rates on an alternative non-insurance deposit product, giving rise to a US$1.1bn decrease in insurance premium income, with a corresponding decrease in ‘Net insurance claims incurred and movement in liabilities to policyholders’. Excluding the effect of a significant re-insurance transaction in 2008 which passed insurance premiums to a third-party reinsurer, net premiums in France increased despite a significant reduction in the distribution network following the disposal of the regional banks in July 2008.
Other operating incomeincreased by 45%, mainly due to a US$576m gain on the sale and leaseback of 8 Canada Square in London which was effected through the disposal of our entire shareholding in the company which was the legal owner of the building and long leasehold interest in 8 Canada Square. In 2008, we reported a gain of US$416m representing the equity deposit on a previously negotiated sale of the building which ultimately did not complete. In addition, a change in mortality assumptions in France resulted in increased PVIF of long-term insurance business. The growth in revenue also reflected the non-recurrence of costs associated with the support of money market funds in the global asset management business in 2008. Offsetting this was the non-recurrence of a favourable embedded value adjustment following the introduction of enhanced benefits to our existing pension products in the UK in 2008, and lower gains on the sale and leaseback of branches.
Net insurance claims incurred and movement in liabilities to policyholdersincreased by US$2.5bn. The majority of the movement was due to the change
53(b)
Report of the Directors: Operating and Financial Review(continued)
in liabilities to policyholders reported above in ‘Financial instruments designated at fair value’, and the large one-off reinsurance transaction in France in 2008. In addition, an increase of US$310m in claims reserving was required to reflect a higher incidence and severity of insurance claims in the UK motor underwriting business and a higher incidence of credit protection claims through the reinsurance business in Ireland. Risk mitigation measures implemented in 2009 included the decision to cease originations of UK motor insurance business. This was partly offset by the decrease in liabilities following reduced sales of the personal customer bond product offering noted above.
Loan impairment charges and other credit risk provisionsrose by 66% to US$5.6bn as the impact of weaker economic conditions across the region fed through to higher delinquency and default. In GB&M, loan impairment charges and credit risk provisions increased, with the charges concentrated among a small number of clients in the financial and property sectors. The emergence in the year of cash flow impairment on certain asset-backed debt securities held within the available-for-sale portfolios added US$1.1bn to the charge. Impairment booked on these exposures reflects mark-to-market losses which we judge to be significantly in excess of the likely ultimate cash losses.
In CMB, loan impairment charges rose by US$471m, again reflecting the economic downturn. Our commercial property portfolio in the UK
declined during 2009, reflecting our efforts to reduce risk in this sector. In the personal sector, deterioration was most evident in the unsecured portfolios as unemployment rose. As a result of past management action, unsecured lending remained a small proportion of our personal lending portfolio, with the bulk of the portfolio secured in the form of residential mortgages. Despite some increase in losses in the residential sector, impairment charges as a percentage of total lending in this portfolio remained very low at 0.14%.
Operating expenseswere held broadly in line with 2008. Excluding an accounting gain of US$499m following a change in the basis of delivering death-in-service, ill health and early retirement benefits for some UK employees, operating expenses increased slightly despite efficiency benefits as higher performance-related awards were made to reflect GB&M’s exceptional revenue and profit growth in selective businesses.
In PFS and CMB businesses, operational cost savings reflected the leverage of our global technology platforms and processes to reduce costs and improve customer experience, complemented by tight control over discretionary expenditure and a reduction in staff numbers. Payroll savings and lower Financial Services Compensation Scheme costs were partly offset by an increase in rental costs following the sale and leaseback of properties and higher regular defined benefit pension charges. In Europe, full time equivalent staff numbers fell by some 6,000 during the year.
53(c)
Report of the Directors: Operating and Financial Review(continued)
Profit/(loss) before tax and balance sheet data – Europe
| | | | | | | | | | | | | | | | | | | | | | | | | | | | | |
| | | 2010 |
| | | Personal | | | | | | | Global | | | Global | | | | | | | Inter- | | | | |
| | | Financial | | | Commercial | | | Banking & | | | Private | | | | | | | segment | | | | |
| | | Services | | | Banking | | | Markets | | | Banking | | | Other | | | elimination | 56 | | Total | |
| | | US$m | | | US$m | | | US$m | | | US$m | | | US$m | | | US$m | | | US$m | |
| | | | | | | | | | | | | | | | | | | | | | | | | | | | | |
Profit/(loss) before tax | | | | | | | | | | | | | | | | | | | | | | | | | | | | |
| | | | | | | | | | | | | | | | | | | | | | | | | | | | | |
| Net interest income/(expense) | | | 5,536 | | | | 2,774 | | | | 2,936 | | | | 871 | | | | (654 | ) | | | (213 | ) | | | 11,250 | |
| | | | | | | | | | | | | | | | | | | | | | | | | | | | | |
| Net fee income | | | 2,016 | | | | 1,570 | | | | 1,863 | | | | 883 | | | | 39 | | | | – | | | | 6,371 | |
| | | | | | | | | | | | | | | | | | | | | | | | | | | | | |
| | | | | | | | | | | | | | | |
| Trading income/(expense) excluding net interest income | | | (7 | ) | | | 3 | | | | 1,542 | | | | 185 | | | | (262 | ) | | | – | | | | 1,461 | |
| Net interest income/(expense) on trading activities | | | (1 | ) | | | 19 | | | | 1,127 | | | | 21 | | | | 23 | | | | 213 | | | | 1,402 | |
| | | | | | | | | | | | | | | |
| | | | | | | | | | | | | | | | | | | | | | | | | | | | | |
Net trading income/(expense)49 | | | (8 | ) | | | 22 | | | | 2,669 | | | | 206 | | | | (239 | ) | | | 213 | | | | 2,863 | |
| | | | | | | | | | | | | | | | | | | | | | | | | | | | | |
| | | | | | | | | | | | | | | |
| Changes in fair value of long- term debt issued and related derivatives | | | – | | | | – | | | | – | | | | – | | | | (365 | ) | | | – | | | | (365 | ) |
| Net income/(expense) from other financial instruments designated at fair value | | | 496 | | | | 113 | | | | (23) | | | | – | | | | 61 | | | | – | | | | 647 | |
| | | | | | | | | | | | | | | |
| | | | | | | | | | | | | | | | | | | | | | | | | | | | | |
| Net income/(expense) from financial instruments designated at fair value | | | 496 | | | | 113 | | | | (23 | ) | | | – | | | | (304 | ) | | | – | | | | 282 | |
| Gains less losses from financial investments | | | 29 | | | | – | | | | 460 | | | | (7 | ) | | | 4 | | | | – | | | | 486 | |
| Dividend income | | | – | | | | 1 | | | | 16 | | | | 2 | | | | 1 | | | | – | | | | 20 | |
| Net earned insurance premiums | | | 3,800 | | | | 278 | | | | – | | | | – | | | | (11 | ) | | | – | | | | 4,067 | |
| Other operating income | | | 165 | | | | 163 | | | | 839 | | | | 7 | | | | 754 | | | | 189 | | | | 2,117 | |
| | | | | | | | | | | | | | | |
| | | | | | | | | | | | | | | | | | | | | | | | | | | | | |
Total operating income/(expense) | | | 12,034 | | | | 4,921 | | | | 8,760 | | | | 1,962 | | | | (410 | ) | | | 189 | | | | 27,456 | |
| | | | | | | | | | | | | | | | | | | | | | | | | | | | | |
Net insurance claims57 | | | (4,364 | ) | | | (342 | ) | | | – | | | | – | | | | – | | | | – | | | | (4,706 | ) |
| | | | | | | | | | | | | | | |
| | | | | | | | | | | | | | | | | | | | | | | | | | | | | |
Net operating income/(expense)46 | | | 7,670 | | | | 4,579 | | | | 8,760 | | | | 1,962 | | | | (410 | ) | | | 189 | | | | 22,750 | |
| | | | | | | | | | | | | | | | | | | | | | | | | | | | | |
| Loan impairment (charges)/recoveries and other credit risk provisions | | | (1,217 | ) | | | (997 | ) | | | (783 | ) | | | (26 | ) | | | 3 | | | | – | | | | (3,020 | ) |
| | | | | | | | | | | | | | | |
| | | | | | | | | | | | | | | | | | | | | | | | | | | | | |
Net operating income/(expense) | | | 6,453 | | | | 3,582 | | | | 7,977 | | | | 1,936 | | | | (407 | ) | | | 189 | | | | 19,730 | |
| | | | | | | | | | | | | | | | | | | | | | | | | | | | | |
| Total operating expenses | | | (5,166 | ) | | | (2,378 | ) | | | (5,265 | ) | | | (1,296 | ) | | | (1,151 | ) | | | (189 | ) | | | (15,445 | ) |
| | | | | | | | | | | | | | | |
| | | | | | | | | | | | | | | | | | | | | | | | | | | | | |
Operating profit/(loss) | | | 1,287 | | | | 1,204 | | | | 2,712 | | | | 640 | | | | (1,558 | ) | | | – | | | | 4,285 | |
| | | | | | | | | | | | | | | | | | | | | | | | | | | | | |
| Share of profit in associates and joint ventures | | | 2 | | | | 1 | | | | 14 | | | | – | | | | – | | | | – | | | | 17 | |
| | | | | | | | | | | | | | | |
| | | | | | | | | | | | | | | | | | | | | | | | | | | | | |
Profit/(loss) before tax | | | 1,289 | | | | 1,205 | | | | 2,726 | | | | 640 | | | | (1,558 | ) | | | – | | | | 4,302 | |
| | | | | | | | | | | | | | | |
| | | | | | | | | | | | | | | | | | | | | | | | | | | | | |
| | | | % | | | | % | | | | % | | | | % | | | | % | | | | | | | | % | |
| | | | | | | | | | | | | | | | | | | | | | | | | | | | | |
| Share of HSBC’s profit before tax | | | 6.8 | | | | 6.3 | | | | 14.3 | | | | 3.4 | | | | (8.2 | ) | | | | | | | 22.6 | |
| Cost efficiency ratio | | | 67.4 | | | | 51.9 | | | | 60.1 | | | | 66.1 | | | | (280.7 | ) | | | | | | | 67.9 | |
| | | | | | | | | | | | | | | | | | | | | | | | | | | | | |
Balance sheet data45 | | | | | | | | | | | | | | | | | | | | | | | | | | | | |
| | | | | | | | | | | | | | | | | | | | | | | | | | | | | |
| | | US$m | | | US$m | | | US$m | | | US$m | | | US$m | | | | | | | US$m | |
| | | | | | | | | | | | | | | | | | | | | | | | | | | | | |
| Loans and advances to customers (net) | | | 145,063 | | | | 91,744 | | | | 170,375 | | | | 27,629 | | | | 988 | | | | | | | | 435,799 | |
| Total assets | | | 202,431 | | | | 111,356 | | | | 965,462 | | | | 76,631 | | | | 65,824 | | | | (172,177 | ) | | | 1,249,527 | |
| Customer accounts | | | 168,979 | | | | 96,597 | | | | 169,873 | | | | 56,114 | | | | – | | | | | | | | 491,563 | |
54
Report of the Directors: Operating and Financial Review(continued)
| | | | | | | | | | | | | | | | | | | | | | | | | | | | | |
| Europe | | 2009 |
| | | Personal | | | | | | | Global | | | Global | | | | | | | Inter- | | | | |
| | | Financial | | | Commercial | | | Banking & | | | Private | | | | | | | segment | | | | |
| | | Services | | | Banking | | | Markets | | | Banking | | | Other | | | elimination | 56 | | Total | |
| | | US$m | | | US$m | | | US$m | | | US$m | | | US$m | | | US$m | | | US$m | |
| | | | | | | | | | | | | | | | | | | | | | | | | | | | | |
Profit/(loss) before tax | | | | | | | | | | | | | | | | | | | | | | | | | | | | |
| | | | | | | | | | | | | | | | | | | | | | | | | | | | | |
| Net interest income/(expense) | | | 5,413 | | | | 2,739 | | | | 4,367 | | | | 949 | | | | (525 | ) | | | (675 | ) | | | 12,268 | |
| | | | | | | | | | | | | | | | | | | | | | | | | | | | | |
| Net fee income | | | 1,949 | | | | 1,679 | | | | 1,670 | | | | 883 | | | | 86 | | | | – | | | | 6,267 | |
| | | | | | | | | | | | | | | | | | | | | | | | | | | | | |
| | | | | | | | | | | | | | | |
| Trading income excluding net interest income | | | 34 | | | | 3 | | | | 2,267 | | | | 175 | | | | 382 | | | | – | | | | 2,861 | |
| Net interest income/(expense) on trading activities | | | (1 | ) | | | 17 | | | | 1,869 | | | | 23 | | | | 15 | | | | 675 | | | | 2,598 | |
| | | | | | | | | | | | | | | |
| | | | | | | | | | | | | | | | | | | | | | | | | | | | | |
Net trading income49 | | | 33 | | | | 20 | | | | 4,136 | | | | 198 | | | | 397 | | | | 675 | | | | 5,459 | |
| | | | | | | | | | | | | | | | | | | | | | | | | | | | | |
| | | | | | | | | | | | | | | |
| Changes in fair value of long- term debt issued and related derivatives | | | – | | | | – | | | | – | | | | – | | | | (2,746 | ) | | | – | | | | (2,746 | ) |
| Net income/(expense) from other financial instruments designated at fair value | | | 1,012 | | | | 133 | | | | 375 | | | | – | | | | (199 | ) | | | – | | | | 1,321 | |
| | | | | | | | | | | | | | | |
| | | | | | | | | | | | | | | | | | | | | | | | | | | | | |
| Net income/(expense) from financial instruments designated at fair value | | | 1,012 | | | | 133 | | | | 375 | | | | – | | | | (2,945 | ) | | | – | | | | (1,425 | ) |
| Gains less losses from financial investments | | | 20 | | | | 2 | | | | 25 | | | | 5 | | | | (2 | ) | | | – | | | | 50 | |
| Dividend income | | | 2 | | | | 1 | | | | 26 | | | | 3 | | | | (3 | ) | | | – | | | | 29 | |
| Net earned insurance premiums | | | 3,975 | | | | 253 | | | | (2 | ) | | | – | | | | (3 | ) | | | – | | | | 4,223 | |
| Other operating income | | | 182 | | | | 373 | | | | 670 | | | | 28 | | | | 914 | | | | 95 | | | | 2,262 | |
| | | | | | | | | | | | | | | |
| | | | | | | | | | | | | | | | | | | | | | | | | | | | | |
| Total operating income/(expense) | | | 12,586 | | | | 5,200 | | | | 11,267 | | | | 2,066 | | | | (2,081 | ) | | | 95 | | | | 29,133 | |
| | | | | | | | | | | | | | | | | | | | | | | | | | | | | |
Net insurance claims57 | | | (5,221 | ) | | | (365 | ) | | | – | | | | – | | | | (3 | ) | | | – | | | | (5,589 | ) |
| | | | | | | | | | | | | | | |
| | | | | | | | | | | | | | | | | | | | | | | | | | | | | |
Net operating income/(expense)46 | | | 7,365 | | | | 4,835 | | | | 11,267 | | | | 2,066 | | | | (2,084 | ) | | | 95 | | | | 23,544 | |
| | | | | | | | | | | | | | | | | | | | | | | | | | | | | |
| Loan impairment charges and other credit risk provisions | | | (1,992 | ) | | | (1,267 | ) | | | (2,277 | ) | | | (29 | ) | | | (3 | ) | | | – | | | | (5,568 | ) |
| | | | | | | | | | | | | | | |
| | | | | | | | | | | | | | | | | | | | | | | | | | | | | |
| Net operating income/(expense) | | | 5,373 | | | | 3,568 | | | | 8,990 | | | | 2,037 | | | | (2,087 | ) | | | 95 | | | | 17,976 | |
| | | | | | | | | | | | | | | | | | | | | | | | | | | | | |
| Total operating expenses | | | (5,062 | ) | | | (2,294 | ) | | | (4,447 | ) | | | (1,183 | ) | | | (907 | ) | | | (95 | ) | | | (13,988 | ) |
| | | | | | | | | | | | | | | |
| | | | | | | | | | | | | | | | | | | | | | | | | | | | | |
| Operating profit/(loss) | | | 311 | | | | 1,274 | | | | 4,543 | | | | 854 | | | | (2,994 | ) | | | – | | | | 3,988 | |
| | | | | | | | | | | | | | | | | | | | | | | | | | | | | |
| Share of profit in associates and joint ventures | | | 1 | | | | 18 | | | | 2 | | | | – | | | | – | | | | – | | | | 21 | |
| | | | | | | | | | | | | | | |
| | | | | | | | | | | | | | | | | | | | | | | | | | | | | |
| Profit/(loss) before tax | | | 312 | | | | 1,292 | | | | 4,545 | | | | 854 | | | | (2,994 | ) | | | – | | | | 4,009 | |
| | | | | | | | | | | | | | | |
| | | | | | | | | | | | | | | | | | | | | | | | | | | | | |
| | | | % | | | | % | | | | % | | | | % | | | | % | | | | | | | | % | |
| | | | | | | | | | | | | | | | | | | | | | | | | | | | | |
| Share of HSBC’s profit before tax | | | 4.4 | | | | 18.3 | | | | 64.2 | | | | 12.1 | | | | (42.3 | ) | | | | | | | 56.7 | |
| Cost efficiency ratio | | | 68.7 | | | | 47.4 | | | | 39.5 | | | | 57.3 | | | | (43.5 | ) | | | | | | | 59.4 | |
| | | | | | | | | | | | | | | | | | | | | | | | | | | | | |
Balance sheet data45 | | | | | | | | | | | | | | | | | | | | | | | | | | | | |
| | | | | | | | | | | | | | | | | | | | | | | | | | | | | |
| | | US$m | | | US$m | | | US$m | | | US$m | | | US$m | | | | | | | US$m | |
| | | | | | | | | | | | | | | | | | | | | | | | | | | | | |
| Loans and advances to customers (net) | | | 147,760 | | | | 89,084 | | | | 176,123 | | | | 25,541 | | | | 973 | | | | | | | | 439,481 | |
| Total assets | | | 208,669 | | | | 111,874 | | | | 981,831 | | | | 76,871 | | | | 84,010 | | | | (194,655 | ) | | | 1,268,600 | |
| Customer accounts | | | 165,161 | | | | 102,249 | | | | 169,390 | | | | 58,213 | | | | 6 | | | | | | | | 495,019 | |
55
Report of the Directors: Operating and Financial Review(continued)
| | | | | | | | | | | | | | | | | | | | | | | | | | | | | |
| Europe | | 2008 |
| | | Personal | | | | | | | Global | | | Global | | | | | | | Inter- | | | | |
| | | Financial | | | Commercial | | | Banking & | | | Private | | | | | | | segment | | | | |
| | | Services | | | Banking | | | Markets | | | Banking | | | Other | | | elimination | 56 | | Total | |
| | | US$m | | | US$m | | | US$m | | | US$m | | | US$m | | | US$m | | | US$m | |
| | | | | | | | | | | | | | | | | | �� | | | | | | | | | | | |
Profit/(loss) before tax | | | | | | | | | | | | | | | | | | | | | | | | | | | | |
| | | | | | | | | | | | | | | | | | | | | | | | | | | | | |
| Net interest income/(expense) | | | 6,464 | | | | 3,435 | | | | 3,488 | | | | 1,046 | | | | (459 | ) | | | (4,278 | ) | | | 9,696 | |
| | | | | | | | | | | | | | | | | | | | | | | | | | | | | |
| Net fee income | | | 2,612 | | | | 2,025 | | | | 1,763 | | | | 1,020 | | | | 72 | | | | – | | | | 7,492 | |
| | | | | | | | | | | | | | | | | | | | | | | | | | | | | |
| | | | | | | | | | | | | | | |
| Trading income/(expense) excluding net interest income | | | 47 | | | | 71 | | | | 1,513 | | | | 198 | | | | (138 | ) | | | – | | | | 1,691 | |
| Net interest income/(expense) on trading activities | | | – | | | | 12 | | | | (655 | ) | | | 14 | | | | 17 | | | | 4,278 | | | | 3,666 | |
| | | | | | | | | | | | | | | |
| | | | | | | | | | | | | | | | | | | | | | | | | | | | | |
Net trading income/(expense)49 | | | 47 | | | | 83 | | | | 858 | | | | 212 | | | | (121 | ) | | | 4,278 | | | | 5,357 | |
| | | | | | | | | | | | | | | | | | | | | | | | | | | | | |
| | | | | | | | | | | | | | | |
| Changes in fair value of long- term debt issued and related derivatives | | | – | | | | – | | | | – | | | | – | | | | 2,939 | | | | – | | | | 2,939 | |
| Net income/(expense) from other financial instruments designated at fair value | | | (1,634 | ) | | | (214 | ) | | | (611 | ) | | | – | | | | 633 | | | | – | | | | (1,826 | ) |
| | | | | | | | | | | | | | | |
| | | | | | | | | | | | | | | | | | | | | | | | | | | | | |
| Net income/(expense) from financial instruments designated at fair value | | | (1,634 | ) | | | (214 | ) | | | (611 | ) | | | – | | | | 3,572 | | | | – | | | | 1,113 | |
| Gains less losses from financial investments | | | 281 | | | | 132 | | | | (30 | ) | | | 62 | | | | (27 | ) | | | – | | | | 418 | |
| Dividend income | | | 35 | | | | 74 | | | | 25 | | | | 5 | | | | (9 | ) | | | – | | | | 130 | |
| Net earned insurance premiums | | | 4,927 | | | | 391 | | | | – | | | | – | | | | (19 | ) | | | – | | | | 5,299 | |
| Gains on disposal of French regional banks | | | – | | | | – | | | | – | | | | – | | | | 2,445 | | | | – | | | | 2,445 | |
| Other operating income | | | 230 | | | | 620 | | | | 398 | | | | 16 | | | | 832 | | | | – | | | | 2,096 | |
| | | | | | | | | | | | | | | |
| | | | | | | | | | | | | | | | | | | | | | | | | | | | | |
| Total operating income | | | 12,962 | | | | 6,546 | | | | 5,891 | | | | 2,361 | | | | 6,286 | | | | – | | | | 34,046 | |
| | | | | | | | | | | | | | | | | | | | | | | | | | | | | |
Net insurance claims57 | | | (3,224 | ) | | | (143 | ) | | | – | | | | – | | | | – | | | | – | | | | (3,367 | ) |
| | | | | | | | | | | | | | | |
| | | | | | | | | | | | | | | | | | | | | | | | | | | | | |
Net operating income46 | | | 9,738 | | | | 6,403 | | | | 5,891 | | | | 2,361 | | | | 6,286 | | | | – | | | | 30,679 | |
| | | | | | | | | | | | | | | | | | | | | | | | | | | | | |
| Loan impairment charges and other credit risk provisions | | | (1,971 | ) | | | (867 | ) | | | (875 | ) | | | (38 | ) | | | (3 | ) | | | – | | | | (3,754 | ) |
| | | | | | | | | | | | | | | |
| | | | | | | | | | | | | | | | | | | | | | | | | | | | | |
| Net operating income | | | 7,767 | | | | 5,536 | | | | 5,016 | | | | 2,323 | | | | 6,283 | | | | – | | | | 26,925 | |
| | | | | | | | | | | | | | | | | | | | | | | | | | | | | |
| Total operating expenses | | | (6,107 | ) | | | (2,830 | ) | | | (4,823 | ) | | | (1,325 | ) | | | (987 | ) | | | – | | | | (16,072 | ) |
| | | | | | | | | | | | | | | |
| | | | | | | | | | | | | | | | | | | | | | | | | | | | | |
| Operating profit | | | 1,660 | | | | 2,706 | | | | 193 | | | | 998 | | | | 5,296 | | | | – | | | | 10,853 | |
| | | | | | | | | | | | | | | | | | | | | | | | | | | | | |
| Share of profit/(loss) in associates and joint ventures | | | (2 | ) | | | 16 | | | | 2 | | | | – | | | | – | | | | – | | | | 16 | |
| | | | | | | | | | | | | | | |
| | | | | | | | | | | | | | | | | | | | | | | | | | | | | |
Profit before tax | | | 1,658 | | | | 2,722 | | | | 195 | | | | 998 | | | | 5,296 | | | | – | | | | 10,869 | |
| | | | | | | | | | | | | | | |
| | | | | | | | | | | | | | | | | | | | | | | | | | | | | |
| | | | % | | | | % | | | | % | | | | % | | | | % | | | | | | | | % | |
| |
| Share of HSBC’s profit before tax | | | 17.8 | | | | 29.2 | | | | 2.1 | | | | 10.7 | | | | 56.9 | | | | | | | | 116.7 | |
| Cost efficiency ratio | | | 62.7 | | | | 44.2 | | | | 81.9 | | | | 56.1 | | | | 15.7 | | | | | | | | 52.4 | |
| | | | | | | | | | | | | | | | | | | | | | | | | | | | | |
Balance sheet data45 | | | | | | | | | | | | | | | | | | | | | | | | | | | | |
| |
| | | US$m | | | US$m | | | US$m | | | US$m | | | US$m | | | | | | | US$m | |
| |
| Loans and advances to customers (net) | | | 126,909 | | | | 87,245 | | | | 185,818 | | | | 25,722 | | | | 497 | | | | | | | | 426,191 | |
Total assets | | | 171,962 | | | | 107,495 | | | | 1,180,759 | | | | 84,485 | | | | 64,423 | | | | (217,075 | ) | | | 1,392,049 | |
| Customer accounts | | | 145,411 | | | | 91,188 | | | | 199,687 | | | | 66,007 | | | | 183 | | | | | | | | 502,476 | |
| | |
| For footnotes, see page 83. |
55(a)
Report of the Directors: Operating and Financial Review(continued)
Hong Kong
HSBC’s principal banking subsidiaries in Hong Kong are The Hongkong and Shanghai Banking Corporation Limited and Hang Seng Bank Limited. The former is the largest bank incorporated in Hong Kong and is our flagship bank in the Asia-Pacific region. It is one of Hong Kong’s three note-issuing banks, accounting for more than 65% by value of banknotes in circulation in 2010.
| | | | | | | | | | | | | |
| | | 2010 | | | 2009 | | | 2008 | |
| | | US$m | | | US$m | | | US$m | |
| | | | | | | | | | | | | |
| Net interest income | | | 4,246 | | | | 4,195 | | | | 5,698 | |
| Net fee income | | | 2,962 | | | | 2,669 | | | | 2,580 | |
| Net trading income | | | 1,312 | | | | 1,225 | | | | 1,193 | |
| Other income | | | 1,682 | | | | 1,378 | | | | 683 | |
| | | | | | | |
| | | | | | | | | | | | | |
Net operating income46 | | | 10,202 | | | | 9,467 | | | | 10,154 | |
| | | | | | | | | | | | | |
Impairment charges47 | | | (114 | ) | | | (500 | ) | | | (765 | ) |
| | | | | | | |
| | | | | | | | | | | | | |
Net operating income | | | 10,088 | | | | 8,967 | | | | 9,389 | |
| | | | | | | | | | | | | |
| Total operating expenses | | | (4,431 | ) | | | (3,946 | ) | | | (3,943 | ) |
| | | | | | | |
Operating profit | | | 5,657 | | | | 5,021 | | | | 5,446 | |
| | | | | | | | | | | | | |
Income from associates48 | | | 35 | | | | 8 | | | | 15 | |
| | | | | | | |
| | | | | | | | | | | | | |
Profit before tax | | | 5,692 | | | | 5,029 | | | | 5,461 | |
| | | | | | | |
| | | | | | | | | | | | | |
| Cost efficiency ratio | | | 43.4% | | | | 41.7% | | | | 38.8% | |
| | | | | | | | | | | | | |
| Year-end staff numbers | | | 29,171 | | | | 27,614 | | | | 29,330 | |
Best Bank in Hong Kong
(Euromoney Awards for Excellence 2010)
Market leadership in mortgages,
cards, life insurance
and deposits
64%
growth in
commercial lending balances
| | |
| For footnotes, see page 83. |
| |
| The commentary on Hong Kong is on an underlying basis unless stated otherwise. |
Relatively low interest rates and rapid growth in demand from mainland China contributed to Hong Kong’s economic recovery in 2010. GDP in the year was 6.8% higher than in 2009. A revival in both employment and wage growth helped to boost consumer demand. Inflationary pressures began to emerge in the second half of the year with the annual rate of CPI inflation rising to 3.1% in December. The government initiated a number of measures in November aimed at restricting the pace of price increases in the property market.
Our operations in Hong Kong reported pre-tax profits of US$5.7bn compared with US$5.0bn in 2009, an increase of 13%. On an underlying basis, excluding accounting gains arising from the reclassification of Bao Viet as an associate and following the sale of HSBC Private Equity (Asia) Ltd, profit before tax increased by 11%.
The increase in profitability was driven by strong revenue growth, particularly in investment and insurance product sales and trade-related fees, as we capitalised on the improved economic conditions. Lending balances rose, most notably in CMB and GB&M following a recovery in trade flows and strong economic growth. Customer deposit balances increased, reflecting growth in customer numbers in PFS and CMB. Loan impairment charges were significantly lower than in 2009 across all customer groups, reflecting an improvement in credit conditions. Revenue growth was in part offset by an increase in staff and IT costs driven by business expansion to maintain our strong market position.
We retained our market leadership in residential mortgages, credit cards, life insurance and deposits. The Premier customer base increased by 31% compared with 31 December 2009 to more than 500,000 customers. The Advance proposition, which was launched in early 2010, had a customer base of over 670,000 by the end of the year. In life insurance, we retained the number one market share position for new business annualised premiums as a result of successful sales activity and customer demand and a strategy targeted towards the high net worth customer segment. CMB’s cross-border referrals more than doubled with the increase in trade flows from mainland China. We continued the development of offshore renminbi-related products and maintained our position as a market leader for renminbi products in Hong Kong.
56
Report of the Directors: Operating and Financial Review(continued)
Profit/(loss) before tax by customer group and global business
| | | | | | | | | | | | | |
| | | 2010 | | | 2009 | | | 2008 | |
| | | US$m | | | US$m | | | US$m | |
| | | | | | | | | | | | | |
| Personal Financial Services | | | 2,918 | | | | 2,728 | | | | 3,428 | |
| Commercial Banking | | | 1,352 | | | | 956 | | | | 1,315 | |
| Global Banking and Markets | | | 1,430 | | | | 1,507 | | | | 1,436 | |
| Global Private Banking | | | 227 | | | | 197 | | | | 237 | |
| Other | | | (235 | ) | | | (359 | ) | | | (955 | ) |
| | | | | | | |
| | | | | | | | | | | | | |
| | | | 5,692 | | | | 5,029 | | | | 5,461 | |
| | | | | | | |
Net interest incomewas broadly in line with 2009, as strong loan growth was partly offset by lower spreads resulting from competitive pressures and the low interest rate environment. In Balance Sheet Management, net interest income decreased as yield curves flattened, higher yielding positions matured and funds were reinvested at lower rates.
The recovery in trade volumes in 2010 and the pursuit of CMB’s leading international bank for business strategy resulted in significant growth in commercial lending, notably in commercial, industrial and trade related lending. To a lesser extent, growth was also noted in commercial real estate, supported by a buoyant property market. Average personal lending balances also rose, driven by strong growth in residential mortgage lending, where we continued to lend conservatively with average loan-to-value ratios of 55% on new mortgage drawdowns and an estimated 38% on the overall portfolio.
Asset spreads narrowed as a result of competitive pressures, particularly in trade-related lending and HIBOR-linked residential mortgages.
The growth in customer numbers in the Premier proposition in PFS and new-to-bank customers in CMB resulted in increased customer deposits. The benefit of the higher average deposit balances was limited by narrower deposit spreads as interest rates remained at historically low levels.
Net fee incomeincreased by 11%, primarily due to an increase in sales of investment products driven by improved market sentiment and successful sales campaigns, and growth in trade-related fees and income from Payments and Cash Management as volumes improved. Fees from funds under management also grew as a result of higher net inflows and improved fund performance, while underwriting fees rose due to several significant initial public offerings (‘IPO’s) and loan syndications concluded in 2010.
Net trading incomewas 7% higher than in 2009. Increased holdings of debt securities led to a rise in net interest income from trading activities. Foreign exchange revenues benefited from increased turnover due to high levels of client demand. This
was partly offset by lower revenues from Credit trading, following the strong results achieved in 2009 as credit spreads narrowed, and from Rates trading as market volatility reduced in 2010.
Net income from financial instruments designated at fair valuewas US$384m compared with US$784m in 2009. The movement was primarily due to lower revaluation gains in 2010 on assets held to support linked insurance liabilities, where the value of our liabilities to policyholders is determined in line with the value of supporting assets. To the extent that these lower investment gains were attributed to policyholders, there was a corresponding decrease inNet insurance claims incurred and movement in liabilities to policyholders.
Net earned insurance premiumsgrew by 18% to US$4.3bn as successful sales campaigns drove strong growth, particularly in deferred annuity and unit-linked products. A life insurance product targeted at high net worth individuals also performed well. Growth in the insurance business resulted in a related increase in ‘Net insurance claims incurred and movement in liabilities to policyholders’.
Other operating incomeincreased by 21% to US$1.5bn due to an increase in PVIF reflecting higher life insurance sales, partly offset by the non-recurrence of a gain on sale of a property in 2009.
Loan impairment charges and other credit risk provisionsdecreased by 77% to US$114m, reflecting the recovery in economic conditions. Lower specific impairment charges in CMB and GB&M were incurred as credit conditions improved and loan impairment charges fell in PFS, mainly on unsecured lending as unemployment and bankruptcy levels fell.
Operating expensesrose by 12% as the business grew and the economy recovered. Staff costs grew as we recruited in a competitive market and from general wage increases, while bonuses rose in line with the strong business performance. Marketing costs rose notably in PFS due to the launch of several large campaigns, including Advance and credit cards promotions and rising transaction volumes led to higher back office and support costs.
57
Report of the Directors: Operating and Financial Review(continued)
The performance of theHong Kongeconomy proved variable during the course of 2009, with a robust recovery developing after a sharp contraction was recorded during the first quarter of the year. GDP in 2009 fell by 2.7% after growth of 2.1% in 2008. Unemployment rose during the first half of 2009, before falling slightly to end the year at 4.9%, a figure still well below the average of the past 10 years. The CPI profile proved volatile during the course of the year, turning negative between June and August before rising to 1.3% by December 2009, although these movements largely reflected the trends of food and energy prices. The Hong Kong Monetary Authority held the base rates steady at 0.5% throughout the course of the year. Asset price performance proved unusually volatile as the Hang Seng Index recovered strongly from a weak start to 2009 to record a 52% increase during the year.
Our operations in Hong Kong reported pre-tax profits of US$5.0bn compared with US$5.5bn in 2008, an 8% decline on both a reported and an underlying basis.
The decrease in profits came from lower revenue, which resulted from compressed deposit spreads in a near-zero interest rate environment. This loss of revenue was partly offset by significantly lower loan impairment charges and other credit risk provisions during 2009, and a recovery in trade activity triggered by an improvement in regional economic conditions in the second half of the year.
Despite continuing economic challenges, performance remained robust, and was underpinned by our market-leading share in deposits, residential mortgages, cards and insurance. In particular, we consolidated our position as Hong Kong’s leading bancassurer, growing the value of new life insurance business by 38%. In residential mortgages, business growth was combined with conservative loan-to-value ratios on new business.
Net interest incomedeclined by 27% to US$4.2bn, driven by significant deposit spread compression as HIBOR and LIBOR remained low throughout 2009. Selective repricing of customer loans helped to mitigate the impact of lower rates on lending spreads and the continued increase in customer account balances has positioned us to benefit from economic recovery and a resulting widening of deposit spreads.
Average customer lending balances remained broadly in line with 2008, as lower CMB balances, which reflected the reduction in exports in the first half of 2009, were broadly offset by higher lending in PFS and GB&M. As the regional economy rebounded, trade volumes and CMB lending activity increased in the second half of the year. Throughout this challenging period for trade, we continued to support local business through our HK$20bn (US$2.6bn) global loan fund for smaller businesses. These facilities were fully utilised by over 8,600 companies at 31 December 2009.
As residential property prices increased, personal lending volumes rose, and we consolidated our mortgage market share by originating significant volumes of new mortgages. We led this market with a 38% share of new loan drawdowns with an average loan-to-value ratio of 58% on new business. Asset spreads improved as a result of selective risk-based repricing, notably in cards, while funding costs fell in the low interest rate environment.
We continued to increase market share in savings and deposit accounts, and balances grew following a series of deposit acquisition campaigns. In PFS, customer account balances rose by 15% and Premier customer numbers grew to over 380,000. Strong growth in CMB was driven by a rise in customer numbers, also supported by a series of deposit acquisition campaigns and increased liquidity in the region.
Overall, deposit balances grew by 10%. Liability spreads remained under severe pressure throughout 2009, however.
Net fee incomeincreased by 3% with an increase in IPO underwriting fees in the second half of the year, triggered by improved investor sentiment and a recovery in equity markets. PFS customers’ preference for deposit products rather than equity-linked products in the first half of the year reversed as equity markets recovered in the second half of 2009, resulting in a recovery in revenue generated from unit trusts, wealth management, custody and other investment products. Similarly, the increase in trade flows in the second half of 2009 affected trade-related fee income in CMB.
Trading incomeincreased by 2%, primarily due to increased volumes of bond trading and wider margins on market making activities. The non-recurrence of US$0.2bn of write-downs on a legacy monoline exposure also contributed to the rise. Foreign exchange trading revenue decreased from the exceptional results reported in 2008, reflecting the lower market volatility and a decline in customer
57(a)
Report of the Directors: Operating and Financial Review(continued)
volumes. Interest on trading assets declined due to a reduced holding of trading debt securities.
Income of US$0.8bn was generated fromfinancial instruments designated at fair value, compared with an expense of US$1.2bn in 2008. The positive movement in fair value was primarily driven by equity market-related gains in unit-linked insurance products. To the extent that these gains were attributed to policyholders, there was a corresponding increase innet insurance claims incurred and movement in liabilities to policyholders.
Net earned premiumsincreased by 13% to US$3.7bn due to strong sales of both existing and new products, including a life insurance product designed for high net worth individuals, all of which contributed to a rise in market share. The proportion of regular premium policies grew and sales of investment-linked insurance products began to improve in the second half of the year. We retained our market leadership position in the regular-premium individual-life new business. The growth in our insurance business also resulted in higher net insurance claims incurred and movement in liabilities to policyholders.
Gains less losses from financial investmentsmoved from a loss of US$310m to a net gain of US$9m, mainly due to the non-recurrence of impairments against our available-for-sale equity investments following declines in market valuations in 2008. The loss recognised in 2008 on the equity investments concerned was partially recovered in 2009 but this gain was reflected in reserves rather than reversing through the income statement.
Other operating incomeof US$1.3bn was 55% higher than in 2008, reflecting a positive movement in PVIF driven largely by an increase in insurance sales to new customers. We recognised a gain of US$110m in respect of the disposal of a property in Hong Kong.
Loan impairment charges and other credit risk provisionsfell by 35% to US$0.5bn, as the credit environment was more stable in 2009 following deterioration in the second half of 2008. The high level of credit risk provisions and loan impairment charges taken in 2008 against financial institutions and export-led customers moderated in 2009 as credit conditions recovered and international trade volumes improved.
A rise in unemployment and in bankruptcy petitions led to increased impairment charges against unsecured lending in PFS, though bankruptcy levels improved in the second half of the year. Property prices increased during 2009 and mortgage lending remained well secured with conservative loan-to-value ratios and origination subject to tight internal and regulatory guidelines.
Operating expenditurewas held in line with 2008 as higher staff costs were offset by lower general and administrative costs. The increase in staff costs, driven by higher performance-related pay, was partly offset by reduced staff numbers. Non-staff costs fell as marketing expenditure was reduced and operational efficiencies improved as a result of our increased use of direct channels.
57(b)
Report of the Directors: Operating and Financial Review(continued)
Profit/(loss) before tax and balance sheet data – Hong Kong
| | | | | | | | | | | | | | | | | | | | | | | | | | | | | |
| | | 2010 |
| | | Personal | | | | | | | Global | | | Global | | | | | | | Inter- | | | | |
| | | Financial | | | Commercial | | | Banking & | | | Private | | | | | | | segment | | | | |
| | | Services | | | Banking | | | Markets | | | Banking | | | Other | | | elimination | 56 | | Total | |
| | | US$m | | | US$m | | | US$m | | | US$m | | | US$m | | | US$m | | | US$m | |
| | | | | | | | | | | | | | | | | | | | | | | | | | | | | |
Profit/(loss) before tax | | | | | | | | | | | | | | | | | | | | | | | | | | | | |
| | | | | | | | | | | | | | | | | | | | | | | | | | | | | |
| Net interest income/(expense) | | | 2,604 | | | | 1,106 | | | | 915 | | | | 173 | | | | (463 | ) | | | (89 | ) | | | 4,246 | |
| | | | | | | | | | | | | | | | | | | | | | | | | | | | | |
| Net fee income | | | 1,521 | | | | 634 | | | | 630 | | | | 163 | | | | 14 | | | | – | | | | 2,962 | |
| | | | | | | | | | | | | | | | | | | | | | | | | | | | | |
| | | | | | | | | | | | | | | |
| Trading income/(expense) excluding net interest income | | | 197 | | | | 121 | | | | 681 | | | | 120 | | | | (12 | ) | | | – | | | | 1,107 | |
| Net interest income on trading activities | | | 4 | | | | – | | | | 100 | | | | – | | | | 12 | | | | 89 | | | | 205 | |
| | | | | | | | | | | | | | | |
| | | | | | | | | | | | | | | | | | | | | | | | | | | | | |
Net trading income49 | | | 201 | | | | 121 | | | | 781 | | | | 120 | | | | – | | | | 89 | | | | 1,312 | |
| | | | | | | | | | | | | | | | | | | | | | | | | | | | | |
| | | | | | | | | | | | | | | |
| Changes in fair value of long- term debt issued and related derivatives | | | – | | | | – | | | | – | | | | – | | | | (2 | ) | | | – | | | | (2 | ) |
| Net income/(expense) from other financial instruments designated at fair value | | | 328 | | | | (10) | | | | 61 | | | | – | | | | 1 | | | | – | | | | 380 | |
| | | | | | | | | | | | | | | |
| | | | | | | | | | | | | | | | | | | | | | | | | | | | | |
| Net income/(expense) from financial instruments designated at fair value | | | 328 | | | | (10 | ) | | | 61 | | | | – | | | | (1 | ) | | | – | | | | 378 | |
| Gains less losses from financial investments | | | – | | | | – | | | | 56 | | | | 1 | | | | 41 | | | | – | | | | 98 | |
| Dividend income | | | – | | | | 1 | | | | 12 | | | | – | | | | 17 | | | | – | | | | 30 | |
| Net earned insurance premiums | | | 3,655 | | | | 665 | | | | 12 | | | | – | | | | – | | | | – | | | | 4,332 | |
| Other operating income | | | 503 | | | | 68 | | | | 166 | | | | 12 | | | | 1,140 | | | | (283 | ) | | | 1,606 | |
| | | | | | | | | | | | | | | |
| | | | | | | | | | | | | | | | | | | | | | | | | | | | | |
Total operating income | | | 8,812 | | | | 2,585 | | | | 2,633 | | | | 469 | | | | 748 | | | | (283 | ) | | | 14,964 | |
| | | | | | | | | | | | | | | | | | | | | | | | | | | | | |
Net insurance claims57 | | | (4,193 | ) | | | (559 | ) | | | (10 | ) | | | – | | | | – | | | | – | | | | (4,762 | ) |
| | | | | | | | | | | | | | | |
| | | | | | | | | | | | | | | | | | | | | | | | | | | | | |
Net operating income46 | | | 4,619 | | | | 2,026 | | | | 2,623 | | | | 469 | | | | 748 | | | | (283 | ) | | | 10,202 | |
| | | | | | | | | | | | | | | | | | | | | | | | | | | | | |
| Loan impairment charges and other credit risk provisions | | | (76 | ) | | | (28 | ) | | | (10 | ) | | | – | | | | – | | | | – | | | | (114 | ) |
| | | | | | | | | | | | | | | |
| | | | | | | | | | | | | | | | | | | | | | | | | | | | | |
Net operating income | | | 4,543 | | | | 1,998 | | | | 2,613 | | | | 469 | | | | 748 | | | | (283 | ) | | | 10,088 | |
| | | | | | | | | | | | | | | | | | | | | | | | | | | | | |
| Total operating expenses | | | (1,630 | ) | | | (653 | ) | | | (1,187 | ) | | | (242 | ) | | | (1,002 | ) | | | 283 | | | | (4,431 | ) |
| | | | | | | | | | | | | | | |
| | | | | | | | | | | | | | | | | | | | | | | | | | | | | |
Operating profit/(loss) | | | 2,913 | | | | 1,345 | | | | 1,426 | | | | 227 | | | | (254 | ) | | | – | | | | 5,657 | |
| | | | | | | | | | | | | | | | | | | | | | | | | | | | | |
| Share of profit in associates and joint ventures | | | 5 | | | | 7 | | | | 4 | | | | – | | | | 19 | | | | – | | | | 35 | |
| | | | | | | | | | | | | | | |
| | | | | | | | | | | | | | | | | | | | | | | | | | | | | |
Profit/(loss) before tax | | | 2,918 | | | | 1,352 | | | | 1,430 | | | | 227 | | | | (235 | ) | | | – | | | | 5,692 | |
| | | | | | | | | | | | | | | |
| | | | | | | | | | | | | | | | | | | | | | | | | | | | | |
| | | | % | | | | % | | | | % | | | | % | | | | % | | | | | | | | % | |
| Share of HSBC’s profit before tax | | | 15.3 | | | | 7.1 | | | | 7.5 | | | | 1.2 | | | | (1.2 | ) | | | | | | | 29.9 | |
| Cost efficiency ratio | | | 35.3 | | | | 32.2 | | | | 45.3 | | | | 51.6 | | | | 134.0 | | | | | | | | 43.4 | |
| | | | | | | | | | | | | | | | | | | | | | | | | | | | | |
Balance sheet data45 | | | | | | | | | | | | | | | | | | | | | | | | | | | | |
| | | | | | | | | | | | | | | | | | | | | | | | | | | | | |
| | | US$m | | | US$m | | | US$m | | | US$m | | | US$m | | | | | | | US$m | |
| | | | | | | | | | | | | | | | | | | | | | | | | | | | | |
| Loans and advances to customers (net) | | | 50,983 | | | | 48,670 | | | | 34,491 | | | | 4,760 | | | | 1,787 | | | | | | | | 140,691 | |
Total assets61 | | | 76,665 | | | | 55,030 | | | | 223,492 | | | | 20,598 | | | | 62,486 | | | | (8,706 | ) | | | 429,565 | |
| Customer accounts | | | 176,960 | | | | 71,209 | | | | 29,388 | | | | 19,241 | | | | 686 | | | | | | | | 297,484 | |
58
Report of the Directors: Operating and Financial Review(continued)
| | | | | | | | | | | | | | | | | | | | | | | | | | | | | |
| Hong Kong | | 2009 |
| | | Personal | | | | | | | Global | | | Global | | | | | | | Inter- | | | | |
| | | Financial | | | Commercial | | | Banking & | | | Private | | | | | | | segment | | | | |
| | | Services | | | Banking | | | Markets | | | Banking | | | Other | | | elimination | 56 | | Total | |
| | | US$m | | | US$m | | | US$m | | | US$m | | | US$m | | | US$m | | | US$m | |
| | | | | | | | | | | | | | | | | | | | | | | | | | | | | |
Profit/(loss) before tax | | | | | | | | | | | | | | | | | | | | | | | | | | | | |
| | | | | | | | | | | | | | | | | | | | | | | | | | | | | |
| Net interest income/(expense) | | | 2,577 | | | | 938 | | | | 1,150 | | | | 212 | | | | (558 | ) | | | (124 | ) | | | 4,195 | |
| | | | | | | | | | | | | | | | | | | | | | | | | | | | | |
| Net fee income | | | 1,410 | | | | 530 | | | | 563 | | | | 125 | | | | 41 | | | | – | | | | 2,669 | |
| | | | | | | | | | | | | | | | | | | | | | | | | | | | | |
| | | | | | | | | | | | | | | |
| Trading income/(expense) excluding net interest income | | | 186 | | | | 92 | | | | 792 | | | | 91 | | | | (93 | ) | | | – | | | | 1,068 | |
| Net interest income on trading activities | | | 3 | | | | – | | | | 16 | | | | – | | | | 14 | | | | 124 | | | | 157 | |
| | | | | | | | | | | | | | | |
| | | | | | | | | | | | | | | | | | | | | | | | | | | | | |
Net trading income/(expense)49 | | | 189 | | | | 92 | | | | 808 | | | | 91 | | | | (79 | ) | | | 124 | | | | 1,225 | |
| | | | | | | | | | | | | | | | | | | | | | | | | | | | | |
| | | | | | | | | | | | | | | |
| Changes in fair value of long- term debt issued and related derivatives | | | – | | | | – | | | | – | | | | – | | | | (3 | ) | | | – | | | | (3 | ) |
| Net income/(expense) from other financial instruments designated at fair value | | | 707 | | | | (46 | ) | | | 138 | | | | – | | | | (11 | ) | | | – | | | | 788 | |
| | | | | | | | | | | | | | | |
| | | | | | | | | | | | | | | | | | | | | | | | | | | | | |
| Net income/(expense) from financial instruments designated at fair value | | | 707 | | | | (46 | ) | | | 138 | | | | – | | | | (14 | ) | | | – | | | | 785 | |
| Gains less losses from financial investments | | | 80 | | | | 18 | | | | (108 | ) | | | – | | | | 19 | | | | – | | | | 9 | |
| Dividend income | | | 1 | | | | 1 | | | | 10 | | | | – | | | | 16 | | | | – | | | | 28 | |
| Net earned insurance premiums | | | 3,161 | | | | 500 | | | | 13 | | | | – | | | | – | | | | – | | | | 3,674 | |
| Other operating income | | | 346 | | | | 64 | | | | 59 | | | | 10 | | | | 1,062 | | | | (267 | ) | | | 1,274 | |
| | | | | | | | | | | | | | | |
| | | | | | | | | | | | | | | | | | | | | | | | | | | | | |
| Total operating income | | | 8,471 | | | | 2,097 | | | | 2,633 | | | | 438 | | | | 487 | | | | (267 | ) | | | 13,859 | |
| | | | | | | | | | | | | | | | | | | | | | | | | | | | | |
Net insurance claims57 | | | (3,979 | ) | | | (404 | ) | | | (9 | ) | | | – | | | | – | | | | – | | | | (4,392 | ) |
| | | | | | | | | | | | | | | |
| | | | | | | | | | | | | | | | | | | | | | | | | | | | | |
Net operating income46 | | | 4,492 | | | | 1,693 | | | | 2,624 | | | | 438 | | | | 487 | | | | (267 | ) | | | 9,467 | |
| | | | | | | | | | | | | | | | | | | | | | | | | | | | | |
| Loan impairment (charges)/ recoveries and other credit risk provisions | | | (203 | ) | | | (168 | ) | | | (131 | ) | | | 1 | | | | 1 | | | | – | | | | (500 | ) |
| | | | | | | | | | | | | | | |
| | | | | | | | | | | | | | | | | | | | | | | | | | | | | |
| Net operating income | | | 4,289 | | | | 1,525 | | | | 2,493 | | | | 439 | | | | 488 | | | | (267 | ) | | | 8,967 | |
| | | | | | | | | | | | | | | | | | | | | | | | | | | | | |
| Total operating expenses | | | (1,566 | ) | | | (570 | ) | | | (987 | ) | | | (242 | ) | | | (848 | ) | | | 267 | | | | (3,946 | ) |
| | | | | | | | | | | | | | | |
| | | | | | | | | | | | | | | | | | | | | | | | | | | | | |
| Operating profit/(loss) | | | 2,723 | | | | 955 | | | | 1,506 | | | | 197 | | | | (360 | ) | | | – | | | | 5,021 | |
| | | | | | | | | | | | | | | | | | | | | | | | | | | | | |
| Share of profit in associates and joint ventures | | | 5 | | | | 1 | | | | 1 | | | | – | | | | 1 | | | | – | | | | 8 | |
| | | | | | | | | | | | | | | |
| | | | | | | | | | | | | | | | | | | | | | | | | | | | | |
| Profit/(loss) before tax | | | 2,728 | | | | 956 | | | | 1,507 | | | | 197 | | | | (359 | ) | | | – | | | | 5,029 | |
| | | | | | | | | | | | | | | |
| | | | | | | | | | | | | | | | | | | | | | | | | | | | | |
| | | | % | | | | % | | | | % | | | | % | | | | % | | | | | | | | % | |
| | | | | | | | | | | | | | | | | | | | | | | | | | | | | |
| Share of HSBC’s profit before tax | | | 38.5 | | | | 13.5 | | | | 21.3 | | | | 2.8 | | | | (5.1 | ) | | | | | | | 71.0 | |
| Cost efficiency ratio | | | 34.9 | | | | 33.7 | | | | 37.6 | | | | 55.3 | | | | 174.1 | | | | | | | | 41.7 | |
| | | | | | | | | | | | | | | | | | | | | | | | | | | | | |
Balance sheet data45 | | | | | | | | | | | | | | | | | | | | | | | | | | | | |
| | | | | | | | | | | | | | | | | | | | | | | | | | | | | |
| | | US$m | | | US$m | | | US$m | | | US$m | | | US$m | | | | | | | US$m | |
| | | | | | | | | | | | | | | | | | | | | | | | | | | | | |
| Loans and advances to customers (net) | | | 43,869 | | | | 28,217 | | | | 21,991 | | | | 3,361 | | | | 1,943 | | | | | | | | 99,381 | |
Total assets61 | | | 83,497 | | | | 34,743 | | | | 217,146 | | | | 20,353 | | | | 52,508 | | | | (9,004 | ) | | | 399,243 | |
| Customer accounts | | | 166,445 | | | | 62,146 | | | | 26,650 | | | | 19,474 | | | | 726 | | | | | | | | 275,441 | |
59
Report of the Directors: Operating and Financial Review(continued)
| | | | | | | | | | | | | | | | | | | | | | | | | | | | | |
| Hong Kong | | 2008 |
| | | Personal | | | | | | | Global | | | Global | | | | | | | Inter- | | | | |
| | | Financial | | | Commercial | | | Banking & | | | Private | | | | | | | segment | | | | |
| | | Services | | | Banking | | | Markets | | | Banking | | | Other | | | elimination | 56 | | Total | |
| | | US$m | | | US$m | | | US$m | | | US$m | | | US$m | | | US$m | | | US$m | |
| | | | | | | | | | | | | | | | | | | | | | | | | | | | | |
Profit/(loss) before tax | | | | | | | | | | | | | | | | | | | | | | | | | | | | |
| | | | | | | | | | | | | | | | | | | | | | | | | | | | | |
| Net interest income/(expense) | | | 3,381 | | | | 1,498 | | | | 1,524 | | | | 214 | | | | (669 | ) | | | (250 | ) | | | 5,698 | |
| | | | | | | | | | | | | | | | | | | | | | | | | | | | | |
| Net fee income | | | 1,441 | | | | 548 | | | | 414 | | | | 163 | | | | 14 | | | | – | | | | 2,580 | |
| | | | | | | | | | | | | | | | | | | | | | | | | | | | | |
| | | | | | | | | | | | | | | |
| Trading income excluding net interest income | | | 143 | | | | 79 | | | | 483 | | | | 120 | | | | 30 | | | | – | | | | 855 | |
| Net interest/(expense) income on trading activities | | | 11 | | | | 1 | | | | 244 | | | | – | | | | (168 | ) | | | 250 | | | | 338 | |
| | | | | | | | | | | | | | | |
| | | | | | | | | | | | | | | | | | | | | | | | | | | | | |
Net trading income/(expense)49 | | | 154 | | | | 80 | | | | 727 | | | | 120 | | | | (138 | ) | | | 250 | | | | 1,193 | |
| | | | | | | | | | | | | | | | | | | | | | | | | | | | | |
| | | | | | | | | | | | | | | |
| Changes in fair value of long- term debt issued and related derivatives | | | – | | | | – | | | | – | | | | – | | | | 3 | | | | – | | | | 3 | |
| Net income/(expense) from other financial instruments designated at fair value | | | (1,291 | ) | | | (10 | ) | | | 39 | | | | – | | | | 68 | | | | – | | | | (1,194 | ) |
| | | | | | | | | | | | | | | |
| | | | | | | | | | | | | | | | | | | | | | | | | | | | | |
| Net income/(expense) from financial instruments designated at fair value | | | (1,291 | ) | | | (10 | ) | | | 39 | | | | – | | | | 71 | | | | – | | | | (1,191 | ) |
| Gains less losses from financial investments | | | 156 | | | | 32 | | | | (109 | ) | | | – | | | | (388 | ) | | | – | | | | (309 | ) |
| Dividend income | | | 3 | | | | 2 | | | | 17 | | | | – | | | | 19 | | | | – | | | | 41 | |
| Net earned insurance premiums | | | 3,047 | | | | 181 | | | | 17 | | | | – | | | | 2 | | | | – | | | | 3,247 | |
| Other operating income | | | 132 | | | | 38 | | | | 101 | | | | 8 | | | | 906 | | | | (368 | ) | | | 817 | |
| | | | | | | | | | | | | | | |
| | | | | | | | | | | | | | | | | | | | | | | | | | | | | |
| Total operating income | | | 7,023 | | | | 2,369 | | | | 2,730 | | | | 505 | | | | (183 | ) | | | (368 | ) | | | 12,076 | |
| | | | | | | | | | | | | | | | | | | | | | | | | | | | | |
Net insurance claims57 | | | (1,773 | ) | | | (136 | ) | | | (11 | ) | | | – | | | | (2 | ) | | | – | | | | (1,922 | ) |
| | | | | | | | | | | | | | | |
| | | | | | | | | | | | | | | | | | | | | | | | | | | | | |
Net operating income46 | | | 5,250 | | | | 2,233 | | | | 2,719 | | | | 505 | | | | (185 | ) | | | (368 | ) | | | 10,154 | |
| | | | | | | | | | | | | | | | | | | | | | | | | | | | | |
| Loan impairment (charges)/recoveries and other credit risk provisions | | | (134 | ) | | | (335 | ) | | | (284 | ) | | | (13 | ) | | | 1 | | | | – | | | | (765 | ) |
| | | | | | | | | | | | | | | |
| | | | | | | | | | | | | | | | | | | | | | | | | | | | | |
| Net operating income/(expense) | | | 5,116 | | | | 1,898 | | | | 2,435 | | | | 492 | | | | (184 | ) | | | (368 | ) | | | 9,389 | |
| | | | | | | | | | | | | | | | | | | | | | | | | | | | | |
| Total operating expenses | | | (1,691 | ) | | | (584 | ) | | | (1,000 | ) | | | (255 | ) | | | (781 | ) | | | 368 | | | | (3,943 | ) |
| | | | | | | | | | | | | | | |
| | | | | | | | | | | | | | | | | | | | | | | | | | | | | |
| Operating profit/(loss) | | | 3,425 | | | | 1,314 | | | | 1,435 | | | | 237 | | | | (965 | ) | | | – | | | | 5,446 | |
| | | | | | | | | | | | | | | | | | | | | | | | | | | | | |
| Share of profit in associates and joint ventures | | | 3 | | | | 1 | | | | 1 | | | | – | | | | 10 | | | | – | | | | 15 | |
| | | | | | | | | | | | | | | |
| | | | | | | | | | | | | | | | | | | | | | | | | | | | | |
| Profit/(loss) before tax | | | 3,428 | | | | 1,315 | | | | 1,436 | | | | 237 | | | | (955 | ) | | | – | | | | 5,461 | |
| | | | | | | | | | | | | | | |
| | | | | | | | | | | | | | | | | | | | | | | | | | | | | |
| | | | % | | | | % | | | | % | | | | % | | | | % | | | | | | | | % | |
| | | | | | | | | | | | | | | | | | | | | | | | | | | | | |
| Share of HSBC’s profit before tax | | | 36.9 | | | | 14.1 | | | | 15.4 | | | | 2.6 | | | | (10.3 | ) | | | | | | | 58.7 | |
| Cost efficiency ratio | | | 32.2 | | | | 26.2 | | | | 36.8 | | | | 50.5 | | | | (422.2 | ) | | | | | | | 38.8 | |
| | | | | | | | | | | | | | | | | | | | | | | | | | | | | |
Balance sheet data45 | | | | | | | | | | | | | | | | | | | | | | | | | | | | |
| | | | | | | | | | | | | | | | | | | | | | | | | | | | | |
| | | US$m | | | US$m | | | US$m | | | US$m | | | US$m | | | | | | | US$m | |
| | | | | | | | | | | | | | | | | | | | | | | | | | | | | |
| Loans and advances to customers (net) | | | 41,447 | | | | 30,331 | | | | 23,042 | | | | 3,605 | | | | 1,795 | | | | | | | | 100,220 | |
| Total assets | | | 75,419 | | | | 36,428 | | | | 233,187 | | | | 28,800 | | | | 66,192 | | | | (25,542 | ) | | | 414,484 | |
| Customer accounts | | | 145,002 | | | | 54,869 | | | | 30,866 | | | | 19,416 | | | | 364 | | | | | | | | 250,517 | |
| | |
| For footnotes, see page 83. |
59(a)
Report of the Directors: Operating and Financial Review(continued)
Rest of Asia-Pacific
We offer a full suite of banking and financial services in mainland China, mainly through our local subsidiary, HSBC Bank (China) Company Limited. We also participate indirectly in mainland China through our four associates.
Outside Hong Kong and mainland China, we conduct business in 22 countries and territories in the Rest of Asia-Pacific region, primarily through branches and subsidiaries of The Hongkong and Shanghai Banking Corporation, with particularly strong coverage in Australia, India, Indonesia, Malaysia and Singapore.
| | | | | | | | | | | | | |
| | | 2010 | | | 2009 | | | 2008 | |
| | | US$m | | | US$m | | | US$m | |
| | | | | | | | | | | | | |
| Net interest income | | | 3,828 | | | | 3,539 | | | | 3,937 | |
| Net fee income | | | 1,932 | | | | 1,557 | | | | 1,867 | |
| Net trading income | | | 1,618 | | | | 1,606 | | | | 2,042 | |
| Other income | | | 1,854 | | | | 1,301 | | | | 1,135 | |
| | | | | | | |
| | | | | | | | | | | | | |
Net operating income46 | | | 9,232 | | | | 8,003 | | | | 8,981 | |
| | | | | | | | | | | | | |
Impairment charges47 | | | (439 | ) | | | (896 | ) | | | (852 | ) |
| | | | | | | |
| | | | | | | | | | | | | |
Net operating income | | | 8,793 | | | | 7,107 | | | | 8,129 | |
| | | | | | | | | | | | | |
| Total operating expenses | | | (5,143 | ) | | | (4,450 | ) | | | (4,704 | ) |
| | | | | | | |
| | | | | | | | | | | | | |
Operating profit | | | 3,650 | | | | 2,657 | | | | 3,425 | |
| | | | | | | | | | | | | |
Income from associates48 | | | 2,252 | | | | 1,543 | | | | 1,297 | |
| | | | | | | |
| | | | | | | | | | | | | |
Profit before tax | | | 5,902 | | | | 4,200 | | | | 4,722 | |
| | | | | | | |
| | | | | | | | | | | | | |
| Cost efficiency ratio | | | 55.7% | | | | 55.6% | | | | 52.4% | |
| | | | | | | | | | | | | |
| Year-end staff numbers | | | 91,607 | | | | 87,141 | | | | 89,706 | |
41%
growth in reported pre-tax profit
Leadership in renminbi
product development
Significant and growing presence
in mainland China
| | |
| | | For footnotes, see page 83. |
| |
| | | The commentary on Rest of Asia-Pacific is on an underlying basis unless stated otherwise. |
Economic activity accelerated inmainland China, building on the recovery which began in 2009. Annual GDP growth peaked at 11.9% in the first quarter of the year, as resilient domestic demand coincided with an acceleration in export growth as world demand recovered. Investment growth remained strong amid large scale government infrastructure projects and construction of public housing. Meanwhile, consumer spending was boosted by robust growth in employment and wages. In the final months of 2010, inflation became more of a concern, with the annual rate of CPI inflation rising to 4.6% in December. The People’s Bank of China increased the commercial banking sector’s required Statutory Deposit Ratio by 4.5 percentage points to 19.5% (for major banks) and 17.0% (for the rest) and raised the policy rate by 50 basis points over the course of the year. The renminbi exchange rate rose by 3% against the US dollar throughout the course of the year.
Japan’seconomic conditions improved in 2010, led mainly by a recovery in world trade, though unemployment remained at about 5% throughout the year. The Bank of Japan introduced a new programme of monetary stimulus in October 2010, aimed at curbing yen appreciation and reducing the deflationary pressures evident in the economy.
Elsewhere in the region, economies rebounded strongly, with growth in external demand a common feature. Comparing the third quarter of 2010 with the same period in 2009, GDP inTaiwangrew by 9.8%, inSouth Koreaby 4.4% and inIndiaby 8.9%. In the last, concerns emerged over the rate of wholesale price inflation, which rose to 8.4% in December. InSingapore, GDP growth was volatile as activity in the pharmaceutical sector fluctuated, contracting at an annualised rate of nearly 19% in the third quarter but rising 6.9% in the fourth quarter.MalaysianGDP, boosted by private consumption and exports, rose by 5.3% year on year in the third quarter, after surging 10.1% in the first quarter and 8.9% in the second quarter. InThailand, the re-emergence of political risks in the second quarter of 2010 appeared not to dent household consumption or foreign direct investment. Foreign direct investment intoIndonesiaunderpinned GDP growth of 5.8% in the third quarter. The economies of thePhilippinesandVietnamalso grew strongly. InAustraliagrowth was more modest, in part because of a rise in the Reserve Bank of Australia’s interest rate to 4.75% in the second half of the year. Activity in the mining sector continued to grow rapidly.
60
Report of the Directors: Operating and Financial Review(continued)
Profit/(loss) before tax by country within customer groups and global businesses
| | | | | | | | | | | | | | | | | | | | | | | | | |
| | | Personal | | | | | | | Global | | | Global | | | | | | | |
| | | Financial | | | Commercial | | | Banking & | | | Private | | | | | | | |
| | | Services | | | Banking | | | Markets | | | Banking | | | Other | | | Total | |
| | | US$m | | | US$m | | | US$m | | | US$m | | | US$m | | | US$m | |
2010 | | | | | | | | | | | | | | | | | | | | | | | | |
| Australia | | | 59 | | | | 96 | | | | 95 | | | | – | | | | 8 | | | | 258 | |
| India | | | (82 | ) | | | 71 | | | | 507 | | | | 4 | | | | 179 | | | | 679 | |
| Indonesia | | | 12 | | | | 94 | | | | 116 | | | | – | | | | (3 | ) | | | 219 | |
| Japan | | | (76 | ) | | | – | | | | 119 | | | | (1 | ) | | | (6 | ) | | | 36 | |
| Mainland China | | | 839 | | | | 833 | | | | 683 | | | | (7 | ) | | | 217 | | | | 2,565 | |
| | | | | | | | | | | | | |
| Associates | | | 973 | | | | 746 | | | | 443 | | | | – | | | | 188 | | | | 2,350 | |
| Other mainland China | | | (134 | ) | | | 87 | | | | 240 | | | | (7 | ) | | | 29 | | | | 215 | |
| | | | | | | | | | | | | |
| | | | | | | | | | | | | | | | | | | | | | | | | |
| Malaysia | | | 120 | | | | 88 | | | | 194 | | | | – | | | | (1 | ) | | | 401 | |
| Singapore | | | 126 | | | | 87 | | | | 143 | | | | 84 | | | | 84 | | | | 524 | |
| South Korea | | | 2 | | | | (4 | ) | | | 305 | | | | – | | | | 50 | | | | 353 | |
| Taiwan | | | 19 | | | | 36 | | | | 99 | | | | – | | | | (7 | ) | | | 147 | |
| Vietnam | | | (7 | ) | | | 50 | | | | 61 | | | | – | | | | 7 | | | | 111 | |
| Other | | | 54 | | | | 205 | | | | 262 | | | | 1 | | | | 87 | | | | 609 | |
| | | | | | | | | | | | | |
| | | | | | | | | | | | | | | | | | | | | | | | | |
| | | | 1,066 | | | | 1,556 | | | | 2,584 | | | | 81 | | | | 615 | | | | 5,902 | |
| | | | | | | | | | | | | |
| | |
| 2009 | | | | | | | | | | | | | | | | | | | | | | | | |
| Australia | | | 30 | | | | 32 | | | | 140 | | | | – | | | | (4 | ) | | | 198 | |
| India | | | (219 | ) | | | (41 | ) | | | 393 | | | | 1 | | | | 240 | | | | 374 | |
| Indonesia | | | (24 | ) | | | 60 | | | | 129 | | | | – | | | | (11 | ) | | | 154 | |
| Japan | | | (79 | ) | | | – | | | | 65 | | | | (4 | ) | | | 1 | | | | (17 | ) |
| Mainland China | | | 494 | | | | 616 | | | | 479 | | | | (7 | ) | | | 50 | | | | 1,632 | |
| | | | | | | | | | | | | |
| Associates | | | 678 | | | | 558 | | | | 285 | | | | – | | | | – | | | | 1,521 | |
| Other mainland China | | | (184 | ) | | | 58 | | | | 194 | | | | (7 | ) | | | 50 | | | | 111 | |
| | | | | | | | | | | | | |
| | | | | | | | | | | | | | | | | | | | | | | | | |
| Malaysia | | | 88 | | | | 53 | | | | 140 | | | | – | | | | 5 | | | | 286 | |
| Singapore | | | 129 | | | | 77 | | | | 247 | | | | 98 | | | | (9 | ) | | | 542 | |
| South Korea | | | (3 | ) | | | (5 | ) | | | 342 | | | | – | | | | 25 | | | | 359 | |
| Taiwan | | | (3 | ) | | | 65 | | | | 96 | | | | – | | | | 2 | | | | 160 | |
| Vietnam | | | (8 | ) | | | 40 | | | | 63 | | | | – | | | | 6 | | | | 101 | |
| Other | | | 58 | | | | 167 | | | | 225 | | | | 2 | | | | (41 | ) | | | 411 | |
| | | | | | | | | | | | | |
| | | | | | | | | | | | | | | | | | | | | | | | | |
| | | | 463 | | | | 1,064 | | | | 2,319 | | | | 90 | | | | 264 | | | | 4,200 | |
| | | | | | | | | | | | | |
| | | | | | | | | | | | | | | | | | | | | | | | | |
| 2008 | | | | | | | | | | | | | | | | | | | | | | | | |
| Australia | | | 19 | | | | 68 | | | | 102 | | | | – | | | | (13 | ) | | | 176 | |
| India | | | (155 | ) | | | 118 | | | | 578 | | | | 2 | | | | 123 | | | | 666 | |
| Indonesia | | | (22 | ) | | | 17 | | | | 126 | | | | – | | | | – | | | | 121 | |
| Japan | | | (88 | ) | | | (1 | ) | | | 88 | | | | 1 | | | | 4 | | | | 4 | |
| Mainland China | | | 284 | | | | 622 | | | | 688 | | | | (5 | ) | | | 16 | | | | 1,605 | |
| | | | | | | | | | | | | |
| Associates | | | 393 | | | | 558 | | | | 335 | | | | – | | | | – | | | | 1,286 | |
| Other mainland China | | | (109 | ) | | | 64 | | | | 353 | | | | (5 | ) | | | 16 | | | | 319 | |
| | | | | | | | | | | | | |
| | | | | | | | | | | | | | | | | | | | | | | | | |
| Malaysia | | | 94 | | | | 96 | | | | 171 | | | | – | | | | 8 | | | | 369 | |
| Singapore | | | 104 | | | | 83 | | | | 337 | | | | 110 | | | | (37 | ) | | | 597 | |
| South Korea | | | (16 | ) | | | (13 | ) | | | 304 | | | | – | | | | 38 | | | | 313 | |
| Taiwan | | | (41 | ) | | | 45 | | | | 179 | | | | – | | | | (8 | ) | | | 175 | |
| Vietnam | | | (16 | ) | | | 32 | | | | 63 | | | | – | | | | (14 | ) | | | 65 | |
| Other | | | 48 | | | | 168 | | | | 334 | | | | 1 | | | | 80 | | | | 631 | |
| | | | | | | | | | | | | |
| | | | | | | | | | | | | | | | | | | | | | | | | |
| | | | 211 | | | | 1,235 | | | | 2,970 | | | | 109 | | | | 197 | | | | 4,722 | |
| | | | | | | | | | | | | |
61
Report of the Directors: Operating and Financial Review(continued)
Our operations in the Rest of Asia-Pacific region reported pre-tax profits of US$5.9bn compared with US$4.2bn in 2009, an increase of 41%. Reported profits included an accounting gain of US$188m arising from the dilution of HSBC’s shareholding in Ping An Insurance following its issue of share capital to a third party in 2010. On an underlying basis, which excludes this dilution gain, pre-tax profit rose by 29% as business volumes increased across many countries and all customer groups as the economic environment in the region improved.
The economic performance of the region was reflected in a recovery in trade volumes, an increase in our customers’ appetite for investment-related products, strong growth in lending balances and a significant decline in loan impairment charges. All these factors contributed to an increase in our profitability, as did a rise in our share of profit from associates in mainland China. Operating expenses increased to support this business growth.
During 2010 we continued to target growth, particularly in the key regional markets of mainland China, India, Indonesia, Singapore, Malaysia and Australia. We consolidated our position as the leading foreign bank in mainland China with 106 outlets in 27 cities, 16 rural bank outlets and 38 Hang Seng Bank outlets in 13 cities. We maintained our leadership in the development of renminbi products and now have renminbi capabilities in 36 countries across all six continents. In July 2010 we agreed to acquire a substantial part of The Royal Bank of Scotland Group plc’s commercial and retail businesses in India. In Malaysia, four additional Amanah branches were opened.
Our focus on higher value segments was reflected in the Premier customer base in the region which grew by 33% while the Advance proposition was launched in nine markets, exceeding 660,000 customers by the year end. In CMB, we continued to build on our international connectivity, with cross-regional referrals nearly doubling as we pursued our objective to be the leading international business bank.
Net interest incomewas broadly in line with 2009 as strong loan growth was offset by narrower asset spreads in the face of strong competition. Higher average lending balances resulted from business growth in GB&M and CMB across the region, reflecting the recovery in trade activity. Average PFS lending balances also rose, mainly in the mortgage book, most notably in Australia, Singapore and Malaysia, as well as in Taiwan and
mainland China, supported by successful marketing campaigns.
The narrower asset spreads were also the consequence of a shift to lower risk customers following the managed reduction of certain unsecured lending portfolios, particularly in India.
Average customer deposit balances grew, primarily in mainland China, Australia and Singapore as a result of a targeted strategy to expand the customer base.
Balance Sheet Management income declined from 2009 as higher yielding trades matured, interest rates generally remained low and yield curves flattened.
Net fee incomewas 16% higher. An improvement in equity markets and inflows of funds under management drove a significant increase in fee income in GB&M while, in CMB, the recovery in trade activity led to higher trade-related fees and credit facilities. In PFS, fee income also rose from the increased sales of investment and insurance products.
Net trading incomedeclined by 7%, as reduced market volatility led to lower Rates trading income. In India, trading income further declined as gains achieved in 2009 from narrowing bond yields did not recur while in South Korea, lower trading revenues reflected the non-recurrence of one-off gains recognised in 2009. These were partly offset by higher foreign exchange income in mainland China and wider margins in India as a result of strong client volumes in the growing economies and a rise in interest income from trading activities resulting from increased holdings of debt securities.
Net income from financial instruments designated at fair valuefell by US$95m. The movement was due to lower revaluation gains in 2010 than in 2009 on assets held to support insurance contracts. To the extent that these lower investment gains were attributed to policyholders, there was a corresponding decrease in ‘Net insurance claims incurred and movement in liabilities to policyholders’.
Gains less losses from financial investmentswere US$141m compared with losses of US$15m in 2009, as a result of a gain on disposal of an equity investment in a Singaporean property company and gains on sales of other available-for-sale investments. Impairments reported in 2009 did not recur in 2010.
Other operating incomeincreased by 8% to US$1.4bn, largely due to an increase in PVIF,
62
Report of the Directors: Operating and Financial Review(continued)
reflecting higher life insurance sales in the region and recoveries against initial fair value on loan portfolios acquired with Bank Ekonomi in Indonesia and from The Chinese Bank Co., Ltd in Taiwan.
Net earned insurance premiumsincreased by 15% to US$448m, largely due to higher sales in Malaysia, Taiwan and mainland China, primarily from successful product launches and marketing campaigns.
Growth in the insurance business resulted in a related increase inNet insurance claims incurred and movement in liabilities to policyholderswhich was more than offset by the decrease corresponding to the lower investment gains reported above in ‘Net income from financial instruments designated at fair value’.
Loan impairment charges and other credit risk provisionsdecreased by 55% to US$439m. As economic and credit conditions improved across the region, loan impairment charges fell in PFS, most notably in India as certain unsecured lending portfolios were managed down, and fewer specific impairments were recognised in CMB. Partly offsetting this
improvement were specific impairment charges booked in GB&M.
Operating expensesincreased by 8% to US$5.1bn in support of business growth and to capitalise on the region’s economic recovery. Examples were the continuing expansion of the branch network in mainland China and the opening of the new headquarters building in Shanghai, as well as local incorporation and expansion of the Taiwan operations. Staff numbers rose to support business expansion, particularly in the key regional markets of mainland China, Australia, Singapore and Indonesia. Business initiatives were supported by marketing campaigns in most markets and higher transaction volumes which led to increased processing costs.
Share of profit from associates and joint venturesin the region increased by 45%, with a higher contribution from Ping An Insurance driven by strong sales growth. The share of profit from Bank of Communications also increased due to growth in lending and higher fee income from cards, wealth management and settlement activity. Growth in lending and an increase in fee income led to a higher contribution from Industrial Bank.
63
Report of the Directors: Operating and Financial Review(continued)
Growth inmainland Chinaaccelerated throughout the course of the year as the government’s fiscal stimulus package helped offset weak levels of demand within key export markets. Overall GDP growth totalled 8.7% in 2009, down from 9.6% in 2008, although on a quarterly basis the annual rate of growth rose to a very high 10.7% in the final three months of the year. Industrial production also gathered momentum as the year progressed, while very strong levels of bank lending growth helped fixed asset investment expenditure to maintain a rapid pace of expansion throughout 2009. Consumer spending remained robust, with retail sales rising by 17.5% in the year. The annual CPI rate was negative throughout much of 2009, largely reflecting the earlier movements in food and energy prices, before accelerating to 1.9% in December 2009. The renminbi exchange rate was little changed against the US dollar throughout the course of the year.
Economic conditions proved difficult inJapanduring 2009, although some signs of stabilisation did emerge following an extremely weak start to the year. First quarter GDP fell by 3.2% on a quarter-on-quarter basis, before gains of 1.3%, zero and 1.1% were recorded in the next three quarters, respectively. The unemployment rate rose from 4.3% in December 2008 to a record high of 5.7% in July 2009, before declining to finish the year at 5.1%. The Bank of Japan introduced a range of initiatives in January 2009 with the intention of improving financing conditions across the corporate sector, while fiscal stimulus packages were also implemented.
Elsewhere in Asia, most economies experienced a further year of uneven growth in 2009. Sharp economic contractions proved commonplace across the region during the early months of 2009 before economic recovery began, often helped by an aggressive loosening of both monetary and fiscal policy. Such trends were particularly evident inSingaporewhere, following a very weak start to 2009, a rapid rate of expansion was recorded during the second quarter, although GDP growth fell back into negative territory during the final months of the year. Growth proved much more stable inIndia, with GDP rising by 6.3% in the first three quarters of the fiscal year 2009/10 following a 5.7% expansion in the same period in 2008/09, helped by an aggressive reduction in interest rates and a sharp increase in government expenditure. Although growth slowed in 2009 inIndonesia, the 4.5% increase in GDP and the relative stability of growth
left the country as one of the region’s better performers. Economic conditions proved very weak during the early months of 2009 inMalaysiaas first quarter GDP fell by 6.2% on the same period in 2008, but a strong recovery, helped by an improvement in regional trade activity and a domestic stimulus package, placed fourth quarter GDP some 4.5% above the comparable figure from a year earlier. A recovery in both exports and domestic demand helped theSouth Koreaneconomy to record a strong recovery from a very weak start to 2009, with GDP increasing slightly by 0.2% for the full year, following a 2.2% increase during 2008. Increased public expenditure helped thePhilippines economy to return to growth following a weak start to 2009, with full year growth of 0.9% being recorded, down from 3.8% in 2008.Taiwan’seconomy proved particularly vulnerable to the sharp fall in global trade activity during the early months of 2009, although the year-on-year rate of decline in GDP moderated as 2009 progressed, thanks in part to a recovery in consumer expenditure around the middle of the year. A substantial fiscal stimulus package inVietnamcontributed to improved growth momentum during the first half of 2009, although concerns over the deterioration in the trade position led to a devaluation of the currency and a tightening of monetary policy during the final weeks of the year. Full year 2009 GDP growth slowed slightly to 5.3% from 6.2% in 2008.
Our operations in the Rest of Asia-Pacific region reported a pre-tax profit of US$4.2bn compared with US$4.7bn in 2008, a decline of 11% or 8% on an underlying basis. The decline in regional performance was primarily attributable to the challenging economic conditions which resulted in deposit spread compression, lower fee income and credit quality deterioration.
During 2009, we continued to build our presence in the region through organic growth, the acquisition of Bank Ekonomi, and strategic investments. The purchase of Bank Ekonomi nearly doubled our presence in Indonesia to over 200 outlets in 27 cities. We became the first foreign bank to incorporate locally in Vietnam in January 2009, creating the opportunity to widen the product range and increase distribution channels to customers. The integration of IL&FS Investsmart, subsequently rebranded to HSBC InvestDirect, has strengthened our network in India, allowing us to offer wealth management products through over 200 additional outlets. Building our mainland China business and renminbi capabilities continued to be a key focus, as
63(a)
Report of the Directors: Operating and Financial Review(continued)
demonstrated by the opening of onshore renminbi accounts in mainland China and the launch of renminbi trade settlement in seven ASEAN countries. 19 new HSBC branded outlets were opened in mainland China in 2009, as well as eight additional rural bank outlets and four new Hang Seng Bank branches, consolidating our position as the leading foreign bank in the country. We also launched a new jointly-owned life insurance company in mainland China, and announced the intention to establish a new cards joint venture with Bank of Communications to which over 11m cards in force will be transferred. In insurance, we expanded our regional coverage and increased our stake in Bao Viet in January 2010, allowing it to extend its position in the Vietnamese market.
Net interest incomedeclined by 8% to US$3.5bn, driven by deposit spread compression in the low interest rate environment and a decline in lending balances. This was partly offset by asset repricing, particularly in CMB.
Average lending balances fell in GB&M and CMB as a result of lower demand for financing as international trade volumes declined, especially in the first half of the year. Growth returned in the second half of the year as the volume of trade activity improved.
Customer deposits grew compared with 2008. PFS continued to successfully attract deposits and the acquisition of Premier customers was strong with the region growing customer numbers by 35% to over 580,000. Payments and cash management was adversely affected by the low interest rate environment.
Net fee incomewas 13% lower than in 2008, driven by a decline in income from funds under management and global custody. Fees from funds under management in Singapore, Japan and Taiwan declined as a result of weak investor sentiment and lower fee margins as customers moved away from equity investment products though, in the latter part of the year, an improvement in equity markets drove a recovery in our investment-related fee income. In India, tightened credit criteria resulted in lower fees from the card business. By contrast, trade services and cash management increased in a number of countries, and we took various steps to capture cross-border business and continued to benefit from our international business reach. Significant cross-border referral growth was seen in Greater China where numbers rose compared with 2008.
Net trading incomedeclined by 16%, as the fall in interest rates reduced net interest income from trading activities. Foreign exchange and Rates
trading income also declined across the region, reflecting relatively low market volatility, though Credit trading performance was strong, particularly in mainland China, Japan and Singapore. In mainland China, the decline in Rates income resulted from losses on bond positions following an upward shift in yields. However, in South Korea, revenue increased as opportunities arose from market-making and client hedging activities.
Net income fromfinancial instruments designated at fair valueof US$110m was recorded compared with a net expense of US$171m in 2008. This was primarily attributable to equity market-related gains on unit-linked insurance products and was largely offset by a corresponding increase in liabilities to policyholders reflected in net insurance claims incurred and movement in liabilities to policyholders.
Net earned insurance premiumsincreased by 91% to US$365m. Sales growth was particularly strong in Singapore following the launch of new products, including a life insurance product designed for high net worth individuals and a single premium guaranteed saver product. Growth in insurance business resulted in highernet insurance claims incurred and movement in liabilities to policyholders.
Loan impairment charges and other credit risk provisionsrose by 9% compared with 2008 as credit quality deteriorated in India.
In PFS, loan impairment charges rose by 9% to US$649m, primarily due to rising delinquencies in our unsecured consumer lending businesses in India and Indonesia. In India, a challenging credit environment and high delinquency rates contributed to increased loan impairment charges in personal loans, consumer finance and mortgages. The delinquencies in India began to moderate in the second half of 2009 as the measures we had implemented in the second half of 2008 to mitigate loan losses, including ceasing consumer finance loan origination and tightening lending criteria on other unsecured lending products, began to take effect. As a result, loan impairment charges against cards remained broadly in line with 2008. In CMB, significant deterioration was experienced in India in the first half of 2009. The loan impairment charges across the region improved in the second half of 2009 with credit quality stabilising as a result of support from the governments’ various economic stimulus initiatives, together with improved liquidity and actions taken by our customers to adjust in difficult times. Notwithstanding the improvement
63(b)
Report of the Directors: Operating and Financial Review(continued)
towards the end of the year, we continue to closely monitor portfolios for signs of weakness.
Operating expenditurewas broadly in line with 2008. Tight cost control resulted in lower administrative costs and marketing expenditure. Staff costs fell due to lower performance-related costs and a decrease in staff numbers. These were broadly offset by expenditure to support the ongoing development of infrastructure in the region, including branch expansion in mainland China, Vietnam and Malaysia and integration and development costs related to HSBC InvestDirect and the operations of The Chinese Bank Co., Ltd (‘The Chinese Bank’) in Taiwan.
In an effort to improve operational efficiencies and reduce costs, an increased number of transactions were completed through direct channels, including internet banking, telephone services and self-service machines compared with 2008.
Operating expenses within the Group Service and Software Development Centres rose by 9% as the number of migrated activities and processes increased in accordance with our global resourcing strategy to develop centres of excellence. All related costs are recharged to other Group entities and the income from these recharges is reported withinother operating income.
Profit from associates and joint venturesin the region was 17% higher as a result of the non-recurrence of Ping An Insurance’s impairment of its investment in Fortis in 2008, and an increase in new business sales and investment returns which were boosted by a recovery in equity markets. Income from Bank of Communications remained in line with 2008.
63(c)
Report of the Directors: Operating and Financial Review(continued)
Profit before tax and balance sheet data – Rest of Asia-Pacific
| | | | | | | | | | | | | | | | | | | | | | | | | | | | | |
| | | 2010 |
| | | Personal | | | | | | | Global | | | Global | | | | | | | Inter- | | | | |
| | | Financial | | | Commercial | | | Banking & | | | Private | | | | | | | segment | | | | |
| | | Services | | | Banking | | | Markets | | | Banking | | | Other | | | elimination | 56 | | Total | |
| | | US$m | | | US$m | | | US$m | | | US$m | | | US$m | | | US$m | | | US$m | |
| | | | | | | | | | | | | | | | | | | | | | | | | | | | | |
Profit before tax | | | | | | | | | | | | | | | | | | | | | | | | | | | | |
| | | | | | | | | | | | | | | | | | | | | | | | | | | | | |
| Net interest income | | | 1,581 | | | | 938 | | | | 1,435 | | | | 91 | | | | 55 | | | | (272 | ) | | | 3,828 | |
| | | | | | | | | | | | | | | | | | | | | | | | | | | | | |
| Net fee income/(expense) | | | 668 | | | | 442 | | | | 777 | | | | 55 | | | | (10 | ) | | | – | | | | 1,932 | |
| | | | | | | | | | | | | | | | | | | | | | | | | | | | | |
| | | | | | | | | | | | | | | |
| Trading income/(expense) excluding net interest income | | | 81 | | | | 129 | | | | 966 | | | | 69 | | | | (38 | ) | | | – | | | | 1,207 | |
| Net interest income on trading activities | | | – | | | | – | | | | 138 | | | | – | | | | 1 | | | | 272 | | | | 411 | |
| | | | | | | | | | | | | | | |
Net trading income/(expense)49 | | | 81 | | | | 129 | | | | 1,104 | | | | 69 | | | | (37 | ) | | | 272 | | | | 1,618 | |
| | | | | | | | | | | | | | | | | | | | | | | | | | | | | |
| | | | | | | | | | | | | | | |
| Changes in fair value of long-term debt issued and related derivatives | | | – | | | | – | | | | – | | | | – | | | | (2 | ) | | | – | | | | (2 | ) |
| Net income/(expense) from other financial instruments designated at fair value | | | 41 | | | | 2 | | | | (1 | ) | | | – | | | | (16 | ) | | | – | | | | 26 | |
| | | | | | | | | | | | | | | |
| | | | | | | | | | | | | | | | | | | | | | | | | | | | | |
| Net income/(expense) from financial instruments designated at fair value | | | 41 | | | | 2 | | | | (1 | ) | | | – | | | | (18 | ) | | | – | | | | 24 | |
| Gains less losses from financial investments | | | 1 | | | | 3 | | | | 50 | | | | – | | | | 92 | | | | – | | | | 146 | |
| Dividend income | | | – | | | | – | | | | 1 | | | | – | | | | – | | | | – | | | | 1 | |
| Net earned insurance premiums | | | 386 | | | | 62 | | | | – | | | | – | | | | – | | | | – | | | | 448 | |
| Other operating income | | | 108 | | | | 86 | | | | 56 | | | | 1 | | | | 1,499 | | | | (152 | ) | | | 1,598 | |
| | | | | | | | | | | | | | | |
| | | | | | | | | | | | | | | | | | | | | | | | | | | | | |
Total operating income | | | 2,866 | | | | 1,662 | | | | 3,422 | | | | 216 | | | | 1,581 | | | | (152 | ) | | | 9,595 | |
| | | | | | | | | | | | | | | | | | | | | | | | | | | | | |
Net insurance claims57 | | | (324 | ) | | | (39 | ) | | | – | | | | – | | | | – | | | | – | | | | (363 | ) |
| | | | | | | | | | | | | | | |
| | | | | | | | | | | | | | | | | | | | | | | | | | | | | |
Net operating income46 | | | 2,542 | | | | 1,623 | | | | 3,422 | | | | 216 | | | | 1,581 | | | | (152 | ) | | | 9,232 | |
| | | | | | | | | | | | | | | | | | | | | | | | | | | | | |
| Loan impairment charges and other credit risk provisions | | | (298 | ) | | | (19 | ) | | | (122 | ) | | | – | | | | – | | | | – | | | | (439 | ) |
| | | | | | | | | | | | | | | |
| | | | | | | | | | | | | | | | | | | | | | | | | | | | | |
Net operating income | | | 2,244 | | | | 1,604 | | | | 3,300 | | | | 216 | | | | 1,581 | | | | (152 | ) | | | 8,793 | |
| | | | | | | | | | | | | | | | | | | | | | | | | | | | | |
| Total operating expenses | | | (2,164 | ) | | | (799 | ) | | | (1,163 | ) | | | (135 | ) | | | (1,034 | ) | | | 152 | | | | (5,143 | ) |
| | | | | | | | | | | | | | | |
| | | | | | | | | | | | | | | | | | | | | | | | | | | | | |
Operating profit | | | 80 | | | | 805 | | | | 2,137 | | | | 81 | | | | 547 | | | | – | | | | 3,650 | |
| | | | | | | | | | | | | | | | | | | | | | | | | | | | | |
| Share of profit in associates and joint ventures | | | 986 | | | | 751 | | | | 447 | | | | – | | | | 68 | | | | – | | | | 2,252 | |
| | | | | | | | | | | | | | | |
| | | | | | | | | | | | | | | | | | | | | | | | | | | | | |
Profit before tax | | | 1,066 | | | | 1,556 | | | | 2,584 | | | | 81 | | | | 615 | | | | – | | | | 5,902 | |
| | | | | | | | | | | | | | | |
| | | | | | | | | | | | | | | | | | | | | | | | | | | | | |
| | | % | | | % | | | % | | | % | | | % | | | | | | | % | |
| | | |
| Share of HSBC’s profit before tax | | | 5.6 | | | | 8.2 | | | | 13.6 | | | | 0.4 | | | | 3.2 | | | | | | | | 31.0 | |
| Cost efficiency ratio | | | 85.1 | | | | 49.2 | | | | 34.0 | | | | 62.5 | | | | 65.4 | | | | | | | | 55.7 | |
| | | | | | | | | | | | | | | | | | | | | | | | | | | | | |
Balance sheet data45 | | | | | | | | | | | | | | | | | | | | | | | | | | | | |
| | | | | | | | | | | | | | | | | | | | | | | | | | | | | |
| | | US$m | | | US$m | | | US$m | | | US$m | | | US$m | | | | | | | US$m | |
| | | |
| Loans and advances to customers (net) | | | 37,831 | | | | 31,423 | | | | 35,810 | | | | 3,489 | | | | 178 | | | | | | | | 108,731 | |
| Total assets | | | 49,508 | | | | 41,588 | | | | 166,960 | | | | 12,126 | | | | 19,450 | | | | (11,570 | ) | | | 278,062 | |
| Customer accounts | | | 54,741 | | | | 36,943 | | | | 53,752 | | | | 12,620 | | | | 99 | | | | | | | | 158,155 | |
64
Report of the Directors: Operating and Financial Review(continued)
| | | | | | | | | | | | | | | | | | | | | | | | | | | | | |
| Rest of Asia-Pacific | | 2009 |
| | | Personal | | | | | | | Global | | | Global | | | | | | | Inter- | | | | |
| | | Financial | | | Commercial | | | Banking & | | | Private | | | | | | | segment | | | | |
| | | Services | | | Banking | | | Markets | | | Banking | | | Other | | | elimination | 56 | | Total | |
| | | US$m | | | US$m | | | US$m | | | US$m | | | US$m | | | US$m | | | US$m | |
| | | | | | | | | | | | | | | | | | | | | | | | | | | | | |
Profit before tax | | | | | | | | | | | | | | | | | | | | | | | | | | | | |
| | | | | | | | | | | | | | | | | | | | | | | | | | | | | |
| Net interest income | | | 1,493 | | | | 807 | | | | 1,174 | | | | 115 | | | | 91 | | | | (141 | ) | | | 3,539 | |
| | | | | | | | | | | | | | | | | | | | | | | | | | | | | |
| Net fee income/(expense) | | | 554 | | | | 331 | | | | 636 | | | | 55 | | | | (19 | ) | | | – | | | | 1,557 | |
| | | | | | | | | | | | | | | | | | | | | | | | | | | | | |
| | | | | | | | | | | | | | | |
| Trading income/(expense) excluding net interest income | | | 80 | | | | 134 | | | | 1,013 | | | | 55 | | | | (18 | ) | | | – | | | | 1,264 | |
| Net interest income/(expense) on trading activities | | | (1 | ) | | | – | | | | 202 | | | | – | | | | – | | | | 141 | | | | 342 | |
| | | | | | | | | | | | | | | |
| | | | | | | | | | | | | | | | | | | | | | | | | | | | | |
Net trading income/(expense)49 | | | 79 | | | | 134 | | | | 1,215 | | | | 55 | | | | (18 | ) | | | 141 | | | | 1,606 | |
| | | | | | | | | | | | | | | | | | | | | | | | | | | | | |
| | | | | | | | | | | | | | | |
| Changes in fair value of long-term debt issued and related derivatives | | | – | | | | – | | | | – | | | | – | | | | (1 | ) | | | – | | | | (1 | ) |
| Net income/(expense) from other financial instruments designated at fair value | | | 110 | | | | 1 | | | | (2 | ) | | | – | | | | 2 | | | | – | | | | 111 | |
| | | | | | | | | | | | | | | |
| | | | | | | | | | | | | | | | | | | | | | | | | | | | | |
| Net income/(expense) from financial instruments designated at fair value | | | 110 | | | | 1 | | | | (2 | ) | | | – | | | | 1 | | | | – | | | | 110 | |
| Gains less losses from financial investments | | | 5 | | | | 2 | | | | (7 | ) | | | – | | | | (19 | ) | | | – | | | | (19 | ) |
| Dividend income | | | – | | | | – | | | | 1 | | | | – | | | | 1 | | | | – | | | | 2 | |
| Net earned insurance premiums | | | 337 | | | | 28 | | | | – | | | | – | | | | – | | | | – | | | | 365 | |
| Other operating income/(expense) | | | 67 | | | | 66 | | | | 41 | | | | (2 | ) | | | 1,200 | | | | (134 | ) | | | 1,238 | |
| | | | | | | | | | | | | | | |
| | | | | | | | | | | | | | | | | | | | | | | | | | | | | |
| Total operating income | | | 2,645 | | | | 1,369 | | | | 3,058 | | | | 223 | | | | 1,237 | | | | (134 | ) | | | 8,398 | |
| | | | | | | | | | | | | | | | | | | | | | | | | | | | | |
Net insurance claims57 | | | (380 | ) | | | (15 | ) | | | – | | | | – | | | | – | | | | – | | | | (395 | ) |
| | | | | | | | | | | | | | | |
| | | | | | | | | | | | | | | | | | | | | | | | | | | | | |
Net operating income46 | | | 2,265 | | | | 1,354 | | | | 3,058 | | | | 223 | | | | 1,237 | | | | (134 | ) | | | 8,003 | |
| | | | | | | | | | | | | | | | | | | | | | | | | | | | | |
| Loan impairment charges and other credit risk provisions | | | (649 | ) | | | (221 | ) | | | (23 | ) | | | (2 | ) | | | (1 | ) | | | – | | | | (896 | ) |
| | | | | | | | | | | | | | | |
| | | | | | | | | | | | | | | | | | | | | | | | | | | | | |
| Net operating income | | | 1,616 | | | | 1,133 | | | | 3,035 | | | | 221 | | | | 1,236 | | | | (134 | ) | | | 7,107 | |
| | | | | | | | | | | | | | | | | | | | | | | | | | | | | |
| Total operating expenses | | | (1,839 | ) | | | (636 | ) | | | (1,006 | ) | | | (131 | ) | | | (972 | ) | | | 134 | | | | (4,450 | ) |
| | | | | | | | | | | | | | | |
| | | | | | | | | | | | | | | | | | | | | | | | | | | | | |
| Operating profit/(loss) | | | (223 | ) | | | 497 | | | | 2,029 | | | | 90 | | | | 264 | | | | – | | | | 2,657 | |
| | | | | | | | | | | | | | | | | | | | | | | | | | | | | |
| Share of profit in associates and joint ventures | | | 686 | | | | 567 | | | | 290 | | | | – | | | | – | | | | – | | | | 1,543 | |
| | | | | | | | | | | | | | | |
| | | | | | | | | | | | | | | | | | | | | | | | | | | | | |
| Profit before tax | | | 463 | | | | 1,064 | | | | 2,319 | | | | 90 | | | | 264 | | | | – | | | | 4,200 | |
| | | | | | | | | | | | | | | |
| | | | | | | | | | | | | | | | | | | | | | | | | | | | | |
| | | | | | | | | | | | | | | | | | | | | | | | | | | | | |
| | | % | | | % | | | % | | | % | | | % | | | | | | | % | |
| |
| Share of HSBC’s profit before tax | | | 6.5 | | | | 15.0 | | | | 32.8 | | | | 1.3 | | | | 3.7 | | | | | | | | 59.3 | |
| Cost efficiency ratio | | | 81.2 | | | | 47.0 | | | | 32.9 | | | | 58.7 | | | | 78.6 | | | | | | | | 55.6 | |
| | | | | | | | | | | | | | | | | | | | | | | | | | | | | |
Balance sheet data45 | | | | | | | | | | | | | | | | | | | | | | | | | | | | |
| | | | | | | | | | | | | | | | | | | | | | | | | | | | | |
| | | US$m | | | US$m | | | US$m | | | US$m | | | US$m | | | | | | | US$m | |
| |
| Loans and advances to customers (net) | | | 30,433 | | | | 22,595 | | | | 23,989 | | | | 2,834 | | | | 192 | | | | | | | | 80,043 | |
| Total assets | | | 40,266 | | | | 31,221 | | | | 138,884 | | | | 11,928 | | | | 7,160 | | | | (7,320 | ) | | | 222,139 | |
| Customer accounts | | | 47,573 | | | | 30,196 | | | | 43,698 | | | | 12,496 | | | | 36 | | | | | | | | 133,999 | |
65
Report of the Directors: Operating and Financial Review(continued)
| | | | | | | | | | | | | | | | | | | | | | | | | | | | | |
| Rest of Asia-Pacific | | 2008 |
| | | Personal | | | | | | | Global | | | Global | | | | | | | Inter- | | | | |
| | | Financial | | | Commercial | | | Banking & | | | Private | | | | | | | segment | | | | |
| | | Services | | | Banking | | | Markets | | | Banking | | | Other | | | elimination | 56 | | Total | |
| | | US$m | | | US$m | | | US$m | | | US$m | | | US$m | | | US$m | | | US$m | |
| | | | | | | | | | | | | | | | | | | | | | | | | | | | | |
Profit before tax | | | | | | | | | | | | | | | | | | | | | | | | | | | | |
| | | | | | | | | | | | | | | | | | | | | | | | | | | | | |
| Net interest income | | | 1,708 | | | | 934 | | | | 1,524 | | | | 103 | | | | 139 | | | | (471 | ) | | | 3,937 | |
| | | | | | | | | | | | | | | | | | | | | | | | | | | | | |
| Net fee income | | | 592 | | | | 356 | | | | 831 | | | | 71 | | | | 17 | | | | – | | | | 1,867 | |
| | | | | | | | | | | | | | | | | | | | | | | | | | | | | |
| | | | | | | | | | | | | | | |
| Trading income/(expense) excluding net interest income | | | 65 | | | | 122 | | | | 1,233 | | | | 77 | | | | (54 | ) | | | – | | | | 1,443 | |
| Net interest income/(expense) on trading activities | | | (5 | ) | | | – | | | | 123 | | | | – | | | | 10 | | | | 471 | | | | 599 | |
| | | | | | | | | | | | | | | |
| | | | | | | | | | | | | | | | | | | | | | | | | | | | | |
Net trading income/(expense)49 | | | 60 | | | | 122 | | | | 1,356 | | | | 77 | | | | (44 | ) | | | 471 | | | | 2,042 | |
| | | | | | | | | | | | | | | | | | | | | | | | | | | | | |
| | | | | | | | | | | | | | | |
| Changes in fair value of long-term debt issued and related derivatives | | | – | | | | – | | | | – | | | | – | | | | 1 | | | | – | | | | 1 | |
| Net income/(expense) from other financial instruments designated at fair value | | | (172 | ) | | | – | | | | (4 | ) | | | – | | | | 4 | | | | – | | | | (172 | ) |
| | | | | | | | | | | | | | | |
| | | | | | | | | | | | | | | | | | | | | | | | | | | | | |
| Net income/(expense) from financial instruments designated at fair value | | | (172 | ) | | | – | | | | (4 | ) | | | – | | | | 5 | | | | – | | | | (171 | ) |
| Gains less losses from financial investments | | | 15 | | | | 3 | | | | 6 | | | | – | | | | – | | | | – | | | | 24 | |
| Dividend income | | | – | | | | – | | | | 2 | | | | – | | | | – | | | | – | | | | 2 | |
| Net earned insurance premiums | | | 172 | | | | 25 | | | | – | | | | – | | | | – | | | | – | | | | 197 | |
| Other operating income/ (expense) | | | 58 | | | | 76 | | | | 79 | | | | (1 | ) | | | 1,070 | | | | (227 | ) | | | 1,055 | |
| | | | | | | | | | | | | | | |
| | | | | | | | | | | | | | | | | | | | | | | | | | | | | |
| Total operating income | | | 2,433 | | | | 1,516 | | | | 3,794 | | | | 250 | | | | 1,187 | | | | (227 | ) | | | 8,953 | |
| | | | | | | | | | | | | | | | | | | | | | | | | | | | | |
Net insurance claims57 | | | 42 | | | | (14 | ) | | | – | | | | – | | | | – | | | | – | | | | 28 | |
| | | | | | | | | | | | | | | |
| | | | | | | | | | | | | | | | | | | | | | | | | | | | | |
Net operating income46 | | | 2,475 | | | | 1,502 | | | | 3,794 | | | | 250 | | | | 1,187 | | | | (227 | ) | | | 8,981 | |
| | | | | | | | | | | | | | | | | | | | | | | | | | | | | |
| Loan impairment charges and other credit risk provisions | | | (640 | ) | | | (137 | ) | | | (73 | ) | | | (1 | ) | | | (1 | ) | | | – | | | | (852 | ) |
| | | | | | | | | | | | | | | |
| | | | | | | | | | | | | | | | | | | | | | | | | | | | | |
| Net operating income | | | 1,835 | | | | 1,365 | | | | 3,721 | | | | 249 | | | | 1,186 | | | | (227 | ) | | | 8,129 | |
| | | | | | | | | | | | | | | | | | | | | | | | | | | | | |
| Total operating expenses | | | (2,016 | ) | | | (689 | ) | | | (1,086 | ) | | | (140 | ) | | | (1,000 | ) | | | 227 | | | | (4,704 | ) |
| | | | | | | | | | | | | | | |
| | | | | | | | | | | | | | | | | | | | | | | | | | | | | |
| Operating profit/(loss) | | | (181 | ) | | | 676 | | | | 2,635 | | | | 109 | | | | 186 | | | | – | | | | 3,425 | |
| | | | | | | | | | | | | | | | | | | | | | | | | | | | | |
| Share of profit in associates and joint ventures | | | 392 | | | | 559 | | | | 335 | | | | – | | | | 11 | | | | – | | | | 1,297 | |
| | | | | | | | | | | | | | | |
| | | | | | | | | | | | | | | | | | | | | | | | | | | | | |
| Profit before tax | | | 211 | | | | 1,235 | | | | 2,970 | | | | 109 | | | | 197 | | | | – | | | | 4,722 | |
| | | | | | | | | | | | | | | |
| | | | | | | | | | | | | | | | | | | | | | | | | | | | | |
| | | % | | | % | | | % | | | % | | | % | | | | | | | % | |
| |
| Share of HSBC’s profit before tax | | | 2.3 | | | | 13.3 | | | | 31.9 | | | | 1.2 | | | | 2.0 | | | | | | | | 50.7 | |
| Cost efficiency ratio | | | 81.5 | | | | 45.9 | | | | 28.6 | | | | 56.0 | | | | 84.2 | | | | | | | | 52.4 | |
| | | | | | | | | | | | | | | | | | | | | | | | | | | | | |
Balance sheet data45 | | | | | | | | | | | | | | | | | | | | | | | | | | | | |
| | | US$m | | | US$m | | | US$m | | | US$m | | | US$m | | | | | | | US$m | |
| |
| Loans and advances to customers (net) | | | 27,634 | | | | 21,967 | | | | 27,941 | | | | 2,960 | | | | 159 | | | | | | | | 80,661 | |
| Total assets | | | 36,310 | | | | 29,030 | | | | 147,714 | | | | 12,440 | | | | 5,528 | | | | (5,449 | ) | | | 225,573 | |
| Customer accounts | | | 42,778 | | | | 25,372 | | | | 42,977 | | | | 12,713 | | | | 354 | | | | | | | | 124,194 | |
| | | | | | | | | | | | | | | | | | | | | | | | | | | | | |
For footnotes, see page 83. | | | | | | | | | | | | | | | | | | | | | | | | | | | | |
65(a)
Report of the Directors: Operating and Financial Review (continued)
In the Middle East, the network of branches of HSBC Bank Middle East Limited, together with HSBC’s subsidiaries and associates, gives us the widest coverage in the region. Our associate in Saudi Arabia, The Saudi British Bank (40% owned), is the Kingdom’s fifth largest bank by total assets.
| | | | | | | | | | | | | |
| | | 2010 | | | 2009 | | | 2008 | |
| | | US$m | | | US$m | | | US$m | |
| | | | | | | | | | | | | |
| Net interest income | | | 1,367 | | | | 1,485 | | | | 1,556 | |
| Net fee income | | | 677 | | | | 625 | | | | 691 | |
| Net trading income | | | 370 | | | | 394 | | | | 402 | |
| Other income | | | (4 | ) | | | 90 | | | | 19 | |
| | | | | | | |
| | | | | | | | | | | | | |
Net operating income46 | | | 2,410 | | | | 2,594 | | | | 2,668 | |
| | | | | | | | | | | | | |
Impairment charges47 | | | (627 | ) | | | (1,334 | ) | | | (279 | ) |
| | | | | | | |
| | | | | | | | | | | | | |
Net operating income | | | 1,783 | | | | 1,260 | | | | 2,389 | |
| | | | | | | | | | | | | |
| Total operating expenses | | | (1,078 | ) | | | (1,001 | ) | | | (959 | ) |
| | | | | | | |
| | | | | | | | | | | | | |
Operating profit | | | 705 | | | | 259 | | | | 1,430 | |
| | | | | | | | | | | | | |
Income from associates48 | | | 187 | | | | 196 | | | | 316 | |
| | | | | | | |
| | | | | | | | | | | | | |
Profit before tax | | | 892 | | | | 455 | | | | 1,746 | |
| | | | | | | |
| | | | | | | | | | | | | |
| Cost efficiency ratio | | | 44.7% | | | | 38.6% | | | | 35.9% | |
| | | | | | | | | | | | | |
| Year-end staff numbers | | | 8,676 | | | | 8,281 | | | | 8,453 | |
Underlying pre-tax
profit doubled
Leading provider of
traditional trade services
in the UAE
PFS in the Middle East
returns to profitability
| | |
| | | For footnotes, see page 83. |
| |
| | | The commentary on the Middle East is on an underlying basis unless stated otherwise. |
Economic activity in much of the Middle East showed signs of stabilising during 2010. A 30% year on year rise in average oil prices led to a marked strengthening of public finances in the Gulf states, allowing governments such asSaudi Arabiato boost public current and capital spending. The high and stable average oil prices also improved external account positions in the Gulf, leading to an increase in reserves and overall net foreign asset accumulation following the modest drawdowns in 2009.
As well as receiving support from rising public spending, non-oil goods and service exporters in the region also benefited from rising external demand, particularly from Asia. TheUAEwas a leading beneficiary, most notably in its transport and logistics sectors. Banking sector activity remained relatively subdued, with rates of credit growth flat or negative in real terms across much of the region. This contributed to subdued consumer and asset price inflation. Although there was some evidence inSaudi Arabia,OmanandKuwaitthat stronger growth and higher commodity prices were putting pressure on prices in late 2010, the pace of increase remained below that seen in other emerging markets. Inflation was largely absent in the UAE.
Dubaihad another challenging year in 2010, as it continued to struggle with high levels of debt, falling real estate prices and a stagnant credit market. Although no figures have been released, officials estimated in October that real GDP was likely to have grown by 2.3% in 2010, mostly from global trade as exports rose 35% in the year to the third quarter. The domestic economy was considerably weaker through most of the year although there were signs of an improvement by the year end.
InEgypt,GDP growth returned to 6% by the end of 2010, driven primarily by domestic demand. Egypt’s structural economic strengths leave us positive on the medium-term outlook, although recent political turmoil might overshadow its near-term prospects.
Our operations in the Middle East reported pre-tax profits of US$892m, an increase of US$437m compared with 2009.
In October 2010, we completed the sale of our investment in the British Arab Commercial Bank, on which a loss of US$42m was recorded. On an underlying basis and excluding this loss, pre-tax profits increased by US$481m.
66
Report of the Directors: Operating and Financial Review (continued)
Profit/(loss) before tax by country within customer groups and global businesses
| | | | | | | | | | | | | | | | | | | | | | | | | |
| | | Personal | | | | | | | Global | | | Global | | | | | | | |
| | | Financial | | | Commercial | | | Banking & | | | Private | | | | | | | |
| | | Services | | | Banking | | | Markets | | | Banking | | | Other | | | Total | |
| | | US$m | | | US$m | | | US$m | | | US$m | | | US$m | | | US$m | |
| | | | | | | | | | | | | | | | | | | | | | | | | |
2010 | | | | | | | | | | | | | | | | | | | | | | | | |
| Egypt | | | 38 | | | | 82 | | | | 77 | | | | – | | | | (2 | ) | | | 195 | |
| Qatar | | | 19 | | | | 52 | | | | 67 | | | | – | | | | – | | | | 138 | |
| United Arab Emirates | | | 17 | | | | 186 | | | | 121 | | | | 1 | | | | (1 | ) | | | 324 | |
| Other | | | 19 | | | | 57 | | | | (19 | ) | | | – | | | | – | | | | 57 | |
| | | | | | | | | | | | | |
| | | | | | | | | | | | | | | | | | | | | | | | | |
| Middle East (excluding Saudi Arabia) | | | 93 | | | | 377 | | | | 246 | | | | 1 | | | | (3 | ) | | | 714 | |
| Saudi Arabia | | | 7 | | | | 107 | | | | 71 | | | | (16 | ) | | | 9 | | | | 178 | |
| | | | | | | | | | | | | |
| | | | | | | | | | | | | | | | | | | | | | | | | |
| | | | 100 | | | | 484 | | | | 317 | | | | (15 | ) | | | 6 | | | | 892 | |
| | | | | | | | | | | | | |
| | | | | | | | | | | | | | | | | | | | | | | | | |
| 2009 | | | | | | | | | | | | | | | | | | | | | | | | |
| Egypt | | | 18 | | | | 51 | | | | 97 | | | | – | | | | 58 | | | | 224 | |
| Qatar | | | 10 | | | | 60 | | | | 66 | | | | – | | | | – | | | | 136 | |
| United Arab Emirates | | | (177 | ) | | | (136 | ) | | | 307 | | | | (2 | ) | | | 5 | | | | (3 | ) |
| Other | | | 3 | | | | (15 | ) | | | (80 | ) | | | – | | | | (3 | ) | | | (95 | ) |
| | | | | | | | | | | | | |
| | | | | | | | | | | | | | | | | | | | | | | | | |
| Middle East (excluding Saudi Arabia) | | | (146 | ) | | | (40 | ) | | | 390 | | | | (2 | ) | | | 60 | | | | 262 | |
| Saudi Arabia | | | 20 | | | | 61 | | | | 77 | | | | 8 | | | | 27 | | | | 193 | |
| | | | | | | | | | | | | |
| | | | | | | | | | | | | | | | | | | | | | | | | |
| | | | (126 | ) | | | 21 | | | | 467 | | | | 6 | | | | 87 | | | | 455 | |
| | | | | | | | | | | | | |
| | | | | | | | | | | | | | | | | | | | | | | | | |
| 2008 | | | | | | | | | | | | | | | | | | | | | | | | |
| Egypt | | | 16 | | | | 68 | | | | 90 | | | | – | | | | 49 | | | | 223 | |
| Qatar | | | 23 | | | | 33 | | | | 57 | | | | – | | | | – | | | | 113 | |
| United Arab Emirates | | | 133 | | | | 330 | | | | 388 | | | | 4 | | | | 6 | | | | 861 | |
| Other | | | 57 | | | | 92 | | | | 104 | | | | – | | | | 1 | | | | 254 | |
| | | | | | | | | | | | | |
| | | | | | | | | | | | | | | | | | | | | | | | | |
| Middle East (excluding Saudi Arabia) | | | 229 | | | | 523 | | | | 639 | | | | 4 | | | | 56 | | | | 1,451 | |
| Saudi Arabia | | | 60 | | | | 35 | | | | 177 | | | | – | | | | 23 | | | | 295 | |
| | | | | | | | | | | | | |
| | | | | | | | | | | | | | | | | | | | | | | | | |
| | | | 289 | | | | 558 | | | | 816 | | | | 4 | | | | 79 | | | | 1,746 | |
| | | | | | | | | | | | | |
Profits increased strongly in the second half of 2010 compared with the first half of the year, reflecting increased stability in the regional economy and growing momentum in several of the key markets.
The improvement in the credit environment and our risk management actions combined to contribute to significantly lower loan impairment charges and other credit risk provisions. The benefit was partly offset by lower revenues from the run-off of higher yielding unsecured loans, mainly in the UAE.
Our Premier and Advance customer base continued to grow in line with our strategy to build a sustainable wealth-driven, premium-based PFS business, with Premier attracting 35,000 net new customers in the year, of whom 19,000 were new to the Group. During 2010, we launched the Advance proposition across most of the region and the number of customers reached 152,000 at 31 December 2010. The opening of our 100th branch in Egypt is an example of initiatives to expand our regional presence.
In CMB, we continued to build on our competitive advantage in international connectivity.
The increased opportunities to support business and trade flows between the region and the rest of the world, particularly mainland China and India, led to strong trade-related revenues and supported our market-leading position in this business. As a result, we gained market share in our key markets and received several awards for trade services including ‘Leading Trade Services Bank in the Middle East and North Africa’ which was awarded byGlobal Trade Reviewfor the fourth consecutive year.
As part of our continued support to local internationally-focused businesses, we fully allocated the pledged US$100m fund to UAE SME customers engaged in international cross-border business.
In GB&M we continued to invest in the region to support existing and anticipated new business and we now have a fully functional dealing room in Abu Dhabi and a ‘China desk’ in the UAE to support ‘East-East’ business. We continued to be recognised as the dominant player in regional bond markets and won several awards, including ‘Best Investment Bank in the Middle East’ awarded byEuromoney.
67
Report of the Directors: Operating and Financial Review (continued)
Net interest incomedecreased by 8% as average lending balances declined in both PFS and CMB, the proportion of higher yielding assets fell and the cost of liquidity remained high.
In PFS, spreads narrowed as we focused new lending on Premier and Advance customers, while concurrently managing down higher risk unsecured lending balances, mostly in the UAE.
In CMB, asset balances and net interest income rose throughout the second half of 2010 as increasing trade finance balances contributed to growing revenues.
Average customer accounts declined as corporate customers reduced their deposits in response to tighter liquidity in the local markets. This was partly offset by an increase in average liability balances in PFS, which was driven by successful deposit campaigns launched in 2010 and by the acquisition of Premier and Advance customers. Our overall liquidity position improved although the market returns on the deployment of liquidity remained low.
Net fee incomeincreased by 8%, primarily driven by higher volumes of credit facilities related to trade, guarantees and remittances in CMB. The benefit was partly offset by lower advisory revenues from equity capital markets in GB&M as a result of limited issuances in the regional equity markets.
Net trading incomefell by 6% to US$370m. Subdued trading conditions and the non-recurrence of gains which had resulted from the tightening of credit spreads on certain positions in early 2009 resulted in lower Credit trading income. Foreign exchange income decreased with the easing in market volatility as speculation regarding the unpegging of Gulf currencies from the US dollar receded.
Other operating incomedeclined by US$37m as gains arising in 2009 from the buy-back and extinguishment of own debt did not recur.
Loan impairment charges and other credit risk provisionsdecreased by 53%. An overall improvement in credit conditions in the region along with enhanced collections processes, improvements in the quality of our customer base and a reduction in unsecured lending resulted in significantly lower net collective impairment provisions, notably in the UAE, and lower requirements for specific corporate provisions.
In PFS, strengthened collections processes and a repositioning of the loan book contributed to lower delinquency rates. In CMB, loan impairment charges and other credit risk provisions decreased due to significantly lower net collectively assessed impairment charges and fewer specific loan impairment charges, with the majority of the charge in 2010 relating to a small number of large corporate customers.
Loan impairment charges and other credit risk provisions in GB&M rose, mainly from restructuring activity which drove UAE-related loan impairments for a small number of large corporate customers in the first half of 2010. The improvement in economic conditions during the latter part of 2010 resulted in lower loan impairment charges in the second half of the year.
Operating expensesincreased by 8%, driven by increased investment in marketing and advertising, including key sponsorship deals and the promotion of the HSBC brand through strategic messaging in the Abu Dhabi and Dubai airports, together with an increase in premises and people costs, mainly from the investment in the branch network expansion in Egypt.
Profit from associates and joint venturesdecreased by 5%. The contribution from The Saudi British Bank was lower as revenue fell in challenging operating conditions.
68
Report of the Directors: Operating and Financial Review(continued)
Although the majority of economies in theMiddle Eastwere spared the most severe effects of the global recession, 2009 marked a dramatic downturn as growth slowed markedly, bringing a sharp end to a five-year run of strong expansion.
In part, the region proved vulnerable to weakened external demand, particularly economies such as Egypt and the UAE that are significant service and merchandise exporters to the West and are exposed to global trade patterns. A sharp drop in hydrocarbon prices in late 2008 and early 2009 adversely affected sentiment and caused some oil-exporters to reassess spending plans as their revenue streams weakened.
In addition, the liquidity environment tightened considerably during the course of the year. This led to a rapid slowdown in credit creation, weighing heavily on private consumption and investment spending and contributing to marked downward pressure on asset prices. Access to international funding was also impaired as global capital flows slowed, further impeding local investment spending.
The recovery of the region may lag behind that of some other emerging markets. However, in contrast to 1998 (the last occasion on which growth trends sharply reversed) policymakers in Saudi Arabia and elsewhere were able to draw on reserves built up during years of high oil earnings to maintain spending, rather than boosting borrowing. With the recovery in oil prices from mid-2009 onward, the reserves allowed the region to weather the difficult economic environment without experiencing pressure on external balances or a downturn in the dollar value of local currencies. Inflation also fell across the region as growth slowed and import prices fell, and policymakers were able to track the exceptionally low level of interest rates in the US.
Our operations in the Middle East reported a pre-tax profit of US$0.5bn compared with US$1.7bn in 2008, a decrease of 74% on both reported and underlying bases. The decline in profitability was largely due to the impact of the global recession, which brought a sharp decline in oil prices and a considerable reduction in capital inflows in the second half of 2008, triggering a regional economic downturn which continued throughout 2009. The UAE was significantly affected by declines in construction and global trade, losses incurred by regional investors, and tight liquidity and lower real-
estate prices, which together resulted in higher loan impairment charges as the crisis affected both personal and corporate customers. However, despite the severe deterioration in credit conditions, the region remained profitable due to GB&M. In PFS, we continued to focus on Premier and affluent mass market customers, growing our Premier customer base by 32% compared with 2008. We further expanded our presence in Egypt, opening 15 new branches in 2009.
Net interest incomedeclined by 4%, driven by lower deposit and lending balances and deposit spread compression across all customer groups.
CMB lending balances fell as trade levels declined. In PFS, average mortgages and credit card balances were higher than in 2008, reflecting the deferred drawdown of facilities approved in 2008. Unsecured personal lending balances declined during the year due to tighter origination criteria and a move towards relationship lending. The shift in the composition of personal lending portfolios, from unsecured to secured lending, resulted in narrower asset spreads.
Customer deposit balances fell, mainly due to an outflow of funds from corporate customers reflecting tighter liquidity in the local markets. In PFS, liability balances rose due to the combination of attractive rates offered and ongoing marketing campaigns, although the higher rates resulted in narrower deposit spreads.
Net fee incomefell by 9%, due to a decline in custody, insurance and unit trust income as investor sentiment weakened in the difficult market conditions and trade finance fees declined as regional trade deteriorated. Cards income also fell due to lower drawdowns and originations as underwriting criteria were tightened.
Trading incomewas broadly in line with 2008 as weaker foreign exchange and Rates trading revenue were offset by higher revenue from Credit trading on favourable positioning of the trading portfolio in expectation of spreads narrowing from their peak in the third quarter of 2008.
Other operating incomerose by US$62m, driven by gains arising from the buy-back and extinguishment of our own debt issued locally.
Loan impairment charges and other credit risk provisionsrose significantly from US$0.3bn to US$1.3bn, reflecting substantially higher charges in the UAE where the deterioration in credit quality was particularly significant. The UAE’s real estate and construction industries were adversely affected by the global economic crisis, resulting in several
68(a)
Report of the Directors: Operating and Financial Review(continued)
large infrastructure projects being postponed or cancelled, and triggering higher levels of unemployment. This resulted in increased delinquencies, notably in credit cards and personal loans, which were exacerbated by large numbers of expatriate workers departing the region leaving debts unpaid. We took steps to mitigate losses, including reducing our credit lines, tightening origination criteria and strengthening collections activities.
Commercial and corporate banking loan impairment charges rose sharply, primarily due to a few individually significant impairment charges recorded on exposures to large corporates.
Operating expenditureincreased by 6%. Staff costs remained broadly flat as higher expenditure in GB&M was offset by lower staff costs in PFS and CMB as headcount declined. Non-staff costs rose as new headquarter buildings in the UAE and Qatar caused higher rental costs, and IT investment increased from systems upgrades and rollouts.
Profit from associates and joint venturesin the region fell by 38% as our share of income from The Saudi British Bank declined as a result of higher loan impairment charges. Our share of income from HSBC Saudi Arabia Ltd declined as a result of a slowdown in IPOs and a decline in assets under management.
Report of the Directors: Operating and Financial Review(continued)
Profit/(loss) before tax and balance sheet data – Middle East
| | | | | | | | | | | | | | | | | | | | | | | | | | | | | |
| | | 2010 |
| | | Personal | | | | | | | Global | | | Global | | | | | | | Inter- | | | | |
| | | Financial | | | Commercial | | | Banking & | | | Private | | | | | | | segment | | | | |
| | | Services | | | Banking | | | Markets | | | Banking | | | Other | | | elimination | 56 | | Total | |
| | | US$m | | | US$m | | | US$m | | | US$m | | | US$m | | | US$m | | | US$m | |
| | | | | | | | | | | | | | | | | | | | | | | | | | | | | |
Profit/(loss) before tax | | | | | | | | | | | | | | | | | | | | | | | | | | | | |
| | | | | | | | | | | | | | | | | | | | | | | | | | | | | |
| Net interest income | | | 553 | | | | 473 | | | | 334 | | | | – | | | | 14 | | | | (7 | ) | | | 1,367 | |
| | | | | | | | | | | | | | | | | | | | | | | | | | | | | |
| Net fee income | | | 200 | | | | 258 | | | | 202 | | | | 17 | | | | – | | | | – | | | | 677 | |
| | | | | | | | | | | | | | | | | | | | | | | | | | | | | |
| | | | | | | | | | | | | | | |
| Trading income/(expense) excluding net interest income | | | 59 | | | | 85 | | | | 205 | | | | 1 | | | | (7 | ) | | | – | | | | 343 | |
| Net interest income/(expense) on trading activities | | | 1 | | | | 7 | | | | 18 | | | | – | | | | (6 | ) | | | 7 | | | | 27 | |
| | | | | | | | | | | | | | | |
| | | | | | | | | | | | | | | | | | | | | | | | | | | | | |
Net trading income/(expense)49 | | | 60 | | | | 92 | | | | 223 | | | | 1 | | | | (13 | ) | | | 7 | | | | 370 | |
| | | | | | | | | | | | | | | | | | | | | | | | | | | | | |
| Gains less losses from financial investments | | | 1 | | | | – | | | | (3 | ) | | | – | | | | (1 | ) | | | – | | | | (3 | ) |
| Dividend income | | | 2 | | | | 1 | | | | 4 | | | | – | | | | – | | | | – | | | | 7 | |
| Other operating income/(expense) | | | 27 | | | | (8 | ) | | | (1 | ) | | | 1 | | | | 40 | | | | (67 | ) | | | (8 | ) |
| | | | | | | | | | | | | | | |
| | | | | | | | | | | | | | | | | | | | | | | | | | | | | |
Total operating income | | | 843 | | | | 816 | | | | 759 | | | | 19 | | | | 40 | | | | (67 | ) | | | 2,410 | |
| | | | | | | | | | | | | | | | | | | | | | | | | | | | | |
Net insurance claims57 | | | – | | | | – | | | | – | | | | – | | | | – | | | | – | | | | – | |
| | | | | | | | | | | | | | | |
| | | | | | | | | | | | | | | | | | | | | | | | | | | | | |
Net operating income46 | | | 843 | | | | 816 | | | | 759 | | | | 19 | | | | 40 | | | | (67 | ) | | | 2,410 | |
| | | | | | | | | | | | | | | | | | | | | | | | | | | | | |
| Loan impairment charges and other credit risk provisions | | | (227 | ) | | | (145 | ) | | | (255 | ) | | | – | | | | – | | | | – | | | | (627 | ) |
| | | | | | | | | | | | | | | |
| | | | | | | | | | | | | | | | | | | | | | | | | | | | | |
Net operating income | | | 616 | | | | 671 | | | | 504 | | | | 19 | | | | 40 | | | | (67 | ) | | | 1,783 | |
| | | | | | | | | | | | | | | | | | | | | | | | | | | | | |
| Total operating expenses | | | (524 | ) | | | (297 | ) | | | (263 | ) | | | (18 | ) | | | (43 | ) | | | 67 | | | | (1,078 | ) |
| | | | | | | | | | | | | | | |
| | | | | | | | | | | | | | | | | | | | | | | | | | | | | |
Operating profit/(loss) | | | 92 | | | | 374 | | | | 241 | | | | 1 | | | | (3 | ) | | | – | | | | 705 | |
| | | | | | | | | | | | | | | | | | | | | | | | | | �� | | | |
| Share of profit/(loss) in associates and joint ventures | | | 8 | | | | 110 | | | | 76 | | | | (16 | ) | | | 9 | | | | – | | | | 187 | |
| | | | | | | | | | | | | | | |
| | | | | | | | | | | | | | | | | | | | | | | | | | | | | |
Profit/(loss) before tax | | | 100 | | | | 484 | | | | 317 | | | | (15 | ) | | | 6 | | | | – | | | | 892 | |
| | | | | | | | | | | | | | | |
| | | | | | | | | | | | | | | | | | | | | | | | | | | | | |
| | | | % | | | | % | | | | % | | | | % | | | | % | | | | | | | | % | |
| | | | | | | | | | | | | | | | | | | | | | | | | | | | | |
| Share of HSBC’s profit before tax | | | 0.5 | | | | 2.6 | | | | 1.7 | | | | (0.1 | ) | | | – | | | | | | | | 4.7 | |
| Cost efficiency ratio | | | 62.2 | | | | 36.4 | | | | 34.7 | | | | 94.7 | | | | 107.5 | | | | | | | | 44.7 | |
| | | | | | | | | | | | | | | | | | | | | | | | | | | | | |
Balance sheet data45 | | | | | | | | | | | | | | | | | | | | | | | | | | | | |
| | | | | | | | | | | | | | | | | | | | | | | | | | | | | |
| | | US$m | | | US$m | | | US$m | | | US$m | | | US$m | | | | | | | US$m | |
| | | | | | | | | | | | | | | | | | | | | | | | | | | | | |
| Loans and advances to customers (net) | | | 5,063 | | | | 12,293 | | | | 7,247 | | | | 21 | | | | 2 | | | | | | | | 24,626 | |
| Total assets | | | 6,244 | | | | 13,991 | | | | 31,295 | | | | 59 | | | | 4,129 | | | | (2,961 | ) | | | 52,757 | |
| Customer accounts | | | 17,538 | | | | 10,319 | | | | 5,306 | | | | 290 | | | | 58 | | | | | | | | 33,511 | |
69
Report of the Directors: Operating and Financial Review(continued)
| | | | | | | | | | | | | | | | | | | | | | | | | | | | | |
| Middle East | | 2009 |
| | | Personal | | | | | | | Global | | | Global | | | | | | | Inter- | | | | |
| | | Financial | | | Commercial | | | Banking & | | | Private | | | | | | | segment | | | | |
| | | Services | | | Banking | | | Markets | | | Banking | | | Other | | | elimination | 56 | | Total | |
| | | US$m | | | US$m | | | US$m | | | US$m | | | US$m | | | US$m | | | US$m | |
| | | | | | | | | | | | | | | | | | | | | | | | | | | | | |
Profit/(loss) before tax | | | | | | | | | | | | | | | | | | | | | | | | | | | | |
| | | | | | | | | | | | | | | | | | | | | | | | | | | | | |
| Net interest income | | | 644 | | | | 464 | | | | 330 | | | | 1 | | | | 46 | | | | – | | | | 1,485 | |
| | | | | | | | | | | | | | | | | | | | | | | | | | | | | |
| Net fee income | | | 203 | | | | 219 | | | | 198 | | | | 3 | | | | 2 | | | | – | | | | 625 | |
| | | | | | | | | | | | | | | | | | | | | | | | | | | | | |
| | | | | | | | | | | | | | | |
| Trading income excluding net interest income | | | 55 | | | | 75 | | | | 235 | | | | 1 | | | | 3 | | | | – | | | | 369 | |
| Net interest income on trading activities | | | – | | | | – | | | | 20 | | | | – | | | | 5 | | | | – | | | | 25 | |
| | | | | | | | | | | | | | | |
| | | | | | | | | | | | | | | | | | | | | | | | | | | | | |
Net trading income49 | | | 55 | | | | 75 | | | | 255 | | | | 1 | | | | 8 | | | | – | | | | 394 | |
| | | | | | | | | | | | | | | | | | | | | | | | | | | | | |
| Gains less losses from financial investments | | | 12 | | | | (2 | ) | | | 1 | | | | – | | | | 5 | | | | – | | | | 16 | |
| Dividend income | | | – | | | | – | | | | 3 | | | | – | | | | – | | | | – | | | | 3 | |
| Other operating income/ (expense) | | | 35 | | | | 39 | | | | 35 | | | | (1 | ) | | | 39 | | | | (76 | ) | | | 71 | |
| | | | | | | | | | | | | | | |
| | | | | | | | | | | | | | | | | | | | | | | | | | | | | |
| Total operating income | | | 949 | | | | 795 | | | | 822 | | | | 4 | | | | 100 | | | | (76 | ) | | | 2,594 | |
| | | | | | | | | | | | | | | | | | | | | | | | | | | | | |
Net insurance claims57 | | | – | | | | – | | | | – | | | | – | | | | – | | | | – | | | | – | |
| | | | | | | | | | | | | | | |
| | | | | | | | | | | | | | | | | | | | | | | | | | | | | |
Net operating income46 | | | 949 | | | | 795 | | | | 822 | | | | 4 | | | | 100 | | | | (76 | ) | | | 2,594 | |
| | | | | | | | | | | | | | | | | | | | | | | | | | | | | |
| Loan impairment charges and other credit risk provisions | | | (588 | ) | | | (573 | ) | | | (173 | ) | | | – | | | | – | | | | – | | | | (1,334 | ) |
| | | | | | | | | | | | | | | |
| | | | | | | | | | | | | | | | | | | | | | | | | | | | | |
| Net operating income | | | 361 | | | | 222 | | | | 649 | | | | 4 | | | | 100 | | | | (76 | ) | | | 1,260 | |
| | | | | | | | | | | | | | | | | | | | | | | | | | | | | |
| Total operating expenses | | | (508 | ) | | | (269 | ) | | | (255 | ) | | | (6 | ) | | | (39 | ) | | | 76 | | | | (1,001 | ) |
| | | | | | | | | | | | | | | |
| | | | | | | | | | | | | | | | | | | | | | | | | | | | | |
| Operating profit/(loss) | | | (147 | ) | | | (47 | ) | | | 394 | | | | (2 | ) | | | 61 | | | | – | | | | 259 | |
| | | | | | | | | | | | | | | | | | | | | | | | | | | | | |
| Share of profit in associates and joint ventures | | | 21 | | | | 68 | | | | 73 | | | | 8 | | | | 26 | | | | – | | | | 196 | |
| | | | | | | | | | | | | | | |
| | | | | | | | | | | | | | | | | | | | | | | | | | | | | |
| Profit/(loss) before tax | | | (126 | ) | | | 21 | | | | 467 | | | | 6 | | | | 87 | | | | – | | | | 455 | |
| | | | | | | | | | | | | | | |
| | | | | | | | | | | | | | | | | | | | | | | | | | | | | |
| | | | % | | | | % | | | | % | | | | % | | | | % | | | | | | | | % | |
| | | | | | | | | | | | | | | | | | | | | | | | | | | | | |
| Share of HSBC’s profit before tax | | | (1.8 | ) | | | 0.3 | | | | 6.6 | | | | 0.1 | | | | 1.2 | | | | | | | | 6.4 | |
| Cost efficiency ratio | | | 53.5 | | | | 33.8 | | | | 31.0 | | | | 150.0 | | | | 39.0 | | | | | | | | 38.6 | |
| | | | | | | | | | | | | | | | | | | | | | | | | | | | | |
Balance sheet data45 | | | | | | | | | | | | | | | | | | | | | | | | | | | | |
| | | US$m | | | US$m | | | US$m | | | US$m | | | US$m | | | | | | | US$m | |
| | | | | | | | | | | | | | | | | | | | | | | | | | | | | |
| Loans and advances to customers (net) | | | 5,979 | | | | 10,281 | | | | 6,554 | | | | 28 | | | | 2 | | | | | | | | 22,844 | |
| Total assets | | | 6,810 | | | | 11,861 | | | | 28,189 | | | | 96 | | | | 4,952 | | | | (3,801 | ) | | | 48,107 | |
| Customer accounts | | | 15,074 | | | | 10,122 | | | | 5,752 | | | | 1,172 | | | | 409 | | | | | | | | 32,529 | |
70
Report of the Directors: Operating and Financial Review(continued)
| | | | | | | | | | | | | | | | | | | | | | | | | | | | | |
| Middle East | | 2008 |
| | | Personal | | | | | | | Global | | | Global | | | | | | | Inter- | | | | |
| | | Financial | | | Commercial | | | Banking & | | | Private | | | | | | | segment | | | | |
| | | Services | | | Banking | | | Markets | | | Banking | | | Other | | | elimination | 56 | | Total | |
| | | US$m | | | US$m | | | US$m | | | US$m | | | US$m | | | US$m | | | US$m | |
| | | | | | | | | | | | | | | | | | | | | | | | | | | | | |
Profit before tax | | | | | | | | | | | | | | | | | | | | | | | | | | | | |
| | | | | | | | | | | | | | | | | | | | | | | | | | | | | |
| Net interest income | | | 652 | | | | 510 | | | | 362 | | | | 3 | | | | 46 | | | | (17 | ) | | | 1,556 | |
| | | | | | | | | | | | | | | | | | | | | | | | | | | | | |
| Net fee income | | | 227 | | | | 241 | | | | 217 | | | | 6 | | | | – | | | | – | | | | 691 | |
| | | | | | | | | | | | | | | | | | | | | | | | | | | | | |
| | | | | | | | | | | | | | | |
| Trading income excluding net interest income | | | 47 | | | | 65 | | | | 244 | | | | – | | | | 24 | | | | – | | | | 380 | |
| Net interest income/(expense) on trading activities | | | – | | | | – | | | | 20 | | | | – | | | | (15) | | | | 17 | | | | 22 | |
| | | | | | | | | | | | | | | |
| | | | | | | | | | | | | | | | | | | | | | | | | | | | | |
Net trading income49 | | | 47 | | | | 65 | | | | 264 | | | | – | | | | 9 | | | | 17 | | | | 402 | |
| | | | | | | | | | | | | | | | | | | | | | | | | | | | | |
| Gains less losses from financial investments | | | 14 | | | | – | | | | (6 | ) | | | – | | | | – | | | | – | | | | 8 | |
| Dividend income | | | – | | | | – | | | | 2 | | | | – | | | | – | | | | – | | | | 2 | |
| Other operating income | | | 21 | | | | 8 | | | | 11 | | | | 3 | | | | 26 | | | | (60 | ) | | | 9 | |
| | | | | | | | | | | | | | | |
| | | | | | | | | | | | | | | | | | | | | | | | | | | | | |
| Total operating income | | | 961 | | | | 824 | | | | 850 | | | | 12 | | | | 81 | | | | (60 | ) | | | 2,668 | |
| | | | | | | | | | | | | | | | | | | | | | | | | | | | | |
Net insurance claims57 | | | – | | | | – | | | | – | | | | – | | | | – | | | | – | | | | – | |
| | | | | | | | | | | | | | | |
| | | | | | | | | | | | | | | | | | | | | | | | | | | | | |
Net operating income46 | | | 961 | | | | 824 | | | | 850 | | | | 12 | | | | 81 | | | | (60 | ) | | | 2,668 | |
| | | | | | | | | | | | | | | | | | | | | | | | | | | | | |
| Loan impairment (charges)/ recoveries and other credit risk provisions | | | (223 | ) | | | (45 | ) | | | (12 | ) | | | – | | | | 1 | | | | – | | | | (279 | ) |
| | | | | | | | | | | | | | | |
| | | | | | | | | | | | | | | | | | | | | | | | | | | | | |
| Net operating income | | | 738 | | | | 779 | | | | 838 | | | | 12 | | | | 82 | | | | (60 | ) | | | 2,389 | |
| | | | | | | | | | | | | | | | | | | | | | | | | | | | | |
| Total operating expenses | | | (511 | ) | | | (264 | ) | | | (212 | ) | | | (8 | ) | | | (24 | ) | | | 60 | | | | (959 | ) |
| | | | | | | | | | | | | | | |
| | | | | | | | | | | | | | | | | | | | | | | | | | | | | |
| Operating profit | | | 227 | | | | 515 | | | | 626 | | | | 4 | | | | 58 | | | | – | | | | 1,430 | |
| | | | | | | | | | | | | | | | | | | | | | | | | | | | | |
| Share of profit in associates and joint ventures | | | 62 | | | | 43 | | | | 190 | | | | – | | | | 21 | | | | – | | | | 316 | |
| | | | | | | | | | | | | | | |
| | | | | | | | | | | | | | | | | | | | | | | | | | | | | |
| Profit before tax | | | 289 | | | | 558 | | | | 816 | | | | 4 | | | | 79 | | | | – | | | | 1,746 | |
| | | | | | | | | | | | | | | |
| | | | | | | | | | | | | | | | | | | | | | | | | | | | | |
| | | | % | | | | % | | | | % | | | | % | | | | % | | | | | | | | % | |
| | | | | | | | | | | | | | | | | | | | | | | | | | | | | |
| Share of HSBC’s profit before tax | | | 3.1 | | | | 6.0 | | | | 8.9 | | | | – | | | | 0.8 | | | | | | | | 18.8 | |
| Cost efficiency ratio | | | 53.2 | | | | 32.0 | | | | 24.9 | | | | 66.7 | | | | 29.6 | | | | | | | | 35.9 | |
| | | | | | | | | | | | | | | | | | | | | | | | | | | | | |
Balance sheet data45 | | | | | | | | | | | | | | | | | | | | | | | | | | | | |
| | | US$m | | | US$m | | | US$m | | | US$m | | | US$m | | | | | | | US$m | |
| | | | | | | | | | | | | | | | | | | | | | | | | | | | | |
| Loans and advances to customers (net) | | | 7,226 | | | | 13,221 | | | | 6,649 | | | | 29 | | | | 170 | | | | | | | | 27,295 | |
| Total assets | | | 8,168 | | | | 14,672 | | | | 27,975 | | | | 46 | | | | 5,754 | | | | (5,663 | ) | | | 50,952 | |
| Customer accounts | | | 13,753 | | | | 10,978 | | | | 7,628 | | | | 1,762 | | | | 1,044 | | | | | | | | 35,165 | |
| | | | | | | | | | | | | | | | | | | | | | | | | | | | | |
For footnotes, see page 83. | | | | | | | | | | | | | | | | | | | | | | | | | | | | |
70(a)
Report of the Directors: Operating and Financial Review(continued)
Our North American businesses are located in the US, Canada and Bermuda. Operations in the US are primarily conducted through HSBC Bank USA, N.A., which is concentrated in New York State, and HSBC Finance, a national consumer finance company based near Chicago. HSBC Markets (USA) Inc. is the intermediate holding company of, inter alia, HSBC Securities (USA) Inc. HSBC Bank Canada and HSBC Bank Bermuda operate in their respective countries.
| | | | | | | | | | | | | |
| | | 2010 | | | 2009 | | | 2008 | |
| | | US$m | | | US$m | | | US$m | |
| | | | | | | | | | | | | |
| Net interest income | | | 12,439 | | | | 13,670 | | | | 15,218 | |
| Net fee income | | | 3,664 | | | | 4,817 | | | | 5,227 | |
| Net trading income/ (expense) | | | 314 | | | | 331 | | | | (3,135 | ) |
| Other income/(expense) | | | 630 | | | | (2,513 | ) | | | 3,869 | |
| | | | | | | |
| | | | | | | | | | | | | |
Net operating income46 | | | 17,047 | | | | 16,305 | | | | 21,179 | |
| | | | | | | | | | | | | |
Impairment charges47 | | | (8,295 | ) | | | (15,664 | ) | | | (16,795 | ) |
| | | | | | | |
| | | | | | | | | | | | | |
Net operating income | | | 8,752 | | | | 641 | | | | 4,384 | |
| | | | | | | | | | | | | |
| Total operating expenses | | | (8,322 | ) | | | (8,391 | ) | | | (19,923 | ) |
| | | | | | | |
| | | | | | | | | | | | | |
Operating profit/(loss) | | | 430 | | | | (7,750 | ) | | | (15,539 | ) |
| | | | | | | | | | | | | |
Income from associates48 | | | 24 | | | | 12 | | | | 11 | |
| | | | | | | |
| | | | | | | | | | | | | |
Profit/(loss) before tax | | | 454 | | | | (7,738 | ) | | | (15,528 | ) |
| | | | | | | |
| | | | | | | | | | | | | |
| Cost efficiency ratio | | | 48.8% | | | | 51.5% | | | | 94.1% | |
| | | | | | | | | | | | | |
| Year-end staff numbers | | | 33,865 | | | | 35,458 | | | | 44,725 | |
Pre-tax profit for the
first time since 2006
Impairment charges at
lowest levels since 2006
Card and Retail Services
pre-tax profit
US$2.0bn
2009: US$641m; 2008: US$837m
| | |
| | | For footnotes, see page 83. |
| |
| | | The commentary on North America is on an underlying basis unless stated otherwise. |
The economic recession in theUSofficially ended in the middle of 2009 but, given its depth and duration, the subsequent recovery was disappointing. In 2010, GDP expanded by 2.9%. The initial stage of the recovery was helped by tax reductions and direct subsidies for home purchases, but the growth momentum faded as their impact waned. In addition, fiscal tightening by state and local governments intensified, leading to spending cutbacks and job cuts that adversely affected consumer confidence and the rate of growth of consumer spending. Unemployment fell from 10.0% in the fourth quarter of 2009 to 9.4% by the end of 2010. The annual rate of ‘core’ inflation (excluding food and energy products) fell steadily during the year to 0.8% in December, the smallest rate of annual increase in the 50 year history of the series.
In the fourth quarter of 2010, the Federal Reserve launched a US$600bn programme of large scale asset purchases to ease monetary conditions. Asset prices rebounded and consumer spending picked up sharply, helping to renew economic activity.
In the year ended November 2010,CanadianGDP rose by 3%, compared with a decline of 1.2% in the year to November 2009, driven by housing construction, consumer spending and inventory restocking. Employment growth in the first half of 2010 was strong and the unemployment rate fell to 7.6% in December 2010 from the high of 8.7% in 2009. CPI inflation remained close to the Bank of Canada’s 2% target through much of 2010 but the recovery in economic activity prompted the central bank to begin normalising the policy rate from a low of 0.25% to 1% by October.
In North America, a reported profit before tax of US$454m in 2010 compared with a loss of US$7.7bn in 2009. On an underlying basis, the pre-tax profit of US$246m compared with a pre-tax loss of US$4.0bn. The improved performance was largely due to a marked decline in loan impairment charges in our Card and Retail Services business and run-off portfolios, partly offset by lower revenue reflecting a reduction in lending balances, the effects of the CARD Act (see page 19) and adverse fair value movements on non-qualifying hedges.
Our results in 2011 will continue to be affected in general terms by the strength of the US economy and the impact of proposed regulatory changes on
71
Report of the Directors: Operating and Financial Review(continued)
Profit/(loss) before tax by country within customer groups and global businesses
| | | | | | | | | | | | | | | | | | | | | | | | | |
| | | Personal | | | | | | | Global | | | Global | | | | | | | |
| | | Financial | | | Commercial | | | Banking & | | | Private | | | | | | | |
| | | Services | | | Banking | | | Markets | | | Banking | | | Other | | | Total | |
| | | US$m | | | US$m | | | US$m | | | US$m | | | US$m | | | US$m | |
| | | | | | | | | | | | | | | | | | | | | | | | | |
2010 | | | | | | | | | | | | | | | | | | | | | | | | |
| US | | | (2,306 | ) | | | 402 | | | | 1,285 | | | | 113 | | | | (39 | ) | | | (545 | ) |
| Canada | | | 110 | | | | 505 | | | | 248 | | | | – | | | | 4 | | | | 867 | |
| Bermuda | | | 47 | | | | 32 | | | | 49 | | | | (3 | ) | | | 7 | | | | 132 | |
| Other | | | – | | | | – | | | | – | | | | 1 | | | | (1 | ) | | | – | |
| | | | | | | | | | | | | |
| | | | | | | | | | | | | | | | | | | | | | | | | |
| | | | (2,149 | ) | | | 939 | | | | 1,582 | | | | 111 | | | | (29 | ) | | | 454 | |
| | | | | | | | | | | | | |
| |
| 2009 | | | | | | | | | | | | | | | | | | | | | | | | |
| US | | | (5,292 | ) | | | 158 | | | | 505 | | | | (49 | ) | | | (3,626 | ) | | | (8,304 | ) |
| Canada | | | 17 | | | | 347 | | | | 159 | | | | – | | | | (100 | ) | | | 423 | |
| Bermuda | | | 49 | | | | 37 | | | | 47 | | | | (2 | ) | | | 10 | | | | 141 | |
| Other | | | – | | | | 1 | | | | 1 | | | | 1 | | | | (1 | ) | | | 2 | |
| | | | | | | | | | | | | |
| | | | | | | | | | | | | | | | | | | | | | | | | |
| | | | (5,226 | ) | | | 543 | | | | 712 | | | | (50 | ) | | | (3,717 | ) | | | (7,738 | ) |
| | | | | | | | | | | | | |
| | | | | | | | | | | | | | | | | | | | | | | | | |
| 2008 | | | | | | | | | | | | | | | | | | | | | | | | |
US62 | | | (17,364 | ) | | | 226 | | | | (2,899 | ) | | | 67 | | | | 3,427 | | | | (16,543 | ) |
| Canada | | | 106 | | | | 380 | | | | 252 | | | | 5 | | | | 96 | | | | 839 | |
| Bermuda | | | 31 | | | | 51 | | | | 72 | | | | 11 | | | | 9 | | | | 174 | |
| Other | | | (1 | ) | | | 1 | | | | – | | | | – | | | | 2 | | | | 2 | |
| | | | | | | | | | | | | |
| | | | (17,228 | ) | | | 658 | | | | (2,575 | ) | | | 83 | | | | 3,534 | | | | (15,528 | ) |
| | | | | | | | | | | | | |
For footnote, see page 83.
our business and, specifically, by the extent to which unemployment rates improve and the recovery in the housing market is sustained.
In 2010, we continued to reposition our core businesses and we remained focused on managing down our run-off assets. In addition, we made progress with the changes required to conform with new regulatory frameworks and policies.
In our core PFS business, we continued to grow our Premier proposition, with customer numbers increasing by 37% to over 700,000, and we expanded our branch network, opening five new branches in the states of California, Maryland and Virginia. Our Card and Retail Services business continued to be profitable, despite a decline in lending balances as customers reduced their outstanding credit card debt.
In CMB, we increased pre-tax profits by 51% to US$873m as credit quality improved and we grew our revenue through repricing. In line with our global strategy to be the leading international business bank, CMB actively targeted the growing number of companies with international banking requirements achieving a 28% increase in referral volumes to other HSBC sites, and GB&M drove cross-regional and cross-customer group connectivity. GB&M and GPB also continued to appeal to internationally focused customers, attracted by the Group’s presence in both emerging and developed markets.
Net interest incomefell by 10% to US$12.4bn as customer lending balances declined, mainly in HSBC
Finance, due to the run-off of the residual balances in our Mortgage Services, Consumer Lending and vehicle finance portfolios. We took additional steps during 2010 to accelerate this process, selling US$1.0bn in vehicle finance loans in March and the remainder of the portfolio (US$4.3bn) in August to the same purchaser. Lower balances in our Card and Retail Services business reflected a decline in active accounts, actions taken to mitigate risk and an increased focus by our customers on reducing their credit card debt.
Asset spreads in Mortgage Services and Consumer Lending widened, reflecting lower funding costs and higher yields resulting from lower levels of modified loans and delinquent balances. In our Card and Retail Services portfolio asset spreads also widened due to lower funding costs, re-pricing initiatives and contract re-negotiation with certain merchants, partly offset by the effects of the CARD Act.
Average customer deposit balances increased in PFS and CMB as we continued to grow our customer base. In GB&M, our increased deposit base reflected a rise in repurchase transactions. Deposit spreads improved, despite falling interest rates, mainly due to repricing as competitive pressures eased.
Lower net interest income from Balance Sheet Management reflected the sales and maturities of higher yielding assets and the reinvestment of the proceeds into lower yielding, lower risk assets.
72
Report of the Directors: Operating and Financial Review(continued)
Net fee incomefell by 25% to US$3.7bn. Lower transaction volumes, a reduction in customer spending and customers actively seeking to reduce credit card debt improved delinquency trends, and the effects of changes required by the CARD Act led to lower late and overlimit fees in our Card and Retail Services business.
Net trading incomeof US$314m was 8% lower than in 2009, primarily because of US$353m adverse fair value movements in non-qualifying hedges due to the decrease in long-term US interest rates. This compared with US$184m in favourable fair value movements on these instruments in 2009. The majority of these instruments were interest rate swaps used to economically hedge floating rate debt issued by HSBC Finance. The debt was issued to offset the increase in the duration of the company’s mortgage portfolio resulting from lower prepayment rates and the corresponding rise in interest rate risk.
In 2010, we increased our estimates of exposure on repurchase obligations associated with loans previously sold, primarily to Government-sponsored enterprises (‘GSE’s), which reduced our trading income by US$341m compared with US$65m in 2009. This related mainly to mortgages originated through broker channels. These trading losses were partly offset by a rise in GB&M, despite lower revenue from Rates, as write-backs on legacy positions in Credit trading compared with write-downs in 2009.
Net expense from financial instruments designated at fair valueof US$31m compared with net income of US$192m in 2009. This was due to adverse fair value movements from interest rate ineffectiveness in the economic hedging of our long-term debt. In 2009, fair value movements on economic hedges resulted in net income.
Gains less losses from financial investmentsdeclined by 52% due to lower gains from asset sales in the available-for-sale portfolio, undertaken to reduce the overall level of balance sheet risk.
Net earned insurance premiumsandNet insurance claims incurred and movement in liabilities to policyholdersboth declined. Lower premiums reflected a fall in sales of payment protection products following the discontinuance of mortgage originations in HSBC Finance. Claims and reserves declined as the lending balances and associated in-force insurance contracts reduced.
Other operating incomedeclined by 70% to US$167m as we recognised a loss of US$207m on the sale of our vehicle finance loan portfolio and loan servicing platform. In addition, gains in 2009
from the sale of residential mortgages and the refinement of the income recognition methodology of long-term insurance contracts did not recur. This was partly offset by a gain on the sale of our New York headquarters building in 2010.
Loan impairment charges and other credit risk provisionsdecreased by 47% to US$8.3bn, the lowest level since 2006. Although most significant in PFS, the decline was across all businesses as the economy generally improved in 2010.
Loan impairment charges in Card and Retail Services declined by 57%, reflecting lower lending balances and an increased focus by our customers on reducing outstanding credit card debt. There was also an overall improvement in the credit quality of the portfolio, with lower delinquency levels and better delinquency roll rates.
Loan impairment charges in our Mortgage Services and Consumer Lending businesses fell by 29% as balances continued to run-off and delinquent balances reduced. Loss severity also improved reflecting an increase in deed-in-lieu and short sales agreements, both of which result in lower losses than foreclosed loans.
As a result of investigations into the foreclosure practices of certain mortgage service providers, there could be additional delays in the processing of foreclosures. See page 83 for more information.
In GB&M, a net release of loan impairment charges and other credit risk provisions of US$184m compared with a reported net charge of US$621m in 2009. This reflected an improvement in the credit environment and a release of impairments on available-for-sale ABSs. In CMB, loan impairment charges declined as the improved economic conditions resulted in credit upgrades on certain accounts and fewer downgrades across all business lines. Further commentary on delinquency trends in the US PFS portfolios is provided on page 110.
Operating expensesfell by 2% to US$8.3bn, reflecting the non-recurrence of restructuring costs following the closure of the Consumer Lending branch network in 2009 and the reduced scope of our business operations in the US as we ran off the legacy portfolios in HSBC Finance. In addition, we recorded a pension curtailment gain in 2010 and deposit insurance costs declined as a 2009 special assessment did not recur. These reductions were partly offset by a rise in marketing expenses in Card and Retail Services, an increase in litigation provisions and higher regulatory and compliance costs.
73
Report of the Directors: Operating and Financial Review(continued)
Economic conditions remained extremely difficult in theUSduring the early months of 2009 before some signs of recovery appeared as the year progressed, limiting the decline in full year GDP to 2.4% after a 0.4% increase during 2008. Housing sales and residential construction activity showed some improvement from very depressed levels and this, along with the introduction of tax incentives, drove a reduction in the rate of decline of house prices in some states as the year progressed. Labour market conditions weakened throughout the year as the unemployment rate rose to a 26-year high of 10.1% in October 2009, contributing to concerns around the trend of delinquencies on both secured and unsecured debt within the household sector. The annual CPI rate remained negative during the second and third quarters of the year before rising to 2.7% by December 2009, although this trend was largely reflective of the earlier volatility of energy prices. Measures of consumer confidence improved during the year, but remained consistent with a weak overall level of household expenditure. The Standard & Poor’s S&P 500 stock market index recovered from a weak start to 2009 to eventually record a gain of 23% in the year. Having already lowered the Fed funds target rate to within a narrow range of between zero and 25 basis points, the Federal Reserve maintained their efforts to improve the availability of credit across the economy by purchasing a range of financial instruments, while a substantial fiscal stimulus package provided additional support to economic activity from the middle of the year.
CanadianGDP fell by 3.2% during the first eleven months of 2009 compared with the equivalent period of 2008, led by a sharp contraction of output within the manufacturing sector. Labour market conditions deteriorated as the unemployment rate rose from a level of 6.8% in December 2008 to an 11 year high of 8.7% in August 2009, before then declining slightly in the final months of the year. In common with many other economies, the headline CPI rate turned negative around the middle of 2009, largely reflecting the trend of energy prices, and the core rate of inflation displayed a more pronounced downward trend as 2009 progressed. Responding to this deteriorating economic outlook, the Bank of Canada cut its overnight interest rate from 1.5% in December 2008 to 0.25% in April 2009, and provided a conditional commitment to maintain this level of interest rates until the end of the second quarter of 2010.
In North America, we reported a loss before tax of US$7.7bn in 2009 compared with a loss of US$15.5bn in 2008. On an underlying basis, excluding US$3.7bn of fair value movements on our own debt, and also excluding an impairment charge of US$10.6bn in 2008 to fully write-off goodwill in respect of North America PFS, the pre-tax loss fell by 52% to US$4.1bn. This improved performance was largely due to a marked reduction in write-downs and losses in GB&M, lower loan impairment charges in PFS and lower operating expenses following the closure of our Consumer Lending branch network at the beginning of 2009, partly offset by higher loan impairment charges and other credit risk provisions in the corporate and commercial, and GPB, books.
Net interest incomein 2009 declined by 10%, mainly reflecting reduced asset balances in the legacy consumer finance portfolios, increases in average delinquencies and modified loans (which generate lower yields), the compression of deposit spreads and lower revenue from Balance Sheet Management activities. These effects were partly offset by lower funding costs from the decline in interest rates and higher credit card yields which were driven by the effects of re-pricing initiatives, interest rate floors and lower levels of promotional balances.
Loans and advances to customers declined, mainly in HSBC Finance, following decisions taken to cease new originations and run off the residual balances in Mortgage Services, Consumer Lending and vehicle finance. HSBC Bank USA sold US$4.5bn of prime mortgages in 2009 in addition to normal sale activity. In our Card and Retail Services, balances declined due to lower consumer spending and steps taken by management to mitigate risk and reduce originations, including tightening initial credit-line sales authorisation criteria, closing inactive accounts, decreasing credit lines, restricting underwriting criteria, restricting cash access and reducing marketing expenditure. In the second half of the year, we resumed direct marketing mailings and new customer account originations for portions of the sub-prime credit card portfolio which had held up well through the economic downturn.
In November 2009, we entered into an agreement to sell the vehicle finance loan servicing operation and US$1.0bn of associated loans. This transaction is expected to close in the first quarter of 2010.
In December 2009, HSBC Finance revised the write-off period for its real estate secured and other
73(a)
Report of the Directors: Operating and Financial Review(continued)
personal lending portfolios in order to reflect changed customer behaviour, aligning it with the policy used across the Group. As a consequence of this, real estate secured loan balances are now written down to net realisable value generally no later than the end of the month in which the account becomes 180 days delinquent, and personal lending products balances are now written off no later than the end of the month in which the account becomes 180 days delinquent. This change did not have a material effect on our financial results as write-offs were offset with releases of related impairment allowances. However, the write-offs resulted in a US$3.3bn reduction in gross balances in Mortgage Services and Consumer Lending.
Asset spreads narrowed slightly in the Mortgage Services and Consumer Lending portfolios as the effect of credit quality deterioration and increased loan modifications were partly offset by lower funding costs. Vehicle finance spreads widened due to lower funding costs. In Card and Retail Services, spreads widened due to lower funding costs, repricing initiatives, lower levels of promotional balances and interest rate floors on portions of the portfolio. In GB&M and CMB, asset spreads widened, primarily due to loan repricing and lower funding costs.
Customer deposit balances were broadly unchanged. In GB&M, reduced deposits reflected the decline in assets being funded. This reduction was partly offset in both PFS and CMB, which were successful in increasing deposits through Premier, the expanded branch network and various internet-based propositions. Liability spreads tightened as base rates declined, although spreads widened in the second half of 2009 as rates paid to customers decreased in line with major competitors.
Net interest income from Balance Sheet Management fell, despite strong performance in the first half of the year, affected by risk management initiatives which included selling higher yielding assets and reinvesting the proceeds in assets with a reduced risk profile, resulting in lower yield.
Net fee incomedeclined by 7% to US$4.8bn, driven by lower late, overlimit, interchange and cash advance fees in the US credit cards business. This was mainly due to a reduction in our cards in issue, lower transaction volumes and changes in customer behaviour. Fee income from enhancement services also decreased due to lower balances and fewer accounts, and the discontinuance of all but one partner relationship and a change in product mix to lower revenue products led to a decline in fee income from Taxpayer Financial Services. In
GB&M, fee income from underwriting increased, driven by higher debt origination volumes.
Net trading incomeof US$331m compared with a net trading loss of US$3.1bn in 2008, primarily due to significantly lower write-downs on exposures in GB&M, as the effect of downgrades of monoline insurers and mortgage-backed securities were far less marked than in 2008. Revenue from foreign exchange fell, following a record performance in 2008 in which there had been unprecedented levels of market volatility and wider spreads. In Global Banking, fair value losses were recorded on certain credit default swap transactions used to hedge corporate loan exposures following the tightening of credit spreads, compared with gains in 2008.
Net income from financial instruments designated at fair valuedeclined by 35% to US$192m, as income from ineffective interest rate hedges related to long-term debt issued by our subsidiaries in North America reduced.
Gains less losses from financial investmentswere US$296m, compared with a net loss of US$123m in 2008. Gains in the current year were largely attributable to the sale of mortgage-backed securities, compared with losses on the sale of US government agency securities in 2008. Gains from the sale of Visa shares in 2008 did not recur.
Net earned insurance premiumsdeclined by 21% as lower loan balances and the discontinuation of real estate originations in HSBC Finance led to lower premiums from payment protection insurance products.
Other operating incomewas US$566m compared with US$26m in 2008 due to lower losses on sales of repossessed properties during 2009. House prices began to stabilise during the second half of the year and this resulted in less deterioration in value in the time between taking title and selling the property. Also, there were further delays in the foreclosure process in 2009, resulting in lower inventory levels and fewer sales. In addition, HSBC Finance recognised gains from the refinement of the income recognition methodology of long-term insurance contracts, and gains on the sale of prime mortgages in HSBC Bank USA increased.
Net insurance claims incurred and movements in liabilities to policyholdersincreased marginally to US$241m as higher claims and an increase in liabilities for credit protection policies written against the US prime mortgage book were largely offset by reduced life insurance and disability claims due to a decline in the number of policies underwritten.
73(b)
Report of the Directors: Operating and Financial Review(continued)
Loan impairment charges and other credit risk provisionsdecreased by 7% to US$15.7bn. Lower loan impairment charges in HSBC Finance were partly offset by increases in loan impairment charges and other credit risk provisions in GB&M, CMB, the US prime mortgage book and GPB.
Loan impairment charges in US consumer finance decreased by 12% to US$13.5bn, due to a stabilisation in delinquency trends. In our Mortgage Services portfolio, loan impairment charges fell by 40% to US$2.1bn as the portfolio progressed further into run-off. By contrast, there was a 4% rise in loan impairment charges in Consumer Lending, primarily in the unsecured portfolio due to a deterioration in the 2006 and 2007 vintages and, to a lesser extent, first lien real estate secured loans. This was partly offset by lower loan impairment charges for second lien real estate secured loans, reflecting a reduction in portfolio risk factors as delinquency trends stabilised and the outlook for current inherent losses on certain first lien real estate secured vintages improved. The change in write-off period referred above had no significant effect on loan impairment charges.
In Card and Retail Services, loan impairment charges decreased by 4%, due to lower loan balances, reflecting lower consumer spending and actions taken to manage risk, and stable credit conditions. In addition, the outlook for future loss estimates improved: the effect of higher unemployment on losses was not as severe as had been predicted, in part due to tighter underwriting; fuel prices declined; and government stimulus activities helped household cashflow. These developments occurred despite the continued deterioration of the US economy and higher levels of unemployment and personal bankruptcy filings.
In PFS in HSBC Bank USA, loan impairment charges rose by 18% to US$616m, mainly in the prime residential mortgage portfolios. Higher delinquencies and losses were experienced due to credit quality deterioration and continued weakness in house prices in certain markets.
Loan impairment charges and other credit risk provisions in GB&M rose from US$198m to US$621m, driven by deterioration in the credit position of certain corporate clients and additional impairments recognised in respect of certain ABSs held in the available-for-sale portfolio which reflected mark-to-market losses. In CMB, loan impairment charges rose by 15% to US$519m as the recession adversely affected the commercial real estate and construction portfolios in the US, and the commercial real estate, manufacturing, trade and
service sectors in Canada. In GPB, higher loan impairment charges were attributable to a single specific charge.
Further commentary on delinquency trends in our US PFS portfolios is provided in ‘Areas of special interest – personal lending’ on page 106.
Operating expensesdeclined to US$8.4bn. Apart from the non-recurrence of a US$10.6bn charge for the impairment of the goodwill of the North American PFS business, savings from the decision to discontinue originations and close branches in the Consumer Lending business and other cost reduction initiatives drove expense reduction. Restructuring costs associated with the closure of our branch network amounted to US$150m. Staff costs decreased as a result of lower staff numbers, offsetting higher performance-related costs in GB&M. General and administrative costs declined with lower marketing costs in Card and Retail Services as a significant element as origination activity was curtailed. Deposit insurance expenses increased by US$143m following a Federal Deposit Insurance Corporation special assessment in response to the bail out of a number of regional banks.
Report of the Directors: Operating and Financial Review(continued)
Profit/(loss) before tax and balance sheet data – North America
| | | | | | | | | | | | | | | | | | | | | | | | | | | | | |
| | | 2010 |
| | | Personal | | | | | | | Global | | | Global | | | | | | | Inter- | | | | |
| | | Financial | | | Commercial | | | Banking & | | | Private | | | | | | | segment | | | | |
| | | Services | | | Banking | | | Markets | | | Banking | | | Other | | | elimination | 56 | | Total | |
| | | US$m | | | US$m | | | US$m | | | US$m | | | US$m | | | US$m | | | US$m | |
| | | | | | | | | | | | | | | | | | | | | | | | | | | | | |
Profit/(loss) before tax | | | | | | | | | | | | | | | | | | | | | | | | | | | | |
| | | | | | | | | | | | | | | | | | | | | | | | | | | | | |
| Net interest income/(expense) | | | 9,912 | | | | 1,525 | | | | 952 | | | | 190 | | | | (71 | ) | | | (69 | ) | | | 12,439 | |
| | | | | | | | | | | | | | | | | | | | | | | | | | | | | |
| Net fee income/(expense) | | | 2,032 | | | | 534 | | | | 955 | | | | 149 | | | | (6 | ) | | | – | | | | 3,664 | |
| | | | | | | | | | | | | | | |
| Trading income/(expense) excluding net interest income | | | (472 | ) | | | 17 | | | | 563 | | | | 13 | | | | (12 | ) | | | – | | | | 109 | |
| Net interest income on trading activities | | | 24 | | | | 2 | | | | 93 | | | | – | | | | 17 | | | | 69 | | | | 205 | |
| | | | | | | | | | | | | | | |
Net trading income/(expense)49 | | | (448 | ) | | | 19 | | | | 656 | | | | 13 | | | | 5 | | | | 69 | | | | 314 | |
| | | | | | | | | | | | | | | |
| Changes in fair value of long- term debt issued and related derivatives | | | – | | | | – | | | | – | | | | – | | | | 111 | | | | – | | | | 111 | |
| Net income/(expense) from other financial instruments designated at fair value | | | 6 | | | | – | | | | (2 | ) | | | – | | | | (4 | ) | | | – | | | | – | |
| | | | | | | | | | | | | | | |
| Net income/(expense) from financial instruments designated at fair value | | | 6 | | | | – | | | | (2 | ) | | | – | | | | 107 | | | | – | | | | 111 | |
| Gains less losses from financial investments | | | 5 | | | | (6 | ) | | | 141 | | | | – | | | | 3 | | | | – | | | | 143 | |
| Dividend income | | | 18 | | | | 7 | | | | 12 | | | | 3 | | | | 2 | | | | – | | | | 42 | |
| Net earned insurance premiums | | | 245 | | | | – | | | | – | | | | – | | | | – | | | | – | | | | 245 | |
| Other operating income | | | (243 | ) | | | 242 | | | | 64 | | | | 15 | | | | 2,351 | | | | (2,196 | ) | | | 233 | |
| | | | | | | | | | | | | | | |
Total operating income | | | 11,527 | | | | 2,321 | | | | 2,778 | | | | 370 | | | | 2,391 | | | | (2,196 | ) | | | 17,191 | |
| | | | | | | | | | | | | | | | | | | | | | | | | | | | | |
Net insurance claims57 | | | (148 | ) | | | – | | | | – | | | | – | | | | 4 | | | | – | | | | (144 | ) |
| | | | | | | | | | | | | | | |
Net operating income46 | | | 11,379 | | | | 2,321 | | | | 2,778 | | | | 370 | | | | 2,395 | | | | (2,196 | ) | | | 17,047 | |
| Loan impairment (charges)/recoveries and other credit risk provisions | | | (8,194 | ) | | | (323 | ) | | | 184 | | | | 38 | | | | – | | | | – | | | | (8,295 | ) |
| | | | | | | | | | | | | | | |
Net operating income | | | 3,185 | | | | 1,998 | | | | 2,962 | | | | 408 | | | | 2,395 | | | | (2,196 | ) | | | 8,752 | |
| | | | | | | | | | | | | | | | | | | | | | | | | | | | | |
| Total operating expenses | | | (5,338 | ) | | | (1,081 | ) | | | (1,380 | ) | | | (297 | ) | | | (2,422 | ) | | | 2,196 | | | | (8,322 | ) |
| | | | | | | | | | | | | | | |
Operating profit/(loss) | | | (2,153 | ) | | | 917 | | | | 1,582 | | | | 111 | | | | (27 | ) | | | – | | | | 430 | |
| | | | | | | | | | | | | | | | | | | | | | | | | | | | | |
| Share of profit/(loss) in associates and joint ventures | | | 4 | | | | 22 | | | | – | | | | – | | | | (2 | ) | | | – | | | | 24 | |
| | | | | | | | | | | | | | | |
Profit/(loss) before tax | | | (2,149 | ) | | | 939 | | | | 1,582 | | | | 111 | | | | (29 | ) | | | – | | | | 454 | |
| | | | | | | | | | | | | | | |
| | | | | | | | | | | | | | | | | | | | | | | | | | | | | |
| | | | % | | | | % | | | | % | | | | % | | | | % | | | | | | | | % | |
| | | | | | | | | | | | | | | | | | | | | | | | | | | | |
| Share of HSBC’s profit before tax | | | (11.3 | ) | | | 5.0 | | | | 8.3 | | | | 0.6 | | | | (0.2 | ) | | | | | | | 2.4 | |
| Cost efficiency ratio | | | 46.9 | | | | 46.6 | | | | 49.7 | | | | 80.3 | | | | 101.1 | | | | | | | | 48.8 | |
| | | | | | | | | | | | | | | | | | | | | | | | | | | | | |
Balance sheet data45 | | | | | | | | | | | | | | | | | | | | | | | | | | | | |
| | | US$m | | | US$m | | | US$m | | | US$m | | | US$m | | | | | | | US$m | |
| | | | | | | | | | | | | | | | | | | | | | | | | | | | |
| Loans and advances to customers (net) | | | 131,194 | | | | 30,277 | | | | 24,338 | | | | 4,723 | | | | – | | | | | | | | 190,532 | |
| Total assets | | | 154,086 | | | | 39,213 | | | | 306,416 | | | | 5,824 | | | | 9,373 | | | | (22,425 | ) | | | 492,487 | |
| Customer accounts | | | 76,817 | | | | 46,425 | | | | 22,324 | | | | 12,812 | | | | 108 | | | | | | | | 158,486 | |
74
Report of the Directors: Operating and Financial Review(continued)
| | | | | | | | | | | | | | | | | | | | | | | | | | | | | |
| North America | | 2009 |
| | | Personal | | | | | | | Global | | | Global | | | | | | | Inter- | | | | |
| | | Financial | | | Commercial | | | Banking & | | | Private | | | | | | | segment | | | | |
| | | Services | | | Banking | | | Markets | | | Banking | | | Other | | | elimination | 56 | | Total | |
| | | US$m | | | US$m | | | US$m | | | US$m | | | US$m | | | US$m | | | US$m | |
| | | | | | | | | | | | | | | | | | | | | | | | | | | | | |
Profit/(loss) before tax | | | | | | | | | | | | | | | | | | | | | | | | | | | | |
| | | | | | | | | | | | | | | | | | | | | | | | | | | | | |
| Net interest income/(expense) | | | 11,244 | | | | 1,391 | | | | 999 | | | | 178 | | | | (84 | ) | | | (58 | ) | | | 13,670 | |
| | | | | | | | | | | | | | | | | | | | | | | | | | | | | |
| Net fee income | | | 3,174 | | | | 453 | | | | 1,045 | | | | 142 | | | | 3 | | | | – | | | | 4,817 | |
| | | | | | | | | | | | | | | |
| Trading income/(expense) excluding net interest income | | | 257 | | | | (10 | ) | | | (179 | ) | | | (3 | ) | | | (30 | ) | | | – | | | | 35 | |
| Net interest income/(expense) on trading activities | | | 60 | | | | 3 | | | | 175 | | | | (1) | | | | 1 | | | | 58 | | | | 296 | |
| | | | | | | | | | | | | | | |
Net trading income/(expense)49 | | | 317 | | | | (7 | ) | | | (4 | ) | | | (4 | ) | | | (29 | ) | | | 58 | | | | 331 | |
| | | | | | | | | | | | | | | |
| Changes in fair value of long- term debt issued and related derivatives | | | – | | | | – | | | | – | | | | – | | | | (3,497 | ) | | | – | | | | (3,497 | ) |
| Net income from other financial instruments designated at fair value | | | – | | | | – | | | | – | | | | – | | | | 1 | | | | – | | | | 1 | |
| | | | | | | | | | | | | | | |
| Net expense from financial instruments designated at fair value | | | – | | | | – | | | | – | | | | – | | | | (3,496 | ) | | | – | | | | (3,496 | ) |
| Gains less losses from financial investments | | | 16 | | | | 3 | | | | 277 | | | | – | | | | – | | | | – | | | | 296 | |
| Dividend income | | | 21 | | | | 5 | | | | 27 | | | | 2 | | | | (2 | ) | | | – | | | | 53 | |
| Net earned insurance premiums | | | 309 | | | | – | | | | – | | | | – | | | | – | | | | – | | | | 309 | |
| Other operating income | | | 9 | | | | 162 | | | | 317 | | | | 11 | | | | 1,828 | | | | (1,761 | ) | | | 566 | |
| | | | | | | | | | | | | | | |
| | | | | | | | | | | | | | | | | | | | | | | | | | | | | |
| Total operating income/(expense) | | | 15,090 | | | | 2,007 | | | | 2,661 | | | | 329 | | | | (1,780 | ) | | | (1,761 | ) | | | 16,546 | |
| | | | | | | | | | | | | | | | | | | | | | | | | | | | | |
Net insurance claims57 | | | (241 | ) | | | – | | | | – | | | | – | | | | – | | | | – | | | | (241 | ) |
| | | | | | | | | | | | | | | |
| | | | | | | | | | | | | | | | | | | | | | | | | | | | | |
Net operating income/(expense)46 | | | 14,849 | | | | 2,007 | | | | 2,661 | | | | 329 | | | | (1,780 | ) | | | (1,761 | ) | | | 16,305 | |
| | | | | | | | | | | | | | | | | | | | | | | | | | | | | |
| Loan impairment charges and other credit risk provisions | | | (14,424 | ) | | | (519 | ) | | | (621 | ) | | | (98 | ) | | | (2 | ) | | | – | | | | (15,664 | ) |
| | | | | | | | | | | | | | | |
| | | | | | | | | | | | | | | | | | | | | | | | | | | | | |
| Net operating income/(expense) | | | 425 | | | | 1,488 | | | | 2,040 | | | | 231 | | | | (1,782 | ) | | | (1,761 | ) | | | 641 | |
| | | | | | | | | | | | | | | | | | | | | | | | | | | | | |
| Total operating expenses | | | (5,651 | ) | | | (958 | ) | | | (1,328 | ) | | | (281 | ) | | | (1,934 | ) | | | 1,761 | | | | (8,391 | ) |
| | | | | | | | | | | | | | | |
| | | | | | | | | | | | | | | | | | | | | | | | | | | | | |
| Operating profit/(loss) | | | (5,226 | ) | | | 530 | | | | 712 | | | | (50 | ) | | | (3,716 | ) | | | – | | | | (7,750 | ) |
| | | | | | | | | | | | | | | | | | | | | | | | | | | | | |
| Share of profit/(loss) in associates and joint ventures | | | – | | | | 13 | | | | – | | | | – | | | | (1 | ) | | | – | | | | 12 | |
| | | | | | | | | | | | | | | |
| | | | | | | | | | | | | | | | | | | | | | | | | | | | | |
| Profit/(loss) before tax | | | (5,226 | ) | | | 543 | | | | 712 | | | | (50 | ) | | | (3,717 | ) | | | – | | | | (7,738 | ) |
| | | | | | | | | | | | | | | |
| | | | | | | | | | | | | | | | | | | | | | | | | | | | | |
| | | | % | | | | % | | | | % | | | | % | | | | % | | | | | | | | % | |
| | | | | | | | | | | | | | | | | | | | | | | | | | | | | |
| Share of HSBC’s profit before tax | | | (73.8 | ) | | | 7.7 | | | | 10.1 | | | | (0.7 | ) | | | (52.6 | ) | | | | | | | (109.3 | ) |
| Cost efficiency ratio | | | 38.1 | | | | 47.7 | | | | 49.9 | | | | 85.4 | | | | (108.7 | ) | | | | | | | 51.5 | |
| | | | | | | | | | | | | | | | | | | | | | | | | | | | | |
Balance sheet data45 | | | | | | | | | | | | | | | | | | | | | | | | | | | | |
| | | US$m | | | US$m | | | US$m | | | US$m | | | US$m | | | | | | | US$m | |
| | | | | | | | | | | | | | | | | | | | | | | | | | | | | |
| Loans and advances to customers (net) | | | 151,671 | | | | 31,292 | | | | 18,654 | | | | 5,236 | | | | – | | | | | | | | 206,853 | |
| Total assets | | | 179,597 | | | | 38,232 | | | | 260,131 | | | | 6,572 | | | | 2,071 | | | | (11,589 | ) | | | 475,014 | |
| Customer accounts | | | 74,228 | | | | 42,900 | | | | 19,095 | | | | 12,834 | | | | 100 | | | | | | | | 149,157 | |
| | | | | | | | | | | | | | | | | | | | | | | | | | | | | |
75
Report of the Directors: Operating and Financial Review(continued)
| | | | | | | | | | | | | | | | | | | | | | | | | | | | | |
| North America | | 2008 |
| | | Personal | | | | | | | Global | | | Global | | | | | | | Inter- | | | | |
| | | Financial | | | Commercial | | | Banking & | | | Private | | | | | | | segment | | | | |
| | | Services | | | Banking | | | Markets | | | Banking | | | Other | | | elimination | 56 | | Total | |
| | | US$m | | | US$m | | | US$m | | | US$m | | | US$m | | | US$m | | | US$m | |
| | | | | | | | | | | | | | | | | | | | | | | | | | | | | |
Profit/(loss) before tax | | | | | | | | | | | | | | | | | | | | | | | | | | | | |
| | | | | | | | | | | | | | | | | | | | | | | | | | | | | |
| Net interest income | | | 12,632 | | | | 1,480 | | | | 1,064 | | | | 224 | | | | 22 | | | | (204 | ) | | | 15,218 | |
| | | | | | | | | | | | | | | | | | | | | | | | | | | | | |
| Net fee income/(expense) | | | 3,896 | | | | 391 | | | | 818 | | | | 181 | | | | (59 | ) | | | – | | | | 5,227 | |
| | | | | | | | | | | | | | | |
| Trading income/(expense) excluding net interest income | | | (250 | ) | | | 5 | | | | (3,516 | ) | | | 10 | | | | (128 | ) | | | – | | | | (3,879 | ) |
| Net interest income/(expense) on trading activities | | | 66 | | | | – | | | | 584 | | | | – | | | | (110 | ) | | | 204 | | | | 744 | |
| | | | | | | | | | | | | | | |
Net trading income/(expense)49 | | | (184 | ) | | | 5 | | | | (2,932 | ) | | | 10 | | | | (238 | ) | | | 204 | | | | (3,135 | ) |
| | | | | | | | | | | | | | | |
| Changes in fair value of long-term debt issued and related derivatives | | | – | | | | – | | | | – | | | | – | | | | 3,736 | | | | – | | | | 3,736 | |
| Net income/(expense) from other financial instruments designated at fair value | | | (2 | ) | | | – | | | | (1 | ) | | | – | | | | 4 | | | | – | | | | 1 | |
| | | | | | | | | | | | | | | |
| Net income/(expense) from financial instruments designated at fair value | | | (2 | ) | | | – | | | | (1 | ) | | | – | | | | 3,740 | | | | – | | | | 3,737 | |
| Gains less losses from financial investments | | | 65 | | | | 5 | | | | (209 | ) | | | – | | | | 19 | | | | – | | | | (120 | ) |
| Dividend income | | | 36 | | | | 11 | | | | 27 | | | | 3 | | | | – | | | | – | | | | 77 | |
| Net earned insurance premiums | | | 390 | | | | – | | | | – | | | | – | | | | – | | | | – | | | | 390 | |
| Other operating income/(expense) | | | (426 | ) | | | 140 | | | | 240 | | | | 20 | | | | 1,419 | | | | (1,370 | ) | | | 23 | |
| | | | | | | | | | | | | | | |
| Total operating income/(expense) | | | 16,407 | | | | 2,032 | | | | (993 | ) | | | 438 | | | | 4,903 | | | | (1,370 | ) | | | 21,417 | |
| |
Net insurance claims57 | | | (238 | ) | | | – | | | | – | | | | – | | | | – | | | | – | | | | (238 | ) |
| | | | | | | | | | | | | | | |
Net operating income/(expense)46 | | | 16,169 | | | | 2,032 | | | | (993 | ) | | | 438 | | | | 4,903 | | | | (1,370 | ) | | | 21,179 | |
| |
| Loan impairment charges and other credit risk provisions | | | (16,132 | ) | | | (449 | ) | | | (198 | ) | | | (16 | ) | | | – | | | | – | | | | (16,795 | ) |
| | | | | | | | | | | | | | | |
| | | | | | | | | | | | | | | | | | | | | | | | | | | | | |
| Net operating income/(expense) | | | 37 | | | | 1,583 | | | | (1,191 | ) | | | 422 | | | | 4,903 | | | | (1,370 | ) | | | 4,384 | |
| | | | | | | | | | | | | | | | | | | | | | | | | | | | | |
| Operating expenses (excluding goodwill impairment) | | | (6,701 | ) | | | (937 | ) | | | (1,384 | ) | | | (339 | ) | | | (1,368 | ) | | | 1,370 | | | | (9,359 | ) |
| Goodwill impairment | | | (10,564 | ) | | | – | | | | – | | | | – | | | | – | | | | – | | | | (10,564 | ) |
| | | | | | | | | | | | | | | |
| Operating profit/(loss) | | | (17,228 | ) | | | 646 | | | | (2,575 | ) | | | 83 | | | | 3,535 | | | | – | | | | (15,539 | ) |
| | | | | | | | | | | | | | | | | | | | | | | | | | | | | |
| Share of profit/(loss) in associates and joint ventures | | | – | | | | 12 | | | | – | | | | – | | | | (1 | ) | | | – | | | | 11 | |
| | | | | | | | | | | | | | | |
| Profit/(loss) before tax | | | (17,228 | ) | | | 658 | | | | (2,575 | ) | | | 83 | | | | 3,534 | | | | – | | | | (15,528 | ) |
| | | | | | | | | | | | | | | |
| | | | | | | | | | | | | | | | | | | | | | | | | | | | | |
| | | | % | | | | % | | | | % | | | | % | | | | % | | | | | | | | % | |
| |
| Share of HSBC’s profit before tax | | | (185.1 | ) | | | 7.1 | | | | (27.7 | ) | | | 0.9 | | | | 38.0 | | | | | | | | (166.8 | ) |
| Cost efficiency ratio | | | 106.8 | | | | 46.1 | | | | (139.4 | ) | | | 77.4 | | | | 27.9 | | | | | | | | 94.1 | |
| | | | | | | | | | | | | | | | | | | | | | | | | | | | | |
Balance sheet data45 | | | | | | | | | | | | | | | | | | | | | | | | | | | | |
| | | US$m | | | US$m | | | US$m | | | US$m | | | US$m | | | | | | | US$m | |
| |
| Loans and advances to customers (net) | | | 179,663 | | | | 35,725 | | | | 35,583 | | | | 5,243 | | | | – | | | | | | | | 256,214 | |
| Total assets | | | 205,722 | | | | 42,211 | | | | 348,347 | | | | 7,054 | | | | 3,323 | | | | (10,355 | ) | | | 596,302 | |
| Customer accounts | | | 65,830 | | | | 39,105 | | | | 23,844 | | | | 14,657 | | | | 96 | | | | | | | | 143,532 | |
| | | | | | | | | | | | | | | | | | | | | | | | | | | | | |
For footnotes, see page 83. | | | | | | | | | | | | | | | | | | | | | | | | | | | | |
75a
Report of the Directors: Operating and Financial Review(continued)
Latin America
Our operations in Latin America principally comprise HSBC Bank Brasil S.A.-Banco Múltiplo, HSBC México, S.A., HSBC Bank Argentina S.A. and HSBC Bank (Panama) S.A. In addition to banking services, we operate insurance businesses in Brazil, Mexico, Argentina, Panama and a range of smaller markets.
| | | | | | | | | | | | | |
| | | 2010 | | | 2009 | | | 2008 | |
| | | US$m | | | US$m | | | US$m | |
| | | | | | | | | | | | | |
| Net interest income | | | 6,311 | | | | 5,573 | | | | 6,458 | |
| Net fee income | | | 1,749 | | | | 1,729 | | | | 2,167 | |
| Net trading income | | | 733 | | | | 848 | | | | 701 | |
| Other income | | | 938 | | | | 874 | | | | 1,187 | |
| | | | | | | |
| | | | | | | | | | | | | |
Net operating income46 | | | 9,731 | | | | 9,024 | | | | 10,513 | |
| | | | | | | | | | | | | |
Impairment charges47 | | | (1,544 | ) | | | (2,526 | ) | | | (2,492 | ) |
| | | | | | | |
| | | | | | | | | | | | | |
Net operating income | | | 8,187 | | | | 6,498 | | | | 8,021 | |
| | | | | | | | | | | | | |
| Total operating expenses | | | (6,394 | ) | | | (5,375 | ) | | | (5,990 | ) |
| | | | | | | |
| | | | | | | | | | | | | |
Operating profit | | | 1,793 | | | | 1,123 | | | | 2,031 | |
| | | | | | | | | | | | | |
Income from associates48 | | | 2 | | | | 1 | | | | 6 | |
| | | | | | | |
| | | | | | | | | | | | | |
Profit before tax | | | 1,795 | | | | 1,124 | | | | 2,037 | |
| | | | | | | |
| | | | | | | | | | | | | |
| Cost efficiency ratio | | | 65.7% | | | | 59.6% | | | | 57.0% | |
| | | | | | | | | | | | | |
| Year-end staff numbers | | | 56,044 | | | | 54,288 | | | | 58,559 | |
Higher pre-tax profits
driven by an improvement
in credit quality
Record pre-tax profits
in Brazil of over
US$1bn
New sales desks established
to promote trade with
mainland China
For footnotes, see page 83.
The commentary on Latin America is on an underlying basis unless stated otherwise.
TheBrazilianeconomy expanded at its fastest rate in three decades in 2010, with GDP growing 7.5% on an annual basis in the third quarter. Consumer demand played a major role supported by a rapid expansion of credit, which rose by 20.5% in 2010, and robust labour market conditions, as the unemployment rate fell to an all-time low of 5.3% in December. The growth of domestic demand led to a rapid rise in import growth and a widening of Brazil’s current account deficit and contributed, along with a rise in food prices during the year, to an increase in CPI inflation to 5.9% in December compared with 4.3% at the end of 2009. The Central Bank tightened monetary policy by 2 percentage points between April and July 2010 and raised commercial banks’ reserve requirements and capital adequacy ratios on certain consumer loans in December.
Mexico’seconomy continued to recover in 2010, and GDP rose by 5.5% in the year. Strong external demand was the main driver of the recovery, leading to robust growth in the production of Mexican manufactured goods. By contrast, domestic demand was lacklustre, reflecting high unemployment, restricted credit availability and low levels of consumer confidence. This weak domestic demand and the rise in the peso kept inflation subdued during 2010 and the Central Bank of Mexico maintained its policy rate at 4.5% throughout the year.
InArgentina, third quarter GDP was 7.5% higher than for the comparable period in 2009. This improvement was led by a strong rebound in industrial production, which expanded by 12.7% in the year to November 2010. The manufacture of motor vehicles recovered particularly strongly, rising by 35% during the year, with many being exported to Brazil. Inflation remained high, in part due to rapid growth in the price of food and beverages.
Our operations in Latin America reported pre-tax profits of US$1.8bn compared with US$1.1bn in 2009, largely reflecting the strong performance in Brazil, which recorded pre-tax profits in excess of US$1bn for the first time. On an underlying basis, pre-tax profits increased by 49% as loan impairment charges declined, reflecting better economic conditions and actions taken to improve asset quality by managing down riskier portfolios and enhancing risk management processes. Revenue was marginally lower as trading income declined from the strong performance recorded in 2009 and fee income fell
76
Report of the Directors: Operating and Financial Review(continued)
Profit/(loss) before tax by country within customer groups and global businesses
| | | | | | | | | | | | | | | | | | | | | | | | | |
| | | Personal | | | | | | | Global | | | Global | | | | | | | |
| | | Financial | | | Commercial | | | Banking & | | | Private | | | | | | | |
| | | Services | | | Banking | | | Markets | | | Banking | | | Other | | | Total | |
| | | US$m | | | US$m | | | US$m | | | US$m | | | US$m | | | US$m | |
2010 | | | | | | | | | | | | | | | | | | | | | | | | |
| Argentina | | | 88 | | | | 90 | | | | 106 | | | | – | | | | – | | | | 284 | |
| Brazil | | | 93 | | | | 382 | | | | 488 | | | | 6 | | | | 64 | | | | 1,033 | |
| Mexico | | | 165 | | | | 24 | | | | 219 | | | | 4 | | | | (11 | ) | | | 401 | |
| Panama | | | 48 | | | | 57 | | | | 33 | | | | 2 | | | | – | | | | 140 | |
| Other | | | (100 | ) | | | 1 | | | | 51 | | | | (2 | ) | | | (13 | ) | | | (63 | ) |
| | | | | | | | | | | | | |
| | | | 294 | | | | 554 | | | | 897 | | | | 10 | | | | 40 | | | | 1,795 | |
| | | | | | | | | | | | | |
| 2009 | | | | | | | | | | | | | | | | | | | | | | | | |
| Argentina | | | 24 | | | | 86 | | | | 122 | | | | – | | | | – | | | | 232 | |
| Brazil | | | (224 | ) | | | 211 | | | | 515 | | | | 5 | | | | 3 | | | | 510 | |
| Mexico | | | (31 | ) | | | 66 | | | | 230 | | | | 7 | | | | – | | | | 272 | |
| Panama | | | 69 | | | | 55 | | | | 24 | | | | – | | | | – | | | | 148 | |
| Other | | | (54 | ) | | | (19 | ) | | | 40 | | | | (1 | ) | | | (4 | ) | | | (38 | ) |
| | | | | | | | | | | | | |
| | | | | | | | | | | | | | | | | | | | | | | | | |
| | | | (216 | ) | | | 399 | | | | 931 | | | | 11 | | | | (1 | ) | | | 1,124 | |
| | | | | | | | | | | | | |
| | | | | | | | | | | | | | | | | | | | | | | | | |
| 2008 | | | | | | | | | | | | | | | | | | | | | | | | |
| Argentina | | | – | | | | 111 | | | | 113 | | | | – | | | | – | | | | 224 | |
| Brazil | | | 250 | | | | 348 | | | | 298 | | | | 8 | | | | 6 | | | | 910 | |
| Mexico | | | 360 | | | | 157 | | | | 190 | | | | 7 | | | | – | | | | 714 | |
| Panama | | | 51 | | | | 37 | | | | 33 | | | | – | | | | – | | | | 121 | |
| Other | | | 7 | | | | 53 | | | | 7 | | | | 1 | | | | – | | | | 68 | |
| | | | | | | | | | | | | |
| | | | | | | | | | | | | | | | | | | | | | | | | |
| | | | 668 | | | | 706 | | | | 641 | | | | 16 | | | | 6 | | | | 2,037 | |
| | | | | | | | | | | | | |
due to reduced transaction volumes, although this was largely offset by increased income from Balance Sheet Management.
In PFS, spreads tightened in Mexico as lending was refocused from higher-yielding consumer loans to higher quality assets. The managing down of certain portfolios in Brazil and Mexico and the strengthening of underwriting and collections processes resulted in an overall increase in pre-tax profit in PFS. Across the region we continued to focus on new customer acquisition in the mass affluent market segment through our Premier and Advance propositions. The number of Premier customers increased to over 790,000 at 31 December 2010. Advance was launched in Brazil, Mexico, Argentina, Panama and Chile in 2010 and customer numbers exceeded 425,000 at the end of the year. The insurance business continued to perform strongly, with revenue growing in Brazil, Mexico and Argentina due to the improving economic conditions.
The regional economic recovery and our focus on growing the CMB business drove increased domestic lending in our major markets. GB&M and CMB both benefited from our global connectivity by increasing intra-regional and inter-regional business, with GB&M in particular contributing to other regions and customer groups through increased cross-referrals. Our operations in Brazil and
mainland China worked closely together on a number of initiatives, including the completion of the first renminbi-denominated trade settlement in the region. Dedicated sales desks were established in mainland China and Hong Kong to support our Latin America customers and promote trade with Brazil.
Net interest incomeincreased by 4% to US$6.3bn. Increased volumes of financial investments, a decline in the cost of funding trading positions as market interest rates fell and a change in the portfolio mix to higher-yielding longer-term assets drove a rise in revenue from Balance Sheet Management.
Average customer lending balances fell in PFS, as certain portfolios were managed down, notably in credit cards in Mexico and other higher-risk personal loan balances in Mexico and Brazil. However, year-end balances were higher than in 2009 as we reversed the decline in customer lending by selectively growing certain portfolios. Demand-driven lending increased in CMB and GB&M in Brazil and Argentina while, in Mexico, increased average lending balances in CMB were attributable to the continued strategy of targeting state and municipal customers.
Our operations in Brazil actively grew customer account balances to fund loan growth and meet higher liquidity requirements following regulatory
77
Report of the Directors: Operating and Financial Review(continued)
changes. In Mexico and Argentina, sales and marketing initiatives supported by product and channel enhancements resulted in an increase in current and savings account balances. However, the benefit was partly offset by tighter spreads on customer accounts as a result of decreased market interest rates in Mexico and Argentina.
Fee incomefell by 7% to US$1.7bn, driven by lower transaction volumes in credit cards and account services in Mexico and reduced account services income in Brazil. Regulatory restrictions in Brazil and Mexico also reduced the fees that could be charged for certain banking services.
Net trading incomeof US$733m was 23% lower than in 2009. A decline in market volatility which resulted in fewer trading opportunities meant that the strong performances in Foreign Exchange and Rates in 2009 were not repeated.
Net income on financial instruments designated at fair valuedeclined by 21% to US$425m, primarily due to lower investment returns experienced on assets held in support of the pension-linked portfolio in Brazil and annuity products in Argentina. An offsetting decrease was recorded in ‘Net insurance claims incurred and movement in liabilities to policyholders’.
Gains less losses from financial investmentsdeclined by US$93m, largely because the gains on the sale of Visa Inc. shares in 2009 did not recur.
Net earned insurance premiumsincreased marginally to US$2.1bn, driven by improved economic conditions which resulted in higher sales of policies in Brazil and Argentina through the branch network and a rise in premiums in Mexico. This, combined with repricing initiatives in Argentina and higher contributions in the pension-linked product in Brazil from PFS and CMB customers, resulted in increased premiums.
Net insurance claims incurred and movement in liabilities to policyholdersof US$1.8bn declined by 9%, mainly in pension-linked products in Brazil as lower investment gains were allocated to policyholders. This was partly offset by an increase related to higher premiums in Argentina and Mexico.
Loan impairment charges and other credit risk provisionsdeclined by 44% in 2010 to US$1.5bn. In PFS, the reduction in loan impairment charges reflected a significant decline in the size of the credit card portfolio in Mexico and an improvement in its quality as a result of repositioning the portfolio towards higher quality customers, tighter origination criteria and improved collection practices. Loan impairment charges also declined in Brazil, primarily in consumer finance portfolios including motor vehicle finance and payroll loans, as economic conditions improved and these portfolios were managed down. In CMB, loan impairment charges fell, largely in Brazil, as improved economic conditions and better credit quality resulted in lower specific impairment charges, while in Mexico loan impairment charges remained broadly unchanged.
Operating expensesincreased by 10% to US$6.4bn, driven largely by inflationary pressures and investment in infrastructure and technology projects across the region in support of improved operational efficiency and business growth. Staff costs increased in Brazil and Argentina due to union-agreed wage increases, although this was partly offset by a decline in average headcount as costs continued to be managed carefully. Non-staff expenditure also rose, driven mainly by higher marketing and advertising costs in Brazil as we positioned ourselves in this key growth market, and transactional taxes increased as sales grew.
78
Report of the Directors: Operating and Financial Review(continued)
A mixture of weak external demand and the disruption caused by the H1N1 virus contributed to a substantial deterioration in economic conditions inMexicoduring the first half of 2009. The period of recession ended decisively as the economy improved strongly during the third quarter of the year, but the previous sharp decline in activity had left GDP some 6.2% below the comparable figure in 2008. The annual CPI rate continued to moderate, falling from 6.5% in December 2008 to 3.6% in December 2009. In response to the deterioration in economic conditions, the Bank of Mexico cut its overnight interest rate by 375 basis points during the first seven months of 2009 to 4.5% by the end of the year.
TheBrazilianeconomy experienced a mild contraction during the early months of 2009 but returned to growth during the second quarter of the year, helped by a recovery in household consumption and a broader stabilisation of external demand and commodity prices. Starting the year at unusually low levels, the unemployment rate increased during the early months of 2009 relative to the comparable period of 2008, before declining to the historically low level of 6.8% in December 2009. The annual CPI rate moderated from 5.9% in December 2008 to a level slightly below the central banks’ targeted rate of 4.5% at the year end. Faced with this softening of economic conditions and diminishing inflationary pressures, the central bank of Brazil reduced the policy Selic target rate by a cumulative 500 basis points during the first seven months of 2009, placing the rate at 8.75% at the end of the period.
InArgentina, economic activity was adversely affected by the decline in external demand during 2009, with a very weak level of growth being reported around the middle of the year. Industrial production is reported to have risen by 0.4% during 2009. The improving global and regional outlook during the second half of 2009 and a recovery in commodity prices provided some relief to the economy, enabling interest rates to ease.
Our operations in Latin America reported pre-tax profits of US$1.1bn, compared with US$2.0bn in 2008. On an underlying basis, pre-tax profits decreased by 33%, primarily attributable to significantly higher loan impairment charges in PFS and CMB and lower revenues in PFS. GB&M’s
performance improved driven by strong results in trading and Balance Sheet Management.
2009 was a year of consolidating risk policies and strongly emphasising cost control. We injected additional capital into Brazil and Mexico during the fourth quarter of 2009, in line with our strategy of focusing on emerging markets. In both Panama and Argentina, strong results were achieved in spite of the challenging economic environment. However, performance in Honduras, Costa Rica and El Salvador was significantly affected by higher loan impairment charges and lower income. One HSBC and Group systems were implemented in Chile and the operations in Panama were fully integrated.
Net interest incomeremained broadly in line with 2008 excluding the one-off interest income which arose on recovery of transactional taxes on insurance transactions in Brazil in 2008. Net interest income decreased in PFS as average customer lending volumes declined, primarily driven by actions taken to tighten credit criteria and manage down existing higher risk portfolios including credit cards, personal loans and vehicle finance. The effect was partly offset by higher income on increased lending to commercial customers, primarily in Brazil. Repricing initiatives taken during 2008 and early 2009 drove increased spreads on lending products.
Average customer deposit balances rose, resulting from an increase in commercial and Global Banking balances. In Mexico, PFS launched new deposit products to mitigate the fall in deposits. Deposit spreads narrowed due to falling interest rates, also primarily in Mexico.
Interest income rose in Balance Sheet Management, primarily in Brazil.
Net fee incomedeclined by 8%. Tighter credit origination criteria resulted in lower credit card fees in Mexico. Account service fees also fell, primarily due to lower transaction volumes. Weak equity market performance in Brazil led to lower assets under management and related fee income. This was partly offset by growth in restructuring fees in GB&M.
Net trading incomerose by 42% due to a strong performance in GB&M, particularly in the first half of the year in Brazil. This resulted from increased foreign exchange and Rates trading income, which benefited from early positioning against interest rate movements in a volatile market.
Net income from financial instruments designated at fair valuerose by 36%, primarily from higher insurance-related assets. This resulted from
78(a)
Report of the Directors: Operating and Financial Review(continued)
business growth and a recovery of the Brazilian equity markets as well as an increase in the fair value of fixed income securities held in support of personal pension portfolios in the country. An offsetting increase was recorded in net insurance claims incurred and movement in liabilities to policyholders.
Net earned insurance premiumsrose by 24%, driven by higher sales of pension and life assurance products. In addition, a number of customers in Brazil switched their personal pension annuities to HSBC. These gains were partially offset by the impact of the 2008 nationalisation of the pension system in Argentina on the annuities business there.
Net insurance claims incurred and movement in liabilities to policyholdersrose, primarily as a result of the fair value movement on financial instruments referred to above and insurance business growth.
Other operating incomefell by 29%, largely due to the non-recurrence of gains arising in 2008 on a refinement of the income recognition methodology used in respect of long-term insurance contracts in Brazil. In 2009, a one-off gain was realised on the sale of the head office in Argentina.
Loan impairment charges and other credit risk provisionsrose by 15% as economic conditions deteriorated across the region. In the first half of 2009, our delinquencies rose as GDP fell and unemployment increased. The situation was exacerbated by the H1N1 virus in Mexico and the related economic shutdown. With the introduction of enhanced credit risk management techniques and gradual economic recovery, loan impairment charges in the second half of 2009 decreased by 11% compared with the second half of 2008 and by 27% on the first half of 2009.
In PFS, the combination of portfolio seasoning, which followed expansion in market share in
previous years, and increased delinquencies in secured and unsecured personal lending products such as personal loans and payroll loans in Brazil and cards and mortgages in Mexico, resulted in higher loan impairment charges, mainly in the first half of 2009. Some payroll loan portfolios were run down in Brazil, as were several consumer finance and unsecured portfolios in Mexico. Loan impairment charges in PFS fell by 8% in the second half of the year compared with the same period in 2008 and by 27% compared with the first half of 2009.
Loan impairment charges rose in commercial lending portfolios, primarily in Business Banking and mid-market business segments in Brazil, as trade levels fell as a consequence of the global economic slowdown. This was partly offset by net releases in loan impairment charges in GB&M when compared with a net charge in 2008.
Operating expensesincreased slightly by 2%, well below the inflation rates of the main economies in which we operate, reflecting significant cost control measures. The benefit from the reduction in staff numbers, which began in 2008 and continued in 2009, was partially offset by union-agreed pay rises. Savings in general and administrative costs were offset by investment expenditure on regional initiatives to centralise certain back office processes, and the implementation of One HSBC and Group systems intended to drive future operational efficiencies. Costs also increased in the form of higher litigation expenses and transactional taxes, the latter partly from the non-recurrence of a recovery of transactional taxes in the insurance business in 2008.
78(b)
Report of the Directors: Operating and Financial Review(continued)
Profit/(loss) before tax and balance sheet data – Latin America
| | | | | | | | | | | | | | | | | | | | | | | | | | | | | |
| | | 2010 |
| | | Personal | | | | | | | Global | | | Global | | | | | | | Inter- | | | | |
| | | Financial | | | Commercial | | | Banking & | | | Private | | | | | | | segment | | | | |
| | | Services | | | Banking | | | Markets | | | Banking | | | Other | | | elimination | 56 | | Total | |
| | | US$m | | | US$m | | | US$m | | | US$m | | | US$m | | | US$m | | | US$m | |
| | | | | | | | | | | | | | | | | | | | | | | | | | | | | |
Profit/(loss) before tax | | | | | | | | | | | | | | | | | | | | | | | | | | | | |
| | | | | | | | | | | | | | | | | | | | | | | | | | | | | |
| Net interest income | | | 3,975 | | | | 1,671 | | | | 776 | | | | 20 | | | | 121 | | | | (252 | ) | | | 6,311 | |
| | | | | | | | | | | | | | | | | | | | | | | | | | | | | |
| Net fee income/(expense) | | | 899 | | | | 526 | | | | 298 | | | | 32 | | | | (6 | ) | | | – | | | | 1,749 | |
| | | | | | | | | | | | | | | | | | | | | | | | | | | | | |
| | | | | | | | | | | | | | | | | | | | | | |
| Trading income/(expense) excluding net interest income | | | 35 | | | | 72 | | | | 370 | | | | 3 | | | | (27 | ) | | | – | | | | 453 | |
| Net interest income on trading activities | | | – | | | | – | | | | 28 | | | | – | | | | – | | | | 252 | | | | 280 | |
| | | | | | | | | | | | | | | | | | | | | | |
| | | | | | | | | | | | | | | | | | | | | | | | | | | | | |
Net trading income/(expense)49 | | | 35 | | | | 72 | | | | 398 | | | | 3 | | | | (27 | ) | | | 252 | | | | 733 | |
| | | | | | | | | | | | | | | | | | | | | | | | | | | | | |
| | | | | | | | | | | | | | | | | | | | | | |
| Changes in fair value of long-term debt issued and related derivatives | | | – | | | | – | | | | – | | | | – | | | | – | | | | – | | | | – | |
| Net income from other financial instruments designated at fair value | | | 339 | | | | 85 | | | | 1 | | | | – | | | | – | | | | – | | | | 425 | |
| | | | | | | | | | | | | | | | | | | | | | |
| | | | | | | | | | | | | | | | | | | | | | | | | | | | | |
| Net income from financial instruments designated at fair value | | | 339 | | | | 85 | | | | 1 | | | | – | | | | – | | | | – | | | | 425 | |
| Gains less losses from financial investments | | | 6 | | | | 2 | | | | 93 | | | | – | | | | (3 | ) | | | – | | | | 98 | |
| Dividend income | | | 7 | | | | 2 | | | | 3 | | | | – | | | | – | | | | – | | | | 12 | |
| Net earned insurance premiums | | | 1,651 | | | | 374 | | | | 29 | | | | – | | | | – | | | | – | | | | 2,054 | |
| Other operating income | | | 90 | | | | 34 | | | | 23 | | | | 2 | | | | 221 | | | | (229 | ) | | | 141 | |
| | | | | | | | | | | | | | | | | | | | | | |
| | | | | | | | | | | | | | | | | | | | | | | | | | | | | |
Total operating income | | | 7,002 | | | | 2,766 | | | | 1,621 | | | | 57 | | | | 306 | | | | (229 | ) | | | 11,523 | |
| | | | | | | | | | | | | | | | | | | | | | | | | | | | | |
Net insurance claims57 | | | (1,479 | ) | | | (297 | ) | | | (16 | ) | | | – | | | | – | | | | – | | | | (1,792 | ) |
| | | | | | | | | | | | | | | | | | | | | | |
| | | | | | | | | | | | | | | | | | | | | | | | | | | | | |
Net operating income46 | | | 5,523 | | | | 2,469 | | | | 1,605 | | | | 57 | | | | 306 | | | | (229 | ) | | | 9,731 | |
| | | | | | | | | | | | | | | | | | | | | | | | | | | | | |
| Loan impairment charges and other credit risk provisions | | | (1,247 | ) | | | (293 | ) | | | (4 | ) | | | – | | | | – | | | | – | | | | (1,544 | ) |
| | | | | | | | | | | | | | | | | | | | | | |
| | | | | | | | | | | | | | | | | | | | | | | | | | | | | |
Net operating income | | | 4,276 | | | | 2,176 | | | | 1,601 | | | | 57 | | | | 306 | | | | (229 | ) | | | 8,187 | |
| | | | | | | | | | | | | | | | | | | | | | | | | | | | | |
| Total operating expenses | | | (3,983 | ) | | | (1,623 | ) | | | (704 | ) | | | (47 | ) | | | (266 | ) | | | 229 | | | | (6,394 | ) |
| | | | | | | | | | | | | | | | | | | | | | |
| | | | | | | | | | | | | | | | | | | | | | | | | | | | | |
Operating profit | | | 293 | | | | 553 | | | | 897 | | | | 10 | | | | 40 | | | | – | | | | 1,793 | |
| | | | | | | | | | | | | | | | | | | | | | | | | | | | | |
| Share of profit in associates and joint ventures | | | 1 | | | | 1 | | | | – | | | | – | | | | – | | | | – | | | | 2 | |
| | | | | | | | | | | | | | | | | | | | | | |
| | | | | | | | | | | | | | | | | | | | | | | | | | | | | |
Profit before tax | | | 294 | | | | 554 | | | | 897 | | | | 10 | | | | 40 | | | | – | | | | 1,795 | |
| | | | | | | | | | | | | | | | | | | | | | |
| | | | | | | | | | | | | | | | | | | | | | | | | | | | | |
| | | | % | | | | % | | | | % | | | | % | | | | % | | | | | | | | % | |
| | | | | | | | | | | | | | | | | | | | | | | | | | | | | |
| Share of HSBC’s profit before tax | | | 1.5 | | | | 2.9 | | | | 4.7 | | | | 0.1 | | | | 0.2 | | | | | | | | 9.4 | |
| Cost efficiency ratio | | | 72.1 | | | | 65.7 | | | | 43.9 | | | | 82.5 | | | | 86.9 | | | | | | | | 65.7 | |
| | | | | | | | | | | | | | | | | | | | | | | | | | | | | |
Balance sheet data45 | | | | | | | | | | | | | | | | | | | | | | | | | | | | |
| | | US$m | | | US$m | | | US$m | | | US$m | | | US$m | | | | | | | US$m | |
| | | | | | | | | | | | | | | | | | | | | | | | | | | | | |
Loans and advances to
customers (net) | | | 20,823 | | | | 24,879 | | | | 12,242 | | | | 43 | | | | – | | | | | | | | 57,987 | |
| Total assets | | | 38,764 | | | | 35,619 | | | | 64,690 | | | | 1,608 | | | | 196 | | | | (939 | ) | | | 139,938 | |
| Customer accounts | | | 30,149 | | | | 24,514 | | | | 27,810 | | | | 6,053 | | | | – | | | | | | | | 88,526 | |
79
Report of the Directors: Operating and Financial Review(continued)
| | | | | | | | | | | | | | | | | | | | | | | | | | | | | |
| Latin America | | 2009 |
| | | Personal | | | | | | | Global | | | Global | | | | | | | Inter- | | | | |
| | | Financial | | | Commercial | | | Banking & | | | Private | | | | | | | segment | | | | |
| | | Services | | | Banking | | | Markets | | | Banking | | | Other | | | elimination | 56 | | Total | |
| | | US$m | | | US$m | | | US$m | | | US$m | | | US$m | | | US$m | | | US$m | |
| | | | | | | | | | | | | | | | | | | | | | | | | | | | | |
Profit/(loss) before tax | | | | | | | | | | | | | | | | | | | | | | | | | | | | |
| | | | | | | | | | | | | | | | | | | | | | | | | | | | | |
| Net interest income/(expense) | | | 3,736 | | | | 1,544 | | | | 590 | | | | 19 | | | | (5 | ) | | | (311 | ) | | | 5,573 | |
| | | | | | | | | | | | | | | | | | | | | | | | | | | | | |
| Net fee income | | | 948 | | | | 490 | | | | 251 | | | | 28 | | | | 12 | | | | – | | | | 1,729 | |
| | | | | | | | | | | | | | | | | | | | | | | | | | | | | |
| | | | | | | | | | | | | | | |
| Trading income excluding net interest income | | | 25 | | | | 38 | | | | 573 | | | | 3 | | | | – | | | | – | | | | 639 | |
| Net interest income/(expense) on trading activities | | | 4 | | | | 2 | | | | (108 | ) | | | – | | | | – | | | | 311 | | | | 209 | |
| | | | | | | | | | | | | | | |
| | | | | | | | | | | | | | | | | | | | | | | | | | | | | |
Net trading income49 | | | 29 | | | | 40 | | | | 465 | | | | 3 | | | | – | | | | 311 | | | | 848 | |
| | | | | | | | | | | | | | | | | | | | | | | | | | | | | |
| | | | | | | | | | | | | | | |
| Changes in fair value of long-term debt issued and related derivatives | | | – | | | | – | | | | – | | | | – | | | | – | | | | – | | | | – | |
| Net income/(expense) from other financial instruments designated at fair value | | | 510 | | | | 12 | | | | (38 | ) | | | – | | | | 11 | | | | – | | | | 495 | |
| | | | | | | | | | | | | | | |
| | | | | | | | | | | | | | | | | | | | | | | | | | | | | |
| Net income/(expense) from financial instruments designated at fair value | | | 510 | | | | 12 | | | | (38 | ) | | | – | | | | 11 | | | | – | | | | 495 | |
| Gains less losses from financial investments | | | 91 | | | | – | | | | 77 | | | | – | | | | – | | | | – | | | | 168 | |
| Dividend income | | | 9 | | | | 1 | | | | 1 | | | | – | | | | – | | | | – | | | | 11 | |
| Net earned insurance premiums | | | 1,752 | | | | 105 | | | | 43 | | | | – | | | | – | | | | – | | | | 1,900 | |
| Other operating income/(expense) | | | 170 | | | | 35 | | | | 24 | | | | 2 | | | | (1 | ) | | | (97 | ) | | | 133 | |
| | | | | | | | | | | | | | | |
| | | | | | | | | | | | | | | | | | | | | | | | | | | | | |
| Total operating income | | | 7,245 | | | | 2,227 | | | | 1,413 | | | | 52 | | | | 17 | | | | (97 | ) | | | 10,857 | |
| | | | | | | | | | | | | | | | | | | | | | | | | | | | | |
Net insurance claims57 | | | (1,750 | ) | | | (58 | ) | | | (25 | ) | | | – | | | | – | | | | – | | | | (1,833 | ) |
| | | | | | | | | | | | | | | |
| | | | | | | | | | | | | | | | | | | | | | | | | | | | | |
Net operating income46 | | | 5,495 | | | | 2,169 | | | | 1,388 | | | | 52 | | | | 17 | | | | (97 | ) | | | 9,024 | |
| | | | | | | | | | | | | | | | | | | | | | | | | | | | | |
| Loan impairment (charges)/ recoveries and other credit risk provisions | | | (2,046 | ) | | | (534 | ) | | | 57 | | | | – | | | | (3 | ) | | | – | | | | (2,526 | ) |
| | | | | | | | | | | | | | | |
| | | | | | | | | | | | | | | | | | | | | | | | | | | | | |
| Net operating income | | | 3,449 | | | | 1,635 | | | | 1,445 | | | | 52 | | | | 14 | | | | (97 | ) | | | 6,498 | |
| | | | | | | | | | | | | | | | | | | | | | | | | | | | | |
| Total operating expenses | | | (3,666 | ) | | | (1,236 | ) | | | (514 | ) | | | (41 | ) | | | (15 | ) | | | 97 | | | | (5,375 | ) |
| | | | | | | | | | | | | | | |
| | | | | | | | | | | | | | | | | | | | | | | | | | | | | |
| Operating profit/(loss) | | | (217 | ) | | | 399 | | | | 931 | | | | 11 | | | | (1 | ) | | | – | | | | 1,123 | |
| | | | | | | | | | | | | | | | | | | | | | | | | | | | | |
| Share of profit in associates and joint ventures | | | 1 | | | | – | | | | – | | | | – | | | | – | | | | – | | | | 1 | |
| | | | | | | | | | | | | | | |
| | | | | | | | | | | | | | | | | | | | | | | | | | | | | |
| Profit/(loss) before tax | | | (216 | ) | | | 399 | | | | 931 | | | | 11 | | | | (1 | ) | | | – | | | | 1,124 | |
| | | | | | | | | | | | | | | |
| | | | | | | | | | | | | | | | | | | | | | | | | | | | | |
| | | | % | | | | % | | | | % | | | | % | | | | % | | | | | | | | % | |
| | | | | | | | | | | | | | | | | | | | | | | | | | | | | |
| Share of HSBC’s profit before tax | | | (3.1 | ) | | | 5.6 | | | | 13.2 | | | | 0.2 | | | | – | | | | | | | | 15.9 | |
| Cost efficiency ratio | | | 66.7 | | | | 57.0 | | | | 37.0 | | | | 78.8 | | | | 88.2 | | | | | | | | 59.6 | |
| | | | | | | | | | | | | | | | | | | | | | | | | | | | | |
Balance sheet data45 | | | | | | | | | | | | | | | | | | | | | | | | | | | | |
| | | | | | | | | | | | | | | | | | | | | | | | | | | | | |
| | | US$m | | | US$m | | | US$m | | | US$m | | | US$m | | | | | | | US$m | |
Loans and advances to
customers (net) | | | 19,748 | | | | 18,205 | | | | 9,645 | | | | 31 | | | | – | | | | | | | | 47,629 | |
| Total assets | | | 35,236 | | | | 23,212 | | | | 57,491 | | | | 328 | | | | 281 | | | | (581 | ) | | | 115,967 | |
| Customer accounts | | | 30,628 | | | | 19,775 | | | | 20,142 | | | | 2,344 | | | | – | | | | | | | | 72,889 | |
| | | | | | | | | | | | | | | | | | | | | | | | | | | | | |
80
Report of the Directors: Operating and Financial Review(continued)
| | | | | | | | | | | | | | | | | | | | | | | | | | | | | |
| Latin America | | 2008 |
| | | Personal | | | | | | | Global | | | Global | | | | | | | Inter- | | | | |
| | | Financial | | | Commercial | | | Banking & | | | Private | | | | | | | segment | | | | |
| | | Services | | | Banking | | | Markets | | | Banking | | | Other | | | elimination | 56 | | Total | |
| | | US$m | | | US$m | | | US$m | | | US$m | | | US$m | | | US$m | | | US$m | |
| | | | | | | | | | | | | | | | | | | | | | | | | | | | | |
Profit before tax | | | | | | | | | | | | | | | | | | | | | | | | | | | | |
| | | | | | | | | | | | | | | | | | | | | | | | | | | | | |
| Net interest income/(expense) | | | 4,582 | | | | 1,637 | | | | 579 | | | | 22 | | | | (35 | ) | | | (327 | ) | | | 6,458 | |
| | | | | | | | | | | | | | | | | | | | | | | | | | | | | |
| Net fee income | | | 1,339 | | | | 536 | | | | 248 | | | | 35 | | | | 9 | | | | – | | | | 2,167 | |
| | | | | | | | | | | | | | | | | | | | | | | | | | | | | |
| | | | | | | | | | | | | | | |
| Trading income excluding net interest income | | | 123 | | | | 27 | | | | 200 | | | | 3 | | | | 4 | | | | – | | | | 356 | |
| Net interest income/(expense) on trading activities | | | 7 | | | | 4 | | | | 8 | | | | – | | | | (2 | ) | | | 327 | | | | 345 | |
| | | | | | | | | | | | | | | |
| | | | | | | | | | | | | | | | | | | | | | | | | | | | | |
Net trading income49 | | | 130 | | | | 31 | | | | 208 | | | | 3 | | | | 2 | | | | 327 | | | | 701 | |
| | | | | | | | | | | | | | | | | | | | | | | | | | | | | |
| | | | | | | | | | | | | | | |
| Changes in fair value of long-term debt issued and related derivatives | | | – | | | | – | | | | – | | | | – | | | | – | | | | – | | | | – | |
| Net income from other financial instruments designated at fair value | | | 187 | | | | – | | | | 139 | | | | – | | | | 38 | | | | – | | | | 364 | |
| | | | | | | | | | | | | | | |
| | | | | | | | | | | | | | | | | | | | | | | | | | | | | |
| Net income from financial instruments designated at fair value | | | 187 | | | | – | | | | 139 | | | | – | | | | 38 | | | | – | | | | 364 | |
| Gains less losses from financial investments | | | 132 | | | | 21 | | | | 21 | | | | 2 | | | | – | | | | – | | | | 176 | |
| Dividend income | | | 16 | | | | 1 | | | | 3 | | | | – | | | | – | | | | – | | | | 20 | |
| Net earned insurance premiums | | | 1,547 | | | | 82 | | | | 88 | | | | – | | | | – | | | | – | | | | 1,717 | |
| Other operating income | | | 244 | | | | 57 | | | | 39 | | | | 3 | | | | 8 | | | | (51 | ) | | | 300 | |
| | | | | | | | | | | | | | | |
| | | | | | | | | | | | | | | | | | | | | | | | | | | | | |
| Total operating income | | | 8,177 | | | | 2,365 | | | | 1,325 | | | | 65 | | | | 22 | | | | (51 | ) | | | 11,903 | |
| | | | | | | | | | | | | | | | | | | | | | | | | | | | | |
Net insurance claims57 | | | (1,281 | ) | | | (42 | ) | | | (68 | ) | | | – | | | | 1 | | | | – | | | | (1,390 | ) |
| | | | | | | | | | | | | | | |
| | | | | | | | | | | | | | | | | | | | | | | | | | | | | |
Net operating income46 | | | 6,896 | | | | 2,323 | | | | 1,257 | | | | 65 | | | | 23 | | | | (51 | ) | | | 10,513 | |
| | | | | | | | | | | | | | | | | | | | | | | | | | | | | |
| Loan impairment charges and other credit risk provisions | | | (2,120 | ) | | | (340 | ) | | | (29 | ) | | | – | | | | (3 | ) | | | – | | | | (2,492 | ) |
| | | | | | | | | | | | | | | |
| | | | | | | | | | | | | | | | | | | | | | | | | | | | | |
| Net operating income | | | 4,776 | | | | 1,983 | | | | 1,228 | | | | 65 | | | | 20 | | | | (51 | ) | | | 8,021 | |
| | | | | | | | | | | | | | | | | | | | | | | | | | | | | |
| Total operating expenses | | | (4,114 | ) | | | (1,277 | ) | | | (587 | ) | | | (49 | ) | | | (14 | ) | | | 51 | | | | (5,990 | ) |
| | | | | | | | | | | | | | | |
| | | | | | | | | | | | | | | | | | | | | | | | | | | | | |
| Operating profit | | | 662 | | | | 706 | | | | 641 | | | | 16 | | | | 6 | | | | – | | | | 2,031 | |
| | | | | | | | | | | | | | | | | | | | | | | | | | | | | |
| Share of profit in associates and joint ventures | | | 6 | | | | – | | | | – | | | | – | | | | – | | | | – | | | | 6 | |
| | | | | | | | | | | | | | | |
| | | | | | | | | | | | | | | | | | | | | | | | | | | | | |
| Profit before tax | | | 668 | | | | 706 | | | | 641 | | | | 16 | | | | 6 | | | | – | | | | 2,037 | |
| | | | | | | | | | | | | | | |
| | | | | | | | | | | | | | | | | | | | | | | | | | | | | |
| | | | % | | | | % | | | | % | | | | % | | | | % | | | | | | | | % | |
| | | | | | | | | | | | | | | | | | | | | | | | | | | | | |
| Share of HSBC’s profit before tax | | | 7.2 | | | | 7.6 | | | | 6.9 | | | | 0.2 | | | | – | | | | | | | | 21.9 | |
| Cost efficiency ratio | | | 59.7 | | | | 55.0 | | | | 46.7 | | | | 75.4 | | | | 60.9 | | | | | | | | 57.0 | |
| | | | | | | | | | | | | | | | | | | | | | | | | | | | | |
Balance sheet data45 | | | | | | | | | | | | | | | | | | | | | | | | | | | | |
| | | | | | | | | | | | | | | | | | | | | | | | | | | | | |
| | | US$m | | | US$m | | | US$m | | | US$m | | | US$m | | | | | | | US$m | |
| | | | | | | | | | | | | | | | | | | | | | | | | | | | | |
Loans and advances to
customers (net) | | | 18,523 | | | | 15,460 | | | | 8,273 | | | | 31 | | | | – | | | | | | | | 42,287 | |
| Total assets | | | 30,320 | | | | 19,382 | | | | 53,870 | | | | 391 | | | | 361 | | | | (1,378 | ) | | | 102,946 | |
| Customer accounts | | | 27,564 | | | | 14,367 | | | | 15,384 | | | | 2,128 | | | | – | | | | | | | | 59,443 | |
| | | | | | | | | | | | | | | | | | | | | | | | | | | | | |
For footnotes, see page 83. | | | | | | | | | | | | | | | | | | | | | | | | | | | | |
80(a)
Report of the Directors: Operating and Financial Review(continued)
Reconciliation of reported and underlying profit/(loss) before tax
Europe
2010 compared with 2009
| | | | | | | | | | | | | | | | | | | | | | | | | | | | | | | | | | | | | |
| | | | | | | | | | | | | | | 2009 | | | | | | | | | | | | | | | | |
| | | 2009 | | | 2009 | | | | | | | at 2010 | | | 2010 | | | 2010 | | | 2010 | | | Re- | | | Under- | |
| | | as | | | adjust- | | | Currency | | | exchange | | | as | | | adjust- | | | under- | | | ported | | | lying | |
| | | reported | | | ments | 10 | | translation | 11 | | rates | 12 | | reported | | | ments | 10 | | lying | | | change | 13 | | change | 13 |
| | | US$m | | | US$m | | | US$m | | | US$m | | | US$m | | | US$m | | | US$m | | | % | | | % | |
| | | | | | | | | | | | | | | | | | | | | | | | | | | | | | | | | | | | | |
| Net interest income | | | 12,268 | | | | (1 | ) | | | (189 | ) | | | 12,078 | | | | 11,250 | | | | – | | | | 11,250 | | | | (8 | ) | | | (7 | ) |
| Net fee income | | | 6,267 | | | | (210 | ) | | | (125 | ) | | | 5,932 | | | | 6,371 | | | | – | | | | 6,371 | | | | 2 | | | | 7 | |
Changes in fair value14 | | | (2,841 | ) | | | 2,841 | | | | – | | | | – | | | | (198 | ) | | | 198 | | | | – | | | | 93 | | | | – | |
| Other income | | | 7,850 | | | | (283 | ) | | | (104 | ) | | | 7,463 | | | | 5,327 | | | | (362 | ) | | | 4,965 | | | | (32 | ) | | | (33 | ) |
| | | | | | | | | | | | | | | | | | | | | | | |
| | | | | | | | | | | | | | | | | | | | | | | | | | | | | | | | | | | | | |
Net operating income15 | | | 23,544 | | | | 2,347 | | | | (418 | ) | | | 25,473 | | | | 22,750 | | | | (164 | ) | | | 22,586 | | | | (3 | ) | | | (11 | ) |
| | | | | | | | | | | | | | | | | | | | | | | | | | | | | | | | | | | | | |
| Loan impairment charges and other credit risk provisions | | | (5,568 | ) | | | – | | | | 48 | | | | (5,520 | ) | | | (3,020 | ) | | | – | | | | (3,020 | ) | | | 46 | | | | 45 | |
| | | | | | | | | | | | | | | | | | | | | | | |
| | | | | | | | | | | | | | | | | | | | | | | | | | | | | | | | | | | | | |
Net operating income | | | 17,976 | | | | 2,347 | | | | (370 | ) | | | 19,953 | | | | 19,730 | | | | (164 | ) | | | 19,566 | | | | 10 | | | | (2 | ) |
| | | | | | | | | | | | | | | | | | | | | | | | | | | | | | | | | | | | | |
| Operating expenses | | | (13,988 | ) | | | 200 | | | | 220 | | | | (13,568 | ) | | | (15,445 | ) | | | – | | | | (15,445 | ) | | | (10 | ) | | | (14 | ) |
| | | | | | | | | | | | | | | | | | | | | | | |
| | | | | | | | | | | | | | | | | | | | | | | | | | | | | | | | | | | | | |
Operating profit | | | 3,988 | | | | 2,547 | | | | (150 | ) | | | 6,385 | | | | 4,285 | | | | (164 | ) | | | 4,121 | | | | 7 | | | | (35 | ) |
| | | | | | | | | | | | | | | | | | | | | | | | | | | | | | | | | | | | | |
| Income from associates | | | 21 | | | | (1 | ) | | | (2 | ) | | | 18 | | | | 17 | | | | – | | | | 17 | | | | (19 | ) | | | (6 | ) |
| | | | | | | | | | | | | | | | | | | | | | | |
| | | | | | | | | | | | | | | | | | | | | | | | | | | | | | | | | | | | | |
Profit before tax | | | 4,009 | | | | 2,546 | | | | (152 | ) | | | 6,403 | | | | 4,302 | | | | (164 | ) | | | 4,138 | | | | 7 | | | | (35 | ) |
| | | | | | | | | | | | | | | | | | | | | | | |
| | | | | | | | | | | | | | | | | | | | | | | | | | | | | | | | | | | | | |
| 2009 compared with 2008 | | | | | | | | | | | | | | | | | | | | | | | | | | | | | | | | |
| | | | | | | | | | | | | | | | | | | | | | | | | | | | | | | | | | | | | |
| | | | | | | | | | | | | | | | | | | | | | | | | | | | | | | | | | | | | |
| | | | | | | | | | | | | | | 2008 | | | | | | | | | | | | | | | | |
| | | 2008 | | | 2008 | | | | | | | at 2009 | | | 2009 | | | 2009 | | | 2009 | | | Re- | | | Under- | |
| | | as | | | adjust- | | | Currency | | | exchange | | | as | | | adjust- | | | under- | | | ported | | | lying | |
| | | reported | | | ments | 10 | | translation | 11 | | rates | 16 | | reported | | | ments | 10 | | lying | | | change | 13 | | change | 13 |
| | | US$m | | | US$m | | | US$m | | | US$m | | | US$m | | | US$m | | | US$m | | | % | | | % | |
| | | | | | | | | | | | | | | | | | | | | | | | | | | | | | | | | | | | | |
| Net interest income | | | 9,696 | | | | (65 | ) | | | (1,049 | ) | | | 8,582 | | | | 12,268 | | | | – | | | | 12,268 | | | | 27 | | | | 43 | |
| Net fee income | | | 7,492 | | | | (58 | ) | | | (917 | ) | | | 6,517 | | | | 6,267 | | | | – | | | | 6,267 | | | | (16 | ) | | | (4 | ) |
Changes in fair value14 | | | 3,118 | | | | (3,118 | ) | | | – | | | | – | | | | (2,841 | ) | | | 2,841 | | | | – | | | | | | | | | |
| Gains on disposal of French regional banks | | | 2,445 | | | | (2,445 | ) | | | – | | | | – | | | | – | | | | – | | | | – | | | | (100 | ) | | | | |
| Other income | | | 7,928 | | | | (609 | ) | | | (1,206 | ) | | | 6,113 | | | | 7,850 | | | | (280 | ) | | | 7,570 | | | | (1 | ) | | | 24 | |
| | | | | | | | | | | | | | | | | | | | | | | |
| | | | | | | | | | | | | | | | | | | | | | | | | | | | | | | | | | | | | |
Net operating income15 | | | 30,679 | | | | (6,295 | ) | | | (3,172 | ) | | | 21,212 | | | | 23,544 | | | | 2,561 | | | | 26,105 | | | | (23 | ) | | | 23 | |
| | | | | | | | | | | | | | | | | | | | | | | | | | | | | | | | | | | | | |
| Loan impairment charges and other credit risk provisions | | | (3,754 | ) | | | 6 | | | | 395 | | | | (3,353 | ) | | | (5,568 | ) | | | – | | | | (5,568 | ) | | | (48 | ) | | | (66 | ) |
| | | | | | | | | | | | | | | | | | | | | | | |
| | | | | | | | | | | | | | | | | | | | | | | | | | | | | | | | | | | | | |
| Net operating income | | | 26,925 | | | | (6,289 | ) | | | (2,777 | ) | | | 17,859 | | | | 17,976 | | | | 2,561 | | | | 20,537 | | | | (33 | ) | | | 15 | |
| | | | | | | | | | | | | | | | | | | | | | | | | | | | | | | | | | | | | |
| Operating expenses | | | (16,072 | ) | | | 68 | | | | 1,723 | | | | (14,281 | ) | | | (13,988 | ) | | | – | | | | (13,988 | ) | | | 13 | | | | 2 | |
| | | | | | | | | | | | | | | | | | | | | | | |
| | | | | | | | | | | | | | | | | | | | | | | | | | | | | | | | | | | | | |
| Operating profit | | | 10,853 | | | | (6,221 | ) | | | (1,054 | ) | | | 3,578 | | | | 3,988 | | | | 2,561 | | | | 6,549 | | | | (63 | ) | | | 83 | |
| | | | | | | | | | | | | | | | | | | | | | | | | | | | | | | | | | | | | |
| Income from associates | | | 16 | | | | – | | | | – | | | | 16 | | | | 21 | | | | – | | | | 21 | | | | 31 | | | | 31 | |
| | | | | | | | | | | | | | | | | | | | | | | |
| | | | | | | | | | | | | | | | | | | | | | | | | | | | | | | | | | | | | |
| Profit before tax | | | 10,869 | | | | (6,221 | ) | | | (1,054 | ) | | | 3,594 | | | | 4,009 | | | | 2,561 | | | | 6,570 | | | | (63 | ) | | | 83 | |
| | | | | | | | | | | | | | | | | | | | | | | |
For footnotes, see page 83.
80(b)
Report of the Directors: Operating and Financial Review(continued)
Hong Kong
2010 compared with 2009
| | | | | | | | | | | | | | | | | | | | | | | | | | | | | | | | | | | | | |
| | | | | | | | | | | | | | | 2009 | | | | | | | | | | | | | | | | |
| | | 2009 | | | 2009 | | | | | | | at 2010 | | | 2010 | | | 2010 | | | 2010 | | | Re- | | | Under- | |
| | | as | | | adjust- | | | Currency | | | exchange | | | as | | | adjust- | | | under- | | | ported | | | lying | |
| | | reported | | | ments | 10 | | translation | 11 | | rates | 12 | | reported | | | ments | 10 | | lying | | | change | 13 | | change | 13 |
| | | US$m | | | US$m | | | US$m | | | US$m | | | US$m | | | US$m | | | US$m | | | % | | | % | |
| | | | | | | | | | | | | | | | | | | | | | | | | | | | | | | | | | | | | |
| Net interest income | | | 4,195 | | | | – | | | | (7 | ) | | | 4,188 | | | | 4,246 | | | | – | | | | 4,246 | | | | 1 | | | | 1 | |
| Net fee income | | | 2,669 | | | | – | | | | (4 | ) | | | 2,665 | | | | 2,962 | | | | – | | | | 2,962 | | | | 11 | | | | 11 | |
Changes in fair value14 | | | (1 | ) | | | 1 | | | | – | | | | – | | | | (6 | ) | | | 6 | | | | – | | | | (500 | ) | | | – | |
| Other income | | | 2,604 | | | | – | | | | (6 | ) | | | 2,598 | | | | 3,000 | | | | (136 | ) | | | 2,864 | | | | 15 | | | | 10 | |
| | | | | | | | | | | | | | | | | | | | | | | |
| | | | | | | | | | | | | | | | | | | | | | | | | | | | | | | | | | | | | |
Net operating income15 | | | 9,467 | | | | 1 | | | | (17 | ) | | | 9,451 | | | | 10,202 | | | | (130 | ) | | | 10,072 | | | | 8 | | | | 7 | |
| | | | | | | | | | | | | | | | | | | | | | | | | | | | | | | | | | | | | |
| Loan impairment charges and other credit risk provisions | | | (500 | ) | | | – | | | | 1 | | | | (499 | ) | | | (114 | ) | | | – | | | | (114 | ) | | | 77 | | | | 77 | |
| | | | | | | | | | | | | | | | | | | | | | | |
| | | | | | | | | | | | | | | | | | | | | | | | | | | | | | | | | | | | | |
Net operating income | | | 8,967 | | | | 1 | | | | (16 | ) | | | 8,952 | | | | 10,088 | | | | (130 | ) | | | 9,958 | | | | 13 | | | | 11 | |
| | | | | | | | | | | | | | | | | | | | | | | | | | | | | | | | | | | | | |
| Operating expenses | | | (3,946 | ) | | | – | | | | 6 | | | | (3,940 | ) | | | (4,431 | ) | | | – | | | | (4,431 | ) | | | (12 | ) | | | (12 | ) |
| | | | | | | | | | | | | | | | | | | | | | | |
| | | | | | | | | | | | | | | | | | | | | | | | | | | | | | | | | | | | | |
Operating profit | | | 5,021 | | | | 1 | | | | (10 | ) | | | 5,012 | | | | 5,657 | | | | (130 | ) | | | 5,527 | | | | 13 | | | | 10 | |
| | | | | | | | | | | | | | | | | | | | | | | | | | | | | | | | | | | | | |
| Income from associates | | | 8 | | | | – | | | | – | | | | 8 | | | | 35 | | | | – | | | | 35 | | | | 338 | | | | 338 | |
| | | | | | | | | | | | | | | | | | | | | | | |
| | | | | | | | | | | | | | | | | | | | | | | | | | | | | | | | | | | | | |
Profit before tax | | | 5,029 | | | | 1 | | | | (10 | ) | | | 5,020 | | | | 5,692 | | | | (130 | ) | | | 5,562 | | | | 13 | | | | 11 | |
| | | | | | | | | | | | | | | | | | | | | | | |
| | | | | | | | | | | | | | | | | | | | | | | | | | | | | | | | | | | | | |
2009 compared with 2008 | | | | | | | | | | | | | | | | | | | | | | | | | | | | | | | | | | | | |
| | | | | | | | | | | | | | | | | | | | | | | | | | | | | | | | | | | | | |
| | | | | | | | | | | | | | | | | | | | | | | | | | | | | | | | | | | | | |
| | | | | | | | | | | | | | | 2008 | | | | | | | | | | | | | | | | |
| | | 2008 | | | 2008 | | | | | | | at 2009 | | | 2009 | | | 2009 | | | 2009 | | | Re- | | | Under- | |
| | | as | | | adjust- | | | Currency | | | exchange | | | as | | | adjust- | | | under- | | | ported | | | lying | |
| | | reported | | | ments | 10 | | translation | 11 | | rates | 16 | | reported | | | ments | 10 | | lying | | | change | 13 | | change | 13 |
| | | US$m | | | US$m | | | US$m | | | US$m | | | US$m | | | US$m | | | US$m | | | % | | | % | |
| | | | | | | | | | | | | | | | | | | | | | | | | | | | | | | | | | | | | |
| Net interest income | | | 5,698 | | | | – | | | | 21 | | | | 5,719 | | | | 4,195 | | | | – | | | | 4,195 | | | | (26 | ) | | | (27 | ) |
| Net fee income | | | 2,580 | | | | – | | | | 10 | | | | 2,590 | | | | 2,669 | | | | – | | | | 2,669 | | | | 3 | | | | 3 | |
Changes in fair value14 | | | 5 | | | | (5 | ) | | | – | | | | – | | | | (1 | ) | | | 1 | | | | – | | | | | | | | | |
| Other income | | | 1,871 | | | | – | | | | 7 | | | | 1,878 | | | | 2,604 | | | | – | | | | 2,604 | | | | 39 | | | | 39 | |
| | | | | | | | | | | | | | | | | | | | | | | |
| | | | | | | | | | | | | | | | | | | | | | | | | | | | | | | | | | | | | |
Net operating income15 | | | 10,154 | | | | (5 | ) | | | 38 | | | | 10,187 | | | | 9,467 | | | | 1 | | | | 9,468 | | | | (7 | ) | | | (7 | ) |
| | | | | | | | | | | | | | | | | | | | | | | | | | | | | | | | | | | | | |
| Loan impairment charges and other credit risk provisions | | | (765 | ) | | | – | | | | (2 | ) | | | (767 | ) | | | (500 | ) | | | – | | | | (500 | ) | | | 35 | | | | 35 | |
| | | | | | | | | | | | | | | | | | | | | | | |
| | | | | | | | | | | | | | | | | | | | | | | | | | | | | | | | | | | | | |
| Net operating income | | | 9,389 | | | | (5 | ) | | | 36 | | | | 9,420 | | | | 8,967 | | | | 1 | | | | 8,968 | | | | (4 | ) | | | (5 | ) |
| | | | | | | | | | | | | | | | | | | | | | | | | | | | | | | | | | | | | |
| Operating expenses | | | (3,943 | ) | | | – | | | | (16 | ) | | | (3,959 | ) | | | (3,946 | ) | | | – | | | | (3,946 | ) | | | – | | | | – | |
| | | | | | | | | | | | | | | | | | | | | | | |
| | | | | | | | | | | | | | | | | | | | | | | | | | | | | | | | | | | | | |
| Operating profit | | | 5,446 | | | | (5 | ) | | | 20 | | | | 5,461 | | | | 5,021 | | | | 1 | | | | 5,022 | | | | (8 | ) | | | (8 | ) |
| | | | | | | | | | | | | | | | | | | | | | | | | | | | | | | | | | | | | |
| Income from associates | | | 15 | | | | – | | | | – | | | | 15 | | | | 8 | | | | – | | | | 8 | | | | (47 | ) | | | (47 | ) |
| | | | | | | | | | | | | | | | | | | | | | | |
| | | | | | | | | | | | | | | | | | | | | | | | | | | | | | | | | | | | | |
| Profit before tax | | | 5,461 | | | | (5 | ) | | | 20 | | | | 5,476 | | | | 5,029 | | | | 1 | | | | 5,030 | | | | (8 | ) | | | (8 | ) |
| | | | | | | | | | | | | | | | | | | | | | | |
| | | | | | | | | | | | | | | | | | | | | | | | | | | | | | | | | | | | | |
For footnotes, see page 83. | | | | | | | | | | | | | | | | | | | | | | | | | | | | | | | | | | | | |
80(c)
Report of the Directors: Operating and Financial Review(continued)
Rest of Asia-Pacific
2010 compared with 2009
| | | | | | | | | | | | | | | | | | | | | | | | | | | | | | | | | | | | | |
| | | | | | | | | | | | | | | 2009 | | | | | | | | | | | | | | | | |
| | | 2009 | | | 2009 | | | | | | | at 2010 | | | 2010 | | | 2010 | | | 2010 | | | Re- | | | Under- | |
| | | as | | | adjust- | | | Currency | | | exchange | | | as | | | adjust- | | | under- | | | ported | | | lying | |
| | | reported | | | ments | 10 | | translation | 11 | | rates | 12 | | reported | | | ments | 10 | | lying | | | change | 13 | | change | 13 |
| | | US$m | | | US$m | | | US$m | | | US$m | | | US$m | | | US$m | | | US$m | | | % | | | % | |
| | | | | | | | | | | | | | | | | | | | | | | | | | | | | | | | | | | | | |
| Net interest income | | | 3,539 | | | | – | | | | 240 | | | | 3,779 | | | | 3,828 | | | | (31 | ) | | | 3,797 | | | | 8 | | | | – | |
| Net fee income | | | 1,557 | | | | – | | | | 109 | | | | 1,666 | | | | 1,932 | | | | (3 | ) | | | 1,929 | | | | 24 | | | | 16 | |
Changes in fair value14 | | | (3 | ) | | | 3 | | | | – | | | | – | | | | (1 | ) | | | 1 | | | | – | | | | 67 | | | | – | |
| Other income | | | 2,910 | | | | – | | | | 208 | | | | 3,118 | | | | 3,473 | | | | (197 | ) | | | 3,276 | | | | 19 | | | | 5 | |
| | | | | | | | | | | | | | | | | | | | | | | |
| | | | | | | | | | | | | | | | | | | | | | | | | | | | | | | | | | | | | |
Net operating income15 | | | 8,003 | | | | 3 | | | | 557 | | | | 8,563 | | | | 9,232 | | | | (230 | ) | | | 9,002 | | | | 15 | | | | 5 | |
| | | | | | | | | | | | | | | | | | | | | | | | | | | | | | | | | | | | | |
| Loan impairment charges and other credit risk provisions | | | (896 | ) | | | – | | | | (74 | ) | | | (970 | ) | | | (439 | ) | | | – | | | | (439 | ) | | | 51 | | | | 55 | |
| | | | | | | | | | | | | | | | | | | | | | | |
| | | | | | | | | | | | | | | | | | | | | | | | | | | | | | | | | | | | | |
Net operating income | | | 7,107 | | | | 3 | | | | 483 | | | | 7,593 | | | | 8,793 | | | | (230 | ) | | | 8,563 | | | | 24 | | | | 13 | |
| | | | | | | | | | | | | | | | | | | | | | | | | | | | | | | | | | | | | |
| Operating expenses | | | (4,450 | ) | | | – | | | | (291 | ) | | | (4,741 | ) | | | (5,143 | ) | | | 19 | | | | (5,124 | ) | | | (16 | ) | | | (8 | ) |
| | | | | | | | | | | | | | | | | | | | | | | |
| | | | | | | | | | | | | | | | | | | | | | | | | | | | | | | | | | | | | |
Operating profit | | | 2,657 | | | | 3 | | | | 192 | | | | 2,852 | | | | 3,650 | | | | (211 | ) | | | 3,439 | | | | 37 | | | | 21 | |
| | | | | | | | | | | | | | | | | | | | | | | | | | | | | | | | | | | | | |
| Income from associates | | | 1,543 | | | | – | | | | 13 | | | | 1,556 | | | | 2,252 | | | | – | | | | 2,252 | | | | 46 | | | | 45 | |
| | | | | | | | | | | | | | | | | | | | | | | |
| | | | | | | | | | | | | | | | | | | | | | | | | | | | | | | | | | | | | |
Profit before tax | | | 4,200 | | | | 3 | | | | 205 | | | | 4,408 | | | | 5,902 | | | | (211 | ) | | | 5,691 | | | | 41 | | | | 29 | |
| | | | | | | | | | | | | | | | | | | | | | | |
| | | | | | | | | | | | | | | | | | | | | | | | | | | | | | | | | | | | | |
2009 compared with 2008 | | | | | | | | | | | | | | | | | | | | | | | | | | | | | | | | | | | | |
| | | | | | | | | | | | | | | | | | | | | | | | | | | | | | | | | | | | | |
| | | | | | | | | | | | | | | | | | | | | | | | | | | | | | | | | | | | | |
| | | | | | | | | | | | | | | 2008 | | | | | | | | | | | | | | | | |
| | | 2008 | | | 2008 | | | | | | | at 2009 | | | 2009 | | | 2009 | | | 2009 | | | Re- | | | Under- | |
| | | as | | | adjust- | | | Currency | | | exchange | | | as | | | adjust- | | | under- | | | ported | | | lying | |
| | | reported | | | ments | 10 | | translation | 11 | | rates | 16 | | reported | | | ments | 10 | | lying | | | change | 13 | | change | 13 |
| | | US$m | | | US$m | | | US$m | | | US$m | | | US$m | | | US$m | | | US$m | | | % | | | % | |
| | | | | | | | | | | | | | | | | | | | | | | | | | | | | | | | | | | | | |
| Net interest income | | | 3,937 | | | | – | | | | (165 | ) | | | 3,772 | | | | 3,539 | | | | (53 | ) | | | 3,486 | | | | (10 | ) | | | (8 | ) |
| Net fee income | | | 1,867 | | | | – | | | | (80 | ) | | | 1,787 | | | | 1,557 | | | | (6 | ) | | | 1,551 | | | | (17 | ) | | | (13 | ) |
Changes in fair value14 | | | 3 | | | | (3 | ) | | | – | | | | – | | | | (3 | ) | | | 3 | | | | – | | | | | | | | | |
| Other income | | | 3,174 | | | | – | | | | (205 | ) | | | 2,969 | | | | 2,910 | | | | (18 | ) | | | 2,892 | | | | (8 | ) | | | (3 | ) |
| | | | | | | | | | | | | | | | | | | | | | | |
| | | | | | | | | | | | | | | | | | | | | | | | | | | | | | | | | | | | | |
Net operating income15 | | | 8,981 | | | | (3 | ) | | | (450 | ) | | | 8,528 | | | | 8,003 | | | | (74 | ) | | | 7,929 | | | | (11 | ) | | | (7 | ) |
| | | | | | | | | | | | | | | | | | | | | | | | | | | | | | | | | | | | | |
| Loan impairment charges and other credit risk provisions | | | (852 | ) | | | – | | | | 31 | | | | (821 | ) | | | (896 | ) | | | – | | | | (896 | ) | | | (5 | ) | | | (9 | ) |
| | | | | | | | | | | | | | | | | | | | | | | |
| | | | | | | | | | | | | | | | | | | | | | | | | | | | | | | | | | | | | |
| Net operating income | | | 8,129 | | | | (3 | ) | | | (419 | ) | | | 7,707 | | | | 7,107 | | | | (74 | ) | | | 7,033 | | | | (13 | ) | | | (9 | ) |
| | | | | | | | | | | | | | | | | | | | | | | | | | | | | | | | | | | | | |
| Operating expenses | | | (4,704 | ) | | | – | | | | 208 | | | | (4,496 | ) | | | (4,450 | ) | | | 31 | | | | (4,419 | ) | | | 5 | | | | 2 | |
| | | | | | | | | | | | | | | | | | | | | | | |
| | | | | | | | | | | | | | | | | | | | | | | | | | | | | | | | | | | | | |
| Operating profit | | | 3,425 | | | | (3 | ) | | | (211 | ) | | | 3,211 | | | | 2,657 | | | | (43 | ) | | | 2,614 | | | | (22 | ) | | | (19 | ) |
| | | | | | | | | | | | | | | | | | | | | | | | | | | | | | | | | | | | | |
| Income from associates | | | 1,297 | | | | – | | | | 27 | | | | 1,324 | | | | 1,543 | | | | – | | | | 1,543 | | | | 19 | | | | 17 | |
| | | | | | | | | | | | | | | | | | | | | | | |
| | | | | | | | | | | | | | | | | | | | | | | | | | | | | | | | | | | | | |
| Profit before tax | | | 4,722 | | | | (3 | ) | | | (184 | ) | | | 4,535 | | | | 4,200 | | | | (43 | ) | | | 4,157 | | | | (11 | ) | | | (8 | ) |
| | | | | | | | | | | | | | | | | | | | | | | |
| | | | | | | | | | | | | | | | | | | | | | | | | | | | | | | | | | | | | |
For footnotes, see page 83. | | | | | | | | | | | | | | | | | | | | | | | | | | | | | | | | | | | | |
80(d)
Report of the Directors: Operating and Financial Review(continued)
Middle East
2010 compared with 2009
| | | | | | | | | | | | | | | | | | | | | | | | | | | | | | | | | | | | | |
| | | | | | | | | | | | | | | 2009 | | | | | | | | | | | | | | | | |
| | | 2009 | | | 2009 | | | | | | | at 2010 | | | 2010 | | | 2010 | | | 2010 | | | Re- | | | Under- | |
| | | as | | | adjust- | | | Currency | | | exchange | | | as | | | adjust- | | | under- | | | ported | | | lying | |
| | | reported | | | ments | 10 | | translation | 11 | | rates | 12 | | reported | | | ments | 10 | | lying | | | change | 13 | | change | 13 |
| | | US$m | | | US$m | | | US$m | | | US$m | | | US$m | | | US$m | | | US$m | | | % | | | % | |
| | | | | | | | | | | | | | | | | | | | | | | | | | | | | | | | | | | | | |
| Net interest income | | | 1,485 | | | | – | | | | (4 | ) | | | 1,481 | | | | 1,367 | | | | – | | | | 1,367 | | | | (8 | ) | | | (8 | ) |
| Net fee income | | | 625 | | | | – | | | | (1 | ) | | | 624 | | | | 677 | | | | – | | | | 677 | | | | 8 | | | | 8 | |
| Other income | | | 484 | | | | – | | | | (1 | ) | | | 483 | | | | 366 | | | | 42 | | | | 408 | | | | (24 | ) | | | (16 | ) |
| | | | | | | | | | | | | | | | | | | | | | | |
| | | | | | | | | | | | | | | | | | | | | | | | | | | | | | | | | | | | | |
Net operating income15 | | | 2,594 | | | | – | | | | (6 | ) | | | 2,588 | | | | 2,410 | | | | 42 | | | | 2,452 | | | | (7 | ) | | | (5 | ) |
| | | | | | | | | | | | | | | | | | | | | | | | | | | | | | | | | | | | | |
| Loan impairment charges and other credit risk provisions | | | (1,334 | ) | | | – | | | | 1 | | | | (1,333 | ) | | | (627 | ) | | | – | | | | (627 | ) | | | 53 | | | | 53 | |
| | | | | | | | | | | | | | | | | | | | | | | |
| | | | | | | | | | | | | | | | | | | | | | | | | | | | | | | | | | | | | |
Net operating income | | | 1,260 | | | | – | | | | (5 | ) | | | 1,255 | | | | 1,783 | | | | 42 | | | | 1,825 | | | | 42 | | | | 45 | |
| | | | | | | | | | | | | | | | | | | | | | | | | | | | | | | | | | | | | |
| Operating expenses | | | (1,001 | ) | | | – | | | | 3 | | | | (998 | ) | | | (1,078 | ) | | | – | | | | (1,078 | ) | | | (8 | ) | | | (8 | ) |
| | | | | | | | | | | | | | | | | | | | | | | |
| | | | | | | | | | | | | | | | | | | | | | | | | | | | | | | | | | | | | |
Operating profit | | | 259 | | | | – | | | | (2 | ) | | | 257 | | | | 705 | | | | 42 | | | | 747 | | | | 172 | | | | 191 | |
| | | | | | | | | | | | | | | | | | | | | | | | | | | | | | | | | | | | | |
| Income from associates | | | 196 | | | | – | | | | – | | | | 196 | | | | 187 | | | | – | | | | 187 | | | | (5 | ) | | | (5 | ) |
| | | | | | | | | | | | | | | | | | | | | | | |
| | | | | | | | | | | | | | | | | | | | | | | | | | | | | | | | | | | | | |
Profit before tax | | | 455 | | | | – | | | | (2 | ) | | | 453 | | | | 892 | | | | 42 | | | | 934 | | | | 96 | | | | 106 | |
| | | | | | | | | | | | | | | | | | | | | | | |
| | | | | | | | | | | | | | | | | | | | | | | | | | | | | | | | | | | | | |
2009 compared with 2008 | | | | | | | | | | | | | | | | | | | | | | | | | | | | | | | | | | | | |
| | | | | | | | | | | | | | | | | | | | | | | | | | | | | | | | | | | | | |
| | | | | | | | | | | | | | | | | | | | | | | | | | | | | | | | | | | | | |
| | | | | | | | | | | | | | | 2008 | | | | | | | | | | | | | | | | |
| | | 2008 | | | 2008 | | | | | | | at 2009 | | | 2009 | | | 2009 | | | 2009 | | | Re- | | | Under- | |
| | | as | | | adjust- | | | Currency | | | exchange | | | as | | | adjust- | | | under- | | | ported | | | lying | |
| | | reported | | | ments | 10 | | translation | 11 | | rates | 16 | | reported | | | ments | 10 | | lying | | | change | 13 | | change | 13 |
| | | US$m | | | US$m | | | US$m | | | US$m | | | US$m | | | US$m | | | US$m | | | % | | | % | |
| | | | | | | | | | | | | | | | | | | | | | | | | | | | | | | | | | | | | |
| Net interest income | | | 1,556 | | | | – | | | | (7 | ) | | | 1,549 | | | | 1,485 | | | | – | | | | 1,485 | | | | (5 | ) | | | (4 | ) |
| Net fee income | | | 691 | | | | – | | | | (4 | ) | | | 687 | | | | 625 | | | | – | | | | 625 | | | | (10 | ) | | | (9 | ) |
| Other income | | | 421 | | | | – | | | | (7 | ) | | | 414 | | | | 484 | | | | – | | | | 484 | | | | 15 | | | | 17 | |
| | | | | | | | | | | | | | | | | | | | | | | |
| | | | | | | | | | | | | | | | | | | | | | | | | | | | | | | | | | | | | |
Net operating income15 | | | 2,668 | | | | – | | | | (18 | ) | | | 2,650 | | | | 2,594 | | | | – | | | | 2,594 | | | | (3 | ) | | | (2 | ) |
| | | | | | | | | | | | | | | | | | | | | | | | | | | | | | | | | | | | | |
| Loan impairment charges and other credit risk provisions | | | (279 | ) | | | – | | | | (1 | ) | | | (280 | ) | | | (1,334 | ) | | | – | | | | (1,334 | ) | | | (378 | ) | | | (376 | ) |
| | | | | | | | | | | | | | | | | | | | | | | |
| | | | | | | | | | | | | | | | | | | | | | | | | | | | | | | | | | | | | |
| Net operating income | | | 2,389 | | | | – | | | | (19 | ) | | | 2,370 | | | | 1,260 | | | | – | | | | 1,260 | | | | (47 | ) | | | (47 | ) |
| | | | | | | | | | | | | | | | | | | | | | | | | | | | | | | | | | | | | |
| Operating expenses | | | (959 | ) | | | – | | | | 11 | | | | (948 | ) | | | (1,001 | ) | | | – | | | | (1,001 | ) | | | (4 | ) | | | (6 | ) |
| | | | | | | | | | | | | | | | | | | | | | | |
| | | | | | | | | | | | | | | | | | | | | | | | | | | | | | | | | | | | | |
| Operating profit | | | 1,430 | | | | – | | | | (8 | ) | | | 1,422 | | | | 259 | | | | – | | | | 259 | | | | (82 | ) | | | (82 | ) |
| | | | | | | | | | | | | | | | | | | | | | | | | | | | | | | | | | | | | |
| Income from associates | | | 316 | | | | – | | | | 1 | | | | 317 | | | | 196 | | | | – | | | | 196 | | | | (38 | ) | | | (38 | ) |
| | | | | | | | | | | | | | | | | | | | | | | |
| | | | | | | | | | | | | | | | | | | | | | | | | | | | | | | | | | | | | |
| Profit before tax | | | 1,746 | | | | – | | | | (7 | ) | | | 1,739 | | | | 455 | | | | – | | | | 455 | | | | (74 | ) | | | (74 | ) |
| | | | | | | | | | | | | | | | | | | | | | | |
| | | | | | | | | | | | | | | | | | | | | | | | | | | | | | | | | | | | | |
For footnotes, see page 83. | | | | | | | | | | | | | | | | | | | | | | | | | | | | | | | | | | | | |
80(e)
Report of the Directors: Operating and Financial Review(continued)
North America
2010 compared with 2009
| | | | | | | | | | | | | | | | | | | | | | | | | | | | | | | | | | | | | |
| | | | | | | | | | | | | | | 2009 | | | | | | | | | | | | | | | | |
| | | 2009 | | | 2009 | | | | | | | at 2010 | | | 2010 | | | 2010 | | | 2010 | | | Re- | | | Under- | |
| | | as | | | adjust- | | | Currency | | | exchange | | | as | | | adjust- | | | under- | | | ported | | | lying | |
| | | reported | | | ments | 10 | | translation | 11 | | rates | 12 | | reported | | | ments | 10 | | lying | | | change | 13 | | change | 13 |
| | | US$m | | | US$m | | | US$m | | | US$m | | | US$m | | | US$m | | | US$m | | | % | | | % | |
| | | | | | | | | | | | | | | | | | | | | | | | | | | | | | | | | | | | | |
| Net interest income | | | 13,670 | | | | – | | | | 134 | | | | 13,804 | | | | 12,439 | | | | – | | | | 12,439 | | | | (9 | ) | | | (10 | ) |
| Net fee income | | | 4,817 | | | | – | | | | 56 | | | | 4,873 | | | | 3,664 | | | | – | | | | 3,664 | | | | (24 | ) | | | (25 | ) |
Changes in fair value14 | | | (3,688 | ) | | | 3,688 | | | | – | | | | – | | | | 142 | | | | (142 | ) | | | – | | | | | | | | | |
| Other income/ (expense) | | | 1,506 | | | | – | | | | 12 | | | | 1,518 | | | | 802 | | | | (66 | ) | | | 736 | | | | (47 | ) | | | (52 | ) |
| | | | | | | | | | | | | | | | | | | | | | | |
| | | | | | | | | | | | | | | | | | | | | | | | | | | | | | | | | | | | | |
Net operating income15 | | | 16,305 | | | | 3,688 | | | | 202 | | | | 20,195 | | | | 17,047 | | | | (208 | ) | | | 16,839 | | | | 5 | | | | (17 | ) |
| | | | | | | | | | | | | | | | | | | | | | | | | | | | | | | | | | | | | |
| Loan impairment charges and other credit risk provisions | | | (15,664 | ) | | | – | | | | (53 | ) | | | (15,717 | ) | | | (8,295 | ) | | | – | | | | (8,295 | ) | | | 47 | | | | 47 | |
| | | | | | | | | | | | | | | | | | | | | | | |
| | | | | | | | | | | | | | | | | | | | | | | | | | | | | | | | | | | | | |
Net operating income | | | 641 | | | | 3,688 | | | | 149 | | | | 4,478 | | | | 8,752 | | | | (208 | ) | | | 8,544 | | | | 1,265 | | | | 91 | |
| | | | | | | | | | | | | | | | | | | | | | | | | | | | | | | | | | | | | |
| Operating expenses (excluding goodwill impairment) | | | (8,391 | ) | | | – | | | | (103 | ) | | | (8,494 | ) | | | (8,322 | ) | | | – | | | | (8,322 | ) | | | 1 | | | | 2 | |
| | | | | | | | | | | | | | | | | | | | | | | |
| | | | | | | | | | | | | | | | | | | | | | | | | | | | | | | | | | | | | |
Operating profit/(loss) | | | (7,750 | ) | | | 3,688 | | | | 46 | | | | (4,016 | ) | | | 430 | | | | (208 | ) | | | 222 | | | | | | | | | |
| | | | | | | | | | | | | | | | | | | | | | | | | | | | | | | | | | | | | |
| Income from associates | | | 12 | | | | – | | | | – | | | | 12 | | | | 24 | | | | – | | | | 24 | | | | 100 | | | | 100 | |
| | | | | | | | | | | | | | | | | | | | | | | |
| | | | | | | | | | | | | | | | | | | | | | | | | | | | | | | | | | | | | |
Profit/(loss) before tax | | | (7,738 | ) | | | 3,688 | | | | 46 | | | | (4,004 | ) | | | 454 | | | | (208 | ) | | | 246 | | | | | | | | | |
| | | | | | | | | | | | | | | | | | | | | | | |
| | | | | | | | | | | | | | | | | | | | | | | | | | | | | | | | | | | | | |
2009 compared with 2008 | | | | | | | | | | | | | | | | | | | | | | | | | | | | | | | | | | | | |
| | | | | | | | | | | | | | | | | | | | | | | | | | | | | | | | | | | | | |
| | | | | | | | | | | | | | | | | | | | | | | | | | | | | | | | | | | | | |
| | | | | | | | | | | | | | | 2008 | | | | | | | | | | | | | | | | |
| | | 2008 | | | 2008 | | | | | | | at 2009 | | | 2009 | | | 2009 | | | 2009 | | | Re- | | | Under- | |
| | | as | | | adjust- | | | Currency | | | exchange | | | as | | | adjust- | | | under- | | | ported | | | lying | |
| | | reported | | | ments | 10 | | translation | 11 | | rates | 16 | | reported | | | ments | 10 | | lying | | | change | 13 | | change | 13 |
| | | US$m | | | US$m | | | US$m | | | US$m | | | US$m | | | US$m | | | US$m | | | % | | | % | |
| | | | | | | | | | | | | | | | | | | | | | | | | | | | | | | | | | | | | |
| Net interest income | | | 15,218 | | | | – | | | | (79 | ) | | | 15,139 | | | | 13,670 | | | | – | | | | 13,670 | | | | (10 | ) | | | (10 | ) |
| Net fee income | | | 5,227 | | | | – | | | | (33 | ) | | | 5,194 | | | | 4,817 | | | | – | | | | 4,817 | | | | (8 | ) | | | (7 | ) |
Changes in fair value14 | | | 3,444 | | | | (3,444 | ) | | | – | | | | – | | | | (3,688 | ) | | | 3,688 | | | | – | | | | | | | | | |
| Other income/(expense) | | | (2,710 | ) | | | – | | | | (4 | ) | | | (2,714 | ) | | | 1,506 | | | | – | | | | 1,506 | | | | | | | | | |
| | | | | | | | | | | | | | | | | | | | | | | |
| | | | | | | | | | | | | | | | | | | | | | | | | | | | | | | | | | | | | |
Net operating income15 | | | 21,179 | | | | (3,444 | ) | | | (116 | ) | | | 17,619 | | | | 16,305 | | | | 3,688 | | | | 19,993 | | | | (23 | ) | | | 13 | |
| | | | | | | | | | | | | | | | | | | | | | | | | | | | | | | | | | | | | |
| Loan impairment charges and other credit risk provisions | | | (16,795 | ) | | | – | | | | (8 | ) | | | (16,803 | ) | | | (15,664 | ) | | | – | | | | (15,664 | ) | | | 7 | | | | 7 | |
| | | | | | | | | | | | | | | | | | | | | | | |
| | | | | | | | | | | | | | | | | | | | | | | | | | | | | | | | | | | | | |
| Net operating income | | | 4,384 | | | | (3,444 | ) | | | (124 | ) | | | 816 | | | | 641 | | | | 3,688 | | | | 4,329 | | | | (85 | ) | | | 431 | |
| | | | | | | | | | | | | | | | | | | | | | | | | | | | | | | | | | | | | |
| Operating expenses (excluding goodwill impairment) | | | (9,359 | ) | | | – | | | | 58 | | | | (9,301 | ) | | | (8,391 | ) | | | – | | | | (8,391 | ) | | | 10 | | | | 10 | |
| Goodwill impairment | | | (10,564 | ) | | | – | | | | – | | | | (10,564 | ) | | | – | | | | – | | | | – | | | | 100 | | | | 100 | |
| | | | | | | | | | | | | | | | | | | | | | | |
| | | | | | | | | | | | | | | | | | | | | | | | | | | | | | | | | | | | | |
| Operating loss | | | (15,539 | ) | | | (3,444 | ) | | | (66 | ) | | | (19,049 | ) | | | (7,750 | ) | | | 3,688 | | | | (4,062 | ) | | | 50 | | | | 79 | |
| | | | | | | | | | | | | | | | | | | | | | | | | | | | | | | | | | | | | |
| Income from associates | | | 11 | | | | – | | | | (1 | ) | | | 10 | | | | 12 | | | | – | | | | 12 | | | | 9 | | | | 20 | |
| | | | | | | | | | | | | | | | | | | | | | | |
| | | | | | | | | | | | | | | | | | | | | | | | | | | | | | | | | | | | | |
| Loss before tax | | | (15,528 | ) | | | (3,444 | ) | | | (67 | ) | | | (19,039 | ) | | | (7,738 | ) | | | 3,688 | | | | (4,050 | ) | | | 50 | | | | 79 | |
| | | | | | | | | | | | | | | | | | | | | | | |
| | | | | | | | | | | | | | | | | | | | | | | | | | | | | | | | | | | | | |
For footnotes, see page 83. | | | | | | | | | | | | | | | | | | | | | | | | | | | | | | | | | | | | |
80(f)
Report of the Directors: Operating and Financial Review(continued)
Latin America
2010 compared with 2009
| | | | | | | | | | | | | | | | | | | | | | | | | | | | | | | | | | | | | |
| | | | | | | | | | | | | | | 2009 | | | | | | | | | | | | | | | | |
| | | 2009 | | | 2009 | | | | | | | at 2010 | | | 2010 | | | 2010 | | | 2010 | | | Re- | | | Under- | |
| | | as | | | adjust- | | | Currency | | | exchange | | | as | | | adjust- | | | under- | | | ported | | | lying | |
| | | reported | | | ments | 10 | | translation | 11 | | rates | 12 | | reported | | | ments | 10 | | lying | | | change | 13 | | change | 13 |
| | | US$m | | | US$m | | | US$m | | | US$m | | | US$m | | | US$m | | | US$m | | | % | | | % | |
| | | | | | | | | | | | | | | | | | | | | | | | | | | | | | | | | | | | | |
| Net interest income | | | 5,573 | | | | – | | | | 468 | | | | 6,041 | | | | 6,311 | | | | – | | | | 6,311 | | | | 13 | | | | 4 | |
| Net fee income | | | 1,729 | | | | – | | | | 147 | | | | 1,876 | | | | 1,749 | | | | – | | | | 1,749 | | | | 1 | | | | (7 | ) |
| Other income | | | 1,722 | | | | – | | | | 169 | | | | 1,891 | | | | 1,671 | | | | – | | | | 1,671 | | | | (3 | ) | | | (12 | ) |
| | | | | | | | | | | | | | | | | | | | | | | |
| | | | | | | | | | | | | | | | | | | | | | | | | | | | | | | | | | | | | |
Net operating income15 | | | 9,024 | | | | – | | | | 784 | | | | 9,808 | | | | 9,731 | | | | – | | | | 9,731 | | | | 8 | | | | (1 | ) |
| | | | | | | | | | | | | | | | | | | | | | | | | | | | | | | | | | | | | |
| Loan impairment charges and other credit risk provisions | | | (2,526 | ) | | | – | | | | (253 | ) | | | (2,779 | ) | | | (1,544 | ) | | | – | | | | (1,544 | ) | | | 39 | | | | 44 | |
| | | | | | | | | | | | | | | | | | | | | | | |
| | | | | | | | | | | | | | | | | | | | | | | | | | | | | | | | | | | | | |
Net operating income | | | 6,498 | | | | – | | | | 531 | | | | 7,029 | | | | 8,187 | | | | – | | | | 8,187 | | | | 26 | | | | 16 | |
| | | | | | | | | | | | | | | | | | | | | | | | | | | | | | | | | | | | | |
| Operating expenses | | | (5,375 | ) | | | – | | | | (453 | ) | | | (5,828 | ) | | | (6,394 | ) | | | – | | | | (6,394 | ) | | | (19 | ) | | | (10 | ) |
| | | | | | | | | | | | | | | | | | | | | | | |
| | | | | | | | | | | | | | | | | | | | | | | | | | | | | | | | | | | | | |
Operating profit | | | 1,123 | | | | – | | | | 78 | | | | 1,201 | | | | 1,793 | | | | – | | | | 1,793 | | | | 60 | | | | 49 | |
| | | | | | | | | | | | | | | | | | | | | | | | | | | | | | | | | | | | | |
| Income from associates | | | 1 | | | | – | | | | – | | | | 1 | | | | 2 | | | | – | | | | 2 | | | | 100 | | | | 100 | |
| | | | | | | | | | | | | | | | | | | | | | | |
| | | | | | | | | | | | | | | | | | | | | | | | | | | | | | | | | | | | | |
Profit before tax | | | 1,124 | | | | – | | | | 78 | | | | 1,202 | | | | 1,795 | | | | – | | | | 1,795 | | | | 60 | | | | 49 | |
| | | | | | | | | | | | | | | | | | | | | | | |
| | | | | | | | | | | | | | | | | | | | | | | | | | | | | | | | | | | | | |
2009 compared with 2008 | | | | | | | | | | | | | | | | | | | | | | | | | | | | | | | | | | | | |
| | | | | | | | | | | | | | | | | | | | | | | | | | | | | | | | | | | | | |
| | | | | | | | | | | | | | | | | | | | | | | | | | | | | | | | | | | | | |
| | | | | | | | | | | | | | | 2008 | | | | | | | | | | | | | | | | |
| | | 2008 | | | 2008 | | | | | | | at 2009 | | | 2009 | | | 2009 | | | 2009 | | | Re- | | | Under- | |
| | | as | | | adjust- | | | Currency | | | exchange | | | as | | | adjust- | | | under- | | | ported | | | lying | |
| | | reported | | | ments | 10 | | translation | 11 | | rates | 16 | | reported | | | ments | 10 | | lying | | | change | 13 | | change | 13 |
| | | US$m | | | US$m | | | US$m | | | US$m | | | US$m | | | US$m | | | US$m | | | % | | | % | |
| | | | | | | | | | | | | | | | | | | | | | | | | | | | | | | | | | | | | |
| Net interest income | | | 6,458 | | | | – | | | | (783 | ) | | | 5,675 | | | | 5,573 | | | | – | | | | 5,573 | | | | (14 | ) | | | (2 | ) |
| Net fee income | | | 2,167 | | | | – | | | | (291 | ) | | | 1,876 | | | | 1,729 | | | | – | | | | 1,729 | | | | (20 | ) | | | (8 | ) |
| Other income | | | 1,888 | | | | (71 | ) | | | (220 | ) | | | 1,597 | | | | 1,722 | | | | – | | | | 1,722 | | | | (9 | ) | | | 8 | |
| | | | | | | | | | | | | | | | | | | | | | | |
| | | | | | | | | | | | | | | | | | | | | | | | | | | | | | | | | | | | | |
Net operating income15 | | | 10,513 | | | | (71 | ) | | | (1,294 | ) | | | 9,148 | | | | 9,024 | | | | – | | | | 9,024 | | | | (14 | ) | | | (1 | ) |
| | | | | | | | | | | | | | | | | | | | | | | | | | | | | | | | | | | | | |
| Loan impairment charges and other credit risk provisions | | | (2,492 | ) | | | – | | | | 294 | | | | (2,198 | ) | | | (2,526 | ) | | | – | | | | (2,526 | ) | | | (1 | ) | | | (15 | ) |
| | | | | | | | | | | | | | | | | | | | | | | |
| | | | | | | | | | | | | | | | | | | | | | | | | | | | | | | | | | | | | |
| Net operating income | | | 8,021 | | | | (71 | ) | | | (1,000 | ) | | | 6,950 | | | | 6,498 | | | | – | | | | 6,498 | | | | (19 | ) | | | (7 | ) |
| | | | | | | | | | | | | | | | | | | | | | | | | | | | | | | | | | | | | |
| Operating expenses | | | (5,990 | ) | | | – | | | | 709 | | | | (5,281 | ) | | | (5,375 | ) | | | – | | | | (5,375 | ) | | | 10 | | | | (2 | ) |
| | | | | | | | | | | | | | | | | | | | | | | |
| | | | | | | | | | | | | | | | | | | | | | | | | | | | | | | | | | | | | |
| Operating profit | | | 2,031 | | | | (71 | ) | | | (291 | ) | | | 1,669 | | | | 1,123 | | | | – | | | | 1,123 | | | | (45 | ) | | | (33 | ) |
| | | | | | | | | | | | | | | | | | | | | | | | | | | | | | | | | | | | | |
| Income from associates | | | 6 | | | | – | | | | (2 | ) | | | 4 | | | | 1 | | | | – | | | | 1 | | | | (83 | ) | | | (75 | ) |
| | | | | | | | | | | | | | | | | | | | | | | |
| | | | | | | | | | | | | | | | | | | | | | | | | | | | | | | | | | | | | |
| Profit before tax | | | 2,037 | | | | (71 | ) | | | (293 | ) | | | 1,673 | | | | 1,124 | | | | – | | | | 1,124 | | | | (45 | ) | | | (33 | ) |
| | | | | | | | | | | | | | | | | | | | | | | |
| | | | | | | | | | | | | | | | | | | | | | | | | | | | | | | | | | | | | |
For footnotes, see page 83. | | | | | | | | | | | | | | | | | | | | | | | | | | | | | | | | | | | | |
80(g)
Report of the Directors: Operating and Financial Review(continued)
Disclosure controls
The Group Chief Executive and Group Finance Director, with the assistance of other members of management, carried out an evaluation of the effectiveness of the design and operation of HSBC Holdings’ disclosure controls and procedures as of 31 December 2010. Based upon that evaluation, the Group Chief Executive and Group Finance Director concluded that our disclosure controls and procedures as of 31 December 2010 were effective to provide reasonable assurance that information required to be disclosed in the reports which the company files and submits under the US Securities Exchange Act of 1934, as amended, is recorded, processed, summarised and reported as and when required. There are inherent limitations to the effectiveness of any system of disclosure controls and procedures, including the possibility of human error and the circumvention or overriding of the controls and procedures. Accordingly, even effective disclosure controls and procedures can only provide reasonable assurance of achieving their control objectives.
There has been no change in HSBC Holdings’ internal controls over financial reporting during the year ended 31 December 2010 that has materially affected, or is reasonably likely to materially affect, HSBC Holdings’ internal controls over financial reporting.
Management’s assessment of internal controls over financial reporting
Management is responsible for establishing and maintaining an adequate internal control structure and procedures for financial reporting, and has completed an assessment of the effectiveness of the Group’s internal controls over financial reporting as of 31 December 2010. In making the assessment, management used the framework for Director’s internal control evaluation contained within the Combined Code (‘The Revised Turnbull Guidance’), as well as the criteria established by the Committee of Sponsoring Organisations of the Treadway Commission (‘COSO’) in ‘Internal Control-Integrated Framework’.
Based on the assessment performed, management concluded that as at 31 December 2010, the Group’s internal controls over financial reporting were effective.
KPMG Audit Plc, which has audited the consolidated financial statements of the Group for the year ended 31 December 2010, has also audited the effectiveness of the Group’s internal control over financial reporting under Auditing Standard No. 5 of the Public Company Accounting Oversight Board (United States) as stated in their report on pages 235 and 236.
80(h)
Report of the Directors: Operating and Financial Review(continued)
Other information
Funds under management and assets held in custody
| | | | | | | | | |
| | | 2010 | | | 2009 | |
| | | US$bn | | | US$bn | |
| | | | | | | | | |
Funds under management | | | | | | | | |
| At 1 January | | | 857 | | | | 735 | |
| Net new money | | | 42 | | | | 36 | |
| Value change | | | 33 | | | | 76 | |
| Exchange and other | | | (7 | ) | | | 10 | |
| | | | | |
| | | | | | | | | |
| At 31 December | | | 925 | | | | 857 | |
| | | | | |
| |
| | | At 31 December | |
| | | 2010 | | | 2009 | |
| | | US$bn | | | US$bn | |
| | | | | | | | | |
Funds under management by business | | | | | | | | |
| Global Asset Management | | | 439 | | | | 423 | |
| Global Private Banking | | | 277 | | | | 251 | |
| Affiliates | | | 3 | | | | 3 | |
| Other | | | 206 | | | | 180 | |
| | | | | |
| | | | | | | | | |
| | | | 925 | | | | 857 | |
| | | | | |
Funds under management at 31 December 2010 amounted to US$925bn, an increase of 8% when compared with 2009. Both Global Asset Management and GPB fund holdings increased, reflecting an improvement in equity market performance and strong net inflows.
Global Asset Management funds, including emerging market funds, increased by 4% to US$439bn as a result of market performance gains and strong net inflows, particularly in Europe and Asia, partly offset by adverse foreign exchange movements. We remain one of the world’s largest emerging market asset managers with funds under management of US$145bn at 31 December 2010 in countries outside North America, Western Europe, Japan and Australia.
GPB funds increased by 10% in 2010 to US$277bn, driven by an improvement in equity market performance and strong net inflows which benefited from our strength in emerging markets, hiring of key relationship managers and cross-business referrals. Client assets, which include funds under management and cash deposits and provide an indicator of the scale of GPB, increased by US$23bn to US$390bn due to the increase in funds under management.
Other funds under management, which are mainly held by a corporate trust business in Asia, increased by 14% to US$206bn.
We announced in November 2010 that, with effect from 1 March 2011, Retail Banking and Wealth Management will be managed as a single global business from Hong Kong. Global Asset Management will become part of this business and will be transferred from GB&M.
Assets held in custody and under administration
Custody is the safekeeping and servicing of securities and other financial assets on behalf of clients. At 31 December 2010, we held assets as custodian of US$5.7 trillion, 9% higher than the US$5.2 trillion held at 31 December 2009. This was mainly driven by an increase in the market value of assets and favourable foreign exchange movements.
Our assets under administration business, which includes the provision of various support function activities including the valuation of portfolios of securities and other financial assets on behalf of clients, complements the custody business. At 31 December 2010, the value of assets held under administration by the Group amounted to US$2.7 trillion, compared with US$2.8 trillion in 2009.
At 31 December 2010, we operated from some 9,950 operational properties worldwide, of which approximately 2,500 were located in Europe, 3,100 in Hong Kong and Rest of Asia-Pacific, 800 in North America, 3,350 in Latin America and 200 in the Middle East. These properties had an area of approximately 71.3m square feet (2009: 70.8m square feet).
Our freehold and long leasehold properties, together with all our leasehold land in Hong Kong, were valued in 2010. The value of these properties was US$7.1bn (2009: US$4.1bn) in excess of their carrying amount in the consolidated balance sheet. In addition, properties with a net book value of US$1,133m were held for investment purposes.
HSBC’s operational properties are stated at cost, being historical cost or fair value at the date of transition to IFRSs (their deemed cost) less any impairment losses, and are depreciated on a basis calculated to write off the assets over their estimated useful lives. Properties owned as a consequence of an acquisition are recognised initially at fair value.
Further details are included in Note 25 on the Financial Statements.
81
Report of the Directors: Operating and Financial Review(continued)
Legal proceedings, investigations and regulatory matters
As a result of an August 2002 restatement of previously reported consolidated financial statements and other corporate events, including the 2002 settlement with 46 State Attorneys General relating to real estate lending practices, Household International (now HSBC Finance) and certain former officers were named as defendants in a class action law suit,Jaffe v Household International Inc, et alNo 2. C 5893 (N.D.Ill, filed 19 August 2002). Following a jury trial concluded in April 2009, the Court issued a ruling on 22 November 2010, within the second phase of the case to determine actual damages, that claim forms should be mailed to class members and also set out a method for calculating damages for class members who filed claims. Despite the jury verdict and the November 2010 ruling, HSBC continues to believe that it has meritorious defences and intends to seek an appeal of the Court’s ruling. The timing and outcome of the resolution of this matter is uncertain. Given the complexity and uncertainties associated with the actual determination of damages, including but not limited to the number of class members that may file valid claims, the number of claims that can be substantiated by class members providing adequate documentation, the reduction of trading losses by any trading gains made over the relevant period, the determination of reliance by class members on the financial statements, and whether any given class member was the beneficial owner of the shares, HSBC is unable at this time to estimate reliably the amount of any damages or range of possible damages that could arise, but they could be significant.
In December 2008, Bernard L Madoff (‘Madoff’) was arrested for running a Ponzi scheme and a trustee was appointed for the liquidation of his firm, Bernard L Madoff Investment Securities LLC (‘Madoff Securities’), a Securities and Exchange Commission (‘SEC’) registered broker-dealer and investment adviser. Madoff subsequently pleaded guilty to various charges and is serving a 150-year prison sentence. Various non-US HSBC companies provide custodial, administration and similar services to a number of funds incorporated outside the US whose assets were invested with Madoff Securities and have been named as defendants in suits in the US, Ireland, Luxembourg and other jurisdictions. There are many factors which may affect the range of possible outcomes including, but not limited to, the circumstances of the fraud, the multiple jurisdictions in which the proceedings have been brought, and the number of different plaintiffs
and defendants in such proceedings. The cases are at an early stage. For these reasons, among others, it is not practicable at this time for HSBC to estimate reliably the aggregate liabilities or ranges of liabilities that may arise as a result of all such claims but they could be significant. In any event, HSBC considers that it has good defences to these claims and will continue to defend them vigorously.
HSBC Bank USA entered into a consent cease and desist order with the Office of the Comptroller of the Currency and the indirect parent of that company, HSBC North America, entered into a consent cease and desist order with the Federal Reserve Board in the first week of October 2010. These actions require improvements for an effective compliance risk management programme across the Group’s US businesses, including US Bank Secrecy Act (‘BSA’) and Anti Money Laundering (‘AML’) compliance. Steps continue to be taken to address the requirements of these Orders and to ensure that compliance and effective policies and procedures are maintained.
Various HSBC Group companies are the subject of ongoing investigations, including Grand Jury subpoenas and other requests for information, by US Government agencies, including the US Attorney’s Office, the US Department of Justice and the New York County District Attorney’s Office. These investigations pertain to, among other matters, HSBC Bank USA’s bank note and foreign correspondent banking businesses and its compliance with BSA and AML controls, as well as various HSBC companies’ compliance with Office of Foreign Asset Control (‘OFAC’) requirements, and adherence by certain customers to US tax reporting requirements.
The consent cease and desist orders do not preclude additional enforcement actions against HSBC Bank USA or HSBC North America by bank regulatory or law enforcement agencies, including actions to recover civil money penalties, fines and other financial penalties relating to activities which were the subject of the cease and desist orders. In addition, it is likely that there could be some form of formal enforcement action in respect of some or all of the ongoing investigations. Actual or threatened enforcement actions against other financial institutions for breaches of BSA, AML and OFAC requirements have resulted in settlements involving fines and penalties, some of which have been significant depending on the individual circumstances of each action. The ongoing investigations are at an early stage. Based on the facts currently known, it is not practicable at this time for HSBC to determine the terms on which the ongoing investigations will be resolved or the timing of such resolution or for HSBC
82
Report of the Directors: Operating and Financial Review(continued)
to estimate reliably the amounts, or range of possible amounts, of any fines and/or penalties. As matters progress, it is possible that any fines and/or penalties could be significant.
For further information see Note 44 on the Financial Statements.
US State and federal officials recently announced investigations into the procedures followed by mortgage servicing companies and banks, including HSBC Finance and HSBC Bank USA, relating to foreclosures. We have responded to all related inquiries and co-operated with all applicable investigations, including a joint examination by staffs of the Federal Reserve Board and the Office of the Comptroller of the Currency as part of their broad review of industry foreclosure practices. Following the examination, our examiners issued supervisory letters noting certain deficiencies in our processing, preparation and signing of affidavits and other documents supporting foreclosures, and in the governance of and resources devoted to our foreclosure processes, including the evaluation and monitoring of third party law firms retained to effect our foreclosures. Certain other processes were deemed adequate. Management is reviewing foreclosures where judgement has not yet been entered and will correct deficient documentation and re-file affidavits where necessary. We have suspended foreclosures until such time as we have substantially addressed noted deficiencies in our processes. We are engaged in discussions with the Federal Reserve Board and the Office of the Comptroller of the Currency regarding the terms of consent cease and desist orders, which will prescribe actions to address the deficiencies noted in the joint examination. We expect the consent orders will be
finalised shortly. While the impact of the consent orders depends on the final terms, we believe they have the potential to increase our operational, reputational and legal risk profiles and expect implementation of their provisions will require significant and managerial resources. In addition, the consent orders will not preclude further actions against HSBC Bank USA or HSBC Finance by bank regulatory or other agencies, including the imposition of fines and civil money penalties. We are unable at this time, however, to determine the likelihood of any further action or the amount of fines or penalties, if any, that may be imposed by the regulators or agencies.
In March 2010 HSBC Private Bank (Suisse) SA announced that it had been the victim of a significant data theft. In 2010, HSBC Private Bank (Suisse) SA conducted a comprehensive review of its information security procedures, formulated and implemented major security upgrade programmes and continued a multi-million franc investment programme in systems to ensure industry-leading security standards. It also reviewed and strengthened risk management and operational controls and will continue to invest in these areas. In March 2010, the Swiss Financial Market Supervisory Authority (‘FINMA’) launched an investigation into the circumstances of the data theft. On 22 February 2011 a notice of decision with a declaratory ruling was received from FINMA following such investigation which found that, because of deficiencies in its internal organisation and oversight of its IT activities, HSBC Private Bank (Suisse) SA had breached various regulatory provisions. HSBC Private Bank (Suisse) SA is currently considering the details of the notice of decision and actions required by FINMA.
Footnotes to Overview and Operating and Financial Review
Financial highlights
| | |
| 1 | | Dividends recorded in the financial statements are dividends per ordinary share declared in a year and are not dividends in respect of, or for, that year. The third interim dividend for 2009 of US$0.08 was paid on 13 January 2010. The fourth interim dividend for 2009 of US$0.10 was paid on 5 May 2010. First, second and third interim dividends for 2010, each of US$0.08 per ordinary share, were paid on 7 July 2010, 6 October 2010 and 12 January 2011, respectively. Note 11 on the Financial Statements provides more information on the dividends declared in 2010. On 28 February 2011 the Directors declared a fourth interim dividend for 2010 of US$0.12 per ordinary share in lieu of a final dividend, which will be payable to ordinary shareholders on 5 May 2011 in cash in US dollars, or in pounds sterling or Hong Kong dollars at exchange rates to be determined on 27 April 2011, with a scrip dividend alternative. The reserves available for distribution at 31 December 2010 were US$36,013m.
Quarterly dividends of US$15.50 per 6.2% non-cumulative Series A US dollar preference share, equivalent to a dividend of US$0.3875 per Series A ADS, each of which represents one-fortieth of a Series A US dollar preference share, were paid on 15 March 2010, 15 June 2010, 15 September 2010 and 15 December 2010. |
| |
| | | Quarterly coupons of US$0.508 per security were paid with respect to 8.125% capital securities on 15 January 2010, 15 April 2010, 15 July 2010 and 15 October 2010. |
| |
| | | Quarterly coupons of US$0.45 and US$0.50 per security were paid with respect to 8% capital securities on 15 September 2010 and on 15 December 2010, respectively. |
| |
| 2 | | Return on invested capital is based on the profit attributable to ordinary shareholders. Average invested capital is measured as average |
83
Report of the Directors: Operating and Financial Review(continued)
| | |
| | | total shareholders’ equity after adding back goodwill previously written-off directly to reserves, deducting average equity preference shares issued by HSBC Holdings and deducting/(adding) average reserves for unrealised gains/(losses) on effective cash flow hedges and available-for-sale securities. This measure reflects capital initially invested and subsequent profit. |
| |
| 3 | | The return on average total shareholders’ equity is defined as profit attributable to shareholders of the parent company divided by average total shareholders’ equity. |
| |
| 4 | | The cost efficiency ratio is defined as total operating expenses divided by net operating income before loan impairment charges and other credit risk provisions. |
| |
| 5 | | Each ADS represents five ordinary shares. |
| |
| 6 | | Total shareholder return is defined as the growth in share value and declared dividend income during the relevant period. |
| |
| 7 | | The Financial Times Stock Exchange 100 Index, the Morgan Stanley Capital International World Index and the Morgan Stanley Capital International World Bank Index. |
| |
| 8 | | HBEU is HSBC Bank plc; HBAP is The Hongkong and Shanghai Banking Corporation; and HBUS is HSBC Bank USA. Figures provided for HSBC Bank plc and The Hongkong and Shanghai Banking Corporation incorporate the major overseas branches of these entities. Subsidiaries of these entities are not included unless there is unrestricted transferability of liquidity between the subsidiaries and the parent. |
| |
| 9 | | This comprises our other main banking subsidiaries and, as such, includes businesses spread across a range of locations, in many of which we may require a higher ratio of net liquid assets to customer liabilities to reflect local market conditions. |
Reconciliations of reported and underlying profit/(loss) before tax
| | |
| 10 | | These columns comprise the net increments or decrements in profits in the current year compared with the previous year which are attributable to acquisitions or disposals of subsidiaries and/or movements in fair value of own debt attributable to credit spread. The inclusion of acquisitions and disposals is determined in the light of events each year. |
| |
| 11 | | ‘Currency translation’ is the effect of translating the results of subsidiaries and associates for the previous year at the average rates of exchange applicable in the current year. |
| |
| 12 | | Excluding adjustments in 2009. |
| |
| 13 | | Positive numbers are favourable: negative numbers are unfavourable. |
| |
| 14 | | Changes in fair value due to movements in own credit spread on long-term debt issued. This does not include the fair value changes due to own credit spread on structured notes issued and other hybrid instruments included within trading liabilities. |
| |
| 15 | | Net operating income before loan impairment charges and other credit risk provisions. |
| |
| 16 | | Excluding adjustments in 2008. |
Financial summary
| | |
| 17 | | This footnote is intentionally left blank. |
| |
| 18 | | The effect of the bonus element of the rights issue in 2009 has been included within the basic and diluted earnings per share. |
| |
| 19 | | Dividends per ordinary share expressed as a percentage of earnings per ordinary share. |
| |
| 20 | | Net interest income includes the cost of funding trading assets, while the related external revenues are reported in trading income. In our customer group results, the cost of funding trading assets is included with GB&M’s net trading income as interest expense. |
| |
| 21 | | Gross interest yield is the average annualised interest rate earned on average interest-earning assets (‘AIEA’). |
| |
| 22 | | Net interest spread is the difference between the average annualised interest rate earned on AIEA, net of amortised premiums and loan fees, and the average annualised interest rate paid on average interest-bearing funds. |
| |
| 23 | | Net interest margin is net interest income expressed as an annualised percentage of AIEA. |
| |
| 24 | | Other interest-earning assets includes intercompany eliminations. |
| |
| 25 | | Interest income on trading assets is reported as ‘Net trading income’ in the consolidated income statement. |
| |
| 26 | | Interest income on financial assets designated at fair value is reported as ‘Net income from financial instruments designated at fair value’ in the consolidated income statement. |
| |
| 27 | | This includes interest-bearing bank deposits only. |
| |
| 28 | | Interest expense on financial liabilities designated at fair value is reported as ‘Net income on financial instruments designated at fair value’ in the consolidated income statement, other than interest on own debt which is reported in ‘Interest Expense’. |
| |
| 29 | | This includes interest-bearing customer accounts only. |
| |
| 30 | | The cost of internal funding of trading assets was US$902m (2009: US$1,309m; 2008: US$5,547m) and is excluded from the reported ‘Net trading income’ line and included in ‘Net interest income’. However, this cost is reinstated in ‘Net trading income’ in HSBC’s customer group and global business reporting. |
| |
| 31 | | Net trading income includes income of US$23m (2009: expense of US$444m; 2008: income of US$529m), associated with changes in the fair value of issued structured notes and other hybrid instrument liabilities derived from movements in HSBC issuance spreads. |
| |
| 32 | | Other changes in fair value include gains and losses arising from changes in the fair value of derivatives that are managed in conjunction with HSBC’s long-term debt issued. |
| |
| 33 | | Discretionary participation features. |
| |
| 34 | | Net insurance claims incurred and movement in liabilities to policyholders arise from both life and non-life insurance business. For non-life business, amounts reported represent the cost of claims paid during the year and the estimated cost of notified claims. For life business, the main element of claims is the liability to policyholders created on the initial underwriting of the policy and any subsequent movement in the liability that arises, primarily from the attribution of investment performance to savings-related policies. Consequently, claims rise in line with increases in sales of savings-related business and with investment market growth. |
Consolidated balance sheet
| | |
| 35 | | Net of impairment allowances. |
| |
| 36 | | The calculation of capital resources, capital ratios and risk-weighted assets for 2008 to 2010 is on a Basel II basis. 2006 and 2007 comparatives are on a Basel I basis. |
| |
| 37 | | Capital resources are total regulatory capital, the calculation of which is set out on page 180. |
| |
| 38 | | Includes perpetual preferred securities, details of which can be found in Note 34 on the Financial Statements. |
84
Report of the Directors: Operating and Financial Review(continued)
| | |
| 39 | | The definition of net asset value per share is total shareholders’ equity, less non-cumulative preference shares and capital securities, divided by the number of ordinary shares in issue. |
| |
| 40 | | ‘Currency translation’ is the effect of translating the assets and liabilities of subsidiaries and associates for the previous year-end at the rates of exchange applicable at the current year-end. |
Economic profit
| | |
| 41 | | Expressed as a percentage of average invested capital. |
| |
| 42 | | Average invested capital is measured as average total shareholders’ equity after: |
| | – | | adding back the average balance of goodwill amortised pre-transition to IFRSs or subsequently written-off, directly to reserves (less goodwill previously amortised in respect of the French regional banks sold in 2008); |
| |
| | – | | deducting the average balance of HSBC’s revaluation surplus relating to property held for own use. This reserve was generated when determining the deemed carrying cost of such properties on transition to IFRSs and will run down over time as the properties are sold; |
| |
| | – | | deducting average preference shares and other equity instruments issued by HSBC Holdings; and |
| |
| | – | | deducting average reserves for unrealised gains/(losses) on effective cash flow hedges and available-for-sale securities. |
| | |
| 43 | | Return on invested capital is profit attributable to ordinary shareholders of the parent company, which can be found in Note 12 on the Financial Statements on page 296. |
Customer groups and global businesses and Geographical regions
| | |
| 44 | | The main items reported under ‘Other’ are certain property activities, unallocated investment activities, centrally held investment companies, gains arising from the dilution of interests in associates, movements in the fair value of own debt designated at fair value (the remainder of the Group’s gain on own debt is included in GB&M) and HSBC’s holding company and financing operations. The results also include net interest earned on free capital held centrally, operating costs incurred by the head office operations in providing stewardship and central management services to HSBC, and costs incurred by the Group Service Centres and Shared Service Organisations and associated recoveries. At 31 December 2010, there was a US$188m gain arising from the dilution of interests in associates (2009: nil; 2008: nil) and adverse fair value movements on HSBC’s own debt designated at fair value were US$0.1bn (2009: US$6.5bn adverse; 2008: US$6.6bn favourable). |
| |
| 45 | | Assets by geographical region and customer group include intra-HSBC items. These items are eliminated, where appropriate, under the heading ‘Intra-HSBC items’. |
| |
| 46 | | Net operating income before loan impairment charges and other credit risk provisions. |
| |
| 47 | | Loan impairment charges and other credit risk provisions. |
| |
| 48 | | Share of profit in associates and joint ventures. |
| |
| 49 | | In the analyses of customer groups and global businesses, net trading income comprises all gains and losses from changes in the fair value of financial assets and financial liabilities classified as held for trading, together with related external and internal interest income and interest expense, and dividends received; in the statutory presentation internal interest income and expense are eliminated. |
| |
| 50 | | In 2010, Global Markets included a favourable fair value movement of US$23m on the widening of credit spreads on structured liabilities (2009: adverse fair value movement of US$444m; 2008: favourable fair value movement of US$529m). |
| |
| 51 | | Total income earned on securities services products in the Group amounted to US$1.5bn (2009: US$1.4bn; 2008: US$2.2bn), of which US$1.5bn was in GB&M (2009: US$1.4bn; 2008: US$2.1bn) and US$29m was in CMB (2009: US$19m; 2008: US$45m). |
| |
| 52 | | Total income earned on payments and cash management products in the Group amounted to US$4.4bn (2009: US$4.1bn; 2008: US$5.8bn), of which US$3.3bn was in CMB (2009: US$3.1bn; 2008: US$4.1bn) and US$1.1bn was in GB&M (2009: US$1.1bn; 2008: US$1.7bn). |
| |
| 53 | | Total income earned on other transaction services in the Group amounted to US$2.3bn (2009: US$1.8bn; 2008: US$1.8bn), of which US$1.6bn was in CMB relating to trade and supply chain (2009: US$1.3bn; 2008: US$1.3bn) and US$636m was in GB&M of which US$523m related to trade and supply chain (2009: US$382m; 2008: US$355m) and US$113m related to banknotes and other (2009: US$125m; 2008: US$126m). |
| |
| 54 | | In each Group entity, Balance Sheet Management is responsible for managing liquidity and funding under the supervision of the local ALCO. Balance Sheet Management also manages the structural interest rate position of the entity within a Global Markets limit structure. |
| |
| 55 | | ‘Other’ in GB&M includes net interest earned on free capital held in the global business not assigned to products. |
| |
| 56 | | Inter-segment elimination comprises (i) the costs of shared services and Group Service Centres included within ‘Other’ which are recovered from customer groups, and (ii) the intra-segment funding costs of trading activities undertaken within GB&M. HSBC’s Balance Sheet Management business, reported within GB&M, provides funding to the trading businesses. To report GB&M’s ‘Net trading income’ on a fully funded basis, ‘Net interest income’ and ‘Net interest income/(expense) on trading activities’ are grossed up to reflect internal funding transactions prior to their elimination in the inter-segment column. |
| |
| 57 | | Net insurance claims incurred and movement in liabilities to policyholders. |
| |
| 58 | | ‘Employee expenses’ comprises costs directly incurred by each customer group. The reallocation and recharging of employee and other expenses directly incurred in the ‘Other’ customer group is shown in ‘Other operating expenses’. |
| |
| 59 | | RWAs are non-additive across geographical regions due to market risk diversification effects within the Group. |
| |
| 60 | | France primarily comprises the domestic operations of HSBC France, HSBC Assurances Vie and the Paris branch of HSBC Bank plc. |
| |
| 61 | | Hong Kong Government certificates of indebtedness were reclassified from PFS to ‘Other’ at 1 January 2010. |
| |
| 62 | | US includes the impairment of goodwill in respect of PFS – North America. |
85
Report of the Directors: Operating and Financial Review(continued)
Average balance sheet
| | |
| 63 | | Interest income on trading assets is reported as ‘Net trading income’ in the consolidated income statement. |
| |
| 64 | | Interest income on financial assets designated at fair value is reported as ‘Net income from financial instruments designated at fair value’ in the consolidated income statement. |
| |
| 65 | | Brazilian operations comprise HSBC Bank Brasil S.A.-Banco Múltiplo and subsidiaries, plus HSBC Serviços e Participações Limitada. |
| |
| 66 | | This includes interest-bearing bank deposits only. See page 31(n) for an analysis of all bank deposits. |
| |
| 67 | | Interest expense on financial liabilities designated at fair value is reported as ‘Net income on financial instruments designated at fair value’ in the consolidated income statement, other than interest on own debt which is reported in ‘Interest Expense’. |
| |
| 68 | | This includes interest-bearing customer accounts only. See page 31(o) for an analysis of all customer accounts. |
| |
| 69 | | Net interest margin is calculated as net interest income divided by average interest earning assets. |
| |
| 70 | | For the purpose of calculating the ratios, earnings consist of income from continuing operations before taxation and non-controlling interests, plus fixed charges, and after deduction of the unremitted pre-tax income of associated undertakings. Fixed charges consist of total interest expense, including or excluding interest on deposits, as appropriate, dividends on preference shares and other equity instruments, as applicable, and the proportion of rental expense deemed representative of the interest factor. |
| |
| 71 | | Trading assets and financial investments held by GB&M in North America include financial assets which may be repledged or resold by counterparties. |
| |
| 72 | | Derivative assets and derivative liabilities of GB&M include derivative transactions between different regions of GB&M. |
| |
| 73 | | Ratio excludes trading loans classified as in default. |
85(a)
Report of the Directors: Operating and Financial Review(continued)
Regulation and supervision
(Unaudited)
With listings of its ordinary shares in London, Hong Kong, New York, Paris and Bermuda, HSBC Holdings complies with the relevant requirements for listing and trading on each of these exchanges. In the UK, these are the Listing Rules of the Financial Services Authority (‘FSA’); in Hong Kong, The Rules Governing the Listing of Securities on The Stock Exchange of Hong Kong Limited (‘HKSE’); in the US, where the shares are traded in the form of ADSs, HSBC Holdings’ shares are registered with the US Securities and Exchange Commission (‘SEC’). As a consequence of its US listing, HSBC Holdings is also subject to the reporting and other requirements of the US Securities Act of 1933, as amended, the Securities Exchange Act of 1934, as amended, and the New York Stock Exchange’s (‘NYSE’) Listed Company Manual, in each case as applied to foreign private issuers. In France and Bermuda, HSBC Holdings is subject to the listing rules of Euronext, Paris and the Bermuda Stock Exchange respectively, applicable to companies with secondary listings.
A statement of our compliance with the provisions of the Combined Code on Corporate Governance issued by the Financial Reporting Council and with the Code on Corporate Governance Practices in Appendix 14 to the Rules Governing the Listing of Securities on The Stock Exchange of Hong Kong Limited is set out in the ‘Report of the Directors: Governance’ on page 183.
Our operations throughout the world are regulated and supervised by approximately 540 different central banks and regulatory authorities in those jurisdictions in which we have offices, branches or subsidiaries. These authorities impose a variety of requirements and controls designed to improve financial stability and the transparency of financial markets and their contribution to economic growth. These regulations and controls cover,inter alia, capital adequacy, depositor protection, market liquidity, governance standards, customer protection (for example, fair lending practices, product design, and marketing and documentation standards), and social responsibility obligations (for example, anti-money laundering and anti-terrorist financing measures). In addition, a number of countries in which we operate impose rules that affect, or place limitations on, foreign or foreign-owned or controlled banks and financial institutions. The rules include restrictions on the opening of local offices, branches or subsidiaries and the types of banking and non-banking activities that may be conducted by those local offices, branches or subsidiaries;
restrictions on the acquisition of local banks or regulations requiring a specified percentage of local ownership; and restrictions on investment and other financial flows entering or leaving the country. The supervisory and regulatory regimes of the countries where we operate will determine to some degree our ability to expand into new markets, the services and products that we will be able to offer in those markets and how we structure specific operations. As a result of government interventions in response to recent global economic conditions, it is widely anticipated that there will be a substantial increase in government regulation and supervision of the financial services industry, including the imposition of higher capital requirements, heightened disclosure standards and restrictions on certain types of transaction structures.
The FSA supervises us on a consolidated basis. In addition, each operating bank, finance company or insurance operation within HSBC is regulated by local supervisors. The primary regulatory authorities are those in the UK, Hong Kong and the US, our principal areas of operation.
UK regulation and supervision
UK banking and financial services institutions are subject to multiple regulations. The primary UK statute is the Financial Services and Markets Act 2000 (‘FSMA’). Additionally, data privacy is regulated by the Data Protection Act 1998. Other UK financial services legislation is derived from EU directives relating to banking, securities, insurance, investments and sales of personal financial services.
In addition to its role as our lead regulator, the FSA is responsible for authorising and supervising all our businesses in the UK which require authorisation under FSMA. These include deposit-taking, retail banking, life and general insurance, pensions, investments, mortgages, custody and share dealing businesses, and treasury and capital markets activity. HSBC Bank is our principal authorised institution in the UK.
FSA rules establish the minimum criteria for authorisation for banks and financial services businesses in the UK. They also set out reporting (and, as applicable, consent) requirements with regard to large individual exposures and large exposures to related borrowers. In its capacity as our supervisor on a consolidated basis, the FSA receives information on the capital adequacy of, and sets requirements for, HSBC as a whole. Further details on capital measurement are included in ‘Capital’ on pages 177 to 182.
85(b)
Report of the Directors: Operating and Financial Review(continued)
The FSA’s approach to capital requirements for UK insurers is to require minimum capital to be calculated on two bases. First, firms must calculate their liabilities on a prudent basis and add a statutory solvency margin (‘pillar 1’). Secondly, firms must calculate their liabilities on a realistic basis then add to this their own calculation of risk-based capital. The sum of realistic reserves and risk-based capital (‘pillar 2’) is agreed with the FSA. Insurers are required to maintain capital equal to the higher of pillars 1 and 2. The FSA has the right to object, on prudential grounds, to persons who hold, or intend to hold, 10% or more of the voting power of a financial institution.
The regulatory framework of the UK financial services system has traditionally been based on co-operation between the FSA and authorised institutions. The FSA monitors authorised institutions through ongoing supervision and the review of routine andad hocreports relating to financial and prudential matters. The FSA may periodically obtain independent reports, usually from the auditors of the authorised institution, as to the adequacy of internal control procedures and systems as well as procedures and systems governing records and accounting. The FSA meets regularly with our senior executives to discuss our adherence to the FSA’s prudential guidelines. They also regularly discuss fundamental matters relating to our business in the UK and internationally, including areas such as strategic and operating plans, risk control, loan portfolio composition and organisational changes, including succession planning. In light of current conditions, we have experienced an increased level of ongoing interaction with the FSA.
Hong Kong regulation and supervision
Banking in Hong Kong is subject to the provisions of the Banking Ordinance and to the powers, functions and duties ascribed by the Banking Ordinance to the Hong Kong Monetary Authority (the ‘HKMA’). The principal function of the HKMA is to promote the general stability and effective working of the banking system in Hong Kong. The HKMA is responsible for supervising compliance with the provisions of the Banking Ordinance. The Banking Ordinance gives power to the Chief Executive of Hong Kong to give directions to the HKMA and the Financial Secretary with respect to the exercise of their respective functions under the Banking Ordinance.
The HKMA has responsibility for authorising banks, and has discretion to attach conditions to its authorisation. The HKMA requires that banks or their holding companies file regular prudential
returns, and holds regular discussions with the management of the banks to review their operations. The HKMA may also conduct ‘on-site’ examinations of banks and, in the case of banks incorporated in Hong Kong, of any local and overseas branches and subsidiaries. The HKMA requires all authorised institutions to have adequate systems of internal control and requires the institutions’ external auditors, upon request, to report on those systems and other matters such as the accuracy of information provided to the HKMA. In addition, the HKMA may from time to time conduct tripartite discussions with banks and their external auditors.
The HKMA has the power to serve a notice of objection on persons if they are no longer deemed to be fit and proper to be controllers of the bank, if they may otherwise threaten the interests of depositors or potential depositors, or if they have contravened any conditions specified by the HKMA. The HKMA may revoke authorisation in the event of an institution’s non-compliance with the provisions of the Banking Ordinance. These provisions require, among other things, the furnishing of accurate reports.
The HKMA implemented Basel II with effect from 1 January 2007 for all Authorised Institutions incorporated in Hong Kong.
The marketing of, dealing in and provision of advice and asset management services in relation to securities in Hong Kong are subject to the provisions of the Securities and Futures Ordinance of Hong Kong (‘Securities and Futures Ordinance’). Entities engaging in activities regulated by the Securities and Futures Ordinance are required to be licensed. The HKMA is the primary regulator for banks involved in the securities business, while the Securities and Futures Commission is the regulator for non-banking entities.
US regulation and supervision
We are subject to extensive federal and state supervision and regulation in the US. Banking laws and regulations of the Board of Governors of the Federal Reserve System (the ‘Federal Reserve Board’), the Office of the Comptroller of the Currency (the ‘OCC’) and the Federal Deposit Insurance Corporation (the ‘FDIC’) govern many aspects of our US business.
On 21 July 2010, the United States enacted the Dodd-Frank Wall Street Reform and Consumer Protection Act (‘Dodd-Frank’), which provides a broad framework for significant regulatory changes that will extend to almost every area of US financial regulation. Implementation of Dodd-Frank will require further detailed rulemaking over several
85(c)
Report of the Directors: Operating and Financial Review(continued)
years by different US regulators, including the Department of the Treasury, the Federal Reserve Board, the FDIC, the Securities and Exchange Commission (the ‘SEC’), the Commodity Futures Trading Commission and the newly created Financial Stability Oversight Council (the ‘FSOC’) and Consumer Financial Protection Bureau (the ‘Consumer Bureau’), and uncertainty remains about the final details, timing and impact of the rules.
HSBC and our US operations are subject to supervision, regulation and examination by the Federal Reserve Board because HSBC is a ‘bank holding company’ under the US Bank Holding Company Act of 1956 (‘BHCA’), as a result of our control of HSBC Bank USA, N.A., McLean, Virginia (‘HBUS’); and HSBC Trust Company (Delaware), N.A., Wilmington, Delaware (‘HTCD’). HSBC North America Holdings Inc. (‘HNAH’), formed to hold our US and Canadian operations is also a ‘bank holding company’. Both HSBC and HNAH are registered as financial holding companies (‘FHC’s) under the BHCA, and, accordingly, may affiliate with securities firms and insurance companies and engage in other activities that are financial in nature or incidental or complementary to activities that are financial in nature. The ability of HSBC and HNAH to engage in expanded financial activities as FHCs depends upon HSBC and HNAH continuing to meet certain criteria set forth in the BHCA, including requirements that our US depository institution subsidiaries be ‘well capitalised’ and ‘well managed’, and that such institutions have achieved at least a satisfactory record in meeting community credit needs during their most recent examinations pursuant to the Community Reinvestment Act.
Under Dodd-Frank, in order for HNAH to meet the criteria for qualifying as a financial holding company, it will be required to be well capitalised.
In general, under the BHCA, an FHC would be required, upon notice by the Federal Reserve Board, to enter into an agreement with the Federal Reserve Board to correct any failure to comply with the requirements to maintain FHC status. Until such deficiencies are corrected, the Federal Reserve Board may impose limitations on the US activities of an FHC and depository institutions under its control. If such deficiencies are not corrected, the Federal Reserve Board may require an FHC to divest its control of any subsidiary depository institution or to desist from certain financial activities in the US.
The two US banks, HBUS and HTCD are subject to regulation and examination primarily by the OCC, secondarily by the FDIC, and by
the Federal Reserve Board. Banking laws and regulations restrict many aspects of their operations and administration, including the establishment and maintenance of branch offices, capital and reserve requirements, deposits and borrowings, investment and lending activities, payment of dividends and numerous other matters.
In December 2007, US regulators published a final rule regarding Risk-Based Capital Standards: Advanced Capital Adequacy Framework – Basel II. This final rule represents the US adoption of Basel II. The final rule became effective on 1 April 2008, and requires large bank holding companies, including HNAH, to adopt its provisions no later than 1 April 2011. HNAH has established comprehensive Basel II implementation project teams comprised of risk management specialists representing all risk disciplines. In addition, US banking authorities have adopted ‘leverage’ capital requirements that generally require US banks and bank holding companies to maintain a minimum amount of capital in relation to their balance sheet assets (measured on a non-risk weighted basis).
Dodd-Frank also establishes minimum risk-based capital requirements that shall not be less than the currently “generally applicable” capital requirements, which shall serve as a floor for any capital requirements the bank regulatory agencies may require. We expect that the US bank regulatory agencies will adopt regulations to implement Basel III as well as various provisions of Dodd-Frank. We cannot be certain of the impact the new capital regulations will have on our US capital ratios at this time.
HSBC Bank USA and HTCD are subject to risk-based assessments from the FDIC, which insures deposits generally to a maximum of US$250,000 per depositor for domestic deposits. Dodd-Frank provides for unlimited deposit insurance for certain non-interest-bearing transactions accounts for the period to 31 December 2012. Due to projected shortfalls in the FDIC fund as a result of continuing bank failures, the FDIC required all insured banks, including HBUS and HTCD, to prepay their insurance premium for the years 2010, 2011 and 2012.
Dodd-Frank changes the FDIC’s risk-based deposit insurance assessment framework primarily by basing assessments on an FDIC-insured institution’s total assets less tangible equity rather than US domestic deposits, which is expected to shift a greater portion of the aggregate assessments to large FDIC-insured institutions. The new large bank pricing system will result in higher assessment
85(d)
Report of the Directors: Operating and Financial Review(continued)
rates for banks with high-risk asset concentrations, less stable balance sheet liquidity, or potentially higher loss severity in the event of failure.
Our US consumer finance operations are subject to extensive state-by-state regulation in the US, and to laws relating to consumer protection (both in general, and in respect of sub-prime lending operations, which have been subject to enhanced regulatory scrutiny); discrimination in extending credit; use of credit reports; privacy matters; disclosure of credit terms; and correction of billing errors. They also are subject to regulations and legislation that limit operations in certain jurisdictions.
Dodd-Frank will limit the ability of banking entities to sponsor or invest in private equity or hedge funds or to engage in certain types of proprietary trading in the United States unrelated to serving clients. Dodd-Frank also provides regulators with tools to provide greater capital, leverage and liquidity requirements and other prudential standards, particularly for financial institutions that pose significant systemic risk. However, in imposing heightened capital, leverage, liquidity and other prudential standards on non-US banks, the Federal Reserve Board is directed to take into account the principle of national treatment and equality of competitive opportunity, and the extent to which the foreign bank is subject to comparable home country standards.
US regulators will also be able to restrict the size and growth of systemically significant non-bank financial companies and large interconnected bank holding companies and will be required to impose bright-line debt-to-equity ratio limits on financial companies that the FSOC determines pose a grave threat to financial stability. Furthermore, Dodd-Frank provides for an extensive framework for the regulation of over-the-counter (‘OTC’) derivatives, including mandatory clearing, exchange trading and transaction reporting of certain OTC derivatives, as well as rules regarding the registration of swap dealers and major swap participants, and related capital, margin, business conduct, record keeping and other requirements applicable to such entities. Dodd-Frank also requires broader regulation of hedge funds and private equity funds, and imposes new requirements with respect to asset securitisation activities. In addition, effective by July 2012, Dodd-Frank will require that the lending limits applicable to HBUS and HTCD take into account credit exposure from derivative transactions, securities borrowing and lending transactions, and repurchase and reverse repurchase agreements.
Dodd-Frank also grants the SEC discretionary rule-making authority to impose a new fiduciary standard on brokers, dealers and investment advisers, and expands the extraterritorial jurisdiction of US courts over actions brought by the SEC or the United States with respect to violations of the anti-fraud provisions in the Securities Act, the Securities Exchange Act of 1934 and the Investment Advisers Act of 1940. In addition, regulations which the FSOC, the Consumer Bureau or other regulators may adopt could affect the nature of the activities which our FDIC-insured depository institution subsidiaries may conduct, and may impose restrictions and limitations on the conduct of such activities. Dodd-Frank also establishes a new regime for the orderly liquidation of systemically significant financial companies and authorises assessments on financial institutions with US$50bn or more in consolidated assets to repay outstanding debts owed to the Treasury in connection with a liquidation of a systemically significant financial company under the new insolvency regime.
Implementation of Dodd-Frank and related final regulations could result in additional costs or limit or restrict the way we conduct our business, although uncertainty remains about the details, impact and timing of these reforms.
The HSBC Group takes its obligations to prevent money laundering and terrorist financing very seriously. HSBC has policies, procedures and training intended to ensure that its employees know and understand HSBC’s criteria for when a client relationship or business should be evaluated as higher risk. As part of its continuing evaluation of risk, the HSBC Group monitors its activities relating to the countries subject to US economic sanctions programmes administered by the Office of Foreign Assets Control as well as those subject to UN, UK and EU sanctions. HSBC Group policy requires that relevant Group offices should adhere to the letter and spirit of all applicable laws and regulations. HSBC’s business activities include banking services for nationals of, and clients domiciled in, some of the countries. The Group had a small representative office in Tehran, Iran which was closed in December 2010.
HSBC Bank USA entered into a Consent Cease & Desist Order with OCC, and HNAH entered into a Consent Cease & Desist Order with the Federal Reserve Board in the first week of October 2010. These Orders require improvement for an effective Compliance Risk Management Programme including anti-money laundering controls across the Group’s US businesses. Steps continue to be taken to address the requirements of these Orders and to ensure that
85(e)
Report of the Directors: Operating and Financial Review(continued)
compliance and effective policies and procedures are maintained.
The US State Department has designated certain countries (Cuba, Iran, Sudan and Syria) as state sponsors of terrorism, and US law generally prohibits US persons from doing business with such countries. HSBC is aware of initiatives by governmental entities and institutions in the US to adopt rules, regulations or policies prohibiting transactions with or investments in entities doing business with such countries. HSBC Group Policy requires all Group companies to comply to the extent applicable with US law and regulation, including the
country and individual sanctions promulgated by OFAC sanctions. This means that not only must US subsidiaries and US nationals comply with OFAC regulations, but that HSBC subsidiaries outside the US which are not US persons must not participate in US Dollar business that would, if conducted by a US person, contravene the OFAC sanctions. The HSBC Group does not consider that its business activities with counterparties in, or directly relating to, these countries are material to its business, and such activities represented a very small part of total assets at 31 December 2010 and total revenues for the year ended 31 December 2010.
85(f)
Report of the Directors: Operating and Financial Review(continued)
Risk
| | | | | |
| | | Page |
| | | 86 | |
| | | 87 | |
| | | 87 | |
| | | 87 | |
| | | 88 | |
| | | 88 | |
| | | 88 | |
| | | 89 | |
| | | 90 | |
| | | 93 | |
| | | 93 | |
| | | 95 | |
| | | 103 | |
| | | 114 | |
| | | 124 | |
| | | 127 | |
| | | 128 | |
| | | 139(a) |
| | | 140 | |
| | | 140 | |
| | | 141 | |
| | | 142 | |
| | | 143 | |
| | | 144 | |
| | | 145 | |
| | | 145 | |
| | | 145 | |
| | | 146 | |
| | | 149 | |
| | | 149 | |
| | | 151 | |
| | | 152 | |
| | | 154 | |
| | | 154 | |
| | | 155 | |
| | | 155 | |
| | | 155 | |
| | | 156 | |
| | | 156 | |
| | | 157 | |
| | | 161 | |
| | | 170 | |
| | | 170 | |
| | | 171 | |
| | | 172 | |
| | | 172 | |
| | | 172 | |
| | | 173 | |
| | | 174 | |
1Unaudited 2Audited 3Audited where indicated
Risk Profile
(Unaudited)
Managing our risk profile
| • | | A strong balance sheet remains core to our philosophy. |
| |
| • | | We have reduced our exposure to higher risk asset classes while achieving controlled balance sheet growth. |
| |
| • | | We have ensured that our portfolio remains diversified across regions, client sectors and risk types. |
Maintaining capital strength and strong liquidity position
| • | | Our tier 1 capital ratio remains strong at 12.1%. |
| |
| • | | We have sustained our strong liquidity position throughout 2010. |
| |
| • | | The ratio of customer advances to deposits remains below 80%. |
Strong governance
| • | | Our Global Risk function is independent of our commercial and operational functions. |
| |
| • | | Robust risk governance and accountability is embedded across the Group. |
| |
| • | | The Board, advised by the Group Risk Committee, approves our risk appetite. |
| |
| • | | A global risk operating model provides consistent and effective oversight across all six regions and our customer groups and global businesses. |
Our top and emerging risks
| • | | Challenges to our business operations. |
| |
| • | | Challenges to our governance and internal control systems. |
| |
| • | | Macro-economic and geopolitical risk. |
| |
| • | | Macro-prudential and regulatory risks to our business model. |
86
Report of the Directors: Operating and Financial Review(continued)
Managing risk
(Unaudited)
The continued growth in our business in 2010 was achieved while ensuring risks were assumed in a measured manner and in line with our appetite for such risks. This approach is encapsulated within our risk appetite framework. It is approved by the Group Risk Committee and the Board.
The framework is maintained at Group, regional, global business and customer group levels, operating through governance bodies, processes and metrics designed to assist in risk management. Risk appetite statements define, at various levels of the business, the qualitative and quantitative expressions of the risks which HSBC is prepared to embrace in alignment with its strategy and business plans. Quantitative metrics are assigned to five key categories: earnings, capital and liquidity, impairments and expected losses, risk category and diversification and scenario stress testing. Measurement against the metrics serves to:
| • | | guide underlying business activity, ensuring it is aligned to risk appetite statements; |
| |
| • | | determine risk-adjusted remuneration; |
| |
| • | | enable the key underlying assumptions to be monitored and, where necessary, adjusted through subsequent business planning cycles; and |
| |
| • | | promptly identify business decisions needed to mitigate risk. |
| |
| |
Report of the Group Risk Committee |
| |
| Further commentary on risk appetite, risk governance and stress testing can be found within the Report of the Group Risk Committee, on pages 197 to 201 of the Governance section. |
| |
| |
The diversification of our lending portfolio across our regions, together with our broad range of customer groups and products, ensure that we are not dependent on a few countries or markets to generate income and growth. Our geographical diversification also provides impetus to our strategies for growth in faster-growing markets and those with international connectivity.
During 2010, the financial markets were dominated by concerns over sovereign debt. In addition, the perception that the world economic recovery remained fragile created volatility in certain financial markets. Further quantitative easing from the US temporarily boosted market confidence, but inflationary pressures remained an issue, especially in the UK and some emerging markets.
With an ever-changing economic and financial environment, we pro-actively review our risk profile and, where appropriate, introduce new risk
measures. Stress testing will continue to evolve to ensure that it considers prevailing concerns.
Our insurance operations are managed with regard to the effects on financial markets of prevailing economic conditions such as the low yields available on fixed-interest investments and continuing high unemployment rates, particularly in the US and Europe.
We maintained a strong balance sheet during 2010 while reducing the overall risk in our portfolio. Our balance sheet assets grew by 4% during the year while our credit risk-weighted assets fell by 1.4%. This was achieved, in part, by concentrating on our growth in core portfolios and running off those that were not core to our business.
In addition, we reduced our loan impairment charges and other credit risk provisions from US$26.5bn in 2009 to US$14.0bn in 2010, reflecting the general improvement in the credit quality of our portfolio.
Preserving our strong capital position has long been, and will remain, a key priority for HSBC. We are equipped to respond to the capital requirements imposed by Basel III, which are discussed further on pages 181 and 182, and to sustain future growth. We have adopted a holistic approach to testing the sensitivities of our capital plans against a number of scenarios; our approach to scenario stress testing analysis is discussed below.
We continue to maintain a strong liquidity position and are well positioned for the new regulatory landscape. The run-off of the HSBC Finance portfolio and the continuing moderation of market conditions in 2010 contributed to our strong liquidity position.
Risk governance
(Unaudited)
Our strong risk governance reflects the importance placed by the Board on shaping the Group’s risk strategy and managing risks effectively. It is supported by a clear policy framework of risk ownership, by the cascading from the GMB of balanced scorecards that align business and risk objectives, and by the accountability of all officers for identifying, assessing and managing risks within the scope of their assigned responsibilities. This personal accountability, reinforced by the governance structure, experience and mandatory learning, helps to foster throughout HSBC a disciplined and constructive culture of risk management and control.
87
Report of the Directors: Operating and Financial Review(continued)
We conduct a range of Group stress testing scenarios including, but not limited to, severe global economic downturn, country, sector and counterparty failures, and a variety of projected major operational risk events. The outcomes of the stress scenarios are used to assess the potential impact on demand for regulatory capital against its supply. We also participate, where appropriate, in scenario analyses requested by regulatory bodies.
In addition to the suite of risk scenarios considered for the Group, each major HSBC subsidiary conducts regular macro-economic and event-driven scenario analyses specific to its region.
Stress testing is also used by the market risk discipline to evaluate the potential impact on portfolio values of events or movements in a set of financial variables.
Challenges and uncertainties
(Unaudited)
The top and emerging risks identified through our risk management processes and outlined in the Report of the Group Risk Committee on page 199, present challenges and uncertainties as we carry out our activities. These are considered in further detail below.
Business operations, governance and control
Operational risks are inherent in our business
We are exposed to many types of operational risk, including fraudulent and other criminal activities (both internal and external), breakdowns in processes or procedures, or systems failure or unavailability. We are also subject to the risk of disruption to our business arising from events that are wholly or partially beyond our control (for example: natural disasters, acts of terrorism, epidemics and transport or utility failures) which may give rise to losses in service to customers and/or economic loss to HSBC. All of these risks are also applicable where we rely on external suppliers or vendors to provide services to us and our customers.
The reliability and security of our information and technology infrastructure and its customer databases, for example to combat internet fraud, are crucial to maintaining our banking applications and processes and to protecting the HSBC brand. Critical system failure, any prolonged loss of service availability or any material breach of data security, particularly involving confidential customer data,
could cause serious damage to our ability to serve our clients, could breach regulations under which we operate and could cause long-term damage to our business and brand. Information security and the management of increasing operational complexity are two of the key emerging operational risks that we face.
We are subject to legal and compliance risks, which could have an adverse effect on the Group
Legal and compliance risks arise from a variety of sources with the potential to cause harm to HSBC and our ability to operate. These issues require us to deal appropriately with potential conflicts of interest; regulatory requirements; ethical issues; anti-money laundering laws and regulations; privacy laws; information security policies; sales and trading practices; and the conduct of companies with which we are associated. Failure to address these issues appropriately may give rise to additional legal and compliance risk to HSBC, with an increase in the number of litigation claims and the amount of damages asserted against us, or subject us to regulatory enforcement actions, fines or penalties or reputational damage.
We are subject to tax-related risks in the countries in which we operate
We are subject to the substance and interpretation of tax laws in all countries in which we operate. Failure to respond to changes in tax rates and comply with procedures required by tax authorities could lead to increased tax charges, including financial or operating penalties.
Liquidity and funding risks are inherent in our business
HSBC’s business model is founded upon having ready access to financial resources whenever required to meet our obligations and grow our business. To this end, our entities seek to maintain a diversified and stable funding base comprising core retail and corporate customer deposits and institutional balances, and certain entities augment this with amounts of long-term wholesale funding. In addition, we hold portfolios of highly liquid assets to enable us to respond to unusual liquidity requirements. We continue to maintain a strong liquidity position, moving into the new regulatory landscape.
Where markets become illiquid, the value at which financial instruments can be realised is highly uncertain, and capital resources may shrink as valuations decline. Rating agency downgrades of
88
Report of the Directors: Operating and Financial Review(continued)
instruments to which we have exposure, or threats of downgrades, can exacerbate the effect. The liquidity of those HSBC entities that utilise long-term wholesale markets could be constrained by an inability to access them due to a variety of unforeseen market dislocations or interruptions.
The market conditions that the financial services industry experienced during the recent financial crisis highlighted the significant benefits of a diversified core deposit base, leading to increased competition for such deposits and the greater risk of deposit migration between competitors.
Our GB&M business operates in many markets affected by illiquidity and is subject to the threat of extreme price volatility, either directly or indirectly, through exposures to securities, loans, derivatives and other commitments. Although market conditions continued to moderate in 2010, it is difficult to predict if this trend will continue and, if conditions worsen, which of our markets, products and other businesses will be affected. Any repeat of these factors could have an adverse effect on our results.
Macro-economic and geopolitical
Prevailing economic and market conditions may adversely affect our results
Our earnings are affected by global and local economic and market conditions. Following the problems experienced in financial markets in 2007-8, concerted government action in 2009 paved the way for a general improvement in the economic environment in 2010, though recovery was variable between regions. The eurozone economies came under greater pressure, the dominant concern being over sovereign debt. The financial services industry continued to face an unusually high degree of uncertainty.
With unemployment remaining high, consumer confidence weak in developed markets and amid signs of emerging inflationary pressures, economic conditions remain fragile and volatile. Some countries may recover only slowly to past levels of growth, with the possibility of a return to recessionary conditions in more sluggish economies, while others which are growing rapidly may need to undertake major adjustments to counter the formation of asset bubbles. This could have an adverse effect on our operating results. In particular, we may face the following challenges in connection with these events to our operations and operating model:
| • | | the demand for borrowing from creditworthy customers may diminish if economic activity slows; |
| • | | trade and capital flows may contract as a result of protectionist measures being introduced in certain markets, or on the emergence of geopolitical risks; |
| |
| • | | a prolonged period of low interest rates will constrain, for example through margin compression and low returns on assets, net interest income we earn on our excess deposits; |
| |
| • | | our ability to borrow from other financial institutions or to engage in funding transactions could be adversely affected by market disruption, for example in the event of contagion from stress in the eurozone sovereign and financial sectors; |
| |
| • | | market developments may depress consumer and business confidence, for example if growth in the US or the UK were to be poor, adversely affecting both asset prices and payment patterns and leading to increases in delinquencies and default rates, write-offs and loan impairment charges beyond our expectations. The effect of such conditions in 2010 and previous years on our North American retail business is described on page 110. |
We are subject to political and economic risks in the countries in which we operate
We responded effectively to the financial crisis and, more recently, the sovereign debt problems within the eurozone, where we continued during 2010 to support our operations and carry out wider market functions.
As an organisation which operates in 87 countries and territories, however, our results are subject to the risk of loss from unfavourable political developments, currency fluctuations, social instability and changes in government policies on such matters as expropriation, authorisations, international ownership, interest-rate caps, foreign exchange transferability and tax in the jurisdictions in which we operate.
The ability of HSBC’s subsidiaries and affiliates to pay dividends could be restricted by changes in official banking measures, exchange controls and other requirements. We prepare our accounts in US dollars, but because a substantial portion of our assets, liabilities, funds under management, revenues and expenses are denominated in other currencies, changes in foreign exchange rates have an effect on our reported income, cash flows and shareholders’ equity.
89
Report of the Directors: Operating and Financial Review(continued)
We have significant exposure to counterparty risk within our portfolio
We have exposure to virtually all major industries and counterparties, and we routinely execute transactions with counterparties in financial services, including brokers and dealers, commercial banks, investment banks, mutual and hedge funds, and other institutional clients. Many of these transactions expose us to credit risk in the event of default by our counterparty or client. Financial institutions are necessarily interdependent because of trading, clearing, counterparty or other relationships. As a consequence, a default by, or decline in market confidence in, individual institutions, or anxiety about the financial services industry generally, can lead to further individual and/or systemic losses. Our credit risk may remain high if the collateral taken to mitigate counterparty risk cannot be realised or has to be liquidated at prices which are insufficient to recover the full amount of our loan or derivative exposure. For further information relating to the major risk areas, see ‘Areas of Special Interest’ on page 103.
Macro-prudential and regulatory
We face a number of challenges in regulation and supervision
Financial services providers face increased regulation and supervision, with more stringent and costly requirements in the areas of capital and liquidity management and of compliance relating to conduct of business and the integrity of financial services delivery. Increased government intervention and control over financial institutions, together with measures to reduce systemic risk, could significantly alter the competitive landscape.
Recent regulatory and supervisory developments have largely been shaped by the leaders, Finance Ministers and Central Bank Governors of the Group of Twenty nations (‘the G20’), who delegated the development and issuance of standards to the Basel Committee of Banking Supervisors (‘the Basel Committee’). The G20 also established the Financial Stability Board (‘FSB’) to assess vulnerabilities affecting the financial system as a whole, as well as to monitor and advise on market developments and best practice in meeting regulatory standards.
In looking to address the systemic failures that caused the financial crisis of 2007-8, the authorities asserted two primary objectives: to establish a resilient system to reduce substantially the risks of failure of financial institutions and, in case failure in the end proved unavoidable, to have in place
measures to achieve orderly resolution without cost to taxpayers. Governments and regulators have embarked on significant change in the regulation of the financial system, highlighting the following priorities:
| • | | a stronger international framework for prudential regulation, ensuring significantly increased liquidity and regulatory capital buffers and enhanced quality of capital; |
| |
| • | | convergence towards a single set of high-quality, global, independent accounting standards, with particular focus on accounting for financial instruments and off-balance sheet exposures; |
| |
| • | | strengthening the regulation of hedge funds and credit rating agencies, and improving the infrastructure for derivative transactions, including central counterparty clearing of over-the-counter derivatives; |
| |
| • | | design and implementation of a system which will allow for the restructuring or resolution of financial institutions, without taxpayers ultimately bearing the burden; |
| |
| • | | an increased role for colleges of supervisors to coordinate oversight of systemically significant institutions such as HSBC, and effective coordination of resolution regimes for failed banks; |
| |
| • | | measures on financial sector compensation arrangements to prevent excessive short-term risk taking and mitigate systemic risk on a globally consistent basis; and |
| |
| • | | a fair and substantial contribution by the financial sector towards paying for any burden associated with government interventions, where they occur, to repair and reduce risks from the financial system or to fund the resolution of problems. |
Measures proposed by the Basel Committee to increase resilience in the financial system
The Basel Committee, following consultation, impact analyses and draft proposals during 2010, issued final proposals in December 2010, known as Basel III, on the twin areas of capital and liquidity, the key aspects of which are set out below.
| • | | Risk weightings:increased weightings for the trading book and re-securitisations are planned for implementation by the end of 2011. A fundamental review of the trading book will continue during 2011. |
90
Report of the Directors: Operating and Financial Review(continued)
| • | | Quality of capital:there is renewed emphasis on common equity as the principal component of tier 1 capital, with increased deductions from shareholders’ equity (calculated on an accounting basis) to determine the level of regulatory capital. The phasing-in periods for these new deductions will start in 2014, to be fully implemented by 2018. |
| • | | Minimum ratios:a new minimum common equity requirement of 4.5% is to be implemented in full by 1 January 2015. An additional capital conservation buffer of 2.5% in common equity effectively acts as a trigger for restrictions on management actions (such as the payment of dividends or bonuses) so that the capital structure can be rebuilt. This will be phased in between 1 January 2016 and 1 January 2019. In addition to these core tier 1 levels, additional requirements from the Basel Committee for tier 1 capital of 1.5% and tier 2 capital of 2.0%, by 2019, will lift the minimum total capital requirement for banks to around 10.5%. |
| • | | Countercyclical capital buffer:the Basel Committee has finalised its proposals for a countercyclical capital buffer of 2.5% in common equity, to be built up in periods of excess credit growth compared with GDP growth. It is not clear how these may operate in practice and there is doubt that either supervisors or the market would support release of a buffer again as the economic cycle turned. |
| • | | Total leverage:the Committee has proposed a leverage ratio of 3% of total assets to constrain aggregate size relative to the capital base. It is intended that an observation period of parallel running from 2013 to 2017 should enable a minimum standard to become mandatory in 2018. |
| • | | Liquidity and funding:a new minimum standard, the Liquidity Coverage Ratio, has been developed to promote the short-term resilience of a bank’s liquidity risk profile. A Net Stable Funding Ratio has also been introduced to provide a sustainable maturity structure of assets and liabilities. As it is not yet clear what unintended consequences these measures may have, they will be phased in after observation periods in 2015 and 2018, respectively. |
| • | | The Basel Committee is also developing an approach, due by the end of 2011, to defining Global Systemically Important Financial Institutions (‘G-SIFI’s) to introduce more |
| | | rigorous oversight and co-ordinated assessment of their risks through international supervisory colleges, provide for higher levels of capital and liquidity resilience, and require mandatory recovery and resolution plans with institution-specific crisis cooperation agreements between cross-border crisis management groups. |
A strong capital position has long been, and will remain, a key priority for HSBC. We are equipped to respond to the capital requirement standards of Basel III, as discussed further on pages 181 and 182, and to sustain future growth.
| • | | Remuneration:the FSB has issued principles on remuneration designed to guide regional and national authorities in establishing appropriate regimes to align remuneration in a risk-based manner with the long-term interests of stakeholders. The EU has implemented rule changes in the Capital Requirements Directive which impact the balance between fixed and variable remuneration, establishing limits on the percentage of bonus which can be paid in cash. Approaches to the issue remain divergent globally, however. |
| • | | Bank levies:a number of levies are being raised on banks, notably by the UK, Germany and France. There is a renewed US proposal to raise a financial crisis responsibility fee on certain financial companies with assets over US$50bn. The European levies are calculated with reference to measures of stability of funding, in order to encourage more stable structures. In the UK, for example, the levy is to be charged at a rate of 0.075% on all liabilities excluding insured deposits and certain other elements, but with a lower rate for longer-term liabilities and uninsured deposits. Germany will hypothecate levy income to create resolution funds to support failing banks, while in other jurisdictions it will accrue to general tax revenues. Under the draft legislation, the UK levy is not tax deductible and does not meet the definition of an income tax for income statement purposes. For indicative purposes only, the UK levy that would be payable based on the closing 2010 balance sheet, after taking into account announced changes to deposit protection schemes in 2011, is estimated at US$0.6bn. |
| • | | Other taxes:other areas of financial sector taxation being considered by the authorities are a Financial Activities Tax (‘FAT’), a tax on profit and remuneration, and a Financial |
91
Report of the Directors: Operating and Financial Review(continued)
| | | Transaction Tax (‘FTT’) applied to a specified range of financial transactions. An IMF report for the G20 in 2010 saw merit in an FAT but did not recommend an FTT as it was felt not to address the key issues within the G20 mandate and might have unintended economic and regulatory consequences. In its Seoul 2010 communique the G20 did not promote any one approach for adoption. Both the European Commission and the UK Government are considering an FAT, which the former believes can work at EU level. The EU also sees merit in an FTT but, recognising the dependency on an international consensus, will continue to work within the G20 for its adoption. |
| • | | The ‘Volcker Rule’:under the Dodd-Frank Act, banking organisations with operations in the US face limits on their ability to sponsor or invest in private equity or hedge funds and are prohibited from engaging in certain types of ‘proprietary trading’ in the US, subject to a number of exceptions allowing an entity significant leeway to engage in client-serving trading, such as market-making and underwriting, and risk-mitigating hedging activities. The ultimate impact of these restrictions will depend on how US regulators implement them in rulemaking. |
| • | | Derivatives and central counterparties regulation:as agreed by the G20, the authorities are seeking to reduce systemic risk and volatility relating to derivatives trading. In the US, the Dodd-Frank Act provides for an extensive regulatory framework for over the counter (‘OTC’) derivatives. In addition to the mandatory clearing, exchange trading and reporting of certain swaps and security-based swaps, it also requires the registration of swap dealers and major swap participants, making them subject to capital, margin, business conduct and record-keeping regulations. In September 2010, the EU Commission presented proposals, currently in negotiation, for all standardised OTC derivatives to be reported to trade repositories and centrally cleared by the end of 2012. The proposal disincentivises derivative contracts which are not eligible for central clearing by proposing higher capital requirements. Exemptions for foreign exchange swaps and forwards are currently being considered. |
| • | | Markets in financial instruments:the European Commission is conducting a major Review of the Markets in Financial Instruments Directive, potentially to extend its scope beyond equities to other asset classes including bonds, exchange- |
| | | traded funds and other equity-like and non-equity instruments, and to promote their trading on exchanges and other markets that will be subject to regulation. It also proposes giving additional power to regulators to ban trading in products that are eligible to be cleared but for which no clearing solution is currently available. |
| • | | The UK Independent Commission on Banking:this Commission was established to examine issues of banking activity and competition, including the potential impact on financial markets of a number of options to separate the retail and wholesale activities of universal banks. Responses to the opening consultation have been published and the Commission intends to publish an interim report in April 2011, with further consultation prior to a final report in September 2011. The UK Government is not bound to adopt the Commission’s recommendations. |
| • | | Recovery and resolution plans:such plans are considered a key element in improving the ability of regulators to rescue (or ‘resolve’) firms when they get into difficulties without putting taxpayer monies at risk. Studies and pilots have been initiated by various official bodies on the resolution of financial firms and the international coordination of such exercises; the UK authorities have been at the forefront of work to develop approaches to this subject. The EU has consulted on a new framework for crisis management, including so-called ‘bail-in’ creditor write-down resolution. Legislative proposals are expected mid-2011. In the US, the Dodd-Frank Act established the Orderly Liquidation Authority which will ultimately provide a bank-like receivership process for large financial companies; resolution plans will be required of large financial institutions and rules for ‘early remediation’ will be forthcoming. There is currently no consistent approach and a number of key areas need to be addressed, including an international legal framework for addressing competing creditor claims and the application of collateral. |
Restructuring of regulatory bodies
In addition to the significant volume of new regulation emanating from the Basel Committee and others, the landscape of financial sector regulation itself in a number of major Western countries is undergoing significant change, presenting its own challenges to the industry and its implementation of proposed reforms.
92
Report of the Directors: Operating and Financial Review(continued)
| • | | In the EU, new authorities for segments of the financial services sector took up their powers with effect from 1 January 2011: the European Banking Authority, the European Securities Markets Authority and the European Insurance and Occupational Pension Authority. In addition, a European Systemic Risk Board will consider emerging macro-prudential risks. |
| • | | In the UK, the Financial Services Authority’s (‘FSA’) prudential supervisory responsibilities will be transferred in 2012 to a Bank of England agency, the Prudential Regulatory Authority, while the Financial Conduct Authority will act as a single regulator of conduct of business for both retail and wholesale firms. |
| • | | In the US, the Dodd-Frank Act re-assigns responsibilities of existing agencies, demising the Office of Thrift Supervision and creating others, including a Financial Stability Oversight Council to address systemic matters and a Bureau of Consumer Protection. |
Implementation risks
The extensive programme of regulatory change carries significant implementation risks for authorities and industry participants alike, including:
| • | | Disparities in implementation:many official measures are proposals in development and negotiation, and have yet to be enacted into regional and national legislation. These processes could result in differing, fragmented and overlapping implementation around the world, leading to risks of regulatory arbitrage, a far from level competitive playing-field and increased compliance costs, especially for large, global financial institutions such as HSBC. |
| • | | Timetable and market expectations:while the Basel Committee has announced the timetable for its core proposals in Basel III, it remains uncertain how these and other measures will play out in practice, for instance with regard to differences in approach between Basel III and the Dodd-Frank Act in the US. Meanwhile, market expectations will exert pressure on institutions to assess and effect compliance well in advance of official timetables. |
| • | | Wider economic impact and unforeseen consequences:while the conclusions of official and industry studies have diverged, the measures proposed will clearly impact on financial and economic activity in ways that cannot yet be clearly foreseen. For example, higher capital requirements may seriously |
| | | constrain the availability of funds for lending to support economic recovery. |
Credit Risk
(Audited)
Credit risk is the risk of financial loss if a customer or counterparty fails to meet a payment obligation under a contract. It arises principally from direct lending, trade finance and leasing business, but also from off-balance sheet products such as counterparty risk guarantees and credit derivatives, and from our holdings of debt securities. Of the risks in which we engage, credit risk generates the largest regulatory capital requirement.
| | | |
| |
| Principal objectives of our credit risk management |
| | | |
• | | to maintain across HSBC a strong culture of responsible lending and a robust risk policy and control framework; |
| | | |
• | | to both partner and challenge our businesses in defining, implementing and continually re-evaluating our risk appetite under actual and scenario conditions; and |
| | | |
• | | to ensure there is independent, expert scrutiny of credit risks, their costs and their mitigation. |
| |
| |
The Credit Risk department fulfils the role of an independent credit control unit as part of the Global Risk function in our Group Management Office (‘GMO’). Credit approval authorities are delegated by the Board to the most senior Chief Executive Officers, who receive commensurate authorities from their own boards. In each major subsidiary, a Chief Risk Officer reports to the local Chief Executive Officer on credit-related issues, while maintaining a direct functional reporting line to the Group Chief Risk Officer in GMO.
(Audited)
Our credit risk rating systems and processes differentiate exposures in order to highlight those with greater risk factors and higher potential severity of loss. In the case of individually significant accounts, risk ratings are reviewed regularly and any amendments are implemented promptly. Within our retail businesses, risk is assessed and managed using a wide range of risk and pricing models to generate portfolio data.
Our risk rating system facilitates the internal ratings-based (‘IRB’) approach under Basel II adopted by the Group to support calculation of our minimum credit regulatory capital requirement. For further details, see ‘Credit quality of financial instruments’ on page 114.
93
Report of the Directors: Operating and Financial Review(continued)
Special attention is paid to problem exposures in order to accelerate remedial action. Where appropriate, our operating companies use specialist units to provide customers with support in order to help them avoid default wherever possible.
| | | |
| |
| The high-level oversight and management of credit risk provided globally by the Credit Risk function within GMO |
| | | |
• | | to formulate Group credit policy. Compliance, subject to approved dispensations, is mandatory for all operating companies which must develop local credit policies consistent with Group policies; |
| | | |
• | | to guide operating companies on our appetite for credit risk exposure to specified market sectors, activities and banking products and controlling exposures to certain higher-risk sectors; |
| | | |
• | | to undertake an independent review and objective assessment of risk. Global Risk assesses all commercial non-bank credit facilities and exposures over designated limits, prior to the facilities being committed to customers or transactions being undertaken; |
| | | |
• | | to monitor the performance and management of portfolios across the Group; |
| | | |
• | | to control exposure to sovereign entities, banks and other financial institutions, as well as debt securities which are not held solely for the purpose of trading; |
| | | |
• | | to set our policy on large credit exposures, ensuring that concentrations of exposure by counterparty, sector or geography do not become excessive in relation to our capital base, and remain within internal and regulatory limits; |
| | | |
• | | to control our cross-border exposures (see page 102); |
| | | |
• | | to maintain and develop our risk rating framework and systems. The Group Chief Risk Officer chairs the Credit Risk Analytics Oversight Committee, which reports to the Risk Management Meeting and oversees risk rating model governance for both wholesale and retail business; |
| | | |
• | | to report on retail portfolio performance, high risk portfolios, risk concentrations, country limits and cross-border exposures, large impaired accounts, impairment allowances and stress testing results and recommendations to the Risk Management Meeting, the Group Risk Committee and the Board; and |
| | | |
• | | to act on behalf of HSBC Holdings as the primary interface, for credit-related issues, with the Bank of England, the FSA, local regulators, rating agencies, analysts and counterparts in major banks and non-bank financial institutions. |
| |
| |
Group and regional Credit Review and Risk Identification teams regularly review exposures and processes in order to provide an independent, rigorous assessment of credit risk across the HSBC Group, reinforce secondary risk management controls and share best practice. Internal audit, as a tertiary control function, focuses on risks with a global perspective and on the design and effectiveness of primary and secondary controls, carrying out oversight audits via sampling of global/regional control frameworks, themed audits of key or emerging risks and project audits to assess major change initiatives.
(Audited)
It is HSBC’s policy that each operating company creates allowances for impaired loans promptly and consistently.
Impairment allowances may be assessed and created either for individually significant accounts or, on a collective basis, for groups of individually significant accounts for which no evidence of impairment has been individually identified or for high-volume groups of homogeneous loans that are not considered individually significant.
When impairment losses occur, we reduce the carrying amount of loans and advances through the use of an allowance account. When impairment of available-for-sale financial assets and held-to-maturity financial investments occurs, we reduce the carrying amount of the asset directly. For further details, see ‘Critical accounting policies’ on page 33.
Write-off of loans and advances
Loans are normally written off, either partially or in full, when there is no realistic prospect of further recovery. For secured loans, write-off generally occurs after receipt of any proceeds from the realisation of security. Write-off may occur earlier when the net realisable value of any collateral has been determined and there is no reasonable expectation of further recovery.
In HSBC Finance, the carrying amounts of residential mortgage and second lien loans in excess of net realisable value are written off at or before the time foreclosure is completed or settlement is reached with the borrower. If there is no reasonable expectation of recovery, and foreclosure is pursued, the loan is normally written off no later than the end of the month in which the loan becomes 180 days contractually past due.
Unsecured personal facilities, including credit cards, are generally written off at between 150 and 210 days past due, the standard period being the end of the month in which the account becomes 180 days contractually delinquent. Write-off periods may be extended, generally to no more than 360 days past due but in very exceptional circumstances exceeding that figure, in a few countries where local regulation or legislation constrain earlier write-off, or where the realisation of collateral for secured real estate lending extends to this time.
In the event of bankruptcy or analogous proceedings, write-off may occur earlier than at the
94
Report of the Directors: Operating and Financial Review(continued)
periods stated above. Collections procedures may continue after write-off.
We assess the vulnerability of countries to foreign currency payment restrictions, including economic and political factors, when considering impairment allowances on cross-border exposures. Impairment allowances are assessed in respect of all qualifying exposures within vulnerable countries unless these exposures and the inherent risks are:
| • | | performing, trade-related and of less than one year’s maturity; |
| |
| • | | mitigated by acceptable security cover which is, other than in exceptional cases, held outside the country concerned; |
| |
| • | | in the form of securities held for trading purposes for which a liquid and active market exists, and which are measured at fair value daily; and |
| |
| • | | performing facilities with a principal (excluding security) of US$1m or below and/or with maturity dates shorter than three months. |
Maximum exposure to credit risk
(Audited)
Our credit exposure is spread across a broad range of asset classes, including derivatives, trading assets, loans and advances to customers, loans and advances to banks and financial investments. In 2010, exposure to credit risk remained diversified across classes. However, the balance changed compared with the end of 2009, reflecting growth in loans and advances to both customers and banks, and a reduction in trading assets due to the deconsolidation of the Constant Net Asset Value funds.
Residential mortgage lending continued to represent a significant portion of our overall credit exposure. In 2010, the credit quality of our mortgage portfolios generally improved, reflecting economic conditions and a stabilisation of unemployment and house prices in most of our key markets. Despite
some improvement, economic and housing market conditions remain difficult across the US and we remain focused on running off the residual balances in our Consumer Lending and Mortgage Services portfolio. In the UK, we grew our residential mortgage lending exposure as a result of successful promotional campaigns and competitive pricing. The consistent application of conservative underwriting criteria ensured the credit quality of our residential mortgage exposure in the UK remained satisfactory and well secured. Our exposure to the Hong Kong residential mortgage market also grew during 2010; we continued to lend conservatively with an average loan-to-value ratio of 55% on new mortgage sales. For further commentary on personal lending, see ‘Areas of special interest — Personal Lending’ on page 106.
Loss experience: percentage of total loan impairment charges and other credit risk provisions
(Unaudited)
| | | |
| 2010 | | 2009 |
| US$14,039m | | US$26,488m |
| | | |
 | |  |
The following table presents the maximum exposure to credit risk from balance sheet and off-balance sheet financial instruments, before taking account of any collateral held or other credit enhancements (unless such credit enhancements meet accounting offsetting requirements). For financial assets recognised on the balance sheet, the maximum exposure to credit risk equals their carrying amount; for financial guarantees and similar contracts granted, it is the maximum amount that we would have to pay if the guarantees were called upon. For loan commitments and other credit-related commitments that are irrevocable over the life of the respective facilities, it is generally the full amount of the committed facilities.
Report of the Directors: Operating and Financial Review(continued)
Maximum exposure to credit risk
(Audited)
| | | | | | | | | | | | | | | | | | | | | | | | | |
| | | At 31 December 2010 | | | At 31 December 2009 | |
| | | | | | | | | Exposure | | | | | | | | | | | Exposure | |
| | | Maximum | | | | | | to credit | | | Maximum | | | | | | | to credit | |
| | | exposure | | | Offset | | | risk (net) | | | exposure | | | Offset | | | risk (net) | |
| | | US$m | | | US$m | | | US$m | | | US$m | | | US$m | | | US$m | |
| | | | | | | | | | | | | | | | | | | | | | | | | |
| Cash and balances at central banks | | | 57,383 | | | | – | | | | 57,383 | | | | 60,655 | | | | – | | | | 60,655 | |
| Items in the course of collection from other banks | | | 6,072 | | | | – | | | | 6,072 | | | | 6,395 | | | | – | | | | 6,395 | |
| Hong Kong Government certificates of indebtedness | | | 19,057 | | | | – | | | | 19,057 | | | | 17,463 | | | | – | | | | 17,463 | |
| | | | | | | | | | | | | | | | | | | | | | | | | |
| Trading assets | | | 343,966 | | | | (4,189 | ) | | | 339,777 | | | | 386,070 | | | | (8,496 | ) | | | 377,574 | |
| | | | | | | | | | | | | |
| Treasury and other eligible bills | | | 25,620 | | | | – | | | | 25,620 | | | | 22,346 | | | | – | | | | 22,346 | |
| Debt securities | | | 168,268 | | | | – | | | | 168,268 | | | | 201,598 | | | | – | | | | 201,598 | |
| Loans and advances to banks | | | 70,456 | | | | – | | | | 70,456 | | | | 78,126 | | | | – | | | | 78,126 | |
| Loans and advances to customers | | | 79,622 | | | | (4,189 | ) | | | 75,433 | | | | 84,000 | | | | (8,496 | ) | | | 75,504 | |
| | | | | | | | | | | | | |
| | | | | | | | | | | | | | | | | | | | | | | | | |
| Financial assets designated at fair value | | | 19,593 | | | | – | | | | 19,593 | | | | 22,198 | | | | – | | | | 22,198 | |
| | | | | | | | | | | | | |
| Treasury and other eligible bills | | | 159 | | | | – | | | | 159 | | | | 223 | | | | – | | | | 223 | |
| Debt securities | | | 18,248 | | | | – | | | | 18,248 | | | | 20,718 | | | | – | | | | 20,718 | |
| Loans and advances to banks | | | 315 | | | | – | | | | 315 | | | | 354 | | | | – | | | | 354 | |
| Loans and advances to customers | | | 871 | | | | – | | | | 871 | | | | 903 | | | | – | | | | 903 | |
| | | | | | | | | | | | | |
| | | | | | | | | | | | | | | | | | | | | | | | | |
| Derivatives | | | 260,757 | | | | (197,501 | ) | | | 63,256 | | | | 250,886 | | | | (189,606 | ) | | | 61,280 | |
| | | | | | | | | | | | | | | | | | | | | | | | | |
| Loans and advances held at amortised cost | | | 1,166,637 | | | | (91,966 | ) | | | 1,074,671 | | | | 1,076,012 | | | | (91,127 | ) | | | 984,885 | |
| | | | | | | | | | | | | |
| – to banks | | | 208,271 | | | | (3,099 | ) | | | 205,172 | | | | 179,781 | | | | (116 | ) | | | 179,665 | |
| – to customers | | | 958,366 | | | | (88,867 | ) | | | 869,499 | | | | 896,231 | | | | (91,011 | ) | | | 805,220 | |
| | | | | | | | | | | | | |
| | | | | | | | | | | | | | | | | | | | | | | | | |
| Financial investments | | | 392,772 | | | | – | | | | 392,772 | | | | 360,034 | | | | – | | | | 360,034 | |
| | | | | | | | | | | | | |
| Treasury and other similar bills | | | 57,129 | | | | – | | | | 57,129 | | | | 58,434 | | | | – | | | | 58,434 | |
| Debt securities | | | 335,643 | | | | – | | | | 335,643 | | | | 301,600 | | | | – | | | | 301,600 | |
| | | | | | | | | | | | | |
| | | | | | | | | | | | | | | | | | | | | | | | | |
| Other assets | | | 30,371 | | | | (29 | ) | | | 30,342 | | | | 36,373 | | | | (4 | ) | | | 36,369 | |
| | | | | | | | | | | | | |
| Endorsements and acceptances | | | 10,116 | | | | (29 | ) | | | 10,087 | | | | 9,311 | | | | (4 | ) | | | 9,307 | |
| Other | | | 20,255 | | | | – | | | | 20,255 | | | | 27,062 | | | | – | | | | 27,062 | |
| | | | | | | | | | | | | |
| | | | | | | | | | | | | | | | | | | | | | | | | |
| Financial guarantees and similar contracts | | | 49,436 | | | | – | | | | 49,436 | | | | 53,251 | | | | – | | | | 53,251 | |
Loan and other credit-related commitments1 | | | 602,513 | | | | – | | | | 602,513 | | | | 558,050 | | | | – | | | | 558,050 | |
| | | | | | | | | | | | | |
| | | | | | | | | | | | | | | | | | | | | | | | | |
| | | | 2,948,557 | | | | (293,685 | ) | | | 2,654,872 | | | | 2,827,387 | | | | (289,233 | ) | | | 2,538,154 | |
| | | | | | | | | | | | | |
For footnote, see page 174.
Collateral and other credit enhancements
(Audited)
Collateral held against financial instruments presented in the above table is described in more detail below.
Loans and advances
Although collateral can be an important mitigant of credit risk, it is our policy to lend on the basis of the customer’s capacity to repay rather than to rely on the value of security offered. Depending on the customer’s standing and the type of product, facilities may be provided unsecured.
We employ the following principal collateral types:
| • | | in the personal sector, mortgages over residential properties; |
| |
| • | | in the commercial and industrial sector, charges over business assets such as premises, stock and debtors; |
| • | | in the commercial real estate sector, charges over the properties being financed; and |
| |
| • | | in the financial sector, charges over financial instruments such as cash, debt securities and equities in support of trading facilities. |
In addition, credit derivatives and securitisation structures are used to hedge or transfer credit risk within our loan portfolio.
The loans and advances offset adjustment in the table above primarily relates to customer loans and deposits, and balances arising from repo and reverse repo transactions. The offset relates to balances where there is a legally enforceable right of offset in the event of counterparty default, and where, as a result, there is a net exposure for credit risk management purposes. However, as there is no intention to settle these balances on a net basis under normal circumstances, they do not qualify for net presentation for accounting purposes.
96
Report of the Directors: Operating and Financial Review(continued)
We do not disclose the fair value of collateral held as security or other credit enhancements on loans and advances past due but not impaired, or on individually assessed impaired loans and advances, as it is not practicable to do so.
Derivatives
The International Swaps and Derivatives Association (‘ISDA’) Master Agreement is our preferred agreement for documenting derivatives activity. It provides the contractual framework within which dealing activity across a full range of OTC products is conducted, and contractually binds both parties to apply close-out netting across all outstanding transactions covered by an agreement if either party defaults or another pre-agreed termination event occurs. It is common, and our preferred practice, for the parties to execute a Credit Support Annex (‘CSA’) in conjunction with the ISDA Master Agreement. Under a CSA, collateral is passed between the parties to mitigate the counterparty risk inherent in outstanding positions. The majority of our CSAs are with financial institutional clients.
The derivative offset amount in the above table relates to exposures where the counterparty has an offsetting derivative exposure with HSBC, a master netting arrangement is in place and the credit risk exposure is managed on a net basis, or the position is specifically collateralised, normally in the form of cash. At 31 December 2010, the total amount of such offsets was US$197.5bn (2009: US$189.6bn), of which US$178.3bn (2009: US$168.5bn) were offsets under a master netting arrangement, US$19.0bn (2009: US$21.0bn) were collateral received in cash and US$0.2bn (2009: US$0.1bn) were other collateral. These amounts do not qualify for net presentation for accounting purposes, as settlement may not actually be made on a net basis.
Treasury, other eligible bills and debt securities
Debt securities, treasury and other eligible bills are generally unsecured except for asset-backed securities (‘ABS’) and similar instruments, which are secured by pools of financial assets.
Items in the course of collection from other banks
Settlement risk arises in any situation where a payment in cash, securities or equities is made in the expectation of a corresponding receipt of cash, securities or equities. Daily settlement limits are established for counterparties to cover the aggregate of our transactions with each one on any single day.
We substantially mitigate settlement risk on many transactions, particularly those involving
securities and equities, by settling through assured payment systems or on a delivery-versus-payment basis.
Concentration of exposure
(Audited)
Concentrations of credit risk arise when a number of counterparties or exposures have comparable economic characteristics, or such counterparties are engaged in similar activities or operate in the same geographical areas or industry sectors, so that their collective ability to meet contractual obligations is uniformly affected by changes in economic, political or other conditions. We use a number of controls and measures to minimise undue concentration of exposure in our portfolios across industry, country and customer groups. These include portfolio and counterparty limits, approval and review controls, and stress testing.
Wrong-way risk is an aggravated form of concentration risk and arises when there is a strong correlation between the counterparty’s probability of default and the mark-to-market value of the underlying transaction. We use a range of procedures to monitor and control wrong-way risk, including requiring entities to obtain prior approval before undertaking wrong-way risk transactions outside pre-agreed guidelines.
Securities held for trading
(Unaudited)
A detailed analysis of securities held for trading is set out in Note 15 on the Financial Statements and an analysis of credit quality is provided on page 114.
Debt securities, treasury and other eligible bills
(Unaudited)
HSBC’s holdings of corporate debt, ABS and other securities were spread across a wide range of issuers and geographical regions, with 25% invested in securities issued by banks and other financial institutions. A more detailed analysis of financial investments is set out in Note 21 on the Financial Statements and an analysis by credit quality is provided on page 114.
At 31 December 2010, our insurance businesses held diversified portfolios of debt and equity securities designated at fair value (2010: US$28bn; 2009: US$25bn) and debt securities classified as financial investments (2010: US$38bn; 2009: US$35bn). A more detailed analysis of securities held by the insurance businesses is set out on page 162.
97
Report of the Directors: Operating and Financial Review(continued)
Derivatives
(Unaudited)
Derivative assets at 31 December 2010 were US$261bn, a rise of 4% from 31 December 2009. Our single largest exposure was to interest rate derivatives, and this balance increased in 2010 reflecting downward shifts in yield curves, partly offset by higher netting from increased trading with clearing houses. The notional value of outstanding contracts also rose, reflecting an increase in the number of open transactions compared with 2009. In addition our exposure to exchange rate derivatives rose as a result of increased volatility.
Loans and advances
(Unaudited)
On a reported basis, gross loans and advances to customers (excluding the financial sector) at 31 December 2010 increased by US$52bn or 6% from 31 December 2009. On a constant currency basis the increase was 7%. The rise was primarily due to growth in Asia, mainly in trade-related lending and, to a lesser extent, our commercial real estate and personal lending portfolios, as the region prospered.
Summary of gross loans and advances to customers
(Unaudited)
The following commentary is on a constant currency basis:
Personal lending was US$425bn, a decline of 2% compared with the end of 2009 as growth in residential mortgage lending was more than offset by lower other personal lending balances. Personal lending represented 43% of our total lending to customers. At US$269bn, residential mortgage lending constituted the Group’s largest concentration in a single exposure type. In 2010, residential mortgage lending increased by 4%, reflecting strong growth in new mortgage sales in Hong Kong and the UK. This was partly offset by a 12% decline in the US, mainly due to the continued run-off of our Consumer Lending and Mortgage Services portfolios.
Corporate and commercial lending was 46% of gross lending to customers at 31 December 2010, comprising our largest lending category. Commercial, industrial and international trade represented the largest portion of this category and this increased by 23% in the year, reflecting the growth in trade activity, particularly in Asia. Commercial real estate lending, which represented 7% of total gross lending to customers, increased by 5% due to strong growth in Hong Kong.
In the financial category, our largest exposure was to non-bank financial institutions; this largely comprised secured lending on trading accounts, mainly repo facilities.
Loans and advances to banks were widely distributed across major institutions in 2010 and increased by 16% as placements with central and commercial banks in Europe, Asia and Latin America rose.
The following tables analyse loans by industry sector and by the location of the principal operations of the lending subsidiary or, in the case of the operations of The Hongkong and Shanghai Banking Corporation, HSBC Bank, HSBC Bank Middle East and HSBC Bank USA, by the location of the lending branch.
98
Report of the Directors: Operating and Financial Review(continued)
Gross loans and advances by industry sector
(Audited)
| | | | | | | | | | | | | | | | | | | | | | | | | | | | | |
| | | | | | | Currency | | | Move- | | | | | | | | | | | | | |
| | | 2010 | | | effect | | | ment | | | 2009 | | | 2008 | | | 2007 | | | 2006 | |
| | | US$m | | | US$m | | | US$m | | | US$m | | | US$m | | | US$m | | | US$m | |
| | | | | | | | | | | | | | | | | | | | | | | | | | | | | |
Personal2 | | | 425,320 | | | | (2,026 | ) | | | (6,860 | ) | | | 434,206 | | | | 440,227 | | | | 500,834 | | | | 476,146 | |
| | | | | | | | | | | | | | | |
Residential mortgages2,3 | | | 268,681 | | | | (1,707 | ) | | | 9,719 | | | | 260,669 | | | | 243,337 | | | | 269,068 | | | | 265,337 | |
Other personal2,4 | | | 156,639 | | | | (319 | ) | | | (16,579 | ) | | | 173,537 | | | | 196,890 | | | | 231,766 | | | | 210,809 | |
| | | | | | | | | | | | | | | |
| | | | | | | | | | | | | | | | | | | | | | | | | | | | | |
| Corporate and commercial | | | 445,512 | | | | (5,297 | ) | | | 67,719 | | | | 383,090 | | | | 407,474 | | | | 400,771 | | | | 343,107 | |
| | | | | | | | | | | | | | | |
| Commercial, industrial and international trade | | | 237,694 | | | | (2,948 | ) | | | 44,514 | | | | 196,128 | | | | 209,840 | | | | 202,038 | | | | 162,109 | |
| Commercial real estate | | | 71,880 | | | | (773 | ) | | | 3,264 | | | | 69,389 | | | | 70,969 | | | | 72,345 | | | | 60,366 | |
| Other property-related | | | 34,838 | | | | 222 | | | | 4,096 | | | | 30,520 | | | | 30,739 | | | | 33,907 | | | | 27,165 | |
| Government | | | 8,594 | | | | (14 | ) | | | 1,919 | | | | 6,689 | | | | 6,544 | | | | 5,708 | | | | 8,990 | |
Other commercial5 | | | 92,506 | | | | (1,784 | ) | | | 13,926 | | | | 80,364 | | | | 89,382 | | | | 86,773 | | | | 84,477 | |
| | | | | | | | | | | | | | | |
| | | | | | | | | | | | | | | | | | | | | | | | | | | | | |
| Financial | | | 101,725 | | | | (3,540 | ) | | | 8,615 | | | | 96,650 | | | | 101,085 | | | | 99,148 | | | | 62,458 | |
| | | | | | | | | | | | | | | |
| Non-bank financial institutions | | | 100,163 | | | | (3,544 | ) | | | 8,470 | | | | 95,237 | | | | 99,536 | | | | 96,781 | | | | 59,204 | |
| Settlement accounts | | | 1,562 | | | | 4 | | | | 145 | | | | 1,413 | | | | 1,549 | | | | 2,367 | | | | 3,254 | |
| | | | | | | | | | | | | | | |
| | | | | | | | | | | | | | | | | | | | | | | | | | | | | |
| Asset-backed securities reclassified | | | 5,892 | | | | (319 | ) | | | (1,616 | ) | | | 7,827 | | | | 7,991 | | | | – | | | | – | |
| | | | | | | | | | | | | | | |
| | | | | | | | | | | | | | | | | | | | | | | | | | | | | |
Total gross loans and advances to customers (‘TGLAC’)6 | | | 978,449 | | | | (11,182 | ) | | | 67,858 | | | | 921,773 | | | | 956,777 | | | | 1,000,753 | | | | 881,711 | |
| | | | | | | | | | | | | | | | | | | | | | | | | | | | | |
| Gross loans and advances to banks | | | 208,429 | | | | (8 | ) | | | 28,549 | | | | 179,888 | | | | 153,829 | | | | 237,373 | | | | 185,212 | |
| | | | | | | | | | | | | | | |
| | | | | | | | | | | | | | | | | | | | | | | | | | | | | |
| Total gross loans and advances | | | 1,186,878 | | | | (11,190 | ) | | | 96,407 | | | | 1,101,661 | | | | 1,110,606 | | | | 1,238,126 | | | | 1,066,923 | |
| | | | | | | | | | | | | | | |
| | | | | | | | | | | | | | | | | | | | | | | | | | | | | |
| Impaired loans and advances to customers | | | 28,091 | | | | (254 | ) | | | (2,261 | ) | | | 30,606 | | | | 25,352 | | | | 19,582 | | | | 15,071 | |
| – as a percentage of TGLAC | | | 2.9 | % | | | | | | | | | | | 3.3% | | | | 2.6% | | | | 2.0% | | | | 1.7% | |
| | | | | | | | | | | | | | | | | | | | | | | | | | | | | |
| Impairment allowances on loans and advances to customers | | | 20,083 | | | | (75 | ) | | | (5,384 | ) | | | 25,542 | | | | 23,909 | | | | 19,205 | | | | 13,578 | |
| – as a percentage of TGLAC | | | 2.1 | % | | | | | | | | | | | 2.8% | | | | 2.5% | | | | 1.9% | | | | 1.5% | |
| | | | | | | | | | | | | | | | | | | | | | | | | | | | | |
| Charge for impairment losses | | | 13,548 | | | | 321 | | | | (11,715 | ) | | | 24,942 | | | | 24,131 | | | | 17,177 | | | | 10,547 | |
| | | | | | | | | | | | | | | |
| New allowances net of allowance releases | | | 14,568 | | | | 353 | | | | (11,617 | ) | | | 25,832 | | | | 24,965 | | | | 18,182 | | | | 11,326 | |
| Recoveries | | | (1,020 | ) | | | (32 | ) | | | (98 | ) | | | (890 | ) | | | (834 | ) | | | (1,005 | ) | | | (779 | ) |
| | | | | | | | | | | | | | | |
For footnotes, see page 174.
99
Report of the Directors: Operating and Financial Review(continued)
Gross loans and advances to customers by industry sector and by geographical region
(Audited)
| | | | | | | | | | | | | | | | | | | | | | | | | | | | | | | | | |
| | | Gross loans and advances to customers | |
| | | | | | | | | | | Rest of | | | | | | | | | | | | | | | | | | | As a % | |
| | | | | | | Hong | | | Asia- | | | Middle | | | North | | | Latin | | | | | | | of total | |
| | | Europe | | | Kong | | | Pacific | | | East | | | America | | | America | | | Total | | | gross loans | |
| | | US$m | | | US$m | | | US$m | | | US$m | | | US$m | | | US$m | | | US$m | | | % | |
At 31 December 2010 | | | | | | | | | | | | | | | | | | | | | | | | | | | | | | | | |
| Personal | | | 161,717 | | | | 57,308 | | | | 40,184 | | | | 5,371 | | | | 139,117 | | | | 21,623 | | | | 425,320 | | | | 43.4 | |
| | | | | | | | | | | | | | | | | |
Residential mortgages3 | | | 111,618 | | | | 42,488 | | | | 28,724 | | | | 1,751 | | | | 78,842 | | | | 5,258 | | | | 268,681 | | | | 27.4 | |
Other personal4 | | | 50,099 | | | | 14,820 | | | | 11,460 | | | | 3,620 | | | | 60,275 | | | | 16,365 | | | | 156,639 | | | | 16.0 | |
| | | | | | | | | | | | | | | | | |
| | | | | | | | | | | | | | | | | | | | | | | | | | | | | | | | | |
| Corporate and commercial | | | 203,804 | | | | 80,823 | | | | 67,247 | | | | 19,560 | | | | 38,707 | | | | 35,371 | | | | 445,512 | | | | 45.6 | |
| | | | | | | | | | | | | | | | | |
| Commercial, industrial and international trade | | | 111,980 | | | | 33,451 | | | | 41,274 | | | | 11,173 | | | | 16,737 | | | | 23,079 | | | | 237,694 | | | | 24.3 | |
| Commercial real estate | | | 30,629 | | | | 19,678 | | | | 8,732 | | | | 1,085 | | | | 8,768 | | | | 2,988 | | | | 71,880 | | | | 7.3 | |
| Other property-related | | | 6,401 | | | | 15,232 | | | | 5,426 | | | | 1,785 | | | | 5,109 | | | | 885 | | | | 34,838 | | | | 3.6 | |
| Government | | | 2,289 | | | | 2,339 | | | | 415 | | | | 1,345 | | | | 89 | | | | 2,117 | | | | 8,594 | | | | 0.9 | |
Other commercial5 | | | 52,505 | | | | 10,123 | | | | 11,400 | | | | 4,172 | | | | 8,004 | | | | 6,302 | | | | 92,506 | | | | 9.5 | |
| | | | | | | | | | | | | | | | | |
| | | | | | | | | | | | | | | | | | | | | | | | | | | | | | | | | |
| Financial | | | 70,725 | | | | 3,189 | | | | 2,259 | | | | 1,347 | | | | 21,202 | | | | 3,003 | | | | 101,725 | | | | 10.4 | |
| | | | | | | | | | | | | | | | | |
| Non-bank financial institutions | | | 70,019 | | | | 2,824 | | | | 2,058 | | | | 1,335 | | | | 21,109 | | | | 2,818 | | | | 100,163 | | | | 10.2 | |
| Settlement accounts | | | 706 | | | | 365 | | | | 201 | | | | 12 | | | | 93 | | | | 185 | | | | 1,562 | | | | 0.2 | |
| | | | | | | | | | | | | | | | | |
| | | | | | | | | | | | | | | | | | | | | | | | | | | | | | | | | |
| Asset-backed securities reclassified | | | 5,216 | | | | – | | | | – | | | | – | | | | 676 | | | | – | | | | 5,892 | | | | 0.6 | |
| | | | | | | | | | | | | | | | | |
| | | | | | | | | | | | | | | | | | | | | | | | | | | | | | | | | |
TGLAC6 | | | 441,462 | | | | 141,320 | | | | 109,690 | | | | 26,278 | | | | 199,702 | | | | 59,997 | | | | 978,449 | | | | 100.0 | |
| | | | | | | | | | | | | | | | | |
| | | | | | | | | | | | | | | | | | | | | | | | | | | | | | | | | |
| Percentage of TGLAC by geographical region | | | 45.2% | | | | 14.4% | | | | 11.2% | | | | 2.7% | | | | 20.4% | | | | 6.1% | | | | 100.0% | | | | | |
| | | | | | | | | | | | | | | | | | | | | | | | | | | | | | | | | |
| Impaired loans | | | 10,557 | | | | 660 | | | | 1,324 | | | | 2,433 | | | | 10,727 | | | | 2,390 | | | | 28,091 | | | | | |
| – as a percentage of TGLAC | | | 2.4% | | | | 0.5% | | | | 1.2% | | | | 9.3% | | | | 5.4% | | | | 4.0% | | | | 2.9% | | | | | |
| | | | | | | | | | | | | | | | | | | | | | | | | | | | | | | | | |
| Total impairment allowances | | | 5,663 | | | | 629 | | | | 959 | | | | 1,652 | | | | 9,170 | | | | 2,010 | | | | 20,083 | | | | | |
| – as a percentage of TGLAC | | | 1.3% | | | | 0.4% | | | | 0.9% | | | | 6.3% | | | | 4.6% | | | | 3.4% | | | | 2.1% | | | | | |
| | | | | | | | | | | | | | | | | | | | | | | | | | | | | | | | | |
| At 31 December 2009 | | | | | | | | | | | | | | | | | | | | | | | | | | | | | | | | |
| Personal | | | 162,562 | | | | 47,946 | | | | 32,514 | | | | 6,405 | | | | 163,934 | | | | 20,845 | | | | 434,206 | | | | 47.2 | |
| | | | | | | | | | | | | | | | | |
Residential mortgages3 | | | 109,872 | | | | 35,292 | | | | 21,983 | | | | 1,898 | | | | 86,591 | | | | 5,033 | | | | 260,669 | | | | 28.3 | |
Other personal4 | | | 52,690 | | | | 12,654 | | | | 10,531 | | | | 4,507 | | | | 77,343 | | | | 15,812 | | | | 173,537 | | | | 18.9 | |
| | | | | | | | | | | | | | | | | |
| | | | | | | | | | | | | | | | | | | | | | | | | | | | | | | | | |
Corporate and commercial7 | | | 202,919 | | | | 49,340 | | | | 46,175 | | | | 16,604 | | | | 40,902 | | | | 27,150 | | | | 383,090 | | | | 41.5 | |
| | | | | | | | | | | | | | | | | |
| Commercial, industrial and international trade | | | 112,374 | | | | 17,728 | | | | 28,228 | | | | 9,336 | | | | 11,528 | | | | 16,934 | | | | 196,128 | | | | 21.3 | |
| Commercial real estate | | | 33,853 | | | | 13,782 | | | | 6,475 | | | | 1,309 | | | | 11,527 | | | | 2,443 | | | | 69,389 | | | | 7.5 | |
| Other property-related | | | 6,231 | | | | 10,062 | | | | 3,863 | | | | 1,357 | | | | 8,452 | | | | 555 | | | | 30,520 | | | | 3.3 | |
| Government | | | 2,216 | | | | 441 | | | | 595 | | | | 1,356 | | | | 208 | | | | 1,873 | | | | 6,689 | | | | 0.7 | |
Other commercial5 | | | 48,245 | | | | 7,327 | | | | 7,014 | | | | 3,246 | | | | 9,187 | | | | 5,345 | | | | 80,364 | | | | 8.7 | |
| | | | | | | | | | | | | | | | | |
| | | | | | | | | | | | | | | | | | | | | | | | | | | | | | | | | |
| Financial | | | 73,851 | | | | 2,899 | | | | 2,350 | | | | 1,213 | | | | 14,150 | | | | 2,187 | | | | 96,650 | | | | 10.5 | |
| | | | | | | | | | | | | | | | | |
| Non-bank financial institutions | | | 73,225 | | | | 2,462 | | | | 2,246 | | | | 1,206 | | | | 13,963 | | | | 2,135 | | | | 95,237 | | | | 10.3 | |
| Settlement accounts | | | 626 | | | | 437 | | | | 104 | | | | 7 | | | | 187 | | | | 52 | | | | 1,413 | | | | 0.2 | |
| | | | | | | | | | | | | | | | | |
| | | | | | | | | | | | | | | | | | | | | | | | | | | | | | | | | |
| Asset-backed securities reclassified | | | 6,284 | | | | – | | | | – | | | | – | | | | 1,543 | | | | – | | | | 7,827 | | | | 0.8 | |
| | | | | | | | | | | | | | | | | |
| | | | | | | | | | | | | | | | | | | | | | | | | | | | | | | | | |
TGLAC6 | | | 445,616 | | | | 100,185 | | | | 81,039 | | | | 24,222 | | | | 220,529 | | | | 50,182 | | | | 921,773 | | | | 100.0 | |
| | | | | | | | | | | | | | | | | |
| | | | | | | | | | | | | | | | | | | | | | | | | | | | | | | | | |
| Percentage of TGLAC by geographical region | | | 48.3% | | | | 10.9% | | | | 8.8% | | | | 2.6% | | | | 23.9% | | | | 5.5% | | | | 100.0% | | | | | |
| | | | | | | | | | | | | | | | | | | | | | | | | | | | | | | | | |
| Impaired loans | | | 10,722 | | | | 841 | | | | 1,200 | | | | 1,646 | | | | 13,246 | | | | 2,951 | | | | 30,606 | | | | | |
| – as a percentage of TGLAC | | | 2.4% | | | | 0.8% | | | | 1.5% | | | | 6.8% | | | | 6.0% | | | | 5.9% | | | | 3.3% | | | | | |
| | | | | | | | | | | | | | | | | | | | | | | | | | | | | | | | | |
| Total impairment allowances | | | 6,135 | | | | 804 | | | | 996 | | | | 1,378 | | | | 13,676 | | | | 2,553 | | | | 25,542 | | | | | |
| – as a percentage of TGLAC | | | 1.4% | | | | 0.8% | | | | 1.2% | | | | 5.7% | | | | 6.2% | | | | 5.1% | | | | 2.8% | | | | | |
For footnotes, see page 174.
100
Report of the Directors: Operating and Financial Review(continued)
Loans and advances to banks by geographical region
(Audited)
| | | | | | | | | | | | | | | | | | | | | | | | | | | | | | | | | |
| | | | | | | | | | | Rest of | | | | | | | | | | | | | | | Loans and | | | Impair- | |
| | | | | | | Hong | | | Asia- | | | Middle | | | North | | | Latin | | | advances | | | ment | |
| | | Europe | | | Kong | | | Pacific | | | East | | | America | | | America | | | to banks | | | allowances | |
| | | US$m | | | US$m | | | US$m | | | US$m | | | US$m | | | US$m | | | US$m | | | US$m | |
| | | | | | | | | | | | | | | | | | | | | | | | | | | | | | | | | |
At 31 December 20108 | | | 78,239 | | | | 33,585 | | | | 40,437 | | | | 9,335 | | | | 19,479 | | | | 27,354 | | | �� | 208,429 | | | | (158 | ) |
| At 31 December 2009 | | | 65,614 | | | | 36,197 | | | | 35,648 | | | | 8,435 | | | | 15,386 | | | | 18,608 | | | | 179,888 | | | | (107 | ) |
| At 31 December 2008 | | | 62,012 | | | | 29,646 | | | | 28,665 | | | | 7,476 | | | | 11,458 | | | | 14,572 | | | | 153,829 | | | | (63 | ) |
| At 31 December 2007 | | | 104,534 | | | | 63,737 | | | | 32,373 | | | | 7,488 | | | | 16,566 | | | | 12,675 | | | | 237,373 | | | | (7 | ) |
| At 31 December 2006 | | | 76,837 | | | | 50,359 | | | | 19,716 | | | | 7,801 | | | | 17,865 | | | | 12,634 | | | | 185,212 | | | | (7 | ) |
Gross loans and advances to customers by country
(Audited)
| | | | | | | | | | | | | | | | | | | | | |
| | | | | | | | | | | | | | | Commercial, | | | | |
| | | Residential | | | Other | | | Property- | | | international | | | | |
| | | mortgages | | | personal | | | related | | | trade and other | | | Total | |
| | | US$m | | | US$m | | | US$m | | | US$m | | | US$m | |
At 31 December 2010 | | | | | | | | | | | | | | | | | | | | |
Europe | | | 111,618 | | | | 50,099 | | | | 37,030 | | | | 242,715 | | | | 441,462 | |
| | | | | | | | | | | |
| UK | | | 103,037 | | | | 25,636 | | | | 26,002 | | | | 165,283 | | | | 319,958 | |
| France | | | 3,749 | | | | 9,550 | | | | 8,737 | | | | 56,613 | | | | 78,649 | |
| Germany | | | 11 | | | | 356 | | | | 79 | | | | 4,015 | | | | 4,461 | |
| Malta | | | 1,656 | | | | 599 | | | | 563 | | | | 1,643 | | | | 4,461 | |
| Switzerland | | | 1,358 | | | | 10,708 | | | | 114 | | | | 1,837 | | | | 14,017 | |
| Turkey | | | 809 | | | | 2,817 | | | | 210 | | | | 2,783 | | | | 6,619 | |
| Other | | | 998 | | | | 433 | | | | 1,325 | | | | 10,541 | | | | 13,297 | |
| | | | | | | | | | | |
| | | | | | | | | | | | | | | | | | | | | |
Hong Kong | | | 42,488 | | | | 14,820 | | | | 34,910 | | | | 49,102 | | | | 141,320 | |
| | | | | | | | | | | | | | | | | | | | | |
Rest of Asia-Pacific | | | 28,724 | | | | 11,460 | | | | 14,158 | | | | 55,348 | | | | 109,690 | |
| | | | | | | | | | | |
| Australia | | | 8,405 | | | | 1,267 | | | | 2,346 | | | | 4,867 | | | | 16,885 | |
| India | | | 920 | | | | 526 | | | | 680 | | | | 4,583 | | | | 6,709 | |
| Indonesia | | | 74 | | | | 531 | | | | 115 | | | | 3,374 | | | | 4,094 | |
| Japan | | | 226 | | | | 199 | | | | 1,214 | | | | 2,503 | | | | 4,142 | |
| Mainland China | | | 2,046 | | | | 310 | | | | 3,836 | | | | 12,932 | | | | 19,124 | |
| Malaysia | | | 3,833 | | | | 2,053 | | | | 1,361 | | | | 4,845 | | | | 12,092 | |
| Singapore | | | 6,571 | | | | 3,661 | | | | 3,262 | | | | 7,846 | | | | 21,340 | |
| South Korea | | | 2,295 | | | | 248 | | | | 58 | | | | 2,494 | | | | 5,095 | |
| Taiwan | | | 3,002 | | | | 527 | | | | 135 | | | | 2,832 | | | | 6,496 | |
| Vietnam | | | 35 | | | | 162 | | | | 59 | | | | 1,255 | | | | 1,511 | |
| Other | | | 1,317 | | | | 1,976 | | | | 1,092 | | | | 7,817 | | | | 12,202 | |
| | | | | | | | | | | |
| | | | | | | | | | | | | | | | | | | | | |
Middle East(excluding Saudi Arabia) | | | 1,751 | | | | 3,620 | | | | 2,870 | | | | 18,037 | | | | 26,278 | |
| | | | | | | | | | | |
| Egypt | | | 3 | | | | 396 | | | | 111 | | | | 2,484 | | | | 2,994 | |
| Qatar | | | 8 | | | | 491 | | | | 404 | | | | 918 | | | | 1,821 | |
| United Arab Emirates | | | 1,477 | | | | 2,099 | | | | 1,359 | | | | 11,043 | | | | 15,978 | |
| Other | | | 263 | | | | 634 | | | | 996 | | | | 3,592 | | | | 5,485 | |
| | | | | | | | | | | |
| | | | | | | | | | | | | | | | | | | | | |
North America | | | 78,842 | | | | 60,275 | | | | 13,877 | | | | 46,708 | | | | 199,702 | |
| | | | | | | | | | | |
| US | | | 57,630 | | | | 51,686 | | | | 8,269 | | | | 31,496 | | | | 149,081 | |
| Canada | | | 19,505 | | | | 8,070 | | | | 5,079 | | | | 14,711 | | | | 47,365 | |
| Bermuda | | | 1,707 | | | | 519 | | | | 529 | | | | 501 | | | | 3,256 | |
| | | | | | | | | | | |
| | | | | | | | | | | | | | | | | | | | | |
Latin America | | | 5,258 | | | | 16,365 | | | | 3,873 | | | | 34,501 | | | | 59,997 | |
| | | | | | | | | | | |
| Argentina | | | 30 | | | | 918 | | | | 103 | | | | 2,172 | | | | 3,223 | |
| Brazil | | | 1,111 | | | | 10,979 | | | | 1,816 | | | | 17,093 | | | | 30,999 | |
| Mexico | | | 2,097 | | | | 2,365 | | | | 1,146 | | | | 8,622 | | | | 14,230 | |
| Panama | | | 1,155 | | | | 982 | | | | 489 | | | | 3,794 | | | | 6,420 | |
| Other | | | 865 | | | | 1,121 | | | | 319 | | | | 2,820 | | | | 5,125 | |
| | | | | | | | | | | |
| | | | | | | | | | | | | | | | | | | | | |
| | | | | | | | | | | |
| Total | | | 268,681 | | | | 156,639 | | | | 106,718 | | | | 446,411 | | | | 978,449 | |
| | | | | | | | | | | |
101
Report of the Directors: Operating and Financial Review(continued)
| | | | | | | | | | | | | | | | | | | | | |
| | | | | | | | | | | | | | | Commercial, | | | | |
| | | Residential | | | Other | | | Property- | | | international | | | | |
| | | mortgages | | | personal | | | related | | | trade and other | | | Total | |
| | | US$m | | | US$m | | | US$m | | | US$m | | | US$m | |
| | | | | | | | | | | | | | | | | | | | | |
| At 31 December 2009 | | | | | | | | | | | | | | | | | | | | |
| Europe | | | 109,872 | | | | 52,690 | | | | 40,084 | | | | 242,970 | | | | 445,616 | |
| | | | | | | | | | | |
| UK | | | 100,667 | | | | 29,018 | | | | 28,339 | | | | 175,513 | | | | 333,537 | |
| France | | | 4,326 | | | | 10,224 | | | | 9,429 | | | | 48,570 | | | | 72,549 | |
| Germany | | | 10 | | | | 404 | | | | 90 | | | | 3,689 | | | | 4,193 | |
| Malta | | | 1,730 | | | | 612 | | | | 660 | | | | 1,689 | | | | 4,691 | |
| Switzerland | | | 1,301 | | | | 9,197 | | | | 175 | | | | 1,413 | | | | 12,086 | |
| Turkey | | | 843 | | | | 2,778 | | | | 150 | | | | 2,490 | | | | 6,261 | |
| Other | | | 995 | | | | 457 | | | | 1,241 | | | | 9,606 | | | | 12,299 | |
| | | | | | | | | | | |
| | | | | | | | | | | | | | | | | | | | | |
| Hong Kong | | | 35,292 | | | | 12,654 | | | | 23,844 | | | | 28,395 | | | | 100,185 | |
| | | | | | | | | | | | | | | | | | | | | |
| Rest of Asia-Pacific | | | 21,983 | | | | 10,531 | | | | 10,338 | | | | 38,187 | | | | 81,039 | |
| | | | | | | | | | | |
| Australia | | | 5,919 | | | | 993 | | | | 1,785 | | | | 3,496 | | | | 12,193 | |
| India | | | 883 | | | | 864 | | | | 458 | | | | 3,002 | | | | 5,207 | |
| Indonesia | | | 59 | | | | 571 | | | | 71 | | | | 2,114 | | | | 2,815 | |
| Japan | | | 109 | | | | 149 | | | | 796 | | | | 1,444 | | | | 2,498 | |
| Mainland China | | | 1,503 | | | | 319 | | | | 2,633 | | | | 8,915 | | | | 13,370 | |
| Malaysia | | | 2,925 | | | | 1,717 | | | | 1,085 | | | | 3,548 | | | | 9,275 | |
| Singapore | | | 5,149 | | | | 3,041 | | | | 2,407 | | | | 4,251 | | | | 14,848 | |
| South Korea | | | 2,093 | | | | 407 | | | | 30 | | | | 1,932 | | | | 4,462 | |
| Taiwan | | | 2,205 | | | | 503 | | | | 53 | | | | 1,578 | | | | 4,339 | |
| Vietnam | | | 23 | | | | 132 | | | | 51 | | | | 1,042 | | | | 1,248 | |
| Other | | | 1,115 | | | | 1,835 | | | | 969 | | | | 6,865 | | | | 10,784 | |
| | | | | | | | | | | |
| | | | | | | | | | | | | | | | | | | | | |
| Middle East (excluding Saudi Arabia) | | | 1,898 | | | | 4,507 | | | | 2,666 | | | | 15,151 | | | | 24,222 | |
| | | | | | | | | | | |
| Egypt | | | 4 | | | | 326 | | | | 126 | | | | 2,132 | | | | 2,588 | |
| Qatar | | | 9 | | | | 624 | | | | 416 | | | | 841 | | | | 1,890 | |
| United Arab Emirates | | | 1,650 | | | | 2,881 | | | | 1,395 | | | | 8,848 | | | | 14,774 | |
| Other | | | 235 | | | | 676 | | | | 729 | | | | 3,330 | | | | 4,970 | |
| | | | | | | | | | | |
| | | | | | | | | | | | | | | | | | | | | |
| North America | | | 86,591 | | | | 77,343 | | | | 19,979 | | | | 36,616 | | | | 220,529 | |
| | | | | | | | | | | |
| US | | | 65,784 | | | | 69,275 | | | | 8,922 | | | | 25,747 | | | | 169,728 | |
| Canada | | | 19,228 | | | | 7,526 | | | | 10,641 | | | | 10,339 | | | | 47,734 | |
| Bermuda | | | 1,579 | | | | 542 | | | | 416 | | | | 530 | | | | 3,067 | |
| | | | | | | | | | | |
| | | | | | | | | | | | | | | | | | | | | |
| Latin America | | | 5,033 | | | | 15,812 | | | | 2,998 | | | | 26,339 | | | | 50,182 | |
| | | | | | | | | | | |
| Argentina | | | 31 | | | | 628 | | | | 49 | | | | 1,689 | | | | 2,397 | |
| Brazil | | | 717 | | | | 10,494 | | | | 1,076 | | | | 12,111 | | | | 24,398 | |
| Mexico | | | 2,259 | | | | 2,702 | | | | 995 | | | | 6,762 | | | | 12,718 | |
| Panama | | | 1,151 | | | | 973 | | | | 475 | | | | 3,464 | | | | 6,063 | |
| Other | | | 875 | | | | 1,015 | | | | 403 | | | | 2,313 | | | | 4,606 | |
| | | | | | | | | | | |
| | | | | | | | | | | | | | | | | | | | | |
| | | | | | | | | | | |
| | | | | | | | | | | | | | | | | | | | | |
| Total | | | 260,669 | | | | 173,537 | | | | 99,909 | | | | 387,658 | | | | 921,773 | |
| | | | | | | | | | | |
Country distribution of outstandings and cross-border exposures
(Unaudited)
We control the risk associated with cross-border lending through a centralised structure of internal country limits. Exposures to individual countries and cross-border exposure in the aggregate are kept under continual review.
The following table summarises the aggregate of in-country foreign currency and cross-border outstandings by type of borrower to countries which individually represent in excess of 0.75% of our total
assets. The classification is based on the country of residence of the borrower but also recognises the transfer of country risk in respect of third-party guarantees, eligible collateral held and residence of the head office when the borrower is a branch. In accordance with the Bank of England Country Exposure Report (Form CE) guidelines, outstandings comprise loans and advances (excluding settlement accounts), amounts receivable under finance leases, acceptances, commercial bills, certificates of deposit (‘CD’s) and debt and equity securities (net of short positions), and exclude accrued interest and intra-HSBC exposures.
102
Report of the Directors: Operating and Financial Review(continued)
In-country foreign currency and cross-border amounts outstanding
(Unaudited)
| | | | | | | | | | | | | | | | | |
| | | | | | | Government | | | | | | | |
| | | | | | | and official | | | | | | | |
| | | Banks | | | institutions | | | Other | | | Total | |
| | | US$bn | | | US$bn | | | US$bn | | | US$bn | |
At 31 December 2010 | | | | | | | | | | | | | | | | |
| UK | | | 27.6 | | | | 6.3 | | | | 51.6 | | | | 85.5 | |
| US | | | 13.6 | | | | 37.6 | | | | 17.6 | | | | 68.8 | |
| France | | | 23.8 | | | | 11.1 | | | | 11.2 | | | | 46.1 | |
| Hong Kong | | | 15.4 | | | | 1.6 | | | | 17.2 | | | | 34.2 | |
| Mainland China | | | 21.5 | | | | 1.2 | | | | 9.1 | | | | 31.8 | |
| Japan | | | 14.0 | | | | 16.2 | | | | 1.3 | | | | 31.5 | |
| Germany | | | 17.8 | | | | 4.2 | | | | 9.4 | | | | 31.4 | |
| | | | | | | | | | | | | | | | | |
| At 31 December 2009 | | | | | | | | | | | | | | | | |
| UK | | | 37.5 | | | | 7.0 | | | | 38.0 | | | | 82.5 | |
| US | | | 10.7 | | | | 29.3 | | | | 25.7 | | | | 65.7 | |
| France | | | 27.0 | | | | 10.7 | | | | 7.7 | | | | 45.4 | |
| Germany | | | 21.9 | | | | 15.0 | | | | 4.5 | | | | 41.4 | |
The Netherlands9 | | | 10.3 | | | | 1.7 | | | | 7.6 | | | | 19.6 | |
| | | | | | | | | | | | | | | | | |
| At 31 December 2008 | | | | | | | | | | | | | | | | |
| UK | | | 38.4 | | | | 7.1 | | | | 33.8 | | | | 79.3 | |
| US | | | 13.6 | | | | 26.4 | | | | 34.1 | | | | 74.1 | |
| France | | | 19.9 | | | | 12.1 | | | | 7.9 | | | | 39.9 | |
| Germany | | | 18.9 | | | | 8.0 | | | | 6.7 | | | | 33.6 | |
| The Netherlands | | | 14.1 | | | | 1.9 | | | | 10.3 | | | | 26.3 | |
Japan9 | | | 2.6 | | | | 19.4 | | | | 2.3 | | | | 24.3 | |
For footnote, see page 174.
Areas of special interest
(Unaudited)
Wholesale lending covers the range of credit facilities granted to sovereign borrowers, banks, non-bank financial institutions and corporate entities. Our wholesale portfolios are well diversified across geographical and industry sectors, with certain exposures subject to specific portfolio controls. Overall credit quality improved during 2010, as economies generally demonstrated signs of recovery.
Exposures to countries in the eurozone
(Unaudited)
Intervention by governments to stabilise and re-capitalise banks and other financial intermediaries during the financial crisis helped to reduce the possibility of a systemic threat to financial markets by transferring risk from the private sector to sovereign bodies. In 2010, this contributed to the creation of large fiscal imbalances in some industrialised economies and as a result, market concerns about sovereign credit risk in these countries intensified. Credit spreads for the affected sovereign and bank credit markets remained volatile during most of 2010. Risk aversion resurfaced, and the assumption of higher
sovereign credit risk premia in private securities prices triggered portfolio reallocation to safer assets and a tightening of market liquidity. Initial concerns over liquidity and funding spread to doubts about solvency in a number of cases. The table below summarises our exposures to governments and central banks of selected eurozone countries, and near/quasi government agencies and banks domiciled in those countries. An analysis of loans and advances to customers by significant countries is provided on page 101.
Our exposure to eurozone countries under pressure in 2010 was US$25.4bn.
Sovereign debt
As a result of the disruption in global financial markets, the eurozone experienced a severe recession, followed by a sovereign debt crisis in some member countries, where the high level of government deficits, banking system problems, fiscal imbalances and low or declining GDP growth increased their perceived vulnerability to a future downturn. Various financial and political stresses forced Greece and Ireland to seek a bailout by the ECB and the International Monetary Fund (‘IMF’) in May and November 2010, respectively, and contagion risk to peripheral countries, notably Italy, Portugal and Spain persisted. Belgium was also
103
Report of the Directors: Operating and Financial Review(continued)
Exposures to selected eurozone countries10
(Unaudited)
| | | | | | | | | | | | | | | | | | | | | | | | | | | | | |
| | | At 31 December 2010 | |
| | | Not held for trading | | | Held for trading | | | | |
| | | Cash and | | | | | | | | | | | Net debt | | | | | | | | | | | |
| | | lending to | | | Financial | | | Total | | | securities | | | | | | | Total | | | | |
| | | banks | 11 | | investments | | | balances | | | and loans | | | Derivatives | 12 | | balances | | | Total | |
| | | US$bn | | | US$bn | | | US$bn | | | US$bn | | | US$bn | | | US$bn | | | US$bn | |
| | | | | | | | | | | | | | | | | | | | | | | | | | | | | |
Belgium | | | | | | | | | | | | | | | | | | | | | | | | | | | | |
| Sovereign and agencies | | | 0.2 | | | | 0.7 | | | | 0.9 | | | | 0.6 | | | | – | | | | 0.6 | | | | 1.5 | |
| Banks | | | 5.8 | | | | 0.3 | | | | 6.1 | | | | 1.5 | | | | 1.2 | | | | 2.7 | | | | 8.8 | |
| | | | | | | | | | | | | | | | | | | | | | |
| | | | 6.0 | | | | 1.0 | | | | 7.0 | | | | 2.1 | | | | 1.2 | | | | 3.3 | | | | 10.3 | |
| | | | | | | | | | | | | | | | | | | | | | |
| | | | | | | | | | | | | | | | | | | | | | | | | | | | | |
Greece | | | | | | | | | | | | | | | | | | | | | | | | | | | | |
| Sovereign and agencies | | | – | | | | 0.3 | | | | 0.3 | | | | 0.8 | | | | – | | | | 0.8 | | | | 1.1 | |
| Banks | | | – | | | | – | | | | – | | | | 0.6 | | | | – | | | | 0.6 | | | | 0.6 | |
| | | | | | | | | | | | | | | | | | | | | | |
| | | | | | | | | | | | | | | | | | | | | | | | | | | | | |
| | | | – | | | | 0.3 | | | | 0.3 | | | | 1.4 | | | | – | | | | 1.4 | | | | 1.7 | |
| | | | | | | | | | | | | | | | | | | | | | |
| | | | | | | | | | | | | | | | | | | | | | | | | | | | | |
Ireland | | | | | | | | | | | | | | | | | | | | | | | | | | | | |
| Sovereign and agencies | | | – | | | | 0.2 | | | | 0.2 | | | | 0.1 | | | | 0.1 | | | | 0.2 | | | | 0.4 | |
| Banks | | | 0.2 | | | | 0.5 | | | | 0.7 | | | | 1.1 | | | | 0.4 | | | | 1.5 | | | | 2.2 | |
| | | | | | | | | | | | | | | | | | | | | | |
| | | | | | | | | | | | | | | | | | | | | | | | | | | | | |
| | | | 0.2 | | | | 0.7 | | | | 0.9 | | | | 1.2 | | | | 0.5 | | | | 1.7 | | | | 2.6 | |
| | | | | | | | | | | | | | | | | | | | | | |
| | | | | | | | | | | | | | | | | | | | | | | | | | | | | |
Italy | | | | | | | | | | | | | | | | | | | | | | | | | | | | |
| Sovereign and agencies | | | – | | | | 1.7 | | | | 1.7 | | | | 1.8 | | | | – | | | | 1.8 | | | | 3.5 | |
| Banks | | | 1.9 | | | | 0.4 | | | | 2.3 | | | | 0.2 | | | | – | | | | 0.2 | | | | 2.5 | |
| | | | | | | | | | | | | | | | | | | | | | |
| | | | | | | | | | | | | | | | | | | | | | | | | | | | | |
| | | | 1.9 | | | | 2.1 | | | | 4.0 | | | | 2.0 | | | | – | | | | 2.0 | | | | 6.0 | |
| | | | | | | | | | | | | | | | | | | | | | |
Portugal | | | | | | | | | | | | | | | | | | | | | | | | | | | | |
| Sovereign and agencies | | | – | | | | 0.1 | | | | 0.1 | | | | – | | | | – | | | | – | | | | 0.1 | |
| Banks | | | 0.3 | | | | 0.1 | | | | 0.4 | | | | 0.1 | | | | – | | | | 0.1 | | | | 0.5 | |
| | | | | | | | | | | | | | | | | | | | | | |
| | | | | | | | | | | | | | | | | | | | | | | | | | | | | |
| | | | 0.3 | | | | 0.2 | | | | 0.5 | | | | 0.1 | | | | – | | | | 0.1 | | | | 0.6 | |
| | | | | | | | | | | | | | | | | | | | | | |
| | | | | | | | | | | | | | | | | | | | | | | | | | | | | |
Spain | | | | | | | | | | | | | | | | | | | | | | | | | | | | |
| Sovereign and agencies | | | 0.1 | | | | 0.9 | | | | 1.0 | | | | 0.7 | | | | 0.1 | | | | 0.8 | | | | 1.8 | |
| Banks | | | 0.8 | | | | 0.2 | | | | 1.0 | | | | 1.4 | | | | – | | | | 1.4 | | | | 2.4 | |
| | | | | | | | | | | | | | | | | | | | | | |
| | | | | | | | | | | | | | | | | | | | | | | | | | | | | |
| | | | 0.9 | | | | 1.1 | | | | 2.0 | | | | 2.1 | | | | 0.1 | | | | 2.2 | | | | 4.2 | |
| | | | | | | | | | | | | | | | | | | | | | |
| | | | | | | | | | | | | | | | | | | | | | | | | | | | | |
Total | | | | | | | | | | | | | | | | | | | | | | | | | | | | |
| Sovereign and agencies | | | 0.3 | | | | 3.9 | | | | 4.2 | | | | 4.0 | | | | 0.2 | | | | 4.2 | | | | 8.4 | |
| Banks | | | 9.0 | | | | 1.5 | | | | 10.5 | | | | 4.9 | | | | 1.6 | | | | 6.5 | | | | 17.0 | |
| | | | | | | | | | | | | | | | | | | | | | |
| | | | | | | | | | | | | | | | | | | | | | | | | | | | | |
| | | | 9.3 | | | | 5.4 | | | | 14.7 | | | | 8.9 | | | | 1.8 | | | | 10.7 | | | | 25.4 | |
| | | | | | | | | | | | | | | | | | | | | | |
For footnotes, see page 174.
under pressure, but for its specific political situation. Rating agencies downgraded the debt of a number of eurozone countries during 2010 and put some on review for possible downgrades. While the ECB continues to provide broad access to liquidity support for eurozone sovereign borrowers and banks, the availability of longer-term fiscal support from the EU for sovereigns is less certain and may lead to debt restructuring and increased private sector participation.
The eurozone as a whole retained substantial economic and financial strength despite the stresses from the financial crisis. However, concerns remained over the refinancing risks for sovereign borrowers and banks posed by the problems with market liquidity and the uncertainty surrounding support arrangements in the longer term. Eurozone policymakers have created two major facilities to counter short-term financing problems, the European Financial Stability Facility and the European
Financial Stability Mechanism. This has been viewed as a positive development by the market and rating agencies, though implementation awaits disclosure of further details by the policymakers. We expect the ECB and eurozone countries will focus in 2011 on resolving intra-eurozone imbalances, rebuilding public finances, improving fiscal discipline, strengthening the banking system and managing cross-border risk.
We have closely managed our exposure to sovereign debt during 2010. At the end of the year, our exposure to the sovereign debt of Belgium, Greece, Ireland, Italy, Portugal and Spain was US$8.4bn and the overall quality of the portfolio was strong with most in-country and cross-border limits extended to countries with high-grade internal credit risk ratings. We regularly update our assessment of higher risk countries and adjust our risk appetite to reflect such changes.
104
Report of the Directors: Operating and Financial Review(continued)
European banks
In May 2010, an FSB review indicated that European banks would have to make additional loan impairment charges of up to US$143bn in 2011. Following the publication of this report, bond spreads on both European and US banks widened. The size of the financial sector’s exposure to sovereign debt and doubts about economic conditions in parts of the eurozone raised fresh concerns about banks’ credit ratings. In addition, uncertainty over liquidity, solvency, funding, changing regulation, capital requirements and taxation, and speculation over the stability of the euro, continued to cloud the future for European banking.
The banking sector in the eurozone remains under stress, mainly as a consequence of governments having to finance large budget deficits, troubles in property markets and weak credit growth. The Ireland bailout was a direct consequence of the failure of the Irish banking sector, largely driven by the domestic property price crash. Worries about the size and quality of eurozone banks’ exposure to weaker eurozone countries are entwined with concerns about their ability to fund themselves. European banks share nearly three quarters of the public and private sector debt in Belgium, Greece, Ireland, Italy, Portugal and Spain. The regional and local banks in the eurozone are considered more vulnerable than well-diversified global banks.
During 2010, we were subject to the Committee of European Banking Supervisors (now the European Banking Authority) coordinated stress test of 91 EU financial institutions. Banks were required to meet a 6% minimum tier 1 target under stress. We passed the test satisfactorily, with a post-stress tier 1 ratio of 10.2% placing us in the top quartile of the institutions tested. Further stress testing is due to take place in 2011.
We expect that the pace of reforms outlined by various policymakers will gather speed in 2011, most notably the Basel III proposals. These regulations will require banks to hold more capital and a higher quality of capital and implement new liquidity rules, and are likely to result in a rise in the cost of funding and put pressure on credit pricing.
We continue to closely monitor and manage eurozone bank exposures, and are cautious in lending to this sector. We regularly update our assessment of higher-risk eurozone banks and adjust our risk appetite accordingly. We also, where possible, seek to play a positive role in maintaining credit and liquidity supply.
Middle East and North Africa
In 2009, Dubai World requested a standstill agreement with creditors in respect of the indebtedness of certain Dubai World group companies. The market disruption that ensued cut would-be borrowers off from the capital markets, although continued restructuring efforts throughout 2010 saw the return of significant positive sentiment from investors. As one of the long-term bankers to Dubai World and the various entities related to the Government of Dubai, the Group has worked closely during 2010 to address the prevailing issues. In October 2010, Dubai World obtained an agreement to restructure US$25bn of its debt subject to final documentation expected to be signed in the first half of 2011. The arrangement extends loan maturities for five to eight years at discounted rates, allowing Dubai World time to sell off its non-core assets while focusing on its core earnings. The Group’s exposure to Dubai is primarily spread across operating companies within the emirate.
Political developments in the region are being monitored closely and action taken to mitigate their impact. It is too early to foresee how events may unfold; hitherto, our business in the region has for the most part operated without serious disruption. In the medium term, economic growth in the region may be adversely affected, with wider implications if the prices of oil, food and commodities rise significantly.
Commercial real estate
Our exposure in the commercial real estate sectors is concentrated in the UK, North America and Hong Kong. While there were some positive signs of recovery in markets in the UK and the US, in part supported by the low levels of interest rates, the slow speed of the recovery meant that financing and re-financing activity in the sector remained subdued. In Hong Kong, the economy recovered robustly and the market was relatively buoyant in 2010, characterised by strong demand and continuing credit appetite.
On a constant currency basis, the aggregate of our commercial real estate and other property-related lending of US$107bn at 31 December 2010 was 7% higher than at 31 December 2009 and represented 11% of total loans and advances to customers. The increase in exposure was largely in Hong Kong, offset by a reduction in North America. In 2010, credit quality across this sector generally showed signs of stabilising but remained under stress in certain markets.
Across our portfolios, credit risk is mitigated by long-standing and conservative policies on asset
105
Report of the Directors: Operating and Financial Review(continued)
origination which focus on relationships with long-term customers and limited initial leverage. We also set and monitor sector risk appetite limits at Group and regional levels to detect and prevent higher risk concentrations. While individual regions differ in their approach, typically origination loan to value ratios would be less than 65% across the Group.
(Unaudited)
We provide a broad range of secured and unsecured personal lending products to meet customer needs. Given the diverse nature of the markets in which we operate, the range is not standard across all countries but is tailored to meet the demands of individual markets while using appropriate distribution channels and, wherever possible, global IT platforms.
Personal lending includes advances to customers for asset purchases, such as residential property and motor vehicles, where the loans are typically secured by the assets being acquired. We also offer loans secured on existing assets, such as first and second liens on residential property; unsecured lending products such as overdrafts, credit cards and payroll loans; and debt consolidation loans which may be secured or unsecured.
In 2010, credit quality in our personal lending portfolios improved, reflecting a recovery of economic conditions in most markets. Delinquency levels and loan impairment charges declined, particularly in those countries which had previously been most affected by rising unemployment and house price depreciation.
The commentary that follows is on an underlying basis.
At 31 December 2010, total personal lending was US$425bn, a decline of 2% from 31 December 2009 as the reduction in our US run-off portfolios continued, partly offset by notable growth in Hong Kong and the UK. Within our PFS business, total loan impairment charges and other credit risk provisions of US$11.3bn were 44% lower than in 2009, and were concentrated in North America (US$8.2bn) and, to a lesser extent, Europe (US$1.2bn) and Latin America (US$1.2bn).
In the UK, total personal lending was US$129bn, an increase of 4% compared with the end of 2009. The increase was due to growth in mortgage lending as a result of the enhancement of our product offerings, successful marketing and competitive pricing (UK mortgage lending is discussed in greater detail on page 108). This was partly offset by an 8%
fall in other personal lending balances, reflecting a reduction in unsecured lending products as we tightened our underwriting criteria and some consumers reduced their indebtedness.
Total personal lending balances in the US at 31 December 2010 were US$109bn, a decrease of 19% compared with the end of 2009, reflecting the continued reduction in balances in our consumer finance run-off portfolios and lower balances in our Card and Retail Services business.
US residential mortgage lending balances fell by 12% to US$58bn, driven by the decisions taken in 2007 to close the Mortgage Services business and in March 2009 to close all Consumer Lending branches and run off the residual consumer finance balances. US mortgage lending is discussed in greater detail on page 108.
In PFS, total loan impairment charges and other credit risk provisions were 44% down on 2009.
Other personal lending balances in the US were US$52bn at 31 December 2010, 25% lower than at the end of 2009. Credit card balances declined by 14% reflecting a reduction in active customer accounts and an increased focus by our customers on reducing outstanding credit card debt.
In March we sold US$1.0bn of vehicle finance loans. This was followed in August by the sale of the residual vehicle finance loans (US$4.3bn) to the same purchaser.
In Hong Kong, total personal lending grew by 20% to US$57bn as a result of strong growth in residential mortgage lending. In the Rest of Asia-Pacific region, personal lending also grew strongly across many countries, notably Australia, Singapore and Malaysia, through successful marketing. This growth was partly offset by a managed reduction in unsecured personal lending balances in India.
In Latin America, total personal lending was broadly flat at US$22bn as moderate growth in residential mortgage lending, particularly in Brazil, was more than offset by a decline in other personal lending. The latter reflected falls in credit card lending in Mexico and other higher-risk portfolios in Mexico and Brazil as we continued to reduce higher-risk portfolios in the region and tighten our underwriting criteria.
For an analysis of loan impairment allowances and impaired loans, see page 119.
106
Report of the Directors: Operating and Financial Review(continued)
Total personal lending
(Unaudited)
| | | | | | | | | | | | | | | | | | | | | | | | | |
| | | | | | | | | | | | | | | Rest of | | | | | | | |
| | | | | | | Rest of | | | | | | | North | | | Other | | | | |
| | | UK | | | Europe | | | US | 13 | | America | | | regions | 14 | | Total | |
| | | US$m | | | US$m | | | US$m | | | US$m | | | US$m | | | US$m | |
At 31 December 2010 | | | | | | | | | | | | | | | | | | | | | | | | |
| Residential mortgages | | | 103,037 | | | | 8,581 | | | | 57,630 | | | | 21,212 | | | | 78,221 | | | | 268,681 | |
| | | | | | | | | | | | | | | | | | | | | | | | | |
| Other personal lending | | | 25,636 | | | | 24,463 | | | | 51,686 | | | | 8,589 | | | | 46,265 | | | | 156,639 | |
| | | | | | | | | | | | | |
| – motor vehicle finance | | | – | | | | 35 | | | | 72 | | | | 55 | | | | 5,886 | | | | 6,048 | |
| – credit cards | | | 11,612 | | | | 1,916 | | | | 33,744 | | | | 1,334 | | | | 13,778 | | | | 62,384 | |
| – second lien mortgages | | | 846 | | | | 2 | | | | 9,322 | | | | 578 | | | | 422 | | | | 11,170 | |
| – other | | | 13,178 | | | | 22,510 | | | | 8,548 | | | | 6,622 | | | | 26,179 | | | | 77,037 | |
| | | | | | | | | | | | | |
| | | | | | | | | | | | | | | | | | | | | | | | | |
| | | | | | | | | | | | | |
| | | | | | | | | | | | | | | | | | | | | | | | | |
| Total personal lending | | | 128,673 | | | | 33,044 | | | | 109,316 | | | | 29,801 | | | | 124,486 | | | | 425,320 | |
| | | | | | | | | | | | | |
| | | | | | | | | | | | | | | | | | | | | | | | | |
Impairment allowances | | | | | | | | | | | | | | | | | | | | | | | | |
| Residential mortgages | | | (275 | ) | | | (58 | ) | | | (3,592 | ) | | | (25 | ) | | | (297 | ) | | | (4,247 | ) |
| | | | | | | | | | | | | | | | | | | | | | | | | |
| Other personal lending | | | (1,348 | ) | | | (467 | ) | | | (4,436 | ) | | | (179 | ) | | | (1,616 | ) | | | (8,046 | ) |
| | | | | | | | | | | | | |
| – motor vehicle finance | | | – | | | | (5 | ) | | | – | | | | – | | | | (244 | ) | | | (249 | ) |
| – credit cards | | | (506 | ) | | | (216 | ) | | | (2,256 | ) | | | (62 | ) | | | (483 | ) | | | (3,523 | ) |
| – second lien mortgages | | | (58 | ) | | | – | | | | (889 | ) | | | (19 | ) | | | – | | | | (966 | ) |
| – other | | | (784 | ) | | | (246 | ) | | | (1,291 | ) | | | (98 | ) | | | (889 | ) | | | (3,308 | ) |
| | | | | | | | | | | | | |
| | | | | | | | | | | | | | | | | | | | | | | | | |
| | | | | | | | | | | | | |
| | | | | | | | | | | | | | | | | | | | | | | | | |
| Total impairment allowances on personal lending | | | (1,623 | ) | | | (525 | ) | | | (8,028 | ) | | | (204 | ) | | | (1,913 | ) | | | (12,293 | ) |
| | | | | | | | | | | | | |
| | | | | | | | | | | | | | | | | | | | | | | | | |
| – as a percentage of total personal lending | | | 1.3% | | | | 1.6% | | | | 7.3% | | | | 0.7% | | | | 1.5% | | | | 2.9% | |
| | | | | | | | | | | | | | | | | | | | | | | | | |
| | | US$m | | | US$m | | | US$m | | | US$m | | | US$m | | | US$m | |
| At 31 December 2009 | | | | | | | | | | | | | | | | | | | | | | | | |
| Residential mortgages | | | 100,667 | | | | 9,205 | | | | 65,784 | | | | 20,807 | | | | 64,206 | | | | 260,669 | |
| | | | | | | | | | | | | | | | | | | | | | | | | |
| Other personal lending | | | 29,018 | | | | 23,672 | | | | 69,275 | | | | 8,068 | | | | 43,504 | | | | 173,537 | |
| | | | | | | | | | | | | |
| – motor vehicle finance | | | – | | | | 65 | | | | 5,771 | | | | 99 | | | | 6,378 | | | | 12,313 | |
| – credit cards | | | 12,427 | | | | 1,820 | | | | 39,374 | | | | 1,118 | | | | 13,319 | | | | 68,058 | |
| – second lien mortgages | | | 1,068 | | | | 2 | | | | 11,786 | | | | 695 | | | | 472 | | | | 14,023 | |
| – other | | | 15,523 | | | | 21,785 | | | | 12,344 | | | | 6,156 | | | | 23,335 | | | | 79,143 | |
| | | | | | | | | | | | | |
| | | | | | | | | | | | | | | | | | | | | | | | | |
| | | | | | | | | | | | | |
| | | | | | | | | | | | | | | | | | | | | | | | | |
| Total personal lending | | | 129,685 | | | | 32,877 | | | | 135,059 | | | | 28,875 | | | | 107,710 | | | | 434,206 | |
| | | | | | | | | | | | | |
| | | | | | | | | | | | | | | | | | | | | | | | | |
| Impairment allowances | | | | | | | | | | | | | | | | | | | | | | | | |
| Residential mortgages | | | (151 | ) | | | (41 | ) | | | (4,416 | ) | | | (7 | ) | | | (233 | ) | | | (4,848 | ) |
| | | | | | | | | | | | | | | | | | | | | | | | | |
| Other personal lending | | | (1,443 | ) | | | (552 | ) | | | (7,691 | ) | | | (206 | ) | | | (2,349 | ) | | | (12,241 | ) |
| | | | | | | | | | | | | |
| – motor vehicle finance | | | – | | | | (7 | ) | | | (211 | ) | | | (1 | ) | | | (351 | ) | | | (570 | ) |
| – credit cards | | | (524 | ) | | | (233 | ) | | | (3,895 | ) | | | (42 | ) | | | (854 | ) | | | (5,548 | ) |
| – second lien mortgages | | | (79 | ) | | | – | | | | (1,608 | ) | | | (56 | ) | | | – | | | | (1,743 | ) |
| – other | | | (840 | ) | | | (312 | ) | | | (1,977 | ) | | | (107 | ) | | | (1,144 | ) | | | (4,380 | ) |
| | | | | | | | | | | | | |
| | | | | | | | | | | | | | | | | | | | | | | | | |
| | | | | | | | | | | | | |
| |
| Total impairment allowances on personal lending | | | (1,594 | ) | | | (593 | ) | | | (12,107 | ) | | | (213 | ) | | | (2,582 | ) | | | (17,089 | ) |
| | | | | | | | | | | | | |
| | | | | | | | | | | | | | | | | | | | | | | | | |
| – as a percentage of total personal lending | | | 1.2% | | | | 1.8% | | | | 9.0% | | | | 0.7% | | | | 2.4% | | | | 3.9% | |
For footnotes, see page 174.
Mortgage lending
We offer a wide range of mortgage products designed to meet customer needs, including capital repayment mortgages subject to fixed or variable interest rates and products designed to meet demand for housing loans with more flexible payment structures. We underwrite both first lien residential mortgages and loans secured on second lien mortgages.
Interest-only mortgages are those for which customers make regular payments of interest during the life of the loan and repay the principal from the sale of their home or alternative sources of funds. Typically, with introductory interest-only mortgages, the interest-only element is for a fixed term at the start of the loan, after which principal repayments commence.
Affordability mortgages include all products where the customers’ monthly payments are set at
107
Report of the Directors: Operating and Financial Review(continued)
a low initial rate, either variable or fixed, before resetting to a higher rate once the introductory period is over. Offset mortgages are products linked to a current or savings account, where interest earned is used to repay mortgage debt.
UK mortgage lending
On a constant currency basis, total mortgage lending in the UK, comprising residential and second lien lending, increased by 7% to US$104bn at 31 December 2010. Growth was achieved largely through the enhancement of our product offerings, successful marketing and competitive pricing. Nonetheless, mortgage lending was constrained by the decline in re-mortgage activity due to the low interest rate environment and consumer concerns over future employment and higher interest rates.
Our UK mortgage portfolio remained of high quality, consisting primarily of lending to owner-occupiers. We restricted lending to purchase residential property for the purpose of rental and almost all new business was originated through our own salesforce, with the self-certification of income not permitted. The majority of mortgage lending was to existing customers holding current or savings accounts with HSBC; this facilitated and strengthened the underwriting process.
Loan impairment charges and delinquency levels in our UK mortgage book declined despite unemployment remaining high, mainly due to improving economic conditions and low interest rates, which helped make mortgages more affordable for customers. Our continuing enhancements in credit underwriting, credit policies and collection processes contributed to the reduction in delinquencies.
The percentage of loans that were 30 days or more delinquent declined from 1.6% at 31 December 2009 to 1.4% in 2010 in the HSBC Bank mortgage portfolio and remained at less than 1.0% in the First Direct portfolio.
In 2010, the average loan-to-value ratio for new business in the UK was 54%, an increase of a single percentage point on the previous year.
Interest-only mortgage balances increased by 4% to US$45bn compared with 2009. The majority of these mortgages were offset mortgages at First Direct for which delinquency rates remained at very low levels.
US mortgage lending
US mortgage lending balances, comprising residential and second lien lending, were US$67bn at
31 December 2010, a decline of 14% compared with the end of 2009.
Mortgage lending in HSBC Finance fell by 17% to US$51bn with declines in both the Consumer Lending and Mortgage Services portfolios from their planned run-off. See table on page 110 for a breakdown of mortgage lending in HSBC Finance.
Mortgage lending in the UK rose by 7% to US$104bn, while in the US balances declined by 14% to US$67bn.
Mortgage lending balances in HSBC Bank USA remained broadly unchanged at US$16bn. We continue to sell the majority of new origination to the secondary markets as a means of managing our interest rate risk and improving structural liquidity. This reduction was partly offset by an increase in originations to Premier customers with whom we already held a banking relationship. At 31 December 2010, approximately 32% of the HSBC Bank USA mortgage portfolio were fixed rate loans and 77% were first lien.
During 2010, state and federal officials announced investigations into the procedures followed by mortgage servicing companies and banks, including HSBC Finance and its affiliates, in relation to foreclosures. This included a joint examination by the Federal Reserve and the Office of the Comptroller of the Currency. Following the examination, our examiners issued supervisory letters noting deficiencies in our processing, preparation and signing of affidavits and other documents supporting foreclosures, and in the governance of and resources devoted to our foreclosure process. We have suspended foreclosures pending correction of the weaknesses. Management is reviewing all foreclosures which have not yet been completed, and will correct deficient documentation and refile documents where required.
As a result of the investigations, we expect that the scrutiny of documents will increase, and in some states additional verification of information may be required. If these trends continue after we reinstitute foreclosure, there could be additional delays in the process.
A discussion of credit trends in the US mortgage lending portfolio and the steps taken to mitigate risk is provided in ‘US personal lending – credit quality’ on page 110.
The following table shows the levels of mortgage lending products in the various portfolios in the US, the UK and the rest of the HSBC Group.
108
Report of the Directors: Operating and Financial Review(continued)
Mortgage lending products
(Unaudited)
| | | | | | | | | | | | | | | | | | | | | | | | | |
| | | | | | | | | | | | | | | Rest of | | | | | | | |
| | | | | | | Rest of | | | | | | | North | | | Other | | | | |
| | | UK | | | Europe | | | US | 13 | | America | | | regions | 14 | | Total | |
| | | US$m | | | US$m | | | US$m | | | US$m | | | US$m | | | US$m | |
At 31 December 2010 | | | | | | | | | | | | | | | | | | | | | | | | |
| Residential mortgages | | | 103,037 | | | | 8,581 | | | | 57,630 | | | | 21,212 | | | | 78,221 | | | | 268,681 | |
| Second lien mortgages | | | 846 | | | | 2 | | | | 9,322 | | | | 578 | | | | 422 | | | | 11,170 | |
| | | | | | | | | | | | | | | | | | | |
| | | | | | | | | | | | | | | | | | | | | | | | | |
| Total mortgage lending | | | 103,883 | | | | 8,583 | | | | 66,952 | | | | 21,790 | | | | 78,643 | | | | 279,851 | |
| | | | | | | | | | | | | | | | | | | |
| | | | | | | | | | | | | | | | | | | | | | | | | |
| Second lien as a percentage of total mortgage lending | | | 0.8% | | | | 0.0% | | | | 13.9% | | | | 2.7% | | | | 0.5% | | | | 4.0% | |
| | | | | | | | | | | | | | | | | | | | | | | | | |
| Impairment allowances | | | | | | | | | | | | | | | | | | | | | | | | |
| Residential mortgages | | | (275 | ) | | | (58 | ) | | | (3,592) | | | | (25) | | | | (297) | | | | (4,247) | |
| Second lien mortgages | | | (58) | | | | – | | | | (889) | | | | (19) | | | | – | | | | (966) | |
| | | | | | | | | | | | | | | | | | | |
| | | | | | | | | | | | | | | | | | | | | | | | | |
| Total impairment allowances on mortgage lending | | | (333) | | | | (58) | | | | (4,481) | | | | (44) | | | | (297) | | | | (5,213) | |
| | | | | | | | | | | | | | | | | | | |
| | | | | | | | | | | | | | | | | | | | | | | | | |
| Interest-only (including endowment) mortgages | | | 45,039 | | | | 51 | | | | – | | | | 908 | | | | 1,282 | | | | 47,280 | |
| Affordability mortgages, including ARMs | | | 1,089 | | | | 326 | | | | 18,494 | | | | 274 | | | | 7,855 | | | | 28,038 | |
| Other | | | 102 | | | | – | | | | – | | | | – | | | | 183 | | | | 285 | |
| | | | | | | | | | | | | | | | | | | |
| | | | | | | | | | | | | | | | | | | | | | | | | |
| Total interest-only and affordability mortgages | | | 46,230 | | | | 377 | | | | 18,494 | | | | 1,182 | | | | 9,320 | | | | 75,603 | |
| | | | | | | | | | | | | | | | | | | |
| | | | | | | | | | | | | | | | | | | | | | | | | |
| – as a percentage of total mortgage lending | | | 44.5% | | | | 4.4% | | | | 27.6% | | | | 5.4% | | | | 11.9% | | | | 27.0% | |
| | | | | | | | | | | | | | | | | | | | | | | | | |
Negative equity mortgages15 | | | 2,436 | | | | – | | | | 15,199 | | | | 103 | | | | 291 | | | | 18,029 | |
Other loan-to-value ratios greater than 90%16 | | | 5,802 | | | | 263 | | | | 10,460 | | | | 1,698 | | | | 1,348 | | | | 19,571 | |
| | | | | | | | | | | | | | | | | | | |
| | | | | | | | | | | | | | | | | | | | | | | | | |
| Total negative equity and other mortgages | | | 8,238 | | | | 263 | | | | 25,659 | | | | 1,801 | | | | 1,639 | | | | 37,600 | |
| | | | | | | | | | | | | | | | | | | |
| | | | | | | | | | | | | | | | | | | | | | | | | |
| – as a percentage of total mortgage lending | | | 7.9% | | | | 3.1% | | | | 38.3% | | | | 8.3% | | | | 2.1% | | | | 13.4% | |
| | | | | | | | | | | | | | | | | | | | | | | | | |
| At 31 December 2009 | | | | | | | | | | | | | | | | | | | | | | | | |
| Residential mortgages | | | 100,667 | | | | 9,205 | | | | 65,784 | | | | 20,807 | | | | 64,206 | | | | 260,669 | |
| Second lien mortgages | | | 1,068 | | | | 2 | | | | 11,786 | | | | 695 | | | | 472 | | | | 14,023 | |
| | | | | | | | | | | | | | | | | | | |
| | | | | | | | | | | | | | | | | | | | | | | | | |
| Total mortgage lending | | | 101,735 | | | | 9,207 | | | | 77,570 | | | | 21,502 | | | | 64,678 | | | | 274,692 | |
| | | | | | | | | | | | | | | | | | | |
| | | | | | | | | | | | | | | | | | | | | | | | | |
| Second lien as a percentage of total mortgage lending | | | 1.0% | | | | – | | | | 15.2% | | | | 3.2% | | | | 0.7% | | | | 5.1% | |
| | | | | | | | | | | | | | | | | | | | | | | | | |
| Impairment allowances | | | | | | | | | | | | | | | | | | | | | | | | |
| Residential mortgages | | | (151) | | | | (41) | | | | (4,416) | | | | (7) | | | | (233) | | | | (4,848) | |
| Second lien mortgages | | | (79) | | | | – | | | | (1,608) | | | | (56) | | | | – | | | | (1,743) | |
| | | | | | | | | | | | | | | | | | | |
| | | | | | | | | | | | | | | | | | | | | | | | | |
| Total impairment allowances on mortgage lending | | | (230) | | | | (41) | | | | (6,024) | | | | (63) | | | | (233) | | | | (6,591) | |
| | | | | | | | | | | | | | | | | | | |
| | | | | | | | | | | | | | | | | | | | | | | | | |
| Interest-only (including endowment) mortgages | | | 45,471 | | | | – | | | | – | | | | 1,154 | | | | 1,127 | | | | 47,752 | |
| Affordability mortgages, including ARMs | | | 2,681 | | | | 1,084 | | | | 21,024 | | | | 232 | | | | 5,921 | | | | 30,942 | |
| Other | | | 144 | | | | – | | | | – | | | | – | | | | 147 | | | | 291 | |
| | | | | | | | | | | | | | | | | | | |
| | | | | | | | | | | | | | | | | | | | | | | | | |
| Total interest-only and affordability mortgages | | | 48,296 | | | | 1,084 | | | | 21,024 | | | | 1,386 | | | | 7,195 | | | | 78,985 | |
| | | | | | | | | | | | | | | | | | | |
| | | | | | | | | | | | | | | | | | | | | | | | | |
| – as a percentage of total mortgage lending | | | 47.5% | | | | 11.8% | | | | 27.1% | | | | 6.4% | | | | 11.1% | | | | 28.8% | |
| | | | | | | | | | | | | | | | | | | | | | | | | |
Negative equity mortgages15 | | | 6,412 | | | | – | | | | 20,229 | | | | 163 | | | | 488 | | | | 27,292 | |
Other loan-to-value ratios greater than 90%16 | | | 10,522 | | | | – | | | | 13,695 | | | | 1,887 | | | | 1,451 | | | | 27,555 | |
| | | | | | | | | | | | | | | | | | | |
| | | | | | | | | | | | | | | | | | | | | | | | | |
| Total negative equity and other mortgages | | | 16,934 | | | | – | | | | 33,924 | | | | 2,050 | | | | 1,939 | | | | 54,847 | |
| | | | | | | | | | | | | | | | | | | |
| | | | | | | | | | | | | | | | | | | | | | | | | |
| – as a percentage of total mortgage lending | | | 16.6% | | | | – | | | | 43.7% | | | | 9.5% | | | | 3.0% | | | | 20.0% | |
For footnotes, see page 174.
HSBC Finance held approximately US$51bn of residential mortgage and second lien loans and advances to personal customers secured on real
| | | estate at 31 December 2010, 12% of the Group’s gross loans and advances to personal customers. |
109
Report of the Directors: Operating and Financial Review(continued)
HSBC Finance US mortgage lending17
(Unaudited)
| | | | | | | | | | | | | | | | | | | | | | | | | | | | | | | | | |
| | | At 31 December 2010 | | At 31 December 2009 |
| | | | | | | | | | | Other | | | | | | | | | | | | | | | Other | | | | |
| | | Mortgage | | | Consumer | | | mortgage | | | | | | | Mortgage | | | Consumer | | | mortgage | | | | |
| | | Services | | | Lending | | | lending | | | Total | | | Services | | | Lending | | | lending | | | Total | |
| | | US$m | | | US$m | | | US$m | | | US$m | | | US$m | | | US$m | | | US$m | | | US$m | |
| | | | | | | | | | | | | | | | | | | | | | | | | | | | | | | | | |
| Fixed-rate | | | 11,447 | | | | 31,759 | | | | 87 | | | | 43,293 | | | | 13,596 | | | | 37,639 | | | | 98 | | | | 51,333 | |
| Other | | | 6,122 | | | | 1,517 | | | | 2 | | | | 7,641 | | | | 8,168 | | | | 1,867 | | | | 6 | | | | 10,041 | |
| | | | | | | | | | | | | | | | | |
| Adjustable-rate | | | 5,042 | | | | 1,517 | | | | 2 | | | | 6,561 | | | | 7,070 | | | | 1,867 | | | | – | | | | 8,937 | |
Interest-only (affordability mortgages)18 | | | 1,080 | | | | – | | | | – | | | | 1,080 | | | | 1,098 | | | | – | | | | 6 | | | | 1,104 | |
| | | | | | | | | | | | | | | | | |
| | | | | | | | | | | | | | | | | | | | | | | | | | | | | | | | | |
| | | | | | | | | | | | | | | | | |
| | | | | | | | | | | | | | | | | | | | | | | | | | | | | | | | | |
| | | | 17,569 | | | | 33,276 | | | | 89 | | | | 50,934 | | | | 21,764 | | | | 39,506 | | | | 104 | | | | 61,374 | |
| | | | | | | | | | | | | | | | | |
| | | | | | | | | | | | | | | | | | | | | | | | | | | | | | | | | |
| First lien | | | 15,300 | | | | 29,950 | | | | 66 | | | | 45,316 | | | | 18,710 | | | | 34,913 | | | | 77 | | | | 53,700 | |
| Second lien | | | 2,269 | | | | 3,326 | | | | 23 | | | | 5,618 | | | | 3,054 | | | | 4,593 | | | | 27 | | | | 7,674 | |
| | | | | | | | | | | | | | | | | |
| | | | | | | | | | | | | | | | | | | | | | | | | | | | | | | | | |
| | | | 17,569 | | | | 33,276 | | | | 89 | | | | 50,934 | | | | 21,764 | | | | 39,506 | | | | 104 | | | | 61,374 | |
| | | | | | | | | | | | | | | | | |
| | | | | | | | | | | | | | | | | | | | | | | | | | | | | | | | | |
Stated income19 | | | 2,905 | | | | – | | | | – | | | | 2,905 | | | | 3,905 | | | | – | | | | – | | | | 3,905 | |
Negative equity mortgages15 | | | 5,161 | | | | 8,910 | | | | – | | | | 14,071 | | | | 6,770 | | | | 12,031 | | | | – | | | | 18,801 | |
| | | | | | | | | | | | | | | | | |
| | | | | | | | | | | | | | | | | | | | | | | | | | | | | | | | | |
| Impairment allowances | | | 1,837 | | | | 2,474 | | | | – | | | | 4,311 | | | | 2,419 | | | | 3,167 | | | | 1 | | | | 5,587 | |
| – as a percentage of total mortgage lending | | | 10.5% | | | | 7.4% | | | | – | | | | 8.5% | | | | 11.1% | | | | 8.0% | | | | 1.0% | | | | 9.1% | |
For footnotes, see page 174.
(Unaudited)
Credit quality
During 2010, economic conditions in the US generally improved, although the pace of improvement continued to be slow.
In the first half of 2010, house prices stabilised in many markets and began to recover in others, as the first time homebuyer tax credit and continued low interest rates favourably affected the housing market. However, in the second half of the year, house prices declined in many markets as the homebuyer tax credit ended and foreclosure levels rose.
Unemployment rates, which have been a major factor in the deterioration of credit quality, were 9.4% in December 2010, a decrease of 60 basis points since December 2009. Unemployment rates in 18 states were at or above the US national average and unemployment rates in 5 states were at or above 11%, including California and Florida, where more than 5% of HSBC Finance’s total loan balances are based.
Ongoing improvement in the US economy will be dependent on a sustained recovery in the housing market and unemployment rates, as well as the continuation of low interest rates. Renewed weakening in these factors and in consumer confidence may adversely affect consumer payment patterns and credit quality.
HSBC Finance: geographical concentration of US lending17, 20
(Unaudited)
| | | | | | | | | | | | | | | | | | | | | |
| | | Mortgage lending | | | Other personal lending | | | | |
| | | as a percentage of: | | | as a percentage of: | | | | |
| | | | | | | total | | | | | | | total other | | | percentage | |
| | | total | | | mortgage | | | total | | | personal | | | of total | |
| | | lending | | | lending | | | lending | | | lending | | | lending | |
| | | % | | | % | | | % | | | % | | | % | |
| | | | | | | | | | | | | | | | | | | | | |
| California | | | 6 | | | | 10 | | | | 4 | | | | 10 | | | | 10 | |
| New York | | | 4 | | | | 7 | | | | 3 | | | | 7 | | | | 7 | |
| Florida | | | 4 | | | | 6 | | | | 2 | | | | 5 | | | | 6 | |
| Pennsylvania | | | 3 | | | | 6 | | | | 2 | | | | 5 | | | | 6 | |
| Texas | | | 2 | | | | 4 | | | | 3 | | | | 7 | | | | 5 | |
| Ohio | | | 3 | | | | 6 | | | | 2 | | | | 5 | | | | 5 | |
For footnotes, see page 174.
110
Report of the Directors: Operating and Financial Review(continued)
Mortgage lending
In 2010, we reduced our non-prime mortgage exposure as balances continued to run-off in our Consumer Lending and Mortgage Services portfolios in HSBC Finance. At 31 December 2010, residential mortgage lending balances were US$58bn, a decline of 12% compared with the end of 2009.
In both our Consumer Lending and Mortgage Servicesmortgage portfolios, two months or more delinquent balances declined as balances ran-off and economic conditions improved. In addition, written-off balances were replaced with lower levels of new delinquency volumes as the portfolios continue to season. First lien two months or more delinquent balances in our Consumer Lending portfolio declined from US$5.4bn at 31 December 2009 to US$4.9bn at 31 December 2010 and, in our Mortgage Services portfolio, from US$3.1bn at 31 December 2009 to US$2.8bn at 31 December 2010. In each case, lending balances liquidated at a faster pace than delinquency. As a result, two months or more delinquency rates on first lien loans in our Consumer Lending portfolio increased from 15.4% at 31 December 2009 to 16.2%, while in our Mortgage Services portfolio, two months or more delinquency rates increased from 16.5% to 18.0%.
At HSBC Bank USA, we continued to sell the majority of new mortgage loan originations to the secondary markets. These decreases were partly offset by increases to the portfolio from new lending to our Premier relationship customers. Two months or more delinquency rates decreased from 8.6% to 7.9% at 31 December 2010, while delinquent balances remained flat at US$1.0bn.
Second lien mortgage loanshave a risk profile characterised by higher loan-to-value ratios because, in the majority of cases, the loans were taken out to complete the refinancing or purchase of properties. Loss experience on default of second lien loans has typically approached 100% of the amount owed, as any equity in the property is initially applied to the first lien loan. In the Mortgage Services second lien portfolio, outstanding balances declined by 26% to US$2.3bn and two months or more delinquency rates decreased to 10.8% at 31 December 2010. In the Consumer Lending second lien portfolio, outstanding balances declined by 28% to US$3.3bn, and two months or more delinquency rates decreased to 12.7% at 31 December 2010.
At HSBC Bank USA, second lien balances declined by 10% to US$3.7bn, and two months or more delinquency rates increased from 4.0% at 31 December 2009 to 4.8% at 31 December 2010 due to the effects of high unemployment levels.
Stated-income mortgagesare underwritten on the basis of borrowers’ representations of annual income and are not verified by supporting documents and, as a result, represent a higher than average level of risk. Stated income balances in HSBC Finance declined from US$3.9bn to US$2.9bn as the portfolio continued to run off. Two months or more delinquency rates increased to 24.0% at 31 December 2010. In HSBC Bank USA, stated-income balances were unchanged at US$2.1bn while delinquency rates decreased from 11.1% at 31 December 2009 to 10.6% at 31 December 2010.
At 31 December 2010, HSBC Finance had US$7.6bn ofaffordability mortgages, a decline of 24% compared with 31 December 2009, as the portfolio continued to run off. At HSBC Bank USA, affordability mortgage balances of US$10.9bn at 31 December 2010 compared with US$11.1bn at 31 December 2009.
Real estate markets in the majority of the US have been and will continue to be, affected by stagnation or declines in property values. As a result, loan-to-value ratios for our real estate secured loans have generally deteriorated since origination. Loans with a loan-to-value of 100% or more have historically had a greater likelihood of becoming delinquent. At 31 December 2010 loans in negative equity were US$14bn, compared with US$19bn at the end of 2009.
At HSBC Finance, the number offoreclosed propertiesat 31 December 2010 increased compared with the end of 2009. The rise reflected the improvement in the processing of foreclosures as backlogs and action taken by local governments and certain states had lengthened proceedings in previous years. The average loss on sale of foreclosed properties decreased compared with 2009 though the average loss increased in the second half of 2010, as house prices in many markets showed signs of deterioration due to a rise in the number of foreclosed properties and the expiration of the homebuyer tax credit. We continued to assist customers in restructuring their debts to avoid foreclosure, including by modifying their loans when it was decided that they could be serviced on revised terms. For more details on the investigation into US foreclosure practices, see page 83.
111
Report of the Directors: Operating and Financial Review(continued)
HSBC Finance foreclosed properties in the US
(Unaudited)
| | | | | | | | | | | | | | | | | | | | | | | | | |
| | | | | | | Quarter ended | | | |
| | | | | | | 31 Dec | | | 30 Sep | | | 30 Jun | | | 31 Mar | | | | |
| | | 2010 | | | 2010 | | | 2010 | | | 2010 | | | 2010 | | | 2009 | |
| Number of foreclosed properties at end of period | | | 10,940 | | | | 10,940 | | | | 9,798 | | | | 8,394 | | | | 6,961 | | | | 6,188 | |
| Number of properties added to foreclosed inventory in the year/quarter | | | 20,489 | | | | 5,763 | | | | 5,413 | | | | 5,096 | | | | 4,217 | | | | 14,845 | |
Average loss on sale of foreclosed properties21 | | | 9% | | | | 15% | | | | 10% | | | | 4% | | | | 4% | | | | 12% | |
Average total loss on foreclosed properties22 | | | 51% | | | | 54% | | | | 52% | | | | 49% | | | | 49% | | | | 51% | |
| Average time to sell foreclosed properties (days) | | | 161 | | | | 165 | | | | 158 | | | | 156 | | | | 170 | | | | 193 | |
For footnotes, see page 174.
Credit cards
In our credit card and private label portfolios two months or more delinquency balances declined markedly, reflecting actions taken to improve credit quality, and our customer payment rates benefited from an increased focus by consumers on reducing outstanding credit card debt. Two months or more delinquent balances in our credit card portfolio declined from US$1.8bn to US$1.0bn, while in percentage terms they declined from 7.4% at 31 December 2009 to 4.7% at 31 December 2010. In the private label cards portfolio, two months or more delinquent balances declined from US$622m to US$404m while in percentage terms delinquency decreased from 4.1% at 31 December 2009 to 3.0% at 31 December 2010.
Motor vehicle finance
In 2010, we sold our vehicle finance loan portfolio and vehicle finance servicing operations. See page 106 for details.
Other personal lending
In the US unsecured lending portfolio, two months or more delinquency rates declined as balances continued to run off, economic conditions generally improved, and actions taken previously to tighten underwriting and reduce risk in this portfolio continued to have a favourable effect on credit quality.
Loan delinquency
Trends in two months and over contractual delinquency in the US
(Unaudited)
| | | | | | | | | | | | | | | | | | | | | | | | | | | | | | | | | | | | | |
| | | Quarter ended |
| | | | | | | | | | | | | | | | | | | As | | | Ex. period | | | | | | | | | | |
| | | | | | | | | | | | | | | | | | | reported | | | change | | | | | | | | | | |
| | | 31 Dec | | | 30 Sep | | | 30 Jun | | | 31 Mar | | | 31 Dec | | | 31 Dec | | | 30 Sep | | | 30 Jun | | | 31 Mar | |
| | | 2010 | | | 2010 | | | 2010 | | | 2010 | | | 2009 | | | 2009 | | | 2009 | | | 2009 | | | 2009 | |
| | | US$m | | | US$m | | | US$m | | | US$m | | | US$m | | | US$m | | | US$m | | | US$m | | | US$m | |
In Personal Financial
Services in the US | | | | | | | | | | | | | | | | | | | | | | | | | | | | | | | | | | | | |
| Residential mortgages | | | 8,632 | | | | 8,885 | | | | 8,591 | | | | 8,960 | | | | 9,551 | | | | 11,519 | | | | 10,834 | | | | 10,070 | | | | 9,892 | |
| Second lien mortgage lending | | | 847 | | | | 907 | | | | 930 | | | | 1,011 | | | | 1,194 | | | | 1,628 | | | | 1,631 | | | | 1,676 | | | | 1,772 | |
| Vehicle finance | | | – | | | | – | | | | 152 | | | | 194 | | | | 267 | | | | 267 | | | | 295 | | | | 310 | | | | 269 | |
| Credit card | | | 957 | | | | 1,066 | | | | 1,201 | | | | 1,511 | | | | 1,798 | | | | 1,798 | | | | 1,834 | | | | 1,864 | | | | 1,992 | |
| Private label | | | 404 | | | | 445 | | | | 478 | | | | 510 | | | | 622 | | | | 622 | | | | 639 | | | | 636 | | | | 659 | |
| Personal non-credit card | | | 811 | | | | 953 | | | | 987 | | | | 1,194 | | | | 1,548 | | | | 2,619 | | | | 2,680 | | | | 2,709 | | | | 2,855 | |
| | | | | | | | | | | | | | | | | | | |
| | | | | | | | | | | | | | | | | | | | | | | | | | | | | | | | | | | | | |
| Total | | | 11,651 | | | | 12,256 | | | | 12,339 | | | | 13,380 | | | | 14,980 | | | | 18,453 | | | | 17,913 | | | | 17,265 | | | | 17,439 | |
| | | | | | | | | | | | | | | | | | | |
| | | % | 23 | | % | 23 | | % | 23 | | % | 23 | | % | 23 | | % | 23 | | % | 23 | | % | 23 | | % | 23 |
| | | | | | | | | | | | | | | | | | | | | | | | | | | | | | | | | | | | | |
| Residential mortgages | | | 15.00 | | | | 14.97 | | | | 14.02 | | | | 14.12 | | | | 14.54 | | | | 17.03 | | | | 15.39 | | | | 13.89 | | | | 12.82 | |
| Second lien mortgage lending | | | 9.10 | | | | 9.23 | | | | 8.98 | | | | 9.17 | | | | 10.14 | | | | 13.35 | | | | 12.71 | | | | 12.35 | | | | 12.59 | |
| Vehicle finance | | | – | | | | – | | | | 3.59 | | | | 3.96 | | | | 4.63 | | | | 4.63 | | | | 4.61 | | | | 3.97 | | | | 2.79 | |
| Credit card | | | 4.69 | | | | 5.23 | | | | 5.65 | | | | 6.84 | | | | 7.38 | | | | 7.38 | | | | 7.28 | | | | 7.25 | | | | 7.14 | |
| Private label | | | 3.03 | | | | 3.56 | | | | 3.80 | | | | 3.78 | | | | 4.12 | | | | 4.12 | | | | 4.38 | | | | 4.08 | | | | 4.28 | |
| Personal non-credit card | | | 9.49 | | | | 10.15 | | | | 9.60 | | | | 10.75 | | | | 12.55 | | | | 19.77 | | | | 18.73 | | | | 18.02 | | | | 18.30 | |
| | | | | | | | | | | | | | | | | | | | | | | | | | | | | | | | | | | | | |
| Total | | | 10.67 | | | | 10.99 | | | | 10.28 | | | | 10.61 | | | | 11.09 | | | | 13.34 | | | | 12.47 | | | | 11.49 | | | | 10.92 | |
112
Report of the Directors: Operating and Financial Review(continued)
| | | | | | | | | | | | | | | | | | | | | | | | | | | | | | | | | | | | | |
| | | Quarter ended | |
| | | | | | | | | | | | | | | | | | | As | | | Ex. period | | | | | | | | | | |
| | | | | | | | | | | | | | | | | | | reported | | | change | | | | | | | | | | |
| | | 31 Dec | | | 30 Sep | | | 30 Jun | | | 31 Mar | | | 31 Dec | | | 31 Dec | | | 30 Sep | | | 30 Jun | | | 31 Mar | |
| | | 2010 | | | 2010 | | | 2010 | | | 2010 | | | 2009 | | | 2009 | | | 2009 | | | 2009 | | | 2009 | |
| In Mortgage Services | | US$m | | | US$m | | | US$m | | | US$m | | | US$m | | | US$m | | | US$m | | | US$m | | | US$m | |
and Consumer | | | | | | | | | | | | | | | | | | | | | | | | | | | | | | | | | | | | |
Lending24 | | | | | | | | | | | | | | | | | | | | | | | | | | | | | | | | | | | | |
| Mortgage Services: | | | 3,002 | | | | 3,117 | | | | 3,067 | | | | 3,236 | | | | 3,477 | | | | 4,456 | | | | 4,250 | | | | 4,257 | | | | 4,535 | |
| | | | | | | | | | | | | | | | | | | |
| – first lien | | | 2,757 | | | | 2,850 | | | | 2,788 | | | | 2,928 | | | | 3,093 | | | | 3,900 | | | | 3,688 | | | | 3,642 | | | | 3,824 | |
| – second lien | | | 245 | | | | 267 | | | | 279 | | | | 308 | | | | 384 | | | | 556 | | | | 562 | | | | 615 | | | | 711 | |
| | | | | | | | | | | | | | | | | | | |
| Consumer Lending: | | | 5,284 | | | | 5,495 | | | | 5,278 | | | | 5,493 | | | | 6,022 | | | | 7,445 | | | | 7,131 | | | | 6,514 | | | | 6,203 | |
| | | | | | | | | | | | | | | | | | | |
| – first lien | | | 4,861 | | | | 5,022 | | | | 4,795 | | | | 4,970 | | | | 5,380 | | | | 6,541 | | | | 6,241 | | | | 5,640 | | | | 5,322 | |
| – second lien | | | 423 | | | | 473 | | | | 483 | | | | 523 | | | | 642 | | | | 904 | | | | 890 | | | | 874 | | | | 881 | |
| | | | | | | | | | | | | | | | | | | |
| | | | % | 23 | | | % | 23 | | | % | 23 | | | % | 23 | | | % | 23 | | | % | 23 | | | % | 23 | | | % | 23 | | | % | 23 |
| Mortgage Services: | | | | | | | | | | | | | | | | | | | | | | | | | | | | | | | | | | | | |
| – first lien | | | 18.02 | | | | 17.73 | | | | 16.50 | | | | 16.38 | | | | 16.53 | | | | 20.00 | | | | 18.09 | | | | 17.13 | | | | 17.24 | |
| – second lien | | | 10.80 | | | | 10.93 | | | | 10.63 | | | | 10.87 | | | | 12.57 | | | | 17.25 | | | | 16.36 | | | | 16.35 | | | | 17.44 | |
| – total | | | 17.09 | | | | 16.83 | | | | 15.71 | | | | 15.62 | | | | 15.98 | | | | 19.61 | | | | 17.84 | | | | 17.01 | | | | 17.27 | |
| | | | | | | | | | | | | | | | | | | | | | | | | | | | | | | | | | | | | |
| Consumer Lending: | | | | | | | | | | | | | | | | | | | | | | | | | | | | | | | | | | | | |
| – first lien | | | 16.23 | | | | 16.16 | | | | 14.85 | | | | 14.79 | | | | 15.41 | | | | 18.15 | | | | 16.75 | | | | 14.72 | | | | 13.52 | |
| – second lien | | | 12.72 | | | | 13.16 | | | | 12.44 | | | | 12.25 | | | | 13.98 | | | | 18.64 | | | | 17.49 | | | | 16.17 | | | | 15.43 | |
| – total | | | 15.88 | | | | 15.85 | | | | 14.59 | | | | 14.51 | | | | 15.24 | | | | 18.21 | | | | 16.84 | | | | 14.90 | | | | 13.76 | |
For footnotes, see page 174.
Forbearance strategies and renegotiated loans
(Audited)A range of forbearance strategies are employed in order to improve the management of customer relationships, maximise collection opportunities and, if possible, avoid foreclosure or repossession. Our policies and practices are based on criteria which, in the judgement of local management, indicate that repayment is likely to continue.
Forbearance arrangements include extended payment terms, a reduction in interest or principal repayments, approved external debt management plans, the deferral of foreclosures, other modifications, and loan restructures. These management policies and practices typically provide the customer with terms and conditions that are more favourable than those provided initially. Such arrangements could include cases where an account is brought up-to-date without full repayment of all the arrears.
Our most common forbearance arrangements are loan restructures applied to real estate loans within consumer finance portfolios in the US. Our credit risk management policy sets out restrictions on the number and frequency of restructures, the minimum period an account must have been opened before any restructure can be considered, and the number of qualifying payments that must be received before an account may be considered restructured and up-to-date. The application of this policy varies according to the nature of the market,
the product and the management of customer relationships through the occurrence of exceptional events.
Loans that are subject to restructuring may only be classified as restructured and up-to-date once a specified number and/or amount of qualifying payments have been received. These qualifying payments are set at a level appropriate to the nature of the loan and the customer’s ability to make the repayment going forward. Typically the receipt of two or more qualifying payments is required within a certain period, generally 60 days (in the case of HSBC Finance, in certain circumstances, for example where debt has been restructured in bankruptcy proceedings, fewer or no payments may be required). Loans that have been restructured and would otherwise have been past due or impaired are classified as renegotiated.
Renegotiated loans are segregated from other parts of the loan portfolio for collective impairment assessment, to reflect the higher rates of losses often encountered in this segment of the portfolio. When empirical evidence indicates an increased propensity to default and higher losses on such accounts, the use of roll rate methodology ensures these factors are taken into account when calculating impairment allowances. The carrying amount of loans that have been classified as renegotiated retain this classification until maturity or derecognition. Interest is recorded on renegotiated loans on the basis of new contractual terms following renegotiation.
113
Report of the Directors: Operating and Financial Review(continued)
Renegotiated loans totalled US$35bn at 31 December 2010 (2009: US$39bn). The largest concentration was in the US and amounted to US$28bn (2009: US$33bn) or 82% (2009: 86%) of our total renegotiated loans, substantially all of which was held by HSBC Finance.
HSBC Finance loan modifications and re-ageing
(Unaudited)
HSBC Finance continued to refine its customer account management policies and practices, including account modification and re-age programmes. Modification occurs when the terms of a loan are modified either temporarily or permanently. Modification may also lead to a re-ageing of the account. In 2010, HSBC Finance modified 42,500 loans with an aggregate balance of US$6.0bn in Consumer Lending and Mortgage Services through the foreclosure avoidance and account modification programmes.
At 31 December 2010, the total balance outstanding on HSBC Finance real estate secured accounts which have been re-aged or modified was US$26.7bn, compared with US$30.2bn at the end of 2009. US$10.6bn relates to loans that had been re-aged without modification to the terms (2009: US$11.1bn), and US$13.9bn relates to loans whose terms have been modified and have been re-aged (2009: US$15.7bn). These amounts are included in the renegotiated loans balance disclosed above. In addition, US$2.2bn of loans have been modified but not re-aged (2009: US$3.4bn) and as such do not meet the definition of a renegotiated loan as the impairment or past-due status of the loans did not change on modification. At 31 December 2010, 62% of modified or re-aged real estate loans remained up-to-date or past due less than 30 days (2009: 61%) and 26% were two or more months delinquent (2009: 26%).
Collateral and other credit enhancements obtained
(Audited)
We obtained assets by taking possession of collateral held as security, or calling upon other credit enhancements, as follows:
| | | | | | | | | |
| | | Carrying amount | |
| | | obtained in: | |
| | | 2010 | | | 2009 | |
| | | US$m | | | US$m | |
Nature of assets | | | | | | | | |
| Residential property | | | 2,052 | | | | 1,587 | |
| Commercial and industrial property | | | 61 | | | | 93 | |
| Other | | | 119 | | | | 355 | |
| | | | | |
| | | | 2,232 | | | | 2,035 | |
| | | | | |
We make repossessed properties available for sale in an orderly fashion, with the proceeds used to reduce or repay the outstanding indebtedness. If excess funds arise after the debt has been repaid, they are made available either to repay other secured lenders with lower priority or are returned to the customer. We do not generally occupy repossessed properties for our business use.
Credit quality of financial instruments
(Audited)
The five credit quality classifications defined below each encompass a range of more granular internal credit rating grades assigned to wholesale and retail lending business, as well as the external ratings attributed by external agencies to debt securities. There is no direct correlation between the internal and external ratings at a granular level, except to the extent each falls within a single quality classification.
Credit quality classification
(Unaudited)
| | | | | | | | | | | | | | | | | | | | | |
| | | Debt securities | | Wholesale lending | | | | |
| | | and other bills | | and derivatives | | | Retail lending |
| Quality | | External | | Internal | | Probability of | | | Internal | | | Expected | |
| classification | | credit rating | | credit rating | | default % | | | credit rating25 | | loss % | |
| | | | | | | | | | | | | | | | | | | | | |
| Strong | | A– and above | | CRR1 to CRR2 | | | 0 – 0.169 | | | EL1 to EL2 | | | | 0 – 0.999 | |
| Good | | BBB+ to BBB– | | CRR3 | | | 0.170 – 0.740 | | | EL3 | | | | 1.000 – 4.999 | |
| Satisfactory | | BB+ to B+ | | | | | | | | | | | | | | | | |
| | | and unrated | | CRR4 to CRR5 | | | 0.741 – 4.914 | | | EL4 to EL5 | | | | 5.000 – 19.999 | |
| Sub-standard | | B and below | | CRR6 to CRR8 | | | 4.915 – 99.999 | | | EL6 to EL8 | | | | 20.000 – 99.999 | |
| Impaired | | Impaired | | CRR9 to CRR10 | | | 100 | | | EL9 to EL10 | | | 100+ or defaulted26 |
For footnotes, see page 174.
114
Report of the Directors: Operating and Financial Review(continued)
| | | |
Quality classification definitions | | |
• ‘Strong’: exposures demonstrate a strong capacity to meet financial commitments, with negligible or low probability of default and/or low levels of expected loss. Retail accounts operate within product parameters and only exceptionally show any period of delinquency. | | commitments, with moderate default risk. Retail accounts typically show only short periods of delinquency, with any losses expected to be minor following the adoption of recovery processes.
• ‘Sub-standard’: exposures require varying degrees of special attention and default risk is of greater concern. Retail portfolio segments show longer delinquency periods of generally up to 90 days past due and/or expected losses are higher due to a reduced ability to mitigate these through security realisation or other recovery processes. |
| | |
• ‘Good’: exposures require closer monitoring and demonstrate a good capacity to meet financial commitments, with low default risk. Retail accounts typically show only short periods of delinquency, with any losses expected to be minimal following the adoption of recovery processes. | |
| | | |
• ‘Satisfactory’: exposures require closer monitoring and demonstrate an average to fair capacity to meet financial | | • ‘Impaired’: exposures have been assessed, individually or collectively, as impaired. |
The Customer Risk Rating (‘CRR’) 10-grade scale above summarises a more granular underlying 23-grade scale (2009: 22-grade scale) of obligor probability of default (‘PD’). The 23-grade scale was introduced in September 2010 following the harmonisation of PDs for three asset classes (banks, sovereigns and corporates) into one scale which required an additional PD band. All distinct HSBC customers are rated using the 10 or 23-grade scale, depending on the degree of sophistication of the Basel II approach adopted for the exposure.
The Expected Loss (‘EL’) 10-grade scale for retail business summarises a more granular underlying EL scale for these customer segments; this combines obligor and facility/product risk factors in a composite measure.
For debt securities and certain other financial instruments, external ratings have been aligned to the five quality classifications. The ratings of Standard and Poor’s are cited, with those of other agencies being treated equivalently. Debt securities with short-term issue ratings are reported against the long-term rating of the issuer of those securities. If major rating agencies have different ratings for the same debt securities, a prudent rating selection is made in line with regulatory requirements.
Additional credit quality information in respect of our consolidated holdings of ABSs is provided on pages 134 and 135.
For the purpose of the following disclosure, retail loans which are past due up to 89 days and are not otherwise classified as EL9 or EL10, are not disclosed within the EL grade to which they relate, but are separately classified as past due but not impaired.
Financial instruments by credit quality
2010 compared with 2009
Financial instruments on which credit quality has been assessed increased by 4% to US$2,297bn due to strong growth in lending, mainly in Asia. At December 2010, US$1,550bn or 67% was classified as ‘strong’ in line with the end of 2009, reflecting the continued actions by management to mitigate the Group’s exposure to credit risk. The proportion of financial instruments classified as ‘good’ and ‘satisfactory’ were broadly unchanged at 16% and 12% respectively. The proportion of ‘sub-standard’ financial instruments was 2%.
Loans and advances on which credit quality has been assessed increased by 8% to US$1,167bn, driven by growth in commercial and personal lending in Asia as generally economic conditions improved, while loans and advances to banks also rose. The growth was in balances classified as ‘strong’ and ‘good’, while balances classified as ‘sub-standard’ and ‘past due but not impaired’ declined.
Derivative assets on which credit quality has been assessed grew by 4% to US$261bn from 31 December 2009, with growth in balances being classified as ‘strong’. The increase was mainly in interest rate derivatives, reflecting a downward shift in yield curves.
At 31 December 2010, financial investments on which credit quality has been assessed increased by 9% compared with the end of 2009, to US$393bn. Substantially all this growth was in assets classified as ‘strong’, reflecting increased investment of excess liquidity into low-risk government issued or government guaranteed bonds.
115
Report of the Directors: Operating and Financial Review(continued)
Trading assets on which credit quality has been assessed decreased by 11%, with the decline being in assets rated as ‘strong’. This reflected the de-consolidation of the Constant Net Asset Value funds.
The following tables set out our distribution of financial instruments by measures of credit quality:
Distribution of financial instruments by credit quality
(Audited)
| | | | | | | | | | | | | | | | | | | | | | | | | | | | | | | | | |
| | | Neither past due nor impaired | | | Past due | | | | | | | Impair- | | | | |
| | | | | | | | | | | | | | | Sub- | | | but not | | | | | | | ment | | | | |
| | | Strong | | | Good | | | Satisfactory | | | standard | | | impaired | | | Impaired | | | allowances | 27 | | Total | |
| | | US$m | | | US$m | | | US$m | | | US$m | | | US$m | | | US$m | | | US$m | | | US$m | |
At 31 December 2010 | | | | | | | | | | | | | | | | | | | | | | | | | | | | | | | | |
| Cash and balances at central banks | | | 51,682 | | | | 3,100 | | | | 2,461 | | | | 140 | | | | | | | | | | | | | | | | 57,383 | |
| Items in the course of collection from other banks | | | 5,631 | | | | 101 | | | | 340 | | | | – | | | | | | | | | | | | | | | | 6,072 | |
| Hong Kong Government certificates of indebtedness | | | 19,057 | | | | – | | | | – | | | | – | | | | | | | | | | | | | | | | 19,057 | |
| | | | | | | | | | | | | | | | | | | | | | | | | | | | | | | | | |
Trading assets28 | | | 256,576 | | | | 41,620 | | | | 43,278 | | | | 2,492 | | | | | | | | | | | | | | | | 343,966 | |
| | | | | | | | | | | | | | | | | | | | | | | |
| – treasury and other eligible bills | | | 23,663 | | | | 1,000 | | | | 957 | | | | – | | | | | | | | | | | | | | | | 25,620 | |
| – debt securities | | | 141,837 | | | | 8,254 | | | | 17,222 | | | | 955 | | | | | | | | | | | | | | | | 168,268 | |
| – loans and advances to banks | | | 55,534 | | | | 9,980 | | | | 4,865 | | | | 77 | | | | | | | | | | | | | | | | 70,456 | |
| – loans and advances to customers | | | 35,542 | | | | 22,386 | | | | 20,234 | | | | 1,460 | | | | | | | | | | | | | | | | 79,622 | |
| | | | | | | | | | | | | | | | | | | | | | | |
Financial assets designated at fair value28 | | | 8,377 | | | | 4,640 | | | | 6,536 | | | | 40 | | | | | | | | | | | | | | | | 19,593 | |
| | | | | | | | | | | | | | | | | | | | | | | |
| – treasury and other eligible bills | | | 158 | | | | – | | | | 1 | | | | – | | | | | | | | | | | | | | | | 159 | |
| – debt securities | | | 7,310 | | | | 4,368 | | | | 6,530 | | | | 40 | | | | | | | | | | | | | | | | 18,248 | |
| – loans and advances to banks | | | 38 | | | | 272 | | | | 5 | | | | – | | | | | | | | | | | | | | | | 315 | |
| – loans and advances to customers | | | 871 | | | | – | | | | – | | | | – | | | | | | | | | | | | | | | | 871 | |
| | | | | | | | | | | | | | | | | | | | | | | |
Derivatives28 | | | 199,920 | | | | 45,042 | | | | 13,980 | | | | 1,815 | | | | | | | | | | | | | | | | 260,757 | |
| | | | | | | | | | | | | | | | | | | | | | | | | | | | | | | | | |
| Loans and advances held at amortised cost | | | 653,248 | | | | 251,265 | | | | 186,704 | | | | 37,057 | | | | 30,320 | | | | 28,284 | | | | (20,241 | ) | | | 1,166,637 | |
| | | | | | | | | | | | | | | | | |
| – loans and advances to banks | | | 166,943 | | | | 33,051 | | | | 6,982 | | | | 1,152 | | | | 108 | | | | 193 | | | | (158) | | | | 208,271 | |
– loans and advances to customers29 | | | 486,305 | | | | 218,214 | | | | 179,722 | | | | 35,905 | | | | 30,212 | | | | 28,091 | | | | (20,083) | | | | 958,366 | |
| | | | | | | | | | | | | | | | | |
| Financial investments | | | 345,265 | | | | 23,253 | | | | 17,168 | | | | 4,479 | | | | 16 | | | | 2,591 | | | | | | | | 392,772 | |
| | | | | | | | | | | | | | | | | | | |
| – treasury and other similar bills | | | 52,423 | | | | 2,702 | | | | 1,882 | | | | 115 | | | | – | | | | 7 | | | | | | | | 57,129 | |
| – debt securities | | | 292,842 | | | | 20,551 | | | | 15,286 | | | | 4,364 | | | | 16 | | | | 2,584 | | | | | | | | 335,643 | |
| | | | | | | | | | | | | | | | | | | |
| Other assets | | | 9,752 | | | | 6,067 | | | | 12,212 | | | | 1,510 | | | | 513 | | | | 317 | | | | | | | | 30,371 | |
| | | | | | | | | | | | | | | | | | | |
| – endorsements and acceptances | | | 2,074 | | | | 3,305 | | | | 4,227 | | | | 493 | | | | 9 | | | | 8 | | | | | | | | 10,116 | |
| – accrued income and other | | | 7,678 | | | | 2,762 | | | | 7,985 | | | | 1,017 | | | | 504 | | | | 309 | | | | | | | | 20,255 | |
| | | | | | | | | | | | | | | | | |
| | | | | | | | | | | | | | | | | | | | | | | | | | | | | | | | | |
| | | | | | | | | | | | | | | | | |
| | | | | | | | | | | | | | | | | | | | | | | | | | | | | | | | | |
| Total financial instruments | | | 1,549,508 | | | | 375,088 | | | | 282,679 | | | | 47,533 | | | | 30,849 | | | | 31,192 | | | | (20,241 | ) | | | 2,296,608 | |
| | | | | | | | | | | | | | | | | |
116
Report of the Directors: Operating and Financial Review(continued)
| | | | | | | | | | | | | | | | | | | | | | | | | | | | | | | | | |
| | | Neither past due nor impaired | | | Past due | | | | | | | Impair- | | | | |
| | | | | | | | | | | | | | | Sub- | | | but not | | | | | | | ment | | | | |
| | | Strong | | | Good | | | Satisfactory | | | standard | | | impaired | | | Impaired | | | allowances | 27 | | Total | |
| | | US$m | | | US$m | | | US$m | | | US$m | | | US$m | | | US$m | | | US$m | | | US$m | |
| At 31 December 2009 | | | | | | | | | | | | | | | | | | | | | | | | | | | | | | | | |
| Cash and balances at central banks | | | 55,355 | | | | 3,414 | | | | 1,589 | | | | 297 | | | | | | | | | | | | | | | | 60,655 | |
| Items in the course of collection from other banks | | | 5,922 | | | | 20 | | | | 453 | | | | – | | | | | | | | | | | | | | | | 6,395 | |
| Hong Kong Government certificates of indebtedness | | | 17,463 | | | | – | | | | – | | | | – | | | | | | | | | | | | | | | | 17,463 | |
| | | | | | | | | | | | | | | | | | | | | | | | | | | | | | | | | |
Trading assets28 | | | 306,481 | | | | 37,911 | | | | 39,457 | | | | 2,221 | | | | | | | | | | | | | | | | 386,070 | |
| | | | | | | | | | | | | | | | | | | | | | | |
| – treasury and other eligible bills | | | 21,747 | | | | 315 | | | | 169 | | | | 115 | | | | | | | | | | | | | | | | 22,346 | |
| – debt securities | | | 180,876 | | | | 7,499 | | | | 12,360 | | | | 863 | | | | | | | | | | | | | | | | 201,598 | |
| – loans and advances to banks | | | 59,152 | | | | 14,213 | | | | 4,572 | | | | 189 | | | | | | | | | | | | | | | | 78,126 | |
| – loans and advances to customers | | | 44,706 | | | | 15,884 | | | | 22,356 | | | | 1,054 | | | | | | | | | | | | | | | | 84,000 | |
| | | | | | | | | | | | | | | | | | | | | | | |
| | | | | | | | | | | | | | | | | | | | | | | | | | | | | | | | | |
Financial assets designated at fair value28 | | | 11,163 | | | | 3,834 | | | | 7,122 | | | | 79 | | | | | | | | | | | | | | | | 22,198 | |
| | | | | | | | | | | | | | | | | | | | | | | |
| – treasury and other eligible bills | | | 223 | | | | – | | | | – | | | | – | | | | | | | | | | | | | | | | 223 | |
| – debt securities | | | 9,701 | | | | 3,834 | | | | 7,104 | | | | 79 | | | | | | | | | | | | | | | | 20,718 | |
| – loans and advances to banks | | | 336 | | | | – | | | | 18 | | | | – | | | | | | | | | | | | | | | | 354 | |
| – loans and advances to customers | | | 903 | | | | – | | | | – | | | | – | | | | | | | | | | | | | | | | 903 | |
| | | | | | | | | | | | | | | | | | | | | | | |
| | | | | | | | | | | | | | | | | | | | | | | | | | | | | | | | | |
Derivatives28 | | | 169,430 | | | | 60,759 | | | | 15,688 | | | | 5,009 | | | | | | | | | | | | | | | | 250,886 | |
| | | | | | | | | | | | | | | | | | | | | | | | | | | | | | | | | |
| Loans and advances held at amortised cost | | | 570,357 | | | | 231,394 | | | | 185,167 | | | | 43,820 | | | | 40,078 | | | | 30,845 | | | | (25,649 | ) | | | 1,076,012 | |
| | | | | | | | | | | | | | | | | |
| – loans and advances to banks | | | 130,403 | | | | 34,646 | | | | 13,154 | | | | 1,434 | | | | 12 | | | | 239 | | | | (107) | | | | 179,781 | |
– loans and advances to customers29 | | | 439,954 | | | | 196,748 | | | | 172,013 | | | | 42,386 | | | | 40,066 | | | | 30,606 | | | | (25,542) | | | | 896,231 | |
| | | | | | | | | | | | | | | | | |
| | | | | | | | | | | | | | | | | | | | | | | | | | | | | | | | | |
| Financial investments | | | 316,604 | | | | 20,080 | | | | 15,359 | | | | 5,602 | | | | – | | | | 2,389 | | | | | | | | 360,034 | |
| | | | | | | | | | | | | | | | | | | |
| – treasury and other similar bills | | | 54,158 | | | | 1,458 | | | | 2,315 | | | | 498 | | | | – | | | | 5 | | | | | | | | 58,434 | |
| – debt securities | | | 262,446 | | | | 18,622 | | | | 13,044 | | | | 5,104 | | | | – | | | | 2,384 | | | | | | | | 301,600 | |
| | | | | | | | | | | | | | | | | | | |
| | | | | | | | | | | | | | | | | | | | | | | | | | | | | | | | | |
| Other assets | | | 13,454 | | | | 6,968 | | | | 12,477 | | | | 1,718 | | | | 908 | | | | 848 | | | | | | | | 36,373 | |
| | | | | | | | | | | | | | | | | | | |
| – endorsements and acceptances | | | 1,349 | | | | 3,200 | | | | 4,161 | | | | 512 | | | | 12 | | | | 77 | | | | | | | | 9,311 | |
| – accrued income and other | | | 12,105 | | | | 3,768 | | | | 8,316 | | | | 1,206 | | | | 896 | | | | 771 | | | | | | | | 27,062 | |
| | | | | | | | | | | | | | | | | | | |
| | | | | | | | | | | | | | | | | | | | | | | | | | | | | | | | | |
| | | | | | | | | | | | | | | | | |
| | | | | | | | | | | | | | | | | | | | | | | | | | | | | | | | | |
| Total financial instruments | | | 1,466,229 | | | | 364,380 | | | | 277,312 | | | | 58,746 | | | | 40,986 | | | | 34,082 | | | | (25,649 | ) | | | 2,216,086 | |
| | | | | | | | | | | | | | | | | |
For footnotes, see page 174.
Past due but not impaired gross financial instruments
(Audited)
Examples of exposures past due but not impaired include overdue loans fully secured by cash collateral; mortgages that are individually assessed for impairment, and that are in arrears more than
90 days, but where the value of collateral is sufficient to repay both the principal debt and all potential interest for at least one year; and short-term trade facilities past due more than 90 days for technical reasons such as delays in documentation, but where there is no concern over the creditworthiness of the counterparty.
Past due but not impaired loans and advances to customers and banks by geographical region
(Audited)
| | | | | | | | | | | | | | | | | | | | | | | | | | | | | |
| | | | | | | | | | | Rest of | | | | | | | | | | | | | |
| | | | | | | Hong | | | Asia- | | | Middle | | | North | | | Latin | | | | |
| | | Europe | | | Kong | | | Pacific | | | East | | | America | | | America | | | Total | |
| | | US$m | | | US$m | | | US$m | | | US$m | | | US$m | | | US$m | | | US$m | |
| | | | | | | | | | | | | | | | | | | | | | | | | | | | | |
At 31 December 2010 | | | 2,518 | | | | 1,158 | | | | 2,092 | | | | 1,351 | | | | 20,227 | | | | 2,974 | | | | 30,320 | |
| At 31 December 2009 | | | 3,759 | | | | 1,165 | | | | 1,996 | | | | 1,661 | | | | 27,989 | | | | 3,508 | | | | 40,078 | |
117
Report of the Directors: Operating and Financial Review(continued)
Past due but not impaired loans and advances to customers and banks by industry sector
| | | | | | | | | |
| | | At 31 December | |
| | | 2010 | | | 2009 | |
| | | US$m | | | US$m | |
| | | | | | | | | |
| Banks | | | 108 | | | | 12 | |
| | | | | | | | | |
| Customers | | | 30,212 | | | | 40,066 | |
| | | | | |
| Personal | | | 24,824 | | | | 34,306 | |
| Corporate and commercial | | | 5,292 | | | | 5,522 | |
| Financial | | | 96 | | | | 238 | |
| | | | | |
| | | | | | | | | |
| | | | | |
| | | | | | | | | |
| | | | 30,320 | | | | 40,078 | |
| | | | | |
Ageing analysis of days past due but not impaired gross financial instruments
| | | | | | | | | | | | | | | | | | | | | | | | | |
| | | Up to 29 | | | 30-59 | | | 60-89 | | | 90-179 | | | 180 days | | | | |
| | | days | | | days | | | days | | | days | | | and over | | | Total | |
| | | US$m | | | US$m | | | US$m | | | US$m | | | US$m | | | US$m | |
| At 31 December 2010 | | | | | | | | | | | | | | | | | | | | | | | | |
| Loans and advances held at amortised cost | | | 19,481 | | | | 6,915 | | | | 3,281 | | | | 482 | | | | 161 | | | | 30,320 | |
| | | | | | | | | | | | | |
| – loans and advances to banks | | | 108 | | | | – | | | | – | | | | – | | | | – | | | | 108 | |
| – loans and advances to customers | | | 19,373 | | | | 6,915 | | | | 3,281 | | | | 482 | | | | 161 | | | | 30,212 | |
| | | | | | | | | | | | | |
| | | | | | | | | | | | | | | | | | | | | | | | | |
| Financial investments | | | | | | | | | | | | | | | | | | | | | | | | |
| – debt securities | | | 16 | | | | – | | | | – | | | | – | | | | – | | | | 16 | |
| | | | | | | | | | | | | | | | | | | | | | | | | |
| Other assets | | | 262 | | | | 123 | | | | 57 | | | | 26 | | | | 45 | | | | 513 | |
| | | | | | | | | | | | | |
| – endorsements and acceptances | | | 7 | | | | – | | | | – | | | | 1 | | | | 1 | | | | 9 | |
| – other | | | 255 | | | | 123 | | | | 57 | | | | 25 | | | | 44 | | | | 504 | |
| | | | | | | | | | | | | |
| | | | | | | | | | | | | | | | | | | | | | | | | |
| | | | | | | | | | | | | |
| | | | | | | | | | | | | | | | | | | | | | | | | |
| | | | 19,759 | | | | 7,038 | | | | 3,338 | | | | 508 | | | | 206 | | | | 30,849 | |
| | | | | | | | | | | | | |
| | | | | | | | | | | | | | | | | | | | | | | | | |
| At 31 December 2009 | | | | | | | | | | | | | | | | | | | | | | | | |
| Loans and advances held at amortised cost | | | 24,330 | | | | 9,920 | | | | 5,259 | | | | 355 | | | | 214 | | | | 40,078 | |
| | | | | | | | | | | | | |
| – loans and advances to banks | | | 12 | | | | – | | | | – | | | | – | | | | – | | | | 12 | |
| – loans and advances to customers | | | 24,318 | | | | 9,920 | | | | 5,259 | | | | 355 | | | | 214 | | | | 40,066 | |
| | | | | | | | | | | | | |
| | | | | | | | | | | | | | | | | | | | | | | | | |
| Financial investments | | | | | | | | | | | | | | | | | | | | | | | | |
| – debt securities | | | – | | | | – | | | | – | | | | – | | | | – | | | | – | |
| | | | | | | | | | | | | | | | | | | | | | | | | |
| Other assets | | | 609 | | | | 130 | | | | 63 | | | | 24 | | | | 82 | | | | 908 | |
| | | | | | | | | | | | | |
| – endorsements and acceptances | | | 9 | | | | 1 | | | | – | | | | 1 | | | | 1 | | | | 12 | |
| – other | | | 600 | | | | 129 | | | | 63 | | | | 23 | | | | 81 | | | | 896 | |
| | | | | | | | | | | | | |
| | | | | | | | | | | | | | | | | | | | | | | | | |
| | | | | | | | | | | | | |
| | | | | | | | | | | | | | | | | | | | | | | | | |
| | | | 24,939 | | | | 10,050 | | | | 5,322 | | | | 379 | | | | 296 | | | | 40,986 | |
| | | | | | | | | | | | | |
Impaired loans and advances
Impaired loans and advances to customers and banks by industry sector
(Audited)
| | | | | | | | | | | | | | | | | | | | | | | | | |
| | | Impaired loans and advances at | | Impaired loans and advances at | |
| | | 31 December 2010 | | 31 December 2009 | |
| | | Individually | | | Collectively | | | | | | | Individually | | | Collectively | | | | |
| | | assessed | | | assessed | | | Total | | | assessed | | | assessed | | | Total | |
| | | US$m | | | US$m | | | US$m | | | US$m | | | US$m | | | US$m | |
| | | | | | | | | | | | | | | | | | | | | | | | | |
| Banks | | | 193 | | | | – | | | | 193 | | | | 239 | | | | – | | | | 239 | |
| | | | | | | | | | | | | | | | | | | | | | | | | |
| Customers | | | 15,201 | | | | 12,890 | | | | 28,091 | | | | 14,767 | | | | 15,839 | | | | 30,606 | |
| | | | | | | | | | | | | |
| Personal | | | 2,121 | | | | 12,592 | | | | 14,713 | | | | 1,977 | | | | 15,451 | | | | 17,428 | |
| Corporate and commercial | | | 11,964 | | | | 298 | | | | 12,262 | | | | 11,839 | | | | 387 | | | | 12,226 | |
| Financial | | | 1,116 | | | | – | | | | 1,116 | | | | 951 | | | | 1 | | | | 952 | |
| | | | | | | | | | | | | |
| | | | | | | | | | | | | | | | | | | | | | | | | |
| | | | | | | | | | | | | |
| | | | | | | | | | | | | | | | | | | | | | | | | |
| | | | 15,394 | | | | 12,890 | | | | 28,284 | | | | 15,006 | | | | 15,839 | | | | 30,845 | |
| | | | | | | | | | | | | |
118
Report of the Directors: Operating and Financial Review(continued)
Impairment allowances on loans and advances to customers and banks
(Audited)
The tables below analyse by geographical region the impairment allowances recognised for impaired
loans and advances that are either individually assessed or collectively assessed, and collective impairment allowances on loans and advances classified as not impaired.
Impairment allowances on loans and advances to customers by geographical region
(Audited)
| | | | | | | | | | | | | | | | | | | | | | | | | | | | | |
| | | | | | | | | | | Rest of | | | | | | | | | | | | | |
| | | | | | | Hong | | | Asia- | | | Middle | | | North | | | Latin | | | | |
| | | Europe | | | Kong | | | Pacific | | | East | | | America | | | America | | | Total | |
| | | US$m | | | US$m | | | US$m | | | US$m | | | US$m | | | US$m | | | US$m | |
At 31 December 2010
Gross loans and advances | | | | | | | | | | | | | | | | | | | | | | | | | | | | |
Individually assessed impaired loans30 | | | 8,831 | | | | 637 | | | | 1,185 | | | | 2,137 | | | | 1,632 | | | | 779 | | | | 15,201 | |
| | | | | | | | | | | | | | | | | | | | | | | | | | | | | |
Collectively assessed31 | | | 432,631 | | | | 140,683 | | | | 108,505 | | | | 24,141 | | | | 198,070 | | | | 59,218 | | | | 963,248 | |
| | | | | | | | | | | | | | | |
Impaired loans30 | | | 1,726 | | | | 23 | | | | 139 | | | | 296 | | | | 9,095 | | | | 1,611 | | | | 12,890 | |
Non-impaired loans32 | | | 430,905 | | | | 140,660 | | | | 108,366 | | | | 23,845 | | | | 188,975 | | | | 57,607 | | | | 950,358 | |
| | | | | | | | | | | | | | | |
| | | | | | | | | | | | | | | | | | | | | | | | | | | | | |
| | | | | | | | | | | | | | | |
| | | | | | | | | | | | | | | | | | | | | | | | | | | | | |
| Total gross loans and advances | | | 441,462 | | | | 141,320 | | | | 109,690 | | | | 26,278 | | | | 199,702 | | | | 59,997 | | | | 978,449 | |
| | | | | | | | | | | | | | | |
| | | | | | | | | | | | | | | | | | | | | | | | | | | | | |
Impairment allowances | | | | | | | | | | | | | | | | | | | | | | | | | | | | |
| Individually assessed | | | 3,563 | | | | 345 | | | | 629 | | | | 1,163 | | | | 390 | | | | 367 | | | | 6,457 | |
| Collectively assessed | | | 2,100 | | | | 284 | | | | 330 | | | | 489 | | | | 8,780 | | | | 1,643 | | | | 13,626 | |
| | | | | | | | | | | | | | | |
| | | | | | | | | | | | | | | | | | | | | | | | | | | | | |
| Total impairment allowances | | | 5,663 | | | | 629 | | | | 959 | | | | 1,652 | | | | 9,170 | | | | 2,010 | | | | 20,083 | |
| | | | | | | | | | | | | | | |
| | | | | | | | | | | | | | | | | | | | | | | | | | | | | |
| Net loans and advances | | | 435,799 | | | | 140,691 | | | | 108,731 | | | | 24,626 | | | | 190,532 | | | | 57,987 | | | | 958,366 | |
| | | | | | | | | | | | | | | | | | | | | | | | | | | | | |
| | | | % | | | | % | | | | % | | | | % | | | | % | | | | % | | | | % | |
| Individually assessed allowances as a percentage of individually assessed loans and advances | | | 40.3 | | | | 54.2 | | | | 53.1 | | | | 54.4 | | | | 23.9 | | | | 47.1 | | | | 42.5 | |
| Collectively assessed allowances as a percentage of collectively assessed loans and advances | | | 0.5 | | | | 0.2 | | | | 0.3 | | | | 2.0 | | | | 4.4 | | | | 2.8 | | | | 1.4 | |
| Total allowances as a percentage of total gross loans and advances | | | 1.3 | | | | 0.4 | | | | 0.9 | | | | 6.3 | | | | 4.6 | | | | 3.4 | | | | 2.1 | |
| |
| | | US$m | | | US$m | | | US$m | | | US$m | | | US$m | | | US$m | | | US$m | |
| At 31 December 2009 | | | | | | | | | | | | | | | | | | | | | | | | | | | | |
| Gross loans and advances | | | | | | | | | | | | | | | | | | | | | | | | | | | | |
Individually assessed impaired loans30 | | | 8,800 | | | | 823 | | | | 1,006 | | | | 1,310 | | | | 1,990 | | | | 838 | | | | 14,767 | |
| | | | | | | | | | | | | | | | | | | | | | | | | | | | | |
Collectively assessed31 | | | 436,816 | | | | 99,362 | | | | 80,033 | | | | 22,912 | | | | 218,539 | | | | 49,344 | | | | 907,006 | |
| | | | | | | | | | | | | | | |
Impaired loans30 | | | 1,922 | | | | 18 | | | | 194 | | | | 336 | | | | 11,256 | | | | 2,113 | | | | 15,839 | |
Non-impaired loans32 | | | 434,894 | | | | 99,344 | | | | 79,839 | | | | 22,576 | | | | 207,283 | | | | 47,231 | | | | 891,167 | |
| | | | | | | | | | | | | | | |
| | | | | | | | | | | | | | | | | | | | | | | | | | | | | |
| | | | | | | | | | | | | | | |
| | | | | | | | | | | | | | | | | | | | | | | | | | | | | |
| Total gross loans and advances | | | 445,616 | | | | 100,185 | | | | 81,039 | | | | 24,222 | | | | 220,529 | | | | 50,182 | | | | 921,773 | |
| | | | | | | | | | | | | | | |
| | | | | | | | | | | | | | | | | | | | | | | | | | | | | |
| Impairment allowances | | | | | | | | | | | | | | | | | | | | | | | | | | | | |
| Individually assessed | | | 3,742 | | | | 490 | | | | 508 | | | | 688 | | | | 650 | | | | 416 | | | | 6,494 | |
| Collectively assessed | | | 2,393 | | | | 314 | | | | 488 | | | | 690 | | | | 13,026 | | | | 2,137 | | | | 19,048 | |
| | | | | | | | | | | | | | | |
| | | | | | | | | | | | | | | | | | | | | | | | | | | | | |
| Total impairment allowances | | | 6,135 | | | | 804 | | | | 996 | | | | 1,378 | | | | 13,676 | | | | 2,553 | | | | 25,542 | |
| | | | | | | | | | | | | | | |
| | | | | | | | | | | | | | | | | | | | | | | | | | | | | |
| Net loans and advances | | | 439,481 | | | | 99,381 | | | | 80,043 | | | | 22,844 | | | | 206,853 | | | | 47,629 | | | | 896,231 | |
| | | | | | | | | | | | | | | | | | | | | | | | | | | | | |
| | | | % | | | | % | | | | % | | | | % | | | | % | | | | % | | | | % | |
| Individually assessed allowances as a percentage of individually assessed loans and advances | | | 42.5 | | | | 59.5 | | | | 50.5 | | | | 52.5 | | | | 32.7 | | | | 49.7 | | | | 44.0 | |
| Collectively assessed allowances as a percentage of collectively assessed loans and advances | | | 0.5 | | | | 0.3 | | | | 0.6 | | | | 3.0 | | | | 6.0 | | | | 4.3 | | | | 2.1 | |
| Total allowances as a percentage of total gross loans and advances | | | 1.4 | | | | 0.8 | | | | 1.2 | | | | 5.7 | | | | 6.2 | | | | 5.1 | | | | 2.8 | |
For footnotes, see page 174.
119
Report of the Directors: Operating and Financial Review(continued)
Movement in impairment allowances on loans and advances to customers and banks
(Audited)
| | | | | | | | | | | | | | | | | |
| | | Banks | | | Customers | | | | |
| | | Individually | | | Individually | | | Collectively | | | | |
| | | assessed | 8 | | assessed | | | assessed | | | Total | |
| | | US$m | | | US$m | | | US$m | | | US$m | |
2010 | | | | | | | | | | | | | | | | |
| At 1 January | | | 107 | | | | 6,494 | | | | 19,048 | | | | 25,649 | |
| Amounts written off | | | (9 | ) | | | (2,441 | ) | | | (16,850 | ) | | | (19,300 | ) |
| Recoveries of loans and advances written off in previous years | | | 2 | | | | 143 | | | | 875 | | | | 1,020 | |
| Charge to income statement | | | 12 | | | | 2,613 | | | | 10,923 | | | | 13,548 | |
| Exchange and other movements | | | 46 | | | | (352 | ) | | | (370 | ) | | | (676 | ) |
| | | | | | | | | |
| | | | | | | | | | | | | | | | | |
| At 31 December | | | 158 | | | | 6,457 | | | | 13,626 | | | | 20,241 | |
| | | | | | | | | |
| | | | | | | | | | | | | | | | | |
| Customers | | | | | | | | | | | | | | | | |
| | | | | | | | | | | |
| Personal | | | | | | | 615 | | | | 11,678 | | | | 12,293 | |
| Corporate and commercial | | | | | | | 5,274 | | | | 1,863 | | | | 7,137 | |
| Financial | | | | | | | 568 | | | | 85 | | | | 653 | |
| | | | | | | | | | | |
| | | | | | | | | | | | | | | | | |
| | | | % | | | | % | | | | % | | | | % | |
| | | | | | | | | | | | | | | | | |
Impairment allowances as a percentage of loans and advances33,34 | | | 0.11 | | | | 0.70 | | | | 1.49 | | | | 1.91 | |
| | | | | | | | | | | | | | | | | |
| | | US$m | | | US$m | | | US$m | | | US$m | |
| 2009 | | | | | | | | | | | | | | | | |
| At 1 January | | | 63 | | | | 3,284 | | | | 20,625 | | | | 23,972 | |
| Amounts written off | | | (35 | ) | | | (1,563 | ) | | | (23,242 | ) | | | (24,840 | ) |
| Recoveries of loans and advances written off in previous years | | | 6 | | | | 128 | | | | 756 | | | | 890 | |
| Charge to income statement | | | 70 | | | | 4,388 | | | | 20,484 | | | | 24,942 | |
| Exchange and other movements | | | 3 | | | | 257 | | | | 425 | | | | 685 | |
| | | | | | | | | |
| | | | | | | | | | | | | | | | | |
| At 31 December | | | 107 | | | | 6,494 | | | | 19,048 | | | | 25,649 | |
| | | | | | | | | |
| | | | | | | | | | | | | | | | | |
| Customers | | | | | | | | | | | | | | | | |
| | | | | | | | | | | |
| Personal | | | | | | | 572 | | | | 16,517 | | | | 17,089 | |
| Corporate and commercial | | | | | | | 5,528 | | | | 2,354 | | | | 7,882 | |
| Financial | | | | | | | 394 | | | | 177 | | | | 571 | |
| | | | | | | | | | | |
| | | | | | | | | | | | | | | | | |
| | | | % | | | | % | | | | % | | | | % | |
| | | | | | | | | | | | | | | | | |
Impairment allowances as a percentage of loans and advances33,34 | | | 0.09 | | | | 0.75 | | | | 2.21 | | | | 2.63 | |
For footnotes, see page 174.
120
Report of the Directors: Operating and Financial Review(continued)
Movement in impairment allowances by industry sector
(Audited)
| | | | | | | | | | | | | | | | | | | | | |
| | | 2010 | | | 2009 | | | 2008 | | | 2007 | | | 2006 | |
| | | US$m | | | US$m | | | US$m | | | US$m | | | US$m | |
| | | | | | | | | | | | | | | | | | | | | |
| Impairment allowances at 1 January | | | 25,649 | | | | 23,972 | | | | 19,212 | | | | 13,585 | | | | 11,366 | |
| | | | | | | | | | | | | | | | | | | | | |
| Amounts written off | | | (19,300 | ) | | | (24,840 | ) | | | (17,955 | ) | | | (12,844 | ) | | | (9,473 | ) |
Personal2 | | | (16,458 | ) | | | (22,703 | ) | | | (16,625 | ) | | | (11,670 | ) | | | (8,281 | ) |
| | | | | | | | | | | |
– residential mortgages2 | | | (4,163) | | | | (4,704) | | | | (2,110) | | | | (930) | | | | (628) | |
– other personal2 | | | (12,295) | | | | (17,999) | | | | (14,515) | | | | (10,740) | | | | (7,653) | |
| | | | | | | | | | | |
| | | | | | | | | | | | | | | | | | | | | |
| Corporate and commercial | | | (2,789 | ) | | | (1,984 | ) | | | (1,294 | ) | | | (1,163 | ) | | | (1,153 | ) |
| | | | | | | | | | | |
| – commercial, industrial and international trade | | | (1,050) | | | | (1,093 | ) | | | (789 | ) | | | (897) | | | | (782) | |
| – commercial real estate and other property-related | | | (1,280) | | | | (327 | ) | | | (115 | ) | | | (98) | | | | (111) | |
| – other commercial | | | (459) | | | | (564 | ) | | | (390) | | | | (168) | | | | (260) | |
| | | | | | | | | | | |
| | | | | | | | | | | | | | | | | | | | | |
Financial35 | | | (53 | ) | | | (153 | ) | | | (36 | ) | | | (11 | ) | | | (39 | ) |
| | | | | | | | | | | | | | | | | | | | | |
| Recoveries of amounts written off in previous years | | | 1,020 | | | | 890 | | | | 834 | | | | 1,005 | | | | 779 | |
| Personal | | | 846 | | | | 712 | | | | 686 | | | | 837 | | | | 605 | |
| | | | | | | | | | | |
| – residential mortgages | | | 93 | | | | 61 | | | | 19 | | | | 19 | | | | 19 | |
| – other personal | | | 753 | | | | 651 | | | | 667 | | | | 818 | | | | 586 | |
| | | | | | | | | | | |
| | | | | | | | | | | | | | | | | | | | | |
| Corporate and commercial | | | 156 | | | | 170 | | | | 142 | | | | 157 | | | | 163 | |
| | | | | | | | | | | |
| – commercial, industrial and international trade | | | 92 | | | | 123 | | | | 76 | | | | 74 | | | | 88 | |
| – commercial real estate and other property-related | | | 21 | | | | 9 | | | | 6 | | | | 29 | | | | 21 | |
| – other commercial | | | 43 | | | | 38 | | | | 60 | | | | 54 | | | | 54 | |
| | | | | | | | | | | |
| | | | | | | | | | | | | | | | | | | | | |
Financial35 | | | 18 | | | | 8 | | | | 6 | | | | 11 | | | | 11 | �� |
| | | | | | | | | | | | | | | | | | | | | |
Charge to income statement36 | | | 13,548 | | | | 24,942 | | | | 24,131 | | | | 17,177 | | | | 10,547 | |
| Personal | | | 11,187 | | | | 19,781 | | | | 20,950 | | | | 15,968 | | | | 9,929 | |
| | | | | | | | | | | |
| – residential mortgages | | | 3,461 | | | | 4,185 | | | | 5,000 | | | | 1,840 | | | | 1,096 | |
| – other personal | | | 7,726 | | | | 15,596 | | | | 15,950 | | | | 14,128 | | | | 8,833 | |
| | | | | | | | | | | |
| | | | | | | | | | | | | | | | | | | | | |
| Corporate and commercial | | | 2,198 | | | | 4,711 | | | | 2,879 | | | | 1,176 | | | | 664 | |
| | | | | | | | | | | |
| – commercial, industrial and international trade | | | 909 | | | | 2,392 | | | | 1,573 | | | | 897 | | | | 503 | |
| – commercial real estate and other property-related | | | 660 | | | | 1,492 | | | | 755 | | | | 152 | | | | 75 | |
| – other commercial | | | 629 | | | | 827 | | | | 551 | | | | 127 | | | | 86 | |
| | | | | | | | | | | |
| | | | | | | | | | | | | | | | | | | | | |
Financial35 | | | 163 | | | | 450 | | | | 302 | | | | 36 | | | | (9 | ) |
| Governments | | | – | | | | – | | | | – | | | | (3 | ) | | | (37 | ) |
| | | | | | | | | | | | | | | | | | | | | |
| Exchange and other movements | | | (676 | ) | | | 685 | | | | (2,250 | ) | | | 289 | | | | 366 | |
| | | | | | | | | | | |
| | | | | | | | | | | | | | | | | | | | | |
At 31 December2 | | | 20,241 | | | | 25,649 | | | | 23,972 | | | | 19,212 | | | | 13,585 | |
| | | | | | | | | | | |
| | | | | | | | | | | | | | | | | | | | | |
| Impairment allowances against banks: | | | | | | | | | | | | | | | | | | | | |
| – individually assessed | | | 158 | | | | 107 | | | | 63 | | | | 7 | | | | 7 | |
| Impairment allowances against customers: | | | | | | | | | | | | | | | | | | | | |
| – individually assessed | | | 6,457 | | | | 6,494 | | | | 3,284 | | | | 2,699 | | | | 2,565 | |
– collectively assessed2 | | | 13,626 | | | | 19,048 | | | | 20,625 | | | | 16,506 | | | | 11,013 | |
| | | | | | | | | | | |
| | | | | | | | | | | | | | | | | | | | | |
At 31 December2 | | | 20,241 | | | | 25,649 | | | | 23,972 | | | | 19,212 | | | | 13,585 | |
| | | | | | | | | | | |
| | | | | | | | | | | | | | | | | | | | | |
| | | | % | | | | % | | | | % | | | | % | | | | % | |
| Impairment allowances against customers as a percentage of loans and advances to customers: | | | | | | | | | | | | | | | | | | | | |
| – individually assessed | | | 0.66 | | | | 0.70 | | | | 0.34 | | | | 0.27 | | | | 0.29 | |
| – collectively assessed | | | 1.39 | | | | 2.07 | | | | 2.16 | | | | 1.65 | | | | 1.25 | |
| | | | | | | | | | | |
| At 31 December | | | 2.05 | | | | 2.77 | | | | 2.50 | | | | 1.92 | | | | 1.54 | |
| | | | | | | | | | | |
For footnotes, see page 174.
121
Report of the Directors: Operating and Financial Review(continued)
Movement in impairment allowances by industry sector and by geographical region
| | | | | | | | | | | | | | | | | | | | | | | | | | | | | |
| | | 2010 |
| | | | | | | | | | | Rest of | | | | | | | | | | | | | |
| | | | | | | Hong | | | Asia- | | | Middle | | | North | | | Latin | | | | |
| | | Europe | | | Kong | | | Pacific | | | East | | | America | | | America | | | Total | |
| | | US$m | | | US$m | | | US$m | | | US$m | | | US$m | | | US$m | | | US$m | |
| | | | | | | | | | | | | | | | | | | | | | | | | | | | | |
| Impairment allowances at 1 January | | | 6,227 | | | | 804 | | | | 996 | | | | 1,393 | | | | 13,676 | | | | 2,553 | | | | 25,649 | |
| | | | | | | | | | | | | | | | | | | | | | | | | | | | | |
| Amounts written off | | | (3,001 | ) | | | (265 | ) | | | (678 | ) | | | (386 | ) | | | (12,601 | ) | | | (2,369 | ) | | | (19,300 | ) |
| Personal | | | (1,447 | ) | | | (150 | ) | | | (561 | ) | | | (375 | ) | | | (12,070 | ) | | | (1,855 | ) | | | (16,458 | ) |
| | | | | | | | | | | | | | | |
| – residential mortgages | | | (49) | | | | (1) | | | | (10) | | | | – | | | | (4,027) | | | | (76) | | | | (4,163) | |
| – other personal | | | (1,398) | | | | (149) | | | | (551) | | | | (375) | | | | (8,043) | | | | (1,779) | | | | (12,295) | |
| | | | | | | | | | | | | | | |
| | | | | | | | | | | | | | | | | | | | | | | | | | | | | |
| Corporate and commercial | | | (1,539 | ) | | | (109 | ) | | | (110 | ) | | | (11 | ) | | | (507 | ) | | | (513 | ) | | | (2,789 | ) |
| | | | | | | | | | | | | | | |
| – commercial, industrial and international trade | | | (385) | | | | (90) | | | | (46) | | | | (10) | | | | (174) | | | | (345) | | | | (1,050) | |
| – commercial real estate and other property-related | | | (1,022) | | | | (18) | | | | (18) | | | | – | | | | (194) | | | | (28) | | | | (1,280) | |
| – other commercial | | | (132) | | | | (1) | | | | (46) | | | | (1) | | | | (139) | | | | (140) | | | | (459) | |
| | | | | | | | | | | | | | | |
| | | | | | | | | | | | | | | | | | | | | | | | | | | | | |
Financial35 | | | (15 | ) | | | (6 | ) | | | (7 | ) | | | – | | | | (24 | ) | | | (1 | ) | | | (53 | ) |
| | | | | | | | | | | | | | | | | | | | | | | | | | | | | |
| Recoveries of amounts written off in previous years | | | 287 | | | | 39 | | | | 188 | | | | 57 | | | | 182 | | | | 267 | | | | 1,020 | |
| Personal | | | 251 | | | | 32 | | | | 168 | | | | 53 | | | | 134 | | | | 208 | | | | 846 | |
| | | | | | | | | | | | | | | |
| – residential mortgages | | | 29 | | | | 4 | | | | 3 | | | | – | | | | 30 | | | | 27 | | | | 93 | |
| – other personal | | | 222 | | | | 28 | | | | 165 | | | | 53 | | | | 104 | | | | 181 | | | | 753 | |
| | | | | | | | | | | | | | | |
| | | | | | | | | | | | | | | | | | | | | | | | | | | | | |
| Corporate and commercial | | | 33 | | | | 7 | | | | 7 | | | | 4 | | | | 46 | | | | 59 | | | | 156 | |
| | | | | | | | | | | | | | | |
| – commercial, industrial and international trade | | | 16 | | | | 7 | | | | 5 | | | | 2 | | | | 19 | | | | 43 | | | | 92 | |
| – commercial real estate and other property-related | | | 6 | | | | – | | | | – | | | | – | | | | 11 | | | | 4 | | | | 21 | |
| – other commercial | | | 11 | | | | – | | | | 2 | | | | 2 | | | | 16 | | | | 12 | | | | 43 | |
| | | | | | | | | | | | | | | |
| | | | | | | | | | | | | | | | | | | | | | | | | | | | | |
Financial35 | | | 3 | | | | – | | | | 13 | | | | – | | | | 2 | | | | – | | | | 18 | |
| | | | | | | | | | | | | | | | | | | | | | | | | | | | | |
Charge to income statement36 | | | 2,532 | | | | 137 | | | | 428 | | | | 623 | | | | 8,304 | | | | 1,524 | | | | 13,548 | |
| Personal | | | 1,263 | | | | 78 | | | | 297 | | | | 226 | | | | 8,138 | | | | 1,185 | | | | 11,187 | |
| | | | | | | | | | | | | | | |
| – residential mortgages | | | 153 | | | | (17) | | | | 11 | | | | 46 | | | | 3,189 | | | | 79 | | | | 3,461 | |
| – other personal | | | 1,110 | | | | 95 | | | | 286 | | | | 180 | | | | 4,949 | | | | 1,106 | | | | 7,726 | |
| | | | | | | | | | | | | | | |
| | | | | | | | | | | | | | | | | | | | | | | | | | | | | |
| Corporate and commercial | | | 1,080 | | | | 72 | | | | 146 | | �� | | 304 | | | | 269 | | | | 327 | | | | 2,198 | |
| | | | | | | | | | | | | | | |
| – commercial, industrial and international trade | | | 395 | | | | 21 | | | | 100 | | | | 165 | | | | 25 | | | | 203 | | | | 909 | |
| – commercial real estate and other property-related | | | 360 | | | | (7) | | | | 12 | | | | 117 | | | | 178 | | | | – | | | | 660 | |
| – other commercial | | | 325 | | | | 58 | | | | 34 | | | | 22 | | | | 66 | | | | 124 | | | | 629 | |
| | | | | | | | | | | | | | | |
| | | | | | | | | | | | | | | | | | | | | | | | | | | | | |
Financial35 | | | 189 | | | | (13 | ) | | | (15 | ) | | | 93 | | | | (103 | ) | | | 12 | | | | 163 | |
| | | | | | | | | | | | | | | | | | | | | | | | | | | | | |
| Exchange and other movements | | | (305 | ) | | | (86 | ) | | | 25 | | | | (18 | ) | | | (327 | ) | | | 35 | | | | (676 | ) |
| | | | | | | | | | | | | | | |
| | | | | | | | | | | | | | | | | | | | | | | | | | | | | |
At 31 December | | | 5,740 | | | | 629 | | | | 959 | | | | 1,669 | | | | 9,234 | | | | 2,010 | | | | 20,241 | |
| | | | | | | | | | | | | | | |
| | | | | | | | | | | | | | | | | | | | | | | | | | | | | |
| Impairment allowances against banks: | | | | | | | | | | | | | | | | | | | | | | | | | | | | |
| – individually assessed | | | 77 | | | | – | | | | – | | | | 17 | | | | 64 | | | | – | | | | 158 | |
| Impairment allowances against customers: | | | | | | | | | | | | | | | | | | | | | | | | | | | | |
| – individually assessed | | | 3,563 | | | | 345 | | | | 629 | | | | 1,163 | | | | 390 | | | | 367 | | | | 6,457 | |
– collectively assessed37 | | | 2,100 | | | | 284 | | | | 330 | | | | 489 | | | | 8,780 | | | | 1,643 | | | | 13,626 | |
| | | | | | | | | | | | | | | |
| | | | | | | | | | | | | | | | | | | | | | | | | | | | | |
| At 31 December | | | 5,740 | | | | 629 | | | | 959 | | | | 1,669 | | | | 9,234 | | | | 2,010 | | | | 20,241 | |
| | | | | | | | | | | | | | | |
| | | | | | | | | | | | | | | | | | | | | | | | | | | | | |
| | | | % | | | | % | | | | % | | | | % | | | | % | | | | % | | | | % | |
| Impairment allowances against customers as a percentage of loans and advances to customers: | | | | | | | | | | | | | | | | | | | | | | | | | | | | |
| – individually assessed | | | 0.81 | | | | 0.24 | | | | 0.57 | | | | 4.43 | | | | 0.20 | | | | 0.61 | | | | 0.66 | |
– collectively assessed37 | | | 0.48 | | | | 0.20 | | | | 0.30 | | | | 1.86 | | | | 4.40 | | | | 2.74 | | | | 1.39 | |
| | | | | | | | | | | | | | | |
| | | | | | | | | | | | | | | | | | | | | | | | | | | | | |
| At 31 December | | | 1.29 | | | | 0.44 | | | | 0.87 | | | | 6.29 | | | | 4.60 | | | | 3.35 | | | | 2.05 | |
| | | | | | | | | | | | | | | |
122
Report of the Directors: Operating and Financial Review(continued)
| | | | | | | | | | | | | | | | | | | | | | | | | | | | | |
| | | 2009 | |
| | | | | | | | | | | Rest of | | | | | | | | | | | | | |
| | | | | | | Hong | | | Asia- | | | Middle | | | North | | | Latin | | | | |
| | | Europe | | | Kong | | | Pacific | | | East | | | America | | | America | | | Total | |
| | | US$m | | | US$m | | | US$m | | | US$m | | | US$m | | | US$m | | | US$m | |
| | | | | | | | | | | | | | | | | | | | | | | | | | | | | |
| Impairment allowances at 1 January | | | 3,922 | | | | 733 | | | | 813 | | | | 414 | | | | 16,090 | | | | 2,000 | | | | 23,972 | |
| | | | | | | | | | | | | | | | | | | | | | | | | | | | | |
| Amounts written off | | | (2,781 | ) | | | (357 | ) | | | (850 | ) | | | (384 | ) | | | (17,792 | ) | | | (2,676 | ) | | | (24,840 | ) |
| Personal | | | (1,876 | ) | | | (240 | ) | | | (787 | ) | | | (376 | ) | | | (17,204 | ) | | | (2,220 | ) | | | (22,703 | ) |
| | | | | | | | | | | | | | | |
| – residential mortgages | | | (41 | ) | | | (1) | | | | (9) | | | | – | | | | (4,610) | | | | (43) | | | | (4,704) | |
| – other personal | | | (1,835) | | | | (239 | ) | | | (778) | | | | (376) | | | | (12,594) | | | | (2,177) | | | | (17,999) | |
| | | | | | | | | | | | | | | |
| | | | | | | | | | | | | | | | | | | | | | | | | | | | | |
| Corporate and commercial | | | (810 | ) | | | (117 | ) | | | (63 | ) | | | (8 | ) | | | (534 | ) | | | (452 | ) | | | (1,984 | ) |
| | | | | | | | | | | | | | | |
| – commercial, industrial and international trade | | | (438) | | | | (114) | | | | (50) | | | | (8) | | | | (228) | | | | (255) | | | | (1,093) | |
| – commercial real estate and other property-related | | | (148) | | | | (1) | | | | (3) | | | | – | | | | (163) | | | | (12) | | | | (327) | |
| – other commercial | | | (224) | | | | (2) | | | | (10) | | | | – | | | | (143) | | | | (185) | | | | (564) | |
| | | | | | | | | | | | | | | |
| | | | | | | | | | | | | | | | | | | | | | | | | | | | | |
Financial35 | | | (95 | ) | | | – | | | | – | | | | – | | | | (54 | ) | | | (4 | ) | | | (153 | ) |
| | | | | | | | | | | | | | | | | | | | | | | | | | | | | |
| Recoveries of amounts written off in previous years | | | 265 | | | | 34 | | | | 132 | | | | 27 | | | | 93 | | | | 339 | | | | 890 | |
| Personal | | | 200 | | | | 32 | | | | 123 | | | | 25 | | | | 60 | | | | 272 | | | | 712 | |
| | | | | | | | | | | | | | | |
| – residential mortgages | | | 28 | | | | 6 | | | | 1 | | | | – | | | | 7 | | | | 19 | | | | 61 | |
| – other personal | | | 172 | | | | 26 | | | | 122 | | | | 25 | | | | 53 | | | | 253 | | | | 651 | |
| | | | | | | | | | | | | | | |
| | | | | | | | | | | | | | | | | | | | | | | | | | | | | |
| Corporate and commercial | | | 57 | | | | 2 | | | | 9 | | | | 2 | | | | 33 | | | | 67 | | | | 170 | |
| | | | | | | | | | | | | | | |
| – commercial, industrial and international trade | | | 52 | | | | 2 | | | | 7 | | | | 2 | | | | 16 | | | | 44 | | | | 123 | |
| – commercial real estate and other property-related | | | 5 | | | | – | | | | 1 | | | | – | | | | 2 | | | | 1 | | | | 9 | |
| – other commercial | | | – | | | | – | | | | 1 | | | | – | | | | 15 | | | | 22 | | | | 38 | |
| | | | | | | | | | | | | | | |
| | | | | | | | | | | | | | | | | | | | | | | | | | | | | |
Financial35 | | | 8 | | | | – | | | | – | | | | – | | | | – | | | | – | | | | 8 | |
| | | | | | | | | | | | | | | | | | | | | | | | | | | | | |
Charge to income statement36 | | | 4,409 | | | | 450 | | | | 874 | | | | 1,333 | | | | 15,372 | | | | 2,504 | | | | 24,942 | |
| Personal | | | 1,995 | | | | 206 | | | | 654 | | | | 593 | | | | 14,390 | | | | 1,943 | | | | 19,781 | |
| | | | | | | | | | | | | | | |
| – residential mortgages | | | 158 | | | | (16) | | | | 14 | | | | 20 | | | | 3,955 | | | | 54 | | | | 4,185 | |
| – other personal | | | 1,837 | | | | 222 | | | | 640 | | | | 573 | | | | 10,435 | | | | 1,889 | | | | 15,596 | |
| | | | | | | | | | | | | | | |
| | | | | | | | | | | | | | | | | | | | | | | | | | | | | |
| Corporate and commercial | | | 2,163 | | | | 244 | | | | 220 | | | | 706 | | | | 818 | | | | 560 | | | | 4,711 | |
| | | | | | | | | | | | | | | |
| – commercial, industrial and international trade | | | 963 | | | | 164 | | | | 154 | | | | 413 | | | | 309 | | | | 389 | | | | 2,392 | |
| – commercial real estate and other property-related | | | 958 | | | | 70 | | | | 29 | | | | 106 | | | | 288 | | | | 41 | | | | 1,492 | |
| – other commercial | | | 242 | | | | 10 | | | | 37 | | | | 187 | | | | 221 | �� | | | 130 | | | | 827 | |
| | | | | | | | | | | | | | | |
| | | | | | | | | | | | | | | | | | | | | | | | | | | | | |
Financial35 | | | 251 | | | | – | | | | – | | | | 34 | | | | 164 | | | | 1 | | | | 450 | |
| | | | | | | | | | | | | | | | | | | | | | | | | | | | | |
| Exchange and other movements | | | 412 | | | | (56 | ) | | | 27 | | | | 3 | | | | (87 | ) | | | 386 | | | | 685 | |
| | | | | | | | | | | | | | | |
| | | | | | | | | | | | | | | | | | | | | | | | | | | | | |
| At 31 December | | | 6,227 | | | | 804 | | | | 996 | | | | 1,393 | | | | 13,676 | | | | 2,553 | | | | 25,649 | |
| | | | | | | | | | | | | | | |
| | | | | | | | | | | | | | | | | | | | | | | | | | | | | |
| Impairment allowances against banks: | | | | | | | | | | | | | | | | | | | | | | | | | | | | |
| – individually assessed | | | 92 | | | | – | | | | – | | | | 15 | | | | – | | | | – | | | | 107 | |
| Impairment allowances against customers: | | | | | | | | | | | | | | | | | | | | | | | | | | | | |
| – individually assessed | | | 3,742 | | | | 490 | | | | 508 | | | | 688 | | | | 650 | | | | 416 | | | | 6,494 | |
– collectively assessed37 | | | 2,393 | | | | 314 | | | | 488 | | | | 690 | | | | 13,026 | | | | 2,137 | | | | 19,048 | |
| | | | | | | | | | | | | | | |
| | | | | | | | | | | | | | | | | | | | | | | | | | | | | |
| At 31 December | | | 6,227 | | | | 804 | | | | 996 | | | | 1,393 | | | | 13,676 | | | | 2,553 | | | | 25,649 | |
| | | | | | | | | | | | | | | |
| | | | | | | | | | | | | | | | | | | | | | | | | | | | | |
| | | | % | | | | % | | | | % | | | | % | | | | % | | | | % | | | | % | |
| Impairment allowances against customers as a percentage of loans and advances to customers: | | | | | | | | | | | | | | | | | | | | | | | | | | | | |
| – individually assessed | | | 0.84 | | | | 0.49 | | | | 0.63 | | | | 2.84 | | | | 0.29 | | | | 0.83 | | | | 0.70 | |
– collectively assessed37 | | | 0.54 | | | | 0.31 | | | | 0.60 | | | | 2.85 | | | | 5.91 | | | | 4.26 | | | | 2.07 | |
| | | | | | | | | | | | | | | |
| | | | | | | | | | | | | | | | | | | | | | | | | | | | | |
| At 31 December | | | 1.38 | | | | 0.80 | | | | 1.23 | | | | 5.69 | | | | 6.20 | | | | 5.09 | | | | 2.77 | |
| | | | | | | | | | | | | | | |
For footnotes, see page 174.
123
Report of the Directors: Operating and Financial Review(continued)
| Impairment charge to the income statement |
Individually and collectively assessed impairment charge to income statement by industry segment
| | | | | | | | | | | | | | | | | | | | | | | | | |
| | | 2010 | | 2009 |
| | | Individually | | | Collectively | | | | | | | Individually | | | Collectively | | | | |
| | | assessed | | | assessed | | | Total | | | assessed | | | assessed | | | Total | |
| | | US$m | | | US$m | | | US$m | | | US$m | | | US$m | | | US$m | |
| | | | | | | | | | | | | | | | | | | | | | | | | |
| Banks | | | 12 | | | | – | | | | 12 | | | | 70 | | | | – | | | | 70 | |
| Personal | | | 180 | | | | 11,007 | | | | 11,187 | | | | 316 | | | | 19,465 | | | | 19,781 | |
| | | | | | | | | | | | | |
| Residential mortgages | | | 137 | | | | 3,324 | | | | 3,461 | | | | 171 | | | | 4,014 | | | | 4,185 | |
| Other personal | | | 43 | | | | 7,683 | | | | 7,726 | | | | 145 | | | | 15,451 | | | | 15,596 | |
| | | | | | | | | | | | | |
| | | | | | | | | | | | | | | | | | | | | | | | | |
| Corporate and commercial | | | 2,190 | | | | 8 | | | | 2,198 | | | | 3,699 | | | | 1,012 | | | | 4,711 | |
| | | | | | | | | | | | | |
| Commercial, industrial and international trade | | | 997 | | | | (88) | | | | 909 | | | | 1,681 | | | | 711 | | | | 2,392 | |
| Commercial real estate and other property-related | | | 680 | | | | (20) | | | | 660 | | | | 1,330 | | | | 162 | | | | 1,492 | |
| Other commercial | | | 513 | | | | 116 | | | | 629 | | | | 688 | | | | 139 | | | | 827 | |
| | | | | | | | | | | | | |
| | | | | | | | | | | | | | | | | | | | | | | | | |
| Financial | | | 243 | | | | (92 | ) | | | 151 | | | | 373 | | | | 7 | | | | 380 | |
| | | | | | | | | | | | | |
| | | | | | | | | | | | | | | | | | | | | | | | | |
| Total charge to income statement | | | 2,625 | | | | 10,923 | | | | 13,548 | | | | 4,458 | | | | 20,484 | | | | 24,942 | |
| | | | | | | | | | | | | |
Net loan impairment charge to the income statement
| | | | | | | | | | | | | | | | | | | | | |
| | | 2010 | | | 2009 | | | 2008 | | | 2007 | | | 2006 | |
| | | US$m | | | US$m | | | US$m | | | US$m | | | US$m | |
| | | | | | | | | | | | | | | | | | | | | |
| Individually assessed impairment allowances | | | 2,625 | | | | 4,458 | | | | 2,064 | | | | 796 | | | | 458 | |
| | | | | | | | | | | |
| New allowances | | | 3,617 | | | | 5,173 | | | | 2,742 | | | | 1,533 | | | | 1,297 | |
| Release of allowances no longer required | | | (847) | | | | (581) | | | | (565) | | | | (608) | | | | (711) | |
| Recoveries of amounts previously written off | | | (145) | | | | (134) | | | | (113) | | | | (129) | | | | (128) | |
| | | | | | | | | | | |
| | | | | | | | | | | | | | | | | | | | | |
| Collectively assessed impairment allowances | | | 10,923 | | | | 20,484 | | | | 22,067 | | | | 16,381 | | | | 10,089 | |
| | | | | | | | | | | |
| New allowances net of allowance releases | | | 11,798 | | | | 21,240 | | | | 22,788 | | | | 17,257 | | | | 10,740 | |
| Recoveries of amounts previously written off | | | (875) | | | | (756) | | | | (721) | | | | (876) | | | | (651) | |
| | | | | | | | | | | |
| | | | | | | | | | | | | | | | | | | | | |
| | | | | | | | | | | |
| | | | | | | | | | | | | | | | | | | | | |
| Total charge for impairment losses | | | 13,548 | | | | 24,942 | | | | 24,131 | | | | 17,177 | | | | 10,547 | |
| | | | | | | | | | | |
| Banks | | | 12 | | | | 70 | | | | 54 | | | | – | | | | (3) | |
| Customers | | | 13,536 | | | | 24,872 | | | | 24,077 | | | | 17,177 | | | | 10,550 | |
| | | | | | | | | | | |
| | | | | | | | | | | | | | | | | | | | | |
| | | | | | | | | | | |
| | | | | | | | | | | | | | | | | | | | | |
| | | | % | | | | % | | | | % | | | | % | | | | % | |
| Charge for impairment losses as a percentage of closing gross loans and advances | | | 1.14 | | | | 2.26 | | | | 2.17 | | | | 1.39 | | | | 0.99 | |
| | | | | | | | | | | | | | | | | | | | | |
| | | US$m | | | US$m | | | US$m | | | US$m | | | US$m | |
At 31 December | | | | | | | | | | | | | | | | | | | | |
Impaired loans2 | | | 28,284 | | | | 30,845 | | | | 25,422 | | | | 19,594 | | | | 15,086 | |
Impairment allowances2 | | | 20,241 | | | | 25,649 | | | | 23,972 | | | | 19,212 | | | | 13,585 | |
For footnote, see page 174.
124
Report of the Directors: Operating and Financial Review(continued)
Net loan impairment charge to the income statement by geographical region
(Unaudited)
| | | | | | | | | | | | | | | | | | | | | | | | | | | | | |
| | | | | | | | | | | Rest of | | | | | | | | | | | | | |
| | | | | | | Hong | | | Asia- | | | Middle | | | North | | | Latin | | | | |
| | | Europe | | | Kong | | | Pacific | | | East | | | America | | | America | | | Total | |
| | | US$m | | | US$m | | | US$m | | | US$m | | | US$m | | | US$m | | | US$m | |
2010 | | | | | | | | | | | | | | | | | | | | | | | | | | | | |
| Individually assessed impairment allowances | | | 1,445 | | | | 45 | | | | 198 | | | | 502 | | | | 348 | | | | 87 | | | | 2,625 | |
| | | | | | | | | | | | | | | |
| New allowances | | | 1,874 | | | | 111 | | | | 311 | | | | 561 | | | | 580 | | | | 180 | | | | 3,617 | |
| Release of allowances no longer required | | | (394) | | | | (54) | | | | (84) | | | | (55) | | | | (196) | | | | (64) | | | | (847) | |
| Recoveries of amounts previously written off | | | (35) | | | | (12) | | | | (29) | | | | (4) | | | | (36) | | | | (29) | | | | (145) | |
| | | | | | | | | | | | | | | |
| Collectively assessed impairment allowances | | | 1,087 | | | | 92 | | | | 230 | | | | 121 | | | | 7,956 | | | | 1,437 | | | | 10,923 | |
| | | | | | | | | | | | | | | |
| New allowances net of allowance releases | | | 1,339 | | | | 119 | | | | 389 | | | | 174 | | | | 8,102 | | | | 1,675 | | | | 11,798 | |
| Recoveries of amounts previously written off | | | (252) | | | | (27) | | | | (159) | | | | (53) | | | | (146) | | | | (238) | | | | (875) | |
| | | | | | | | | | | | | | | |
| | | | | | | | | | | | | | | |
| | | | | | | | | | | | | | | | | | | | | | | | | | | | | |
| Total charge for impairment losses | | | 2,532 | | | | 137 | | | | 428 | | | | 623 | | | | 8,304 | | | | 1,524 | | | | 13,548 | |
| | | | | | | | | | | | | | | |
| Banks | | | 2 | | | | – | | | | – | | | | 2 | | | | 8 | | | | – | | | | 12 | |
| Customers | | | 2,530 | | | | 137 | | | | 428 | | | | 621 | | | | 8,296 | | | | 1,524 | | | | 13,536 | |
| | | | | | | | | | | | | | | |
| | | | |
| | | | | | | | | | | | | | | |
| | | | | | | | | | | | | | | | | | | | | | | | | | | | | |
| | | | % | | | | % | | | | % | | | | % | | | | % | | | | % | | | | % | |
| Charge for impairment losses as a percentage of closing gross loans and advances | | | 0.49 | | | | 0.08 | | | | 0.29 | | | | 1.75 | | | | 3.79 | | | | 1.74 | | | | 1.14 | |
| | | | | | | | | | | | | | | | | | | | | | | | | | | | | |
| | | US$m | | | US$m | | | US$m | | | US$m | | | US$m | | | US$m | | | US$m | |
At 31 December 2010 | | | | | | | | | | | | | | | | | | | | | | | | | | | | |
| Impaired loans | | | 10,663 | | | | 665 | | | | 1,324 | | | | 2,453 | | | | 10,789 | | | | 2,390 | | | | 28,284 | |
| Impairment allowances | | | 5,740 | | | | 629 | | | | 959 | | | | 1,669 | | | | 9,234 | | | | 2,010 | | | | 20,241 | |
| | | | | | | | | | | | | | | | | | | | | | | | | | | | | |
| 2009 | | | | | | | | | | | | | | | | | | | | | | | | | | | | |
| Individually assessed impairment allowances | | | 2,248 | | | | 242 | | | | 244 | | | | 580 | | | | 916 | | | | 228 | | | | 4,458 | |
| | | | | | | | | | | | | | | |
| New allowances | | | 2,573 | | | | 315 | | | | 341 | | | | 598 | | | | 1,052 | | | | 294 | | | | 5,173 | |
| Release of allowances no longer required | | | (255 | ) | | | (64 | ) | | | (82 | ) | | | (16 | ) | | | (112 | ) | | | (52) | | | | (581 | ) |
| Recoveries of amounts previously written off | | | (70 | ) | | | (9 | ) | | | (15 | ) | | | (2 | ) | | | (24 | ) | | | (14 | ) | | | (134 | ) |
| | | | | | | | | | | | | | | |
| | | | | | | | | | | | | | | | | | | | | | | | | | | | | |
| Collectively assessed impairment allowances | | | 2,161 | | | | 208 | | | | 630 | | | | 753 | | | | 14,456 | | | | 2,276 | | | | 20,484 | |
| | | | | | | | | | | | | | | |
| New allowances net of allowance releases | | | 2,356 | | | | 233 | | | | 747 | | | | 778 | | | | 14,525 | | | | 2,601 | | | | 21,240 | |
| Recoveries of amounts previously written off | | | (195 | ) | | | (25 | ) | | | (117 | ) | | | (25 | ) | | | (69) | | | | (325) | | | | (756 | ) |
| | | | | | | | | | | | | | | |
| | | | | | | | | | | | | | | |
| | | | | | | | | | | | | | | | | | | | | | | | | | | | | |
| Total charge for impairment losses | | | 4,409 | | | | 450 | | | | 874 | | | | 1,333 | | | | 15,372 | | | | 2,504 | | | | 24,942 | |
| | | | | | | | | | | | | | | |
| Banks | | | 55 | | | | – | | | | – | | | | 15 | | | | – | | | | – | | | | 70 | |
| Customers | | | 4,354 | | | | 450 | | | | 874 | | | | 1,318 | | | | 15,372 | | | | 2,504 | | | | 24,872 | |
| | | | | | | | | | | | | | | |
| | | | | | | | | | | | | | | |
| | | | | | | | | | | | | | | | | | | | | | | | | | | | | |
| | | | % | | | | % | | | | % | | | | % | | | | % | | | | % | | | | % | |
| Charge for impairment losses as a percentage of closing gross loans and advances | | | 0.86 | | | | 0.33 | | | | 0.75 | | | | 4.08 | | | | 6.52 | | | | 3.64 | | | | 2.26 | |
| | | | | | | | | | | | | | | | | | | | | | | | | | | | | |
| | | US$m | | | US$m | | | US$m | | | US$m | | | US$m | | | US$m | | | US$m | |
| At 31 December 2009 | | | | | | | | | | | | | | | | | | | | | | | | | | | | |
| Impaired loans | | | 10,873 | | | | 846 | | | | 1,201 | | | | 1,666 | | | | 13,308 | | | | 2,951 | | | | 30,845 | |
| Impairment allowances | | | 6,227 | | | | 804 | | | | 996 | | | | 1,393 | | | | 13,676 | | | | 2,553 | | | | 25,649 | |
Charge for impairment losses as a percentage of average gross loans and advances to customers2
(Unaudited)
| | | | | | | | | | | | | | | | | | | | | |
| | | 2010 | | | 2009 | | | 2008 | | | 2007 | | | 2006 | |
| | | % | | | % | | | % | | | % | | | % | |
| | | | | |
| | | | | | | | | | | | | | | | | | | | | |
| New allowances net of allowance releases | | | 1.65 | | | | 2.92 | | | | 2.54 | | | | 2.09 | | | | 1.49 | |
| Recoveries | | | (0.12 | ) | | | (0.10 | ) | | | (0.09 | ) | | | (0.12 | ) | | | (0.10 | ) |
| | | | | | | | | | | | |
| | | | | | | | | | | | | | | | | | | | | |
| Total charge for impairment losses | | | 1.53 | | | | 2.82 | | | | 2.45 | | | | 1.97 | | | | 1.39 | |
| | | | | | | | | | | | |
| | | | | | | | | | | | | | | | | | | | | |
| Amount written off net of recoveries | | | 2.08 | | | | 2.71 | | | | 1.75 | | | | 1.36 | | | | 1.15 | |
| | |
| For footnote, see page 174. |
125
Report of the Directors: Operating and Financial Review(continued)
Charge for impairment losses as a percentage of average gross loans and advances to customers by geographical region
(Unaudited)
| | | | | | | | | | | | | | | | | | | | | | | | | | | | | |
| | | | | | | | | | | Rest of | | | | | | | | | | | | | |
| | | | | | | Hong | | | Asia- | | | Middle | | | North | | | Latin | | | | |
| | | Europe | | | Kong | | | Pacific | | | East | | | America | | | America | | | Total | |
| | | % | | | % | | | % | | | % | | | % | | | % | | | % | |
2010 | | | | | | | | | | | | | | | | | | | | | | | | | | | | |
| New allowances net of allowance releases | | | 0.74 | | | | 0.15 | | | | 0.66 | | | | 2.71 | | | | 4.02 | | | | 3.41 | | | | 1.65 | |
| Recoveries | | | (0.07 | ) | | | (0.03 | ) | | | (0.20 | ) | | | (0.23 | ) | | | (0.09 | ) | | | (0.51 | ) | | | (0.12 | ) |
| | | | | | | | | | | | | | | | | | | | | | |
| Total charge for impairment losses | | | 0.67 | | | | 0.12 | | | | 0.46 | | | | 2.48 | | | | 3.93 | | | | 2.90 | | | | 1.53 | |
| | | | | | | | | | | | | | | | | | | | | | |
| | | | | | | | | | | | | | | | | | | | | | | | | | | | | |
| Amount written off net of recoveries | | | 0.71 | | | | 0.19 | | | | 0.53 | | | | 1.32 | | | | 5.89 | | | | 4.01 | | | | 2.08 | |
| | | | | | | | | | | | | | | | | | | | | | | | | | | | | |
| 2009 | | | | | | | | | | | | | | | | | | | | | | | | | | | | |
| New allowances net of allowance releases | | | 1.19 | | | | 0.49 | | | | 1.31 | | | | 5.25 | | | | 6.24 | | | | 6.11 | | | | 2.92 | |
| Recoveries | | | (0.07 | ) | | | (0.03 | ) | | | (0.17 | ) | | | (0.11 | ) | | | (0.04 | ) | | | (0.73 | ) | | | (0.10 | ) |
| | | | | | | | | | | | | | | |
| | | | | | | | | | | | | | | | | | | | | | | | | | | | | |
| Total charge for impairment losses | | | 1.12 | | | | 0.46 | | | | 1.14 | | | | 5.14 | | | | 6.20 | | | | 5.38 | | | | 2.82 | |
| | | | | | | | | | | | | | | |
| | | | | | | | | | | | | | | | | | | | | | | | | | | | | |
| Amount written off net of recoveries | | | 0.63 | | | | 0.33 | | | | 0.94 | | | | 1.40 | | | | 7.14 | | | | 5.03 | | | | 2.71 | |
2010 compared with 2009
(Unaudited)
Loan impairment charges of US$13.5bn declined by 46% on both a reported and an underlying basis compared with 2009. Reported impaired loans were US$28.3bn at 31 December 2010, a decrease of 8% on both bases. The following commentary is on a constant currency basis.
New allowances for loan impairment charges were US$15.4bn, a decline of 42% compared with 2009, while releases and recoveries of US$1.9bn were 23% higher.
Impaired loans were 2.4% of total gross loans and advances at 31 December 2010, compared with 2.8% at 31 December 2009.
InEurope, new loan impairment allowances were US$3.2bn, 34% lower than in 2009, reflecting a more stable credit environment across many countries in the region. Individually assessed loan impairment allowances declined, mainly in the UK, reflecting an improvement in credit conditions. Significantly, impairment charges in 2009 against specific customers in the property sector did not recur. Collectively assessed loan impairment allowances also declined due to a fall in delinquency levels as our customers continued to benefit from the low interest rate environment and the general improvement in economic conditions. In our personal lending portfolios, new collectively assessed loan impairment allowances declined, reflecting lower levels of unsecured lending and tightened underwriting criteria. Impaired loans of US$10.7bn were 3% higher than at the end of 2009.
In Europe, releases and recoveries increased by 32% to US$681m.
InHong Kong, new loan impairment allowances declined by 58% to US$230m and impaired loans fell by 21% from the end of 2009 to US$665m. New loan impairment allowances declined in both the personal and commercial lending portfolios, reflecting the economic recovery and improvement in credit conditions in the territory and fewer customer downgrades, partly offset by an increase in lending balances.
Releases and recoveries in Hong Kong were US$93m, 5% lower than in 2009.
New loan impairment allowances inRest of Asia-Pacificdeclined by 40% to US$700m. The decline reflected lower new collective impairment allowances in India due to improved delinquency rates and lower balances as certain unsecured portfolios and higher risk elements of the credit card portfolio were managed down. In addition, new individually assessed impairment allowances also declined, mainly in India, due to the non-recurrence of large impairments, notably on certain technology-related exposures. These were partly offset by a significant loan impairment charge against a single customer. Impaired loans in the region increased by 3% to US$1.3bn at the end of 2010.
Releases and recoveries in the region rose by 19% due to releases in the construction and software industries in India and higher recoveries of amounts previously written off, notably in Australia.
In theMiddle East, new loan impairment allowances were US$735m, 47% lower than in 2009. The decrease was largely due to a decline in new collectively assessed loan impairment allowances net of allowance releases against the personal and commercial lending portfolios as delinquency rates improved, with a decline in personal balances in line
126
Report of the Directors: Operating and Financial Review(continued)
with the managing down of our exposure to higher risk unsecured personal lending. The lower allowances also reflected an overall improvement in economic conditions across the region. There were also declines in new individually assessed loan impairment charges as new charges for 2010 were restricted to a small number of large corporate exposures. Impaired loans rose by 47% from 31 December 2009 to US$2.5bn due to credit deterioration in a small number of specific exposures, and debt restructuring in the UAE.
Releases and recoveries in the Middle East more than doubled from 2009 to US$112m due to the release of judgemental impairment allowances reflecting improved economic conditions during 2010.
InNorth America, new loan impairment allowances declined markedly, reducing by 44% to US$8.7bn. In our HSBC Finance portfolios, lower new loan impairment allowances in Card and Retail Services reflected a reduction in lending balances and an improvement in delinquency rates. In our Consumer Lending and Mortgage Services portfolios, new loan impairment allowances also fell as the portfolio continued to run-off. In addition, total loss severities on foreclosed loans improved compared with 2009 reflecting the increase in the number of properties for which we accepted a deed-in-lieu of foreclosure, or a short sale, both of which result in lower losses compared with loans which are subjected to a formal foreclosure process.
In our corporate and commercial portfolios in North America, new loan impairment allowances declined, reflecting lower balances due to customer deleveraging and improved credit quality which, along with the improved economy, resulted in credit upgrades on certain accounts and fewer customer downgrades.
In North America, impaired loans decreased by 19% from the end of 2009 to US$10.8bn, while releases and recoveries rose by 80% compared with 2009 to US$378m.
InLatin America, new loan impairment allowances declined by 42% to US$1.9bn, while impaired loans declined by 23% to US$2.4bn as economic conditions in the region improved. Lower new loan impairment allowances in the personal lending portfolios were due to lower credit card balances in Mexico as we repositioned the portfolio to target higher quality customers and, to a lesser extent, in Brazil, due to the managed reduction in consumer finance balances. In addition, in the commercial lending portfolios in Brazil lower new impairment allowances reflected an improvement in economic conditions.
Releases and recoveries in Latin America declined by 21% from 2009 to US$331m.
For an analysis of loan impairment charges and other credit risk provisions by customer group, see pages 24 to 26.
127
Report of the Directors: Operating and Financial Review(continued)
2009 compared with 2008
(Unaudited)
Our loan impairment charges increased by 3% to US$24.9bn from US$24.1bn in 2008. The commentary on net loan impairment allowances is on a constant currency basis while the commentary on impaired loans is on a reported basis.
New allowances for loan impairment charges rose by 7% compared with 2008 to US$26.4bn. Releases and recoveries of allowances increased by 17% to US$1.5bn. Total impaired loans to customers at 31 December 2009 were US$31bn, an increase of 21% compared with the end of 2008. Impaired loans remained at 3% of customer loans and advances at 31 December 2009.
InEurope, new loan impairment allowances increased by 37% to US$4.9bn in 2009, driven by credit quality deterioration in individually impaired loans. Impaired loans increased by 59% to US$10.9bn at 31 December 2009.
In the UK, higher new loan impairment allowances reflected a small number of large individually assessed impairments against corporate and commercial exposures, together with the effects of credit quality deterioration in the personal lending portfolio. In the unsecured portfolios, credit quality declined in the cards and personal loans portfolios reflecting the deterioration in the economic environment. In the residential mortgage portfolios, credit quality remained strong despite higher unemployment in the UK. Our exposure to this market remained well secured with typical loan-to-value ratios of below 60%.
In Europe, releases and recoveries were US$520m, a decrease of 5% compared with 31 December 2008.
InHong Kong, new loan impairment allowances were US$548m, a decline of 12% compared with 2008. Credit quality within the commercial lending portfolios improved compared with 2008, when significant impairments were taken on some exporters due to the contraction in global trade. New loan impairment allowances increased in the unsecured personal portfolios, reflecting the rise in unemployment and bankruptcy filings. Impaired loans were broadly stable at US$846m.
InRest of Asia-Pacific, new loan impairment allowances rose by 18% to US$1.1bn, mainly due to increased delinquencies on unsecured lending, particularly in the credit card and personal lending portfolios in India and, to a lesser extent, in Indonesia. In the corporate and commercial portfolios, new loan impairment allowances
increased, reflecting a deterioration in India’s economic conditions. Impaired loans increased by 44% to US$1.2bn.
Releases and recoveries in the Rest of Asia-Pacific region rose by 42% to US$214m at 31 December 2009.
New loan impairment allowances in theMiddle Eastincreased significantly from a low base, to US$1.4bn. The increase reflected higher charges in the UAE, largely in Dubai, due to a marked deterioration in credit quality which particularly affected the real estate and construction industries. Infrastructure projects were delayed or cancelled and unemployment levels increased. Delinquency rates rose as a result, particularly in the credit card and personal loan portfolios. Impaired loans increased by US$1.4bn to US$1.7bn.
New loan impairment allowances rose by 7% to US$26.4bn despite falls of 12% in Hong Kong and 7% in North America.
InNorth America,new loan impairment allowances declined by 7% to US$15.6bn against the backdrop of a widespread rise in unemployment, continued weakness in the US economy and housing markets, higher levels of personal bankruptcy filings and portfolio seasoning. This decline was the result of lower loan impairment charges in the Mortgage Services real estate secured, credit card and vehicle finance portfolios, partially offset by higher loan impairment charges in the branch-based Consumer Lending business. Apart from the changes made to the write-off period, the main contributing factors were as follows:
| • | | new loan impairment allowances in the Mortgage Services business decreased in 2009 as the portfolio continued to run off. While loss severities increased compared with 2008, a higher percentage of impairment was in respect of first lien loans which have less severity than second lien loans; |
| |
| • | | new loan impairment allowances in the vehicle finance loan portfolio decreased as a result of lower loan levels reflecting the discontinuance of vehicle finance originations in July 2008. In addition, loss severities decreased as prices on repossessed vehicles improved; and |
| |
| • | | new loan impairment allowances in the branch-based Consumer Lending business increased in 2009, primarily in the unsecured portfolio due to the deterioration in the 2006 and 2007 vintages which were more pronounced in certain geographic regions and, to a lesser extent, first |
127(a)
Report of the Directors: Operating and Financial Review(continued)
| | | lien real estate secured loans. These increases were partially offset by lower new loan impairment allowances for second lien real estate secured loans. |
New loan impairment allowances in the Cards and Retail Services portfolios declined due to lower outstanding balances and management action taken in the past two years to constrain origination activities in riskier segments. In addition, impairment provisioning reflects an improved outlook on future loss estimates as the impact of higher unemployment rates on losses has not been as severe as initially expected due, in part, to lower fuel prices and the boost to cash flow provided by government stimulus programmes that meaningfully benefit non-prime customers. In HSBC Bank USA personal lending portfolios, new loan impairment allowances increased, mainly in prime residential mortgage lending.
New loan impairment allowances in the corporate and commercial lending portfolios increased as the weaker economy affected firms in the commercial real estate and construction sectors in the US. In Canada, our new loan impairment allowances were higher, primarily against exposures in the commercial real estate, manufacturing and trade sectors.
In North America, releases and recoveries increased by 14% to US$205m at 31 December 2009 due to an increase in the repayment of loans previously impaired in the corporate, commercial and financial portfolios.
Impaired loans decreased by 7% to US$13.3bn at 31 December 2009.
New loan impairment allowances inLatin Americaincreased by 18% to US$2.9bn, while impaired loans rose by 27% to US$3.0bn. The increase in new loan impairment allowances in Brazil was driven by higher delinquencies, mainly in credit cards, overdrafts and payroll loans, due to higher unemployment. In the commercial portfolio, higher new loan impairment allowances reflected the challenging economic environment which particularly affected the business banking and mid-market business segments.
Releases and recoveries in Latin America increased by 56% to US$391m at 31 December 2009.
For an analysis of loan impairment charges and other credit risk provisions by customer group, see page 49.
127(b)
Report of the Directors: Operating and Financial Review(continued)
(Audited)
Credit risk in HSBC Holdings primarily arises from transactions with Group subsidiaries and from guarantees issued in support of obligations assumed by certain Group operations in the normal conduct of their business.
These risks are reviewed and managed within regulatory and internal limits for exposures by our
Global Risk function, which provides high-level centralised oversight and management of our credit risks worldwide.
HSBC Holdings’ maximum exposure to credit risk at 31 December 2010 is shown below. Its financial assets principally represent claims on Group subsidiaries in Europe and North America. No collateral or other credit enhancements were held by HSBC Holdings in respect of its transactions with subsidiaries.
HSBC Holdings – maximum exposure to credit risk
(Audited)
| | | | | | | | | |
| | | 2010 | | | 2009 | |
| | | US$m | | | US$m | |
| | | | | | | | | |
| Cash at bank and in hand: | | | | | | | | |
| – balances with HSBC undertakings | | | 459 | | | | 224 | |
| Derivatives | | | 2,327 | | | | 2,981 | |
| Loans and advances to HSBC undertakings | | | 21,238 | | | | 23,212 | |
| Financial investments | | | 2,025 | | | | 2,455 | |
| Financial guarantees and similar contracts | | | 46,988 | | | | 35,073 | |
| Loan and other credit-related commitments | | | 2,720 | | | | 3,240 | |
| | | | | |
| | | | | | | | | |
| | | | 75,757 | | | | 67,185 | |
| | | | | |
All of the derivative transactions are with HSBC undertakings which are banking counterparties (2009: 100%).
The credit quality of the loans and advances to HSBC undertakings is assessed as strong/good, with 100% of the exposure being neither past due nor impaired (2009: 100%).
The credit ratings of the financial investments held by HSBC Holdings are within the Standard and Poor’s (‘S&P’) ratings range of A to BBB+ (2009: A+ to A–).
Securitisation exposures and other structured products
(Audited)
The financial impact of the recent market disruption is lessening with net write-downs to the income statement of nil (2009: US$1.9bn net write-downs) and a reduction in the available-for-sale ABSs reserve deficit by US$5.8bn to US$6.4bn.
Following the dislocation in markets which began in 2007, there was a modest recovery in the risk appetite of investors in 2009. However, the first half of 2010 saw renewed uncertainty and concerns over sovereign credit risk. As a result, the prices of many assets perceived to be of higher risk fell. In addition, the widespread downgrading of securitised assets continued in the first half of 2010 as rating agencies changed their methodologies, reducing the appetite for securitised assets among institutions subject to the Basel II framework.
Increased stability returned in the second half of 2010 following the interventions of the EU and the International Monetary Fund. A modest increase in house prices in some areas and the continued low interest rate environment contributed to a rise in the price of some securitised assets. As a result, the levels of write-downs and losses on our holdings of structured assets remained modest. Unrealised losses in our available-for-sale reserve continued to reduce due to increases in fair value and the principal amortisation of ABSs as repayments were received at par. Expectations of cash losses on available-for-sale ABSs remained consistent with our previous estimates.
(Audited)
Accounting policies
Our accounting policies for the classification and valuation of financial instruments are in accordance with the requirements of IAS 32 ‘Financial Instruments: Presentation’ and IAS 39 ‘Financial Instruments: Recognition and Measurement’, as described in Note 2 on the Financial Statements, and the use of assumptions and estimates in respect of valuation of financial instruments as described in Note 16 on the Financial Statements.
This section contains information about our exposure to the following:
| • | | ABSs, including mortgage-backed securities (‘MBS’s) and related collateralised debt obligations (‘CDO’s); |
| |
| • | | direct lending held at fair value through profit or loss; |
128
Report of the Directors: Operating and Financial Review(continued)
| • | | monolines; |
| |
| • | | credit derivative product companies (‘CDPC’s); |
| |
| • | | leveraged finance transactions; and |
| |
| • | | representations and warranties related to |
| | | mortgage sales and securitisation activities. |
The following table summarises our exposure to these products.
Overall exposure of HSBC
(Audited)
| | | | | | | | | | | | | | | | | |
| | | At 31 December 2010 | | At 31 December 2009 |
| | | | | | | Including | | | | | | | Including | |
| | | Carrying | | | sub-prime | | | Carrying | | | sub-prime | |
| | | amount | | | and Alt-A | | | amount | | | and Alt-A | |
| | | US$bn | | | US$bn | | | US$bn | | | US$bn | |
| | | | | | | | | | | | | | | | | |
| Asset-backed securities (‘ABS’s) | | | 73.9 | | | | 8.5 | | | | 70.6 | | | | 10.8 | |
| | | | | | | | | |
| – fair value through profit or loss | | | 10.8 | | | | 0.3 | | | | 12.1 | | | | 0.7 | |
– available for sale38 | | | 54.7 | | | | 7.1 | | | | 48.1 | | | | 8.2 | |
– held to maturity38 | | | 2.2 | | | | 0.2 | | | | 2.5 | | | | 0.2 | |
| – loans and receivables | | | 6.2 | | | | 0.9 | | | | 7.9 | | | | 1.7 | |
| | | | | | | | | |
| | | | | | | | | | | | | | | | | |
| Loans at fair value through profit or loss | | | 1.6 | | | | 1.2 | | | | 2.0 | | | | 1.6 | |
| | | | | | | | | |
| | | | | | | | | | | | | | | | | |
| Total ABS and direct lending at fair value through profit or loss | | | 75.5 | | | | 9.7 | | | | 72.6 | | | | 12.4 | |
| | | | | | | | | | | | | | | | | |
| Less securities mitigated by credit derivatives with monolines and other financial institutions | | | (8.3 | ) | | | (0.4 | ) | | | (10.2 | ) | | | (1.0 | ) |
| | | | | | | | | |
| | | | | | | | | | | | | | | | | |
| | | | 67.2 | | | | 9.3 | | | | 62.4 | | | | 11.4 | |
| | | | | | | | | |
| | | | | | | | | | | | | | | | | |
| Leveraged finance loans | | | 4.9 | | | | – | | | | 6.2 | | | | – | |
| | | | | | | | | |
| – fair value through profit or loss | | | 0.3 | | | | – | | | | 0.2 | | | | – | |
| – loans and receivables | | | 4.6 | | | | – | | | | 6.0 | | | | – | |
| | | | | | | | | |
| | | | | | | | | | | | | | | | | |
| | | | | | | | | |
| | | | | | | | | | | | | | | | | |
| | | | 72.1 | | | | 9.3 | | | | 68.6 | | | | 11.4 | |
| | | | | | | | | |
| | | | | | | | | | | | | | | | | |
| Exposure including securities mitigated by credit derivatives with monolines and other financial institutions | | | 80.4 | | | | 9.7 | | | | 78.8 | | | | 12.4 | |
For footnote, see page 174.
Asset-backed securities and leveraged finance
(Audited)
We are or have been involved in the following activities involving ABSs and leveraged finance:
| • | | purchasing US mortgage loans with the intention of structuring and placing securitisations into the market; |
| |
| • | | trading in ABSs, including MBSs, in secondary markets; |
| |
| • | | holding MBSs and other ABSs in balance sheet management activities, with the intention of earning net interest income over the life of the securities; |
| |
| • | | holding MBSs and other ABSs as part of investment portfolios, including securities investment conduits (‘SIC’s) and money market funds, as described in Note 43 on the Financial Statements, with the intention of earning net interest income and management fees; |
| |
| • | | holding MBSs or other ABSs in the trading portfolio hedged through credit derivative protection, typically purchased from monolines, with the intention of earning the spread differential over the life of the instruments; and |
| • | | originating leveraged finance loans for the purposes of syndicating or selling them down in order to generate a trading profit or holding them in order to earn interest margin over their lives. |
These activities are not a significant part of GB&M’s on-going business, and GB&M is not reliant on them for any material aspect of its business operations or profitability. The purchase and securitisation of US mortgage loans and the secondary trading of US MBSs, which was conducted in our US MBS business, was discontinued in 2007.
Nature of HSBC’s exposures
MBSs are securities that represent interests in groups of mortgages and provide investors with the right to receive cash from future mortgage payments (interest and/or principal). An MBS which references mortgages with different risk profiles is classified according to the highest risk class.
CDOs are securities backed by a pool of bonds, loans or other assets such as ABSs. CDOs may include exposure to sub-prime or Alt-A mortgage
129
Report of the Directors: Operating and Financial Review(continued)
assets where these are part of the underlying assets or reference assets. As there is often uncertainty surrounding the precise nature of the underlying collateral supporting CDOs, all CDOs supported by residential mortgage-related assets are classified as
sub-prime. Our holdings of ABSs and CDOs and direct lending positions, and the categories of mortgage collateral and lending activity, are described below.
| | | | | |
| Categories of | | | | |
| ABSs and CDOs | | Definition | | Classification |
| | | | | |
| Sub-prime | | Loans to customers who have limited credit histories, modest incomes or high debt-to-income ratios or have experienced credit problems caused by occasional delinquencies, prior charge-offs, bankruptcy or other credit-related actions. | | For US mortgages, standard US credit scores are primarily used to determine whether a loan is sub-prime; for non-US mortgages, management judgement is used. |
| |
| US Home Equity Lines of Credit (‘HELoC’s) | | A form of revolving credit facility provided to customers, which is supported by a first or second lien charge over residential property. | | Holdings of HELoCs are classified as sub-prime. |
| |
| US Alt-A | | Lower risk loans than sub-prime, but they share higher risk characteristics than lending under fully conforming standard criteria. | | US credit scores and the completeness of documentation held (such as proof of income), are considered when determining whether an Alt-A classification is appropriate. Non sub-prime mortgages in the US are classified as Alt-A if they are not eligible for sale to the major US Government sponsored mortgage agencies. |
| |
| US Government agency and sponsored enterprises mortgage-related assets | | Securities that are guaranteed by US Government agencies such as the Government National Mortgage Association (‘Ginnie Mae’), or by US Government sponsored entities including the Federal National Mortgage Association (‘Fannie Mae’) and the Federal Home Loan Mortgage Corporation (‘Freddie Mac’). | | Holdings of US Government agency and US Government sponsored enterprises’ mortgage-related assets are classified as prime exposures. |
| |
| UK non-conforming mortgages | | UK mortgages that do not meet normal lending criteria. Examples include mortgages where the expected level of documentation is not provided (such as income with self-certification), or where poor credit history increases risk and results in pricing at a higher than normal lending rate. | | UK non-conforming mortgages are treated as sub-prime exposures. |
| |
| Other mortgages | | Residential mortgages, including prime mortgages, that do not meet any of the classifications described above. | | Prime residential mortgage-related assets are included in this category. |
Our exposure to non-residential mortgage-related ABSs and direct lending includes securities with collateral relating to:
| • | | commercial property mortgages; |
| |
| • | | leveraged finance loans; |
| |
| • | | student loans; and |
| |
| • | | other assets, such as securities with other receivable-related collateral. |
ABSs classified as available for sale
Our principal holdings of available-for-sale ABSs (see table below) are in GB&M through special purpose entities (‘SPE’s) which were established from the outset with the benefit of external investor first loss protection support, together with positions held directly and by Solitaire Funding Limited (‘Solitaire’), where we have first loss risk.
The following table summarises our exposure to ABS’s classified as available for sale:
Available-for-sale ABSs exposure
(Audited)
| | | | | | | | | | | | | | | | | | | | | | | | | |
| | | At 31 December 2010 | | At 31 December 2009 |
| | | Directly | | | | | | | | | Directly | | | | | | | |
| | | held/ | | | | | | | | | held/ | | | | | | | |
| | | Solitaire | 39 | | SPEs | | | Total | | | Solitaire | 39 | | SPEs | | | Total | |
| | | US$m | | | US$m | | | US$m | | | US$m | | | US$m | | | US$m | |
| | | | | | | | | | | | | | | | | | | | | | | | | |
| Total carrying amount of net principal exposure | | | 41,106 | | | | 13,586 | | | | 54,692 | | | | 34,040 | | | | 14,021 | | | | 48,061 | |
| Notional principal value of impaired securities | | | 3,015 | | | | 2,399 | | | | 5,414 | | | | 2,641 | | | | 1,565 | | | | 4,206 | |
| Carrying value of capital notes liability | | | – | | | | (254 | ) | | | (254 | ) | | | – | | | | (740 | ) | | | (740 | ) |
130
Report of the Directors: Operating and Financial Review(continued)
Movement in the available-for-sale (‘AFS’) ABSs reserve
| | | | | | | | | | | | | | | | | | | | | | | | | |
| | | 2010 | | 2009 |
| | | Directly | | | | | | | | | Directly | | | | | | | |
| | | held/ | | | | | | | | | held/ | | | | | | | |
| | | Solitaire | 39 | | SPEs | | | Total | | | Solitaire | 39 | | SPEs | | | Total | |
| | | US$m | | | US$m | | | US$m | | | US$m | | | US$m | | | US$m | |
| | | | | | | | | | | | | | | | | | | | | | | | | |
| AFS reserve at 1 January | | | (7,349 | ) | | | (4,864 | ) | | | (12,213 | ) | | | (11,528 | ) | | | (7,204 | ) | | | (18,732 | ) |
| Increase in fair value of securities | | | 2,175 | | | | 1,543 | | | | 3,718 | | | | 3,419 | | | | 704 | | | | 4,123 | |
| Impairment charge: | | | | | | | | | | | | | | | | | | | | | | | | |
| – borne by HSBC | | | 444 | | | | – | | | | 444 | | | | 1,422 | | | | – | | | | 1,422 | |
– allocated to capital note holders40 | | | – | | | | 531 | | | | 531 | | | | – | | | | 666 | | | | 666 | |
| Repayment of capital | | | 540 | | | | 187 | | | | 727 | | | | 431 | | | | 668 | | | | 1,099 | |
| Other movements | | | 88 | | | | 297 | | | | 385 | | | | (1,093 | ) | | | 302 | | | | (791 | ) |
| | | | | | | | | | | | | |
| | | | | | | | | | | | | | | | | | | | | | | | | |
| AFS reserve at 31 December | | | (4,102 | ) | | | (2,306 | ) | | | (6,408 | ) | | | (7,349 | ) | | | (4,864 | ) | | | (12,213 | ) |
| | | | | | | | | | | | | |
| For footnotes, see page 174. | | |
Securities investment conduits
(Audited)
The total carrying amount of ABSs held through SPEs in the above table represents holdings in which significant first loss protection is provided through capital notes issued by SICs, excluding Solitaire.
At each reporting date, we assess whether there is any objective evidence of impairment in the value of the ABSs held by SPEs. Impairment charges incurred on these assets are offset by a credit to the impairment line for the amount of the loss allocated to capital note holders.
The economic first loss protection remaining at 31 December 2010 amounted to US$2.2bn (2009: US$2.2bn). On an IFRSs accounting basis, the carrying value of the liability for the capital notes at 31 December 2010 amounted to US$0.3bn (2009: US$0.7bn). The impairment charge recognised during 2010 amounted to US$531m (2009: US$666m).
At 31 December 2010, the available-for-sale reserve in respect of securities held by the SICs was a deficit of US$2.7bn (2009: US$5.2bn). Of this, US$2.3bn related to ABSs (2009: US$4.9bn).
Impairments recognised during 2010 from assets held directly or within Solitaire, in recognition of the first loss protection of US$1.2bn we provide through credit enhancement and from drawings against the liquidity facility we provide, were US$444m (2009: US$1.4bn). The reduction in impairment charges compared with 2009 was due to the stabilising of loss severities and delinquency roll rates which have resulted in lower losses in the underlying collateral pools. The level of impairment recognised in comparison with the deficit in the available-for-sale reserve was a
reflection of the credit quality and seniority of the assets held.
Sub-prime and Alt-A residential mortgage-backed securities
(Audited)
The assets which are most sensitive to possible future impairment are sub-prime and Alt-A residential MBSs. Available-for-sale holdings in these higher risk categories where HSBC does not benefit from significant first loss protection amounted to US$3.8bn at 31 December 2010 (2009: US$4.9bn). For these securities the cumulative fair value losses not recognised in the income statement at 31 December 2010 was US$1.6bn (2009: losses of US$3.2bn). Other holdings in these higher risk categories classified as available-for-sale are held in vehicles where third party first loss protection exists, as described in the section on securities investment conduits, above.
During 2010, the credit ratings on certain ABSs held directly by HSBC, Solitaire and the SICs were downgraded. A downgrade of a security’s credit rating is not, of itself, evidence of impairment. Consequently, the actions of the rating agencies alone have no direct impact on the measurement of impairment losses. The impairment losses recognised on these securities at 31 December 2010 are set out above.
(Audited)
The accounting policy for impairment and indicators of impairment is set out in Note 2j on the Financial Statements.
For available-for-sale ABSs, to identify objective evidence of impairment, an industry standard valuation model is normally applied which uses data with reference to the underlying asset
131
Report of the Directors: Operating and Financial Review(continued)
pools and models their projected future cash flows. The estimated future cash flows of the securities are assessed at the specific financial asset level to determine whether any of them are unlikely to be recovered as a result of loss events occurring on or before the reporting date.
The principal assumptions and inputs to the models are typically the delinquency status of the underlying loans, the probability of delinquent loans progressing to default, the prepayment profiles of the underlying assets and the loss severity in the event of default. However, the models utilise other variables relevant to specific classes of collateral to forecast future defaults and recovery rates. Management uses externally available data and applies judgement when determining the appropriate assumptions in respect of these factors. HSBC uses a modelling approach which incorporates historically observed progression rates to default, to determine if the decline in aggregate projected cash flows from the underlying collateral will lead to a shortfall in contractual cash flows. In such cases the security is considered to be impaired.
In respect of CDOs, expected future cash flows for the underlying collateral are assessed to determine whether there is likely to be a shortfall in the contractual cash flows of the CDO.
When a security benefits from a contract provided by a monoline insurer that insures payments of principal and interest, the expected recovery on the contract is assessed in determining the total expected credit support available to the ABS.
Impairment and cash loss projections
(Unaudited)
At 31 December 2009, management undertook an analysis to estimate further potential impairments and expected cash losses on the available-for-sale ABS portfolio. This exercise comprised a shift of projections of future loss severities, default rates and prepayment rates. The results of the analysis indicated that further impairment charges of some US$1.1bn and expected cash losses of some US$450m could arise over the next two to three years.
At 31 December 2010, management re-performed the stress test. After taking into account the cash losses experienced during 2010, the remaining cash loss projections of US$250m were consistent with those as at 31 December 2009. However, the impairment charge projections showed an additional charge of US$300m arising over the next two years in relation to the SICs, after taking into account the impairments recognised in 2010, resulting in future impairment charges of US$950m, including the US$300m relating to the SICs. This additional charge reflects where the accounting impairments will exceed the carrying amount of the capital notes held by third parties.
For the purposes of identifying impairment at the reporting date, the future projected cash flows reflect the effect of loss events that have occurred at or prior to the reporting date. For the purposes of performing stress tests to estimate potential future impairment charges, the projected future cash flows reflect additional assumptions about future loss events after the balance sheet date.
This analysis makes assumptions in respect of the future behaviour of loss severities, default rates and prepayment rates. Movements in the parameters are not independent of each other. For example, increased default rates and increased loss severities, which would imply greater impairments, generally arise under economic conditions that give rise to reduced levels of prepayment, reducing the potential for impairment charges. Conversely, economic conditions which increase the rates of prepayment are generally associated with reduced default rates and decreased loss severities.
At 31 December 2010, the incurred and projected impairment charges, measured in accordance with accounting requirements, significantly exceeded the expected cash losses on the securities. Over the lives of the available-for-sale ABSs the cumulative impairment charges will converge towards the level of cash losses. In respect of the SICs, in particular, the capital notes held by third parties are expected to absorb the cash losses arising in the vehicles.
132
Report of the Directors: Operating and Financial Review(continued)
Carrying amount of HSBC’s consolidated holdings of ABSs, and direct lending held at fair value through profit or loss
(Audited)
| | | | | | | | | | | | | | | | | | | | | | | | | | | | | |
| | | | | | | | | | | | | | | Designated | | | | | | | | | | | Of which | |
| | | | | | | | | | | | | | | at fair value | | | | | | | | | | | held through | |
| | | | | | | Available | | | Held to | | | through | | | Loans and | | | | | | | consolidated | |
| | | Trading | | | for sale | | | maturity | | | profit | | | receivables | | | Total | | | SPEs | |
| | | US$m | | | US$m | | | US$m | | | US$m | | | US$m | | | US$m | | | US$m | |
| | | | | | | | | | | | | | | | | | | | | | | | | | | | | |
At 31 December 2010 | | | | | | | | | | | | | | | | | | | | | | | | | | | | |
| Mortgage-related assets | | | | | | | | | | | | | | | | | | | | | | | | | | | | |
| Sub-prime residential | | | 1,297 | | | | 2,565 | | | | – | | | | – | | | | 652 | | | | 4,514 | | | | 2,763 | |
| | | | | | | | | | | | | | | |
| Direct lending | | | 1,078 | | | | – | | | | – | | | | – | | | | – | | | | 1,078 | | | | 632 | |
MBSs and MBS CDOs41 | | | 219 | | | | 2,565 | | | | – | | | | – | | | | 652 | | | | 3,436 | | | | 2,131 | |
| | | | | | | | | | | | | | | |
| | | | | | | | | | | | | | | | | | | | | | | | | | | | | |
| US Alt-A residential | | | 180 | | | | 4,545 | | | | 191 | | | | – | | | | 270 | | | | 5,186 | | | | 3,651 | |
| | | | | | | | | | | | | | | |
| Direct lending | | | 96 | | | | – | | | | – | | | | – | | | | – | | | | 96 | | | | – | |
MBSs41 | | | 84 | | | | 4,545 | | | | 191 | | | | – | | | | 270 | | | | 5,090 | | | | 3,651 | |
| | | | | | | | | | | | | | | |
| | | | | | | | | | | | | | | | | | | | | | | | | | | | | |
| US Government agency and sponsored enterprises | | | | | | | | | | | | | | | | | | | | | | | | | | | | |
MBSs41 | | | 657 | | | | 21,699 | | | | 2,032 | | | | – | | | | – | | | | 24,388 | | | | 6 | |
| | | | | | | | | | | | | | | | | | | | | | | | | | | | | |
| Other residential | | | 1,075 | | | | 4,024 | | | | – | | | | – | | | | 1,111 | | | | 6,210 | | | | 2,669 | |
| | | | | | | | | | | | | | | |
| Direct lending | | | 417 | | | | – | | | | – | | | | – | | | | – | | | | 417 | | | | – | |
MBSs41 | | | 658 | | | | 4,024 | | | | – | | | | – | | | | 1,111 | | | | 5,793 | | | | 2,669 | |
| | | | | | | | | | | | | | | |
| | | | | | | | | | | | | | | | | | | | | | | | | | | | | |
| Commercial property | | | | | | | | | | | | | | | | | | | | | | | | | | | | |
MBSs and MBS CDOs41 | | | 546 | | | | 8,160 | | | | – | | | | 111 | | | | 1,942 | | | | 10,759 | | | | 6,441 | |
| | | | | | | | | | | | | | | | | | | | | | | | | | | | | |
| | | | | | | | | | | | | | | |
| | | | 3,755 | | | | 40,993 | | | | 2,223 | | | | 111 | | | | 3,975 | | | | 51,057 | | | | 15,530 | |
| | | | | | | | | | | | | | | | | | | | | | | | | | | | | |
| Leveraged finance-related assets | | | | | | | | | | | | | | | | | | | | | | | | | | | | |
ABSs and ABS CDOs41 | | | 392 | | | | 5,418 | | | | – | | | | – | | | | 414 | | | | 6,224 | | | | 3,886 | |
| Student loan-related assets | | | | | | | | | | | | | | | | | | | | | | | | | | | | |
ABSs and ABS CDOs41 | | | 163 | | | | 5,178 | | | | – | | | | – | | | | 150 | | | | 5,491 | | | | 4,251 | |
| Other assets | | | | | | | | | | | | | | | | | | | | | | | | | | | | |
ABSs and ABS CDOs41 | | | 1,936 | | | | 3,103 | | | | – | | | | 6,017 | | | | 1,710 | | | | 12,766 | | | | 2,526 | |
| | | | | | | | | | | | | | | |
| | | | | | | | | | | | | | | | | | | | | | | | | | | | | |
| | | | 6,246 | | | | 54,692 | | | | 2,223 | | | | 6,128 | | | | 6,249 | | | | 75,538 | | | | 26,193 | |
| | | | | | | | | | | | | | | |
| | | | | | | | | | | | | | | | | | | | | | | | | | | | | |
| At 31 December 2009 | | | | | | | | | | | | | | | | | | | | | | | | | | | | |
| Mortgage-related assets | | | | | | | | | | | | | | | | | | | | | | | | | | | | |
| Sub-prime residential | | | 2,063 | | | | 2,782 | | | | – | | | | – | | | | 837 | | | | 5,682 | | | | 3,213 | |
| | | | | | | | | | | | | | | |
| Direct lending | | | 1,439 | | | | – | | | | – | | | | – | | | | – | | | | 1,439 | | | | 913 | |
MBSs and MBS CDOs41 | | | 624 | | | | 2,782 | | | | – | | | | – | | | | 837 | | | | 4,243 | | | | 2,300 | |
| | | | | | | | | | | | | | | |
| | | | | | | | | | | | | | | | | | | | | | | | | | | | | |
| US Alt-A residential | | | 191 | | | | 5,403 | | | | 192 | | | | – | | | | 882 | | | | 6,668 | | | | 3,672 | |
| | | | | | | | | | | | | | | |
| Direct lending | | | 113 | | | | – | | | | – | | | | – | | | | – | | | | 113 | | | | – | |
MBSs41 | | | 78 | | | | 5,403 | | | | 192 | | | | – | | | | 882 | | | | 6,555 | | | | 3,672 | |
| | | | | | | | | | | | | | | |
| | | | | | | | | | | | | | | | | | | | | | | | | | | | | |
| US Government agency and sponsored enterprises | | | | | | | | | | | | | | | | | | | | | | | | | | | | |
MBSs41 | | | 375 | | | | 13,332 | | | | 2,333 | | | | – | | | | – | | | | 16,040 | | | | 322 | |
| | | | | | | | | | | | | | | | | | | | | | | | | | | | | |
| Other residential | | | 1,646 | | | | 4,582 | | | | – | | | | 335 | | | | 1,401 | | | | 7,964 | | | | 3,160 | |
| | | | | | | | | | | | | | | |
| Direct lending | | | 452 | | | | – | | | | – | | | | – | | | | – | | | | 452 | | | | – | |
MBSs41 | | | 1,194 | | | | 4,582 | | | | – | | | | 335 | | | | 1,401 | | | | 7,512 | | | | 3,160 | |
| | | | | | | | | | | | | | | |
| | | | | | | | | | | | | | | | | | | | | | | | | | | | | |
| Commercial property | | | | | | | | | | | | | | | | | | | | | | | | | | | | |
MBSs and MBS CDOs41 | | | 414 | | | | 7,535 | | | | – | | | | 103 | | | | 2,143 | | | | 10,195 | | | | 5,730 | |
| | | | | | | | | | | | | | | |
| | | | | | | | | | | | | | | | | | | | | | | | | | | | | |
| | | | 4,689 | | | | 33,634 | | | | 2,525 | | | | 438 | | | | 5,263 | | | | 46,549 | | | | 16,097 | |
| | | | | | | | | | | | | | | | | | | | | | | | | | | | | |
| Leveraged finance-related assets | | | | | | | | | | | | | | | | | | | | | | | | | | | | |
ABSs and ABS CDOs41 | | | 555 | | | | 5,150 | | | | – | | | | – | | | | 484 | | | | 6,189 | | | | 4,144 | |
| Student loan-related assets | | | | | | | | | | | | | | | | | | | | | | | | | | | | |
ABSs and ABS CDOs41 | | | 141 | | | | 4,948 | | | | – | | | | – | | | | 145 | | | | 5,234 | | | | 4,127 | |
| Other assets | | | | | | | | | | | | | | | | | | | | | | | | | | | | |
ABSs and ABS CDOs41 | | | 2,302 | | | | 4,329 | | | | – | | | | 6,025 | | | | 1,987 | | | | 14,643 | | | | 2,696 | |
| | | | | | | | | | | | | | | |
| | | | | | | | | | | | | | | | | | | | | | | | | | | | | |
| | | | 7,687 | | | | 48,061 | | | | 2,525 | | | | 6,463 | | | | 7,879 | | | | 72,615 | | | | 27,064 | |
| | | | | | | | | | | | | | | |
For footnote, see page 174.
The above table excludes leveraged finance transactions, which are shown separately on page 139.
133
Report of the Directors: Operating and Financial Review(continued)
HSBC’s consolidated holdings of ABSs, and direct lending held at fair value through profit or loss
(Audited)
| | | | | | | | | | | | | | | | | | | | | | | | | | | | | | | | | |
| | | 2010 | | At 31 December 2010 |
| | | Gross fair value | | | | | | | | | | | | | | | | | | | | |
| | | movements | | Realised | | | | | | | | | | | Credit | | | | | | | |
| | | | | | | Other | | | gains/ | | | | | | | | | | | default | | | | | | | |
| | | | | | | compre- | | | (losses) in | | | | | | | | | | | swap | | | Net | | | | |
| | | Income | | | hensive | | | the income | | | Reclassi- | | | Gross | | | gross | | | principal | | | Carrying | |
| | | Statement | 43 | | income | 44 | | statement | 45 | | fied | 46 | | principal | 47 | | protection | 48 | | exposure | 49 | | Amount | 50 |
| | | US$m | | | US$m | | | US$m | | | US$m | | | US$m | | | US$m | | | US$m | | | US$m | |
| Mortgage-related assets | | | | | | | | | | | | | | | | | | | | | | | | | | | | | | | | |
| Sub-prime residential | | | | | | | | | | | | | | | | | | | | | | | | | | | | | | | | |
| Direct lending | | | (35 | ) | | | – | | | | (20 | ) | | | – | | | | 2,233 | | | | – | | | | 2,233 | | | | 1,078 | |
MBSs41 | | | 58 | | | | 313 | | | | 14 | | | | 385 | | | | 5,104 | | | | 336 | | | | 4,768 | | | | 3,135 | |
| | | | | | | | | | | | | | | | | |
– high grade42 | | | 6 | | | | 151 | | | | 5 | | | | 52 | | | | 1,996 | | | | 292 | | | | 1,704 | | | | 1,458 | |
| – rated C to A | | | 52 | | | | 162 | | | | 7 | | | | 333 | | | | 3,006 | | | | 44 | | | | 2,962 | | | | 1,645 | |
| – not publicly rated | | | – | | | | – | | | | 2 | | | | – | | | | 102 | | | | – | | | | 102 | | | | 32 | |
| | | | | | | | | | | | | | | | | |
| | | | | | | | | | | | | | | | | | | | | | | | | | | | | | | | | |
MBS CDOs41 | | | – | | | | 7 | | | | – | | | | (3 | ) | | | 90 | | | | 12 | | | | 78 | | | | 17 | |
| | | | | | | | | | | | | | | | | |
– high grade42 | | | – | | | | – | | | | – | | | | – | | | | 2 | | | | – | | | | 2 | | | | 1 | |
| – rated C to A | | | – | | | | 6 | | | | – | | | | (3 | ) | | | 86 | | | | 12 | | | | 74 | | | | 14 | |
| – not publicly rated | | | – | | | | 1 | | | | – | | | | – | | | | 2 | | | | – | | | | 2 | | | | 2 | |
| | | | | | | | | | | | | | | | | |
| | | | | | | | | | | | | | | | | | | | | | | | | | | | | | | | | |
| | | | | | | | | | | | | | | | | |
| | | | | | | | | | | | | | | | | | | | | | | | | | | | | | | | | |
| | | | 23 | | | | 320 | | | | (6 | ) | | | 382 | | | | 7,427 | | | | 348 | | | | 7,079 | | | | 4,230 | |
| | | | | | | | | | | | | | | | | |
| US Alt-A residential | | | | | | | | | | | | | | | | | | | | | | | | | | | | | | | | |
| Direct lending | | | (1 | ) | | | – | | | | – | | | | – | | | | 108 | | | | – | | | | 108 | | | | 96 | |
MBSs41 | | | 4 | | | | 575 | | | | 3 | | | | 1,564 | | | | 9,957 | | | | 100 | | | | 9,857 | | | | 5,013 | |
| | | | | | | | | | | | | | | | | |
– high grade42 | | | – | | | | 35 | | | | 3 | | | | 45 | | | | 660 | | | | 100 | | | | 560 | | | | 473 | |
| – rated C to A | | | 4 | | | | 539 | | | | – | | | | 1,520 | | | | 9,254 | | | | – | | | | 9,254 | | | | 4,503 | |
| – not publicly rated | | | – | | | | 1 | | | | – | | | | (1 | ) | | | 43 | | | | – | | | | 43 | | | | 37 | |
| | | | | | | | | | | | | | | | | |
| | | | | | | | | | | | | | | | | | | | | | | | | | | | | | | | | |
| | | | | | | | | | | | | | | | | |
| | | | | | | | | | | | | | | | | | | | | | | | | | | | | | | | | |
| | | | 3 | | | | 575 | | | | 3 | | | | 1,564 | | | | 10,065 | | | | 100 | | | | 9,965 | | | | 5,109 | |
| | | | | | | | | | | | | | | | | |
| US Government agency and sponsored enterprises | | | | | | | | | | | | | | | | | | | | | | | | | | | | | | | | |
MBSs41 | | | | | | | | | | | | | | | | | | | | | | | | | | | | | | | | |
– high grade42 | | | 3 | | | | 226 | | | | (11 | ) | | | (43 | ) | | | 23,739 | | | | – | | | | 23,739 | | | | 24,388 | |
| | | | | | | | | | | | | | | | | | | | | | | | | | | | | | | | | |
| Other residential | | | | | | | | | | | | | | | | | | | | | | | | | | | | | | | | |
| Direct lending | | | 63 | | | | – | | | | 35 | | | | – | | | | 424 | | | | – | | | | 424 | | | | 417 | |
MBSs41 | | | 6 | | | | 163 | | | | 4 | | | | (7 | ) | | | 6,571 | | | | – | | | | 6,571 | | | | 5,793 | |
| | | | | | | | | | | | | | | | | |
– high grade42 | | | 5 | | | | 149 | | | | 4 | | | | (7 | ) | | | 5,841 | | | | – | | | | 5,841 | | | | 5,256 | |
| – rated C to A | | | 1 | | | | 14 | | | | – | | | | – | | | | 648 | | | | – | | | | 648 | | | | 450 | |
| – not publicly rated | | | – | | | | – | | | | – | | | | – | | | | 82 | | | | – | | | | 82 | | | | 87 | |
| | | | | | | | | | | | | | | | | |
| | | | | | | | | | | | | | | | | | | | | | | | | | | | | | | | | |
| | | | | | | | | | | | | | | | | |
| | | | | | | | | | | | | | | | | | | | | | | | | | | | | | | | | |
| | | | 69 | | | | 163 | | | | 39 | | | | (7 | ) | | | 6,995 | | | | – | | | | 6,995 | | | | 6,210 | |
| | | | | | | | | | | | | | | | | |
| Commercial property | | | | | | | | | | | | | | | | | | | | | | | | | | | | | | | | |
MBS and MBS CDOs41 | | | 45 | | | | 1,366 | | | | 6 | | | | 112 | | | | 12,625 | | | | 421 | | | | 12,204 | | | | 10,493 | |
| | | | | | | | | | | | | | | | | |
– high grade42 | | | 5 | | | | 540 | | | | 4 | | | | 71 | | | | 6,341 | | | | 15 | | | | 6,326 | | | | 5,791 | |
| – rated C to A | | | 40 | | | | 826 | | | | 2 | | | | 36 | | | | 6,201 | | | | 406 | | | | 5,795 | | | | 4,637 | |
| – not publicly rated | | | – | | | | – | | | | – | | | | 5 | | | | 83 | | | | – | | | | 83 | | | | 65 | |
| | | | | | | | | | | | | | | | | |
| | | | | | | | | | | | | | | | | | | | | | | | | | | | | | | | | |
| Leveraged finance-related assets | | | | | | | | | | | | | | | | | | | | | | | | | | | | | | | | |
ABSs and ABS CDOs41 | | | 5 | | | | 453 | | | | – | | | | 18 | | | | 7,148 | | | | 788 | | | | 6,360 | | | | 5,721 | |
| | | | | | | | | | | | | | | | | |
– high grade42 | | | 3 | | | | 308 | | | | – | | | | (8 | ) | | | 6,078 | | | | 351 | | | | 5,727 | | | | 5,148 | |
| – rated C to A | | | 2 | | | | 145 | | | | – | | | | 26 | | | | 971 | | | | 437 | | | | 534 | | | | 472 | |
| – not publicly rated | | | – | | | | – | | | | – | | | | – | | | | 99 | | | | – | | | | 99 | | | | 101 | |
| | | | | | | | | | | | | | | | | |
| | | | | | | | | | | | | | | | | | | | | | | | | | | | | | | | | |
| Student loan-related assets | | | | | | | | | | | | | | | | | | | | | | | | | | | | | | | | |
ABSs and ABS CDOs41 | | | 7 | | | | 230 | | | | 3 | | | | (6 | ) | | | 7,161 | | | | 100 | | | | 7,061 | | | | 5,459 | |
| | | | | | | | | | | | | | | | | |
– high grade42 | | | 9 | | | | 44 | | | | 3 | | | | (4 | ) | | | 4,080 | | | | – | | | | 4,080 | | | | 3,626 | |
| – rated C to A | | | (2 | ) | | | 157 | | | | – | | | | (2 | ) | | | 2,620 | | | | 100 | | | | 2,520 | | | | 1,663 | |
| – not publicly rated | | | – | | | | 29 | | | | – | | | | – | | | | 461 | | | | – | | | | 461 | | | | 170 | |
| | | | | | | | | | | | | | | | | |
| | | | | | | | | | | | | | | | | | | | | | | | | | | | | | | | | |
| Other assets | | | | | | | | | | | | | | | | | | | | | | | | | | | | | | | | |
ABS and ABS CDOs41 | | | 2 | | | | 385 | | | | 1 | | | | 67 | | | | 15,497 | | | | 7,765 | | | | 7,732 | | | | 5,622 | |
| | | | | | | | | | | | | | | | | |
– high grade42 | | | – | | | | 188 | | | | – | | | | 1 | | | | 10,947 | | | | 7,447 | | | | 3,500 | | | | 2,884 | |
| – rated C to A | | | 2 | | | | 188 | | | | 1 | | | | 46 | | | | 4,059 | | | | 318 | | | | 3,741 | | | | 2,379 | |
| – not publicly rated | | | – | | | | 9 | | | | – | | | | 20 | | | | 491 | | | | – | | | | 491 | | | | 359 | |
| | | | | | | | | | | | | | | | | |
| | | | | | | | | | | | | | | | | | | | | | | | | | | | | | | | | |
| | | | | | | | | | | | | | | | | |
| | | | | | | | | | | | | | | | | | | | | | | | | | | | | | | | | |
| Total | | | 157 | | | | 3,718 | | | | 35 | | | | 2,087 | | | | 90,657 | | | | 9,522 | | | | 81,135 | | | | 67,232 | |
| | | | | | | | | | | | | | | | | |
134
Report of the Directors: Operating and Financial Review(continued)
| | | | | | | | | | | | | | | | | | | | | | | | | | | | | | | | | |
| | | 2009 | | At 31 December 2009 |
| | | Gross fair value | | | | | | | | | | | | | | | | | | | | |
| | | movements | | Realised | | | | | | | | | | | Credit | | | | | | | |
| | | | | | | Other | | | gains/ | | | | | | | | | | | default | | | | | | | |
| | | | | | | compre- | | | (losses) in | | | | | | | | | | | swap | | | Net | | | | |
| | | Income | | | hensive | | | the income | | | Reclassi- | | | Gross | | | gross | | | principal | | | Carrying | |
| | | Statement | 43 | | income | 44 | | statement | 45 | | fied | 46 | | principal | 47 | | protection | 48 | | exposure | 49 | | Amount | 50 |
| | | US$m | | | US$m | | | US$m | | | US$m | | | US$m | | | US$m | | | US$m | | | US$m | |
| | | | | | | | | | | | | | | | | | | | | | | | | | | | | | | | | |
| Mortgage-related assets | | | | | | | | | | | | | | | | | | | | | | | | | | | | | | | | |
| Sub-prime residential | | | | | | | | | | | | | | | | | | | | | | | | | | | | | | | | |
| Direct lending | | | (227 | ) | | | – | | | | (40 | ) | | | – | | | | 1,703 | | | | – | | | | 1,703 | | | | 1,439 | |
MBSs41 | | | (44 | ) | | | 187 | | | | (130 | ) | | | 795 | | | | 7,483 | | | | 1,248 | | | | 6,235 | | | | 3,419 | |
| | | | | | | | | | | | | | | | | |
– high grade42 | | | (16 | ) | | | 177 | | | | 1 | | | | 134 | | | | 2,762 | | | | 603 | | | | 2,159 | | | | 1,719 | |
| – rated C to A | | | (25 | ) | | | 10 | | | | (131 | ) | | | 661 | | | | 4,616 | | | | 645 | | | | 3,971 | | | | 1,700 | |
| – not publicly rated | | | (3 | ) | | | – | | | | – | | | | – | | | | 105 | | | | – | | | | 105 | | | | – | |
| | | | | | | | | | | | | | | | | |
| | | | | | | | | | | | | | | | | | | | | | | | | | | | | | | | | |
MBS CDOs41 | | | (2 | ) | | | (9 | ) | | | – | | | | 2 | | | | 138 | | | | 15 | | | | 123 | | | | 29 | |
| | | | | | | | | | | | | | | | | |
– high grade42 | | | – | | | | (1 | ) | | | – | | | | – | | | | 36 | | | | 15 | | | | 21 | | | | 17 | |
| – rated C to A | | | (1 | ) | | | (8 | ) | | | – | | | | 2 | | | | 89 | | | | – | | | | 89 | | | | 10 | |
| – not publicly rated | | | (1 | ) | | | – | | | | – | | | | – | | | | 13 | | | | – | | | | 13 | | | | 2 | |
| | | | | | | | | | | | | | | | | |
| | | | | | | | | | | | | | | | | | | | | | | | | | | | | | | | | |
| | | | | | | | | | | | | | | | | |
| | | | | | | | | | | | | | | | | | | | | | | | | | | | | | | | | |
| | | | (273 | ) | | | 178 | | | | (170 | ) | | | 797 | | | | 9,324 | | | | 1,263 | | | | 8,061 | | | | 4,887 | |
| | | | | | | | | | | | | | | | | |
| US Alt-A residential | | | | | | | | | | | | | | | | | | | | | | | | | | | | | | | | |
| Direct lending | | | – | | | | – | | | | – | | | | – | | | | 129 | | | | – | | | | 129 | | | | 113 | |
MBSs41 | | | 95 | | | | 661 | | | | (143 | ) | | | 1,693 | | | | 13,546 | | | | 491 | | | | 13,055 | | | | 6,427 | |
| | | | | | | | | | | | | | | | | |
– high grade42 | | | (9 | ) | | | 361 | | | | 1 | | | | 317 | | | | 1,625 | | | | 428 | | | | 1,197 | | | | 1,237 | |
| – rated C to A | | | 103 | | | | 300 | | | | (144 | ) | | | 1,376 | | | | 11,885 | | | | 63 | | | | 11,822 | | | | 5,176 | |
| – not publicly rated | | | 1 | | | | – | | | | – | | | | – | | | | 36 | | | | – | | | | 36 | | | | 14 | |
| | | | | | | | | | | | | | | | | |
| | | | | | | | | | | | | | | | | | | | | | | | | | | | | | | | | |
| | | | | | | | | | | | | | | | | |
| | | | | | | | | | | | | | | | | | | | | | | | | | | | | | | | | |
| | | | 95 | | | | 661 | | | | (143 | ) | | | 1,693 | | | | 13,675 | | | | 491 | | | | 13,184 | | | | 6,540 | |
| | | | | | | | | | | | | | | | | |
| US Government agency and sponsored enterprises | | | | | | | | | | | | | | | | | | | | | | | | | | | | | | | | |
MBSs41 | | | | | | | | | | | | | | | | | | | | | | | | | | | | | | | | |
– high grade42 | | | 116 | | | | 252 | | | | (2 | ) | | | (123 | ) | | | 15,827 | | | | – | | | | 15,827 | | | | 16,040 | |
| | | | | | | | | | | | | | | | | | | | | | | | | | | | | | | | | |
| Other residential | | | | | | | | | | | | | | | | | | | | | | | | | | | | | | | | |
| Direct lending | | | 79 | | | | – | | | | 70 | | | | – | | | | 463 | | | | – | | | | 463 | | | | 452 | |
MBSs41 | | | 71 | | | | 625 | | | | 37 | | | | 50 | | | | 8,741 | | | | 91 | | | | 8,650 | | | | 7,443 | |
| | | | | | | | | | | | | | | | | |
– high grade42 | | | 76 | | | | 617 | | | | 37 | | | | 75 | | | | 7,884 | | | | 91 | | | | 7,793 | | | | 6,440 | |
| – rated C to A | | | (5 | ) | | | 10 | | | | – | | | | (34 | ) | | | 773 | | | | – | | | | 773 | | | | 941 | |
| – not publicly rated | | | – | | | | (2 | ) | | | – | | | | 9 | | | | 84 | | | | – | | | | 84 | | | | 62 | |
| | | | | | | | | | | | | | | | | |
| | | | | | | | | | | | | | | | | | | | | | | | | | | | | | | | | |
| | | | | | | | | | | | | | | | | |
| | | | | | | | | | | | | | | | | | | | | | | | | | | | | | | | | |
| | | | 150 | | | | 625 | | | | 107 | | | | 50 | | | | 9,204 | | | | 91 | | | | 9,113 | | | | 7,895 | |
| | | | | | | | | | | | | | | | | |
| Commercial property | | | | | | | | | | | | | | | | | | | | | | | | | | | | | | | | �� |
MBS and MBS CDOs41 | | | 35 | | | | 702 | | | | (8 | ) | | | (104 | ) | | | 13,734 | | | | 395 | | | | 13,339 | | | | 9,954 | |
| | | | | | | | | | | | | | | | | |
– high grade42 | | | 72 | | | | 683 | | | | (8 | ) | | | (90 | ) | | | 9,805 | | | | 264 | | | | 9,541 | | | | 7,537 | |
| – rated C to A | | | (37 | ) | | | 17 | | | | – | | | | (12 | ) | | | 3,860 | | | | 131 | | | | 3,729 | | | | 2,365 | |
| – not publicly rated | | | – | | | | 2 | | | | – | | | | (2 | ) | | | 69 | | | | – | | | | 69 | | | | 52 | |
| | | | | | | | | | | | | | | | | |
| | | | | | | | | | | | | | | | | | | | | | | | | | | | | | | | | |
| Leveraged finance-related assets | | | | | | | | | | | | | | | | | | | | | | | | | | | | | | | | |
ABSs and ABS CDOs41 | | | (1 | ) | | | 721 | | | | – | | | | (40 | ) | | | 7,516 | | | | 895 | | | | 6,621 | | | | 5,612 | |
| | | | | | | | | | | | | | | | | |
– high grade42 | | | 14 | | | | 758 | | | | – | | | | (41 | ) | | | 6,620 | | | | 414 | | | | 6,206 | | | | 5,301 | |
| – rated C to A | | | (15 | ) | | | (37 | ) | | | – | | | | 1 | | | | 881 | | | | 481 | | | | 400 | | | | 295 | |
| – not publicly rated | | | – | | | | – | | | | – | | | | – | | | | 15 | | | | – | | | | 15 | | | | 16 | |
| | | | | | | | | | | | | | | | | |
| | | | | | | | | | | | | | | | | | | | | | | | | | | | | | | | | |
| Student loan-related assets | | | | | | | | | | | | | | | | | | | | | | | | | | | | | | | | |
ABSs and ABS CDOs41 | | | (6 | ) | | | 569 | | | | 2 | | | | 32 | | | | 7,192 | | | | 224 | | | | 6,968 | | | | 5,122 | |
| | | | | | | | | | | | | | | | | |
– high grade42 | | | 2 | | | | 630 | | | | – | | | | 32 | | | | 6,690 | | | | 30 | | | | 6,660 | | | | 5,019 | |
| – rated C to A | | | (8 | ) | | | (61 | ) | | | 2 | | | | – | | | | 477 | | | | 194 | | | | 283 | | | | 76 | |
| – not publicly rated | | | – | | | | – | | | | – | | | | – | | | | 25 | | | | – | | | | 25 | | | | 27 | |
| | | | | | | | | | | | | | | | | |
| | | | | | | | | | | | | | | | | | | | | | | | | | | | | | | | | |
| Other assets | | | | | | | | | | | | | | | | | | | | | | | | | | | | | | | | |
ABS and ABS CDOs41 | | | 74 | | | | 415 | | | | (17 | ) | | | 91 | | | | 17,608 | | | | 8,797 | | | | 8,811 | | | | 6,327 | |
| | | | | | | | | | | | | | | | | |
– high grade42 | | | 18 | | | | 288 | | | | 10 | | | | 31 | | | | 12,846 | | | | 8,607 | | | | 4,239 | | | | 3,564 | |
| – rated C to A | | | 40 | | | | 152 | | | | (29 | ) | | | 85 | | | | 4,126 | | | | 190 | | | | 3,936 | | | | 2,245 | |
| – not publicly rated | | | 16 | | | | (25 | ) | | | 2 | | | | (25 | ) | | | 636 | | | | – | | | | 636 | | | | 518 | |
| | | | | | | | | | | | | | | | | |
| | | | | | | | | | | | | | | | | | | | | | | | | | | | | | | | | |
| | | | | | | | | | | | | | | | | |
| | | | | | | | | | | | | | | | | | | | | | | | | | | | | | | | | |
| Total | | | 190 | | | | 4,123 | | | | (231 | ) | | | 2,396 | | | | 94,080 | | | | 12,156 | | | | 81,924 | | | | 62,377 | |
| | | | | | | | | | | | | | | | | |
For footnotes, see page 174.
135
Report of the Directors: Operating and Financial Review(continued)
Analysis of exposures and significant movements
(Audited)
Sub-prime residential mortgage-related assets
Sub-prime residential mortage-related assets included US$3.1bn (2009: US$3.7bn) related to US-originated assets and US$1.1bn (2009: US$1.1bn) relating to UK non-conforming residential mortgage-related assets. Of the non-high grade assets held of US$1.7bn (2009: US$1.7bn), US$1.5bn (2009: US$1.6bn) related to US-originated assets, reflecting the higher quality of the UK-originated assets.
A modest increase in observable values of our sub-prime assets took place in 2010. Further net impairment of US$48m on assets classified as available for sale was recognised in 2010 (2009: US$559m) as losses were incurred under current accounting impairment rules. Our expectation of cash losses on the underlying assets did not increase from that at 31 December 2009. Of the above impairment, US$54m (2009: US$312m) occurred in the SICs and was borne by the capital note holders.
US Alt-A residential mortgage-related assets
During 2010, spreads on Alt-A mortgage-related assets tightened modestly from the levels seen in 2009. Further impairments of US$884m (2009: US$1,372m) were recorded in respect of Alt-A mortgage-related assets as losses were incurred under the accounting rules described in the paragraph above, without reference to the amount of expected loss. Our expectation of losses in the underlying assets did not increase from that at 31 December 2009. Of the impairment above, US$450m (2009: US$346m) occurred in the SICs and was borne by the capital note holders.
The downgrade of our US Alt-A residential MBSs is reflected in the disclosure of fair value movements in the above tables as if the downgrade had taken effect on 1 January 2010.
The following table shows the vintages of the collateral assets supporting our holdings of US sub-prime and Alt-A MBSs. Market prices for these instruments generally incorporate higher discounts for later vintages. The majority of our holdings of US sub-prime MBSs originated pre-2007; holdings of US Alt-A MBSs are more evenly distributed between pre-2007 vintages and those from 2007 onwards.
Vintages of US sub-prime and Alt-A mortgage-backed securities
(Audited)
| | | | | | | | | | | | | | | | | |
| | | Gross principal47of US sub-prime | | Gross principal47 of US Alt-A |
| | | mortgage-backed securities | | mortgage-backed securities |
| | | at 31 December | | at 31 December |
| | | 2010 | | | 2009 | | | 2010 | | | 2009 | |
| | | US$m | | | US$m | | | US$m | | | US$m | |
Mortgage vintage | | | | | | | | | | | | | | | | |
| Pre-2006 | | | 1,061 | | | | 1,748 | | | | 1,159 | | | | 2,108 | |
| 2006 | | | 1,822 | | | | 2,827 | | | | 5,147 | | | | 6,225 | |
| 2007 | | | 979 | | | | 1,187 | | | | 3,651 | | | | 5,213 | |
| | | | | | | | | | | |
| | | | | | | | | | | | | | | | | |
| | | | 3,862 | | | | 5,762 | | | | 9,957 | | | | 13,546 | |
| | | | | | | | | | | |
For footnote, see page 174.
US Government agency and sponsored enterprises mortgage-related assets
During 2010, we increased our holdings of US Government agency and sponsored enterprises mortgage-related assets by US$8.3bn.
Other residential mortgage-related assets
The majority of our other residential mortgage-related assets were originated in the UK (2010: US$3.9bn; 2009: US$4.7bn). No impairments were recognised in respect of these UK originated assets in 2010 (2009: nil), reflecting credit support within the asset portfolio.
Commercial property mortgage-related assets
Of our total of US$10.5bn (2009: US$10.0bn) of commercial property mortgage-related assets, US$5.2bn related to US originated assets (2009: US$4.3bn). Spreads tightened on both US and non-US commercial property mortgage-related assets during 2010. Impairments of US$5m (2009: US$88m) were recognised in 2010.
Leveraged finance-related assets
The majority of these assets related to US-originated exposures; 90% (2009: 94%) were high grade with no impairments recorded in the year (2009: nil).
136
Report of the Directors: Operating and Financial Review(continued)
Student loan-related assets
Our holdings in student loan-related assets were US$5.5bn (2009: US$5.1bn). No impairments were recorded on student loan-related assets in 2010 (2009: nil).
Transactions with monoline insurers
(Audited)
HSBC’s exposure to derivative transactions entered into directly with monolines
Our principal exposure to monolines is through a number of OTC derivative transactions, mainly credit default swaps (‘CDS’s). We entered into these CDSs primarily to purchase credit protection against securities held at the time within the trading portfolio.
During 2010, the notional value of derivative contracts with monolines and our overall credit exposure to monolines decreased as a number of transactions were commuted, others matured, and credit spreads narrowed. The table below sets out the fair value, essentially the replacement cost, of the
remaining derivative transactions at 31 December 2010, and hence the amount at risk if the CDS protection purchased were to be wholly ineffective because, for example, the monoline insurer was unable to meet its obligations. In order to further analyse that risk, the value of protection purchased is shown subdivided between those monolines that were rated by S&P at ‘BBB- or above’ at 31 December 2010, and those that were ‘below BBB–’ (BBB– is the S&P cut-off for an investment grade classification). The ‘Credit risk adjustment’ column indicates the valuation adjustment taken against the net exposures, and reflects our best estimate of the likely loss of value on purchased protection arising from the deterioration in creditworthiness of the monolines. These valuation adjustments, which reflect a measure of the irrecoverability of the protection purchased, have been charged to the income statement. During 2010, the credit risk adjustment on derivative contracts with monolines decreased as a number of transactions commuted and others matured.
HSBC’s exposure to derivative transactions entered into directly with monoline insurers
(Audited)
| | | | | | | | | | | | | | | | | |
| | | | | | | Net exposure | | | | | | | | |
| | | | | | | before credit | | | | | | | Net exposure | |
| | | Notional | | | risk | | | Credit risk | | | after credit | |
| | | amount | | | adjustment | 51 | | Adjustment | 52 | | risk adjustment | |
| | | US$m | | | US$m | | | US$m | | | US$m | |
At 31 December 2010 | | | | | | | | | | | | | | | | |
| Derivative transactions with monoline counterparties | | | | | | | | | | | | | | | | |
| Monoline – investment grade (BBB– or above) | | | 5,179 | | | | 876 | | | | (88 | ) | | | 788 | |
| Monoline – sub-investment grade (below BBB–) | | | 2,290 | | | | 648 | | | | (431 | ) | | | 217 | |
| | | | | | | | | |
| | | | | | | | | | | | | | | | | |
| | | | 7,469 | | | | 1,524 | | | | (519 | ) | | | 1,005 | |
| | | | | | | | | |
| | | | | | | | | | | | | | | | | |
| At 31 December 2009 | | | | | | | | | | | | | | | | |
| Derivative transactions with monoline counterparties | | | | | | | | | | | | | | | | |
| Monoline – investment grade (BBB– or above) | | | 5,623 | | | | 997 | | | | (100 | ) | | | 897 | |
| Monoline – sub-investment grade (below BBB–) | | | 4,400 | | | | 1,317 | | | | (909 | ) | | | 408 | |
| | | | | | | | | |
| | | | | | | | | | | | | | | | | |
| | | | 10,023 | | | | 2,314 | | | | (1,009 | ) | | | 1,305 | |
| | | | | | | | | |
For footnotes, see page 174.
The above table can be analysed as follows. HSBC has derivative transactions referenced to underlying securities with a notional value of US$7.5bn (2009: US$10.0bn), whose value at 31 December 2010 indicated a potential claim against the protection purchased from the monolines of some US$1.5bn (2009: US$2.3bn). On the basis of a credit assessment of the monolines, a provision of US$519m has been taken (2009: US$1.0bn), leaving US$1.0bn exposed (2009: US$1.3bn), of which US$788m is recoverable from monolines rated investment grade at 31 December 2010 (2009: US$897m). The provisions taken imply in aggregate that 90 cents in the dollar will be recoverable from investment
grade monolines and 33 cents in the dollar from non-investment grade monolines (2009: 90 cents and 31 cents, respectively).
For the CDSs, market prices are generally not readily available. Therefore the CDSs are valued on the basis of market prices of the referenced securities.
The credit risk adjustment against monolines is determined by one of a number of methodologies, dependent upon the internal credit rating of the monoline. Our assignment of internal credit
137
Report of the Directors: Operating and Financial Review(continued)
ratings is based upon detailed credit analysis, and may differ from external ratings.
Credit risk adjustments for monolines
| • | | For highly-rated monolines, the standard credit risk adjustment methodology (as described on page 312) applies, with the exception that the future exposure profile is deemed to be constant (equal to the current market value) over the weighted average life of the referenced security, and the credit risk adjustment cannot fall below 10% of the mark-to-market exposure. |
| |
| • | | In respect of monolines, where default has either occurred or there is a strong possibility of default in the near term, the adjustment is determined based on the estimated probabilities of various potential scenarios, and the estimated recovery in each case. |
| |
| • | | For other monoline exposures, the credit risk adjustment follows the methodology for highly-rated monolines, adjusted to include the probability of a claim arising in respect of the referenced security, and applies implied probabilities of default where the likelihood of a claim is believed to be high. |
| |
As described above, HSBC’s monoline credit risk adjustment calculation utilises a range of approaches dependent upon the credit quality of the monoline. The net impact of utilising the methodology adopted for ‘highly-rated’ monolines across all monolines would be a reduction in credit risk adjustment of US$94m. The net impact of utilising a methodology based on credit default swap spreads would be an increase in credit risk adjustment of US$8m.
At 31 December 2010, US$1.4bn (2009: US$2.6bn) notional value of securities referenced by monoline CDS transactions with a market value of US$1.0bn (2009: US$1.9bn) were held in the loans and receivables category, having been included in the reclassification of financial assets described in Note 18 on the Financial Statements. At the date of reclassification, the market value of the remaining assets was US$1.2bn. The reclassification resulted in an accounting asymmetry between the CDSs, which continue to be held at fair value through profit and loss, and the reclassified securities, which are accounted for on an amortised cost basis. If the reclassifications had not occurred, the impact on the income statement for 2010 would have been a decrease in profit of US$3m (2009: increase in profit of US$5m). This amount represents the difference between the increase in market value of the securities during 2010 and the accretion recognised under the amortised cost method in 2010.
HSBC’s exposure to direct lending and irrevocable commitments to lend to monolines
HSBC had no liquidity facilities to monolines at 31 December 2010 (2009: minimal).
HSBC’s exposure to debt securities which benefit from guarantees provided by monolines
Within both the trading and available-for-sale portfolios, we hold bonds that are ‘wrapped’ with a credit enhancement from a monoline. As the bonds are traded explicitly with the benefit of this enhancement, any deterioration in the credit profile of the monoline is reflected in market prices and, therefore, in the carrying amount of these securities at 31 December 2010. For wrapped bonds held in our trading portfolio, the mark-to-market movement has been reflected through the income statement. For wrapped bonds held in the available-for-sale portfolio, the mark-to-market movement is reflected in equity unless there is objective evidence of impairment, in which case the impairment loss is reflected in the income statement. No wrapped bonds were included in the reclassification of financial assets described in Note 18 on the Financial Statements.
HSBC’s exposure to Credit Derivative Product Companies
(Audited)
Credit Derivative Product Companies (‘CDPC’s) are independent companies that specialise in selling credit default protection on corporate exposures. OTC derivative exposure to CDPCs became a focus during the second half of 2008 as the spreads widened, but these exposures reduced during 2009 as the spreads tightened again. At 31 December 2010, HSBC had purchased from CDPCs credit protection with a notional value of US$4.9bn (2009: US$5.0bn) which had a fair value of US$0.2bn (2009: US$0.3bn), against which a credit risk adjustment (a provision) of US$0.1bn (2009: US$0.1bn) was held. At 31 December 2010, none of the exposure was to CDPCs with investment grade ratings (2009: 83%). The deterioration reflects rating downgrades and withdrawals during 2010.
Leveraged finance transactions
(Audited)
Leveraged finance transactions include sub-investment grade acquisition or event-driven financing. The following table shows our exposure to leveraged finance transactions arising from primary transactions. Our additional exposure to leveraged finance loans through holdings of ABSs from our trading and investment activities is shown in the table on page 133.
138
Report of the Directors: Operating and Financial Review(continued)
HSBC’s exposure to leveraged finance transactions
(Audited)
| | | | | | | | | | | | | | | | | | | | | | | | | |
| | | At 31 December 2010 | | | At 31 December 2009 | |
| | | Funded | | | Unfunded | | | Total | | | Funded | | | Unfunded | �� | | Total | |
| | | Exposures | 53 | | exposures | 53 | | exposures | | | Exposures | 53 | | exposures | 53 | | exposures | |
| | | US$m | | | US$m | | | US$m | | | US$m | | | US$m | | | US$m | |
| | | | | | | | | | | | | | | | | | | | | | | | | |
| Europe | | | 3,337 | | | | 298 | | | | 3,635 | | | | 3,790 | | | | 368 | | | | 4,158 | |
| Rest of Asia-Pacific | | | 17 | | | | 22 | | | | 39 | | | | 70 | | | | 22 | | | | 92 | |
| North America | | | 1,066 | | | | 185 | | | | 1,251 | | | | 1,713 | | | | 188 | | | | 1,901 | |
| | | | | | | | | | | | | |
| | | | | | | | | | | | | | | | | | | | | | | | | |
| | | | 4,420 | | | | 505 | | | | 4,925 | | | | 5,573 | | | | 578 | | | | 6,151 | |
| | | | | | | | | | | | | |
| | | | | | | | | | | | | | | | | | | | | | | | | |
| Held within: | | | | | | | | | | | | | | | | | | | | | | | | |
| – loans and receivables | | | 4,199 | | | | 393 | | | | 4,592 | | | | 5,569 | | | | 386 | | | | 5,955 | |
| – fair value through profit or loss | | | 221 | | | | 112 | | | | 333 | | | | 4 | | | | 192 | | | | 196 | |
| | |
| For footnotes, see page 174. |
We held leveraged finance commitments of US$5.1bn at 31 December 2010 (2009: US$6.5bn), of which US$4.6bn (2009: US$5.9bn) was funded.
As described in Note 18 on the Financial Statements, certain leveraged finance loans were reclassified from held for trading to loans and receivables. As a result, these loans are held at amortised cost subject to impairment and are not marked to market, and net gains of US$0.1bn (2009: net gains of US$1.2bn) were not taken to the income statement in 2010.
At 31 December 2010, our principal exposures were to companies in two sectors: US$2.8bn to data processing (2009: US$3.8bn) and US$1.8bn to communications and infrastructure (2009: US$1.9bn). During 2010, 99% of the total fair value movement not recognised was against exposures in these two sectors (2009: 99%).
Representations and warranties related to mortgage sales and securitisation activities
(Audited)
We have been involved in various activities related to the sale and securitisation of residential mortgages, which are not recognised on our balance sheet. These activities include:
| • | | the purchase of US$24bn of third party originated mortgages by HSBC Bank USA and securitisation of these by HSBC Securities (USA) Inc. (‘HSI’) between 2005 and 2007; |
| |
| • | | HSI acting as underwriter for third party issuance of private label MBSs with an original issuance value of US$37bn, most of which were sub-prime, as well as underwriting US$6bn of MBSs issued by HSBC Finance; and |
| |
| • | | the origination and sale by HSBC Bank USA of mortgage loans, primarily to government sponsored entities. |
In sales and securitisations of mortgage loans, various representations and warranties regarding the loans may be made to purchasers of the mortgage loans and MBSs. In respect of the purchase and securitisation of third party originated mortgages and the underwriting of third party MBSs, the obligation to repurchase loans in the event of a breach of loan level representations and warranties resides predominantly with the organisation that originated the loan. While certain of these originators are or may become financially impaired, and therefore, unable to fulfil their repurchase obligations, we do not believe we have significant exposure for repurchases on these loans.
At 31 December 2010, a liability of US$262m was recognised in respect of various representations and warranties, relating to the origination and sale by HSBC Bank USA of mortgage loans, primarily to government sponsored entities (2009: US$66m). These relate to, among other things, the ownership of the loans, the validity of the liens, the loan selection and origination process, and the compliance to the origination criteria established by the agencies. In the event of a breach of our representations and warranties, HSBC Bank USA may be obliged to repurchase the loans with identified defects or to indemnify the buyers. The liability is estimated based on the level of outstanding repurchase demands, the level of outstanding requests for loan files and estimated future demands in respect of mortgages sold to date which are either two or more payments delinquent or expected to become delinquent at an estimated conversion rate. Repurchase demands of US$115m were outstanding at 2010 (2009: US$123m).
139
Report of the Directors: Operating and Financial Review(continued)
Upon receipt of a repurchase demand, we perform a detailed evaluation of the request. In many cases, we ultimately are not required to repurchase a loan as we are able to resolve the purported defect. From initial inquiry to ultimate resolution, a typical case takes roughly 12 months. Acceptance of a repurchase demand will involve either a) repurchase of the loan at the unpaid principal balance plus accrued interest or b) reimbursement for any realised loss on the sale of a property (‘make-whole’ payment).
To date, repurchase demands we have received primarily relate to prime loans sourced during 2004
through 2008 from the legacy broker channel which we exited in late 2008. Loans sold to GSEs and other third parties originated in 2004 through 2008 subject to representations and warranties for which we may be liable had an outstanding principal balance of approximately US$23.0bn at 31 December 2010, including US$14.3bn of loans sourced from our legacy broker channel.
The trend in repurchase demands received on loans sold to GSEs and other third parties by loan origination vintage, outstanding repurchase demands and movement in repurchase liabilities are as follows:
Trend in repurchase demands received by loans sold to GSEs and other third parties by origination vintage
| | | | | | | | | |
| | | 2010 | | | 2009 | |
| | | US$m | | | US$m | |
| | | | | | | | | |
| Pre-2004 | | | 14 | | | | 8 | |
| 2004 | | | 31 | | | | 9 | |
| 2005 | | | 24 | | | | 10 | |
| 2006 | | | 41 | | | | 21 | |
| 2007 | | | 161 | | | | 59 | |
| 2008 | | | 112 | | | | 53 | |
| Post-2008 | | | 34 | | | | 5 | |
| | | | | |
| | | | | | | | | |
| Total repurchase demands received | | | 417 | | | | 165 | |
| | | | | |
Outstanding repurchase demands received from GSEs and other third parties
| | | | | | | | | |
| | | At 31 December | |
| | | 2010 | | | 2009 | |
| | | US$m | | | US$m | |
| | | | | | | | | |
| GSEs | | | 92 | | | | 104 | |
| Others | | | 23 | | | | 19 | |
| | | | | |
| | | | | | | | | |
| Total | | | 115 | | | | 123 | |
| | | | | |
Movement in repurchase liability for loans sold to GSEs and other third parties
| | | | | | | | | |
| | | At 31 December |
| | | 2010 | | | 2009 | |
| | | US$m | | | US$m | |
| | | | | | | | | |
| At 1 January | | | 66 | | | | 13 | |
| Increase in liability recorded through earnings | | | 341 | | | | 65 | |
| Realised losses | | | (145 | ) | | | (12 | ) |
| | | | | |
| | | | | | | | | |
| At 31 December | | | 262 | | | | 66 | |
| | | | | |
Because the level of mortgage loan repurchase losses are dependent upon economic factors, investor demand strategies and other external risk factors such as housing market trends that may change, the level of the liability for a mortgage loan repurchase requires significant judgement. Because these estimates are influenced by factors outside our control, there is uncertainty inherent in them, making it reasonably possible that the estimates could change.
Risk elements in the loan portfolio
(Unaudited)
The disclosure of credit risk elements in this section reflects US accounting practice and classifications. The purpose of the disclosure is to present within the US disclosure framework those elements of the loan portfolios with a greater risk of loss. The three main classifications of credit risk elements presented are:
139(a)
Report of the Directors: Operating and Financial Review(continued)
| • | | unimpaired loans contractually past due 90 days or more as to interest or principal; and |
| |
| • | | troubled debt restructurings not included in the above. |
In the following tables, we present information on our impaired loans and advances in accordance with the classification approach described on page 114.
Interest forgone on impaired loans
Interest income that would have been recognised under the original terms of impaired and restructured loans amounted to approximately US$2.2bn in 2010 (2009: US$2.7bn). Interest income from such loans of approximately US$1.2bn was recorded in 2010 (2009: US$1.4bn).
Impaired loans
Loans are classified as impaired when there is objective evidence that not all contractual cash flows will be received. In accordance with IFRSs, we recognise interest income on assets after they have been written down as a result of an impairment loss.
Unimpaired loans past due 90 days or more
Loans that are subject to individual impairment assessment and are over 90 days past due as regards principal and/or interest are classified as unimpaired loans when we expect to recover the contractual cash flows in full.
Troubled debt restructurings
The SEC requires separate disclosure of any loans not included in the previous two categories whose terms have been modified to grant concessions other than are warranted by market conditions because of problems with the borrower. These are classified as
‘troubled debt restructurings’ (‘TDR’s). The definition of TDRs differs from the ‘Renegotiated loans that would otherwise be past due or impaired’ quantified on page 139(c) insofar as for TDRs, the delinquency status of the loan following restructuring may continue to be past due not impaired or, where appropriate, impaired. In addition, where a restructure is on market terms, the classification of a loan as a TDR may be discontinued after the first year if the debt performs in accordance with the new terms.
TDRs decreased by 3% in 2010, reflecting the movement in loan balances where long-term modifications were offered to customers experiencing payment difficulties, particularly in the real estate secured portfolios in the US.
Potential problem loans
Credit risk elements also cover potential problem loans. These are loans where information on possible credit problems among borrowers causes management to seriously doubt their ability to comply with the loan repayment terms. There are no potential problem loans other than those identified in the table of risk elements set out below, and as discussed in ‘Areas of special interest’ on page 103. ‘Areas of special interest’ includes further disclosure about certain homogeneous groups of loans which are collectively assessed for impairment, and represent the Group’s most significant exposures to potential problem loans, including ARMs and stated-income products. Collectively assessed loans and advances, as set out on page 119, although not classified as impaired until more than 90 days, are assessed collectively for losses that have been incurred but have not yet been individually identified. This policy is further described on page 94.
Analysis of risk elements in the loan portfolio by geographical region
(Unaudited)
| | | | | | | | | | | | | | | | | | | | | | | | | | | | | |
| | | | | | | | | | | | | | | Movement | | | | | | | | | | | Movement | |
| | | | | | | | | | | 31 Dec 09 | | | on a | | | | | | | | | | | on a | |
| | | | | | | Constant | | | at 31 Dec 10 | | | constant | | | | | | | | | | | constant | |
| | | 31 Dec 09 | | | currency | | | exchange | | | currency | | | 31 Dec 10 | | | Reported | | | currency | |
| | | as reported | | | effect | | | rates | | | basis | | | as reported | | | change | | | basis | |
| | | US$m | | | US$m | | | US$m | | | US$m | | | US$m | | | % | | | % | |
| | | | | | | | | | | | | | | | | | | | | | | | | | | | | |
| Europe | | | 11,418 | | | | (554 | ) | | | 10,864 | | | | 150 | | | | 11,014 | | | | (4 | ) | | | 1 | |
| Hong Kong | | | 1,096 | | | | (1 | ) | | | 1,095 | | | | (216 | ) | | | 879 | | | | (20 | ) | | | (20 | ) |
| Rest of Asia-Pacific | | | 1,380 | | | | 101 | | | | 1,481 | | | | 86 | | | | 1,567 | | | | 14 | | | | 6 | |
| Middle East | | | 1,986 | | | | (1 | ) | | | 1,985 | | | | 784 | | | | 2,769 | | | | 39 | | | | 39 | |
| North America | | | 24,643 | | | | 56 | | | | 24,699 | | | | (2,479 | ) | | | 22,220 | | | | (7 | ) | | | (10 | ) |
| Latin America | | | 4,662 | | | | 210 | | | | 4,872 | | | | (1,039 | ) | | | 3,833 | | | | (18 | ) | | | (21 | ) |
| | | | | | | | | | | | | | | | | | | |
| | | | | | | | | | | | | | | | | | | | | | | | | | | | | |
| | | | 45,185 | | | | (189 | ) | | | 44,996 | | | | (2,714 | ) | | | 42,282 | | | | (6 | ) | | | (6 | ) |
| | | | | | | | | | | | | | | | | | | |
139(b)
Report of the Directors: Operating and Financial Review(continued)
Analysis of risk elements in the loan portfolio by geographical region
(Unaudited)
| | | | | | | | | | | | | | | | | | | | | |
| | | At 31 December |
| | | 2010 | | | 2009 | | | 2008 | | | 2007 | | | 2006 | |
| | | US$m | | | US$m | | | US$m | | | US$m | | | US$m | |
| | | | | | | | | | | | | | | | | | | | | |
Impaired loans | | | | | | | | | | | | | | | | | | | | |
| Europe | | | 10,663 | | | | 10,873 | | | | 6,844 | | | | 6,266 | | | | 5,858 | |
| Hong Kong | | | 665 | | | | 846 | | | | 852 | | | | 433 | | | | 454 | |
| Rest of Asia-Pacific | | | 1,324 | | | | 1,201 | | | | 835 | | | | 779 | | | | 807 | |
| Middle East | | | 2,453 | | | | 1,666 | | | | 279 | | | | 309 | | | | 381 | |
North America2 | | | 10,789 | | | | 13,308 | | | | 14,285 | | | | 9,662 | | | | 6,108 | |
| Latin America | | | 2,390 | | | | 2,951 | | | | 2,327 | | | | 2,145 | | | | 1,478 | |
| | | | | | | | | | | |
| | | | | | | | | | | | | | | | | | | | | |
| | | | 28,284 | | | | 30,845 | | | | 25,422 | | | | 19,594 | | | | 15,086 | |
| | | | | | | | | | | |
| | | | | | | | | | | | | | | | | | | | | |
Unimpaired loans contractually past due 90 days or more as to principal or interest | | | | | | | | | | | | | | | | | | | | |
| Europe | | | 64 | | | | 57 | | | | 635 | | | | 202 | | | | 237 | |
| Hong Kong | | | 7 | | | | 4 | | | | 43 | | | | 49 | | | | 79 | |
| Rest of Asia-Pacific | | | 40 | | | | 36 | | | | 84 | | | | 94 | | | | 75 | |
| Middle East | | | 264 | | | | 215 | | | | 190 | | | | 62 | | | | 3 | |
| North America | | | 265 | | | | 217 | | | | 108 | | | | 24 | | | | 78 | |
| Latin America | | | 3 | | | | 40 | | | | 21 | | | | 421 | | | | 165 | |
| | | | | | | | | | | |
| | | | | | | | | | | | | | | | | | | | | |
| | | | 643 | | | | 569 | | | | 1,081 | | | | 852 | | | | 637 | |
| | | | | | | | | | | |
| | | | | | | | | | | | | | | | | | | | | |
Troubled debt restructurings (not included in the classifications above) | | | | | | | | | | | | | | | | | | | | |
| Europe | | | 240 | | | | 436 | | | | 366 | | | | 648 | | | | 360 | |
| Hong Kong | | | 205 | | | | 236 | | | | 165 | | | | 146 | | | | 189 | |
| Rest of Asia-Pacific | | | 198 | | | | 135 | | | | 90 | | | | 23 | | | | 56 | |
| Middle East | | | 50 | | | | 103 | | | | 29 | | | | 11 | | | | 17 | |
| North America | | | 9,670 | | | | 9,613 | | | | 5,618 | | | | 3,322 | | | | 1,712 | |
| Latin America | | | 1,319 | | | | 1,518 | | | | 1,067 | | | | 848 | | | | 915 | |
| | | | | | | | | | | |
| | | | | | | | | | | | | | | | | | | | | |
| | | | 11,682 | | | | 12,041 | | | | 7,335 | | | | 4,998 | | | | 3,249 | |
| | | | | | | | | | | |
| | | | | | | | | | | | | | | | | | | | | |
Trading loans classified as in default | | | | | | | | | | | | | | | | | | | | |
| North America | | | 412 | | | | 798 | | | | 561 | | | | 675 | | | | 127 | |
| | | | | | | | | | | |
| | | | | | | | | | | | | | | | | | | | | |
Risk elements on loans | | | | | | | | | | | | | | | | | | | | |
| Europe | | | 10,967 | | | | 11,366 | | | | 7,845 | | | | 7,116 | | | | 6,455 | |
| Hong Kong | | | 877 | | | | 1,086 | | | | 1,060 | | | | 628 | | | | 722 | |
| Rest of Asia-Pacific | | | 1,562 | | | | 1,372 | | | | 1,009 | | | | 896 | | | | 938 | |
| Middle East | | | 2,767 | | | | 1,984 | | | | 498 | | | | 382 | | | | 401 | |
| North America | | | 21,136 | | | | 23,936 | | | | 20,572 | | | | 13,683 | | | | 8,025 | |
| Latin America | | | 3,712 | | | | 4,509 | | | | 3,415 | | | | 3,414 | | | | 2,558 | |
| | | | | | | | | | | |
| | | | | | | | | | | | | | | | | | | | | |
| | | | 41,021 | | | | 44,253 | | | | 34,399 | | | | 26,119 | | | | 19,099 | |
| | | | | | | | | | | |
| | | | | | | | | | | | | | | | | | | | | |
Assets held for resale | | | | | | | | | | | | | | | | | | | | |
| Europe | | | 47 | | | | 52 | | | | 81 | | | | 59 | | | | 30 | |
| Hong Kong | | | 2 | | | | 10 | | | | 26 | | | | 29 | | | | 42 | |
| Rest of Asia-Pacific | | | 5 | | | | 8 | | | | 11 | | | | 5 | | | | 15 | |
| Middle East | | | 2 | | | | 2 | | | | 2 | | | | 2 | | | | 2 | |
| North America | | | 1,084 | | | | 707 | | | | 1,758 | | | | 1,172 | | | | 999 | |
| Latin America | | | 121 | | | | 153 | | | | 113 | | | | 101 | | | | 91 | |
| | | | | | | | | | | |
| | | | | | | | | | | | | | | | | | | | | |
| | | | 1,261 | | | | 932 | | | | 1,991 | | | | 1,368 | | | | 1,179 | |
| | | | | | | | | | | |
| | | | | | | | | | | | | | | | | | | | | |
Total risk elements | | | | | | | | | | | | | | | | | | | | |
| Europe | | | 11,014 | | | | 11,418 | | | | 7,926 | | | | 7,175 | | | | 6,485 | |
| Hong Kong | | | 879 | | | | 1,096 | | | | 1,086 | | | | 657 | | | | 764 | |
| Rest of Asia-Pacific | | | 1,567 | | | | 1,380 | | | | 1,020 | | | | 901 | | | | 953 | |
| Middle East | | | 2,769 | | | | 1,986 | | | | 500 | | | | 384 | | | | 403 | |
| North America | | | 22,220 | | | | 24,643 | | | | 22,330 | | | | 14,855 | | | | 9,024 | |
| Latin America | | | 3,833 | | | | 4,662 | | | | 3,528 | | | | 3,515 | | | | 2,649 | |
| | | | | | | | | | | |
| | | | | | | | | | | | | | | | | | | | | |
| | | | 42,282 | | | | 45,185 | | | | 36,390 | | | | 27,487 | | | | 20,278 | |
| | | | | | | | | | | |
| | | | | | | | | | | | | | | | | | | | | |
| | | | % | | | | % | | | | % | | | | % | | | | % | |
| | | | | | | | | | | | | | | | | | | | | |
Loan impairment allowances as a percentage of risk elements on loans73 | | | 49.8 | | | | 59.0 | | | | 70.8 | | | | 75.5 | | | | 71.6 | |
| | | | | | | | | | | |
For footnotes, see page 174.
139(c)
Report of the Directors: Operating and Financial Review(continued)
Liquidity and funding
(Audited)
HSBC expects its operating entities to manage liquidity and funding risk on a standalone basis employing a centrally imposed framework and limit structure which is adapted to variations in business mix and underlying markets. Our operating entities are required to maintain strong liquidity positions and to manage the liquidity profiles of their assets, liabilities and commitments with the objective of ensuring that their cash flows are balanced under various severe stress scenarios and that all their anticipated obligations can be met when due. The objective of our liquidity framework is to be very conservative and adaptable to changing business models, markets and regulation.
The objective of our liquidity and funding management framework is to ensure that all foreseeable funding commitments can be met when due, and that access to the wholesale markets is co-ordinated and cost-effective. To this end, we maintain a diversified funding base comprising core retail and corporate customer deposits and institutional balances. We augment this with wholesale funding and portfolios of highly liquid assets diversified by currency and maturity which are held to enable us to respond quickly and smoothly to unforeseen liquidity requirements.
We adapt our liquidity and funding risk management framework in response to changes in the mix of business that we undertake, and to changes in the nature of the markets in which we operate. We also seek to continuously evolve and strengthen our liquidity and funding risk management framework. As part of this process, we have refined the way in which we characterise core deposits. The characterisation takes into account the activities and operating environment in the entity originating the deposit, the nature of the customer and the size and pricing of the deposit. This exercise has resulted in a revised internal calculation of advances to core funding ratio (discussed more fully below), and comparatives have been restated accordingly. While total core deposits at the Group consolidated level have not changed materially, there have been some revisions to individual entities.
We employ a number of measures to monitor liquidity risk. The emphasis on the ‘ratio of net liquid assets to customer deposits’, as reported in the
Annual Report and Accounts 2009, has been reduced and a ‘stressed one month coverage ratio’, an extension of our projected cash flow scenario analysis, is now used as a simple and more useful metric to express liquidity risk. The bank also manages its intra-day liquidity positions so that it is able to meet payment and settlement obligations on a timely basis. Payment flows in real time gross settlement systems, expected peak payment flows and large time-critical payments are monitored during the day and the intra-day collateral position is managed so that there is liquidity available to meet payments.
Policies and procedures
(Audited)
The management of liquidity and funding is primarily undertaken locally in our operating entities in compliance with practices and limits set by the Risk Management Meeting. These limits vary according to the depth and liquidity of the market in which the entities operate. It is our policy that each banking entity should be self-sufficient when funding its own operations. Exceptions are permitted for certain short-term treasury requirements and start-up operations or for branches which do not have access to local deposit markets. These entities are funded from our largest banking operations and within clearly defined internal and regulatory guidelines and limits. The limits place formal restrictions on the transfer of resources between our entities and reflect the broad range of currencies, markets and time zones within which we operate.
Elements of our liquidity and funding management process
| • | | projecting cash flows by major currency under various stress scenarios and considering the level of liquid assets necessary in relation thereto; |
| |
| • | | monitoring balance sheet liquidity and advances to core funding ratios against internal and regulatory requirements; |
| |
| • | | maintaining a diverse range of funding sources with back-up facilities; |
| |
| • | | managing the concentration and profile of debt maturities; |
| |
| • | | managing contingent liquidity commitment exposures within pre-determined caps; |
| |
| • | | maintaining debt financing plans; |
| |
| • | | monitoring depositor concentration in order to avoid undue reliance on large individual depositors and ensure a satisfactory overall funding mix; and |
| |
| • | | maintaining liquidity and funding contingency plans. These plans identify early indicators of stress conditions and describe actions to be taken in the event of difficulties arising from systemic or other crises, while minimising adverse long-term implications for the business. |
140
Report of the Directors: Operating and Financial Review(continued)
Primary sources of funding
(Audited)
Current accounts and savings deposits payable on demand or at short notice form a significant part of our funding, and we place considerable importance on maintaining their stability. For deposits, stability depends upon preserving depositor confidence in our capital strength and liquidity, and on competitive and transparent pricing.
We also access professional markets in order to provide funding for non-banking subsidiaries that do not accept deposits, to align asset and liability maturities and currencies and to maintain a presence in local money markets. Market disruption continued to have adverse effects on the liquidity and funding risk profile of the banking system in 2010. Despite
these challenges, we have continued to have good access to debt capital markets. Group entities issued US$26bn of term debt securities in the public capital markets in 2010.
In aggregate, our banking entities are liquidity providers to the interbank market, placing significantly more funds with other banks than they themselves borrow. Our main operating subsidiary that does not accept deposits is HSBC Finance, which is funded principally by taking term funding in the professional markets and securitising assets. At 31 December 2010, US$65bn (2009: US$82bn) of HSBC Finance’s liabilities were drawn from professional markets, utilising a range of products, maturities and currencies.
Cash flows payable by HSBC under financial liabilities by remaining contractual maturities
(Audited)
| | | | | | | | | | | | | | | | | | | | | |
| | | | | | | | | | | Due | | | Due | | | | |
| | | | | | | Due | | | between | | | between | | | Due | |
| | | On | | | within 3 | | | 3 and 12 | | | 1 and 5 | | | after 5 | |
| | | demand | | | months | | | months | | | years | | | years | |
| | | US$m | | | US$m | | | US$m | | | US$m | | | US$m | |
| | | | | | | | | | | | | | | | | | | | | |
At 31 December 2010 | | | | | | | | | | | | | | | | | | | | |
| Deposits by banks | | | 42,481 | | | | 70,072 | | | | 8,393 | | | | 7,949 | | | | 1,346 | |
| Customer accounts | | | 881,575 | | | | 244,501 | | | | 89,557 | | | | 23,209 | | | | 3,483 | |
| Trading liabilities | | | 300,703 | | | | – | | | | – | | | | – | | | | – | |
| Financial liabilities designated at fair value | | | 7,421 | | | | 3,786 | | | | 7,825 | | | | 35,583 | | | | 61,575 | |
| Derivatives | | | 255,046 | | | | 531 | | | | 1,143 | | | | 2,065 | | | | 942 | |
| Debt securities in issue | | | 1,320 | | | | 48,062 | | | | 41,939 | | | | 62,148 | | | | 16,255 | |
| Subordinated liabilities | | | 34 | | | | 1,491 | | | | 1,863 | | | | 10,001 | | | | 51,293 | |
| Other financial liabilities | | | 24,834 | | | | 24,378 | | | | 7,944 | | | | 2,184 | | | | 824 | |
| | | | | | | | | | | |
| | | | | | | | | | | | | | | | | | | | | |
| | | | 1,513,414 | | | | 392,821 | | | | 158,664 | | | | 143,139 | | | | 135,718 | |
| Loan and other credit-related commitments | | | 524,394 | | | | 51,732 | | | | 14,023 | | | | 11,964 | | | | 400 | |
| Financial guarantees and similar contracts | | | 18,491 | | | | 9,233 | | | | 12,231 | | | | 7,082 | | | | 2,399 | |
| | | | | | | | | | | |
| | | | | | | | | | | | | | | | | | | | | |
| | | | 2,056,299 | | | | 453,786 | | | | 184,918 | | | | 162,185 | | | | 138,517 | |
| | | | | | | | | | | |
| | | | | | | | | | | | | | | | | | | | | |
| At 31 December 2009 | | | | | | | | | | | | | | | | | | | | |
| Deposits by banks | | | 39,484 | | | | 85,922 | | | | 18,925 | | | | 6,180 | | | | 1,359 | |
| Customer accounts | | | 800,199 | | | | 277,071 | | | | 71,243 | | | | 45,561 | | | | 7,911 | |
| Trading liabilities | | | 268,130 | | | | – | | | | – | | | | – | | | | – | |
| Financial liabilities designated at fair value | | | 6,628 | | | | 1,050 | | | | 5,976 | | | | 36,185 | | | | 67,209 | |
| Derivatives | | | 245,027 | | | | 300 | | | | 1,002 | | | | 467 | | | | 320 | |
| Debt securities in issue | | | 124 | | | | 49,493 | | | | 38,445 | | | | 66,661 | | | | 22,663 | |
| Subordinated liabilities | | | 43 | | | | 481 | | | | 3,020 | | | | 8,660 | | | | 52,304 | |
| Other financial liabilities | | | 22,500 | | | | 25,123 | | | | 5,732 | | | | 2,354 | | | | 1,103 | |
| | | | | | | | | | | |
| | | | | | | | | | | | | | | | | | | | | |
| | | | 1,382,135 | | | | 439,440 | | | | 144,343 | | | | 166,068 | | | | 152,869 | |
Loan and other credit-related commitments54 | | | 494,269 | | | | 36,726 | | | | 11,810 | | | | 12,495 | | | | 2,750 | |
Financial guarantees and similar contracts54 | | | 16,561 | | | | 11,169 | | | | 12,737 | | | | 9,096 | | | | 3,688 | |
| | | | | | | | | | | |
| | | | | | | | | | | | | | | | | | | | | |
| | | | 1,892,965 | | | | 487,335 | | | | 168,890 | | | | 187,659 | | | | 159,307 | |
| | | | | | | | | | | |
For footnote, see page 174.
The balances in the above table will not agree directly with those in our consolidated balance sheet as the table incorporates, on an undiscounted basis, all cash flows relating to principal and future coupon payments (except for trading liabilities and trading derivatives). In addition, loan and other credit-related commitments and financial guarantees and
similar contracts are generally not recognised on our balance sheet. Trading liabilities and trading derivatives are included in the ‘On demand’ time bucket, and not by contractual maturity, because trading liabilities are typically held for short periods of time. We classify the undiscounted cash flows payable under hedging derivative liabilities
144
Report of the Directors: Operating and Financial Review(continued)
according to their contractual maturities. The undiscounted cash flows potentially payable under financial guarantees and similar contracts are classified on the basis of the earliest date they can be called.
Cash flows payable in respect of customer accounts are primarily contractually repayable on demand or at short notice. However, in practice, short-term deposit balances remain stable as inflows and outflows broadly match and a significant portion of loan commitments expire without being drawn upon.
The management of liquidity risk
(Audited)
We use a number of principal measures to manage liquidity risk, as described below.
Advances to core funding ratio
We emphasise the importance of core customer deposits as a source of funds to finance lending to customers, and discourage reliance on short-term professional funding. This is achieved by placing limits on banking entities which restrict their ability to increase loans and advances to customers without
corresponding growth in their core customer deposits or long-term debt funding. This measure is referred to as the ‘advances to core funding’ ratio. Previously, we utilised the ‘advances to deposits’ ratio.
Advances to core funding ratio limits are set by the Risk Management Meeting and monitored by Group Finance. The ratio expresses current loans and advances to customers as a percentage of the total of core customer deposits and term funding with a remaining term to maturity in excess of one year. Loans and advances to customers which are part of reverse repurchase arrangements, and where we receive securities which are deemed to be liquid, are excluded from the advances to core funding ratio.
The three principal banking entities listed in the table below represented 62% of our total core deposits at 31 December 2010 (31 December 2009: 63%). The table shows that loans and advances to customers in our principal banking entities are overwhelmingly financed by reliable and stable sources of funding. We would meet any unexpected net cash outflows by selling securities and accessing additional funding sources such as interbank or collateralised lending markets.
HSBC’s principal banking entities – the management of liquidity risk
(Audited)
| | | | | | | | | | | | | | | | | |
| | | Advances to core funding | | Stressed one month coverage |
| | | ratio during: | | ratio during: |
| | | 2010 | | | 2009 | | | 2010 | | | 2009 | |
| | | % | | | % | | | % | | | % | |
| | | | | | | | | | | | | | | | | |
HSBC Bank plc55 | | | | | | | | | | | | | | | | |
| Year-end | | | 103.0 | | | | 105.0 | | | | 111.1 | | | | 103.2 | |
| Maximum | | | 109.7 | | | | 116.0 | | | | 111.3 | | | | 108.1 | |
| Minimum | | | 102.6 | | | | 105.0 | | | | 103.2 | | | | 101.3 | |
| Average | | | 106.0 | | | | 110.6 | | | | 108.2 | | | | 103.9 | |
| | | | | | | | | | | | | | | | | |
The Hongkong and Shanghai Banking Corporation55 | | | | | | | | | | | | | | | | |
| Year-end | | | 70.3 | | | | 55.5 | | | | 144.6 | | | | 153.2 | |
| Maximum | | | 70.3 | | | | 62.0 | | | | 165.4 | | | | 153.2 | |
| Minimum | | | 55.5 | | | | 55.5 | | | | 132.6 | | | | 134.3 | |
| Average | | | 63.6 | | | | 57.5 | | | | 148.8 | | | | 144.8 | |
| | | | | | | | | | | | | | | | | |
| HSBC Bank USA | | | | | | | | | | | | | | | | |
| Year-end | | | 98.3 | | | | 101.0 | | | | 108.5 | | | | 105.3 | |
| Maximum | | | 104.3 | | | | 111.1 | | | | 118.5 | | | | 128.0 | |
| Minimum | | | 94.2 | | | | 99.5 | | | | 105.3 | | | | 105.3 | |
| Average | | | 98.0 | | | | 106.1 | | | | 112.3 | | | | 118.7 | |
| | | | | | | | | | | | | | | | | |
Total of HSBC’s other principal banking entities56 | | | | | | | | | | | | | | | | |
| Year-end | | | 89.1 | | | | 85.9 | | | | 119.6 | | | | 124.8 | |
| Maximum | | | 89.1 | | | | 89.2 | | | | 126.5 | | | | 124.8 | |
| Minimum | | | 85.7 | | | | 81.2 | | | | 118.1 | | | | 116.3 | |
| Average | | | 87.0 | | | | 85.9 | | | | 122.2 | | | | 120.5 | |
For footnotes, see page 174.
Stressed one month coverage ratio
The stressed one month coverage ratios tabulated above are derived from these scenario analyses, and express the stressed cash inflows as a percentage of stressed cash outflows over a one month time
horizon. Our entities are required to target a ratio of 100% or greater.
Projected cash flow scenario analysis
We use a number of standard projected cash flow
142
Report of the Directors: Operating and Financial Review(continued)
scenarios designed to model combinations of both Group-specific and market-wide liquidity crises, in which the rate and timing of deposit withdrawals and drawdowns on committed lending facilities are varied, and the ability to access interbank funding and term debt markets and to generate funds from asset portfolios is restricted. The scenarios are modelled by all our banking entities and by HSBC Finance. The appropriateness of the assumptions under each scenario is regularly reviewed. In addition to our standard projected cash flow scenarios, individual entities are required to design their own scenarios to reflect specific local market conditions, products and funding bases.
Limits for cumulative net cash flows under stress scenarios are set for each banking entity and for HSBC Finance. Both ratio and cash flow limits reflect the local market place, the diversity of funding sources available and the concentration risk from large depositors. Compliance with entity level limits is monitored centrally by Group Finance and reported regularly to the Risk Management Meeting.
HSBC Finance
As HSBC Finance is unable to accept standard retail customer deposits, it takes funding from the professional markets. HSBC Finance uses a range of measures to monitor funding risk, including projected cash flow scenario analysis and caps placed on the amount of unsecured term funding that can mature in any rolling three-month and rolling 12-month periods. HSBC Finance also maintains access to committed sources of secured funding and has in place committed backstop lines for short-term refinancing commercial paper (‘CP’) programmes. A CP programme is a short-term, unsecured funding tool used to manage day to day cash flow needs. In agreement with the rating agencies, issuance under this programme will not exceed 100% of committed bank backstop lines.
The need for HSBC Finance to refinance maturing term funding is mitigated by the continued run-down of its balance sheet.
HSBC Finance – funding
(Audited)
| | | | | | | | | |
| | | At 31 December |
| | | 2010 | | | 2009 | |
| | | US$bn | | | US$bn | |
| | | | | | | | | |
| Maximum amounts of unsecured term funding maturing in any rolling: | | | | | | | | |
| – 3 month period | | | 5.1 | | | | 5.2 | |
| – 12 month period | | | 10.8 | | | | 12.3 | |
Unused committed sources of secured funding57 | | | 0.5 | | | | 0.4 | |
| Committed backstop lines from non-Group entities in support of CP programmes | | | 4.3 | | | | 5.3 | |
For footnote, see page 174.
Contingent liquidity risk
(Audited)
In the normal course of business, we provide customers with committed facilities, including committed backstop lines to conduit vehicles sponsored by HSBC and standby facilities to corporate customers. These facilities increase our funding requirements when customers choose to raise drawdown levels over and above their normal utilisation rates. The liquidity risk consequences of increased levels of drawdown are analysed in the form of projected cash flows under different stress scenarios. The Risk Management Meeting also sets limits for non-cancellable contingent funding commitments by Group entity after due consideration of each entity’s ability to fund them. The limits are split according to the borrower, the liquidity of the underlying assets and the size of the committed line.
The Group’s contractual exposures at 31 December monitored under the contingent liquidity risk limit structure
(Audited)
| | | | | | | | | | | | | | | | | | | | | | | | | | | | | | | | | |
| | | | | | | | | | | | | | | | | | | | | | | | | | | The Hongkong and |
| | | | | | | | | | | | | | | | | | | | | | | | | | | Shanghai Banking |
| | | HSBC Bank | | HSBC Bank USA | | HSBC Bank Canada | | Corporation |
| | | 2010 | | | 2009 | | | 2010 | | | 2009 | | | 2010 | | | 2009 | | | 2010 | | | 2009 | |
| | | US$bn | | | US$bn | | | US$bn | | | US$bn | | | US$bn | | | US$bn | | | US$bn | | | US$bn | |
| | | | | | | | | | | | | | | | | | | | | | | | | | | | | | | | | |
| Conduits | | | | | | | | | | | | | | | | | | | | | | | | | | | | | | | | |
Client-originated assets58 | | | | | | | | | | | | | | | | | | | | | | | | | | | | | | | | |
| – total lines | | | 7.8 | | | | 7.4 | | | | 4.0 | | | | 6.4 | | | | 0.2 | | | | 0.3 | | | | – | | | | 0.3 | |
| – largest individual lines | | | 0.7 | | | | 0.8 | | | | 0.4 | | | | 0.4 | | | | 0.1 | | | | 0.1 | | | | – | | | | 0.3 | |
HSBC-managed assets59 | | | 25.6 | | | | 29.1 | | | | – | | | | – | | | | – | | | | – | | | | – | | | | – | |
Other conduits60 | | | – | | | | – | | | | 1.4 | | | | 1.3 | | | | – | | | | – | | | | – | | | | – | |
| | | | | | | | | | | | | | | | | | | | | | | | | | | | | | | | | |
| Single-issuer liquidity facilities | | | | | | | | | | | | | | | | | | | | | | | | | | | | | | | | |
– five largest61 | | | 4.2 | | | | 4.3 | | | | 5.3 | | | | 6.1 | | | | 2.0 | | | | 2.0 | | | | 1.4 | | | | 1.2 | |
– largest market sector62 | | | 8.4 | | | | 7.9 | | | | 4.9 | | | | 4.7 | | | | 3.8 | | | | 2.9 | | | | 2.4 | | | | 1.5 | |
For footnotes, see page 174.
143
Report of the Directors: Operating and Financial Review(continued)
HSBC Holdings
(Audited)
HSBC Holdings’ primary sources of cash are dividends received from subsidiaries, interest on and repayment of intra-group loans and interest earned on its own liquid funds. HSBC Holdings also raises ancillary funds in the debt capital markets through subordinated and senior debt issuance. Cash is primarily used for the provision of capital to subsidiaries, interest payments to debt holders and dividend payments to shareholders.
HSBC Holdings is also subject to contingent liquidity risk by virtue of loan and other credit-related commitments and guarantees and similar contracts issued. Such commitments and guarantees are only issued after due consideration of HSBC
Holdings’ ability to finance the commitments and guarantees and the likelihood of the need arising.
HSBC Holdings actively manages the cash flows from its subsidiaries to optimise the amount of cash held at the holding company level. The ability of subsidiaries to pay dividends or advance monies to HSBC Holdings depends on, among other things, their respective regulatory capital requirements, statutory reserves, and financial and operating performance. The wide range of our activities means that HSBC Holdings is not dependent on a single source of profits to fund its dividend payments to shareholders. During 2010, HSBC Holdings continued to have full access to debt capital markets at market rates and issued US$5.0bn of capital instruments (2009: US$5.3bn).
Cash flows payable by HSBC Holdings under financial liabilities by remaining contractual maturities
(Audited)
| | | | | | | | | | | | | | | | | | | | | |
| | | | | | | | | | | Due | | | Due | | | | |
| | | | | | | Due | | | between | | | between | | | Due | |
| | | On | | | within 3 | | | 3 and 12 | | | 1 and 5 | | | after 5 | |
| | | demand | | | months | | | months | | | years | | | years | |
| | | US$m | | | US$m | | | US$m | | | US$m | | | US$m | |
| | | | | | | | | | | | | | | | | | | | | |
At 31 December 2010 | | | | | | | | | | | | | | | | | | | | |
| Amounts owed to HSBC undertakings | | | – | | | | 163 | | | | 1,332 | | | | 1,453 | | | | – | |
| Financial liabilities designated at fair value | | | – | | | | 219 | | | | 658 | | | | 5,810 | | | | 24,215 | |
| Derivatives | | | 827 | | | | – | | | | – | | | | – | | | | – | |
| Debt securities in issue | | | – | | | | 35 | | | | 106 | | | | 2,110 | | | | 1,559 | |
| Subordinated liabilities | | | – | | | | 219 | | | | 657 | | | | 3,504 | | | | 28,670 | |
| Other financial liabilities | | | – | | | | 1,782 | | | | – | | | | – | | | | – | |
| | | | | | | | | | | |
| | | | | | | | | | | | | | | | | | | | | |
| | | | 827 | | | | 2,418 | | | | 2,753 | | | | 12,877 | | | | 54,444 | |
| Loan commitments | | | 2,720 | | | | – | | | | – | | | | – | | | | – | |
| Financial guarantees and similar contracts | | | 46,988 | | | | – | | | | – | | | | – | | | | – | |
| | | | | | | | | | | |
| | | | | | | | | | | | | | | | | | | | | |
| | | | 50,535 | | | | 2,418 | | | | 2,753 | | | | 12,877 | | | | 54,444 | |
| | | | | | | | | | | |
| | | | | | | | | | | | | | | | | | | | | |
| At 31 December 2009 | | | | | | | | | | | | | | | | | | | | |
| Amounts owed to HSBC undertakings | | | – | | | | 292 | | | | 25 | | | | 3,477 | | | | – | |
| Financial liabilities designated at fair value | | | – | | | | 229 | | | | 687 | | | | 6,205 | | | | 26,152 | |
| Derivatives | | | 362 | | | | – | | | | – | | | | – | | | | – | |
| Debt securities in issue | | | – | | | | 37 | | | | 112 | | | | 2,346 | | | | 1,698 | |
| Subordinated liabilities | | | – | | | | 243 | | | | 728 | | | | 3,881 | | | | 32,232 | |
| Other financial liabilities | | | – | | | | 1,239 | | | | – | | | | – | | | | – | |
| | | | | | | | | | | |
| | | | | | | | | | | | | | | | | | | | | |
| | | | 362 | | | | 2,040 | | | | 1,552 | | | | 15,909 | | | | 60,082 | |
| Loan commitments | | | 3,240 | | | | – | | | | – | | | | – | | | | – | |
| Financial guarantees and similar contracts | | | 35,073 | | | | – | | | | – | | | | – | | | | – | |
| | | | | | | | | | | |
| | | | | | | | | | | | | | | | | | | | | |
| | | | 38,675 | | | | 2,040 | | | | 1,552 | | | | 15,909 | | | | 60,082 | |
| | | | | | | | | | | |
The balances in the above table will not agree directly with those in the balance sheet of HSBC Holdings as the table incorporates, on an undiscounted basis, all cash flows relating to principal and future coupon payments (except for trading derivatives).
In addition, loan and other credit-related commitments and financial guarantees and similar
contracts are generally not recognised on the balance sheet. Trading derivatives are included in the ‘On demand’ time bucket, and not by contractual maturity, because trading derivatives are typically held for short periods of time. The undiscounted cash flows potentially payable under financial guarantees and similar contracts are classified on the basis of the earliest date they can be called.
144
Report of the Directors: Operating and Financial Review(continued)
Market risk
(Audited)
Market risk is the risk that movements in market factors, including foreign exchange rates and commodity prices, interest rates, credit spreads and equity prices, will reduce our income or the value of our portfolios.
We separate exposures to market risk into trading and non-trading portfolios. Trading portfolios include positions arising from market-making, position-taking and others designated as marked to market.
Non-trading portfolios include positions that primarily arise from the interest rate management of our retail and commercial banking assets and liabilities, financial investments designated as available for sale and held to maturity, and exposures arising from our insurance operations.
Market risk arising in our insurance businesses is discussed in ‘Risk management of insurance operations’ on pages 155 to 171.
Monitoring and limiting market risk exposure
(Audited)
Our objective is to manage and control market risk exposures in order to optimise return on risk while maintaining a market profile consistent with our status as one of the world’s largest banking and financial services organisations.
The management of market risk is principally undertaken in Global Markets using risk limits approved by the GMB. Limits are set for portfolios, products and risk types, with market liquidity being a primary factor in determining the level of limits set. Group Risk, an independent unit within GMO, is responsible for our market risk management policies and measurement techniques. Each major operating entity has an independent market risk management and control function which is responsible for measuring market risk exposures in accordance with the policies defined by Group Risk, and monitoring and reporting these exposures against the prescribed limits on a daily basis.
Each operating entity is required to assess the market risks arising on each product in its business and to transfer them to either its local Global Markets unit for management, or to separate books managed under the supervision of the local Asset and Liability Management Committee (‘ALCO’). Our aim is to ensure that all market risks are consolidated within operations that have the necessary skills, tools, management and governance to manage them
professionally. In certain cases where the market risks cannot be fully transferred, we use simulation modelling to identify the impact of varying scenarios on valuations and net interest income.
We employ a range of tools to monitor and limit market risk exposures. These include sensitivity analysis, value at risk (‘VAR’) and stress testing.
Sensitivity analysis
(Unaudited)
We use sensitivity measures to monitor the market risk positions within each risk type, for example, the present value of a basis point movement in interest rates for interest rate risk. Sensitivity limits are set for portfolios, products and risk types, with the depth of the market being one of the principal factors in determining the level of limits set.
Value at risk
(Audited)
VAR is a technique that estimates the potential losses on risk positions as a result of movements in market rates and prices over a specified time horizon and to a given level of confidence.
The VAR models we use are based predominantly on historical simulation. These models derive plausible future scenarios from past series of recorded market rates and prices, taking into account inter-relationships between different markets and rates such as interest rates and foreign exchange rates. The models also incorporate the effect of option features on the underlying exposures.
Our historical simulation models assess potential market movements with reference to data from the past two years and calculate VAR to a 99% confidence level and for a one-day holding period.
Although a valuable guide to risk, VAR should always be viewed in the context of its limitations:
| • | | the use of historical data as a proxy for estimating future events may not encompass all potential events, particularly those which are extreme in nature; |
| |
| • | | the use of a one-day holding period assumes that all positions can be liquidated or the risk offset in one day. This may not fully reflect the market risk arising at times of severe illiquidity, when a one-day holding period may be insufficient to liquidate or hedge all positions fully; |
| |
| • | | the use of a 99% confidence level, by definition, does not take into account losses that might occur beyond this level of confidence; |
| |
| • | | VAR is calculated on the basis of exposures outstanding at the close of business and therefore does not necessarily reflect intra-day exposures; and |
| |
| • | | VAR is unlikely to reflect loss potential on exposures that only arise under significant market moves. |
145
Report of the Directors: Operating and Financial Review(continued)
We routinely validate the accuracy of our VAR models by back-testing the actual daily profit and loss results, adjusted to remove non-modelled items such as fees and commissions, against the corresponding VAR numbers. Statistically, we would expect to see losses in excess of VAR only 1% of the time over a one-year period. The actual number of excesses over this period can therefore be used to gauge how well the models are performing.
Stress testing
(Audited)
In recognition of VAR’s limitations, we augment it with stress testing to evaluate the potential impact on portfolio values of more extreme, although plausible, events or movements in a set of financial variables. The process is governed by the Stress Testing Review Group forum which, in conjunction with regional risk managers, determines the scenarios to be applied at portfolio and consolidated levels, as follows:
| • | | sensitivity scenarios consider the impact of any single risk factor or set of factors that are unlikely to be captured within the VAR models, such as the break of a currency peg; |
| |
| • | | technical scenarios consider the largest move in each risk factor, without consideration of any underlying market correlation; |
| |
| • | | hypothetical scenarios consider potential macro economic events, for example, a global flu pandemic; and |
| |
| • | | historical scenarios incorporate historical observations of market movements during previous periods of stress which would not be captured within VAR. |
Stress testing results provide senior management with an assessment of the financial effect such events would have on our profit.
Trading and non-trading portfolios
(Audited)
The following table provides an overview of the reporting of risks within this section:
| | | | | | | | | |
| | | Portfolio |
| | | Trading | | | Non-trading | |
| | | | | | | | | |
Risk type | | | | | | | | |
| Foreign exchange and commodity | | VAR | | | VAR | 63 |
| Interest rate | | VAR | | | VAR | 64 |
| Equity | | VAR | | | Sensitivity | |
| Credit spread | | VAR | | | VAR | 65 |
For footnotes, see page 174.
Value at risk of the trading and non-trading portfolios
Our Group VAR, both trading and non-trading, was as follows:
Value at risk (excluding credit spread VAR)
(Audited)
| | | | | | | | | |
| | | 2010 | | | 2009 | |
| | | US$m | | | US$m | |
| | | | | | | | | |
| At 31 December | | | 266.6 | | | | 204.5 | |
| Average | | | 199.8 | | | | 156.1 | |
| Minimum | | | 139.5 | | | | 105.7 | |
| Maximum | | | 285.7 | | | | 204.5 | |
The rise in interest rate volatility, coupled with a modest increase in underlying interest rate exposure, resulted in a higher VAR and higher maximum VAR at the end of 2010 compared with the end of 2009. The volatility in the other asset classes in 2010 was lower than in 2009.
Our Group daily VAR, both trading and non-trading, was as follows:
Daily VAR (excluding credit spread) (US$m)
(Unaudited)
The major contributor to our Group trading and non-trading VAR was Global Markets.
The histogram below illustrates the frequency of daily revenue arising from Global Markets’ trading, balance sheet management and other trading activities.
Daily revenue
(Unaudited)
| | | | | | | | | |
| | | 2010 | | | 2009 | |
| | | US$m | | | US$m | |
| | | | | | | | | |
| Average daily revenue | | | 49.3 | | | | 59.9 | |
Standard deviation66 | | | 37.8 | | | | 38.4 | |
For footnote, see page 174.
An analysis of the frequency distribution of daily revenue shows that there were nine days with negative revenues during 2010 compared with
146
Report of the Directors: Operating and Financial Review(continued)
11 days in the same period ended 31 December 2009. The most frequent result was daily revenue of between US$30m and US$40m with 41 occurrences, compared with between US$30m and US$40m and between US$40m and US$50m with 29 occurrences each in 2009.
On 9 May 2010, the International Monetary Fund and the 16 member states of the euro area announced stabilisation measures for the eurozone. The period prior to this announcement was volatile, leading to a number of negative revenue days. The maximum daily revenue of US$450m arose on 10 May 2010 which in large part reflected a recovery of these negative revenues days.
Daily distribution of Global Markets’ trading, balance sheet management and other trading revenues67
(Unaudited)
| | |
| For footnote, see page 174. |
(Audited)
Risk measurement and control
Our control of market risk in the trading portfolios is based on a policy of restricting individual operations to trading within a list of permissible instruments authorised for each site by Group Risk, of enforcing rigorous new product approval procedures, and of
restricting trading in the more complex derivative products only to offices with appropriate levels of product expertise and robust control systems.
The VAR for trading intent activity within Global Markets at 31 December 2010 was US$80.8m (2009: US$95.1m). This is analysed below by risk type:
VAR by risk type for trading intent activities68
(Audited)
| | | | | | | | | | | | | | | | | | | | | |
| | | Foreign | | | | | | | | | | | | | | |
| | | exchange and | | | Interest | | | | | | | Credit | | | | |
| | | commodity | | | rate | | | Equity | | | spread | 69 | | Total | 70 |
| | | US$m | | | US$m | | | US$m | | | US$m | | | US$m | |
| | | | | | | | | | | | | | | | | | | | | |
At 31 December 2010 | | | 24.9 | | | | 49.5 | | | | 13.0 | | | | 39.1 | | | | 80.8 | |
| At 31 December 2009 | | | 19.5 | | | | 42.6 | | | | 17.5 | | | | 59.3 | | | | 95.1 | |
| | | | | | | | | | | | | | | | | | | | | |
| Average | | | | | | | | | | | | | | | | | | | | |
2010 | | | 27.2 | | | | 51.6 | | | | 9.2 | | | | 62.0 | | | | 113.4 | |
| 2009 | | | 20.6 | | | | 51.3 | | | | 11.3 | | | | 58.0 | | | | 85.3 | |
| Minimum | | | | | | | | | | | | | | | | | | | | |
2010 | | | 8.0 | | | | 34.7 | | | | 2.9 | | | | 33.7 | | | | 55.0 | |
| 2009 | | | 11.1 | | | | 35.6 | | | | 4.9 | | | | 31.9 | | | | 54.3 | |
| Maximum | | | | | | | | | | | | | | | | | | | | |
2010 | | | 62.9 | | | | 88.9 | | | | 21.6 | | | | 102.5 | | | | 212.2 | |
| 2009 | | | 46.7 | | | | 78.0 | | | | 18.7 | | | | 94.3 | | | | 132.5 | |
| | |
| For footnotes, see page 174. |
147
Report of the Directors: Operating and Financial Review(continued)
The VAR for overall trading intent activity as at 31 December 2010 was lower than at the end of 2009, because of reduced volatility in various asset classes. However, the wider band in VAR observed in 2010 was driven by an increase in client-led transactions and reduced portfolio diversification benefit, which resulted in occasionally higher VAR utilisation, as reflected in the above summary statistics.
(Audited)
The risk associated with movements in credit spreads is primarily managed through sensitivity limits, stress testing and VAR for those portfolios on which it is calculated.
At 31 December 2010, the Group credit spread VAR was US$41.9m (2009: US$72.7m). The decrease arose from the effect of volatile credit spread scenarios rolling off from the VAR calculation.
Credit spread risk also arises on credit derivative transactions entered into by Global Banking in order to manage the risk concentrations within our corporate loan portfolio and so enhance capital efficiency. The mark-to-market of these transactions is reflected in the income statement. At 31 December 2010, the credit VAR on the credit derivatives transactions entered into by Global Banking was US$12.3m (2009: US$13.8m).
Gap risk
Even for transactions that are structured to render the risk to HSBC negligible under a wide range of market conditions or events, there exists a remote possibility that a significant gap event could lead to loss. A gap event could arise from a significant change in market price with no accompanying trading opportunity, with the result that the threshold is breached beyond which the risk profile changes from no risk to full exposure to the underlying structure. Such movements may occur, for example, when, in reaction to an adverse event or unexpected news announcement, the market for a specific investment becomes illiquid, making hedging impossible.
Given their characteristics, these transactions make little or no contribution to VAR or to traditional market risk sensitivity measures. We capture their risks within our stress testing scenarios and monitor gap risk on an ongoing basis. We regularly consider the probability of gap loss, and fair value adjustments are booked against this risk. We did not incur any material gap loss in respect of
such transactions in 2010.
(Audited)
Risk measurement and control
The principal objective of market risk management of non-trading portfolios is to optimise net interest income. Interest rate risk in non-trading portfolios arises principally from mismatches between the future yield on assets and their funding cost, as a result of interest rate changes. Analysis of this risk is complicated by having to make assumptions on embedded optionality within certain product areas such as the incidence of mortgage prepayments, and from behavioural assumptions regarding the economic duration of liabilities which are contractually repayable on demand such as current accounts.
Our control of market risk in the non-trading portfolios is based on transferring the risks to the books managed by Global Markets or the local ALCO. The net exposure is typically managed through the use of interest rate swaps within agreed limits. The VAR for these portfolios is included within the Group VAR (see ‘Value at risk of the trading and non-trading portfolios’ on page 146).
Credit spread risk
The risk associated with movements in credit spreads is primarily managed through sensitivity limits, stress testing, and VAR for those portfolios where VAR is calculated. We have introduced credit spread as a separate risk type within our VAR models on a global basis. The VAR shows the effect on income from a one-day movement in credit spreads over a two-year period, calculated to a 99% confidence interval.
At 31 December 2010, the sensitivity of equity capital to the effect of movements in credit spreads, based on credit spread VAR, on our available-for-sale debt securities was US$264m (2009: US$535m). After including the gross exposure for the SICs consolidated within our balance sheet, this exposure rose to US$299m (2009: US$549m). This sensitivity is calculated before taking into account losses which would have been absorbed by the capital note holders. At 31 December 2010, the capital note holders can absorb the first US$2.2bn (2009: US$2.2bn) of any losses incurred by the SICs before we incur any equity losses.
The decrease in this sensitivity at 31 December 2010 compared with 31 December 2009 can be explained by the effect of lower volatility in credit spread scenarios observed during 2010.
148
Report of the Directors: Operating and Financial Review(continued)
Equity securities classified as available for sale
Market risk arises on equity securities classified as available for sale. The fair value of these securities
at 31 December 2010 was US$8.0bn (2009: US$9.1bn).
Fair value of equity securities classified as available for sale
(Audited)
| | | | | | | | | |
| | | 2010 | | | 2009 | |
| | | US$bn | | | US$bn | |
| | | | | | | | | |
Private equity holdings71 | | | 2.8 | | | | 4.0 | |
| Funds invested for short-term cash management | | | 0.5 | | | | 0.8 | |
Investment to facilitate ongoing business72 | | | 1.0 | | | | 1.2 | |
| Other strategic investments | | | 3.7 | | | | 3.1 | |
| | | | | |
| | | | 8.0 | | | | 9.1 | |
| | | | | |
| | |
| For footnotes, see page 174. |
The fair value of the constituents of equity securities classified as available for sale can fluctuate considerably. A 10% reduction in their value at 31 December 2010 would have reduced our equity by US$0.8bn (2009: US$0.9bn). For details of the impairment incurred on available-for-sale equity securities, see ‘Securitisation exposures and other structured products’ on page 128.
Structural foreign exchange exposures
(Unaudited)
Structural foreign exchange exposures represent net investments in subsidiaries, branches and associates, the functional currencies of which are currencies other than the US dollar. An entity’s functional currency is the currency of the primary economic environment in which the entity operates.
Exchange differences on structural exposures are recognised in other comprehensive income. We use the US dollar as our presentation currency in our consolidated financial statements because the US dollar and currencies linked to it form the major currency bloc in which we transact and fund our business. Our consolidated balance sheet is, therefore, affected by exchange differences between the US dollar and all the non-US dollar functional currencies of underlying subsidiaries.
We hedge structural foreign exchange exposures only in limited circumstances. Our structural foreign exchange exposures are managed with the primary objective of ensuring, where practical, that our consolidated capital ratios and the capital ratios of individual banking subsidiaries are largely protected from the effect of changes in exchange rates. This is usually achieved by ensuring that, for each subsidiary bank, the ratio of structural exposures in a given currency to risk-weighted assets denominated in that currency is broadly equal to the capital ratio of the subsidiary in question.
We may also transact hedges where a currency in which we have structural exposures is considered to be significantly overvalued and it is possible in practice to transact a hedge. Any hedging is undertaken using forward foreign exchange contracts which are accounted for under IFRSs as hedges of a net investment in a foreign operation, or by financing with borrowings in the same currencies as the functional currencies involved. No forward foreign exchange hedges were in place during 2010 in respect of our consolidated Group structural foreign exchange position.
For details of structural foreign exchange exposures see Note 36 on the Financial Statements.
Sensitivity of net interest income
(Unaudited)
A principal element of our management of market risk in non-trading portfolios is monitoring the sensitivity of projected net interest income under varying interest rate scenarios (simulation modelling). We aim to mitigate the effect of prospective interest rate movements which could reduce future net interest income, while balancing the cost of such hedging activities on the current net revenue stream.
For simulation modelling, our businesses use a combination of scenarios relevant to them and their local markets and standard scenarios which are required throughout HSBC. The standard scenarios are consolidated to illustrate the combined pro forma effect on our consolidated portfolio valuations and net interest income.
The table below sets out the effect on future net interest income of incremental 25 basis point parallel falls or rises in all yield curves worldwide at the beginning of each quarter during the 12 months from 1 January 2011.
149
Report of the Directors: Operating and Financial Review(continued)
Assuming no management actions, a sequence of such rises would increase planned net interest income for 2011 by US$882m (2010: US$695m), while a sequence of such falls would decrease
planned net interest income by US$1,525m (2010: US$1,563m). These figures incorporate the effect of any option features in the underlying exposures.
Sensitivity of projected net interest income73
(Unaudited)
| | | | | | | | | | | | | | | | | | | | | | | | | | | | | |
| | | | | | | Rest of | | | Hong Kong | | | Rest of | | | | | | | | | | |
| | | US dollar | | | Americas | | | dollar | | | Asia | | | Sterling | | | Euro | | | | |
| | | bloc | | | bloc | | | bloc | | | bloc | | | bloc | | | bloc | | | Total | |
| | | US$m | | | US$m | | | US$m | | | US$m | | | US$m | | | US$m | | | US$m | |
| | | | | | | | | | | | | | | | | | | | | | | | | | | | | |
Change in 2011 projected net interest income arising from a shift in yield curves of: | | | | | | | | | | | | | | | | | | | | | | | | | | | | |
| | | | | | | | | | | | | | | | | | | | | | | | | | | | | |
| +25 basis points at the beginning of each quarter | | | 164 | | | | 72 | | | | 191 | | | | 245 | | | | 292 | | | | (82 | ) | | | 882 | |
| –25 basis points at the beginning of each quarter | | | (550 | ) | | | (68 | ) | | | (280 | ) | | | (143 | ) | | | (546 | ) | | | 62 | | | | (1,525 | ) |
| | | | | | | | | | | | | | | | | | | | | | | | | | | | | |
| Change in 2010 projected net interest income arising from a shift in yield curves of: | | | | | | | | | | | | | | | | | | | | | | | | | | | | |
| | | | | | | | | | | | | | | | | | | | | | | | | | | | | |
| +25 basis points at the beginning of each quarter | | | 13 | | | | 92 | | | | 416 | | | | 112 | | | | 363 | | | | (301 | ) | | | 695 | |
| –25 basis points at the beginning of each quarter | | | (382 | ) | | | (46 | ) | | | (507 | ) | | | (133 | ) | | | (689 | ) | | | 194 | | | | (1,563 | ) |
| | |
| For footnote, see page 174. |
The interest rate sensitivities set out in the table above are illustrative only and are based on simplified scenarios.
The figures represent the effect of the pro forma movements in net interest income based on the projected yield curve scenarios and our current interest rate risk profile. This effect, however, does not incorporate actions that would be taken by Balance Sheet Management within Global Markets or in the business units to mitigate the impact of this interest rate risk; in reality, Balance Sheet Management seeks proactively to change the interest rate risk profile to minimise losses and optimise net revenues. The projections above also assume that interest rates of all maturities move by the same amount and, therefore, do not reflect the potential effect on net interest income of some rates changing while others remain unchanged. In addition, the projections take account of the effect on net interest income of anticipated differences in changes between interbank interest rates and interest rates linked to other bases (such as Central Bank rates or product rates over which the entity has discretion in terms of the timing and extent of rate changes). The projections make other simplifying assumptions too, including that all positions run to maturity.
Projecting the movement in net interest income from prospective changes in interest rates is a complex interaction of structural and managed exposures. Our exposure to the effect of movements
in interest rates on our net interest income arises in two main areas, core deposit franchises and Balance Sheet Management:
| • | | core deposit franchises are exposed to changes in the cost of deposits raised and spreads on wholesale funds. The net interest income benefit of core deposits increases as interest rates rise and decreases as interest rates fall. This risk is asymmetrical in a very low interest rate environment, however, as there is limited room to lower deposit pricing in the event of interest rate reductions; and |
| |
| • | | residual interest rate risk is managed within Balance Sheet Management, under our policy of transferring interest rate risk to Balance Sheet Management to be managed within defined limits and with flexibility as to the instruments used. |
The table above reflects the fact that our deposit taking businesses will generally benefit from rising rates which will be partially offset by increased funding costs in Balance Sheet Management given our simplifying assumption of unchanged Balance Sheet Management positioning. Additionally, the benefit to deposit taking businesses of rising rates is also offset by the increased funding cost of trading assets, which is recorded in ‘Net interest income’ and therefore captured in the above table, whereas the income from such assets is recorded in ‘Net trading income’.
150
Report of the Directors: Operating and Financial Review(continued)
The main drivers of the year on year changes in the sensitivity of the Group’s net interest income to the change in rates shown in the table were lower implied yield curves, changes in Balance Sheet Management positioning, and changed expectations for deposit pricing for some currencies in a rising rate environment.
We monitor the sensitivity of reported reserves to interest rate movements on a monthly basis by
assessing the expected reduction in valuation of available-for-sale portfolios and cash flow hedges due to parallel movements of plus or minus 100 basis points in all yield curves. The table below describes the sensitivity of our reported reserves to these movements at the end of 2010 and 2009 and the maximum and minimum month-end figures during these years:
Sensitivity of reported reserves to interest rate movements
(Unaudited)
| | | | | | | | | | | | | |
| | | | | | | Maximum | | | Minimum | |
| | | | | | | impact | | | impact | |
| | | US$m | | | US$m | | | US$m | |
At 31 December 2010 | | | | | | | | | | | | |
| | | | | | | | | | | | | |
| + 100 basis point parallel move in all yield curves | | | (6,162 | ) | | | (6,162 | ) | | | (3,096 | ) |
| As a percentage of total shareholders’ equity | | | (4.2% | ) | | | (4.2% | ) | | | (2.1% | ) |
| | | | | | | | | | | | | |
| – 100 basis point parallel move in all yield curves | | | 6,174 | | | | 6,174 | | | | 3,108 | |
| As a percentage of total shareholders’ equity | | | 4.2% | | | | 4.2% | | | | 2.1% | |
| | | | | | | | | | | | | |
| At 31 December 2009 | | | | | | | | | | | | |
| | | | | | | | | | | | | |
| + 100 basis point parallel move in all yield curves | | | (3,096 | ) | | | (3,438 | ) | | | (2,715 | ) |
| As a percentage of total shareholders’ equity | | | (2.4% | ) | | | (2.7% | ) | | | (2.1% | ) |
| | | | | | | | | | | | | |
| – 100 basis point parallel move in all yield curves | | | 3,108 | | | | 3,380 | | | | 2,477 | |
| As a percentage of total shareholders’ equity | | | 2.4% | | | | 2.6% | | | | 1.9% | |
The sensitivities are illustrative only and are based on simplified scenarios. The table shows the potential sensitivity of reserves to valuation changes in available-for-sale portfolios and from cash flow hedges following the pro forma movements in interest rates. These particular exposures form only a part of our overall interest rate exposures. The accounting treatment under IFRSs of our remaining interest rate exposures, while economically largely offsetting the exposures shown in the above table, does not require revaluation movements to go to reserves.
The year-on-year increase in sensitivity of reserves is due to an increase in government bonds held in Balance Sheet Management, which are accounted for on an available-for-sale basis.
Defined benefit pension schemes
(Audited)
Market risk arises within our defined benefit pension schemes to the extent that the obligations of the schemes are not fully matched by assets with determinable cash flows. Pension scheme obligations fluctuate with changes in long-term interest rates, inflation, salary levels and the longevity of scheme members. Pension scheme assets include equities and debt securities, the cash flows of which change as equity prices and interest
rates vary. There is a risk that market movements in equity prices and interest rates could result in asset values which, taken together with regular ongoing contributions, are insufficient over time to cover the level of projected obligations and these, in turn, could increase with a rise in inflation and members living longer. Management, together with the trustees who act on behalf of the pension scheme beneficiaries, assess these risks using reports prepared by independent external actuaries, take action and, where appropriate, adjust investment strategies and contribution levels accordingly.
HSBC’s defined benefit pension schemes
(Audited)
| | | | | | | | | |
| | | 2010 | | | 2009 | |
| | | US$bn | | | US$bn | |
| Liabilities (present value) | | | 32.6 | | | | 30.6 | |
| | | | | |
| | | | | | | | | |
| | | | % | | | | % | |
| | | | | | | | | |
| Assets: | | | | | | | | |
| Equities | | | 20 | | | | 21 | |
| Debt securities | | | 66 | | | | 67 | |
| Other (including property) | | | 14 | | | | 12 | |
| | | | | |
| | | | | | | | | |
| | | | 100 | | | | 100 | |
| | | | | |
For details of our defined benefit schemes, see Note 7 on the Financial Statements, and for pension risk management, see page 172.
151
Report of the Directors: Operating and Financial Review(continued)
(Audited)
As a financial services holding company, HSBC Holdings has limited market risk activity. Its activities predominantly involve maintaining sufficient capital resources to support the Group’s diverse activities; allocating these capital resources across our businesses; earning dividend and interest income on its investments in our businesses; providing dividend payments to HSBC Holdings’ equity shareholders and interest payments to providers of debt capital; and maintaining a supply of short-term cash resources. It does not take proprietary trading positions.
The main market risks to which HSBC Holdings is exposed are interest rate risk and foreign currency risk. Exposure to these risks arises from short-term cash balances, funding positions held, loans to subsidiaries, investments in long-term financial assets and financial liabilities including debt capital issued. The objective of HSBC Holdings’ market risk management strategy is to reduce exposure to these risks and minimise volatility in economic income, cash flows and distributable reserves. Market risk for HSBC Holdings is monitored by the Holdings ALCO (formerly the Structural Positions Review Group).
HSBC Holdings has entered into a number of cross-currency swaps to manage the market risk arising on certain long-term debt capital issues for which hedge accounting has not been applied.
Changes in the market values of these swaps are recognised directly in the income statement. HSBC Holdings expects that these swaps will be held to final maturity with the accumulated changes in market value consequently trending to zero.
Certain loans to subsidiaries of a capital nature that are not denominated in the functional currency of either the provider or the recipient are accounted for as financial assets. Changes in the carrying amount of these assets due to exchange differences are taken directly to the income statement. These loans, and the associated foreign exchange exposures, are eliminated on a Group consolidated basis.
The principal tools used in the management of market risk are the projected sensitivity of HSBC Holdings’ net interest income to future changes in yield curves and interest rate gap re-pricing tables for interest rate risk, and VAR for foreign exchange rate risk.
Sensitivity of net interest income
(Unaudited)
HSBC Holdings monitors net interest income sensitivity over a 5-year time horizon reflecting the longer-term perspective on interest rate risk management appropriate to a financial services holding company. The table below sets out the effect on HSBC Holdings’ future net interest income over a 5-year time horizon of incremental 25 basis point parallel falls or rises in all yield curves worldwide at the beginning of each quarter during the 12 months from 1 January 2011.
Sensitivity of HSBC Holdings’ net interest income to interest rate movements73
(Unaudited)
| | | | | | | | | | | | | | | | | |
| Change in projected net interest income as at 31 December | | US dollar | | | Sterling | | | Euro | | | | |
| arising from a shift in yield curves | | bloc | | | bloc | | | bloc | | | Total | |
| | | US$m | | | US$m | | | US$m | | | US$m | |
2010 | | | | | | | | | | | | | | | | |
| | | | | | | | | | | | | | | | | |
| of + 25 basis points at the beginning of each quarter | | | | | | | | | | | | | | | | |
| 0-1 year | | | (6 | ) | | | 19 | | | | 11 | | | | 24 | |
| 2-3 years | | | (56 | ) | | | 75 | | | | 62 | | | | 81 | |
| 4-5 years | | | (79 | ) | | | 71 | | | | 58 | | | | 50 | |
| | | | | | | | | | | | | | | | | |
| of – 25 basis points at the beginning of each quarter | | | | | | | | | | | | | | | | |
| 0-1 year | | | 6 | | | | (19 | ) | | | (11 | ) | | | (24 | ) |
| 2-3 years | | | 56 | | | | (75 | ) | | | (62 | ) | | | (81 | ) |
| 4-5 years | | | 79 | | | | (71 | ) | | | (58 | ) | | | (50 | ) |
| | | | | | | | | | | | | | | | | |
| 2009 | | | | | | | | | | | | | | | | |
| | | | | | | | | | | | | | | | | |
| of + 25 basis points at the beginning of each quarter | | | | | | | | | | | | | | | | |
| 0-1 year | | | (13 | ) | | | 18 | | | | 11 | | | | 16 | |
| 2-3 years | | | (172 | ) | | | 75 | | | | 19 | | | | (78 | ) |
| 4-5 years | | | (165 | ) | | | 105 | | | | 6 | | | | (54 | ) |
| | | | | | | | | | | | | | | | | |
| of – 25 basis points at the beginning of each quarter | | | | | | | | | | | | | | | | |
| 0-1 year | | | 12 | | | | (18 | ) | | | (11 | ) | | | (17 | ) |
| 2-3 years | | | 172 | | | | (75 | ) | | | (19 | ) | | | 78 | |
| 4-5 years | | | 165 | | | | (105 | ) | | | (6 | ) | | | 54 | |
| | |
| For footnote, see page 174. |
152
Report of the Directors: Operating and Financial Review(continued)
The interest rate sensitivities tabulated above are illustrative only and are based on simplified scenarios. The figures represent the effect of pro forma movements in net interest income based on our projected yield curve scenarios, HSBC Holdings’ current interest rate risk profile and assumed changes to that profile during the next five years. Changes to assumptions concerning the risk profile over the next five years can have a significant impact on the net interest income sensitivity for that period. The figures do not take into account the effect of actions that could be taken to mitigate this interest rate risk, however.
Interest repricing gap table
The interest rate risk on the fixed-rate securities issued by HSBC Holdings is not included within the Group VAR but is managed on a repricing gap basis. The interest rate repricing gap table below analyses the full term structure of interest rate mismatches within HSBC Holdings’ balance sheet. The year-on-year movement in the repricing gap was mainly due to the refinancing of maturing interest bearing capital liabilities with perpetual fixed rate issues.
Repricing gap analysis of HSBC Holdings
(Audited)
| | | | | | | | | | | | | | | | | | | | | | | | | |
| | | | | | | | | | | | | | | | | | | | | | | Non- | |
| | | | | | | Up to | | | | | | | | | | | More than | | | interest | |
| | | Total | | | 1 year | | | 1-5 years | | | 5-10 years | | | 10 years | | | bearing | |
| | | US$m | | | US$m | | | US$m | | | US$m | | | US$m | | | US$m | |
At 31 December 2010 | | | | | | | | | | | | | | | | | | | | | | | | |
| Cash at bank and in hand: | | | | | | | | | | | | | | | | | | | | | | | | |
| – balances with HSBC undertakings | | | 459 | | | | 339 | | | | – | | | | – | | | | – | | | | 120 | |
| Derivatives | | | 2,327 | | | | – | | | | – | | | | – | | | | – | | | | 2,327 | |
| Loans and advances to HSBC undertakings | | | 21,238 | | | | 19,351 | | | | – | | | | 290 | | | | 605 | | | | 992 | |
| Financial investments | | | 2,025 | | | | – | | | | 300 | | | | 900 | | | | 731 | | | | 94 | |
| Investments in subsidiaries | | | 92,899 | | | | 1,785 | | | | 875 | | | | 1,164 | | | | – | | | | 89,075 | |
| Other assets | | | 393 | | | | – | | | | – | | | | – | | | | – | | | | 393 | |
| | | | | | | | | | | | | |
| | | | | | | | | | | | | | | | | | | | | | | | | |
| Total assets | | | 119,341 | | | | 21,475 | | | | 1,175 | | | | 2,354 | | | | 1,336 | | | | 93,001 | |
| | | | | | | | | | | | | |
| | | | | | | | | | | | | | | | | | | | | | | | | |
| Amounts owed to HSBC undertakings | | | (2,932 | ) | | | (2,266 | ) | | | – | | | | – | | | | – | | | | (666 | ) |
| Financial liabilities designated at fair values | | | (16,288 | ) | | | – | | | | (7,184 | ) | | | (4,740 | ) | | | (3,509 | ) | | | (855 | ) |
| Derivatives | | | (827 | ) | | | – | | | | – | | | | – | | | | – | | | | (827 | ) |
| Debt securities in issue | | | (2,668 | ) | | | – | | | | (1,664 | ) | | | – | | | | (1,004 | ) | | | – | |
| Other liabilities | | | (1,232 | ) | | | – | | | | – | | | | – | | | | – | | | | (1,232 | ) |
| Subordinated liabilities | | | (13,313 | ) | | | (750 | ) | | | (1,579 | ) | | | (2,140 | ) | | | (8,680 | ) | | | (164 | ) |
| Total equity | | | (81,331 | ) | | | – | | | | – | | | | (7,450 | ) | | | – | | | | (73,881 | ) |
| Other non-interest bearing liabilities | | | (750 | ) | | | – | | | | – | | | | – | | | | – | | | | (750 | ) |
| | | | | | | | | | | | | |
| | | | | | | | | | | | | | | | | | | | | | | | | |
| Total liabilities and equity | | | (119,341 | ) | | | (3,016 | ) | | | (10,427 | ) | | | (14,330 | ) | | | (13,193 | ) | | | (78,375 | ) |
| | | | | | | | | | | | | |
| | | | | | | | | | | | | | | | | | | | | | | | | |
| Off-balance sheet items attracting interest rate sensitivity | | | – | | | | (15,302 | ) | | | 7,221 | | | | 4,403 | | | | 3,409 | | | | 269 | |
| | | | | | | | | | | | | |
| | | | | | | | | | | | | | | | | | | | | | | | | |
| Net interest rate risk gap | | | – | | | | 3,157 | | | | (2,031 | ) | | | (7,573 | ) | | | (8,448 | ) | | | 14,895 | |
| | | | | | | | | | | | | |
| | | | | | | | | | | | | | | | | | | | | | | | | |
| Cumulative interest rate gap | | | – | | | | 3,157 | | | | 1,126 | | | | (6,447 | ) | | | (14,895 | ) | | | – | |
| | | | | | | | | | | | | |
| | | | | | | | | | | | | | | | | | | | | | | | | |
| At 31 December 2009 | | | | | | | | | | | | | | | | | | | | | | | | |
| Cash at bank and in hand: | | | | | | | | | | | | | | | | | | | | | | | | |
| – balances with HSBC undertakings | | | 224 | | | | 224 | | | | – | | | | – | | | | – | | | | – | |
| Derivatives | | | 2,981 | | | | – | | | | – | | | | – | | | | – | | | | 2,981 | |
| Loans and advances to HSBC undertakings | | | 23,212 | | | | 16,980 | | | | 3,084 | | | | – | | | | 1,896 | | | | 1,252 | |
| Financial investments | | | 2,455 | | | | – | | | | – | | | | 300 | | | | 1,610 | | | | 545 | |
| Investments in subsidiaries | | | 86,247 | | | | 1,866 | | | | 1,217 | | | | – | | | | 875 | | | | 82,289 | |
| | |
| | | | | | | | | | | | | | | | | | | | | | | | | |
| Other assets | | | 674 | | | | – | | | | – | | | | – | | | | – | | | | 674 | |
| | | | | | | | | | | | | |
| | | | | | | | | | | | | | | | | | | | | | | | | |
| Total assets | | | 115,793 | | | | 19,070 | | | | 4,301 | | | | 300 | | | | 4,381 | | | | 87,741 | |
| | | | | | | | | | | | | |
| | | | | | | | | | | | | | | | | | | | | | | | | |
| Amounts owed to HSBC undertakings | | | (3,711 | ) | | | (2,898 | ) | | | – | | | | – | | | | – | | | | (813 | ) |
| Financial liabilities designated at fair values | | | (16,909 | ) | | | – | | | | (6,108 | ) | | | (5,017 | ) | | | (5,015 | ) | | | (769 | ) |
| Derivatives | | | (362 | ) | | | – | | | | – | | | | – | | | | – | | | | (362 | ) |
| Debt securities in issue | | | (2,839 | ) | | | – | | | | (1,784 | ) | | | – | | | | (1,055 | ) | | | – | |
| Other liabilities | | | (1,257 | ) | | | – | | | | – | | | | – | | | | – | | | | (1,257 | ) |
| Subordinated liabilities | | | (14,406 | ) | | | (2,850 | ) | | | (865 | ) | | | (3,117 | ) | | | (7,382 | ) | | | (192 | ) |
| Total equity | | | (75,876 | ) | | | – | | | | – | | | | – | | | | (3,650 | ) | | | (72,226 | ) |
| Other non-interest bearing liabilities | | | (433 | ) | | | – | | | | – | | | | – | | | | – | | | | (433 | ) |
| | | | | | | | | | | | | |
| | | | | | | | | | | | | | | | | | | | | | | | | |
| Total liabilities and equity | | | (115,793 | ) | | | (5,748 | ) | | | (8,757 | ) | | | (8,134 | ) | | | (17,102 | ) | | | (76,052 | ) |
| | | | | | | | | | | | | |
| | | | | | | | | | | | | | | | | | | | | | | | | |
| Off-balance sheet items attracting interest rate sensitivity | | | – | | | | (15,302 | ) | | | 6,275 | | | | 6,306 | | | | 4,051 | | | | (1,330 | ) |
| | | | | | | | | | | | | |
| | | | | | | | | | | | | | | | | | | | | | | | | |
| Net interest rate risk gap | | | – | | | | (1,980 | ) | | | 1,819 | | | | (1,528 | ) | | | (8,670 | ) | | | 10,359 | |
| | | | | | | | | | | | | |
| | | | | | | | | | | | | | | | | | | | | | | | | |
| Cumulative interest rate gap | | | – | | | | (1,980 | ) | | | (161 | ) | | | (1,689 | ) | | | (10,359 | ) | | | – | |
| | | | | | | | | | | | | |
153
Report of the Directors: Operating and Financial Review(continued)
Total foreign exchange VAR arising within HSBC Holdings in 2010 and 2009 was as follows:
HSBC Holdings – foreign exchange VAR
(Audited)
| | | | | | | | | |
| | | Foreign exchange | |
| | | 2010 | | | 2009 | |
| | | US$m | | | US$m | |
| At 31 December | | | 40.4 | | | | 83.2 | |
| Average | | | 56.6 | | | | 76.6 | |
| Minimum | | | 40.2 | | | | 55.2 | |
| Maximum | | | 83.2 | | | | 190.8 | |
The foreign exchange risk largely arises from loans to subsidiaries of a capital nature that are not denominated in the functional currency of either the provider or the recipient and which are accounted for as financial assets. Changes in the carrying amount of these loans due to foreign exchange rate differences are taken directly to HSBC Holdings’ income statement. These loans, and the associated foreign exchange exposures, are eliminated on a Group consolidated basis.
Operational risk
(Unaudited)
Operational risk is relevant to every aspect of our business and covers a wide spectrum of issues. Losses arising through fraud, unauthorised activities, errors, omission, inefficiency, systems failure or from external events all fall within the definition of operational risk.
The objective of our operational risk management is to manage and control operational risk in a cost effective manner within targeted levels of operational risk consistent with our risk appetite, as defined by the GMB.
A formal governance structure provides oversight over the management of operational risk. A Global Operational Risk and Control Committee, which reports to the Risk Management Meeting, meets at least quarterly to discuss key risk issues and review the effective implementation of our operational risk management framework.
In each of our subsidiaries, business managers are responsible for maintaining an acceptable level of internal control, commensurate with the scale and nature of operations. They are responsible for identifying and assessing risks, designing controls and monitoring the effectiveness of these controls. The operational risk management framework helps managers to fulfil these responsibilities by defining a standard risk assessment methodology and providing a tool for the systematic reporting of operational loss data.
A centralised database is used to record the results of the operational risk management process. Operational risk self-assessments are input and maintained by business units. To ensure that operational risk losses are consistently reported and monitored at Group level, all Group companies are required to report individual losses when the net loss is expected to exceed US$10,000.
Further details of our approach to Operational Risk Management can be found inPillar 3 Disclosures 2010which is published as a separate document on www.hsbc.com.
(Unaudited)
Each operating company is required to implement procedures to manage legal risk that conform to our standards. Legal risk falls within the definition of operational risk and includes contractual risk, dispute risk, legislative risk and non-contractual rights risk.
| • | | Contractual risk is the risk that the rights and/or obligations of an HSBC company within a contractual relationship are defective. |
| |
| • | | Dispute risk consists of the risks that an HSBC company is subject to when it is involved in or managing a potential or actual dispute. |
| |
| • | | Legislative risk is the risk that an HSBC company fails to adhere to the laws of the jurisdictions in which it operates. |
| |
| • | | Non-contractual rights risk is the risk that an HSBC company’s assets are not properly owned or are infringed by others, or an HSBC company infringes another party’s rights. |
We have a global legal function to assist management in controlling legal risk. The function provides legal advice and support in managing claims against our companies, as well as in respect of non-routine debt recoveries or other litigation against third parties.
The GMO Legal department oversees the global legal function and is headed by the Group General Counsel. There are legal departments in 58 of the countries in which we operate. There are also regional legal functions in each of Europe, North America, Latin America, the Middle East, and Asia-Pacific headed by Regional General Counsels.
Our operating companies must notify the appropriate legal department immediately any litigation is either threatened or commenced against HSBC or an employee. Any claims which exceed US$1.5m or equivalent must be advised to the
154
Report of the Directors: Operating and Financial Review(continued)
appropriate regional legal department and the regional legal department must immediately advise the GMO Legal department if any such claim exceeds US$5m. The appropriate regional legal department must also be immediately advised (and must in turn immediately advise the GMO Legal department) of any action by a regulatory authority, where the proceedings are criminal, or where the claim might materially affect our reputation. Insofar as matters relate to GB&M or GPB, notification should also be made to GB&M Legal in London. All such matters are then reported to the Risk Management Meeting in a monthly paper.
In addition, our operating companies are required to submit semi-annual returns detailing outstanding claims where the claim (or group of similar claims) exceeds US$10m, where the action is by a regulatory authority, where the proceedings are criminal, where the claim might materially affect our reputation, or, where the GMO Legal department has requested returns be completed for a particular claim. These returns are used for reporting to the Risk Management Meeting, the Group Audit Committee and the Board, and disclosure in theAnnual Report and AccountsandInterim Report, if appropriate.
(Unaudited)
Compliance risk falls within the definition of operational risk. All Group companies are required to observe the letter and spirit of all relevant laws, codes, rules, regulations and standards of good market practice. These rules, regulations, other standards and Group policies include those relating to anti-money laundering, counter terrorist financing and sanctions compliance.
The Group Compliance function supports line management in ensuring that there are adequate policies and procedures, and is responsible for maintaining adequate resources to mitigate compliance risk. The GMO Compliance department oversees the global compliance function and is headed by the Head of Group Compliance who in turn reports to the Group Chief Risk Officer. There are compliance teams in all of the countries where we operate. These compliance teams are principally overseen by Regional Compliance Officers located in Europe, North America, Latin America, the Middle East and Asia-Pacific.
Group Compliance policies and procedures require the prompt identification and escalation to GMO Compliance of all actual or suspected breaches of any law, rule, regulation, Group policy or other relevant requirement. These escalation
procedures are supplemented by a requirement for the submission of compliance certificates at the half-year and year-end by all Group companies detailing any known breaches as above. The contents of these escalation and certification processes are used for reporting to the Risk Management Meeting, the Group Risk Committee and the Board and disclosure in theAnnual Report and AccountsandInterim Report, if appropriate.
Group security and fraud risk
(Unaudited)
Security and fraud risk issues are managed at Group level by Group Security and Fraud Risk. This unit, which has responsibility for physical risk, fraud, information and contingency risk, and security and business intelligence, is fully integrated within the central GMO Risk function. This enables management to identify and mitigate the effect of the permutations of these and other non-financial risks on our business lines across the jurisdictions in which we operate.
Risk management of insurance
operations
(Audited)
We operate a bancassurance model which provides insurance products for customers with whom we have a banking relationship. Insurance products are sold to all customer groups, mainly utilising retail branches, the internet and phone centres. PFS customers attract the majority of sales and comprise the majority of policyholders.
Many of these insurance products are manufactured by our subsidiaries. This allows us to retain the risks and rewards associated with writing insurance contracts as both the underwriting profit and the commission paid by the manufacturer to the bank distribution channel are kept within the Group.
Where we consider it operationally more effective, third parties are engaged to manufacture insurance products for sale through our banking network. We work with a limited number of market-leading partners to provide the products. These arrangements earn us a commission.
Our bancassurance business operates in all six of our geographical regions with over 30 legal entities, the majority of which are subsidiaries of banking legal entities, manufacturing insurance products.
The insurance contracts we sell primarily relate to core underlying banking activities, such as savings and investment products, and credit life products.
155
Report of the Directors: Operating and Financial Review(continued)
Our manufacturing business concentrates on personal lines, e.g. contracts written for individuals. This focus on the higher volume, lower individual value personal lines contributes to diversifying risk.
Overview of insurance products
(Audited)
The main contracts we manufacture are listed below:
| • | | Life insurance contracts with discretionary participation features (‘DPF’); |
| |
| • | | credit life insurance business; |
| |
| • | | annuities; |
| |
| • | | term assurance and critical illness policies; |
| |
| • | | linked life insurance; |
| |
| • | | investment contracts with DPF; |
| |
| • | | unit-linked investment contracts; and |
| |
| • | | other investment contracts (including pension contracts written in Hong Kong). |
Non-life insurance business
Non-life insurance contracts include motor, fire and other damage to property, accident and health, repayment protection and commercial insurance.
Credit non-life insurance is concentrated in North America and Europe, and is originated in conjunction with the provision of loans. Following a decision taken to close the Consumer Lending network in the US, insurance products written in conjunction with this business are being run off.
In December 2007, we decided to stop selling payment protection insurance (‘PPI’) products in the UK and a phased withdrawal was completed across the HSBC, first direct and M&S Money brands during 2008. HFC ceased selling single premium PPI in 2008 and sales of regular premium PPI will reduce as HFC exits its remaining retail relationships. HSBC continues to distribute its UK short-term income protection (‘STIP’) product. In January 2009, the Competition Commission (‘CC’) published its report into the PPI market in which it stipulated that STIP products will also be subject to their remedies when sold in conjunction with or as a result of a referral following the sale of a loan or similar credit product. We have undertaken an analysis of the required changes to the STIP product and its sales processes resulting from the CC’s remedies. Following an appeal to the Competition Appeal Tribunal, the CC had to reconsider whether a ban on firms selling PPI at the point of sale of the credit product was an appropriate and justified remedy for the deficiencies it identified in the PPI
market. On 14 October 2010, the CC confirmed that it intended to proceed with a point of sale ban. It is anticipated that the Order implementing the CC’s remedies will be made in late March or early April, and that the point of sale ban will then come into effect 12 months after the date of the Order.
Nature and extent of risks
(Audited)
The majority of the risk in our insurance business derives from manufacturing activities and can be categorised as insurance risk and financial risks. The following sections describe how these risks are managed. Financial risks include market risk, credit risk and liquidity risk. The assets of insurance manufacturing subsidiaries are included within the consolidated credit risk disclosures on pages 93 to 128, although separate disclosures in respect of insurance manufacturing subsidiaries are provided below. The consolidated liquidity risk and market risk disclosures focus on banking entities and disclosures specific to the insurance manufacturing subsidiaries are provided in the sections below. Operational risk is covered by the Group’s overall operational risk management process.
The insurance manufacturers set their own control procedures in addition to complying with guidelines issued by the Group Insurance Head Office. The control framework for monitoring risk includes the Group Insurance Risk Committee, which oversees the status of the significant risk categories in the insurance operations. Five sub-committees of this Committee focus on products and pricing, market and liquidity risk, credit risk, operational risk and insurance risk, respectively. Similar risk committees exist at regional and entity levels. Any issues requiring escalation from the Group Insurance Risk Committee would be reported to the GMB via the Risk Management Meeting.
In addition, local ALCOs and Risk Management Committees monitor certain risk exposures, mainly for life business where the duration and cash flow matching of insurance assets and liabilities are reviewed.
All insurance products, whether manufactured internally or by a third party, are subjected to a product approval process. Approval is provided by the Regional Insurance Head Office or Group Insurance Head Office depending on the type of product and its risk profile. The approval process is formalised through the Product and Pricing Committee, which comprise the heads of the relevant risk functions within insurance.
156
Report of the Directors: Operating and Financial Review(continued)
(Audited)
Insurance risk is the risk, other than financial risk, of loss transferred from the holder of the insurance contract to the issuer (HSBC). The principal insurance risk we face is that, over time, the cost of acquiring and administering a contract, claims and benefits may exceed the aggregate amount of premiums received and investment income.
The cost of claims and benefits can be influenced by many factors, including mortality and morbidity experience, lapse and surrender rates and, if the policy has a savings element, the performance of the assets held to support the liabilities.
Life and non-life business insurance risks are controlled by high-level policies and procedures set centrally, taking into account where appropriate local market conditions and regulatory requirements.
Formal underwriting, reinsurance and claims-handling procedures designed to ensure compliance with regulations are applied, supplemented with stress testing.
As well as exercising underwriting controls, we use reinsurance as a means of mitigating exposure to insurance risk, in particular to aggregations of catastrophe risk. When we manage our exposure to insurance risk through the use of third-party reinsurers, the associated revenue and manufacturing profit is ceded to them. Although reinsurance provides a means of managing insurance risk, such contracts expose us to credit risk, the risk of default by the reinsurer (see page 165).
The following tables analyse our insurance risk exposures by geographical region and by type of business.
Analysis of life insurance risk – liabilities to policyholders74
(Audited)
| | | | | | | | | | | | | | | | | | | | | | | | | |
| | | | | | | | | | | Rest of | | | | | | | | | | |
| | | | | | | Hong | | | Asia- | | | North | | | Latin | | | | |
| | | Europe | | | Kong | | | Pacific | | | America | | | America | | | Total | |
| | | US$m | | | US$m | | | US$m | | | US$m | | | US$m | | | US$m | |
At 31 December 2010 | | | | | | | | | | | | | | | | | | | | | | | | |
| Life (non-linked) | | | 1,679 | | | | 17,989 | | | | 789 | | | | 1,004 | | | | 2,122 | | | | 23,583 | |
| | | | | | | | | | | | | |
Insurance contracts with DPF75 | | | 327 | | | | 17,203 | | | | 278 | | | | – | | | | – | | | | 17,808 | |
| Credit life | | | 565 | | | | – | | | | 72 | | | | 36 | | | | 2 | | | | 675 | |
| Annuities | | | 471 | | | | – | | | | 31 | | | | 760 | | | | 1,622 | | | | 2,884 | |
| Term assurance and other long-term contracts | | | 316 | | | | 786 | | | | 408 | | | | 208 | | | | 498 | | | | 2,216 | |
| | | | | | | | | | | | | |
| | | | | | | | | | | | | | | | | | | | | | | | | |
| Life (linked) | | | 2,274 | | | | 3,235 | | | | 485 | | | | – | | | | 4,502 | | | | 10,496 | |
| | | | | | | | | | | | | | | | | | | | | | | | | |
Investment contracts with DPF75,76 | | | 22,052 | | | | – | | | | 22 | | | | – | | | | – | | | | 22,074 | |
| | | | | | | | | | | | | |
| | | | | | | | | | | | | | | | | | | | | | | | | |
| Insurance liabilities to policyholders | | | 26,005 | | | | 21,224 | | | | 1,296 | | | | 1,004 | | | | 6,624 | | | | 56,153 | |
| | | | | | | | | | | | | |
| | | | | | | | | | | | | | | | | | | | | | | | | |
| At 31 December 2009 | | | | | | | | | | | | | | | | | | | | | | | | |
| Life (non-linked) | | | 2,998 | | | | 14,456 | | | | 526 | | | | 1,026 | | | | 1,973 | | | | 20,979 | |
| | | | | | | | | | | | | |
Insurance contracts with DPF75 | | | 1,128 | | | | 14,095 | | | | 227 | | | | – | | | | – | | | | 15,450 | |
| Credit life | | | 953 | | | | – | | | | 20 | | | | 50 | | | | – | | | | 1,023 | |
| Annuities | | | 452 | | | | – | | | | 28 | | | | 777 | | | | 1,554 | | | | 2,811 | |
| Term assurance and other long-term contracts | | | 465 | | | | 361 | | | | 251 | | | | 199 | | | | 419 | | | | 1,695 | |
| | | | | | | | | | | | | |
| | | | | | | | | | | | | | | | | | | | | | | | | |
| Life (linked) | | | 2,125 | | | | 2,896 | | | | 437 | | | | – | | | | 3,528 | | | | 8,986 | |
| | | | | | | | | | | | | | | | | | | | | | | | | |
Investment contracts with DPF75,76 | | | 20,979 | | | | – | | | | 35 | | | | – | | | | – | | | | 21,014 | |
| | | | | | | | | | | | | |
| | | | | | | | | | | | | | | | | | | | | | | | | |
| Insurance liabilities to policyholders | | | 26,102 | | | | 17,352 | | | | 998 | | | | 1,026 | | | | 5,501 | | | | 50,979 | |
| | | | | | | | | | | | | |
For footnotes, see page 174.
Our most significant life insurance products are investment contracts with DPF issued in France, insurance contracts with DPF issued in Hong Kong and unit-linked contracts issued in Hong Kong, Latin America and the UK.
The principal drivers of our insurance risk are described below. The liabilities for long-term contracts are set by reference to a range of
assumptions around these drivers. These typically reflect the issuers’ own experiences. The type and quantum of insurance risk arising from life insurance depends on the type of business, and varies considerably.
| • | | mortality and morbidity:the main contracts which generate exposure to these risks are term assurance, whole life products, critical illness |
157
Report of the Directors: Operating and Financial Review(continued)
| | | and income protection contracts and annuities. The risks are monitored on a regular basis, and are primarily mitigated by underwriting controls and reinsurance and by retaining the ability in certain cases to amend premiums in the light of experience; |
| |
| • | | lapses and surrenders:the risks associated with this are generally mitigated by product design, the application of surrender charges and management actions, for example, managing the level of bonus payments to policyholders. A detailed persistency analysis at a product level is carried out at least on an annual basis; and |
| • | | expense riskis mitigated by pricing, for example, retaining the ability in certain cases to amend premiums and/or policyholder charges based on experience, and cost management discipline. |
Economic assumptions, such as investment returns and interest rates, are usually based on observable market data. Clearly, liabilities are affected by changes in assumptions (see ‘Sensitivity of HSBC’s insurance subsidiaries to risk factors’ on page 165 and ‘Sensitivity analysis’ on page 171).
Analysis of non-life insurance risk – net written insurance premiums74,77
(Audited)
| | | | | | | | | | | | | | | | | | | | | | | | | |
| | | | | | | | | | | Rest of | | | | | | | | | | |
| | | | | | | Hong | | | Asia- | | | North | | | Latin | | | | |
| | | Europe | | | Kong | | | Pacific | | | America | | | America | | | Total | |
| | | US$m | | | US$m | | | US$m | | | US$m | | | US$m | | | US$m | |
2010 | | | | | | | | | | | | | | | | | | | | | | | | |
| Accident and health | | | 78 | | | | 174 | | | | 8 | | | | 3 | | | | 37 | | | | 300 | |
| Motor | | | – | | | | 15 | | | | 28 | | | | – | | | | 267 | | | | 310 | |
| Fire and other damage | | | 38 | | | | 29 | | | | 11 | | | | 16 | | | | 22 | | | | 116 | |
| Liability | | | – | | | | 20 | | | | 4 | | | | – | | | | 2 | | | | 26 | |
| Credit (non-life) | | | 25 | | | | – | | | | – | | | | 53 | | | | 2 | | | | 80 | |
| Marine, aviation and transport | | | 3 | | | | 10 | | | | 4 | | | | – | | | | 18 | | | | 35 | |
| Other non-life insurance contracts | | | 20 | | | | 39 | | | | 1 | | | | 9 | | | | 84 | | | | 153 | |
| | | | | | | | | | | | | |
| | | | | | | | | | | | | | | | | | | | | | | | | |
| Total net written insurance premiums | | | 164 | | | | 287 | | | | 56 | | | | 81 | | | | 432 | | | | 1,020 | |
| | | | | | | | | | | | | |
| | | | | | | | | | | | | | | | | | | | | | | | | |
| Net insurance claims incurred and movement in liabilities to policyholders | | | (169 | ) | | | (117 | ) | | | (25 | ) | | | (13 | ) | | | (201 | ) | | | (525 | ) |
| | | | | | | | | | | | | |
| | | | | | | | | | | | | | | | | | | | | | | | | |
| 2009 | | | | | | | | | | | | | | | | | | | | | | | | |
| Accident and health | | | 94 | | | | 160 | | | | 7 | | | | 3 | | | | 23 | | | | 287 | |
| Motor | | | 123 | | | | 14 | | | | 20 | | | | – | | | | 234 | | | | 391 | |
| Fire and other damage | | | 72 | | | | 22 | | | | 8 | | | | 16 | | | | 22 | | | | 140 | |
| Liability | | | – | | | | 15 | | | | 4 | | | | – | | | | 2 | | | | 21 | |
| Credit (non-life) | | | 35 | | | | – | | | | – | | | | 86 | | | | – | | | | 121 | |
| Marine, aviation and transport | | | 7 | | | | 9 | | | | 4 | | | | – | | | | 17 | | | | 37 | |
| Other non-life insurance contracts | | | 24 | | | | 32 | | | | 1 | | | | 12 | | | | 58 | | | | 127 | |
| | | | | | | | | | | | | |
| | | | | | | | | | | | | | | | | | | | | | | | | |
| Total net written insurance premiums | | | 355 | | | | 252 | | | | 44 | | | | 117 | | | | 356 | | | | 1,124 | |
| | | | | | | | | | | | | |
| | | | | | | | | | | | | | | | | | | | | | | | | |
| Net insurance claims incurred and movement in liabilities to policyholders | | | (748 | ) | | | (107 | ) | | | (17 | ) | | | (96 | ) | | | (155 | ) | | | (1,123 | ) |
| | | | | | | | | | | | | |
| | | | | | | | | | | | | | | | | | | | | | | | | |
| 2008 | | | | | | | | | | | | | | | | | | | | | | | | |
| Accident and health | | | 14 | | | | 155 | | | | 5 | | | | 3 | | | | 27 | | | | 204 | |
| Motor | | | 350 | | | | 15 | | | | 14 | | | | – | | | | 273 | | | | 652 | |
| Fire and other damage | | | 150 | | | | 26 | | | | 3 | | | | 4 | | | | 22 | | | | 205 | |
| Liability | | | – | | | | 14 | | | | 4 | | | | – | | | | 34 | | | | 52 | |
| Credit (non-life) | | | 99 | | | | – | | | | – | | | | 144 | | | | – | | | | 243 | |
| Marine, aviation and transport | | | – | | | | 11 | | | | 4 | | | | – | | | | 24 | | | | 39 | |
| Other non-life insurance contracts | | | 49 | | | | 28 | | | | – | | | | 15 | | | | 29 | | | | 121 | |
| | | | | | | | | | | | | |
| | | | | | | | | | | | | | | | | | | | | | | | | |
| Total net written insurance premiums | | | 662 | | | | 249 | | | | 30 | | | | 166 | | | | 409 | | | | 1,516 | |
| | | | | | | | | | | | | |
| | | | | | | | | | | | | | | | | | | | | | | | | |
| Net insurance claims incurred and movement in liabilities to policyholders | | | (553 | ) | | | (121 | ) | | | (13 | ) | | | (98 | ) | | | (176 | ) | | | (961 | ) |
| | | | | | | | | | | | | |
For footnotes, see page 174.
158
Report of the Directors: Operating and Financial Review(continued)
(Audited)
Our motor business is written predominantly in Latin America. The run-off of the UK motor book continued in 2010. Accident and health is written in all regions but mainly in Hong Kong. We write fire and other damage to property contracts in all major markets, most significantly in Europe. Credit non-life insurance, which is originated in conjunction with the provision of loans, is concentrated in the US and Europe.
The main risks associated with non-life business are:
| • | | underwriting: the risk that premiums are not appropriate for the cover provided; and |
| |
| • | | claims experience: the risk that claims exceed expectations. |
We manage these risks through pricing (for example, imposing restrictions and deductibles in the
policy terms and conditions), product design, risk selection, claims handling, investment strategy and reinsurance policy. The majority of our non-life insurance contracts are renewable annually, providing added flexibility to the underwriting terms and conditions.
Balance sheet of insurance manufacturing
subsidiaries
(Audited)
A principal tool we use to manage our exposure to insurance risk, in particular for life insurance contracts, is asset and liability matching.
The tables below show the composition of assets and liabilities by contract and by geographical region and demonstrate that there were sufficient assets to cover the liabilities to policyholders in each case at the end of 2010.
Balance sheet of insurance manufacturing subsidiaries by type of contract
(Audited)
| | | | | | | | | | | | | | | | | | | | | | | | | | | | | | | | | | | | | | | | | |
| | | Insurance contracts | | | Investment contracts | | | | | | | |
| | | | | | | | | | | | | | | Term | | | | | | | | | | | | | | | | | | | | | |
| | | With | | | Unit- | | | Annu- | | | assur- | | | | | | | With | | | Unit- | | | | | | | Other | | | | |
| | | DPF | | | linked | | | ities | | | ance | 78 | | Non-life | | | DPF | 72 | | linked | | | Other | | | assets | 79 | | Total | |
| | | US$m | | | US$m | | | US$m | | | US$m | | | US$m | | | US$m | | | US$m | | | US$m | | | US$m | | | US$m | |
At 31 December 2010 | | | | | | | | | | | | | | | | | | | | | | | | | | | | | | | | | | | | | | | | |
| Financial assets | | | 17,665 | | | | 9,763 | | | | 2,615 | | | | 2,671 | | | | 2,231 | | | | 21,511 | | | | 8,338 | | | | 3,927 | | | | 7,157 | | | | 75,878 | |
| | | | | | | | | | | | | | | | | | | | | |
| – trading assets | | | – | | | | – | | | | – | | | | – | | | | 11 | | | | – | | | | – | | | | – | | | | – | | | | 11 | |
| – financial assets designated at fair value | | | 1,206 | | | | 9,499 | | | | 413 | | | | 523 | | | | 180 | | | | 5,961 | | | | 7,624 | | | | 1,486 | | | | 1,452 | | | | 28,344 | |
| – derivatives | | | 53 | | | | – | | | | 1 | | | | 6 | | | | – | | | | 229 | | | | 7 | | | | 1 | | | | 4 | | | | 301 | |
| – financial investments | | | 14,068 | | | | – | | | | 1,847 | | | | 1,661 | | | | 692 | | | | 14,465 | | | | – | | | | 1,804 | | | | 4,495 | | | | 39,032 | |
| – other financial assets | | | 2,338 | | | | 264 | | | | 354 | | | | 481 | | | | 1,348 | | | | 856 | | | | 707 | | | | 636 | | | | 1,206 | | | | 8,190 | |
| | | | | | | | | | | | | | | | | | | | | |
| | | | | | | | | | | | | | | | | | | | | | | | | | | | | | | | | | | | | | | | | |
| Reinsurance assets | | | 10 | | | | 760 | | | | 400 | | | | 263 | | | | 432 | | | | – | | | | – | | | | – | | | | 79 | | | | 1,944 | |
PVIF80 | | | – | | | | – | | | | – | | | | – | | | | – | | | | – | | | | – | | | | – | | | | 3,440 | | | | 3,440 | |
| Other assets and investment properties | | | 189 | | | | 6 | | | | 21 | | | | 398 | | | | 213 | | | | 565 | | | | 14 | | | | 56 | | | | 712 | | | | 2,174 | |
| | | | | | | | | | | | | | | | | | | | | |
| | | | | | | | | | | | | | | | | | | | | | | | | | | | | | | | | | | | | | | | | |
| Total assets | | | 17,864 | | | | 10,529 | | | | 3,036 | | | | 3,332 | | | | 2,876 | | | | 22,076 | | | | 8,352 | | | | 3,983 | | | | 11,388 | | | | 83,436 | |
| | | | | | | | | | | | | | | | | | | | | |
| | | | | | | | | | | | | | | | | | | | | | | | | | | | | | | | | | | | | | | | | |
| Liabilities under investment contracts: | | | | | | | | | | | | | | | | | | | | | | | | | | | | | | | | | | | | | | | | |
| – designated at fair value | | | – | | | | – | | | | – | | | | – | | | | – | | | | – | | | | 8,321 | | | | 3,379 | | | | – | | | | 11,700 | |
| – carried at amortised cost | | | – | | | | – | | | | – | | | | – | | | | – | | | | – | | | | – | | | | 439 | | | | – | | | | 439 | |
| Liabilities under insurance contracts | | | 17,808 | | | | 10,496 | | | | 2,884 | | | | 2,891 | | | | 2,456 | | | | 22,074 | | | | – | | | | – | | | | – | | | | 58,609 | |
| Deferred tax | | | 11 | | | | – | | | | 20 | | | | 4 | | | | 6 | | | | – | | | | – | | | | 1 | | | | 793 | | | | 835 | |
| Other liabilities | | | – | | | | – | | | | – | | | | – | | | | – | | | | – | | | | – | | | | – | | | | 2,075 | | | | 2,075 | |
| | | | | | | | | | | | | | | | | | | | | |
| Total liabilities | | | 17,819 | | | | 10,496 | | | | 2,904 | | | | 2,895 | | | | 2,462 | | | | 22,074 | | | | 8,321 | | | | 3,819 | | | | 2,868 | | | | 73,658 | |
| Total equity | | | – | | | | – | | | | – | | | | – | | | | – | | | | – | | | | – | | | | – | | | | 9,778 | | | | 9,778 | |
| | | | | | | | | | | | | | | | | | | | | |
Total equity and liabilities81 | | | 17,819 | | | | 10,496 | | | | 2,904 | | | | 2,895 | | | | 2,462 | | | | 22,074 | | | | 8,321 | | | | 3,819 | | | | 12,646 | | | | 83,436 | |
| | | | | | | | | | | | | | | | | | | | | |
159
Report of the Directors: Operating and Financial Review(continued)
Balance sheet of insurance manufacturing subsidiaries by type of contract (continued)
| | | | | | | | | | | | | | | | | | | | | | | | | | | | | | | | | | | | | | | | | |
| | | Insurance contracts | | | Investment contracts | | | | | | | |
| | | | | | | | | | | | | | | Term | | | | | | | | | | | | | | | | | | | | | |
| | | With | | | Unit- | | | Annu- | | | assur- | | | | | | | With | | | Unit- | | | | | | | Other | | | | |
| | | DPF | | | linked | | | ities | | | ance | 78 | | Non-life | | | DPF | 76 | | linked | | | Other | | | assets | 79 | | Total | |
| | | US$m | | | US$m | | | US$m | | | US$m | | | US$m | | | US$m | | | US$m | | | US$m | | | US$m | | | US$m | |
| At 31 December 2009 | | | | | | | | | | | | | | | | | | | | | | | | | | | | | | | | | | | | | | | | |
| Financial assets | | | 15,322 | | | | 8,204 | | | | 2,567 | | | | 2,053 | | | | 2,290 | | | | 20,501 | | | | 7,366 | | | | 4,008 | | | | 7,252 | | | | 69,563 | |
| | | | | | | | | | | | | | | | | | | | | |
| – trading assets | | | – | | | | – | | | | – | | | | – | | | | 10 | | | | – | | | | – | | | | – | | | | – | | | | 10 | |
| – financial assets designated at fair value | | | 599 | | | | 7,837 | | | | 446 | | | | 482 | | | | 63 | | | | 5,498 | | | | 6,572 | | | | 1,582 | | | | 2,085 | | | | 25,164 | |
| – derivatives | | | 16 | | | | 1 | | | | – | | | | 3 | | | | – | | | | 144 | | | | 299 | | | | 2 | | | | 3 | | | | 468 | |
| – financial investments | | | 13,013 | | | | – | | | | 1,511 | | | | 1,033 | | | | 742 | | | | 13,948 | | | | – | | | | 1,701 | | | | 3,901 | | | | 35,849 | |
| – other financial assets | | | 1,694 | | | | 366 | | | | 610 | | | | 535 | | | | 1,475 | | | | 911 | | | | 495 | | | | 723 | | | | 1,263 | | | | 8,072 | |
| | | | | | | | | | | | | | | | | | | | | |
| | | | | | | | | | | | | | | | | | | | | | | | | | | | | | | | | | | | | | | | | |
| Reinsurance assets | | | 6 | | | | 831 | | | | 376 | | | | 389 | | | | 467 | | | | – | | | | – | | | | – | | | | 60 | | | | 2,129 | |
PVIF80 | | | – | | | | – | | | | – | | | | – | | | | – | | | | – | | | | – | | | | – | | | | 2,780 | | | | 2,780 | |
| Other assets and investment properties | | | 165 | | | | 5 | | | | 25 | | | | 634 | | | | 242 | | | | 516 | | | | 13 | | | | 56 | | | | 601 | | | | 2,257 | |
| | | | | | | | | | | | | | | | | | | | | |
| | | | | | | | | | | | | | | | | | | | | | | | | | | | | | | | | | | | | | | | | |
| Total assets | | | 15,493 | | | | 9,040 | | | | 2,968 | | | | 3,076 | | | | 2,999 | | | | 21,017 | | | | 7,379 | | | | 4,064 | | | | 10,693 | | | | 76,729 | |
| | | | | | | | | | | | | | | | | | | | | |
| | | | | | | | | | | | | | | | | | | | | | | | | | | | | | | | | | | | | | | | | |
| Liabilities under investment contracts: | | | | | | | | | | | | | | | | | | | | | | | | | | | | | | | | | | | | | | | | |
| – designated at fair value | | | – | | | | – | | | | – | | | | – | | | | – | | | | – | | | | 7,347 | | | | 3,518 | | | | ��� | | | | 10,865 | |
| – carried at amortised cost | | | – | | | | – | | | | – | | | | – | | | | – | | | | – | | | | – | | | | 417 | | | | – | | | | 417 | |
| Liabilities under insurance contracts | | | 15,450 | | | | 8,986 | | | | 2,811 | | | | 2,718 | | | | 2,728 | | | | 21,014 | | | | – | | | | – | | | | – | | | | 53,707 | |
| Deferred tax | | | 6 | | | | – | | | | 22 | | | | 1 | | | | 7 | | | | 1 | | | | – | | | | 2 | | | | 750 | | | | 789 | |
| Other liabilities | | | – | | | | – | | | | – | | | | – | | | | – | | | | – | | | | – | | | | – | | | | 2,371 | | | | 2,371 | |
| | | | | | | | | | | | | | | | | | | | | |
| | | | | | | | | | | | | | | | | | | | | | | | | | | | | | | | | | | | | | | | | |
| Total liabilities | | | 15,456 | | | | 8,986 | | | | 2,833 | | | | 2,719 | | | | 2,735 | | | | 21,015 | | | | 7,347 | | | | 3,937 | | | | 3,121 | | | | 68,149 | |
| | | | | | | | | | | | | | | | | | | | | | | | | | | | | | | | | | | | | | | | | |
| Total equity | | | – | | | | – | | | | – | | | | – | | | | – | | | | – | | | | – | | | | – | | | | 8,580 | | | | 8,580 | |
| | | | | | | | | | | | | | | | | | | | | |
| | | | | | | | | | | | | | | | | | | | | | | | | | | | | | | | | | | | | | | | | |
Total equity and liabilities82 | | | 15,456 | | | | 8,986 | | | | 2,833 | | | | 2,719 | | | | 2,735 | | | | 21,015 | | | | 7,347 | | | | 3,937 | | | | 11,701 | | | | 76,729 | |
| | | | | | | | | | | | | | | | | | | | | |
For footnotes, see page 174.
Balance sheet of insurance manufacturing subsidiaries by geographical region74
(Audited)
| | | | | | | | | | | | Rest of | | | | | | | | | | | | | |
| | | | | | | Hong | | | Asia- | | | North | | | Latin | | | | |
| | | Europe | | | Kong | | | Pacific | | | America | | | America | | | Total | |
| | | US$m | | | US$m | | | US$m | | | US$m | | | US$m | | | US$m | |
At 31 December 2010 | | | | | | | | | | | | | | | | | | | | | | | | |
| Financial assets | | | 36,233 | | | | 26,278 | | | | 1,651 | | | | 2,548 | | | | 9,168 | | | | 75,878 | |
| | | | | | | | | | | | | |
| – trading assets | | | – | | | | – | | | | – | | | | – | | | | 11 | | | | 11 | |
| – financial assets designated at fair value | | | 16,133 | | | | 5,550 | | | | 1,106 | | | | – | | | | 5,555 | | | | 28,344 | |
| – derivatives | | | 238 | | | | 50 | | | | 12 | | | | – | | | | 1 | | | | 301 | |
| – financial investments | | | 16,758 | | | | 17,299 | | | | 247 | | | | 2,006 | | | | 2,722 | | | | 39,032 | |
| – other financial assets | | | 3,104 | | | | 3,379 | | | | 286 | | | | 542 | | | | 879 | | | | 8,190 | |
| | | | | | | | | | | | | |
| | | | | | | | | | | | | | | | | | | | | | | | | |
| Reinsurance assets | | | 974 | | | | 770 | | | | 33 | | | | 23 | | | | 144 | | | | 1,944 | |
PVIF80 | | | 1,102 | | | | 1,734 | | | | 165 | | | | 141 | | | | 298 | | | | 3,440 | |
| Other assets and investment properties | | | 1,060 | | | | 743 | | | | 26 | | | | 9 | | | | 336 | | | | 2,174 | |
| | | | | | | | | | | | | |
| | | | | | | | | | | | | | | | | | | | | | | | | |
| Total assets | | | 39,369 | | | | 29,525 | | | | 1,875 | | | | 2,721 | | | | 9,946 | | | | 83,436 | |
| | | | | | | | | | | | | |
| | | | | | | | | | | | | | | | | | | | | | | | | |
| Liabilities under investment contracts: | | | | | | | | | | | | | | | | | | | | | | | | |
| – designated at fair value | | | 7,359 | | | | 4,300 | | | | 41 | | | | – | | | | – | | | | 11,700 | |
| – carried at amortised cost | | | – | | | | – | | | | – | | | | – | | | | 439 | | | | 439 | |
| Liabilities under insurance contracts | | | 27,475 | | | | 21,515 | | | | 1,381 | | | | 1,169 | | | | 7,069 | | | | 58,609 | |
| Deferred tax | | | 375 | | | | 298 | | | | 39 | | | | – | | | | 123 | | | | 835 | |
| Other liabilities | | | 1,354 | | | | 289 | | | | 58 | | | | 12 | | | | 362 | | | | 2,075 | |
| | | | | | | | | | | | | |
| | | | | | | | | | | | | | | | | | | | | | | | | |
| Total liabilities | | | 36,563 | | | | 26,402 | | | | 1,519 | | | | 1,181 | | | | 7,993 | | | | 73,658 | |
| | | | | | | | | | | | | | | | | | | | | | | | | |
| Total equity | | | 2,806 | | | | 3,123 | | | | 356 | | | | 1,540 | | | | 1,953 | | | | 9,778 | |
| | | | | | | | | | | | | |
| | | | | | | | | | | | | | | | | | | | | | | | | |
Total equity and liabilities81 | | | 39,369 | | | | 29,525 | | | | 1,875 | | | | 2,721 | | | | 9,946 | | | | 83,436 | |
| | | | | | | | | | | | | |
160
Report of the Directors: Operating and Financial Review(continued)
| | | | | | | | | | | | Rest of | | | | | | | | | | | | | |
| | | | | | | Hong | | | Asia- | | | North | | | Latin | | | | |
| | | Europe | | | Kong | | | Pacific | | | America | | | America | | | Total | |
| | | US$m | | | US$m | | | US$m | | | US$m | | | US$m | | | US$m | |
| At 31 December 2009 | | | | | | | | | | | | | | | | | | | | | | | | |
| Financial assets | | | 35,704 | | | | 22,337 | | | | 1,330 | | | | 2,582 | | | | 7,610 | | | | 69,563 | |
| | | | | | | | | | | | | |
| – trading assets | | | – | | | | – | | | | – | | | | – | | | | 10 | | | | 10 | |
| – financial assets designated at fair value | | | 14,756 | | | | 4,758 | | | | 877 | | | | – | | | | 4,773 | | | | 25,164 | |
| – derivatives | | | 446 | | | | 18 | | | | 3 | | | | – | | | | 1 | | | | 468 | |
| – financial investments | | | 16,940 | | | | 14,771 | | | | 133 | | | | 2,037 | | | | 1,968 | | | | 35,849 | |
| – other financial assets | | | 3,562 | | | | 2,790 | | | | 317 | | | | 545 | | | | 858 | | | | 8,072 | |
| | | | | | | | | | | | | |
| | | | | | | | | | | | | | | | | | | | | | | | | |
| Reinsurance assets | | | 1,100 | | | | 849 | | | | 25 | | | | 19 | | | | 136 | | | | 2,129 | |
PVIF80 | | | 1,022 | | | | 1,248 | | | | 113 | | | | 138 | | | | 259 | | | | 2,780 | |
| Other assets and investment properties | | | 1,380 | | | | 498 | | | | 23 | | | | 40 | | | | 316 | | | | 2,257 | |
| | | | | | | | | | | | | |
| | | | | | | | | | | | | | | | | | | | | | | | | |
| Total assets | | | 39,206 | | | | 24,932 | | | | 1,491 | | | | 2,779 | | | | 8,321 | | | | 76,729 | |
| | | | | | | | | | | | | |
| | | | | | | | | | | | | | | | | | | | | | | | | |
| Liabilities under investment contracts: | | | | | | | | | | | | | | | | | | | | | | | | |
| – designated at fair value | | | 6,500 | | | | 4,299 | | | | 66 | | | | – | | | | – | | | | 10,865 | |
| – carried at amortised cost | | | – | | | | – | | | | – | | | | – | | | | 417 | | | | 417 | |
| Liabilities under insurance contracts | | | 27,845 | | | | 17,618 | | | | 1,072 | | | | 1,268 | | | | 5,904 | | | | 53,707 | |
| Deferred tax | | | 334 | | | | 220 | | | | 27 | | | | 82 | | | | 126 | | | | 789 | |
| Other liabilities | | | 1,744 | | | | 284 | | | | 54 | | | | 3 | | | | 286 | | | | 2,371 | |
| | | | | | | | | | | | | |
| | | | | | | | | | | | | | | | | | | | | | | | | |
| Total liabilities | | | 36,423 | | | | 22,421 | | | | 1,219 | | | | 1,353 | | | | 6,733 | | | | 68,149 | |
| | | | | | | | | | | | | | | | | | | | | | | | | |
| Total equity | | | 2,783 | | | | 2,511 | | | | 272 | | | | 1,426 | | | | 1,588 | | | | 8,580 | |
| | | | | | | | | | | | | |
| | | | | | | | | | | | | | | | | | | | | | | | | |
Total equity and liabilities82 | | | 39,206 | | | | 24,932 | | | | 1,491 | | | | 2,779 | | | | 8,321 | | | | 76,729 | |
| | | | | | | | | | | | | |
For footnotes, see page 174.
(Audited)
Our insurance businesses are exposed to a range of financial risks, including market risk, credit risk and liquidity risk. Market risk includes interest rate risk, equity risk and foreign exchange risk. The nature and management of these risks is described below.
Manufacturing subsidiaries are exposed to financial risks when, for example, the proceeds from financial assets are not sufficient to fund the obligations arising from non-linked insurance and investment contracts. In many jurisdictions, local regulatory requirements prescribe the type, quality
and concentration of assets that these subsidiaries must maintain to meet insurance liabilities. These requirements complement Group-wide policies.
The following table analyses the assets held in our insurance manufacturing subsidiaries at 31 December 2010 by type of contract, and provides a view of the exposure to financial risk. For linked contracts, which pay benefits to policyholders which are determined by reference to the value of the investments supporting the policies, we typically designate assets at fair value; for non-linked contracts, the classification of the assets is driven by the nature of the underlying contract.
161
Report of the Directors: Operating and Financial Review(continued)
Financial assets held by insurance manufacturing subsidiaries
(Audited)
| | | | | | | | | | | | | | | | | | | | | |
| | | Life linked | | | Life non-linked | | | Non-life | | | Other | | | | |
| | | Contracts | 83 | | contracts | 84 | | insurance | 85 | | assets | 79 | | Total | |
| | | US$m | | | US$m | | | US$m | | | US$m | | | US$m | |
| | | | | | | | | | | |
| | | | | | | | | | | | | | | | | | | | | |
At 31 December 2010 | | | | | | | | | | | | | | | | | | | | |
| Trading assets | | | | | | | | | | | | | | | | | | | | |
| Debt securities | | | – | | | | – | | | | 11 | | | | – | | | | 11 | |
| | | | | | | | | | | | | | | | | | | | | |
| Financial assets designated at fair value | | | 17,123 | | | | 9,589 | | | | 180 | | | | 1,452 | | | | 28,344 | |
| | | | | | | | | | | |
| Treasury bills | | | 10 | | | | 119 | | | | – | | | | 10 | | | | 139 | |
| Debt securities | | | 6,660 | | | | 3,281 | | | | 180 | | | | 847 | | | | 10,968 | |
| Equity securities | | | 10,453 | | | | 6,189 | | | | – | | | | 595 | | | | 17,237 | |
| | | | | | | | | | | |
| | | | | | | | | | | | | | | | | | | | | |
| Financial investments | | | | | | | | | | | | | | | | | | | | |
| Held-to-maturity: | | | | | | | | | | | | | | | | | | | | |
| – debt securities | | | – | | | | 16,015 | | | | 152 | | | | 908 | | | | 17,075 | |
| | | | | | | | | | | | | | | | | | | | | |
| Available-for-sale: | | | – | | | | 17,830 | | | | 540 | | | | 3,587 | | | | 21,957 | |
| | | | | | | | | | | |
| – Treasury bills | | | – | | | | 10 | | | | – | | | | 31 | | | | 41 | |
| – other eligible bills | | | – | | | | 36 | | | | 140 | | | | 217 | | | | 393 | |
| – debt securities | | | – | | | | 17,776 | | | | 391 | | | | 3,210 | | | | 21,377 | |
| – equity securities | | | – | | | | 8 | | | | 9 | | | | 129 | | | | 146 | |
| | | | | | | | | | | |
| | | | | | | | | | | | | | | | | | | | | |
| Derivatives | | | 7 | | | | 290 | | | | – | | | | 4 | | | | 301 | |
Other financial assets86 | | | 971 | | | | 4,665 | | | | 1,348 | | | | 1,206 | | | | 8,190 | |
| | | | | | | | | | | |
| | | | | | | | | | | | | | | | | | | | | |
Total financial assets81 | | | 18,101 | | | | 48,389 | | | | 2,231 | | | | 7,157 | | | | 75,878 | |
| | | | | | | | | | | |
| | | | | | | | | | | | | | | | | | | | | |
| At 31 December 2009 | | | | | | | | | | | | | | | | | | | | |
| Trading assets | | | | | | | | | | | | | | | | | | | | |
| Debt securities | | | – | | | | – | | | | 10 | | | | – | | | | 10 | |
| | | | | | | | | | | | | | | | | | | | | |
| Financial assets designated at fair value | | | 14,409 | | | | 8,607 | | | | 63 | | | | 2,085 | | | | 25,164 | |
| | | | | | | | | | | |
| Treasury bills | | | 46 | | | | 174 | | | | – | | | | 3 | | | | 223 | |
| Debt securities | | | 5,086 | | | | 3,428 | | | | 63 | | | | 1,220 | | | | 9,797 | |
| Equity securities | | | 9,277 | | | | 5,005 | | | | – | | | | 862 | | | | 15,144 | |
| | | | | | | | | | | |
| | | | | | | | | | | | | | | | | | | | | |
| Financial investments | | | | | | | | | | | | | | | | | | | | |
| Held-to-maturity: | | | | | | | | | | | | | | | | | | | | |
| – debt securities | | | – | | | | 13,995 | | | | 186 | | | | 670 | | | | 14,851 | |
| | | | | | | | | | | | | | | | | | | | | |
| Available-for-sale: | | | – | | | | 17,211 | | | | 556 | | | | 3,231 | | | | 20,998 | |
| | | | | | | | | | | |
| – Treasury bills | | | – | | | | – | | | | 211 | | | | 86 | | | | 297 | |
| – other eligible bills | | | – | | | | 26 | | | | 127 | | | | 126 | | | | 279 | |
| – debt securities | | | – | | | | 17,169 | | | | 199 | | | | 2,787 | | | | 20,155 | |
| – equity securities | | | – | | | | 16 | | | | 19 | | | | 232 | | | | 267 | |
| | | | | | | | | | | |
| | | | | | | | | | | | | | | | | | | | | |
| Derivatives | | | 300 | | | | 165 | | | | – | | | | 3 | | | | 468 | |
Other financial assets86 | | | 861 | | | | 4,473 | | | | 1,475 | | | | 1,263 | | | | 8,072 | |
| | | | | | | | | | | |
| | | | | | | | | | | | | | | | | | | | | |
Total financial assets82 | | | 15,570 | | | | 44,451 | | | | 2,290 | | | | 7,252 | | | | 69,563 | |
| | | | | | | | | | | |
For footnotes, see page 174.
Approximately 65.1% of financial assets were invested in debt securities at 31 December 2010 (2009: 64.4%) with 22.9% (2009: 22.2%) invested in equity securities.
In life linked insurance, premium income less charges levied is invested in a portfolio of assets. We manage the financial risks of this product on behalf of the policyholders by holding appropriate assets in segregated funds or portfolios to which the liabilities are linked. These assets represented 23.9% of the total financial assets of our insurance manufacturing subsidiaries at the end of 2010 (2009: 22.4%).
(Audited)
Market risk arises when mismatches occur between product liabilities and the investment assets which back them. For example, mismatches between asset and liability yields and maturities give rise to interest rate risk.
Description of market risk
(Audited)
The main features of products manufactured by our insurance manufacturing subsidiaries which generate market risk, and the market risk to which these
162
Report of the Directors: Operating and Financial Review(continued)
features expose the subsidiaries, are discussed below.
Long-term insurance or investment products may incorporate benefits that are guaranteed. The table below shows, in respect of each category of guarantee, the total liabilities to policyholders established for guaranteed products manufactured by our insurance subsidiaries. The table also shows the range of investment returns (net of operating costs) on the assets supporting these products and the implied investment returns that would enable the business to meet the guarantees.
Categories of guaranteed benefits
| • | | annuities in payment; |
| |
| • | | deferred/immediate annuities: these consist of two phases – the savings and investing phase and the retirement income phase; |
| |
| • | | annual return: the annual return is guaranteed to be no lower than a specified rate. This may be the return credited to the policyholder every year, or the average annual return credited to the policyholder over the life of the policy, which may occur on the maturity date or the surrender date of the contract; and |
| |
| • | | capital: policyholders are guaranteed to receive no less than the premiums paid plus declared bonuses less expenses. |
Liabilities to policyholders87
(Audited)
| | | | | | | | | | | | | | | | | | | | | | | | | |
| | | 2010 | | 2009 |
| | | | | | | Investment | | | | | | | | | | | Investment | | | | |
| | | | | | | returns | | | | | | | | | | | returns | | | | |
| | | | Amount of | | | implied by | | | Current | | | Amount of | | | implied by | | | Current | |
| | | reserve | | | guarantee | 81 | | yields | | | reserve | | | guarantee | 82 | | yields | |
| | | US$m | | | % | | | % | | | US$m | | | % | | | % | |
| | | | | | | | | | | | | | | | | | | | | | | | | |
| Annuities in payment | | | 1,491 | | | | 0.0 – 8.5 | | | | 1.5 – 16.2 | | | | 1,299 | | | | 0.0 – 7.5 | | | | 1.3 – 16.7 | |
| Deferred annuities | | | 642 | | | | 0.0 – 6.0 | | | | 2.1 – 16.8 | | | | 569 | | | | 0.0 – 6.0 | | | | 0.9 – 15.1 | |
| Immediate annuities | | | 532 | | | | 6.0 – 9.0 | | | | 5.5 – 5.5 | | | | 553 | | | | 6.0 – 9.0 | | | | 5.4 – 5.4 | |
| Annual return | | | 19,980 | | | | 0.0 – 4.5 | | | | 0.0 – 5.9 | | | | 17,147 | | | | 0.0 – 4.5 | | | | 0.8 – 6.2 | |
| Annual return | | | 841 | | | | 4.5 – 6.0 | | | | 6.1 – 8.5 | | | | 497 | | | | 4.5 – 6.0 | | | | 5.1 – 6.5 | |
| Capital | | | 15,445 | | | | – | | | | 2.0 – 4.0 | | | | 15,866 | | | | – | | | | 2.4 – 4.3 | |
For footnotes, see page 174.
Interest rate risk arises to the extent that yields on the assets are lower than the investment returns implied by the guarantees payable to policyholders by insurance manufacturing subsidiaries. When this happens, we may discontinue products.
The proceeds from insurance and investment products with DPF are primarily invested in bonds with a proportion allocated to other asset classes in order to provide customers with the potential for enhanced returns. Subsidiaries with portfolios of such products are exposed to the risk of falls in market prices which cannot be fully reflected in the discretionary bonuses. An increase in market volatility could also result in an increase in the value of the guarantee to the policyholder.
Long-term insurance and investment products typically permit the policyholder to surrender the policy or let it lapse at any time. When the surrender value is not linked to the value realised from the sale of the associated supporting assets, the subsidiary is exposed to market risk. In particular, when customers seek to surrender their policies when asset values are falling, assets may have to be sold at a loss to fund redemptions.
A subsidiary holding a portfolio of long-term insurance and investment products, especially with DPF, may attempt to reduce exposure to its local market by investing in assets in countries other than that in which it is based. These assets may be denominated in currencies other than the subsidiary’s local currency. It is often not cost effective for the subsidiary to hedge the foreign exchange exposure associated with these assets, and this exposes it to the risk that its local currency will strengthen against the currency of the related assets.
For unit-linked contracts, market risk is substantially borne by the policyholder, but we typically remain exposed to market risk as the market value of the linked assets influences the fees we earn for managing them.
Asset and liability matching
It may not always be possible to achieve a complete matching of asset and liability durations, partly because there is uncertainty over policyholder behaviour, which introduces uncertainty over the receipt of all future premiums and the timing of claims, and partly because the duration of liabilities may exceed the duration of the longest available dated fixed interest investments.
163
Report of the Directors: Operating and Financial Review(continued)
We use models to assess the effect of a range of future scenarios on the values of financial assets and associated liabilities, and ALCOs employ the outcomes in determining how the assets and liabilities should be matched. The scenarios include stresses applied to factors which affect insurance risk such as mortality and lapse rates. Of particular importance is matching the expected pattern of cash inflows with the benefits payable on the underlying contracts, which can extend for many years.
Our current portfolio of assets includes debt securities issued at a time when yields were higher than those observed in the current market. As a result, yields on extant holdings of debt securities exceed those which may be obtained on current issues. We reduced short-term bonus rates paid to policyholders on certain participating contracts to manage the immediate strain on the business. Should interest rates and yield curves remain low for prolonged periods, further such steps may be needed.
How market risk is managed
(Audited)
All our insurance manufacturing subsidiaries have market risk mandates which specify the investment instruments in which they are permitted to invest and the maximum quantum of market risk which they are permitted to retain. They manage market risk by using some or all of the techniques listed below, depending on the nature of the contracts they write.
Techniques for managing market risk
| • | | for products with DPF, adjusting bonus rates to manage the liabilities to policyholders. The effect is that a significant portion of the market risk is borne by the policyholder; |
| |
| • | | as far as possible, matching assets to liabilities; |
| |
| • | | using derivatives to a limited extent; |
| |
| • | | for new products with investment guarantees, considering the cost when determining the level of premiums or the price structure; |
| |
| • | | periodically reviewing products identified as higher risk, which contain investment guarantees and embedded optionality features linked to savings and investment products; |
| |
| • | | including features designed to mitigate market risk in new products, such as charging surrender penalties to recoup losses incurred when policyholders surrender their policies; and |
| |
| • | | exiting, to the extent possible, investment portfolios whose risk is considered unacceptable. |
In the product approval process, the risks embedded in new products are identified and assessed. When, for example, options and guarantees are embedded in new products, the due diligence process ensures that complete and appropriate risk management procedures are in place. For all but the simplest of guaranteed benefits the assessment is
undertaken by Group Insurance Head Office. Management reviews certain exposures more frequently when markets are more volatile to ensure that any matters arising are dealt with in a timely fashion.
How the exposure to market risk is measured
(Audited)
Our insurance manufacturing subsidiaries monitor exposures against mandated limits regularly and report them to Group Insurance Head Office. Exposures are aggregated and reported on a quarterly basis to senior risk management forums in the Group, including the Group Insurance Market and Liquidity Risk Committee, Group Insurance Risk Committee and the Group Stress Test Review Group.
Standard measures for quantifying market risks
| • | | for interest rate risk, the sensitivities of the net present values of asset and expected liability cash flows, in total and by currency, to a one basis point parallel shift in the discount curves used to calculate the net present values; |
| |
| • | | for equity price risk, the total market value of equity holdings and the market value of equity holdings by region and country; and |
| |
| • | | for foreign exchange risk, the total net short foreign exchange position and the net foreign exchange positions by currency. |
The standard measures are relatively straightforward to calculate and aggregate, but they have limitations. The most significant one is that a parallel shift in yield curves of one basis point does not capture the non-linear relationships between the values of certain assets and liabilities and interest rates. Non-linearity arises, for example, from investment guarantees and product features which enable policyholders to surrender their policies. We bear the shortfall if the yields on investments held to support contracts with guaranteed benefits are less than the investment returns implied by the guaranteed benefits.
We recognise these limitations and augment our standard measures with stress tests which examine the effect of a range of market rate scenarios on the aggregate annual profits and total equity of our insurance manufacturing subsidiaries, after taking into consideration tax and accounting treatments where material and relevant. The results of these tests are reported to Group Insurance Head Office and risk committees every quarter.
The following table illustrates the effects of various interest rate, equity price, foreign exchange rate and credit spread scenarios on our profit for the year and total equity of our insurance manufacturing subsidiaries:
164
Report of the Directors: Operating and Financial Review(continued)
Sensitivity of HSBC’s insurance manufacturing subsidiaries to risk factors
(Audited)
| | | | | | | | | | | | | | | | | |
| | | 2010 | | 2009 |
| | | Effect on | | | Effect on | | | Effect on | | | Effect on | |
| | | profit for | | | total | | | profit for | | | total | |
| | | the year | | | equity | | | the year | | | equity | |
| | | US$m | | | US$m | | | US$m | | | US$m | |
| | | | | | | | | | | | | | | | | |
| + 100 basis points parallel shift in yield curves | | | 72 | | | | (132 | ) | | | 68 | | | | (82 | ) |
| – 100 basis points parallel shift in yield curves | | | (86 | ) | | | 131 | | | | (69 | ) | | | 92 | |
| 10% increase in equity prices | | | 76 | | | | 76 | | | | 19 | | | | 19 | |
| 10% decrease in equity prices | | | (76 | ) | | | (76 | ) | | | (20 | ) | | | (20 | ) |
| 10% increase in US dollar exchange rate compared to all currencies | | | 21 | | | | 21 | | | | 20 | | | | 20 | |
| 10% decrease in US dollar exchange rate compared to all currencies | | | (21 | ) | | | (21 | ) | | | (20 | ) | | | (20 | ) |
| Sensitivity to credit spread increases | | | (31 | ) | | | (74 | ) | | | (36 | ) | | | (91 | ) |
Where appropriate, we include the impact of the stress on the PVIF in the results of the stress tests. The relationship between the values of certain assets and liabilities and the risk factors may be non-linear and, therefore, the results disclosed cannot be extrapolated to measure sensitivities to different levels of stress. The sensitivities are stated before allowance for the effect of management actions which may mitigate changes in market rates, and for any factors such as policyholder behaviour that may change in response to changes in market risk.
(Audited)
Description of credit risk
Credit risk can give rise to losses through default and can lead to volatility in our income statement and balance sheet figures through movements in credit spreads, principally on the US$43.3bn (2009: US$40.5bn) non-linked bond portfolio.
As tabulated above, the sensitivity of the net profit after tax of our insurance subsidiaries to the effects of increases in credit spreads is a fall of US$31m (2009: US$36m fall). This is small because 51.4% of the financial assets held by our insurance subsidiaries are classified as either held to maturity or available for sale, and consequently any changes in the fair value of these financial investments, absent impairment, would have no impact on the profit after tax. We calculate the sensitivity using simplified assumptions based on a one-day movement in credit spreads over a two-year period. A confidence level of 99%, consistent with our Group VAR, is applied. While credit spreads have generally widened from the levels observed at the end of 2009, the volatility experienced during 2010 was lower than that seen in 2009, leading to a reduction in our sensitivity to credit spread movements.
We used to sell certain unit-linked life insurance contracts which were reinsured with a third-party counterparty, who also underwrote market return guarantees. We are exposed to credit risk to the extent that the counterparty is unable to meet the terms of the guaranteed benefits. The cost to us of market return guarantees increases when interest rates fall, equity markets fall or market volatility increases. In addition, when determined by reference to a discounted cash flow model in which the discount rate is based on current interest rates, guarantee costs increase in a falling interest rate environment. The sale of these contracts ceased in 2008, reflecting our adjusted risk appetite.
How credit risk is managed
Our exposure to credit risk products is included in the tables showing exposures to life and non-life insurance risk on pages 157 to 159. Our insurance manufacturing subsidiaries are responsible for the credit risk, quality and performance of their investment portfolios. Our assessment of the creditworthiness of issuers and counterparties is based primarily upon internationally recognised credit ratings and other publicly available information.
Investment credit exposures are monitored against limits by our local insurance manufacturing subsidiaries, and are aggregated and reported to Group Credit Risk, the Group Insurance Credit Risk Meeting and the Group Insurance Risk Committee. Stress testing is performed by Group Insurance Head Office on the investment credit exposures using credit spread sensitivities and default probabilities. The stresses are reported to the Group Insurance Risk Committee.
We use a number of tools to manage and monitor credit risk. These include an Early Warning Report and a watch list of investments with current credit concerns which are circulated fortnightly to
165
Report of the Directors: Operating and Financial Review(continued)
senior management in Group Insurance Head Office and the Regional Chief Risk Officers to identify investments which may be at risk of future impairment.
Credit quality
(Audited)
The following table presents an analysis of treasury bills, other eligible bills and debt securities within
our insurance business by measures of credit quality. The five credit quality classifications are defined on page 114. Only assets supporting non-linked liabilities are included in the table as financial risk on assets supporting linked liabilities is predominantly borne by the policyholder. 90.5% (2009: 90.9%) of the assets included in the table are invested in investments rated as ‘Strong’.
Treasury bills, other eligible bills and debt securities in HSBC’s insurance manufacturing subsidiaries
(Audited)
| | | | | | | | | | | | | | | | | | | | | | | | | |
| | | Neither past due nor impaired | | | | | | |
| | | | | | Sub- | | | | | | | |
| | | Strong | | | Good | | | Satisfactory | | | standard | | | Impaired | 88 | | Total | |
| | | US$m | | | US$m | | | US$m | | | US$m | | | US$m | | | US$m | |
At 31 December 2010 | | | | | | | | | | | | | | | | | | | | | | | | |
| | | | | | | | | | | | | | | | | | | | | | | | | |
Supporting liabilities under non-linked insurance and investment contracts | | | | | | | | | | | | | | | | | | | | | | | | |
| Trading assets – debt securities | | | 9 | | | | – | | | | 2 | | | | – | | | | – | | | | 11 | |
| | | | | | | | | | | | | | | | | | | | | | | | | |
| Financial assets designated at fair value | | | 3,126 | | | | 88 | | | | 330 | | | | 36 | | | | – | | | | 3,580 | |
| | | | | | | | | | | | | |
| – treasury and other eligible bills | | | 118 | | | | – | | | | 1 | | | | – | | | | – | | | | 119 | |
| – debt securities | | | 3,008 | | | | 88 | | | | 329 | | | | 36 | | | | – | | | | 3,461 | |
| | | | | | | | | | | | | |
| | | | | | | | | | | | | | | | | | | | | | | | | |
| | | | | | | | | | | | | | | | | | | | | | | | | |
| Financial investments | | | 32,164 | | | | 1,948 | | | | 250 | | | | 158 | | | | – | | | | 34,520 | |
| | | | | | | | | | | | | |
| – treasury and other similar bills | | | – | | | | – | | | | 10 | | | | – | | | | – | | | | 10 | |
| – other eligible bills | | | 176 | | | | – | | | | – | | | | – | | | | – | | | | 176 | |
| – debt securities | | | 31,988 | | | | 1,948 | | | | 240 | | | | 158 | | | | – | | | | 34,334 | |
| | | | | | | | | | | | | |
| | | | 35,299 | | | | 2,036 | | | | 582 | | | | 194 | | | | – | | | | 38,111 | |
| | | | | | | | | | | | | |
| | | | | | | | | | | | | | | | | | | | | | | | | |
Supporting shareholders’ funds89 | | | | | | | | | | | | | | | | | | | | | | | | |
| Financial assets designated at fair value | | | 492 | | | | 286 | | | | 75 | | | | 4 | | | | – | | | | 857 | |
| | | | | | | | | | | | | |
| – treasury and other eligible bills | | | 10 | | | | – | | | | – | | | | – | | | | – | | | | 10 | |
| – debt securities | | | 482 | | | | 286 | | | | 75 | | | | 4 | | | | – | | | | 847 | |
| | | | | | | | | | | | | |
| | | | | | | | | | | | | | | | | | | | | | | | | |
| Financial investments | | | 3,443 | | | | 740 | | | | 101 | | | | 82 | | | | – | | | | 4,366 | |
| | | | | | | | | | | | | |
| – treasury and other similar bills | | | – | | | | – | | | | 31 | | | | – | | | | – | | | | 31 | |
| – other eligible bills | | | 217 | | | | – | | | | – | | | | – | | | | – | | | | 217 | |
| – debt securities | | | 3,226 | | | | 740 | | | | 70 | | | | 82 | | | | – | | | | 4,118 | |
| | | | | | | | | | | | | |
| | | | | | | | | | | | | | | | | | | | | | | | | |
| | | | | | | | | | | | | |
| | | | | | | | | | | | | | | | | | | | | | | | | |
| | | | 3,935 | | | | 1,026 | | | | 176 | | | | 86 | | | | – | | | | 5,223 | |
| | | | | | | | | | | | | |
| | | | | | | | | | | | | | | | | | | | | | | | | |
Total81 | | | | | | | | | | | | | | | | | | | | | | | | |
| Trading assets – debt securities | | | 9 | | | | – | | | | 2 | | | | – | | | | – | | | | 11 | |
| | | | | | | | | | | | | | | | | | | | | | | | | |
| Financial assets designated at fair value | | | 3,618 | | | | 374 | | | | 405 | | | | 40 | | | | – | | | | 4,437 | |
| | | | | | | | | | | | | |
| – treasury and other eligible bills | | | 128 | | | | – | | | | 1 | | | | – | | | | – | | | | 129 | |
| – debt securities | | | 3,490 | | | | 374 | | | | 404 | | | | 40 | | | | – | | | | 4,308 | |
| | | | | | | | | | | | | |
| | | | | | | | | | | | | | | | | | | | | | | | | |
| Financial investments | | | 35,607 | | | | 2,688 | | | | 351 | | | | 240 | | | | – | | | | 38,886 | |
| | | | | | | | | | | | | |
| – treasury and other similar bills | | | – | | | | – | | | | 41 | | | | – | | | | – | | | | 41 | |
| – other eligible bills | | | 393 | | | | – | | | | – | | | | – | | | | – | | | | 393 | |
| – debt securities | | | 35,214 | | | | 2,688 | | | | 310 | | | | 240 | | | | – | | | | 38,452 | |
| | | | | | | | | | | | | |
| | | | | | | | | | | | | | | | | | | | | | | | | |
| | | | | | | | | | | | | |
| | | | | | | | | | | | | | | | | | | | | | | | | |
| | | | 39,234 | | | | 3,062 | | | | 758 | | | | 280 | | | | – | | | | 43,334 | |
| | | | | | | | | | | | | |
166
Report of the Directors: Operating and Financial Review(continued)
| | | | | | | | | | | | | | | | | | | | | | | | | |
| | | Neither past due nor impaired | | | | | | | |
| | | | | | | | | | | | | | | Sub- | | | | | | | |
| | | Strong | | | Good | | | Satisfactory | | | standard | | | Impaired | 88 | | Total | |
| | | US$m | | | US$m | | | US$m | | | US$m | | | US$m | | | US$m | |
At 31 December 2009 | | | | | | | | | | | | | | | | | | | | | | | | |
| | | | | | | | | | | | | | | | | | | | | | | | | |
| Supporting liabilities under non-linked insurance and investment contracts | | | | | | | | | | | | | | | | | | | | | | | | |
| Trading assets – debt securities | | | 8 | | | | – | | | | 2 | | | | – | | | | | | | | 10 | |
| | | | | | | | | | | | | | | | | | | | | | | | | |
| Financial assets designated at fair value | | | 2,812 | | | | 80 | | | | 704 | | | | 69 | | | | | | | | 3,665 | |
| | | | | | | | | | | | | | | |
| – treasury and other eligible bills | | | 174 | | | | – | | | | – | | | | – | | | | | | | | 174 | |
| – debt securities | | | 2,638 | | | | 80 | | | | 704 | | | | 69 | | | | | | | | 3,491 | |
| | | | | | | | | | | | | | | |
| | | | | | | | | | | | | | | | | | | | | | | | | |
| Financial investments | | | 30,126 | | | | 1,509 | | | | 130 | | | | 148 | | | | – | | | | 31,913 | |
| | | | | | | | | | | | | |
| – treasury and other similar bills | | | 211 | | | | – | | | | – | | | | – | | | | – | | | | 211 | |
| – other eligible bills | | | 153 | | | | – | | | | – | | | | – | | | | – | | | | 153 | |
| – debt securities | | | 29,762 | | | | 1,509 | | | | 130 | | | | 148 | | | | – | | | | 31,549 | |
| | | | | | | | | | | | | |
| | | | | | | | | | | | | | | | | | | | | | | | | |
| | | | | | | | | | | | | |
| | | | | | | | | | | | | | | | | | | | | | | | | |
| | | | 32,946 | | | | 1,589 | | | | 836 | | | | 217 | | | | – | | | | 35,588 | |
| | | | | | | | | | | | | |
| | | | | | | | | | | | | | | | | | | | | | | | | |
Supporting shareholders’ funds89 | | | | | | | | | | | | | | | | | | | | | | | | |
| Financial assets designated at fair value | | | 527 | | | | 506 | | | | 180 | | | | 10 | | | | | | | | 1,223 | |
| | | | | | | | | | | | | |
| – treasury and other eligible bills | | | 3 | | | | – | | | | – | | | | – | | | | | | | | 3 | |
| – debt securities | | | 524 | | | | 506 | | | | 180 | | | | 10 | | | | | | | | 1,220 | |
| | | | | | | | | | | | | |
| | | | | | | | | | | | | | | | | | | | | | | | | |
| Financial investments | | | 3,335 | | | | 312 | | | | 16 | | | | 6 | | | | – | | | | 3,669 | |
| | | | | | | | | | | | | |
| – treasury and other similar bills | | | 82 | | | | – | | | | 4 | | | | – | | | | – | | | | 86 | |
| – other eligible bills | | | 126 | | | | – | | | | – | | | | – | | | | – | | | | 126 | |
| – debt securities | | | 3,127 | | | | 312 | | | | 12 | | | | 6 | | | | – | | | | 3,457 | |
| | | | | | | | | | | | | |
| | | | | | | | | | | | | | | | | | | | | | | | | |
| | | | | | | | | | | | | |
| | | | | | | | | | | | | | | | | | | | | | | | | |
| | | | 3,862 | | | | 818 | | | | 196 | | | | 16 | | | | – | | | | 4,892 | |
| | | | | | | | | | | | | |
| | | | | | | | | | | | | | | | | | | | | | | | | |
Total82 | | | | | | | | | | | | | | | | | | | | | | | | |
| Trading assets – debt securities | | | 8 | | | | – | | | | 2 | | | | – | | | | | | | | 10 | |
| | | | | | | | | | | | | | | | | | | | | | | | | |
| Financial assets designated at fair value | | | 3,339 | | | | 586 | | | | 884 | | | | 79 | | | | | | | | 4,888 | |
| | | | | | | | | | | | | | | |
| – treasury and other eligible bills | | | 177 | | | | – | | | | – | | | | – | | | | | | | | 177 | |
| – debt securities | | | 3,162 | | | | 586 | | | | 884 | | | | 79 | | | | | | | | 4,711 | |
| | | | | | | | | | | | | | | |
| | | | | | | | | | | | | | | | | | | | | | | | | |
| Financial investments | | | 33,461 | | | | 1,821 | | | | 146 | | | | 154 | | | | – | | | | 35,582 | |
| | | | | | | | | | | | | |
| – treasury and other similar bills | | | 293 | | | | – | | | | 4 | | | | – | | | | – | | | | 297 | |
| – other eligible bills | | | 279 | | | | – | | | | – | | | | – | | | | – | | | | 279 | |
| – debt securities | | | 32,889 | | | | 1,821 | | | | 142 | | | | 154 | | | | – | | | | 35,006 | |
| | | | | | | | | | | | | |
| | | | | | | | | | | | | | | | | | | | | | | | | |
| | | | | | | | | | | | | |
| | | | | | | | | | | | | | | | | | | | | | | | | |
| | | | 36,808 | | | | 2,407 | | | | 1,032 | | | | 233 | | | | – | | | | 40,480 | |
| | | | | | | | | | | | | |
For footnotes, see page 174.
Issuers of treasury bills, other eligible bills and debt securities in HSBC’s insurance manufacturing subsidiaries
(Audited)
| | | | | | | | | | | | | | | | | |
| | | Treasury | | | Other eligible | | | Debt | | | | |
| | | bills | | | bills | | | securities | | | Total | |
| | | US$m | | | US$m | | | US$m | | | US$m | |
At 31 December 2010 | | | | | | | | | | | | | | | | |
| Governments | | | 170 | | | | 121 | | | | 9,401 | | | | 9,692 | |
| Local authorities | | | – | | | | – | | | | 915 | | | | 915 | |
| Asset-backed securities | | | – | | | | – | | | | 60 | | | | 60 | |
| Corporates and other | | | – | | | | 272 | | | | 32,395 | | | | 32,667 | |
| | | | | | | | | |
| | | | | | | | | | | | | | | | | |
| | | | 170 | | | | 393 | | | | 42,771 | | | | 43,334 | |
| | | | | | | | | |
| | | | | | | | | | | | | | | | | |
| At 31 December 2009 | | | | | | | | | | | | | | | | |
| Governments | | | 342 | | | | 6 | | | | 8,548 | | | | 8,896 | |
| Local authorities | | | – | | | | – | | | | 886 | | | | 886 | |
| Asset-backed securities | | | – | | | | – | | | | 54 | | | | 54 | |
| Corporates and other | | | 132 | | | | 273 | | | | 30,239 | | | | 30,644 | |
| | | | | | | | | |
| | | | | | | | | | | | | | | | | |
| | | | 474 | | | | 279 | | | | 39,727 | | | | 40,480 | |
| | | | | | | | | |
167
Report of the Directors: Operating and Financial Review(continued)
Credit risk also arises when part of the insurance risk we incur is assumed by reinsurers. The split of liabilities ceded to reinsurers and outstanding reinsurance recoveries, analysed by credit quality,
is shown below. Our exposure to third parties under the reinsurance agreements described in the Credit Risk section above is included in this table.
Reinsurers’ share of liabilities under insurance contracts
(Audited)
| | | | | | | | | | | | | | | | | | | | | | | | | |
| | | Neither past due nor impaired | | | Past due | | | | |
| | | | | | | | | | | | | | | Sub- | | | but not | | | | |
| | | Strong | | | Good | | | Satisfactory | | | standard | | | impaired | | | Total | |
| | | US$m | | | US$m | | | US$m | | | US$m | | | US$m | | | US$m | |
At 31 December 2010 | | | | | | | | | | | | | | | | | | | | | | | | |
| Linked insurance contracts | | | 44 | | | | 716 | | | | – | | | | – | | | | – | | | | 760 | |
| Non-linked insurance contracts | | | 997 | | | | 11 | | | | 76 | | | | 12 | | | | 9 | | | | 1,105 | |
| | | | | | | | | | | | | |
| | | | | | | | | | | | | | | | | | | | | | | | | |
Total81 | | | 1,041 | | | | 727 | | | | 76 | | | | 12 | | | | 9 | | | | 1,865 | |
| | | | | | | | | | | | | |
| | | | | | | | | | | | | | | | | | | | | | | | | |
| Reinsurance debtors | | | 30 | | | | 8 | | | | 30 | | | | 1 | | | | 10 | | | | 79 | |
| | | | | | | | | | | | | | | | | | | | | | | | | |
| At 31 December 2009 | | | | | | | | | | | | | | | | | | | | | | | | |
| Linked insurance contracts | | | 27 | | | | 804 | | | | – | | | | – | | | | – | | | | 831 | |
| Non-linked insurance contracts | | | 1,133 | | | | 10 | | | | 90 | | | | 5 | | | | – | | | | 1,238 | |
| | | | | | | | | | | | | |
| | | | | | | | | | | | | | | | | | | | | | | | | |
Total82 | | | 1,160 | | | | 814 | | | | 90 | | | | 5 | | | | – | | | | 2,069 | |
| | | | | | | | | | | | | |
| | | | | | | | | | | | | | | | | | | | | | | | | |
| Reinsurance debtors | | | 24 | | | | 2 | | | | 11 | | | | 6 | | | | 17 | | | | 60 | |
For footnotes, see page 174.
(Audited)
Description of liquidity risk
It is an inherent characteristic of almost all insurance contracts that there is uncertainty over the amount of claims liabilities that may arise and the timing of their settlement, and this creates liquidity risk.
There are three aspects to liquidity risk. The first arises in normal market conditions and is referred to as funding liquidity risk; specifically, the capacity to raise sufficient cash when needed to meet payment obligations. Secondly, market liquidity risk arises when the size of a particular holding may be so large that a sale cannot be completed around the market price. Finally, standby liquidity risk refers to the capacity to meet payment terms in abnormal conditions.
How liquidity risk is managed
Our insurance manufacturing subsidiaries primarily fund cash outflows arising from claim liabilities from the following sources of cash inflows:
| • | | premiums from new business, policy renewals and recurring premium products; |
| |
| • | | interest and dividends on investments and principal repayments of maturing debt investments; |
| |
| • | | cash resources; and |
| |
| • | | the sale of investments. |
They manage liquidity risk by utilising some or all of the following techniques:
| • | | matching cash inflows with expected cash outflows using specific cash flow projections or more general asset and liability matching techniques such as duration matching; |
| |
| • | | maintaining sufficient cash resources; |
| |
| • | | investing in good credit-quality investments with deep and liquid markets to the degree to which they exist; |
| |
| • | | monitoring investment concentrations and restricting them where appropriate, for example, by debt issues or issuers; and |
| |
| • | | establishing committed contingency borrowing facilities. |
Each of these techniques contributes to mitigating the three types of liquidity risk described above.
Every quarter, our insurance manufacturing subsidiaries are required to complete and submit liquidity risk reports to Group Insurance Head Office for collation and review by the Group Insurance Market and Liquidity Risk Meeting. Liquidity risk is assessed in these reports by measuring changes in expected cumulative net cash flows under a series of stress scenarios designed to determine the effect of reducing expected available liquidity and accelerating cash outflows. This is achieved, for example, by assuming new business or renewals are
168
Report of the Directors: Operating and Financial Review(continued)
lower, and surrenders or lapses are greater, than expected.
The following tables show the expected undiscounted cash flows for insurance contract liabilities and the remaining contractual maturity of investment contract liabilities at 31 December 2010. A significant proportion of our non-life insurance business is viewed as short-term, with the settlement of liabilities expected to occur within one year of the
period of risk. There is a greater spread of expected maturities for the life business where, in a large proportion of cases, the liquidity risk is borne in conjunction with policyholders (wholly in the case of unit-linked business).
The profile of the expected maturity of the insurance contracts as at 31 December 2010 remained comparable with 2009.
Expected maturity of insurance contract liabilities
(Audited)
| | | | | | | | | | | | | | | | | | | | | |
| | | Expected cash flows (undiscounted) |
| | | Within 1 year | | | 1-5 years | | | 5-15 years | | | Over 15 years | | | Total | |
| | | US$m | | | US$m | | | US$m | | | US$m | | | US$m | |
At 31 December 2010 | | | | | | | | | | | | | | | | | | | | |
| Non-life insurance | | | 1,140 | | | | 1,157 | | | | 83 | | | | 76 | | | | 2,456 | |
| Life insurance (non-linked) | | | 2,463 | | | | 11,178 | | | | 18,839 | | | | 21,093 | | | | 53,573 | |
| Life insurance (linked) | | | 485 | | | | 2,557 | | | | 6,366 | | | | 10,724 | | | | 20,132 | |
| | | | | | | | | | | | | | | | |
| | | | | | | | | | | | | | | | | | | | | |
Total81 | | | 4,088 | | | | 14,892 | | | | 25,288 | | | | 31,893 | | | | 76,161 | |
| | | | | | | | | | | | | | | | |
| | | | | | | | | | | | | | | | | | | | | |
| At 31 December 2009 | | | | | | | | | | | | | | | | | | | | |
| Non-life insurance | | | 1,318 | | | | 1,277 | | | | 123 | | | | 10 | | | | 2,728 | |
| Life insurance (non-linked) | | | 2,393 | | | | 10,098 | | | | 17,253 | | | | 18,231 | | | | 47,975 | |
| Life insurance (linked) | | | 522 | | | | 2,290 | | | | 4,483 | | | | 6,899 | | | | 14,194 | |
| | | | | | | | | | | |
| | | | | | | | | | | | | | | | | | | | | |
Total82 | | | 4,233 | | | | 13,665 | | | | 21,859 | | | | 25,140 | | | | 64,897 | |
| | | | | | | | | | | |
| | |
| For footnote, see page 174. |
Remaining contractual maturity of investment contract liabilities
(Audited)
| | | | | | | | | | | | | | | | | |
| | | Liabilities under investment contracts by |
| | | insurance manufacturing subsidiaries |
| | | Linked | | | Other | | | Investment | | | | |
| | | investment | | | investment | | | contracts | | | | |
| | | contracts | | | contracts | | | with DPF | | | Total | |
| | | US$m | | | US$m | | | US$m | | | US$m | |
At 31 December 2010 | | | | | | | | | | | | | | | | |
Remaining contractual maturity:81 | | | | | | | | | | | | | | | | |
| – due within 1 year | | | 391 | | | | 446 | | | | 11 | | | | 848 | |
| – due between 1 and 5 years | | | 940 | | | | – | | | | 11 | | | | 951 | |
| – due between 5 and 10 years | | | 1,182 | | | | – | | | | – | | | | 1,182 | |
| – due after 10 years | | | 2,133 | | | | – | | | | – | | | | 2,133 | |
– undated90 | | | 3,675 | | | | 3,372 | | | | 22,052 | | | | 29,099 | |
| | | | | | | | | | | | | |
| | | | | | | | | | | | | | | | | |
| | | | 8,321 | | | | 3,818 | | | | 22,074 | | | | 34,213 | |
| | | | | | | | | | | | | |
| | | | | | | | | | | | | | | | | |
| At 31 December 2009 | | | | | | | | | | | | | | | | |
Remaining contractual maturity:82 | | | | | | | | | | | | | | | | |
| – due within 1 year | | | 477 | | | | 443 | | | | 14 | | | | 934 | |
| – due between 1 and 5 years | | | 904 | | | | – | | | | 20 | | | | 924 | |
| – due between 5 and 10 years | | | 693 | | | | – | | | | – | | | | 693 | |
| – due after 10 years | | | 2,093 | | | | – | | | | – | | | | 2,093 | |
– undated90 | | | 3,180 | | | | 3,492 | | | | 20,980 | | | | 27,652 | |
| | | | | | | | | |
| | | | | | | | | | | | | | | | | |
| | | | 7,347 | | | | 3,935 | | | | 21,014 | | | | 32,296 | |
| | | | | | | | | |
| | |
| For footnotes, see page 174. |
169
Report of the Directors: Operating and Financial Review(continued)
Present value of in-force long-term insurance business
(Audited)
Our life insurance business is accounted for using the embedded value approach which,inter alia, provides a comprehensive risk and valuation framework. The present value of our in-force long-term (‘PVIF’) asset at 31 December 2010 was
US$3.4bn (2009: US$2.8bn), representing the present value of the shareholders’ interest in the profits expected to emerge from the book of in-force policies at that date.
The following table shows the movements recorded during the year in respect of total equity and PVIF of insurance operations:
Movements in total equity and PVIF of insurance operations
(Audited)
| | | | | | | | | | | | | | | | | |
| | | 2010 | | 2009 | |
| | | | | | PVIF | | | | | | | PVIF | |
| | | Total | | | included in | | | Total | | | included in | |
| | | equity | | | total equity | | | equity | | | total equity | |
| | | US$m | | | US$m | | | US$m | | | US$m | |
| At 1 January | | | 8,580 | | | | 2,780 | | | | 7,577 | | | | 2,033 | |
Value of new business written during the year91 | | | 737 | | | | 737 | | | | 600 | | | | 600 | |
| Movements arising from in-force business: | | | | | | | | | | | | | | | | |
| – expected return | | | (85 | ) | | | (85 | ) | | | (123 | ) | | | (123 | ) |
– experience variances92 | | | 20 | | | | 20 | | | | (44 | ) | | | (44 | ) |
| – change in operating assumptions | | | 58 | | | | 58 | | | | 48 | | | | 48 | |
| Investment return variances | | | 19 | | | | 19 | | | | 16 | | | | 16 | |
| Changes in investment assumptions | | | (38 | ) | | | (38 | ) | | | 19 | | | | 19 | |
| Return on net assets | | | 858 | | | | – | | | | 522 | | | | – | |
| Exchange differences and other | | | (222 | ) | | | (51 | ) | | | (83 | ) | | | 231 | |
| Capital transactions | | | (149 | ) | | | – | | | | 48 | | | | – | |
| | | | | | | | | | | |
| | | | | | | | | | | | | | | | | |
| At 31 December | | | 9,778 | | | | 3,440 | | | | 8,580 | | | | 2,780 | |
| | | | | | | | | | | |
| | |
| For footnotes, see page 174. |
Key assumptions used in the computation of PVIF for main life insurance operations
| | | | | | | | | | | | | | | | | | | | | | | | | |
| | | 2010 | | 2009 | |
| | | UK | | | Hong Kong | | | France | | | UK | | | Hong Kong | | | France | |
| | | % | | | % | | | % | | | % | | | % | | | % | |
| Risk free rate | | | 3.46 | | | | 3.10 | | | | 3.15 | | | | 3.50 | | | | 2.58 | | | | 3.46 | |
| Risk discount rate | | | 7.00 | | | | 11.00 | | | | 8.00 | | | | 7.00 | | | | 11.00 | | | | 8.00 | |
| Expenses inflation | | | 3.76 | | | | 3.00 | | | | 2.00 | | | | 3.50 | | | | 3.00 | | | | 2.00 | |
The calculation of the PVIF is based upon assumptions that take into account risk and uncertainty. To project these cash flows, a variety of assumptions regarding future experience is made by each insurance operation which reflects local market conditions and management’s judgement of local future trends. Some of the Group’s insurance operations incorporate risk margins separately in the projection assumptions for each product, while others incorporate risk margins into the overall discount rate. Both factors are reflected in the wide range of risk discount rates applied.
(Audited)
The following table shows the effect on the PVIF of reasonably possible changes in the main economic
assumptions, namely the risk-free and risk discount rates, across all insurance manufacturing subsidiaries.
Due to certain characteristics of the contracts, the relationships may be non-linear and the results of the stress-testing should not be extrapolated to higher levels of stress. In calculating the various scenarios, all assumptions are held stable except when testing the effect of the shift in the risk-free rate, when resultant changes to investment returns, risk discount rates and bonus rates are also incorporated. The sensitivities shown are before actions that could be taken by management to mitigate effects and before resultant changes in policyholder behaviour.
170
Report of the Directors: Operating and Financial Review(continued)
Sensitivity of PVIF to changes in economic assumptions
(Audited)
| | | | | | | | | |
| | | PVIF at 31 December | |
| | | 2010 | | | 2009 | |
| | | US$m | | | US$m | |
| + 100 basis point shift in risk-free rate | | | 231 | | | | 212 | |
| – 100 basis point shift in risk-free rate | | | (190 | ) | | | (145 | ) |
| + 100 basis point shift in risk discount rate | | | (179 | ) | | | (140 | ) |
| – 100 basis point shift in risk discount rate | | | 205 | | | | 162 | |
(Audited)
We determine the policyholder liabilities and PVIF by reference to non-economic assumptions which include, for non-life manufacturers, claims costs and expense rates and, for life manufacturers, mortality and/or morbidity, lapse rates and expense rates. The table below shows the sensitivity of profit for 2010 and total equity at 31 December 2010 to reasonably possible changes in these non-economic assumptions at that date across all our insurance manufacturing subsidiaries, with comparatives for 2009.
The cost of claims is a risk associated with non-life insurance business. An increase in claims costs
would have a negative effect on profit. Our main exposures to this scenario are in the UK, Hong Kong, Latin America and Bermuda.
Mortality and morbidity risk is typically associated with life insurance contracts. The effect on profit of an increase in mortality or morbidity depends on the type of business being written. Our largest exposures to mortality and morbidity risk exist in France, Hong Kong, the UK and the US.
Sensitivity to lapse rates depends on the type of contracts being written. For insurance contracts, claims are funded by premiums received and income earned on the investment portfolio supporting the liabilities. For a portfolio of term assurance, an increase in lapse rates typically has a negative effect on profit due to the loss of future premium income on the lapsed policies. France, Hong Kong, the UK and the US are where we are most sensitive to a change in lapse rates.
Expense rate risk is the exposure to a change in expense rates. To the extent that increased expenses cannot be passed on to policyholders, an increase in expense rates will have a negative impact on our profits.
Sensitivity analysis
(Audited)
| | | | | | | | | | | | | | | | | | | | | | | | | |
| | | Effect on profit for the year | | Effect on total equity |
| | | to 31 December | | at 31 December |
| | | Life | | | Non-life | | | Total | | | Life | | | Non-life | | | Total | |
| | | US$m | | | US$m | | | US$m | | | US$m | | | US$m | | | US$m | |
2010 | | | | | | | | | | | | | | | | | | | | | | | | |
| 20% increase in claims costs | | | – | | | | (211 | ) | | | (211 | ) | | | – | | | | (211 | ) | | | (211 | ) |
| 20% decrease in claims costs | | | – | | | | 211 | | | | 211 | | | | – | | | | 211 | | | | 211 | |
| 10% increase in mortality and/or morbidity rates | | | (55 | ) | | | – | | | | (55 | ) | | | (55 | ) | | | – | | | | (55 | ) |
| 10% decrease in mortality and/or morbidity rates | | | 66 | | | | – | | | | 66 | | | | 66 | | | | – | | | | 66 | |
| 50% increase in lapse rates | | | (203 | ) | | | – | | | | (203 | ) | | | (203 | ) | | | – | | | | (203 | ) |
| 50% decrease in lapse rates | | | 363 | | | | – | | | | 363 | | | | 363 | | | | – | | | | 363 | |
| 10% increase in expense rates | | | (63 | ) | | | (11 | ) | | | (74 | ) | | | (63 | ) | | | (11 | ) | | | (74 | ) |
| 10% decrease in expense rates | | | 63 | | | | 11 | | | | 74 | | | | 63 | | | | 11 | | | | 74 | |
| | | | | | | | | | | | | | | | | | | | | | | | | |
| 2009 | | | | | | | | | | | | | | | | | | | | | | | | |
| 20% increase in claims costs | | | – | | | | (191 | ) | | | (191 | ) | | | – | | | | (191 | ) | | | (191 | ) |
| 20% decrease in claims costs | | | – | | | | 190 | | | | 190 | | | | – | | | | 190 | | | | 190 | |
| 10% increase in mortality and/or morbidity rates | | | (51 | ) | | | – | | | | (51 | ) | | | (51 | ) | | | – | | | | (51 | ) |
| 10% decrease in mortality and/or morbidity rates | | | 62 | | | | – | | | | 62 | | | | 62 | | | | – | | | | 62 | |
| 50% increase in lapse rates | | | (162 | ) | | | – | | | | (162 | ) | | | (162 | ) | | | – | | | | (162 | ) |
| 50% decrease in lapse rates | | | 408 | | | | – | | | | 408 | | | | 408 | | | | – | | | | 408 | |
| 10% increase in expense rates | | | (52 | ) | | | (11 | ) | | | (63 | ) | | | (52 | ) | | | (11 | ) | | | (63 | ) |
| 10% decrease in expense rates | | | 52 | | | | 11 | | | | 63 | | | | 52 | | | | 11 | | | | 63 | |
171
Report of the Directors: Operating and Financial Review(continued)
Other material risks
(Unaudited)
The safeguarding of our reputation is of paramount importance to our continued prosperity and is the responsibility of every member of staff.
We regularly review our policies and procedures for safeguarding against reputational and operational risks. This is an evolutionary process which takes account of relevant developments and industry guidance such as The Association of British Insurers’ guidance on best practice when responding to environmental, social and governance (‘ESG’) risks.
We have always aspired to the highest standards of conduct and, as a matter of routine, take account of reputational risks to our business. Reputational risks can arise from a wide variety of causes, including ESG issues and operational risk events. As a banking group, our good reputation depends upon the way in which we conduct our business, but it can also be affected by the way in which clients, to whom we provide financial services, conduct themselves. The training of Directors on appointment includes reputational matters.
Group functions with responsibility for activities that attract reputational risk are represented at the Group Reputational Risk Committee (‘GRRC’), which is chaired by the Group Chairman. The primary role of the GRRC is to consider areas and activities presenting significant reputational risk and, where appropriate, to make recommendations to the Risk Management Meeting and the GMB for policy or procedural changes to mitigate such risk. Reputational Risk Committees have been established in each of the Group’s regions. These committees are required to ensure that reputational risks are considered at a regional as well as Group level. Minutes from the regional committees are tabled at GRRC.
Standards on all major aspects of business are set for HSBC and for individual subsidiaries, businesses and functions. Reputational risks, including ESG matters, are considered and assessed by the Board, the GMB, the Risk Management Meeting, subsidiary company boards, Board committees and senior management during the formulation of policy and the establishment of our standards. These policies, which form an integral part of the internal control system (see page 202), are communicated through manuals and statements of policy and are promulgated through internal
communications and training. The policies cover ESG issues and set out operational procedures in all areas of reputational risk, including money laundering deterrence, counter-terrorist financing, environmental impact, anti-corruption measures and employee relations. The policy manuals address risk issues in detail and co-operation between GMO departments and businesses is required to ensure a strong adherence to our risk management system and our sustainability practices.
(Unaudited)
We operate a number of pension plans throughout the world, as described in Note 7 on the Financial Statements. Some of them are defined benefit plans, of which the largest is the HSBC Bank (UK) Pension Scheme (‘the principal plan’).
In order to fund the benefits associated with these plans, sponsoring Group companies (and, in some instances, employees) make regular contributions in accordance with advice from actuaries and in consultation with the scheme’s trustees (where relevant). The defined benefit plans invest these contributions in a range of investments designed to meet their long-term liabilities.
The level of these contributions has a direct impact on HSBC’s cash flow and would normally be set to ensure that there are sufficient funds to meet the cost of the accruing benefits for the future service of active members. However, higher contributions will be required when plan assets are considered insufficient to cover the existing pension liabilities as a deficit exists. Contribution rates are typically revised annually or triennially, depending on the plan. The agreed contributions to the principal plan are revised triennially.
A deficit in a defined benefit plan may arise from a number of factors, including
| • | | investments delivering a return below that required to provide the projected plan benefits. This could arise, for example, when there is a fall in the market value of equities, or when increases in long-term interest rates cause a fall in the value of fixed income securities held; |
| |
| • | | the prevailing economic environment leading to corporate failures, thus triggering write-downs in asset values (both equity and debt); |
| |
| • | | a change in either interest rates or inflation which causes an increase in the value of the scheme liabilities; and |
| |
| • | | scheme members living longer than expected (known as longevity risk). |
A plan’s investment strategy is determined after taking into consideration the market risk inherent in the investments and its consequential impact on potential future contributions. The long-term
172
Report of the Directors: Operating and Financial Review(continued)
investment objectives of both HSBC and, where relevant and appropriate, the trustees are:
| • | | to limit the risk of the assets failing to meet the liabilities of the plans over the long-term; and |
| |
| • | | to maximise returns consistent with an acceptable level of risk so as to control the long-term costs of the defined benefit plans. |
In pursuit of these long-term objectives, a benchmark is established for the allocation of the defined benefit plan assets between asset classes. In addition, each permitted asset class has its own benchmarks, such as stock market or property valuation indices and, where relevant, desired levels of out-performance. The benchmarks are reviewed at least triennially within 18 months of the date at which an actuarial valuation is made, or more frequently if required by local legislation or circumstances. The process generally involves an extensive asset and liability review.
Ultimate responsibility for investment strategy rests with either the trustees or, in certain circumstances, a Management Committee. The degree of independence of the trustees from HSBC varies in different jurisdictions. For example, the principal plan, which accounts for approximately 70% of the obligations of our defined benefit pension plans, is overseen by a corporate trustee who regularly monitors the market risks inherent in the scheme.
The principal plan holds a diversified portfolio of investments to meet future cash flow liabilities arising from accrued benefits as they fall due to be paid. The trustee of the principal plan is required to produce a written Statement of Investment Principles which governs decision-making about how investments are made.
The DBS principal plan – asset allocation
| | | | | | | | | |
| | | 2010 | | | 2006 | |
| | | % | | | % | |
| Equities | | | 15.5 | | | | 15.0 | |
| Bonds | | | 56.5 | | | | 50.0 | |
Alternative assets93 | | | 10.5 | | | | 10.0 | |
| Property | | | 9.0 | | | | 10.0 | |
| Cash | | | 8.5 | | | | 15.0 | |
| | | | | | |
| | | | | | | | | |
| | | | 100.0 | | | | 100.0 | |
| | | | | | |
| | |
| For footnote, see page 174. |
In 2006, HSBC and the trustee of the principal plan agreed to change the investment strategy in order to reduce the investment risk. The target asset allocations for this strategy at that time and as revised in 2010 are shown above. The strategy is to
hold the majority of assets in bonds, with the remainder in a more diverse range of investments, and includes a commitment to undertake a programme of swap arrangements (see Note 45 on the Financial Statements) by which the principal plan makes LIBOR-related interest payments in exchange for the receipt of cash flows which are based on projected future benefit payments to be made from the principal plan.
(Unaudited)
Assessing the environmental and social impacts of providing finance to our customers has been firmly embedded into our overall risk management processes.
Sustainability risks arise from the provision of financial services to companies or projects which run counter to the needs of sustainable development; in effect this risk arises when the environmental and social effects outweigh economic benefits. Within GMO, a separate function, Group Corporate Sustainability, is mandated to manage these risks globally working through local offices as appropriate. Sustainability Risk Managers have regional or national responsibilities for advising on and managing environmental and social risks.
Group Corporate Sustainability’s risk management responsibilities include:
| | • | | formulating sustainability risk policies. This includes oversight of our sustainability risk standards, management of the Equator Principles for project finance lending, and sector-based sustainability policies covering those sectors with high environmental or social impacts (forestry, freshwater infrastructure, chemicals, energy, mining and metals, and defence-related lending); undertaking an independent review of transactions where sustainability risks are assessed to be high, and supporting our operating companies to assess similar risks of a lower magnitude; |
| |
| | • | | building and implementing systems-based processes to ensure consistent application of policies, reduce the costs of sustainability risk reviews and capture management information to measure and report on the effect of our lending and investment activities on sustainable development; and |
| |
| | • | | providing training and capacity building within our operating companies to ensure sustainability risks are identified and mitigated consistently to either our own standards, international standards or local regulations, whichever is higher. |
173
Report of the Directors: Operating and Financial Review(continued)
Residual value risk
(Unaudited)
A significant part of a lessor’s return from operating leases is dependent upon its management of residual value risk. This arises from operating lease transactions to the extent that the values recovered from disposing of leased assets or re-letting them at
the end of the lease terms (the ‘residual values’) differ from those projected at the inception of the leases.
The sale of our rail finance business ‘Eversholt Rail Group’ during the year has significantly reduced our exposure to residual value risk.
Credit risk
| | | |
| 1 | | The amount of the loan commitments reflects, where relevant, the expected level of take-up of pre-approved loan offers made by mailshots to personal customers. In addition to those amounts, there is a further maximum possible exposure to credit risk of US$220.2bn (2009: US$62.3bn), reflecting the full take-up of such irrevocable loan commitments. The take-up of such offers is generally at modest levels. |
| 2 | | A change in the write-off period in North America during 2009 resulted in an acceleration of write-offs which reduced residential mortgages by US$1.9bn, other personal loans by US$1.3bn and total personal lending by US$3.3bn, with a corresponding reduction in impairment allowances. There was no significant effect on net loans and advances or loan impairment charges. |
| 3 | | Residential mortgages include Hong Kong Government Home Ownership Scheme loans of US$3.5bn at 31 December 2010 (2009: US$3.5bn). Where disclosed, earlier comparatives were 2008: US$3.9bn; 2007: US$3.9bn; 2006: US$4.1bn. |
| 4 | | Other personal loans and advances include second lien mortgages and other property-related lending. |
| 5 | | Other commercial loans and advances include advances in respect of agriculture, transport, energy and utilities. |
| 6 | | Included within ‘Total gross loans and advances to customers’ (‘TGLAC’) is credit card lending of US$62bn (2009: US$68bn). Where disclosed, earlier comparatives were 2008: US$75bn; 2007: US$83bn; 2006: US$75bn. |
| 7 | | The above numbers for North America include a reclassification within the corporate and commercial lending category to reflect a more accurate presentation of lending in the region. |
| 8 | | The impairment allowances on loans and advances to banks relate to the geographical regions, Europe, Middle East and North America. |
| 9 | | These balances were between 0.75% and 1% of total assets. All other balances were above 1%. |
| 10 | | We do not have material retail exposures in any of the eurozone countries listed in this table. |
| 11 | | Includes balances at central banks. Lending to banks comprises non-trading loans and advances to banks including reverse repurchase transactions. |
| 12 | | Derivative assets net of collateral and derivative liabilities for which a legally enforceable right of offset exists. |
| 13 | | Includes residential mortgages of HSBC Bank USA and HSBC Finance. |
| 14 | | Comprising Hong Kong, Rest of Asia-Pacific, Middle East and Latin America. |
| 15 | | Negative equity arises when the value of the property used to secure a loan is below the balance outstanding on the loan, generally based on values at the balance sheet date. |
| 16 | | Loan-to-value ratios are generally based on values at the balance sheet date. |
| 17 | | HSBC Finance lending is shown on a management basis and includes loans transferred to HSBC USA Inc. which are managed by HSBC Finance. |
| 18 | | Interest-only (affordability mortgages) are loans which are classified as ‘interest only’ for initial period before reverting to repayment. As a consequence, in the table ‘Mortgage lending products’ on page 109 these balances are included in the category ‘Affordability mortgages, including ARMs’. |
| 19 | | Stated income lending forms a subset of total mortgage services lending across all categories. |
| 20 | | By states which individually account for 5% or more of HSBC Finance’s US customer loan portfolio. |
| 21 | | The average loss on sale of foreclosed properties is calculated as cash proceeds after deducting selling costs, commissions and other ancillary costs, minus the book value of the property when it was moved to assets held for sale, divided by the book value of the property when it was moved to assets held for sale. |
| 22 | | The average total loss on foreclosed properties sold includes both the loss on sale (see footnote 21) and the cumulative write-downs recognised on the loans up to and upon classification as assets held for sale. This average total loss on foreclosed properties is expressed as a percentage of the book value of the property prior to its transfer to assets held for sale. |
| 23 | | Percentages are expressed as a function of the relevant loans and receivables balance. |
| 24 | | At 31 December 2010 and 2009, real estate secured delinquency included US$4.2bn and US$3.3bn, respectively, of loans that we carried at the lower of cost on net realisable value. |
| 25 | | We observe the disclosure convention that, in addition to those classified as EL9 to EL10, retail accounts classified EL1 to EL8 that are delinquent by 90 days or more are considered impaired, unless individually they have been assessed as not impaired (see page 117, ‘Past due but not impaired gross financial instruments’). |
| 26 | | The EL percentage is derived through a combination of PD and LGD, and may exceed 100% in circumstances where the LGD is above 100% reflecting the cost of recoveries. |
| 27 | | Impairment allowances are not reported for financial instruments whereby the carrying amount is reduced directly for impairment and not through the use of an allowance account. |
| 28 | | Impairment is not measured for assets held in trading portfolios or designated at fair value as assets in such portfolios are managed according to movements in fair value, and the fair value movement is taken directly to the income statement. Consequently, we report all such balances under ‘Neither past due nor impaired’. |
| 29 | | Loans and advances to customers includes asset-backed securities that have been externally rated as strong (2010: US$4.1bn; 2009: US$5.7bn), good (2010: US$627m; 2009: US$881m), satisfactory (2010: US$452m; 2009: US$311m), sub-standard (2010: US$669m; 2009: US$468m) and impaired (2010: US$29m; 2009: US$460m). |
| 30 | | Impaired loans and advances are those classified as CRR 9, CRR 10, EL 9 or EL 10 and all retail loans 90 days or more past due, unless individually they have been assessed as not impaired (see page 117, ‘Past due but not impaired gross financial instruments’). |
174
Report of the Directors: Operating and Financial Review(continued)
| | | |
| 31 | | Collectively assessed loans and advances comprise homogeneous groups of loans that are not considered individually significant, and loans subject to individual assessment where no impairment has been identified on an individual basis, but on which a collective impairment allowance has been calculated to reflect losses which have been incurred but not yet identified. |
| 32 | | Collectively assessed loans and advances not impaired are those classified as CRR1 to CRR8 and EL1 to EL8 but excluding retail loans 90 days past due. |
| 33 | | Net of repo transactions, settlement accounts and stock borrowings. |
| 34 | | As a percentage of loans and advances to banks and loans and advances to customers, as applicable. |
| 35 | | Includes movement in impairment allowances against banks. |
| 36 | | See table below ‘Net loan impairment charge to the income statement by geographical region’. |
| 37 | | Collectively assessed impairment allowances are allocated to geographical segments based on the location of the office booking the allowances or provisions. Consequently, the collectively assessed impairment allowances booked in Hong Kong may cover assets booked in branches located outside Hong Kong, principally in Rest of Asia-Pacific, as well as those booked in Hong Kong. |
| 38 | | Total includes holdings of ABSs issued by Freddie Mac and Fannie Mae. |
| 39 | | ‘Directly held’ includes assets held by Solitaire where we provide first loss protection and assets held directly by the Group. |
| 40 | | Impairment charges allocated to capital note holders represent impairments where losses would be borne by external third-party investors in the structures. |
| 41 | | Mortgage-backed securities (‘MBS’s), asset-backed securities (‘ABS’s) and collateralised debt obligations (‘CDO’s). |
| 42 | | High grade assets rated AA or AAA. |
| 43 | | Gains or losses on the net principal exposure (footnote 49) recognised in the income statement as a result of changes in the fair value of the asset. |
| 44 | | Fair value gains and losses on the net principal exposure (footnote 49) recognised in other comprehensive income as a result of the changes in the fair value of available-for-sale assets. |
| 45 | | Realised fair value gains and losses on the net principal exposure (footnote 49) recognised in the income statement as a result of the disposal of assets or the receipt of cash flows from assets. |
| 46 | | Reclassified from equity on impairment, disposal or payment. This includes impairment losses recognised in the income statement in respect of the net principal exposure (footnote 49) of available-for-sale assets. Payments are the contractual cash flows received on the assets. |
| 47 | | The gross principal is the redemption amount on maturity or, in the case of an amortising instrument, the sum of the future redemption amounts through the residual life of the security. |
| 48 | | A credit default swap (‘CDS’) gross protection is the gross principal of the underlying instrument that is protected by CDSs. |
| 49 | | Net principal exposure is the gross principal amount of assets that are not protected by CDSs. It includes assets that benefit from monoline protection, except where this protection is purchased with a CDS. |
| 50 | | Carrying amount of the net principal exposure. |
| 51 | | Net exposure after legal netting and any other relevant credit mitigation prior to deduction of the credit risk adjustment. |
| 52 | | Cumulative fair value adjustment recorded against exposures to OTC derivative counterparties to reflect their creditworthiness. |
| 53 | | Funded exposures represent the loan amount advanced to the customer, less any fair value write-downs, net of fees held on deposit. Unfunded exposures represent the contractually committed loan facility amount not yet drawn down by the customer, less any fair value write-downs, net of fees held on deposit. |
| | | |
| Liquidity and funding |
| | | |
| 54 | | 2009 comparative data have been re-presented in line with the classification used in 2010. This resulted in an increase in the ‘On demand’ time band of US$273,078m for ‘Loan and other credit-related commitments’ and US$10,450m for ‘Financial guarantees and similar contracts’. There was an equivalent reduction across the other time bands. |
| 55 | | Figures provided for HSBC Bank plc and The Hongkong and Shanghai Banking Corporation incorporate all overseas branches. Subsidiaries of these entities are not included unless there is unrestricted transferability of liquidity between the subsidiaries and the parent. |
| 56 | | This comprises our other main banking subsidiaries and, as such, includes businesses spread across a range of locations, in many of which we may require a higher ratio of net liquid assets to customer liabilities to reflect local market conditions. |
| 57 | | Unused committed sources of secured funding for which eligible assets were held. |
| 58 | | Client-originated asset exposures relate to consolidated multi-seller conduits (see page 363). These vehicles provide funding to our customers by issuing debt secured by a diversified pool of customer-originated assets. |
| 59 | | HSBC-managed asset exposures relate to consolidated securities investment conduits, primarily Solitaire and Mazarin (see page 362). These vehicles issue debt secured by ABSs which are managed by HSBC. Of the total contingent liquidity risk under this category, US$8.1bn was already funded on-balance sheet at 31 December 2010 (2009: US$7.6bn) leaving a net contingent exposure of US$17.5bn (2009: US$21.5bn). |
| 60 | | Other conduit exposures relate to third-party sponsored conduits (see page 364). |
| 61 | | The five largest committed liquidity facilities provided to customers other than facilities to conduits. |
| 62 | | The total of all committed liquidity facilities provided to the largest market sector, other than facilities to conduits. |
| | | |
| Market risk |
| | | |
| 63 | | The structural foreign exchange risk is monitored using sensitivity analysis (see page 351). The reporting of commodity risk is consolidated with foreign exchange risk and is not applicable to non-trading portfolios. |
| 64 | | The interest rate risk on the fixed-rate securities issued by HSBC Holdings is not included in the Group VAR. The management of this risk is described on page 148. |
| 65 | | Credit spread sensitivity is reported separately for insurance operations (see page 165). |
| 66 | | The standard deviation measures the variation of daily revenues about the mean value of those revenues. |
| 67 | | The effect of any month-end adjustments, not attributable to a specific daily market move, is spread evenly over the days in the month in question. |
| 68 | | Trading intent portfolios include positions arising from market-making and position taking. |
| 69 | | Trading credit spread VAR was previously reported in the Group trading credit VAR. See page 148. |
| 70 | | The total VAR is non-additive across risk types due to diversification effects. It incorporates credit spread VAR. |
175
Report of the Directors: Operating and Financial Review(continued)
| | | |
| 71 | | Investments in private equity are primarily made through managed funds that are subject to limits on the amount of investment. Potential new commitments are subject to risk appraisal to ensure that industry and geographical concentrations remain within acceptable levels for the portfolio as a whole. Regular reviews are performed to substantiate the valuation of the investments within the portfolio. |
| 72 | | Investments held to facilitate ongoing business include holdings in government-sponsored enterprises and local stock exchanges. |
| 73 | | Instead of assuming that all interest rates move together, HSBC groups its interest rate exposures into currency blocs whose rates are considered likely to move together. |
| | | |
| Risk management of insurance operations |
| | | |
| 74 | | HSBC has no insurance manufacturing subsidiaries in the Middle East. |
| 75 | | Insurance contracts and investment contracts with discretionary participation features (‘DPF’) can give policyholders the contractual right to receive, as a supplement to their guaranteed benefits, additional benefits that may be a significant portion of the total contractual benefits, but whose amount and timing are determined by HSBC. These additional benefits are contractually based on the performance of a specified pool of contracts or assets, or the profit of the company issuing the contracts. |
| 76 | | Although investment contracts with DPF are financial investments, HSBC continues to account for them as insurance contracts as permitted by IFRS 4. |
| 77 | | Net written insurance premiums represent gross written premiums less gross written premiums ceded to reinsurers. |
| 78 | | Term assurance includes credit life insurance. |
| 79 | | Other assets comprise shareholder assets. |
| 80 | | Present value of in-force long-term insurance contracts and investment contracts with DPF. |
| 81 | | Does not include associated insurance companies, Ping An Insurance, SABB Takaful Company and Bao Viet, or joint venture insurance companies, Hana Life and Canara HSBC Oriental Bank of Commerce Life Insurance Company Limited. |
| 82 | | Does not include associated insurance companies, Ping An Insurance and SABB Takaful Company or joint venture insurance companies, Hana Life and Canara HSBC Oriental Bank of Commerce Life Insurance Company Limited. |
| 83 | | Comprise life linked insurance contracts and linked long-term investment contracts. |
| 84 | | Comprise life non-linked insurance contracts and non-linked long-term investment contracts. |
| 85 | | Comprises non-life insurance contracts. |
| 86 | | Comprise mainly loans and advances to banks, cash and intercompany balances with other non-insurance legal entities. |
| 87 | | The table excludes contracts where the risk is 100% reinsured. |
| 88 | | Impairment is not measured for debt securities held in trading portfolios or designated at fair value, as assets in such portfolios are managed according to movements in fair value, and the fair value movement is taken directly to the income statement. Consequently, we report all such balances under ‘neither past due nor impaired’. |
| 89 | | Shareholders’ funds comprise solvency and unencumbered assets. |
| 90 | | In most cases, policyholders have the option to terminate their contracts at any time and receive the surrender values of their policies. These may be significantly lower than the amounts shown above. |
| 91 | | Value of net new business during the year is the present value of the projected stream of profits from the business. |
| 92 | | Experience variances include the effect of the difference between demographic, expense and persistency assumptions used in the previous PVIF calculation and actual experience observed during the year. |
| | | |
| Pension risk |
| | | |
| 93 | | In 2010, alternative assets include ABSs, MBSs and infrastructure assets. In 2006, alternative assets included loans and infrastructure assets. |
176
Report of the Directors: Operating and Financial Review(continued)
(Audited)
Our approach to capital management is driven by our strategic and organisational requirements, taking into account the regulatory, economic and commercial environment in which we operate.
It is our objective to maintain a strong capital base to support the development of our business and to meet regulatory capital requirements at all times. To achieve this, our policy is to hold capital in a range of different forms and from diverse sources, and all capital raising is agreed with major subsidiaries as part of their individual and the Group’s overall capital management processes.
Our policy is underpinned by a capital management framework, which enables us to manage our capital in a consistent and aligned manner. The framework, which is approved by the GMB, incorporates a number of different capital measures including market capitalisation, invested capital, economic capital and regulatory capital.
Capital measures
| • | | market capitalisation is the stock market value of the company; |
| |
| • | | invested capital is the equity capital invested in HSBC by our shareholders; |
| |
| • | | economic capital is the internally calculated capital requirement which we deem necessary to support the risks to which we are exposed at a confidence level consistent with a target credit rating of AA; and |
| |
| • | | regulatory capital is the capital which we are required to hold in accordance with the rules established by the FSA for the consolidated Group and by our local regulators for individual Group companies. |
The following risks managed through the capital management framework have been identified as material: credit, market, operational, interest rate risk in the banking book, pension fund, insurance and residual risks.
We incorporate stress testing in the capital management framework, and it is important in understanding the sensitivities of the core assumptions in our capital plans to the adverse effect of extreme, but plausible, events. Stress testing allows us to formulate our response, including risk mitigation actions, in advance of conditions starting to exhibit the stress scenarios identified. The actual market stresses which occurred throughout the financial system during recent years have been used
to inform our capital planning process and further develop the stress scenarios we employ.
In addition to our internal stress tests, others are carried out, both at the request of regulators and by the regulators themselves using their prescribed assumptions. We take into account the results of all such regulatory stress testing when undertaking our internal capital management assessment.
The responsibility for global capital allocation principles and decisions rests with the GMB. Through our structured internal governance processes, we maintain discipline over our investment and capital allocation decisions and seek to ensure that returns on investment are adequate after taking account of capital costs. Our strategy is to allocate capital to businesses on the basis of their economic profit generation, regulatory and economic capital requirements and cost of capital.
Our capital management process is articulated in the annual Group capital plan which is approved by the Board. The plan is drawn up with the objective of maintaining both an appropriate amount of capital and an optimal mix between the different components of capital. HSBC Holdings and its major subsidiaries raise non-equity tier 1 capital and subordinated debt in accordance with our guidelines on market and investor concentration, cost, market conditions, timing, effect on composition and maturity profile. Each of the subsidiaries manages its own capital to support its planned business growth and meet its local regulatory requirements within the context of the approved annual Group capital plan. In accordance with our capital management framework, capital generated by subsidiaries in excess of planned requirements is returned to HSBC Holdings, normally by way of dividends.
HSBC Holdings is the primary provider of capital to its subsidiaries and these investments are substantially funded by HSBC Holdings’ own capital issuance and profit retention. As part of its capital management process, HSBC Holdings seeks to maintain a prudent balance between the composition of its capital and that of its investment in subsidiaries.
The tier 1 ratio (unaudited) increased to 12.1% at 31 December 2010 (2009: 10.8%). It is our belief that this enhanced ratio is appropriate in light of our current evolution of the regulatory framework.
177
Report of the Directors: Operating and Financial Review(continued)
Capital measurement and allocation
(Unaudited)
The FSA supervises HSBC on a consolidated basis and therefore receives information on the capital adequacy of, and sets capital requirements for, the Group as a whole. Individual banking subsidiaries are directly regulated by their local banking supervisors, who set and monitor their capital adequacy requirements.
We calculate capital at a Group level using the Basel II framework of the Basel Committee on Banking Supervision. However, local regulators are at different stages of implementation and local reporting may still be on a Basel I basis, notably in the US. In most jurisdictions, non-banking financial subsidiaries are also subject to the supervision and capital requirements of local regulatory authorities.
Basel II is structured around three ‘pillars’: minimum capital requirements, supervisory review process and market discipline. The Capital Requirements Directive (‘CRD’) implemented Basel II in the EU and the FSA then gave effect to the CRD by including the latter’s requirements in its own rulebooks.
Our capital is divided into two tiers:
| • | | tier 1 capital is divided into core tier 1 and other tier 1 capital. Core tier 1 capital comprises shareholders’ equity and related non-controlling interests. The book values of goodwill and intangible assets are deducted from core tier 1 capital and other regulatory adjustments are made for items reflected in shareholders’ equity which are treated differently for the purposes of capital adequacy. Qualifying capital instruments such as non-cumulative perpetual preference shares and hybrid capital securities are included in other tier 1 capital; and |
| |
| • | | tier 2 capital comprises qualifying subordinated loan capital, related non-controlling interests, allowable collective impairment allowances and unrealised gains arising on the fair valuation of equity instruments held as available for sale. Tier 2 capital also includes reserves arising from the revaluation of properties. |
To ensure the overall quality of the capital base, the FSA’s rules set limits on the amount of hybrid capital instruments that can be included in tier 1 capital relative to core tier 1 capital, and also limits overall tier 2 capital to no more than tier 1 capital.
Regulatory and accounting consolidations
The basis of consolidation for financial accounting purposes is described on page 251 and differs from that used for regulatory purposes. Investments in banking associates are equity accounted in the financial accounting consolidation, whereas their exposures are proportionally consolidated for regulatory purposes. Subsidiaries and associates engaged in insurance and non-financial activities are excluded from the regulatory consolidation and are deducted from regulatory capital. The regulatory consolidation does not include SPEs where significant risk has been transferred to third parties. Exposures to these SPEs are risk-weighted as securitisation positions for regulatory purposes.
Pillar 1 capital requirements
Pillar 1 covers the capital resources requirements for credit risk, market risk and operational risk. Credit risk includes counterparty credit risk and securitisation requirements. These requirements are expressed in terms of risk-weighted assets (‘RWA’s).
Credit risk capital requirements
Basel II applies three approaches of increasing sophistication to the calculation of pillar 1 credit risk capital requirements. The most basic, the standardised approach, requires banks to use external credit ratings to determine the risk weightings applied to rated counterparties and group other counterparties into broad categories and apply standardised risk weightings to these categories. The next level, the internal ratings-based (‘IRB’) foundation approach, allows banks to calculate their credit risk capital requirements on the basis of their internal assessment of the probability that a counterparty will default (‘PD’), but subjects their quantified estimates of exposure at default (‘EAD’) and loss given default (‘LGD’) to standard supervisory parameters. Finally, the IRB advanced approach allows banks to use their own internal assessment in both determining PD and quantifying EAD and LGD.
The capital resources requirement, which is intended to cover unexpected losses, is derived from a formula specified in the regulatory rules, which incorporates these factors and other variables such as maturity and correlation. Expected losses under the IRB approaches are calculated by multiplying PD by EAD and LGD. Expected losses are deducted from capital to the extent that they exceed accounting impairment allowances.
For credit risk, with the FSA’s approval, we have adopted the IRB advanced approach for the majority of our business, with the remainder on either IRB foundation or standardised approaches.
178
Report of the Directors: Operating and Financial Review(continued)
For consolidated group reporting, the FSA’s rules permit the use of other regulators’ standardised approaches where they are considered equivalent. The use of other regulators’ IRB approaches is subject to the agreement of the FSA. Under our Basel II rollout plans, a number of our Group companies and portfolios are in transition to advanced IRB approaches. At December 2010, portfolios in much of Europe, Hong Kong, Rest of Asia-Pacific and North America were on advanced IRB approaches. Others remain on the standardised or foundation approaches under Basel II, pending definition of local regulations or model approval, or under exemptions from IRB treatment.
Counterparty credit risk
Counterparty credit risk arises for OTC derivatives and securities financing transactions. It is calculated in both the trading and non-trading books and is the risk that the counterparty to a transaction may default before completing the satisfactory settlement of the transaction. Three approaches to calculating counterparty credit risk and determining exposure values are defined by Basel II: standardised, mark-to-market and internal model method. These exposure values are used to determine capital requirements under one of the credit risk approaches: standardised, IRB foundation and IRB advanced.
We use the mark-to-market and internal model method approaches for counterparty credit risk. Our longer-term aim is to migrate more positions from the mark-to-market to the internal model method approach.
Securitisation
Basel II specifies two methods for calculating credit risk requirements for securitisation positions in the non-trading book, being the standardised and IRB approaches. Both approaches rely on the mapping of rating agency credit ratings to risk weights, which range between 7% and 1,250%. Positions that would otherwise be weighted at 1,250% are deducted from capital.
Within the IRB approach, we use the Ratings Based Method for the majority of our non-trading book securitisation positions, and the Internal Assessment Approach for unrated liquidity facilities and programme-wide enhancements for asset-backed securitisations. We use the IRB approach for the majority of our non-trading book securitisation positions, while those in the trading book are treated like other market risk positions.
Market risk capital requirement
The market risk capital requirement is measured, with FSA permission, using VAR models, or the standard rules prescribed by the FSA.
We use both VAR and standard rules approaches for market risk. Our aim is to migrate more positions from standard rules to VAR.
Operational risk capital requirement
Basel II includes a capital requirement for operational risk, again utilising three levels of sophistication. The capital required under the basic indicator approach is a simple percentage of gross revenues, whereas under the standardised approach it is one of three different percentages of gross revenues allocated to each of eight defined business lines. Both these approaches use an average of the last three financial years’ revenues. Finally, the advanced measurement approach uses banks’ own statistical analysis and modelling of operational risk data to determine capital requirements.
We have adopted the standardised approach in determining our operational risk capital requirements.
Pillar 2 capital requirements
The second pillar of Basel II (Supervisory Review and Evaluation Process) involves both firms and regulators taking a view on whether a firm should hold additional capital against risks not covered in pillar 1. Part of the pillar 2 process is the Internal Capital Adequacy Assessment Process which is the firm’s self assessment of the levels of capital that it needs to hold. The pillar 2 process culminates in the FSA providing firms with Individual Capital Guidance (‘ICG’). The ICG is set as a capital resources requirement higher than that required under pillar 1. In 2011, this will be supplemented by an additional Capital Planning Buffer, set by the FSA, to cover capital demand should economic conditions worsen considerably against the current outlook.
Pillar 3 disclosure requirements
Pillar 3 of Basel II is related to market discipline and aims to make firms more transparent by requiring them to publish specific, prescribed details of their risks, capital and risk management under the Basel II framework. Our pillar 3 disclosures for the year ended 31 December 2010 are published as a separate document on the Group Investor Relations website.
179
Report of the Directors: Operating and Financial Review(continued)
Capital structure at 31 December
| | | | | | | | | |
| | | 2010 | | | 2009 | |
| | | US$m | | | US$m | |
Composition of regulatory capital | | | | | | | | |
(Audited) | | | | | | | | |
Tier 1 capital | | | | | | | | |
| Shareholders’ equity | | | 142,746 | | | | 135,252 | |
| | | | | |
Shareholders’ equity per balance sheet1 | | | 147,667 | | | | 128,299 | |
| Preference share premium | | | (1,405) | | | | (1,405 | ) |
| Other equity instruments | | | (5,851) | | | | (2,133 | ) |
Deconsolidation of special purpose entities2 | | | 2,335 | | | | 10,491 | |
| | | | | |
| Non-controlling interests | | | 3,917 | | | | 3,932 | |
| | | | | |
| Non-controlling interest per balance sheet | | | 7,248 | | | | 7,362 | |
| Preference share non-controlling interests | | | (2,426) | | | | (2,395 | ) |
| Non-controlling interest transferred to tier 2 capital | | | (501) | | | | (678 | ) |
| Non-controlling interest in deconsolidated subsidiaries | | | (404) | | | | (357 | ) |
| | | | | |
| Regulatory adjustments to the accounting basis | | | 1,794 | | | | 164 | |
| | | | | |
Unrealised losses on available-for-sale debt securities3 | | | 3,843 | | | | 906 | |
| Own credit spread | | | (889) | | | | (1,050 | ) |
Defined benefit pension fund adjustment4 | | | 1,676 | | | | 2,508 | |
| Reserves arising from revaluation of property and unrealised gains on available-for-sale equities | | | (3,121) | | | | (2,226 | ) |
| Cash flow hedging reserve | | | 285 | | | | 26 | |
| | | | | |
| Deductions | | | (32,341 | ) | | | (33,088 | ) |
| | | | | |
| Goodwill capitalised and intangible assets | | | (28,001) | | | | (28,680 | ) |
| 50% of securitisation positions | | | (1,467) | | | | (1,579 | ) |
| 50% of tax credit adjustment for expected losses | | | 241 | | | | 546 | |
| 50% of excess of expected losses over impairment allowances | | | (3,114) | | | | (3,375 | ) |
| | | | | |
Core tier 1 capital | | | 116,116 | | | | 106,260 | |
| | | | | | | | | |
| Other tier 1 capital before deductions | | | 17,926 | | | | 15,798 | |
| | | | | |
| Preference share premium | | | 1,405 | | | | 1,405 | |
| Preference share non-controlling interests | | | 2,426 | | | | 2,395 | |
| Hybrid capital securities | | | 14,095 | | | | 11,998 | |
| | | | | |
| Deductions | | | (863 | ) | | | 99 | |
| | | | | |
Unconsolidated investments5 | | | (1,104) | | | | (447 | ) |
| 50% of tax credit adjustment for expected losses | | | 241 | | | | 546 | |
| | | | | |
| | | | | | | | | |
| | | | | |
| | | | | | | | | |
Tier 1 capital | | | 133,179 | | | | 122,157 | |
| | | | | |
Tier 2 capital | | | | | | | | |
| Total qualifying tier 2 capital before deductions | | | 52,713 | | | | 50,075 | |
| | | | | |
| Reserves arising from revaluation of property and unrealised gains on available-for-sale equities | | | 3,121 | | | | 2,226 | |
Collective impairment allowances6 | | | 3,109 | | | | 4,120 | |
| Perpetual subordinated debt | | | 2,781 | | | | 2,987 | |
| Term subordinated debt | | | 43,402 | | | | 40,442 | |
| Non-controlling interest in tier 2 capital | | | 300 | | | | 300 | |
| | | | | |
| Total deductions other than from tier 1 capital | | | (18,337 | ) | | | (16,503 | ) |
| | | | | |
Unconsolidated investments5 | | | (13,744) | | | | (11,547 | ) |
| 50% of securitisation positions | | | (1,467) | | | | (1,579 | ) |
| 50% of excess of expected losses over impairment allowances | | | (3,114) | | | | (3,375 | ) |
| Other deductions | | | (12) | | | | (2 | ) |
| | | | | |
| | | | | | | | | |
| | | | | |
| | | | | | | | | |
Total regulatory capital | | | 167,555 | | | | 155,729 | |
| | | | | |
| | | | | | | | | |
Risk-weighted assets | | | | | | | | |
(Unaudited) | | | | | | | | |
| Credit risk | | | 890,696 | | | | 903,518 | |
| Counterparty credit risk | | | 50,175 | | | | 51,892 | |
| Market risk | | | 38,679 | | | | 51,860 | |
| Operational risk | | | 123,563 | | | | 125,898 | |
| | | | | |
| Total | | | 1,103,113 | | | | 1,133,168 | |
| | | | | |
180
Report of the Directors: Operating and Financial Review(continued)
| | | | | | | | | |
| | | 2010 | | | 2009 | |
| | | % | | | % | |
Capital ratios | | | | | | | | |
(Unaudited) | | | | | | | | |
| Core tier 1 ratio | | | 10.5 | | | | 9.4 | |
| Tier 1 ratio | | | 12.1 | | | | 10.8 | |
| Total capital ratio | | | 15.2 | | | | 13.7 | |
For footnotes, see page 182.
Source and application of tier 1 capital
| | | | | | | | | |
| | | 2010 | | | 2009 | |
| | | US$m | | | US$m | |
Movement in tier 1 capital | | | | | | | | |
(Audited) | | | | | | | | |
| Opening tier 1 capital | | | 122,157 | | | | 95,336 | |
| Contribution to tier 1 capital from profit for the year | | | 13,218 | | | | 10,247 | |
| | | | | |
| Consolidated profits attributable to shareholders of the parent company | | | 13,159 | | | | 5,834 | |
| Removal of own credit spread net of tax | | | 59 | | | | 4,413 | |
| | | | | |
| Net dividends | | | (3,827 | ) | | | (3,969 | ) |
| | | | | |
| Dividends | | | (6,350) | | | | (5,639 | ) |
| Add back: shares issued in lieu of dividends | | | 2,523 | | | | 1,670 | |
| | | | | |
| Decrease/(increase) in goodwill and intangible assets deducted | | | 679 | | | | (1,819 | ) |
| Ordinary shares issued | | | 180 | | | | 18,399 | |
| | | | | |
Rights issue (net of expenses)7 | | | – | | | | 18,326 | |
| Other | | | 180 | | | | 73 | |
| | | | | |
| Hybrid capital securities issued net of redemptions | | | 2,368 | | | | – | |
| Foreign currency translation differences | | | (526 | ) | | | 4,837 | |
| Other | | | (1,070 | ) | | | (874 | ) |
| | | | | |
| Closing tier 1 capital | | | 133,179 | | | | 122,157 | |
| | | | | |
| | | | | | | | | |
Movement in risk-weighted assets | | | | | | | | |
(Unaudited) | | | | | | | | |
| At 1 January | | | 1,133,168 | | | | 1,147,974 | |
| Movements | | | (30,055 | ) | | | (14,806 | ) |
| | | | | |
| At 31 December | | | 1,103,113 | | | | 1,133,168 | |
| | | | | |
For footnotes, see page 182.
Movement in tier 1 capital
(Audited)
HSBC complied with the FSA’s capital adequacy requirements throughout 2010 and 2009. Profits attributable to shareholders of the parent company increased capital by US$13.2bn, offset by net dividends of US$3.8bn after taking account of shares issued in lieu of dividends. Hybrid capital securities issued, net of redemptions, increased tier 1 capital by US$2.4bn.
Movement in risk-weighted assets
(Unaudited)
RWAs decreased by US$30.1bn or 3% in 2010. Of this reduction, US$12.8bn was due to credit risk, reflecting decreases in North America and Europe offset by increases in Asia and Latin America. There has been a decline in some North American retail portfolio exposures as a result of run off. However, the deterioration in the US economy and housing market in recent years has resulted in increases in the
average risk weighting applicable to those portfolios as we progressively captured the effects of these events within the various Basel II model parameters. Market risk RWAs decreased by US$13.2bn, primarily due to reduced market volatility and continuing exposure management.
Future developments
(Unaudited)
The regulation and supervision of financial institutions continues to undergo significant change in response to the global financial crisis. In December 2010, the Basel Committee issued final rules in two documents:A global regulatory framework for more resilient banks and banking systemsandInternational framework for liquidity risk measurement, standards and monitoring, which together are commonly referred to as ‘Basel III’. The new minimum capital requirements will be phased in from 1 January 2013, with full implementation required by 1 January 2019. The minimum common
181
Report of the Directors: Operating and Financial Review(continued)
equity tier 1 requirement of 4.5% and additional capital conservation buffer requirement of 2.5% will be phased in sequentially from 1 January 2013, becoming fully effective on 1 January 2019. Any additional countercyclical capital buffer requirements will also be phased in, starting in 2016, in parallel with the capital conservation buffer to a maximum level of 2.5% effective on 1 January 2019, although individual jurisdictions may choose to implement larger countercyclical capital buffers. The leverage ratio will be subject to a supervisory monitoring period, which commenced on 1 January 2011, and a parallel run period which will run from 1 January 2013 until 1 January 2017. Further calibration of the leverage ratio will be carried out in the first half of 2017, with a view to migrating to a pillar 1 requirement from 1 January 2018. The Basel Committee has increased the capital requirements for the trading book and complex securitisation exposures which are due to be implemented on 31 December 2011. They will continue to conduct the fundamental review of the trading book, which is targeted for completion by the end of 2011. In addition to the reforms discussed above, institutions designated as G-SIFIs may be subjected to additional requirements, which have yet to be proposed by regulators. The Basel Committee will provide the approach to defining G-SIFIs by the end of 2011. On 13 January 2011, the Basel Committee issued further minimum requirements to ensure that all classes of capital instruments fully absorb losses at the point of non-viability before taxpayers are exposed to loss. Instruments issued on or after 1 January 2013 may only be included in regulatory capital if the new requirements are met. The capital treatment of securities issued prior to this date will be phased out over a 10-year period commencing 1 January 2013.
Impact of Basel III
(Unaudited)
In order to provide some insight into the possible effects of the new Basel III rules on HSBC, we have estimated the pro forma common equity tier 1 ratio of the Group on the basis of our interpretation of those rules, as they would apply at 1 January 2019, but based on the position at 31 December 2010.
We have estimated that the application of the full Basel III rules on a pro forma basis would result in a common equity tier 1 ratio which is lower than the Basel II core tier 1 ratio by some 250—300 basis points. However, as the new rules will be phased in between 1 January 2013 and 1 January 2019, their impact will be gradual over that period. This estimate does not, however, take account of any future retained earnings, nor any management actions to reduce RWAs. The Basel III changes relate to increased capital deductions, new regulatory adjustments and increases in RWAs. The majority of the increase in RWAs relates to Basel III changes which are scheduled to come into effect on 1 January 2013, in particular to changes to counterparty credit risk capital charges and amounts for securitisation positions that were previously deducted from capital that will now be risk-weighted instead. Other increases in RWAs will begin to be phased in from 1 January 2014, including the majority of the unconsolidated investments that were previously deducted from capital. The remainder of the RWA increase arises from increases in trading book capital requirements which take effect on 31 December 2011, primarily relating to changes in market risk.
The estimated impact of Basel III is subject to change as regulators develop their requirements around the practical application and interpretation of the new rules, in particular the counterparty credit risk capital charge. Further uncertainty remains regarding any capital requirements which may be imposed on the Group over the period to 1 January 2019 in respect of the countercyclical capital buffer and any additional regulatory requirements for G-SIFIs. Under the Basel III rules as they will apply from 1 January 2019, we believe that ultimately the level for the common equity tier 1 ratio of the Group may lie in the range 9.5% to 10.5%. This exceeds the minimum requirement for common equity tier 1 capital plus the capital conservation buffer. HSBC has a strong track record of capital generation and actively manages its RWAs. Before these new rules come into force, we will take appropriate management action over the implementation period to 1 January 2019 to reduce the quantum of increase in RWAs that would have occurred if the new rules had been in effect at 31 December 2010.
| | |
| Footnotes to Capital |
| |
| 1 | | Includes externally verified profits for the year to 31 December 2010. |
| |
| 2 | | Mainly comprises unrealised losses on available-for-sale debt securities within special purpose entities which are excluded from the regulatory consolidation. |
| |
| 3 | | Under FSA rules, unrealised gains/losses on debt securities net of tax must be excluded from capital resources. |
| |
| 4 | | Under FSA rules, the defined benefit liability may be substituted with the additional funding that will be paid into the relevant schemes over the following five year period. |
| |
| 5 | | Mainly comprise investments in insurance entities. |
| |
| 6 | | Under FSA rules, collective impairment allowances on loan portfolios on the standardised approach are included in tier 2 capital. |
| |
| 7 | | Rights issue excludes US$493m of losses arising on derivative contracts and certain fees, which are recognised in the income statement. |
182
Report of the Directors: Governance
Governance
| | | | | |
| | | Page |
| | | 183 | |
| | | 183 | |
| | | 187 | |
| | | 187 | |
| | | 187 | |
| | | 189 | |
| | | 189 | |
| | | 194 | |
| | | 194 | |
| | | 194 | |
| | | 195 | |
| | | 197 | |
| | | 201 | |
| | | 201 | |
| | | 202 | |
| | | 202 | |
| | | 204 | |
| | | 204 | |
| | | 206 | |
| | | 207 | |
| | | 207 | |
| | | 207 | |
| | | 209 | |
| | | 211 | |
| | | 212 | |
| | | 212 | |
| | | 213 | |
| | | 213 | |
| | | 214 | |
| | | 214 | |
| | | 214 | |
| | | 214 | |
| | | 214 | |
| | | 216 | |
| | | 217 | |
| | | 217 | |
| | | 218 | |
| | | 218 | |
| | | 218 | |
| | | 218 | |
| | | 219 | |
Corporate Governance Report
Corporate Governance Report
The statement of corporate governance practices set out on pages 183 to 233 constitutes the Corporate Governance Report of HSBC Holdings.
D J Flint, CBE, Group Chairman
Directors
Age 55. Group Chairman and chairman of the Nomination Committee with effect from 3 December 2010. Joined HSBC as Group Finance Director in 1995 and served as Chief Financial Officer, Executive Director, Risk and Regulation from 1 February 2010 until 3 December 2010. A non-executive director of BP p.l.c. since January 2005 and chairman of its Audit Committee since April 2010 but will retire at the BP AGM in April 2011. Director of The Hong Kong Association with effect from 6 February 2011. Co-chairman of the Counterparty Risk Management Policy Group III in 2008. Chaired the Financial Reporting Council’s review of the Turnbull Guidance on Internal Control in 2004. Served on the Accounting Standards Board and the Standards Advisory Council of the International Accounting Standards Board from 2001 to 2004. Served on the Large Business Forum on Tax and Competitiveness and the Consultative Committee of the Large Business Advisory Board of HM Revenue and Customs. A former partner in KPMG.
Mr Flint has extensive governance experience gained through membership of the Boards of HSBC and BP as well as considerable knowledge of finance and risk management in banking, multinational financial reporting, treasury and securities trading operations. In 2006 he was honoured with a CBE in recognition of his services to the finance industry. He is a member of the Institute of Chartered Accountants of Scotland and the Association of Corporate Treasurers and he is a Fellow of The Chartered Institute of Management Accountants.
S T Gulliver, Group Chief Executive
Age 51. Group Chief Executive and chairman of the Group Management Board since 1 January 2011. An executive Director since 2008. Joined HSBC in 1980. Appointed a Group General Manager in 2000 and a Group Managing Director in 2004. Chairman of The Hongkong and Shanghai Banking Corporation Limited with effect from 1 January 2011. Chairman of HSBC France since January 2009 and of HSBC Private Banking Holdings (Suisse) SA since 25 February 2010. Deputy chairman of HSBC Trinkaus & Burkhardt AG since 2007 and a member of its Supervisory Board since 2006. Chairman, Europe, Middle East and Global Businesses until 31 December 2010. Chairman of HSBC Bank plc from 21 April 2010 to 31 December 2010 and of HSBC Bank Middle East Limited from 15 February 2010 to 31 December 2010. Head of Global Banking and Markets from 2006 to 2010 and co-head from 2003 to 2006. Head of Global Markets from 2002 to 2003. Head of Treasury and Capital Markets in Asia-Pacific from 1996 to 2002.
183
Report of the Directors: Governance(continued)
Mr Gulliver is a career banker with over 30 years’ international experience with HSBC. He has held a number of key roles in the Group’s operations worldwide, including in London, Hong Kong, Tokyo, Kuala Lumpur and the United Arab Emirates. He played a leading role in developing and expanding Global Banking and Markets, the wholesale banking division of the Group with operations in over 65 countries and territories.
†S A Catz
Age 49. President of Oracle Corporation. A non-executive Director since 2008. Managing Director of Donaldson, Lufkin & Jenrette from 1997 to 1999. Joined Oracle in 1999 and appointed to the Board of Directors in 2001.
Ms Catz brings to the Board a background in international business leadership, having helped transform Oracle into the second biggest producer of management software and the world’s leading supplier of software for information management.
†L M L Cha, GBS(Appointed 1 March 2011)
Age 61. Non-executive Deputy Chairman of The Hongkong and Shanghai Banking Corporation Limited. A non-executive Director with effect from 1 March 2011. A non-official member of the Executive Council of Hong Kong SAR. Director of Hong Kong Exchanges and Clearing Limited, Tata Consultancy Services Limited and China Telecom Corporation Limited. Chairman of the ICAC Advisory Committee on Corruption and of the University Grants Committee in Hong Kong. Vice-chairman of the International Advisory Council of the China Securities Regulatory Commission and a Hong Kong delegate to the 11th National People’s Congress of China. A member of the Advisory Board of the Yale School of Management, and Millstein Center of Corporate Governance and Performance at Yale University and a Senior International Advisor for Foundation Asset Management Sweden AG. Former appointments include: non-executive director of Bank of Communications Co., Ltd from 2006 to 19 August 2010, Baoshan Iron and Steel Co. Limited and Johnson Electric Holdings Limited. A member of the State Bar of California. She was awarded a Silver Bauhinia Star in 2001 and a Gold Bauhinia Star in 2009 by the Hong Kong Government for her public service.
Mrs Cha has worked in the US and Asia and has extensive regulatory and policy making experience in the finance and securities sector in Hong Kong and mainland China. Mrs Cha was Vice Chairman of the China Securities Regulatory Commission (‘CSRC’) from January 2001 to September 2004. She was appointed to the post by the State Council and became the first person outside mainland China to join the Central Government of the People’s Republic of China at the vice-ministerial rank. Prior to her post at the CSRC, Mrs Cha worked in the Securities and Futures Commission in Hong Kong from 1991 to 2000, becoming its Deputy Chairman in 1998.
V H C Cheng, GBS, OBE
Age 62. Chairman of HSBC Bank (China) Company Limited and, since 21 January 2010, of HSBC Bank (Taiwan) Limited. An executive Director since 2008 and a member of the Corporate Sustainability Committee since 28 May 2010. Joined HSBC in 1978. Appointed a Group General Manager in 1995 and a Group Managing Director in 2005. An independent non-executive director of Great Eagle Holdings Limited and MTR Corporation Limited. Vice chairman of the China Banking Association. A member of the National Committee of the 11th Chinese People’s Political Consultative Conference (‘CPPCC’) and a senior adviser to the 11th Beijing Municipal Committee of the CPPCC. Ceased to be chairman and a director of The Hongkong and Shanghai Banking Corporation Limited on 1 February 2010 and of HSBC Global Asset Management (Hong Kong) Limited on 4 February 2010. Ceased to be a director of HSBC Bank Australia Limited and a member of the Exchange Fund Advisory Committee of the Hong Kong Monetary Authority on 1 February 2010 and of HSBC Bank (Vietnam) Limited on 11 November 2010. A non-executive director of Swire Pacific Limited from 2005 to 2008. Awarded the Gold Bauhinia Star by the Hong Kong Government in 2005.
Mr Cheng is a career banker with extensive international business experience particularly in Asia. Mr Cheng is Vice President of the Hong Kong Institute of Bankers and was chairman of the Process Review Panel for the Securities and Futures Commission and of the Standing Committee on Directorate Salaries and Conditions of Service of the Hong Kong Government. Chairman of the Council of the Chinese University of Hong Kong since October 2009. He was seconded to the Hong Kong Government’s Central Policy Unit from 1989 to 1991 serving as an adviser to the Governor of Hong Kong.
†M K T Cheung, GBS, OBE
Age 63. Non-executive chairman of the Airport Authority Hong Kong. A non-executive Director since February 2009 and a member of the Group Audit Committee since 1 March 2010. A non-executive director of Hang Seng Bank Limited, HKR International Limited and Hong Kong Exchanges and Clearing Limited. A non-official member of the Executive Council of the Hong Kong Special Administrative Region. Non-executive chairman of the Council of the Hong Kong University of Science and Technology. A director of The Association of Former Council Members of The Stock Exchange of Hong Kong Limited and The Hong Kong International Film Festival Society Limited. Ceased to be a non-executive director of Sun Hung Kai Properties Limited in December 2009. Chairman and Chief Executive Officer of KPMG Hong Kong from
184
Report of the Directors: Governance(continued)
1996 to 2003. A Council Member of the Open University of Hong Kong until June 2009. Awarded the Gold Bauhinia Star by the Hong Kong Government in 2008.
Dr Cheung brings to the Board a background in international business and financial accounting, particularly in Greater China and the wider Asian economy. He retired from KPMG Hong Kong in 2003 after more than 30 years’ distinguished service with the firm. He is a Fellow of the Institute of Chartered Accountants in England and Wales.
†J D Coombe
Age 65. Non-executive chairman of Hogg Robinson Group plc. A non-executive Director since 2005 and chairman of the Group Audit Committee since 30 July 2010. A member of the Remuneration Committee and, since 26 February 2010, of the Group Risk Committee. A non-executive director of Home Retail Group plc. A trustee of the Royal Academy Trust. Former appointments include: executive director and Chief Financial Officer of GlaxoSmithKline plc; non-executive director of GUS plc; a member of the Supervisory Board of Siemens AG; chairman of The Hundred Group of Finance Directors, and a member of the Accounting Standards Board.
Mr Coombe brings to the Board a background in international business, financial accounting and the pharmaceutical industry. As Chief Financial Officer of GlaxoSmithKline he had responsibility for the Group’s financial operations globally. He is a Fellow of the Institute of Chartered Accountants in England and Wales.
†R A Fairhead
Age 49. Chairman, Chief Executive Officer and a director of Financial Times Group Limited. A non-executive Director since 2004. Chairman of the Group Risk Committee since 26 February 2010. A member of the Group Audit Committee, having ceased to be chairman on 30 July 2010. A member of the Nomination Committee. A director of Pearson plc and a non-executive director of The Economist Newspaper Limited. A director of the UK Cabinet Office since 16 December 2010. Ceased to be chairman and a director of Interactive Data Corporation on 30 July 2010. Former appointments include Executive Vice President, Strategy and Group Control of Imperial Chemical Industries plc and Finance Director of Pearson plc.
Mrs Fairhead brings to the Board a background in international industry, publishing, finance and general management. As the former Finance Director of Pearson plc she oversaw the day to day running of the finance function and was directly responsible for global financial reporting and control, tax and treasury. She has a Master’s in Business Administration from the Harvard Business School.
A A Flockhart, CBE
Age 59. Chairman, Europe, Middle East, Africa, Latin America, Commercial Banking and Chairman of HSBC Bank plc with effect from 1 January 2011. An executive Director since 2008. Joined HSBC in 1974. Appointed a Group General Manager in 2002 and a Group Managing Director in 2006. Chairman of HSBC Latin America Holdings (UK) Limited since December 2009. A director of HSBC Bank Australia Limited. A member of the Visa Asia Pacific Senior Advisory Council, Visa Inc. Chairman, Personal and Commercial Banking and Insurance until 31 December 2010. Chairman of HSBC Bank Malaysia Berhad from 2007 to 5 February 2010. Chief Executive Officer of The Hongkong and Shanghai Banking Corporation Limited from 2007 to 1 February 2010. Ceased to be a director of HSBC Bank (China) Company Limited on 28 February 2010 and of Hang Seng Bank Limited on 31 December 2010. Ceased to be vice chairman and a director of HSBC Bank (Vietnam) Limited on 16 June 2010. President and Group Managing Director Latin America and the Caribbean from 2006 to 2007. Chief Executive Officer, Mexico from 2002 to 2006. Senior Executive Vice-President, Commercial Banking, HSBC Bank USA, N.A. from 1999 to 2002. Managing Director of The Saudi British Bank from 1997 to 1999.
Mr Flockhart is a career banker, being an emerging markets specialist with over 35 years’ experience with HSBC across Latin America, the Middle East, US and Asia. In 2007 he was honoured with a CBE in recognition of his services to British business and charitable services and institutions in Mexico.
†J W J Hughes-Hallett, SBS
Age 60. Chairman of John Swire & Sons Limited. A non-executive Director since 2005. A member of the Nomination Committee and, since 26 February 2010, of the Group Risk Committee. A member of the Group Audit Committee until 1 March 2010. A non-executive director and former chairman of Cathay Pacific Airways Limited and Swire Pacific Limited. A non-executive director of The Hongkong and Shanghai Banking Corporation Limited from 1999 to 2004. A trustee of the Dulwich Picture Gallery and the Esmée Fairbairn Foundation. A member of The Hong Kong Association and the Governing Board of the Courtauld Institute of Art. Awarded the Silver Bauhinia Star by the Hong Kong Government in 2004.
Mr Hughes-Hallett brings to the Board a background in financial accounting and the management of a broad range of businesses in a number of international industries, including aviation, insurance, property, shipping, manufacturing and trading in the Far East, UK, US and Australia. He is a Fellow of the Institute of Chartered Accountants in England and Wales.
185
Report of the Directors: Governance(continued)
†W S H Laidlaw
Age 55. Chief Executive Officer of Centrica plc. A non-executive Director since 2008. A member of the Remuneration Committee. Former appointments include: Executive Vice President of Chevron Corporation; non-executive director of Hanson PLC; Chief Executive Officer of Enterprise Oil plc; and President and Chief Operating Officer of Amerada Hess Corporation.
Mr Laidlaw brings to the Board significant international experience, particularly in the energy sector, having had responsibility for businesses in four continents. He has a Master’s in Business Administration from INSEAD. He is a member of the UK Prime Minister’s Business Advisory Group and is the Senior Independent Director of the Department for Transport.
†J R Lomax
Age 65. Former Deputy Governor, Monetary Stability, at the Bank of England and a member of the Monetary Policy Committee. A non-executive Director since 2008. A member of the Group Audit Committee since March 2009 and of the Group Risk Committee since 26 February 2010. A non-executive director of The Scottish American Investment Company PLC and Reinsurance Group of America Inc., and since 7 July 2010, of Arcus European Infrastructure Fund GP LLP. A non-executive director of BAA Limited since 24 November 2010. A director of the Council of Imperial College, London and a member of the Board of the Royal National Theatre. A member of the Business Advisory Group to the UK Secretary of State for Business since 18 May 2010. Former appointments include: Deputy Governor of the Bank of England from 2003 to 2008; Permanent Secretary at the UK Government Departments for Transport and Work and Pensions and at the Welsh Office from 1996 to 2003; and Vice President and Chief of Staff to the President of the World Bank from 1995 to 1996.
Ms Lomax brings to the Board business experience in both the public and private sectors and a deep knowledge of the operation of the UK government and the financial system.
I J Mackay, Group Finance Director
Age 49. An executive Director since 3 December 2010. Joined HSBC in 2007. A Director of Hang Seng Bank Limited until 31 December 2010. Chief Financial Officer, Asia Pacific from September 2009 to 3 December 2010 and Chief Financial Officer, North America from 2007 to September 2009. Former appointments include: Vice President and Chief Financial Officer of GE Consumer Finance and Vice President and Chief Financial Officer of GE Healthcare — Global Diagnostic Imaging.
Mr Mackay has extensive financial and international experience. He has worked in London, Paris, US and Asia. He is a member of the Institute of Chartered Accountants of Scotland.
†G Morgan, CM
Age 65. Non-executive Chairman of SNC-Lavalin Group Inc. A non-executive Director since 2006. A member of the Remuneration Committee. A member of the Board of Trustees of The Fraser Institute and the Manning Centre for Building Democracy. A non-executive director of HSBC Bank Canada from 1996 to 2006. Former appointments include Founding President, Chief Executive Officer and Vice Chairman of EnCana Corporation; director of Alcan Inc.; and director of Lafarge North America, Inc.
Mr Morgan brings to the Board a background in technical, operational, financial and management positions and has led large international companies in the energy and engineering sectors. He has been recognised as Canada’s most respected Chief Executive Officer in a national poll of Chief Executives. He is currently a business columnist for Canada’s largest national newspaper. He was appointed a Member of the Order of Canada on 30 December 2010 for his contributions as a business and community leader and as a philanthropist.
†N R N Murthy, CBE
Age 64. Chairman and Chief Mentor and former Chief Executive Officer of Infosys Technologies Limited. A non-executive Director since 2008. Chairman of the Corporate Sustainability Committee since 28 May 2010. A director of the United Nations Foundation. Ceased to be a director of Unilever plc on 12 May 2010. Former appointments include: a non-executive director of DBS Group Holdings Limited, DBS Bank Limited and New Delhi Television Limited.
Mr Murthy brings to the Board experience in information technology, corporate governance and education, particularly in India. He founded Infosys Technologies Limited in India in 1981 and was its Chief Executive Officer for 21 years. Under his leadership, Infosys established a global footprint and was listed on NASDAQ in 1999. During his career he has worked in France and India.
†Sir Simon Robertson, Deputy Chairman, senior independent non-executive Director
Age 69. Non-executive chairman of Rolls-Royce Group plc and the founder member of Simon Robertson Associates LLP. A non-executive Director since 2006. Senior independent non-executive Director since 2007 and Deputy Chairman since 1 December 2010. A member of the Nomination Committee. A non-executive director of Berry Bros. & Rudd Limited, The Economist Newspaper Limited and Royal Opera House Covent Garden Limited. A trustee of the Eden Project Trust and of the Royal Opera House Endowment Fund.
186
Report of the Directors: Governance(continued)
Former appointments include Managing Director of Goldman Sachs International and chairman of Dresdner Kleinwort Benson.
Sir Simon brings to the Board a background in international corporate advisory with a wealth of experience in mergers and acquisitions, merchant banking, investment banking and financial markets. During his career he has worked in France, Germany, the UK and the US. In June 2010 he was honoured with a knighthood in recognition of his services to business.
†J L Thornton
Age 57. A non-executive Director since 2008. Chairman of the Remuneration Committee since 28 May 2010. Non-executive chairman and a director of HSBC North America Holdings Inc since 2008. Professor and director of the Global Leadership Program at the Tsinghua University School of Economics and Management. Chairman of the Brookings Institution Board of Trustees. A non-executive director of Ford Motor Company, News Corporation, Inc. and China Unicom (Hong Kong) Limited. A director of National Committee on United States-China Relations and a Trustee of Asia Society, China Institute, The China Foreign Affairs University, the Palm Beach Civic Association and the United World College of East Africa Trust. A member of the Council on Foreign Relations, the China Securities Regulatory Commission International Advisory Committee and China Reform Forum International Advisory Committee. Former appointments include: a non-executive director of Industrial and Commercial Bank of China Limited from 2005 to 2008; Intel Corporation, Inc. from 2003 to 18 May 2010; and President of the Goldman Sachs Group, Inc. from 1999 to 2003.
Mr Thornton brings to the Board experience that bridges developed and developing economies and the public and private sectors. He has a deep knowledge of financial services and education systems, particularly in Asia. During his 23 year career with Goldman Sachs, he played a key role in the firm’s global development and was Chairman of Goldman Sachs Asia.
†Sir Brian Williamson, CBE
Age 66. A non-executive Director since 2002. A member of the Nomination Committee, having ceased to be its chairman on 26 February 2010. A director of NYSE Euronext. Chairman of Electra Private Equity plc until 24 May 2010. Former appointments include: chairman of London International Financial Futures and Options Exchange and Gerrard Group plc; a director of Climate Exchange plc; and a non-executive director of Resolution plc, the Financial Services Authority and the Court of The Bank of Ireland.
Sir Brian brings to the Board extensive experience in money and bond markets, insurance, private equity, futures, options and commodities trading internationally. He established the London International Financial Futures and Options Exchange in the 1980s and led the Exchange’s development of its electronic trading platform in the mid-1990s. He was the first chairman of Resolution plc, established to consolidate life assurance business in the UK. He is a member of the Guild for International Bankers.
†Independent non-executive Director
R G Barber
Age 60. Group Company Secretary since 1986. Appointed a Group General Manager in 2006. Joined HSBC in 1980. Company Secretary of HSBC Holdings plc since 1990. Chairman of the Disclosure Committee. A member of the Listing Authority Advisory Committee of the Financial Services Authority and of the Primary Markets Group of the London Stock Exchange. Corporation Secretary of The Hongkong and Shanghai Banking Corporation Limited from 1986 to 1992 and Company Secretary of HSBC Bank plc from 1994 to 1996.
D J Shaw
Age 64. An Adviser to the Board since 1998. Solicitor. A former partner in Norton Rose. A director of HSBC Bank Bermuda Limited, HSBC Private Banking Holdings (Suisse) SA and HSBC Private Bank (Suisse) SA. An independent non-executive director of Kowloon Development Company Limited and Shui On Land Limited.
A Almeida
Age 54. Group Head of Human Resources. A Group Managing Director since 2008. Joined HSBC in 1992. Appointed a Group General Manager in 2007. Former appointments include Global Head of Human Resources for Global Banking and Markets, Global Private Banking, Global Transaction Banking and HSBC Amanah from 1996 to 2007.
E Alonso
Age 55. Group Managing Director and Head of HSBC Latin America and the Caribbean. A Group Managing Director since 2008. Joined HSBC in 1997. Appointed a Group General Manager in 2006. Chairman Grupo Financiero HSBC, S.A. de C.V. and HSBC México, S.A., Institución de Banca Múltiple, Grupo Financiero HSBC. President of the Board of Directors of HSBC Bank (Panamá) S.A. A director
187
Report of the Directors: Governance(continued)
of HSBC Latin America Holdings (UK) Limited and HSBC Argentina Holdings S.A. A director of HSBC Bank Brasil S.A. — Banco Múltiplo and Managing Director of HSBC Serviços e Participaçoes Ltda from 2004 to 2008. Managing Director of HSBC (Brasil) Administradora de Consorcio Ltda. from 2001 to 2008.
S Assaf
Age 50. Chief Executive, Global Banking and Markets. A Group Managing Director since 1 January 2011. Joined HSBC France in 1994. Appointed a Group General Manager in 2008. A director of HSBC Bank Egypt S.A.E. since 22 June 2010 and a director of HSBC Global Asset Management Limited. Head of Global Markets from 2008 to 31 December 2010. Deputy Head of Global Markets from 2007 to 2008. Head of Global Markets for Europe, Middle East and Africa from 2006 to 2007.
N S K Booker
Age 52. Chief Executive Officer, HSBC North America Holdings Inc. A Group Managing Director since 1 August 2010. Joined HSBC in 1981. Appointed a Group General Manager in 2004. Chairman of HSBC Bank USA, National Association, HSBC Financial Corporation and HSBC USA Inc. since 31 July 2010. Chief Executive Officer of HSBC Finance Corporation from 2008 to July 2010. Deputy Chairman and Chief Executive Officer of HSBC Bank Middle East Limited from 2006 to 2007. Chief Executive Officer, India from 2002 to 2006.
A M Keir
Age 52. Global Head of Commercial Banking. A Group Managing Director since 1 January 2011. Joined HSBC in 1981. Appointed a Group General Manager in 2006. A director of HSBC Bank A.S. Group General Manager, Commercial Banking, Europe and Global Co-Head, Global Commercial Banking from 2008 to 31 December 2010. Global Co-Head of the Group’s commercial banking activities from 2003 to 2008.
M M Moses
Age 53. Group Chief Risk Officer. A Group Managing Director since 3 December 2010. Joined HSBC in 2005. Appointed a Group General Manager on 27 May 2010. A director of HSBC Insurance (Bermuda) Limited since 2 December 2010. Chief Financial and Risk Officer, Global Banking and Markets from 2005 to 2 December 2010.
B Robertson
Age 56. Chief Executive, HSBC Bank plc since 3 December 2010. A Group Managing Director since 2008. Joined HSBC in 1975. Appointed a Group General Manager in 2003. Chairman of HSBC Life (UK) Limited and a director of HSBC Bank plc since 3 December 2010. Group Chief Risk Officer from 2007 to 2 December 2010. Group General Manager, Group Credit and Risk from 2005 to 2007 and Head of Global Banking and Markets for North America from 2003 to 2005.
P A Thurston
Age 57. Chief Executive, Retail Banking and Wealth Management with effect from 1 March 2011. A Group Managing Director since 2008. Joined HSBC in 1975. Appointed a Group General Manager in 2003. A director of HSBC Bank plc. Chief Executive of HSBC Bank plc from April 2009 to 3 December 2010. Chairman of HSBC Life (UK) Limited from 24 March 2010 to 30 November 2010.
P T S Wong
Age 59. Chief Executive, The Hongkong and Shanghai Banking Corporation Limited. A Group Managing Director since 1 February 2010. Joined HSBC and appointed a Group General Manager in 2005. Deputy Chairman of HSBC Bank (China) Company Limited. Chairman of HSBC Bank Malaysia Berhad since 5 February 2010. Vice Chairman of HSBC Bank (Vietnam) Ltd since 16 June 2010. A director of Hang Seng Bank Limited, Bank of Communications Co., Ltd. and Ping An Insurance (Group) Company of China, Ltd. A non-executive director of Cathay Pacific Airways Limited. A director of HSBC Bank Australia Limited from 1 February 2010 to 1 February 2011.
188
Report of the Directors: Governance(continued)
Board of Directors
The Board
The purpose of HSBC’s management structures, headed by the Board of Directors of HSBC Holdings (the ‘Board’) and led by the Group Chairman, is to deliver sustainable value to our shareholders. The Board sets the strategy for the Group and approves the risk appetite, capital and operating plans presented by management for the achievement of the strategic objectives it has set. This ensures the efficient application of our resources for the achievement of these objectives. Implementation of the strategy set by the Board is delegated to the Group Management Board (‘GMB’) led by the Group Chief Executive.
HSBC Holdings has a unitary Board. The authority of each Director is exercised in Board meetings where the Board acts collectively. At 28 February 2011, the Board comprises the Group Chairman, Group Chief Executive, three other executive Directors and 12 non-executive Directors. Their names and brief biographical particulars are listed on pages 183 to 187. The Group Chairman, Group Chief Executive and three other executive Directors are employees. Non-executive Directors are not HSBC employees and do not participate in the daily business management of HSBC; they bring an external perspective, constructively challenge and help develop proposals on strategy, scrutinise the performance of management in meeting agreed goals and objectives and monitor the reporting of performance. The non-executive Directors bring experience from a number of industries and business sectors, including the leadership of large complex multinational enterprises. The roles of non-executive Directors as members of Board committees are described on pages 194 to 198 and on pages 201 and 202.
The Board has determined that the time commitment expected of non-executive Directors to be not less than 24 days per annum and not less than 30 days per annum in total for non-executive Directors appointed to the Group Audit Committee, Group Risk Committee or Remuneration Committee and for the Deputy Chairman and senior independent non-executive director. The time commitment of each non-executive Director is set out in the Director’s letter of appointment.
The terms and conditions of appointment of non-executive Directors are available for inspection at 8 Canada Square, London E14 5HQ and will be made available for 15 minutes before the Annual General Meeting and during the Meeting itself.
The Board is responsible for managing the business of HSBC Holdings and, in doing so, may exercise its powers, subject to any relevant laws and regulations and to the Articles of Association. In particular, the Board may exercise all the powers of the Company to borrow money and to mortgage or charge all or any part of the undertaking, property or assets (present or future) of HSBC Holdings and may also exercise any of the powers conferred on it by the Companies Act 2006 and/or by shareholders. The Board is able to delegate and confer on certain Directors holding executive office any of its powers, authorities and discretions (including the power to sub-delegate) for such time and on such terms as it thinks fit. In addition, the Board may establish any local or divisional boards or agencies for managing the business of HSBC Holdings in any specified locality and delegate and confer on any local or divisional board, manager or agent so appointed any of its powers, authorities and discretions (including the power to sub-delegate) for such time and on such terms as it thinks fit. The Board may also, by power of attorney or otherwise, appoint any person or persons to be the agent of HSBC Holdings and may delegate to any such person or persons any of its powers, authorities and discretions (including the power to sub-delegate) for such time and on such terms as it thinks fit.
The Board delegates the management and day-to-day running of HSBC to the GMB but retains to itself approval of certain matters including operating plans, risk appetite and performance targets, procedures for monitoring and controlling of operations, the authority or the delegation of authority to approve credit, market risk limits, acquisitions, disposals, investments, capital expenditure or realisation or creation of a new venture, specified senior appointments and any substantial change in balance sheet management policy.
The Directors who served during the year were S A Catz, V H C Cheng, M K T Cheung, J D Coombe, J L Durán (retired 28 May 2010), R A Fairhead, D J Flint, A A Flockhart, W K L Fung (retired 28 May 2010), M F Geoghegan (retired 31 December 2010), Lord Green (retired 3 December 2010), S T Gulliver, J W J Hughes-Hallett, W S H Laidlaw, J R Lomax, I J Mackay (appointed 3 December 2010), Sir Mark Moody-Stuart (retired 28 May 2010), G Morgan, N R N Murthy, Sir Simon Robertson, J L Thornton and Sir Brian Williamson.
HSBC Holdings was registered in Hong Kong under part IX of the Companies Ordinance on 17 January 1991.
189
Report of the Directors: Governance(continued)
Nine Board meetings and a two-day strategy meeting were held in 2010. At least one Board meeting each year is held in a key strategic location outside the UK. During 2010, a Board meeting was held in Shanghai.
The table below shows each Director’s attendance at meetings of the Board, Group Audit Committee, Group Risk Committee, Nomination Committee, Remuneration Committee and Corporate Sustainability Committee held whilst he or she was a Director or member of the relevant committee during 2010. Two meetings of the Board and of the Remuneration Committee were held at short notice. Not all Directors who were entitled to attend were able to attend these meetings.
Eight meetings of other committees of the Board appointed to discharge specific business were held during 2010. These meetings are not shown in the table below.
During 2010, the non-executive Directors and the Group Chairman met three times without the other executive Directors and the non-executive Directors and Group Chairman and Group Chief Executive met once without the other executive Directors. The non-executive Directors also met without the Group Chairman to appraise the Group Chairman’s performance.
All those who were Directors at the time attended the 2010 Annual General Meeting save for V H C Cheng and J L Thornton.
Attendance record
| | | | | | | | | | | | | | | | | | | | | | | | | |
| | Meetings attended in 2010 | |
| | | | | | | | | | | | | | | | | | | Remu- | | | Corporate | |
| | | | | | | Group Audit | | | Group Risk | | | Nomination | | | neration | | | Sustainability | |
| | | Board | | | Committee | | | Committee | 1 | | Committee | | | Committee | | | Committee | |
| | | | | | | | | | | | | | | | | | | | | | | | | |
| Number of meetings held | | | 9 | | | | 6 | | | | 4 | | | | 3 | | | | 9 | | | | 5 | |
| | | | | | | | | | | | | | | | | | | | | | | | | |
| S A Catz | | | 8 | | | | – | | | | – | | | | – | | | | – | | | | – | |
| V H C Cheng | | | 7 | | | | – | | | | – | | | | – | | | | – | | | | 1 | 2 |
| M K T Cheung | | | 8 | | | | 4 | 3 | | | – | | | | – | | | | – | | | | – | |
| J D Coombe | | | 9 | | | | 6 | | | | 4 | | | | – | | | | 9 | | | | – | |
J L Durán4 | | | 2 | | | | – | | | | – | | | | – | | | | – | | | | – | |
| R A Fairhead | | | 8 | | | | 5 | | | | 3 | | | | 2 | | | | – | | | | – | |
| D J Flint | | | 9 | | | | – | | | | – | | | | – | 5 | | | – | | | | – | |
| A A Flockhart | | | 9 | | | | – | | | | – | | | | – | | | | – | | | | – | |
W K L Fung6 | | | 4 | | | | – | | | | – | | | | – | | | | – | | | | 3 | |
| M F Geoghegan | | | 8 | | | | – | | | | – | | | | – | | | | – | | | | – | |
Lord Green7 | | | 8 | | | | – | | | | – | | | | 2 | | | | – | | | | – | |
| S T Gulliver | | | 9 | | | | – | | | | – | | | | – | | | | – | | | | – | |
| J W J Hughes-Hallett | | | 8 | | | | 2 | 8 | | | 2 | | | | 3 | | | | – | | | | – | |
| W S H Laidlaw | | | 9 | | | | – | | | | – | | | | – | | | | 9 | | | | – | |
| J R Lomax | | | 8 | | | | 6 | | | | 4 | | | | – | | | | – | | | | – | |
I J Mackay9 | | | – | | | | – | | | | – | | | | – | | | | – | | | | – | |
Sir Mark Moody-Stuart10 | | | 4 | | | | – | | | | – | | | | – | | | | 4 | | | | 2 | |
| G Morgan | | | 7 | | | | – | | | | – | | | | – | | | | 6 | | | | – | |
| N R N Murthy | | | 7 | | | | – | | | | – | | | | – | | | | – | | | | 5 | |
| Sir Simon Robertson | | | 9 | | | | – | | | | – | | | | 3 | | | | – | | | | – | |
| J L Thornton | | | 8 | | | | – | | | | – | | | | – | | | | 9 | | | | – | |
| Sir Brian Williamson | | | 8 | | | | – | | | | – | | | | 3 | | | | – | | | | – | |
| | |
| 1 | | All members appointed on 26 February 2010 when the Committee was established. All members eligible to attend 4 Committee Meetings. |
| |
| 2 | | Appointed a member on 28 May 2010 – eligible to attend 2 Committee Meetings. |
| |
| 3 | | Appointed a member on 1 March 2010 – eligible to attend 4 Committee Meetings. |
| |
| 4 | | Retired as a Director on 28 May 2010 – eligible to attend 4 Board Meetings. |
| |
| 5 | | Appointed a member on 3 December 2010 – not eligible to attend any Committee Meetings. |
| |
| 6 | | Retired as a Director on 28 May 2010 – eligible to attend 4 Board Meetings and 3 Committee Meetings. |
| |
| 7 | | Appointed a member of the Nomination Committee on 26 February 2010 and retired as a Director on 3 December 2010 – eligible to attend 8 Board Meetings and 2 Committee Meetings. |
| |
| 8 | | Ceased to be a member on 1 March 2010 – eligible to attend 2 Committee Meetings. |
| |
| 9 | | Appointed a Director on 3 December 2010 – eligible to attend one Board Meeting. |
| |
| 10 | | Retired as a Director on 28 May 2010 – eligible to attend 4 Board Meetings, 4 Remuneration Committee Meetings and 3 Corporate Sustainability Committee Meetings. |
190
Report of the Directors: Governance(continued)
Group Chairman and Group Chief Executive
The roles of Group Chairman and Group Chief Executive are separate and held by experienced full-time Directors.
D J Flint succeeded S K Green (who on 22 November 2010 became Lord Green of Hurstpierpoint and is referred to in this document as Lord Green) as Group Chairman on 3 December 2010. S T Gulliver succeeded M F Geoghegan as Group Chief Executive on 1 January 2011.
The appointment of D J Flint, made by a unanimous decision of the Board, was the culmination of a comprehensive succession process begun in the first half of the year under the leadership of the senior independent non-executive Director. When considering the choice of Group Chairman, the Nomination Committee, assisted by an external consultant, took a number of factors into account, including the need to contribute to the unprecedented regulatory and public policy debate on the future shape of the banking industry and, in particular, systemically important financial institutions operating globally with a universal banking model; the full-time demands of this engagement; the personal standing to represent HSBC at the highest levels; a deep understanding and experience of international financial services; and extensive experience of Board governance and stakeholder engagement. The Nomination Committee came to the unanimous conclusion that D J Flint was the best person for the position, meeting all the core criteria and having led our regulatory engagement at Board level through 2010.
S T Gulliver has worked for us throughout his career serving across Asia, in Europe and in the Middle East. The Board considers S T Gulliver ideally qualified for the role of Group Chief Executive. He has built and managed a global business in over 65 countries and has a deep knowledge of and strong reputation in Asia where he worked for over 20 years. S T Gulliver has been responsible for managing complex risks for many years and shepherded and enhanced the Group’s liquidity through the economic crisis. He also has had responsibility for all of HSBC’s operations in the UK, Europe and the Middle East. As Group Chief Executive, S T Gulliver’s principal office is located in Hong Kong.
Sir Simon Robertson became Deputy Chairman with effect from 1 December 2010. As Deputy Chairman his role is to deputise for the Group Chairman at meetings of the Board or shareholders and to support the Group Chairman in his role.
The Board believes strongly that these appointments, which were made by unanimous decision, are in HSBC’s best interests. There is a clear division of responsibilities at the head of the Company between the running of the Board and the executive responsibility for running HSBC’s business. The Group Chairman’s responsibilities include, in addition to the leadership of the Board and ensuring its effectiveness, the development of relationships with governments, regulators and investors; leading the Group’s interactions on matters of public policy and regulatory reform with regard to the banking and financial services industry; maintaining corporate reputation and character; and performance management of the Group Chief Executive. Subject to the Group Chief Executive’s recommendation, the Group Chairman approves risk, capital allocation and capital investment decisions within authorities delegated by the Board.
The Group Chief Executive has responsibility for developing, and delivering performance against, business plans. He is responsible for developing Group strategy in agreement with the Group Chairman and for recommendation to the Board. As chairman of the GMB, the Group Chief Executive is responsible for driving performance within strategic goals and commercial objectives agreed by the Board.
Board balance and independence of Directors
The Board includes a strong presence of both executive and non-executive Directors and no individual or small group can dominate its decision making. The size of the Board is appropriate given the complexity and geographical spread of our business and the significant time demands placed on the non-executive Directors, particularly those who serve as members of Board committees.
The Nomination Committee regularly reviews the structure, size and composition necessary (including the skills, knowledge and experience required of Directors) to address and challenge adequately key risks and decisions that confront, or may confront, the Board and makes recommendations to the Board with regard to any changes. The Nomination Committee maintains a forward-looking schedule of potential candidates as Directors that takes into account the needs and developments of the Group’s businesses and the anticipated retirement dates of existing Directors.
Sir Simon Robertson’s role as the senior independent non-executive Director is to act as an intermediary for other non-executive Directors when
191
Report of the Directors: Governance(continued)
necessary, to lead the non-executive Directors in the oversight of the Group Chairman and to ensure there is a clear division of responsibility between the Group Chairman and Group Chief Executive.
The Board considers all of the non-executive Directors to be independent in character and judgement. The Board has determined S A Catz, L M L Cha, M K T Cheung, J D Coombe, R A Fairhead, J W J Hughes-Hallett, W S H Laidlaw, J R Lomax, G Morgan, N R N Murthy, Sir Simon Robertson, J L Thornton and Sir Brian Williamson to be independent. When determining independence the Board considers that calculation of the length of service of a non-executive Director begins on the date of his or her first election by shareholders as a Director of HSBC Holdings. Given the complexity and geographical spread of our business, the experience of previous service on a subsidiary company board can be a considerable benefit and does not detract from a Director’s independence. In reaching its determination of each non-executive Director’s independence the Board has concluded that there are no relationships or circumstances which are likely to affect a Director’s judgement and any relationships or circumstances which could appear to do so were considered not to be material.
In accordance with the Rules Governing the Listing of Securities on the Stock Exchange of Hong Kong Limited, each non-executive Director determined by the Board to be independent has provided an annual confirmation of his or her independence to HSBC Holdings.
Information, induction and ongoing development
The Board regularly reviews reports on progress against financial objectives, business developments and investor and external relations and receives reports from the chairmen of Board committees and from the Group Chief Executive. The Board receives regular reports and presentations on strategy and developments in the customer groups, global businesses and principal geographical areas. Regular reports are also provided to the Board, the Group Audit Committee, the Group Risk Committee and the Risk Management Meeting of the GMB on credit exposures and the loan portfolio, asset, liability and risk management, liquidity, litigation and finance, compliance and reputational issues. The agenda and supporting papers are distributed in advance of all Board and committee meetings to allow time for appropriate review and to facilitate full discussion at the meetings. All Directors have full and timely
access to all relevant information and may take independent professional advice if necessary.
The Directors have free and open contact with management at all levels. Group Managing Directors and Group General Managers meet informally with Directors after Board meetings. Board offsite visits are made each year to enable Directors to see at first hand the business operations in local environments and to meet management, employees and customers.
Full, formal and tailored induction programmes, with particular emphasis on the systems of risk management and internal controls, are arranged by the Group Company Secretary for newly appointed Directors. The programmes consist of a series of meetings with other Directors and senior executives to enable new Directors to receive information and familiarise themselves with our strategy, risk appetite, operations and internal controls. As part of the induction process the Group Company Secretary will coordinate the production of a development programme based on the individual Director’s needs. Directors receive comprehensive guidance on the duties and liabilities of a Director of HSBC Holdings before appointment and opportunities to update and develop their skills and knowledge, through externally run seminars and briefings by senior executives, throughout their directorship.
Induction programmes are also arranged for newly appointed members of committees and appropriate training is provided on an ongoing basis.
A personalised approach to training and development of Directors is applied. Development plans and records of development activities are maintained by the Group Company Secretary for annual review by the Group Chairman with the Director concerned. The Group Company Secretary coordinates the delivery of any training required. Focused in-house development programmes to enhance business awareness are arranged in conjunction with scheduled Board Meetings. Directors have access online to internal training and development resources.
Non-executive Directors have an open invitation to attend meetings of the GMB to further enhance their understanding and awareness of our businesses and the senior leadership team.
Performance evaluation
In November 2010, Oliver Wyman was commissioned to review and report on the effectiveness of the Board and its principal committees with a particular focus on risk management and governance responsibilities. Oliver
192
Report of the Directors: Governance(continued)
Wyman’s report was prepared following interviews with Directors and senior members of management and a review of relevant documents. Factors assessed during Oliver Wyman’s review included experience and skills of individual Directors, breadth and mix of skills and expertise across the Board and its committees, decision making processes, group culture and dynamics and interaction between the Board and the executive.
The Oliver Wyman report concluded that the Board operates effectively with a number of important strengths. The report identified some areas where effectiveness could be enhanced.
The report was used by the Board in its annual evaluation of its own performance and the performance of its committees and individual Directors. The Board will monitor implementation of actions to address issues arising from its 2010 performance evaluation. All actions arising from the Board’s 2009 performance evaluation have been implemented.
It is the intention of the Board to continue to undertake an evaluation of its performance and that of its committees and individual Directors annually, with external input to the process at least every third year.
Formal evaluation of the individual performance of each Director is undertaken annually by the Chairman using the findings of the performance evaluation process undertaken by the Board. The Group Chairman has confirmed that all of the non-executive Directors continue to perform effectively and to demonstrate commitment to their roles.
The non-executive Directors, led by the senior independent non-executive Director, are responsible for the evaluation of the performance of the Group Chairman.
Oliver Wyman has provided and continues to provide strategic consultancy services to the Group.
Appointment, retirement and re-election of Directors
The Board may at any time appoint any person who is willing to act as a Director, either to fill a vacancy or as an addition to the existing Board, but the total number of Directors shall not exceed twenty-five. Any Director so appointed by the Board shall retire at the Annual General Meeting following his or her appointment and shall be eligible for re-election but is not taken into account in determining the number of Directors who are to retire by rotation at such meeting. The Board may appoint any Director to hold any employment or executive office and may
revoke or terminate any such appointment. Shareholders may, by ordinary resolution, appoint a person as a Director or remove any Director before the expiration of his period of office. On the recommendation of the Nomination Committee and in compliance with provision B.7.1 of the UK Corporate Governance Code, which replaces the Combined Code on Corporate Governance for financial years beginning on or after 29 June 2010, the Board has decided that all of the Directors should be subject to annual re-election by shareholders. Accordingly, all of the Directors will retire at the forthcoming Annual General Meeting and with the exception of V H C Cheng, who is to retire, offer themselves for re-election. All the executive Directors are employed on rolling contracts which require 12 months’ notice to be given by either party. None of the non-executive Directors has a service contract with HSBC.
Brief biographical particulars of all Directors are given on pages 183 to 187.
Relations with shareholders
The Board ensures all Directors develop an understanding of the views of major shareholders. Non-executive Directors are invited to attend analyst presentations and other meetings with institutional investors and their representative bodies. Directors also meet representatives of institutional shareholders annually to discuss corporate governance matters.
All executive Directors and other senior executives hold regular meetings with institutional investors and report to the Board on those meetings. Our corporate brokers give bi-annual presentations to the Board on market views and investor relations. The Board receives a regular Investor Relations activity report which provides feedback from institutional shareholders and brokers, analysts’ forecasts, information from research reports and share price performance data.
During 2010, Sir Simon Robertson, Deputy Chairman and senior independent non-executive Director, J L Thornton and other non-executive Directors met and corresponded with institutional investors and their representatives to discuss strategy, remuneration policy, succession and governance. As senior independent non-executive Director, Sir Simon Robertson is available to shareholders should they have concerns which contact through the normal channels of Group Chairman, Group Chief Executive, Group Finance Director or other executives has failed to resolve or for which such contact would be inappropriate. He
193
Report of the Directors: Governance(continued)
may be contacted through the Group Company Secretary at 8 Canada Square, London E14 5HQ.
Conflicts of interest, indemnification of Directors, relevant audit information and contracts of significance
The Board has authority to approve Directors’ conflicts and potential conflicts of interest and has adopted a policy and procedures for the determination of terms of authorisation for such situations. The Board’s powers to authorise conflicts are operating effectively and the procedures are being followed. A review of situational conflicts which have been authorised from time to time and the terms of those authorisations is undertaken by the Board annually.
Our Articles of Association provide that Directors are entitled to be indemnified out of the assets of HSBC Holdings against claims from third parties in respect of certain liabilities arising in connection with the performance of their functions pursuant to the provisions of the Companies Act 2006. Such indemnity provisions have been in place during the financial year but have not been utilised by the Directors.
Each person who is a Director at the date of approval of this report confirms that so far as he or she is aware, there is no relevant audit information of which the auditor is unaware and the Director has taken all the steps that he or she ought to have taken as a Director in order to make himself or herself aware of any relevant audit information and to establish that the Company’s auditor is aware of that information. This confirmation is given pursuant to section 418 of the Companies Act 2006 and should be interpreted in accordance therewith and subject to the provisions thereof.
None of the Directors had, during the year or at the end of the year, a material interest, directly or indirectly, in any contract of significance with any HSBC company.
Corporate governance codes
We are committed to high standards of corporate governance. We have complied throughout the year with the applicable code provisions of the Combined Code on Corporate Governance issued by the Financial Reporting Council, save for code provision A.2.2 as D J Flint, who had previously served as Chief Financial Officer, Executive Director, Risk and Regulation, did not meet the independence criteria of the Combined Code on Corporate Governance when he was appointed Group Chairman on 3 December 2010. The Board’s
explanation of its decision to appoint D J Flint is set out on page 191. We have complied throughout the year with all applicable code provisions of the Code on Corporate Governance Practices in Appendix 14 to the Rules Governing the Listing of Securities on The Stock Exchange of Hong Kong Limited. The Combined Code on Corporate Governance is available at www.frc.org.uk and the Code on Corporate Governance Practices is available at www.hkex.com.hk.
The Board has adopted a code of conduct for transactions in HSBC Group securities by Directors. The code of conduct complies with The Model Code in the Listing Rules of the FSA and with The Model Code for Securities Transactions by Directors of Listed Issuers (‘Hong Kong Model Code’) set out in the Rules Governing the Listing of Securities on The Stock Exchange of Hong Kong Limited, save that The Stock Exchange of Hong Kong Limited has granted certain waivers from strict compliance with the Hong Kong Model Code. The waivers granted by The Stock Exchange of Hong Kong Limited primarily take into account accepted practices in the UK, particularly in respect of employee share plans. Following a specific enquiry, each Director has confirmed he or she has complied with the code of conduct for transactions in HSBC Group securities throughout the year.
The Board has appointed a number of committees consisting of certain Directors, Group Managing Directors and, in the case of the Corporate Sustainability Committee, certain co-opted non-director members. Information in relation to the principal committees is set out below:
Board committees
Group Management Board
The GMB, an executive management committee, meets frequently and operates as a general management committee under the direct authority of the Board. The objective of the GMB is to maintain a reporting and control structure whereby all of our line operations are accountable to individual members of the GMB who report to the Group Chief Executive who in turn reports to the Group Chairman. The Board has set objectives and measures for the GMB. These align senior executives’ objectives and measures with the strategy and operating plans throughout HSBC.
The members of the GMB are S T Gulliver (Chairman), A A Flockhart and I J Mackay, who are executive Directors, and A Almeida, E Alonso, S Assaf, N S K Booker, A M Keir, M M Moses,
194
Report of the Directors: Governance(continued)
B Robertson, P A Thurston and P T S Wong, all of whom are Group Managing Directors.
The GMB exercises the powers, authorities and discretions of the Board in so far as they concern the management and day-to-day running of HSBC Holdings. Matters reserved for approval by the Board are described on page 189.
The Group Chief Executive reports to each meeting of the Board on the activities of the GMB.
Group Audit Committee
The Report of the Group Audit Committee is set out below.
Role and membership of the Group Audit Committee
The Group Audit Committee (‘GAC’), whose members are all independent non-executive Directors, is responsible for advising the Board on the effectiveness of our systems of internal controls and compliance in relation to financial matters and on meeting financial reporting obligations. The GAC also has responsibilities in relation to risk governance and oversight and internal controls.
The members of the Committee throughout 2010 were J D Coombe (Chairman), R A Fairhead and J R Lomax. On 1 March 2010, M K T Cheung was appointed a member of the Committee in succession to J W J Hughes-Hallett. On 30 July 2010, J D Coombe was appointed chairman of the Committee in succession to R A Fairhead who remains a member of the Committee.
Appointments to the Committee are made for periods of up to three years, extendable by no more than two additional three-year periods, so long as members continue to be independent.
The Board has determined that M K T Cheung, J D Coombe, R A Fairhead and J R Lomax are independent according to SEC criteria and may be regarded as audit committee financial experts for the purposes of section 407 of the Sarbanes-Oxley Act and have recent and relevant financial experience.
The terms of reference of the Committee, which are reviewed annually, are available at www.hsbc.com/boardcommittees.
To ensure consistency of scope and approach by subsidiary company audit committees, the GAC has established core terms of reference to guide subsidiary companies when adopting terms of reference for their audit committees. The Committee’s endorsement is required for any proposed changes to subsidiary audit committee terms of reference and for appointments to such committees. The chairmen of our principal subsidiary audit committees attended a forum in November 2010 led by the chairman of the GAC to ensure a common understanding and approach to the way in which subsidiary audit committees operate throughout the Group; understand and share the key issues we face as an organisation and as audit committee members; and discuss current market conditions and the lessons to be learned from the financial crisis.
Historically the GAC has provided non-executive oversight of risk as well as financial reporting. The Group Risk Committee (‘GRC’) was established in February 2010 to focus on risk governance and to provide an increasingly forward-looking view of risks and their mitigation. The GAC currently has certain responsibilities in relation to risk governance and oversight of internal controls in order to comply with the Hong Kong and UK Corporate Governance Codes.
There is therefore currently a degree of overlap between the responsibilities of the GAC and the GRC in relation to risk matters. For example, a review of the effectiveness of our systems of risk management and internal controls was undertaken by the GAC and by the GRC. Each of the committees is reviewing its terms of reference with the aim of minimising the overlap.
The governance structure for the oversight of our financial reporting and governance is set out below:
195
Report of the Directors: Governance(continued)
| | | | | |
| |
| Authority | | Membership | | Responsibilities |
| |
| The Board | | • Executive and non- executive Directors | | • Approves financial statements • Appoints senior financial officers • Delegates authorities in relation to financial matters |
| |
| The GAC | | • Independent non-
executive Directors | | • Advises the Board on: – ensuring an effective system of internal control and compliance over financial reporting; and |
| | | | | – meeting its external financial reporting obligations |
| | | | | • Responsible for selection, oversight and remuneration of the external auditor |
| |
| Boards and audit committees of principal subsidiaries | | • In relation to boards, executive and non- executive directors. Committees may have additional members who are not directors. | | • Provide bi-annual certificates to the GAC or intermediate audit committees relating to financial statements and internal control procedures of relevant subsidiary |
| |
Committee’s activities
The Committee held six meetings in 2010 — see page 190 for details of Directors’ attendance at these meetings. Following each meeting the Committee reports to the Board on its activities.
The Committee undertook the following activities in the discharge of its responsibilities:
| • | | the Committee satisfied itself that the system of internal control and compliance over financial reporting was effective through regular reports from the Group Finance Director, the Group Chief Accounting Officer, and the Group Head of Internal Audit; presentations from other functional and business heads on the financial control framework; review of minutes of meetings of the GMB, the GRC, Risk Management Meetings, the Group Reputational Risk Committee and the Disclosure Committee; reports on US compliance; and through the processes described in more detail on page 202 in relation to internal controls. The Committee also reviewed the adequacy of resources, qualifications and experience of staff in the finance function. The Group Head of Compliance and the Group Chief Risk Officer regularly attended Committee meetings and other senior financial, internal audit, legal and compliance executives attended as appropriate. The Committee had regular dialogue with the external auditor and the Group Head of Internal Audit, with opportunities at each meeting for dialogue to take place without management present; |
| |
| • | | the Committee satisfied itself that the internal audit function was effective and adequately resourced through regular meetings with and reports from the Group Head of Internal Audit on internal audit issues and review of an annual report on the activities of the internal audit |
| | | function and planned activities for the following year; |
| |
| • | | the Committee received regular updates on the application of changes in law, regulation and accounting policies and practices including financial reporting pursuant to the Sarbanes-Oxley Act, Basel II compliance and changes to the FSA’s large exposure rules; |
| |
| • | | the Committee provided oversight of the external auditor through regular meetings with the external auditor, reviewing the auditor’s strategy paper in relation to the audit and receiving reports on the effectiveness and progress of the audit of financial statements. The Committee has approved policies on the provision of non-audit services by the auditor and its affiliates and on the employment by HSBC of former employees of the auditor or its affiliates. The Committee reviewed the independence and objectivity of the auditor through meetings with the auditor, annual reports on employment of former employees of the auditor and its affiliates and quarterly reports on provision of non-audit services. The external auditor provided written confirmation of its independence under industry standards. The Committee approved the remuneration and terms of engagement of the auditor; |
| |
| • | | the Committee advised the Board on meeting its external financial reporting obligations through a review of financial statements and interim statements prior to approval by the Board; endorsement of the inclusion of the going concern statement in financial statements; review of the disclosure of the results of the EU-wide stress test conducted by the Committee of European Banking Supervisors; a presentation from the Head of Group Planning and Tax on the Group’s tax position; review of accounting |
196
Report of the Directors: Governance(continued)
| | | policies and practices, including approval of the critical accounting policies; reports on proposed changes to the Group’s disclosures in the financial statements; reports from the Disclosure Committee; reports on the adequacy of procedures to identify transactions and matters requiring disclosure under certain accounting standards; and reports on the audit process; and |
| |
| • | | the Committee undertook a review of its terms of reference and its effectiveness. |
Some of the activities of the GRC described on page 200 were carried out by the GAC prior to the establishment of the GRC in February 2010. Since February 2010 some of those activities are carried out by the GRC and the GAC. The description of these activities is not repeated in the list above.
Arrangements relating to the external auditor
The Committee has recommended to the Board that KPMG Audit Plc be reappointed auditor at the forthcoming Annual General Meeting.
An analysis of the remuneration paid in respect of audit and non-audit services provided by KPMG Audit Plc and its affiliates (‘KPMG’) for each of the past three years is disclosed in Note 8 on the Financial Statements.
The Board has approved, on the recommendation of the Committee, a policy for the employment by us of former employees of KPMG and an annual report is received by the Committee on such former employees who are employed by us and the number of such former employees who are employed by us in senior positions. This report enables the Committee to consider whether there has been any impairment, or appearance of impairment, of the auditor’s judgement or independence in respect of the audit.
The policies for the pre-approval of specific services that may be provided by the principal auditor are kept under review by the Committee and amended as necessary to meet the dual objectives of ensuring that we benefit in a cost effective manner from the cumulative knowledge and experience of our auditor, while also ensuring that our auditor maintains the necessary degree of independence and objectivity. These pre-approval policies apply to all services where any HSBC company pays for the service, or is a beneficiary or addressee of the service and has selected or influenced the choice of KPMG. All services provided by KPMG during 2010 were pre-approved by the Committee or were
entered into under pre-approval policies established by the Committee.
The pre-approved services relate to regulatory reviews, agreed-upon procedures reports, other types of attestation reports, the provision of advice and other non-audit services allowed under SEC independence rules. They fall into the categories of audit services, audit-related services, tax services and other services.
Group Risk Committee
The Report of the Group Risk Committee is set out below.
Role and membership of the Group Risk Committee
The GRC, whose members are all independent non-executive Directors, is responsible for advising the Board on material risk matters and providing non-executive oversight of risk. The Committee was established in February 2010 following publication of the final recommendations of Sir David Walker’sReview of Corporate Governance in UK Banks and other Financial Industry Entities,to focus on risk governance and to provide an increasingly forward-looking view of risks and their mitigation.
Historically the GAC has provided non-executive oversight of risk as well as financial reporting. As noted in the section headed ‘Group Audit Committee’ above there is currently a degree of overlap between responsibilities of the GAC and the GRC in relation to risk governance and oversight matters and internal controls. Each committee is reviewing its terms of reference with the aim of minimising the overlap.
The members of the GRC are R A Fairhead (Chairman), J D Coombe, J W J Hughes-Hallett and J R Lomax.
The Committee’s terms of reference, which are reviewed annually, are available at www.hsbc.com/boardcommittees.
To ensure consistency of scope and approach by subsidiary company committees, the GRC has established core terms of reference to guide subsidiary companies when adopting terms of reference for their risk committees (or their audit committees if those committees are also responsible for risk oversight). The Committee’s endorsement is required for any proposed changes to the terms of reference of any subsidiary committee relating to risk oversight and for appointments to such committees.
197
Report of the Directors: Governance(continued)
The chairmen of committees of principal subsidiaries with responsibility for oversight of risk attended the forum referred to on page 195. One of the purposes of the forum was to ensure a common understanding and approach to the way in which subsidiary committees operate in relation to risk oversight throughout the Group; to understand and share the key risk issues we face as an organisation and the issues faced by members of committees responsible for oversight of risk; and to discuss the lessons to be learned from the financial crisis.
Risk governance
All of HSBC’s activities involve, to varying degrees, the measurement, evaluation, acceptance and management of risk or combinations of risks. The Board, advised by the Committee, ensures that the Group has a strong risk governance culture which shapes the Group’s risk strategy. The Board and the Committee ensure that a strong risk management framework is maintained, via the continuous monitoring of the risk environment and an integrated evaluation of risks and their interactions.
The Committee is responsible for overseeing the Group’s risk governance structure and monitoring the effectiveness of the Group’s risk management and internal control systems. The Committee monitors top and emerging risks and reviews the outcome of internal and external stress tests.
In carrying out its responsibilities the Committee is closely supported by the Group Chief Risk Officer, who ensures that top and emerging risks are reported to and considered by the Committee. The Committee receives regular presentations from the Group Head of Internal Audit and other business, function and risk heads on risks within their respective areas of responsibility and regular reports from the Risk Management Meeting of the GMB, which is the executive body responsible for overseeing risk.
The governance structure for the management of risk at HSBC is set out below. Appropriate governance arrangements are in place in regional and operating subsidiaries.
| | | | | |
| |
| Authority | | Membership | | Responsibilities |
| The Board | | Executive and non-executive Directors | | • Approves risk appetite, plans and performance targets for the Group • Appoints senior risk officers • Delegates authorities for risk management |
| |
| The GRC | | Independent non-executive Directors | | • Advises the Board on: |
| | | | | – risk appetite, tolerance and strategy; |
| | | | | – stress testing; |
| | | | | – systems of risk management, internal control and compliance used to identify, measure, monitor, control and report risks; |
| | | | | – the alignment of the Board’s risk appetite with strategy and reward; and |
| | | | | – the maintenance and development of a supportive culture in relation to the management of risk. |
| |
| Risk Management Meeting of the GMB | | Group Chief Executive
Group Chief Risk Officer | | • Formulates high-level Group risk policy • Exercises delegated risk authorities |
| | | Group Finance Director | | • Oversees implementation of risk appetite and controls |
| | | Senior management | | • Monitors all categories of risk and determines action |
| |
| Global Risk Management Board | | Group Chief Risk Officer
Chief Risk Officers of HSBC’s regions
Heads of risk disciplines within Group
Management Office
| | • Supports the Risk Management Meeting and the Group Chief Risk Officer in providing strategic direction for the Global Risk function, sets priorities and oversees their execution • Oversees consistent risk approach to accountability and control across the Global Risk function |
| |
Risk appetite
Risk appetite is central to HSBC’s management of risk. The Board, advised by the GRC, approves the Group’s risk appetite which describes the types and
levels of risk that the Group is prepared to accept in executing our strategy. Our risk appetite is underpinned by the following core characteristics:
198
Report of the Directors: Governance(continued)
Risk appetite: core characteristics
| • | | Strong balance sheet |
| |
| • | | Strong brand |
| |
| • | | Healthy capital position |
| |
| • | | Conservative liquidity management |
| |
| • | | Risk must be commensurate with returns |
| |
| • | | Robust Group structure of separate legal entities |
| |
| • | | The customer group and global product mix should produce sustainable long term earnings growth |
| |
| • | | Risk diversification |
The GRC monitors the Group’s risk appetite and satisfies itself that executive management has taken account of the future macroeconomic and financial environment in identifying top and emerging risks.
From the core characteristics of the Group’s risk appetite (see table above), our strategic and operational objectives are determined which are consistent with the Group’s risk appetite. These objectives are summarised in the table below:
| | | | | |
| |
| Strategic and operational objectives |
| | | | | | |
| Earnings | | | 1. | | Generate sustainable economic profit commensurate with the risks taken |
| | | | | | |
| |
| | | | | | |
| Capital and liquidity | | | 2. | | Maintain capital in excess of regulatory requirements and a long term debt rating of AA |
| | | | | | |
| | | |
| | | | | | |
| | | | 3. | | Maintain a strong tier 1 ratio comprising a high proportion of core tier 1 |
| | | | | | |
| | | |
| | | | | | |
| | | | 4. | | Maintain a well diversified funding structure with a particular focus on advances to core funding ratios |
| | | | | | |
| | | |
| | | | | | |
| | | | 5. | | Off balance sheet vehicles should not be material in size relative to the total balance sheet |
| | | | | | |
| |
| | | | | | |
| Impairments and expected losses | | | 6. | | Manage impairments and expected losses within the Group’s tolerance |
| | | | | | |
| |
| | | | | | |
| Risk category and diversification | | | 7. | | Manage all risk categories within the risk appetite |
| | | | | |
| | | |
| | | | | |
| | | | 8. | | Harness benefits from business diversification to generate non-volatile and sustainable earnings |
| | | | | | |
| | | | | | |
| | | | | | |
| | | | 9. | | Compete for business with international customers where market connectivity is critical; businesses with local customers where we have local scale, and products where global scale is critical to effectiveness |
| | | | | | |
| |
| | | | | | |
| Scenario and stress testing | | | 10. | | Use robust and appropriate scenario stress testing to assess the potential impact on the Group’s capital adequacy and strategic plans |
| | | | | | |
| | | | | | |
Top and emerging risks
Identifying and monitoring top and emerging risks is integral to HSBC’s approach to risk management. We define a ‘top risk’ as being a current, visible risk which has the potential to have a material impact on our financial results, reputation or the sustainability of our long-term business model. An ‘emerging risk’ is one which has large unknown components which,
if they were to crystallise, could have material impact on our long-term strategy.
Current top and emerging risks are viewed as falling under four broad categories: challenges to business operations; challenges to governance and internal control; macro-economic and geopolitical; and macro-prudential and regulatory. These are summarised below:
| | | | |
| |
| | | | | |
| Categories / definitions | | Top and emerging risks |
| | | | | |
| Challenges to our business operations | | • | | Challenges to our operating model in an economic downturn (in developed economies) and rapid growth (in emerging markets) |
| | | • | | Internet crime and fraud |
| | | | | |
| |
| | | | | |
| Challenges to our governance and internal control | | • | | Operational complexity associated with high levels of change |
| systems | | • | | Information security risk |
| | | | | |
| |
| | | | | |
| Macro-economic and geopolitical risk | | • | | Potential emerging markets asset bubble |
| | | • | | Increased geopolitical risk in the Middle East, with possible contagion |
| | | | | |
| |
| | | | | |
| Macro-prudential and regulatory risks to our business model | | •
• | | Regulatory change impacting business model and Group profitability
Regulatory requirements affecting conduct of business |
| | | | | |
| |
199
Report of the Directors: Governance(continued)
Stress testing
HSBC’s scenario analysis and stress testing programme is central to the identification and monitoring of top and emerging risks. It highlights the vulnerabilities of our business and capital plans to the adverse effects of extreme but plausible events. The GRC reviews the outcome of the stress tests performed.
There are three main classifications of scenario and stress tests: regulatory scenarios; Group level business scenarios; and local business scenarios. The GRC uses the outcome of the programme to assess the potential impact of the relevant scenarios on the demand for regulatory capital compared with its supply. Management develops action plans to mitigate the risks identified. The extent to which those action plans are implemented depends on management’s evaluation of the risks and their potential consequences, taking into account HSBC’s risk appetite.
Committee activities
The Committee held four meetings in 2010 – see page 190 for details of Directors’ attendance. Following each meeting the Committee reports to the Board on its activities.
John Trueman, a non-executive director of HSBC Bank plc and chairman of its risk and audit committees has been invited by the Committee to attend its meetings. His experience of risk related matters in the financial services industry is valued by the Committee.
The GRC undertook the following key activities in the discharge of its responsibilities:
| • | | the Committee provided oversight of executive risk management through regular reports from the Group Chief Risk Officer and the Risk Management Meeting of the GMB; review of minutes of meetings of the GMB, the Risk Management Meeting, the Remuneration Committee and the Group Reputational Risk Committee; reports from the Group General Counsel on substantial litigation; a report from the Remuneration Committee on risk related matters; and updates on the Swiss data theft referred to on page 83. The Group Finance Director and the Group Chief Accounting Officer regularly attended committee meetings and other senior financial, risk, internal audit, legal and compliance executives attended as appropriate; |
| |
| • | | the Committee reviewed the effectiveness of internal controls through a cycle of |
| | | presentations from the Group Chief Risk Officer and other business and functional heads on the risk control framework; reports from the Group Head of Internal Audit on the internal audit process and weaknesses identified in internal controls and reports of the external auditor and regulators relating to the internal control system; updates from the Group Head of Compliance; and reports from the Group General Counsel and other senior executives on US compliance matters. The Committee undertook an annual review of the effectiveness of HSBC’s system of internal control, which is described on page 202. The Committee had regular dialogue with the external auditor and the Group Head of Internal Audit, with opportunities at each meeting for dialogue to take place without management present; |
| |
| • | | the Committee considered the Group’s risk appetite and the alignment of strategy with risk appetite through reviewing the Group’s risk appetite statement and reports on liquidity and capital management; receiving reports from the Chief Risk Officer; and considering the outcomes of the scenario and stress testing programme; |
| |
| • | | the Committee considered the alignment of reward structures with the Group’s risk appetite through a report from the Group Head of HR on procedures to be used when determining an individual’s variable pay award for the 2010 performance period. These procedures include making assessments of the profitability of the business area in which an individual works and the performance of that business area when compared to the approved risk appetite in respect of that business. The performance of the individual is also assessed taking into account the extent to which that individual has adhered to the Group’s policies and procedures for risk related matters and has achieved specified performance targets or objectives (such as a revenue or profit target). These procedures were considered by the Remuneration Committee in early 2011. An update was also provided on a review of variable pay plans throughout the Group; |
| |
| • | | in monitoring top and emerging risks the Committee satisfied itself that it understood and took into account the views of senior management; reviewed minutes of executive committee meetings including meetings of the GMB, the Risk Management Meeting and Group Reputational Risk Committee; received reports from the Group Chief Risk Officer and |
200
Report of the Directors: Governance(continued)
| | | the Group Head of Compliance as well as other members of senior management on developments in the Group’s business; and received regular presentations on global market risk and liquidity and the impact of the tightening of liquidity in the money markets; |
| |
| • | | the Committee considered risk issues relating to a proposed strategic acquisition and discussed a report from the Group Head of Mergers and Acquisitions and other members of senior management involved in the proposed acquisition; and |
| |
| • | | the Committee undertook a review of its terms of reference and its effectiveness. |
External advice on US-related compliance matters was provided to the GRC by US law firm Cahill Gordon & Reindel and by Promontory Financial Group, US financial consultants.
Some of the activities referred to above were carried out by the GAC prior to the establishment of the GRC in February 2010. Since February 2010 some of those activities are carried out by the GRC and the GAC.
Remuneration Committee
The role of the Remuneration Committee and its membership are set out in the Directors’ Remuneration Report on page 222.
Nomination Committee
Role and membership of the Nomination Committee
The Nomination Committee is responsible for leading the process for Board appointments and for identifying and nominating, for approval by the Board, candidates for appointment to the Board. Before recommending an appointment to the Board, the Committee evaluates the balance of skills, knowledge and experience on the Board and, in the light of this, and taking into account the needs of the Group’s businesses, identifies the role and capabilities required for a particular appointment. Candidates are considered on merit against these criteria. Care is taken to ensure that appointees have enough time to devote to us. Prospective Directors are asked to identify any significant other commitments and confirm they have sufficient time to discharge what is expected of them.
The members of the Nomination Committee throughout 2010 were Sir Brian Williamson, R A Fairhead, Sir Simon Robertson and J W J Hughes-Hallett, all independent non-executive
Directors. Lord Green succeeded Sir Brian Williamson as chairman of the Nomination Committee on 26 February 2010 and served until his retirement on 3 December 2010 when he was succeeded by D J Flint, upon his appointment as Group Chairman. Lord Green did not chair any meeting of the Nomination Committee when it was dealing with the appointment of the successor to the chairmanship. The selection process for Lord Green’s successor as Group Chairman, was led by the senior independent non-executive Director.
The terms of reference of the Committee, which are reviewed annually, are available at www.hsbc.com/boardcommittees.
The appointments of D J Flint as Group Chairman, S T Gulliver as Group Chief Executive and I J Mackay as an executive Director were made on the advice and recommendation of the Nomination Committee. An external consultancy was used in connection with the appointments.
Committee activities
The Committee held three meetings in 2010 — see page 190 for details of Directors’ attendance at these meetings. Following each meeting the Committee reports to the Board on its activities.
The Committee undertook the following key activities in the discharge of its responsibilities:
| • | | under the chairmanship of the senior independent non-executive Director, the Committee led the succession process for the Group Chairman and the Group Chief Executive. The process is described on page 191; |
| |
| • | | the Committee leads the process for Board appointments, with the support of external consultants as appropriate, and has satisfied itself that appropriate plans are in place for orderly succession to the Board reflecting an appropriate balance of skills and experience on the Board; |
| |
| • | | the Committee maintains a forward-looking schedule of potential candidates for appointment to the Board that takes into account the needs and developments of the Group’s businesses and the anticipated retirement dates of current Directors. On the recommendation of the Committee, the Board has appointed L M L Cha as a non-executive Director with effect from 1 March 2011; |
| |
| • | | the Committee monitored the size, structure and composition of the Board through consideration |
201
Report of the Directors: Governance(continued)
| | | of the skills, knowledge and experience required of the Board and the skills, knowledge and experience of the current Directors. The Committee reviewed the time commitment required from non-executive Directors taking into account the recommendations of Sir David Walker’s review of corporate governance relating to board and board committee matters and made appropriate recommendations to the Board. The Committee considered the re-election of Directors at the annual general meeting and on the recommendation of the Committee, the Board has decided that all Directors should be subject to re-election by shareholders in 2011; |
| |
| • | | the Committee provided oversight of other matters relating to directors including considering a proposed appointment of a Director to an external body and discussing and providing guidance on FSA interactions; and |
| |
| • | | the Committee undertook a review of its terms of reference. The effectiveness of the Committee was reviewed as part of the Board’s performance evaluation. |
Corporate Sustainability Committee
The role of the Corporate Sustainability Committee and its membership are set out on page 213.
The Directors are responsible for internal control in HSBC and for reviewing its effectiveness. Procedures have been designed for safeguarding assets against unauthorised use or disposition; for maintaining proper accounting records; and for the reliability and usefulness of financial information used within the business or for publication. Such procedures are designed to manage rather than eliminate the risk of failure to achieve business objectives and can only provide reasonable and not absolute assurance against material misstatement, errors, losses or fraud. The procedures also enable HSBC Holdings to discharge its obligations under the Handbook of Rules and Guidance issued by the FSA, HSBC’s lead regulator.
The key procedures that the Directors have established are designed to provide effective internal control within HSBC and accord with the Internal Control: Revised Guidance for Directors on the Combined Code on Corporate Governance issued by the Financial Reporting Council. Such procedures for the ongoing identification, evaluation and management of the significant risks faced by HSBC have been in place throughout the year and up to
28 February 2011, the date of approval of theAnnual Report and Accounts 2010. In the case of companies acquired during the year, the internal controls in place are being reviewed against HSBC’s benchmarks and integrated into HSBC’s processes.
Key internal control procedures include the following:
| • | | authority to operate the various subsidiaries and responsibilities for financial performance against plans and for capital expenditure are delegated to their respective chief executive officers within limits set by the Board. Delegation of authority from the Board to individuals requires those individuals to maintain a clear and appropriate apportionment of significant responsibilities and to oversee the establishment and maintenance of systems of control appropriate to the business. The appointment of executives to the most senior positions within HSBC requires the approval of the Board; |
| |
| • | | functional, operating, financial reporting and certain management reporting standards are established by GMO management committees, for application across the whole of HSBC. These are supplemented by operating standards set by functional and local management as required for the type of business and geographical location of each subsidiary; |
| |
| • | | systems and procedures are in place in HSBC to identify, control and report on the major risks including credit, market, liquidity and operational risk (including accounting, tax, legal, compliance, fiduciary, information, physical security, business continuity, fraud, systems and people risk). Exposure to these risks is monitored by risk management committees, asset and liability committees and executive committees in subsidiaries and, for HSBC as a whole, by the GMB. A Risk Management Meeting of the GMB, chaired by the Group Chief Risk Officer, is held in each month (except August) to address asset, liability and risk management issues. The minutes of this meeting are submitted to the GAC, the GRC and the Board; |
| |
| • | | the Global Operational Risk and Control Committee (‘GORCC’), which reports to the Risk Management Meeting of the GMB, meets at least quarterly to monitor HSBC’s operational risk profile and review the effective implementation of the Group’s operational risk management framework. The GORCC receives quarterly reports on the Group’s operational risk |
202
Report of the Directors: Governance(continued)
| | | profile, including top risks, control issues, internal and external operational loss events and key risk indicators. The GORCC communicates the lessons learned from operational events both within HSBC and in the wider industry; |
| |
| • | | a Disclosure Committee has been established to review material public disclosures made by HSBC Holdings for any material errors, misstatements or omissions. The membership of the Disclosure Committee, which is chaired by the Group Company Secretary, includes the heads of the Finance, Legal, Risk, Compliance, Corporate Communications, Investor Relations and Internal Audit functions and representatives from the principal regions, customer groups and global businesses. The integrity of disclosures is underpinned by structures and processes within the Finance and Risk functions that support expert and rigorous analytical review of financial reporting; |
| |
| • | | the group financial reporting process for preparing the consolidatedAnnual Report and Accounts 2010is controlled using documented accounting policies and reporting formats, supported by a chart of accounts with detailed instructions and guidance on reporting requirements, issued by Group Finance to all reporting entities within the Group in advance of each reporting period end. The submission of financial information from each reporting entity to Group Finance is subject to certification by the responsible financial officer, and analytical review procedures at reporting entity and Group levels; |
| |
| • | | processes are in place to identify new risks from changes in market conditions/practices or customer behaviours, which could expose HSBC to heightened risk of loss or reputational damage. During 2010, attention was focused on refinement and operation of the stress testing framework; the roll-out of enhanced counterparty risk aggregation, risk management information, portfolio and crisis management processes; the mitigation of information risks; enhancement of policies and practices relevant to the prevention of financial crimes; and changes in the regulation of and public policy towards the financial services industry. From January 2011, risk review and audit functions have increased their focus on global thematic risks; |
| |
| • | | periodic strategic plans are prepared for key customer groups, global product groups, support functions and certain geographies within the |
| | | framework of the Group Strategic Plan. Rolling operating plans, informed by detailed analysis of risk appetite describing the types and quantum of risk that HSBC is prepared to take in executing its strategy, are prepared and adopted by all major HSBC operating companies and set out the key business initiatives and the likely financial effects of those initiatives; |
| |
| • | | governance arrangements are in place to provide oversight of, and advice to the Board on, material risk-related matters including assurance that risk analytical models are fit for purpose, used accordingly and complemented by both model-specific and enterprise-wide stress tests that evaluate the impact of severe yet plausible events and other unusual circumstances not fully captured by quantitative models; |
| |
| • | | centralised functional control is exercised over all IT developments and operations. Common systems are employed for similar business processes wherever practicable. Credit and market risks are measured and reported on in subsidiaries and aggregated for review of risk concentrations on a Group-wide basis; |
| |
| • | | functional management in GMO is responsible for setting policies, procedures and standards for the following risks: credit; market; liquidity; operations; IT; fraud; business continuity; security; information; insurance; accounting; tax; legal; regulatory compliance; fiduciary; human resources; reputational; sustainability; residual value; shariah and strategic risks. |
| |
| | | Authorities to enter into credit and market risk exposures are delegated with limits to line management of Group companies. The concurrence of GMO is required, however, to credit proposals with specified higher risk characteristics; |
| |
| • | | policies to guide subsidiary companies and management at all levels in the conduct of business to safeguard the Group’s reputation are established by the Board and the GMB, subsidiary company boards, Board committees and senior management. Reputational risks can arise from environmental, social or governance issues, or as a consequence of operational risk events. As a banking group, HSBC’s good reputation depends upon the way in which it conducts its business but it can also be affected by the way in which clients, to which it provides financial services, conduct their business or use financial products and services; |
| |
| • | | the establishment and maintenance of appropriate systems of internal control is |
203
Report of the Directors: Governance(continued)
| | | primarily the responsibility of business management. The Internal Audit function, which is centrally controlled, monitors the effectiveness of internal control structures across the whole of HSBC focusing on the areas of greatest risk to HSBC as determined by a risk-based grading approach. The head of this function reports to the Group Chairman, the Group Chief Executive, the GRC and the GAC; and |
| |
| • | | executive management is responsible for ensuring that recommendations made by the Internal Audit function are implemented within an appropriate and agreed timetable. Confirmation to this effect must be provided to Internal Audit. Executive management must also confirm annually as part of the Internal Audit process that offices under their control have taken, or are in the process of taking, the appropriate actions to deal with all significant recommendations made by external auditors in management letters or by regulators following regulatory inspections. |
Historically the GAC has provided oversight of internal controls and risk as well as oversight of financial reporting. Currently there is a degree of overlap between the responsibilities of the GAC and the GRC in relation to internal controls and risk governance. Each committee is reviewing its terms of reference with the aim of minimising the overlap.
The GRC and the GAC have kept under review the effectiveness of this system of internal control and have reported regularly to the Board. The key processes used by the GRC and the GAC in carrying out their reviews include: regular business and operational risk assessments; regular reports from the heads of key risk functions including Internal Audit and Compliance; the production annually of reviews of the internal control framework applied at GMO and major operating subsidiary levels measured against HSBC benchmarks, which cover all internal controls, both financial and non-financial; semi-annual confirmations from chief executives of principal subsidiary companies as to whether there have been any material losses, contingencies or uncertainties caused by weaknesses in internal controls; internal audit reports; external audit reports; prudential reviews; and regulatory reports. The GRC and the GAC keep under review a risk map of the status of key risk areas which impact the Group and considers whether the mitigating actions put in place are appropriate. In addition, when unexpected losses have arisen or when incidents have occurred which indicate gaps in the control framework or in adherence to Group policies,
the GRC and the GAC review special reports, prepared at the instigation of management, which analyse the cause of the issue, the lessons learned and the actions proposed by management to address the issue.
The Directors, through the GRC and the GAC, have conducted an annual review of the effectiveness of HSBC’s system of internal control covering all material controls, including financial, operational and compliance controls and risk management systems and the adequacy of resources, qualifications and experience of staff of the issuer’s accounting and financial reporting function, and their training programmes and budget. The review does not extend to joint ventures or associates. The GRC and the GAC have received confirmation that executive management has taken or is taking the necessary actions to remedy any failings or weaknesses identified through the operation of HSBC’s framework of controls.
The Financial Statements are prepared on a going concern basis, as the Directors are satisfied that the Group and parent company have the resources to continue in business for the foreseeable future. In making this assessment, the Directors have considered a wide range of information relating to present and future conditions, including future projections of profitability, cash flows and capital resources. Further information relevant to the assessment is provided elsewhere in this Report. In particular, HSBC’s principal activities, strategic direction and challenges and uncertainties are described in the Operating and Financial Review; a financial summary, including a review of the consolidated income statement and consolidated balance sheet, is provided in the Operating and Financial Review and HSBC’s objectives, policies and processes for managing credit, liquidity and market risk, and its approach to capital management and allocation, are described in the Risk section.
Pursuant to the requirements of the UK Listing Rules and according to the register of Directors’ interests maintained by HSBC Holdings pursuant to section 352 of the Securities and Futures Ordinance of Hong Kong, the Directors of HSBC Holdings at 31 December 2010 had the following interests, all beneficial unless otherwise stated, in the shares and loan capital of HSBC Holdings and its associated corporations:
204
Report of the Directors: Governance(continued)
Directors’ interestsHSBC Holdings ordinary shares of US$0.50
| | | | | | | | | | | | | | | | | | | | | | | | | |
| | | | | | | At 31 December 2010 | |
| | | | | | | | | | | | | | | Jointly | | | | | | | | |
| | | At | | | | | | | Child | | | with | | | | | | | | |
| | | 1 January | | | Beneficial | | | under 18 | | | another | | | | | | | Total | |
| | | 2010 | | | owner | | | or spouse | | | person | | | Trustee | | | interests | 1 |
| | | | | | | | | | | | | | | | | | | | | | | | | |
| V H C Cheng | | | 466,165 | | | | 485,493 | | | | 189,072 | | | | – | | | | – | | | | 674,565 | |
| J D Coombe | | | 19,676 | | | | 20,341 | | | | – | | | | – | | | | – | | | | 20,341 | |
| R A Fairhead | | | 21,300 | | | | – | | | | – | | | | 21,300 | | | | – | | | | 21,300 | |
| D J Flint | | | 177,101 | | | | 144,915 | | | | – | | | | – | | | | 33,766 | 2 | | | 178,681 | |
| A A Flockhart | | | 269,008 | | | | – | | | | – | | | | – | | | | 230,112 | | | | 230,112 | |
| S T Gulliver | | | 2,731,057 | | | | 2,553,592 | | | | 177,485 | | | | – | | | | – | | | | 2,731,077 | |
| J W J Hughes-Hallett | | | 67,755 | | | | – | | | | – | | | | – | | | | 39,577 | 2 | | | 39,577 | |
| W S H Laidlaw | | | 30,948 | | | | 29,532 | | | | – | | | | – | | | | 1,416 | 2 | | | 30,948 | |
| I J Mackay | | | 34,217 | 3 | | | 34,217 | | | | – | | | | – | | | | – | | | | 34,217 | |
| G Morgan | | | 78,515 | | | | 81,166 | | | | – | | | | – | | | | – | | | | 81,166 | |
| Sir Simon Robertson | | | 140,093 | | | | 8,623 | | | | – | | | | – | | | | 167,750 | 2 | | | 176,373 | |
| J L Thornton | | | – | | | | – | | | | 10,250 | 4 | | | – | | | | – | | | | 10,250 | |
| Sir Brian Williamson | | | 36,378 | | | | 37,607 | | | | – | | | | – | | | | – | | | | 37,607 | |
| | |
| 1 | | Details of executive Directors’ other interests in HSBC Holdings ordinary shares of US$0.50 arising from the HSBC Holdings savings-related share option plans and the HSBC Share Plan are set out in the Directors’ Remuneration Report on pages 232 and 233. At 31 December 2010, the aggregate interests under the Securities and Futures Ordinance of Hong Kong in HSBC Holdings ordinary shares of US$0.50, including interests arising through employee share plans were: V H C Cheng – 1,546,752; D J Flint – 968,179; A A Flockhart – 1,231,453; S T Gulliver – 4,349,161 and I J Mackay – 289,250. Each Director’s total interests represents less than 0.02% of the shares in issue. |
| |
| 2 | | Non-beneficial. |
| |
| 3 | | Interest at 3 December 2010 – date of appointment. |
| |
| 4 | | Interest in listed American Depositary Shares, which are categorised as equity derivatives under Part XV of the Securities and Futures Ordinance of Hong Kong. |
As a director of HSBC France during 2010, S T Gulliver has an interest as beneficial owner in one share of €5 in that company (representing less than 0.01% of the shares in issue). He has waived his rights to receive dividends on this share and has undertaken to transfer it to HSBC on ceasing to be a director of HSBC France.
V H C Cheng has an interest as beneficial owner in RMB1,960,000 of retail bonds issued by HSBC Bank (China), which he held throughout the year.
No Directors held any short position as defined in the Securities and Futures Ordinance of Hong
Kong in the shares and loan capital of HSBC Holdings and its associated corporations. Save as stated above, none of the Directors had an interest in any shares or debentures of HSBC Holdings or any associated corporation at the beginning or at the end of the year, and none of the Directors or members of their immediate families were awarded or exercised any right to subscribe for any shares or debentures in any HSBC corporation during the year. Since the end of the year, the aggregate interests of the following Directors have increased by the number of HSBC Holdings ordinary shares shown against their names:
Increase in Directors’ interests since 31 December 2010HSBC Holdings ordinary shares of US$0.50
| | | | | | | | | | | | | |
| | | Beneficial | | | Child under | | | | |
| | | owner | | | 18 or spouse | | | Trustee | |
| | | | | | | | | | | | | |
| V H C Cheng | | | 10,384 | 1 | | | 1,446 | 1 | | | – | |
| J D Coombe | | | 156 | 1 | | | – | | | | – | |
| D J Flint | | | 6,074 | 2 | | | – | | | | 258 | 1 |
| A A Flockhart | | | 7,624 | 1 | | | – | | | | 1,759 | 1 |
| S T Gulliver | | | 12,376 | 1 | | | 4 | 1 | | | – | |
| J W J Hughes-Hallett | | | – | | | | – | | | | 3,742 | 3 |
| I J Mackay | | | 1,939 | 1 | | | – | | | | – | |
| G Morgan | | | 620 | 1 | | | – | | | | – | |
| Sir Simon Robertson | | | 65 | 1 | | | – | | | | – | |
| Sir Brian Williamson | | | 288 | 1 | | | – | | | | – | |
| | |
| 1 | | Scrip dividend. |
| |
| 2 | | Comprises scrip dividend, the automatic reinvestment of dividend income by an Individual Savings Account manager (38 shares), the acquisition of shares in the HSBC Holdings UK Share Incentive Plan through regular monthly contributions (18 shares) and the automatic reinvestment of dividend income on shares held in the plan (17 shares). |
| |
| 3 | | Non-beneficial. |
205
Report of the Directors: Governance(continued)
There have been no other changes in the share and loan capital interests of the Directors from 31 December 2010 to the date of this Report. Any subsequent changes up to the last practicable date before the publication of theNotice of Annual General Meetingwill be set out in the notes to that Notice.
At 31 December 2010, Directors and Senior Management (being members of the Group Management Board) held, in aggregate, beneficial interests in 13,152,010 HSBC Holdings ordinary shares (0.07% of the issued ordinary shares).
At 31 December 2010, executive Directors and Senior Management held, in aggregate, options to subscribe for 602,019 of HSBC Holdings ordinary shares under the HSBC Holdings savings-related share option plans, HSBC Holdings Group Share Option Plan and HSBC Finance: 1996 Long-Term Executive Incentive Compensation Plan. These options are exercisable between 2011 and 2015 at prices ranging from £3.3116 to £7.9606 and US$11.8824 to US$18.6226 per ordinary share.
Employees
At 31 December 2010, HSBC employed 307,000 full-time and part-time employees worldwide, compared with 302,000 at 31 December 2009 and 325,000 at 31 December 2008. The main centres of employment were the UK with approximately 52,000 employees, India 34,000, Hong Kong 30,000, the US 27,000, Brazil 24,000, Mexico 20,000, mainland China 16,000 and France 11,000.
Engaged employees are an important enabler of a high-performance culture. We encourage managers to foster open and honest communication and promote active employee involvement in decision making. Employment issues and the financial and economic factors affecting HSBC’s performance are regularly shared with our employees. An employee engagement target was included in the 2010 performance objectives of senior managers.
In 2010, we conducted our fourth Group-wide Global People Survey, which achieved a participation rate of 90%. The survey gives employees the opportunity to provide systematic feedback on their experience of HSBC and involvement in identifying actions to improve their experience. While employee engagement fell 3 percentage points from 71% in 2009 to 68% in 2010, this was 6 percentage points higher than the external global average and 3 percentage points above the financial services sector average.
Key themes emerging from the 2010 survey included the strength of our corporate sustainability effort; those who participate in corporate sustainability initiatives exhibit higher levels of engagement. The view that we have a diverse and fair culture has become stronger. Perceptions of organisational strategy and vision, reputation and Group Values all remain above global industry best in class. In 2011, we aim to improve personal development and strengthen relationships between employees and their direct managers by increasing employee involvement, recognising individual contribution and demonstrating specific behaviours which exemplify our Group Values.
Our approach to reward is meritocratic and market competitive, is underpinned by an ethical performance culture and aligns the interests of our employees and shareholders. See Employee share plans on page 207.
We negotiate with recognised unions. The five highest concentrations of union membership are in Argentina, Brazil, mainland China, Malta and Mexico. It is HSBC’s policy to maintain well-developed communications and consultation programmes with unions and there have been no material disruptions to our operations from labour disputes during the past five years.
Our deep roots in many geographical regions and an international mindset inform our perspective on diversity: ethnicity, age and gender diversity are areas of strategic focus. We remain committed to meritocracy, which requires a diverse and inclusive culture where employees believe that their views are heard, their concerns are attended to and they work in an environment where bias, discrimination and harassment are not tolerated and where advancement is based on objectivity. Our inclusive culture helps us to respond to our increasingly diverse global customer base, while creating and retaining a secure supply of skilled and committed employees.
In 2010, we increased executive management sponsorship and responsibility for the promotion of inclusive working practices. Oversight of related activities resides with the Group Diversity Committee, supported by local People / Diversity Committees.
The role of our Group Values in daily operating practice has taken on increased significance in the context of the global financial crisis with changes to regulatory policy, investor confidence and society’s view of the role of banks.
206
Report of the Directors: Governance(continued)
Our Group Values comprise being: open to different ideas and cultures; connected with our customers, community and each other; dependable and doing the right thing. We have strengthened our values-led culture by embedding our Group Values into the Group’s operating standards, training, development and employee induction, and through the personal sponsorship of senior executives. These initiatives will continue in 2011.
The development of talented employees in both developed and emerging markets is essential to the future strength of our business. We have therefore implemented a systematic approach to identifying and deploying talented people across the organisation in order to ensure an appropriate supply of high calibre individuals with the necessary skills, diversity and experience for current and future senior management positions.
In 2010, we improved both the quality of training and the access that all employees have to relevant programmes through globally consistent technology. Specific areas covered were risk, compliance, customer orientation and performance management.
Employment of disabled persons
We believe in providing equal opportunities for all employees. The employment of disabled persons is included in this commitment and the recruitment, training, career development and promotion of disabled persons is based on the aptitudes and abilities of the individual. Should employees become disabled during their employment with us, efforts are made to continue their employment and, if necessary, appropriate training is provided.
Remuneration policy
As the quality and commitment of its human capital is deemed fundamental to our success, the Board’s stated strategy is to attract, retain and motivate the very best people. This strategy is referenced to the overall business strategy and the commercial environment.
In a business that is based on trust and relationships, our broad policy is to recruit those who are committed to making a long-term career with the organisation since trust and relationships are built over time.
Remuneration is an important component in an individual’s decision about which organisation to join and to stay with but, in our experience, it is not the overriding one. We seek to attract people who wish to work for an organisation with strong and
sound values, one which is meritocratic and competitive, and which offers challenging career development. In line with the overall principles applied to executive Directors by the Remuneration Committee described on page 222:
| • | | employees’ salaries are reviewed annually in the context of business performance, market practice and internal relativities. Allowances and benefits are largely determined by local market practice; |
| |
| • | | employees participate in various variable pay arrangements. Discretionary variable pay is dependent on the achievement of objectives which derive from those determined at Group level. Since 2008, these objectives have typically been categorised in four segments – financial, customer, process and people. Financial and non-financial metrics are used to measure performance against the objectives, which include profitability, expense control, customer recommendation, employee engagement, adherence to our ethical standards, lending guidelines and internal controls and procedures. From 2010, we have used a risk appetite framework which describes the quantum and types of risks that we are prepared to take in executing our strategy. The risk appetite framework is approved by the Board of HSBC Holdings and helps to ensure effective risk management is emphasised to maintain a strong and secure operating platform, and that influences employee remuneration. Actual levels of variable pay depend on the performance of the Group, its constituent businesses and the individual, taking into account competitive market practice and relevant regulator requirements; and |
| |
| • | | to ensure that our interests and those of our employees are aligned with those of our shareholders, that our approach to risk management supports the interests of all stakeholders and that remuneration is consistent with effective risk management, we require a proportion of variable pay awards above certain thresholds to be deferred into awards of Restricted Shares. In addition, employees are encouraged to participate in our savings-related share option plans and local share ownership arrangements. |
Employee share plans
To help align the interests of employees with those of shareholders, share options are granted under all-employee share plans and discretionary awards of
207
Report of the Directors: Governance(continued)
Performance Shares and Restricted Shares are made under the HSBC Share Plan. The following are particulars of outstanding employee share options, including those held by employees working under employment contracts that are regarded as ‘continuous contracts’ for the purposes of the Hong Kong Employment Ordinance. The options were granted at nil consideration. No options have been granted to substantial shareholders, suppliers of goods or services, or in excess of the individual limit for each share plan. No options were cancelled by HSBC during the period. A summary for each scheme of the total number of the options which were awarded, exercised or lapsed during 2010 is shown in the tables below. Further details required to be disclosed pursuant to Chapter 17 of the Rules Governing the Listing of Securities on The Stock Exchange of Hong Kong Limited are available on our website at www.hsbc.com by selecting ‘Investor Relations’, then ‘Share Plans’, and on the website of The Stock Exchange of Hong Kong Limited at www.hkex.com.hk or can be obtained upon request from the Group Company Secretary, 8 Canada
Square, London E14 5HQ. Particulars of options held by Directors of HSBC Holdings are set out on page 232.
All-employee share option plans
All employees employed within the Group on the first working day of the year may be granted options to acquire HSBC Holdings ordinary shares under shareholder-approved all-employee share option plans. Options under the plans are usually exercisable after one, three or five years.
The exercise of the options may be advanced to an earlier date in certain circumstances, for example on retirement, and may be extended in certain circumstances, for example on the death of a participant, the executors may exercise the option up to six months beyond the normal exercise period. The middle market closing price per HSBC Holdings ordinary share quoted on the London Stock Exchange, as derived from the Daily Official List on 20 April 2010, the day before options were awarded in 2010, was £6.917.
HSBC Holdings Savings-Related Share Option Plan
HSBC Holdings ordinary shares of US$0.50
| | | | | | | | | | | | | | | | | | | | | | | | | | | | | | | | | | | | | | | | | |
| | | | | | | Exercise price | | | | | | | | | | | At | | | Awarded | | | Exercised | | | Lapsed | | | At | |
| Dates of award | | | (£) | | | Exercisable | | | 1 Jan | | | during | | | during | | | during | | | 31 Dec | |
| from | | to | | | from | | | to | | | from | | | to | | | 2010 | | | year | | | year | 1 | | year | | | 2010 | |
| | | | | | | | | | | | | | | | | | | | | | | | | | | | | | | | | | | | | | | | | |
| 21 Apr | | 21 Apr | | | | | | | | | | 1 Aug | | | 31 Jan | | | | | | | | | | | | | | | | | | | | | |
| 2004 | | | 2010 | | | | 3.3116 | | | | 6.6870 | | | | 2009 | | | | 2016 | | | | 76,566,328 | | | | 6,183,303 | | | | 4,536,734 | | | | 10,475,032 | | | | 67,737,865 | |
| |
| 1 The weighted average closing price of the shares immediately before the dates on which options were exercised was £6.57. |
| |
HSBC Holdings Savings-Related Share Option Plan: International
HSBC Holdings ordinary shares of US$0.50 |
| |
| | | | | | | | | | | | | | | | | | | | | | | At | | | Awarded | | | Exercised | | | Lapsed | | | At | |
| Dates of award | | | Exercise price | | | Exercisable | | | 1 Jan | | | during | | | during | | | during | | | 31 Dec | |
| from | | to | | | from | | | to | | | from | | | to | | | 2010 | | | year | | | year | 1 | | year | | | 2010 | |
| | | | | | | | | | | | | | | | | | | | | | | | | | | | | | | | | | | | | | | | | |
| 21 Apr | | 21 Apr | | | | (£) | | | | (£) | | | 1 Aug | | | 31 Jan | | | | | | | | | | | | | | | | | | | | | |
| 2004 | | | 2010 | | | | 3.3116 | | | | 6.6870 | | | | 2009 | | | | 2016 | | | | 29,664,282 | | | | 7,585,594 | | | | 5,260,044 | | | | 3,328,890 | | | | 28,660,942 | |
| | | | | | | | | | | | | | | | | | | | | | | | | | | | | | | | | | | | | | | | | |
| 26 Apr | | 21 Apr | | | (US$) | | | (US$) | | | 1 Aug | | | 31 Jan | | | | | | | | | | | | | | | | | | | | | |
| 2006 | | | 2010 | | | | 4.8876 | | | | 12.0958 | | | | 2009 | | | | 2016 | | | | 12,073,216 | | | | 2,535,387 | | | | 1,418,224 | | | | 2,290,964 | | | | 10,899,415 | |
| | | | | | | | | | | | | | | | | | | | | | | | | | | | | | | | | | | | | | | | | |
| 26 Apr | | 21 Apr | | | | (€) | | | | (€) | | | 1 Aug | | | 31 Jan | | | | | | | | | | | | | | | | | | | | | |
| 2006 | | | 2010 | | | | 3.6361 | | | | 9.5912 | | | | 2009 | | | | 2016 | | | | 3,283,710 | | | | 555,803 | | | | 356,578 | | | | 354,427 | | | | 3,128,508 | |
| | | | | | | | | | | | | | | | | | | | | | | | | | | | | | | | | | | | | | | | | |
| 26 Apr | | 21 Apr | | | (HK$) | | | (HK$) | | | 1 Aug | | | 31 Jan | | | | | | | | | | | | | | | | | | | | | |
| 2006 | | | 2010 | | | | 37.8797 | | | | 94.5057 | | | | 2009 | | | | 2016 | | | | 50,938,242 | | | | 5,157,129 | | | | 5,258,144 | | | | 3,408,335 | | | | 47,428,892 | |
| | |
| 1 The weighted average closing price of the shares immediately before the dates on which options were exercised was £6.50. |
Discretionary Share Plans
Discretionary share options were awarded under employee share plans until 2005. There have been no awards of discretionary options since 30 September 2005 save for an award by HSBC InvestDirect (India) Limited before it was acquired by HSBC as
set out below. The exercise period of the options awarded under discretionary share incentive plans may be advanced to an earlier date in certain circumstances, for example on the sale of a business. Note 9 on the Financial Statements gives details on share-based payments, including awards of Restricted Shares made in 2010.
208
Report of the Directors: Governance(continued)
HSBC Holdings Executive Share Option Scheme1
HSBC Holdings ordinary shares of US$0.50
| | | | | | | | | | | | | | | | | | | | | | | | | | | | | |
| | | Exercise | | | | | | | | | | | At | | | Exercised | | | Lapsed | | | At | |
| | | price | | | Exercisable | | 1 Jan | | | during | | | during | | | 31 Dec | |
| Date of award | | (£) | | | from | | | to | | | 2010 | | | year | 2 | | year | | | 2010 | |
| | | | | | | | | | | | | | | | | | | | | | | | | | | | | |
| 3 Apr 2000 | | | 6.5009 | | | 3 Apr 2003 | | 3 Apr 2010 | | | 6,706,848 | | | | 4,228,503 | | | | 2,478,345 | | | | – | |
| | |
| 1 | | The HSBC Holdings Executive Share Option Scheme expired on 26 May 2000. No options have been granted under the Scheme since that date. |
| |
| 2 | | The weighted average closing price of the shares immediately before the dates on which options were exercised was £6.85. |
HSBC Holdings Group Share Option Plan1
HSBC Holdings ordinary shares of US$0.50
| | | | | | | | | | | | | | | | | | | | | | | | | | | | | | | | | | | | | |
| | | | | | | Exercise price | | | | | | | | | | At | | | Exercised | | | Lapsed | | | At | |
| Dates of award | | (£) | | Exercisable | | 1 Jan | | | during | | | during | | | 31 Dec | |
| from | | to | | | from | | | to | | | from | | | to | | | 2010 | | | year | 2 | | year | | | 2010 | |
| | | | | | | | | | | | | | | | | | | | | | | | | | | | | | | | | | | | | |
| 4 Oct | | 20 Apr | | | | | | | | | | | 4 Oct | | | 20 Apr | | | | | | | | | | | | | | | | | |
| 2000 | | | 2005 | | | | 6.0216 | | | | 8.4024 | | | | 2003 | | | | 2015 | | | | 157,719,485 | | | | 1,015,349 | | | | 3,946,021 | | | | 152,758,115 | |
| | |
| 1 | | The HSBC Holdings Group Share Option Plan expired on 26 May 2005. No options have been granted under the Plan since that date. |
| |
| 2 | | The weighted average closing price of the shares immediately before the dates on which options were exercised was £6.80. |
HSBC Share Plan
HSBC Holdings ordinary shares of US$0.50
| | | | | | | | | | | | | | | | | | | | | | | | | | | | | |
| | | Exercise | | | | | | | | | | | At | | | Exercised | | | Lapsed | | | At | |
| | | price | | | Exercisable | | 1 Jan | | | during | | | during | | | 31 Dec | |
| Date of award | | (£) | | | from | | to | | 2010 | | | year | | | year | | | 2010 | |
| | | | | | | | | | | | | | | | | | | | | | | | | | | | | |
| 30 Sep 2005 | | | 7.9911 | | | 30 Sep 2008 | | 30 Sep 2015 | | | 86,046 | | | | – | | | | – | | | | 86,046 | |
Subsidiary company share plans
HSBC France and subsidiary company
When it was acquired in 2000, HSBC France and one of its subsidiary companies, HSBC Private Bank France, operated employee share option plans under
which options could be granted over their respective shares. No further options will be granted under either of these companies’ plans. The following are details of outstanding options to acquire shares in HSBC France and HSBC Private Bank France.
HSBC France
Shares of €5
| | | | | | | | | | | | | | | | | | | | | | | | | | | | | |
| | | Exercise | | | | | | | | | | | At | | | Exercised | | | Lapsed | | | At | |
| | | price | | | Exercisable | | 1 Jan | | | during | | | during | | | 31 Dec | |
| Date of award | | (€) | | | from | | to | | 2010 | | | year | | | year | | | 2010 | |
| | | | | | | | | | | | | | | | | | | | | | | | | | | | | |
| 12 Apr 2000 | | | 142.50 | | | 1 Jan 2002 | | 12 Apr 2010 | | | 604,250 | | | | – | | | | 604,250 | | | | – | |
HSBC Private Bank France
Shares of €2
| | | | | | | | | | | | | | | | | | | | | | | | | | | | | | | | | | | | | |
| | | | | | | Exercise price | | | | | | | | | | At | | | Exercised | | | Lapsed | | | At | |
| Dates of award | | (€) | | Exercisable | | 1 Jan | | | during | | | during | | | 31 Dec | |
| from | | to | | | from | | | to | | | from | | | to | | | 2010 | | | year | 1 | | year | | | 2010 | 1 |
| | | | | | | | | | | | | | | | | | | | | | | | | | | | | | | | | | | | | |
| 10 Mar | | 1 Oct | | | | | | | | | | | 27 Jun | | | 1 Oct | | | | | | | | | | | | | | | | | |
| 2000 | | | 2002 | | | | 12.44 | | | | 22.22 | | | | 2004 | | | | 2012 | | | | 291,520 | | | | 4,420 | | | | – | | | | 287,100 | |
| | |
| 1 | | Following exercise of the options, the HSBC Private Bank France shares will be exchanged for HSBC Holdings ordinary shares in the ratio of 2.099984 HSBC Holdings ordinary shares for each HSBC Private Bank France share. At 31 December 2010, The CCF Employee Benefit Trust 2001 held 989,502 HSBC Holdings ordinary shares which may be exchanged for HSBC Private Bank France shares arising from the exercise of these options. |
209
Report of the Directors: Governance(continued)
Following the acquisition of HSBC Finance in 2003, all outstanding options and equity-based awards over HSBC Finance common shares were converted into rights to receive HSBC Holdings ordinary shares in the same ratio as the share exchange offer for the acquisition of HSBC Finance (2.675 HSBC Holdings ordinary shares for each HSBC Finance common share) and the exercise prices per share were adjusted accordingly. No further options will be granted under the plans.
All outstanding options and other equity-based awards over HSBC Finance common shares granted
before 14 November 2002, being the date the transaction was announced, vested on completion of the acquisition. Options granted after 14 November 2002 are exercisable on their original terms, save that they were adjusted to reflect the exchange ratio.
The following are details of options to acquire shares in HSBC Holdings.
At 31 December 2010, the HSBC (Household) Employee Benefit Trust 2003 held 2,335,315 HSBC Holdings ordinary shares and 1,455 American Depositary Shares, each of which represents five HSBC Holdings ordinary shares, which may be used to satisfy the exercise of employee share options.
HSBC Finance: 1996 Long-Term Executive Incentive Compensation Plan
HSBC Holdings ordinary shares of US$0.50
| | | | | | | | | | | | | | | | | | | | | | | | | | | | | | | | | | | | | |
| | | | | | | Exercise price | | | | | | | | | | At | | | Exercised | | | Lapsed | | | At | |
| Dates of award | | (US$) | | Exercisable | | 1 Jan | | | during | | | during | | | 31 Dec | |
| from | | to | | | from | | | to | | | from | | | to | | | 2010 | | | year | 1 | | year | | | 2010 | |
| | | | | | | | | | | | | | | | | | | | | | | | | | | | | | | | | | | | | |
| 8 Feb | | 20 Nov | | | | | | | | | | | 8 Feb | | | 20 Nov | | | | | | | | | | | | | | | | | |
| 2000 | | | 2002 | | | | 9.29 | | | | 18.62 | | | | 2001 | | | | 2012 | | | | 18,105,959 | | | | 306,964 | | | | 6,681,169 | | | | 11,117,826 | |
| | |
| 1 | | The weighted average closing price of the shares immediately before the dates on which options were exercised was £6.44. |
Following the acquisition of HSBC Bank Bermuda in 2004, all outstanding options over HSBC Bank Bermuda shares were converted into rights to receive HSBC Holdings ordinary shares based on the consideration of US$40 for each HSBC Bank Bermuda share and the average closing price of HSBC Holdings ordinary shares, derived from the London Stock Exchange Daily Official List, for the five business days preceding the closing date of the
acquisition. No further options will be granted under any of these plans.
All outstanding options over HSBC Bank Bermuda shares vested on completion of the acquisition. The following are details of options to acquire shares in HSBC Holdings. At 31 December 2010, the HSBC (Bank of Bermuda) Employee Benefit Trust 2004 held 2,108,830 HSBC Holdings ordinary shares which may be used to satisfy the exercise of employee share options.
HSBC Bank Bermuda: Executive Share Option Plan 1997
HSBC Holdings ordinary shares of US$0.50
| | | | | | | | | | | | | | | | | | | | | | | | | | | | | | | | | | | | | |
| | | | | | | Exercise price | | | | | | | | | | At | | | Exercised | | | Lapsed | | | At | |
| Dates of award | | (US$) | | Exercisable | | 1 Jan | | | during | | | during | | | 31 Dec | |
| from | | to | | | from | | | to | | | from | | | to | | | 2010 | | | year | 1 | | year | | | 2010 | |
| | | | | | | | | | | | | | | | | | | | | | | | | | | | | | | | | | | | | |
| 4 Feb | | 11 Jan | | | | | | | | | | | 4 Feb | | | 11 Jan | | | | | | | | | | | | | | | | | |
| 2000 | | | 2001 | | | | 6.13 | | | | 12.44 | | | | 2001 | | | | 2011 | | | | 190,221 | | | | 4,781 | | | | 123,539 | | | | 61,901 | |
| | |
| 1 | | The weighted average closing price of the shares immediately before the dates on which options were exercised was £6.89. |
HSBC Bank Bermuda: Share Option Plan 2000
HSBC Holdings ordinary shares of US$0.50
| | | | | | | | | | | | | | | | | | | | | | | | | | | | | | | | | | | | | |
| | | | | | | Exercise price | | | | | | | | | | At | | | Exercised | | | Lapsed | | | At | |
| Dates of award | | (US$) | | Exercisable | | 1 Jan | | | during | | | during | | | 31 Dec | |
| from | | to | | | from | | | to | | | from | | | to | | | 2010 | | | year | | | year | | | 2010 | |
| | | | | | | | | | | | | | | | | | | | | | | | | | | | | | | | | | | | | |
| 11 Jan | | 21 Apr | | | | | | | | | | | 11 Jan | | | 21 Apr | | | | | | | | | | | | | | | | | |
| 2001 | | | 2003 | | | | 9.32 | | | | 15.99 | | | | 2002 | | | | 2013 | | | | 2,250,966 | | | | – | | | | – | | | | 2,250,966 | |
210
Report of the Directors: Governance(continued)
HSBC Bank Bermuda: Directors’ Share Option Plan
HSBC Holdings ordinary shares of US$0.50
| | | | | | | | | | | | | | | | | | | | | | | | | | | | | | | | | | | | | |
| | | | | | | Exercise price | | | | | | | | | | At | | | Exercised | | | Lapsed | | | At | |
| Dates of award | | (US$) | | Exercisable | | 1 Jan | | | during | | | during | | | 31 Dec | |
| from | | to | | | from | | | to | | | from | | | to | | | 2010 | | | year | | | year | | | 2010 | |
| | | | | | | | | | | | | | | | | | | | | | | | | | | | | | | | | | | | | |
| 28 Mar | | 30 Apr | | | | | | | | | | | 28 Mar | | | 30 Apr | | | | | | | | | | | | | | | | | |
| 2001 | | | 2003 | | | | 10.66 | | | | 13.95 | | | | 2002 | | | | 2013 | | | | 40,515 | | | | – | | | | 14,349 | | | | 26,166 | |
HSBC InvestDirect (India) Limited
When it was acquired in 2008, HSBC InvestDirect (India) Limited, formerly IL&FS Investsmart Limited, operated an employee share option plan. Under the plan, the options vested one year from the
date of grant in equal tranches over three years. The exercise period is a maximum of seven years from the date of vesting. Following the acquisition, all outstanding options vested on 18 November 2008. No further options will be granted under this plan.
HSBC InvestDirect (India) Limited: Employee Stock Option Scheme 2006
HSBC InvestDirect (India) ordinary shares of Rs10
| | | | | | | | | | | | | | | | | | | | | | | | | | | | | |
| | | Exercise | | | | | | | | | | | At | | | Exercised | | | Lapsed | | | At | |
| | | price | | | Exercisable | | 1 Jan | | | during | | | during | | | 31 Dec | |
| Date of award | | (Rs) | | | from | | to | | 2010 | | | year | 1 | | year | | | 2010 | |
| | | | | | | | | | | | | | | | | | | | | | | | | | | | | |
| 19 Nov 2007 | | | 180 | | | 18 Nov 2002 | | 17 Nov 2015 | | | 873,000 | | | | 873,000 | | | | – | | | | – | |
| | |
| 1 | | The weighted average closing price of the shares, as quoted on the Bombay Stock Exchange Limited and the National Stock Exchange of India Limited, immediately before the dates on which options were exercised was Rs298.76 and Rs297.73 respectively for those shares exercised before trading in the shares ceased on 8 July 2010. The Company was delisted from the Bombay Stock Exchange Limited and the National Stock Exchange of India Limited on 15 July 2010. |
Employee compensation and benefits
Note 7 on the Financial Statements gives details about employee compensation and benefits including pension plans.
Set out below is information in respect of the five individuals (including two Directors of HSBC Holdings) whose emoluments were the highest in HSBC for the year ended 31 December 2010.
Emoluments of 5 highest paid employees
| | | | | |
| | | £000 | |
| | | | | |
| Basic salaries, allowances and benefits in kind | | | 3,874 | |
| Pension contributions | | | 807 | |
| Bonuses paid or receivable | | | 29,339 | |
| Inducements to join paid or receivable | | | 288 | |
| Compensation for loss of office | | | – | |
| | | |
| | | | | |
| Total | | | 34,308 | |
| | | |
| | | | | |
| Total (US$000) | | | 52,983 | |
| | | |
Their emoluments were within the following bands:
| | | | | |
| | | Number of | |
| | | employees | |
| | | | | |
| £6,300,001 – £6,400,000 | | | 3 | |
| £6,800,001 – £6,900,000 | | | 1 | |
| £8,400,001 – £8,500,000 | | | 1 | |
In accordance with the agreement made between the major UK banks and the UK Government on 9 February 2011 (Project Merlin), set out below is information in respect of the five highest paid senior executives (who are members of the GMB, but not Directors of HSBC Holdings plc) for the year ended 31 December 2010.
211
Report of the Directors: Governance(continued)
Emoluments of 5 highest paid senior executives
| | | | | | | | | | | | | | | | | | | | | |
| | | Employee |
| | | 1 | | | 2 | | | 3 | | | 4 | | | 5 | |
| | | £000 | | | £000 | | | £000 | | | £000 | | | £000 | |
| | | | | | | | | | | | | | | | | | | | | |
Fixed | | | | | | | | | | | | | | | | | | | | |
| Cash based | | | 283 | | | | 623 | | | | 421 | | | | 400 | | | | 467 | |
| | | | | | | | | | | |
| | | | | | | | | | | | | | | | | | | | | |
| Total fixed | | | 283 | | | | 623 | | | | 421 | | | | 400 | | | | 467 | |
| | | | | | | | | | | |
| | | | | | | | | | | | | | | | | | | | | |
Variable1 | | | | | | | | | | | | | | | | | | | | |
| Cash | | | 493 | | | | 393 | | | | 404 | | | | 406 | | | | 337 | |
Non-deferred shares2 | | | 493 | | | | 393 | | | | 404 | | | | 406 | | | | 337 | |
| Deferred cash | | | 740 | | | | 590 | | | | 605 | | | | 608 | | | | 505 | |
| Deferred shares | | | 740 | | | | 590 | | | | 605 | | | | 608 | | | | 505 | |
| | | | | | | | | | | |
| | | | | | | | | | | | | | | | | | | | | |
| Total variable pay | | | 2,467 | | | | 1,967 | | | | 2,018 | | | | 2,028 | | | | 1,683 | |
| | | | | | | | | | | |
| | | | | | | | | | | | | | | | | | | | | |
| Total remuneration | | | 2,750 | | | | 2,590 | | | | 2,439 | | | | 2,428 | | | | 2,150 | |
| | | | | | | | | | | |
| | | | | | | | | | | | | | | | | | | | | |
| | | | US$000 | | | | US$000 | | | | US$000 | | | | US$000 | | | | US$000 | |
| | | | | | | | | | | | | | | | | | | | | |
| Total remuneration | | | 4,247 | | | | 4,000 | | | | 3,767 | | | | 3,750 | | | | 3,320 | |
| | | | | | | | | | | |
| | |
| 1 | | Variable pay in respect of performance year 2010. |
| |
| 2 | | Vested shares, subject to a 6-month retention period. |
The aggregate remuneration of Directors and Senior Management (being members of the Group Management Board) for the year ended 31 December 2010 was US$67,760,722.
The aggregate amount set aside or accrued to provide pension, retirement or similar benefits for Directors and Senior Management for the year ended 31 December 2010 was US$3,348,298.
Executive Directors and members of Senior Management are generally subject to notice periods of up to 12 months and a normal retirement age of 65.
Bank payroll tax
In December 2009, the governments of the UK and France introduced one-off taxes in respect of certain bonuses payable by banks and banking groups. In both countries the tax was levied at 50% on bonuses awarded during a certain period and over a threshold amount. The taxes are liabilities of the employer and are payable on awards of both cash and shares. The amount payable and paid in respect of the relevant tax was US$282m in the UK and US$42m in France.
Corporate sustainability
Corporate sustainability
At HSBC, we recognise that environmental, social and economic issues can affect the Group’s long-term success as a business. For us, corporate sustainability means achieving sustainable profit growth so that we can continue to reward shareholders and employees, build long-lasting relationships with customers and suppliers, pay taxes
and duties in those countries where we operate, and invest in communities for future growth.
Our continuing financial success depends, in part, on our ability to identify and address certain factors which present risks or opportunities for the business. These can affect our reputation, drive employee engagement, help manage the risks of lending, leverage savings through eco-efficiency and secure new revenue streams. They generally fall into one or more of the four broad areas discussed below.
Business finance
We aim to build long-term customer relationships around the world through the provision of a consistent and high-quality service and customer experience. We use the benefits of our scale, financial strength, geographical reach and strong brand value to achieve this.
We aim to take advantage of the opportunities and manage the risks presented by emerging global trends by leading the development of sustainable business models to address them. We understand that the world is changing, with significant examples being increased longevity, a widening gap in the relative growth rates of emerging and mature economies and the need to move to a lower-carbon economy in order to mitigate some of the effects of climate change. Over the long term, we anticipate playing a leading role in shaping the market response to these challenges and we are among those financial institutions identifying how business can adapt in ways that bring both social and environmental benefits, while providing viable economic returns.
212
Report of the Directors: Governance(continued)
Operational environmental management
We focus our environmental initiatives primarily on addressing and responding to issues associated with climate change, including energy use, water and waste management. Climate change has the potential to materially affect our customers and, by extension, our long-term success, introducing new risks to business activity. However, it also has the potential to stimulate a new era of low carbon growth, innovation and development. In 2010, we continued to deepen our understanding of the likely effects that climate change and the responses to it will have upon our business and those of our customers. For example, the HSBC Climate Vulnerability Assessment, which maps risks for the G20 in 2020, indicates the impact of climate change on food production, water availability and health. An understanding of the scale of the issues helps the Group – and our customers – to focus on how best to respond.
Community investment
We have a long-standing commitment to the communities in which we operate. Many of our key markets are emerging economies. Our operations bring benefits to our host countries through tax contributions, and to local people and businesses through employment, training, purchasing and investment. Beyond our core business, we aim to encourage social and economic opportunity through community investment activities.
Our focus is on education and the environment because we believe they are essential building blocks for the development of communities and are prerequisites for economic growth. Global education programmes such as Future First, JA More Than MoneyTM and Eco-Schools focus on helping disadvantaged children, promoting financial literacy and environmental education and understanding. Our flagship environmental programme is the HSBC Climate Partnership, a US$100m commitment to working with The Climate Group, Earthwatch, Smithsonian Tropical Research Institute and WWF on tackling climate change.
In 2010, we donated a total of US$108m to community investment projects (2009: US$100m).
Employee issues
‘Employee engagement’ describes employees’ emotional and intellectual commitment to their organisation and its success and is critical to the long-term ability of the Group to deliver the highest quality of financial services. Our annual Global People Survey shows that employees value our
commitment to sustainable business practices and view us as being a leader in this regard. In 2010, 81% of colleagues said they were satisfied with the actions HSBC is taking to embed sustainability (e.g. environmental and social issues) into the way we run our business.
Sustainability governance
The Corporate Sustainability Committee, a committee of the Board, is responsible for advising the Board, committees of the Board and executive management on corporate sustainability policies, including environmental, social and ethical issues.
The terms of reference of the Corporate Sustainability Committee, which are reviewed annually, are available at www.hsbc.com/boardcommittees.
The members of the Committee during 2010 were N R N Murthy, a non-executive Director (appointed Chairman on 28 May 2010), V H C Cheng, an executive Director (appointed 28 May 2010), W K L Fung (retired 28 May 2010), Sir Mark Moody-Stuart (retired 28 May 2010) and G V I Davis, Lord May and Dame Mary Marsh, who are non-director members of the Committee. The Corporate Sustainability Committee held five meetings in 2010. The table on page 190 gives details of Directors’ attendance at these meetings. Following each meeting, the Committee reports to the Board on its activities.
We report on progress in developing and implementing our sustainability strategy annually in the HSBC Sustainability Report, which is independently verified and prepared using the Global Reporting Initiative. PricewaterhouseCoopers verified the Group’s commitment to carbon neutrality and adherence to the Equator Principles. TheHSBC Sustainability Report 2010will be issued on 27 May 2011 and will be available at www.hsbc.com/sustainability.
We have a Corporate Sustainability department within the Group Management Office and in each of our major regions and countries of operation. At an operational level, implementation of our sustainability policies is managed primarily by Group Corporate Sustainability, Group Human Resources, Group Risk and Group Compliance.
Our approach to managing sustainability risk is detailed on page 173.
213
Report of the Directors: Governance(continued)
Health and safety
The maintenance of appropriate health and safety standards remains a key responsibility of all managers and we are committed to proactively managing all health and safety risks associated with our business. Our objectives are to identify, remove, reduce or control material risks of fires and of accidents or injuries to employees and visitors.
Group standards, instructions and related policies and procedures are set by Group Corporate Real Estate. Implementation in-country is coordinated through Health, Safety and Fire Co-ordinators based in each country in which we operate. They may call upon regional and Group resources by way of support at any time.
Group Security provides regular risk assessments in areas of increased risk to assist management in judging the level of terrorist threat. Regional security functions conduct regular security reviews to ensure measures to protect our staff, buildings, assets and information are appropriate for the level of threat. We remain committed to maintaining our preparedness and to ensuring the highest standards of health and safety wherever in the world we operate.
Supplier payment policy
We do not currently subscribe to any code or standard on payment practice. Our policy is to settle terms of payment with suppliers when agreeing the terms of each transaction, to ensure that those suppliers are made aware of the terms of payment, and to abide by the terms of payment.
It is our practice to organise payment to our suppliers through a central accounts payable function operated by our subsidiary, HSBC Bank. Included in the balance with HSBC Bank is the amount due to trade creditors which, at 31 December 2010, represented 27 days’ average daily purchases of goods and services received from such creditors, calculated in accordance with the Companies Act 2006, as amended by Statutory Instrument 2008 No. 410.
Share capital
Share capital
Issued share capital
The nominal value of our issued share capital paid up at 31 December 2010 was US$8,843,092,451 divided into 17,686,155,902 ordinary shares of US$0.50 each, 1,450,000 non-cumulative preference shares of US$0.01 each and 1 non-cumulative preference share of £0.01.
The percentage of the nominal value of our total issued share capital paid up at 31 December 2010 represented by the ordinary shares of US$0.50 each, non-cumulative preference shares of US$0.01 each and the non-cumulative preference share of £0.01 was approximately 99.9998, 0.0002, and 0%, respectively.
Rights and obligations attaching to shares
The rights and obligations attaching to each class of shares in our share capital are set out in our Articles of Association subject to certain rights and obligations that attach to each class of preference share as determined by the Board prior to allotment of the relevant preference shares. Set out below is a summary of the rights and obligations attaching to each class of shares with respect to voting, dividends, capital and, in the case of the preference shares, redemption.
To be registered, a transfer of shares must be in relation to shares which are fully paid up and on which we have no lien and to one class of shares denominated in the same currency. The transfer must be in favour of a single transferee or no more than four joint transferees and it must be duly stamped (if required). The transfer must be delivered to our registered office or our Registrars accompanied by the certificate to which it relates or such other evidence that proves the title of the transferor.
If a shareholder or any person appearing to be interested in our shares has been sent a notice under section 793 of the Companies Act 2006 (which confers upon public companies the power to require information from any person whom we know or have reasonable cause to believe to be interested in the shares) and has failed in relation to any shares (the ‘default shares’) to supply the information requested within the period set out in the notice, then the member, unless the Board otherwise determines, is not entitled to be present at or to vote the default shares at any general meeting or to exercise any other right conferred by being a shareholder. If the default shares represent at least 0.25% in nominal value of the issued shares of that class, unless the Board otherwise determines, any dividend shall be withheld by the Company without interest, no election may be made for any scrip dividend alternative, and no transfer of any shares held by the member will be registered except in limited circumstances.
Ordinary shares
Subject to the Companies Act 2006 and the Articles of Association, we may, by ordinary resolution,
214
Report of the Directors: Governance(continued)
declare dividends to be paid to the holders of ordinary shares, though no dividend shall exceed the amount recommended by the Board. The Board may pay interim dividends as appears to the Board to be justified by the profits available for distribution. All dividends shall be apportioned and paid proportionately to the percentage of the nominal amount paid up on the shares during any portion or portions of the period in respect of which the dividend is paid, but if any share is issued on terms providing that it shall rank for dividend as from a particular date, it shall rank for dividend accordingly. Subject to the Articles of Association, the Board may, with the prior authority of an ordinary resolution passed by the shareholders and subject to such terms and conditions as the Board may determine, offer to any holders of ordinary shares the right to elect to receive ordinary shares of the same or a different currency, credited as fully paid, instead of cash in any currency in respect of the whole (or some part, to be determined by the Board) of any dividend specified by the ordinary resolution. At the 2007 Annual General Meeting shareholders gave authority to the Directors to determine to offer a scrip dividend alternative until the conclusion of the Annual General Meeting in 2012.
Preference shares
There are three classes of preference shares in the share capital of HSBC Holdings, non-cumulative preference shares of US$0.01 each (the ‘Dollar Preference Shares’), non-cumulative preference shares of £0.01 each (the ‘Sterling Preference Shares’) and non-cumulative preference shares of €0.01 (the ‘Euro Preference Shares’). The Dollar Preference Shares in issue are Series A Dollar Preference Shares and the Sterling Preference Share in issue is a Series A Sterling Preference Share. There are no Euro Preference Shares in issue.
Dollar Preference Shares
Holders of the Dollar Preference Shares are only entitled to attend and vote at general meetings if any dividend payable on the relevant preference shares in respect of such period as the Board shall determine prior to allotment thereof is not paid in full or in such other circumstances, and upon and subject to such terms, as the Board may determine prior to allotment of the relevant preference shares. In the case of the Dollar Preference Shares in issue at 28 February 2011 the relevant period determined by the Board is four consecutive dividend payment dates. Whenever holders of the Dollar Preference Shares are entitled
to vote on a resolution at a general meeting, on a show of hands every such holder who is present in person or by proxy shall have one vote and on a poll every such holder who is present in person or by proxy shall have one vote per preference share held by him or her or such number of votes per share as the Board shall determine prior to allotment of such share.
Subject to the Articles of Association, holders of the Dollar Preference Shares have the right to a non-cumulative preferential dividend at such rate, on such dates and on such other terms and conditions as may be determined by the Board prior to allotment thereof in priority to the payment of any dividend to the holders of ordinary shares and any other class of shares of HSBC Holdings in issue (other than (i) the other preference shares in issue and any other shares expressed to rankpari passutherewith as regards income; and (ii) any shares which by their terms rank in priority to the relevant preference shares as regards income). A dividend of US$62.00 per annum is payable on each Dollar Preference Share in issue at 28 February 2011. The dividend is paid at the rate of US$15.50 per quarter at the sole and absolute discretion of the Board.
A dividend will not be declared or paid on the Dollar Preference Shares if payment of the dividend would cause HSBC Holdings not to meet the applicable capital adequacy requirements of the FSA or the profit of HSBC Holdings available for distribution as dividends is not sufficient to enable HSBC Holdings to pay in full both dividends on the relevant preference shares and dividends on any other shares that are scheduled to be paid on the same date and that have an equal right to dividends. Dividends will not be declared or paid on any class of shares of HSBC Holdings ranking lower in the right to dividends than the Dollar Preference Shares nor redeem nor purchase in any manner any of its other shares ranking equal with or lower than the Dollar Preference Shares unless it has paid in full, or set aside an amount to provide for payment in full, the dividends on the Dollar Preference Shares for the then-current dividend period.
The Dollar Preference Shares carry no rights to participate in the profits or assets of HSBC Holdings other than as set out in the Articles of Association and subject to the Companies Act 2006, do not confer any right to participate in any offer or invitation by way of rights or otherwise to subscribe for additional shares in HSBC Holdings, do not confer any right of conversion and do not confer any right to participate in any issue of bonus shares or shares issued by way of capitalisation of reserves.
215
Report of the Directors: Governance(continued)
Subject to the relevant insolvency laws and the Articles of Association of HSBC Holdings, holders of the Dollar Preference Shares have the right in a winding up of HSBC Holdings to receive out of the assets of HSBC Holdings available for distribution to its shareholders, in priority to any payment to the holders of the ordinary shares and any other class of shares of HSBC Holdings in issue (other than (i) the other relevant preference shares and any other shares expressed to rankpari passutherewith as regards repayment of capital; and (ii) any shares which by their terms rank in priority to the relevant preference shares as regards repayment of capital), a sum equal to any unpaid dividend on the Dollar Preference Shares which is payable as a dividend in accordance with or pursuant to the Articles of Association and the amount paid up or credited as paid up on the Dollar Preference Shares together with such premium (if any) as may be determined by the Board prior to allotment thereof. In the case of the Dollar Preference Shares in issue at 28 February 2011, the premium is US$9,999.99 per Dollar Preference Share.
The Dollar Preference Shares may be redeemed in accordance with the Articles of Association and the terms on which Dollar Preference Shares were issued and allotted. In the case of the Dollar Preference Shares in issue at 28 February 2011, HSBC Holdings may redeem such shares in whole at any time on or after 16 December 2010, subject to prior notification to the FSA.
Sterling Preference Shares
The Sterling Preference Shares carry the same rights and obligations under the Articles of Association as the Dollar Preference Shares, save in respect of certain rights and obligations that attach to Sterling Preference Shares to be determined by the Board prior to allotment of the relevant preference shares and the timing and payment of proceeds from the redemption of each class of share. The one Sterling Preference Share in issue at 28 February 2011 carries the same rights and obligations as the Dollar Preference Shares in issue at 28 February 2011 to the extent described in the section above save as follows:
| 1. | | the holder of the Sterling Preference Share is not entitled to attend or vote at general meetings; |
| |
| 2. | | the Sterling Preference Share may be redeemed in whole on any date as may be determined by the Board; and |
| 3. | | the exceptions to the circumstances in which a dividend will not be declared or paid do not apply. |
A dividend of £0.04 per annum is payable on the Sterling Preference Share in issue at 28 February 2011. The dividend is paid at the rate of £0.01 per quarter at the sole and absolute discretion of the Board.
Euro Preference Shares
The Euro Preference Shares carry the same rights and obligations under the Articles of Association as the Dollar Preference Shares, save in respect of certain rights and obligations that attach to Euro Preference Shares which are to be determined by the Board prior to allotment of the relevant preference shares and the timing and payment of proceeds from the redemption of each class of share.
Share capital during 2010
The following events occurred during the year in relation to the ordinary share capital of HSBC Holdings:
| 1. | | 13,135,446 ordinary shares were issued at par in January 2010 to shareholders who elected to receive new shares in lieu of the third interim dividend for 2009. The market value per share used to calculate shareholders’ entitlements to new shares was US$12.2112, being the US dollar equivalent of £7.3900. |
| |
| 2. | | 81,996,589 ordinary shares were issued at par in May 2010 to shareholders who elected to receive new shares in lieu of the fourth interim dividend for 2009. The market value per share used to calculate shareholders’ entitlements to new shares was US$10.2149, being the US dollar equivalent of £6.8154. |
| |
| 3. | | 83,004,992 ordinary shares were issued at par in July 2010 to shareholders who elected to receive new shares in lieu of the first interim dividend for 2010. The market value per share used to calculate shareholders’ entitlements to new shares was US$8.9918, being the US dollar equivalent of £6.2990. |
| |
| 4. | | 74,810,373 ordinary shares were issued at par in October 2010 to shareholders who elected to receive new shares in lieu of the second interim dividend for 2010. The market value per share used to calculate shareholders’ entitlements to new shares was US$9.8237, being the US dollar equivalent of £6.3832. |
216
Report of the Directors: Governance(continued)
| 5. | | In connection with the exercise of options under the HSBC Holdings savings-related share option plans: 9,796,778 ordinary shares were issued at prices ranging from £3.3116 to £6.6870 per share; 5,258,144 ordinary shares were issued at prices ranging from HK$37,8797 to HK$94.5057 per share; 1,418,224 ordinary shares were issued at prices ranging from US$4.8876 to US$12.0958 per share; and 356,578 ordinary shares were issued at prices ranging from €3.6361 to €9.5912 per share. Options over 19,857,648 ordinary shares lapsed. |
| |
| 6. | | 2,928,158 ordinary shares were issued at €6.1884 per share in connection with a Plan d’Epargne Entreprise for the benefit of non-UK resident employees of HSBC France and its subsidiaries. |
| |
| 7. | | Options over 22,017,216 ordinary shares were granted at nil consideration under the HSBC Holdings savings-related share option plans on 21 April 2010 in response to applications from approximately 44,500 applications received from HSBC employees resident in over 75 countries and territories. |
Discretionary share incentive plans
| 8. | | 4,228,503 ordinary shares were issued at a price of £6.5009 per share in connection with the exercise of options under the HSBC Holdings Executive Share Option Scheme. Options over 2,478,345 ordinary shares lapsed. |
| |
| 9. | | 1,015,349 ordinary shares were issued at prices ranging from £6.0216 to £7.3244 per share in connection with the exercise of options under the HSBC Holdings Group Share Option Plan. Options over 3,946,021 ordinary shares lapsed. |
| |
| 10. | | No options were exercised under and no ordinary shares were issued in connection with the HSBC Share Plan. No options over ordinary shares lapsed. |
Cancellation of Deferred Shares and issue of one Series A Sterling Preference Share
| 11. | | HSBC Holdings acquired and cancelled its 301,500 non-voting deferred shares of £1 each as part of a technical capital reorganisation necessitated by the amended EU Capital Requirements Directive 2. To facilitate the cancellation of the deferred shares and comply with the provisions of the Companies (Authorised Minimum) Regulations 2009, |
| | | HSBC Holdings issued one Sterling Preference Share of £0.01 to Tooley Street View Limited for £1.00 on 29 December 2010. |
Authority to allot shares
| 12. | | At the Annual General Meeting in 2010, shareholders renewed the general authority for the Directors to allot new shares. The general authority is to allot up to 3,484,638,000 ordinary shares, 10,000,000 non-cumulative preference shares of £0.01 each, 8,550,000 non-cumulative preference shares of US$0.01 each and 10,000,000 non-cumulative preference shares of €0.01 each. Within this, the Directors have authority to allot up to a maximum of 871,159,500 ordinary shares wholly for cash to persons other than existing shareholders. |
Other than as described above, the Directors did not allot any shares during 2010.
In accordance with the terms of a waiver granted by the Hong Kong Stock Exchange on 19 December 2005, HSBC Holdings will comply with the applicable law and regulation in the UK in relation to the holding of any shares in treasury and with the conditions of the waiver in connection with any shares it may hold in treasury. No shares are currently held in treasury.
Dividends, shareholders and meetings
Dividends, shareholders and meetings
First, second and third interim dividends for 2010, each of US$0.08 per ordinary share, were paid on 7 July 2010, 6 October 2010 and 12 January 2011 respectively. Note 11 on the Financial Statements gives more information on the dividends declared in 2010. On 28 February 2011, the Directors declared a fourth interim dividend for 2010 of US$0.12 per ordinary share in lieu of a final dividend, which will be payable on 5 May 2011 in cash in US dollars, or in sterling or Hong Kong dollars at exchange rates to be determined on 27 April 2011, with a scrip dividend alternative. As the fourth interim dividend for 2010 was declared after 31 December 2010 it has not been included in the balance sheet of HSBC as a debt. The reserves available for distribution at 31 December 2010 were US$36,013m.
A quarterly dividend of US$15.50 per 6.20% non-cumulative US Dollar Preference Share, Series A (‘Series A Dollar Preference Share’), (equivalent
217
Report of the Directors: Governance(continued)
to a dividend of US$0.3875 per Series A American Depositary Share, each of which represents one-fortieth of a Series A Dollar Preference Share), was paid on 15 March, 15 June, 15 September and 15 December 2010.
The proposed timetable for interim dividends in respect of 2011 on the ordinary shares of US$0.50 is set out in the Shareholder Information section on page 371.
Quarterly dividends of US$15.50 per Series A Dollar Preference Share (equivalent to a dividend of US$0.3875 per Series A American Depositary Share, each of which represents one-fortieth of a Series A Dollar Preference Share) and £0.01 per Series A Sterling Preference Share were declared on 8 February 2011 for payment on 15 March 2011.
Communication with shareholders
Communication with shareholders is given high priority. Extensive information about our activities is provided in theAnnual Report and Accounts, Annual Reviewand theInterim Reportto shareholders which are available on www.hsbc.com. There is regular dialogue with institutional investors and enquiries from individuals on matters relating to their shareholdings and our business are welcomed and are dealt with in an informative and timely manner. All shareholders are encouraged to attend the Annual General Meeting or the informal meeting of shareholders held in Hong Kong to discuss our progress.
Notifiable interests in share capital
At 31 December 2010, we had received the following disclosures (which have not been subsequently amended or withdrawn) of major holdings of voting rights pursuant to the requirements of the FSA Disclosure and Transparency Rule 5:
| • | | Legal & General Group Plc gave notice on 3 March 2010 that it had a direct interest on 2 March 2010 in 696,986,631 HSBC Holdings ordinary shares, representing 4% of the total voting rights at that date and gave notice on 9 March 2010 that on 8 March 2010 its holding of HSBC ordinary shares fell to 3.99% of the total voting rights at that date. |
| |
| • | | BlackRock, Inc. gave notice on 9 December 2009 that it had a direct interest on 7 December 2009 in 1,143,379,437 HSBC Holdings ordinary shares, representing 6.57% of the total voting rights at that date. |
As at 31 December 2010, according to the register maintained by HSBC Holdings pursuant to section 336 of the Securities and Futures Ordinance of Hong Kong:
| • | | JPMorgan Chase & Co. gave notice on 29 November 2010 that on 23 November 2010 it had the following interests in HSBC Holdings ordinary shares: a long position of 1,200,117,042 ordinary shares, a short position of 71,496,203 ordinary shares and a lending pool of 826,263,258 ordinary shares, each representing 6.79%, 0.40% and 4.67% respectively of the ordinary shares in issue at that date. Since 31 December 2010, JPMorgan Chase & Co gave notice on 15 February 2011 that on 8 February 2011 it had a long position of 1,250,550,419 ordinary shares, a short position of 58,458,752 ordinary shares and a lending pool of 880,975,655 ordinary shares, each representing 7.06%, 0.33% and 4.98% respectively of the ordinary shares in issue at that date. |
| |
| • | | BlackRock, Inc. gave notice on 2 December 2010 that on 26 November 2010 it had the following interests in HSBC Holdings ordinary shares: a long position of 1,060,061,018 ordinary shares and a short position of 12,888,242 ordinary shares, each representing 5.99% and 0.01% respectively of the ordinary shares in issue at that date. Since 31 December 2010, Blackrock, Inc. gave notice on 21 January 2011 that on 17 January 2011 it had a long position of 1,057,501,184 ordinary shares and a short position of 11,749,901 ordinary shares, representing 5.97% and 0.07% respectively of the ordinary shares in issue at that date. |
In compliance with the Rules Governing the Listing of Securities on The Stock Exchange of Hong Kong Limited at least 25% of the total issued share capital has been held by the public at all times during 2010 and up to the date of this Report.
Dealings in HSBC Holdings shares
Except for dealings as intermediaries by HSBC Bank, HSBC Financial Products (France) and The Hongkong and Shanghai Banking Corporation, which are members of a European Economic Area exchange, neither we nor any of our subsidiaries has purchased, sold or redeemed any of our listed securities during the year ended 31 December 2010.
218
Report of the Directors: Governance(continued)
Our Annual General Meeting will be held at the Barbican Hall, Barbican Centre, London EC2 on 27 May 2011 at 11.00am.
An informal meeting of shareholders will be held at 1 Queen’s Road Central, Hong Kong on Thursday 19 May 2011 at 4.30pm.
Resolutions to receive theAnnual Report and Accounts, approve the Directors’ Remuneration Report, re-elect Directors and reappoint KPMG Audit Plc as Auditor will be submitted to the Annual General Meeting. KPMG Audit Plc has expressed its willingness to continue in office and the Group Audit Committee and the Board has recommended that KPMG Audit Plc be reappointed. Resolutions will also be submitted to the Annual General Meeting to renew the authorities for the allotment of shares and the disapplication of pre-emption rights and seek approval to increase the fees payable to non-executive Directors; and approve general meetings (other than Annual General Meetings) being called on 14 days’ notice.
The Remuneration Committee is consulting with major shareholders about how HSBC can continue to improve the alignment between shareholders and senior management with regard to incentivising long-term sustainable performance. If any material changes to our approach result from this consultation, a resolution will be submitted to the Annual General Meeting.
A live webcast of the Annual General Meeting will be available on www.hsbc.com. From shortly after the conclusion of the Annual General Meeting until 30 June 2011 a recording of the proceedings will be available on www.hsbc.com.
| | | |
| On behalf of the Board | | |
D J Flint,Group Chairman | | 28 February 2011 |
| HSBC Holdings plc | | |
| Registered number 617987 | | |
219
Directors’ Remuneration Report
Report of the Remuneration
Committee
| | | | | |
| | | Page | |
| | | 220 | |
| | | 222 | |
| | | 222 | |
| | | 223 | |
| | | 224 | |
| | | 225 | |
| | | 225 | |
| | | 226 | |
| | | 228 | |
| | | 228 | |
| | | 228 | |
| | | 228 | |
| | | 228 | |
| | | 229 | |
| | | 229 | |
| | | 230 | |
| | | 231 | |
| | | 232 | |
The principal purpose of HSBC’s remuneration strategy is to support and drive sustainable performance over the long-term. Remuneration should reward success towards this end, but it must also not reward failure and it must be properly aligned with risk which remains on the balance sheet.
HSBC strives to achieve this through a variety of ways which are detailed under ‘Overall principles’ on page 222. These include taking a rounded view of financial and non-financial performance in determining reward levels, considering affordability (including cost and quantity of capital and liquidity considerations), market competitiveness, delivering awards with high levels of deferral and making all such deferred awards subject to clawback. Such clawback is applied at the sole discretion of the Remuneration Committee (‘the Committee’).
In our view these elements help to reinforce and reward the delivery of sustainable performance.
2010 performance
Key achievements
The annual financial objectives that we set for ourselves for 2010 were achieved, although in some areas they were lower than the established long-term targets. In the Group’s 2010 performance, particular note was made of the following:
| • | | good growth in profit before tax on both an underlying and a reported basis compared with 2009 and ahead of expectations at the start of 2010. This was primarily driven by lower loan |
| | | impairment charges and other credit risk provisions with all regions and customer groups contributing; |
| |
| • | | strong growth was achieved in emerging markets with loans and advances to customers and revenue increasing in key markets; |
| • | | our capital ratios were above the target range, in part from the contribution of profit to capital but also from our ability to raise capital, as shown in the successful hybrid capital securities issue in the first half of the year; |
| • | | we maintained a highly liquid balance sheet, with a ratio of customer advances to customer accounts of 78.1%; |
| • | | we increased dividends for our shareholders, reflecting the profit-generating capability of the Group; |
| • | | return on average shareholders’ equity of 9.5% was below our target range; and |
| • | | revenue declined and costs grew, resulting in an increase in the cost efficiency ratio from 52.0% to 55.2%. The Group is working on bringing the ratio back to target levels while meeting the need to invest for future growth. |
Key non-financial achievements of the Group in 2010, which reflect the objectives set for senior management, are summarised below:
| • | | process objectives focused on efficiency and qualitative measures which affect financial performance and mitigate risk. The target we set for operational losses as a percentage of revenue was met; |
| |
| • | | progress in meeting customer recommendation and brand recognition targets was made in a challenging environment for retail and commercial banking. Brand health targets for PFS and Business Banking were met. Customer recommendation targets were met for the latter but not for PFS; and |
| |
| • | | regarding the Group’s employees, our 2010 employee engagement score was below target and was less than our 2009 score. However, the 2010 score exceeded the global average and the global financial sector norm for employee engagement in the year. The target for the ratio of revenue to staff costs was also met. |
In determining remuneration levels for 2010, the Committee, applying HSBC’s remuneration strategy and policy, remained mindful of the interests of the many stakeholders and the broader external context. This included taking into account the pay and
220
Directors’ Remuneration Report(continued)
employment conditions of our employees compared to our Directors and senior executives.
Management of risk
The integration of risk management with reward commenced in 2008 when our Group Risk function became involved in the approval of relevant incentive plans. Subsequently, the concept of imputing the cost of capital in the determination of bonus funding was expanded across HSBC, starting with GB&M, and it now applies throughout the Group.
Since 2009, the Group Chief Risk Officer has provided advice to the Committee on the implications of the remuneration policy on risk and risk management. As outlined in ‘Overall principles’ on page 222, risk mitigation objectives are included in objectives.
From 2010, we have used a risk appetite framework which describes the quantum and types of risk that we are prepared to take in executing our strategy. It shapes our integrated approach to business, risk and capital management and supports us in achieving our return on equity objectives. The risk appetite framework is agreed by the HSBC Holdings Board and cascaded across businesses and geographies. It provides an important input into the Committee’s deliberations with regard to remuneration. In addition, individual performance is also reviewed against key risk appetite targets for credit, market, operational and information and security risks to ensure that proposed individual remuneration is appropriate against these aspects.
In February 2010, the Group Risk Committee was established, which advises the Board on risk appetite and also on aligning reward structures with risk appetite. The Group Risk Committee receives information on risk related aspects of reward structures to be proposed by the Committee. The Group Chief Risk Officer regularly reports to, and attends meetings of, the Group Risk Committee.
Further information relating to our approach to risk management in general is set out on page 198.
Regulation
2010 has seen further significant change to the regulatory environment. Regrettably there is still a wide divergence in how regulations operate globally and this presents significant challenges to HSBC, which operates in 87 countries and territories worldwide. In order to deliver long-term sustainable performance, it is imperative we have market-competitive remuneration in order to attract,
motivate and retain talented and committed employees.
We work to ensure our remuneration policies are aligned with both new regulatory practices and the interests of shareholders and confirm that HSBC is fully compliant with the Financial Stability Board and the Financial Services Authority (‘FSA’) guidance and rules on remuneration.
Senior management changes
In September 2010, we announced that our Group Chairman, Lord Green, would retire from the Group on 3 December 2010 and that the Group Chief Executive and Chairman of The Hongkong and Shanghai Banking Corporation, M F Geoghegan, would step down as Group Chief Executive with effect from 31 December 2010 and provide advisory support to the Group until his retirement on 31 March 2011. M F Geoghegan will then act as an external consultant up to 30 June 2011. Succession to these positions affecting the executive Directors is set out below.
D J Flint was appointed Group Chairman with effect from 3 December 2010 and continues to be based in London.
S T Gulliver was appointed Group Chief Executive and Chairman of The Hongkong and Shanghai Banking Corporation with effect from 1 January 2011. In keeping with the policy established in September 2009, his principal office is located in Hong Kong.
A A Flockhart was appointed Chairman, Europe, Middle East, Africa, Latin America, Commercial Banking and Chairman of HSBC Bank plc with effect from 1 January 2011. He has relocated from Hong Kong to London to take up this remit.
I J Mackay was appointed an executive Director and the Group Finance Director with effect from 3 December 2010. He has relocated from Hong Kong to London to take up this remit.
2011 remuneration activities
As announced in 2010, the Committee is considering how HSBC can continue to improve the alignment between shareholders and senior management with regard to incentivising long-term sustainable performance. The Committee is currently in the process of consulting with major shareholders on this subject. Any material changes to our approach which result from this consultation will be explained to shareholders in the Chairman’s letter accompanying the Notice of the Company’s 2011 Annual General Meeting.
221
Directors’ Remuneration Report(continued)
Remuneration Committee –
members and advisers
The Committee meets regularly to consider human resource issues relating to terms and conditions of employment, remuneration and retirement benefits. Within the authority delegated by the Board, the Committee is responsible for approving remuneration policy and in doing so takes into account the pay and conditions across our Group. This includes the terms of bonus plans, share plans, other long-term incentive plans and the individual remuneration packages of executive Directors and other senior Group employees, including all in positions of significant influence and those having an impact on our risk profile. No Directors are involved in deciding their own remuneration.
The members of the Committee during 2010 were J D Coombe, W S H Laidlaw, G Morgan and J L Thornton. Sir Mark Moody-Stuart retired as a Director of HSBC Holdings and ceased to be a member and chairman of the Committee on 28 May 2010. J L Thornton was appointed chairman on 28 May 2010.
There were nine meetings of the Committee during 2010. The table on page 190 gives details of Directors’ attendance at these meetings. Following
each meeting the Committee reports to the Board on its activities. The terms of reference of the Committee are available at www.hsbc.com/boardcommittees.
The Committee received independent advice on executive remuneration issues from Deloitte LLP and remuneration data from Towers Watson. Each of these firms also provided other consulting services to various parts of the Group. Other consultants are used from time to time to advise on specific issues. Going forward, the Committee has agreed to use advisers only as and when required and that these would be separate from the Company’s advisers. During the year, the Group Chief Executive provided regular briefings to the Committee and the Committee received advice from the Group Managing Director, Human Resources, A Almeida, the Head of Group Performance and Reward, T Roberts and B Robertson, then the Group Chief Risk Officer.
Overall principles
Our global reward strategy provides a framework for the Committee to carry out its responsibilities during the year.
| | | |
| HSBC reward strategy | | How achieved |
| | | |
| A rounded approach to measuring performance | | • We assess performance with reference to clear and relevant objectives set within a holistic balanced scorecard framework. Under this framework, objectives are set under four categories – financial, process (including risk mitigation), customer and people. Significant importance is given to the achievement of efficiency and risk objectives as well as financial objectives. Objectives relating to customer development and the productivity of our human capital are key to sustained financial performance and the development of the Group over the short and medium term. |
| | | |
| |
| A focus on total remuneration with variable pay differentiated by performance | | • Reward is delivered through a combination of fixed and variable pay (salary, bonus, other long-term incentives). The variable pay element is differentiated by performance over both the short and long-term. The performance-related elements of pay comprise a material proportion of the total remuneration package for executive Directors, whilst maintaining an appropriate balance between fixed and variable elements. Remuneration is structured to provide an opportunity for market top quartile total remuneration for higher levels of market referenced performance. |
| | | |
| |
| Aligning individual rewards with Group performance and shareholders | | • A significant proportion of variable pay is deferred into, predominantly, awards of HSBC Holdings Restricted Shares to align recipients to the future performance of the Group and to retain key talent. For Code Staff (as defined under FSA rules) 50% of deferred variable pay is delivered in the form of deferred cash. • Executive Directors and other senior executives are subject to share ownership guidelines. |
| | | |
| |
| Competitive and cost effective packages to attract and retain staff | | • A total remuneration package (salary, bonus, long-term incentives and other benefits) which is competitive in relation to comparable organisations in each of the markets in which we operate. |
| | | |
| |
| Effective management of risk | | • Discretion is used in order to assess the extent to which performance has been achieved, rather than applying a formulaic approach which, by its nature, may encourage inappropriate risk taking. • Performance is assessed taking risk into account using a combination of quantitative and qualitative measures as informed by the risk appetite framework. • Affordability is assessed (including the cost and quantity of capital and liquidity considerations). • All Restricted Share awards made from 2010 onwards are, prior to vesting, subject to clawback as are deferred cash awards made from 2011 onwards. |
| | | |
| |
| Stakeholder interest | | • Consideration of shareholder interests together with consideration of the wider environment and societal aspects. • Consideration of the pay and employment conditions of the Group’s employees compared to its Directors and senior executives. |
| | | |
| |
222
Directors’ Remuneration Report(continued)
Executive Directors’ remuneration
The table below sets out our policy relating to and the purpose of each element of the remuneration package for executive Directors.
| | | | | | | | | |
| Element | | Delivery | | Policy | | Purpose | | Timing |
| | | | | | | | | |
Fixed | | | | | | | | |
| Base salary | | • Cash • Monthly • Pensionable | | • Reviewed annually | | • Reflects the market competitive rate for the role and relative responsibility | | • Paid during the year |
| | | | | | | | | |
| |
Variable | | | | | | | | |
| Annual Bonus | | • Comprises a non-deferred and a deferred element. See below | | • Total annual bonus award (including cash and deferred elements) of up to four times salary • Fully discretionary | | • Reflects the extent to which the individual and the Group’s annual objectives have been met under the balanced scorecard approach, risk appetite framework, our absolute and relative performance to our peers and competitive market practice | | • Awarded in the following financial year |
| | | | | | | | |
| | |
Annual bonus
(non-deferred) | | • Either cash or awards of Restricted Shares under the HSBC Share Plan • Non pensionable | | • At least 50% of non-deferred variable remuneration is awarded in Restricted Shares in line with FSA regulations • Such share-based variable remuneration is subject to a 6-month retention period | | | • Awarded in the following financial year |
| | | | | | | | | |
| |
Annual bonus
(deferred) | | • Either deferred cash or awards of Restricted Shares under the HSBC Share Plan • Non pensionable | | • 40% – 60% of variable remuneration is deferred over a period of 3 years, in line with FSA regulations • At least 50% of deferred variable remuneration is awarded in Restricted Shares in line with FSA regulations • Such share-based variable remuneration is subject to a 6-month retention period • 33% vest on each of the first and second anniversaries of an award, the balance (34%) vesting on third anniversary1 | | • See above • Also contributes to retention and encourages alignment with shareholders | | • Awarded in the following financial year |
| | | | | | | | | |
| |
| Performance Shares | | • Performance Shares awarded under the HSBC Share Plan • Non pensionable | | • Face value at grant of up to a maximum of seven times salary • Vesting of awards based on three independent performance measures (relative total shareholder return (‘TSR’) 40%, economic profit 40% and growth in earnings per share (‘EPS’) 20%) and an over-riding ‘sustained improvement’ judgement by the Committee • Performance conditions are measured over a three year period • Performance targets are reviewed annually to ensure that they remain appropriate and challenging, and to consider whether they should be recalibrated for future awards | | • To reflect our relative and absolute performance over the long-term. This takes account of an external measure of value creation, a measure of the extent to which the return on capital invested in HSBC is in excess of a benchmark return and a direct measure of the profits generated for shareholders • Rewards the creation of sustained growth in shareholder value and encourages alignment with shareholders | | • Normally awarded in the following financial year |
| | | | | | | | | |
| |
Benefits | | | | | | | | |
| Pension | | • Deferred cash or cash allowance | | • Employer contributions based on percentage of salary | | • Provides market competitive post-retirement benefits | | • Paid or accrued during the year |
| | | | | | | | | |
| |
| Other benefits | | • Benefits in kind or cash allowance • Non pensionable | | • Benefits include provision of medical and other insurance, accountancy advice and travel assistance | | • Provides market competitive benefits | | • Received during the year |
| |
| | |
| 1 | | By exception, V H C Cheng’s 2010 award has a vesting date three years from the date of award. |
223
Directors’ Remuneration Report(continued)
In order to ensure that executive Directors’ remuneration packages are competitive, having regard to the market in which we compete for executive talent, the Committee considers market data from a defined remuneration comparator group. This group comprises of nine global financial services companies, namely Banco Santander, Bank of America, Barclays, BNP Paribas, Citigroup, Deutsche Bank, JPMorgan Chase & Co, Standard Chartered and UBS. These companies were selected on the basis of their broadly similar business coverage, size and international scope, and are subject to annual review for continuing relevance.
The positioning of total remuneration (salary, bonus and the expected value of long-term incentives) for the executive Directors depends on the performance of the Group and individual performance assessed against a combination of financial and non-financial objectives within an annual balanced scorecard. The annual objectives in themselves are derived from medium term strategic plans.
The above approach applies to all executive Directors with the exception of the Group Chairman, D J Flint who from 2011 will no longer receive annual bonus payments and is not expected to be granted awards of Performance Shares, and S T Gulliver, whose variable compensation arrangements for 2010 take into account wholesale banking market practice. With effect from 2011, S T Gulliver will be subject to the same arrangements as other executive Directors.
Executive Directors’ 2010 emoluments and remuneration
The emoluments of the Group Chairman and executive Directors of HSBC Holdings for 2010, disclosed pursuant to section 421 of the UK Companies Act 2006 and the Large and Medium-sized Companies and Group (Accounts and Reports) Regulations 2008, were as follows:
| | | | | | | | | | | | | | | | | | | | | | | | | | | | | | | | | | | | | | | | | | | | | | | | | | | | | | | | | |
| | | V H C Cheng | | | D J Flint | | | A A Flockhart | | | M F Geoghegan1 | | | Lord Green2 | | | S T Gulliver | | | I J Mackay3 | |
| | | 2010 | | | 2009 | | | 2010 | | | 2009 | | | 2010 | | | 2009 | | | 2010 | | | 2009 | | | 2010 | | | 2009 | | | 2010 | | | 2009 | | | 2010 | | | 2009 | |
| £000 | | | | | | | | | | | | | | | | | | | | | | | | | | | | | | | | | | | | | | | | | | | | | | | | | | | | | | | | |
| Salary | | | 775 | | | | 769 | | | | 845 | | | | 700 | | | | 820 | | | | 662 | | | | 1,164 | | | | 1,070 | | | | 1,160 | | | | 1,250 | | | | 800 | | | | 800 | | | | 57 | | | | – | |
Allowances4 | | | 193 | | | | 191 | | | | 434 | | | | 394 | | | | – | | | | – | | | | 421 | | | | 548 | | | | 31 | | | | 8 | | | | 154 | | | | 8 | | | | 36 | | | | – | |
Benefits in kind5 | | | 311 | | | | 663 | | | | 8 | | | | 8 | | | | 629 | | | | 437 | | | | 430 | | | | 57 | | | | 3 | | | | 4 | | | | 17 | | | | 18 | | | | 27 | | | | – | |
Bonus6 | | | 284 | | | | – | | | | 1,805 | | | | – | | | | 1,385 | | | | – | | | | 2,824 | | | | – | | | | – | | | | – | | | | 2,934 | | | | – | | | | 24 | | | | – | |
| | | | | | | | | | | | | | | | | | | | | | | | | | | | | |
| Total emoluments | | | 1,563 | | | | 1,623 | | | | 3,092 | | | | 1,102 | | | | 2,834 | | | | 1,099 | | | | 4,839 | | | | 1,675 | | | | 1,194 | | | | 1,262 | | | | 3,905 | | | | 826 | | | | 144 | | | | – | |
| | | | | | | | | | | | | | | | | | | | | | | | | | | | | |
| | | | | | | | | | | | | | | | | | | | | | | | | | | | | | | | | | | | | | | | | | | | | | | | | | | | | | | | | |
US$000
Total emoluments | | | 2,414 | | | | 2,532 | | | | 4,775 | | | | 1,719 | | | | 4,377 | | | | 1,714 | | | | 7,473 | | | | 2,613 | | | | 1,844 | | | | 1,969 | | | | 6,031 | | | | 1,288 | | | | 222 | | | | – | |
| |
| The total remuneration of the Group Chairman and executive Directors of HSBC Holdings for 2010, disclosed pursuant to the UK Listing Rules, was as follows: |
| |
| | | V H C Cheng | | | D J Flint | | | A A Flockhart | | | M F Geoghegan1 | | | Lord Green2 | | | S T Gulliver | | | I J Mackay3 | |
| | | 2010 | | | 2009 | | | 2010 | | | 2009 | | | 2010 | | | 2009 | | | 2010 | | | 2009 | | | 2010 | | | 2009 | | | 2010 | | | 2009 | | | 2010 | | | 2009 | |
| £000 | | | | | | | | | | | | | | | | | | | | | | | | | | | | | | | | | | | | | | | | | | | | | | | | | | | | | | | | |
| Salary, allowances and benefits in kind | | | 1,279 | | | | 1,623 | | | | 1,287 | | | | 1,102 | | | | 1,449 | | | | 1,099 | | | | 2,015 | | | | 1,675 | | | | 1,194 | | | | 1,262 | | | | 971 | | | | 826 | | | | 120 | | | | – | |
Bonus7 | | | 711 | | | | 1,240 | | | | 2,800 | | | | 2,100 | | | | 1,808 | | | | 1,908 | | | | 3,800 | | | | 4,000 | | | | – | | | | – | | | | 5,200 | | | | 9,000 | | | | 61 | | | | – | |
| | | | | | | | | | | | | | | | | | | | | | | | | | | | | |
| Total remuneration | | | 1,990 | | | | 2,863 | | | | 4,087 | | | | 3,202 | | | | 3,257 | | | | 3,007 | | | | 5,815 | | | | 5,675 | | | | 1,194 | | | | 1,262 | | | | 6,171 | | | | 9,826 | | | | 181 | | | | – | |
| | | | | | | | | | | | | | | | | | | | | | | | | | | | | |
| | | | | | | | | | | | | | | | | | | | | | | | | | | | | | | | | | | | | | | | | | | | | | | | | | | | | | | | | |
US$000
Total remuneration | | | 3,073 | | | | 4,466 | | | | 6,312 | | | | 4,995 | | | | 5,030 | | | | 4,691 | | | | 8,980 | | | | 8,852 | | | | 1,844 | | | | 1,969 | | | | 9,530 | | | | 15,327 | | | | 280 | | | | – | |
The variance in the above tables is caused by the different definitions of bonus under the UK Companies Act 2006 and the UK Listing Rules. Explanations of the constituent parts of the bonus calculated pursuant to the UK Companies Act 2006 and the UK Listing Rules are given in footnotes 6 and 7 respectively.
| 1 | | Stepped down as Group Chief Executive and a Director of HSBC Holdings on 31 December 2010. Retires from the Group on 31 March 2011. |
| |
| 2 | | Retired as Group Chairman and a Director of HSBC Holdings on 3 December 2010. |
| |
| 3 | | Appointed a Director of HSBC Holdings on 3 December 2010. |
224
Directors’ Remuneration Report(continued)
| 4 | | Allowances include an executive allowance paid to fund personal pension arrangements and a company car allowance. |
| |
| 5 | | Benefits in kind include provision of medical insurance, other insurance cover, accountancy advice and travel assistance. V H C Cheng, A A Flockhart and M F Geoghegan received housing and other benefits in kind that are normal within the location in which they are employed. I J Mackay relocated to London and he received temporary accommodation for him and his family together with other normal relocation benefits. |
| |
| 6 | | Where applicable, bonus comprises: (i) the estimated monetary value of 33% of the award of HSBC Holdings Restricted Shares that will vest on 1 March 2011 arising from the 2009 bonus awarded in March 2010 that was fully deferred into awards of HSBC Holdings Restricted Shares, as follows: D J Flint, £685,000, A A Flockhart, £662,000, M F Geoghegan £1,304,000 and S T Gulliver, £2,934,000; and (ii) 40% of the annual bonus in respect of the 2010 performance year that is non-deferred. The non-deferred bonus is payable half in cash and half in HSBC Holdings Restricted Shares which are subject to a six month retention period. Full details are set out below and on page 223. |
| |
| 7 | | The Bonus for 2010 comprises the deferred and non-deferred bonus, details of which are set out below and on page 223. |
Retirement of M F Geoghegan in 2011
M F Geoghegan will continue to work under his existing compensation arrangements until his retirement on 31 March 2011; however he will not be eligible to receive any bonus in respect of 2011. M F Geoghegan will receive the sum of £1,027,500, and the Group will also make a pension contribution on his behalf equal to £401,250, in lieu of the remaining nine months notice period required to terminate the Service Agreement. Following his retirement, M F Geoghegan will provide consultancy to HSBC for a period of three months from 1 April 2011, at a consultancy fee of £200,000, which he intends to donate to charity. In accordance with our disclosure practices these sums will also be fully disclosed in the 2011 Directors’ Remuneration Report.
Salary
To reflect the significantly increased responsibilities and maintain and reinforce a collegiate executive team, the salaries for two executive Directors were adjusted from 1 February 2010, equalising the salaries of D J Flint, S T Gulliver and A A Flockhart. In addition, with effect from 2010 the employer pension contribution or executive allowance, in lieu of pension, for D J Flint, A A Flockhart and S T Gulliver were equalised at 50% of basic salary.
On appointment as Group Chairman, the salary for D J Flint was increased to £1,500,000 with effect from 3 December 2010.
On appointment as Group Chief Executive, the salary for S T Gulliver was increased to £1,250,000, with effect from 1 January 2011.
On appointment as Chairman, Europe, Middle East, Africa, Latin America, Commercial Banking and Chairman of HSBC Bank plc, the salary for A A Flockhart was increased to £975,000, with effect from 1 January 2011.
I J Mackay was appointed an executive Director on 3 December 2010 with a base salary of £700,000, and will receive an executive allowance of 50% in lieu of pension.
No other salary increases are proposed for executive Directors.
Annual bonus
The awards made to executive Directors in respect of 2010 performance will be 60% deferred and 40% non-deferred (with the exception of S T Gulliver, whose arrangements are noted below). 50% of both the deferred and non-deferred components will be in the form of Restricted Shares issued under the HSBC Share Plan. The remaining 50% will be delivered as cash. The vesting policy as noted on page 223 under ‘Executive Directors remuneration’ will apply to the deferred awards.
S T Gulliver, at his request, will receive his 2010 annual bonus 100% fully deferred in the form of Restricted Shares. This award will be subject to the same vesting policy for other executive Directors’ deferred awards.
The award made to the former Group Chief Executive, M F Geoghegan, and the Group Chairman, D J Flint, in respect of his previous role as Chief Financial Officer, Executive Director, Risk and Regulation, reflects the overall achievements of the Group under the balanced scorecard and risk appetite framework. The 2010 results show an improved profit after tax and return on equity, although below our target range, and a strong core tier 1 capital position. Loan impairment charges as a percentage of total operating income reduced and the firm’s economic profit position improved, although it remained in an overall negative position. Operational losses for the Group were reduced from last year and notwithstanding the Group’s employee engagement score reduced year on year, it still maintained its position ahead of the industry norm. From 2011 and onwards D J Flint will no longer receive an annual bonus payment.
The award made to the Group Chief Executive, S T Gulliver, reflects his overall strong achievements in his previous role as Chairman, Europe, Middle East and Global Businesses. Profit before tax for the businesses within his remit decreased slightly, however this was against challenging market
225
Directors’ Remuneration Report(continued)
conditions. Operational losses for the year, however, also reduced substantially as well as there being a substantial decrease in loan impairment charges as a percentage of total operating income.
The award made to V H C Cheng, Chairman of HSBC Bank (China) Company Limited, reflects his performance in ensuring the continued strategic development in mainland China.
The award made to A A Flockhart reflects his overall achievements in his previous role
as Chairman, Personal and Commercial Banking and Insurance. Profit before tax increased and the return on equity increased in all areas from last year. Operational losses increased from last year, however, resulting in the cost efficiency across his remit to decrease.
The award for I J Mackay, reflects his overall achievements in his previous role as Chief Financial Officer, Asia-Pacific.
Bonus awards
| | | | | | | | | | | | | | | | | | | | | | | | | | | | | | | | | |
| | | 2010 performance1 | | | 2009 performance | | | 2008 performance | |
| | | Non-deferred | | | Deferred | | | | | | | | | | | | | | | |
| | | | | | | Restricted | | | | | | | Restricted | | | | | | | Restricted | | | | | | | Restricted | |
| | | Cash | | | Shares | | | Cash | | | Shares | | | Cash | | | Shares | | | Cash | | | Shares | |
| | | £000 | | | £000 | | | £000 | | | £000 | | | £000 | | | £000 | | | £000 | | | £000 | |
| | | | | | | | | | | | | | | | | | | | | | | | | | | | | | | | | |
| V H C Cheng | | | 142 | | | | 142 | | | | 213 | | | | 213 | | | | – | | | | 1,240 | | | | – | | | | 1,639 | |
D J Flint2 | | | 560 | | | | 560 | | | | 840 | | | | 840 | | | | – | | | | 2,100 | | | | – | | | | – | |
| A A Flockhart | | | 362 | | | | 362 | | | | 542 | | | | 542 | | | | – | | | | 1,908 | | | | – | | | | 1,655 | |
M F Geoghegan2,3 | | | 760 | | | | 760 | | | | 1,140 | | | | 1,140 | | | | – | | | | 4,000 | | | | – | | | | – | |
Lord Green4 | | | – | | | | – | | | | – | | | | – | | | | – | | | | – | | | | – | | | | – | |
S T Gulliver2,5 | | | – | | | | – | | | | – | | | | 5,200 | | | | – | | | | 9,000 | | | | – | | | | – | |
I J Mackay6 | | | 12 | | | | 12 | | | | 18 | | | | 18 | | | | – | | | | – | | | | – | | | | – | |
| | |
| 1 | | The awards made in respect of 2010 performance will be delivered as described on page 225. |
| |
| 2 | | D J Flint, M F Geoghegan and S T Gulliver requested that they not be considered for a bonus in respect of 2008. |
| |
| 3 | | M F Geoghegan has stated that subject to the shares being released, he will make total donations up to the size of his bonus awarded for 2009 performance to charities by 2013. |
| |
| 4 | | At the former Group Chairman’s request, he was not considered for an annual bonus award in 2010, 2009 and 2008. |
| |
| 5 | | S T Gulliver has requested that 100% of the award made to him in respect of 2010 performance be fully deferred in to Restricted Shares subject to the standard vesting and retention period. |
| |
| 6 | | Appointed a Director of HSBC Holdings on 3 December 2010. |
Performance Shares
No awards of Performance Shares have been made since 2008. No awards are proposed to date. Awards may be considered later in 2011, subject to the conclusion of the current consultation with shareholders concerning a revised approach as referenced on page 221.
The average actual vesting of Performance Share awards made in 2004, 2005, 2006 and 2007 (which were tested in 2007, 2008, 2009 and 2010) has been 26.88% of their face value. The awards granted in 2007 did not satisfy the EPS condition but did satisfy the TSR condition and accordingly, 75.6% of the TSR element of the award (37.8% of the overall award) vested. The awards made in 2008 have not satisfied the EPS or economic profit measures. The extent to which the TSR part of the award will vest will be determined following the completion of the three year period on 25 March 2011.
Description of performance conditions
The performance measures for the long-term incentive awards of Performance Shares under the HSBC Share Plan remain as follows.
The vesting of awards is based on three independent performance measures and an overriding ‘sustained improvement’ judgement by the Committee. The three Group measures are relative TSR (40% of the award); economic profit (40%); and growth in EPS (20%).
These measures provide a basis on which to measure our relative and absolute performance over the long-term taking into account an external measure of value creation, a measure of the extent to which the return on capital invested in HSBC is in excess of a benchmark return and a direct measure of the profits generated for shareholders.
Awards will not vest unless the Committee is satisfied that our financial performance has shown a sustained improvement in the period since the award date. In determining whether we have achieved such sustained improvement the Committee will take account of all relevant factors, in particular, comparisons against the TSR comparator group in areas such as revenue growth and mix, cost efficiency, credit performance, cash return on cash invested, dividends and TSR.
The performance conditions are measured over a three year performance period and awards forfeited
226
Directors’ Remuneration Report(continued)
to the extent that they have not been met. The performance measures and the targets described below apply to the last awards made in 2008.
Total shareholder return award
TSR is measured against a comparator group comprising the largest global banks in the world as well as other banks against which we compete for business at a regional and/or local level. These companies are:
| | | |
| |
TSR comparator group
| | |
| AGEAS | | ICBC |
| Banco Bradesco | | Itau Unibanco |
| Banco Santander | | JPMorgan Chase |
| Bank of America | | Lloyds Banking Group |
| Bank of China | | National Australia Bank |
| Barclays | | Royal Bank of Canada |
| BBVA | | Royal Bank of Scotland |
| BNP Paribas | | Société Générale |
| Citigroup | | Standard Chartered |
| Credit Suisse Group | | UBS |
| DBS Group | | UniCredito Italiano |
| Deutsche Bank | | Wells Fargo |
| |
During 2008, HBOS and Wachovia merged with other banks in the comparator group and in 2009 the remainder of the banking activities of Fortis were acquired by BNP Paribas, an existing member of the comparator group. For awards made in 2008, performance from the point of acquisition will track that of the acquirer. This approach retains the free float market capitalisation (‘FFMC’) weighting of the combined entities. The Committee determined that the comparator group remains large enough to be statistically valid and as such it was not necessary to introduce any replacement banks.
To reflect the fact that the range of market capitalisations within the comparator group is very wide, a FFMC weighted method is used to calculate TSR performance. Under this approach, our out-performance of the comparator group will be calculated by dividing the total FFMC of all of the companies that we have outperformed in terms of TSR by the total FFMC of all of the companies in the comparator group. The extent to which the TSR award vests is determined as follows:
| | | | |
| |
| If HSBC’s TSR outperforms | | Proportion of TSR Award |
| companies comprising | | vesting1 |
| | | | | |
| 75% of the total FFMC | | | 100 | % |
| 50% of the total FFMC | | | 20 | % |
| < 50% of the total FFMC | | nil |
| |
| | |
| 1 | | Vesting will occur in a straight line between 20% and 100% where our performance falls between these incremental steps. |
Economic profit award
Economic profit (‘EP’) is calculated as the average annual difference between return on invested capital and our benchmark cost of capital and is expressed as a percentage. EP is a key measure of shareholder value creation as it rewards management progressively to the extent that the return on the capital invested in HSBC by its shareholders is in excess of a threshold return, which itself exceeds our benchmark cost of capital.
For the awards made in 2008 the benchmark cost of capital was 10%. Return on invested capital is based on the profit attributable to shareholders. The extent to which the EP award vests is determined as follows:
| | | | | |
| |
| Average annual EP over | | Proportion of EP Award |
| three years | | vesting1 |
| | | | | |
| 8% or above | | | 100 | % |
| < 3% | | nil |
| |
| | |
| 1 | | Vesting will occur in a straight line between 0% and 100% where our performance falls between these incremental steps. |
Earnings per share award
Growth in EPS is measured on a point to point basis, by comparing EPS in the third financial year of the performance period with EPS in the financial year preceding that in which the award is made.
| | | |
| |
| EPS growth in Year 3 over | | Proportion of EPS |
| the base EPS | | award vesting1 |
| | | |
| 28% or above | | 100% |
| 16% | | 20% |
| < 16% | | nil |
| |
| | |
| 1 | | Vesting will occur in a straight line between 20% and 100% where our performance falls between these incremental steps. |
If events occur which cause the Committee to consider that a performance condition has become unfair or impractical in either direction, the right is reserved to the Committee, if it considers it appropriate, to amend, relax or waive the condition.
Awards will vest in full and immediately in cases of death. In the event of redundancy, retirement on grounds of injury or ill health and where a participant ceases to be employed by HSBC due to a company ceasing to be part of HSBC, awards will normally vest at the end of the vesting period on a time-apportioned basis to the extent that the performance conditions have been satisfied. In the event of a change of control, awards will normally vest immediately and on a time-apportioned basis to the extent that the performance
227
Directors’ Remuneration Report(continued)
conditions have been satisfied. Awards will normally be forfeited if the participant is dismissed for cause or resigns from HSBC. In all circumstances the Committee retains discretion to ensure fair and reasonable treatment.
The dilution limits set out in the HSBC share plans comply with the Association of British Insurers’ guidelines. To date, all vesting awards of Performance Shares and Restricted Shares under the HSBC Share Plan have been satisfied by the transfer of existing shares. To create additional core tier 1 capital and retain funds within HSBC, the Board has agreed that new shares may be issued to satisfy the vesting of awards of Restricted and Performance Shares that cannot be satisfied from shares already held by employee benefit trusts commencing in 2011.
Pursuant to the Large and Medium-sized Companies and Groups (Accounts and Reports) Regulations 2008, the graph below shows the TSR performance against the FTSE 100 Index, for the five-year period ended 31 December 2010. The FTSE 100 Index has been chosen as this is a recognised broad equity market index of which HSBC Holdings is a member.
HSBC TSR and FTSE 100 Index
Source: IDC
The normal retirement age for executive Directors is 65, with the exception of V H C Cheng, for whom no retirement age is specified in keeping with local legislation. The pension entitlements of the executive Directors for 2010 are set out on page 231.
Share ownership guidelines
To ensure appropriate alignment with our shareholders, we operate a formal share ownership policy, expressed as a number of shares, for executive Directors and the Group Managing Directors. The Committee considers that material share ownership by executives creates a community of interest between senior management and shareholders.
Under the existing guidelines, the shareholding is expected to be achieved within five years of the executive’s appointment or three years from the date of approval of amendments to the HSBC Share Plan on 30 May 2008, whichever is the later. The executive Directors and Group Managing Directors are required to build and retain the following shareholdings:
| | | | | | | | | |
| | | Number of shares1 |
| | | | | | | held at 31 | |
| | | | | | | December | |
| | | to be held | | | 2010 | |
| | | | | | | | | |
| V H C Cheng | | | 200,000 | | | | 1,383,564 | |
D J Flint2 | | | 400,000 | | | | 494,933 | |
| A A Flockhart | | | 200,000 | | | | 1,066,450 | |
S T Gulliver3 | | | 600,000 | | | | 4,279,244 | |
I J Mackay4 | | | 200,000 | | | | 287,719 | |
| Group Managing Directors | | | 125,000 | | | | – | 5 |
| | |
| 1 | | For the purposes of the guidelines, unvested awards of Restricted Shares are included. Unvested Performance Share awards are excluded. |
| |
| 2 | | Appointed Group Chairman on 3 December 2010. |
| |
| 3 | | Appointed Group Chief Executive on 1 January 2011. |
| |
| 4 | | Appointed Group Finance Director on 3 December 2010. |
| |
| 5 | | All of the Group Managing Directors exceed the expected holdings. |
The Committee monitors compliance with the share ownership guidelines annually. The Committee will have full discretion in determining any penalties in cases of non-compliance, which could include a reduction of future awards of long-term incentives and/or an increase in the proportion of the annual bonus that is deferred into shares.
Our policy is to employ executive Directors on one-year rolling contracts although longer initial terms may be approved by the Committee if considered appropriate. The Committee will, consistent with the best interests of the Group, seek to minimise termination payments.
228
Directors’ Remuneration Report(continued)
| | | | | | | |
| |
| | | Contract date | | Notice period | | Compensation on termination by the company without |
| Name | | (rolling) | | (Director & HSBC) | | notice or cause |
| | | | | | | |
| V H C Cheng | | 15 March 2010 | | 12 months | | Payment in lieu of notice equal to base salary, pension entitlements and other benefits. |
| |
| |
| D J Flint | | 14 February 2011 | | 12 months | | Payment in lieu of notice equal to base salary, pension entitlements and other benefits. |
| |
| |
| A A Flockhart | | 14 February 2011 | | 12 months | | Payment in lieu of notice equal to base salary, pension entitlements and other benefits. Eligible to be considered for a bonus upon termination of employment other than where the Executive has resigned or the Company has terminated the Executive’s employment with the contractual right to do so. |
| |
| |
M F Geoghegan1 | | 26 February 2010 | | 12 months | | Payment in lieu of notice equal to base salary, pension entitlements and other benefits. Eligible for a bonus calculated as not less than the average of the previous two years of bonus payments received, pro-rated for any part-year worked to termination. |
| |
| |
Lord Green2 | | 28 February 2008 | | 12 months | | Payment in lieu of notice equal to base salary, pension entitlements and other benefits. Eligible for a bonus calculated as not less than the average of the previous two years of bonus payments received, pro-rated for any part-year worked to termination. |
| |
| |
S T Gulliver3 | | 10 February 2011 | | 12 months | | Payment in lieu of notice equal to base salary, pension entitlements and other benefits. Eligible to be considered for a bonus upon termination of employment other than where the Executive has resigned or the Company has terminated the Executive’s employment with the contractual right to do so. |
| |
| |
I J Mackay4 | | 4 February 2011 | | 12 months | | Payment in lieu of notice equal to base salary, pension entitlements and other benefits. Eligible to be considered for a bonus upon termination of employment other than where the Executive has resigned or the Company has terminated the Executive’s employment with the contractual right to do so. |
| |
| |
| | |
| 1 | | Stepped down as Group Chief Executive and a Director of HSBC Holdings on 31 December 2010. |
| |
| 2 | | Retired as Group Chairman and a Director of HSBC Holdings on 3 December 2010. |
| |
| 3 | | The other benefits as part of the payment in lieu of notice do not include the accommodation and car provided in Hong Kong. |
| |
| 4 | | Appointed a Director of HSBC Holdings on 3 December 2010. |
Executive Directors, if so authorised by either the Nomination Committee or the Board, may accept appointments as non-executive Directors of suitable companies which are not part of HSBC. Approval will not be given for executive Directors to accept a non-executive directorship of more than one FTSE 100 company nor the chairmanship of such a company. When considering a non-executive appointment, the Nomination Committee or Board will take into account the expected time commitment of such appointment. The time commitment for executive Directors’ external appointments will be reviewed as part of the annual Board review. Any remuneration receivable in respect of an external appointment is normally paid to HSBC, unless otherwise approved by the Committee. D J Flint has elected to donate his fees as a non-executive Director of BP p.l.c. to charity. Lord Green donated his fees from the Supervisory Board of BASF SE to charity.
Non-executive Directors
Non-executive Directors are appointed for fixed terms not exceeding three years, subject to their re-election by shareholders at Annual General Meetings. Non-executive directors have no service contract and are not eligible to participate in our share plans. Current non-executive Directors’ terms of appointment will expire as follows:
| • | | in 2011, S A Catz, J D Coombe, J W J Hughes-Hallett, W S H Laidlaw and N R N Murthy; |
| |
| • | | in 2012, M K T Cheung, J R Lomax, Sir Simon Robertson, J L Thornton and Sir Brian Williamson; and |
| |
| • | | in 2013, R A Fairhead and G Morgan. |
L M L Cha was appointed a non-executive Director with effect from 1 March 2011. Subject to her re-election by shareholders at the Annual General Meeting in 2011, her term will expire in 2014.
229
Directors’ Remuneration Report(continued)
Non-executive Directors’ fees are regularly reviewed and compared with other large international companies of comparable complexity. The current fee, which was approved by shareholders in 2006, is £65,000 per annum. Having considered comprehensive data it is clear that the current non-executive Directors’ fee is below the level paid
in other major UK companies. The approval will therefore be sought at the Annual General Meeting in 2011 for the fee for non-executive Directors to be increased to £95,000 per annum with effect from 1 January 2011. A fee of £30,000 per annum is payable to the senior independent non-executive Director. In addition, non-executive Directors received the following fees for service on Board Committees:
Board Committee annual fees1
| | | | | | | | | | | | | |
| | | | | | | | | | | Meetings | |
| | | | | | | | | | | held during | |
| | | Chairman | | | Member | | | 2010 | |
| | | £000 | | | £000 | | | (Number) | |
| | | | | | | | | | | | | |
| Group Audit Committee | | | 40 | | | | 20 | | | | 6 | |
| Group Risk Committee | | | 40 | | | | 20 | | | | 4 | |
| Remuneration Committee | | | 40 | | | | 20 | | | | 9 | |
| Nomination Committee | | | 30 | | | | 20 | | | | 3 | |
| Corporate Sustainability Committee | | | 30 | | | | 20 | | | | 5 | |
| | |
| 1 | | The Board will consider increasing the fees for service on Board Committees during 2011. |
The total of fees paid to each of the non-executive Directors of HSBC Holdings for 2010,
being emoluments for the purposes of the UK Companies Act 2006, is as follows:
Fees paid to non-executive Directors
(Audited)
| | | | | | | | | |
| | | | 2010 | | | | 2009 | |
| | | | £000 | | | | £000 | |
| | | | | | | | | |
| S A Catz | | | 65 | | | | 65 | |
M K T Cheung1 | | | 112 | | | | 89 | |
| J D Coombe | | | 130 | | | | 105 | |
J L Durán2 | | | 27 | | | | 65 | |
| R A Fairhead | | | 152 | | | | 135 | |
W K L Fung2, 3 | | | 54 | | | | 132 | |
| J W J Hughes-Hallett | | | 105 | | | | 105 | |
| W S H Laidlaw | | | 85 | | | | 85 | |
| J R Lomax | | | 102 | | | | 82 | |
Sir Mark Moody-Stuart2 | | | 51 | | | | 125 | |
| G Morgan | | | 85 | | | | 85 | |
| N R N Murthy | | | 91 | | | | 85 | |
| Sir Simon Robertson | | | 115 | | | | 115 | |
J L Thornton4 | | | 1,068 | | | | 1,040 | |
| Sir Brian Williamson | | | 87 | | | | 95 | |
| | | | | |
| | | | | | | | | |
| Total | | | 2,329 | | | | 2,408 | |
| | | | | |
| | | | | | | | | |
| Total (US$000) | | | 3,597 | | | | 3,756 | |
| | |
| 1 | | Includes fees as a non-executive Director and member of the Audit Committee of Hang Seng Bank Limited. |
| |
| 2 | | Retired as a Director on 28 May 2010. |
| |
| 3 | | Includes fees as non-executive Deputy Chairman of The Hongkong and Shanghai Banking Corporation Limited. |
| |
| 4 | | Includes fees as non-executive Chairman of HSBC North America Holdings Inc. |
230
Directors’ Remuneration Report(continued)
Pensions
V H C Cheng is a member of the Hong Kong Special Administrative Region Mandatory Provident Fund (‘MPF’) and received an executive allowance of 25% of annual basic salary during 2010, less the mandatory contributions to the MPF by both the employer and employee, to fund personal pension arrangements (HK$2,313,000). During 2010, the mandatory employer contribution to the MPF in respect of Mr Cheng was HK$12,000.
D J Flint received an executive allowance of 55% of basic salary in lieu of personal pension arrangements in the month of January. From 1 February 2010, this allowance was reduced to 50% of basic salary. The executive allowance for the whole of 2010 amounted to £425,224.
A A Flockhart received employer contributions of 40% of basic salary into a personal pension plan in the month of January 2010. From 1 February 2010 Mr Flockhart received employer contributions of 50% of basic salary into a pension plan. The employer contributions for the whole of 2010 amounted to £404,319.
M F Geoghegan received an executive allowance of 50% of basic salary in lieu of pension between 1 January and 25 January 2010. From 26 January 2010, Mr Geoghegan received employer contributions of 50% of basic salary into a pension
plan. The employer contributions for the whole of 2010 amounted to £560,486.
Lord Green ceased membership of the HSBC Bank (UK) Pension Scheme on 5 April 2006. Since 6 April 2006, Lord Green has been entitled to receive benefits from an Employer Funded Retirement Benefits Scheme which together with entitlements from the HSBC Bank (UK) Pension Scheme provided benefits to Lord Green that were broadly comparable to an accrual rate of one-thirtieth of pensionable salary for each year of pensionable service. Lord Green retired on 3 December 2010 and began receiving his pension from 4 December 2010.
S T Gulliver received employer contributions of 30% of basic salary into a personal pension plan in the month of January 2010. From 1 February 2010 Mr Gulliver’s pension arrangements were increased to 50% of basic salary. This was delivered as employer contributions of 30% of basic salary into a personal pension plan and an executive allowance of 20% of basic salary. The employer contributions and the executive allowance for the whole of 2010 amounted to £386,667.
I J Mackay received an executive allowance of 50% of basic salary in lieu of pension with effect from his appointment as executive Director on 3 December 2010 (£28,269 for the period to 31 December 2010) to fund personal pension arrangements.
Defined Benefit Pension arrangements
| | | | | | | | | | | | | | | | | | | | | | | | | | | | | |
| | | | | | | | | | | | | | | | | | | | | | | | | | | Transfer value | |
| | | | | | | | | | | | | | | | | | | | | | | | | | | (less personal | |
| | | | | | | | | | | Increase in | | | | | | | | | | | Increase of | | | contributions) at | |
| | | | | | | | | | | accrued | | | Transfer | | | Transfer | | | transfer value | | | 31 December 2010 | |
| | | Accrued | | | Increase in | | | pension | | | value | | | value | | | of accrued | | | relating to increase | |
| | | annual | | | accrued | | | during 2010, | | | of accrued | | | of accrued | | | pension (less | | | in accrued pensions | |
| | | pension at | | | pension | | | excluding | | | pension at | | | pension at | | | personal | | | during 2010, | |
| | | 31 December | | | during | | | any increase | | | 31 December | | | 31 December | | | contributions) | | | excluding any | |
| | | 2010 | | | 2010 | | | for inflation | | | 2009 | 1 | | 2010 | 1 | | in 2010 | 1 | | increase for inflation | 1 |
| | | £000 | | | £000 | | | £000 | | | £000 | | | £000 | | | £000 | | | £000 | |
| | | | | | | | | | | | | | | | | | | | | | | | | | | | | |
A A Flockhart2 | | | 283 | | | | 13 | | | | 13 | | | | 4,863 | | | | 4,974 | | | | 111 | | | | 201 | |
Lord Green3 | | | – | | | | 38 | | | | 5 | | | | 19,119 | | | | – | | | | 381 | | | | – | |
| | |
| 1 | | The transfer value represents a liability of HSBC’s pension funds and not a sum paid or due to the individual; it cannot therefore meaningfully be added to annual remuneration. |
| |
| 2 | | A A Flockhart ceased accrual of pension in the International Staff Retirement Benefits Scheme (‘ISRBS’) on 30 November 2008 and he has deferred commencement of his pension. He received no increase for inflation to his accrued pension on 1 January 2010. The ISRBS retains a liability for a contingent spouse’s pension of £129,900 per annum as at 31 December 2010. |
| |
| 3 | | Lord Green retired as a Director on 3 December 2010 and commenced receiving his pension from 4 December 2010. |
The table overleaf shows unfunded pension payments, in respect of which provision has been made, during 2010 to six former Directors of HSBC Holdings.
The payments in respect of R Delbridge and Sir Brian Pearse were made by HSBC Bank plc as
former directors of that bank. The payment in respect of C F W de Croisset was made by HSBC France as a former director of that bank. There were no increases to sterling values of the pensions during 2010.
231
Directors’ Remuneration Report(continued)
Unfunded pension payments
| | | | | | | | | |
| | | 2010 | | | 2009 | |
| | | £ | | | £ | |
| | | | | | | | | |
| B H Asher | | | 101,858 | | | | 101,858 | |
| C F W de Croisset | | | 237,662 | | | | 247,115 | |
| R Delbridge | | | 146,507 | | | | 146,507 | |
| Lord Green | | | 2,992 | | | | – | |
| Sir Brian Pearse | | | 61,095 | | | | 61,095 | |
| Sir William Purves | | | 107,827 | | | | 107,827 | |
| | | | | |
| | | | | | | | | |
| | | | 657,941 | | | | 664,402 | |
| | | | | |
Share Plans
At 31 December 2010, the undernamed Directors held options and awards of Performance Shares and Restricted Shares to acquire the number of HSBC Holdings ordinary shares set against their respective names.
HSBC Holdings savings-related share option plans
HSBC Holdings ordinary shares of US$0.50
| | | | | | | | | | | | | | | | | | | | | | | | | |
| | | | | | | | | | | | | | | | | | | At | | | At | |
| | | Date of | | | Exercise | | | Exercisable | | 1 Jan | | | 31 Dec | |
| | | award | | | price (£) | | | from1 | | | until | | | 2010 | | | 2010 | |
| | | | | | | | | | | | | | | | | | | | | | | | | |
| D J Flint | | 25 Apr 2007 | | | | 6.1760 | | | 1 Aug 2012 | | | 31 Jan 2013 | | | | 2,650 | | | | 2,650 | |
| A A Flockhart | | 29 Apr 2009 | | | | 3.3116 | | | 1 Aug 2014 | | | 31 Jan 2015 | | | | 4,529 | | | | 4,529 | |
| | | | | | | | | | | | | | | | | | | | | | | | | |
| | | | | | | US$ | | | | | | | | | | | | | | | | | |
| I J Mackay | | 30 Apr 2008 | | | | 11.8824 | | | 1 Aug 2011 | | | 31 Jan 2012 | | | | 1,531 | 2 | | | 1,531 | |
| | |
| The HSBC Holdings savings-related share option plans are all-employee share plans under which eligible HSBC employees may be granted options to acquire HSBC Holdings ordinary shares. Employees may make contributions of up to £250 (or equivalent) each month over a period of one, three or five years which may be used on the first, third or fifth anniversary of the commencement of the relevant savings contract, at the employee’s election, to exercise the options. The plans help align the interests of employees with the creation of shareholder value and, as such, exercise of the options is not subject to any performance conditions. The options were awarded for nil consideration and are exercisable at a 20% discount to the average market value of the ordinary shares on the five business days immediately preceding the invitation date. No options lapsed during the year. There are no performance criteria conditional upon which the outstanding options are exercisable and there have been no variations to the terms and conditions since the awards were made. The market value per ordinary share at 31 December 2010 was £6.511. The highest and lowest market values per ordinary share during the year were £7.404 and £5.962. Market value is the mid-market price derived from the London Stock Exchange Daily Official List on the relevant date. Under the Securities and Futures Ordinance of Hong Kong, the options are categorised as unlisted physically settled equity derivatives. |
| |
| 1 | | May be advanced to an earlier date in certain circumstances, e.g. retirement. |
| |
| 2 | | Interest at 3 December 2010 – date of appointment. |
Awards of Performance Shares
HSBC Share Plan
HSBC Holdings ordinary shares of US$0.50
| | | | | | | | | | | | | | | | | | | | | | | | | |
| | | | | | | Year in | | | Awards | | | Awards vested | | Awards | |
| | | | | | | which | | | held at | | | during year1,2 | | held at | |
| | | Date of | | | awards | | | 1 Jan | | | | | | | Monetary | | | 31 Dec | |
| | | award | | | may vest | | | 2010 | | | | | | | value | | | 2010 | 3 |
| | | | | | | | | | | | | | | Number | | | £000 | | | | | |
| | | | | | | | | | | | | | | | | | | | | | | | | |
| V H C Cheng | | 5 Mar 2007 | | | 2010 | | | | 218,035 | | | | 83,769 | | | | 560 | | | | – | |
| | | 3 Jun 2008 | | | 2011 | | | | 157,852 | | | | – | | | | – | | | | 163,188 | |
| | | | | | | | | | | | | | | | | | | | | | | | | |
| D J Flint | | 5 Mar 2007 | | | 2010 | | | | 326,626 | | | | 125,489 | | | | 838 | | | | – | |
| | | 3 Jun 2008 | | | 2011 | | | | 455,210 | | | | – | | | | – | | | | 470,596 | |
| | | | | | | | | | | | | | | | | | | | | | | | | |
| A A Flockhart | | 5 Mar 2007 | | | 2010 | | | | 145,238 | | | | 55,799 | | | | 373 | | | | – | |
| | | 3 Jun 2008 | | | 2011 | | | | 155,227 | | | | – | | | | – | | | | 160,474 | |
| | | | | | | | | | | | | | | | | | | | | | | | | |
| M F Geoghegan | | 5 Mar 2007 | | | 2010 | | | | 742,334 | | | | 285,205 | | | | 1,905 | | | | – | |
| | | 3 Jun 2008 | | | 2011 | | | | 1,069,746 | | | | – | | | | – | | | | 1,105,902 | |
| | | | | | | | | | | | | | | | | | | | | | | | | |
| Lord Green | | 5 Mar 2007 | | | 2010 | | | | 556,750 | | | | 213,903 | | | | 1,429 | | | | – | |
| | | 3 Jun 2008 | | | 2011 | | | | 1,251,829 | | | | – | | | | – | | | | 1,294,140 | 4 |
| | | | | | | | | | | | | | | | | | | | | | | | | |
| S T Gulliver | | 5 Mar 2007 | | | 2010 | | | | 161,319 | | | | 61,979 | | | | 414 | | | | – | |
| | | 3 Jun 2008 | | | 2011 | | | | 67,631 | | | | – | | | | – | | | | 69,917 | |
| | |
| Vesting of these awards of Performance Shares is subject to the achievement of the corporate performance conditions set out on pages 226 to 228. Interests in awards of Performance Shares are categorised under the Securities and Futures Ordinance of Hong Kong as the interests of a beneficiary of a trust. |
232
Directors’ Remuneration Report(continued)
| | |
| 1 | | The performance conditions of the total shareholder return element of the award were partially met and the following part of the awards vested on 31 March 2010, when the market value per share was £6.68: V H C Cheng, 82,957 shares; D J Flint, 124,273 shares; A A Flockhart, 55,259 shares; M F Geoghegan, 282,440 shares; Lord Green, 211,830 shares; and S T Gulliver, 61,378 shares. The following awards representing the fourth interim dividend for 2009 vested on 5 May 2010, when the market value per share was £6.53: V H C Cheng, 812 shares; D J Flint, 1,216 shares; A A Flockhart, 540 shares; M F Geoghegan, 2,765 shares; Lord Green, 2,073 shares; and S T Gulliver, 601 shares. The market value per share on the date of the award, 5 March 2007, was £8.96. |
| |
| 2 | | The performance conditions for the earnings per share element and the remaining part of the total shareholder return element of the award were not met and, under the terms of the Plan, the following awards were forfeited on 31 March 2010: V H C Cheng, 136,506 shares; D J Flint, 204,493 shares; A A Flockhart, 90,931 shares; M F Geoghegan, 464,757 shares; Lord Green, 348,568 shares; and S T Gulliver, 100,998 shares. As a consequence, the fourth interim dividend for 2009 did not accrue on the forfeited shares. |
| |
| 3 | | Includes additional shares arising from scrip dividends. |
| |
| 4 | | Interest at 3 December 2010 – date of retirement. |
Awards of Restricted Shares
HSBC Share Plan
HSBC Holdings ordinary shares of US$0.50
| | | | | | | | | | | | | | | | | | | | | | | | | | | | | | | | | |
| | | | | | | Year in | | | Awards | | | Awards made | | Awards vested | | Awards | |
| | | | | | | which | | | held on | | | during year1 | | during year2 | | held at | |
| | | Date of | | awards | | | 1 Jan | | | | | | | Monetary | | | | | | | Monetary | | | 31 Dec | |
| | | award | | may vest | | | 2010 | | | Number | | | value | | | Number | | | value | | | 2010 | 3 |
| | | | | | | | | | | | | | | | | | | £000 | | | | | | | £000 | | | | | |
| | | | | | | | | | | | | | | | | | | | | | | | | | | | | | | | | |
| V H C Cheng | | 3 Mar 2008 | | | 2010 | 4 | | | 103,936 | | | | – | | | | – | | | | 104,616 | | | | 713 | | | | – | |
| | | 2 Mar 2009 | | | 2012 | | | | 493,545 | | | | – | | | | – | | | | – | | | | – | | | | 510,226 | |
| | | 1 Mar 2010 | | | 2013 | | | | – | | | | 193,534 | | | | 1,320 | | | | – | | | | – | | | | 198,773 | |
| | | | | | | | | | | | | | | | | | | | | | | | | | | | | | | | | |
| D J Flint | | 1 Mar 2010 | | | 2011-2013 | 5 | | | – | | | | 307,917 | | | | 2,100 | | | | – | | | | – | | | | 316,252 | |
| | | | | | | | | | | | | | | | | | | | | | | | | | | | | | | | | |
| A A Flockhart | | 31 Oct 2007 | | | 2010 | | | | 64,621 | | | | – | | | | – | | | | 66,806 | 6 | | | 434 | | | | – | |
| | | 3 Mar 2008 | | | 2011 | | | | 15,064 | | | | – | | | | – | | | | – | | | | – | | | | 15,572 | |
| | | 2 Mar 2009 | | | 2012 | | | | 498,124 | | | | – | | | | – | | | | – | | | | – | | | | 514,960 | |
| | | 1 Mar 2010 | | | 2011-2013 | 5 | | | – | | | | 297,746 | | | | 2,031 | | | | – | | | | – | | | | 305,806 | |
| | | | | | | | | | | | | | | | | | | | | | | | | | | | | | | | | |
| M F Geoghegan | | 1 Mar 2010 | | | 2011-2013 | 5 | | | – | | | | 586,510 | | | | 4,000 | | | | – | | | | – | | | | 602,387 | |
| | | | | | | | | | | | | | | | | | | | | | | | | | | | | | | | | |
| S T Gulliver | | 5 Mar 2007 | | | 2008-2010 | 5 | | | 191,842 | | | | – | | | | – | | | | 193,099 | | | | 1,317 | | | | – | |
| | | 3 Mar 2008 | | | 2009-2011 | 5 | | | 388,157 | | | | – | | | | – | | | | 202,986 | | | | 1,384 | | | | 192,796 | |
| | | 1 Mar 2010 | | | 2011-2013 | 5 | | | – | | | | 1,319,648 | | | | 9,000 | | | | – | | | | – | | | | 1,355,371 | |
| | | | | | | | | | | | | | | | | | | | | | | | | | | | | | | | | |
| I J Mackay | | 31 Jul 2007 | | | 2009-2011 | 7 | | | 47,679 | 8 | | | – | | | | – | | | | – | | | | – | | | | 47,679 | |
| | | 31 Mar 2008 | | | 2011 | | | | 46,252 | 8 | | | – | | | | – | | | | – | | | | – | | | | 46,252 | |
| | | 2 Mar 2009 | | | 2012 | | | | 100,309 | 8 | | | – | | | | – | | | | – | | | | – | | | | 100,309 | |
| | | 1 Mar 2010 | | | 2011-2013 | 5 | | | 59,262 | 8 | | | – | | | | – | | | | – | | | | – | | | | 59,262 | |
| | |
| Vesting of Restricted Share awards is normally subject to the Director remaining an employee on the vesting date. The vesting date may be advanced to an earlier date in certain circumstances, e.g. death or retirement. Under the Securities and Futures Ordinance of Hong Kong, interests in Restricted Share awards granted in 2007 and 2008 are categorised as the interests of a beneficiary of a trust and interests in Restricted Share awards granted in 2009 and 2010 are categorised as the interests of a beneficial owner. |
| |
| 1 | | At the date of the award, 1 March 2010, the market value per share was £6.82. |
| |
| 2 | | At the date of vesting, 1 March 2010, the market value per share was £6.82. The market value per share on the dates of the awards, 5 March 2007 and 3 March 2008, was £8.96 and £7.90 respectively. |
| |
| 3 | | Includes additional shares arising from scrip dividends. |
| |
| 4 | | Vesting accelerated from 2011 to 2010. |
| |
| 5 | | 33% of the award vests on each of the first and second anniversaries of the date of the award, with the balance vesting on the third anniversary of the date of the award. |
| |
| 6 | | At the date of vesting, 29 October 2010, the market value per share was £6.49. The market value per share on the date of the award, 31 October 2007 was £9.51. |
| |
| 7 | | 33% of the award vests on each of the second and third anniversaries of the date of the award with the balance vesting on the fourth anniversary of the date of the award. |
| |
| 8 | | Interest at 3 December 2010 – date of appointment. |
| | | |
| | | |
| | | |
| On behalf of the Board | | |
| J L Thornton | | |
| Chairman of Remuneration Committee | | 28 February 2011 |
233
This page intentionally left blank.
234
Report of Independent Registered Public Accounting Firm to the Board of Directors and Shareholders of HSBC Holdings plc
We have audited the accompanying consolidated financial statements of HSBC Holdings plc and its subsidiary undertakings (together ‘HSBC’) on pages 238 to 370 which comprise the consolidated balance sheets as of 31 December 2010 and 2009, and the related consolidated income statements, consolidated statements of cash flows, consolidated statements of comprehensive income and consolidated statements of changes in equity, for each of the years in the three-year period ended 31 December 2010, including the disclosures marked ‘audited’ within the critical accounting policies on pages 33 to 36, the ‘Report of the Directors: Risk’ section on pages 86 to 176 and the ‘Report of the Directors: Capital’ section on pages 177 to 182. We have also audited HSBC’s internal control over financial reporting as of 31 December 2010, based on the framework for Directors’ internal control evaluation contained within the Combined Code (The Revised Turnbull Guidance), and the criteria established inInternal Control – Integrated Frameworkissued by the Committee of Sponsoring Organizations of the Treadway Commission (‘COSO’). HSBC’s management is responsible for these consolidated financial statements, for maintaining effective internal control over financial reporting, and for its assessment of the effectiveness of internal control over financial reporting, included in the accompanying ‘Management’s Assessment of Internal Controls’. Our responsibility is to express an opinion on these consolidated financial statements and an opinion on the effectiveness of HSBC’s internal control over financial reporting based on our audits.
We conducted our audits in accordance with the standards of the Public Company Accounting Oversight Board (United States). Those standards require that we plan and perform the audits to obtain reasonable assurance about whether the financial statements are free of material misstatement and whether effective internal control over financial reporting was maintained in all material respects. Our audits of the consolidated financial statements included examining, on a test basis, evidence supporting the amounts and disclosures in the financial statements, assessing the accounting principles used and significant estimates made by management, and evaluating the overall financial statement presentation. Our audit of internal control over financial reporting included obtaining an understanding of internal control over financial reporting, assessing the risk that a material weakness exists, and testing and evaluating the design and operating effectiveness of internal control based on assessed risk. Our audits also included performing other such procedures as we considered necessary in the circumstances. We believe that our audits provide a reasonable basis for our opinions.
A company’s internal control over financial reporting is a process designed to provide reasonable assurance regarding the reliability of financial reporting and the preparation of financial statements for external purposes in accordance with generally accepted accounting principles. A company’s internal control over financial reporting includes those policies and procedures that (1) pertain to the maintenance of records that, in reasonable detail, accurately and fairly reflect the transactions and dispositions of the assets of the company; (2) provide reasonable assurance that transactions are recorded as necessary to permit preparation of financial statements in accordance with generally accepted accounting principles, and that receipts and expenditures of the company are being made only in accordance with authorisations of management and directors of the company; and (3) provide reasonable assurance regarding prevention or timely detection of unauthorised acquisition, use, or disposition of the company’s assets that could have a material effect on the financial statements.
Because of its inherent limitations, internal control over financial reporting may not prevent or detect misstatements. Also, projections of any evaluation of effectiveness to future periods are subject to the risk that controls may become inadequate because of changes in conditions, or that the degree of compliance with the policies or procedures may deteriorate.
235
Report of Independent Registered Public Accounting Firm to the Board of Directors and Shareholders of HSBC Holdings plc(continued)
In our opinion, the consolidated financial statements referred to above present fairly, in all material respects, the financial position of HSBC as of 31 December 2010 and 2009, and the results of its operations and its cash flows for each of the years in the three-year period ended 31 December 2010, in conformity with International Financial Reporting Standards (‘IFRSs’) as adopted by the European Union (‘EU’) and IFRSs as issued by the International Accounting Standards Board (‘IASB’). Also, in our opinion, HSBC maintained, in all material respects, effective internal control over financial reporting as of 31 December 2010, based on the framework for Directors’ internal control evaluation contained within the Combined Code (The Revised Turnbull Guidance) and the criteria established inInternal Control — Integrated Frameworkissued by COSO.
As set out in the note ‘Reclassification of financial assets’ on page 320, for the year ended 31 December 2008, HSBC changed its method of accounting for certain financial assets following the adoption of ‘Reclassification of Financial Assets (‘Amendments to IAS 39 Financial Instruments: Recognition and Measurement and IFRS 7 Financial Instruments: Disclosures’)’.
KPMG Audit Plc
London, England
28 February 2011
236
Financial statements
Financial statements
Financial statements
| | | | | | | |
| | | | | Page | |
| | | | | | | |
| Financial Statements | | | | |
| | | 238 | |
| | | | | | | |
| | | 239 | |
| | | | | | | |
| | | 240 | |
| | | | | | | |
| | | 241 | |
| | | | | | | |
| | | 242 | |
| | | | | | | |
| | | 245 | |
| | | | | | | |
| | | 246 | |
| | | | | | | |
| | | 247 | |
| | | | | | | |
| Notes on the Financial Statements | | | | |
| | | | | | | |
| 1 | | | | | 250 | |
| | | | | | | |
| 2 | | | | | 253 | |
| | | | | | | |
| 3 | | | | | 271 | |
| | | | | | | |
| 4 | | | | | 272 | |
| | | | | | | |
| 5 | | | | | 272 | |
| | | | | | | |
| 6 | | | | | 273 | |
| | | | | | | |
| 7 | | | | | 274 | |
| | | | | | | |
| 8 | | | | | 285 | |
| | | | | | | |
| 9 | | | | | 286 | |
| | | | | | | |
| 10 | | | | | 291 | |
| | | | | | | |
| 11 | | | | | 295 | |
| | | | | | | |
| 12 | | | | | 296 | |
| | | | | | | |
| 13 | | | | | 296 | |
| | | | | | | |
| 14 | | | | | 303 | |
| | | | | | | |
| 15 | | | | | 307 | |
| | | | | | | |
| 16 | | | | | 308 | |
| | | | | | | |
| 17 | | | | | 318 | |
| | | | | | | |
| 18 | | | | | 320 | |
| | | | | | | |
| | | | | Page | |
| 19 | | | | | 321 | |
| | | | | | | |
| 20 | | | | | 322 | |
| | | | | | | |
| 21 | | | | | 326 | |
| | | | | | | |
| 22 | | | | | 329 | |
| | | | | | | |
| 23 | | | | | 330 | |
| | | | | | | |
| 24 | | | | | 332 | |
| | | | | | | |
| 25 | | | | | 336 | |
| | | | | | | |
| 26 | | | | | 338 | |
| | | | | | | |
| 27 | | | | | 340 | |
| | | | | | | |
| 28 | | | | | 340 | |
| | | | | | | |
| 29 | | | | | 341 | |
| | | | | | | |
| 30 | | | | | 341 | |
| | | | | | | |
| 31 | | | | | 342 | |
| | | | | | | |
| 32 | | | | | 343 | |
| | | | | | | |
| 33 | | | | | 346 | |
| | | | | | | |
| 34 | | | | | 346 | |
| | | | | | | |
| 35 | | | | | 350 | |
| | | | | | | |
| 36 | | | | | 351 | |
| | | | | | | |
| 37 | | | | | 352 | |
| | | | | | | |
| 38 | | | | | 352 | |
| | | | | | | |
| 39 | | | | | 353 | |
| | | | | | | |
| 40 | | | | | 356 | |
| | | | | | | |
| 41 | | | | | 358 | |
| | | | | | | |
| 42 | | | | | 359 | |
| | | | | | | |
| 43 | | | | | 361 | |
| | | | | | | |
| 44 | | | | | 365 | |
| | | | | | | |
| 45 | | | | | 368 | |
| | | | | | | |
| 46 | | | | | 370 | |
| | | | | | | |
| | | 370 | |
237
Financial Statements(continued)
Consolidated income statement for the year ended 31 December 2010
| | | | | | | | | | | | | | | | | |
| | | | | | | 2010 | | | 2009 | | | 2008 | |
| | | Notes | | | US$m | | | US$m | | | US$m | |
| | | | | | | | | | | | | | | | | |
| | | | | | | | | | | |
| Interest income | | | | | | | 58,345 | | | | 62,096 | | | | 91,301 | |
| Interest expense | | | | | | | (18,904 | ) | | | (21,366 | ) | | | (48,738 | ) |
| | | | | | | | | | | |
| | | | | | | | | | | | | | | | | |
| Net interest income | | | | | | | 39,441 | | | | 40,730 | | | | 42,563 | |
| | | | | | | | | | | | | | | | | |
| | | | | | | | | | | |
| Fee income | | | | | | | 21,117 | | | | 21,403 | | | | 24,764 | |
| Fee expense | | | | | | | (3,762 | ) | | | (3,739 | ) | | | (4,740 | ) |
| | | | | | | | | | | |
| | | | | | | | | | | | | | | | | |
| Net fee income | | | | | | | 17,355 | | | | 17,664 | | | | 20,024 | |
| | | | | | | | | | | | | | | | | |
| | | | | | | | | | | |
| Trading income excluding net interest income | | | | | | | 4,680 | | | | 6,236 | | | | 847 | |
| Net interest income on trading activities | | | | | | | 2,530 | | | | 3,627 | | | | 5,713 | |
| | | | | | | | | | | |
| | | | | | | | | | | | | | | | | |
| Net trading income | | | | | | | 7,210 | | | | 9,863 | | | | 6,560 | |
| | | | | | | | | | | | | | | | | |
| | | | | | | | | | | |
| Changes in fair value of long-term debt issued and related derivatives | | | | | | | (258 | ) | | | (6,247 | ) | | | 6,679 | |
| Net income/(expense) from other financial instruments designated at fair value | | | | | | | 1,478 | | | | 2,716 | | | | (2,827 | ) |
| | | | | | | | | | | |
| | | | | | | | | | | | | | | | | |
| Net income/(expense) from financial instruments designated at fair value | | | 3 | | | | 1,220 | | | | (3,531 | ) | | | 3,852 | |
| | | | | | | | | | | | | | | | | |
| Gains less losses from financial investments | | | | | | | 968 | | | | 520 | | | | 197 | |
| Dividend income | | | | | | | 112 | | | | 126 | | | | 272 | |
| Net earned insurance premiums | | | 4 | | | | 11,146 | | | | 10,471 | | | | 10,850 | |
| Gains on disposal of French regional banks | | | | | | | – | | | | – | | | | 2,445 | |
| Other operating income | | | | | | | 2,562 | | | | 2,788 | | | | 1,808 | |
| | | | | | | | | | | |
| | | | | | | | | | | | | | | | | |
Total operating income | | | | | | | 80,014 | | | | 78,631 | | | | 88,571 | |
| | | | | | | | | | | | | | | | | |
| Net insurance claims incurred and movement in liabilities to policyholders | | | 5 | | | | (11,767 | ) | | | (12,450 | ) | | | (6,889 | ) |
| | | | | | | | | | | |
| | | | | | | | | | | | | | | | | |
Net operating income before loan impairment charges and other credit risk provisions | | | | | | | 68,247 | | | | 66,181 | | | | 81,682 | |
| | | | | | | | | | | | | | | | | |
| Loan impairment charges and other credit risk provisions | | | 6 | | | | (14,039 | ) | | | (26,488 | ) | | | (24,937 | ) |
| | | | | | | | | | | |
| | | | | | | | | | | | | | | | | |
Net operating income | | | 6 | | | | 54,208 | | | | 39,693 | | | | 56,745 | |
| | | | | | | | | | | |
| | | | | | | | | | | | | | | | | |
| Employee compensation and benefits | | | 7 | | | | (19,836 | ) | | | (18,468 | ) | | | (20,792 | ) |
| General and administrative expenses | | | | | | | (15,156 | ) | | | (13,392 | ) | | | (15,260 | ) |
| Depreciation and impairment of property, plant and equipment | | | 25 | | | | (1,713 | ) | | | (1,725 | ) | | | (1,750 | ) |
| Goodwill impairment | | | 24 | | | | – | | | | – | | | | (10,564 | ) |
| Amortisation and impairment of intangible assets | | | 24 | | | | (983 | ) | | | (810 | ) | | | (733 | ) |
| | | | | | | | | | | |
| | | | | | | | | | | | | | | | | |
Total operating expenses | | | | | | | (37,688 | ) | | | (34,395 | ) | | | (49,099 | ) |
| | | | | | | | | | | |
| | | | | | | | | | | | | | | | | |
Operating profit | | | | | | | 16,520 | | | | 5,298 | | | | 7,646 | |
| | | | | | | | | | | | | | | | | |
| Share of profit in associates and joint ventures | | | 23 | | | | 2,517 | | | | 1,781 | | | | 1,661 | |
| | | | | | | | | | | |
| | | | | | | | | | | | | | | | | |
Profit before tax | | | | | | | 19,037 | | | | 7,079 | | | | 9,307 | |
| | | | | | | | | | | | | | | | | |
| Tax expense | | | 10 | | | | (4,846 | ) | | | (385 | ) | | | (2,809 | ) |
| | | | | | | | | | | |
| | | | | | | | | | | | | | | | | |
Profit for the year | | | | | | | 14,191 | | | | 6,694 | | | | 6,498 | |
| | | | | | | | | | | |
| | | | | | | | | | | | | | | | | |
| Profit attributable to shareholders of the parent company | | | | | | | 13,159 | | | | 5,834 | | | | 5,728 | |
| Profit attributable to non-controlling interests | | | | | | | 1,032 | | | | 860 | | | | 770 | |
| | | | | | | | | | | | | | | | | |
| | | | | | | US$ | | | US$ | | | US$ | |
| | | | | | | | | | | | | | | | | |
| Basic earnings per ordinary share | | | 12 | | | | 0.73 | | | | 0.34 | | | | 0.41 | |
| Diluted earnings per ordinary share | | | 12 | | | | 0.72 | | | | 0.34 | | | | 0.41 | |
The accompanying notes on pages 250 to 370, ‘Critical accounting policies’ on pages 33 to 36, the audited sections of ‘Risk’ on pages 86 to 176 and the audited sections of ‘Capital’ on pages 177 to 182 form an integral part of these financial statements.
238
Financial Statements(continued)
Consolidated statement of comprehensive income for the year ended 31 December 2010
| | | | | | | | | | | | | |
| | | 2010 | | | 2009 | | | 2008 | |
| | | US$m | | | US$m | | | US$m | |
| | | | | | | | | | | | | |
| Profit for the year | | | 14,191 | | | | 6,694 | | | | 6,498 | |
| | | | | | | | | | | | | |
Other comprehensive income/(expense) | | | | | | | | | | | | |
| Available-for-sale investments | | | 5,835 | | | | 10,817 | | | | (21,904 | ) |
| | | | | | | |
| – fair value gains/(losses) | | | 6,368 | | | | 9,821 | | | | (23,722 | ) |
| – fair value gains transferred to income statement on disposal | | | (1,174 | ) | | | (648 | ) | | | (1,316 | ) |
| – amounts transferred to the income statement in respect of impairment losses | | | 1,118 | | | | 2,391 | | | | 1,779 | |
| – income taxes | | | (477 | ) | | | (747 | ) | | | 1,355 | |
| | | | | | | |
| | | | | | | | | | | | | |
| Cash flow hedges | | | (271 | ) | | | 772 | | | | 124 | |
| | | | | | | |
| – fair value gains/(losses) | | | (178 | ) | | | 481 | | | | (1,720 | ) |
| – fair value (gains)/losses transferred to income statement | | | (164 | ) | | | 808 | | | | 1,754 | |
| – income taxes | | | 71 | | | | (517 | ) | | | 90 | |
| | | | | | | |
| | | | | | | | | | | | | |
| Actuarial losses on defined benefit plans | | | (61 | ) | | | (2,608 | ) | | | (1,175 | ) |
| | | | | | | |
| – before income taxes | | | (60) | | | | (3,586 | ) | | | (1,609 | ) |
| – income taxes | | | (1 | ) | | | 978 | | | | 434 | |
| | | | | | | |
| | | | | | | | | | | | | |
| Share of other comprehensive income/(expense) of associates and joint ventures | | | 107 | | | | 149 | | | | (559 | ) |
| Exchange differences | | | (567 | ) | | | 4,975 | | | | (12,123 | ) |
| | | | | | | |
| Other comprehensive income/(expense) for the year, net of tax | | | 5,043 | | | | 14,105 | | | | (35,637 | ) |
| | | | | | | |
| | | | | | | | | | | | | |
| Total comprehensive income/(expense) for the year | | | 19,234 | | | | 20,799 | | | | (29,139 | ) |
| | | | | | | |
| | | | | | | | | | | | | |
| Total comprehensive income/(expense) for the year attributable to: | | | | | | | | | | | | |
| – shareholders of the parent company | | | 18,087 | | | | 19,529 | | | | (29,143 | ) |
| – non-controlling interests | | | 1,147 | | | | 1,270 | | | | 4 | |
| | | | | | | |
| | | | | | | | | | | | | |
| | | | 19,234 | | | | 20,799 | | | | (29,139 | ) |
| | | | | | | |
The accompanying notes on pages 250 to 370, ‘Critical accounting policies’ on pages 33 to 36, the audited sections of ‘Risk’ on pages 86 to 176 and the audited sections of ‘Capital’ on pages 177 to 182 form an integral part of these financial statements.
239
Financial Statements(continued)
Consolidated balance sheet at 31 December 2010
| | | | | | | | | | | | | |
| | | | | | | 2010 | | | 2009 | |
| | | Notes | | | US$m | | | US$m | |
| | | | | | | | | | | | | |
Assets | | | | | | | | | | | | |
| | | | | | | | | | | | | |
| Cash and balances at central banks | | | | | | | 57,383 | | | | 60,655 | |
| Items in the course of collection from other banks | | | | | | | 6,072 | | | | 6,395 | |
| Hong Kong Government certificates of indebtedness | | | | | | | 19,057 | | | | 17,463 | |
| Trading assets | | | 15 | | | | 385,052 | | | | 421,381 | |
| Financial assets designated at fair value | | | 19 | | | | 37,011 | | | | 37,181 | |
| Derivatives | | | 20 | | | | 260,757 | | | | 250,886 | |
| Loans and advances to banks | | | | | | | 208,271 | | | | 179,781 | |
| Loans and advances to customers | | | | | | | 958,366 | | | | 896,231 | |
| Financial investments | | | 21 | | | | 400,755 | | | | 369,158 | |
| Other assets | | | 27 | | | | 43,251 | | | | 44,534 | |
| Current tax assets | | | | | | | 1,096 | | | | 2,937 | |
| Prepayments and accrued income | | | | | | | 11,966 | | | | 12,423 | |
| Interests in associates and joint ventures | | | 23 | | | | 17,198 | | | | 13,011 | |
| Goodwill and intangible assets | | | 24 | | | | 29,922 | | | | 29,994 | |
| Property, plant and equipment | | | 25 | | | | 11,521 | | | | 13,802 | |
| Deferred tax assets | | | 10 | | | | 7,011 | | | | 8,620 | |
| | | | | | | | | |
| | | | | | | | | | | | | |
| Total assets | | | | | | | 2,454,689 | | | | 2,364,452 | |
| | | | | | | | | |
| | | | | | | | | | | | | |
Liabilities and equity | | | | | | | | | | | | |
| | | | | | | | | | | | | |
Liabilities | | | | | | | | | | | | |
| Hong Kong currency notes in circulation | | | | | | | 19,057 | | | | 17,463 | |
| Deposits by banks | | | | | | | 110,584 | | | | 124,872 | |
| Customer accounts | | | | | | | 1,227,725 | | | | 1,159,034 | |
| Items in the course of transmission to other banks | | | | | | | 6,663 | | | | 5,734 | |
| Trading liabilities | | | 28 | | | | 300,703 | | | | 268,130 | |
| Financial liabilities designated at fair value | | | 29 | | | | 88,133 | | | | 80,092 | |
| Derivatives | | | 20 | | | | 258,665 | | | | 247,646 | |
| Debt securities in issue | | | 30 | | | | 145,401 | | | | 146,896 | |
| Other liabilities | | | 31 | | | | 28,050 | | | | 68,640 | |
| Current tax liabilities | | | | | | | 1,804 | | | | 2,140 | |
| Liabilities under insurance contracts | | | 32 | | | | 58,609 | | | | 53,707 | |
| Accruals and deferred income | | | | | | | 13,906 | | | | 13,190 | |
| Provisions | | | 33 | | | | 2,138 | | | | 1,965 | |
| Deferred tax liabilities | | | 10 | | | | 1,093 | | | | 1,837 | |
| Retirement benefit liabilities | | | 7 | | | | 3,856 | | | | 6,967 | |
| Subordinated liabilities | | | 34 | | | | 33,387 | | | | 30,478 | |
| | | | | | | | | |
| | | | | | | | | | | | | |
| Total liabilities | | | | | | | 2,299,774 | | | | 2,228,791 | |
| | | | | | | | | |
| | | | | | | | | | | | | |
Equity | | | | | | | | | | | | |
| Called up share capital | | | 39 | | | | 8,843 | | | | 8,705 | |
| Share premium account | | | | | | | 8,454 | | | | 8,413 | |
| Other equity instruments | | | | | | | 5,851 | | | | 2,133 | |
| Other reserves | | | | | | | 27,169 | | | | 22,236 | |
| Retained earnings | | | | | | | 97,350 | | | | 86,812 | |
| | | | | | | | | |
| | | | | | | | | | | | | |
| Total shareholders’ equity | | | | | | | 147,667 | | | | 128,299 | |
| Non-controlling interests | | | 38 | | | | 7,248 | | | | 7,362 | |
| | | | | | | | | |
| | | | | | | | | | | | | |
| Total equity | | | | | | | 154,915 | | | | 135,661 | |
| | | | | | | | | |
| | | | | | | | | | | | | |
| Total equity and liabilities | | | | | | | 2,454,689 | | | | 2,364,452 | |
| | | | | | | | | |
The accompanying notes on pages 250 to 370, ‘Critical accounting policies’ on pages 33 to 36, the audited sections of ‘Risk’ on pages 86 to 176 and the audited sections of ‘Capital’ on pages 177 to 182 form an integral part of these financial statements.
D J Flint,Group Chairman
240
Financial Statements(continued)
Consolidated statement of cash flows for the year ended 31 December 2010
| | | | | | | | | | | | | | | | | |
| | | | | | | 2010 | | | 2009 | | | 2008 | |
| | | Notes | | | US$m | | | US$m | | | US$m | |
| | | | | | | | | | | | | | | | | |
Cash flows from operating activities | | | | | | | | | | | | | | | | |
| Profit before tax | | | | | | | 19,037 | | | | 7,079 | | | | 9,307 | |
| | | | | | | | | | | | | | | | | |
| Adjustments for: | | | | | | | | | | | | | | | | |
| – non-cash items included in profit before tax | | | 40 | | | | 18,887 | | | | 31,384 | | | | 41,305 | |
| – change in operating assets | | | 40 | | | | (13,267 | ) | | | (20,803 | ) | | | 18,123 | |
| – change in operating liabilities | | | 40 | | | | 42,272 | | | | 14,645 | | | | (63,413 | ) |
– elimination of exchange differences1 | | | | | | | (1,799 | ) | | | (19,024 | ) | | | 36,132 | |
| – net gain from investing activities | | | | | | | (1,698 | ) | | | (1,910 | ) | | | (4,195 | ) |
| – share of profits in associates and joint ventures | | | | | | | (2,517 | ) | | | (1,781 | ) | | | (1,661 | ) |
| – dividends received from associates | | | | | | | 441 | | | | 414 | | | | 655 | |
| – contributions paid to defined benefit plans | | | | | | | (3,321 | ) | | | (974 | ) | | | (719 | ) |
| – tax paid | | | | | | | (2,293 | ) | | | (2,132 | ) | | | (5,114 | ) |
| | | | | | | | | | | |
| | | | | | | | | | | | | | | | | |
| Net cash generated from operating activities | | | | | | | 55,742 | | | | 6,898 | | | | 30,420 | |
| | | | | | | | | | | |
| | | | | | | | | | | | | | | | | |
Cash flows from investing activities | | | | | | | | | | | | | | | | |
| Purchase of financial investments | | | | | | | (341,202 | ) | | | (304,629 | ) | | | (277,023 | ) |
| Proceeds from the sale and maturity of financial investments | | | | | | | 321,846 | | | | 241,341 | | | | 223,138 | |
| Purchase of property, plant and equipment | | | | | | | (2,533 | ) | | | (2,000 | ) | | | (2,985 | ) |
| Proceeds from the sale of property, plant and equipment | | | | | | | 4,373 | | | | 4,701 | | | | 2,467 | |
| Proceeds from the sale of loan portfolios | | | | | | | 4,243 | | | | 4,852 | | | | 9,941 | |
| Net purchase of intangible assets | | | | | | | (1,179 | ) | | | (956 | ) | | | (1,169 | ) |
| Net cash inflow/(outflow) from acquisition of subsidiaries | | | | | | | (86 | ) | | | (677 | ) | | | 1,313 | |
| Net cash inflow from disposal of subsidiaries | | | | | | | 466 | | | | 45 | | | | 2,979 | |
| Net cash outflow from acquisition of or increase in stake of associates | | | | | | | (1,589 | ) | | | (62 | ) | | | (355 | ) |
| Net cash inflow/(outflow) from the consolidation of funds | | | | | | | (19,566 | ) | | | – | | | | 16,500 | |
| Proceeds from disposal of associates and joint ventures | | | | | | | 254 | | | | 308 | | | | 101 | |
| | | | | | | | | | | |
| | | | | | | | | | | | | | | | | |
| Net cash used in investing activities | | | | | | | (34,973 | ) | | | (57,077 | ) | | | (25,093 | ) |
| | | | | | | | | | | |
| | | | | | | | | | | | | | | | | |
Cash flows from financing activities | | | | | | | | | | | | | | | | |
| Issue of ordinary share capital | | | | | | | 180 | | | | 18,398 | | | | 467 | |
| | | | | | | | | | | |
| – rights issue | | | | | | | – | | | | 18,326 | | | | – | |
| – other | | | | | | | 180 | | | | 72 | | | | 467 | |
| | | | | | | | | | | |
| | | | | | | | | | | | | | | | | |
| Issue of other equity instruments | | | | | | | 3,718 | | | | – | | | | 2,133 | |
| Net sales/(purchases) of own shares for market-making and investment purposes | | | | | | | 163 | | | | (176 | ) | | | (194 | ) |
| Purchases of own shares to meet share awards and share option awards | | | | | | | 11 | | | | (51 | ) | | | (808 | ) |
| On exercise of share options | | | | | | | 2 | | | | 12 | | | | 27 | |
| Subordinated loan capital issued | | | | | | | 4,481 | | | | 2,959 | | | | 7,094 | |
| Subordinated loan capital repaid | | | | | | | (2,475 | ) | | | (4,637 | ) | | | (350 | ) |
| Net cash outflow from change in stake in subsidiaries | | | | | | | (229 | ) | | | – | | | | – | |
| Dividends paid to shareholders of the parent company | | | | | | | (3,441 | ) | | | (4,264 | ) | | | (7,211 | ) |
| Dividends paid to non-controlling interests | | | | | | | (595 | ) | | | (702 | ) | | | (714 | ) |
| Dividends paid to holders of other equity instruments | | | | | | | (413 | ) | | | (269 | ) | | | (92 | ) |
| | | | | | | | | | | |
| Net cash generated from financing activities | | | | | | | 1,402 | | | | 11,270 | | | | 352 | |
| | | | | | | | | | | |
| | | | | | | | | | | | | | | | | |
Net increase/(decrease) in cash and cash equivalents | | | | | | | 22,171 | | | | (38,909 | ) | | | 5,679 | |
| | | | | | | | | | | | | | | | | |
| Cash and cash equivalents at 1 January | | | | | | | 250,766 | | | | 278,872 | | | | 297,009 | |
| Exchange differences in respect of cash and cash equivalents | | | | | | | 1,139 | | | | 10,803 | | | | (23,816 | ) |
| | | | | | | | | | | |
| | | | | | | | | | | | | | | | | |
| Cash and cash equivalents at 31 December | | | 40 | | | | 274,076 | | | | 250,766 | | | | 278,872 | |
| | | | | | | | | | | |
For footnote, see page 249.
The accompanying notes on pages 250 to 370, ‘Critical accounting policies’ on pages 33 to 36, the audited sections of ‘Risk’ on pages 86 to 176 and the audited sections of ‘Capital’ on pages 177 to 182 form an integral part of these financial statements.
241
Notes on the Financial Statements(continued)
Consolidated statement of changes in equity for the year ended 31 December 2010
| | | | | | | | | | | | | | | | | | | | | | | | | | | | | | | | | | | | | | | | | | | | | | | | | |
| | | 2010 |
| | | | | | | | | | | | | | | | | | | Other reserves | | | | | | | | | | |
| | | | | | | | | | | Other | | | | | | | Available- | | | | | | | | | | | Share- | | | | | | | Total | | | | | | | |
| | | Called up | | | | | | | equity | | | | | | | for-sale | | | Cash flow | | | Foreign | | | based | | | | | | | share- | | | Non- | | | | |
| | | share | | | Share | | | instru- | | | Retained | | | fair value | | | hedging | | | exchange | | | payment | | | Merger | | | holders’ | | | controlling | | | Total | |
| | | capital | | | premium | 2 | | ments | | | earnings | 3,4 | | reserve | | | reserve | 5 | | reserve | | | reserve | | | reserve | 3,6 | | equity | | | interests | | | equity | |
| | | US$m | | | US$m | | | US$m | | | US$m | | | US$m | | | US$m | | | US$m | | | US$m | | | US$m | | | US$m | | | US$m | | | US$m | |
| | | | | | | | | | | | | | | | | | | | | | | | | | | | | | | | | | | | | | | | | | | | | | | | | |
| At 1 January | | | 8,705 | | | | 8,413 | | | | 2,133 | | | | 86,812 | | | | (9,965 | ) | | | (26 | ) | | | 2,994 | | | | 1,925 | | | | 27,308 | | | | 128,299 | | | | 7,362 | | | | 135,661 | |
| | | | | | | | | | | | | | | | | | | | | | | | | | | | | | | | | | | | | | | | | | | | | | | | | |
| Profit for the year | | | – | | | | – | | | | – | | | | 13,159 | | | | – | | | | – | | | | – | | | | – | | | | – | | | | 13,159 | | | | 1,032 | | | | 14,191 | |
| Other comprehensive income (net of tax) | | | – | | | | – | | | | – | | | | 49 | | | | 5,671 | | | | (266 | ) | | | (526 | ) | | | – | | | | – | | | | 4,928 | | | | 115 | | | | 5,043 | |
| | | | | | | | | | | | | | | | | | | | | | | | | |
| Available-for-sale investments | | | – | | | | – | | | | – | | | | – | | | | 5,671 | | | | – | | | | – | | | | – | | | | – | | | | 5,671 | | | | 164 | | | | 5,835 | |
| Cash flow hedges | | | – | | | | – | | | | – | | | | – | | | | – | | | | (266 | ) | | | – | | | | – | | | | – | | | | (266 | ) | | | (5 | ) | | | (271 | ) |
| Actuarial losses on defined benefit plans | | | – | | | | – | | | | – | | | | (58 | ) | | | – | | | | – | | | | – | | | | – | | | | – | | | | (58 | ) | | | (3 | ) | | | (61 | ) |
| Share of other comprehensive income of associates and joint ventures | | | – | | | | – | | | | – | | | | 107 | | | | – | | | | – | | | | – | | | | – | | | | – | | | | 107 | | | | – | | | | 107 | |
| Exchange differences | | | – | | | | – | | | | – | | | | – | | | | – | | | | – | | | | (526 | ) | | | – | | | | – | | | | (526 | ) | | | (41 | ) | | | (567 | ) |
| | | | | | | | | | | | | | | | | | | | | | | | | |
| | | | | | | | | | | | | | | | | | | | | | | | | | | | | | | | | | | | | | | | | | | | | | | | | |
| | | | | | | | | | | | | | | | | | | | | | | | | |
| | | | | | | | | | | | | | | | | | | | | | | | | | | | | | | | | | | | | | | | | | | | | | | | | |
| Total comprehensive income for the year | | | – | | | | – | | | | – | | | | 13,208 | | | | 5,671 | | | | (266 | ) | | | (526 | ) | | | – | | | | – | | | | 18,087 | | | | 1,147 | | | | 19,234 | |
| | | | | | | | | | | | | | | | | | | | | | | | | | | | | | | | | | | | | | | | | | | | | | | | | |
| Shares issued under employee share plans | | | 12 | | | | 168 | | | | – | | | | – | | | | – | | | | – | | | | – | | | | – | | | | – | | | | 180 | | | | – | | | | 180 | |
Shares issued in lieu of dividends and amounts arising thereon2 | | | 126 | | | | (127 | ) | | | – | | | | 2,524 | | | | – | | | | – | | | | – | | | | – | | | | – | | | | 2,523 | | | | – | | | | 2,523 | |
Capital securities issued7 | | | – | | | | – | | | | 3,718 | | | | – | | | | – | | | | – | | | | – | | | | – | | | | – | | | | 3,718 | | | | – | | | | 3,718 | |
Dividends to shareholders | | | – | | | | – | | | | – | | | | (6,350 | ) | | | – | | | | – | | | | – | | | | – | | | | – | | | | (6,350 | ) | | | (725 | ) | | | (7,075 | ) |
| Tax credit on dividends | | | – | | | | – | | | | – | | | | 122 | | | | – | | | | – | | | | – | | | | – | | | | – | | | | 122 | | | | – | | | | 122 | |
| Own shares adjustment | | | – | | | | – | | | | – | | | | 174 | | | | – | | | | – | | | | – | | | | – | | | | – | | | | 174 | | | | – | | | | 174 | |
| Exercise and lapse of share options and vesting of share awards | | | – | | | | – | | | | – | | | | 809 | | | | – | | | | – | | | | – | | | | (809 | ) | | | – | | | | – | | | | – | | | | – | |
| Cost of share-based payment arrangements | | | – | | | | – | | | | – | | | | – | | | | – | | | | – | | | | – | | | | 812 | | | | – | | | | 812 | | | | – | | | | 812 | |
| Income taxes on share-based payments | | | – | | | | – | | | | – | | | | (14 | ) | | | – | | | | – | | | | – | | | | – | | | | – | | | | (14 | ) | | | – | | | | (14 | ) |
| Other movements | | | – | | | | – | | | | – | | | | (58 | ) | | | 217 | | | | 7 | | | | – | | | | – | | | | – | | | | 166 | | | | 3 | | | | 169 | |
| Transfers | | | – | | | | – | | | | – | | | | 173 | | | | – | | | | – | | | | – | | | | (173 | ) | | | – | | | | – | | | | – | | | | – | |
| Acquisition and disposal of subsidiaries | | | – | | | | – | | | | – | | | | – | | | | – | | | | – | | | | – | | | | – | | | | – | | | | – | | | | (436 | ) | | | (436 | ) |
| Changes in ownership interests in subsidiaries that did not result in loss of control | | | – | | | | – | | | | – | | | | (50 | ) | | | – | | | | – | | | | – | | | | – | | | | – | | | | (50 | ) | | | (103 | ) | | | (153 | ) |
| | | | | | | | | | | | | | | | | | | | | | | | | |
| | | | | | | | | | | | | | | | | | | | | | | | | | | | | | | | | | | | | | | | | | | | | | | | | |
| At 31 December | | | 8,843 | | | | 8,454 | | | | 5,851 | | | | 97,350 | | | | (4,077 | ) | | | (285 | ) | | | 2,468 | | | | 1,755 | | | | 27,308 | | | | 147,667 | | | | 7,248 | | | | 154,915 | |
| | | | | | | | | | | | | | | | | | | | | | | | | |
242
Notes on the Financial Statements(continued)
| | | | | | | | | | | | | | | | | | | | | | | | | | | | | | | | | | | | | | | | | | | | | | | | | |
| | | 2009 |
| | | | | | | | | | | | | | | | | | | Other reserves | | | | | | | | | | |
| | | | | | | | | | | Other | | | | | | | Available- | | | | | | | | | | | Share- | | | | | | | Total | | | | | | | |
| | | Called up | | | | | | | equity | | | | | | | for-sale | | | Cash flow | | | Foreign | | | based | | | | | | | share- | | | Non- | | | | |
| | | share | | | Share | | | instru- | | | Retained | | | fair value | | | hedging | | | exchange | | | payment | | | Merger | | | holders’ | | | controlling | | | Total | |
| | | capital | | | premium | 2 | | ments | | | earnings | 3,4 | | reserve | | | reserve | 5 | | reserve | | | reserve | | | reserve | 3,6 | | equity | | | interests | | | equity | |
| | | US$m | | | US$m | | | US$m | | | US$m | | | US$m | | | US$m | | | US$m | | | US$m | | | US$m | | | US$m | | | US$m | | | US$m | |
| | | | | | | | | | | | | | | | | | | | | | | | | | | | | | | | | | | | | | | | | | | | | | | | | |
| At 1 January | | | 6,053 | | | | 8,463 | | | | 2,133 | | | | 80,689 | | | | (20,550 | ) | | | (806 | ) | | | (1,843 | ) | | | 1,995 | | | | 17,457 | | | | 93,591 | | | | 6,638 | | | | 100,229 | |
| | | | | | | | | | | | | | | | | | | | | | | | | | | | | | | | | | | | | | | | | | | | | | | | | |
| Profit for the year | | | – | | | | – | | | | – | | | | 5,834 | | | | – | | | | – | | | | – | | | | – | | | | – | | | | 5,834 | | | | 860 | | | | 6,694 | |
| Other comprehensive income (net of tax) | | | – | | | | – | | | | – | | | | (2,536 | ) | | | 10,603 | | | | 791 | | | | 4,837 | | | | – | | | | – | | | | 13,695 | | | | 410 | | | | 14,105 | |
| | | | | | | | | | | | | | | | | | | | | | | | | |
| Available-for-sale investments | | | – | | | | – | | | | – | | | | – | | | | 10,603 | | | | – | | | | – | | | | – | | | | – | | | | 10,603 | | | | 214 | | | | 10,817 | |
| Cash flow hedges | | | – | | | | – | | | | – | | | | – | | | | – | | | | 791 | | | | – | | | | – | | | | – | | | | 791 | | | | (19 | ) | | | 772 | |
| Actuarial gains/(losses) on defined benefit plans | | | – | | | | – | | | | – | | | | (2,685 | ) | | | – | | | | – | | | | – | | | | – | | | | – | | | | (2,685 | ) | | | 77 | | | | (2,608 | ) |
| Share of other comprehensive income of associates and joint ventures | | | – | | | | – | | | | – | | | | 149 | | | | – | | | | – | | | | – | | | | – | | | | – | | | | 149 | | | | – | | | | 149 | |
| Exchange differences | | | – | | | | – | | | | – | | | | – | | | | – | | | | – | | | | 4,837 | | | | – | | | | – | | | | 4,837 | | | | 138 | | | | 4,975 | |
| | | | | | | | | | | | | | | | | | | | | | | | | |
| | | | | | | | | | | | | | | | | | | | | | | | | | | | | | | | | | | | | | | | | | | | | | | | | |
| | | | | | | | | | | | | | | | | | | | | | | | | |
| Total comprehensive income for the year | | | – | | | | – | | | | – | | | | 3,298 | | | | 10,603 | | | | 791 | | | | 4,837 | | | | – | | | | – | | | | 19,529 | | | | 1,270 | | | | 20,799 | |
| | | | | | | | | | | | | | | | | | | | | | | | | | | | | | | | | | | | | | | | | | | | | | | | | |
| Shares issued under employee share plans | | | 4 | | | | 69 | | | | – | | | | – | | | | – | | | | – | | | | – | | | | – | | | | – | | | | 73 | | | | – | | | | 73 | |
Shares issued in lieu of dividends and amounts arising thereon2 | | | 118 | | | | (119 | ) | | | – | | | | 1,670 | | | | – | | | | – | | | | – | | | | – | | | | – | | | | 1,669 | | | | – | | | | 1,669 | |
Shares issued in respect of rights issue6 | | | 2,530 | | | | – | | | | – | | | | – | | | | – | | | | – | | | | – | | | | – | | | | 15,796 | | | | 18,326 | | | | – | | | | 18,326 | |
Dividends to shareholders | | | – | | | | – | | | | – | | | | (5,639 | ) | | | – | | | | – | | | | – | | | | – | | | | – | | | | (5,639 | ) | | | (832 | ) | | | (6,471 | ) |
| Tax credit on dividends | | | – | | | | – | | | | – | | | | 50 | | | | – | | | | – | | | | – | | | | – | | | | – | | | | 50 | | | | – | | | | 50 | |
| Own shares adjustment | | | – | | | | – | | | | – | | | | (227 | ) | | | – | | | | – | | | | – | | | | – | | | | – | | | | (227 | ) | | | – | | | | (227 | ) |
| Exercise and lapse of share options and vesting of share awards | | | – | | | | – | | | | – | | | | 807 | | | | – | | | | – | | | | – | | | | (769 | ) | | | – | | | | 38 | | | | – | | | | 38 | |
| Cost of share-based payment arrangements | | | – | | | | – | | | | – | | | | – | | | | – | | | | – | | | | – | | | | 683 | | | | – | | | | 683 | | | | – | | | | 683 | |
| Income taxes on share-based payments | | | – | | | | – | | | | – | | | | 9 | | | | – | | | | – | | | | – | | | | – | | | | – | | | | 9 | | | | – | | | | 9 | |
| Other movements | | | – | | | | – | | | | – | | | | 210 | | | | (18 | ) | | | (11 | ) | | | – | | | | 16 | | | | – | | | | 197 | | | | 77 | | | | 274 | |
Transfers6 | | | – | | | | – | | | | – | | | | 5,945 | | | | – | | | | – | | | | – | | | | – | | | | (5,945 | ) | | | – | | | | – | | | | – | |
| Acquisition and disposal of subsidiaries | | | – | | | | – | | | | – | | | | – | | | | – | | | | – | | | | – | | | | – | | | | – | | | | – | | | | (38 | ) | | | (38 | ) |
| Change in ownership interests in subsidiaries that did not result in loss of control | | | – | | | | – | | | | – | | | | – | | | | – | | | | – | | | | – | | | | – | | | | – | | | | – | | | | 247 | | | | 247 | |
| | | | | | | | | | | | | | | | | | | | | | | | | |
| | | | | | | | | | | | | | | | | | | | | | | | | | | | | | | | | | | | | | | | | | | | | | | | | |
| At 31 December | | | 8,705 | | | | 8,413 | | | | 2,133 | | | | 86,812 | | | | (9,965 | ) | | | (26 | ) | | | 2,994 | | | | 1,925 | | | | 27,308 | | | | 128,299 | | | | 7,362 | | | | 135,661 | |
| | | | | | | | | | | | | | | | | | | | | | | | | |
243
Notes on the Financial Statements(continued)
Consolidated statement of changes in equity for the year ended 31 December 2010(continued)
| | | | | | | | | | | | | | | | | | | | | | | | | | | | | | | | | | | | | | | | | | | | | | | | | |
| | | 2008 |
| | | | | | | | | | | | | | | | | | | Other reserves | | | | | | | | | | |
| | | | | | | | | | | Other | | | | | | | Available- | | | | | | | | | | | Share- | | | | | | | Total | | | | | | | |
| | | Called up | | | | | | | equity | | | | | | | for-sale | | | Cash flow | | | Foreign | | | based | | | | | | | share- | | | Non- | | | | |
| | | share | | | Share | | | instru- | | | Retained | | | fair value | | | hedging | | | exchange | | | payment | | | Merger | | | holders’ | | | controlling | | | Total | |
| | | capital | | | premium | 2 | | ments | | | earnings | 3,4 | | reserve | | | reserve | 5 | | reserve | | | reserve | | | reserve | 3,6 | | equity | | | interests | | | equity | |
| | | US$m | | | US$m | | | US$m | | | US$m | | | US$m | | | US$m | | | US$m | | | US$m | | | US$m | | | US$m | | | US$m | | | US$m | |
| | | | | | | | | | | | | | | | | | | | | | | | | | | | | | | | | | | | | | | | | | | | | | | | | |
| At 1 January | | | 5,915 | | | | 8,134 | | | | – | | | | 81,097 | | | | 850 | | | | (917 | ) | | | 10,055 | | | | 1,968 | | | | 21,058 | | | | 128,160 | | | | 7,256 | | | | 135,416 | |
| | | | | | | | | | | | | | | | | | | | | | | | | | | | | | | | | | | | | | | | | | | | | | | | | |
| Profit for the year | | | – | | | | – | | | | – | | | | 5,728 | | | | – | | | | – | | | | – | | | | – | | | | – | | | | 5,728 | | | | 770 | | | | 6,498 | |
| Other comprehensive income (net of tax) | | | – | | | | – | | | | – | | | | (1,605 | ) | | | (21,474 | ) | | | 106 | | | | (11,898 | ) | | | – | | | | – | | | | (34,871 | ) | | | (766 | ) | | | (35,637 | ) |
| | | | | | | | | | | | | | | | | | | | | | | | | |
| Available-for-sale investments | | | – | | | | – | | | | – | | | | – | | | | (21,474 | ) | | | – | | | | – | | | | – | | | | – | | | | (21,474 | ) | | | (430 | ) | | | (21,904 | ) |
| Cash flow hedges | | | – | | | | – | | | | – | | | | – | | | | – | | | | 106 | | | | – | | | | – | | | | – | | | | 106 | | | | 18 | | | | 124 | |
| Actuarial gains/(losses) on defined benefit plans | | | – | | | | – | | | | – | | | | (1,046 | ) | | | – | | | | – | | | | – | | | | – | | | | – | | | | (1,046 | ) | | | (129 | ) | | | (1,175 | ) |
| Share of other comprehensive income of associates and joint ventures | | | – | | | | – | | | | – | | | | (559 | ) | | | – | | | | – | | | | – | | | | – | | | | – | | | | (559 | ) | | | – | | | | (559 | ) |
| Exchange differences | | | – | | | | – | | | | – | | | | – | | | | – | | | | – | | | | (11,898 | ) | | | – | | | | – | | | | (11,898 | ) | | | (225 | ) | | | (12,123 | ) |
| | | | | | | | | | | | | | | | | | | | | | | | | |
| | | | | | | | | | | | | | | | | | | | | | | | | | | | | | | | | | | | | | | | | | | | | | | | | |
| Total comprehensive income for the year | | | – | | | | – | | | | – | | | | 4,123 | | | | (21,474 | ) | | | 106 | | | | (11,898 | ) | | | – | | | | – | | | | (29,143 | ) | | | 4 | | | | (29,139 | ) |
| | | | | | | | | | | | | | | | | | | | | | | | | | | | | | | | | | | | | | | | | | | | | | | | | |
| Shares issued under employee share plans | | | 20 | | | | 450 | | | | – | | | | – | | | | – | | | | – | | | | – | | | | – | | | | – | | | | 470 | | | | – | | | | 470 | |
Shares issued in lieu of dividends and amounts arising thereon2 | | | 118 | | | | (121 | ) | | | – | | | | 3,596 | | | | – | | | | – | | | | – | | | | – | | | | – | | | | 3,593 | | | | – | | | | 3,593 | |
Capital securities issued7 | | | – | | | | – | | | | 2,133 | | | | – | | | | – | | | | – | | | | – | | | | – | | | | – | | | | 2,133 | | | | – | | | | 2,133 | |
| Dividends to shareholders | | | – | | | | – | | | | – | | | | (11,301 | ) | | | – | | | | – | | | | – | | | | – | | | | – | | | | (11,301 | ) | | | (813 | ) | | | (12,114 | ) |
| Own shares adjustment | | | – | | | | – | | | | – | | | | (1,002 | ) | | | – | | | | – | | | | – | | | | – | | | | – | | | | (1,002 | ) | | | – | | | | (1,002 | ) |
| Exercise and lapse of share options and vesting of share awards | | | – | | | | – | | | | – | | | | 827 | | | | – | | | | – | | | | – | | | | (848 | ) | | | – | | | | (21 | ) | | | – | | | | (21 | ) |
| Cost of share-based payment arrangements | | | – | | | | – | | | | – | | | | – | | | | – | | | | – | | | | – | | | | 819 | | | | – | | | | 819 | | | | – | | | | 819 | |
| Other movements | | | – | | | | – | | | | – | | | | (252 | ) | | | 74 | | | | 5 | | | | – | | | | 56 | | | | – | | | | (117 | ) | | | 73 | | | | (44 | ) |
Transfers6 | | | – | | | | – | | | | – | | | | 3,601 | | | | – | | | | – | | | | – | | | | – | | | | (3,601 | ) | | | – | | | | – | | | | – | |
| Acquisition and disposal of subsidiaries | | | – | | | | – | | | | – | | | | – | | | | – | | | | – | | | | – | | | | – | | | | – | | | | – | | | | (33 | ) | | | (33 | ) |
| Change in ownership interests in subsidiaries that did not result in loss of control | | | – | | | | – | | | | – | | | | – | | | | – | | | | – | | | | – | | | | – | | | | – | | | | – | | | | 151 | | | | 151 | |
| | | | | | | | | | | | | | | | | | | | | | | | | | | | | | | | | | | | | | | | | | | | | | | | | |
| | | | | | | | | | | | | | | | | | | | | | | | | |
| At 31 December | | | 6,053 | | | | 8,463 | | | | 2,133 | | | | 80,689 | | | | (20,550 | ) | | | (806 | ) | | | (1,843 | ) | | | 1,995 | | | | 17,457 | | | | 93,591 | | | | 6,638 | | | | 100,229 | |
| | | | | | | | | | | | | | | | | | | | | | | | | |
Dividends per ordinary share at 31 December 2010 were US$0.34 (2009: US$0.34; 2008: US$0.93).
For footnotes, see page 249.
The accompanying notes on pages 250 to 370, ‘Critical accounting policies’ on pages 33 to 36, the audited sections of ‘Risk’ on pages 86 to 176 and the audited sections of ‘Capital’ on pages 177 to 182 form an integral part of these financial statements.
244
Financial Statements(continued)
HSBC Holdings balance sheet at 31 December 2010
| | | | | | | | | | | | | |
| | | | | | | 2010 | | | 2009 | |
| | | Notes | | | US$m | | | US$m | |
| | | | | | | | | | | | | |
Assets | | | | | | | | | | | | |
| | | | | | | | | | | | | |
| Cash at bank and in hand: | | | | | | | | | | | | |
| – balances with HSBC undertakings | | | | | | | 459 | | | | 224 | |
| Derivatives | | | 20 | | | | 2,327 | | | | 2,981 | |
| Loans and advances to HSBC undertakings | | | | | | | 21,238 | | | | 23,212 | |
| Financial investments | | | | | | | 2,025 | | | | 2,455 | |
| Other assets | | | | | | | 1 | | | | 4 | |
| Current tax assets | | | | | | | 224 | | | | 562 | |
| Prepayments and accrued income | | | | | | | 107 | | | | 102 | |
| Investments in subsidiaries | | | 26 | | | | 92,899 | | | | 86,247 | |
| Property, plant and equipment | | | | | | | 4 | | | | 6 | |
| Deferred tax assets | | | 10 | | | | 57 | | | | – | |
| | | | | | | | | |
| Total assets | | | | | | | 119,341 | | | | 115,793 | |
| | | | | | | | | | | | | |
| | | | | | | | | |
| | | | | | | | | | | | | |
Liabilities and equity | | | | | | | | | | | | |
| | | | | | | | | | | | | |
Liabilities | | | | | | | | | | | | |
| Amounts owed to HSBC undertakings | | | | | | | 2,932 | | | | 3,711 | |
| Financial liabilities designated at fair value | | | 29 | | | | 16,288 | | | | 16,909 | |
| Derivatives | | | 20 | | | | 827 | | | | 362 | |
| Debt securities in issue | | | 30 | | | | 2,668 | | | | 2,839 | |
| Other liabilities | | | 31 | | | | 1,232 | | | | 1,257 | |
| Accruals and deferred income | | | | | | | 750 | | | | 419 | |
| Deferred tax liabilities | | | 10 | | | | – | | | | 14 | |
| Subordinated liabilities | | | 34 | | | | 13,313 | | | | 14,406 | |
| | | | | | | | | |
| Total liabilities | | | | | | | 38,010 | | | | 39,917 | |
| | | | | | | | | | | | | |
| | | | | | | | | |
| | | | | | | | | | | | | |
Equity | | | | | | | | | | | | |
| Called up share capital | | | 39 | | | | 8,843 | | | | 8,705 | |
| Share premium account | | | | | | | 8,454 | | | | 8,413 | |
| Other equity instruments | | | | | | | 5,828 | | | | 2,133 | |
| Merger reserve and other reserves | | | | | | | 35,127 | | | | 35,127 | |
| Other reserves | | | | | | | 3,394 | | | | 3,642 | |
| Retained earnings | | | | | | | 19,685 | | | | 17,856 | |
| | | | | | | | | |
| Total equity | | | | | | | 81,331 | | | | 75,876 | |
| | | | | | | | | |
| Total equity and liabilities | | | | | | | 119,341 | | | | 115,793 | |
| | | | | | | | | |
The accompanying notes on pages 250 to 370, ‘Critical accounting policies’ on pages 33 to 36, the audited sections of ‘Risk’ on pages 86 to 176 and the audited sections of ‘Capital’ on pages 177 to 182 form an integral part of these financial statements.
D J Flint,Group Chairman
245
Financial Statements(continued)
HSBC Holdings statement of cash flows for the year ended 31 December 2010
| | | | | | | | | | | | | |
| | | | | | | 2010 | | | 2009 | |
| | | Notes | | | US$m | | | US$m | |
| | | | | | | | | | | | | |
Cash flows from operating activities | | | | | | | | | | | | |
| Profit/(loss) before tax | | | | | | | 5,237 | | | | (2,058 | ) |
| | | | | | | | | | | | | |
| Adjustments for: | | | | | | | | | | | | |
| – non-cash items included in profit before tax | | | 40 | | | | 185 | | | | 5,974 | |
| – change in operating assets | | | 40 | | | | 3,091 | | | | (11,077 | ) |
| – change in operating liabilities | | | 40 | | | | (1,754 | ) | | | 2,040 | |
– elimination of exchange differences1 | | | | | | | – | | | | 1 | |
| – tax received | | | | | | | 853 | | | | 266 | |
| | | | | | | | | |
| Net cash generated from/(used in) operating activities | | | | | | | 7,612 | | | | (4,854 | ) |
| | | | | | | | | |
Cash flows from investing activities | | | | | | | | | | | | |
| Proceeds from sale of financial investments | | | | | | | – | | | | 275 | |
| Purchase of property, plant and equipment | | | | | | | – | | | | (2 | ) |
| Net cash outflow from acquisition of or increase in stake of subsidiaries | | | | | | | (6,649 | ) | | | (10,344 | ) |
| | | | | | | | | |
| | | | | | | | | | | | | |
| Net cash used in investing activities | | | | | | | (6,649 | ) | | | (10,071 | ) |
| | | | | | | | | |
Cash flows from financing activities | | | | | | | | | | | | |
| Issue of ordinary share capital | | | | | | | 180 | | | | 18,333 | |
| | | | | | | | | |
| – rights issue | | | | | | | – | | | | 18,261 | |
| – other | | | | | | | 180 | | | | 72 | |
| | | | | | | | | |
| Issue of other equity instruments | | | | | | | 3,695 | | | | – | |
| On exercise of share options | | | | | | | 2 | | | | 12 | |
| Subordinated loan capital issued | | | | | | | 1,349 | | | | 2,456 | |
| Subordinated loan capital repaid | | | | | | | (2,100 | ) | | | (4,380 | ) |
| Debt securities issued | | | | | | | – | | | | 2,818 | |
| Dividends paid | | | | | | | (3,441 | ) | | | (4,264 | ) |
| Dividends paid to holders of other equity instruments | | | | | | | (413 | ) | | | (269 | ) |
| | | | | | | | | |
| Net cash (used in)/generated from financing activities | | | | | | | (728 | ) | | | 14,706 | |
| | | | | | | | | |
Net increase/(decrease) in cash and cash equivalents | | | | | | | 235 | | | | (219 | ) |
| | | | | | | | | | | | | |
| Cash and cash equivalents at 1 January | | | | | | | 224 | | | | 443 | |
| | | | | | | | | |
| Cash and cash equivalents at 31 December | | | 40 | | | | 459 | | | | 224 | |
| | | | | | | | | |
For footnote, see page 249.
The accompanying notes on pages 250 to 370, ‘Critical accounting policies’ on pages 33 to 36, the audited sections of ‘Risk’ on pages 86 to 176 and the audited sections of ‘Capital’ on pages 177 to 182 form an integral part of these financial statements.
246
Financial Statements(continued)
HSBC Holdings statement of changes in equity for the year ended 31 December 2010
| | | | | | | | | | | | | | | | | | | | | | | | | | | | | | | | | | | | | |
| | | 2010 |
| | | | | | | | | | | | | | | | | | | Other reserves | | | |
| | | | | | | | | | | Other | | | | | | | Available- | | | | | | | Share- | | | | | | | Total | |
| | | Called up | | | | | | | equity | | | | | | | for-sale | | | Other | | | based | | | Merger | | | share- | |
| | | share | | | Share | | | instru- | | | Retained | | | fair value | | | paid-in | | | payment | | | and other | | | holders’ | |
| | | capital | | | premium | 2 | | ments | 7 | | earnings | 8 | | reserve | | | capital | | | reserve | | | Reserves | 6 | | equity | |
| | | US$m | | | US$m | | | US$m | | | US$m | | | US$m | | | US$m | | | US$m | | | US$m | | | US$m | |
| | | | | | | | | | | | | | | | | | | | | | | | | | | | | | | | | | | | | |
| At 1 January | | | 8,705 | | | | 8,413 | | | | 2,133 | | | | 17,856 | | | | 253 | | | | 1,464 | | | | 1,925 | | | | 35,127 | | | | 75,876 | |
| | | | | | | | | | | | | | | | | | | | | | | | | | | | | | | | | | | | | |
| Profit for the year | | | – | | | | – | | | | – | | | | 5,658 | | | | – | | | | – | | | | – | | | | – | | | | 5,658 | |
| Other comprehensive income (net of tax) | | | – | | | | – | | | | – | | | | – | | | | (197 | ) | | | – | | | | – | | | | – | | | | (197 | ) |
| | | | | | | | | | | | | | | | | | | |
| Available-for-sale investments | | | – | | | | – | | | | – | | | | – | | | | (275 | ) | | | – | | | | – | | | | – | | | | (275 | ) |
| Income tax | | | – | | | | – | | | | – | | | | – | | | | 78 | | | | – | | | | – | | | | – | | | | 78 | |
| | | | | | | | | | | | | | | | | | | |
| | | | | | | | | | | | | | | | | | | | | | | | | | | | | | | | | | | | | |
| | | | | | | | | | | | | | | | | | | |
| Total comprehensive income for the year | | | – | | | | – | | | | – | | | | 5,658 | | | | (197 | ) | | | – | | | | – | | | | – | | | | 5,461 | |
| Shares issued under employee share plans | | | 12 | | | | 168 | | | | – | | | | – | | | | – | | | | – | | | | – | | | | – | | | | 180 | |
Shares issued in lieu of dividends and amounts arising thereon2 | | | 126 | | | | (127 | ) | | | – | | | | 2,524 | | | | – | | | | – | | | | – | | | | – | | | | 2,523 | |
Capital securities issued7 | | | – | | | | – | | | | 3,695 | | | | – | | | | – | | | | – | | | | – | | | | – | | | | 3,695 | |
| Dividends to shareholders | | | – | | | | – | | | | – | | | | (6,350 | ) | | | – | | | | – | | | | – | | | | – | | | | (6,350 | ) |
| Own shares adjustment | | | – | | | | – | | | | – | | | | (260 | ) | | | – | | | | – | | | | – | | | | – | | | | (260 | ) |
| Exercise and lapse of share options and vesting of share awards | | | – | | | | – | | | | – | | | | – | | | | – | | | | 119 | | | | (119 | ) | | | – | | | | – | |
| Cost of share-based payment arrangements | | | – | | | | – | | | | – | | | | – | | | | – | | | | – | | | | 28 | | | | – | | | | 28 | |
| Equity investments granted to employees of subsidiaries under employee share plans | | | – | | | | – | | | | – | | | | – | | | | – | | | | – | | | | 76 | | | | – | | | | 76 | |
| Other movements | | | – | | | | – | | | | – | | | | 87 | | | | – | | | | – | | | | 15 | | | | – | | | | 102 | |
| Transfers | | | – | | | | – | | | | – | | | | 170 | | | | – | | | | – | | | | (170 | ) | | | – | | | | – | |
| | | | | | | | | | | | | | | | | | | |
| | | | | | | | | | | | | | | | | | | | | | | | | | | | | | | | | | | | | |
| At 31 December | | | 8,843 | | | | 8,454 | | | | 5,828 | | | | 19,685 | | | | 56 | | | | 1,583 | | | | 1,755 | | | | 35,127 | | | | 81,331 | |
| | | | | | | | | | | | | | | | | | | |
247
Financial Statements(continued)
HSBC Holdings statement of changes in equity for the year ended 31 December 2010(continued)
| | | | | | | | | | | | | | | | | | | | | | | | | | | | | | | | | | | | | |
| | | 2009 |
| | | | | | | | | | | | | | | | | | | Other reserves | | | |
| | | | | | | | | | | Other | | | | | | | Available- | | | | | | | Share- | | | | | | | Total | |
| | | Called up | | | | | | | equity | | | | | | | for-sale | | | Other | | | based | | | Merger | | | share- | |
| | | share | | | Share | | | instru- | | | Retained | | | fair value | | | paid-in | | | payment | | | and other | | | holders’ | |
| | | capital | | | premium | 2 | | ments | | | Earnings | 8 | | reserve | | | capital | | | reserve | | | Reserves | 6 | | equity | |
| | | US$m | | | US$m | | | US$m | | | US$m | | | US$m | | | US$m | | | US$m | | | US$m | | | US$m | |
| | | | | | | | | | | | | | | | | | | | | | | | | | | | | | | | | | | | | |
| At 1 January | | | 6,053 | | | | 8,463 | | | | 2,133 | | | | 17,094 | | | | 190 | | | | 1,318 | | | | 1,995 | | | | 25,341 | | | | 62,587 | |
| | | | | | | | | | | | | | | | | | | | | | | | | | | | | | | | | | | | | |
| Profit for the year | | | – | | | | – | | | | – | | | | (1,096 | ) | | | – | | | | – | | | | – | | | | – | | | | (1,096 | ) |
| Other comprehensive income (net of tax) | | | – | | | | – | | | | – | | | | – | | | | 63 | | | | – | | | | – | | | | – | | | | 63 | |
| | | | | | | | | | | | | | | | | | | |
| Available-for-sale investments | | | – | | | | – | | | | – | | | | – | | | | 103 | | | | – | | | | – | | | | – | | | | 103 | |
| Income tax | | | – | | | | – | | | | – | | | | – | | | | (40 | ) | | | – | | | | – | | | | – | | | | (40 | ) |
| | | | | | | | | | | | | | | | | | | |
| | | | | | | | | | | | | | | | | | | | | | | | | | | | | | | | | | | | | |
| Total comprehensive income for the year | | | – | | | | – | | | | – | | | | (1,096 | ) | | | 63 | | | | – | | | | – | | | | – | | | | (1,033 | ) |
| Shares issued under employee share plans | | | 4 | | | | 69 | | | | – | | | | – | | | | – | | | | – | | | | – | | | | – | | | | 73 | |
Shares issued in lieu of dividends and amounts arising thereon2 | | | 118 | | | | (119 | ) | | | – | | | | 1,670 | | | | – | | | | – | | | | – | | | | – | | | | 1,669 | |
| Shares issued in respect of rights issue | | | 2,530 | | | | – | | | | – | | | | – | | | | – | | | | – | | | | – | | | | 15,731 | | | | 18,261 | |
Dividends to shareholders | | | – | | | | – | | | | – | | | | (5,639 | ) | | | – | | | | – | | | | – | | | | – | | | | (5,639 | ) |
| Own shares adjustment | | | – | | | | – | | | | – | | | | (188 | ) | | | – | | | | – | | | | – | | | | – | | | | (188 | ) |
| Exercise and lapse of share options and vesting of share awards | | | – | | | | – | | | | – | | | | – | | | | – | | | | 146 | | | | (146 | ) | | | – | | | | – | |
| Cost of share-based payment arrangements | | | – | | | | – | | | | – | | | | – | | | | – | | | | – | | | | 163 | | | | – | | | | 163 | |
| Income taxes on share- based payments | | | – | | | | – | | | | – | | | | 19 | | | | – | | | | – | | | | – | | | | – | | | | 19 | |
| Equity investments granted to employees of subsidiaries under employee share plans | | | – | | | | – | | | | – | | | | – | | | | – | | | | – | | | | (99 | ) | | | – | | | | (99 | ) |
| Other movements | | | – | | | | – | | | | – | | | | 51 | | | | – | | | | – | | | | 12 | | | | – | | | | 63 | |
Transfers6 | | | – | | | | – | | | | – | | | | 5,945 | | | | – | | | | – | | | | – | | | | (5,945 | ) | | | – | |
| | | | | | | | | | | | | | | | | | | |
| | | | | | | | | | | | | | | | | | | | | | | | | | | | | | | | | | | | | |
| At 31 December | | | 8,705 | | | | 8,413 | | | | 2,133 | | | | 17,856 | | | | 253 | | | | 1,464 | | | | 1,925 | | | | 35,127 | | | | 75,876 | |
| | | | | | | | | | | | | | | | | | | |
Dividends per ordinary share at 31 December 2010 were US$0.34 (2009: US$0.34; 2008: US$0.93).
For footnotes, see page 249.
The accompanying notes on pages 250 to 370, ‘Critical accounting policies’ on pages 33 to 36, the audited sections of ‘Risk’ on pages 86 to 176 and the audited sections of ‘Capital’ on pages 177 to 182 form an integral part of these financial statements.
248
Financial Statements(continued)
Footnotes to Financial Statements
| | |
| 1 | | Adjustment to bring changes between opening and closing balance sheet amounts to average rates. This is not done on a line-by-line basis, as details cannot be determined without unreasonable expense. |
| |
| 2 | | Share premium includes the deduction of US$1m in respect of issuance costs incurred during the year (2009: US$1m; 2008: US$3m). |
| |
| 3 | | Cumulative goodwill amounting to US$5,138m has been charged against reserves in respect of acquisitions of subsidiaries prior to 1 January 1998, including US$3,469m charged against the merger reserve arising on the acquisition of HSBC Bank plc. The balance of US$1,669m has been charged against retained earnings. |
| |
| 4 | | Retained earnings include 123,331,979 (US$1,799m) of own shares held within HSBC’s insurance business, retirement funds for the benefit of policyholders or beneficiaries within employee trusts for the settlement of shares expected to be delivered under employee share schemes or bonus plans, and the market-making activities in Global Markets (2009: 179,964,968 (US$2,572m); 2008: 194,751,829 (US$3,094m)). |
| |
| 5 | | Amounts transferred to the income statement in respect of cash flow hedges include US$605m (2009: US$502m; 2008: US$152m) taken to ‘Net interest income’ and US$441m (2009: US$306m; 2008: US$1,602m) taken to ‘Net trading income’. |
| |
| 6 | | Statutory share premium relief under Section 131 of the Companies Act 1985 (the ‘Act’) was taken in respect of the acquisition of HSBC Bank plc in 1992, HSBC France in 2000 and HSBC Finance Corporation in 2003 and the shares issued were recorded at their nominal value only. In HSBC’s consolidated financial statements the fair value differences of US$8,290m in respect of HSBC France and US$12,768m in respect of HSBC Finance Corporation were recognised in the merger reserve. The merger reserve created on the acquisition of HSBC Finance Corporation subsequently became attached to HSBC Overseas Holdings (UK) Limited (‘HOHU’), following a number of intra-group reorganisations. At 31 December 2009, US$5,945m (2010: nil) was transferred from this reserve to retained earnings as a result of impairment in HSBC Holdings’ investment in HOHU. During 2009, pursuant to section 131 of the Companies Act 1985, statutory share premium relief was taken in respect of the rights issue and US$15,796m was recognised in the merger reserve. The merger reserve includes the deduction of US$614m in respect of costs relating to the rights issue, of which US$149m was subsequently transferred to the income statement. Of this US$149m, US$121m was a loss arising from accounting for the agreement with the underwriters as a contingent forward contract. The merger reserve excludes the loss of US$344m on a forward foreign exchange contract associated with hedging the proceeds of the rights issue. |
| |
| 7 | | During June 2010, HSBC Holdings issued US$3,800m of Perpetual Subordinated Capital Securities, Series 2 (‘capital securities’), on which there were US$82m of external issuance costs and US$23m of intra-group issuance costs which are classified as equity under IFRSs. In April 2008, HSBC Holdings issued US$2,200m of Perpetual Subordinated Capital Securities, including US$67m of issuance costs, which are classified as equity under IFRSs. |
| |
| 8 | | Retained earnings include 39,814,107 (US$562m) of own shares held to fund employee share plans (2009: 38,446,053 (US$562m)). |
249
Notes on the Financial Statements
Notes on the Financial Statements
| | (a) | | Compliance with International Financial Reporting Standards |
| |
| | | | The consolidated financial statements of HSBC and the separate financial statements of HSBC Holdings have been prepared in accordance with International Financial Reporting Standards (‘IFRSs’) as issued by the International Accounting Standards Board (‘IASB’) and as endorsed by the EU. EU-endorsed IFRSs may differ from IFRSs as issued by the IASB if, at any point in time, new or amended IFRSs have not been endorsed by the EU. At 31 December 2010, there were no unendorsed standards effective for the year ended 31 December 2010 affecting these consolidated and separate financial statements, and there was no difference between IFRSs endorsed by the EU and IFRSs issued by the IASB in terms of their application to HSBC. Accordingly, HSBC’s financial statements for the year ended 31 December 2010 are prepared in accordance with IFRSs as issued by the IASB. |
| |
| | | | IFRSs comprise accounting standards issued by the IASB and its predecessor body as well as interpretations issued by the IFRS Interpretations Committee (‘IFRIC’) and its predecessor body. |
| |
| | | | During 2010, HSBC adopted the following major revisions and amendments to standards: |
| |
| | | | HSBC adopted the revised IFRS 3 ‘Business Combinations’ (‘IFRS 3’) and amendments to IAS 27 ‘Consolidated and Separate Financial Statements’ (‘IAS 27’). The main changes under the standards are that: |
| | – | | acquisition-related costs are recognised as an expense in the income statement in the period in which they are incurred; |
| |
| | – | | all consideration transferred, including contingent consideration, is recognised and measured at fair value at the acquisition date; |
| |
| | – | | equity interests held prior to control being obtained are remeasured to fair value at the date of obtaining control, and any gain or loss is recognised in the income statement; |
| |
| | – | | an option is available, on a transaction-by-transaction basis, to measure any non-controlling (previously referred to as minority) interests in the entity acquired either at fair value, or at the non-controlling interests’ proportionate share of the net identifiable assets of the entity acquired; and |
| |
| | – | | changes in a parent’s ownership interest in a subsidiary that do not result in a change of control are treated as transactions between equity holders and are reported in equity. |
| | | | In terms of their application to HSBC, the revised IFRS 3 and the amendments to IAS 27 apply prospectively to acquisitions and transactions taking place on or after 1 January 2010, and have had no significant effect on the consolidated financial statements of HSBC and the separate financial statements of HSBC Holdings. |
| |
| | | | During 2010, in addition to the above, HSBC adopted a number of interpretations and amendments to standards which had an insignificant effect on the consolidated financial statements of HSBC and the separate financial statements of HSBC Holdings. |
| |
| | (b) | | Differences between IFRSs and Hong Kong Financial Reporting Standards |
| |
| | | | There are no significant differences between IFRSs and Hong Kong Financial Reporting Standards in terms of their application to HSBC and consequently there would be no significant differences had the financial statements been prepared in accordance with Hong Kong Financial Reporting Standards. The Notes on the Financial Statements, taken together with the Report of the Directors, include the aggregate of all disclosures necessary to satisfy IFRSs and Hong Kong reporting requirements. |
| |
| | (c) | | Presentation of information |
| |
| | | | Disclosures under IFRS 4 ‘Insurance Contracts’ (‘IFRS 4’) and IFRS 7 ‘Financial Instruments: Disclosures’ (‘IFRS 7’) concerning the nature and extent of risks relating to insurance contracts and financial instruments have been included in the audited sections of the ‘Report of the Directors: Risk’ on pages 86 to 176. |
| |
| | | | Capital disclosures under IAS 1 ‘Presentation of Financial Statements’ (‘IAS 1’) have been included in the audited sections of ‘Report of the Directors: Capital’ on pages 177 to 182. |
250
Notes on the Financial Statements(continued)
| | | | Disclosures relating to HSBC’s securitisation activities and structured products have been included in the audited section of ‘Report of the Directors: Risk’ on pages 86 to 176. |
| |
| | | | In accordance with HSBC’s policy to provide meaningful disclosures that help investors and other stakeholders understand the Group’s performance, financial position and changes thereto, the information provided in the Notes on the Financial Statements and the Report of the Directors goes beyond the minimum levels required by accounting standards, statutory and regulatory requirements and listing rules. In particular, HSBC has adopted the British Bankers’ Association Code for Financial Reporting Disclosure (‘the BBA Code’). The BBA Code aims to increase the quality and comparability of banks’ disclosures and sets out five disclosure principles together with supporting guidance. In line with the principles of the BBA Code, HSBC assesses good practice recommendations issued from time to time by relevant regulators and standard setters and will assess the applicability and relevance of such guidance, enhancing disclosures where appropriate. |
| |
| | | | In publishing the parent company financial statements here together with the Group financial statements, HSBC Holdings has taken advantage of the exemption in section 408(3) of the Companies Act 2006 not to present its individual income statement and related notes that form a part of these financial statements. |
| |
| | | | HSBC’s consolidated financial statements are presented in US dollars which is also HSBC Holdings’ functional currency. HSBC Holdings’ functional currency is the US dollar because the US dollar and currencies linked to it are the most significant currencies relevant to the underlying transactions, events and conditions of its subsidiaries, as well as representing a significant proportion of its funds generated from financing activities. HSBC uses the US dollar as its presentation currency in its consolidated financial statements because the US dollar and currencies linked to it form the major currency bloc in which HSBC transacts and funds its business. |
| |
| | (d) | | Comparative information |
| |
| | | | As required by US public company reporting requirements, these consolidated financial statements include two years of comparative information for the consolidated income statement, consolidated statement of comprehensive income, consolidated statement of cash flows, consolidated statement of changes in equity and related Notes on the Financial Statements. |
| |
| | (e) | | Use of estimates and assumptions |
| |
| | | | The preparation of financial information requires the use of estimates and assumptions about future conditions. The use of available information and the application of judgement are inherent in the formation of estimates; actual results in the future may differ from estimates upon which financial information is prepared. Management believes that HSBC’s critical accounting policies where judgement is necessarily applied are those which relate to impairment of loans and advances, goodwill impairment, the valuation of financial instruments, the impairment of available-for-sale financial assets and deferred tax assets (see ‘Critical Accounting Policies’ on pages 33 to 36, which form an integral part of these financial statements). |
| |
| | | | Further information about key assumptions concerning the future, and other key sources of estimation uncertainty, are set out in the Notes on the Financial Statements. |
| |
| | (f) | | Consolidation |
| |
| | | | The consolidated financial statements of HSBC comprise the financial statements of HSBC Holdings and its subsidiaries made up to 31 December, with the exception of the banking and insurance subsidiaries of HSBC Bank Argentina, whose financial statements are made up to 30 June annually to comply with local regulations. Accordingly, HSBC uses their audited interim financial statements, drawn up to 31 December annually. |
| |
| | | | Subsidiaries are consolidated from the date that HSBC gains control. The acquisition method of accounting is used when subsidiaries are acquired by HSBC. The cost of an acquisition is measured at the fair value of the consideration, including contingent consideration, given at the date of exchange. Acquisition-related costs are recognised as an expense in the income statement in the period in which they are incurred. The acquired identifiable assets, liabilities and contingent liabilities are measured at their fair values at the date of acquisition. Goodwill is measured as the excess of the aggregate of the consideration transferred, the amount of non-controlling interest and the fair value of HSBC’s previously held equity interest, if any, over the net of the amounts of the identifiable assets acquired and the liabilities assumed. The amount of non-controlling interest is measured either at fair value or at the non-controlling interest’s proportionate share of the acquiree’s identifiable |
251
Notes on the Financial Statements(continued)
| | | | net assets. In a business combination achieved in stages, the previously held equity interest is remeasured at the acquisition-date fair value with the resulting gain or loss recognised in the income statement. In the event that the amounts of net assets acquired is in excess of the aggregate of the consideration transferred, the amount of non-controlling interest and the fair value of HSBC’s previously held equity interest, the difference is recognised immediately in the income statement. |
| |
| | | | Changes in a parent’s ownership interest in a subsidiary that do not result in a loss of control are treated as transactions between equity holders and are reported in equity. |
| |
| | | | Entities that are controlled by HSBC are consolidated until the date that control ceases. |
| |
| | | | In the context of Special Purpose Entities (‘SPE’s), the following circumstances may indicate a relationship in which, in substance, HSBC controls and consequently consolidates an SPE: |
| | – | | the activities of the SPE are being conducted on behalf of HSBC according to its specific business needs so that HSBC obtains benefits from the SPE’s operation; |
| |
| | – | | HSBC has the decision-making powers to obtain the majority of the benefits of the activities of the SPE or, by setting up an ‘autopilot’ mechanism, HSBC has delegated these decision-making powers; |
| |
| | – | | HSBC has rights to obtain the majority of the benefits of the SPE and therefore may be exposed to risks incidental to the activities of the SPE; or |
| |
| | – | | HSBC retains the majority of the residual or ownership risks related to the SPE or its assets in order to obtain benefits from its activities. |
| | | | HSBC performs a re-assessment of consolidation whenever there is a change in the substance of the relationship between HSBC and an SPE. |
| |
| | | | All intra-HSBC transactions are eliminated on consolidation. |
| |
| | | | The consolidated financial statements of HSBC also include the attributable share of the results and reserves of joint ventures and associates. These are based on financial statements made up to 31 December, with the exception of the Bank of Communications, Ping An Insurance and Industrial Bank which are included on the basis of financial statements made up for the twelve months to 30 September. These are equity accounted three months in arrears in order to meet the requirements of the Group’s reporting timetable. HSBC has taken into account the effect of significant transactions or events that occur between the period from 1 October to 31 December that would have a material effect on its results. |
| |
| | (g) | | Future accounting developments |
| |
| | | | At 31 December 2010, a number of standards and interpretations, and amendments thereto, had been issued by the IASB, which are not effective for HSBC’s consolidated financial statements or the separate financial statements of HSBC Holdings as at 31 December 2010. Those which are expected to have a significant effect on HSBC’s consolidated financial statements and the separate financial statements of HSBC Holdings are discussed below. |
| |
| | | | Standards and Interpretations issued by the IASB but not endorsed by the EU |
| |
| | | | In November 2009, the IASB issued IFRS 9 ‘Financial Instruments’ (‘IFRS 9’) which introduced new requirements for the classification and measurement of financial assets. In October 2010, the IASB issued additions to IFRS 9 relating to financial liabilities. Together, these changes represent the first phase in the IASB’s planned replacement of IAS 39 ‘Financial Instruments: Recognition and Measurement’ (‘IAS 39’) with a less complex and improved standard for financial instruments. |
| |
| | | | The standard is effective for annual periods beginning on or after 1 January 2013 with early adoption permitted. IFRS 9 is required to be applied retrospectively. If the standard is adopted prior to 1 January 2012, an entity will be exempt from the requirement to restate prior period comparative information. IFRS 9 is subject to EU endorsement, the timing of which is uncertain. Accordingly, HSBC is unable to provide a date by which it plans to apply IFRS 9. |
| |
| | | | The main changes to the requirements of IAS 39 are summarised below. |
252
Notes on the Financial Statements(continued)
| | – | | All financial assets that are currently in the scope of IAS 39 will be classified as either amortised cost or fair value. The available-for-sale, held-to-maturity and loans and receivables categories will no longer exist. |
| |
| | – | | Classification of financial assets is based on an entity’s business model for managing the financial assets and their contractual cash flow characteristics. Reclassifications between the two categories are prohibited unless there is a change in the entity’s business model. |
| |
| | – | | A financial asset is measured at amortised cost if two criteria are met: i) the objective of the business model is to hold the financial asset for the collection of the contractual cash flows; and ii) the contractual cash flows of the instrument are solely payments of principal and interest on the principal outstanding. All other financial assets are measured at fair value. Movements in the fair value of financial assets classified at fair value are recognised in profit or loss, except for equity investments where an entity takes the option to designate an equity instrument that is not held for trading at fair value through other comprehensive income. If this option is taken, all subsequent changes in fair value are recognised in other comprehensive income with no recycling of gains or losses to the income statement. Dividend income would continue to be recognised in the income statement. |
| |
| | – | | An entity is only permitted to designate a financial asset otherwise meeting the amortised cost criteria at fair value through profit or loss if doing so significantly reduces or eliminates an accounting mismatch. This designation is made on initial recognition and is irrevocable. |
| |
| | – | | Financial assets which contain embedded derivatives are to be classified in their entirety either at fair value or amortised cost depending on whether the contracts as a whole meet the relevant criteria under IFRS 9. |
| |
| | – | | Most of IAS 39’s requirements for financial liabilities are retained, including amortised cost accounting for most financial liabilities. The guidance on separation of embedded derivatives will continue to apply to host contracts that are financial liabilities. However, fair value changes attributable to changes in own credit risk for financial liabilities designated under the fair value option other than loan commitments and financial guarantee contracts are to be presented in the statement of other comprehensive income unless the treatment would create or enlarge an accounting mismatch in profit or loss. These amounts are not subsequently reclassified to the income statement but may be transferred within equity. |
| | | | The second and third phases in the IASB’s project to replace IAS 39 will address the impairment of financial assets measured at amortised cost and hedge accounting. The IASB has indicated that it expects to finalise the replacement of IAS 39 by June 2011. In addition, the IASB is working with the US Financial Accounting Standards Board to reduce inconsistencies between US GAAP and IFRS in accounting for financial instruments. The impact of IFRS 9 may change as a consequence of further developments resulting from the IASB’s project to replace IAS 39. As a result, it is impracticable to quantify the impact of IFRS 9 as at the date of publication of these financial statements. |
| 2 | | Summary of significant accounting policies |
| | (a) | | Interest income and expense |
| |
| | | | Interest income and expense for all financial instruments except for those classified as held for trading or designated at fair value (other than debt securities issued by HSBC and derivatives managed in conjunction with such debt securities issued) are recognised in ‘Interest income’ and ‘Interest expense’ in the income statement using the effective interest method. The effective interest method is a way of calculating the amortised cost of a financial asset or a financial liability (or groups of financial assets or financial liabilities) and of allocating the interest income or interest expense over the relevant period. |
| |
| | | | The effective interest rate is the rate that exactly discounts estimated future cash receipts or payments through the expected life of the financial instrument or, where appropriate, a shorter period, to the net carrying amount of the financial asset or financial liability. When calculating the effective interest rate, HSBC estimates cash flows considering all contractual terms of the financial instrument but excluding future credit losses. The calculation includes all amounts paid or received by HSBC that are an integral part of the effective interest rate of a financial instrument, including transaction costs and all other premiums or discounts. |
| |
| | | | Interest on impaired financial assets is recognised using the rate of interest used to discount the future cash flows for the purpose of measuring the impairment loss. |
253
Notes on the Financial Statements(continued)
| | (b) | | Non-interest income |
| |
| | | | Fee incomeis earned from a diverse range of services provided by HSBC to its customers. Fee income is accounted for as follows: |
| | – | | income earned on the execution of a significant act is recognised as revenue when the act is completed (for example, fees arising from negotiating, or participating in the negotiation of, a transaction for a third-party, such as an arrangement for the acquisition of shares or other securities); |
| |
| | – | | income earned from the provision of services is recognised as revenue as the services are provided (for example, asset management, portfolio and other management advisory and service fees); and |
| |
| | – | | income which forms an integral part of the effective interest rate of a financial instrument is recognised as an adjustment to the effective interest rate (for example, certain loan commitment fees) and recorded in ‘Interest income’ (Note 2a). |
| | | | Net trading incomecomprises all gains and losses from changes in the fair value of financial assets and financial liabilities held for trading, together with the related interest income, expense and dividends. |
| |
| | | | Net income from financial instruments designated at fair valueincludes all gains and losses from changes in the fair value of financial assets and financial liabilities designated at fair value through profit or loss. Interest income and expense and dividend income arising on these financial instruments are also included, except for interest arising from debt securities issued, and derivatives managed in conjunction with those debt securities, which is recognised in ‘Interest expense’ (Note 2a). |
| |
| | | | Dividend incomeis recognised when the right to receive payment is established. This is the ex-dividend date for listed equity securities, and usually the date when shareholders have approved the dividend for unlisted equity securities. |
| |
| | (c) | | Operating segments |
| |
| | | | HSBC’s operating segments are organised into six geographical regions; Europe, Hong Kong, Rest of Asia-Pacific, Middle East, North America and Latin America. Due to the nature of the Group, HSBC’s chief operating decision-maker regularly reviews operating activity on a number of bases, including by geographical region, customer group and global business, and retail businesses by geographical region. HSBC’s operating segments were determined to be geographical regions because the chief operating decision-maker primarily uses information on geographical regions in order to make decisions about allocating resources and assessing performance. |
| |
| | | | Measurement of segmental assets, liabilities, income and expenses is in accordance with the Group’s accounting policies. Segmental income and expenses include transfers between segments and these transfers are conducted on arm’s length terms and conditions. Shared costs are included in segments on the basis of the actual recharges made. |
| |
| | (d) | | Valuation of financial instruments |
| |
| | | | All financial instruments are recognised initially at fair value. In the normal course of business, the fair value of a financial instrument on initial recognition is the transaction price (that is, the fair value of the consideration given or received). In certain circumstances, however, the fair value will be based on other observable current market transactions in the same instrument, without modification or repackaging, or on a valuation technique whose variables include only data from observable markets, such as interest rate yield curves, option volatilities and currency rates. When such evidence exists, HSBC recognises a trading gain or loss on inception of the financial instrument, being the difference between the transaction price and the fair value. When unobservable market data have a significant impact on the valuation of financial instruments, the entire initial difference in fair value indicated by the valuation model from the transaction price is not recognised immediately in the income statement but is recognised over the life of the transaction on an appropriate basis, or when the inputs become observable, or the transaction matures or is closed out, or when HSBC enters into an offsetting transaction. |
| |
| | | | Subsequent to initial recognition, the fair values of financial instruments measured at fair value are measured in accordance with HSBC’s valuation methodologies, which are described in Note 16. |
254
Notes on the Financial Statements(continued)
| | (e) | | Reclassification of financial assets |
| |
| | | | Non-derivative financial assets (other than those designated at fair value through profit or loss upon initial recognition) may be reclassified out of the fair value through profit or loss category in the following circumstances: |
| | – | | financial assets that would have met the definition of loans and receivables at initial recognition (if the financial asset had not been required to be classified as held for trading) may be reclassified out of the fair value through profit or loss category if there is the intention and ability to hold the financial asset for the foreseeable future or until maturity; and |
| |
| | – | | financial assets (except financial assets that would have met the definition of loans and receivables at initial recognition) may be reclassified out of the fair value through profit or loss category and into another category in rare circumstances. |
| | | | When a financial asset is reclassified as described in the above circumstances, the financial asset is reclassified at its fair value on the date of reclassification. Any gain or loss already recognised in the income statement is not reversed. The fair value of the financial asset on the date of reclassification becomes its new cost or amortised cost, as applicable. |
| |
| | (f) | | Loans and advances to banks and customers |
| |
| | | | Loans and advances to banks and customers include loans and advances originated by HSBC which are not classified either as held for trading or designated at fair value. Loans and advances are recognised when cash is advanced to a borrower. They are derecognised when either the borrower repays its obligations, or the loans are sold or written off, or substantially all the risks and rewards of ownership are transferred. They are initially recorded at fair value plus any directly attributable transaction costs and are subsequently measured at amortised cost using the effective interest method, less any impairment losses. Where exposures are hedged by derivatives designated and qualifying as fair value hedges, the carrying value of the loans and advances so hedged includes a fair value adjustment for the hedged risk only. |
| |
| | | | HSBC may commit to underwrite loans on fixed contractual terms for specified periods of time, where the drawdown of the loan is contingent upon certain future events outside the control of HSBC. Where the loan arising from the lending commitment is expected to be held for trading, the commitment to lend is recorded as a derivative and measured at fair value through profit or loss. On drawdown, the loan is classified as held for trading and measured at fair value through profit or loss. Where it is not HSBC’s intention to trade but hold the loan, a provision on the loan commitment is only recorded where it is probable that HSBC will incur a loss. This may occur, for example, where a loss of principal is probable or the interest rate charged on the loan is lower than the cost of funding. On inception of the loan, the loan to be held is recorded at its fair value and subsequently measured at amortised cost using the effective interest method. For certain transactions, such as leveraged finance and syndicated lending activities, the cash advanced is not necessarily the best evidence of the fair value of the loan. For these loans, where the initial fair value is lower than the cash amount advanced (for example, due to the rate of interest charged on the loan being below the market rate of interest), the write-down is charged to the income statement. The write-down will be recovered over the life of the loan, through the recognition of interest income using the effective interest method, unless the loan becomes impaired. The write-down is recorded as a reduction to other operating income. |
| |
| | | | Financial assets which have been reclassified into the loans and receivables category are initially recorded at the fair value at the date of reclassification and are subsequently measured at amortised cost, using the effective interest rate determined at the date of reclassification. |
| |
| | (g) | | Impairment of loans and advances |
| |
| | | | Losses for impaired loans are recognised promptly when there is objective evidence that impairment of a loan or portfolio of loans has occurred. Impairment allowances are calculated on individual loans and on groups of loans assessed collectively. Impairment losses are recorded as charges to the income statement. The carrying amount of impaired loans on the balance sheet is reduced through the use of impairment allowance accounts. Losses expected from future events are not recognised. |
255
Notes on the Financial Statements(continued)
| | | | Individually assessed loans and advances |
| |
| | | | For all loans that are considered individually significant, HSBC assesses on a case-by-case basis at each balance sheet date whether there is any objective evidence that a loan is impaired. The criteria used by HSBC to determine that there is such objective evidence include: |
| | – | | known cash flow difficulties experienced by the borrower; |
| |
| | – | | past due contractual payments of either principal or interest; |
| |
| | – | | breach of loan covenants or conditions; |
| |
| | – | | the probability that the borrower will enter bankruptcy or other financial realisation; and |
| |
| | – | | a significant downgrading in credit rating by an external credit rating agency . |
| | | | For those loans where objective evidence of impairment exists, impairment losses are determined considering the following factors: |
| | – | | HSBC’s aggregate exposure to the customer; |
| |
| | – | | the viability of the customer’s business model and their capacity to trade successfully out of financial difficulties and generate sufficient cash flow to service debt obligations; |
| |
| | – | | the amount and timing of expected receipts and recoveries; |
| |
| | – | | the likely dividend available on liquidation or bankruptcy; |
| |
| | – | | the extent of other creditors’ commitments ranking ahead of, orpari passu with, HSBC and the likelihood of other creditors continuing to support the company; |
| |
| | – | | the complexity of determining the aggregate amount and ranking of all creditor claims and the extent to which legal and insurance uncertainties are evident; |
| |
| | – | | the realisable value of security (or other credit mitigants) and likelihood of successful repossession; |
| |
| | – | | the likely deduction of any costs involved in recovery of amounts outstanding; |
| |
| | – | | the ability of the borrower to obtain, and make payments in, the currency of the loan if not denominated in local currency; and |
| |
| | – | | when available, the secondary market price of the debt. |
| | | | Impairment losses are calculated by discounting the expected future cash flows of a loan at its original effective interest rate and comparing the resultant present value with the loan’s current carrying amount. The impairment allowances on individually significant accounts are reviewed at least quarterly and more regularly when circumstances require. This normally encompasses re-assessment of the enforceability of any collateral held and the timing and amount of actual and anticipated receipts. Individually assessed impairment allowances are only released when there is reasonable and objective evidence of a reduction in the established loss estimate. |
| |
| | | | Collectively assessed loans and advances |
| |
| | | | Impairment is assessed on a collective basis in two circumstances: |
| | – | | to cover losses which have been incurred but have not yet been identified on loans subject to individual assessment; and |
| |
| | – | | for homogeneous groups of loans that are not considered individually significant. |
| | | | Incurred but not yet identified impairment |
| |
| | | | Individually assessed loans for which no evidence of loss has been specifically identified on an individual basis are grouped together according to their credit risk characteristics for the purpose of calculating an estimated collective loss. This reflects impairment losses that HSBC has incurred as a result of events occurring before the balance sheet date, which HSBC is not able to identify on an individual loan basis, and that can be reliably estimated. These losses will only be individually identified in the future. As soon as information becomes available which identifies losses on individual loans within the group, those loans are removed from the group and assessed on an individual basis for impairment. |
256
Notes on the Financial Statements(continued)
| | | | The collective impairment allowance is determined after taking into account: |
| | – | | historical loss experience in portfolios of similar credit risk characteristics (for example, by industry sector, loan grade or product); |
| |
| | – | | the estimated period between impairment occurring and the loss being identified and evidenced by the establishment of an appropriate allowance against the individual loan; and |
| |
| | – | | management’s experienced judgement as to whether current economic and credit conditions are such that the actual level of inherent losses at the balance sheet date is likely to be greater or less than that suggested by historical experience. |
| | | | The period between a loss occurring and its identification is estimated by local management for each identified portfolio. |
| |
| | | | Homogeneous groups of loans and advances |
| |
| | | | Statistical methods are used to determine impairment losses on a collective basis for homogeneous groups of loans that are not considered individually significant, because individual loan assessment is impracticable. Losses in these groups of loans are recorded on an individual basis when individual loans are written off, at which point they are removed from the group. Two alternative methods are used to calculate allowances on a collective basis: |
| | – | | When appropriate empirical information is available, HSBC utilises roll rate methodology. This methodology employs statistical analyses of historical data and experience of delinquency and default to estimate the amount of loans that will eventually be written off as a result of the events occurring before the balance sheet date which HSBC is not able to identify on an individual loan basis, and that can be reliably estimated. Under this methodology, loans are grouped into ranges according to the number of days past due and statistical analysis is used to estimate the likelihood that loans in each range will progress through the various stages of delinquency, and ultimately prove irrecoverable. Current economic conditions are also evaluated when calculating the appropriate level of allowance required to cover inherent loss. The estimated loss is the difference between the present value of expected future cash flows, discounted at the original effective interest rate of the portfolio, and the carrying amount of the portfolio. In certain highly developed markets, sophisticated models also take into account behavioural and account management trends as revealed in, for example, bankruptcy and rescheduling statistics. |
| |
| | – | | When the portfolio size is small or when information is insufficient or not reliable enough to adopt a roll rate methodology, HSBC adopts a basic formulaic approach based on historical loss rate experience. |
| | | | In normal circumstances, historical experience provides the most objective and relevant information from which to assess inherent loss within each portfolio, though sometimes it provides less relevant information about the inherent loss in a given portfolio at the balance sheet date, for example, when there have been changes in economic, regulatory or behavioural conditions which result in the most recent trends in portfolio risk factors being not fully reflected in the statistical models. In these circumstances, the risk factors are taken into account by adjusting the impairment allowances derived solely from historical loss experience. |
| |
| | | | These additional portfolio risk factors may include recent loan portfolio growth and product mix, unemployment rates, bankruptcy trends, geographic concentrations, loan product features (such as the ability of borrowers to repay adjustable-rate loans where reset interest rates give rise to increases in interest charges), economic conditions such as national and local trends in housing markets and interest rates, portfolio seasoning, account management policies and practices, current levels of write-offs, changes in laws and regulations and other items which can affect customer payment patterns on outstanding loans, such as natural disasters. These risk factors, where relevant, are taken into account when calculating the appropriate level of impairment allowances by adjusting the impairment allowances derived solely from historical loss experience. |
| |
| | | | Roll rates, loss rates and the expected timing of future recoveries are regularly benchmarked against actual outcomes to ensure they remain appropriate. |
| |
| | | | Write-off of loans and advances |
| |
| | | | Loans (and the related impairment allowance accounts) are normally written off, either partially or in full, when there is no realistic prospect of recovery. Where loans are secured, this is generally after receipt of any proceeds |
257
Notes on the Financial Statements(continued)
| | | | from the realisation of security. In circumstances where the net realisable value of any collateral has been determined and there is no reasonable expectation of further recovery, write off may be earlier. |
| |
| | | | Reversals of impairment |
| |
| | | | If the amount of an impairment loss decreases in a subsequent period, and the decrease can be related objectively to an event occurring after the impairment was recognised, the excess is written back by reducing the loan impairment allowance account accordingly. The write-back is recognised in the income statement. |
| |
| | | | Reclassified loans and advances |
| |
| | | | Where financial assets have been reclassified out of the fair value through profit or loss category to the loans and receivables category, the effective interest rate determined at the date of reclassification is used to calculate any impairment losses. |
| |
| | | | Following reclassification, where there is a subsequent increase in the estimates of future cash receipts as a result of increased recoverability of those cash receipts, the effect of that increase is recognised as an adjustment to the effective interest rate from the date of change in the estimate rather than as an adjustment to the carrying amount of the asset at the date of change in the estimate. |
| |
| | | | Assets acquired in exchange for loans |
| |
| | | | Non-financial assets acquired in exchange for loans as part of an orderly realisation are recorded as assets held for sale and reported in ‘Other assets’ if the carrying amounts of the assets are recovered principally through sale, the assets are available for sale in their present condition and their sale is highly probable. The asset acquired is recorded at the lower of its fair value less costs to sell and the carrying amount of the loan (net of impairment allowance) at the date of exchange. No depreciation is charged in respect of assets held for sale. Any subsequent write-down of the acquired asset to fair value less costs to sell is recognised in the income statement, in ‘Other operating income’. Any subsequent increase in the fair value less costs to sell, to the extent this does not exceed the cumulative write-down, is also recognised in ‘Other operating income’, together with any realised gains or losses on disposal. |
| |
| | | | Renegotiated loans |
| |
| | | | Loans subject to collective impairment assessment whose terms have been renegotiated are no longer considered past due, but are treated as up to date loans for measurement purposes once the minimum number of payments required under the new arrangements have been received. These renegotiated loans are segregated from other parts of the loan portfolio for the purposes of collective impairment assessment, to reflect their risk profile. Loans subject to individual impairment assessment, whose terms have been renegotiated, are subject to ongoing review to determine whether they remain impaired or should be considered past due. The carrying amount of loans that have been classified as renegotiated retain this classification until maturity or derecognition. Interest is recorded on renegotiated loans taking into account the new contractual terms following renegotiation. |
| |
| | (h) | | Trading assets and trading liabilities |
| |
| | | | Treasury bills, debt securities, equity securities, loans, deposits, debt securities in issue, and short positions in securities are classified as held for trading if they have been acquired or incurred principally for the purpose of selling or repurchasing in the near term, or they form part of a portfolio of identified financial instruments that are managed together and for which there is evidence of a recent pattern of short-term profit-taking. These financial assets or financial liabilities are recognised on trade date, when HSBC enters into contractual arrangements with counterparties to purchase or sell the financial instruments, and are normally derecognised when either sold (assets) or extinguished (liabilities). Measurement is initially at fair value, with transaction costs taken to the income statement. Subsequently, the fair values are remeasured, and gains and losses from changes therein are recognised in the income statement in ‘Net trading income’. |
258
Notes on the Financial Statements(continued)
| | (i) | | Financial instruments designated at fair value |
| |
| | | | Financial instruments, other than those held for trading, are classified in this category if they meet one or more of the criteria set out below, and are so designated by management. HSBC may designate financial instruments at fair value when the designation: |
| | – | | eliminates or significantly reduces measurement or recognition inconsistencies that would otherwise arise from measuring financial assets or financial liabilities, or recognising gains and losses on them, on different bases. Under this criterion, the main classes of financial instruments designated by HSBC are: |
| | | | Long-term debt issues. The interest payable on certain fixed rate long-term debt securities issued has been matched with the interest on ‘receive fixed/pay variable’ interest rate swaps as part of a documented interest rate risk management strategy. An accounting mismatch would arise if the debt securities issued were accounted for at amortised cost, because the related derivatives are measured at fair value with changes in the fair value recognised in the income statement. By designating the long-term debt at fair value, the movement in the fair value of the long-term debt will also be recognised in the income statement. |
| |
| | | | Financial assets and financial liabilities under investment contracts. Liabilities to customers under linked contracts are determined based on the fair value of the assets held in the linked funds, with changes recognised in the income statement. If no designation was made for the assets relating to the customer liabilities they would be classified as available for sale and the changes in fair value would be recorded in other comprehensive income. These financial instruments are managed on a fair value basis and management information is also prepared on this basis. Designation at fair value of the financial assets and liabilities under investment contracts allows the changes in fair values to be recorded in the income statement and presented in the same line. |
| | – | | applies to groups of financial assets, financial liabilities or combinations thereof that are managed, and their performance evaluated, on a fair value basis in accordance with a documented risk management or investment strategy, and where information about the groups of financial instruments is reported to management on that basis. Under this criterion, certain financial assets held to meet liabilities under insurance contracts are the main class of financial instrument so designated. HSBC has documented risk management and investment strategies designed to manage such assets at fair value, taking into consideration the relationship of assets to liabilities in a way that mitigates market risks. Reports are provided to management on the fair value of the assets. Fair value measurement is also consistent with the regulatory reporting requirements under the appropriate regulations for these insurance operations. |
| |
| | – | | relates to financial instruments containing one or more embedded derivatives that significantly modify the cash flows resulting from those financial instruments, including certain debt issues and debt securities held. |
| | | | The fair value designation, once made, is irrevocable. Designated financial assets and financial liabilities are recognised when HSBC enters into the contractual provisions of the arrangements with counterparties, which is generally on trade date, and are normally derecognised when either sold (assets) or extinguished (liabilities). Measurement is initially at fair value, with transaction costs taken to the income statement. Subsequently, the fair values are remeasured, and gains and losses from changes therein are recognised in the income statement in ‘Net income from financial instruments designated at fair value’. |
| |
| | (j) | | Financial investments |
| |
| | | | Treasury bills, debt securities and equity securities intended to be held on a continuing basis, other than those designated at fair value, are classified as available for sale or held to maturity. Financial investments are recognised on trade date when HSBC enters into contractual arrangements with counterparties to purchase securities, and are normally derecognised when either the securities are sold or the borrowers repay their obligations. |
| | (i) | | Available-for-sale financial assets are initially measured at fair value plus direct and incremental transaction costs. They are subsequently remeasured at fair value, and changes therein are recognised in other comprehensive income in ‘Available-for-sale investments – fair value gains/(losses)’ until the financial assets are either sold or become impaired. When available-for-sale financial assets are sold, cumulative gains or losses previously recognised in other comprehensive income are recognised in the income statement as ‘Gains less losses from financial investments’. |
259
Notes on the Financial Statements(continued)
| | | | Interest income is recognised on available-for-sale debt securities using the effective interest rate, calculated over the asset’s expected life. Premiums and/or discounts arising on the purchase of dated investment securities are included in the calculation of their effective interest rates. Dividends are recognised in the income statement when the right to receive payment has been established. |
| |
| | | | At each balance sheet date an assessment is made of whether there is any objective evidence of impairment in the value of a financial asset. Impairment losses are recognised if, and only if, there is objective evidence of impairment as a result of one or more events that occurred after the initial recognition of the financial asset (a ‘loss event’) and that loss event (or events) has an impact on the estimated future cash flows of the financial asset that can be reliably estimated. |
| |
| | | | If the available-for-sale financial asset is impaired, the difference between the financial asset’s acquisition cost (net of any principal repayments and amortisation) and the current fair value, less any previous impairment loss recognised in the income statement, is removed from other comprehensive income and recognised in the income statement. |
| |
| | | | Impairment losses for available-for-sale debt securities are recognised within ‘Loan impairment charges and other credit risk provisions’ in the income statement and impairment losses for available-for-sale equity securities are recognised within ‘Gains less losses from financial investments’ in the income statement. The impairment methodologies for available-for-sale financial assets are set out in more detail below. |
| | – | | Available-for-sale debt securities. When assessing available-for-sale debt securities for objective evidence of impairment at the reporting date, HSBC considers all available evidence, including observable data or information about events specifically relating to the securities which may result in a shortfall in recovery of future cash flows. These events may include a significant financial difficulty of the issuer, a breach of contract such as a default, bankruptcy or other financial reorganisation, or the disappearance of an active market for the debt security because of financial difficulties relating to the issuer. |
| |
| | | | These types of specific event and other factors such as information about the issuers’ liquidity, business and financial risk exposures, levels of and trends in default for similar financial assets, national and local economic trends and conditions, and the fair value of collateral and guarantees may be considered individually, or in combination, to determine if there is objective evidence of impairment of a debt security. |
| |
| | | | In addition, when assessing available-for-sale asset-backed securities (‘ABS’s) for objective evidence of impairment, HSBC considers the performance of underlying collateral and the extent and depth of market price declines. Changes in credit ratings are considered but a downgrade of a security’s credit rating is not, of itself, evidence of impairment. The primary indicators of potential impairment are considered to be adverse fair value movements and the disappearance of an active market for a security. ABS impairment methodologies are described in more detail in ‘Securitisation exposures and other structured products’ on page 128. |
| | – | | Available-for-sale equity securities. Objective evidence of impairment for available-for sale equity securities may include specific information about the issuer as detailed above, but may also include information about significant changes in technology, markets, economics or the law that provides evidence that the cost of the equity securities may not be recovered. |
| |
| | | | A significant or prolonged decline in the fair value of the asset below its cost is also objective evidence of impairment. In assessing whether it is significant, the decline in fair value is evaluated against the original cost of the asset at initial recognition. In assessing whether it is prolonged, the decline is evaluated against the period in which the fair value of the asset has been below its original cost at initial recognition. |
| | | | Once an impairment loss has been recognised on an available-for-sale financial asset, the subsequent accounting treatment for changes in the fair value of that asset differs depending on the nature of the available-for-sale financial asset concerned: |
| | – | | for an available-for-sale debt security, a subsequent decline in the fair value of the instrument is recognised in the income statement when there is further objective evidence of impairment as a result of further decreases in the estimated future cash flows of the financial asset. Where there is no further |
260
Notes on the Financial Statements(continued)
| | | | objective evidence of impairment, the decline in the fair value of the financial asset is recognised in other comprehensive income. If the fair value of a debt security increases in a subsequent period, and the increase can be objectively related to an event occurring after the impairment loss was recognised in the income statement, the impairment loss is reversed through the income statement to the extent of the increase in fair value; |
| |
| | – | | for an available-for-sale equity security, all subsequent increases in the fair value of the instrument are treated as a revaluation and are recognised in other comprehensive income. Impairment losses recognised on the equity security are not reversed through the income statement. Subsequent decreases in the fair value of the available-for-sale equity security are recognised in the income statement, to the extent that further cumulative impairment losses have been incurred in relation to the acquisition cost of the equity security. |
| | (ii) | | Held-to-maturity investments are non-derivative financial assets with fixed or determinable payments and fixed maturities that HSBC positively intends, and is able, to hold to maturity. Held-to-maturity investments are initially recorded at fair value plus any directly attributable transaction costs, and are subsequently measured at amortised cost using the effective interest rate method, less any impairment losses. |
| | (k) | | Sale and repurchase agreements (including stock lending and borrowing) |
| |
| | | | When securities are sold subject to a commitment to repurchase them at a predetermined price (‘repos’), they remain on the balance sheet and a liability is recorded in respect of the consideration received. Securities purchased under commitments to sell (‘reverse repos’) are not recognised on the balance sheet and the consideration paid is recorded in ‘Loans and advances to banks’ or ‘Loans and advances to customers’ as appropriate. The difference between the sale and repurchase price is treated as interest and recognised over the life of the agreement. |
| |
| | | | Securities lending and borrowing transactions are generally secured, with collateral taking the form of securities or cash advanced or received. The transfer of securities to counterparties under these agreements is not normally reflected on the balance sheet. Cash collateral advanced or received is recorded as an asset or a liability respectively. |
| |
| | | | Securities borrowed are not recognised on the balance sheet. If they are sold on to third parties, an obligation to return the securities is recorded as a trading liability and measured at fair value, and any gains or losses are included in ‘Net trading income’. |
| |
| | (l) | | Derivatives and hedge accounting |
| |
| | | | Derivatives are recognised initially, and are subsequently remeasured, at fair value. Fair values of exchange-traded derivatives are obtained from quoted market prices. Fair values of over-the-counter derivatives are obtained using valuation techniques, including discounted cash flow models and option pricing models. |
| |
| | | | Derivatives may be embedded in other financial instruments, for example, a convertible bond with an embedded conversion option. Embedded derivatives are treated as separate derivatives when their economic characteristics and risks are not clearly and closely related to those of the host contract; the terms of the embedded derivative would meet the definition of a stand-alone derivative if they were contained in a separate contract; and the combined contract is not held for trading or designated at fair value. These embedded derivatives are measured at fair value with changes therein recognised in the income statement. |
| |
| | | | Derivatives are classified as assets when their fair value is positive, or as liabilities when their fair value is negative. Derivative assets and liabilities arising from different transactions are only offset if the transactions are with the same counterparty, a legal right of offset exists, and the parties intend to settle the cash flows on a net basis. |
| |
| | | | The method of recognising fair value gains and losses depends on whether derivatives are held for trading or are designated as hedging instruments, and if the latter, the nature of the risks being hedged. All gains and losses from changes in the fair value of derivatives held for trading are recognised in the income statement. When derivatives are designated as hedges, HSBC classifies them as either: (i) hedges of the change in fair value of recognised assets or liabilities or firm commitments (‘fair value hedges’); (ii) hedges of the variability in highly probable future cash flows attributable to a recognised asset or liability, or a forecast transaction (‘cash flow hedges’); or (iii) a hedge of a net investment in a foreign operation (‘net investment hedges’). Hedge accounting |
261
Notes on the Financial Statements(continued)
| | | | is applied to derivatives designated as hedging instruments in a fair value, cash flow or net investment hedge provided certain criteria are met. |
| |
| | | | Hedge accounting |
| |
| | | | At the inception of a hedging relationship, HSBC documents the relationship between the hedging instruments and the hedged items, its risk management objective and its strategy for undertaking the hedge. HSBC also requires a documented assessment, both at hedge inception and on an ongoing basis, of whether or not the hedging instruments, primarily derivatives, that are used in hedging transactions are highly effective in offsetting the changes attributable to the hedged risks in the fair values or cash flows of the hedged items. Interest on designated qualifying hedges is included in ‘Net interest income’. |
| |
| | | | Fair value hedge |
| |
| | | | Changes in the fair value of derivatives that are designated and qualify as fair value hedging instruments are recorded in the income statement, along with changes in the fair value of the hedged assets, liabilities or group thereof that are attributable to the hedged risk. |
| |
| | | | If a hedging relationship no longer meets the criteria for hedge accounting, the cumulative adjustment to the carrying amount of the hedged item is amortised to the income statement based on a recalculated effective interest rate over the residual period to maturity, unless the hedged item has been derecognised, in which case, it is released to the income statement immediately. |
| |
| | | | Cash flow hedge |
| |
| | | | The effective portion of changes in the fair value of derivatives that are designated and qualify as cash flow hedges is recognised in other comprehensive income within ‘Cash flow hedges – fair value gains/(losses)’. Any gain or loss in fair value relating to an ineffective portion is recognised immediately in the income statement. |
| |
| | | | The accumulated gains and losses recognised in other comprehensive income are reclassified to the income statement in the periods in which the hedged item will affect profit or loss. However, when the forecast transaction that is hedged results in the recognition of a non-financial asset or a non-financial liability, the gains and losses previously recognised in other comprehensive income are removed from equity and included in the initial measurement of the cost of the asset or liability. |
| |
| | | | When a hedging instrument expires or is sold, or when a hedge no longer meets the criteria for hedge accounting, any cumulative gain or loss recognised in other comprehensive income at that time remains in equity until the forecast transaction is eventually recognised in the income statement. When a forecast transaction is no longer expected to occur, the cumulative gain or loss that was recognised in other comprehensive income is immediately reclassified to the income statement. |
| |
| | | | Net investment hedge |
| |
| | | | Hedges of net investments in foreign operations are accounted for in a similar way to cash flow hedges. A gain or loss on the effective portion of the hedging instrument is recognised in other comprehensive income; a gain or loss on the ineffective portion is recognised immediately in the income statement. Gains and losses previously recognised in other comprehensive income are reclassified to the income statement on the disposal of the foreign operation. |
| |
| | | | Hedge effectiveness testing |
| |
| | | | To qualify for hedge accounting, HSBC requires that at the inception of the hedge and throughout its life, each hedge must be expected to be highly effective (prospective effectiveness), and demonstrate actual effectiveness (retrospective effectiveness) on an ongoing basis. |
| |
| | | | The documentation of each hedging relationship sets out how the effectiveness of the hedge is assessed. The method adopted by an entity to assess hedge effectiveness will depend on its risk management strategy. |
| |
| | | | For prospective effectiveness, the hedging instrument must be expected to be highly effective in offsetting changes in fair value or cash flows attributable to the hedged risk during the period for which the hedge is |
262
Notes on the Financial Statements(continued)
| | | | designated. For actual effectiveness to be achieved, the changes in fair value or cash flows must offset each other in the range of 80% to 125%. |
| |
| | | | Hedge ineffectiveness is recognised in the income statement in ‘Net trading income’. |
| |
| | | | Derivatives that do not qualify for hedge accounting |
| |
| | | | All gains and losses from changes in the fair values of derivatives that do not qualify for hedge accounting are recognised immediately in the income statement. These gains and losses are reported in ‘Net trading income’, except where derivatives are managed in conjunction with financial instruments designated at fair value (other than derivatives managed in conjunction with debt securities issued by the Group), in which case gains and losses are reported in ‘Net income from financial instruments designated at fair value’. The interest on derivatives managed in conjunction with debt securities issued by the Group which are designated at fair value is recognised in ‘Interest expense’. All other gains and losses on these derivatives are reported in ‘Net income from financial instruments designated at fair value’. |
| |
| | (m) | | Derecognition of financial assets and liabilities |
| |
| | | | Financial assets are derecognised when the contractual right to receive cash flows from the assets has expired; or when HSBC has transferred its contractual right to receive the cash flows of the financial assets, and either: |
| | – | | substantially all the risks and rewards of ownership have been transferred; or |
| |
| | – | | HSBC has neither retained nor transferred substantially all the risks and rewards, but has not retained control. |
| | | | Financial liabilities are derecognised when they are extinguished, that is when the obligation is discharged, cancelled, or expires. |
| |
| | (n) | | Offsetting financial assets and financial liabilities |
| |
| | | | Financial assets and financial liabilities are offset and the net amount is reported in the balance sheet when there is a legally enforceable right to offset the recognised amounts and there is an intention to settle on a net basis, or realise the asset and settle the liability simultaneously. |
| |
| | (o) | | Subsidiaries, associates and joint ventures |
| |
| | | | HSBC classifies investments in entities which it controls as subsidiaries. Where HSBC is a party to a contractual arrangement whereby, together with one or more parties, it undertakes an economic activity that is subject to joint control, HSBC classifies its interest in the venture as a joint venture. HSBC classifies investments in entities over which it has significant influence, and that are neither subsidiaries nor joint ventures, as associates. For the purpose of determining this classification, control is considered to be the power to govern the financial and operating policies of an entity so as to obtain benefits from its activities. |
| |
| | | | HSBC Holdings’ investments in subsidiaries are stated at cost less any impairment losses. An impairment loss recognised in prior periods shall be reversed through the income statement if, and only if, there has been a change in the estimates used to determine the recoverable amount of the investment in subsidiary since the last impairment loss was recognised. |
| |
| | | | Investments in associates and interests in joint ventures are recognised using the equity method. Under this method, such investments are initially stated at cost, including attributable goodwill, and are adjusted thereafter for the post-acquisition change in HSBC’s share of net assets. |
| |
| | | | Profits on transactions between HSBC and its associates and joint ventures are eliminated to the extent of HSBC’s interest in the respective associates or joint ventures. Losses are also eliminated to the extent of HSBC’s interest in the associates or joint ventures unless the transaction provides evidence of an impairment of the asset transferred. |
| |
| | (p) | | Goodwill and intangible assets |
| | (i) | | Goodwill arises on the acquisition of subsidiaries, when the aggregate of the fair value of the consideration transferred, the amount of any non-controlling interest and the fair value of any previously held equity |
263
Notes on the Financial Statements(continued)
| | | | interest in the acquiree exceed the amounts of the identifiable assets and liabilities acquired. If they do not exceed the amounts of the identifiable assets and liabilities of an acquired business, the difference is recognised immediately in the income statement. Goodwill arises on the acquisition of interests in joint ventures and associates when the cost of investment exceeds HSBC’s share of the net fair value of the associate’s or joint venture’s identifiable assets and liabilities. |
| |
| | | | Intangible assets are recognised separately from goodwill when they are separable or arise from contractual or other legal rights, and their fair value can be measured reliably. |
| |
| | | | Goodwill is allocated to cash-generating units for the purpose of impairment testing, which is undertaken at the lowest level at which goodwill is monitored for internal management purposes. Impairment testing is performed at least annually, and whenever there is an indication that the cash-generating unit may be impaired, by comparing the recoverable amount from a cash-generating unit with the carrying amount of its net assets, including attributable goodwill. The recoverable amount of an asset is the higher of its fair value less cost to sell, and its value in use. Value in use is the present value of the expected future cash flows from a cash-generating unit. If the recoverable amount is less than the carrying value, an impairment loss is charged to the income statement. Goodwill is stated at cost less accumulated impairment losses. |
| |
| | | | Goodwill on acquisitions of interests in joint ventures and associates is included in ‘Interests in associates and joint ventures’ and is not tested separately for impairment. |
| |
| | | | At the date of disposal of a business, attributable goodwill is included in HSBC’s share of net assets in the calculation of the gain or loss on disposal. |
| |
| | (ii) | | Intangible assets include the present value of in-force long-term insurance business, computer software, trade names, mortgage servicing rights, customer lists, core deposit relationships, credit card customer relationships and merchant or other loan relationships. Computer software includes both purchased and internally generated software. The cost of internally generated software comprises all directly attributable costs necessary to create, produce and prepare the software to be capable of operating in the manner intended by management. Costs incurred in the ongoing maintenance of software are expensed immediately as incurred. |
| |
| | | | Intangible assets are subject to impairment review if there are events or changes in circumstances that indicate that the carrying amount may not be recoverable. Where: |
| | – | | intangible assets have an indefinite useful life, or are not yet ready for use, they are tested for impairment annually. This impairment test may be performed at any time during the year, provided it is performed at the same time every year. An intangible asset recognised during the current period is tested before the end of the current year; and |
| |
| | – | | intangible assets have a finite useful life, except for the present value of in-force long-term insurance business, they are stated at cost less amortisation and accumulated impairment losses and are amortised over their estimated useful lives. Estimated useful life is the lower of legal duration and expected useful life. The amortisation of mortgage servicing rights is included within ‘Net fee income’. |
| | | | For the accounting policy governing the present value of in-force long-term insurance business (see Note 2y). |
| |
| | (iii) | | Intangible assets with finite useful lives are amortised, generally on a straight-line basis, over their useful lives as follows: |
| | | |
| Trade names | | 10 years |
| Mortgage servicing rights | | generally between 5 and 12 years |
| Internally generated software | | between 3 and 5 years |
| Purchased software | | between 3 and 5 years |
| Customer/merchant relationships | | between 3 and 10 years |
| Other | | generally 10 years |
264
Notes on the Financial Statements(continued)
| | (q) | | Property, plant and equipment |
| |
| | | | Land and buildings are stated at historical cost, or fair value at the date of transition to IFRSs (‘deemed cost’), less any impairment losses and depreciation calculated to write-off the assets over their estimated useful lives as follows: |
| | – | | freehold land is not depreciated; |
| |
| | – | | freehold buildings are depreciated at the greater of 2% per annum on a straight-line basis or over their remaining useful lives; and |
| |
| | – | | leasehold buildings are depreciated over the shorter of their unexpired terms of the leases or their remaining useful lives. |
| | | | Equipment, fixtures and fittings (including equipment on operating leases where HSBC is the lessor) are stated at cost less any impairment losses and depreciation calculated on a straight-line basis to write-off the assets over their useful lives, which run to a maximum of 35 years but are generally between 5 years and 20 years. |
| |
| | | | Property, plant and equipment is subject to an impairment review if there are events or changes in circumstances which indicate that the carrying amount may not be recoverable. |
| |
| | | | HSBC holds certain properties as investments to earn rentals or for capital appreciation, or both. Investment properties are included in the balance sheet at fair value with changes therein recognised in the income statement in the period of change. Fair values are determined by independent professional valuers who apply recognised valuation techniques. |
| |
| | (r) | | Finance and operating leases |
| |
| | | | Agreements which transfer to counterparties substantially all the risks and rewards incidental to the ownership of assets, but not necessarily legal title, are classified as finance leases. When HSBC is a lessor under finance leases the amounts due under the leases, after deduction of unearned charges, are included in ‘Loans and advances to banks’ or ‘Loans and advances to customers’, as appropriate. The finance income receivable is recognised in ‘Net interest income’ over the periods of the leases so as to give a constant rate of return on the net investment in the leases. |
| |
| | | | When HSBC is a lessee under finance leases, the leased assets are capitalised and included in ‘Property, plant and equipment’ and the corresponding liability to the lessor is included in ‘Other liabilities’. A finance lease and its corresponding liability are recognised initially at the fair value of the asset or, if lower, the present value of the minimum lease payments. Finance charges payable are recognised in ‘Net interest income’ over the period of the lease based on the interest rate implicit in the lease so as to give a constant rate of interest on the remaining balance of the liability. |
| |
| | | | All other leases are classified as operating leases. When acting as lessor, HSBC includes the assets subject to operating leases in ‘Property, plant and equipment’ and accounts for them accordingly. Impairment losses are recognised to the extent that residual values are not fully recoverable and the carrying value of the assets is thereby impaired. When HSBC is the lessee, leased assets are not recognised on the balance sheet. Rentals payable and receivable under operating leases are accounted for on a straight-line basis over the periods of the leases and are included in ‘General and administrative expenses’ and ‘Other operating income’, respectively. |
| |
| | (s) | | Income tax |
| |
| | | | Income tax comprises current tax and deferred tax. Income tax is recognised in the income statement except to the extent that it relates to items recognised in other comprehensive income or directly in equity, in which case it is recognised in the same statement in which the related item appears. |
| |
| | | | Current tax is the tax expected to be payable on the taxable profit for the year, calculated using tax rates enacted or substantively enacted by the balance sheet date, and any adjustment to tax payable in respect of previous years. Current tax assets and liabilities are offset when HSBC intends to settle on a net basis and the legal right to offset exists. |
| |
| | | | Deferred tax is recognised on temporary differences between the carrying amounts of assets and liabilities in the balance sheet and the amounts attributed to such assets and liabilities for tax purposes. Deferred tax liabilities are generally recognised for all taxable temporary differences and deferred tax assets are recognised to the extent |
265
Notes on the Financial Statements(continued)
| | | | that it is probable that future taxable profits will be available against which deductible temporary differences can be utilised. |
| |
| | | | Deferred tax is calculated using the tax rates expected to apply in the periods in which the assets will be realised or the liabilities settled, based on tax rates and laws enacted, or substantively enacted, by the balance sheet date. Deferred tax assets and liabilities are offset when they arise in the same tax reporting group and relate to income taxes levied by the same taxation authority, and when HSBC has a legal right to offset. |
| |
| | | | Deferred tax relating to actuarial gains and losses on post-employment benefits is recognised in other comprehensive income. Deferred tax relating to share-based payment transactions is recognised directly in equity to the extent that the amount of the estimated future tax deduction exceeds the amount of the related cumulative remuneration expense. Deferred tax relating to fair value re-measurements of available-for-sale investments and cash flow hedging instruments which are charged or credited directly to other comprehensive income, is also charged or credited to other comprehensive income and is subsequently recognised in the income statement when the deferred fair value gain or loss is recognised in the income statement. |
| |
| | (t) | | Pension and other post-employment benefits |
| |
| | | | HSBC operates a number of pension and other post-employment benefit plans throughout the world. These plans include both defined benefit and defined contribution plans and various other post-employment benefits such as post-employment healthcare. |
| |
| | | | Payments to defined contribution plans and state-managed retirement benefit plans, where HSBC’s obligations under the plans are equivalent to a defined contribution plan, are charged as an expense as they fall due. |
| |
| | | | The defined benefit pension costs and the present value of defined benefit obligations are calculated at the reporting date by the schemes’ actuaries using the Projected Unit Credit Method. The net charge to the income statement mainly comprises the current service cost, plus the unwinding of the discount rate on plan liabilities, less the expected return on plan assets, and is presented in operating expenses. Past service costs are charged immediately to the income statement to the extent that the benefits have vested, and are otherwise recognised on a straight-line basis over the average period until the benefits vest. Actuarial gains and losses comprise experience adjustments (the effects of differences between the previous actuarial assumptions and what has actually occurred), as well as the effects of changes in actuarial assumptions. Actuarial gains and losses are recognised in other comprehensive income in the period in which they arise. |
| |
| | | | The defined benefit liability recognised in the balance sheet represents the present value of defined benefit obligations adjusted for unrecognised past service costs and reduced by the fair value of plan assets. Any net defined benefit surplus is limited to unrecognised past service costs plus the present value of available refunds and reductions in future contributions to the plan. |
| |
| | | | The cost of obligations arising from other post-employment defined benefit plans, such as defined benefit health-care plans, are accounted for on the same basis as defined benefit pension plans. |
| |
| | (u) | | Share-based payments |
| |
| | | | The cost of share-based payment arrangements with employees is measured by reference to the fair value of equity instruments on the date they are granted and recognised as an expense on a straight-line basis over the vesting period, with a corresponding credit to the ‘Share-based payment reserve’. The vesting period is the period during which all the specified vesting conditions of a share-based payment arrangement are to be satisfied. The fair value of equity instruments that are made available immediately, with no vesting period attached to the award, are expensed immediately. |
| |
| | | | Fair value is determined by using appropriate valuation models, taking into account the terms and conditions upon which the equity instruments were granted. Vesting conditions include service conditions and performance conditions; any other features of a share-based payment arrangement are non-vesting conditions. Market performance conditions and non-vesting conditions are taken into account when estimating the fair value of equity instruments at the date of grant, so that an award is treated as vesting irrespective of whether the market performance condition or non-vesting condition is satisfied, provided all other vesting conditions are satisfied. |
| |
| | | | Vesting conditions, other than market performance conditions, are not taken into account in the initial estimate of the fair value at the grant date. They are taken into account by adjusting the number of equity instruments |
266
Notes on the Financial Statements(continued)
| | | | included in the measurement of the transaction, so that the amount recognised for services received as consideration for the equity instruments granted shall be based on the number of equity instruments that eventually vest. On a cumulative basis, no expense is recognised for equity instruments that do not vest because of a failure to satisfy non-market performance or service conditions. |
| |
| | | | Where an award has been modified, as a minimum, the expense of the original award continues to be recognised as if it had not been modified. Where the effect of a modification is to increase the fair value of an award or increase the number of equity instruments, the incremental fair value of the award or incremental fair value of the extra equity instruments is recognised in addition to the expense of the original grant, measured at the date of modification, over the modified vesting period. |
| |
| | | | A cancellation that occurs during the vesting period is treated as an acceleration of vesting, and recognised immediately for the amount that would otherwise have been recognised for services over the vesting period. |
| |
| | | | Where HSBC Holdings enters into share-based payment arrangements involving employees of subsidiaries, the cost is recognised in ‘Investment in subsidiaries’ and credited to the ‘Share-based payment reserve’ over the vesting period. Where a subsidiary funds the share-based payment arrangement, ‘Investment in subsidiaries’ is reduced by the fair value of equity instruments. |
| |
| | (v) | | Foreign currencies |
| |
| | | | Items included in the financial statements of each of HSBC’s entities are measured using the currency of the primary economic environment in which the entity operates (‘the functional currency’). HSBC’s consolidated financial statements are presented in US dollars which is also HSBC Holdings’ functional currency. |
| |
| | | | Transactions in foreign currencies are recorded in the functional currency at the rate of exchange prevailing on the date of the transaction. Monetary assets and liabilities denominated in foreign currencies are translated into the functional currency at the rate of exchange ruling at the balance sheet date. Any resulting exchange differences are included in the income statement. Non-monetary assets and liabilities that are measured at historical cost in a foreign currency are translated into the functional currency using the rate of exchange at the date of the initial transaction. Non-monetary assets and liabilities measured at fair value in a foreign currency are translated into the functional currency using the rate of exchange at the date the fair value was determined. Any exchange component of a gain or loss on a non-monetary item is recognised in other comprehensive income if the gain or loss on the non-monetary item is recognised in other comprehensive income. Any exchange component of a gain or loss on a non-monetary item is recognised in the income statement if the gain or loss on the non-monetary item is recognised in the income statement. |
| |
| | | | In the consolidated financial statements, the assets, including related goodwill where applicable, and liabilities of branches, subsidiaries, joint ventures and associates whose functional currency is not US dollars, are translated into the Group’s presentation currency at the rate of exchange ruling at the balance sheet date. The results of branches, subsidiaries, joint ventures and associates whose functional currency is not US dollars are translated into US dollars at the average rates of exchange for the reporting period. Exchange differences arising from the retranslation of opening foreign currency net assets, and exchange differences arising from retranslation of the result for the reporting period from the average rate to the exchange rate prevailing at the period end, are recognised in other comprehensive income. Exchange differences on a monetary item that is part of a net investment in a foreign operation are recognised in the income statement of the separate financial statements. In consolidated financial statements these exchange differences are recognised in other comprehensive income. On disposal of a foreign operation, exchange differences relating thereto and previously recognised in other comprehensive income are recognised in the income statement. |
| |
| | (w) | | Provisions |
| |
| | | | Provisions are recognised when it is probable that an outflow of economic benefits will be required to settle a current legal or constructive obligation, which has arisen as a result of past events, and for which a reliable estimate can be made of the amount of the obligation. |
| |
| | | | Contingent liabilities, which include certain guarantees and letters of credit pledged as collateral security, are possible obligations that arise from past events whose existence will be confirmed only by the occurrence, or non-occurrence, of one or more uncertain future events not wholly within the control of HSBC; or are present obligations that have arisen from past events but are not recognised because it is not probable that settlement will |
267
Notes on the Financial Statements(continued)
| | | | require the outflow of economic benefits, or because the amount of the obligations cannot be reliably measured. Contingent liabilities are not recognised in the financial statements but are disclosed unless the probability of settlement is remote. |
| |
| | (x) | | Financial guarantee contracts |
| |
| | | | Liabilities under financial guarantee contracts which are not classified as insurance contracts are recorded initially at their fair value, which is generally the fee received or receivable. Subsequently, financial guarantee liabilities are measured at the higher of the initial fair value, less cumulative amortisation, and the best estimate of the expenditure required to settle the obligations. |
| |
| | | | HSBC Holdings has issued financial guarantees and similar contracts to other Group entities. Where it has previously asserted explicitly that it regards such contracts as insurance contracts and has used accounting applicable to insurance contracts, HSBC may elect to account for guarantees as an insurance contract. This election is made on a contract by contract basis, but the election for each contract is irrevocable. Where these guarantees have been classified as insurance contracts, they are measured and recognised as insurance liabilities. |
| |
| | (y) | | Insurance contracts |
| |
| | | | Through its insurance subsidiaries, HSBC issues contracts to customers that contain insurance risk, financial risk or a combination thereof. A contract under which HSBC accepts significant insurance risk from another party by agreeing to compensate that party on the occurrence of a specified uncertain future event, is classified as an insurance contract. An insurance contract may also transfer financial risk, but is accounted for as an insurance contract if the insurance risk is significant. |
| |
| | | | While investment contracts with discretionary participation features are financial instruments, they continue to be treated as insurance contracts as permitted by IFRS 4. |
| |
| | | | Insurance contracts are accounted for as follows: |
| |
| | | | Premiums |
| |
| | | | Gross insurance premiums for non-life insurance business are reported as income over the term of the insurance contracts based on the proportion of risks borne during the accounting period. The unearned premium (the proportion of the business underwritten in the accounting year relating to the period of risk after the balance sheet date) is calculated on a daily or monthly pro rata basis. |
| |
| | | | Premiums for life insurance contracts are accounted for when receivable, except in unit-linked insurance contracts where premiums are accounted for when liabilities are established. |
| |
| | | | Reinsurance premiums are accounted for in the same accounting period as the premiums for the direct insurance contracts to which they relate. |
| |
| | | | Claims and reinsurance recoveries |
| |
| | | | Gross insurance claims for non-life insurance contracts include paid claims and movements in outstanding claims liabilities. |
| |
| | | | Gross insurance claims for life insurance contracts reflect the total cost of claims arising during the year, including claim handling costs and any policyholder bonuses allocated in anticipation of a bonus declaration. Claims arising during the year include maturities, surrenders and death claims. |
| |
| | | | Maturity claims are recognised when due for payment. Surrenders are recognised when paid or at an earlier date on which, following notification, the policy ceases to be included within the calculation of the related insurance liabilities. Death claims are recognised when notified. |
| |
| | | | Reinsurance recoveries are accounted for in the same period as the related claim. |
| |
| | | | Liabilities under insurance contracts |
| |
| | | | Outstanding claims liabilities for non-life insurance contracts are based on the estimated ultimate cost of all claims incurred but not settled at the balance sheet date, whether reported or not, together with related claim- |
268
Notes on the Financial Statements(continued)
| | | | handling costs and a reduction for the expected value of salvage and other recoveries. Liabilities for claims incurred but not reported are made on an estimated basis, using appropriate statistical techniques. |
| |
| | | | Liabilities under non-linked life insurance contracts are calculated by each life insurance operation based on local actuarial principles. |
| |
| | | | Liabilities under unit-linked life insurance contracts are at least equivalent to the surrender or transfer value which is calculated by reference to the value of the relevant underlying funds or indices. |
| |
| | | | A liability adequacy test is carried out on insurance liabilities to ensure that the carrying amount of the liabilities is sufficient in the light of current estimates of future cash flows. When performing the liability adequacy test, all contractual cash flows are discounted and compared with the carrying value of the liability. When a shortfall is identified it is charged immediately to the income statement. |
| |
| | | | Present value of in-force long-term insurance business |
| |
| | | | The value placed on insurance contracts that are classified as long-term insurance business or long-term investment contracts with discretionary participating features (‘DPF’) and are in force at the balance sheet date is recognised as an asset. The asset represents the present value of the equity holders’ interest in the profits expected to emerge from these contracts written at the balance sheet date. |
| |
| | | | The present value of in-force long-term insurance business and long-term investment contracts with DPF, referred to as ‘PVIF’, is determined by discounting the equity holders’ interest in future profits expected to emerge from business currently in force using appropriate assumptions in assessing factors such as future mortality, lapse rates and levels of expenses and a risk discount rate that reflects the risk premium attributable to the respective contracts. The PVIF incorporates allowances for both non-market risk and the value of financial options and guarantees. The PVIF asset is presented gross of attributable tax in the balance sheet and movements in the PVIF asset are included in ‘Other operating income’ on a gross of tax basis. |
| |
| | | | Future profit participation |
| |
| | | | Where contracts provide discretionary profit participation benefits to policyholders, liabilities for these contracts include provisions for the future discretionary benefits to policyholders. These provisions reflect actual performance of the investment portfolio to date and management expectation on the future performance in connection with the assets backing the contracts, as well as other experience factors such as mortality, lapses and operational efficiency, where appropriate. This benefit may arise from the contractual terms, regulation, or past distribution policy. |
| |
| | | | In the case of net unrealised investment gains on contracts whose discretionary benefits principally reflect the actual performance of the investment portfolio, the corresponding increase in the liabilities is recognised in either the income statement or other comprehensive income, following the treatment of the unrealised gains on the relevant assets. In the case of net unrealised losses, a deferred participating asset is recognised only to the extent that its recoverability is highly probable. Movements in the liabilities arising from realised gains and losses on relevant assets are recognised in the income statement. |
| |
| | | | Investment contracts |
| |
| | | | Customer liabilities under linked and certain non-linked investment contracts and the corresponding financial assets are designated at fair value. Movements in fair value are recognised in ‘Net income from financial investments designated at fair value’. Premiums receivable and amounts withdrawn are accounted for as increases or decreases in the liability recorded in respect of investment contracts. |
| |
| | | | Liabilities under linked investment contracts are at least equivalent to the surrender or transfer value which is calculated by reference to the value of the relevant underlying funds or indices. |
| |
| | | | Investment management fees receivable are recognised in the income statement over the period of the provision of the investment management services, in ‘Net fee income’. |
| |
| | | | The incremental costs directly related to the acquisition of new investment contracts or renewing existing investment contracts are deferred and amortised over the period during which the investment management services are provided. |
269
Notes on the Financial Statements(continued)
| | (z) | | Debt securities issued and deposits by customers and banks |
| |
| | | | Financial liabilities are recognised when HSBC enters into the contractual provisions of the arrangements with counterparties, which is generally on trade date, and initially measured at fair value, which is normally the consideration received, net of directly attributable transaction costs incurred. Subsequent measurement of financial liabilities, other than those measured at fair value through profit or loss and financial guarantees, is at amortised cost, using the effective interest method to amortise the difference between proceeds received, net of directly attributable transaction costs incurred, and the redemption amount over the expected life of the instrument. |
| |
| | (aa) | | Share capital |
| |
| | | | Shares are classified as equity when there is no contractual obligation to transfer cash or other financial assets. Incremental costs directly attributable to the issue of equity instruments are shown in equity as a deduction from the proceeds, net of tax. |
| |
| | | | HSBC Holdings plc shares held by HSBC are recognised in equity as a deduction from retained earnings until they are cancelled. When such shares are subsequently sold, reissued or otherwise disposed of, any consideration received is included in equity, net of any directly attributable incremental transaction costs and related income tax effects. |
| |
| | (ab) | | Cash and cash equivalents |
| |
| | | | For the purpose of the statement of cash flows, cash and cash equivalents include highly liquid investments that are readily convertible to known amounts of cash and which are subject to an insignificant risk of change in value. Such investments are normally those with less than three months’ maturity from the date of acquisition, and include cash and balances at central banks, treasury bills and other eligible bills, loans and advances to banks, items in the course of collection from or in transmission to other banks, and certificates of deposit. |
| |
| | (ac) | | Rights issues |
| |
| | | | Rights issues to acquire a fixed number of the entity’s own equity instruments for a fixed amount of any currency are equity instruments if the entity offers the rights issues pro rata to all of its existing owners of the same class of its own non-derivative equity instruments. On initial recognition, these rights are recognised in shareholders’ equity and are not subsequently re-measured during the offer period. Following the exercise of the rights and the allotment of new shares, the cash proceeds of the rights issue are recognised in shareholders’ equity. Incremental costs directly attributable to the rights issue are shown as a deduction from the proceeds, net of tax. |
270
Notes on the Financial Statements(continued)
| 3 | | Net income/(expense) from financial instruments designated at fair value |
| | | Net income/(expense) from financial instruments designated at fair value includes: |
| | • | | all gains and losses from changes in the fair value of financial assets and liabilities designated at fair value, including liabilities under investment contracts; |
| |
| | • | | all gains and losses from changes in the fair value of derivatives that are managed in conjunction with financial assets and liabilities designated at fair value; and |
| |
| | • | | interest income, interest expense and dividend income in respect of: |
| | – | | financial assets and liabilities designated at fair value; and |
| |
| | – | | derivatives managed in conjunction with the above, |
| | | | except for interest arising from HSBC’s issued debt securities and derivatives managed in conjunction with those debt securities, which is recognised in ‘Interest expense’. |
| | | Net income/(expense) from financial instruments designated at fair value |
| |
| | | HSBC |
| | | | | | | | | | | | | |
| | | 2010 | | | 2009 | | | 2008 | |
| | | US$m | | | US$m | | | US$m | |
| | | | | | | | | | | | | |
| Net income/(expense) arising on: | | | | | | | | | | | | |
| – financial assets held to meet liabilities under insurance and investment contracts | | | 2,349 | | | | 3,793 | | | | (5,064 | ) |
| – other financial assets designated at fair value | | | 230 | | | | 2 | | | | 1,738 | |
| – derivatives managed in conjunction with other financial assets designated at fair value | | | (149 | ) | | | (249 | ) | | | 77 | |
| | | | | | | |
| | | | 2,430 | | | | 3,546 | | | | (3,249 | ) |
| | | | | | | |
| – liabilities to customers under investment contracts | | | (946 | ) | | | (1,329 | ) | | | 1,751 | |
| – HSBC’s long-term debt issued and related derivatives | | | (258 | ) | | | (6,247 | ) | | | 6,679 | |
| | | | | | | |
| – changes in own credit spread on long-term debt | | | (63 | ) | | | (6,533 | ) | | | 6,570 | |
| – derivatives managed in conjunction with HSBC’s issued debt securities | | | (275 | ) | | | (1,726 | ) | | | 4,413 | |
| – other changes in fair value | | | 80 | | | | 2,012 | | | | (4,304 | ) |
| | | | | | | |
| – other financial liabilities designated at fair value | | | (18 | ) | | | 492 | | | | (1,368 | ) |
| – derivatives managed in conjunction with other financial liabilities designated at fair value | | | 12 | | | | 7 | | | | 39 | |
| | | | | | | |
| | | | (1,210 | ) | | | (7,077 | ) | | | 7,101 | |
| | | | | | | |
| | | | 1,220 | | | | (3,531 | ) | | | 3,852 | |
| | | | | | | |
| | | | | | | | | | | | | |
| | | 2010 | | | 2009 | | | 2008 | |
| | | US$m | | | US$m | | | US$m | |
| | | | | | | | | | | | | |
| Net income/(expense) arising on HSBC Holdings long-term debt issued and related derivatives | | | | | | | | | | | | |
| – changes in own credit spread on long-term debt | | | 248 | | | | (2,612 | ) | | | 2,262 | |
| – derivatives managed in conjunction with HSBC Holdings issued debt securities | | | (482 | ) | | | (352 | ) | | | 688 | |
| – other changes in fair value | | | 373 | | | | 201 | | | | 37 | |
| | | | | | | |
| | | | 139 | | | | (2,763 | ) | | | 2,987 | |
| | | | | | | |
271
Notes on the Financial Statements(continued)
| 4 | | Net earned insurance premiums |
| | | | | | | | | | | | | | | | | | | | | |
| | | | | | | Life | | | Life | | | Investment | | | | |
| | | Non-life | | | insurance | | | insurance | | | contracts | | | | |
| | | insurance | | | (non-linked) | | | (linked) | | | with DPF | 1 | | Total | |
| | | US$m | | | US$m | | | US$m | | | US$m | | | US$m | |
| | | | | | | | | | | | | | | | | | | | | |
2010 | | | | | | | | | | | | | | | | | | | | |
| Gross earned premiums | | | 1,275 | | | | 5,427 | | | | 1,956 | | | | 2,951 | | | | 11,609 | |
| | | | | | | | | | | |
| – gross written premiums | | | 1,192 | | | | 5,357 | | | | 1,956 | | | | 2,951 | | | | 11,456 | |
| – movement in unearned premiums | | | 83 | | | | 70 | | | | – | | | | – | | | | 153 | |
| | | | | | | | | | | |
| | | | | | | | | | | | | | | | | | | | | |
| Reinsurers’ share of gross earned premiums | | | (160 | ) | | | (289 | ) | | | (14 | ) | | | – | | | | (463 | ) |
| | | | | | | | | | | |
| – gross written premiums ceded to reinsurers | | | (172 | ) | | | (266 | ) | | | (8 | ) | | | – | | | | (446 | ) |
| – reinsurers’ share of movement in unearned premiums | | | 12 | | | | (23 | ) | | | (6 | ) | | | – | | | | (17 | ) |
| | | | | | | | | | | |
| | | | | | | | | | | | | | | | | | | | | |
| | | | | | | | | | | |
| | | | | | | | | | | | | | | | | | | | | |
| | | | 1,115 | | | | 5,138 | | | | 1,942 | | | | 2,951 | | | | 11,146 | |
| | | | | | | | | | | |
| | | | | | | | | | | | | | | | | | | | | |
| 2009 | | | | | | | | | | | | | | | | | | | | |
| Gross earned premiums | | | 1,572 | | | | 5,218 | | | | 1,427 | | | | 2,774 | | | | 10,991 | |
| | | | | | | | | | | |
| – gross written premiums | | | 1,339 | | | | 5,285 | | | | 1,427 | | | | 2,774 | | | | 10,825 | |
| – movement in unearned premiums | | | 233 | | | | (67 | ) | | | – | | | | – | | | | 166 | |
| | | | | | | | | | | |
| | | | | | | | | | | | | | | | | | | | | |
| Reinsurers’ share of gross earned premiums | | | (225 | ) | | | (278 | ) | | | (17 | ) | | | – | | | | (520 | ) |
| | | | | | | | | | | |
| – gross written premiums ceded to reinsurers | | | (215 | ) | | | (280 | ) | | | (11 | ) | | | – | | | | (506 | ) |
| – reinsurers’ share of movement in unearned premiums | | | (10 | ) | | | 2 | | | | (6 | ) | | | – | | | | (14 | ) |
| | | | | | | | | | | |
| | | | | | | | | | | | | | | | | | | | | |
| | | | | | | | | | | |
| | | | | | | | | | | | | | | | | | | | | |
| | | | 1,347 | | | | 4,940 | | | | 1,410 | | | | 2,774 | | | | 10,471 | |
| | | | | | | | | | | |
| | | | | | | | | | | | | | | | | | | | | |
| 2008 | | | | | | | | | | | | | | | | | | | | |
| Gross earned premiums | | | 1,834 | | | | 6,086 | | | | 1,825 | | | | 2,802 | | | | 12,547 | |
| | | | | | | | | | | |
| – gross written premiums | | | 1,776 | | | | 6,257 | | | | 1,825 | | | | 2,802 | | | | 12,660 | |
| – movement in unearned premiums | | | 58 | | | | (171 | ) | | | – | | | | – | | | | (113 | ) |
| | | | | | | | | | | |
| | | | | | | | | | | | | | | | | | | | | |
| Reinsurers’ share of gross earned premiums | | | (263 | ) | | | (851 | ) | | | (583 | ) | | | – | | | | (1,697 | ) |
| | | | | | | | | | | |
| – gross written premiums ceded to reinsurers | | | (260 | ) | | | (878 | ) | | | (564 | ) | | | – | | | | (1,702 | ) |
| – reinsurers’ share of movement in unearned premiums | | | (3 | ) | | | 27 | | | | (19 | ) | | | – | | | | 5 | |
| | | | | | | | | | | |
| | | | | | | | | | | | | | | | | | | | | |
| | | | | | | | | | | |
| | | | | | | | | | | | | | | | | | | | | |
| | | | 1,571 | | | | 5,235 | | | | 1,242 | | | | 2,802 | | | | 10,850 | |
| | | | | | | | | | | |
| | |
| 1 | | Discretionary participation features. |
| 5 | | Net insurance claims incurred and movement in liabilities to policyholders |
| | | | | | | | | | | | | | | | | | | | | |
| | | | | | | Life | | | Life | | | Investment | | | | |
| | | Non-life | | | insurance | | | insurance | | | contracts | | | | |
| | | insurance | | | (non-linked) | | | (linked) | | | with DPF | 1 | | Total | |
| | | US$m | | | US$m | | | US$m | | | US$m | | | US$m | |
| | | | | | | | | | | | | | | | | | | | | |
2010 | | | | | | | | | | | | | | | | | | | | |
| Gross claims incurred and movement in liabilities | | | 625 | | | | 5,108 | | | | 2,520 | | | | 3,716 | | | | 11,969 | |
| | | | | | | | | | | |
| – claims, benefits and surrenders paid | | | 815 | | | | 1,355 | | | | 507 | | | | 2,023 | | | | 4,700 | |
| – movement in liabilities | | | (190 | ) | | | 3,753 | | | | 2,013 | | | | 1,693 | | | | 7,269 | |
| | | | | | | | | | | |
| Reinsurers’ share of claims incurred and movement in liabilities | | | (100 | ) | | | (201 | ) | | | 99 | | | | – | | | | (202 | ) |
| | | | | | | | | | | |
| – claims, benefits and surrenders paid | | | (114 | ) | | | (143 | ) | | | (45 | ) | | | – | | | | (302 | ) |
| – movement in liabilities | | | 14 | | | | (58 | ) | | | 144 | | | | – | | | | 100 | |
| | | | | | | | | | | |
| | | | | | | | | | | | | | | | | | | | | |
| | | | | | | | | | | |
| | | | | | | | | | | | | | | | | | | | | |
| | | | 525 | | | | 4,907 | | | | 2,619 | | | | 3,716 | | | | 11,767 | |
| | | | | | | | | | | |
272
Notes on the Financial Statements(continued)
| | | | | | | | | | | | | | | | | | | | | |
| | | | | | | Life | | | Life | | | Investment | | | | |
| | | Non-life | | | insurance | | | insurance | | | contracts | | | | |
| | | insurance | | | (non-linked) | | | (linked) | | | with DPF | 1 | | Total | |
| | | US$m | | | US$m | | | US$m | | | US$m | | | US$m | |
| | | | | | | | | | | | | | | | | | | | | |
| 2009 | | | | | | | | | | | | | | | | | | | | |
| Gross claims incurred and movement in liabilities | | | 1,281 | | | | 4,669 | | | | 2,676 | | | | 3,934 | | | | 12,560 | |
| | | | | | | | | | | |
| – claims, benefits and surrenders paid | | | 987 | | | | 2,098 | | | | 325 | | | | 1,818 | | | | 5,228 | |
| – movement in liabilities | | | 294 | | | | 2,571 | | | | 2,351 | | | | 2,116 | | | | 7,332 | |
| | | | | | | | | | | |
| Reinsurers’ share of claims incurred and movement in liabilities | | | (158 | ) | | | (98 | ) | | | 146 | | | | – | | | | (110 | ) |
| | | | | | | | | | | |
| – claims, benefits and surrenders paid | | | (156 | ) | | | (159 | ) | | | (21 | ) | | | – | | | | (336 | ) |
| – movement in liabilities | | | (2 | ) | | | 61 | | | | 167 | | | | – | | | | 226 | |
| | | | | | | | | | | |
| | | | | | | | | | | | | | | | | | | | | |
| | | | | | | | | | | |
| | | | | | | | | | | | | | | | | | | | | |
| | | | 1,123 | | | | 4,571 | | | | 2,822 | | | | 3,934 | | | | 12,450 | |
| | | | | | | | | | | |
| | | | | | | | | | | | | | | | | | | | | |
| 2008 | | | | | | | | | | | | | | | | | | | | |
| Gross claims incurred and movement in liabilities | | | 1,044 | | | | 5,480 | | | | 939 | | | | 1,743 | | | | 9,206 | |
| | | | | | | | | | | |
| – claims, benefits and surrenders paid | | | 1,044 | | | | 1,491 | | | | 481 | | | | 1,911 | | | | 4,927 | |
| – movement in liabilities | | | – | | | | 3,989 | | | | 458 | | | | (168 | ) | | | 4,279 | |
| | | | | | | | | | | |
| Reinsurers’ share of claims incurred and movement in liabilities | | | (83 | ) | | | (792 | ) | | | (1,442 | ) | | | – | | | | (2,317 | ) |
| | | | | | | | | | | |
| – claims, benefits and surrenders paid | | | (158 | ) | | | (172 | ) | | | (44 | ) | | | – | | | | (374 | ) |
| – movement in liabilities | | | 75 | | | | (620 | ) | | | (1,398 | ) | | | – | | | | (1,943 | ) |
| | | | | | | | | | | |
| | | | | | | | | | | | | | | | | | | | | |
| | | | | | | | | | | |
| | | | | | | | | | | | | | | | | | | | | |
| | | | 961 | | | | 4,688 | | | | (503 | ) | | | 1,743 | | | | 6,889 | |
| | | | | | | | | | | |
| | |
| 1 | | Discretionary participation features. |
| | | Net operating income is stated after the following items of income, expense, gains and losses: |
| | | | | | | | | | | | | |
| | | 2010 | | | 2009 | | | 2008 | |
| | | US$m | | | US$m | | | US$m | |
| | | | | | | | | | | | | |
Income | | | | | | | | | | | | |
| Interest recognised on impaired financial assets | | | 516 | | | | 941 | | | | 1,040 | |
| Fees earned on financial assets or liabilities not held for trading nor designated at fair value, other than fees included in effective interest rate calculations on these types of assets and liabilities | | | 11,445 | | | | 12,310 | | | | 14,511 | |
| Fees earned on trust and other fiduciary activities where HSBC holds or invests assets on behalf of its customers | | | 3,074 | | | | 2,735 | | | | 3,314 | |
| Income from listed investments | | | 7,418 | | | | 9,201 | | | | 11,425 | |
| Income from unlisted investments | | | 7,187 | | | | 7,085 | | | | 11,359 | |
| Losses from the fraud at Bernard L Madoff Investment Securities LLC (within net trading income) | | | – | | | | (72 | ) | | | (984 | ) |
| Gain arising from dilution of interests in associates | | | 188 | | | | – | | | | – | |
| | | | | | | | | | | | | |
Expense | | | | | | | | | | | | |
| Interest on financial instruments, excluding interest on financial liabilities held for trading or designated at fair value | | | (17,549 | ) | | | (19,737 | ) | | | (45,525 | ) |
| Fees payable on financial assets or liabilities not held for trading nor designated at fair value, other than fees included in effective interest rate calculations on these types of assets and liabilities | | | (1,529 | ) | | | (1,580 | ) | | | (1,866 | ) |
| Fees payable relating to trust and other fiduciary activities where HSBC holds or invests assets on behalf of its customers | | | (151 | ) | | | (116 | ) | | | (159 | ) |
| | | | | | | | | | | | | |
Gains/(losses) | | | | | | | | | | | | |
| Gain on disposal or settlement of loans and advances | | | 121 | | | | 244 | | | | 94 | |
| Impairment of available-for-sale equity securities | | | (105 | ) | | | (358 | ) | | | (1,042 | ) |
| Gains on disposal of property, plant and equipment, intangible assets and non-financial investments | | | 639 | | | | 457 | | | | 465 | |
| Gain on sale/repurchase of properties | | | 250 | | | | 576 | | | | 416 | |
| | | | | | | | | | | | | |
Loan impairment charges and other credit risk provisions | | | (14,039 | ) | | | (26,488 | ) | | | (24,937 | ) |
| | | | | | | |
| Net impairment charge on loans and advances | | | (13,548 | ) | | | (24,942 | ) | | | (24,131 | ) |
| Impairment of available-for-sale debt securities | | | (472 | ) | | | (1,474 | ) | | | (737 | ) |
| Impairment in respect of other credit risk provisions | | | (19 | ) | | | (72 | ) | | | (69 | ) |
| | | | | | | |
273
Notes on the Financial Statements(continued)
| 7 | | Employee compensation and benefits |
| | | | | | | | | | | | | |
| | | 2010 | | | 2009 | | | 2008 | |
| | | US$m | | | US$m | | | US$m | |
| | | | | | | | | | | | | |
| Wages and salaries | | | 17,193 | | | | 16,268 | | | | 18,169 | |
| Social security costs | | | 1,567 | | | | 1,512 | | | | 1,625 | |
| Post-employment benefits | | | 1,076 | | | | 688 | | | | 998 | |
| | | | | | | |
| | | | 19,836 | | | | 18,468 | | | | 20,792 | |
| | | | | | | |
Average number of persons employed by HSBC during the year
| | | | | | | | | | | | | |
| | | 2010 | | | 2009 | | | 2008 | |
| | | | | | | | | | | | | |
| Europe | | | 79,902 | | | | 84,056 | | | | 87,864 | |
| Hong Kong | | | 29,105 | | | | 28,894 | | | | 30,030 | |
| Rest of Asia-Pacific | | | 89,737 | | | | 88,122 | | | | 87,954 | |
| Middle East | | | 8,983 | | | | 8,468 | | | | 8,201 | |
| North America | | | 36,822 | | | | 42,202 | | | | 53,090 | |
| Latin America | | | 57,778 | | | | 57,774 | | | | 64,319 | |
| | | | | | | |
| Total | | | 302,327 | | | | 309,516 | | | | 331,458 | |
| | | | | | | |
Post-employment benefit plans
Income statement charge
| | | | | | | | | | | | | |
| | | 2010 | | | 2009 | | | 2008 | |
| | | US$m | | | US$m | | | US$m | |
| | | | | | | | | | | | | |
| Defined benefit pension plans | | | 468 | | | | 161 | | | | 477 | |
| | | | | | | |
| – HSBC Bank (UK) Pension Scheme | | | 308 | | | | (179 | ) | | | 255 | |
| – Other plans | | | 160 | | | | 340 | | | | 222 | |
| | | | | | | |
| Defined contribution pension plans | | | 545 | | | | 492 | | | | 498 | |
| | | | | | | |
| | | | 1,013 | | | | 653 | | | | 975 | |
| Defined benefit healthcare plans | | | 58 | | | | 31 | | | | 13 | |
| Defined contribution healthcare plans | | | 5 | | | | 4 | | | | 10 | |
| | | | | | | |
| | | | 1,076 | | | | 688 | | | | 998 | |
| | | | | | | |
Net assets/(liabilities) recognised on balance sheet in respect of defined benefit plans
| | | | | | | | | |
| | | 2010 | | | 2009 | |
| | | US$m | | | US$m | |
| | | | | | | | | |
| Defined benefit pension plans | | | (2,867 | ) | | | (6,147 | ) |
| HSBC Bank (UK) Pension Scheme | | | (622 | ) | | | (3,822 | ) |
| | | | | |
| – fair value of plan assets | | | 22,236 | | | | 17,701 | |
| – present value of defined benefit obligations | | | (22,858 | ) | | | (21,523 | ) |
| | | | | |
| | | | | | | | | |
| Other plans | | | (2,245 | ) | | | (2,325 | ) |
| | | | | |
| – fair value of plan assets | | | 7,559 | | | | 6,822 | |
| – present value of defined benefit obligations | | | (9,785 | ) | | | (9,109 | ) |
| – effect of limit on plan surpluses | | | (47 | ) | | | (47 | ) |
| – unrecognised past service cost | | | 28 | | | | 9 | |
| | | | | |
| | | | | | | | | |
| Defined benefit healthcare plans | | | (946 | ) | | | (820 | ) |
| | | | | |
| – fair value of plan assets | | | 165 | | | | 142 | |
| – present value of defined benefit obligations | | | (1,087 | ) | | | (937 | ) |
| – unrecognised past service cost | | | (24) | | | | (25 | ) |
| | | | | |
| | | | | | | | | |
| Fair value of plan assets | | | 29,960 | | | | 24,665 | |
| Present value of defined benefit obligations | | | (33,730 | ) | | | (31,569 | ) |
| Effect of limit on plan surpluses | | | (47 | ) | | | (47 | ) |
| Unrecognised past service cost | | | 4 | | | | (16 | ) |
| | | | | |
| | | | | | | | | |
| | | | (3,813 | ) | | | (6,967 | ) |
| | | | | |
| Retirement benefit liabilities | | | (3,856 | ) | | | (6,967 | ) |
| Retirement benefit assets | | | 43 | | | | – | |
274
Notes on the Financial Statements(continued)
Cumulative actuarial gains/(losses) recognised in other comprehensive income
| | | | | | | | | |
| | | 2010 | | | 2009 | |
| | | US$m | | | US$m | |
| | | | | | | | | |
| At 1 January | | | (4,660 | ) | | | (1,074 | ) |
| | | | | |
| HSBC Bank (UK) Pension Scheme | | | 321 | | | | (3,692 | ) |
| Other plans | | | (275 | ) | | | 179 | |
| Healthcare plans | | | (112 | ) | | | (36 | ) |
Change in the effect of limit on plan surpluses1 | | | 6 | | | | (37 | ) |
| | | | | |
| | | | | | | | | |
| Total actuarial losses recognised in other comprehensive income | | | (60 | ) | | | (3,586 | ) |
| | | | | |
At 31 December2 | | | (4,720 | ) | | | (4,660 | ) |
| | | | | |
| 1 | | Excludes exchange differences of US$6m (2009: US$1m). |
| 2 | | Includes cumulative movements related to the limit on plan surpluses. This limit is US$47m at 31 December 2010 (2009: US$47m). |
HSBC pension plans
| | | | | | | | | | | | | |
| | | 2010 | | | 2009 | | | 2008 | |
| | | | | | | | | | | | | |
| Number of plans worldwide | | | 218 | | | | 211 | | | | 205 | |
| | | | | | | | | |
| | | | % | | | | % | | | | % | |
| Percentage of HSBC employees: | | | | | | | | | | | | |
| – enrolled in defined contribution plans | | | 63 | | | | 59 | | | | 50 | |
| – enrolled in defined benefit plans | | | 27 | | | | 29 | | | | 36 | |
| | | | | | | |
| | | | | | | | | |
| – covered by HSBC pension plans | | | 90 | | | | 88 | | | | 86 | |
| | | | | | | |
HSBC has been progressively offering all new employees membership of defined contribution plans.
The majority of the Group’s defined benefit plans are funded plans. The assets of most of the larger plans are held in trusts or similar funds separate from HSBC. The plans are reviewed at least annually or in accordance with local practice and regulations by qualified actuaries. The actuarial assumptions used to calculate the defined benefit obligations and related current service costs vary according to the economic conditions of the countries in which the plans are situated.
Pension plans in the UK
The largest plan exists in the UK, where the HSBC Bank (UK) Pension Scheme (‘the Scheme’) covers employees of HSBC Bank plc and certain other employees of HSBC. This comprises a funded defined benefit plan (‘the principal plan’), which is closed to new entrants, and a defined contribution plan which was established in July 1996 for new employees.
The latest actuarial valuation of the principal plan was made as at 31 December 2008 by C G Singer, Fellow of the Institute of Actuaries, of Towers Watson Limited. At that date, the market value of the HSBC Bank (UK) Pension Scheme’s assets was £10.6bn (US$15.5bn) (including assets relating to the defined benefit plan, the defined contribution plan and additional voluntary contributions). The market value of the plan assets represented 77% of the amount expected to be required, on the basis of the assumptions adopted, to provide the benefits accrued to members after allowing for expected future increases in earnings, and the resulting deficit amounted to £3.2bn (US$4.7bn). The method adopted for this investigation was the projected unit method.
The expected cash flows from the principal plan were projected by reference to the Retail Price Index (‘RPI’) swap break-even curve at 31 December 2008. Salary increases were assumed to be 0.5% per annum above RPI and inflationary pension increases, subject to a minimum of zero per cent and a maximum of 5% (maximum of 3% per annum in respect of service accrued since 1 July 2009), were assumed to be in line with RPI. The projected cash flows were discounted at the LIBOR swap curve at 31 December 2008 plus a margin for the expected return on the investment strategy of 190 basis points per annum. The mortality experience of the principal plan’s pensioners over the three year period since the previous valuation was analysed and, on the basis of this analysis, the mortality assumptions were set based on the SAPS S1 series of tables which best fit the pensioner experience. Allowance was made for future improvements to mortality rates in line with the medium cohort projections with a minimum improvement rate set at 1.75% for males and 1.25% for females. The benefits payable from the defined benefit plan are expected to be as shown in the chart below.
275
Notes on the Financial Statements(continued)
Benefit payments (US$m)

The expected cash flows of the principal plan were projected by reference to the RPI swap curve in calculating the liability recognised. The Occupational Pensions (Revaluation) Order 2010 confirmed the UK Government’s intention to move to using the Consumer Prices Index (‘CPI’) rather than RPI as the inflation measure for determining the minimum pension increases to be applied to the statutory index-linked features of retirement benefits. Historical annual CPI increases have generally been lower than annual RPI increases. The rules of the principal plan prescribe that annual increases will be in line with RPI for pensions in payment and statutory index-linked prior to retirement for deferred pensions. In respect of deferred pensioners, consistent with communications to scheme members, HSBC continued to use RPI in calculating the liability recognised as at 31 December 2010. Using CPI to value the schemes liabilities in respect of deferred pensioners would result in a reduction in the principal plan’s liabilities of approximately US$400m based on the financial and demographic assumptions as at 31 December 2010.
As part of the 31 December 2008 valuation, calculations were also carried out as to the amount of assets that might be needed to meet the liabilities if the Scheme was discontinued and the members’ benefits bought out with an insurance company (although in practice this may not be possible for a plan of this size) or the Trustee continued to run the plan without the support of HSBC. The amount required under this approach is estimated to be £19.8bn (US$28.9bn) as at 31 December 2008. In arriving at this estimation, a more prudent assumption about future mortality was made than for the assessment of the ongoing position and it was assumed that the Trustee would alter the investment strategy to be an appropriately matched portfolio of UK government bonds. An explicit allowance for expenses was also included.
Information on the investment strategy of the principal plan can be found on page 172.
In February 2010, HSBC Bank plc agreed with the Trustee of the Scheme to reduce the deficit of the plan by meeting a schedule of future funding payments. On 17 June 2010, HSBC Bank plc agreed with the Trustee to accelerate the reduction of the deficit of the plan with a special contribution of £1,760m (US$2,638m) in 2010 followed by a revised payment schedule in the following years, as shown below:
Additional future funding payments to the principal plan
| | | | | | | | | | | | | | | | | |
| | | Original plan | | | Original plan | | | Revised plan | | | Revised plan | |
| | | US$m | 1 | | £m | | | US$m | 1 | | £m | |
| | | | | | | | | | | | | | | | | |
| 2011 | | | – | | | | – | | | | – | | | | – | |
| 2012 | | | 722 | | | | 465 | | | | – | | | | – | |
| 2013 | | | 722 | | | | 465 | | | | – | | | | – | |
| 2014 | | | 722 | | | | 465 | | | | – | | | | – | |
| 2015 | | | 978 | | | | 630 | | | | – | | | | – | |
| 2016 | | | 978 | | | | 630 | | | | 768 | | | | 495 | |
| 2017 | | | 978 | | | | 630 | | | | 978 | | | | 630 | |
| 2018 | | | 978 | | | | 630 | | | | 978 | | | | 630 | |
| | |
| 1 | | The payment schedule was agreed with the Trustee in pounds sterling and the equivalent US dollar amounts are shown at the exchange rate effective as at 31 December 2010. |
HSBC considers that the contributions set out above, together with investment returns at an expected level of 240 basis points above the LIBOR swap curve, would be sufficient to meet the deficit as at 31 December 2008 over the agreed period. At each subsequent actuarial valuation, HSBC has agreed with the Trustee that any shortfall in
276
Notes on the Financial Statements(continued)
investment returns relative to this expected level, subject to a maximum of 50 basis points per annum, will be eliminated by payment of equal cash instalments over the remaining years to the end of this recovery plan period.
HSBC Bank plc also agreed to make ongoing contributions to the principal plan in respect of the accrual of benefits of defined benefit section members at the rate of 34% of pensionable salaries (less member contributions) payable from 1 April 2010 until the completion of the next actuarial valuation, due as at 31 December 2011. During 2009, HSBC paid contributions at the rate of 38% of pensionable salaries (less member contributions) and continued contributions at this rate until 31 March 2010.
On 1 July 2009, changes to the design of the defined benefit section of the principal plan were made. This included the introduction of employee contributions, optionality concerning future benefit accrual and, with effect from 1 April 2010, an increased normal retirement age of 65 years. In addition, enhancements to the defined contribution section were also introduced.
Pension plans in Hong Kong
In Hong Kong, the HSBC Group Hong Kong Local Staff Retirement Benefit Scheme covers employees of The Hongkong and Shanghai Banking Corporation and certain other employees of HSBC. The scheme comprises a funded defined benefit scheme (which provides a lump sum on retirement but is now closed to new members) and a defined contribution scheme. The latter was established on 1 January 1999 for new employees. The latest actuarial valuation of the defined benefit scheme was made at 31 December 2009, and was performed by Estella Chiu, fellow of the Society of Actuaries of the United States of America, of HSBC Insurance (Asia) Limited, a subsidiary of HSBC Holdings. At that valuation date, the market value of the defined benefit scheme’s assets was US$1,088m. On an ongoing basis, the actuarial value of the scheme’s assets represented 105% of the actuarial present value of the benefits accrued to members, after allowing for expected future increases in salaries, and the resulting surplus amounted to US$71m. On a wind-up basis, the scheme’s assets represented 107% of the members’ vested benefits, based on current salaries, and the resulting surplus amounted to US$89m. The attained age method has been adopted for the valuation and the major assumptions used in this valuation were a discount rate of 6% per annum and long-term salary increases of 5% per annum.
Pension plans in North America
The HSBC North America (US) Retirement Income Plan covers all employees of HSBC Bank USA, HSBC Finance and other HSBC entities in the US who have reached the age of 21 and met the one year of service participation requirement. The Retirement Income Plan is a funded defined benefit plan which provides final average pay benefits to legacy participants and cash balance benefits to all other participants. All new employees participate in the cash balance section of the plan. In November 2009, the Board of Directors of HSBC North America Holdings, Inc. (‘HNAH’) approved actions to cease all future benefit accruals for legacy participants under the final average pay formula components of the HSBC North America Retirement Income Plan with effect from 1 January 2011. Affected employees were informed of this decision in February 2010. As a result of these changes, HNAH recorded a one-time curtailment gain of US$144m.
The most recent actuarial valuation of the plan to determine compliance with US statutory funding requirements was made at 1 January 2010 by Jennifer Jakubowski, Fellow of the Society of Actuaries, Enrolled Actuary, member of the American Academy of Actuaries, of Mercer. At that date, the market value of the plan’s assets was US$2,321m. The assets represented 85% of the benefits accrued to members as valued under the provisions of the Pension Protection Act of 2006 that was effective for the plan year beginning 1 January 2008. The resulting deficit amounted to US$400m. The method employed for this valuation was the traditional unit credit method and the discount rate was determined using a segment rate method as selected by HSBC under the relevant regulations, which resulted in an effective interest rate of 6.64% per annum.
These determinations described above for actuarial funding valuation purposes are based on different methods and assumptions than those used for financial reporting purposes, and as a result should neither be compared nor related to other determinations included in these financial statements.
The HSBC Bank (UK) Pension Scheme, The HSBC Group Hong Kong Local Staff Retirement Benefit Scheme, and the HSBC North America (US) Retirement Income Plan cover 34% of HSBC’s employees and represent 82% of the Group’s present value of defined benefit obligations.
277
Notes on the Financial Statements(continued)
HSBC healthcare benefits plans
HSBC also provides post-employment healthcare benefits under plans in the UK, the US, Bermuda, Canada, Mexico and Brazil, the majority of which are unfunded. The majority of post-employment healthcare benefits plans are defined benefit plans and are accounted for in the same manner as defined benefit pension plans. The plans are reviewed at least annually or in accordance with local practice and regulations by qualified actuaries. The actuarial assumptions used to calculate the defined benefit obligation and related current service cost vary according to the economic conditions of the countries in which they are situated.
Defined benefit pension plans
Net liability under defined benefit pension plans
| | | | | | | | | | | | | | | | | |
| | | HSBC Bank (UK) Pension Scheme | | Other plans |
| | | 2010 | | | 2009 | | | 2010 | | | 2009 | |
| | | US$m | | | US$m | | | US$m | | | US$m | |
| | | | | | | | | | | | | | | | | |
Fair value of plan assets | | | | | | | | | | | | | | | | |
| At 1 January | | | 17,701 | | | | 14,865 | | | | 6,822 | | | | 6,024 | |
| Expected return on plan assets | | | 1,092 | | | | 959 | | | | 437 | | | | 381 | |
| Contributions by HSBC | | | 2,890 | | | | 367 | | | | 422 | | | | 596 | |
| | | | | | | | | |
| – normal | | | 252 | | | | 367 | | | | 194 | | | | 178 | |
| – special | | | 2,638 | | | | – | | | | 228 | | | | 418 | |
| | | | | | | | | |
| | | | | | | | | | | | | | | | | |
| Contributions by employees | | | 23 | | | | 5 | | | | 17 | | | | 17 | |
| Experience gains | | | 1,772 | | | | 871 | | | | 394 | | | | 65 | |
| Benefits paid | | | (744 | ) | | | (884 | ) | | | (440 | ) | | | (522 | ) |
| Transfers | | | 136 | | | | – | | | | (136 | ) | | | – | |
| Assets distributed on curtailments | | | – | | | | – | | | | (7 | ) | | | (5 | ) |
| Assets distributed on settlements | | | – | | | | – | | | | (10 | ) | | | (6 | ) |
| Exchange differences | | | (634 | ) | | | 1,518 | | | | 60 | | | | 272 | |
| | | | | | | | | |
| | | | | | | | | | | | | | | | | |
| At 31 December | | | 22,236 | | | | 17,701 | | | | 7,559 | | | | 6,822 | |
| | | | | | | | | | | | | | | | | |
Present value of defined benefit obligations | | | | | | | | | | | | | | | | |
| At 1 January | | | (21,523 | ) | | | (15,257 | ) | | | (9,109 | ) | | | (8,787 | ) |
| Current service cost | | | (252 | ) | | | (260 | ) | | | (300 | ) | | | (334 | ) |
| Interest cost | | | (1,148 | ) | | | (1,019 | ) | | | (438 | ) | | | (397 | ) |
| Contributions by employees | | | (23 | ) | | | (5 | ) | | | (17 | ) | | | (17 | ) |
| Actuarial (losses)/gains | | | (1,451 | ) | | | (4,563 | ) | | | (669 | ) | | | 114 | |
| Benefits paid | | | 744 | | | | 884 | | | | 518 | | | | 608 | |
| Past service cost – vested immediately | | | – | | | | – | | | | (11 | ) | | | (20 | ) |
| Past service cost – unvested benefits | | | – | | | | – | | | | (20 | ) | | | – | |
| Business combinations | | | – | | | | – | | | | – | | | | (4 | ) |
| Transfers | | | (136 | ) | | | – | | | | 136 | | | | – | |
| Reduction in liabilities resulting from curtailments | | | – | | | | – | | | | 158 | | | | 41 | |
| Liabilities extinguished on settlements | | | – | | | | 499 | | | | 12 | | | | 1 | |
| Exchange differences | | | 931 | | | | (1,802 | ) | | | (45 | ) | | | (314 | ) |
| | | | | | | | | |
| | | | | | | | | | | | | | | | | |
| At 31 December | | | (22,858 | ) | | | (21,523 | ) | | | (9,785 | ) | | | (9,109 | ) |
| | | | | | | | | |
| Funded | | | (22,858 | ) | | | (21,523 | ) | | | (9,241 | ) | | | (8,588 | ) |
| Unfunded | | | – | | | | – | | | | (544 | ) | | | (521 | ) |
| | | | | | | | | |
| | | | | | | | | | | | | | | | | |
| Effect of limit on plan surpluses | | | – | | | | – | | | | (47 | ) | | | (47 | ) |
| Unrecognised past service cost | | | – | | | | – | | | | 28 | | | | 9 | |
| | | | | | | | | |
| | | | | | | | | | | | | | | | | |
| Net liability | | | (622 | ) | | | (3,822 | ) | | | (2,245 | ) | | | (2,325 | ) |
| | | | | | | | | |
| | | | | | | | | | | | | | | | | |
| Retirement benefit liabilities recognised in the balance sheet | | | (622 | ) | | | (3,822 | ) | | | (2,288 | ) | | | (2,325 | ) |
| Retirement benefit assets recognised in the balance sheet (within ‘Other assets’) | | | – | | | | – | | | | 43 | | | | – | |
Plan assets of the Group’s pension schemes included US$57m (2009: US$62m) of equities and US$1m (2009: US$2m) of bonds issued by HSBC and US$1,592m (2009: US$1,925m) of other assets placed or transacted with HSBC. The fair value of plan assets included derivatives entered into with HSBC Bank plc by the HSBC Bank (UK) Pension Scheme with a positive fair value of US$2,173m at 31 December 2010 (2009: US$1,049m positive fair value) and US$77m positive fair value (2009: US$27m positive fair value) in respect of the HSBC International Staff Retirement Benefits Scheme. Further details of these swap arrangements are included in Note 45.
278
Notes on the Financial Statements(continued)
On 17 June 2010, HSBC Bank plc made a £1,760m (US$2,638m) special contribution to accelerate the reduction of the deficit of the HSBC Bank (UK) Pension Scheme. On the same day the Scheme used the contribution to acquire debt securities with a fair value of £1,760m (US$2,638m) from HSBC in a transaction at an arm’s length value determined by the Scheme’s independent third-party advisors. The debt securities sold comprised supranational, agency and government-guaranteed securities, asset-backed securities, corporate subordinated debt and auction rate securities. The contribution together with net actuarial gains of US$321m helped achieve a reduction in the net liability of the scheme from US$3,822m at 31 December 2009 to US$622m at 31 December 2010.
The special contributions of US$228m to other plans include an additional contribution of US$187m to the HSBC North America (US) Retirement Income Plan which was made to maintain a minimum funding level.
The actual return on plan assets for the year ended 31 December 2010 was a positive return of US$3,695m (2009: positive US$2,276m).
HSBC expects to make US$880m of contributions to defined benefit pension plans during 2011. Benefits expected to be paid from the plans to retirees over each of the next five years, and in aggregate for the five years thereafter, are as follows:
Benefits expected to be paid from plans
| | | | | | | | | | | | | | | | | | | | | | | | | |
| | | 2011 | | | 2012 | | | 2013 | | | 2014 | | | 2015 | | | 2016-2020 | |
| | | US$m | | | US$m | | | US$m | | | US$m | | | US$m | | | US$m | |
| | | | | | | | | | | | | | | | | | | | | | | | | |
| HSBC Bank (UK) Pension Scheme | | | 716 | | | | 745 | | | | 790 | | | | 835 | | | | 903 | | | | 5,665 | |
| Other significant plans | | | 502 | | | | 506 | | | | 528 | | | | 568 | | | | 579 | | | | 3,639 | |
Total (income)/expense recognised in the income statement in ‘Employee compensation and benefits’
| | | | | | | | | | | | | | | | | | | | | | | | | |
| | | HSBC Bank (UK) Pension Scheme | | Other plans |
| | | 2010 | | | 2009 | | | 2008 | | | 2010 | | | 2009 | | | 2008 | |
| | | US$m | | | US$m | | | US$m | | | US$m | | | US$m | | | US$m | |
| | | | | | | | | | | | | | | | | | | | | | | | | |
| Current service cost | | | 252 | | | | 260 | | | | 387 | | | | 300 | | | | 334 | | | | 357 | |
| Interest cost | | | 1,148 | | | | 1,019 | | | | 1,227 | | | | 438 | | | | 397 | | | | 466 | |
| Expected return on plan assets | | | (1,092 | ) | | | (959 | ) | | | (1,359 | ) | | | (437 | ) | | | (381 | ) | | | (549 | ) |
| Past service cost | | | – | | | | – | | | | – | | | | 12 | | | | 21 | | | | 9 | |
| Gains on curtailments | | | – | | | | – | | | | – | | | | (151 | ) | | | (36 | ) | | | (20 | ) |
| (Gains)/losses on settlements | | | – | | | | (499 | ) | | | – | | | | (2 | ) | | | 5 | | | | (41 | ) |
| | | | | | | | | | | | | |
| | | | | | | | | | | | | | | | | | | | | | | | | |
| Total (income)/expense | | | 308 | | | | (179 | ) | | | 255 | | | | 160 | | | | 340 | | | | 222 | |
| | | | | | | | | | | | | |
The US$499m settlement gain in 2009 relates to an accounting benefit following a restructuring of the basis of delivery of death in service and ill health early retirement benefits to certain UK employees.
Summary
| | | | | | | | | | | | | | | | | | | | | |
| | | HSBC Bank (UK) Pension Scheme |
| | | 2010 | | | 2009 | | | 2008 | | | 2007 | | | 2006 | |
| | | US$m | | | US$m | | | US$m | | | US$m | | | US$m | |
| | | | | | | | | | | | | | | | | | | | | |
| Defined benefit obligation | | | (22,858 | ) | | | (21,523 | ) | | | (15,257 | ) | | | (23,512 | ) | | | (24,332 | ) |
| Fair value of plan assets | | | 22,236 | | | | 17,701 | | | | 14,865 | | | | 22,704 | | | | 20,587 | |
| | | | | | | | | | | |
| | | | | | | | | | | | | | | | | | | | | |
| Net deficit | | | (622 | ) | | | (3,822 | ) | | | (392 | ) | | | (808 | ) | | | (3,745 | ) |
| | | | | | | | | | | |
| | | | | | | | | | | | | | | | | | | | | |
| Experience gains/(losses) on plan liabilities | | | (327 | ) | | | (234 | ) | | | (49 | ) | | | (64 | ) | | | 540 | |
| Experience gains/(losses) on plan assets | | | 1,772 | | | | 871 | | | | (2,861 | ) | | | 29 | | | | – | |
| Gains/(losses) from changes in actuarial assumptions | | | (1,124 | ) | | | (4,329 | ) | | | 3,081 | | | | 2,459 | | | | (570 | ) |
| | | | | | | | | | | |
| | | | | | | | | | | | | | | | | | | | | |
| Total net actuarial gains/(losses) | | | 321 | | | | (3,692 | ) | | | 171 | | | | 2,424 | | | | (30 | ) |
| | | | | | | | | | | |
279
Notes on the Financial Statements(continued)
Summary (continued)
| | | | | | | | | | | | | | | | | | | | | |
| | | Other plans |
| | | 2010 | | | 2009 | | | 2008 | | | 2007 | | | 2006 | |
| | | US$m | | | US$m | | | US$m | | | US$m | | | US$m | |
| | | | | | | | | | | | | | | | | | | | | |
| Defined benefit obligation | | | (9,785 | ) | | | (9,109 | ) | | | (8,787 | ) | | | (8,873 | ) | | | (7,916 | ) |
| Fair value of plan assets | | | 7,559 | | | | 6,822 | | | | 6,024 | | | | 7,768 | | | | 7,116 | |
| | | | | | | | | | | |
| | | | | | | | | | | | | | | | | | | | | |
| Net deficit | | | (2,226 | ) | | | (2,287 | ) | | | (2,763 | ) | | | (1,105 | ) | | | (800 | ) |
| | | | | | | | | | | |
| | | | | | | | | | | | | | | | | | | | | |
| Experience gains/(losses) on plan liabilities | | | (73 | ) | | | 20 | | | | (52 | ) | | | (354 | ) | | | (167 | ) |
| Experience gains/(losses) on plan assets | | | 394 | | | | 65 | | | | (1,452 | ) | | | 157 | | | | 203 | |
| Gains/(losses) from changes in actuarial assumptions | | | (596 | ) | | | 94 | | | | (306 | ) | | | (121 | ) | | | (44 | ) |
| | | | | | | | | | | |
| | | | | | | | | | | | | | | | | | | | | |
| Total net actuarial gains/(losses) | | | (275 | ) | | | 179 | | | | (1,810 | ) | | | (318 | ) | | | (8 | ) |
| | | | | | | | | | | |
Defined benefit healthcare plans
Net liability under defined benefit healthcare plans
| | | | | | | | | |
| | | 2010 | | | 2009 | |
| | | US$m | | | US$m | |
| | | | | | | | | |
Fair value of plan assets | | | | | | | | |
| At 1 January | | | 142 | | | | 128 | |
| Expected return on plan assets | | | 13 | | | | 11 | |
| Contributions by HSBC | | | 9 | | | | 11 | |
| Experience gains | | | 6 | | | | 8 | |
| Benefits paid | | | (12 | ) | | | (4 | ) |
| Assets distributed on settlements | | | (2 | ) | | | (4 | ) |
| Exchange differences | | | 9 | | | | (8 | ) |
| | | | | |
| | | | | | | | | |
| At 31 December | | | 165 | | | | 142 | |
| | | | | |
| | | | | | | | | |
Present value of defined benefit obligations | | | | | | | | |
| At 1 January | | | (937 | ) | | | (839 | ) |
| Current service cost | | | (12 | ) | | | (11 | ) |
| Interest cost | | | (60 | ) | | | (55 | ) |
| Contributions by employees | | | (1 | ) | | | (2 | ) |
| Actuarial losses | | | (118 | ) | | | (44 | ) |
| Benefits paid | | | 52 | | | | 43 | |
| Reduction in liabilities resulting from curtailments | | | – | | | | 22 | |
| Liabilities extinguished on settlements | | | 2 | | | | 4 | |
| Exchange differences | | | (13 | ) | | | (55 | ) |
| | | | | |
| | | | | | | | | |
| At 31 December | | | (1,087 | ) | | | (937 | ) |
| | | | | |
| Funded | | | (197 | ) | | | (148 | ) |
| Unfunded | | | (890 | ) | | | (789 | ) |
| | | | | |
| | | | | | | | | |
| Unrecognised past service cost | | | (24 | ) | | | (25 | ) |
| | | | | |
| | | | | | | | | |
| At 31 December | | | (946 | ) | | | (820 | ) |
| | | | | |
The actual return on plan assets for the year ended 31 December 2010 was a positive return of US$19m (2009: positive US$19m).
HSBC expects to make US$61m of contributions to post-employment healthcare benefit plans during 2011. Benefits expected to be paid from the plans to retirees over each of the next five years, and in aggregate for the five years thereafter, are as follows:
Benefits expected to be paid from plans
| | | | | | | | | | | | | | | | | | | | | | | | | |
| | | 2011 | | | 2012 | | | 2013 | | | 2014 | | | 2015 | | | 2016-2020 | |
| | | US$m | | | US$m | | | US$m | | | US$m | | | US$m | | | US$m | |
| | | | | | | | | | | | | | | | | | | | | | | | | |
| Significant plans | | | 57 | | | | 58 | | | | 60 | | | | 62 | | | | 64 | | | | 334 | |
280
Notes on the Financial Statements(continued)
Total expense recognised in the income statement in ‘Employee compensation and benefits’
| | | | | | | | | | | | | |
| | | 2010 | | | 2009 | | | 2008 | |
| | | US$m | | | US$m | | | US$m | |
| | | | | | | | | | | | | |
| Current service cost | | | 12 | | | | 11 | | | | 19 | |
| Interest cost | | | 60 | | | | 55 | | | | 65 | |
| Expected return on plan assets | | | (13 | ) | | | (11 | ) | | | (12 | ) |
| Past service cost | | | (1 | ) | | | (2 | ) | | | (2 | ) |
| Gains on curtailments | | | – | | | | (22 | ) | | | (31 | ) |
| Gains on settlements | | | – | | | | – | | | | (26 | ) |
| | | | | | | |
| | | | | | | | | | | | | |
| Total expense | | | 58 | | | | 31 | | | | 13 | |
| | | | | | | |
Summary
| | | | | | | | | | | | | | | | | | | | | |
| | | 2010 | | | 2009 | | | 2008 | | | 2007 | | | 2006 | |
| | | US$m | | | US$m | | | US$m | | | US$m | | | US$m | |
| | | | | | | | | | | | | | | | | | | | | |
| Defined benefit obligation | | | (1,087 | ) | | | (937 | ) | | | (839 | ) | | | (1,038 | ) | | | (1,106 | ) |
| Fair value of plan assets | | | 165 | | | | 142 | | | | 128 | | | | 146 | | | | 133 | |
| | | | | | | | | | | |
| | | | | | | | | | | | | | | | | | | | | |
| Net deficit | | | (922 | ) | | | (795 | ) | | | (711 | ) | | | (892 | ) | | | (973 | ) |
| | | | | | | | | | | |
| | | | | | | | | | | | | | | | | | | | | |
| Experience gains/(losses) on plan liabilities | | | (27 | ) | | | 13 | | | | (34 | ) | | | 15 | | | | (12 | ) |
| Experience gains/(losses) on plan assets | | | 6 | | | | 8 | | | | (14 | ) | | | (6 | ) | | | (1 | ) |
| Gains/(losses) from changes in actuarial assumptions | | | (91 | ) | | | (57 | ) | | | 32 | | | | 94 | | | | (25 | ) |
| | | | | | | | | | | |
| | | | | | | | | | | | | | | | | | | | | |
| Total net actuarial gains/(losses) | | | (112 | ) | | | (36 | ) | | | (16 | ) | | | 103 | | | | (38 | ) |
| | | | | | | | | | | |
Post-employment defined benefit plans’ principal actuarial financial assumptions
The principal actuarial financial assumptions used to calculate the Group’s obligations under its defined benefit pension and post-employment healthcare plans at 31 December for each period, and used as the basis for measuring periodic costs under the plans in the following periods, were as follows.
Principal actuarial assumptions
| | | | | | | | | | | | | | | | | | | | | | | | | | | | | |
| | | | | | | | | | | | | | | | | | | Healthcare cost trend |
| | | | | | | | | | | Rate of | | | Rate | | | | | | | | | | | Year of | |
| | | Discount | | | Inflation | | | increase for | | | of pay | | | Initial | | | Ultimate | | | ultimate | |
| | | rate | | | rate | | | pensions | 1 | | increase | | | rate | | | rate | | | rate | |
| | | % | | | % | | | % | | | % | | | % | | | % | | | | | |
| | | | | | | | | | | | | | | | | | | | | | | | | | | | | |
At 31 December 2010 | | | | | | | | | | | | | | | | | | | | | | | | | | | | |
UK2 | | | 5.40 | | | | 3.70 | | | | 3.50 | | | | 4.20 | | | | 7.70 | | | | 7.70 | | | | n/a | |
| Hong Kong | | | 2.85 | | | | n/a | | | | n/a | | | | 5.00 | | | | n/a | | | | n/a | | | | n/a | |
| US | | | 5.41 | | | | 2.50 | | | | n/a | | | | 2.75 | | | | 7.20 | | | | 4.50 | | | | 2027 | |
| Jersey | | | 5.40 | | | | 3.70 | | | | 3.70 | | | | 5.45 | | | | n/a | | | | n/a | | | | n/a | |
| Mexico | | | 7.50 | | | | 3.50 | | | | 3.50 | | | | 4.50 | | | | 6.75 | | | | 6.75 | | | | n/a | |
| Brazil | | | 10.51 | | | | 4.50 | | | | 4.50 | | | | 5.50 | | | | 10.00 | | | | 5.50 | | | | 2020 | |
| France | | | 4.75 | | | | 2.00 | | | | 2.00 | | | | 3.00 | | | | n/a | | | | n/a | | | | n/a | |
| Canada | | | 5.45 | | | | 2.50 | | | | n/a | | | | 3.72 | | | | 8.00 | | | | 5.00 | | | | 2015 | |
| Switzerland | | | 2.60 | | | | 1.50 | | | | n/a | | | | 2.50 | | | | n/a | | | | n/a | | | | n/a | |
| Germany | | | 5.00 | | | | 2.00 | | | | 2.00 | | | | 3.00 | | | | n/a | | | | n/a | | | | n/a | |
| | | | | | | | | | | | | | | | | | | | | | | | | | | | | |
| At 31 December 2009 | | | | | | | | | | | | | | | | | | | | | | | | | | | | |
UK2 | | | 5.70 | | | | 3.70 | | | | 3.50 | | | | 4.20 | | | | 7.70 | | | | 7.70 | | | | n/a | |
| Hong Kong | | | 2.58 | | | | n/a | | | | n/a | | | | 5.00 | | | | n/a | | | | n/a | | | | n/a | |
| US | | | 5.92 | | | | 2.50 | | | | n/a | | | | 3.50 | | | | 7.40 | | | | 4.50 | | | | 2027 | |
| Jersey | | | 5.70 | | | | 3.70 | | | | 3.70 | | | | 5.45 | | | | n/a | | | | n/a | | | | n/a | |
| Mexico | | | 8.50 | | | | 3.50 | | | | 3.50 | | | | 4.50 | | | | 6.75 | | | | 6.75 | | | | n/a | |
| Brazil | | | 11.25 | | | | 4.50 | | | | 4.50 | | | | 5.50 | | | | 10.00 | | | | 5.50 | | | | 2019 | |
| France | | | 5.50 | | | | 2.00 | | | | 2.00 | | | | 3.00 | | | | n/a | | | | n/a | | | | n/a | |
| Canada | | | 6.25 | | | | 2.50 | | | | n/a | | | | 3.72 | | | | 8.00 | | | | 5.00 | | | | 2015 | |
| Switzerland | | | 3.25 | | | | 1.50 | | | | n/a | | | | 2.50 | | | | n/a | | | | n/a | | | | n/a | |
| Germany | | | 5.50 | | | | 2.00 | | | | 2.00 | | | | 3.00 | | | | n/a | | | | n/a | | | | n/a | |
281
Notes on the Financial Statements(continued)
Principal actuarial assumptions (continued)
| | | | | | | | | | | | | | | | | | | | | | | | | | | | | |
| | | | | | | | | | | | | | | | | | | Healthcare cost trend |
| | | | | | | | | | | Rate of | | | Rate | | | | | | | | | | | Year of | |
| | | Discount | | | Inflation | | | increase for | | | of pay | | | Initial | | | Ultimate | | | ultimate | |
| | | rate | | | rate | | | pensions | 1 | | increase | | | rate | | | rate | | | rate | |
| | | % | | | % | | | % | | | % | | | % | | | % | | | | | |
| | | | | | | | | | | | | | | | | | | | | | | | | | | | | |
| At 31 December 2008 | | | | | | | | | | | | | | | | | | | | | | | | | | | | |
UK2 | | | 6.50 | | | | 2.90 | | | | 3.00 | | | | 3.40 | | | | 6.90 | | | | 6.90 | | | | n/a | |
| Hong Kong | | | 1.19 | | | | n/a | | | | n/a | | | | 5.00 | | | | n/a | | | | n/a | | | | n/a | |
| US | | | 6.05 | | | | 2.50 | | | | n/a | | | | 3.50 | | | | 8.90 | | | | 5.00 | | | | 2018 | |
| Jersey | | | 6.50 | | | | 2.90 | | | | 2.90 | | | | 4.65 | | | | n/a | | | | n/a | | | | n/a | |
| Mexico | | | 8.10 | | | | 3.50 | | | | 2.00 | | | | 4.50 | | | | 6.75 | | | | 6.75 | | | | n/a | |
| Brazil | | | 10.75 | | | | 4.50 | | | | 4.50 | | | | 5.50 | | | | 10.00 | | | | 5.50 | | | | 2018 | |
| France | | | 5.75 | | | | 2.00 | | | | 2.00 | | | | 3.00 | | | | n/a | | | | n/a | | | | n/a | |
| Canada | | | 7.19 | | | | 2.50 | | | | n/a | | | | 3.85 | | | | 8.20 | | | | 4.90 | | | | 2012 | |
| Switzerland | | | 2.60 | | | | 1.50 | | | | n/a | | | | 2.39 | | | | n/a | | | | n/a | | | | n/a | |
| Germany | | | 5.75 | | | | 2.00 | | | | 2.00 | | | | 3.00 | | | | n/a | | | | n/a | | | | n/a | |
| |
| 1 | Rate of increase for pensions in payment and deferred pensions (except for the UK). |
| |
| 2 | Rate of increase for pensions in the UK is for pensions in payment only, capped at 5%. Deferred pensions are projected to increase in line with the assumed inflation rate. |
HSBC determines the discount rates to be applied to its obligations in consultation with the plans’ local actuaries, on the basis of current average yields of high quality (AA rated or equivalent) debt instruments, with maturities consistent with those of the defined benefit obligations. In countries where there is not a deep market in corporate bonds, government bond yields have been used. The yield curve has been extrapolated where the term of the liabilities is longer than the duration of available bonds and the discount rate used then takes into account the term of the liabilities and the shape of the yield curve. When determining the discount rate with reference to a bond index, an appropriate index for the specific region has been used.
Mortality tables and average life expectancy at age 65
| | | | | | | | | | | | | | | | | | | |
| | | | | Life expectancy at | | Life expectancy at |
| | | | | age 65 for a male | | age 65 for a female |
| | | Mortality table | | member currently: | | member currently: |
| | | | | Aged 65 | | | Aged 45 | | | Aged 65 | | | Aged 45 | |
| | | | | | | | | | | | | | | | | | | |
At 31 December 2010 | | | | | | | | | | | | | | | | | | |
| UK | | SAPS MC1 | | | 22.4 | | | | 24.3 | | | | 23.4 | | | | 25.3 | |
Hong Kong4 | | n/a | | | n/a | | | | n/a | | | | n/a | | | | n/a | |
| US | | RP 2000 fully generational | | | 19.3 | | | | 20.8 | | | | 21.2 | | | | 22.1 | |
| Jersey | | 80% of PNA002 | | | 24.2 | | | | 26.2 | | | | 26.6 | | | | 28.5 | |
| Mexico | | EMSSA-97 AA generational scale from RP 2000 series | | | 18.6 | | | | 20.1 | | | | 21.1 | | | | 22.0 | |
| Brazil | | RP 2000 fully generational | | | 19.3 | | | | 20.8 | | | | 21.2 | | | | 22.1 | |
| France | | TG 05 | | | 23.4 | | | | 26.1 | | | | 26.8 | | | | 29.7 | |
| Canada | | UP94 generational | | | 19.5 | | | | 21.1 | | | | 22.0 | | | | 22.8 | |
| Switzerland | | BVG 20053 | | | 17.9 | | | | 17.9 | | | | 21.0 | | | | 21.0 | |
| Germany | | Heubeck 2005 G | | | 18.4 | | | | 21.1 | | | | 22.5 | | | | 25.1 | |
| | | | | | | | | | | | | | | | | | | |
| At 31 December 2009 | | | | | | | | | | | | | | | | | | |
| UK | | SAPS MC1 | | | 22.3 | | | | 24.2 | | | | 23.3 | | | | 25.2 | |
Hong Kong4 | | n/a | | | n/a | | | | n/a | | | | n/a | | | | n/a | |
| US | | RP 2000 fully generational | | | 19.2 | | | | 20.7 | | | | 21.2 | | | | 22.1 | |
| Jersey | | 80% of PNA002 | | | 24.1 | | | | 26.1 | | | | 26.5 | | | | 28.4 | |
| Mexico | | EMSSA-97 AA generational scale from RP 2000 series | | | 18.5 | | | | 20.1 | | | | 21.1 | | | | 22.0 | |
| Brazil | | RP 2000 fully generational | | | 19.2 | | | | 20.7 | | | | 21.2 | | | | 22.1 | |
| France | | TG 05 | | | 23.2 | | | | 26.0 | | | | 26.7 | | | | 29.6 | |
| Canada | | UP94 generational | | | 19.5 | | | | 21.1 | | | | 22.0 | | | | 22.8 | |
| Switzerland | | BVG 20053 | | | 17.9 | | | | 17.9 | | | | 21.0 | | | | 21.0 | |
| Germany | | Heubeck 2005 G | | | 18.3 | | | | 21.0 | | | | 22.4 | | | | 25.0 | |
| |
| 1 | SAPS MC projections with 1% minimum improvement beyond 2002. Light table with 1.08 rating for male and standard table with 1.06 rating for female. |
| |
| 2 | PNA00 year of birth and medium cohort with 1% minimum improvement thereafter. |
| |
| 3 | Additional 8.5% liability loading for future mortality improvements. |
| |
| 4 | The significant plans in Hong Kong are lump sum plans which do not use a post-retirement mortality table. |
282
Notes on the Financial Statements(continued)
Expected rates of return
| | | | | | | | | | | | | | | | | |
| | | 2010 | | 2009 |
| | | Expected | | | | | | | Expected | | | | |
| | | rates of return | 1 | | Value | | | rates of return | 1 | | Value | |
| | | % | | | US$m | | | % | | | US$m | |
| | | | | | | | | | | | | | | | | |
HSBC Bank (UK) Pension Scheme | | | | | | | | | | | | | | | | |
| Fair value of plan assets | | | | | | | 22,236 | | | | | | | | 17,701 | |
| | | | | | | | | | | | | |
| Equities | | | 8.4 | | | | 3,415 | | | | 8.4 | | | | 2,770 | |
| Bonds | | | 5.3 | | | | 15,638 | | | | 5.3 | | | | 12,597 | |
| Property | | | 7.6 | | | | 1,438 | | | | 7.7 | | | | 1,502 | |
| Other | | | 4.0 | | | | 1,745 | | | | 5.3 | | | | 832 | |
| | | | | | | | | | | | | |
| | | | | | | | | | | | | | | | | |
Other plans | | | | | | | | | | | | | | | | |
| Fair value of plan assets | | | | | | | 7,559 | | | | | | | | 6,822 | |
| | | | | | | | | | | | | |
| Equities | | | 8.2 | | | | 2,617 | | | | 8.2 | | | | 2,302 | |
| Bonds | | | 5.0 | | | | 4,073 | | | | 5.0 | | | | 3,809 | |
| Property | | | 6.1 | | | | 98 | | | | 6.4 | | | | 55 | |
| Other | | | 6.2 | | | | 771 | | | | 3.5 | | | | 656 | |
| | | | | | | | | | | | | |
| | | | | | | | | | | | | | | | | |
Healthcare plans | | | | | | | | | | | | | | | | |
| Fair value of plan assets | | | | | | | 165 | | | | | | | | 142 | |
| | | | | | | | | | | | | |
| Equities | | | 12.0 | | | | 49 | | | | 12.2 | | | | 43 | |
| Bonds | | | 8.4 | | | | 81 | | | | 8.7 | | | | 72 | |
| Other | | | 7.6 | | | | 35 | | | | 4.6 | | | | 27 | |
| | | | | | | | | | | | | |
| | |
| 1 | | The expected rates of return are used to measure the net defined benefit pension costs in each subsequent year, and weighted on the basis of the fair value of the plan assets. |
The expected return on plan assets represents the best estimate of long-term future asset returns, which takes into account historical market returns plus additional factors such as the current rate of inflation and interest rates.
Actuarial assumption sensitivities
The discount rate is sensitive to changes in market conditions arising during the reporting period. The mortality rates used are sensitive to experience from the plan member profile. The following table shows the effect of changes in these and the other key assumptions on the principal defined benefit pension plan:
The effect of changes in key assumptions on the principal plan
| | | | | | | | | |
| | | HSBC Bank (UK) Pension Scheme |
| | | 2010 | | | 2009 | |
| | | US$m | | | US$m | |
| | | | | | | | | |
| Discount rate | | | | | | | | |
| Change in pension obligation at year end from a 25bps increase | | | (941 | ) | | | (879 | ) |
| Change in pension obligation at year end from a 25bps decrease | | | 1,003 | | | | 946 | |
| Change in 2011 pension cost from a 25bps increase | | | (9 | ) | | | (13 | ) |
| Change in 2011 pension cost from a 25bps decrease | | | 9 | | | | 13 | |
| | | | | | | | | |
| Rate of inflation | | | | | | | | |
| Change in pension obligation at year end from a 25bps increase | | | 1,029 | | | | 964 | |
| Change in pension obligation at year end from a 25bps decrease | | | (978 | ) | | | (907 | ) |
| Change in 2011 pension cost from a 25bps increase | | | 67 | | | | 65 | |
| Change in 2011 pension cost from a 25bps decrease | | | (64 | ) | | | (63 | ) |
| | | | | | | | | |
| Rate of increase for pensions in payment and deferred pensions | | | | | | | | |
| Change in pension obligation at year end from a 25bps increase | | | 813 | | | | 800 | |
| Change in pension obligation at year end from a 25bps decrease | | | (775 | ) | | | (766 | ) |
| Change in 2011 pension cost from a 25bps increase | | | 48 | | | | 50 | |
| Change in 2011 pension cost from a 25bps decrease | | | (45 | ) | | | (49 | ) |
| | | | | | | | | |
| Rate of pay increase | | | | | | | | |
| Change in pension obligation at year end from a 25bps increase | | | 216 | | | | 195 | |
| Change in pension obligation at year end from a 25bps decrease | | | (203 | ) | | | (174 | ) |
| Change in 2011 pension cost from a 25bps increase | | | 20 | | | | 18 | |
| Change in 2011 pension cost from a 25bps decrease | | | (17 | ) | | | (16 | ) |
| | | | | | | | | |
| Investment return | | | | | | | | |
| Change in 2011 pension cost from a 25bps increase | | | (54 | ) | | | (44 | ) |
| Change in 2011 pension cost from a 25bps decrease | | | 54 | | | | 44 | |
| | | | | | | | | |
| Mortality | | | | | | | | |
| Change in pension obligation from each additional year of longevity assumed | | | 497 | | | | 487 | |
283
Notes on the Financial Statements(continued)
The effect of changes in the discount rate and in mortality rates on plans other than the principal plan
| | | | | | | | | |
| | | Other plans |
| | | 2010 | | | 2009 | |
| | | US$m | | | US$m | |
| | | | | | | | | |
| Change in defined benefit obligation at year end from a 25bps increase in discount rate | | | (290 | ) | | | (269 | ) |
| Change in 2011 pension cost from a 25bps increase in discount rate | | | (1 | ) | | | (3 | ) |
| Increase in defined benefit obligation from each additional year of longevity assumed | | | 131 | | | | 120 | |
Effect of one percentage point change in assumed healthcare cost trend rates
| | | | | | | | | | | | | | | | | |
| | | 2010 | | 2009 |
| | | 1% increase | | | 1% decrease | | | 1% increase | | | 1% decrease | |
| | | US$m | | | US$m | | | US$m | | | US$m | |
| | | | | | | | | | | | | | | | | |
| Increase/(decrease) of the aggregate of the current service cost and interest cost | | | 8 | | | | (7 | ) | | | 8 | | | | (7 | ) |
| Increase/(decrease) of defined benefit obligation | | | 106 | | | | (86 | ) | | | 86 | | | | (75 | ) |
Employee compensation and benefit expense in respect of HSBC Holdings’ employees in 2010 amounted to US$244m (2009: US$217m). The average number of persons employed by HSBC Holdings during 2010 was 1,015 (2009: 876).
Employees of HSBC Holdings who are members of defined benefit pension plans are principally members of either the HSBC Bank (UK) Pension Scheme or the HSBC International Staff Retirement Benefits Scheme.
The aggregate emoluments of the Directors of HSBC Holdings, computed in accordance with the Companies Act 2006 and the Large and Medium-sized Companies and Group (Accounts and Reports) Regulations 2008 were:
| | | | | | | | | | | | | |
| | | 2010 | | | 2009 | | | 2008 | |
| | | US$000 | | | US$000 | | | US$000 | |
| | | | | | | | | | | | | |
| Fees | | | 3,597 | | | | 3,756 | | | | 2,529 | |
| Salaries and other emoluments | | | 12,841 | | | | 11,835 | | | | 11,584 | |
| Bonuses | | | 14,294 | | | | – | | | | – | |
| | | | | | | |
| | | | | | | | | | | | | |
| | | | 30,732 | | | | 15,591 | | | | 14,113 | |
| | | | | | | |
| | | | | | | | | | | | | |
| Gains on the exercise of share options | | | – | | | | – | | | | 23 | |
| Vesting of Long-Term Incentive awards | | | 8,523 | | | | 1,579 | | | | 7,147 | |
In addition, there were payments under retirement benefit agreements with former Directors of US$1,016,089 (2009: US$1,036,385). The provision at 31 December 2010 in respect of unfunded pension obligations to former Directors amounted to US$17,628,508 (2009: US$16,296,028).
During the year, aggregate contributions to pension schemes in respect of Directors were US$1,055,582 (2009: US$788,734). Discretionary bonuses for Directors are based on a combination of individual and corporate performance and are determined by the Remuneration Committee. Details of Directors’ remuneration, share options and conditional awards under the Restricted Share Plan 2000 and the HSBC Share Plan are included in the ‘Directors’ Remuneration Report’ on pages 232 and 233.
284
Notes on the Financial Statements(continued)
Auditors’ remuneration in relation to the statutory audit amounted to US$51.4m (2009: US$50.7m; 2008: US$54.9m). The following fees were payable by HSBC to the Group’s principal auditor, KPMG Audit Plc and its associates (together ‘KPMG’):
Fees payable by HSBC to KPMG
| | | | | | | | | | | | | |
| | | 2010 | | | 2009 | | | 2008 | |
| | | US$m | | | US$m | | | US$m | |
| | | | | | | | | | | | | |
Audit fees for HSBC Holdings’ statutory audit1 | | | 2.4 | | | | 2.3 | | | | 2.1 | |
| | | | | | | |
| – fees relating to current year | | | 2.4 | | | | 2.1 | | | | 2.5 | |
| – fees relating to prior year | | | – | | | | 0.2 | | | | (0.4 | ) |
| | | | | | | |
| | | | | | | | | | | | | |
| Fees payable to KPMG for other services provided to HSBC | | | 75.9 | | | | 77.1 | | | | 88.3 | |
| | | | | | | |
| Audit-related services: | | | | | | | | | | | | |
– audit of HSBC’s subsidiaries, pursuant to legislation2 | | | 46.7 | | | | 45.9 | | | | 48.6 | |
– other services pursuant to legislation3 | | | 20.8 | | | | 24.2 | | | | 26.5 | |
Tax services4 | | | 2.4 | | | | 2.6 | | | | 3.1 | |
| Other services: | | | | | | | | | | | | |
– services relating to information technology5 | | | 0.1 | | | | 0.3 | | | | 0.6 | |
– services related to corporate finance transactions6 | | | – | | | | 0.1 | | | | 1.4 | |
– all other services7 | | | 5.9 | | | | 4.0 | | | | 8.1 | |
| | | | | | | |
| | | | | | | |
| | | | | | | | | | | | | |
| Total fees payable | | | 78.3 | | | | 79.4 | | | | 90.4 | |
| | | | | | | |
| |
| 1 | Fees payable to KPMG Audit Plc for the statutory audit of the consolidated financial statements of HSBC and the separate financial statements of HSBC Holdings. They exclude amounts payable for the statutory audit of HSBC Holdings’ subsidiaries which have been included in ‘Fees payable to KPMG for other services provided to HSBC’. |
| |
| 2 | Including fees payable to KPMG for the statutory audit of HSBC’s subsidiaries. |
| |
| 3 | Including services for assurance and other services that relate to statutory and regulatory filings, including comfort letters and interim reviews. |
| |
| 4 | Including tax compliance services and tax advisory services. |
| |
| 5 | Including advice on IT security and business continuity and performing agreed-upon IT testing procedures. |
| |
| 6 | Including fees payable to KPMG for transaction-related work, including US debt issuances. |
| |
| 7 | Including other assurance and advisory services such as translation services, ad-hoc accounting advice and review of financial models. |
No fees were payable by HSBC to KPMG for the following types of services: internal audit services, valuation and actuarial services, services related to litigation and services related to recruitment and remuneration.
Fees payable by HSBC’s associated pension schemes to KPMG
| | | | | | | | | | | | | |
| | | 2010 | | | 2009 | | | 2008 | |
| | | US$000 | | | US$000 | | | US$000 | |
| | | | | | | | | | | | | |
| Audit fees | | | 384 | | | | 670 | | | | 720 | |
| Tax services | | | – | | | | – | | | | 73 | |
| All other services | | | – | | | | 260 | | | | – | |
| | | | | | | |
| | | | | | | | | | | | | |
| Total fees payable | | | 384 | | | | 930 | | | | 793 | |
| | | | | | | |
No fees were payable by HSBC’s associated pension schemes to KPMG for the following types of services: other services pursuant to legislation, services relating to information technology, internal audit services, valuation and actuarial services, services related to litigation, services related to recruitment and remuneration, and services related to corporate finance transactions.
In addition to the above, KPMG estimate they have been paid fees of US$14.9m (2009: US$8.1m; 2008: US$4.8m) by parties other than HSBC but where HSBC is connected with the contracting party and therefore may be involved in appointing KPMG. These fees arise from services such as auditing mutual funds managed by HSBC and reviewing the financial position of corporate concerns which borrow from HSBC.
Fees payable to KPMG for non-audit services for HSBC Holdings are not disclosed separately because such fees are disclosed on a consolidated basis for HSBC Group.
285
Notes on the Financial Statements(continued)
During 2010, US$813m was charged to the income statement in respect of share-based payment transactions settled in equity (2009: US$683m; 2008: US$819m). This expense, which was computed from the fair values of the share-based payment transactions when contracted, arose under employee share awards made in accordance with HSBC’s reward structures.
Calculation of fair values
Fair values of share options/awards, measured at the date of grant of the option/award, are calculated using a Black-Scholes model. When modelling options/awards with vesting dependent on HSBC’s Total Shareholder Return (‘TSR’) over a period, the TSR performance targets are incorporated into the model using Monte Carlo simulation. The expected life of options depends on the behaviour of option holders, which is incorporated into the option model on the basis of historical observable data. The fair values calculated are inherently subjective and uncertain due to the assumptions made and the limitations of the model used.
Significant weighted average assumptions used to estimate the fair value of options granted
| | | | | | | | | | | | | |
| | | Savings-related share option plans |
| | | 1-year plan | | | 3-year plans | | | 5-year plans | |
| | | | | | | | | | | | | |
2010 | | | | | | | | | | | | |
Risk-free interest rate1 (%) | | | 0.7 | | | | 1.9 | | | | 2.9 | |
Expected life2 (years) | | | 1 | | | | 3 | | | | 5 | |
Expected volatility3 (%) | | | 30 | | | | 30 | | | | 30 | |
| Share price at grant date (£) | | | 6.82 | | | | 6.82 | | | | 6.82 | |
| | | | | | | | | | | | | |
| 2009 | | | | | | | | | | | | |
Risk-free interest rate1 (%) | | | 0.7 | | | | 2.1 | | | | 2.4 | |
Expected life2 (years) | | | 1 | | | | 3 | | | | 5 | |
Expected volatility3 (%) | | | 50 | | | | 35 | | | | 30 | |
| Share price at grant date (£) | | | 4.65 | | | | 4.65 | | | | 4.65 | |
| | | | | | | | | | | | | |
| 2008 | | | | | | | | | | | | |
Risk-free interest rate1 (%) | | | 4.5 | | | | 4.5 | | | | 4.5 | |
Expected life2 (years) | | | 1 | | | | 3 | | | | 5 | |
Expected volatility3 (%) | | | 25 | | | | 25 | | | | 25 | |
| Share price at grant date (£) | | | 8.80 | | | | 8.80 | | | | 8.80 | |
| |
| 1 | The risk-free rate was determined from the UK gilts yield curve for the UK Savings-Related Share Option Plans. A similar yield curve was used for the International Savings-Related Share Option Plans. |
| |
| 2 | Expected life is not a single input parameter but a function of various behavioural assumptions. |
| |
| 3 | Expected volatility is estimated by considering both historic average share price volatility and implied volatility derived from traded options over HSBC shares of similar maturity to those of the employee options. |
The expected US dollar denominated dividend yield was determined to be 4.5% per annum in line with consensus analyst forecasts (2009: 4.5%). Prior to 2009, HSBC adopted a dividend growth model and incorporated expected dividends into the valuation model for share options and awards. In 2008, the expected dividend growth was determined to be 7% for the first year and 8% thereafter.
The HSBC Share Plan was approved at the 2005 Annual General Meeting and amendments were approved at the 2008 Annual General Meeting. Under this plan, Performance Share awards, Restricted Share awards and share option awards may be made. The aim of the HSBC Share Plan is to align the interests of executives with the creation of shareholder value and recognise individual performance and potential. Awards are also made under this plan for recruitment and retention purposes.
Performance Share awards
Awards of Performance Shares are made to executive Directors and other senior executives after taking into account individual performance in the previous year. For awards made prior to 2008, each award is divided into two equal parts for testing attainment against pre-determined benchmarks. One half of the award is subject to a TSR measure, based on HSBC’s ranking against a comparator group of 28 major banks; the other half is subject to an earnings per share (‘EPS’) target. For each element of the award, shares are released to the employee on a sliding scale from 30%
286
Notes on the Financial Statements(continued)
to 100% of the award, depending on the scale of achievement against the benchmarks, providing that the minimum criteria for each performance measure have been met.
For awards made during 2008 and prospectively, each award is divided into three parts for testing attainment against pre-determined benchmarks. 40% of the award is subject to a TSR measure, based on a free-float market capitalisation ranking method; 40% is subject to an economic profit measure, calculated as the average annual difference between return on invested capital and HSBC’s benchmark cost of capital; and 20% is subject to an EPS target. For the TSR and EPS elements of the awards, shares are released to the employee on a sliding scale from 20% to 100% of the award, depending on the scale of achievement against the benchmarks. For the economic profit element of the awards, shares are released to the employee on a sliding scale from zero to 100%, depending on the scale of achievement against the benchmark. In all cases, shares are only released when the minimum criteria for each performance measure has been met. The performance conditions are measured over a three year performance period and awards forfeited to the extent they have not been met.
In addition to the performance conditions mentioned above, before an award can vest, the Remuneration Committee needs to be satisfied that the Group has shown a sustained improvement in the period since the award was made. In determining this, the Remuneration Committee will take account of all relevant factors, in particular, comparisons against the TSR comparator group in areas such as revenue growth and mix, cost efficiency, credit performance as measured by risk-adjusted revenues, cash return on cash invested, dividend performance and TSR.
Movement in Performance Share awards under the HSBC Share Plan
| | | | | | | | | |
| | | 2010 | | | 2009 | |
| | | Number | | | Number | |
| | | (000s) | | | (000s) | |
| | | | | | | | | |
| Outstanding at 1 January | | | 7,360 | | | | 11,619 | |
Additions during the year1 | | | 351 | | | | 333 | |
| Adjustment for rights issue | | | – | | | | 1,712 | |
| Released in the year | | | (1,181 | ) | | | (1,076 | ) |
| Forfeited in the year | | | (2,105 | ) | | | (5,228 | ) |
| | | | | |
| | | | | | | | | |
| Outstanding at 31 December | | | 4,425 | | | | 7,360 | |
| | | | | |
| |
| 1 | Additions during the year comprised reinvested dividend equivalents. |
No Performance Shares were awarded by HSBC in 2010 and 2009.
Restricted Share awards
Awards of Restricted Shares are made to employees on the basis of their performance, potential and retention requirements, to aid recruitment or as a part-deferral of annual bonuses. Shares are awarded without corporate performance conditions and generally vest between one and three years from the date of award, providing the employees have remained continually employed by HSBC for this period.
Movement in Restricted Share awards under the HSBC Share Plan
| | | | | | | | | |
| | | 2010 | | | 2009 | |
| | | Number | | | Number | |
| | | (000s) | | | (000s) | |
| | | | | | | | | |
| Outstanding at 1 January | | | 184,318 | | | | 122,206 | |
| Additions during the year | | | 110,711 | | | | 108,439 | |
| Adjustment for rights issue | | | – | | | | 26,119 | |
| Released in the year | | | (55,419 | ) | | | (49,718 | ) |
| Forfeited in the year | | | (10,518 | ) | | | (22,728 | ) |
| | | | | |
| | | | | | | | | |
| Outstanding at 31 December | | | 229,092 | | | | 184,318 | |
| | | | | |
The weighted average fair value of Restricted Share awards in 2010 was US$10.50 (2009: US$6.31).
Share options
A small number of discretionary share options were granted in 2005 exclusively to individuals employed by HSBC France under the HSBC Share Plan rules, after the expiry of the Group Share Option Plan rules.
287
Notes on the Financial Statements(continued)
Nil-cost share options were granted to senior executives on the basis of their performance in the previous year. The share options were subject to the achievement of the same corporate performance conditions as the 2005 Performance Share awards. The options vested after three years in the same proportion as the 2005 Performance Shares but were only exercisable up to the fourth anniversary of the date of grant. These options have now lapsed and there are currently no options with outstanding performance conditions.
Share options were also awarded to a number of employees under the HSBC Share Plan rules. These options may vest after three years and are exercisable up to the tenth anniversary of the date of the grant, after which they lapse.
Movement in share options under the HSBC Share Plan
| | | | | | | | | | | | | | | | | |
| | | 2010 | | 2009 |
| | | | | | | Weighted | | | | | | | Weighted | |
| | | | | | | average | | | | | | | average | |
| | | | | | | exercise | | | | | | | exercise | |
| | | Number | | | price | | | Number | | | price | |
| | | (000s) | | | £ | | | (000s) | | | £ | |
| | | | | | | | | | | | | | | | | |
| Outstanding at 1 January | | | 86 | | | | 7.99 | | | | 300 | | | | 8.89 | |
| Adjustment for rights issue | | | – | | | | – | | | | 44 | | | | 7.75 | |
| Forfeited and expired in the year | | | – | | | | – | | | | (258 | ) | | | 7.66 | |
| | | | | | | | | | | | | |
| | | | | | | | | | | | | | | | | |
| Outstanding and exercisable at 31 December | | | 86 | | | | 7.99 | | | | 86 | | | | 7.99 | |
| | | | | | | | | | | | | |
No share options were granted in 2010 and 2009. The weighted average remaining contractual life of options outstanding at the balance sheet date was 4.8 years (2009: 5.8 years). The exercise price of options outstanding at the balance sheet date was £7.99 (2009: £7.99).
Savings-related share option plans
Savings-related share option plans invite eligible employees to enter into savings contracts to save up to £250 per month (or its equivalent in US dollars, Hong Kong dollars or euros), with the option to use the savings to acquire shares. The aim of the plans is to align the interests of all employees with the creation of shareholder value. The options are exercisable within three months following the first anniversary of the commencement of a one-year savings contract or within six months following either the third or the fifth anniversaries of the commencement of three-year or five-year savings contracts, respectively. The exercise price is set at a 20% (2009: 20%) discount to the market value immediately preceding the date of invitation (except for the one-year options granted under the US sub-plan where a 15% discount is applied).
Movement in savings-related share options
| | | | | | | | | | | | | | | | | |
| | | 2010 | | 2009 |
| | | | | | | Weighted | | | | | | | Weighted | |
| | | | | | | average | | | | | | | average | |
| | | | | | | exercise | | | | | | | exercise | |
| | | Number | | | price | | | Number | | | price | |
| | | (000s) | | | £ | | | (000s) | | | £ | |
| | | | | | | | | | | | | | | | | |
| Outstanding at 1 January | | | 172,526 | | | | 3.69 | | | | 74,401 | | | | 6.97 | |
| Granted in the year | | | 22,017 | | | | 5.39 | | | | 152,796 | | | | 3.32 | |
| Adjustment for rights issue | | | – | | | | – | | | | 7,970 | | | | 6.08 | |
| Exercised in the year | | | (16,830 | ) | | | 4.18 | | | | (5,011 | ) | | | 5.72 | |
| Forfeited, cancelled and expired in the year | | | (19,858 | ) | | | 4.44 | | | | (57,630 | ) | | | 5.96 | |
| | | | | | | | | | | | | |
| | | | | | | | | | | | | | | | | |
| Outstanding at 31 December | | | 157,855 | | | | 3.87 | | | | 172,526 | | | | 3.69 | |
| | | | | | | | | | | | | |
288
Notes on the Financial Statements(continued)
The weighted average fair value of options granted during the year was US$2.41 (2009: US$2.03). The weighted average share price at the date the share options were exercised was US$10.08 (2009: US$10.23). The exercise price range and weighted average remaining contractual life for options outstanding at the balance sheet date were as follows:
| | | | | | | | | |
| | | 2010 | | | 2009 | |
| | | | | | | | | |
| Exercise price range (£) | | | 3.31 – 6.69 | | | | 3.31 – 6.69 | |
| Weighted average remaining contractual life (years) | | | 2.76 | | | | 3.47 | |
| Of which exercisable: | | | | | | | | |
| Number (000s) | | | 1,883 | | | | 5,145 | |
| Weighted average exercise price (£) | | | 6.23 | | | | 6.26 | |
HSBC Holdings Restricted Share Plan 2000
Restricted Share awards made under the Restricted Share Plan
Awards of Restricted Shares were made under the Restricted Share Plan to eligible employees from 2000 to 2005, after taking into account the employees’ performance in the previous year, their potential and retention requirements. Restricted shares were also awarded as part-deferral of annual bonuses or for recruitment purposes. Shares were awarded without corporate performance conditions and in most cases fully vest within three years from the date of award, providing the employees have remained continuously employed by HSBC for the period.
Movement on Restricted Share awards under the HSBC Holdings Restricted Share Plan
| | | | | | | | | |
| | | 2010 | | | 2009 | |
| | | Number | | | Number | |
| | | (000s) | | | (000s) | |
| | | | | | | | | |
| Outstanding at 1 January | | | 173 | | | | 2,717 | |
Additions during the year1 | | | – | | | | 30 | |
| Adjustment for rights issue | | | – | | | | 376 | |
| Released in the year | | | – | | | | (2,916 | ) |
| Forfeited in the year | | | (173 | ) | | | (34 | ) |
| | | | | |
| | | | | | | | | |
| Outstanding at 31 December | | | – | | | | 173 | |
| | | | | |
| |
| 1 | Additions in 2009 principally comprised reinvested dividend equivalents. |
At 31 December 2009 the weighted average remaining vesting period was 0.3 years.
HSBC Holdings Group Share Option Plan
The HSBC Holdings Group Share Option Plan was a long-term incentive plan under which certain HSBC employees between 2000 and 2005 were awarded share options. The aim of the plan was to align the interests of those higher performing employees with the creation of shareholder value. In most jurisdictions, this was achieved by setting certain TSR targets which would normally have to be attained in order for the awards to vest. Options were granted at market value and are normally exercisable between the third and tenth anniversaries of the date of grant, subject to vesting conditions. Options granted after May 2005 are made under the HSBC Share Plan.
Movement on the HSBC Holdings Group Share Option Plan awards
| | | | | | | | | | | | | | | | | |
| | | 2010 | | 2009 |
| | | | | | | Weighted | | | | | | | Weighted | |
| | | | | | | average | | | | | | | average | |
| | | | | | | exercise | | | | | | | exercise | |
| | | Number | | | price | | | Number | | | price | |
| | | (000s) | | | £ | | | (000s) | | | £ | |
| | | | | | | | | | | | | | | | | |
| Outstanding and exercisable at 1 January | | | 157,719 | | | | 7.12 | | | | 142,593 | | | | 8.16 | |
| Adjustment for rights issue | | | – | | | | – | | | | 21,333 | | | | 7.12 | |
| Exercised in the year | | | (1,015 | ) | | | 6.08 | | | | (1,548 | ) | | | 6.28 | |
| Forfeited and expired in the year | | | (3,946 | ) | | | 7.36 | | | | (4,659 | ) | | | 7.15 | |
| | | | | | | | | | | | | |
| | | | | | | | | | | | | | | | | |
| Outstanding and exercisable at 31 December | | | 152,758 | | | | 7.12 | | | | 157,719 | | | | 7.12 | |
| | | | | | | | | | | | | |
289
Notes on the Financial Statements(continued)
The weighted average share price at the date the share options were exercised was US$10.26 (2009: US$9.14). The number of options, weighted average exercise price and weighted average remaining contractual life of options outstanding at the balance sheet date, analysed by exercise price range, were as follows:
| | | | | | | | | | | | | | | | | |
| | | 2010 | | 2009 |
| | | | | | | | | | | | | | | | | |
| Exercise price range (£) | | | 6.00 – 7.00 | | | | 7.01 – 8.50 | | | | 6.00 – 7.00 | | | | 7.01 – 8.50 | |
| | | | | | | | | | | | | | | | | |
| Number (000s) | | | 26,927 | | | | 125,831 | | | | 28,406 | | | | 129,313 | |
| Weighted average exercise price (£) | | | 6.03 | | | | 7.36 | | | | 6.03 | | | | 7.36 | |
| Weighted average remaining contractual life (years) | | | 2.33 | | | | 2.34 | | | | 3.33 | | | | 3.34 | |
| Of which exercisable: | | | | | | | | | | | | | | | | |
| Number (000s) | | | 26,927 | | | | 125,831 | | | | 28,406 | | | | 129,313 | |
| Weighted average exercise price (£) | | | 6.03 | | | | 7.36 | | | | 6.03 | | | | 7.36 | |
HSBC Holdings Executive Share Option Scheme
The HSBC Holdings Executive Share Option Scheme was a long-term incentive plan under which certain senior HSBC employees were awarded share options before the adoption of the HSBC Holdings Group Share Option Plan in 2000. The aim of the plan was to align the interests of those higher performing senior employees with the creation of shareholder value. This was achieved by setting certain TSR targets to be attained in order for the awards to vest. Options were granted at market value and were exercisable between the third and tenth anniversaries of the date of grant, subject to vesting conditions. No awards have been made under this plan since 2000 and all options have now expired or been exercised.
Movement on the HSBC Holdings Executive Share Option Scheme awards
| | | | | | | | | | | | | | | | | |
| | | 2010 | | 2009 |
| | | | | | | Weighted | | | | | | | Weighted | |
| | | | | | | average | | | | | | | average | |
| | | | | | | exercise | | | | | | | exercise | |
| | | Number | | | price | | | Number | | | price | |
| | | (000s) | | | £ | | | (000s) | | | £ | |
| | | | | | | | | | | | | | | | | |
| Outstanding and exercisable at 1 January | | | 6,707 | | | | 6.50 | | | | 13,964 | | | | 6.92 | |
| Adjustment for rights issue | | | – | | | | – | | | | 2,046 | | | | 6.04 | |
| Exercised in the year | | | (4,229 | ) | | | 6.50 | | | | (920 | ) | | | 6.39 | |
| Expired in the year | | | (2,478 | ) | | | 6.50 | | | | (8,383 | ) | | | 5.61 | |
| | | | | | | | | | | | | |
| | | | | | | | | | | | | | | | | |
| Outstanding and exercisable at 31 December | | | – | | | | – | | | | 6,707 | | | | 6.50 | |
| | | | | | | | | | | | | |
The weighted average share price at the date the share options were exercised was US$10.26 (2009: US$9.14).
At 31 December 2009, the exercise price range for options outstanding was £5.50–£7.00 and the weighted average remaining contractual life of options outstanding was 0.26 years.
HSBC France and subsidiary company plans
Before its acquisition by HSBC in 2000, HSBC France and certain of its subsidiaries operated employee share option plans. Options over HSBC France shares granted between 1994 and 1999 vested upon announcement of HSBC’s agreement to acquire HSBC France and were therefore included in the valuation of HSBC France.
HSBC France granted 909,000 options in 2000 after the public announcement of the acquisition. The options vested on 1 January 2002. The HSBC France shares obtained on exercise of the options were exchangeable for HSBC Holdings ordinary shares of US$0.50. Options were granted at market value and are exercisable within ten years of the date of grant. Movements in options granted after the public announcement are shown below.
Movement on HSBC France share options
| | | | | | | | | | | | | | | | | |
| | | 2010 | | 2009 |
| | | | | | | Exercise | | | | | | | Exercise | |
| | | Number | | | price | | | Number | | | price | |
| | | (000s) | | | € | | | (000s) | | | € | |
| | | | | | | | | | | | | | | | | |
| Outstanding and exercisable at 1 January | | | 604 | | | | 142.5 | | | | 604 | | | | 142.5 | |
| Forfeited in the year | | | (604 | ) | | | 142.5 | | | | – | | | | – | |
| | | | | | | | | | | | | |
| | | | | | | | | | | | | | | | | |
| Outstanding and exercisable at 31 December | | | – | | | | – | | | | 604 | | | | 142.5 | |
| | | | | | | | | | | | | |
290
Notes on the Financial Statements(continued)
At 31 December 2009, the remaining contractual life for options outstanding was 0.3 years.
At the date of its acquisition, certain of HSBC France’s subsidiary companies also operated employee share option plans. On exercise of certain of these options, the subsidiary shares are exchanged for HSBC ordinary shares. The total number of HSBC ordinary shares exchanged under such arrangements in 2010 was 9,281 (2009: 70,257).
Upon acquisition, HSBC Finance share options previously granted were converted to share options over HSBC ordinary shares of US$0.50 each at a rate of 2.675 HSBC share options (the same ratio as the Exchange Offer for HSBC Finance) for each HSBC Finance share option. Options granted under HSBC Finance’s own share option schemes prior to the announcement of the acquisition by HSBC in November 2002 vested as options over HSBC shares upon acquisition by HSBC. Options granted after the announcement of the acquisition but prior to its completion on 28 March 2003 generally vest equally over four years and expire ten years from the date of grant. Options granted after the announcement are shown in the table below.
Movement on HSBC Finance share options
| | | | | | | | | | | | | | | | | |
| | | 2010 | | 2009 |
| | | | | | | Exercise | | | | | | | Exercise | |
| | | Number | | | price | | | Number | | | price | |
| | | (000s) | | | US$ | | | (000s) | | | US$ | |
| | | | | | | | | | | | | | | | | |
| Outstanding at 1 January | | | 2,736 | | | | 9.29 | | | | 2,402 | | | | 10.66 | |
| Adjustment for rights issue | | | – | | | | – | | | | 354 | | | | 9.29 | |
| Exercised in the year | | | (307 | ) | | | 9.29 | | | | (20 | ) | | | 9.29 | |
| Expired in the year | | | – | | | | – | | | | – | | | | 9.29 | |
| | | | | | | | | | | | | |
| | | | | | | | | | | | | | | | | |
| Outstanding and exercisable at 31 December | | | 2,429 | | | | 9.29 | | | | 2,736 | | | | 9.29 | |
| | | | | | | | | | | | | |
The weighted average share price at the date the share options were exercised was US$10.26 (2009: US$9.14). The remaining contractual life for options outstanding at the balance sheet date was 1.9 years (2009: 2.9 years).
| | | | | | | | | | | | | |
| | | 2010 | | | 2009 | | | 2008 | |
| | | US$m | | | US$m | | | US$m | |
| | | | | | | | | | | | | |
Current tax | | | | | | | | | | | | |
| UK Corporation tax | | | 383 | | | | 206 | | | | 1,671 | |
| | | | | | | |
| – on current year profit | | | 404 | | | | 280 | | | | 1,738 | |
| – adjustments in respect of prior years | | | (21 | ) | | | (74 | ) | | | (67 | ) |
| | | | | | | |
| | | | | | | | | | | | | |
| Overseas tax | | | 3,328 | | | | 1,847 | | | | 1,703 | |
| | | | | | | |
| – on current year profit | | | 3,235 | | | | 1,826 | | | | 1,732 | |
| – adjustments in respect of prior years | | | 93 | | | | 21 | | | | (29 | ) |
| | | | | | | |
| | | | | | | |
| | | | | | | | | | | | | |
| | | | 3,711 | | | | 2,053 | | | | 3,374 | |
| | | | | | | |
| | | | | | | | | | | | | |
Deferred tax | | | | | | | | | | | | |
| Origination and reversal of temporary differences | | | 1,176 | | | | (1,672 | ) | | | (504 | ) |
| Effect of changes in tax rates | | | 31 | | | | (10 | ) | | | (89 | ) |
| Adjustments in respect of prior years | | | (72 | ) | | | 14 | | | | 28 | |
| | | | | | | |
| | | | | | | | | | | | | |
| | | | 1,135 | | | | (1,668 | ) | | | (565 | ) |
| | | | | | | |
| | | | | | | | | | | | | |
| Tax expense | | | 4,846 | | | | 385 | | | | 2,809 | |
| | | | | | | |
The UK corporation tax rate applying to HSBC Holdings and its subsidiaries was 28% (2009: 28%; 2008: 30% to 31 March 2008 and 28% thereafter). Overseas tax included Hong Kong profits tax of US$962m (2009: US$783m; 2008: US$846m). The Hong Kong tax rate applying to the profits of subsidiaries assessable in Hong Kong was 16.5% (2009: 16.5%; 2008: 16.5%). Other overseas subsidiaries and overseas branches provided for taxation at the appropriate rates in the countries in which they operate.
291
Notes on the Financial Statements(continued)
The following table reconciles the tax expense which would apply if all profits had been taxed at the UK corporation tax rate:
Analysis of tax expense
| | | | | | | | | | | | | | | | | | | | | | | | | |
| | | 2010 | | 2009 | | 2008 |
| | | US$m | | | % | | | US$m | | | % | | | US$m | | | % | |
| | | | | | | | | | | | | | | | | | | | | | | | | |
Taxation at UK corporation tax rate of 28% (2009: 28%; 2008: 28.5%)1 | | | 5,330 | | | | 28.0 | | | | 1,982 | | | | 28.0 | | | | 2,652 | | | | 28.5 | |
| Goodwill impairment | | | – | | | | – | | | | – | | | | – | | | | 3,010 | | | | 32.3 | |
Non-deductible loss on foreign exchange swaps on rights issue proceeds2 | | | – | | | | – | | | | 96 | | | | 1.4 | | | | – | | | | – | |
| Effect of taxing overseas profits in principal locations at different rates | | | (744 | ) | | | (3.9 | ) | | | (1,345 | ) | | | (19.0 | ) | | | (1,339 | ) | | | (14.4 | ) |
| Gains not subject to tax | | | (275 | ) | | | (1.4 | ) | | | (238 | ) | | | (3.4 | ) | | | (1,016 | ) | | | (10.9 | ) |
| Adjustments in respect of prior period liabilities | | | – | | | | – | | | | (39 | ) | | | (0.6 | ) | | | (67 | ) | | | (0.7 | ) |
Low income housing tax credits3 | | | (86 | ) | | | (0.5 | ) | | | (98 | ) | | | (1.4 | ) | | | (103 | ) | | | (1.1 | ) |
| Effect of profit in associates and joint ventures | | | (705 | ) | | | (3.7 | ) | | | (499 | ) | | | (7.1 | ) | | | (473 | ) | | | (5.1 | ) |
Tax impact of intra-group transfer of subsidiary4 | | | 1,216 | | | | 6.4 | | | | – | | | | – | | | | – | | | | – | |
| Impact of gains arising from dilution of interests in associates | | | (53 | ) | | | (0.3 | ) | | | – | | | | – | | | | – | | | | – | |
Deferred tax temporary differences not provided/(previously not recognised)5 | | | (6 | ) | | | – | | | | 360 | | | | 5.1 | | | | 157 | | | | 1.7 | |
| Non taxable income | | | (374 | ) | | | (2.0 | ) | | | (365 | ) | | | (5.2 | ) | | | (519 | ) | | | (5.6 | ) |
| Permanent disallowables | | | 276 | | | | 1.5 | | | | 223 | | | | 3.2 | | | | 217 | | | | 2.3 | |
| Additional provision for tax on overseas dividends | | | – | | | | – | | | | 341 | | | | 4.8 | | | | 294 | | | | 3.2 | |
| Effect of bank payroll tax | | | 79 | | | | 0.4 | | | | – | | | | – | | | | – | | | | – | |
| Change in tax rates | | | 31 | | | | 0.2 | | | | (10 | ) | | | (0.1 | ) | | | (89 | ) | | | (0.9 | ) |
| Local taxes and overseas withholding tax | | | 61 | | | | 0.3 | | | | 12 | | | | 0.1 | | | | 122 | | | | 1.3 | |
| Other items | | | 96 | | | | 0.5 | | | | (35 | ) | | | (0.4 | ) | | | (37 | ) | | | (0.4 | ) |
| | | | | | | | | | | | | |
| | | | | | | | | | | | | | | | | | | | | | | | | |
Tax expense1 | | | 4,846 | | | | 25.5 | | | | 385 | | | | 5.4 | | | | 2,809 | | | | 30.2 | |
| | | | | | | | | | | | | |
| | |
| 1 | | The change in the UK corporation tax rate from 30% to 28% with effect from 1 April 2008 gave rise to a blended tax rate for 2008 of 28.5%. |
| |
| 2 | | In August 2009, the UK Government enacted legislation that gains or losses on transactions designated to hedge foreign exchange exposures connected to rights issues should be disregarded for tax purposes. |
| |
| 3 | | Low income housing tax credits arise in the US and are designed to encourage the provision of rental housing for low income households. |
| |
| 4 | | This relates to the transfer of HSBC Bank Canada, which was part of the sub-group headed by HSBC North America Holdings Inc, to HSBC Overseas Holdings (UK) Limited. A taxable gain arises on this disposal but the crystallisation of deferred tax assets and utilisation of current year foreign tax credits meant that no tax was paid on this transfer. |
| |
| 5 | | 2009 and 2008 include the effect of previously unrecognised temporary differences principally related to the recognition of foreign tax credits and trading losses, respectively. |
On 22 June 2010, the UK Government announced its intention to reduce the main rate of corporation tax from 28% to 24%. It is proposed that the reduction will be phased in over a period of four years with a 1% decrease in the main corporation tax rate for each year starting on 1 April 2011. As at 31 December 2010, only the initial phase to reduce the main rate of UK corporation tax from 28% to 27% has been substantively enacted and therefore only this change has been reflected in the amounts recognised as at that date. However, it is not expected that the future proposed rate changes will have a significant effect on the net UK deferred tax asset recognised at 31 December 2010 of US$383m.
The following table shows the deferred tax assets and liabilities before offsetting balances within countries and the related movements recognised in the income statement, other comprehensive income and directly in equity.
292
Notes on the Financial Statements(continued)
Movement of deferred tax assets and liabilities before offsetting balances within countries
| | | | | | | | | | | | | | | | | | | | | | | | | | | | | | | | | | | | | | | | | | | | | | | | | | | | | |
| | | | | | | Loan | | | | | | | Accelerated | | | Available- | | | | | | | Share- | | | Assets | | | | | | | | | | | Relief for | | | | | | | |
| | | Retirement | | | impairment | | | Unused | | | capital | | | for-sale | | | Cash flow | | | based | | | leased to | | | Revaluation | | | | | | | unused tax | | | | | | | |
| | | benefits | | | allowances | | | tax losses | | | allowances | | | investments | | | hedges | | | payments | | | customers | | | of property | | | Fee income | | | credits | | | Other | | | Total | |
| 2010 | | US$m | | | US$m | | | US$m | | | US$m | | | US$m | | | US$m | | | US$m | | | US$m | | | US$m | | | US$m | | | US$m | | | US$m | | | US$m | |
| | | | | | | | | | | | | | | | | | | | | | | | | | | | | | | | | | | | | | | | | | | | | | | | | | | | | |
| Assets | | | 1,772 | | | | 6,363 | | | | 164 | | | | 215 | | | | 68 | | | | 229 | | | | 196 | | | | – | | | | – | | | | – | | | | 243 | | | | 1,535 | | | | 10,785 | |
| Liabilities | | | – | | | | – | | | | – | | | | (129 | ) | | | (340 | ) | | | (91 | ) | | | – | | | | (1,121 | ) | | | (399 | ) | | | (1,080 | ) | | | – | | | | (842 | ) | | | (4,002 | ) |
| | | | | | | | | | | | | | | | | | | | | | | | | | | |
| | | | | | | | | | | | | | | | | | | | | | | | | | | | | | | | | | | | | | | | | | | | | | | | | | | | | |
| At 1 January 2010 | | | 1,772 | | | | 6,363 | | | | 164 | | | | 86 | | | | (272 | ) | | | 138 | | | | 196 | | | | (1,121 | ) | | | (399 | ) | | | (1,080 | ) | | | 243 | | | | 693 | | | | 6,783 | |
| Acquisitions and disposals | | | – | | | | 8 | | | | – | | | | – | | | | 12 | | | | (2 | ) | | | – | | | | – | | | | – | | | | – | | | | – | | | | (16 | ) | | | 2 | |
| Income statement | | | (468 | ) | | | (1,702 | ) | | | 2 | | | | 14 | | | | (16 | ) | | | 3 | | | | 50 | | | | 250 | | | | 75 | | | | 386 | | | | (72 | ) | | | 343 | | | | (1,135 | ) |
| Other comprehensive income: | | | | | | | | | | | | | | | | | | | | | | | | | | | | | | | | | | | | | | | | | | | | | | | | | | | | |
| – available-for-sale investment | | | – | | | | – | | | | – | | | | – | | | | (73 | ) | | | – | | | | – | | | | – | | | | – | | | | – | | | | – | | | | – | | | | (73 | ) |
| – cash flow hedges | | | – | | | | – | | | | – | | | | – | | | | – | | | | 70 | | | | – | | | | – | | | | – | | | | – | | | | – | | | | – | | | | 70 | |
| – actuarial losses | | | (1 | ) | | | – | | | | – | | | | – | | | | – | | | | – | | | | – | | | | – | | | | – | | | | – | | | | – | | | | – | | | | (1 | ) |
| Equity: | | | | | | | | | | | | | | | | | | | | | | | | | | | | | | | | | | | | | | | | | | | | | | | | | | | | |
| – share-based payments | | | – | | | | – | | | | – | | | | – | | | | – | | | | – | | | | (14 | ) | | | – | | | | – | | | | – | | | | – | | | | – | | | | (14 | ) |
| Foreign exchange and other adjustments | | | 235 | | | | 130 | | | | 15 | | | | (117 | ) | | | 225 | | | | 55 | | | | 9 | | | | 164 | | | | 99 | | | | (62 | ) | | | (4 | ) | | | (463 | ) | | | 286 | |
| | | | | | | | | | | | | | | | | | | | | | | | | | | |
| | | | | | | | | | | | | | | | | | | | | | | | | | | | | | | | | | | | | | | | | | | | | | | | | | | | | |
At 31 December 2010 | | | 1,538 | | | | 4,799 | | | | 181 | | | | (17 | ) | | | (124 | ) | | | 264 | | | | 241 | | | | (707 | ) | | | (225 | ) | | | (756 | ) | | | 167 | | | | 557 | | | | 5,918 | |
| | | | | | | | | | | | | | | | | | | | | | | | | | | |
| | | | | | | | | | | | | | | | | | | | | | | | | | | | | | | | | | | | | | | | | | | | | | | | | | | | | |
| Assets | | | 1,538 | | | | 4,799 | | | | 181 | | | | 109 | | | | 11 | | | | 352 | | | | 241 | | | | – | | | | – | | | | – | | | | 170 | | | | 957 | | | | 8,358 | |
| Liabilities | | | – | | | | – | | | | – | | | | (126 | ) | | | (135 | ) | | | (88 | ) | | | – | | | | (707 | ) | | | (225 | ) | | | (756 | ) | | | (3 | ) | | | (400 | ) | | | (2,440 | ) |
| | | | | | | | | | | | | | | | | | | | | | | | | | | | | | | | | | | | | | | | | | | | | | | | | | | | | |
| 2009 | | | | | | | | | | | | | | | | | | | | | | | | | | | | | | | | | | | | | | | | | | | | | | | | | | | | |
| | | | | | | | | | | | | | | | | | | | | | | | | | | | | | | | | | | | | | | | | | | | | | | | | | | | | |
| Assets | | | 927 | | | | 5,891 | | | | 282 | | | | 99 | | | | 518 | | | | 1,145 | | | | 245 | | | | – | | | | – | | | | – | | | | 94 | | | | 363 | | | | 9,564 | |
| Liabilities | | | – | | | | – | | | | – | | | | (167 | ) | | | (121 | ) | | | (280 | ) | | | – | | | | (916 | ) | | | (374 | ) | | | (930 | ) | | | – | | | | (1,620 | ) | | | (4,408 | ) |
| | | | | | | | | | | | | | | | | | | | | | | | | | | |
| | | | | | | | | | | | | | | | | | | | | | | | | | | | | | | | | | | | | | | | | | | | | | | | | | | | | |
| At 1 January 2009 | | | 927 | | | | 5,891 | | | | 282 | | | | (68 | ) | | | 397 | | | | 865 | | | | 245 | | | | (916 | ) | | | (374 | ) | | | (930 | ) | | | 94 | | | | (1,257 | ) | | | 5,156 | |
| Acquisitions and disposals | | | – | | | | – | | | | – | | | | – | | | | – | | | | – | | | | – | | | | – | | | | – | | | | – | | | | – | | | | – | | | | – | |
| Income statement | | | (193 | ) | | | 19 | | | | (141 | ) | | | 132 | | | | (33 | ) | | | (4 | ) | | | (82 | ) | | | 136 | | | | 29 | | | | 3 | | | | 414 | | | | 1,388 | | | | 1,668 | |
| Other comprehensive income: | | | | | | | | | | | | | | | | | | | | | | | | | | | | | | | | | | | | | | | | | | | | | | | | | | | | |
| – available-for-sale investment | | | – | | | | – | | | | – | | | | – | | | | (587 | ) | | | – | | | | – | | | | – | | | | – | | | | – | | | | – | | | | – | | | | (587 | ) |
| – cash flow hedges | | | – | | | | – | | | | – | | | | – | | | | – | | | | (517 | ) | | | – | | | | – | | | | – | | | | – | | | | – | | | | – | | | | (517 | ) |
| – actuarial losses | | | 978 | | | | – | | | | – | | | | – | | | | – | | | | – | | | | – | | | | – | | | | – | | | | – | | | | – | | | | – | | | | 978 | |
| Equity: | | | | | | | | | | | | | | | | | | | | | | | | | | | | | | | | | | | | | | | | | | | | | | | | | | | | |
| – share-based payments | | | – | | | | – | | | | – | | | | – | | | | – | | | | – | | | | 9 | | | | – | | | | – | | | | – | | | | – | | | | – | | | | 9 | |
| Foreign exchange and other adjustments | | | 60 | | | | 453 | | | | 23 | | | | 22 | | | | (49 | ) | | | (206 | ) | | | 24 | | | | (341 | ) | | | (54 | ) | | | (153 | ) | | | (265 | ) | | | 562 | | | | 76 | |
| | | | | | | | | | | | | | | | | | | | | | | | | | | |
| | | | | | | | | | | | | | | | | | | | | | | | | | | | | | | | | | | | | | | | | | | | | | | | | | | | | |
| At 31 December 2009 | | | 1,772 | | | | 6,363 | | | | 164 | | | | 86 | | | | (272 | ) | | | 138 | | | | 196 | | | | (1,121 | ) | | | (399 | ) | | | (1,080 | ) | | | 243 | | | | 693 | | | | 6,783 | |
| | | | | | | | | | | | | | | | | | | | | | | | | | | |
| | | | | | | | | | | | | | | | | | | | | | | | | | | | | | | | | | | | | | | | | | | | | | | | | | | | | |
| Assets | | | 1,772 | | | | 6,363 | | | | 164 | | | | 215 | | | | 68 | | | | 229 | | | | 196 | | | | – | | | | – | | | | – | | | | 243 | | | | 1,535 | | | | 10,785 | |
| Liabilities | | | – | | | | – | | | | – | | | | (129 | ) | | | (340 | ) | | | (91 | ) | | | – | | | | (1,121 | ) | | | (399 | ) | | | (1,080 | ) | | | – | | | | (842 | ) | | | (4,002 | ) |
293
Notes on the Financial Statements(continued)
Presentation of deferred tax balances
Deferred tax balances are presented in the consolidated balance sheet after offsetting asset and liability balances where HSBC has the legal right to set off and intends to settle on a net basis, as follows:
| | | | | | | | | |
| | | 2010 | | | 2009 | |
| | | US$m | | | US$m | |
| | | | | | | | | |
| Deferred tax assets | | | 7,011 | | | | 8,620 | |
| Deferred tax liabilities | | | (1,093 | ) | | | (1,837 | ) |
| | | | | |
| | | | | | | | | |
| | | | 5,918 | | | | 6,783 | |
| | | | | |
Analysis of deferred tax assets by country
| | | | | | | | | |
| | | 2010 | | | 2009 | |
| | | US$m | | | US$m | |
| | | | | | | | | |
| US | | | 4,043 | | | | 5,110 | |
| Brazil | | | 883 | | | | 1,289 | |
| Mexico | | | 665 | | | | 620 | |
| UK | | | 383 | | | | 395 | |
| Other | | | 1,037 | | | | 1,206 | |
| | | | | |
| | | | | | | | | |
| | | | 7,011 | | | | 8,620 | |
| | | | | |
The amount of temporary differences, unused tax losses and unused tax credits excluding the US, for which no deferred tax asset is recognised in the balance sheet is US$2,473m (2009: US$1,723m). Of this amount, US$2,366m (2009: US$1,608m) has no expiry date, US$107m (2009: US$115m) is scheduled to expire within 10 years (2009: 10 years) and the remaining will expire after 10 years. The deferred tax asset unrecognised in respect of these items is US$601m (2009: US$491m), of which US$564m (2009: US$450m) has no expiry date, US$37m (2009: US$40m) is scheduled to expire within 10 years (2009: 10 years) and the remaining will expire after 10 years.
In the US, the deferred tax asset unrecognised in respect of temporary differences, unused tax losses and unused tax credits was US$1,715m (2009: US$1,577m), of which US$70m (2009: US$52m) has no expiry date, US$908m (2009: US$932m) is scheduled to expire within 10 years (2009: 10 years) and the remaining will expire within 20 years.
The US deferred tax assets not recognised of US$1,715m (2009: US$1,577m) comprise unused state losses of US$694m (2009: US$854m), unused federal losses of US$43m (2009: nil), unused tax credits of US$908m (2009: US$716m) and other differences of US$70m (2009: US$7m). The gross temporary difference in respect of the unused state losses is US$12,486m (2009: US$15,517m), the unused federal losses are US$122m (2009: nil), the other differences are US$200m (2009: US$20m), while no gross equivalent is applied to the unused tax credits.
Deferred tax of US$89m (2009: US$94m) has been provided in respect of distributable reserves of associates that, on distribution, would attract withholding tax.
Deferred tax is not recognised in respect of the Group’s investments in subsidiaries and branches where remittance is not contemplated, and for those associates and interests in joint ventures where it has been determined that no additional tax will arise. The aggregate amount of temporary differences associated with investments where no deferred tax liability is recognised is nil (2009: nil; 2008: US$38,443m). Following the change in the UK tax treatment of dividends on 1 July 2009, no UK tax is expected to arise on distributions from group entities and no temporary difference exists except where withholding tax or other foreign tax could arise on the investments. No amount is disclosed for the unrecognised deferred tax or the 2010 and 2009 temporary differences associated with such investments, as it is impracticable to determine the amount of income taxes that would be payable when any temporary differences reverse.
Of the total net deferred tax assets of US$7.0bn at 31 December 2010 (2009: US$8.6bn), US$4.0bn (2009: US$5.1bn) arose in respect of HSBC’s US operations where there has been a recent history of losses. Management’s analysis of the recognition of these deferred tax assets significantly discounts any future expected profits from the US operations and relies to a greater extent on capital support to the US operations from HSBC Holdings plc, including tax planning strategies implemented in relation to such support. Further to the implementation of this strategy, the transfer of HSBC Bank Canada, which was part of the sub-group headed by HSBC North America Holdings Inc., to HSBC Overseas Holdings (UK) Limited in an internal reorganisation on 31 January 2010, provided substantial support for the recoverability of the US deferred tax assets. The associated taxable gain arising in the US operations
294
Notes on the Financial Statements(continued)
reduced the deferred tax assets by US$1.2bn. US legislation enacted on 6 November 2009 allowed for an extended carryback period for certain federal tax net operating losses. This had the effect of crystallising deferred tax assets related to such losses at 31 December 2009 by approximately US$1.6bn. Currently, it has been determined that the US operations primary tax planning strategy, in combination with other tax planning strategies, provides support for the realisation of the net deferred tax assets recorded for the US operations. Such determination is based on HSBC’s business forecasts and assessments as to the most efficient and effective deployment of HSBC capital, most importantly including the length of time such capital will need to be maintained in the US for purposes of the tax planning strategy.
The deferred tax assets relating to HSBC’s Brazil operation is US$0.9bn (2009: US$1.3bn) and the Mexican operation is US$0.7bn (2009: US$0.6bn). On the evidence available, including management projections of income and the state of the Brazilian and Mexican economies, there will be sufficient taxable income generated by the businesses to support these assets.
HSBC Holdings
| | | | | | | | | |
| | | Deferred tax assets/(liabilities) |
| | | 2010 | | | 2009 | |
| | | US$m | | | US$m | |
| | | | | | | | | |
| Temporary differences: | | | | | | | | |
| – short-term timing differences | | | 1 | | | | 1 | |
| – available-for-sale investments | | | (21 | ) | | | (99 | ) |
| – fair valued assets and liabilities | | | 61 | | | | 76 | |
| – share-based payments | | | 16 | | | | 8 | |
| | | | | |
| | | | | | | | | |
| | | | 57 | | | | (14 | ) |
| | | | | |
Dividends to shareholders of the parent company
| | | | | | | | | | | | | | | | | | | | | | | | | | | | | | | | | | | | | |
| | | 2010 | | 2009 | | 2008 |
| | | Per | | | | | | | Settled | | | Per | | | | | | | Settled | | | Per | | | | | | | Settled | |
| | | share | | | Total | | | in scrip | | | share | | | Total | | | in scrip | | | share | | | Total | | | in scrip | |
| | | US$ | | | US$m | | | US$m | | | US$ | | | US$m | | | US$m | | | US$ | | | US$m | | | US$m | |
| | | | | | | | | | | | | | | | | | | | | | | | | | | | | | | | | | | | | |
Dividends declared on ordinary shares | | | | | | | | | | | | | | | | | | | | | | | | | | | | | | | | | | | | |
| In respect of previous year: | | | | | | | | | | | | | | | | | | | | | | | | | | | | | | | | | | | | |
| – fourth interim dividend | | | 0.10 | | | | 1,733 | | | | 838 | | | | 0.10 | | | | 1,210 | | | | 624 | | | | 0.39 | | | | 4,620 | | | | 2,233 | |
| In respect of current year: | | | | | | | | | | | | | | | | | | | | | | | | | | | | | | | | | | | | |
| – first interim dividend | | | 0.08 | | | | 1,394 | | | | 746 | | | | 0.08 | | | | 1,384 | | | | 190 | | | | 0.18 | | | | 2,158 | | | | 256 | |
| – second interim dividend | | | 0.08 | | | | 1,402 | | | | 735 | | | | 0.08 | | | | 1,385 | | | | 696 | | | | 0.18 | | | | 2,166 | | | | 727 | |
| – third interim dividend | | | 0.08 | | | | 1,408 | | | | 205 | | | | 0.08 | | | | 1,391 | | | | 160 | | | | 0.18 | | | | 2,175 | | | | 380 | |
| | | | | | | | | | | | | | | | | | | |
| | | | | | | | | | | | | | | | | | | | | | | | | | | | | | | | | | | | | |
| | | | 0.34 | | | | 5,937 | | | | 2,524 | | | | 0.34 | | | | 5,370 | | | | 1,670 | | | | 0.93 | | | | 11,119 | | | | 3,596 | |
| | | | | | | | | | | | | | | | | | | |
| | | | | | | | | | | | | | | | | | | | | | | | | | | | | | | | | | | | | |
Quarterly dividends on preference shares classified as equity | | | | | | | | | | | | | | | | | | | | | | | | | | | | | | | | | | | | |
| March dividend | | | 15.50 | | | | 22 | | | | | | | | 15.50 | | | | 22 | | | | | | | | 15.50 | | | | 22 | | | | | |
| June dividend | | | 15.50 | | | | 23 | | | | | | | | 15.50 | | | | 23 | | | | | | | | 15.50 | | | | 23 | | | | | |
| September dividend | | | 15.50 | | | | 22 | | | | | | | | 15.50 | | | | 22 | | | | | | | | 15.50 | | | | 22 | | | | | |
| December dividend | | | 15.50 | | | | 23 | | | | | | | | 15.50 | | | | 23 | | | | | | | | 15.50 | | | | 23 | | | | | |
| | | | | | | | | | | | | | | | | | | | | | | | | |
| | | | | | | | | | | | | | | | | | | | | | | | | | | | | | | | | | | | | |
| | | | 62.00 | | | | 90 | | | | | | | | 62.00 | | | | 90 | | | | | | | | 62.00 | | | | 90 | | | | | |
| | | | | | | | | | | | | | | | | | | | | | | | | |
| | | | | | | | | | | | | | | | | | | | | | | | | | | | | | | | | | | | | |
Quarterly coupons on capital securities classified as equity1 | | | | | | | | | | | | | | | | | | | | | | | | | | | | | | | | | | | | |
| January coupon | | | 0.508 | | | | 44 | | | | | | | | 0.508 | | | | 44 | | | | | | | | – | | | | – | | | | | |
| April coupon | | | 0.508 | | | | 45 | | | | | | | | 0.508 | | | | 45 | | | | | | | | – | | | | – | | | | | |
| July coupon | | | 0.508 | | | | 45 | | | | | | | | 0.508 | | | | 45 | | | | | | | | 0.541 | | | | 47 | | | | | |
| September coupon | | | 0.450 | | | | 68 | | | | | | | | – | | | | – | | | | | | | | – | | | | – | | | | | |
| October coupon | | | 0.508 | | | | 45 | | | | | | | | 0.508 | | | | 45 | | | | | | | | 0.508 | | | | 45 | | | | | |
| December coupon | | | 0.500 | | | | 76 | | | | | | | | – | | | | – | | | | | | | | – | | | | – | | | | | |
| | | | | | | | | | | | | | | | | | | | | | | | | |
| | | | | | | | | | | | | | | | | | | | | | | | | | | | | | | | | | | | | |
| | | | 2.982 | | | | 323 | | | | | | | | 2.032 | | | | 179 | | | | | | | | 1.049 | | | | 92 | | | | | |
| | | | | | | | | | | | | | | | | | | | | | | | | |
| | |
| 1 | | HSBC Holdings issued Perpetual Subordinated Capital Securities of US$3,800m in June 2010 and US$2,200m in April 2008, which are classified as equity under IFRSs. |
295
Notes on the Financial Statements(continued)
The Directors declared after the end of the year a fourth interim dividend in respect of the financial year ended 31 December 2010 of US$0.12 per ordinary share, a distribution of approximately US$2,125m. The fourth interim dividend will be payable on 5 May 2011 to holders of record on 17 March 2011 on the Hong Kong Overseas Branch Register and 18 March 2011 on the Principal Register in the UK or the Bermuda Overseas Branch Register. No liability is recorded in the financial statements in respect of the fourth interim dividend for 2010.
On 18 January 2011, HSBC paid a further coupon on the capital securities of US$0.508 per security, a distribution of US$44m. No liability is recorded in the balance sheet at 31 December 2010 in respect of this coupon payment.
Basic earnings per ordinary share was calculated by dividing the profit attributable to ordinary shareholders of the parent company by the weighted average number of ordinary shares outstanding, excluding own shares held. Diluted earnings per ordinary share was calculated by dividing the basic earnings, which require no adjustment for the effects of dilutive potential ordinary shares, by the weighted average number of ordinary shares outstanding, excluding own shares held, plus the weighted average number of ordinary shares that would be issued on conversion of dilutive potential ordinary shares.
Profit attributable to the ordinary shareholders of the parent company
| | | | | | | | | | | | | |
| | | 2010 | | | 2009 | | | 2008 | |
| | | US$m | | | US$m | | | US$m | |
| | | | | | | | | | | | | |
| Profit attributable to shareholders of the parent company | | | 13,159 | | | | 5,834 | | | | 5,728 | |
| Dividend payable on preference shares classified as equity | | | (90 | ) | | | (90 | ) | | | (90 | ) |
| Coupon payable on capital securities classified as equity | | | (323 | ) | | | (179 | ) | | | (92 | ) |
| | | | | | | |
| | | | | | | | | | | | | |
| Profit attributable to the ordinary shareholders of the parent company | | | 12,746 | | | | 5,565 | | | | 5,546 | |
| | | | | | | |
Basic and diluted earnings per share
| | | | | | | | | | | | | | | | | | | | | | | | | | | | | | | | | | | | | |
| | | 2010 | | 2009 | | 2008 |
| | | | | | | Number | | | Per | | | | | | | Number of | | | Per | | | | | | | Number | | | Per | |
| | | Profit | | | of shares | | | share | | | Profit | | | shares | | | share | | | Profit | | | of shares | | | share | |
| | | US$m | | | (millions) | | | US$ | | | US$m | | | (millions) | | | US$ | | | US$m | | | (millions) | | | US$ | |
Basic1 | | | 12,746 | | | | 17,404 | | | | 0.73 | | | | 5,565 | | | | 16,277 | | | | 0.34 | | | | 5,546 | | | | 13,555 | | | | 0.41 | |
| Effect of dilutive potential ordinary shares | | | | | | | 229 | | | | | | | | | | | | 143 | | | | | | | | | | | | 118 | | | | | |
| | | | | | | | | | | | | | | | | | | | | | | | | | | | | | | |
| – Savings-related Share Option Plan | | | | | | | 55 | | | | | | | | | | | | 26 | | | | | | | | | | | | 13 | | | | | |
| – Executive Share Option Scheme | | | | | | | – | | | | | | | | | | | | – | | | | | | | | | | | | 3 | | | | | |
| – Group Share Option Plan | | | | | | | – | | | | | | | | | | | | – | | | | | | | | | | | | 5 | | | | | |
| – Restricted and performance share awards | | | | | | | 174 | | | | | | | | | | | | 117 | | | | | | | | | | | | 95 | | | | | |
| – HSBC France share options | | | | | | | – | | | | | | | | | | | | – | | | | | | | | | | | | 1 | | | | | |
| – HSBC Finance share options | | | | | | | – | | | | | | | | | | | | – | | | | | | | | | | | | 1 | | | | | |
| | | | | | | | | | | | | | | | | | | | | | | | | | | | | | | |
| | | | | | | | | | | | | | | | | | | |
| | | | | | | | | | | | | | | | | | | | | | | | | | | | | | | | | | | | | |
Diluted2 | | | 12,746 | | | | 17,633 | | | | 0.72 | | | | 5,565 | | | | 16,420 | | | | 0.34 | | | | 5,546 | | | | 13,673 | | | | 0.41 | |
| | | | | | | | | | | | | | | | | | | |
| | |
| 1 | | Weighted average number of ordinary shares outstanding. |
| |
| 2 | | Weighted average number of ordinary shares outstanding assuming dilution. |
The weighted average number of dilutive potential ordinary shares excludes 150m employee share options that were anti-dilutive (2009: 214m; 2008: 166m).
HSBC’s operating segments are organised into six geographical regions, Europe, Hong Kong, Rest of Asia-Pacific, Middle East, North America and Latin America. Due to the nature of the Group, HSBC’s chief operating decision-maker regularly reviews operating activity on a number of bases, including by geographical region, customer group and global business and retail businesses by geographical region. The segmental analysis is presented on a geographical basis because, although information is reviewed on a number of bases, capital resources are allocated and performance is assessed primarily by geographical region. Also, the economic conditions of each geographical region are highly influential in determining the performance of the different businesses carried out in each region. As a result, provision of segmental information on a geographical basis provides the most meaningful basis from which
296
Notes on the Financial Statements(continued)
to assess performance. HSBC’s chief operating decision-maker is the Group Management Board which operates as a general management committee under the direct authority of the Board.
Geographical information is classified by the location of the principal operations of the subsidiary or, for The Hongkong and Shanghai Banking Corporation, HSBC Bank, HSBC Bank Middle East and HSBC Bank USA, by the location of the branch responsible for reporting the results or advancing the funds.
Information provided to HSBC’s chief operating decision-maker to make decisions about allocating resources to, and assessing the performance of, operating segments is measured in accordance with IFRSs. The financial information shown below includes the effects of intra-HSBC transactions between operating segments which are conducted on an arm’s length basis and eliminated in a separate column. Shared costs are included in operating segments on the basis of the actual recharges made.
HSBC provides a comprehensive range of banking and related financial services to its customers in its six geographical regions. The products and services offered to customers are organised by customer group and global business.
| • | | Personal Financial Services offers a broad range of products and services to meet the personal banking, consumer finance and wealth management needs of individual customers. Personal banking products typically include current and savings accounts, mortgages and personal loans, credit cards, debit cards, insurance, wealth management and local and international payment services. |
| |
| • | | Commercial Banking product offerings include the provision of financing services, payments and cash management, international trade finance, treasury and capital markets, commercial cards, insurance, and online and direct banking offerings. |
| |
| • | | Global Banking and Markets provides tailored financial solutions to major government, corporate and institutional clients and private investors worldwide. The client-focused business lines deliver a full range of banking capabilities including financing, advisory and transaction services; a markets business that provides services in credit, rates, foreign exchange, money markets and securities services; global asset management services and principal investment activities. |
| |
| • | | Global Private Banking provides a range of services to meet the banking, investment and wealth advisory needs of high net worth individuals. |
In the following segmental analysis, the benefit of shareholders’ funds impacts the analysis only to the extent that these funds are actually allocated to businesses in the segment by way of intra-HSBC capital and funding structures.
297
Notes on the Financial Statements(continued)
Profit/(loss) for the year
| | | | | | | | | | | | | | | | | | | | | | | | | | | | | | | | | |
| | | 2010 | |
| | | | | | | | | | | Rest of | | | | | | | | | | | | | | | Intra- | | | | |
| | | | | | | Hong | | | Asia- | | | Middle | | | North | | | Latin | | | HSBC | | | | |
| | | Europe | | | Kong | | | Pacific | | | East | | | America | | | America | | | items | | | Total | |
| | | US$m | | | US$m | | | US$m | | | US$m | | | US$m | | | US$m | | | US$m | | | US$m | |
| | | | | | | | | | | | | | | | | | | | | | | | | | | | | | | | | |
| | | | | | | | | | | | | | | | | |
| Interest income | | | 17,550 | | | | 5,102 | | | | 6,432 | | | | 2,003 | | | | 16,781 | | | | 11,590 | | | | (1,113 | ) | | | 58,345 | |
| Interest expense | | | (6,300 | ) | | | (856 | ) | | | (2,604 | ) | | | (636 | ) | | | (4,342 | ) | | | (5,279 | ) | | | 1,113 | | | | (18,904 | ) |
| | | | | | | | | | | | | | | | | |
| | | | | | | | | | | | | | | | | | | | | | | | | | | | | | | | | |
| Net interest income | | | 11,250 | | | | 4,246 | | | | 3,828 | | | | 1,367 | | | | 12,439 | | | | 6,311 | | | | – | | | | 39,441 | |
| | | | | | | | | | | | | | | | | | | | | | | | | | | | | | | | | |
| | | | | | | | | | | | | | | | | |
| Fee income | | | 8,334 | | | | 3,460 | | | | 2,399 | | | | 737 | | | | 4,524 | | | | 2,366 | | | | (703 | ) | | | 21,117 | |
| Fee expense | | | (1,963 | ) | | | (498 | ) | | | (467 | ) | | | (60 | ) | | | (860 | ) | | | (617 | ) | | | 703 | | | | (3,762 | ) |
| | | | | | | | | | | | | | | | | |
| | | | | | | | | | | | | | | | | | | | | | | | | | | | | | | | | |
| Net fee income | | | 6,371 | | | | 2,962 | | | | 1,932 | | | | 677 | | | | 3,664 | | | | 1,749 | | | | – | | | | 17,355 | |
| | | | | | | | | | | | | | | | | | | | | | | | | | | | | | | | | |
| | | | | | | | | | | | | | | | | |
| Trading income excluding net interest income | | | 1,461 | | | | 1,107 | | | | 1,207 | | | | 343 | | | | 109 | | | | 453 | | | | – | | | | 4,680 | |
| Net interest income on trading activities | | | 1,402 | | | | 205 | | | | 411 | | | | 27 | | | | 205 | | | | 280 | | | | – | | | | 2,530 | |
| | | | | | | | | | | | | | | | | |
| | | | | | | | | | | | | | | | | | | | | | | | | | | | | | | | | |
| Net trading income | | | 2,863 | | | | 1,312 | | | | 1,618 | | | | 370 | | | | 314 | | | | 733 | | | | – | | | | 7,210 | |
| | | | | | | | | | | | | | | | | | | | | | | | | | | | | | | | | |
| | | | | | | | | | | | | | | | | |
| Changes in fair value of long- term debt issued and related derivatives | | | (365 | ) | | | (2 | ) | | | (2 | ) | | | – | | | | 111 | | | | – | | | | – | | | | (258 | ) |
| Net income from other financial instruments designated at fair value | | | 647 | | | | 380 | | | | 26 | | | | – | | | | – | | | | 425 | | | | – | | | | 1,478 | |
| | | | | | | | | | | | | | | | | |
| | | | | | | | | | | | | | | | | | | | | | | | | | | | | | | | | |
| Net income from financial instruments designated at fair value | | | 282 | | | | 378 | | | | 24 | | | | – | | | | 111 | | | | 425 | | | | – | | | | 1,220 | |
| Gains less losses from financial investments | | | 486 | | | | 98 | | | | 146 | | | | (3 | ) | | | 143 | | | | 98 | | | | – | | | | 968 | |
| Dividend income | | | 20 | | | | 30 | | | | 1 | | | | 7 | | | | 42 | | | | 12 | | | | – | | | | 112 | |
| Net earned insurance premiums | | | 4,067 | | | | 4,332 | | | | 448 | | | | – | | | | 245 | | | | 2,054 | | | | – | | | | 11,146 | |
| Other operating income/(expense) | | | 2,117 | | | | 1,606 | | | | 1,598 | | | | (8 | ) | | | 233 | | | | 141 | | | | (3,125 | ) | | | 2,562 | |
| | | | | | | | | | | | | | | | | |
| | | | | | | | | | | | | | | | | | | | | | | | | | | | | | | | | |
Total operating income | | | 27,456 | | | | 14,964 | | | | 9,595 | | | | 2,410 | | | | 17,191 | | | | 11,523 | | | | (3,125 | ) | | | 80,014 | |
| | | | | | | | | | | | | | | | | | | | | | | | | | | | | | | | | |
| Net insurance claims incurred and movement in liabilities to policyholders | | | (4,706 | ) | | | (4,762 | ) | | | (363 | ) | | | – | | | | (144 | ) | | | (1,792 | ) | | | – | | | | (11,767 | ) |
| | | | | | | | | | | | | | | | | |
| | | | | | | | | | | | | | | | | | | | | | | | | | | | | | | | | |
Net operating income before loan impairment charges and other credit risk provisions | | | 22,750 | | | | 10,202 | | | | 9,232 | | | | 2,410 | | | | 17,047 | | | | 9,731 | | | | (3,125 | ) | | | 68,247 | |
| | | | | | | | | | | | | | | | | | | | | | | | | | | | | | | | | |
| Loan impairment charges and other credit risk provisions | | | (3,020 | ) | | | (114 | ) | | | (439 | ) | | | (627 | ) | | | (8,295 | ) | | | (1,544 | ) | | | – | | | | (14,039 | ) |
| | | | | | | | | | | | | | | | | |
| | | | | | | | | | | | | | | | | | | | | | | | | | | | | | | | | |
Net operating income | | | 19,730 | | | | 10,088 | | | | 8,793 | | | | 1,783 | | | | 8,752 | | | | 8,187 | | | | (3,125 | ) | | | 54,208 | |
| | | | | | | | | | | | | | | | | | | | | | | | | | | | | | | | | |
| | | | | | | | | | | | | | | | | |
| Employee compensation and benefits | | | (7,875 | ) | | | (2,341 | ) | | | (2,719 | ) | | | (579 | ) | | | (3,672 | ) | | | (2,650 | ) | | | – | | | | (19,836 | ) |
| General and administrative expenses | | | (6,499 | ) | | | (1,686 | ) | | | (2,181 | ) | | | (450 | ) | | | (4,179 | ) | | | (3,286 | ) | | | 3,125 | | | | (15,156 | ) |
| Depreciation and impairment of property, plant and equipment | | | (719 | ) | | | (237 | ) | | | (189 | ) | | | (42 | ) | | | (288 | ) | | | (238 | ) | | | – | | | | (1,713 | ) |
| Amortisation and impairment of intangible assets | | | (352 | ) | | | (167 | ) | | | (54 | ) | | | (7 | ) | | | (183 | ) | | | (220 | ) | | | – | | | | (983 | ) |
| | | | | | | | | | | | | | | | | |
| | | | | | | | | | | | | | | | | | | | | | | | | | | | | | | | | |
Total operating expenses | | | (15,445 | ) | | | (4,431 | ) | | | (5,143 | ) | | | (1,078 | ) | | | (8,322 | ) | | | (6,394 | ) | | | 3,125 | | | | (37,688 | ) |
| | | | | | | | | | | | | | | | | |
| | | | | | | | | | | | | | | | | | | | | | | | | | | | | | | | | |
Operating profit | | | 4,285 | | | | 5,657 | | | | 3,650 | | | | 705 | | | | 430 | | | | 1,793 | | | | – | | | | 16,520 | |
| | | | | | | | | | | | | | | | | | | | | | | | | | | | | | | | | |
| Share of profit in associates and joint ventures | | | 17 | | | | 35 | | | | 2,252 | | | | 187 | | | | 24 | | | | 2 | | | | – | | | | 2,517 | |
| | | | | | | | | | | | | | | | | |
| | | | | | | | | | | | | | | | | | | | | | | | | | | | | | | | | |
Profit before tax | | | 4,302 | | | | 5,692 | | | | 5,902 | | | | 892 | | | | 454 | | | | 1,795 | | | | – | | | | 19,037 | |
| | | | | | | | | | | | | | | | | | | | | | | | | | | | | | | | | |
| Tax expense | | | (1,006 | ) | | | (987 | ) | | | (962 | ) | | | (138 | ) | | | (1,180 | ) | | | (573 | ) | | | – | | | | (4,846 | ) |
| | | | | | | | | | | | | | | | | |
| | | | | | | | | | | | | | | | | | | | | | | | | | | | | | | | | |
Profit/(loss) for the year | | | 3,296 | | | | 4,705 | | | | 4,940 | | | | 754 | | | | (726 | ) | | | 1,222 | | | | – | | | | 14,191 | |
| | | | | | | | | | | | | | | | | |
298
Notes on the Financial Statements(continued)
| | | | | | | | | | | | | | | | | | | | | | | | | | | | | | | | | |
| | | 2009 | |
| | | | | | | | | | | Rest of | | | | | | | | | | | | | | | Intra- | | | | |
| | | | | | | Hong | | | Asia- | | | Middle | | | North | | | Latin | | | HSBC | | | | |
| | | Europe | | | Kong | | | Pacific | | | East | | | America | | | America | | | items | | | Total | |
| | | US$m | | | US$m | | | US$m | | | US$m | | | US$m | | | US$m | | | US$m | | | US$m | |
| | | | | | | | | | | | | | | | | | | | | | | | | | | | | | | | | |
| | | | | | | | | | | | | | | | | |
| Interest income | | | 20,283 | | | | 5,327 | | | | 5,877 | | | | 2,260 | | | | 19,526 | | | | 10,091 | | | | (1,268 | ) | | | 62,096 | |
| Interest expense | | | (8,015 | ) | | | (1,132 | ) | | | (2,338 | ) | | | (775 | ) | | | (5,856 | ) | | | (4,518 | ) | | | 1,268 | | | | (21,366 | ) |
| | | | | | | | | | | | | | | | | |
| | | | | | | | | | | | | | | | | | | | | | | | | | | | | | | | | |
| Net interest income | | | 12,268 | | | | 4,195 | | | | 3,539 | | | | 1,485 | | | | 13,670 | | | | 5,573 | | | | – | | | | 40,730 | |
| | | | | | | | | | | | | | | | | | | | | | | | | | | | | | | | | |
| | | | | | | | | | | | | | | | | |
| Fee income | | | 8,576 | | | | 3,099 | | | | 1,972 | | | | 682 | | | | 5,496 | | | | 2,230 | | | | (652 | ) | | | 21,403 | |
| Fee expense | | | (2,309 | ) | | | (430 | ) | | | (415 | ) | | | (57 | ) | | | (679 | ) | | | (501 | ) | | | 652 | | | | (3,739 | ) |
| | | | | | | | | | | | | | | | | |
| | | | | | | | | | | | | | | | | | | | | | | | | | | | | | | | | |
| Net fee income | | | 6,267 | | | | 2,669 | | | | 1,557 | | | | 625 | | | | 4,817 | | | | 1,729 | | | | – | | | | 17,664 | |
| | | | | | | | | | | | | | | | | | | | | | | | | | | | | | | | | |
| | | | | | | | | | | | | | | | | |
| Trading income excluding net interest income | | | 2,861 | | | | 1,068 | | | | 1,264 | | | | 369 | | | | 35 | | | | 639 | | | | – | | | | 6,236 | |
| Net interest income on trading activities | | | 2,598 | | | | 157 | | | | 342 | | | | 25 | | | | 296 | | | | 209 | | | | – | | | | 3,627 | |
| | | | | | | | | | | | | | | | | |
| | | | | | | | | | | | | | | | | | | | | | | | | | | | | | | | | |
| Net trading income | | | 5,459 | | | | 1,225 | | | | 1,606 | | | | 394 | | | | 331 | | | | 848 | | | | – | | | | 9,863 | |
| | | | | | | | | | | | | | | | | | | | | | | | | | | | | | | | | |
| | | | | | | | | | | | | | | | | |
| Changes in fair value of long- term debt issued and related derivatives | | | (2,746 | ) | | | (3 | ) | | | (1 | ) | | | – | | | | (3,497 | ) | | | – | | | | – | | | | (6,247 | ) |
| Net income from other financial instruments designated at fair value | | | 1,321 | | | | 788 | | | | 111 | | | | – | | | | 1 | | | | 495 | | | | – | | | | 2,716 | |
| | | | | | | | | | | | | | | | | |
| | | | | | | | | | | | | | | | | | | | | | | | | | | | | | | | | |
| Net income/(expense) from financial instruments designated at fair value | | | (1,425 | ) | | | 785 | | | | 110 | | | | – | | | | (3,496 | ) | | | 495 | | | | – | | | | (3,531 | ) |
| Gains less losses from financial investments | | | 50 | | | | 9 | | | | (19 | ) | | | 16 | | | | 296 | | | | 168 | | | | – | | | | 520 | |
| Dividend income | | | 29 | | | | 28 | | | | 2 | | | | 3 | | | | 53 | | | | 11 | | | | – | | | | 126 | |
| Net earned insurance premiums | | | 4,223 | | | | 3,674 | | | | 365 | | | | – | | | | 309 | | | | 1,900 | | | | – | | | | 10,471 | |
| Other operating income | | | 2,262 | | | | 1,274 | | | | 1,238 | | | | 71 | | | | 566 | | | | 133 | | | | (2,756 | ) | | | 2,788 | |
| | | | | | | | | | | | | | | | | |
| | | | | | | | | | | | | | | | | | | | | | | | | | | | | | | | | |
| Total operating income | | | 29,133 | | | | 13,859 | | | | 8,398 | | | | 2,594 | | | | 16,546 | | | | 10,857 | | | | (2,756 | ) | | | 78,631 | |
| | | | | | | | | | | | | | | | | | | | | | | | | | | | | | | | | |
| Net insurance claims incurred and movement in liabilities to policyholders | | | (5,589 | ) | | | (4,392 | ) | | | (395 | ) | | | – | | | | (241 | ) | | | (1,833 | ) | | | – | | | | (12,450 | ) |
| | | | | | | | | | | | | | | | | |
| | | | | | | | | | | | | | | | | | | | | | | | | | | | | | | | | |
| Net operating income before loan impairment charges and other credit risk provisions | | | 23,544 | | | | 9,467 | | | | 8,003 | | | | 2,594 | | | | 16,305 | | | | 9,024 | | | | (2,756 | ) | | | 66,181 | |
| | | | | | | | | | | | | | | | | | | | | | | | | | | | | | | | | |
| Loan impairment charges and other credit risk provisions | | | (5,568 | ) | | | (500 | ) | | | (896 | ) | | | (1,334 | ) | | | (15,664 | ) | | | (2,526 | ) | | | – | | | | (26,488 | ) |
| | | | | | | | | | | | | | | | | |
| | | | | | | | | | | | | | | | | | | | | | | | | | | | | | | | | |
| Net operating income | | | 17,976 | | | | 8,967 | | | | 7,107 | | | | 1,260 | | | | 641 | | | | 6,498 | | | | (2,756 | ) | | | 39,693 | |
| | | | | | | | | | | | | | | | | | | | | | | | | | | | | | | | | |
| | | | | | | | | | | | | | | | | |
| Employee compensation and benefits | | | (7,174 | ) | | | (2,102 | ) | | | (2,363 | ) | | | (545 | ) | | | (4,085 | ) | | | (2,199 | ) | | | – | | | | (18,468 | ) |
| General and administrative expenses | | | (5,775 | ) | | | (1,502 | ) | | | (1,872 | ) | | | (419 | ) | | | (3,794 | ) | | | (2,786 | ) | | | 2,756 | | | | (13,392 | ) |
| Depreciation and impairment of property, plant and equipment | | | (762 | ) | | | (224 | ) | | | (172 | ) | | | (31 | ) | | | (329 | ) | | | (207 | ) | | | – | | | | (1,725 | ) |
| Amortisation and impairment of intangible assets | | | (277 | ) | | | (118 | ) | | | (43 | ) | | | (6 | ) | | | (183 | ) | | | (183 | ) | | | – | | | | (810 | ) |
| | | | | | | | | | | | | | | | | |
| | | | | | | | | | | | | | | | | | | | | | | | | | | | | | | | | |
| Total operating expenses | | | (13,988 | ) | | | (3,946 | ) | | | (4,450 | ) | | | (1,001 | ) | | | (8,391 | ) | | | (5,375 | ) | | | 2,756 | | | | (34,395 | ) |
| | | | | | | | | | | | | | | | | |
| | | | | | | | | | | | | | | | | | | | | | | | | | | | | | | | | |
| Operating profit/(loss) | | | 3,988 | | | | 5,021 | | | | 2,657 | | | | 259 | | | | (7,750 | ) | | | 1,123 | | | | – | | | | 5,298 | |
| | | | | | | | | | | | | | | | | | | | | | | | | | | | | | | | | |
| Share of profit in associates and joint ventures | | | 21 | | | | 8 | | | | 1,543 | | | | 196 | | | | 12 | | | | 1 | | | | – | | | | 1,781 | |
| | | | | | | | | | | | | | | | | |
| | | | | | | | | | | | | | | | | | | | | | | | | | | | | | | | | |
| Profit/(loss) before tax | | | 4,009 | | | | 5,029 | | | | 4,200 | | | | 455 | | | | (7,738 | ) | | | 1,124 | | | | – | | | | 7,079 | |
| | | | | | | | | | | | | | | | | | | | | | | | | | | | | | | | | |
| Tax income/(expense) | | | (776 | ) | | | (869 | ) | | | (753 | ) | | | (94 | ) | | | 2,285 | | | | (178 | ) | | | – | | | | (385 | ) |
| | | | | | | | | | | | | | | | | |
| | | | | | | | | | | | | | | | | | | | | | | | | | | | | | | | | |
| Profit/(loss) for the year | | | 3,233 | | | | 4,160 | | | | 3,447 | | | | 361 | | | | (5,453 | ) | | | 946 | | | | – | | | | 6,694 | |
| | | | | | | | | | | | | | | | | |
299
Notes on the Financial Statements(continued)
Profit/(loss) for the year (continued)
| | | | | | | | | | | | | | | | | | | | | | | | | | | | | | | | | |
| | | 2008 | |
| | | | | | | | | | | Rest of | | | | | | | | | | | | | | | Intra- | | | | |
| | | | | | | Hong | | | Asia- | | | Middle | | | North | | | Latin | | | HSBC | | | | |
| | | Europe | | | Kong | | | Pacific | | | East | | | America | | | America | | | items | | | Total | |
| | | US$m | | | US$m | | | US$m | | | US$m | | | US$m | | | US$m | | | US$m | | | US$m | |
| | | | | | | | | | | | | | | | | | | | | | | | | | | | | | | | | |
| | | | | | | | | | | | | | | | | |
| Interest income | | | 35,117 | | | | 9,530 | | | | 9,066 | | | | 2,451 | | | | 25,897 | | | | 11,632 | | | | (2,392 | ) | | | 91,301 | |
| Interest expense | | | (25,421 | ) | | | (3,832 | ) | | | (5,129 | ) | | | (895 | ) | | | (10,679 | ) | | | (5,174 | ) | | | 2,392 | | | | (48,738 | ) |
| | | | | | | | | | | | | | | | | |
| | | | | | | | | | | | | | | | | | | | | | | | | | | | | | | | | |
| Net interest income | | | 9,696 | | | | 5,698 | | | | 3,937 | | | | 1,556 | | | | 15,218 | | | | 6,458 | | | | – | | | | 42,563 | |
| | | | | | | | | | | | | | | | | | | | | | | | | | | | | | | | | |
| | | | | | | | | | | | | | | | | |
| Fee income | | | 10,225 | | | | 3,062 | | | | 2,414 | | | | 740 | | | | 6,292 | | | | 2,716 | | | | (685 | ) | | | 24,764 | |
| Fee expense | | | (2,733 | ) | | | (482 | ) | | | (547 | ) | | | (49 | ) | | | (1,065 | ) | | | (549 | ) | | | 685 | | | | (4,740 | ) |
| | | | | | | | | | | | | | | | | |
| | | | | | | | | | | | | | | | | | | | | | | | | | | | | | | | | |
| Net fee income | | | 7,492 | | | | 2,580 | | | | 1,867 | | | | 691 | | | | 5,227 | | | | 2,167 | | | | – | | | | 20,024 | |
| | | | | | | | | | | | | | | | | | | | | | | | | | | | | | | | | |
| | | | | | | | | | | | | | | | | |
| Trading income/(expense) excluding net interest income | | | 1,691 | | | | 856 | | | | 1,443 | | | | 380 | | | | (3,879 | ) | | | 356 | | | | – | | | | 847 | |
| Net interest income on trading activities | | | 3,666 | | | | 337 | | | | 599 | | | | 22 | | | | 744 | | | | 345 | | | | – | | | | 5,713 | |
| | | | | | | | | | | | | | | | | |
| | | | | | | | | | | | | | | | | | | | | | | | | | | | | | | | | |
| Net trading income/(expense) | | | 5,357 | | | | 1,193 | | | | 2,042 | | | | 402 | | | | (3,135 | ) | | | 701 | | | | – | | | | 6,560 | |
| | | | | | | | | | | | | | | | | | | | | | | | | | | | | | | | | |
| | | | | | | | | | | | | | | | | |
| Changes in fair value of long-term debt issued and related derivatives | | | 2,939 | | | | 3 | | | | 1 | | | | – | | | | 3,736 | | | | – | | | | – | | | | 6,679 | |
| Net income/(expense) from other financial instruments designated at fair value | | | (1,826 | ) | | | (1,194 | ) | | | (172 | ) | | | – | | | | 1 | | | | 364 | | | | – | | | | (2,827 | ) |
| | | | | | | | | | | | | | | | | |
| | | | | | | | | | | | | | | | | | | | | | | | | | | | | | | | | |
| Net income/(expense) from financial instruments designated at fair value | | | 1,113 | | | | (1,191 | ) | | | (171 | ) | | | – | | | | 3,737 | | | | 364 | | | | – | | | | 3,852 | |
| Gains less losses from financial investments | | | 418 | | | | (309 | ) | | | 24 | | | | 8 | | | | (120 | ) | | | 176 | | | | – | | | | 197 | |
| Dividend income | | | 130 | | | | 41 | | | | 2 | | | | 2 | | | | 77 | | | | 20 | | | | – | | | | 272 | |
| Net earned insurance premiums | | | 5,299 | | | | 3,247 | | | | 197 | | | | – | | | | 390 | | | | 1,717 | | | | – | | | | 10,850 | |
| Gains on disposal of French regional banks | | | 2,445 | | | | – | | | | – | | | | – | | | | – | | | | – | | | | – | | | | 2,445 | |
| Other operating income | | | 2,096 | | | | 817 | | | | 1,055 | | | | 9 | | | | 23 | | | | 300 | | | | (2,492 | ) | | | 1,808 | |
| | | | | | | | | | | | | | | | | |
| | | | | | | | | | | | | | | | | | | | | | | | | | | | | | | | | |
| Total operating income | | | 34,046 | | | | 12,076 | | | | 8,953 | | | | 2,668 | | | | 21,417 | | | | 11,903 | | | | (2,492 | ) | | | 88,571 | |
| | | | | | | | | | | | | | | | | | | | | | | | | | | | | | | | | |
| Net insurance claims incurred and movement in liabilities to policyholders | | | (3,367 | ) | | | (1,922 | ) | | | 28 | | | | – | | | | (238 | ) | | | (1,390 | ) | | | – | | | | (6,889 | ) |
| | | | | | | | | | | | | | | | | |
| | | | | | | | | | | | | | | | | | | | | | | | | | | | | | | | | |
| Net operating income before loan impairment charges and other credit risk provisions | | | 30,679 | | | | 10,154 | | | | 8,981 | | | | 2,668 | | | | 21,179 | | | | 10,513 | | | | (2,492 | ) | | | 81,682 | |
| | | | | | | | | | | | | | | | | | | | | | | | | | | | | | | | | |
| Loan impairment charges and other credit risk provisions | | | (3,754 | ) | | | (765 | ) | | | (852 | ) | | | (279 | ) | | | (16,795 | ) | | | (2,492 | ) | | | – | | | | (24,937 | ) |
| | | | | | | | | | | | | | | | | |
| | | | | | | | | | | | | | | | | | | | | | | | | | | | | | | | | |
| Net operating income | | | 26,925 | | | | 9,389 | | | | 8,129 | | | | 2,389 | | | | 4,384 | | | | 8,021 | | | | (2,492 | ) | | | 56,745 | |
| | | | | | | | | | | | | | | | | | | | | | | | | | | | | | | | | |
| | | | | | | | | | | | | | | | | |
| Employee compensation and benefits | | | (8,551 | ) | | | (2,069 | ) | | | (2,475 | ) | | | (544 | ) | | | (4,609 | ) | | | (2,544 | ) | | | – | | | | (20,792 | ) |
| General and administrative expenses | | | (6,428 | ) | | | (1,562 | ) | | | (2,037 | ) | | | (384 | ) | | | (4,282 | ) | | | (3,059 | ) | | | 2,492 | | | | (15,260 | ) |
| Depreciation and impairment of property, plant and equipment | | | (865 | ) | | | (209 | ) | | | (163 | ) | | | (25 | ) | | | (265 | ) | | | (223 | ) | | | – | | | | (1,750 | ) |
| Amortisation and impairment of intangible assets | | | (228 | ) | | | (103 | ) | | | (29 | ) | | | (6 | ) | | | (203 | ) | | | (164 | ) | | | – | | | | (733 | ) |
| Goodwill impairment | | | – | | | | – | | | | – | | | | – | | | | (10,564 | ) | | | – | | | | – | | | | (10,564 | ) |
| | | | | | | | | | | | | | | | | |
| | | | | | | | | | | | | | | | | | | | | | | | | | | | | | | | | |
| Total operating expenses | | | (16,072 | ) | | | (3,943 | ) | | | (4,704 | ) | | | (959 | ) | | | (19,923 | ) | | | (5,990 | ) | | | 2,492 | | | | (49,099 | ) |
| | | | | | | | | | | | | | | | | |
| | | | | | | | | | | | | | | | | | | | | | | | | | | | | | | | | |
| Operating profit/(loss) | | | 10,853 | | | | 5,446 | | | | 3,425 | | | | 1,430 | | | | (15,539 | ) | | | 2,031 | | | | – | | | | 7,646 | |
| | | | | | | | | | | | | | | | | | | | | | | | | | | | | | | | | |
| Share of profit in associates and joint ventures | | | 16 | | | | 15 | | | | 1,297 | | | | 316 | | | | 11 | | | | 6 | | | | – | | | | 1,661 | |
| | | | | | | | | | | | | | | | | |
| | | | | | | | | | | | | | | | | | | | | | | | | | | | | | | | | |
| Profit/(loss) before tax | | | 10,869 | | | | 5,461 | | | | 4,722 | | | | 1,746 | | | | (15,528 | ) | | | 2,037 | | | | – | | | | 9,307 | |
| | | | | | | | | | | | | | | | | | | | | | | | | | | | | | | | | |
| Tax income/(expense) | | | (2,199 | ) | | | (899 | ) | | | (928 | ) | | | (245 | ) | | | 1,715 | | | | (253 | ) | | | – | | | | (2,809 | ) |
| | | | | | | | | | | | | | | | | |
| | | | | | | | | | | | | | | | | | | | | | | | | | | | | | | | | |
| Profit/(loss) for the year | | | 8,670 | | | | 4,562 | | | | 3,794 | | | | 1,501 | | | | (13,813 | ) | | | 1,784 | | | | – | | | | 6,498 | |
| | | | | | | | | | | | | | | | | |
300
Notes on the Financial Statements(continued)
Other information about the profit/(loss) for the year
| | | | | | | | | | | | | | | | | | | | | | | | | | | | | | | | | |
| | | | | | | | | | | Rest of | | | | | | | | | | | | | | | Intra- | | | | |
| | | | | | | Hong | | | Asia- | | | Middle | | | North | | | Latin | | | HSBC | | | | |
| | | Europe | | | Kong | | | Pacific | | | East | | | America | | | America | | | items | | | Total | |
| | | US$m | | | US$m | | | US$m | | | US$m | | | US$m | | | US$m | | | US$m | | | US$m | |
2010 | | | | | | | | | | | | | | | | | | | | | | | | | | | | | | | | |
| Net operating income | | | 19,730 | | | | 10,088 | | | | 8,793 | | | | 1,783 | | | | 8,752 | | | | 8,187 | | | | (3,125 | ) | | | 54,208 | |
| | | | | | | | | | | | | | | | | |
| External | | | 18,881 | | | | 9,170 | | | | 7,728 | | | | 1,774 | | | | 8,504 | | | | 8,151 | | | | – | | | | 54,208 | |
| Inter-segment | | | 849 | | | | 918 | | | | 1,065 | | | | 9 | | | | 248 | | | | 36 | | | | (3,125 | ) | | | – | |
| | | | | | | | | | | | | | | | | |
| | | | | | | | | | | | | | | | | | | | | | | | | | | | | | | | | |
| Profit/(loss) for the year includes the following significant non-cash items: | | | | | | | | | | | | | | | | | | | | | | | | | | | | | | | | |
| Depreciation, amortisation and impairment | | | 1,071 | | | | 404 | | | | 243 | | | | 49 | | | | 471 | | | | 458 | | | | – | | | | 2,696 | |
| Loan impairment losses gross of recoveries and other credit risk provisions | | | 3,303 | | | | 169 | | | | 615 | | | | 684 | | | | 8,476 | | | | 1,812 | | | | – | | | | 15,059 | |
| Impairment of financial investments | | | 35 | | | | 41 | | | | 4 | | | | 5 | | | | 21 | | | | 1 | | | | – | | | | 107 | |
| | | | | | | | | | | | | | | | | | | | | | | | | | | | | | | | | |
| 2009 | | | | | | | | | | | | | | | | | | | | | | | | | | | | | | | | |
| Net operating income | | | 17,976 | | | | 8,967 | | | | 7,107 | | | | 1,260 | | | | 641 | | | | 6,498 | | | | (2,756 | ) | | | 39,693 | |
| | | | | | | | | | | | | | | | | |
| External | | | 16,734 | | | | 8,352 | | | | 6,056 | | | | 1,283 | | | | 767 | | | | 6,501 | | | | – | | | | 39,693 | |
| Inter-segment | | | 1,242 | | | | 615 | | | | 1,051 | | | | (23 | ) | | | (126 | ) | | | (3 | ) | | | (2,756 | ) | | | – | |
| | | | | | | | | | | | | | | | | |
| | | | | | | | | | | | | | | | | | | | | | | | | | | | | | | | | |
| Profit/(loss) for the year includes the following significant non-cash items: | | | | | | | | | | | | | | | | | | | | | | | | | | | | | | | | |
| Depreciation, amortisation and impairment | | | 1,039 | | | | 342 | | | | 215 | �� | | | 37 | | | | 515 | | | | 390 | | | | – | | | | 2,538 | |
| Loan impairment losses gross of recoveries and other credit risk provisions | | | 5,833 | | | | 534 | | | | 1,028 | | | | 1,361 | | | | 15,757 | | | | 2,865 | | | | – | | | | 27,378 | |
| Impairment of financial investments | | | 137 | | | | 129 | | | | 50 | | | | 4 | | | | 38 | | | | – | | | | – | | | | 358 | |
| | | | | | | | | | | | | | | | | | | | | | | | | | | | | | | | | |
| 2008 | | | | | | | | | | | | | | | | | | | | | | | | | | | | | | | | |
| Net operating income | | | 26,925 | | | | 9,389 | | | | 8,129 | | | | 2,389 | | | | 4,384 | | | | 8,021 | | | | (2,492 | ) | | | 56,745 | |
| | | | | | | | | | | | | | | | | |
| External | | | 25,887 | | | | 8,205 | | | | 7,010 | | | | 2,386 | | | | 5,236 | | | | 8,021 | | | | – | | | | 56,745 | |
| Inter-segment | | | 1,038 | | | | 1,184 | | | | 1,119 | | | | 3 | | | | (852 | ) | | | – | | | | (2,492 | ) | | | – | |
| | | | | | | | | | | | | | | | | |
| | | | | | | | | | | | | | | | | | | | | | | | | | | | | | | | | |
| Profit/(loss) for the year includes the following significant non-cash items: | | | | | | | | | | | | | | | | | | | | | | | | | | | | | | | | |
| Depreciation, amortisation and impairment | | | 1,093 | | | | 312 | | | | 192 | | | | 31 | | | | 11,352 | | | | 387 | | | | – | | | | 13,367 | |
| Loan impairment losses gross of recoveries and other credit risk provisions | | | 4,050 | | | | 803 | | | | 960 | | | | 309 | | | | 16,892 | | | | 2,757 | | | | – | | | | 25,771 | |
| Impairment of financial investments | | | 278 | | | | 535 | | | | – | | | | – | | | | 229 | | | | – | | | | – | | | | 1,042 | |
301
Notes on the Financial Statements(continued)
Performance ratios
| | | | | | | | | | | | | | | | | | | | | | | | | | | | | | | | | |
| | | | | | | | | | | Rest of | | | | | | | | | | | | | | | | | |
| | | | | | | Hong | | | Asia- | | | Middle | | | North | | | Latin | | | | | | | | |
| | | Europe | | | Kong | | | Pacific | | | East | | | America | | | America | | | | | | | Total | |
| | | % | | | % | | | % | | | % | | | % | | | % | | | | | | | % | |
2010 | | | | | | | | | | | | | | | | | | | | | | | | | | | | | | | | |
| Share of HSBC’s profit before tax | | | 22.6 | | | | 29.9 | | | | 31.0 | | | | 4.7 | | | | 2.4 | | | | 9.4 | | | | | | | | 100.0 | |
| Cost efficiency ratio | | | 67.9 | | | | 43.4 | | | | 55.7 | | | | 44.7 | | | | 48.8 | | | | 65.7 | | | | | | | | 55.2 | |
| | | | | | | | | | | | | | | | | | | | | | | | | | | | | | | | | |
| 2009 | | | | | | | | | | | | | | | | | | | | | | | | | | | | | | | | |
| Share of HSBC’s profit/(loss) before tax | | | 56.7 | | | | 71.0 | | | | 59.3 | | | | 6.4 | | | | (109.3 | ) | | | 15.9 | | | | | | | | 100.0 | |
| Cost efficiency ratio | | | 59.4 | | | | 41.7 | | | | 55.6 | | | | 38.6 | | | | 51.5 | | | | 59.6 | | | | | | | | 52.0 | |
| | | | | | | | | | | | | | | | | | | | | | | | | | | | | | | | | |
| 2008 | | | | | | | | | | | | | | | | | | | | | | | | | | | | | | | | |
| Share of HSBC’s profit/(loss) before tax | | | 116.7 | | | | 58.7 | | | | 50.7 | | | | 18.8 | | | | (166.8 | ) | | | 21.9 | | | | | | | | 100.0 | |
| Cost efficiency ratio | | | 52.4 | | | | 38.8 | | | | 52.4 | | | | 35.9 | | | | 94.1 | | | | 57.0 | | | | | | | | 60.1 | |
Balance sheet information
| | | | | | | | | | | | | | | | | | | | | | | | | | | | | | | | | |
| | | | | | | | | | | Rest of | | | | | | | | | | | | | | | Intra- | | | | |
| | | | | | | Hong | | | Asia- | | | Middle | | | North | | | Latin | | | HSBC | | | | |
| | | Europe | | | Kong | | | Pacific | | | East | | | America | | | America | | | items | | | Total | |
| | | US$m | | | US$m | | | US$m | | | US$m | | | US$m | | | US$m | | | US$m | | | US$m | |
At 31 December 2010 | | | | | | | | | | | | | | | | | | | | | | | | | | | | | | | | |
| Loans and advances to customers (net) | | | 435,799 | | | | 140,691 | | | | 108,731 | | | | 24,626 | | | | 190,532 | | | | 57,987 | | | | – | | | | 958,366 | |
| Interests in associates and joint ventures | | | 186 | | | | 207 | | | | 15,035 | | | | 1,661 | | | | 104 | | | | 5 | | | | – | | | | 17,198 | |
| Total assets | | | 1,249,527 | | | | 429,565 | | | | 278,062 | | | | 52,757 | | | | 492,487 | | | | 139,938 | | | | (187,647 | ) | | | 2,454,689 | |
| Customer accounts | | | 491,563 | | | | 297,484 | | | | 158,155 | | | | 33,511 | | | | 158,486 | | | | 88,526 | | | | – | | | | 1,227,725 | |
| Total liabilities | | | 1,189,996 | | | | 422,101 | | | | 246,989 | | | | 45,379 | | | | 459,301 | | | | 123,655 | | | | (187,647 | ) | | | 2,299,774 | |
| | | | | | | | | | | | | | | | | | | | | | | | | | | | | | | | | |
Capital expenditure incurred1 | | | 865 | | | | 836 | | | | 168 | | | | 46 | | | | 774 | | | | 788 | | | | – | | | | 3,477 | |
| | | | | | | | | | | | | | | | | | | | | | | | | | | | | | | | | |
| At 31 December 2009 | | | | | | | | | | | | | | | | | | | | | | | | | | | | | | | | |
| Loans and advances to customers (net) | | | 439,481 | | | | 99,381 | | | | 80,043 | | | | 22,844 | | | | 206,853 | | | | 47,629 | | | | – | | | | 896,231 | |
| Interests in associates and joint ventures | | | 147 | | | | 157 | | | | 11,083 | | | | 1,573 | | | | 42 | | | | 9 | | | | – | | | | 13,011 | |
| Total assets | | | 1,268,600 | | | | 399,243 | | | | 222,139 | | | | 48,107 | | | | 475,014 | | | | 115,967 | | | | (164,618 | ) | | | 2,364,452 | |
| Customer accounts | | | 495,019 | | | | 275,441 | | | | 133,999 | | | | 32,529 | | | | 149,157 | | | | 72,889 | | | | – | | | | 1,159,034 | |
| Total liabilities | | | 1,213,907 | | | | 384,912 | | | | 203,243 | | | | 42,325 | | | | 447,530 | | | | 101,492 | | | | (164,618 | ) | | | 2,228,791 | |
| | | | | | | | | | | | | | | | | | | | | | | | | | | | | | | | | |
Capital expenditure incurred1 | | | 983 | | | | 290 | | | | 159 | | | | 102 | | | | 658 | | | | 540 | | | | – | | | | 2,732 | |
| | | | | | | | | | | | | | | | | | | | | | | | | | | | | | | | | |
| At 31 December 2008 | | | | | | | | | | | | | | | | | | | | | | | | | | | | | | | | |
| Loans and advances to customers (net) | | | 426,191 | | | | 100,220 | | | | 80,661 | | | | 27,295 | | | | 256,214 | | | | 42,287 | | | | – | | | | 932,868 | |
| Interests in associates and joint ventures | | | 137 | | | | 153 | | | | 9,728 | | | | 1,383 | | | | 128 | | | | 8 | | | | – | | | | 11,537 | |
| Total assets | | | 1,392,049 | | | | 414,484 | | | | 225,573 | | | | 50,952 | | | | 596,302 | | | | 102,946 | | | | (254,841 | ) | | | 2,527,465 | |
| Customer accounts | | | 502,476 | | | | 250,517 | | | | 124,194 | | | | 35,165 | | | | 143,532 | | | | 59,443 | | | | – | | | | 1,115,327 | |
| Total liabilities | | | 1,361,960 | | | | 400,637 | | | | 210,478 | | | | 45,416 | | | | 571,657 | | | | 91,929 | | | | (254,841 | ) | | | 2,427,236 | |
| | | | | | | | | | | | | | | | | | | | | | | | | | | | | | | | | |
Capital expenditure incurred1 | | | 2,078 | | | | 440 | | | | 426 | | | | 85 | | | | 726 | | | | 617 | | | | – | | | | 4,372 | |
| | |
| 1 | | Expenditure incurred on property, plant and equipment and other intangible assets. Excludes assets acquired as part of business combinations and goodwill. |
302
Notes on the Financial Statements(continued)
Other financial information
Net operating income by customer group and global business
| | | | | | | | | | | | | | | | | | | | | | | | | | | | | |
| | | Personal | | | | | | | Global | | | Global | | | | | | | Intra- | | | | |
| | | Financial | | | Commercial | | | Banking | | | Private | | | | | | | HSBC | | | | |
| | | Services | | | Banking | | | & Markets | | | Banking | | | Other | 1 | | items | | | Total | |
| | | US$m | | | US$m | | | US$m | | | US$m | | | US$m | | | US$m | | | US$m | |
| | | | | | | | | | | | | | | | | | | | | | | | | | | | | |
2010 | | | | | | | | | | | | | | | | | | | | | | | | | | | | |
| Net operating income | | | 21,317 | | | | 12,029 | | | | 18,957 | | | | 3,105 | | | | 4,663 | | | | (5,863 | ) | | | 54,208 | |
| | | | | | | | | | | | | | | |
| External | | | 19,529 | | | | 11,419 | | | | 22,090 | | | | 2,194 | | | | (1,024 | ) | | | – | | | | 54,208 | |
| Internal | | | 1,788 | | | | 610 | | | | (3,133 | ) | | | 911 | | | | 5,687 | | | | (5,863 | ) | | | – | |
| | | | | | | | | | | | | | | |
| | | | | | | | | | | | | | | | | | | | | | | | | | | | | |
| 2009 | | | | | | | | | | | | | | | | | | | | | | | | | | | | |
| Net operating income | | | 15,513 | | | | 9,571 | | | | 18,652 | | | | 2,984 | | | | (2,031 | ) | | | (4,996 | ) | | | 39,693 | |
| | | | | | | | | | | | | | | |
| External | | | 13,804 | | | | 9,285 | | | | 21,383 | | | | 2,275 | | | | (7,054 | ) | | | – | | | | 39,693 | |
| Internal | | | 1,709 | | | | 286 | | | | (2,731 | ) | | | 709 | | | | 5,023 | | | | (4,996 | ) | | | – | |
| | | | | | | | | | | | | | | |
| | | | | | | | | | | | | | | | | | | | | | | | | | | | | |
| 2008 | | | | | | | | | | | | | | | | | | | | | | | | | | | | |
| Net operating income | | | 20,269 | | | | 13,144 | | | | 12,047 | | | | 3,563 | | | | 12,290 | | | | (4,568 | ) | | | 56,745 | |
| | | | | | | | | | | | | | | |
| External | | | 15,023 | | | | 13,080 | | | | 17,739 | | | | 2,231 | | | | 8,672 | | | | – | | | | 56,745 | |
| Internal | | | 5,246 | | | | 64 | | | | (5,692 | ) | | | 1,332 | | | | 3,618 | | | | (4,568 | ) | | | – | |
| | | | | | | | | | | | | | | |
| | |
| 1 | | The main items reported in the ‘Other’ category are certain property activities, unallocated investment activities, centrally held investment companies, movements in fair value of own debt and HSBC’s holding company and financing operations. The ‘Other’ category also includes gains and losses on the disposal of certain significant subsidiaries or business units. |
Information by country
| | | | | | | | | | | | | | | | | | | | | | | | | |
| | | 2010 | | | 2009 | | | 2008 | |
| | | External net | | | Non- | | | External net | | | Non- | | | External net | | | Non- | |
| | | operating | | | current | | | operating | | | current | | | operating | | | current | |
| | | income | 1 | | assets | 2 | | income | 1 | | assets | 2 | | income | 1 | | assets | 2 |
| | | US$m | | | US$m | | | US$m | | | US$m | | | US$m | | | US$m | |
| | | | | | | | | | | | | | | | | | | | | | | | | |
| UK | | | 11,467 | | | | 19,661 | | | | 9,958 | | | | 19,704 | | | | 15,789 | | | | 12,491 | |
| Hong Kong | | | 9,170 | | | | 4,630 | | | | 8,352 | | | | 3,374 | | | | 8,205 | | | | 3,527 | |
| USA | | | 6,098 | | | | 6,669 | | | | (1,042 | ) | | | 5,499 | | | | 2,862 | | | | 4,660 | |
| France | | | 3,185 | | | | 10,914 | | | | 3,322 | | | | 11,782 | | | | 6,457 | | | | 11,862 | |
| Brazil | | | 4,506 | | | | 2,025 | | | | 3,368 | | | | 1,868 | | | | 3,886 | | | | 1,421 | |
| Other countries | | | 19,782 | | | | 29,747 | | | | 15,735 | | | | 25,557 | | | | 19,546 | | | | 23,020 | |
| | | | | | | | | | | | | |
| | | | | | | | | | | | | | | | | | | | | | | | | |
| | | | 54,208 | | | | 73,646 | | | | 39,693 | | | | 67,784 | | | | 56,745 | | | | 56,981 | |
| | | | | | | | | | | | | |
| | |
| 1 | | External net operating income is attributed to countries on the basis of the location of the branch responsible for reporting the results or advancing the funds. |
| |
| 2 | | Non-current assets consist of property, plant and equipment, goodwill, other intangible assets, interests in associates and joint ventures and certain other assets expected to be recovered more than twelve months after the reporting period. |
14 Analysis of financial assets and liabilities by measurement basis
| | | Financial assets and financial liabilities are measured on an ongoing basis either at fair value or at amortised cost. The summary of significant accounting policies in Note 2 describes how the classes of financial instruments are measured, and how income and expenses, including fair value gains and losses, are recognised. The following table analyses the carrying amounts of the financial assets and liabilities by category as defined in IAS 39 and by balance sheet heading. |
303
Notes on the Financial Statements(continued)
HSBC
| | | | | | | | | | | | | | | | | | | | | | | | | | | | | | | | | |
| | | At 31 December 2010 | |
| | | | | | | | | | | | | | | | | | | Financial | | | Derivatives | | | Derivatives | | | | |
| | | | | | | | | | | | | | | | | | | assets and | | | designated | | | designated | | | | |
| | | | | | | | | | | Held-to- | | | Available- | | | liabilities at | | | as fair value | | | as cash flow | | | | |
| | | Held for | | | Designated | | | maturity | | | for-sale | | | amortised | | | hedging | | | hedging | | | | |
| | | trading | | | at fair value | | | securities | | | securities | | | cost | | | instruments | | | instruments | | | Total | |
| | | US$m | | | US$m | | | US$m | | | US$m | | | US$m | | | US$m | | | US$m | | | US$m | |
| | | | | | | | | | | | | | | | | | | | | | | | | | | | | | | | | |
Financial assets | | | | | | | | | | | | | | | | | | | | | | | | | | | | | | | | |
| Cash and balances at central banks | | | – | | | | – | | | | – | | | | – | | | | 57,383 | | | | – | | | | – | | | | 57,383 | |
| Items in the course of collection from other banks | | | – | | | | – | | | | – | | | | – | | | | 6,072 | | | | – | | | | – | | | | 6,072 | |
| Hong Kong Government certificates of indebtedness | | | – | | | | – | | | | – | | | | – | | | | 19,057 | | | | – | | | | – | | | | 19,057 | |
| Trading assets | | | 385,052 | | | | – | | | | – | | | | – | | | | – | | | | – | | | | – | | | | 385,052 | |
| Financial assets designated at fair value | | | – | | | | 37,011 | | | | – | | | | – | | | | – | | | | – | | | | – | | | | 37,011 | |
| Derivatives | | | 256,689 | | | | – | | | | – | | | | – | | | | – | | | | 596 | | | | 3,472 | | | | 260,757 | |
| Loans and advances to banks | | | – | | | | – | | | | – | | | | – | | | | 208,271 | | | | – | | | | – | | | | 208,271 | |
| Loans and advances to customers | | | – | | | | – | | | | – | | | | – | | | | 958,366 | | | | – | | | | – | | | | 958,366 | |
| Financial investments | | | – | | | | – | | | | 19,499 | | | | 381,256 | | | | – | | | | – | | | | – | | | | 400,755 | |
| Other assets | | | – | | | | – | | | | – | | | | – | | | | 20,097 | | | | – | | | | – | | | | 20,097 | |
| Accrued income | | | – | | | | – | | | | – | | | | – | | | | 10,274 | | | | – | | | | – | | | | 10,274 | |
| | | | | | | | | | | | | | | | | |
| | | | | | | | | | | | | | | | | | | | | | | | | | | | | | | | | |
| Total financial assets | | | 641,741 | | | | 37,011 | | | | 19,499 | | | | 381,256 | | | | 1,279,520 | | | | 596 | | | | 3,472 | | | | 2,363,095 | |
| | | | | | | | | | | | | | | | | |
| | | | | | | | | | | | | | | | | | | | | | | | | | | | | | | | | |
Financial liabilities | | | | | | | | | | | | | | | | | | | | | | | | | | | | | | | | |
| Hong Kong currency notes in circulation | | | – | | | | – | | | | – | | | | – | | | | 19,057 | | | | – | | | | – | | | | 19,057 | |
| Deposits by banks | | | – | | | | – | | | | – | | | | – | | | | 110,584 | | | | – | | | | – | | | | 110,584 | |
| Customer accounts | | | – | | | | – | | | | – | | | | – | | | | 1,227,725 | | | | – | | | | – | | | | 1,227,725 | |
| Items in the course of transmission to other banks | | | – | | | | – | | | | – | | | | – | | | | 6,663 | | | | – | | | | – | | | | 6,663 | |
| Trading liabilities | | | 300,703 | | | | – | | | | – | | | | – | | | | – | | | | – | | | | – | | | | 300,703 | |
| Financial liabilities designated at fair value | | | – | | | | 88,133 | | | | – | | | | – | | | | – | | | | – | | | | – | | | | 88,133 | |
| Derivatives | | | 254,416 | | | | – | | | | – | | | | – | | | | – | | | | 2,226 | | | | 2,023 | | | | 258,665 | |
| Debt securities in issue | | | – | | | | – | | | | – | | | | – | | | | 145,401 | | | | – | | | | – | | | | 145,401 | |
| Other liabilities | | | – | | | | – | | | | – | | | | – | | | | 25,533 | | | | – | | | | – | | | | 25,533 | |
| Accruals | | | – | | | | – | | | | – | | | | – | | | | 12,545 | | | | – | | | | – | | | | 12,545 | |
| Subordinated liabilities | | | – | | | | – | | | | – | | | | – | | | | 33,387 | | | | – | | | | – | | | | 33,387 | |
| | | | | | | | | | | | | | | | | |
| | | | | | | | | | | | | | | | | | | | | | | | | | | | | | | | | |
| Total financial liabilities | | | 555,119 | | | | 88,133 | | | | – | | | | – | | | | 1,580,895 | | | | 2,226 | | | | 2,023 | | | | 2,228,396 | |
| | | | | | | | | | | | | | | | | |
304
Notes on the Financial Statements(continued)
| | | | | | | | | | | | | | | | | | | | | | | | | | | | | | | | | |
| | | At 31 December 2009 | |
| | | | | | | | | | | | | | | | | | | Financial | | | Derivatives | | | Derivatives | | | | |
| | | | | | | | | | | | | | | | | | | assets and | | | designated | | | designated | | | | |
| | | | | | | | | | Held-to- | | | Available- | | | liabilities at | | | as fair value | | | as cash flow | | | | |
| | | Held for | | | Designated | | | maturity | | | for-sale | | | amortised | | | hedging | | | hedging | | | | |
| | | trading | | | at fair value | | | securities | | | securities | | | cost | | | instruments | | | instruments | | | Total | |
| | | US$m | | | US$m | | | US$m | | | US$m | | | US$m | | | US$m | | | US$m | | | US$m | |
| | | | | | | | | | | | | | | | | | | | | | | | | | | | | | | | | |
| Financial assets | | | | | | | | | | | | | | | | | | | | | | | | | | | | | | | | |
| Cash and balances at central banks | | | – | | | | – | | | | – | | | | – | | | | 60,655 | | | | – | | | | – | | | | 60,655 | |
| Items in the course of collection from other banks | | | – | | | | – | | | | – | | | | – | | | | 6,395 | | | | – | | | | – | | | | 6,395 | |
| Hong Kong Government certificates of indebtedness | | | – | | | | | | | | – | | | | – | | | | 17,463 | | | | – | | | | – | | | | 17,463 | |
| Trading assets | | | 421,381 | | | | – | | | | – | | | | – | | | | – | | | | – | | | | – | | | | 421,381 | |
| Financial assets designated at fair value | | | – | | | | 37,181 | | | | – | | | | – | | | | – | | | | – | | | | – | | | | 37,181 | |
| Derivatives | | | 245,685 | | | | – | | | | – | | | | – | | | | – | | | | 584 | | | | 4,617 | | | | 250,886 | |
| Loans and advances to banks | | | – | | | | – | | | | – | | | | – | | | | 179,781 | | | | – | | | | – | | | | 179,781 | |
| Loans and advances to customers | | | – | | | | – | | | | – | | | | – | | | | 896,231 | | | | – | | | | – | | | | 896,231 | |
| Financial investments | | | – | | | | – | | | | 17,626 | | | | 351,532 | | | | – | | | | – | | | | – | | | | 369,158 | |
| Other assets | | | – | | | | – | | | | – | | | | 3 | | | | 26,114 | | | | – | | | | – | | | | 26,117 | |
| Accrued income | | | – | | | | – | | | | – | | | | – | | | | 10,256 | | | | – | | | | – | | | | 10,256 | |
| | | | | | | | | | | | | | | | | |
| | | | | | | | | | | | | | | | | | | | | | | | | | | | | | | | | |
| Total financial assets | | | 667,066 | | | | 37,181 | | | | 17,626 | | | | 351,535 | | | | 1,196,895 | | | | 584 | | | | 4,617 | | | | 2,275,504 | |
| | | | | | | | | | | | | | | | | |
| | | | | | | | | | | | | | | | | | | | | | | | | | | | | | | | | |
| Financial liabilities | | | | | | | | | | | | | | | | | | | | | | | | | | | | | | | | |
| Hong Kong currency notes in circulation | | | – | | | | – | | | | – | | | | – | | | | 17,463 | | | | – | | | | – | | | | 17,463 | |
| Deposits by banks | | | – | | | | – | | | | – | | | | – | | | | 124,872 | | | | – | | | | – | | | | 124,872 | |
| Customer accounts | | | – | | | | – | | | | – | | | | – | | | | 1,159,034 | | | | – | | | | – | | | | 1,159,034 | |
| Items in the course of transmission to other banks | | | – | | | | – | | | | – | | | | – | | | | 5,734 | | | | – | | | | – | | | | 5,734 | |
| Trading liabilities | | | 268,130 | | | | – | | | | – | | | | – | | | | – | | | | – | | | | – | | | | 268,130 | |
| Financial liabilities designated at fair value | | | – | | | | 80,092 | | | | – | | | | – | | | | – | | | | – | | | | – | | | | 80,092 | |
| Derivatives | | | 244,072 | | | | – | | | | – | | | | – | | | | – | | | | 1,085 | | | | 2,489 | | | | 247,646 | |
| Debt securities in issue | | | – | | | | – | | | | – | | | | – | | | | 146,896 | | | | – | | | | – | | | | 146,896 | |
| Other liabilities | | | – | | | | – | | | | – | | | | – | | | | 66,169 | | | | – | | | | – | | | | 66,169 | |
| Accruals | | | – | | | | – | | | | – | | | | – | | | | 11,644 | | | | – | | | | – | | | | 11,644 | |
| Subordinated liabilities | | | – | | | | – | | | | – | | | | – | | | | 30,478 | | | | – | | | | – | | | | 30,478 | |
| | | | | | | | | | | | | | | | | |
| | | | | | | | | | | | | | | | | | | | | | | | | | | | | | | | | |
| Total financial liabilities | | | 512,202 | | | | 80,092 | | | | – | | | | – | | | | 1,562,290 | | | | 1,085 | | | | 2,489 | | | | 2,158,158 | |
| | | | | | | | | | | | | | | | | |
305
Notes on the Financial Statements(continued)
HSBC Holdings
| | | | | | | | | | | | | | | | | | | | | | | | | |
| | | At 31 December 2010 | |
| | | | | | | | | | | | | | | | | | | Financial | | | | |
| | | | | | | | | | | | | | | | | | | assets and | | | | |
| | | | | | | | | | | | | | | Available- | | | liabilities at | | | | |
| | | Held for | | | Designated | | | Loans and | | | for-sale | | | amortised | | | | |
| | | trading | | | at fair value | | | receivables | | | securities | | | cost | | | Total | |
| | | US$m | | | US$m | | | US$m | | | US$m | | | US$m | | | US$m | |
| | | | | | | | | | | | | | | | | | | | | | | | | |
Financial assets | | | | | | | | | | | | | | | | | | | | | | | | |
| Cash at bank and in hand | | | – | | | | – | | | | – | | | | – | | | | 459 | | | | 459 | |
| Derivatives | | | 2,327 | | | | – | | | | – | | | | – | | | | – | | | | 2,327 | |
| Loans and advances to HSBC undertakings | | | – | | | | – | | | | 21,238 | | | | – | | | | – | | | | 21,238 | |
| Financial investments | | | – | | | | – | | | | – | | | | 2,025 | | | | – | | | | 2,025 | |
| Other assets | | | – | | | | – | | | | – | | | | – | | | | 1 | | | | 1 | |
| | | | | | | | | | | | | |
| Total financial assets | | | 2,327 | | | | – | | | | 21,238 | | | | 2,025 | | | | 460 | | | | 26,050 | |
| | | | | | | | | | | | | |
| | | | | | | | | | | | | | | | | | | | | | | | | |
Financial liabilities | | | | | | | | | | | | | | | | | | | | | | | | |
| Amounts owed to HSBC undertakings | | | – | | | | – | | | | – | | | | – | | | | 2,932 | | | | 2,932 | |
| Financial liabilities designated at fair value | | | – | | | | 16,288 | | | | – | | | | – | | | | – | | | | 16,288 | |
| Derivatives | | | 827 | | | | – | | | | – | | | | – | | | | – | | | | 827 | |
| Debt securities in issue | | | – | | | | – | | | | – | | | | – | | | | 2,668 | | | | 2,668 | |
| Other liabilities | | | – | | | | – | | | | – | | | | – | | | | 1,216 | | | | 1,216 | |
| Accruals | | | – | | | | – | | | | – | | | | – | | | | 566 | | | | 566 | |
| Subordinated liabilities | | | – | | | | – | | | | – | | | | – | | | | 13,313 | | | | 13,313 | |
| | | | | | | | | | | | | |
| | | | | | | | | | | | | | | | | | | | | | | | | |
| Total financial liabilities | | | 827 | | | | 16,288 | | | | – | | | | – | | | | 20,695 | | | | 37,810 | |
| | | | | | | | | | | | | |
| | | | | | | | | | | | | | | | | | | | | | | | | |
| | | At 31 December 2009 | |
| | | | | | | | | | | | | | | | | | | Financial | | | | |
| | | | | | | | | | | | | | | | | | | assets and | | | | |
| | | | | | | | | | | | | | | Available- | | | liabilities at | | | | |
| | | Held for | | | Designated at | | | Loans and | | | for-sale | | | amortised | | | | |
| | | trading | | | fair value | | | receivables | | | securities | | | cost | | | Total | |
| | | US$m | | | US$m | | | US$m | | | US$m | | | US$m | | | US$m | |
| | | | | | | | | | | | | | | | | | | | | | | | | |
| Financial assets | | | | | | | | | | | | | | | | | | | | | | | | |
| Cash at bank and in hand | | | – | | | | – | | | | – | | | | – | | | | 224 | | | | 224 | |
| Derivatives | | | 2,981 | | | | – | | | | – | | | | – | | | | – | | | | 2,981 | |
| Loans and advances to HSBC undertakings | | | – | | | | – | | | | 23,212 | | | | – | | | | – | | | | 23,212 | |
| Financial investments | | | – | | | | – | | | | – | | | | 2,455 | | | | – | | | | 2,455 | |
| Other assets | | | – | | | | – | | | | – | | | | – | | | | 4 | | | | 4 | |
| | | | | | | | | | | | | |
| | | | | | | | | | | | | | | | | | | | | | | | | |
| Total financial assets | | | 2,981 | | | | – | | | | 23,212 | | | | 2,455 | | | | 228 | | | | 28,876 | |
| | | | | | | | | | | | | |
| | | | | | | | | | | | | | | | | | | | | | | | | |
| Financial liabilities | | | | | | | | | | | | | | | | | | | | | | | | |
| Amounts owed to HSBC undertakings | | | – | | | | – | | | | – | | | | – | | | | 3,711 | | | | 3,711 | |
| Financial liabilities designated at fair value | | | – | | | | 16,909 | | | | – | | | | – | | | | – | | | | 16,909 | |
| Derivatives | | | 362 | | | | – | | | | – | | | | – | | | | – | | | | 362 | |
| Debt securities in issue | | | – | | | | – | | | | – | | | | – | | | | 2,839 | | | | 2,839 | |
| Other liabilities | | | – | | | | – | | | | – | | | | – | | | | 8 | | | | 8 | |
| Accruals | | | – | | | | – | | | | – | | | | – | | | | 419 | | | | 419 | |
| Subordinated liabilities | | | – | | | | – | | | | – | | | | – | | | | 14,406 | | | | 14,406 | |
| | | | | | | | | | | | | |
| | | | | | | | | | | | | | | | | | | | | | | | | |
| Total financial liabilities | | | 362 | | | | 16,909 | | | | – | | | | – | | | | 21,383 | | | | 38,654 | |
| | | | | | | | | | | | | |
| | | | | | | | | | | | | | | | | | | | | | | | | |
306
Notes on the Financial Statements(continued)
| | | | | | | | | |
| | | 2010 | | | 2009 | |
| | | US$m | | | US$m | |
| Trading assets: | | | | | | | | |
| – not subject to repledge or resale by counterparties | | | 284,940 | | | | 320,155 | |
| – which may be repledged or resold by counterparties | | | 100,112 | | | | 101,226 | |
| | | | | |
| | | | | | | | | |
| | | | 385,052 | | | | 421,381 | |
| | | | | |
| | | | | | | | | |
| Treasury and other eligible bills | | | 25,620 | | | | 22,346 | |
| Debt securities | | | 168,268 | | | | 201,598 | |
| Equity securities | | | 41,086 | | | | 35,311 | |
| | | | | |
| | | | | | | | | |
| Trading securities at fair value | | | 234,974 | | | | 259,255 | |
| Loans and advances to banks | | | 70,456 | | | | 78,126 | |
| Loans and advances to customers | | | 79,622 | | | | 84,000 | |
| | | | | |
| | | | | | | | | |
| | | | 385,052 | | | | 421,381 | |
| | | | | |
Trading securities valued at fair value
| | | | | | | | | |
| | | Fair value1 |
| | | 2010 | | | 2009 | |
| | | US$m | | | US$m | |
| | | | | | | | | |
US Treasury and US Government agencies2 | | | 20,239 | | | | 17,620 | |
| UK Government | | | 17,036 | | | | 12,113 | |
| Hong Kong Government | | | 11,053 | | | | 10,649 | |
| Other government | | | 92,826 | | | | 94,264 | |
Asset-backed securities3 | | | 3,998 | | | | 5,308 | |
| Corporate debt and other securities | | | 48,736 | | | | 83,990 | |
| Equity securities | | | 41,086 | | | | 35,311 | |
| | | | | |
| | | | | | | | | |
| | | | 234,974 | | | | 259,255 | |
| | | | | |
| | |
| 1 | | Included within these figures are debt securities issued by banks and other financial institutions of US$37,170m (2009: US$41,466m), of which US$8,330m (2009: US$7,280m) are guaranteed by various governments. |
| |
| 2 | | Includes securities that are supported by an explicit guarantee issued by the US Government. |
| |
| 3 | | Excludes asset-backed securities included under US Treasury and US Government agencies. |
Trading securities listed on a recognised exchange and unlisted
| | | | | | | | | | | | | | | | | |
| | | Treasury | | | | | | | | | | |
| | | and other | | | Debt | | | Equity | | | | |
| | | eligible bills | | | securities | | | securities | | | Total | |
| | | US$m | | | US$m | | | US$m | | | US$m | |
Fair value at 31 December 2010 | | | | | | | | | | | | | | | | |
Listed on a recognised exchange1 | | | 698 | | | | 113,878 | | | | 40,098 | | | | 154,674 | |
| Unlisted | | | 24,922 | | | | 54,390 | | | | 988 | | | | 80,300 | |
| | | | | | | | | |
| | | | | | | | | | | | | | | | | |
| | | | 25,620 | | | | 168,268 | | | | 41,086 | | | | 234,974 | |
| | | | | | | | | |
| | | | | | | | | | | | | | | | | |
| Fair value at 31 December 2009 | | | | | | | | | | | | | | | | |
Listed on a recognised exchange1 | | | 3,107 | | | | 159,030 | | | | 33,428 | | | | 195,565 | |
| Unlisted | | | 19,239 | | | | 42,568 | | | | 1,883 | | | | 63,690 | |
| | | | | | | | | |
| | | | | | | | | | | | | | | | | |
| | | | 22,346 | | | | 201,598 | | | | 35,311 | | | | 259,255 | |
| | | | | | | | | |
| | |
| 1 | | Included within listed investments are US$3,254m (2009: US$3,229m) of investments listed in Hong Kong. |
Loans and advances to banks held for trading
| | | | | | | | | |
| | | 2010 | | | 2009 | |
| | | US$m | | | US$m | |
| | | | | | | | | |
| Reverse repos | | | 45,771 | | | | 50,357 | |
| Settlement accounts | | | 5,226 | | | | 10,128 | |
| Stock borrowing | | | 6,346 | | | | 4,711 | |
| Other | | | 13,113 | | | | 12,930 | |
| | | | | |
| | | | | | | | | |
| | | | 70,456 | | | | 78,126 | |
| | | | | |
307
Notes on the Financial Statements(continued)
Loans and advances to customers held for trading
| | | | | | | | | |
| | | 2010 | | | 2009 | |
| | | US$m | | | US$m | |
| Reverse repos | | | 46,366 | | | | 42,172 | |
| Settlement accounts | | | 7,516 | | | | 12,134 | |
| Stock borrowing | | | 11,161 | | | | 18,042 | |
| Other | | | 14,579 | | | | 11,652 | |
| | | | | |
| | | | | | | | | |
| | | | 79,622 | | | | 84,000 | |
| | | | | |
16 Fair values of financial instruments carried at fair value
The classification of financial instruments is determined in accordance with the accounting policies set out in Note 2. The use of assumptions and estimation in valuing financial instruments is described on page 34.
Fair value is the amount for which an asset could be exchanged, or a liability settled, between knowledgeable, willing parties in an arm’s length transaction.
The following table sets out the financial instruments carried at fair value.
Financial instruments carried at fair value and bases of valuation
| | | | | | | | | | | | | | | | | |
| | | | | | Valuation techniques | | | | |
| | | | | | | | | With | | | | |
| | | Quoted | | | Using | | | significant | | | | |
| | | market | | | observable | | | unobservable | | | | |
| | | price | | | inputs | | | inputs | | | | |
| | | Level 1 | | | Level 2 | | | Level 3 | | | Total | |
| | | US$m | | | US$m | | | US$m | | | US$m | |
31 December 2010 | | | | | | | | | | | | | | | | |
| Assets | | | | | | | | | | | | | | | | |
| Trading assets | | | 224,613 | | | | 154,750 | | | | 5,689 | | | | 385,052 | |
| Financial assets designated at fair value | | | 23,641 | | | | 12,783 | | | | 587 | | | | 37,011 | |
| Derivatives | | | 2,078 | | | | 254,718 | | | | 3,961 | | | | 260,757 | |
| Financial investments: available for sale | | | 214,276 | | | | 158,743 | | | | 8,237 | | | | 381,256 | |
| | | | | | | | | | | | | | | | | |
| Liabilities | | | | | | | | | | | | | | | | |
| Trading liabilities | | | 124,874 | | | | 164,436 | | | | 11,393 | | | | 300,703 | |
| Financial liabilities designated at fair value | | | 22,193 | | | | 65,370 | | | | 570 | | | | 88,133 | |
| Derivatives | | | 1,808 | | | | 253,051 | | | | 3,806 | | | | 258,665 | |
| | | | | | | | | | | | | | | | | |
| 31 December 2009 | | | | | | | | | | | | | | | | |
| Assets | | | | | | | | | | | | | | | | |
| Trading assets | | | 272,509 | | | | 142,452 | | | | 6,420 | | | | 421,381 | |
| Financial assets designated at fair value | | | 24,184 | | | | 11,773 | | | | 1,224 | | | | 37,181 | |
| Derivatives | | | 1,961 | | | | 244,472 | | | | 4,453 | | | | 250,886 | |
| Financial investments: available for sale | | | 163,149 | | | | 178,168 | | | | 10,214 | | | | 351,531 | |
| | | | | | | | | | | | | | | | | |
| Liabilities | | | | | | | | | | | | | | | | |
| Trading liabilities | | | 119,544 | | | | 139,812 | | | | 8,774 | | | | 268,130 | |
| Financial liabilities designated at fair value | | | 27,553 | | | | 52,032 | | | | 507 | | | | 80,092 | |
| Derivatives | | | 1,843 | | | | 240,611 | | | | 5,192 | | | | 247,646 | |
The reduction of Level 1 trading assets reflects the deconsolidation of CNAV funds which is discussed further on page 363. The increase in Level 1 available-for-sale instruments reflects increased investment in government and US agency securities. The rise in the size of Level 2 trading assets and liabilities reflects an increase in repo and reverse repo activity.
There were no material transfers between Level 1 and Level 2 in the period.
Fair values are subject to a control framework designed to ensure that they are either determined or validated by a function independent of the risk-taker.
308
Notes on the Financial Statements(continued)
For all financial instruments where fair values are determined by reference to externally quoted prices or observable pricing inputs to models, independent price determination or validation is utilised. In inactive markets, direct observation of a traded price may not be possible. In these circumstances, HSBC will source alternative market information to validate the financial instrument’s fair value, with greater weight given to information that is considered to be more relevant and reliable. The factors that are considered in this regard are,inter alia:
| • | | the extent to which prices may be expected to represent genuine traded or tradeable prices; |
| |
| • | | the degree of similarity between financial instruments; |
| |
| • | | the degree of consistency between different sources; |
| |
| • | | the process followed by the pricing provider to derive the data; |
| |
| • | | the elapsed time between the date to which the market data relates and the balance sheet date; and |
| |
| • | | the manner in which the data was sourced. |
For fair values determined using a valuation model, the control framework may include, as applicable, independent development or validation of (i) the logic within valuation models; (ii) the inputs to those models; (iii) any adjustments required outside the valuation models; and (iv) where possible, model outputs. Valuation models are subject to a process of due diligence and calibration before becoming operational and are calibrated against external market data on an ongoing basis.
The fair value governance structure is as follows:
Determination of fair value
Fair values are determined according to the following hierarchy:
| • | | Level 1 – quoted market price:financial instruments with quoted prices for identical instruments in active markets. |
| • | | Level 2 – valuation technique using observable inputs:financial instruments with quoted prices for similar instruments in active markets or quoted prices for identical or similar instruments in inactive markets and financial instruments valued using models where all significant inputs are observable. |
| • | | Level 3 – valuation technique with significant unobservable inputs: financial instruments valued using valuation techniques where one or more significant inputs are unobservable. |
The best evidence of fair value is a quoted price in an actively traded market. The fair values of financial instruments that are quoted in active markets are based on bid prices for assets held and offer prices for liabilities issued. Where a financial instrument has a quoted price in an active market and it is part of a portfolio, the fair value of the portfolio is calculated as the product of the number of units and quoted price and no block discounts are applied. In the event that the market for a financial instrument is not active, a valuation technique is used.
The judgement as to whether a market is active may include, but is not restricted to, the consideration of factors such as the magnitude and frequency of trading activity, the availability of prices and the size of bid/offer spreads. The bid/offer spread represents the difference in prices at which a market participant would be willing to buy compared with the price at which they would be willing to sell. In inactive markets, obtaining assurance that the transaction price provides evidence of fair value or determining the adjustments to transaction prices that are necessary to measure the fair value of the instrument requires additional work during the valuation process.
309
Notes on the Financial Statements(continued)
Valuation techniques incorporate assumptions about factors that other market participants would use in their valuations, including interest rate yield curves, exchange rates, volatilities, and prepayment and default rates. During the year, as a result of evolving market practice in the pricing of certain interest rate derivatives, HSBC has, for single currency swaps with collateralised counterparties and in significant major currencies, adopted a discounting curve that reflects the overnight interest rate (‘OIS discounting’). Previously, in line with market practice, discount curves did not reflect this overnight interest rate component but were based on a term LIBOR rate. The financial effect of this change was not significant.
The majority of valuation techniques employ only observable market data. However, certain financial instruments are valued on the basis of valuation techniques that feature one or more significant market inputs that are unobservable, and for them, the derivation of fair value is more judgemental. An instrument in its entirety is classified as valued using significant unobservable inputs if, in the opinion of management, a significant proportion of the instrument’s carrying amount and/or inception profit (‘day 1 gain or loss’) is driven by unobservable inputs. ‘Unobservable’ in this context means that there is little or no current market data available from which to determine the price at which an arm’s length transaction would be likely to occur. It generally does not mean that there is no data available at all upon which to base a determination of fair value (consensus pricing data may, for example, be used).
In certain circumstances, primarily where debt is hedged with interest rate derivatives, HSBC records its own debt in issue at fair value, based on quoted prices in an active market for the specific instrument concerned, if available. When quoted market prices are unavailable, the own debt in issue is valued using valuation techniques, the inputs for which are either based upon quoted prices in an inactive market for the instrument, or are estimated by comparison with quoted prices in an active market for similar instruments. In both cases, the fair value includes the effect of applying the credit spread which is appropriate to HSBC’s liabilities. The change in fair value of issued debt securities attributable to the Group’s own credit spread is computed as follows: for each security at each reporting date, an externally verifiable price is obtained or a price is derived using credit spreads for similar securities for the same issuer. Then, using discounted cash flow, each security is valued using a LIBOR-based discount curve. The difference in the valuations is attributable to the Group’s own credit spread. This methodology is applied consistently across all securities.
Structured notes issued and certain other hybrid instrument liabilities are included within trading liabilities and are measured at fair value. The credit spread applied to these instruments is derived from the spreads at which HSBC issues structured notes. These market spreads are smaller than credit spreads observed for plain vanilla debt or in the credit default swap markets.
Gains and losses arising from changes in the credit spread of liabilities issued by HSBC reverse over the contractual life of the debt, provided that the debt is not repaid at a premium or a discount.
Fair value adjustments are adopted when HSBC considers that there are additional factors that would be considered by a market participant that are not incorporated within the valuation model. The magnitude of fair value adjustments depends upon many entity-specific factors, and therefore fair value adjustments may not be comparable across the banking industry.
HSBC classifies fair value adjustments as either ‘risk-related’ or ‘model-related’. The majority of these adjustments relate to Global Banking and Markets.
Movements in the level of fair value adjustments do not necessarily result in the recognition of profits or losses within the income statement. For example, as models are enhanced, fair value adjustments may no longer be required. Similarly, fair value adjustments will decrease when the related positions are unwound, but this may not result in profit or loss.
310
Notes on the Financial Statements(continued)
Global Banking and Markets fair value adjustments
| | | | | | | | | |
| | | At 31 December | |
| | | 2010 | | | 2009 | |
| | | US$m | | | US$m | |
Type of adjustment | | | | | | | | |
| Risk-related | | | 2,171 | | | | 2,955 | |
| | | | | |
| Bid-offer | | | 620 | | | | 528 | |
| Uncertainty | | | 136 | | | | 223 | |
| Credit risk adjustment | | | 1,355 | | | | 2,172 | |
| Other | | | 60 | | | | 32 | |
| | | | | |
| | | | | | | | | |
| Model-related | | | 389 | | | | 457 | |
| | | | | |
| Model limitation | | | 383 | | | | 391 | |
| Other | | | 6 | | | | 66 | |
| | | | | |
| | | | | | | | | |
| Inception profit (Day 1 P&L reserves) (Note 20) | | | 250 | | | | 260 | |
| | | | | |
| | | | | | | | | |
| | | | 2,810 | | | | 3,672 | |
| | | | | |
The most significant fair value adjustment movement related to the release of US$490m of credit risk adjustments held for monoline insurers of which US$336m resulted from commutations. The commutations did not result in a material gain or loss. The remainder of the decrease in the credit risk adjustment derived primarily from commutations or restructures with non-monoline counterparties and internal credit rating upgrades of certain counterparties.
Risk-related adjustments
Bid-offer
IAS 39 requires that portfolios are marked at bid or offer, as appropriate. Valuation models will typically generate mid market values. The bid-offer adjustment reflects the cost that would be incurred if substantially all residual net portfolio market risks were closed using available hedging instruments or by disposing of or unwinding the actual position.
Uncertainty
Certain model inputs may be less readily determinable from market data, and/or the choice of model itself may be more subjective. In these circumstances, there exists a range of possible values that the financial instrument or market parameter may assume and an adjustment may be necessary to reflect the likelihood that in estimating the fair value of the financial instrument, market participants would adopt rather more conservative values for uncertain parameters and/or model assumptions than those used in the valuation model.
Credit risk adjustment
The credit risk adjustment is an adjustment to the valuation of OTC derivative contracts to reflect within fair value the possibility that the counterparty may default and HSBC may not receive the full market value of the transactions.
Model-related adjustments
Model limitation
Models used for portfolio valuation purposes may be based upon a simplifying set of assumptions that do not capture all material market characteristics. Additionally, markets evolve, and models that were adequate in the past may require development to capture all material market characteristics in current market conditions. In these circumstances, model limitation adjustments are adopted. As model development progresses, model limitations are addressed within the valuation models and a model limitation adjustment is no longer needed.
Inception profit (Day 1 P&L reserves)
Inception profit adjustments are adopted where the fair value estimated by a valuation model is based on one or more significant unobservable inputs. The accounting for inception profit adjustments is discussed on page 254. An analysis of the movement in the deferred Day 1 P&L reserve is provided on page 324.
311
Notes on the Financial Statements(continued)
Credit risk adjustment methodology
HSBC calculates a separate credit risk adjustment for each HSBC legal entity, and within each entity for each counterparty to which the entity has exposure. The calculation of the monoline credit risk adjustment and sensitivity to different assumptions is described on page 137. Of the total credit risk adjustment at 31 December 2010 of US$1,355m (2009: US$2,172m), US$836m (2009: US$1,163m) relates to the credit risk adjustment taken against non-monoline counterparties. The methodology for calculating the credit risk adjustment for non-monoline counterparties is described below.
HSBC calculates the credit risk adjustment by applying the probability of default of the counterparty to the expected positive exposure to the counterparty, and multiplying the result by the loss expected in the event of default. The calculation is performed over the life of the potential exposure.
The probability of default is based on HSBC’s internal credit rating for the counterparty, taking into account how credit ratings may deteriorate over the duration of the exposure through the use of historical rating transition matrices. For most products, to calculate the expected positive exposure to a counterparty, HSBC uses a simulation methodology to incorporate the range of potential exposures across the portfolio of transactions with the counterparty over the life of an instrument. The simulation methodology includes credit mitigants such as counterparty netting agreements and collateral agreements with the counterparty. A standard loss given default assumption of 60% is generally adopted. HSBC does not adjust derivative liabilities for HSBC’s own credit risk, such an adjustment is often referred to as a ‘debit valuation adjustment’.
For certain types of exotic derivatives where the products are not currently supported by the simulation, or for derivative exposures in smaller trading locations where the simulation tool is not yet available, HSBC adopts alternative methodologies. These may involve mapping to the results for similar products from the simulation tool or where such a mapping approach is not appropriate, a simplified methodology is used, generally following the same principles as the simulation methodology. The calculation is applied at a trade level, with more limited recognition of credit mitigants such as netting or collateral agreements than used in the simulation methodology described previously.
The methodologies do not, in general, account for ‘wrong-way risk’. Wrong-way risk arises where the underlying value of the derivative prior to any credit risk adjustment is positively correlated to the probability of default of the counterparty. Where there is significant wrong-way risk, a trade specific approach is applied to reflect the wrong-way risk within the valuation.
HSBC includes all third party counterparties in the credit risk adjustment calculation and does not net credit risk adjustments across HSBC Group entities. During 2010, there were no material changes made by HSBC to the methodologies used to calculate the credit risk adjustment.
Fair value valuation bases
Financial instruments measured at fair value using a valuation technique with significant unobservable inputs – Level 3
| | | | | | | | | | | | | | | | | | | | | | | | | | | | | |
| | | Assets | | Liabilities |
| | | | | | | | | Designated | | | | | | | | | Designated | | | | |
| | | | | | | | | at fair value | | | | | | | | | at fair value | | | | |
| | | Available | | | Held for | | | through | | | | | | Held for | | | through | | | | |
| | | for sale | | | trading | | | profit or loss | | | Derivatives | | | trading | | | profit or loss | | | Derivatives | |
| | | US$m | | | US$m | | | US$m | | | US$m | | | US$m | | | US$m | | | US$m | |
At 31 December 2010 | | | | | | | | | | | | | | | | | | | | | | | | | | | | |
| Private equity including strategic investments | | | 4,057 | | | | 278 | | | | 120 | | | | – | | | | – | | | | – | | | | – | |
| Asset-backed securities | | | 1,949 | | | | 566 | | | | – | | | | – | | | | – | | | | – | | | | – | |
| Leveraged finance | | | – | | | | – | | | | – | | | | – | | | | – | | | | – | | | | 11 | |
| Loans held for securitisation | | | – | | | | 1,043 | | | | – | | | | – | | | | – | | | | – | | | | – | |
| Structured notes | | | – | | | | – | | | | – | | | | – | | | | 10,667 | | | | – | | | | – | |
| Derivatives with monolines | | | – | | | | – | | | | – | | | | 1,005 | | | | – | | | | – | | | | – | |
| Other derivatives | | | – | | | | – | | | | – | | | | 2,956 | | | | – | | | | – | | | | 3,787 | |
| Other portfolios | | | 2,231 | | | | 3,802 | | | | 467 | | | | – | | | | 726 | | | | 570 | | | | 8 | |
| | | | | | | | | | | | | | | |
| | | | | | | | | | | | | | | | | | | | | | | | | | | | | |
| | | | 8,237 | | | | 5,689 | | | | 587 | | | | 3,961 | | | | 11,393 | | | | 570 | | | | 3,806 | |
312
Notes on the Financial Statements(continued)
| | | | | | | | | | | | | | | | | | | | | | | | | | | | | |
| | | Assets | | Liabilities |
| | | | | | | | | | | Designated | | | | | | | | | | | Designated | | | | |
| | | | | | | | | | | at fair value | | | | | | | | | | | at fair value | | | | |
| | | Available | | | Held for | | | through | | | | | | | Held for | | | through | | | | |
| | | for sale | | | trading | | | profit or loss | | | Derivatives | | | trading | | | profit or loss | | | Derivatives | |
| | | US$m | | | US$m | | | US$m | | | US$m | | | US$m | | | US$m | | | US$m | |
| At 31 December 2009 | | | | | | | | | | | | | | | | | | | | | | | | | | | | |
| Private equity and strategic investments | | | 2,949 | | | | 197 | | | | 345 | | | | – | | | | – | | | | – | | | | – | |
| Asset-backed securities | | | 4,270 | | | | 944 | | | | – | | | | – | | | | – | | | | – | | | | – | |
| Leveraged finance | | | – | | | | 73 | | | | – | | | | – | | | | – | | | | – | | | | 25 | |
| Loans held for securitisation | | | – | | | | 1,395 | | | | – | | | | – | | | | – | | | | – | | | | – | |
| Structured notes | | | – | | | | 196 | | | | – | | | | – | | | | 5,055 | | | | – | | | | – | |
| Derivatives with monolines | | | – | | | | – | | | | – | | | | 1,305 | | | | – | | | | – | | | | – | |
| Other derivatives | | | – | | | | – | | | | – | | | | 3,148 | | | | – | | | | – | | | | 5,167 | |
| Other portfolios | | | 2,995 | | | | 3,615 | | | | 879 | | | | – | | | | 3,719 | | | | 507 | | | | – | |
| | | | | | | | | | | | | | | |
| | | | | | | | | | | | | | | | | | | | | | | | | | | | | |
| | | | 10,214 | | | | 6,420 | | | | 1,224 | | | | 4,453 | | | | 8,774 | | | | 507 | | | | 5,192 | |
| | | | | | | | | | | | | | | |
Private equity and strategic investments
HSBC’s private equity and strategic investments are generally classified as available for sale and are not traded in active markets. In the absence of an active market, an investment’s fair value is estimated on the basis of an analysis of the investee’s financial position and results, risk profile, prospects and other factors, as well as by reference to market valuations for similar entities quoted in an active market, or the price at which similar companies have changed ownership.
Asset-backed securities
Illiquidity and a lack of transparency in the market for ABSs have resulted in less observable data being available. While quoted market prices are generally used to determine the fair value of these securities, valuation models are used to substantiate the reliability of the limited market data available and to identify whether any adjustments to quoted market prices are required. For ABSs including residential MBSs, the valuation uses an industry standard model and the assumptions relating to prepayment speeds, default rates and loss severity based on collateral type, and performance, as appropriate. The valuations output is benchmarked for consistency against observable data for securities of a similar nature.
Loans, including leveraged finance and loans held for securitisation
Loans held at fair value are valued from broker quotes and/or market data consensus providers when available. In the absence of an observable market, the fair value is determined using valuation techniques. These techniques include discounted cash flow models, which incorporate assumptions regarding an appropriate credit spread for the loan, derived from other market instruments issued by the same or comparable entities.
Structured notes
The fair value of structured notes valued using a valuation technique is derived from the fair value of the underlying debt security, and the fair value of the embedded derivative is determined as described in the paragraph below on derivatives.
Derivatives
OTC (i.e. non-exchange traded) derivatives are valued using valuation models. Valuation models calculate the present value of expected future cash flows, based upon ‘no-arbitrage’ principles. For many vanilla derivative products, such as interest rate swaps and European options, the modelling approaches used are standard across the industry. For more complex derivative products, there may be some differences in market practice. Inputs to valuation models are determined from observable market data wherever possible, including prices available from exchanges, dealers, brokers or providers of consensus pricing. Certain inputs may not be observable in the market directly, but can be determined from observable prices via model calibration procedures or estimated from historical data or other sources. Examples of inputs that may be unobservable include volatility surfaces, in whole or in part, for less commonly traded option products, and correlations between market factors such as foreign exchange rates, interest rates and equity prices. The valuation of derivatives with monolines is discussed on page 137.
313
Notes on the Financial Statements(continued)
Reconciliation of fair value measurements in Level 3 of the fair value hierarchy
The following table provides a reconciliation of the movement between opening and closing balances of Level 3 financial instruments, measured at fair value using a valuation technique with significant unobservable inputs:
Movement in Level 3 financial instruments
| | | | | | | | | | | | | | | | | | | | | | | | | | | | | |
| | | Assets | | Liabilities |
| | | | | | | | | Designated | | | | | | | | | Designated | | | | |
| | | | | | | | | at fair value | | | | | | | | | at fair value | | | | |
| | | Available | | | Held for | | | through | | | | | | Held for | | | through | | | | |
| | | for sale | | | trading | | | profit or loss | | | Derivatives | | | trading | | | profit or loss | | | Derivatives | |
| | | US$m | | | US$m | | | US$m | | | US$m | | | US$m | | | US$m | | | US$m | |
2010 | | | | | | | | | | | | | | | | | | | | | | | | | | | | |
| At 1 January | | | 10,214 | | | | 6,420 | | | | 1,224 | | | | 4,453 | | | | 8,774 | | | | 507 | | | | 5,192 | |
| Total gains/(losses) recognised in profit or loss | | | 345 | | | | 158 | | | | 63 | | | | (675 | ) | | | 166 | | | | (11 | ) | | | (240 | ) |
Total gains/(losses) recognised in other comprehensive income1 | | | 618 | | | | (101 | ) | | | (36 | ) | | | (110 | ) | | | (157 | ) | | | 74 | | | | 93 | |
| Purchases | | | 3,708 | | | | 858 | | | | 81 | | | | – | | | | (356 | ) | | | – | | | | – | |
| New issuances | | | – | | | | – | | | | – | | | | – | | | | 4,025 | | | | – | | | | – | |
| Sales | | | (2,461 | ) | | | (1,543 | ) | | | (8 | ) | | | – | | | | – | | | | – | | | | – | |
| Settlements | | | (1,032 | ) | | | 1 | | | | (22 | ) | | | 64 | | | | (948 | ) | | | – | | | | (820 | ) |
| Transfers out | | | (7,065 | ) | | | (629 | ) | | | (894 | ) | | | (669 | ) | | | (1,750 | ) | | | – | | | | (1,003 | ) |
| Transfers in | | | 3,910 | | | | 525 | | | | 179 | | | | 898 | | | | 1,639 | | | | – | | | | 584 | |
| | | | | | | | | | | | | | | |
| | | | | | | | | | | | | | | | | | | | | | | | | | | | | |
| At 31 December | | | 8,237 | | | | 5,689 | | | | 587 | | | | 3,961 | | | | 11,393 | | | | 570 | | | | 3,806 | |
| | | | | | | | | | | | | | | |
| | | | | | | | | | | | | | | | | | | | | | | | | | | | | |
| Total gains/(losses) recognised in profit or loss relating to assets and liabilities held on 31 December: | | | 113 | | | | 116 | | | | 17 | | | | 268 | | | | 180 | | | | (14 | ) | | | 361 | |
| | | | | | | | | | | | | | | |
| – net interest income | | | 89 | | | | – | | | | – | | | | – | | | | – | | | | – | | | | – | |
| – trading income excluding net interest income | | | – | | | | 98 | | | | – | | | | 268 | | | | 198 | | | | – | | | | 361 | |
| – net interest income on trading activities | | | – | | | | 18 | | | | – | | | | – | | | | (18) | | | | – | | | | – | |
| – net income/(expense) from other financial instruments designated at fair value | | | – | | | | – | | | | 17 | | | | – | | | | – | | | | (14) | | | | – | |
| – dividend income | | | 24 | | | | – | | | | – | | | | – | | | | – | | | | – | | | | – | |
| | | | | | | | | | | | | | | |
| | | | | | | | | | | | | | | | | | | | | | | | | | | | | |
| 2009 | | | | | | | | | | | | | | | | | | | | | | | | | | | | |
| At 1 January | | | 9,116 | | | | 7,561 | | | | 460 | | | | 9,883 | | | | 6,509 | | | | – | | | | 3,805 | |
| Total gains/(losses) recognised in profit or loss | | | (260 | ) | | | (730 | ) | | | 97 | | | | (5,275 | ) | | | (107 | ) | | | (3 | ) | | | (1,372 | ) |
Total gains recognised in other comprehensive income1 | | | 617 | | | | 85 | | | | – | | | | 119 | | | | 301 | | | | 10 | | | | 94 | |
| Purchases | | | 1,785 | | | | 1,598 | | | | 260 | | | | – | | | | 22 | | | | – | | | | – | |
| New issuances | | | – | | | | – | | | | – | | | | – | | | | 2,522 | | | | 500 | | | | – | |
| Sales | | | (806 | ) | | | (2,166 | ) | | | (13 | ) | | | – | | | | – | | | | – | | | | – | |
| Settlements | | | (1,059 | ) | | | (295 | ) | | | (6 | ) | | | (104 | ) | | | (1,266 | ) | | | – | | | | (206 | ) |
| Transfers out | | | (3,043 | ) | | | (1,077 | ) | | | – | | | | (1,057 | ) | | | (537 | ) | | | – | | | | (620 | ) |
| Transfers in | | | 3,864 | | | | 1,444 | | | | 426 | | | | 887 | | | | 1,330 | | | | – | | | | 3,491 | |
| | | | | | | | | | | | | | | |
| | | | | | | | | | | | | | | | | | | | | | | | | | | | | |
| At 31 December | | | 10,214 | | | | 6,420 | | | | 1,224 | | | | 4,453 | | | | 8,774 | | | | 507 | | | | 5,192 | |
| | | | | | | | | | | | | | | |
| | | | | | | | | | | | | | | | | | | | | | | | | | | | | |
| Total gains/(losses) recognised in profit or loss relating to assets and liabilities held on 31 December: | | | (371 | ) | | | (596 | ) | | | 98 | | | | (3,753 | ) | | | (136 | ) | | | (3 | ) | | | (135 | ) |
| | | | | | | | | | | | | | | |
| – net interest income | | | (364) | | | | – | | | | – | | | | – | | | | – | | | | – | | | | – | |
| – trading income excluding net interest income | | | – | | | | (640) | | | | 98 | | | | (3,753) | | | | (135) | | | | – | | | | (135) | |
| – net interest income on trading activities | | | – | | | | 44 | | | | – | | | | – | | | | (1) | | | | – | | | | – | |
| – gains less losses from financial investments | | | (9) | | | | – | | | | – | | | | – | | | | – | | | | – | | | | – | |
| – net income/(expense) from other financial instruments designated at fair value | | | – | | | | – | | | | – | | | | – | | | | – | | | | (3) | | | | – | |
| – dividend income | | | 2 | | | | – | | | | – | | | | – | | | | – | | | | – | | | | – | |
| | | | | | | | | | | | | | | |
| | |
| 1 | | Included in ‘Available-for-sale investments: Fair value gains/(losses)’ and ‘Exchange differences’ in the consolidated statement of comprehensive income. |
314
Notes on the Financial Statements(continued)
Available-for-sale securities:Greater pricing certainty of valuations in ABS markets (particularly MBS) has resulted in the transfer of assets out of Level 3 during 2010. Transfers into Level 3 were primarily related to strategic investments in Asia.
Trading assets:Greater pricing certainty of valuations in ABS markets (particularly MBS) and certain corporate bonds has resulted in the transfer of assets out of Level 3 during 2010. Transfers into Level 3 were driven by certain other corporate bonds for which pricing certainty decreased. Sales relate to disposals of whole loans, municipal bonds and various ABSs.
Derivative assets:Transfers out of Level 3 were driven by increased observability of longer-dated equity index volatility, particularly in Asian markets. Transfers in relate primarily to quanto structured credit transactions. Commutations of monoline derivatives and the narrowing of credit spreads have led to an overall reduction in the value of Level 3 assets.
Trading liabilities:Transfers out of and in to Level 3 relate primarily to increased / decreased observability of structured notes with embedded equity derivatives. New issuances relate to structured notes particularly those with embedded equity derivatives issued in the US.
Derivative liabilities:The increased observability in certain OTC equity derivative markets primarily in Asia led to transfers out of Level 3. Transfers in were driven by structured credit transactions.
Effect of changes in significant unobservable assumptions to reasonably possible alternatives
As discussed above, the fair value of financial instruments are, in certain circumstances, measured using valuation techniques that incorporate assumptions that are not evidenced by prices from observable current market transactions in the same instrument and are not based on observable market data. The following table shows the sensitivity of these fair values to reasonably possible alternative assumptions:
Sensitivity of fair values to reasonably possible alternative assumptions
| | | | | | | | | | | | | | | | | |
| | | | | | | | | | | Reflected in other |
| | | Reflected in profit or loss | | comprehensive income |
| | | Favourable | | | Unfavourable | | | Favourable | | | Unfavourable | |
| | | changes | | | changes | | | changes | | | changes | |
| | | US$m | | | US$m | | | US$m | | | US$m | |
At 31 December 2010 | | | | | | | | | | | | | | | | |
Derivatives, trading assets and trading liabilities1 | | | 554 | | | | (444 | ) | | | – | | | | – | |
| Financial assets and liabilities designated at fair value | | | 77 | | | | (75 | ) | | | – | | | | – | |
| Financial investments: available for sale | | | – | | | | – | | | | 763 | | | | (744 | ) |
| | | | | | | | | |
| | | | | | | | | | | | | | | | | |
| | | | 631 | | | | (519 | ) | | | 763 | | | | (744 | ) |
| | | | | | | | | |
| | | | | | | | | | | | | | | | | |
| At 31 December 2009 | | | | | | | | | | | | | | | | |
Derivatives, trading assets and trading liabilities1 | | | 984 | | | | (577 | ) | | | – | | | | – | |
| Financial assets and liabilities designated at fair value | | | 102 | | | | (98 | ) | | | – | | | | – | |
| Financial investments: available for sale | | | – | | | | – | | | | 1,161 | | | | (1,157 | ) |
| | | | | | | | | |
| | | | | | | | | | | | | | | | | |
| | | | 1,086 | | | | (675 | ) | | | 1,161 | | | | (1,157 | ) |
| | | | | | | | | |
| | |
| 1 | | Derivatives, trading assets and trading liabilities are presented as one category to reflect the manner in which these financial instruments are risk-managed. |
The decrease in the effect of changes in significant unobservable inputs in relation to derivatives, trading assets and trading liabilities during the year primarily reflected the decreased sensitivity to monoline credit risk adjustment assumptions as exposures have reduced. The decrease in the effect of changes in significant unobservable inputs for available-for-sale assets arose from increased pricing certainty in respect of ABSs.
315
Notes on the Financial Statements(continued)
Sensitivity of fair values to reasonably possible alternative assumptions by Level 3 instrument type
| | | | | | | | | | | | | | | | | |
| | | | | Reflected in other |
| | | Reflected in profit or loss | | comprehensive income |
| | | Favourable | | | Unfavourable | | | Favourable | | | Unfavourable | |
| | | changes | | | changes | | | changes | | | changes | |
| | | US$m | | | US$m | | | US$m | | | US$m | |
At 31 December 2010 | | | | | | | | | | | | | | | | |
| Private equity investments | | | 112 | | | | (71 | ) | | | 383 | | | | (383 | ) |
| Asset-backed securities | | | 8 | | | | (8 | ) | | | 179 | | | | (181 | ) |
| Loans held for securitisation | | | 8 | | | | (8 | ) | | | – | | | | – | |
| Structured notes | | | 18 | | | | (16 | ) | | | – | | | | – | |
| Derivatives with monolines | | | 94 | | | | (8 | ) | | | – | | | | – | |
| Other derivatives | | | 256 | | | | (258 | ) | | | – | | | | – | |
| Other portfolios | | | 135 | | | | (150 | ) | | | 201 | | | | (180 | ) |
| | | | | | | | | |
| | | | | | | | | | | | | | | | | |
| | | | 631 | | | | (519 | ) | | | 763 | | | | (744 | ) |
| | | | | | | | | |
| | | | | | | | | | | | | | | | | |
| At 31 December 2009 | | | | | | | | | | | | | | | | |
| Private equity investments | | | 54 | | | | (54 | ) | | | 302 | | | | (299 | ) |
| Asset-backed securities | | | 41 | | | | (41 | ) | | | 734 | | | | (735 | ) |
| Leveraged finance | | | 1 | | | | (1 | ) | | | – | | | | – | |
| Loans held for securitisation | | | 16 | | | | (16 | ) | | | – | | | | – | |
| Structured notes | | | 3 | | | | (3 | ) | | | – | | | | – | |
| Derivatives with monolines | | | 333 | | | | (25 | ) | | | – | | | | – | |
| Other derivatives | | | 309 | | | | (332 | ) | | | – | | | | – | |
| Other portfolios | | | 329 | | | | (203 | ) | | | 125 | | | | (123 | ) |
| | | | | | | | | |
| | | | | | | | | | | | | | | | | |
| | | | 1,086 | | | | (675 | ) | | | 1,161 | | | | (1,157 | ) |
| | | | | | | | | |
Favourable and unfavourable changes are determined on the basis of changes in the value of the instrument as a result of varying the levels of the unobservable parameters using statistical techniques. When parameters are not amenable to statistical analysis, quantification of uncertainty is judgemental.
When the fair value of a financial instrument is affected by more than one unobservable assumption, the above table reflects the most favourable or most unfavourable change from varying the assumptions individually.
In respect of private equity investments, in many of the methodologies, the principal assumption is the valuation multiple to be applied to the main financial indicators. This may be determined with reference to multiples for comparable listed companies and includes discounts for marketability.
For ABSs, the principal assumptions in the models are based on benchmark information about prepayment speeds, default rates, loss severities and the historical performance of the underlying assets.
For leveraged finance, loans held for securitisation and derivatives with monolines the principal assumption concerns the appropriate value to be attributed to the counterparty credit risk. This requires estimation of exposure at default, probability of default and recovery in the event of default. For loan transactions, assessment of exposure at default is straightforward. For derivative transactions, a future exposure profile is generated on the basis of current market data. Probabilities of default and recovery levels are estimated using available evidence, which may include financial information, historical experience, CDS spreads and consensus recovery levels.
For structured notes and other derivatives, principal assumptions concern the value to be attributed to future volatility of asset values and the future correlation between asset values. These principal assumptions include credit volatilities and correlations used in the valuation of structured credit derivatives (including leveraged credit derivatives). For such unobservable assumptions, estimates are based on available market data, which may include the use of a proxy method to derive a volatility or a correlation from comparable assets for which market data is more readily available, and/or an examination of historical levels.
316
Notes on the Financial Statements(continued)
HSBC Holdings
The following table provides an analysis of the basis for valuing financial assets and financial liabilities measured at fair value in the financial statements:
Bases of valuing HSBC Holdings’ financial assets and liabilities measured at fair value
| | | | | | | | | | | | | | | | | |
| | | | | | Valuation techniques | | | |
| | | | | | | | | | | With | | | | |
| | | Quoted | | | Using | | | significant | | | | |
| | | market | | | observable | | | unobservable | | | | |
| | | price | | | inputs | | | inputs | | | | |
| | | Level 1 | | | Level 2 | | | Level 3 | | | Total | |
| | | US$m | | | US$m | | | US$m | | | US$m | |
At 31 December 2010 | | | | | | | | | | | | | | | | |
| Assets | | | | | | | | | | | | | | | | |
| Derivatives | | | – | | | | 2,327 | | | | – | | | | 2,327 | |
| Financial investments: available for sale | | | – | | | | – | | | | 2,025 | | | | 2,025 | |
| | | | | | | | | | | | | | | | | |
| Liabilities | | | | | | | | | | | | | | | | |
| Financial liabilities designated at fair value | | | 12,029 | | | | 4,259 | | | | – | | | | 16,288 | |
| Derivatives | | | – | | | | 827 | | | | – | | | | 827 | |
| |
| At 31 December 2009 | | | | | | | | | | | | | | | | |
| Assets | | | | | | | | | | | | | | | | |
| Derivatives | | | – | | | | 2,981 | | | | – | | | | 2,981 | |
| Financial investments: available for sale | | | – | | | | – | | | | 2,455 | | | | 2,455 | |
| | | | | | | | | | | | | | | | | |
| Liabilities | | | | | | | | | | | | | | | | |
| Financial liabilities designated at fair value | | | 12,549 | | | | 4,360 | | | | – | | | | 16,909 | |
| Derivatives | | | – | | | | 362 | | | | – | | | | 362 | |
Financial instruments measured at fair value – Level 3
Financial investments measured using a valuation technique with significant unobservable inputs (Level 3) comprise fixed-rate preferred securities and senior notes purchased from HSBC undertakings. The unobservable elements of the valuation technique include the use of implied credit spreads and simplified bond pricing assumptions.
Movement in Level 3 financial instruments available for sale
| | | | | | | | | |
| | | 2010 | | | 2009 | |
| | | US$m | | | US$m | |
| | | | | | | | | |
| At 1 January | | | 2,455 | | | | 2,629 | |
| Total gains or losses: | | | | | | | | |
| – recognised in profit or loss | | | (155 | ) | | | (2 | ) |
| – recognised in other comprehensive income | | | (275 | ) | | | 103 | |
| Settlements | | | – | | | | (275 | ) |
| | | | | | |
| | | | | | | | | |
| At 31 December | | | 2,025 | | | | 2,455 | |
| | | | | | |
| | | | | | | | | |
| Total gains or losses recognised in profit or loss relating to those assets and liabilities held on 31 December | | | (1 | ) | | | (2 | ) |
In certain circumstances, the fair value of financial instruments are measured using valuation models that incorporate assumptions that are not supported by prices from observable current market transactions in the same instrument and are not based on observable market data. The following table shows the sensitivity of non-derivative financial instruments to reasonably possible alternative assumptions:
Effect of changes in significant unobservable assumptions to reasonably possible alternatives
| | | | | | | | | |
| | | Reflected in equity |
| | | Favourable | | | Unfavourable | |
| | | changes | | | changes | |
| | | US$m | | | US$m | |
Financial investments: available for sale | | | | | | | | |
| | | | | | | | | |
At 31 December 2010 | | | 34 | | | | (33 | ) |
| At 31 December 2009 | | | 115 | | | | (107 | ) |
317
Notes on the Financial Statements(continued)
17 Fair values of financial instruments not carried at fair value
The classification of financial instruments is determined in accordance with the accounting policies set out in Note 2.
Fair values of financial instruments which are not carried at fair value on the balance sheet
| | | | | | | | | | | | | | | | | |
| | | At 31 December 2010 | | At 31 December 2009 | |
| | | Carrying | | | Fair | | | Carrying | | | Fair | |
| | | amount | | | value | | | amount | | | value | |
| | | US$m | | | US$m | | | US$m | | | US$m | |
Assets | | | | | | | | | | | | | | | | |
| Loans and advances to banks | | | 208,271 | | | | 208,311 | | | | 179,781 | | | | 179,658 | |
| Loans and advances to customers | | | 958,366 | | | | 934,444 | | | | 896,231 | | | | 855,780 | |
| Financial investments: debt securities | | | 19,386 | | | | 20,374 | | | | 17,526 | | | | 18,097 | |
| Financial investments: treasury and other eligible bills | | | 113 | | | | 113 | | | | 101 | | | | 101 | |
| | | | | | | | | | | | | | | | | |
Liabilities | | | | | | | | | | | | | | | | |
| Deposits by banks | | | 110,584 | | | | 110,563 | | | | 124,872 | | | | 124,856 | |
| Customer accounts | | | 1,227,725 | | | | 1,227,428 | | | | 1,159,034 | | | | 1,160,036 | |
| Debt securities in issue | | | 145,401 | | | | 145,417 | | | | 146,896 | | | | 145,888 | |
| Subordinated liabilities | | | 33,387 | | | | 33,161 | | | | 30,478 | | | | 30,307 | |
Fair values of financial instruments held for sale which are not carried at fair value on the balance sheet
| | | | | | | | | | | | | | | | | |
| | | At 31 December 2010 | | At 31 December 2009 | |
| | | Carrying | | | Fair | | | Carrying | | | Fair | |
| | | amount | | | value | | | amount | | | value | |
| | | US$m | | | US$m | | | US$m | | | US$m | |
Assets classified as held for sale | | | | | | | | | | | | | | | | |
| Loans and advances to banks and customers | | | 116 | | | | 116 | | | | 1,356 | | | | 1,316 | |
The following is a list of financial instruments whose carrying amount is a reasonable approximation of fair value because, for example, they are short-term in nature or reprice to current market rates frequently:
Assets
Cash and balances at central banks
Items in the course of collection from other banks
Hong Kong Government certificates of indebtedness
Endorsements and acceptances
Short-term receivables within ‘Other assets’
Accrued income
Liabilities
Hong Kong currency notes in circulation
Items in the course of transmission to other banks
Investment contracts with discretionary participation features within ‘Liabilities under insurance contracts’
Endorsements and acceptances
Short-term payables within ‘Other liabilities’
Accruals
Analysis of loans and advances to customers by geographical segment
| | | | | | | | | | | | | | | | | |
| | | At 31 December 2010 | | At 31 December 2009 | |
| | | Carrying | | | Fair | | | Carrying | | | Fair | |
| | | amount | | | value | | | amount | | | value | |
| | | US$m | | | US$m | | | US$m | | | US$m | |
Loans and advances to customers | | | | | | | | | | | | | | | | |
| Europe | | | 435,799 | | | | 430,333 | | | | 439,481 | | | | 431,158 | |
| Hong Kong | | | 140,691 | | | | 140,699 | | | | 99,381 | | | | 99,694 | |
| Rest of Asia-Pacific | | | 108,731 | | | | 108,582 | | | | 80,043 | | | | 79,972 | |
| Middle East | | | 24,626 | | | | 24,539 | | | | 22,844 | | | | 22,538 | |
| North America | | | 190,532 | | | | 172,522 | | | | 206,853 | | | | 174,957 | |
| Latin America | | | 57,987 | | | | 57,769 | | | | 47,629 | | | | 47,461 | |
| | | | | | | | | | | |
| | | | 958,366 | | | | 934,444 | | | | 896,231 | | | | 855,780 | |
| | | | | | | | | | | |
318
Notes on the Financial Statements(continued)
Valuation
The calculation of fair value incorporates HSBC’s estimate of the amount at which financial assets could be exchanged, or financial liabilities settled, between knowledgeable, willing parties in an arm’s length transaction. It does not reflect the economic benefits and costs that HSBC expects to flow from the instruments’ cash flows over their expected future lives. Other reporting entities may use different valuation methodologies and assumptions in determining fair values for which no observable market prices are available, so comparisons of fair values between entities may not be meaningful and users are advised to exercise caution when using this data.
Loans and advances to banks and customers
The fair value of loans and advances is based on observable market transactions, where available. In the absence of observable market transactions, fair value is estimated using discounted cash flow models.
Performing loans are grouped, as far as possible, into homogeneous pools segregated by maturity and interest rates and the contractual cash flows are generally discounted using HSBC’s estimate of the discount rate that a market participant would use in valuing instruments with similar maturity, re-pricing and credit risk characteristics.
The fair value of a loan portfolio reflects both loan impairments at the balance sheet date and estimates of market participants’ expectations of credit losses over the life of the loans. For impaired loans, fair value is estimated by discounting the future cash flows over the time period they are expected to be recovered.
Financial investments
The fair values of listed financial investments are determined using bid market prices. The fair values of unlisted financial investments are determined using valuation techniques that take into consideration the prices and future earnings streams of equivalent quoted securities.
Deposits by banks and customer accounts
For the purpose of estimating fair value, deposits by banks and customer accounts are grouped by remaining contractual maturity. Fair values are estimated using discounted cash flows, applying current rates offered for deposits of similar remaining maturities. The fair value of a deposit repayable on demand is assumed to be the amount payable on demand at the balance sheet date.
Debt securities in issue and subordinated liabilities
Fair values are determined using quoted market prices at the balance sheet date where available, or by reference to quoted market prices for similar instruments.
The fair values in this note are stated at a specific date and may be significantly different from the amounts which will actually be paid on the maturity or settlement dates of the instruments. In many cases, it would not be possible to realise immediately the estimated fair values given the size of the portfolios measured. Accordingly, these fair values do not represent the value of these financial instruments to HSBC as a going concern.
HSBC Holdings
The methods used by HSBC Holdings to determine fair values of financial instruments for the purpose of measurement and disclosure are described above.
The following table provides an analysis of the fair value of financial instruments not carried at fair value on the balance sheet:
319
Notes on the Financial Statements(continued)
Fair values of HSBC Holdings’ financial instruments not carried at fair value on the balance sheet
| | | | | | | | | | | | | | | | | |
| | | At 31 December 2010 | | At 31 December 2009 |
| | | Carrying | | | Fair | | | Carrying | | | Fair | |
| | | amount | | | value | | | amount | | | value | |
| | | US$m | | | US$m | | | US$m | | | US$m | |
Assets | | | | | | | | | | | | | | | | |
| Loans and advances to HSBC undertakings | | | 21,238 | | | | 21,798 | | | | 23,212 | | | | 23,871 | |
| | | | | | | | | | | | | | | | | |
Liabilities | | | | | | | | | | | | | | | | |
| Amounts owed to HSBC undertakings | | | 2,932 | | | | 2,963 | | | | 3,711 | | | | 3,827 | |
| Debt securities in issue | | | 2,668 | | | | 2,960 | | | | 2,839 | | | | 3,141 | |
| Subordinated liabilities | | | 13,313 | | | | 14,428 | | | | 14,406 | | | | 15,666 | |
18 Reclassification of financial assets
During the second half of 2008, HSBC reclassified US$15.3bn and US$2.6bn of financial assets from the held-for-trading category to the loans and receivables and available-for-sale classifications, respectively, as permitted by the relevant amendment to IAS 39 and explained in Note 2(e) on the Financial Statements. No further reclassifications were undertaken by HSBC in 2010 and 2009.
Reclassification of HSBC’s financial assets
| | | | | | | | | | | | | | | | | |
| | | At 31 December 2010 | | At 31 December 2009 |
| | | Carrying | | | Fair | | | Carrying | | | Fair | |
| | | amount | | | value | | | amount | | | value | |
| | | US$m | | | US$m | | | US$m | | | US$m | |
Reclassification to loans and receivables | | | | | | | | | | | | | | | | |
| ABSs | | | 5,892 | | | | 4,977 | | | | 7,827 | | | | 6,177 | |
| Trading loans – commercial mortgage loans | | | 522 | | | | 493 | | | | 553 | | | | 506 | |
| Leveraged finance and syndicated loans | | | 4,533 | | | | 4,166 | | | | 5,824 | | | | 5,434 | |
| | | | | | | | | | | |
| | | | 10,947 | | | | 9,636 | | | | 14,204 | | | | 12,117 | |
Reclassification to available for sale | | | | | | | | | | | | | | | | |
| Corporate debt and other securities | | | 91 | | | | 91 | | | | 1,408 | | | | 1,408 | |
| | | | | | | | | | | |
| | | | 11,038 | | | | 9,727 | | | | 15,612 | | | | 13,525 | |
| | | | | | | | | | | |
The following table shows the fair value gains and losses, income and expense recognised in the income statement in respect of reclassified assets and the gains and losses that would have been recognised if no reclassification had taken place.
Effect of reclassifying and not reclassifying financial assets
| | | | | | | | | | | | | | | | | | | | | | | | | |
| | | Financial assets reclassified to: | | | | |
| | | | | | | | | | | | | | | | | | | available | | | | |
| | | loans and receivables | | | for sale | | | | |
| | | | | | | Trading loans | | | Leveraged | | | | | | | Corporate | | | | |
| | | | | | – commercial | | | finance and | | | | | | | debt and | | | | |
| | | | | | | mortgage | | | syndicated | | | | | | | other | | | | |
| | | ABSs | | | loans | | | loans | | | Total | | | securities | | | Total | |
| | | US$m | | | US$m | | | US$m | | | US$m | | | US$m | | | US$m | |
2010 | | | | | | | | | | | | | | | | | | | | | | | | |
Recorded in the income statement1 | | | 235 | | | | 29 | | | | 346 | | | | 610 | | | | 56 | | | | 666 | |
Assuming no reclassification2 | | | 908 | | | | 45 | | | | 307 | | | | 1,260 | | | | 59 | | | | 1,319 | |
| | | | | | | | | | | | | | | | | | | |
| Net effect of reclassification | | | (673 | ) | | | (16 | ) | | | 39 | | | | (650 | ) | | | (3 | ) | | | (653 | ) |
| | | | | | | | | | | | | | | | | | | |
| | | | | | | | | | | | | | | | | | | | | | | | | |
| Attributable to: | | | | | | | | | | | | | | | | | | | | | | | | |
| Europe | | | (527 | ) | | | (16 | ) | | | (23 | ) | | | (566 | ) | | | (2 | ) | | | (568 | ) |
| North America | | | (146 | ) | | | – | | | | 49 | | | | (97 | ) | | | (1 | ) | | | (98 | ) |
| Middle East | | | – | | | | – | | | | 13 | | | | 13 | | | | – | | | | 13 | |
320
Notes on the Financial Statements(continued)
| | | | | | | | | | | | | | | | | | | | | | | | | |
| | | Financial assets reclassified to: | | | |
| | | | | | | | | | | | | | | | | | | available | | | | |
| | | loans and receivables | | for sale | | | | |
| | | | | | | Trading loans | | | Leveraged | | | | | | | Corporate | | | | |
| | | | | | | – commercial | | | finance and | | | | | | | debt and | | | | |
| | | | | | | mortgage | | | syndicated | | | | | | | other | | | | |
| | | ABSs | | | loans | | | loans | | | Total | | | securities | | | Total | |
| | | US$m | | | US$m | | | US$m | | | US$m | | | US$m | | | US$m | |
| 2009 | | | | | | | | | | | | | | | | | | | | | | | | |
Recorded in the income statement1 | | | 511 | | | | 32 | | | | 434 | | | | 977 | | | | 101 | | | | 1,078 | |
Assuming no reclassification2 | | | 767 | | | | 15 | | | | 1,494 | | | | 2,276 | | | | 301 | | | | 2,577 | |
| | | | | | | | | | | | | |
| 2008 | | | | | | | | | | | | | | | | | | | | | | | | |
| Net effect of reclassification | | | (256 | ) | | | 17 | | | | (1,060 | ) | | | (1,299 | ) | | | (200 | ) | | | (1,499 | ) |
| | | | | | | | | | | | | |
| | | | | | | | | | | | | | | | | | | | | | | | | |
| Attributable to: | | | | | | | | | | | | | | | | | | | | | | | | |
| Europe | | | (212 | ) | | | 17 | | | | (566 | ) | | | (761 | ) | | | (170 | ) | | | (931 | ) |
| North America | | | (44 | ) | | | – | | | | (543 | ) | | | (587 | ) | | | (30 | ) | | | (617 | ) |
| Middle East | | | – | | | | – | | | | 49 | | | | 49 | | | | – | | | | 49 | |
| | | | | | | | | | | | | | | | | | | | | | | | | |
| 2008 | | | | | | | | | | | | | | | | | | | | | | | | |
Recorded in the income statement1 | | | 303 | | | | 17 | | | | 192 | | | | 512 | | | | 22 | | | | 534 | |
Assuming no reclassification2 | | | (1,549 | ) | | | (13 | ) | | | (1,239 | ) | | | (2,801 | ) | | | (202 | ) | | | (3,003 | ) |
| | | | | | | | | | | | | |
| 2008 | | | | | | | | | | | | | | | | | | | | | | | | |
| Net effect of reclassification | | | 1,852 | | | | 30 | | | | 1,431 | | | | 3,313 | | | | 224 | | | | 3,537 | |
| | | | | | | | | | | | | |
| | | | | | | | | | | | | | | | | | | | | | | | | |
| Attributable to: | | | | | | | | | | | | | | | | | | | | | | | | |
| Europe | | | 1,537 | | | | 30 | | | | 803 | | | | 2,370 | | | | 193 | | | | 2,563 | |
| North America | | | 315 | | | | – | | | | 601 | | | | 916 | | | | 31 | | | | 947 | |
| Middle East | | | – | | | | – | | | | 27 | | | | 27 | | | | – | | | | 27 | |
| | |
| 1 | | ‘Income and expense’ recorded in the income statement represents the accrual of the effective interest rate and, for 2010, includes US$6m in respect of impairment (2009: US$163m; 2008: US$26m). The effect on the income statement for 2008 shows the income and expense post-reclassification. In 2008 pre-reclassification, the assets were held at fair value and a loss of US$1,371m was recorded in the period up to reclassification. |
| |
| 2 | | Effect on the income statement during the year had the reclassification not occurred. |
19 Financial assets designated at fair value
| | | | | | | | | |
| | | 2010 | | | 2009 | |
| | | US$m | | | US$m | |
| Financial assets designated at fair value: | | | | | | | | |
| – not subject to repledge or resale by counterparties | | | 36,990 | | | | 37,166 | |
| – which may be repledged or resold by counterparties | | | 21 | | | | 15 | |
| | | | | | |
| | | | | | | | | |
| | | | 37,011 | | | | 37,181 | |
| | | | | | |
| | | | | | | | | |
| Treasury and other eligible bills | | | 159 | | | | 223 | |
| Debt securities | | | 18,248 | | | | 20,718 | |
| Equity securities | | | 17,418 | | | | 14,983 | |
| | | | | | |
| Securities designated at fair value | | | 35,825 | | | | 35,924 | |
| Loans and advances to banks | | | 315 | | | | 354 | |
| Loans and advances to customers | | | 871 | | | | 903 | |
| | | | | | |
| | | | | | | | | |
| | | | 37,011 | | | | 37,181 | |
| | | | | | |
Securities designated at fair value
| | | | | | | | | |
| | | Fair value1 | |
| | | 2010 | | | 2009 | |
| | | US$m | | | US$m | |
| | | | | | | | | |
US Treasury and US Government agencies2 | | | 78 | | | | 78 | |
| UK Government | | | 1,304 | | | | 4,799 | |
| Hong Kong Government | | | 151 | | | | 177 | |
| Other government | | | 4,130 | | | | 3,491 | |
Asset-backed securities3 | | | 6,128 | | | | 6,463 | |
| Corporate debt and other securities | | | 6,616 | | | | 5,933 | |
| Equities | | | 17,418 | | | | 14,983 | |
| | | | | | |
| | | | | | | | | |
| | | | 35,825 | | | | 35,924 | |
| | | | | | |
| | |
| 1 | | Included within these figures are debt securities issued by banks and other financial institutions of US$10,185m (2009: US$13,745m), of which US$48m (2009: US$49m) are guaranteed by various governments. |
| |
| 2 | | Includes securities that are supported by an explicit guarantee issued by the US Government. |
| |
| | | 3Excludes asset-backed securities included under US Treasury and US Government agencies. |
321
Notes on the Financial Statements(continued)
Securities listed on a recognised exchange and unlisted
| | | | | | | | | | | | | | | | | |
| | | Treasury | | | | | | | | | | |
| | | and other | | | Debt | | | Equity | | | | |
| | | eligible bills | | | securities | | | securities | | | Total | |
| | | US$m | | | US$m | | | US$m | | | US$m | |
Fair value at 31 December 2010 | | | | | | | | | | | | | | | | |
Listed on a recognised exchange1 | | | 21 | | | | 4,168 | | | | 12,548 | | | | 16,737 | |
| Unlisted | | | 138 | | | | 14,080 | | | | 4,870 | | | | 19,088 | |
| | | | | | | | | |
| | | | 159 | | | | 18,248 | | | | 17,418 | | | | 35,825 | |
| | | | | | | | | |
| | | | | | | | | | | | | | | | | |
| Fair value at 31 December 2009 | | | | | | | | | | | | | | | | |
Listed on a recognised exchange1 | | | 78 | | | | 7,168 | | | | 10,549 | | | | 17,795 | |
| Unlisted | | | 145 | | | | 13,550 | | | | 4,434 | | | | 18,129 | |
| | | | | | | | | |
| | | | | | | | | | | | | | | | | |
| | | | 223 | | | | 20,718 | | | | 14,983 | | | | 35,924 | |
| | | | | | | | | |
| | |
| 1 | | Included within listed investments are US$756m of investments listed in Hong Kong (2009: US$506m). |
20 Derivatives
Fair values of derivatives by product contract type held by HSBC
| | | | | | | | | | | | | | | | | | | | | | | | | |
| | | Assets | | | Liabilities | |
| | | Trading | | | Hedging | | | Total | | | Trading | | | Hedging | | | Total | |
| | | US$m | | | US$m | | | US$m | | | US$m | | | US$m | | | US$m | |
At 31 December 2010 | | | | | | | | | | | | | | | | | | | | | | | | |
| Foreign exchange | | | 65,905 | | | | 1,304 | | | | 67,209 | | | | 67,564 | | | | 340 | | | | 67,904 | |
| Interest rate | | | 278,364 | | | | 2,764 | | | | 281,128 | | | | 273,222 | | | | 3,909 | | | | 277,131 | |
| Equity | | | 13,983 | | | | – | | | | 13,983 | | | | 14,716 | | | | – | | | | 14,716 | |
| Credit | | | 20,907 | | | | – | | | | 20,907 | | | | 20,027 | | | | – | | | | 20,027 | |
| Commodity and other | | | 1,261 | | | | – | | | | 1,261 | | | | 2,618 | | | | – | | | | 2,618 | |
| | | | | | | | | | | | | |
| Gross total fair values | | | 380,420 | | | | 4,068 | | | | 384,488 | | | | 378,147 | | | | 4,249 | | | | 382,396 | |
| | | | | | | | | | | | | | | | | |
| Netting | | | | | | | | | | | (123,731 | ) | | | | | | | | | | | (123,731 | ) |
| | | | | | | | | | | | | | | | | | | | | |
| Total | | | | | | | | | | | 260,757 | | | | | | | | | | | | 258,665 | |
| | | | | | | | | | | | | | | | | | | | | |
| | | | | | | | | | | | | | | | | | | | | | | | | |
| At 31 December 2009 | | | | | | | | | | | | | | | | | | | | | | | | |
| Foreign exchange | | | 55,036 | | | | 1,695 | | | | 56,731 | | | | 54,502 | | | | 300 | | | | 54,802 | |
| Interest rate | | | 212,102 | | | | 3,506 | | | | 215,608 | | | | 209,351 | | | | 3,274 | | | | 212,625 | |
| Equity | | | 15,729 | | | | – | | | | 15,729 | | | | 19,013 | | | | – | | | | 19,013 | |
| Credit | | | 28,479 | | | | – | | | | 28,479 | | | | 27,042 | | | | – | | | | 27,042 | |
| Commodity and other | | | 1,135 | | | | – | | | | 1,135 | | | | 960 | | | | – | | | | 960 | |
| | | | | | | | | | | | | |
| Gross total fair values | | | 312,481 | | | | 5,201 | | | | 317,682 | | | | 310,868 | | | | 3,574 | | | | 314,442 | |
| | | | | | | | | | | | | | | | | |
| Netting | | | | | | | | | | | (66,796 | ) | | | | | | | | | | | (66,796 | ) |
| | | | | | | | | | | | | | | | | | | | | |
| Total | | | | | | | | | | | 250,886 | | | | | | | | | | | | 247,646 | |
| | | | | | | | | | | | | | | | | | | | | |
The 4% increase in the fair value of derivative assets during 2010 was driven both by this increased volume of open trades and by small net declines in yield curves of major currencies over the year. The netting adjustment increased as increasing volumes of transactions, particularly interest rate derivatives and credit derivatives, were executed through clearing houses, where the settlement arrangements satisfied the IFRS netting criteria.
Fair values of derivatives by product contract type held by HSBC Holdings with subsidiaries
| | | | | | | | | | | | | | | | | |
| | | At 31 December 2010 | | | At 31 December 2009 | |
| | | Trading | | | Trading | | | Trading | | | Trading | |
| | | assets | | | liabilities | | | assets | | | liabilities | |
| | | US$m | | | US$m | | | US$m | | | US$m | |
| | | | | | | | | | | | | | | | | |
| Foreign exchange | | | 1,407 | | | | 827 | | | | 2,250 | | | | 362 | |
| Interest rate | | | 920 | | | | – | | | | 731 | | | | – | |
| | | | | | | | | |
| | | | 2,327 | | | | 827 | | | | 2,981 | | | | 362 | |
| | | | | | | | | |
322
Notes on the Financial Statements(continued)
Derivatives are financial instruments that derive their value from the price of underlying items such as equities, bonds, interest rates, foreign exchange, credit spreads, commodities and equity or other indices. Derivatives enable users to increase, reduce or alter exposure to credit or market risks. HSBC makes markets in derivatives for its customers and uses derivatives to manage its exposure to credit and market risks.
Derivatives are carried at fair value and shown in the balance sheet as separate totals of assets and liabilities. A description of how the fair value of derivatives is derived is set out on page 313. Derivative assets and liabilities on different transactions are only set off if the transactions are with the same counterparty, a legal right of set-off exists and the cash flows are intended to be settled on a net basis.
Use of derivatives
HSBC transacts derivatives for three primary purposes: to create risk management solutions for clients, to manage the portfolio risks arising from client business and to manage and hedge HSBC’s own risks. Derivatives (except for derivatives which are designated as effective hedging instruments as defined in IAS 39) are held for trading. The held for trading classification includes two types of derivatives: those used in sales and trading activities, and those used for risk management purposes but which for various reasons do not meet the qualifying criteria for hedge accounting. The second category includes derivatives managed in conjunction with financial instruments designated at fair value. These activities are described more fully below.
HSBC’s derivative activities give rise to significant open positions in portfolios of derivatives. These positions are managed constantly to ensure that they remain within acceptable risk levels, with matching deals being utilised to achieve this where necessary. When entering into derivative transactions, HSBC employs the same credit risk management procedures to assess and approve potential credit exposures that are used for traditional lending.
Trading derivatives
Most of HSBC’s derivative transactions relate to sales and trading activities. Sales activities include the structuring and marketing of derivative products to customers to enable them to take, transfer, modify or reduce current or expected risks. Trading activities in derivatives are entered into principally for the purpose of generating profits from short-term fluctuations in price or margin. Positions may be traded actively or be held over a period of time to benefit from expected changes in exchange rates, interest rates, equity prices or other market parameters. Trading includes market-making, positioning and arbitrage activities. Market-making entails quoting bid and offer prices to other market participants for the purpose of generating revenues based on spread and volume; positioning means managing market risk positions in the expectation of benefiting from favourable movements in prices, rates or indices; arbitrage involves identifying and profiting from price differentials between markets and products.
As mentioned above, other derivatives classified as held for trading include non-qualifying hedging derivatives, ineffective hedging derivatives and the components of hedging derivatives that are excluded from assessing hedge effectiveness. Non-qualifying hedging derivatives are entered into for risk management purposes but do not meet the criteria for hedge accounting. These include derivatives managed in conjunction with financial instruments designated at fair value.
Gains and losses from changes in the fair value of derivatives, including the contractual interest, that do not qualify for hedge accounting are reported in ‘Net trading income’, except for derivatives managed in conjunction with financial instruments designated at fair value, where gains and losses are reported in ‘Net income from financial instruments designated at fair value’, together with the gains and losses on the economically hedged items. Where the derivatives are managed with debt securities in issue, the contractual interest is shown in ‘interest expense’ together with the interest payable on the issued debt. Substantially all of HSBC Holdings’ derivatives entered into with HSBC undertakings are managed in conjunction with financial liabilities designated at fair value.
The notional contract amounts of derivatives held for trading purposes indicate the nominal value of transactions outstanding at the balance sheet date; they do not represent amounts at risk. The 27% increase in the notional amounts of HSBC’s derivative assets during 2010 was primarily driven by an increase in the number of open interest rate contracts, reflecting increased trading volumes in the period.
323
Notes on the Financial Statements(continued)
Notional contract amounts of derivatives held for trading purposes by product type
| | | | | | | | | | | | | | | | | |
| | | HSBC | | | HSBC Holdings | |
| | | At | | | At | | | At | | | At | |
| | | 31 December | | | 31 December | | | 31 December | | | 31 December | |
| | | 2010 | | | 2009 | | | 2010 | | | 2009 | |
| | | US$m | | | US$m | | | US$m | | | US$m | |
| | | | | | | | | | | | | | | | | |
| Foreign exchange | | | 3,692,798 | | | | 2,883,201 | | | | 17,287 | | | | 17,150 | |
| Interest rate | | | 18,104,141 | | | | 13,874,355 | | | | 6,804 | | | | 6,804 | |
| Equity | | | 294,587 | | | | 217,828 | | | | – | | | | – | |
| Credit | | | 1,065,218 | | | | 1,237,055 | | | | – | | | | – | |
| Commodity and other | | | 82,856 | | | | 53,720 | | | | – | | | | – | |
| | | | | | | | | |
| | | | 23,239,600 | | | | 18,266,159 | | | | 24,091 | | | | 23,954 | |
| | | | | | | | | |
Credit derivatives
HSBC trades credit derivatives through its principal dealing operations and acts as a principal counterparty to a broad range of users, structuring deals to produce risk management products for its customers, or making markets in certain products. Risk is typically controlled through entering into offsetting credit derivative contracts with other counterparties.
HSBC manages the credit risk arising on buying and selling credit derivative protection by including the related credit exposures within its overall credit limit structure for the relevant counterparty. Trading of credit derivatives is restricted to a small number of offices within the major centres which have the control infrastructure and market skills to manage effectively the credit risk inherent in the products.
Credit derivatives are also deployed to a limited extent for the risk management of the Group’s loan portfolios.
The notional contract amount of credit derivatives of US$1,065,218m (2009: US$1,237,055m) consisted of protection bought of US$530,235m (2009: US$614,690m) and protection sold of US$534,983m (2009: US$622,365m).
The credit derivative business operates within the market risk management framework described on pages 145 to 154.
Derivatives valued using models with unobservable inputs
The difference between the fair value at initial recognition (the transaction price) and the value that would have been derived had valuation techniques used for subsequent measurement been applied at initial recognition, less subsequent releases, is as follows:
Unamortised balance of derivatives valued using models with significant unobservable inputs
| | | | | | | | �� | |
| | | 2010 | | | 2009 | |
| | | US$m | | | US$m | |
| | | | | | | | | |
| Unamortised balance at 1 January | | | 260 | | | | 204 | |
| Deferral on new transactions | | | 331 | | | | 192 | |
| Recognised in the income statement during the period: | | | | | | | | |
| – amortisation | | | (106 | ) | | | (86 | ) |
| – subsequent to unobservable inputs becoming observable | | | (17 | ) | | | (19 | ) |
| – maturity, termination or offsetting derivative | | | (163 | ) | | | (42 | ) |
| Exchange differences | | | (15 | ) | | | 11 | |
| Risk hedged | | | (40 | ) | | | – | |
| | | | | |
Unamortised balance at 31 December1 | | | 250 | | | | 260 | |
| | | | | |
| | |
| 1 | | This amount is yet to be recognised in the consolidated income statement. |
Hedging instruments
HSBC uses derivatives (principally interest rate swaps) for hedging purposes in the management of its own asset and liability portfolios and structural positions. This enables HSBC to optimise the overall cost to the Group of accessing debt capital markets, and to mitigate the market risk which would otherwise arise from structural imbalances in the maturity and other profiles of its assets and liabilities.
324
Notes on the Financial Statements(continued)
The accounting treatment of hedge transactions varies according to the nature of the instrument hedged and the type of hedge transactions. Derivatives may qualify as hedges for accounting purposes if they are fair value hedges, cash flow hedges, or hedges in net investment of foreign operations. These are described under the relevant headings below.
The notional contract amounts of derivatives held for hedging purposes indicate the nominal value of transactions outstanding at the balance sheet date; they do not represent amounts at risk.
Notional contract amounts of derivatives held for hedging purposes by product type
| | | | | | | | | | | | | | | | | |
| | | At 31 December 2010 | | | At 31 December 2009 | |
| | | Cash flow | | | Fair value | | | Cash flow | | | Fair value | |
| | | hedge | | | hedge | | | hedge | | | hedge | |
| | | US$m | | | US$m | | | US$m | | | US$m | |
| | | | | | | | | | | | | | | | | |
| Foreign exchange | | | 10,599 | | | | 1,392 | | | | 12,359 | | | | 2,469 | |
| Interest rate | | | 282,412 | | | | 62,757 | | | | 236,388 | | | | 42,224 | |
| | | | | | | | | |
| | | | 293,011 | | | | 64,149 | | | | 248,747 | | | | 44,693 | |
| | | | | | | | | |
Fair value hedges
HSBC’s fair value hedges principally consist of interest rate swaps that are used to protect against changes in the fair value of fixed-rate long-term financial instruments due to movements in market interest rates. For qualifying fair value hedges, all changes in the fair value of the derivative and in the fair value of the item in relation to the risk being hedged are recognised in the income statement. If the hedge relationship is terminated, the fair value adjustment to the hedged item continues to be reported as part of the basis of the item and is amortised to the income statement as a yield adjustment over the remainder of the hedging period.
Fair value of derivatives designated as fair value hedges
| | | | | | | | | | | | | | | | | |
| | | At 31 December 2010 | | | At 31 December 2009 | |
| | | Assets | | | Liabilities | | | Assets | | | Liabilities | |
| | | US$m | | | US$m | | | US$m | | | US$m | |
| | | | | | | | | | | | | | | | | |
| Foreign exchange | | | 153 | | | | – | | | | 342 | | | | – | |
| Interest rate | | | 443 | | | | 2,226 | | | | 242 | | | | 1,085 | |
| | | | | | | | | |
| | | | 596 | | | | 2,226 | | | | 584 | | | | 1,085 | |
| | | | | | | | | |
Gains or losses arising from fair value hedges
| | | | | | | | | | | | | |
| | | 2010 | | | 2009 | | | 2008 | |
| | | US$m | | | US$m | | | US$m | |
| Gains/(losses): | | | | | | | | | | | | |
| – on hedging instruments | | | (830 | ) | | | 114 | | | | (296 | ) |
| – on the hedged items attributable to the hedged risk | | | 868 | | | | (159 | ) | | | 301 | |
| | | | | | | |
| | | | 38 | | | | (45 | ) | | | 5 | |
| | | | | | | |
The gains and losses on ineffective portions of fair value hedges are recognised immediately in ‘Net trading income’.
Cash flow hedges
HSBC’s cash flow hedges consist principally of interest rate and cross-currency swaps that are used to protect against exposures to variability in future interest cash flows on non-trading assets and liabilities which bear interest at variable rates or which are expected to be re-funded or reinvested in the future. The amounts and timing of future cash flows, representing both principal and interest flows, are projected for each portfolio of financial assets and liabilities on the basis of their contractual terms and other relevant factors, including estimates of prepayments and defaults. The aggregate principal balances and interest cash flows across all portfolios over time form the basis for identifying gains and losses on the effective portions of derivatives designated as cash flow hedges of forecast transactions. Gains and losses are initially recognised in other comprehensive income, and accumulated in the cash flow hedging reserve, and are transferred to the income statement when the forecast cash flows affect the income statement.
325
Notes on the Financial Statements(continued)
Fair value of derivatives designated as cash flow hedges
| | | | | | | | | | | | | | | | | |
| | | At 31 December 2010 | | | At 31 December 2009 | |
| | | Assets | | | Liabilities | | | Assets | | | Liabilities | |
| | | US$m | | | US$m | | | US$m | | | US$m | |
| | | | | | | | | | | | | | | | | |
| Foreign exchange | | | 1,151 | | | | 340 | | | | 1,353 | | | | 300 | |
| Interest rate | | | 2,321 | | | | 1,683 | | | | 3,264 | | | | 2,189 | |
| | | | | | | | | |
| | | | 3,472 | | | | 2,023 | | | | 4,617 | | | | 2,489 | |
| | | | | | | | | |
Forecast principal balances on which interest cash flows are expected to arise
| | | | | | | | | | | | | | | | | |
| | | | | | | More than 3 | | | 5 years or less | | | | | |
| | | 3 months | | | months but less | | | more than | | | More than | |
| | | or less | | | than 1 year | | | 1 year | | | 5 years | |
| | | US$m | | | US$m | | | US$m | | | US$m | |
At 31 December 2010 | | | | | | | | | | | | | | | | |
| Assets | | | 163,006 | | | | 97,174 | | | | 58,975 | | | | 1,358 | |
| Liabilities | | | (89,112 | ) | | | (58,811 | ) | | | (42,259 | ) | | | (6,065 | ) |
| | | | | | | | | |
| Net cash inflows/(outflows) exposure | | | 73,894 | | | | 38,363 | | | | 16,716 | | | | (4,707 | ) |
| | | | | | | | | |
| At 31 December 2009 | | | | | | | | | | | | | | | | |
| Assets | | | 120,915 | | | | 111,456 | | | | 53,184 | | | | 476 | |
| Liabilities | | | (71,143 | ) | | | (78,841 | ) | | | (39,377 | ) | | | (6,559 | ) |
| | | | | | | | | |
| Net cash inflows/(outflows) exposure | | | 49,772 | | | | 32,615 | | | | 13,807 | | | | (6,083 | ) |
| | | | | | | | | |
This table reflects the interest rate repricing profile of the underlying hedged items.
The gains and losses on ineffective portions of such derivatives are recognised immediately in ‘Net trading income’. During the year to 31 December 2010 a loss of US$9m (2009: gain of US$90m; 2008: loss of US$40m) was recognised due to hedge ineffectiveness.
Hedges of net investments in foreign operations
The Group applies hedge accounting in respect of certain consolidated net investments. Hedging is undertaken using forward foreign exchange contracts or by financing with currency borrowings.
At 31 December 2010, the fair values of outstanding financial instruments designated as hedges of net investments in foreign operations were liabilities of US$34m (2009: US$28m) and notional contract values of US$644m (2009: US$566m).
The ineffectiveness recognised in ‘Net trading income’ in the year ended 31 December 2010 that arose from hedges in foreign operations was nil (2009 and 2008: nil).
21 Financial investments
| | | | | | | | | |
| | | 2010 | | | 2009 | |
| | | US$m | | | US$m | |
| Financial investments: | | | | | | | | |
| – not subject to repledge or resale by counterparties | | | 369,597 | | | | 356,864 | |
| – which may be repledged or resold by counterparties | | | 31,158 | | | | 12,294 | |
| | | | | |
| | | | 400,755 | | | | 369,158 | |
| | | | | |
326
Notes on the Financial Statements(continued)
Carrying amount and fair value of financial investments
| | | | | | | | | | | | | | | | | |
| | | 2010 | | 2009 |
| | | Carrying | | | Fair | | | Carrying | | | Fair | |
| | | amount | | | value | | | amount | | | value | |
| | | US$m | | | US$m | | | US$m | | | US$m | |
| | | | | | | | | | | | | | |
| Treasury and other eligible bills | | | 57,129 | | | | 57,129 | | | | 58,434 | | | | 58,434 | |
| | | | | | | | | |
| – available for sale | | | 57,016 | | | | 57,016 | | | | 58,333 | | | | 58,333 | |
| – held to maturity | | | 113 | | | | 113 | | | | 101 | | | | 101 | |
| | | | | | | | | |
| Debt securities | | | 335,643 | | | | 336,632 | | | | 301,600 | | | | 302,171 | |
| | | | | | | | | |
| – available for sale | | | 316,257 | | | | 316,257 | | | | 284,074 | | | | 284,074 | |
| – held to maturity | | | 19,386 | | | | 20,375 | | | | 17,526 | | | | 18,097 | |
| | | | | | | | | |
| Equity securities | | | 7,983 | | | | 7,983 | | | | 9,124 | | | | 9,124 | |
| | | | | | | | | |
| – available for sale | | | 7,983 | | | | 7,983 | | | | 9,124 | | | | 9,124 | |
| | | | | | | | | |
| | | | | | | | | | | | | | | | | |
| | | | | | | | | |
| | | | | | | | | | | | | | | | | |
| Total financial investments | | | 400,755 | | | | 401,744 | | | | 369,158 | | | | 369,729 | |
| | | | | | | | | |
Financial investments at amortised cost and fair value
| | | | | | | | | |
| | | Amortised | | | Fair | |
| | | cost | | | value | 1 |
| | | US$m | | | US$m | |
At 31 December 2010 | | | | | | | | |
| US Treasury | | | 37,380 | | | | 37,255 | |
US Government agencies2 | | | 20,895 | | | | 21,339 | |
US Government sponsored entities2 | | | 5,029 | | | | 5,267 | |
| UK Government | | | 31,069 | | | | 31,815 | |
| Hong Kong Government | | | 29,770 | | | | 29,793 | |
| Other government | | | 108,947 | | | | 109,806 | |
Asset-backed securities3 | | | 39,845 | | | | 33,175 | |
| Corporate debt and other securities | | | 124,704 | | | | 125,311 | |
| Equities | | | 5,605 | | | | 7,983 | |
| | | | | |
| | | | 403,244 | | | | 401,744 | |
| | | | | |
| |
| At 31 December 2009 | | | | | | | | |
| US Treasury | | | 17,650 | | | | 17,635 | |
US Government agencies2 | | | 12,539 | | | | 12,804 | |
US Government sponsored entities2 | | | 4,885 | | | | 4,924 | |
| UK Government | | | 9,653 | | | | 9,782 | |
| Hong Kong Government | | | 37,747 | | | | 37,763 | |
| Other government | | | 87,122 | | | | 87,881 | |
Asset-backed securities3 | | | 48,500 | | | | 34,914 | |
| Corporate debt and other securities | | | 153,639 | | | | 154,902 | |
| Equities | | | 7,051 | | | | 9,124 | |
| | | | | |
| | | | 378,786 | | | | 369,729 | |
| | | | | |
| At 31 December 2008 | | | | | | | | |
| US Treasury | | | 11,528 | | | | 11,755 | |
US Government agencies2 | | | 8,131 | | | | 8,307 | |
US Government sponsored entities2 | | | 15,109 | | | | 15,240 | |
| UK Government | | | 16,077 | | | | 16,217 | |
| Hong Kong Government | | | 966 | | | | 989 | |
| Other government | | | 60,755 | | | | 61,528 | |
Asset-backed securities3 | | | 55,685 | | | | 36,052 | |
| Corporate debt and other securities | | | 145,269 | | | | 143,940 | |
| Equities | | | 5,901 | | | | 7,251 | |
| | | | | |
| | | | 319,421 | | | | 301,279 | |
| | | | | |
| | |
| 1 | | Included within the above figures are debt securities issued by banks and other financial institutions of US$99,733m (2009: US$133,256m; 2008: US$140,878m), of which US$38,862m (2009: US$55,324m; 2008: US$39,213m) are guaranteed by various governments. The fair value of the debt securities issued by banks and other financial institutions was US$100,070m (2009: US$133,461m; 2008: US$141,526m). |
| |
| 2 | | Includes securities that are supported by an explicit guarantee issued by the US Government. |
| |
| 3 | | Excludes asset-backed securities included under US Government agencies and sponsored entities. |
327
Notes on the Financial Statements(continued)
Financial investments listed on a recognised exchange and unlisted
| | | | | | | | | | | | | | | | | | | | | | | | | |
| | | Treasury | | | Treasury | | | | | | | | | | | | | |
| | | and other | | | and other | | | Debt | | | Debt | | | Equity | | | | |
| | | eligible bills | | | eligible bills | | | securities | | | securities | | | securities | | | | |
| | | available | | | held to | | | available | | | held to | | | available | | | | |
| | | for sale | | | maturity | | | for sale | | | maturity | | | for sale | | | Total | |
| | | US$m | | | US$m | | | US$m | | | US$m | | | US$m | | | US$m | |
Carrying amount at 31 December 2010 | | | | | | | | | | | | | | | | | | | | | | | | |
Listed on a recognised exchange1 | | | 1,400 | | | | – | | | | 138,374 | | | | 4,182 | | | | 851 | | | | 144,807 | |
Unlisted2 | | | 55,616 | | | | 113 | | | | 177,883 | | | | 15,204 | | | | 7,132 | | | | 255,948 | |
| | | | | | | | | | | | | |
| | | | | | | | | | | | | | | | | | | | | | | | | |
| | | | 57,016 | | | | 113 | | | | 316,257 | | | | 19,386 | | | | 7,983 | | | | 400,755 | |
| | | | | | | | | | | | | |
| Carrying amount at 31 December 2009 | | | | | | | | | | | | | | | | | | | | | | | | |
Listed on a recognised exchange1 | | | 2,334 | | | | – | | | | 135,653 | | | | 2,743 | | | | 911 | | | | 141,641 | |
Unlisted2 | | | 55,999 | | | | 101 | | | | 148,421 | | | | 14,783 | | | | 8,213 | | | | 227,517 | |
| | | | | | | | | | | | | |
| | | | | | | | | | | | | | | | | | | | | | | | | |
| | | | 58,333 | | | | 101 | | | | 284,074 | | | | 17,526 | | | | 9,124 | | | | 369,158 | |
| | | | | | | | | | | | | |
| | |
| 1 | | The fair value of listed held-to-maturity debt securities as at 31 December 2010 was US$4,332m (2009: US$2,769m). Included within listed investments were US$1,902m (2009: US$1,670m) of investments listed in Hong Kong. |
| |
| 2 | | Unlisted treasury and other eligible bills available for sale primarily comprise treasury bills not listed on a recognised exchange but for which there is a liquid market. |
Maturities of investments in debt securities at their carrying amount
| | | | | | | | | |
| | | At 31 December | |
| | | 2010 | | | 2009 | |
| | | US$m | | | US$m | |
| Remaining contractual maturity of total debt securities: | | | | | | | | |
| 1 year or less | | | 92,961 | | | | 75,782 | |
| 5 years or less but over 1 year | | | 124,596 | | | | 141,683 | |
| 10 years or less but over 5 years | | | 56,926 | | | | 31,934 | |
| Over 10 years | | | 61,160 | | | | 52,201 | |
| | | | | |
| | | | | | | | | |
| | | | 335,643 | | | | 301,600 | |
| | | | | |
| | | | | | | | | |
| Remaining contractual maturity of debt securities available for sale: | | | | | | | | |
| 1 year or less | | | 91,939 | | | | 75,160 | |
| 5 years or less but over 1 year | | | 117,931 | | | | 135,187 | |
| 10 years or less but over 5 years | | | 50,113 | | | | 26,105 | |
| Over 10 years | | | 56,274 | | | | 47,622 | |
| | | | | |
| | | | | | | | | |
| | | | 316,257 | | | | 284,074 | |
| | | | | |
| | | | | | | | | |
| Remaining contractual maturity of debt securities held to maturity: | | | | | | | | |
| 1 year or less | | | 1,022 | | | | 622 | |
| 5 years or less but over 1 year | | | 6,665 | | | | 6,496 | |
| 10 years or less but over 5 years | | | 6,813 | | | | 5,829 | |
| Over 10 years | | | 4,886 | | | | 4,579 | |
| | | | | |
| | | | | | | | | |
| | | | 19,386 | | | | 17,526 | |
| | | | | |
Contractual maturities and weighted average yields of investment debt securities at 31 December 2010
| | | | | | | | | | | | | | | | | | | | | | | | | | | | | | | | | |
| | | | | | | | | | | After one year but | | | After five years but | | | | |
| | | Within one year | | | within five years | | | within ten years | | | After ten years | |
| | | Amount | | | Yield | | | Amount | | | Yield | | | Amount | | | Yield | | | Amount | | | Yield | |
| | | US$m | | | % | | | US$m | | | % | | | US$m | | | % | | | US$m | | | % | |
Available-for-sale | | | | | | | | | | | | | | | | | | | | | | | | | | | | | | | | |
| US Treasury | | | 8,761 | | | | 0.95 | | | | 13,513 | | | | 1.19 | | | | 9,225 | | | | 2.61 | | | | 4,648 | | | | 4.32 | |
| US Government agencies | | | – | | | | – | | | | 7 | | | | 2.95 | | | | 230 | | | | 4.78 | | | | 20,236 | | | | 3.71 | |
| US Government-sponsored agencies | | | 859 | | | | 0.70 | | | | 114 | | | | 1.75 | | | | 1,993 | | | | 3.81 | | | | 445 | | | | 3.60 | |
| UK Government | | | 3,994 | | | | 2.90 | | | | 11,407 | | | | 2.22 | | | | 13,987 | | | | 2.97 | | | | 1,248 | | | | 2.80 | |
| Hong Kong Government | | | 362 | | | | 0.55 | | | | 407 | | | | 2.95 | | | | – | | | | – | | | | – | | | | – | |
| Other governments | | | 28,779 | | | | 2.25 | | | | 44,920 | | | | 4.00 | | | | 6,945 | | | | 4.65 | | | | 2,073 | | | | 4.58 | |
| Asset-backed securities | | | 392 | | | | 0.77 | | | | 2,311 | | | | 1.73 | | | | 7,773 | | | | 0.66 | | | | 29,178 | | | | 0.64 | |
| Corporate debt and other securities | | | 49,014 | | | | 2.26 | | | | 44,009 | | | | 2.54 | | | | 10,342 | | | | 3.44 | | | | 4,065 | | | | 4.72 | |
| | | | | | | | | | | | | | | | | | | | | | | | | |
| | | | | | | | | | | | | | | | | | | | | | | | | | | | | | | | | |
| Total amortised cost | | | 92,161 | | | | | | | | 116,688 | | | | | | | | 50,495 | | | | | | | | 61,893 | | | | | |
| | | | | | | | | | | | | | | | | | | | | | | | | |
| | | | | | | | | | | | | | | | | | | | | | | | | | | | | | | | | |
| Total carrying value | | | 91,939 | | | | | | | | 117,931 | | | | | | | | 50,113 | | | | | | | | 56,274 | | | | | |
| | | | | | | | | | | | | | | | | | | | | | | | | |
328
Notes on the Financial Statements(continued)
| | | | | | | | | | | | | | | | | | | | | | | | | | | | | | | | | |
| | | | | | | | | | | After one year but | | | After five years but | | | | |
| | | Within one year | | | within five years | | | within ten years | | | After ten years | |
| | | Amount | | | Yield | | | Amount | | | Yield | | | Amount | | | Yield | | | Amount | | | Yield | |
| | | US$m | | | % | | | US$m | | | % | | | US$m | | | % | | | US$m | | | % | |
Held-to-maturity | | | | | | | | | | | | | | | | | | | | | | | | | | | | | | | | |
| US Treasury | | | – | | | | – | | | | 32 | | | | 3.13 | | | | 60 | | | | 6.67 | | | | 62 | | | | 9.68 | |
| US Government agencies | | | – | | | | – | | | | – | | | | – | | | | 6 | | | | 7.65 | | | | 416 | | | | 6.49 | |
| US Government-sponsored agencies | | | 19 | | | | 5.26 | | | | 28 | | | | 7.14 | | | | 2 | | | | 6.92 | | | | 1,560 | | | | 6.15 | |
| Hong Kong Government | | | 2 | | | | 3.02 | | | | – | | | | – | | | | 8 | | | | 5.05 | | | | – | | | | – | |
| Other governments | | | 53 | | | | 5.66 | | | | 424 | | | | 3.30 | | | | 252 | | | | 4.37 | | | | 595 | | | | 7.23 | |
| Asset-backed securities | | | – | | | | – | | | | – | | | | – | | | | – | | | | – | | | | 191 | | | | 6.28 | |
| Corporate debt and other securities | | | 948 | | | | 4.01 | | | | 6,181 | | | | 4.29 | | | | 6,485 | | | | 4.52 | | | | 2,062 | | | | 5.92 | |
| | | | | | | | | | | | | | | | | | | | | | | | | |
| | | | | | | | | | | | | | | | | | | | | | | | | | | | | | | | | |
| Total amortised cost | | | 1,022 | | | | | | | | 6,665 | | | | | | | | 6,813 | | | | | | | | 4,886 | | | | | |
| | | | | | | | | | | | | | | | | | | | | | | | | |
| | | | | | | | | | | | | | | | | | | | | | | | | | | | | | | | | |
| Total carrying value | | | 1,022 | | | | | | | | 6,665 | | | | | | | | 6,813 | | | | | | | | 4,886 | | | | | |
| | | | | | | | | | | | | | | | | | | | | | | | | |
The maturity distributions of asset-backed securities are presented in the above table on the basis of contractual maturity dates. The weighted average yield for each range of maturities is calculated by dividing the annualised interest income for the year ended 31 December 2010 by the book amount of available-for-sale debt securities at that date. The yields do not include the effect of related derivatives.
22 Transfers of financial assets not qualifying for derecognition
HSBC enters into transactions in the normal course of business by which it transfers recognised financial assets directly to third parties or to SPEs. These transfers may give rise to the full or partial derecognition of the financial assets concerned.
| – | | Full derecognition occurs when HSBC transfers its contractual right to receive cash flows from the financial assets, or retains the right but assumes an obligation to pass on the cash flows from the asset, and transfers substantially all the risks and rewards of ownership. The risks include credit, interest rate, currency, prepayment and other price risks. |
| |
| – | | Partial derecognition occurs when HSBC sells or otherwise transfers financial assets in such a way that some but not substantially all of the risks and rewards of ownership are transferred but control is retained. These financial assets are recognised on the balance sheet to the extent of HSBC’s continuing involvement. |
The majority of financial assets that do not qualify for derecognition are (i) debt securities held by counterparties as collateral under repurchase agreements or (ii) equity securities lent under securities lending agreements. The following table analyses the carrying amount of financial assets that did not qualify for derecognition and their associated financial liabilities:
Financial assets and associated financial liabilities not qualifying for derecognition
| | | | | | | | | | | | | | | | | |
| | | 2010 | | 2009 | |
| | | Carrying | | | Carrying | | | Carrying | | | Carrying | |
| | | amount of | | | amount of | | | amount of | | | amount of | |
| | | transferred | | | associated | | | transferred | | | associated | |
| | | assets | | | liabilities | | | assets | | | liabilities | |
| | | US$m | | | US$m | | | US$m | | | US$m | |
Nature of transaction | | | | | | | | | | | | | | | | |
| Repurchase agreements | | | 124,625 | | | | 122,455 | | | | 108,518 | | | | 107,525 | |
| Securities lending agreements | | | 7,277 | | | | 7,202 | | | | 7,363 | | | | 7,264 | |
| | | | | | | | | |
| | | | | | | | | | | | | | | | | |
| | | | 131,902 | | | | 129,657 | | | | 115,881 | | | | 114,789 | |
| | | | | | | | | |
A small proportion of financial assets that do not qualify for derecognition relate to loans, credit cards, debt securities and trade receivables that have been securitised under arrangements by which HSBC retains a continuing involvement in such transferred assets. Continuing involvement may entail retaining the rights to future cash flows arising from the assets after investors have received their contractual terms (for example, interest rate strips); providing subordinated interest; liquidity support; continuing to service the underlying asset; or entering into derivative transactions with the securitisation vehicles. As such, HSBC continues to be exposed to risks associated with these transactions.
329
Notes on the Financial Statements(continued)
The rights and obligations that HSBC retains from its continuing involvement in securitisations are initially recorded as an allocation of the fair value of the financial asset between the part that is derecognised and the part that continues to be recognised on the date of transfer. The following analyses the carrying amount of financial assets to the extent of HSBC’s continuing involvement that qualified for partial derecognition during the year, and their associated liabilities:
HSBC’s continuing involvement in financial assets qualifying for partial derecognition
| | | | | | | | | |
| | | Securitisations at 31 December | |
| | | 2010 | | | 2009 | |
| | | US$m | | | US$m | |
| | | | | | | | | |
| Carrying amount of assets (original) | | | 17,427 | | | | 17,427 | |
| Carrying amount of assets (currently recognised) | | | 42 | | | | 139 | |
| Carrying amount of associated liabilities (currently recognised) | | | 21 | | | | 69 | |
23 Interests in associates and joint ventures
Principal associates of HSBC
| | | | | | | | | | | | | | | | | |
| | | At 31 December 2010 | | At 31 December 2009 | |
| | | Carrying | | | Fair | | | Carrying | | | Fair | |
| | | amount | | | value | | | amount | | | value | |
| | | US$m | | | US$m | | | US$m | | | US$m | |
Listed | | | | | | | | | | | | | | | | |
| Bank of Communications Co., Limited | | | 6,944 | | | | 10,773 | | | | 5,110 | | | | 10,820 | |
| Industrial Bank Co., Limited | | | 1,769 | | | | 2,799 | | | | 1,084 | | | | 3,774 | |
| Ping An Insurance (Group) Company of China, Limited | | | 5,596 | | | | 13,735 | | | | 4,391 | | | | 10,803 | |
| SABB Takaful Company | | | 28 | | | | 49 | | | | 29 | | | | 99 | |
| The Saudi British Bank | | | 1,580 | | | | 3,224 | | | | 1,376 | | | | 3,472 | |
| | | | | | | | | |
| | | | | | | | | | | | | | | | | |
| | | | 15,917 | | | | 30,580 | | | | 11,990 | | | | 28,968 | |
| | | | | | | | | |
| | | | | | | | | | | | | |
| | | At 31 December 2010 |
| | | | | | | HSBC’s | | Issued | |
| | | Country of | | interest in | | equity | |
| | | incorporation | | equity capital | | capital | |
Listed | | | | | | | | | | | | |
| Bank of Communications Co., Limited | | PRC1 | | 19.03% | | RMB56,260m | |
| Industrial Bank Co., Limited | | PRC1 | | 12.80% | | RMB5,992m | |
| Ping An Insurance (Group) Company of China, Limited | | PRC1 | | 16.13% | | RMB7,345m | |
| SABB Takaful Company | | Saudi Arabia | | 32.50% | | SR340m | |
| The Saudi British Bank | | Saudi Arabia | | 40.00% | | SR7,500m | |
| | | | | | | | | | | | | |
Unlisted | | | | | | | | | | | | |
Barrowgate Limited3 | | Hong Kong | | 24.64% | | – | |
Vietnam Technological and Commercial Joint Stock Bank | | Vietnam | | 19.79% | | VND6,932,184m | |
Yantai Bank Co., Limited2 | | PRC1 | | 20.00% | | RMB2,000m | |
| | |
| 1 | | People’s Republic of China. |
| |
| 2 | | Yantai Bank Co., Limited was previously known as Yantai City Commercial Bank. The investment is held through Hang Seng Bank Limited, a 62.14% owned subsidiary of HSBC. |
| |
| 3 | | Issued equity capital is less than HK$1m. |
All the above investments in associates are owned by subsidiaries of HSBC Holdings.
During 2010, HSBC disposed of its 48.92% interest in the equity capital of British Arab Commercial Bank Public Limited Company, which was previously reported as an unlisted principal associate.
Details of all HSBC associates and joint ventures, as required under Section 409 Companies Act 2006, will be annexed to the next Annual Return of HSBC Holdings filed with the UK Registrar of Companies.
HSBC had US$12,540m (2009: US$9,501m) of investments in associates and joint ventures listed in Hong Kong.
For the year ended 31 December 2010, HSBC’s share of associates and joint ventures’ tax on profit was US$774m (2009: US$491m), which is included within share of profit in associates and joint ventures in the income statement.
330
Notes on the Financial Statements(continued)
Summarised aggregate financial information on associates
| | | | | | | | | |
| | | 2010 | | | 2009 | |
| | | US$m | | | US$m | |
| HSBC’s share of: | | | | | | | | |
| – assets | | | 191,286 | | | | 158,890 | |
| – liabilities | | | 175,812 | | | | 147,501 | |
| – revenues | | | 9,274 | | | | 7,514 | |
| – profit after tax | | | 2,479 | | | | 1,735 | |
HSBC’s investment in Bank of Communications Co., Limited was equity accounted with effect from August 2004. HSBC’s significant influence in Bank of Communications Co., Limited was established as a result of representation on the Board of Directors, and in accordance with the Technical Support and Assistance Agreements, HSBC is assisting in the development of financial and operating policies and a number of staff have been seconded to assist in this process.
HSBC’s investment in Industrial Bank Co., Limited was equity accounted with effect from May 2004, reflecting HSBC’s significant influence over this associate. HSBC’s significant influence was established as a result of representation on the Board of Directors, and in accordance with the Technical Support and Assistance Agreements, HSBC is assisting in the development of financial and operating policies.
HSBC’s investment in Ping An Insurance (Group) Company of China, Limited was equity accounted with effect from 31 August 2005, reflecting HSBC’s significant influence over this associate. HSBC’s significant influence was established as a result of representation on the Board of Directors. In May 2010, following the issue of shares by the associate to a third party, HSBC’s holding was diluted to 16.13% and a dilution gain of US$188m was recognised in ‘Other operating income’.
The statutory accounting reference date of Bank of Communications Co., Limited, Ping An Insurance (Group) Company of China, Limited and Industrial Bank Co., Limited is 31 December. For the year ended 31 December 2010, these companies were included on the basis of financial statements made up for the twelve months to 30 September 2010, taking into account changes in the subsequent period from 1 October 2010 to 31 December 2010 that would have materially affected their results.
HSBC acquired 15% of Vietnam Technological & Commercial Joint Stock Bank in October 2007. This investment was equity accounted from that date due to HSBC’s representation on the Board of Directors and involvement in the Technical Support and Assistance Agreement. In December 2007, as a result of a rights issue in which HSBC did not participate, HSBC’s equity interest was diluted to 14.44%. In September 2008, HSBC increased its equity interest to 20%. HSBC’s equity interest has been subsequently diluted to below 20% due to the issue of shares by the associate to its own employees.
Principal interests in joint ventures
| | | | | | | | | | | | | | | | | |
| | | At 31 December 2010 |
| | | | | | | | | | | HSBC’s interest | | Issued | |
| | | Country of | | Principal | | in equity | | equity | |
| | | incorporation | | activity | | capital | | capital | |
| | | | |
| HSBC Saudi Arabia Limited | | Saudi Arabia | | Investment banking | | 60.00% | | SR50m | |
| Vaultex UK Limited | | England | | Cash management | | 50.00% | | £10m | |
| Hana HSBC Life Insurance Co., Ltd | | South Korea | | Insurance manufacturing | | 49.99% | | KRW60,201m | |
| Canara HSBC Oriental Bank of Commerce Life Insurance Company Limited | | India | | Insurance manufacturing | | 26.00% | | INR5,000m | |
331
Notes on the Financial Statements(continued)
Summarised aggregate financial information on joint ventures
| | | | | | | | | |
| | | 2010 | | | 2009 | |
| | | US$m | | | US$m | |
| HSBC’s share of: | | | | | | | | |
| – current assets | | | 1,481 | | | | 700 | |
| – non-current assets | | | 97 | | | | 513 | |
| – current liabilities | | | 706 | | | | 621 | |
| – non-current liabilities | | | 666 | | | | 416 | |
| – income | | | 366 | | | | 370 | |
| – expenses | | | 328 | | | | 324 | |
Goodwill included in carrying amount of associates and joint ventures
| | | | | | | | | |
| | | 2010 | | | 2009 | |
| | | US$m | | | US$m | |
Gross amount | | | | | | | | |
| At 1 January | | | 1,446 | | | | 1,453 | |
| Additions | | | 60 | | | | 5 | |
| Exchange differences | | | 40 | | | | (12 | ) |
| Other changes | | | (28 | ) | | | – | |
| | | | | |
| | | | | | | | | |
At 31 December1 | | | 1,518 | | | | 1,446 | |
| | | | | |
| | |
| 1 | | Includes the carrying amount of goodwill arising from joint ventures of US$32m (2009: US$32m). |
24 Goodwill and intangible assets
| | | | | | | | | |
| | | 2010 | | | 2009 | |
| | | US$m | | | US$m | |
| | | | | | | | | |
| Goodwill | | | 22,406 | | | | 23,241 | |
Present value of in-force long-term insurance business (‘PVIF’)1 | | | 3,440 | | | | 2,780 | |
| Other intangible assets | | | 4,076 | | | | 3,973 | |
| | | | | |
| | | | | | | | | |
| | | | 29,922 | | | | 29,994 | |
| | | | | |
| | |
| 1 | | Disclosures on PVIF are provided on page 170. |
Reconciliation of goodwill
| | | | | | | | | | | | | | | | | | | | | | | | | | | | | |
| | | | | | | | | | | Rest of | | | | | | | | | | | | | |
| | | | | | | Hong | | | Asia- | | | Middle | | | North | | | Latin | | | | |
| | | Europe | | | Kong | | | Pacific | | | East | | | America | | | America | | | Total | |
| | | US$m | | | US$m | | | US$m | | | US$m | | | US$m | | | US$m | | | US$m | |
Gross amount | | | | | | | | | | | | | | | | | | | | | | | | | | | | |
| At 1 January 2010 | | | 15,915 | | | | 123 | | | | 1,053 | | | | 69 | | | | 12,483 | | | | 4,162 | | | | 33,805 | |
| Additions | | | – | | | | – | | | | 16 | | | | – | | | | – | | | | – | | | | 16 | |
| Disposals | | | (3 | ) | | | – | | | | – | | | | – | | | | (17 | ) | | | – | | | | (20 | ) |
| Exchange differences | | | (1,004 | ) | | | 1 | | | | 52 | | | | (4 | ) | | | (1 | ) | | | 154 | | | | (802 | ) |
| Other changes | | | (23 | ) | | | – | | | | (6 | ) | | | – | | | | – | | | | – | | | | (29 | ) |
| | | | | | | | | | | | | | | |
| | | | | | | | | | | | | | | | | | | | | | | | | | | | | |
| At 31 December 2010 | | | 14,885 | | | | 124 | | | | 1,115 | | | | 65 | | | | 12,465 | | | | 4,316 | | | | 32,970 | |
| | | | | | | | | | | | | | | |
| | | | | | | | | | | | | | | | | | | | | | | | | | | | | |
Accumulated impairment losses | | | | | | | | | | | | | | | | | | | | | | | | | | | | |
| At 1 January and 31 December 2010 | | | – | | | | – | | | | – | | | | – | | | | (10,564 | ) | | | – | | | | (10,564 | ) |
| | | | | | | | | | | | | | | |
| | | | | | | | | | | | | | | | | | | | | | | | | | | | | |
| Net carrying amount at 31 December 2010 | | | 14,885 | | | | 124 | | | | 1,115 | | | | 65 | | | | 1,901 | | | | 4,316 | | | | 22,406 | |
| | | | | | | | | | | | | | | |
332
Notes on the Financial Statements(continued)
| | | | | | | | | | | | | | | | | | | | | | | | | | | | | |
| | | | | | | | | | | Rest of | | | | | | | | | | | | | |
| | | | | | | Hong | | | Asia- | | | Middle | | | North | | | Latin | | | | |
| | | Europe | | | Kong | | | Pacific | | | East | | | America | | | America | | | Total | |
| | | US$m | | | US$m | | | US$m | | | US$m | | | US$m | | | US$m | | | US$m | |
| Gross amount | | | | | | | | | | | | | | | | | | | | | | | | | | | | |
| At 1 January 2009 | | | 15,511 | | | | 122 | | | | 364 | | | | 69 | | | | 12,487 | | | | 3,866 | | | | 32,419 | |
| Additions | | | – | | | | – | | | | 570 | | | | – | | | | – | | | | 10 | | | | 580 | |
| Disposals | | | (3 | ) | | | – | | | | – | | | | – | | | | – | | | | – | | | | (3 | ) |
| Exchange differences | | | 460 | | | | 1 | | | | 119 | | | | – | | | | – | | | | 294 | | | | 874 | |
| Other changes | | | (53 | ) | | | – | | | | – | | | | – | | | | (4 | ) | | | (8 | ) | | | (65 | ) |
| | | | | | | | | | | | | | | |
| | | | | | | | | | | | | | | | | | | | | | | | | | | | | |
| At 31 December 2009 | | | 15,915 | | | | 123 | | | | 1,053 | | | | 69 | | | | 12,483 | | | | 4,162 | | | | 33,805 | |
| | | | | | | | | | | | | | | |
| | | | | | | | | | | | | | | | | | | | | | | | | | | | | |
| Accumulated impairment losses | | | | | | | | | | | | | | | | | | | | | | | | | | | | |
| At 1 January and 31 December 2009 | | | – | | | | – | | | | – | | | | – | | | | (10,564 | ) | | | – | | | | (10,564 | ) |
| | | | | | | | | | | | | | | |
| | | | | | | | | | | | | | | | | | | | | | | | | | | | | |
| Net carrying amount at 31 December 2009 | | | 15,915 | | | | 123 | | | | 1,053 | | | | 69 | | | | 1,919 | | | | 4,162 | | | | 23,241 | |
| | | | | | | | | | | | | | | |
During 2010, there was no impairment of goodwill (2009: nil; 2008: US$10.6bn).
Impairment testing
Timing of impairment testing
HSBC’s impairment test in respect of goodwill allocated to each cash-generating unit (‘CGU’) is performed as at 1 July each year. In line with the accounting policy set out in Note 2p, goodwill is also retested for impairment whenever there is an indication that goodwill may be impaired. There was no indication of impairment in the period to 31 December 2010 and therefore goodwill has not been retested since 1 July 2010. For the purpose of impairment testing, the Group’s CGUs are based on customer groups and global business separated by geographical region. The CGUs represent the lowest level at which goodwill is monitored for internal management purposes.
Basis of the recoverable amount – value in use or fair value less costs to sell
The recoverable amount of all CGUs to which goodwill has been allocated was equal to its value in use (‘VIU’) at each respective testing date for 2009 and 2010.
For each significant CGU, the VIU is calculated by discounting management’s cash flow projections for the CGU. The discount rate used is based on the cost of capital HSBC allocates to investments in the countries within which the CGU operates. The long-term growth rate is used to extrapolate the cash flows in perpetuity because of the long-term perspective within the Group of the business units making up the CGUs. In 2010, for most CGUs, management’s cash flow projections until the end of 2011 were used. However, due to the current economic conditions in Personal Financial Services – Latin America, a 10-year cash flow projection was used to more accurately estimate the cash flows for the period.
Key assumptions in VIU calculation and management’s approach to determining the values assigned to each key assumption
| | | | | | | | | | | | | | | | | | | | | | | | | |
| | | 2010 | | 2009 |
| | | | | | | | | | | Nominal | | | | | | | | | | | Nominal | |
| | | | | | | | | | | growth rate | | | | | | | | | | | growth rate | |
| | | | | | | | | | | beyond | | | | | | | | | | | beyond | |
| | | Goodwill at | | | | | | | initial | | | Goodwill at | | | | | | | initial | |
| | | 1 July | | | Discount | | | cash flow | | | 1 July | | | Discount | | | cash flow | |
| Cash-generating unit | | 2010 | | | rate | | | projections | | | 2009 | | | rate | | | projections | |
| | | US$m | | | % | | | % | | | US$m | | | % | | | % | |
| | | | | | | | | | | | | | | | | | | | | | | | | |
| Personal Financial Services – Europe | | | 4,017 | | | | 11.0 | | | | 3.0 | | | | 4,507 | | | | 11.0 | | | | 3.1 | |
| Commercial Banking – Europe | | | 3,015 | | | | 11.0 | | | | 3.0 | | | | 3,480 | | | | 11.0 | | | | 3.1 | |
| Global Private Banking – Europe | | | 4,055 | | | | 11.0 | | | | 3.0 | | | | 4,483 | | | | 11.0 | | | | 3.1 | |
| Global Banking and Markets – Europe | | | 2,983 | | | | 12.0 | | | | 3.0 | | | | 3,489 | | | | 11.0 | | | | 3.1 | |
| Personal Financial Services – Latin America | | | 2,385 | | | | 14.3 | | | | 8.6 | | | | 2,350 | | | | 15.0 | | | | 8.0 | |
| | | | | | | | | | | | | | | | | | | | | |
| | | | | | | | | | | | | | | | | | | | | | | | | |
| Total goodwill in the CGUs listed above | | | 16,455 | | | | | | | | | | | | 18,309 | | | | | | | | | |
| | | | | | | | | | | | | | | | | | | | | |
333
Notes on the Financial Statements(continued)
At 1 July 2010, aggregate goodwill of US$4,674m (1 July 2009: US$4,475m) had been allocated to CGUs that were not considered individually significant. These CGUs do not carry on their balance sheets any significant intangible assets with indefinite useful lives, other than goodwill.
Nominal long-term growth rate: external data that reflects the market’s assessment of GDP and inflation for the countries within which the CGU operates. The rates used for 2009 and 2010 are taken as an average of the last 10 years.
Discount rate: the discount rate used to discount the cash flows is based on the cost of capital assigned to each CGU, which is derived using a Capital Asset Pricing Model (‘CAPM’). The CAPM depends on inputs reflecting a number of financial and economic variables including the risk-free rate in the country concerned and a premium to reflect the inherent risk of the business being evaluated. These variables are based on the market’s assessment of the economic variables and management’s judgement. In addition, for the purposes of testing goodwill for impairment, management supplements this process by comparing the discount rates derived using the internally generated CAPM with cost of capital rates produced by external sources. HSBC uses externally-sourced cost of capital rates where, in management’s judgement, those rates reflect more accurately the current market and economic conditions. For 2010 and 2009, internal costs of capital rates were consistent with externally-sourced rates.
Management’s judgement in estimating the cash flows of a CGU: the cash flow projections for each CGU are based on plans approved by the Group Management Board. The key assumptions in addition to the discount rate and nominal long-term growth rate for each significant CGU are discussed below.
Personal Financial Services – Europe and Commercial Banking – Europe:the assumptions included in the cash flow projections for Personal Financial Services – Europe and Commercial Banking – Europe reflect the economic environment and financial outlook of the European countries within these two segments. Key assumptions include the level of interest rates and the level and change in unemployment rates. While current economic conditions in Europe continue to be challenging, management’s cash flow projections are based primarily on these prevailing conditions. Risks include a double-dip recession in the UK and the continuation of base rates at their current low levels. Based on the conditions at the balance sheet date, management determined that a reasonably possible change in any of the key assumptions described above would not cause an impairment to be recognised in respect of Personal Financial Services – Europe or Commercial Banking – Europe.
Global Private Banking – Europe:the revenues in Global Private Banking – Europe are predominately generated through HSBC’s client relationships. The cash flow forecast reflects current economic conditions and key assumptions include the level of interest rates and client risk appetite. Further economic deterioration could result in a decrease in assets under management and a reduction in fee and trading income through increased client risk aversion. Based on the conditions at the balance sheet date, management determined that a reasonably possible change in any of the key assumptions described above would not cause an impairment to be recognised in respect of Global Private Banking – Europe.
Global Banking and Markets – Europe:the cash flows generated by Global Banking and Markets – Europe are diversified and there is no one key assumption that drives the cash flow projection of this CGU. In line with other CGUs, Global Banking and Markets – Europe is sensitive to changes in the interest rate environment and the strength of economic recovery in Europe. One of the key factors which may impact the carrying value of this CGU is the level of impairment charges which may emerge in the future, particularly in respect of holdings of available-for-sale sub-prime and Alt-A Residential MBSs. Based on management’s current assessment of the credit quality of these securities, which includes stressed scenarios for collateral defaults and house prices, and the level of credit support available, management determined that a reasonably possible change in key assumptions would not cause an impairment to be recognised in respect of Global Banking and Markets – Europe.
Personal Financial Services – Latin America:the assumptions included in the cash flow projections for Personal Financial Services – Latin America reflect the economic environment and financial outlook of the countries within this segment, with Brazil and Mexico being two of the largest countries included within this segment. Key assumptions include the growth in lending and deposit volumes and the credit quality of the loan portfolios. Mexico and Central America in particular are sensitive to economic conditions in the US which could constrain demand. Based on the conditions at the balance sheet date, management determined that a reasonably possible change in any of the key assumptions described above would not cause an impairment to be recognised in respect of Personal Financial Services – Latin America.
334
Notes on the Financial Statements(continued)
Movement of intangible assets excluding goodwill and the PVIF
| | | | | | | | | | | | | | | | | | | | | | | | | | | | | |
| | | | | | | | | | | | | | | | | | | Customer/ | | | | | | | |
| | | | | | | Mortgage | | | Internally | | | | | | | merchant | | | | | | | |
| | | Trade | | | servicing | | | generated | | | Purchased | | | relation- | | | | | | | |
| | | names | | | rights | | | software | | | software | | | ships | | | Other | | | Total | |
| | | US$m | | | US$m | | | US$m | | | US$m | | | US$m | | | US$m | | | US$m | |
Cost | | | | | | | | | | | | | | | | | | | | | | | | | | | | |
| At 1 January 2010 | | | 68 | | | | 689 | | | | 4,400 | | | | 954 | | | | 1,988 | | | | 502 | | | | 8,601 | |
Additions1 | | | – | | | | 52 | | | | 960 | | | | 140 | | | | 48 | | | | 4 | | | | 1,204 | |
| Disposals | | | – | | | | (105 | ) | | | (40 | ) | | | (15 | ) | | | (79 | ) | | | – | | | | (239 | ) |
| Amount written off | | | – | | | | – | | | | (70 | ) | | | (2 | ) | | | – | | | | – | | | | (72 | ) |
| Exchange differences | | | – | | | | – | | | | (68 | ) | | | (4 | ) | | | 30 | | | | 27 | | | | (15 | ) |
| Other changes | | | – | | | | – | | | | 20 | | | | (8 | ) | | | – | | | | (30 | ) | | | (18 | ) |
| | | | | | | | | | | | | | | |
| | | | | | | | | | | | | | | | | | | | | | | | | | | | | |
| At 31 December 2010 | | | 68 | | | | 636 | | | | 5,202 | | | | 1,065 | | | | 1,987 | | | | 503 | | | | 9,461 | |
| | | | | | | | | | | | | | | |
| | | | | | | | | | | | | | | | | | | | | | | | | | | | | |
Accumulated amortisation | | | | | | | | | | | | | | | | | | | | | | | | | | | | |
| At 1 January 2010 | | | (50 | ) | | | (240 | ) | | | (2,511 | ) | | | (747 | ) | | | (955 | ) | | | (125 | ) | | | (4,628 | ) |
Charge for the year2 | | | (5 | ) | | | (105 | ) | | | (596 | ) | | | (97 | ) | | | (243 | ) | | | (30 | ) | | | (1,076 | ) |
| Impairment | | | – | | | | – | | | | (12 | ) | | | – | | | | – | | | | – | | | | (12 | ) |
| Disposals | | | – | | | | 105 | | | | 33 | | | | 8 | | | | 68 | | | | (1 | ) | | | 213 | |
| Amount written off | | | – | | | | – | | | | 70 | | | | 2 | | | | – | | | | – | | | | 72 | |
| Exchange differences | | | 1 | | | | – | | | | 48 | | | | 1 | | | | (13 | ) | | | (1 | ) | | | 36 | |
| Other changes | | | 2 | | | | – | | | | 10 | | | | (15 | ) | | | – | | | | 13 | | | | 10 | |
| | | | | | | | | | | | | | | |
| | | | | | | | | | | | | | | | | | | | | | | | | | | | | |
| At 31 December 2010 | | | (52 | ) | | | (240 | ) | | | (2,958 | ) | | | (848 | ) | | | (1,143 | ) | | | (144 | ) | | | (5,385 | ) |
| | | | | | | | | | | | | | | |
| | | | | | | | | | | | | | | | | | | | | | | | | | | | | |
| Net carrying amount at 31 December 2010 | | | 16 | | | | 396 | | | | 2,244 | | | | 217 | | | | 844 | | | | 359 | | | | 4,076 | |
| | | | | | | | | | | | | | | |
| | | | | | | | | | | | | | | | | | | | | | | | | | | | | |
| Cost | | | | | | | | | | | | | | | | | | | | | | | | | | | | |
| At 1 January 2009 | | | 67 | | | | 1,360 | | | | 3,429 | | | | 867 | | | | 1,749 | | | | 421 | | | | 7,893 | |
Additions1 | | | – | | | | 116 | | | | 763 | | | | 65 | | | | 20 | | | | 10 | | | | 974 | |
| Acquisition of subsidiaries | | | – | | | | – | | | | – | | | | – | | | | 58 | | | | – | | | | 58 | |
| Disposals | | | – | | | | (29 | ) | | | (14 | ) | | | (18 | ) | | | (25 | ) | | | – | | | | (86 | ) |
| Amount written off | | | – | | | | (757 | ) | | | (45 | ) | | | (1 | ) | | | (15 | ) | | | – | | | | (818 | ) |
| Exchange differences | | | 1 | | | | – | | | | 247 | | | | 53 | | | | 201 | | | | 9 | | | | 511 | |
| Other changes | | | – | | | | (1 | ) | | | 20 | | | | (12 | ) | | | – | | | | 62 | | | | 69 | |
| | | | | | | | | | | | | | | |
| | | | | | | | | | | | | | | | | | | | | | | | | | | | | |
| At 31 December 2009 | | | 68 | | | | 689 | | | | 4,400 | | | | 954 | | | | 1,988 | | | | 502 | | | | 8,601 | |
| | | | | | | | | | | | | | | |
| | | | | | | | | | | | | | | | | | | | | | | | | | | | | |
| Accumulated amortisation | | | | | | | | | | | | | | | | | | | | | | | | | | | | |
| At 1 January 2009 | | | (45 | ) | | | (1,023 | ) | | | (1,992 | ) | | | (631 | ) | | | (681 | ) | | | (52 | ) | | | (4,424 | ) |
Charge for the year2 | | | (4 | ) | | | (3 | ) | | | (433 | ) | | | (98 | ) | | | (228 | ) | | | (30 | ) | | | (796 | ) |
| Impairment | | | – | | | | – | | | | (6 | ) | | | (5 | ) | | | (6 | ) | | | – | | | | (17 | ) |
| Disposals | | | – | | | | 29 | | | | 6 | | | | 18 | | | | 15 | | | | – | | | | 68 | |
| Amount written off | | | – | | | | 757 | | | | 45 | | | | 1 | | | | 15 | | | | – | | | | 818 | |
| Exchange differences | | | (1 | ) | | | – | | | | (131 | ) | | | (32 | ) | | | (72 | ) | | | (1 | ) | | | (237 | ) |
| Other changes | | | – | | | | – | | | | – | | | | – | | | | 2 | | | | (42 | ) | | | (40 | ) |
| | | | | | | | | | | | | | | |
| | | | | | | | | | | | | | | | | | | | | | | | | | | | | |
| At 31 December 2009 | | | (50 | ) | | | (240 | ) | | | (2,511 | ) | | | (747 | ) | | | (955 | ) | | | (125 | ) | | | (4,628 | ) |
| | | | | | | | | | | | | | | |
| | | | | | | | | | | | | | | | | | | | | | | | | | | | | |
| Net carrying amount at 31 December 2009 | | | 18 | | | | 449 | | | | 1,889 | | | | 207 | | | | 1,033 | | | | 377 | | | | 3,973 | |
| | | | | | | | | | | | | | | |
| | |
| 1 | | At 31 December 2010, HSBC had US$0.2m (2009: US$0.2m) of contractual commitments to acquire intangible assets. |
| |
| 2 | | The amortisation charge for the year is recognised within the income statement under ‘Amortisation and impairment of intangible assets’, with the exception of the amortisation of mortgage servicing rights which is recognised in net fee income. |
335
Notes on the Financial Statements(continued)
25 Property, plant and equipment
| | | | | | | | | | | | | | | | | | | | | | | | | |
| | | | | | | Long | | | Short | | | Equipment, | | | Equipment | | | | |
| | | Freehold | | | Leasehold | | | leasehold | | | fixtures | | | on | | | | |
| | | land and | | | land and | | | land and | | | and | | | operating | | | | |
| | | buildings | | | buildings | | | buildings | 1 | | fittings | 2 | | leases | | | Total | 3 |
| | | US$m | | | US$m | | | US$m | | | US$m | | | US$m | | | US$m | |
Cost or fair value | | | | | | | | | | | | | | | | | | | | | | | | |
| At 1 January 2010 | | | 3,915 | | | | 1,327 | | | | 3,135 | | | | 11,552 | | | | 5,236 | | | | 25,165 | |
Additions at cost4 | | | 349 | | | | 76 | | | | 632 | | | | 1,456 | | | | 65 | | | | 2,578 | |
| Fair value adjustments | | | 31 | | | | 24 | | | | 38 | | | | – | | | | – | | | | 93 | |
Disposals5 | | | (307 | ) | | | (8 | ) | | | (82 | ) | | | (355 | ) | | | (5,113 | ) | | | (5,865 | ) |
| Reclassified to held for sale | | | (73 | ) | | | (16 | ) | | | (3 | ) | | | (35 | ) | | | – | | | | (127 | ) |
| Transfers | | | (47 | ) | | | (147 | ) | | | 199 | | | | (5 | ) | | | – | | | | – | |
| Exchange differences | | | (47 | ) | | | (5 | ) | | | (17 | ) | | | (62 | ) | | | (135 | ) | | | (266 | ) |
| Other changes | | | 131 | | | | 422 | | | | 102 | | | | (22 | ) | | | – | | | | 633 | |
| | | | | | | | | | | | | |
| | | | | | | | | | | | | | | | | | | | | | | | | |
| At 31 December 2010 | | | 3,952 | | | | 1,673 | | | | 4,004 | | | | 12,529 | | | | 53 | | | | 22,211 | |
| | | | | | | | | | | | | |
| | | | | | | | | | | | | | | | | | | | | | | | | |
Accumulated depreciation and impairment | | | | | | | | | | | | | | | | | | | | | | | | |
| At 1 January 2010 | | | (450 | ) | | | (229 | ) | | | (1,065 | ) | | | (7,743 | ) | | | (1,876 | ) | | | (11,363 | ) |
| Depreciation charge for the year | | | (91 | ) | | | (46 | ) | | | (203 | ) | | | (1,178 | ) | | | (150 | ) | | | (1,668 | ) |
Disposals5 | | | 31 | | | | – | | | | 68 | | | | 344 | | | | 1,956 | | | | 2,399 | |
| Reclassified (from)/to held for sale | | | 24 | | | | – | | | | 1 | | | | 26 | | | | – | | | | 51 | |
| Transfers | | | 23 | | | | 20 | | | | (43 | ) | | | – | | | | – | | | | – | |
| Impairment losses recognised | | | (22 | ) | | | – | | | | 1 | | | | (24 | ) | | | – | | | | (45 | ) |
| Exchange differences | | | 5 | | | | 2 | | | | 5 | | | | 54 | | | | 45 | | | | 111 | |
| Other changes | | | (106 | ) | | | (54 | ) | | | (32 | ) | | | 15 | | | | 2 | | | | (175 | ) |
| | | | | | | | | | | | | |
| | | | | | | | | | | | | | | | | | | | | | | | | |
| At 31 December 2010 | | | (586 | ) | | | (307 | ) | | | (1,268 | ) | | | (8,506 | ) | | | (23 | ) | | | (10,690 | ) |
| | | | | | | | | | | | | |
| | | | | | | | | | | | | | | | | | | | | | | | | |
| Net carrying amount at 31 December 2010 | | | 3,366 | | | | 1,366 | | | | 2,736 | | | | 4,023 | | | | 30 | | | | 11,521 | |
| | | | | | | | | | | | | |
| | | | | | | | | | | | | | | | | | | | | | | | | |
| Cost or fair value | | | | | | | | | | | | | | | | | | | | | | | | |
| At 1 January 2009 | | | 4,126 | | | | 1,736 | | | | 2,924 | | | | 10,320 | | | | 4,547 | | | | 23,653 | |
Additions at cost4 | | | 344 | | | | 35 | | | | 179 | | | | 1,253 | | | | 299 | | | | 2,110 | |
| Acquisition of subsidiaries | | | – | | | | – | | | | 15 | | | | 7 | | | | – | | | | 22 | |
| Fair value adjustments | | | (58 | ) | | | 16 | | | | 18 | | | | – | | | | – | | | | (24 | ) |
| Disposals | | | (201 | ) | | | (510 | ) | | | (98 | ) | | | (640 | ) | | | (117 | ) | | | (1,566 | ) |
| Reclassified to held for sale | | | (697 | ) | | | – | | | | (20 | ) | | | (63 | ) | | | – | | | | (780 | ) |
| Transfers | | | – | | | | (2 | ) | | | 2 | | | | – | | | | – | | | | – | |
| Exchange differences | | | 342 | | | | 62 | | | | 90 | | | | 737 | | | | 507 | | | | 1,738 | |
| Other changes | | | 59 | | | | (10 | ) | | | 25 | | | | (62 | ) | | | – | | | | 12 | |
| | | | | | | | | | | | | |
| | | | | | | | | | | | | | | | | | | | | | | | | |
| At 31 December 2009 | | | 3,915 | | | | 1,327 | | | | 3,135 | | | | 11,552 | | | | 5,236 | | | | 25,165 | |
| | | | | | | | | | | | | |
| | | | | | | | | | | | | | | | | | | | | | | | | |
| Accumulated depreciation and impairment | | | | | | | | | | | | | | | | | | | | | | | | |
| At 1 January 2009 | | | (368 | ) | | | (228 | ) | | | (886 | ) | | | (6,614 | ) | | | (1,532 | ) | | | (9,628 | ) |
| Depreciation charge for the year | | | (82 | ) | | | (44 | ) | | | (193 | ) | | | (1,160 | ) | | | (169 | ) | | | (1,648 | ) |
| Disposals | | | 39 | | | | 46 | | | | 90 | | | | 495 | | | | (4 | ) | | | 666 | |
| Reclassified to held for sale | | | 46 | | | | – | | | | 3 | | | | 30 | | | | – | | | | 79 | |
| Impairment losses recognised | | | (30 | ) | | | (1 | ) | | | (26 | ) | | | (20 | ) | | | – | | | | (77 | ) |
| Exchange differences | | | (25 | ) | | | (7 | ) | | | (42 | ) | | | (496 | ) | | | (173 | ) | | | (743 | ) |
| Other changes | | | (30 | ) | | | 5 | | | | (11 | ) | | | 22 | | | | 2 | | | | (12 | ) |
| | | | | | | | | | | | | |
| | | | | | | | | | | | | | | | | | | | | | | | | |
| At 31 December 2009 | | | (450 | ) | | | (229 | ) | | | (1,065 | ) | | | (7,743 | ) | | | (1,876 | ) | | | (11,363 | ) |
| | | | | | | | | | | | | |
| | | | | | | | | | | | | | | | | | | | | | | | | |
| Net carrying amount at 31 December 2009 | | | 3,465 | | | | 1,098 | | | | 2,070 | | | | 3,809 | | | | 3,360 | | | | 13,802 | |
| | | | | | | | | | | | | |
| | |
| 1 | | Including assets held on finance leases with a net book value of US$11m (2009: US$18m). |
| |
| 2 | | Including assets held on finance leases with a net book value of US$204m (2009: US$513m). |
| |
| 3 | | Including assets with a net book value of US$31m (2009: US$36m) pledged as security for liabilities. |
| |
| 4 | | At 31 December 2010, HSBC had US$593m (2009: US$878m) of contractual commitments to acquire property, plant and equipment. |
| |
| 5 | | The disposals included under ‘Equipment on operating leases’ relate to the sale of a subsidiary, Eversholt Rail Group, during the year. |
Leasehold land and buildings
Leasehold land and buildings are considered to be held under finance lease contracts where the value of the land cannot reliably be separated from the value of the lease and the respective contracts do not meet the criteria for classification as operating leases. Included within ‘Short leasehold land and buildings’ are the following amounts in respect of assets classed as improvements to buildings, which are carried at depreciated historical cost:
336
Notes on the Financial Statements(continued)
Leasehold land and buildings
| | | | | | | | | | | | | | | | | |
| | | 2010 | | | 2009 | |
| | | | | | | Accumulated | | | | | | | Accumulated | |
| | | Cost | | | depreciation | | | Cost | | | depreciation | |
| | | US$m | | | US$m | | | US$m | | | US$m | |
| | | | | | | | | | | | | | | | | |
| At 1 January | | | 1,824 | | | | (831 | ) | | | 1,621 | | | | (675 | ) |
| Additions | | | 181 | | | | – | | | | 175 | | | | – | |
| Disposals | | | (81 | ) | | | 54 | | | | (89 | ) | | | 71 | |
| Depreciation charge for the year | | | – | | | | (133 | ) | | | – | | | | (133 | ) |
| Impairment loss recognised | | | – | | | | – | | | | – | | | | (24 | ) |
| Exchange differences | | | (16 | ) | | | – | | | | 86 | | | | (40 | ) |
| Other changes | | | 36 | | | | (23 | ) | | | 31 | | | | (30 | ) |
| | | | | | | | | |
| | | | | | | | | | | | | | | | | |
| At 31 December | | | 1,944 | | | | (933 | ) | | | 1,824 | | | | (831 | ) |
| | | | | | | | | |
| | | | | | | | | | | | | | | | | |
| Net carrying amount at 31 December | | | 1,011 | | | | | | | | 993 | | | | | |
| | | | | | | | | | | | | |
Movement on the fair value of investment properties
| | | | | | | | | | | | | | | | | |
| | | | | | | Long | | | Short | | | | |
| | | Freehold | | | leasehold | | | leasehold | | | | |
| | | land and | | | land and | | | land and | | | | |
| | | buildings | | | buildings | | | buildings | | | Total | |
| | | US$m | | | US$m | | | US$m | | | US$m | |
Fair value | | | | | | | | | | | | | | | | |
| At 1 January 2010 | | | 640 | | | | 184 | | | | 237 | | | | 1,061 | |
| Additions at cost | | | 240 | | | | – | | | | – | | | | 240 | |
| Fair value adjustments | | | 31 | | | | 24 | | | | 38 | | | | 93 | |
| Disposals | | | (216 | ) | | | (2 | ) | | | – | | | | (218 | ) |
| Transfers | | | – | | | | (42 | ) | | | 42 | | | | – | |
| Exchange differences | | | (34 | ) | | | (1 | ) | | | (1 | ) | | | (36 | ) |
| Other changes | | | 6 | | | | (7 | ) | | | (6 | ) | | | (7 | ) |
| | | | | | | | | |
| At 31 December 2010 | | | 667 | | | | 156 | | | | 310 | | | | 1,133 | |
| | | | | | | | | |
| | | | | | | | | | | | | | | | | |
| Fair value | | | | | | | | | | | | | | | | |
| At 1 January 2009 | | | 566 | | | | 188 | | | | 217 | | | | 971 | |
| Additions at cost | | | 36 | | | | – | | | | – | | | | 36 | |
| Fair value adjustments | | | (58 | ) | | | 16 | | | | 18 | | | | (24 | ) |
| Disposals | | | – | | | | (25 | ) | | | – | | | | (25 | ) |
| Exchange differences | | | 57 | | | | 5 | | | | – | | | | 62 | |
| Other changes | | | 39 | | | | – | | | | 2 | | | | 41 | |
| | | | | | | | | |
| | | | | | | | | | | | | | | | | |
| At 31 December 2009 | | | 640 | | | | 184 | | | | 237 | | | | 1,061 | |
| | | | | | | | | |
Investment properties are valued on an open market value basis as at 31 December each year by independent professional valuers who have recent experience in the location and type of properties. Investment properties in Hong Kong, the Macau Special Administrative Region and mainland China, which represent more than 35% by value of HSBC’s investment properties subject to revaluation, were valued by an independent valuer who is a member of the Hong Kong Institute of Surveyors and who has recent experience in the locations and categories of the investment properties.
Included within ‘Other operating income’ was rental income of US$26m (2009: US$81m; 2008: US$23m) earned by HSBC on its investment properties. Direct operating expenses of US$3m (2009: US$2m; 2008: US$2m) incurred in respect of the investment properties during the year were recognised in ‘General and administrative expenses’. Direct operating expenses arising in respect of investment properties that did not generate rental income during 2010 amounted to nil (2009 and 2008: nil).
At 31 December 2010, HSBC had no contractual obligations to purchase, construct, develop, maintain or enhance investment properties (2009: nil).
HSBC Holdings had no investment properties at 31 December 2010 or 2009.
337
Notes on the Financial Statements(continued)
HSBC properties leased to customers
HSBC properties leased to customers included US$441m at 31 December 2010 (2009: US$434m) let under operating leases, net of accumulated depreciation of US$19m (2009: US$18m). None was held by HSBC Holdings.
| 26 | Investments in subsidiaries |
Principal subsidiaries of HSBC Holdings
| | | | | | | | | | | | | | | | | |
| | | At 31 December 2010 | |
| | | | | | | HSBC’s | | | | | | | |
| | | Country of | | | interest in | | | Issued | | | | |
| | | incorporation | | | equity capital | | | equity | | | Share | |
| | | or registration | | | % | | | capital | | | class | |
Europe | | | | | | | | | | | | | | | | |
| HSBC Asset Finance (UK) Limited | | England | | | | 100 | | | | £265m | | | Ordinary £1 | |
| HSBC Bank A.S. | | | Turkey | | | | 100 | | | | TRL652m | | | A-Common TRL1 | |
| | | | | | | | | | | | B-Common TRL1 | |
| HSBC Bank Malta p.l.c. | | Malta | | | | 70.03 | | | | €88m | | | Ordinary €0.30 | |
| HSBC Bank plc | | England | | | | 100 | | | | £797m | | | Ordinary £1 | |
| | | | | | | | | | | | | | | Preferred Ordinary £1 | |
| | | | | | | | | | | | | | | Series 2 Third Dollar | |
| | | | | | | | | | | | | | | Preference US$0.01 | |
| | | | | | | | | | | | | | | Third Dollar | |
| | | | | | | | | | | | | | | Preference US$0.01 | |
| HSBC France | | France | | | | 99.99 | | | | €337m | | | Shares €5.00 | |
| HSBC Bank International Limited | | Jersey | | | | 100 | | | | £1m | | | Ordinary £1 | |
| HSBC Life (UK) Limited | | England | | | | 100 | | | | £94m | | | Ordinary £1 | |
| HSBC Private Banking Holdings (Suisse) S.A. | | Switzerland | | | | 100 | | | CHF1,363m | | | Ordinary CHF1,000 | |
| HSBC Trinkaus & Burkhardt AG | | Germany | | | | 80.40 | | | | €28m | | | Shares of no par value | |
Marks and Spencer Retail Financial Services Holdings
Limited | | England | | | | 100 | | | | £67m | | | Ordinary £1 | |
| | | | | | | | | | | | | | | | | |
Hong Kong | | | | | | | | | | | | | | | | |
Hang Seng Bank Limited7 | | Hong Kong | | | | 62.14 | | | HK$9,559m | | | Ordinary HK$5.00 | |
| HSBC Insurance (Asia) Limited | | Hong Kong | | | | 100 | | | HK$318m | | | Ordinary HK$1,000 | |
| HSBC Life (International) Limited | | Bermuda | | | | 100 | | | HK$421m | | | Ordinary HK$1.00 | |
| The Hongkong and Shanghai Banking Corporation Limited | | Hong Kong | | | | 100 | | | HK$22,494m | | | Ordinary HK$2.50 | |
| | | | | | | | | | | | | | | CIP1US$1.00 | |
| | | | | | | | | | | | | | | CRP2US$1.00 | |
| | | | | | | | | | | | | | | NIP3US$1.00 | |
| | | | | | | | | | | | | | | | | |
Rest of Asia-Pacific | | | | | | | | | | | | | | | | |
| HSBC Bank Australia Limited | | Australia | | | | 100 | | | | A$751m | | | Shares of no par value | |
| HSBC Bank (China) Company Limited | | PRC4 | | | | 100 | | | RMB8,000m | | | Ordinary CNY1.00 | |
| HSBC Bank Malaysia Berhad | | Malaysia | | | | 100 | | | RM115m | | | Ordinary RM0.50 | |
| | | | | | | | | | | | | | | | | |
Middle East | | | | | | | | | | | | | | | | |
| HSBC Bank Middle East Limited | | Jersey | | | | 100 | | | | US$931m | | | CRP2US$1.00 | |
| | | | | | | | | | | | | | | Ordinary US$1.00 | |
| HSBC Bank Egypt S.A.E. | | Egypt | | | | 94.53 | | | EGP1,511m | | | Ordinary EGP84.00 | |
| | | | | | | | | | | | | | | | | |
North America | | | | | | | | | | | | | | | | |
| HSBC Bank Bermuda Limited | | Bermuda | | | | 100 | | | | US$30m | | | Common BMD1.00 | |
| HSBC Bank Canada | | Canada | | | | 100 | | | | C$1,225m | | | Class 1 Pref of NPV5 | | |
| | | | | | | | | | | | | | | Class 2 Pref of NPV5 | |
| | | | | | | | | | | | | | | Common of NPV | |
| HSBC Bank USA, N.A. | | United States | | | | 100 | | | | US$2m | | | Common US$100 | |
| HSBC Finance Corporation | | United States | | | | 100 | | | | –6 | | | Common US$0.01 | |
| HSBC Securities (USA) Inc. | | United States | | | | 100 | | | | –6 | | | Common US$0.05 | |
| | | | | | | | | | | | | | | | | |
Latin America | | | | | | | | | | | | | | | | |
| HSBC Bank Argentina S.A. | | Argentina | | | | 99.99 | | | ARS1,244m | | | Ordinary-A ARS1.00 | |
| | | | | | | | | | | | | | | Ordinary-B ARS1.00 | |
| HSBC Bank Brasil S.A. – Banco Múltiplo | | Brazil | | | | 100 | | | BRL5,178m | | | Shares of no par value | |
HSBC Mexico, S.A., Institución de Banca Múltiple,
Grupo Financiero HSBC. | | Mexico | | | | 99.99 | | | MXN5,087m | | | Ordinary MXN2.00 | |
| HSBC Bank (Panama) S.A. | | Panama | | | | 100 | | | | US$10m | | | Ordinary PAB 1.00 | |
| | | |
1 Cumulative Irredeemable Preference shares. | | 5 Preference shares of nil par value. |
2 Cumulative Redeemable Preference shares | | 6 Issued equity capital is less than US$1m. |
3 Non-cumulative Irredeemable Preference shares. | | 7 Listed in Hong Kong. |
4 People’s Republic of China | | |
Details of the debt, subordinated debt and preference shares issued by the principal subsidiaries to parties external to the Group are included in the Notes 30 ‘Debt securities in issue’, 34 ‘Subordinated liabilities’ and 38 ‘Non-controlling interests’, respectively.
338
Notes on the Financial Statements(continued)
All the above subsidiaries are included in the HSBC consolidated financial statements.
Details of all HSBC subsidiaries will be annexed to the next Annual Return of HSBC Holdings filed with the UK Registrar of Companies.
All the above make their financial statements up to 31 December except for HSBC Bank Argentina S.A., whose financial statements are made up to 30 June annually.
The principal countries of operation are the same as the countries of incorporation except for HSBC Bank Middle East Limited which operates mainly in the Middle East and HSBC Life (International) Limited which operates mainly in Hong Kong.
Subsidiaries which experience significant restrictions on their ability to transfer funds to HSBC in the form of cash dividends or to repay loans and advances
During 2010 and 2009, none of the Group’s subsidiaries experienced significant restrictions on paying dividends or repaying loans and advances.
Subsidiaries excluding SPEs where HSBC owns less than 50% of the voting rights
At 31 December 2009, HSBC consolidated HSBC Private Equity Fund 3 (‘HPEF3’) but only had a 38.8% interest in its equity capital. HSBC had control under IAS 27 because it was the investment adviser/manager of the fund and had a significant equity interest.
On 30 November 2010, the Group completed the sale of an 80.1% interest in HSBC Private Equity (Asia) Limited (‘HPEA’) to HPEA’s management. As a result, the Group no longer controls HPEF3. The Group previously consolidated HPEF 3 by virtue of its control over HPEA, which in turn controlled HPEF3. Upon deconsolidation, the group retains its 38.8% interest in HPEF3 as an available for sale investment. HPEF3 has been renamed The Headland Private Equity Fund 3 Limited.
SPEs consolidated by HSBC where HSBC owns less than 50% of the voting rights
| | | | | | | | | | | |
| | | Carrying value of total | | | |
| | | consolidated assets | | Nature of SPE |
| | | 2010 | | | 2009 | | | |
| | | US$bn | | | US$bn | | | |
| | | | | | | | | | |
| Barion Funding Limited | | | 4.5 | | | | 4.4 | | | Structured investment conduit |
| Bryant Park Funding LLC | | | 3.0 | | | | 3.8 | | | Conduit |
| HSBC Affinity Corporation I | | | 4.2 | | | | 4.9 | | | Securitisation |
| HSBC Auto Receivables Corporation | | | – | | | | 1.3 | | | Securitisation |
| HSBC Corporate Money Fund (Euro) | | | – | | | | 0.8 | | | Money market fund |
| HSBC Funding Inc V | | | 5.4 | | | | 5.3 | | | Securitisation |
| HSBC Home Equity Loan Corporation I | | | 2.8 | | | | 3.1 | | | Securitisation |
| HSBC Home Equity Loan Corporation II | | | 2.8 | | | | 3.3 | | | Securitisation |
| HSBC Investor Prime Money Market Fund | | | – | | | | 10.7 | | | Money market fund |
| HSBC Receivables Funding, Inc I | | | 3.7 | | | | 5.4 | | | Securitisation |
| HSBC Receivables Inc Funding II | | | 2.0 | | | | 1.8 | | | Securitisation |
| HSBC Sterling Liquidity Fund | | | – | | | | 7.5 | | | Money market fund |
| HSBC US Dollar Liquidity Fund | | | – | | | | 23.4 | | | Money market fund |
| Malachite Funding Limited | | | 3.9 | | | | 4.3 | | | Structured investment conduit |
| Mazarin Funding Limited | | | 10.3 | | | | 11.3 | | | Structured investment conduit |
| Metrix Funding Ltd | | | 1.4 | | | | 3.7 | | | Securitisation |
| Metrix Securities plc | | | 1.0 | | | | 4.2 | | | Securitisation |
| Regency Assets Limited | | | 6.3 | | | | 6.8 | | | Conduit |
| Solitaire Funding Ltd | | | 13.5 | | | | 12.8 | | | Conduit |
| Turquoise Receivable Trustee Ltd | | | – | | | | 0.5 | | | Securitisation |
In addition to the above, HSBC consolidates a number of individually insignificant SPEs with total assets of US$10.6bn. For further details, see ‘Special purpose entities’ on page 361.
In each of the above cases, HSBC has less than 50% of the voting rights, but consolidates because it has the majority of risks and rewards of ownership of the SPE, or the substance of the relationship with the SPE is such that its activities are conducted on behalf of HSBC according to its specific business needs so that HSBC obtains benefit from the SPE’s operation. The consolidation of SPEs sponsored by HSBC is discussed on page 251.
339
Notes on the Financial Statements(continued)
There were minor acquisitions and increases in investment in subsidiaries which increased goodwill by US$16m.
| | | | | | | | | |
| | | 2010 | | | 2009 | |
| | | US$m | | | US$m | |
| | | | | | | | | |
| Bullion | | | 18,446 | | | | 13,757 | |
| Assets held for sale | | | 1,991 | | | | 3,118 | |
| Reinsurers’ share of liabilities under insurance contracts (Note 32) | | | 1,865 | | | | 2,069 | |
| Endorsements and acceptances | | | 10,116 | | | | 9,311 | |
| Other accounts | | | 10,833 | | | | 16,279 | |
| | | | | |
| | | | | | | | | |
| | | | 43,251 | | | | 44,534 | |
| | | | | |
At 31 December 2010, ‘Assets held for sale’ included US$520m related to the sale of a majority interest in the UK-based global real estate and infrastructure private equity fund management business to the unit’s senior management team. The transaction is expected to complete in the first half of 2011. Associated liabilities of US$86m are included in ‘Other Liabilities’.
Non-current assets held for sale
| | | | | | | | | |
| | | 2010 | | | 2009 | |
| | | US$m | | | US$m | |
| | | | | | | | | |
| Interests in associates | | | – | | | | 105 | |
| Property, plant and equipment | | | 1,333 | | | | 1,639 | |
| Investment properties | | | 9 | | | | 1 | |
| Financial assets | | | 116 | | | | 1,359 | |
| Other | | | 3 | | | | 14 | |
| | | | | |
| | | | | | | | | |
| | | | 1,461 | | | | 3,118 | |
| | | | | |
The property, plant and equipment classified as held for sale is the result of repossession of property that had been pledged as collateral by customers. Substantially all of these assets are disposed of within 12 months of acquisition. The majority arose within the geographical segment of North America. At 31 December 2009, property, plant and equipment held for sale also included US$257m in relation to the proposed sale of 452 Fifth Avenue and 1 W. 39th Street in New York and US$370m in relation to the proposed sale of 103 Champs Elysées and 15 Rue Vernet in Paris. On completion of these transactions in 2010 gains of US$56m and US$194m respectively were recognised within ‘Other operating income’.
At 31 December 2009, financial assets classified as held for sale included US$972m of vehicle finance loans and US$366m of credit card portfolios, presented in the geographical segment of North America.
Neither a gain nor loss was recognised on reclassifying assets as held for sale during the year.
| | | | | | | | | |
| | | 2010 | | | 2009 | |
| | | US$m | | | US$m | |
| | | | | | | | | |
| Deposits by banks | | | 38,678 | | | | 41,165 | |
| Customer accounts | | | 125,684 | | | | 99,306 | |
| Other debt securities in issue (Note 30) | | | 33,726 | | | | 37,592 | |
| Other liabilities – net short positions in securities | | | 102,615 | | | | 90,067 | |
| | | | | |
| | | | | | | | | |
| | | | 300,703 | | | | 268,130 | |
| | | | | |
At 31 December 2010, the cumulative amount of change in fair value attributable to changes in HSBC credit risk was a gain of US$142m (2009: gain of US$119m).
340
Notes on the Financial Statements(continued)
| 29 | Financial liabilities designated at fair value |
| | | | | | | | | |
| | | 2010 | | | 2009 | |
| | | US$m | | | US$m | |
| | | | | | | | | |
| Deposits by banks and customer accounts | | | 6,527 | | | | 6,586 | |
| Liabilities to customers under investment contracts | | | 11,700 | | | | 10,865 | |
| Debt securities in issue (Note 30) | | | 46,091 | | | | 38,208 | |
| Subordinated liabilities (Note 34) | | | 19,395 | | | | 20,180 | |
| Preferred securities (Note 34) | | | 4,420 | | | | 4,253 | |
| | | | | |
| | | | | | | | | |
| | | | 88,133 | | | | 80,092 | |
| | | | | |
The carrying amount at 31 December 2010 of financial liabilities designated at fair value was US$1,631m more than the contractual amount at maturity (2009: US$1,346m more). The cumulative amount of the change in fair value attributable to changes in credit risk was a gain of US$1,279m (2009: gain of US$1,510m).
| | | | | | | | | |
| | | 2010 | | | 2009 | |
| | | US$m | | | US$m | |
| Subordinated liabilities (Note 34): | | | | | | | | |
| – owed to third parties | | | 12,029 | | | | 12,549 | |
| – owed to HSBC undertakings | | | 4,259 | | | | 4,360 | |
| | | | | |
| | | | | | | | | |
| | | | 16,288 | | | | 16,909 | |
| | | | | |
The carrying amount at 31 December 2010 of financial liabilities designated at fair value was US$855m more than the contractual amount at maturity (2009: US$769m more). The cumulative amount of the change in fair value attributable to changes in credit risk was a gain of US$439m (2009: gain of US$191m).
| 30 | Debt securities in issue |
| | | | | | | | | |
| | | 2010 | | | 2009 | |
| | | US$m | | | US$m | |
| | | | | | | | | |
| Bonds and medium-term notes | | | 162,948 | | | | 160,295 | |
| Other debt securities in issue | | | 62,270 | | | | 62,401 | |
| | | | | |
| | | | | | | | | |
| | | | 225,218 | | | | 222,696 | |
| Of which debt securities in issue reported as: | | | | | | | | |
| – trading liabilities (Note 28) | | | (33,726 | ) | | | (37,592 | ) |
| – financial liabilities designated at fair value (Note 29) | | | (46,091 | ) | | | (38,208 | ) |
| | | | | |
| | | | | | | | | |
| | | | 145,401 | | | | 146,896 | |
| | | | | |
Certain debt securities in issue are managed on a fair value basis as part of HSBC’s interest rate risk management policies. The hedged portion of these debt securities is presented within the balance sheet caption ‘Financial liabilities designated at fair value’, with the remaining portion included within ‘Trading liabilities’. The following table analyses the carrying amount of bonds and medium-term notes in issue at 31 December with original maturities greater than one year:
341
Notes on the Financial Statements(continued)
Bonds and medium-term notes
HSBC
| | | | | | | | | |
| | | 2010 | | | 2009 | |
| | | US$m | | | US$m | |
Fixed rate | | | | | | | | |
| Secured financing: | | | | | | | | |
| 0.01% to 3.99%: until 2068 | | | 6,666 | | | | 5,929 | |
| 4.00% to 4.99%: until 2013 | | | 1,956 | | | | 1,948 | |
| 5.00% to 5.99%: until 2022 | | | 387 | | | | 1,315 | |
| 7.00% to 7.99%: until 2019 | | | 209 | | | | 9 | |
| 8.00% to 9.99%: until 2028 | | | 394 | | | | 417 | |
| 10.00% or higher: until 2011 | | | – | | | | 43 | |
| Other fixed rate senior debt: | | | | | | | | |
| 0.01% to 3.99%: until 2057 | | | 39,596 | | | | 22,554 | |
| 4.00% to 4.99%: until 2046 | | | 12,854 | | | | 15,754 | |
| 5.00% to 5.99%: until 2021 | | | 19,011 | | | | 25,619 | |
| 6.00% to 6.99%: until 2033 | | | 11,008 | | | | 11,066 | |
| 7.00% to 7.99%: until 2032 | | | 3,124 | | | | 3,900 | |
| 8.00% to 9.99%: until 2036 | | | 254 | | | | 1,737 | |
| 10.00% or higher: until 2021 | | | 337 | | | | 280 | |
| | | | | |
| | | | 95,796 | | | | 90,571 | |
| | | | | |
| | | | | | | | | |
Variable interest rate | | | | | | | | |
| Secured financings – 0.01% to 13.99%: until 2068 | | | 8,448 | | | | 13,971 | |
| FHLB advances – 0.01% to 0.99%: until 2036 | | | 1,000 | | | | 1,000 | |
| Other variable interest rate senior debt – 0.01% to 12.99%: until 2068 | | | 53,301 | | | | 50,258 | |
| | | | | |
| | | | | | | | | |
| | | | 62,749 | | | | 65,229 | |
| | | | | |
| | | | | | | | | |
Structured notes | | | | | | | | |
| Interest rate linked | | | 4 | | | | 5 | |
| Equity, equity index or credit-linked | | | 4,399 | | | | 4,490 | |
| | | | | |
| | | | | | | | | |
| | | | 4,403 | | | | 4,495 | |
| | | | | | | |
| | | | | | | | | |
| | | | 162,948 | | | | 160,295 | |
| | | | | |
HSBC Holdings
| | | | | | | | | |
| | | 2010 | | | 2009 | |
| | | US$m | | | US$m | |
| | | | | | | | | |
Fixed rate senior debt, unsecured: | | | | | | | | |
| 4.00% to 4.99%: until 2014 | | | 1,664 | | | | 1,791 | |
| 6.00% to 6.99%: until 2024 | | | 1,004 | | | | 1,048 | |
| | | | | |
| | | | | | | | | |
| | | | 2,668 | | | | 2,839 | |
| | | | | |
| | | | | | | | | | | | | | | | | |
| | | HSBC | | | HSBC Holdings | |
| | | 2010 | | | 2009 | | | 2010 | | | 2009 | |
| | | US$m | | | US$m | | | US$m | | | US$m | |
| | | | | | | | | | | | | | | | | |
| Amounts due to investors in funds consolidated by HSBC | | | 840 | | | | 48,193 | | | | – | | | | – | |
| Obligations under finance leases (Note 42) | | | 454 | | | | 644 | | | | – | | | | – | |
| Dividend declared and payable by HSBC Holdings (Note 11) | | | 1,203 | | | | 1,231 | | | | 1,203 | | | | 1,231 | |
| Endorsements and acceptances | | | 10,123 | | | | 9,313 | | | | – | | | | – | |
| Other liabilities | | | 15,430 | | | | 9,259 | | | | 29 | | | | 26 | |
| | | | | | | | | |
| | | | | | | | | | | | | | | | | |
| | | | 28,050 | | | | 68,640 | | | | 1,232 | | | | 1,257 | |
| | | | | | | | | |
342
Notes on the Financial Statements(continued)
| 32 | Liabilities under insurance contracts |
| | | | | | | | | | | | | |
| | | | | | | Reinsurers’ | | | | |
| | | Gross | | | share | | | Net | |
| | | US$m | | | US$m | | | US$m | |
At 31 December 2010 | | | | | | | | | | | | |
Non-life insurance liabilities | | | | | | | | | | | | |
| Unearned premium provision | | | 727 | | | | (129 | ) | | | 598 | |
| Notified claims | | | 879 | | | | (230 | ) | | | 649 | |
| Claims incurred but not reported | | | 745 | | | | (75 | ) | | | 670 | |
| Other | | | 105 | | | | 2 | | | | 107 | |
| | | | | | | |
| | | | | | | | | | | | | |
| | | | 2,456 | | | | (432 | ) | | | 2,024 | |
| | | | | | | |
| | | | | | | | | | | | | |
Life insurance liabilities to policyholders | | | | | | | | | | | | |
| Life (non-linked) | | | 23,583 | | | | (673 | ) | | | 22,910 | |
Investment contracts with discretionary participation features1 | | | 22,074 | | | | – | | | | 22,074 | |
| Life (linked) | | | 10,496 | | | | (760 | ) | | | 9,736 | |
| | | | | | | |
| | | | | | | | | | | | | |
| | | | 56,153 | | | | (1,433 | ) | | | 54,720 | |
| | | | | | | |
| | | | | | | | | | | | | |
| | | | 58,609 | | | | (1,865 | ) | | | 56,744 | |
| | | | | | | |
| | | | | | | | | | | | | |
| At 31 December 2009 | | | | | | | | | | | | |
| Non-life insurance liabilities | | | | | | | | | | | | |
| Unearned premium provision | | | 833 | | | | (135 | ) | | | 698 | |
| Notified claims | | | 1,032 | | | | (245 | ) | | | 787 | |
| Claims incurred but not reported | | | 685 | | | | (82 | ) | | | 603 | |
| Other | | | 178 | | | | (5 | ) | | | 173 | |
| | | | | | | |
| | | | | | | | | | | | | |
| | | | 2,728 | | | | (467 | ) | | | 2,261 | |
| | | | | | | |
| | | | | | | | | | | | | |
| Life insurance liabilities to policyholders | | | | | | | | | | | | |
| Life (non-linked) | | | 20,979 | | | | (771 | ) | | | 20,208 | |
Investment contracts with discretionary participation features1 | | | 21,014 | | | | – | | | | 21,014 | |
| Life (linked) | | | 8,986 | | | | (831 | ) | | | 8,155 | |
| | | | | | | |
| | | | | | | | | | | | | |
| | | | 50,979 | | | | (1,602 | ) | | | 49,377 | |
| | | | | | | |
| | | | | | | | | | | | | |
| | | | 53,707 | | | | (2,069 | ) | | | 51,638 | |
| | | | | | | |
| | |
| 1 | | Though investment contracts with discretionary participation features are financial instruments, HSBC continues to treat them as insurance contracts as permitted by IFRS 4. |
343
Notes on the Financial Statements(continued)
Movement on non-life insurance liabilities
| | | | | | | | | | | | | |
| | | | | | | Reinsurers’ | | | | |
| | | Gross | | | share | | | Net | |
| | | US$m | | | US$m | | | US$m | |
2010 | | | | | | | | | | | | |
Unearned premium reserve (‘UPR’) | | | | | | | | | | | | |
| At 1 January | | | 833 | | | | (135 | ) | | | 698 | |
| Changes in UPR recognised as (income)/expense | | | (83 | ) | | | (12 | ) | | | (95 | ) |
| | | | | | | |
| Gross written premiums | | | 1,192 | | | | (172) | | | | 1,020 | |
| Gross earned premiums | | | (1,275) | | | | 160 | | | | (1,115) | |
| | | | | | | |
| Exchange differences and other movements | | | (23 | ) | | | 18 | | | | (5 | ) |
| | | | | | | |
| | | | | | | | | | | | | |
| At 31 December | | | 727 | | | | (129 | ) | | | 598 | |
| | | | | | | |
| | | | | | | | | | | | | |
Notified and incurred but not reported claims | | | | | | | | | | | | |
| At 1 January | | | 1,717 | | | | (327 | ) | | | 1,390 | |
| | | | | | | |
| Notified claims | | | 1,032 | | | | (245) | | | | 787 | |
| Claims incurred but not reported | | | 685 | | | | (82) | | | | 603 | |
| | | | | | | |
| | | | | | | | | | | | | |
| Claims paid in current year | | | (815 | ) | | | 114 | | | | (701 | ) |
| Claims incurred in respect of current year | | | 519 | | | | (111 | ) | | | 408 | |
| Claims incurred in respect of prior years | | | 106 | | | | 11 | | | | 117 | |
| Exchange differences and other movements | | | 97 | | | | 8 | | | | 105 | |
| | | | | | | |
| | | | | | | | | | | | | |
| At 31 December | | | 1,624 | | | | (305 | ) | | | 1,319 | |
| | | | | | | |
| Notified claims | | | 879 | | | | (230) | | | | 649 | |
| Claims incurred but not reported | | | 745 | | | | (75) | | | | 670 | |
| | | | | | | |
| | | | | | | | | | | | | |
| Other | | | 105 | | | | 2 | | | | 107 | |
| | | | | | | |
| | | | | | | | | | | | | |
| Total non-life insurance liabilities | | | 2,456 | | | | (432 | ) | | | 2,024 | |
| | | | | | | |
| | | | | | | | | | | | | |
| 2009 | | | | | | | | | | | | |
| Unearned premium reserve (‘UPR’) | | | | | | | | | | | | |
| At 1 January | | | 1,136 | | | | (159 | ) | | | 977 | |
| Changes in UPR recognised as (income)/expense | | | (233 | ) | | | 10 | | | | (223 | ) |
| | | | | | | |
| Gross written premiums | | | 1,339 | | | | (215 | ) | | | 1,124 | |
| Gross earned premiums | | | (1,572 | ) | | | 225 | | | | (1,347 | ) |
| | | | | | | |
| Exchange differences and other movements | | | (70 | ) | | | 14 | | | | (56 | ) |
| | | | | | | |
| | | | | | | | | | | | | |
| At 31 December | | | 833 | | | | (135 | ) | | | 698 | |
| | | | | | | |
| | | | | | | | | | | | | |
| Notified and incurred but not reported claims | | | | | | | | | | | | |
| At 1 January | | | 1,276 | | | | (271 | ) | | | 1,005 | |
| | | | | | | |
| Notified claims | | | 908 | | | | (230 | ) | | | 678 | |
| Claims incurred but not reported | | | 368 | | | | (41 | ) | | | 327 | |
| | | | | | | |
| | | | | | | | | | | | | |
| Claims paid in current year | | | (987 | ) | | | 156 | | | | (831 | ) |
| Claims incurred in respect of current year | | | 939 | | | | (156 | ) | | | 783 | |
| Claims incurred in respect of prior years | | | 342 | | | | (2 | ) | | | 340 | |
| Exchange differences and other movements | | | 147 | | | | (54 | ) | | | 93 | |
| | | | | | | |
| | | | | | | | | | | | | |
| At 31 December | | | 1,717 | | | | (327 | ) | | | 1,390 | |
| | | | | | | |
| Notified claims | | | 1,032 | | | | (245 | ) | | | 787 | |
| Claims incurred but not reported | | | 685 | | | | (82 | ) | | | 603 | |
| | | | | | | |
| | | | | | | | | | | | | |
| Other | | | 178 | | | | (5 | ) | | | 173 | |
| | | | | | | |
| | | | | | | | | | | | | |
| Total non-life insurance liabilities | | | 2,728 | | | | (467 | ) | | | 2,261 | |
| | | | | | | |
344
Notes on the Financial Statements(continued)
Life insurance liabilities to policyholders
| | | | | | | | | | | | | |
| | | | | | | Reinsurers’ | | | | |
| | | Gross | | | share | | | Net | |
| | | US$m | | | US$m | | | US$m | |
2010 | | | | | | | | | | | | |
Life (non-linked) | | | | | | | | | | | | |
| At 1 January | | | 20,979 | | | | (771 | ) | | | 20,208 | |
| Benefits paid | | | (1,355 | ) | | | 143 | | | | (1,212 | ) |
| Increase in liabilities to policyholders | | | 5,108 | | | | (201 | ) | | | 4,907 | |
| Exchange differences and other movements | | | (1,149 | ) | | | 156 | | | | (993 | ) |
| | | | | | | |
| | | | | | | | | | | | | |
| At 31 December | | | 23,583 | | | | (673 | ) | | | 22,910 | |
| | | | | | | |
| | | | | | | | | | | | | |
Investment contracts with discretionary participation features | | | | | | | | | | | | |
| At 1 January | | | 21,014 | | | | – | | | | 21,014 | |
| Benefits paid | | | (2,023 | ) | | | – | | | | (2,023 | ) |
| Increase in liabilities to policyholders | | | 3,716 | | | | – | | | | 3,716 | |
Exchange differences and other movements1 | | | (633 | ) | | | – | | | | (633 | ) |
| | | | | | | |
| | | | | | | | | | | | | |
| At 31 December | | | 22,074 | | | | – | | | | 22,074 | |
| | | | | | | |
| | | | | | | | | | | | | |
Life (linked) | | | | | | | | | | | | |
| At 1 January | | | 8,986 | | | | (831 | ) | | | 8,155 | |
| Benefits paid | | | (507 | ) | | | 45 | | | | (462 | ) |
| Increase in liabilities to policyholders | | | 2,520 | | | | 99 | | | | 2,619 | |
Exchange differences and other movements2 | | | (503 | ) | | | (73 | ) | | | (576 | ) |
| | | | | | | |
| | | | | | | | | | | | | |
| At 31 December | | | 10,496 | | | | (760 | ) | | | 9,736 | |
| | | | | | | |
| | | | | | | | | | | | | |
| Total liabilities to policyholders | | | 56,153 | | | | (1,433 | ) | | | 54,720 | |
| | | | | | | |
| | | | | | | | | | | | | |
| 2009 | | | | | | | | | | | | |
| Life (non-linked) | | | | | | | | | | | | |
| At 1 January | | | 17,370 | | | | (637 | ) | | | 16,733 | |
| Benefits paid | | | (2,098 | ) | | | 159 | | | | (1,939 | ) |
| Increase in liabilities to policyholders | | | 4,669 | | | | (98 | ) | | | 4,571 | |
| Exchange differences and other movements | | | 1,038 | | | | (195 | ) | | | 843 | |
| | | | | | | |
| | | | | | | | | | | | | |
| At 31 December | | | 20,979 | | | | (771 | ) | | | 20,208 | |
| | | | | | | |
| | | | | | | | | | | | | |
| Investment contracts with discretionary participation features | | | | | | | | | | | | |
| At 1 January | | | 17,766 | | | | – | | | | 17,766 | |
| Benefits paid | | | (1,818 | ) | | | – | | | | (1,818 | ) |
| Increase in liabilities to policyholders | | | 3,934 | | | | – | | | | 3,934 | |
Exchange differences and other movements1 | | | 1,132 | | | | – | | | | 1,132 | |
| | | | | | | |
| | | | | | | | | | | | | |
| At 31 December | | | 21,014 | | | | – | | | | 21,014 | |
| | | | | | | |
| | | | | | | | | | | | | |
| Life (linked) | | | | | | | | | | | | |
| At 1 January | | | 6,067 | | | | (956 | ) | | | 5,111 | |
| Benefits paid | | | (325 | ) | | | 21 | | | | (304 | ) |
| Increase in liabilities to policyholders | | | 2,676 | | | | 146 | | | | 2,822 | |
Exchange differences and other movements2 | | | 568 | | | | (42 | ) | | | 526 | |
| | | | | | | |
| | | | | | | | | | | | | |
| At 31 December | | | 8,986 | | | | (831 | ) | | | 8,155 | |
| | | | | | | |
| | | | | | | | | | | | | |
| Total liabilities to policyholders | | | 50,979 | | | | (1,602 | ) | | | 49,377 | |
| | | | | | | |
| | |
| 1 | | Includes movement in liabilities relating to discretionary profit participation benefits due to policyholders arising from net unrealised investment gains recognised in other comprehensive income. |
| |
| 2 | | Includes amounts arising under reinsurance agreements. |
The increase in liabilities to policyholders represents the aggregate of all events giving rise to additional liabilities to policyholders in the year. The key factors contributing to the movement in liabilities to policyholders include death claims, surrenders, lapses, liabilities to policyholders created at the initial inception of the policies, the declaration of bonuses and other amounts attributable to policyholders.
345
Notes on the Financial Statements(continued)
| | | | | | | | | |
| | | 2010 | | | 2009 | |
| | | US$m | | | US$m | |
| | | | | | | | |
| At 1 January | | | 1,965 | | | | 1,730 | |
| Additional provisions/increase in provisions | | | 812 | | | | 894 | |
| Provisions utilised | | | (564 | ) | | | (684 | ) |
| Amounts reversed | | | (132 | ) | | | (225 | ) |
| Exchange differences and other movements | | | 57 | | | | 250 | |
| | | | | |
| | | | | | | |
| At 31 December | | | 2,138 | | | | 1,965 | |
| | | | | |
Provisions include US$1,257m (2009: US$1,025m) relating to legal proceedings, investigations and regulatory matters, US$405m (2009: US$449m) relating to costs arising from contingent liabilities and contractual commitments; and US$118m (2009: US$158m) relating to provisions for onerous property contracts.
34 Subordinated liabilities
| | | | | | | | | |
| | | 2010 | | | 2009 | |
| | | US$m | | | US$m | |
| | | | | | | | | |
| Subordinated liabilities | | | | | | | | |
| At amortised cost | | | 33,387 | | | | 30,478 | |
| | | | | |
| – subordinated liabilities | | | 28,309 | | | | 23,893 | |
| – preferred securities | | | 5,078 | | | | 6,585 | |
| | | | | |
| | | | | | | | | |
| Designated at fair value (Note 29) | | | 23,815 | | | | 24,433 | |
| | | | | |
| – subordinated liabilities | | | 19,395 | | | | 20,180 | |
| – preferred securities | | | 4,420 | | | | 4,253 | |
| | | | | |
| | | | | | | | | |
| | | | | |
| | | | | | | | | |
| | | | 57,202 | | | | 54,911 | |
| | | | | |
| | | | | | | | | |
| Subordinated liabilities | | | | | | | | |
| HSBC Holdings | | | 22,878 | | | | 23,048 | |
| | | | | | | | | |
| Other HSBC | | | 34,324 | | | | 31,863 | |
| | | | | |
| | | | | | | | | |
| | | | 57,202 | | | | 54,911 | |
| | | | | |
346
Notes on the Financial Statements(continued)
HSBC’s subordinated liabilities
| | | | | | | | | | | |
| | | | | 2010 | | | 2009 | |
| | | | | US$m | | | US$m | |
| | | | | | | | | | | |
| Amounts owed to third parties by HSBC Holdings(see page 349) | | | 22,878 | | | | 23,048 | |
| | | | | | | |
| | | | | | | | | | | |
| Other HSBC subordinated liabilities | | | | | | | | |
| US$2,939m | | 6.676% senior subordinated notes 20211 | | | 2,174 | | | | – | |
| €1,400m | | 5.3687% non-cumulative step-up perpetual preferred securities2 | | | 1,843 | | | | 1,804 | |
| US$1,250m | | 4.875% subordinated notes 2020 | | | 1,252 | | | | – | |
| US$1,250m | | 4.61% non-cumulative step-up perpetual preferred securities2 | | | 1,185 | | | | 1,077 | |
| £700m | | 5.844% non-cumulative step-up perpetual preferred securities3 | | | 1,087 | | | | 1,136 | |
| €800m | | Callable subordinated floating rate notes 20164 | | | 1,070 | | | | 1,152 | |
| US$1,000m | | 4.625% subordinated notes 2014 | | | 1,009 | | | | 1,002 | |
| US$1,000m | | 5.911% trust preferred securities 20355 | | | 994 | | | | 993 | |
| US$1,000m | | 5.875% subordinated notes 2034 | | | 971 | | | | 950 | |
| €750m | | 5.13% non-cumulative step-up perpetual preferred securities2 | | | 958 | | | | 960 | |
| £600m | | 4.75% subordinated notes 2046 | | | 919 | | | | 961 | |
| US$900m | | 10.176% non-cumulative step-up perpetual preferred securities, series 22 | | | 891 | | | | 890 | |
| €600m | | 4.25% callable subordinated notes 20164 | | | 823 | | | | 904 | |
| €600m | | 8.03% non-cumulative step-up perpetual preferred securities2 | | | 801 | | | | 862 | |
| £500m | | 4.75% callable subordinated notes 20206 | | | 774 | | | | 785 | |
| £500m | | 8.208% non-cumulative step-up perpetual preferred securities2 | | | 772 | | | | 806 | |
| US$750m | | Undated floating rate primary capital notes | | | 750 | | | | 750 | |
| US$750m | | 5.00% subordinated notes 2020 | | | 747 | | | | – | |
| £500m | | 5.375% subordinated notes 2033 | | | 729 | | | | 776 | |
| US$750m | | 5.625% subordinated notes 2035 | | | 728 | | | | 712 | |
| US$700m | | 7.00% subordinated notes 2039 | | | 694 | | | | 688 | |
| €500m | | Callable subordinated floating rate notes 20207 | | | 592 | | | | 639 | |
| £350m | | Callable subordinated variable coupon notes 20178 | | | 562 | | | | 608 | |
| £350m | | 5.00% callable subordinated notes 20239 | | | 547 | | | | 550 | |
| US$500m | | 6.00% subordinated notes 2017 | | | 526 | | | | 521 | |
| £350m | | 5.375% callable subordinated step-up notes 203010 | | | 510 | | | | 531 | |
| US$500m | | Undated floating rate primary capital notes | | | 500 | | | | 500 | |
| £300m | | 6.5% subordinated notes 2023 | | | 462 | | | | 483 | |
| US$450m | | Callable subordinated floating rate notes 201611 | | | 450 | | | | 449 | |
| £300m | | 5.862% non-cumulative step-up perpetual preferred securities3 | | | 434 | | | | 412 | |
| CAD400m | | 4.80% subordinated notes 2022 | | | 417 | | | | 382 | |
| US$400m | | Primary capital undated floating rate notes | | | 407 | | | | 407 | |
| US$400m | | Primary capital undated floating rate notes (second series) | | | 403 | | | | 404 | |
| US$400m | | Primary capital undated floating rate notes (third series) | | | 400 | | | | 400 | |
| £225m | | 6.25% subordinated notes 2041 | | | 347 | | | | 363 | |
| US$300m | | 7.65% subordinated notes 2025 | | | 342 | | | | 312 | |
| US$300m | | 6.95% subordinated notes 2011 | | | 310 | | | | 321 | |
| BRL500m | | Subordinated certificates of deposit 2016 | | | 301 | | | | 287 | |
| US$300m | | Undated floating rate primary capital notes, series 3 | | | 300 | | | | 300 | |
| US$300m | | Callable subordinated floating rate notes 201712 | | | 300 | | | | 299 | |
| US$250m | | Non-convertible subordinated obligations 2019 | | | 248 | | | | 247 | |
| BRL383m | | Subordinated certificates of deposit 2015 | | | 231 | | | | 220 | |
| US$250m | | 7.20% subordinated debentures 2097 | | | 213 | | | | 213 | |
| AUD200m | | Callable subordinated floating rate notes 201613 | | | 204 | | | | 180 | |
| AUD200m | | Callable subordinated floating rate notes 2020 | | | 204 | | | | – | |
| US$200m | | 7.808% capital securities 2026 | | | 200 | | | | 200 | |
| US$200m | | 8.38% capital securities 2027 | | | 200 | | | | 200 | |
| CAD200m | | 4.94% subordinated debentures 2021 | | | 200 | | | | 190 | |
| US$1,350m | | 9.547% non-cumulative step-up perpetual preferred securities, series 114 | | | – | | | | 1,349 | |
| | | Other subordinated liabilities each less than US$200m | | | 3,343 | | | | 3,688 | |
| | | | | | | |
| | | | | | | | | | | |
| | | | | | 34,324 | | | | 31,863 | |
| | | | | | | |
| | | | | | | | | | | |
| | | | | | 57,202 | | | | 54,911 | |
| | | | | | | |
Subordinated loan capital is repayable at par on maturity, but some is repayable prior to maturity at the option of the borrower, generally subject to prior notification to the Financial Services Authority and, where relevant, the consent of the local banking regulator, and in certain cases at a premium over par. Interest rates on the floating rate loan capital are related to interbank offered rates. On the remaining subordinated loan capital, interest is payable at fixed rates of up to 10.176%.
347
Notes on the Financial Statements(continued)
| | |
| 1 | | Approximately 25% of the 6.676% senior subordinated notes 2021 is held by HSBC Holdings. |
| |
| 2 | | See ‘Step-up perpetual preferred securities’ below, note (a) ‘Guaranteed by HSBC Holdings’. |
| |
| 3 | | See ‘Step-up perpetual preferred securities’ below, note (b) ‘Guaranteed by HSBC Bank’. |
| |
| 4 | | On 15 February 2011, HSBC gave notice to holders of its €800m callable subordinated floating rate notes 2016 and its €600m 4.25% callable subordinated notes 2016 that it will call and redeem the notes at par on 29 March 2011 and 18 March 2011, respectively. |
| |
| 5 | | The distributions on the trust preferred securities change in November 2015 to three-month dollar LIBOR plus 1.926%. |
| |
| 6 | | The interest rate on the 4.75% callable subordinated notes 2020 changes in September 2015 to three-month sterling LIBOR plus 0.82%. |
| |
| 7 | | The interest margin on the callable subordinated floating rate notes 2020 increases by 0.5% from September 2015. |
| |
| 8 | | The interest rate on the callable subordinated variable coupon notes 2017 is fixed at 5.75% until June 2012. Thereafter, the rate per annum is the sum of the gross redemption yield of the then prevailing five-year UK gilt plus 1.70%. |
| |
| 9 | | The interest rate on the 5.00% callable subordinated notes 2023 changes in March 2018 to become the rate per annum which is the sum of the gross redemption yield of the then prevailing five-year UK gilt plus 1.80%. |
| |
| 10 | | The interest rate on the 5.375% callable subordinated step-up notes 2030 changes in November 2025 to three-month sterling LIBOR plus 1.50%. |
| |
| 11 | | The interest margin on the US$450m callable subordinated floating rate notes 2016 increases by 0.5% from July 2011. |
| |
| 12 | | The interest margin on the callable subordinated floating rate notes 2017 increases by 0.5% from July 2012. |
| |
| 13 | | The interest margin on the callable subordinated floating rate notes 2016 increases by 0.5% from May 2011. |
| |
| 14 | | In June 2010, HSBC redeemed its 9.547% non-cumulative step-up preferred securities, series 1 at par. |
| |
| Footnotes 4 to 13 relate to notes that are repayable at the option of the borrower on the date of the change of the interest rate, and at subsequent interest rate reset dates and interest payment dates in some cases, subject to prior notification to the Financial Services Authority and, where relevant, the consent of the local banking regulator. |
Step-up perpetual preferred securities
| (a) | | Guaranteed by HSBC Holdings |
| |
| | | The six issues of non-cumulative step-up perpetual preferred securities (footnote 2) were made by Jersey limited partnerships and are guaranteed, on a subordinated basis, by HSBC Holdings. The proceeds of the issues were on-lent to HSBC Holdings by the limited partnerships by issue of subordinated notes. The preferred securities qualify as tier 1 hybrid capital for HSBC. The preferred securities, together with the guarantee, are intended to provide investors with rights to income and capital distributions and distributions upon liquidation of HSBC Holdings that are equivalent to the rights that they would have had if they had purchased non-cumulative perpetual preference shares of HSBC Holdings. |
| |
| | | The preferred securities are perpetual, but redeemable in 2014, 2013, 2016, 2030, 2012 and 2015, respectively, at the option of the general partner of the limited partnerships. If not redeemed, the distributions payable step-up and become floating rate or, for the sterling issue, for each successive five-year period the sum of the then five-year benchmark UK gilt plus a margin. There are limitations on the payment of distributions if prohibited under UK banking regulations or other requirements, if a payment would cause a breach of HSBC’s capital adequacy requirements, or if HSBC Holdings has insufficient distributable reserves (as defined). |
| |
| | | HSBC Holdings has covenanted that if it is prevented under certain circumstances from paying distributions on the preferred securities in full, it will not pay dividends or other distributions in respect of its ordinary shares, or effect repurchase or redemption of its ordinary shares, until after a distribution has been paid in full. |
| |
| | | If (i) HSBC’s total capital ratio falls below the regulatory minimum ratio required, or (ii) the Directors expect that, in view of the deteriorating financial condition of HSBC Holdings, the former will occur in the near term, then the preferred securities will be substituted by preference shares of HSBC Holdings having economic terms which are in all material respects equivalent to those of the preferred securities and the guarantee taken together. |
| |
| (b) | | Guaranteed by HSBC Bank |
| |
| | | The two issues of non-cumulative step-up perpetual preferred securities (footnote 3) were made by Jersey limited partnerships and are guaranteed, on a subordinated basis, by HSBC Bank. The proceeds of the issues were on-lent to HSBC Bank by the limited partnerships by issue of subordinated notes. The preferred securities qualify as tier 1 hybrid capital for HSBC and for HSBC Bank on a solo and consolidated basis and, together with the guarantee, are intended to provide investors with rights to income and capital distributions and distributions upon liquidation of HSBC Bank that are equivalent to the rights they would have had if they had purchased non-cumulative perpetual preference shares of HSBC Bank. |
| |
| | | The two issues of preferred securities are perpetual, but redeemable in 2031 and 2020, respectively, at the option of the general partner of the limited partnerships. If not redeemed, the distributions payable step-up and become floating rate. The same limitations on the payment of distributions apply to HSBC Bank as to HSBC Holdings, |
348
Notes on the Financial Statements(continued)
| | | as described above. HSBC Bank has provided a similar covenant to that provided by HSBC Holdings, also as described above. |
| |
| | | If (i) any of the two issues of preferred securities are outstanding in November 2048 or April 2049, respectively, or (ii) the total capital ratio of HSBC Bank on a solo and consolidated basis falls below the regulatory minimum ratio required, or (iii) in view of the deteriorating financial condition of HSBC Bank, the Directors expect (ii) to occur in the near term, then the preferred securities will be substituted by preference shares of HSBC Bank having economic terms which are in all material respects equivalent to those of the preferred securities and the guarantee taken together. |
| | | | | | | | | |
| | | 2010 | | | 2009 | |
| | | US$m | | | US$m | |
| Subordinated liabilities: | | | | | | | | |
| – at amortised cost | | | 13,313 | | | | 14,406 | |
| – designated at fair value (Note 29) | | | 16,288 | | | | 16,909 | |
| | | | | |
| | | | | | | | | |
| | | | 29,601 | | | | 31,315 | |
| | | | | |
HSBC Holdings’ subordinated liabilities
| | | | | | | | | | | |
| | | | | 2010 | | | 2009 | |
| | | | | US$m | | | US$m | |
| Amounts owed to third parties | | | | | | | | |
| US$2,500m | | 6.5% subordinated notes 2037 | | | 2,695 | | | | 2,659 | |
| €1,750m | | 6.0% subordinated notes 2019 | | | 2,578 | | | | 2,835 | |
| €1,600m | | 6.25% subordinated notes 2018 | | | 2,142 | | | | 2,306 | |
| US$2,000m | | 6.5% subordinated notes 2036 | | | 2,050 | | | | 2,052 | |
| £900m | | 6.375% callable subordinated notes 20221 | | | 1,493 | | | | 1,517 | |
| US$1,400m | | 5.25% subordinated notes 2012 | | | 1,492 | | | | 1,488 | |
| US$1,500m | | 6.8% subordinated notes 2038 | | | 1,485 | | | | 1,484 | |
| €1,000m | | 5.375% subordinated notes 2012 | | | 1,405 | | | | 1,549 | |
| £900m | | 6.0% subordinated notes 2040 | | | 1,372 | | | | – | |
| £750m | | 7.0% subordinated notes 2038 | | | 1,210 | | | | 1,267 | |
| £650m | | 6.75% subordinated notes 2028 | | | 1,000 | | | | 1,043 | |
| £650m | | 5.75% subordinated notes 2027 | | | 971 | | | | 1,000 | |
| €700m | | 3.625% callable subordinated notes 20202 | | | 928 | | | | 1,005 | |
| US$750m | | Callable subordinated floating rate notes 20163 | | | 750 | | | | 750 | |
| US$488m | | 7.625% subordinated notes 2032 | | | 582 | | | | 587 | |
| £250m | | 9.875% subordinated bonds 20184 | | | 467 | | | | 496 | |
| US$222m | | 7.35% subordinated notes 2032 | | | 258 | | | | 260 | |
| US$750m | | Callable subordinated floating rate notes 20155 | | | – | | | | 750 | |
| | | | | | | |
| | | | | | | | | | | |
| | | | | | 22,878 | | | | 23,048 | |
| | | | | | | |
| | | | | | | | | | | |
| Amounts owed to HSBC undertakings | | | | | | | | |
| €1,400m | | 5.3687% fixed/floating subordinated notes 2043 –
HSBC Capital Funding (Euro 2) LP | | | 1,957 | | | | 2,042 | |
| US$1,250m | | 4.61% fixed/floating subordinated notes 2043 –
HSBC Capital Funding (Dollar 2) LP | | | 1,274 | | | | 1,223 | |
| €750m | | 5.13% fixed/floating subordinated notes 2044 –
HSBC Capital Funding (Euro 3) LP | | | 1,028 | | | | 1,095 | |
| US$900m | | 10.176% subordinated step-up cumulative notes 2040 –
HSBC Capital Funding (Dollar 1) LP | | | 891 | | | | 890 | |
| €600m | | 8.03% subordinated step-up cumulative notes 2040 –
HSBC Capital Funding (Euro 1) LP | | | 801 | | | | 862 | |
| £500m | | 8.208% subordinated step-up cumulative notes 2040 –
HSBC Capital Funding (Sterling 1) LP | | | 772 | | | | 806 | |
| US$1,350m | | 9.547% subordinated step-up cumulative notes 2040 –
HSBC Capital Funding (Dollar 1) LP6 | | | – | | | | 1,349 | |
| | | | | | | |
| | | | | | | | | | | |
| | | | | | 6,723 | | | | 8,267 | |
| | | | | | | |
| | | | | | | | | | | |
| | | | | | 29,601 | | | | 31,315 | |
| | | | | | | |
| | |
| 1 | | The interest rate on the 6.375% callable subordinated notes 2022 changes in October 2017 to become three-month sterling LIBOR plus 1.3%. The notes may be redeemed at par from October 2017 at the option of the borrower, subject to the prior notification to the FSA. |
349
Notes on the Financial Statements(continued)
| | |
| 2 | | The interest rate on the 3.625% callable subordinated notes 2020 changes in June 2015 to become three-month EURIBOR plus 0.93%. The notes may be redeemed at par from June 2015 at the option of the borrower, subject to the prior notification to the FSA. |
| |
| 3 | | The interest margin on the callable subordinated floating rate notes 2016 increases by 0.5% from October 2011. The notes are repayable from their step up date at the option of the borrower, subject to the prior notification to the FSA. |
| |
| 4 | | The interest rate on the 9.875% subordinated bonds 2018 changes in April 2013 to become the higher of (i) 9.875% or (ii) the sum of the yield on the relevant benchmark treasury stock plus 2.5%. The bonds may be redeemed in April 2013 at par and redemption has also been allowed from April 1998, subject to the prior notification to the FSA, for an amount based on the redemption yields of the relevant benchmark treasury stocks. |
| |
| 5 | | In March 2010, HSBC Holdings redeemed its US$750m callable subordinated floating rate notes due 2015 at par. |
| |
| 6 | | In June 2010, HSBC Holdings redeemed its 9.547% subordinated step-up cumulative notes 2040 – HSBC Capital Funding (Dollar 1) LP at par. |
35 Maturity analysis of assets and liabilities
The following is an analysis, by remaining contractual maturities at the balance sheet date, of asset and liability line items that represent amounts expected to be recovered or settled within one year, and after more than one year.
Trading assets and liabilities are excluded because they are not held for collection or settlement over the period of contractual maturity.
Maturity analysis of assets and liabilities
HSBC
| | | | | | | | | | | | | | | | | | | | | | | | | |
| | | At 31 December 2010 | | At 31 December 2009 |
| | | | | | | Due after | | | | | | | | | | | Due after | | | | |
| | | Due within | | | more than | | | | | | | Due within | | | more than | | | | |
| | | one year | | | one year | | | Total | | | one year | | | one year | | | Total | |
| | | US$m | | | US$m | | | US$m | | | US$m | | | US$m | | | US$m | |
| | | | | | | | | | | | | | | | | | | | | | | | | |
Assets | | | | | | | | | | | | | | | | | | | | | | | | |
| Financial assets designated at fair value | | | 3,030 | | | | 33,981 | | | | 37,011 | | | | 3,786 | | | | 33,395 | | | | 37,181 | |
| Loans and advances to banks | | | 200,098 | | | | 8,173 | | | | 208,271 | | | | 172,916 | | | | 6,865 | | | | 179,781 | |
| Loans and advances to customers | | | 424,713 | | | | 533,653 | | | | 958,366 | | | | 381,967 | | | | 514,264 | | | | 896,231 | |
| Financial investments | | | 149,954 | | | | 250,801 | | | | 400,755 | | | | 134,824 | | | | 234,334 | | | | 369,158 | |
| Other financial assets | | | 19,417 | | | | 5,519 | | | | 24,936 | | | | 26,189 | | | | 7,383 | | | | 33,572 | |
| | | | | | | | | | | | | |
| | | | | | | | | | | | | | | | | | | | | | | | | |
| | | | 797,212 | | | | 832,127 | | | | 1,629,339 | | | | 719,682 | | | | 796,241 | | | | 1,515,923 | |
| | | | | | | | | | | | | |
| | | | | | | | | | | | | | | | | | | | | | | | | |
Liabilities | | | | | | | | | | | | | | | | | | | | | | | | |
| Deposits by banks | | | 105,462 | | | | 5,122 | | | | 110,584 | | | | 118,308 | | | | 6,564 | | | | 124,872 | |
| Customer accounts | | | 1,181,095 | | | | 46,630 | | | | 1,227,725 | | | | 1,114,149 | | | | 44,885 | | | | 1,159,034 | |
| Financial liabilities designated at fair value | | | 10,141 | | | | 77,992 | | | | 88,133 | | | | 4,666 | | | | 75,426 | | | | 80,092 | |
| Debt securities in issue | | | 86,096 | | | | 59,305 | | | | 145,401 | | | | 83,590 | | | | 63,306 | | | | 146,896 | |
| Other financial liabilities | | | 24,865 | | | | 4,792 | | | | 29,657 | | | | 67,061 | | | | 3,606 | | | | 70,667 | |
| Subordinated liabilities | | | 791 | | | | 32,596 | | | | 33,387 | | | | 369 | | | | 30,109 | | | | 30,478 | |
| | | | | | | | | | | | | |
| | | | | | | | | | | | | | | | | | | | | | | | | |
| | | | 1,408,450 | | | | 226,437 | | | | 1,634,887 | | | | 1,388,143 | | | | 223,896 | | | | 1,612,039 | |
| | | | | | | | | | | | | |
HSBC Holdings
| | | | | | | | | | | | | | | | | | | | | | | | | |
| | | At 31 December 2010 | | At 31 December 2009 |
| | | | | | | Due after | | | | | | | | | | | Due after | | | | |
| | | Due within | | | more than | | | | | | | Due within | | | more than | | | | |
| | | one year | | | one year | | | Total | | | one year | | | one year | | | Total | |
| | | US$m | | | US$m | | | US$m | | | US$m | | | US$m | | | US$m | |
| | | | | | | | | | | | | | | | | | | | | | | | | |
Assets | | | | | | | | | | | | | | | | | | | | | | | | |
| Loans and advances to HSBC undertakings | | | 13,691 | | | | 7,547 | | | | 21,238 | | | | 18,067 | | | | 5,145 | | | | 23,212 | |
| Financial investments | | | – | | | | 2,025 | | | | 2,025 | | | | – | | | | 2,455 | | | | 2,455 | |
| Other financial assets | | | 1 | | | | – | | | | 1 | | | | 4 | | | | – | | | | 4 | |
| | | | | | | | | | | | | |
| | | | | | | | | | | | | | | | | | | | | | | | | |
| | | | 13,692 | | | | 9,572 | | | | 23,264 | | | | 18,071 | | | | 7,600 | | | | 25,671 | |
| | | | | | | | | | | | | |
| | | | | | | | | | | | | | | | | | | | | | | | | |
Liabilities | | | | | | | | | | | | | | | | | | | | | | | | |
| Amounts owed to HSBC undertakings | | | 1,480 | | | | 1,452 | | | | 2,932 | | | | 277 | | | | 3,434 | | | | 3,711 | |
| Financial liabilities designated at fair value | | | – | | | | 16,288 | | | | 16,288 | | | | – | | | | 16,909 | | | | 16,909 | |
| Debt securities in issue | | | – | | | | 2,668 | | | | 2,668 | | | | – | | | | 2,839 | | | | 2,839 | |
| Other financial liabilities | | | 1,782 | | | | – | | | | 1,782 | | | | 1,240 | | | | 17 | | | | 1,257 | |
| Subordinated liabilities | | | – | | | | 13,313 | | | | 13,313 | | | | – | | | | 14,406 | | | | 14,406 | |
| | | | | | | | | | | | | |
| | | | | | | | | | | | | | | | | | | | | | | | | |
| | | | 3,262 | | | | 33,721 | | | | 36,983 | | | | 1,517 | | | | 37,605 | | | | 39,122 | |
| | | | | | | | | | | | | |
350
Notes on the Financial Statements(continued)
36 Foreign exchange exposures
Structural foreign exchange exposures
HSBC’s structural foreign exchange exposures are represented by the net asset value of its foreign exchange equity and subordinated debt investments in subsidiaries, branches, joint ventures and associates with non-US dollar functional currencies. Gains or losses on structural foreign exchange exposures are recognised in other comprehensive income. HSBC’s management of its structural foreign exchange exposures is discussed in the ‘Report of the Directors: Risk’ on page 149.
In its separate financial statements, HSBC Holdings recognises its foreign exchange gains and losses on structural foreign exchange exposures in the income statement.
Net structural foreign exchange exposures
| | | | | | | | | |
| | | 2010 | | | 2009 | |
| | | US$m | | | US$m | |
| | | | | | | | | |
Currency of structural exposure | | | | | | | | |
| Pound sterling | | | 23,247 | | | | 21,369 | |
| Euro | | | 23,222 | | | | 25,284 | |
| Chinese renminbi | | | 17,454 | | | | 13,398 | |
| Brazilian reais | | | 6,004 | | | | 5,234 | |
| Mexican pesos | | | 5,991 | | | | 5,393 | |
| Indian rupees | | | 4,754 | | | | 3,836 | |
| Canadian dollars | | | 4,012 | | | | 3,620 | |
| Swiss francs | | | 3,357 | | | | 2,910 | |
| Hong Kong dollars | | | 2,659 | | | | 3,842 | |
| UAE dirhams | | | 2,469 | | | | 2,209 | |
| Turkish lira | | | 1,854 | | | | 1,741 | |
| Malaysian ringgit | | | 1,619 | | | | 1,300 | |
| Korean won | | | 1,456 | | | | 1,412 | |
| Taiwanese dollars | | | 1,429 | | | | 547 | |
| Australian dollars | | | 1,381 | | | | 1,017 | |
| Indonesian rupiah | | | 1,190 | | | | 1,057 | |
| Saudi riyals | | | 907 | | | | 657 | |
| Argentine pesos | | | 881 | | | | 675 | |
| Egyptian pounds | | | 642 | | | | 561 | |
| Philippine pesos | | | 635 | | | | 473 | |
| Vietnamese dong | | | 621 | | | | 505 | |
| Singapore dollars | | | 596 | | | | 556 | |
| Qatari rial | | | 510 | | | | 384 | |
| Thai baht | | | 424 | | | | 357 | |
| Costa Rican colon | | | 416 | | | | 375 | |
| Honduran lempira | | | 291 | | | | 282 | |
| Japanese yen | | | 267 | | | | 228 | |
| Colombian pesos | | | 266 | | | | 220 | |
| Russian rouble | | | 257 | | | | 295 | |
| Chilean pesos | | | 249 | | | | 230 | |
| South African rand | | | 238 | | | | 201 | |
| Omani rial | | | 234 | | | | 210 | |
| Brunei dollars | | | 227 | | | | 132 | |
| Jordanian dinar | | | 181 | | | | 159 | |
| New Zealand dollars | | | 172 | | | | 161 | |
| Algerian dinar | | | 155 | | | | 146 | |
| Sri Lankan rupee | | | 136 | | | | 141 | |
| Bahraini dinar | | | 133 | | | | 85 | |
| Kazakh tenge | | | 109 | | | | 64 | |
| Others, each less than US$100m | | | 658 | | | | 523 | |
| | | | | |
| | | | | | | | | |
| Total | | | 111,303 | | | | 101,789 | |
| | | | | |
Shareholders’ equity would decrease by US$2,213m (2009: US$2,222m) if euro and sterling foreign currency exchange rates weakened by 5% relative to the US dollar.
351
Notes on the Financial Statements(continued)
37 Assets charged as security for liabilities and collateral accepted as security for assets
Financial assets pledged to secure liabilities
| | | | | | | | | |
| | | Assets pledged at 31 December |
| | | 2010 | | | 2009 | |
| | | US$m | | | US$m | |
| | | | | | | | | |
| Treasury bills and other eligible securities | | | 5,859 | | | | 3,970 | |
| Loans and advances to banks | | | 11,773 | | | | 6,767 | |
| Loans and advances to customers | | | 60,500 | | | | 77,699 | |
| Debt securities | | | 214,126 | | | | 203,766 | |
| Equity shares | | | 7,216 | | | | 7,305 | |
| Other | | | 931 | | | | 646 | |
| | | | | |
| | | | | | | | | |
| | | | 300,405 | | | | 300,153 | |
| | | | | |
These transactions are conducted under terms that are usual and customary to collateralised transactions, including, where relevant, standard securities lending and repurchase agreements.
Collateral accepted as security for assets
The fair value of assets accepted as collateral that HSBC is permitted to sell or repledge in the absence of default is US$333,921m (2009: US$362,560m). The fair value of any such collateral that has been sold or repledged was US$205,470m (2009: US$215,940m). HSBC is obliged to return equivalent securities.
These transactions are conducted under terms that are usual and customary to standard securities borrowing and reverse repurchase agreements.
38 Non-controlling interests
| | | | | | | | | |
| | | 2010 | | | 2009 | |
| | | US$m | | | US$m | |
| | | | | | | | | |
| Non-controlling interests attributable to holders of ordinary shares in subsidiaries | | | 4,522 | | | | 4,665 | |
| Preference shares issued by subsidiaries | | | 2,726 | | | | 2,697 | |
| | | | | |
| | | | | | | | | |
| | | | 7,248 | | | | 7,362 | |
| | | | | |
Preference shares issued by subsidiaries
| | | | | | | | | | | |
| | | | | 2010 | | | 2009 | |
| | | | | US$m | | | US$m | |
| | | | | | | | | | | |
| US$575m | | 6.36% non-cumulative preferred stock, Series B1 | | | 559 | | | | 559 | |
| US$518m | | Floating rate non-cumulative preferred stock, Series F2 | | | 518 | | | | 518 | |
| US$374m | | Floating rate non-cumulative preferred stock, Series G3 | | | 374 | | | | 374 | |
| US$374m | | 6.50% non-cumulative preferred stock, Series H3 | | | 374 | | | | 374 | |
| CAD250m | | Non-cumulative 5 year rate reset class 1 preferred shares, Series E4 | | | 251 | | | | 238 | |
| CAD175m | | Non-cumulative redeemable class 1 preferred shares, Series C5 | | | 175 | | | | 167 | |
| CAD175m | | Non-cumulative class 1 preferred shares, Series D5 | | | 175 | | | | 167 | |
| US$150m | | Depositary shares each representing 25% interest in a share of
adjustable-rate cumulative preferred stock, Series D6 | | | 150 | | | | 150 | |
| US$150m | | Cumulative preferred stock7 | | | 150 | | | | 150 | |
| | | | | | | |
| | | | | | | | | | | |
| | | | | | 2,726 | | | | 2,697 | |
| | | | | | | |
| | |
| 1 | | The Series B preferred stock has been redeemable at the option of HSBC Finance Corporation, in whole or in part, from 24 June 2010 at par. |
| |
| 2 | | The Series F preferred stock has been redeemable at par at the option of HSBC USA, Inc., in whole or in part, on any dividend payment date from 7 April 2010. |
| |
| 3 | | The Series G and Series H preferred stock are redeemable at par at the option of HSBC USA, Inc., in whole or in part, at any time from 1 January 2011 and 1 July 2011, respectively. |
| |
| 4 | | The Series E preferred shares are redeemable at par at the option of HSBC Bank Canada, in whole or in part commencing 30 June 2014 and on 30 June every five years thereafter. |
| |
| 5 | | The Series C and Series D preferred shares have been redeemable at a declining premium above par at the option of HSBC Bank Canada, in whole or in part, from 30 June 2010 and 31 December 2010, respectively. |
| |
| 6 | | The preferred stock has been redeemable at the option of HSBC USA, Inc., in whole or in part, from 1 July 1999 at par. |
| |
| 7 | | The preferred stock has been redeemable at the option of HSBC USA, Inc., in whole or in part, from 1 October 2007 at par. |
352
Notes on the Financial Statements(continued)
All redemptions are subject to prior notification to the Financial Services Authority and, where relevant, the local banking regulator.
39 Called up share capital and other equity instruments
| | | | | | | | | |
| | | 2010 | | | 2009 | |
| | | US$m | | | US$m | |
| | | | | | | | | |
HSBC Holdings ordinary shares1 | | | 8,843 | | | | 8,705 | |
| | | | | |
| | | | | | | | | |
| | | Number | | | US$m | |
| | | | | | | | | |
HSBC Holdings ordinary shares of US$0.50 each | | | | | | | | |
| At 1 January 2010 | | | 17,408,206,768 | | | | 8,705 | |
| Shares issued under HSBC employee share plans | | | 25,001,734 | | | | 12 | |
| Shares issued in lieu of dividends | | | 252,947,400 | | | | 126 | |
| | | | | |
| | | | | | | | | |
| At 31 December 2010 | | | 17,686,155,902 | | | | 8,843 | |
| | | | | |
| | | | | | | | | |
| At 1 January 2009 | | | 12,105,265,082 | | | | 6,053 | |
| Shares issued under HSBC employee share plans | | | 7,476,952 | | | | 4 | |
| Shares issued in lieu of dividends | | | 235,225,669 | | | | 118 | |
| Shares issued in respect of rights issue | | | 5,060,239,065 | | | | 2,530 | |
| | | | | |
| | | | | | | | | |
| At 31 December 2009 | | | 17,408,206,768 | | | | 8,705 | |
| | | | | |
| | | | | |
1 All ordinary shares in issue confer identical rights in respect of capital, dividends, voting and otherwise. |
| | | | | |
| | | Number | | | US$m | |
| | | | | | | | | |
HSBC Holdings non-cumulative preference shares of US$0.01 each | | | | | | | | |
| | | | | | | | | |
| At 1 January 2010 and 31 December 2010 | | | 1,450,000 | | | | – | |
| | | | | | | | | |
| At 1 January 2009 and 31 December 2009 | | | 1,450,000 | | | | – | |
Dividends on the HSBC Holdings non-cumulative dollar preference shares (‘Dollar Preference Shares’) in issue are paid quarterly at the sole and absolute discretion of the Board of Directors. The Board of Directors will not declare a dividend on the Dollar Preference Shares in issue if payment of the dividend would cause HSBC Holdings not to meet the applicable capital adequacy requirements of the FSA or the profit of HSBC Holdings available for distribution as dividends is not sufficient to enable HSBC Holdings to pay in full both dividends on the Dollar Preference Shares in issue and dividends on any other shares that are scheduled to be paid on the same date and that have an equal right to dividends. HSBC Holdings may not declare or pay dividends on any class of its shares ranking lower in the right to dividends than the Dollar Preference Shares in issue nor redeem nor purchase in any manner any of its other shares ranking equal with or lower than the Dollar Preference Shares in issue unless it has paid in full, or set aside an amount to provide for payment in full, the dividends on the Dollar Preference Shares in issue for the then-current dividend period. The Dollar Preference Shares in issue carry no rights to conversion into ordinary shares of HSBC Holdings. Holders of the Dollar Preference Shares in issue will only be entitled to attend and vote at general meetings of shareholders of HSBC Holdings if the dividend payable on the Dollar Preference Shares in issue has not been paid in full for four consecutive dividend payment dates. In such circumstances, holders of the Dollar Preference Shares in issue will be entitled to vote on all matters put to general meetings until such time as HSBC Holdings has paid a full dividend on the Dollar Preference Shares in issue. HSBC Holdings may redeem the Dollar Preference Shares in issue in whole at any time on or after 16 December 2010, subject to prior notification to the FSA.
HSBC Holdings non-cumulative preference shares of £0.01 each
On 29 December 2010 HSBC Holdings issued one non-cumulative sterling preference share of £0.01 (‘Sterling Preference Share’) to facilitate the cancellation of the non-voting deferred shares and comply with the provisions of the Companies (Authorised Minimum) Regulations 2009. Dividends on the Sterling Preference Share in issue are paid quarterly at the sole and absolute discretion of the Board. The Sterling Preference Share in issue carries no rights to conversion into ordinary shares of HSBC Holdings and no rights to attend and vote at general meetings of shareholders of HSBC Holdings. HSBC Holdings may redeem the Sterling Preference Share in issue in whole at any time at the option of the Company.
353
Notes on the Financial Statements(continued)
HSBC Holdings non-voting deferred shares
301,500 non-voting deferred shares of £1 each were in issue throughout 2009 and up to 29 December 2010 and were held by a subsidiary of HSBC Holdings. As part of a technical internal capital reorganisation necessitated by the amended EU Capital Requirements Directive 2, which applied to HSBC Holdings from 31 December 2010, all of the non-voting deferred shares of £1 each were cancelled.
Other equity instruments
On 9 April 2008, HSBC Holdings issued, in bearer form, 88m 8.125% Perpetual Subordinated Capital Securities (‘Capital Securities’), each with a par value of US$25 and with an aggregate nominal value of US$2,200m. The Capital Securities were issued at par value, raising US$2,133m, net of issuance costs. The Capital Securities were issued to support the development of and to strengthen further HSBC’s capital base. Coupon payments on the Capital Securities are paid quarterly in arrears from 15 July 2008 and may be deferred at the discretion of HSBC Holdings. The Capital Securities have no fixed maturity and are redeemable at HSBC’s option on or after 15 April 2013 at their principal amounts together with any accrued, unpaid and deferred coupon payments. While any coupon payments are unpaid or deferred, HSBC Holdings will not declare, pay dividends or make distributions or similar periodic payments in respect of, or repurchase, redeem or otherwise acquire any securities of lower or equal rank. At the Company’s discretion, and subject to certain conditions being satisfied, the Capital Securities may be exchanged on any coupon payment date for non-cumulative preference shares to be issued by HSBC Holdings and which would rankpari passuwith the dollar and sterling preference shares in issue. The preference shares will be issued at a nominal value of US$0.01 per share and a premium of US$24.99 per share, with both such amounts being subscribed and fully paid.
During June 2010, HSBC Holdings issued, in bearer form, 152m 8.00% of Perpetual Subordinated Capital Securities, Series 2 (‘Capital Securities, Series 2’), each with a par value of US$25 and with an aggregate nominal value of US$3,800m. The Capital Securities, Series 2 were issued at par value, raising US$3,718m, net of issuance costs. These securities were issued on substantially the same terms as the Capital Securities issued in 2008. Coupon payments on the Capital Securities, Series 2 are paid quarterly in arrears from 15 September 2010 and may be deferred at the discretion of HSBC Holdings. The Capital Securities, Series 2 have no fixed maturity and are redeemable at HSBC’s option on or after 15 December 2015 at their principal amounts together with any accrued, unpaid and deferred coupon payments. At the Company’s discretion, and subject to certain conditions being satisfied, the Capital Securities, Series 2 may be exchanged on any coupon payment date for non-cumulative preference shares to be issued by HSBC Holdings and which would rankpari passuwith the dollar and sterling preference shares in issue. The preference shares will be issued at a nominal value of US$0.01 per share and a premium of US$24.99 per share, with both such amounts being subscribed and fully paid.
Shares under option
Details of the options outstanding to subscribe for HSBC Holdings ordinary shares under the HSBC Holdings Group Share Option Plan, HSBC Holdings Executive Share Option Scheme, the HSBC Share Plan and HSBC Holdings savings-related share option plans are given in Note 9.
Aggregate options outstanding under these plans
| | | | | | | | | | | | | |
| | | Number of | | | | | | | |
| | | HSBC Holdings | | | | | | | |
| | | ordinary shares | | | Period of exercise | | | Exercise price | |
| | | | | | | | | | | | | |
31 December 2010 | | | 249,242,968 | | | 2011 to 2016 | | | | £3.3116 – 8.4024 | |
| | | | 47,428,892 | | | 2011 to 2016 | | | HK$37.8797 – 94.5057 | |
| | | | 3,128,508 | | | 2011 to 2016 | | | | €3.6361 – 9.5912 | |
| | | | 10,899,415 | | | 2011 to 2016 | | | | US$4.8876 – 12.0958 | |
| | | | | | | | | | | | | |
31 December 20091 | | | 270,742,989 | | | | 2010 to 2015 | | | | £3.3116 – 8.4024 | |
| | | | 50,938,242 | | | | 2010 to 2015 | | | HK$37.8797 – 94.5057 | |
| | | | 3,283,710 | | | | 2010 to 2015 | | | | €3.6361 – 9.5912 | |
| | | | 12,073,216 | | | | 2010 to 2015 | | | | US$4.8876 – 12.0958 | |
| | | | | | | | | | | | | |
| 31 December 2008 | | | 211,226,573 | | | | 2009 to 2015 | | | | £5.3496 – 9.642 | |
| | | | 11,344,167 | | | | 2009 to 2014 | | | HK$103.4401 – 108.4483 | |
| | | | 1,304,119 | | | | 2009 to 2014 | | | | €8.6720 – 11.0062 | |
| | | | 7,382,145 | | | | 2009 to 2014 | | | | US$13.3290 – 14.7478 | |
| | |
| 1 | | During 2009, the number and prices of unexercised share options were adjusted for the rights issue. |
354
Notes on the Financial Statements(continued)
HSBC France and subsidiary company plans
Following the acquisition of HSBC France in 2000, outstanding employee share options over HSBC France shares vested. On exercise of the options, the HSBC France shares were exchangeable for HSBC Holdings ordinary shares at the ratio of 14.917916 HSBC Holdings ordinary shares for each HSBC France.
During 2010, no employee share options (2009: nil) were exercised and no HSBC France shares were issued and exchanged for HSBC Holdings ordinary shares (2009: nil). During 2010, 604,250 options over HSBC France shares lapsed (2009: 183,627). At 31 December 2010, there are no employee share options outstanding and the HSBC Holdings Employee Benefit Trust 2001 (No. 1) held no (2009: 9,963,718) HSBC Holdings ordinary shares to exchange for HSBC France shares arising from the exercise of options.
HSBC France options effectively outstanding over HSBC Holdings ordinary shares
| | | | | | | | | | | | | |
| | | Number of | | | | | | | |
| | | HSBC France | | | | | | | |
| | | shares exchangeable | | | | | | | |
| | | for HSBC Holdings | | | | | | | |
| | | ordinary shares | | | Period of exercise | | | Exercise price | |
| | | | | | | | | | | | | |
31 December 2010 | | | – | | | | – | | | | – | |
| 31 December 2009 | | | 604,250 | | | | 2010 | | | | €142.50 | |
| 31 December 2008 | | | 787,877 | | | | 2009 to 2010 | | | | €81.71 – 142.50 | |
HSBC Private Bank France plan
There are also outstanding options over the shares of HSBC Private Bank France, a subsidiary of HSBC France.
On exercise of the options, the HSBC Private Bank France shares are exchangeable for HSBC Holdings ordinary shares at the ratio of 2.099984 HSBC Holdings ordinary shares for each HSBC Private Bank France share. During 2010, 4,420 (2009: 33,456) HSBC Private Bank France shares were issued following the exercise of employee share options and exchanged for 9,281 (2009: 70,248) HSBC Holdings ordinary shares, such shares being delivered from The CCF Employee Benefit Trust 2001 (Private Banking France). During 2010, no options over HSBC Private Bank France shares lapsed (2009: 9,000). At 31 December 2010, The CCF Employee Benefit Trust 2001 (Private Banking France) held 989,502 (2009: 998,783) HSBC Holdings ordinary shares which may be exchanged for HSBC Private Bank France shares arising from the exercise of options.
HSBC Private Bank France options effectively outstanding over HSBC Holdings ordinary shares
| | | | | | | | | | | | | |
| | | Number of HSBC | | | | | | | |
| | | Private Bank France | | | | | | | |
| | | shares exchangeable | | | | | | | |
| | | for HSBC Holdings | | | | | | | |
| | | ordinary shares | | | Period of exercise | | | Exercise price | |
| | | | | | | | | | | | | |
31 December 2010 | | | 287,100 | | | 2011 to 2012 | | | | €20.80 – 22.22 | |
| 31 December 2009 | | | 291,520 | | | | 2010 to 2012 | | | | €12.44 – 22.22 | |
| 31 December 2008 | | | 333,976 | | | | 2009 to 2012 | | | | €10.84 – 22.22 | |
HSBC Finance plan
Following the acquisition of HSBC Finance in 2003, all outstanding options and equity-based awards over HSBC Finance common shares were converted into rights to receive HSBC Holdings ordinary shares in the same ratio as the share exchange offer for HSBC Finance (2.675 HSBC Holdings ordinary shares for each HSBC Finance common share) and the exercise prices per share adjusted accordingly. During 2010, 306,964 options (2009: 20,000) over HSBC Holdings ordinary shares were exercised and 306,964 (2009: 20,000) HSBC Holdings ordinary shares delivered from The HSBC (Household) Employee Benefit Trust 2003 to satisfy the exercise of these options. During 2010, options over 6,681,169 (2009: 5,606,714) HSBC Holdings ordinary shares lapsed. At 31 December 2010, the Trust held a total of 2,335,315 (2009: 2,642,279) HSBC Holdings ordinary shares and 1,455 (2009: 1,455) ADSs, which may be used to satisfy the exercise of these options and equity-based awards under the HSBC Finance share plans. Each ADS represents five HSBC Holdings ordinary shares.
355
Notes on the Financial Statements(continued)
Options outstanding over HSBC Holdings ordinary shares under the HSBC Finance share plan
| | | | | | | | | | | | | |
| | | Number of | | | | | | | |
| | | HSBC Holdings | | | | | | | |
| | | ordinary shares | | | Period of exercise | | | Exercise price | |
| | | | | | | | | | | | | |
31 December 2010 | | | 11,117,826 | | | 2011 to 2012 | | | | US$9.29 – 18.62 | |
31 December 20091 | | | 18,105,959 | | | | 2010 to 2012 | | | | US$9.29 – 18.62 | |
| 31 December 2008 | | | 20,681,582 | | | | 2009 to 2012 | | | | US$10.66 – 21.37 | |
| | |
| 1 | | During 2009, the number and prices of unexercised share options were adjusted for the rights issue. |
HSBC Bank Bermuda plans
Following the acquisition of HSBC Bank Bermuda in 2004, all outstanding employee share options over HSBC Bank Bermuda shares were converted into rights to receive HSBC Holdings ordinary shares based on the consideration of US$40 for each HSBC Bank Bermuda share and the average closing price of HSBC Holdings ordinary shares, derived from the London Stock Exchange Daily Official List, for the five business days preceding the closing date of the acquisition. During 2010, options over 4,781 HSBC Holdings ordinary shares were exercised (2009: 18,153) and satisfied by delivery from the HSBC (Bank of Bermuda) Employee Benefit Trust 2004. During 2010, options over 137,888 (2009: 24,673) HSBC Holdings ordinary shares lapsed. At 31 December 2010, the HSBC (Bank of Bermuda) Employee Benefit Trust 2004 held 2,108,830 (2009: 2,113,611) HSBC Holdings ordinary shares which may be used to satisfy the exercise of options.
Options outstanding over HSBC Holdings ordinary shares under the HSBC Bank Bermuda share plan
| | | | | | | | | | | | | |
| | | Number of HSBC | | | | | | | |
| | | Holdings | | | | | | | |
| | | ordinary shares | | | Period of exercise | | | Exercise price | |
| | | | | | | | | | | | | |
31 December 2010 | | | 2,339,033 | | | 2011 to 2013 | | | | US$9.32 – 15.99 | |
31 December 20091 | | | 2,481,702 | | | | 2010 to 2013 | | | | US$6.13 – 15.99 | |
| 31 December 2008 | | | 2,205,321 | | | | 2009 to 2013 | | | | US$7.04 – 18.35 | |
| | |
| 1 | | During 2009, the number and prices of unexercised share options were adjusted for the rights issue. |
Maximum obligation to deliver HSBC Holdings ordinary shares
At 31 December 2010, the maximum obligation to deliver HSBC Holdings ordinary shares under all of the above option arrangements, together with awards of Performance Shares and Restricted Shares under the HSBC Share Plan, was 558,187,326 (2009: 559,960,290). The total number of shares at 31 December 2010 held by employee benefit trusts that may be used to satisfy such obligations to deliver HSBC Holdings ordinary shares was 79,541,700 (2009: 134,903,061).
40 Notes on the statement of cash flows
Non-cash items included in profit before tax
| | | | | | | | | | | | | | | | | | | | | |
| | | HSBC | | HSBC Holdings |
| | | 2010 | | | 2009 | | | 2008 | | | 2010 | | | 2009 | |
| | | US$m | | | US$m | | | US$m | | | US$m | | | US$m | |
| | | | | | | | | | | | | | | | | | | | | |
| Depreciation, amortisation and impairment | | | 2,801 | | | | 2,538 | | | | 13,367 | | | | 2 | | | | 5,947 | |
| Gains arising from dilution of interests in associates | | | (188 | ) | | | – | | | | – | | | | – | | | | – | |
| Revaluations on investment property | | | (93 | ) | | | 24 | | | | 92 | | | | – | | | | – | |
| Share-based payment expense | | | 812 | | | | 683 | | | | 819 | | | | 28 | | | | 21 | |
| Loan impairment losses gross of recoveries and other credit risk provisions | | | 15,059 | | | | 27,378 | | | | 25,771 | | | | – | | | | – | |
| Provisions | | | 680 | | | | 669 | | | | 591 | | | | – | | | | – | |
| Impairment of financial investments | | | 105 | | | | 358 | | | | 1,042 | | | | 113 | | | | – | |
| Charge for defined benefit plans | | | 526 | | | | 192 | | | | 490 | | | | – | | | | – | |
| Accretion of discounts and amortisation of premiums | | | (815 | ) | | | (458 | ) | | | (867 | ) | | | 42 | | | | 6 | |
| | | | | | | | | | | |
| | | | | | | | | | | | | | | | | | | | | |
| | | | 18,887 | | | | 31,384 | | | | 41,305 | | | | 185 | | | | 5,974 | |
| | | | | | | | | | | |
356
Notes on the Financial Statements(continued)
Change in operating assets
| | | | | | | | | | | | | | | | | | | | | |
| | | HSBC | | HSBC Holdings |
| | | 2010 | | | 2009 | | | 2008 | | | 2010 | | | 2009 | |
| | | US$m | | | US$m | | | US$m | | | US$m | | | US$m | |
| | | | | | | | | | | | | | | | | | | | | |
| Change in loans to HSBC undertakings | | | – | | | | – | | | | – | | | | 1,974 | | | | (11,408 | ) |
| Change in prepayments and accrued income | | | 457 | | | | 3,198 | | | | 4,178 | | | | (5 | ) | | | (44 | ) |
| Change in net trading securities and net derivatives | | | 60,337 | | | | 15,388 | | | | (23,293 | ) | | | 1,119 | | | | 354 | |
| Change in loans and advances to banks | | | 5,213 | | | | (30,354 | ) | | | 22,596 | | | | – | | | | – | |
| Change in loans and advances to customers | | | (79,283 | ) | | | 6,149 | | | | 7,279 | | | | – | | | | – | |
| Change in financial assets designated at fair value | | | 154 | | | | (8,911 | ) | | | 12,757 | | | | – | | | | – | |
| Change in other assets | | | (145 | ) | | | (6,273 | ) | | | (5,394 | ) | | | 3 | | | | 21 | |
| | | | | | | | | | | |
| | | | | | | | | | | | | | | | | | | | | |
| | | | (13,267 | ) | | | (20,803 | ) | | | 18,123 | | | | 3,091 | | | | (11,077 | ) |
| | | | | | | | | | | |
Change in operating liabilities
| | | | | | | | | | | | | | | | | | | | | |
| | | HSBC | | HSBC Holdings |
| | | 2010 | | | 2009 | | | 2008 | | | 2010 | | | 2009 | |
| | | US$m | | | US$m | | | US$m | | | US$m | | | US$m | |
| | | | | | | | | | | | | | | | | | | | | |
| Change in accruals and deferred income | | | 716 | | | | (2,258 | ) | | | (6,169 | ) | | | 147 | | | | 131 | |
| Change in deposits by banks | | | (14,288 | ) | | | (5,216 | ) | | | (3,038 | ) | | | – | | | | – | |
| Change in customer accounts | | | 68,691 | | | | 41,983 | | | | 32,372 | | | | – | | | | – | |
| Change in debt securities in issue | | | (1,495 | ) | | | (32,797 | ) | | | (67,152 | ) | | | (171 | ) | | | 21 | |
| Change in financial liabilities designated at fair value | | | 5,659 | | | | 7,430 | | | | (15,352 | ) | | | (621 | ) | | | 2,411 | |
| Change in other liabilities | | | (17,011 | ) | | | 5,503 | | | | (4,074 | ) | | | (1,109 | ) | | | (523 | ) |
| | | | | | | | | | | |
| | | | | | | | | | | | | | | | | | | | | |
| | | | 42,272 | | | | 14,645 | | | | (63,413 | ) | | | (1,754 | ) | | | 2,040 | |
| | | | | | | | | | | |
Cash and cash equivalents
| | | | | | | | | | | | | | | | | | | | | |
| | | HSBC | | HSBC Holdings |
| | | 2010 | | | 2009 | | | 2008 | | | 2010 | | | 2009 | |
| | | US$m | | | US$m | | | US$m | | | US$m | | | US$m | |
| | | | | | | | | | | | | | | | | | | | | |
| Cash at bank with HSBC undertakings | | | | | | | – | | | | – | | | | 459 | | | | 224 | |
| Cash and balances at central banks | | | 57,383 | | | | 60,655 | | | | 52,396 | | | | – | | | | – | |
| Items in the course of collection from other banks | | | 6,072 | | | | 6,395 | | | | 6,003 | | | | – | | | | – | |
| Loans and advances to banks of one month or less | | | 189,197 | | | | 160,673 | | | | 165,066 | | | | – | | | | – | |
| Treasury bills, other bills and certificates of deposit less than three months | | | 28,087 | | | | 28,777 | | | | 62,639 | | | | – | | | | – | |
| Less: items in the course of transmission to other banks | | | (6,663 | ) | | | (5,734 | ) | | | (7,232 | ) | | | – | | | | – | |
| | | | | | | | | | | |
| | | | | | | | | | | | | | | | | | | | | |
| | | | 274,076 | | | | 250,766 | | | | 278,872 | | | | 459 | | | | 224 | |
| | | | | | | | | | | |
Interest and dividends
| | | | | | | | | | | | | | | | | | | | | |
| | | HSBC | | HSBC Holdings |
| | | 2010 | | | 2009 | | | 2008 | | | 2010 | | | 2009 | |
| | | US$m | | | US$m | | | US$m | | | US$m | | | US$m | |
| | | | | | | | | | | | | | | | | | | | | |
| Interest paid | | | (21,405 | ) | | | (29,030 | ) | | | (60,342 | ) | | | (2,363 | ) | | | (2,513 | ) |
| Interest received | | | 63,696 | | | | 74,062 | | | | 107,019 | | | | 1,405 | | | | 1,560 | |
| Dividends received | | | 563 | | | | 1,023 | | | | 1,876 | | | | 7,008 | | | | 7,488 | |
The amount of cash and cash equivalents not available for use by HSBC at 31 December 2010 was US$37,413m (2009: US$19,119m), of which US$28,780m (2009: US$11,595m) related to mandatory deposits at central banks.
357
Notes on the Financial Statements(continued)
41 Contingent liabilities, contractual commitments and guarantees
| | | | | | | | | | | | | | | | | |
| | | HSBC | | HSBC Holdings |
| | | 2010 | | | 2009 | | | 2010 | | | 2009 | |
| | | US$m | | | US$m | | | US$m | | | US$m | |
| | | | | | | | | | | | | | | | | |
Guarantees and contingent liabilities | | | | | | | | | | | | | | | | |
| Guarantees and irrevocable letters of credit pledged as collateral security | | | 71,157 | | | | 73,385 | | | | 46,988 | | | | 35,073 | |
| Other contingent liabilities | | | 166 | | | | 174 | | | | – | | | | – | |
| | | | | | | | | |
| | | | | | | | | | | | | | | | | |
| | | | 71,323 | | | | 73,559 | | | | 46,988 | | | | 35,073 | |
| | | | | | | | | |
| | | | | | | | | | | | | | | | | |
Commitments | | | | | | | | | | | | | | | | |
| Documentary credits and short-term trade-related transactions | | | 12,051 | | | | 9,066 | | | | – | | | | – | |
| Forward asset purchases and forward forward deposits placed | | | 30 | | | | 192 | | | | – | | | | – | |
| Undrawn formal standby facilities, credit lines and other commitments to lend | | | 590,432 | | | | 548,792 | | | | 2,720 | | | | 3,240 | |
| | | | | | | | | |
| | | | | | | | | | | | | | | | | |
| | | | 602,513 | | | | 558,050 | | | | 2,720 | | | | 3,240 | |
| | | | | | | | | |
The above table discloses the nominal principal amounts of commitments excluding capital commitments, which are separately disclosed below, guarantees and other contingent liabilities; mainly credit-related instruments including both financial and non-financial guarantees and commitments to extend credit. Contingent liabilities arising from legal proceedings and regulatory matters against the Group are disclosed in Note 44. Nominal principal amounts represent the amounts at risk should contracts be fully drawn upon and clients default. The amount of the loan commitments shown above reflects, where relevant, the expected level of take-up of pre-approved loan offers made by mailshots to personal customers. As a significant portion of guarantees and commitments is expected to expire without being drawn upon, the total of the nominal principal amounts is not representative of future liquidity requirements.
Guarantees
HSBC provides guarantees and similar undertakings on behalf of both third-party customers and other entities within the HSBC Group. These guarantees are generally provided in the normal course of HSBC’s banking business. The principal types of guarantees provided, and the maximum potential amount of future payments which HSBC could be required to make at 31 December 2010, were as follows:
| | | | | | | | | | | | | | | | | |
| | | At 31 December 2010 | | At 31 December 2009 |
| | | | | | | Guarantees | | | | | | | Guarantees | |
| | | | | | | by HSBC | | | | | | | by HSBC | |
| | | | | | | Holdings | | | | | | | Holdings | |
| | | Guarantees in | | | in favour of | | | Guarantees | | | in favour of | |
| | | favour of | | | other HSBC | | | in favour of | | | other HSBC | |
| | | third parties | | | Group entities | | | third parties | | | Group entities | |
| | | US$m | | | US$m | | | US$m | | | US$m | |
| | | | | | | | | | | | | | | | | |
Guarantee type | | | | | | | | | | | | | | | | |
Guarantees of indebtedness including financial guarantees1 and guarantees of a capital nature | | | 21,175 | | | | 46,988 | | | | 23,558 | | | | 35,073 | |
| Standby letters of credit that are financial guarantees | | | 8,033 | | | | – | | | | 10,712 | | | | – | |
Other direct credit substitutes2 | | | 6,555 | | | | – | | | | 4,676 | | | | – | |
Performance bonds3 | | | 15,367 | | | | – | | | | 14,468 | | | | – | |
Bid bonds3 | | | 927 | | | | – | | | | 728 | | | | – | |
Standby letters of credit related to particular transactions3 | | | 6,263 | | | | – | | | | 4,944 | | | | – | |
Other transaction-related guarantees3 | | | 12,746 | | | | – | | | | 13,577 | | | | – | |
| Other items | | | 91 | | | | – | | | | 722 | | | | – | |
| | | | | | | | | |
| | | | | | | | | | | | | | | | | |
| | | | 71,157 | | | | 46,988 | | | | 73,385 | | | | 35,073 | |
| | | | | | | | | |
| | |
| 1 | | Financial guarantees are contracts that require the issuer to make specified payments to reimburse the holder for a loss incurred because a specified debtor fails to make payment when due in accordance with the original or modified terms of a debt instrument. |
| |
| 2 | | Other direct credit substitutes include re-insurance letters of credit and trade-related letters of credit issued without provision for the issuing entity to retain title to the underlying shipment. |
| |
| 3 | | Performance bonds, bid bonds, standby letters of credit and other transaction-related guarantees are undertakings by which the obligation on HSBC to make payment depends on the outcome of a future event. |
358
Notes on the Financial Statements(continued)
The amounts disclosed in the above table are nominal principal amounts and reflect HSBC’s maximum exposure under a large number of individual guarantee undertakings. The risks and exposures arising from guarantees are captured and managed in accordance with HSBC’s overall credit risk management policies and procedures. Approximately half of the above guarantees have a term of less than one year. Guarantees with terms of more than one year are subject to HSBC’s annual credit review process.
Financial Services Compensation Scheme
The Financial Services Compensation Scheme (‘FSCS’) has provided compensation to consumers following the collapse of a number of deposit takers. The compensation paid out to consumers is currently funded through loans from the Bank of England and HM Treasury. The bank could be liable to pay a proportion of the outstanding borrowings that the FSCS has borrowed from HM Treasury which at 31 March 2010 stood at approximately £20bn (US$30bn). Currently, the levy paid by the bank represents its share of the interest on these borrowings. The accrual at 31 December 2010 was US$144m in respect of the 2010/11 and 2011/12 levy years (2009: US$182m in respect of the 2009/10 and 2010/11 levy years).
The ultimate FSCS levy to the industry as a result of the collapses cannot currently be estimated reliably as it is dependent on various uncertain factors including the potential recoveries of assets by the FSCS and changes in the interest rate, the level of protected deposits and the population of FSCS members at the time.
Commitments
In addition to the commitments disclosed on page 358, at 31 December 2010, HSBC had US$1,071m (2009: US$1,359m) of capital commitments contracted but not provided for and US$287m (2009: US$227m) of capital commitments authorised but not contracted for.
Associates
HSBC’s share of associates’ contingent liabilities amounted to US$25,640m at 31 December 2010 (2009: US$19,770m). No matters arose where HSBC was severally liable.
42 Lease commitments
Finance lease commitments
HSBC leases land and buildings (including branches) and equipment from third parties under finance lease arrangements to support its operations.
| | | | | | | | | | | | | | | | | | | | | | | | | |
| | | At 31 December 2010 | | At 31 December 2009 |
| | | | | | | | | | | Present value | | | | | | | | | | | Present value | |
| | | Total future | | | Future | | | of finance | | | Total future | | | Future | | | of finance | |
| | | minimum | | | interest | | | lease | | | minimum | | | interest | | | lease | |
| | | payments | | | charges | | | commitments | | | payments | | | charges | | | commitments | |
| | | US$m | | | US$m | | | US$m | | | US$m | | | US$m | | | US$m | |
| | | | | | | | | | | | | | | | | | | | | | | | | |
| Lease commitments: | | | | | | | | | | | | | | | | | | | | | | | | |
| – no later than one year | | | 107 | | | | (20 | ) | | | 87 | | | | 103 | | | | (29 | ) | | | 74 | |
| – later than one year and no later than five years | | | 187 | | | | (92 | ) | | | 95 | | | | 249 | | | | (116 | ) | | | 133 | |
| – later than five years | | | 390 | | | | (118 | ) | | | 272 | | | | 619 | | | | (182 | ) | | | 437 | |
| | | | | | | | | | | | | |
| | | | | | | | | | | | | | | | | | | | | | | | | |
| | | | 684 | | | | (230 | ) | | | 454 | | | | 971 | | | | (327 | ) | | | 644 | |
| | | | | | | | | | | | | |
At 31 December 2010, future minimum sublease payments of US$436m (2009: US$512m) are expected to be received under non-cancellable subleases at the balance sheet date.
359
Notes on the Financial Statements(continued)
Operating lease commitments
At 31 December 2010, HSBC was obligated under a number of non-cancellable operating leases for properties, plant and equipment on which the future minimum lease payments extend over a number of years.
| | | | | | | | | | | | | | | | | |
| | | At 31 December 2010 | | At 31 December 2009 |
| | | Land and | | | | | | | Land and | | | | |
| | | buildings | | | Equipment | | | buildings | | | Equipment | |
| | | US$m | | | US$m | | | US$m | | | US$m | |
| | | | | | | | | | | | | | | | | |
| Future minimum lease payments under non-cancellable operating leases: | | | | | | | | | | | | | | | | |
| – no later than one year | | | 920 | | | | 23 | | | | 846 | | | | 11 | |
| – later than one year and no later than five years | | | 2,663 | | | | 37 | | | | 2,253 | | | | 11 | |
| – later than five years | | | 2,614 | | | | – | | | | 2,534 | | | | – | |
| | | | | | | | | |
| | | | | | | | | | | | | | | | | |
| | | | 6,197 | | | | 60 | | | | 5,633 | | | | 22 | |
| | | | | | | | | | |
At 31 December 2010, future minimum sublease payments of US$21m (2009: US$21m) are expected to be received under non-cancellable subleases at the balance sheet date.
In 2010, US$888m (2009: US$1,100m; 2008: US$861m) was charged to ‘General and administrative expenses’ in respect of lease and sublease agreements, of which US$869m (2009: US$833m; 2008: US$635m) related to minimum lease payments, US$18m (2009: US$16m; 2008: US$22m) to contingent rents, and US$1m (2009: US$251m; 2008: US$204m) to sublease payments.
The contingent rent represents escalation payments made to landlords for operating, tax and other escalation expenses.
Finance lease receivables
HSBC leases a variety of assets to third parties under finance leases, including transport assets (such as aircraft), property and general plant and machinery. At the end of lease terms, assets may be sold to third parties or leased for further terms. Lessees may participate in any sales proceeds achieved. Lease rentals arising during the lease terms will either be fixed in quantum or be varied to reflect changes in, for example, tax or interest rates. Rentals are calculated to recover the cost of assets less their residual value, and earn finance income.
| | | | | | | | | | | | | | | | | | | | | | | | | |
| | | At 31 December 2010 | | At 31 December 2009 |
| | | Total future | | | Unearned | | | | | | | Total future | | | Unearned | | | | |
| | | minimum | | | finance | | | Present | | | minimum | | | finance | | | Present | |
| | | payments | | | income | | | value | | | payments | | | income | | | value | |
| | | US$m | | | US$m | | | US$m | | | US$m | | | US$m | | | US$m | |
| | | | | | | | | | | | | | | | | | | | | | | | | |
| Lease receivables: | | | | | | | | | | | | | | | | | | | | | | | | |
| – no later than one year | | | 3,002 | | | | (344 | ) | | | 2,658 | | | | 2,874 | | | | (328 | ) | | | 2,546 | |
| – later than one year and no later than five years | | | 8,940 | | | | (813 | ) | | | 8,127 | | | | 9,525 | | | | (1,061 | ) | | | 8,464 | |
| – later than five years | | | 6,629 | | | | (1,462 | ) | | | 5,167 | | | | 6,902 | | | | (1,737 | ) | | | 5,165 | |
| | | | | | | | | | | | | |
| | | | | | | | | | | | | | | | | | | | | | | | | |
| | | | 18,571 | | | | (2,619 | ) | | | 15,952 | | | | 19,301 | | | | (3,126 | ) | | | 16,175 | |
| | | | | | | | | | | | | |
At 31 December 2010, unguaranteed residual values of US$243m (2009: US$230m) had been accrued, and the accumulated allowance for uncollectible minimum lease payments receivable amounted to US$11m (2009: US$21m). During the year, no contingent rents were received (2009: nil) and recognised in the income statement.
360
Notes on the Financial Statements(continued)
Operating lease receivables
HSBC leases a variety of different assets to third parties under operating lease arrangements, including transport assets, property and general plant and machinery.
| | | | | | | | | | | | | | | | | |
| | | At 31 December 2010 | | At 31 December 2009 |
| | | Land and | | | | | | | Land and | | | | |
| | | buildings | | | Equipment | | | buildings | | | Equipment | |
| | | US$m | | | US$m | | | US$m | | | US$m | |
| | | | | | | | | | | | | | | | | |
| Future minimum lease payments under non-cancellable operating leases: | | | | | | | | | | | | | | | | |
| – no later than one year | | | 18 | | | | 17 | | | | 37 | | | | 857 | |
| – later than one year and no later than five years | | | 21 | | | | 22 | | | | 21 | | | | 917 | |
| – later than five years | | | 14 | | | | 2 | | | | 23 | | | | 447 | |
| | | | | | | | | |
| | | | | | | | | | | | | | | | | |
| | | | 53 | | | | 41 | | | | 81 | | | | 2,221 | |
| | | | | | | | | |
| 43 | | Special purpose entities |
HSBC enters into certain transactions with customers in the ordinary course of business which involve the establishment of special purpose entities (‘SPE’s) to facilitate or secure customer transactions. HSBC structures that utilise SPEs are authorised centrally when they are established to ensure appropriate purpose and governance. The activities of SPEs administered by HSBC are closely monitored by senior management.
SPEs are assessed for consolidation in accordance with the accounting policy set out in Note 1f.
Total consolidated assets held by SPEs by balance sheet classification
| | | | | | | | | | | | | | | | | | | | | |
| | | | | | | | | | | | | | | Non-money | | | | |
| | | | | | | | | | | Money | | | market | | | | |
| | | | | | | Securit- | | | market | | | investment | | | | |
| | | Conduits | | | isations | | | funds | | | funds | | | Total | |
| | | US$bn | | | US$bn | | | US$bn | | | US$bn | | | US$bn | |
| | | | | | | | | | | | | | | | | | | | | |
At 31 December 2010 | | | | | | | | | | | | | | | | | | | | |
| Cash | | | 1.0 | | | | 0.7 | | | | – | | | | 0.3 | | | | 2.0 | |
| Trading assets | | | 0.1 | | | | 0.6 | | | | 0.4 | | | | 0.5 | | | | 1.6 | |
| Financial assets designated at fair value | | | 0.1 | | | | – | | | | – | | | | 6.4 | | | | 6.5 | |
| Derivatives | | | – | | | | 0.3 | | | | – | | | | – | | | | 0.3 | |
| Loans and advances to banks | | | – | | | | 1.4 | | | | – | | | | – | | | | 1.4 | |
| Loans and advances to customers | | | 8.4 | | | | 22.2 | | | | – | | | | – | | | | 30.6 | |
| Financial investments | | | 30.5 | | | | 0.1 | | | | – | | | | – | | | | 30.6 | |
| Other assets | | | 1.6 | | | | 0.4 | | | | – | | | | 0.4 | | | | 2.4 | |
| | | | | | | | | | | |
| | | | | | | | | | | | | | | | | | | | | |
| | | | 41.7 | | | | 25.7 | | | | 0.4 | | | | 7.6 | | | | 75.4 | |
| | | | | | | | | | | |
| | | | | | | | | | | | | | | | | | | | | |
| At 31 December 2009 | | | | | | | | | | | | | | | | | | | | |
| Cash | | | – | | | | – | | | | – | | | | 0.2 | | | | 0.2 | |
| Trading assets | | | – | | | | 0.9 | | | | 42.8 | | | | 0.2 | | | | 43.9 | |
| Financial assets designated at fair value | | | 0.1 | | | | – | | | | – | | | | 5.3 | | | | 5.4 | |
| Derivatives | | | – | | | | 1.2 | | | | – | | | | – | | | | 1.2 | |
| Loans and advances to banks | | | 0.3 | | | | – | | | | – | | | | – | | | | 0.3 | |
| Loans and advances to customers | | | 10.3 | | | | 35.4 | | | | – | | | | – | | | | 45.7 | |
| Financial investments | | | 31.4 | | | | – | | | | – | | | | – | | | | 31.4 | |
| Other assets | | | 1.6 | | | | 1.4 | | | | 0.3 | | | | – | | | | 3.3 | |
| | | | | | | | | | | |
| | | | | | | | | | | | | | | | | | | | | |
| | | | 43.7 | | | | 38.9 | | | | 43.1 | | | | 5.7 | | | | 131.4 | |
| | | | | | | | | | | |
HSBC’s maximum exposure to SPEs
The following table shows the total assets of the various types of SPEs and the amount of funding provided by HSBC to these SPEs. The table also shows HSBC’s maximum exposure to the SPEs and, within that exposure, the liquidity and credit enhancements provided by HSBC. The maximum exposures to SPEs represent HSBC’s maximum possible risk exposure that could occur as a result of the Group’s arrangements and commitments to SPEs. The maximum amounts are contingent in nature, and may arise as a result of drawdowns under liquidity facilities, where these have been provided, and any other funding commitments, or as a result of any loss protection provided by HSBC to the SPEs. The conditions under which such exposure might arise differ depending on the nature of each SPE and HSBC’s involvement with it.
361
Notes on the Financial Statements(continued)
Total assets of consolidated and unconsolidated SPEs and HSBC’s funding and maximum exposure
| | | | | | | | | | | | | | | | | | | | | | | | | | | | | |
| | | Consolidated SPEs | | Unconsolidated SPEs |
| | | | | | | | | | | Liquidity | | | | | | | | | | | | | | |
| | | | | | | Funding | | | and credit | | | HSBC’s | | | | | | | Funding | | | HSBC’s | |
| | | Total | | | provided | | | enchance- | | | maximum | | | Total | | | provided | | | maximum | |
| | | assets | | | by HSBC | | | ments | | | exposure | | | assets | | | by HSBC | | | exposure | |
| | | US$bn | | | US$bn | | | US$bn | | | US$bn | | | US$bn | | | US$bn | | | US$bn | |
At 31 December 2010 | | | | | | | | | | | | | | | | | | | | | | | | | | | | |
| Conduits | | | 41.7 | | | | 28.6 | | | | 38.3 | | | | 50.5 | | | | – | | | | – | | | | – | |
| | | | | | | | | | | | | | | |
| Securities investment conduits | | | 32.2 | | | | 28.6 | | | | 25.6 | | | | 37.8 | | | | – | | | | – | | | | – | |
| Multi-seller conduits | | | 9.5 | | | | 0.0 | | | | 12.7 | | | | 12.7 | | | | – | | | | – | | | | – | |
| | | | | | | | | | | | | | | |
| Securitisations | | | 25.7 | | | | 1.9 | | | | 0.1 | | | | 4.7 | | | | 9.9 | | | | – | | | | – | |
| Money market funds | | | 0.4 | | | | 0.4 | | | | – | | | | 0.4 | | | | 95.8 | | | | 0.7 | | | | 0.7 | |
| | | | | | | | | | | | | | | |
| Constant net asset value funds | | | – | | | | – | | | | – | | | | – | | | | 74.9 | | | | 0.5 | | | | 0.5 | |
| Other | | | 0.4 | | | | 0.4 | | | | – | | | | 0.4 | | | | 20.9 | | | | 0.2 | | | | 0.2 | |
| | | | | | | | | | | | | | | |
| Non-money market investment funds | | | 7.6 | | | | 6.9 | | | | – | | | | 6.9 | | | | 274.7 | | | | 1.7 | | | | 1.7 | |
| | | | | | | | | | | | | | | |
| | | | | | | | | | | | | | | | | | | | | | | | | | | | | |
| | | | 75.4 | | | | 37.8 | | | | 38.4 | | | | 62.5 | | | | 380.4 | | | | 2.4 | | | | 2.4 | |
| | | | | | | | | | | | | | | |
| | | | | | | | | | | | | | | | | | | | | | | | | | | | | |
| At 31 December 2009 | | | | | | | | | | | | | | | | | | | | | | | | | | | | |
| Conduits | | | 43.7 | | | | 32.8 | | | | 43.5 | | | | 56.9 | | | | – | | | | – | | | | – | |
| | | | | | | | | | | | | | | |
| Securities investment conduits | | | 32.8 | | | | 32.4 | | | | 29.1 | | | | 42.5 | | | | – | | | | – | | | | – | |
| Multi-seller conduits | | | 10.9 | | | | 0.4 | | | | 14.4 | | | | 14.4 | | | | – | | | | – | | | | – | |
| | | | | | | | | | | | | | | |
| Securitisations | | | 38.9 | | | | 2.9 | | | | 0.1 | | | | 7.9 | | | | 11.1 | | | | 0.1 | | | | 0.1 | |
| Money market funds | | | 43.1 | | | | 1.5 | | | | – | | | | 1.5 | | | | 55.9 | | | | 0.3 | | | | 0.3 | |
| | | | | | | | | | | | | | | |
| Constant net asset value funds | | | 42.4 | | | | 0.9 | | | | – | | | | 0.9 | | | | 31.2 | | | | 0.1 | | | | 0.1 | |
| Other | | | 0.7 | | | | 0.6 | | | | – | | | | 0.6 | | | | 24.7 | | | | 0.2 | | | | 0.2 | |
| | | | | | | | | | | | | | | |
| Non-money market investment funds | | | 5.7 | | | | 5.4 | | | | – | | | | 5.4 | | | | 249.7 | | | | 1.4 | | | | 1.4 | |
| Other | | | – | | | | – | | | | – | | | | – | | | | 20.6 | | | | 8.8 | | | | 3.2 | |
| | | | | | | | | | | | | | | |
| | | | | | | | | | | | | | | | | | | | | | | | | | | | | |
| | | | 131.4 | | | | 42.6 | | | | 43.6 | | | | 71.7 | | | | 337.3 | | | | 10.6 | | | | 5.0 | |
| | | | | | | | | | | | | | | |
HSBC sponsors and manages two types of conduits: securities investment conduits (‘SIC’s) and multi-seller conduits.
Securities investment conduits
Solitaire, HSBC’s principal SIC, purchases highly rated asset-backed securities (‘ABS’s) to facilitate tailored investment opportunities. At 31 December 2010, Solitaire held US$11.7bn of ABSs (2009: US$11.7bn). These are included within the disclosures of ABS ‘held through consolidated SPEs’ on page 133. HSBC’s other SICs, Mazarin, Barion and Malachite, evolved from the restructuring of HSBC’s sponsored structured investment vehicles (‘SIV’s) in 2008.
Solitaire
Commercial Paper (‘CP’) issued by Solitaire benefits from a 100% liquidity facility provided by HSBC. At 31 December 2010, US$7.6bn of Solitaire’s assets were funded by the draw-down of the liquidity facility (2009: US$7.6bn). HSBC is exposed to credit losses on the drawn amounts.
HSBC’s maximum exposure represents the risk that HSBC may be required to fund the vehicle in the event the CP is redeemed without reinvestment from third parties. At 31 December 2010 this amounted to US$16.8bn (31 December 2009: US$18.4bn).
Mazarin
HSBC is exposed to the par value of Mazarin’s assets through the provision of a liquidity facility equal to the lesser of the amortised cost of issued senior debt and the amortised cost of non-defaulted assets. At 31 December 2010 this amounted to US$11.6bn (2009: US$13.6bn). First loss protection is provided through the capital notes issued by Mazarin, which are substantially all held by third parties.
362
Notes on the Financial Statements(continued)
At 31 December 2010, HSBC held 1.3% of Mazarin’s capital notes (2009: 1.3%) which have a par value of US$17m (2009: US$17m) and a carrying amount of US$0.6m (2009: US$0.6m).
Barion and Malachite
HSBC’s primary exposure to these SICs is represented by the amortised cost of the debt required to support the non-cash assets of the vehicles. At 31 December 2010 this amounted to US$9.4bn (2009: US$10.5bn). First loss protection is provided through the capital notes issued by these vehicles, which are substantially all held by third parties.
At 31 December 2010, HSBC held 3.7% of the capital notes issued by these vehicles (2009: 3.8%) which have a par value of US$35m (2009: US$37m) and a carrying amount of US$2m (2009: US$2m).
Multi-seller conduits
These vehicles were established for the purpose of providing access to flexible market-based sources of finance for HSBC’s clients.
HSBC’s maximum exposure is equal to the transaction-specific liquidity facilities offered to the multi-seller conduits. First loss protection is provided by the originator of the assets, and not by HSBC, through transaction-specific credit enhancements. A layer of secondary loss protection is provided by HSBC in the form of programme-wide enhancement facilities.
The following table sets out the weighted average life of the asset portfolios for the above mentioned conduits.
Weighted average life of portfolios
| | | | | | | | | | | | | | | | | |
| | | | | | | | | | | | | | | Total multi- | |
| | | Solitaire | | | Other SICs | | | Total SICs | | | seller conduits | |
Weighted average life (years) | | | | | | | | | | | | | | | | |
| | | | | | | | | | | | | | | | | |
At 31 December 2010 | | | 5.1 | | | | 4.0 | | | | 4.4 | | | | 1.8 | |
| At 31 December 2009 | | | 6.3 | | | | 4.1 | | | | 4.9 | | | | 2.4 | |
HSBC uses SPEs to securitise customer loans and advances that it has originated in order to diversify its sources of funding for asset origination and for capital efficiency purposes. The loans and advances are transferred by HSBC to the SPEs for cash, and the SPEs issue debt securities to investors to fund the cash purchases.
HSBC’s maximum exposure is the aggregate of any holdings of notes issued by these vehicles and the reserve account positions intended to provide credit support under certain pre-defined circumstances to senior note holders.
In addition, HSBC uses SPEs to mitigate the capital absorbed by some of the customer loans and advances it has originated. Credit derivatives are used to transfer the credit risk associated with these customer loans and advances to an SPE, using securitisations commonly known as synthetic securitisations by which the SPE writes credit default swap protection to HSBC. The SPE is funded by the issuance of notes with the cash held as collateral against the credit default protection. From a UK regulatory perspective, the credit protection issued by the SPE in respect of the customer loans allows the risk weight of the loans to be replaced by the risk weight of the collateral in the SPE and as a result mitigates the capital absorbed by the customer loans. Any notes issued by the SPE and held by HSBC attract the appropriate risk weight under the relevant regulatory regime. These SPEs are consolidated when HSBC is exposed to the majority of risks and rewards of ownership.
HSBC has established and manages a number of money market funds which provide customers with tailored investment opportunities within narrow and well-defined objectives.
The majority of these money market funds are Constant Net Asset Value funds (‘CNAV’), which invest in shorter-dated and highly-rated money market securities with the objective of providing investors with a highly liquid and secure investment. In September 2008 during the financial crisis, HSBC consolidated certain of its CNAV funds as a result of a number of actions taken to maintain their AAA rating and mitigate the risks of forced sales of liquid assets to meet potential redemptions. Since consolidation of the CNAV funds, HSBC has not provided any additional support to the funds and
363
Notes on the Financial Statements(continued)
letters of indemnity provided in 2008 have all expired. At all times the funds continued to be governed by their prospectuses.
In December 2010, management determined that it would not provide similar support in the future in the light of changes in the application of banking regulations. As a result, any presumption of ongoing support caused by past actions is no longer valid and it is not appropriate to continue to consolidate the CNAV funds.
The effect of deconsolidating the CNAV funds on HSBC’s balance sheet was to derecognise US$44.4bn of assets and US$43.9bn of liabilities. The deconsolidation of the CNAV funds did not have a material impact on HSBC’s consolidated income statement for the year ended 31 December 2010.
HSBC’s maximum exposure to the CNAV funds is represented by HSBC’s investment in the units of the funds which at 31 December 2010 amounted to US$0.5bn (2009: US$1.0bn). Investments in units of the funds are included within ‘Trading assets’. Prior to deconsolidation, the interest income from the CNAV funds and the expense payable to third-party holders of units in the funds were presented within ‘Net interest income on trading activities’.
HSBC’s maximum exposure to money market funds is represented by HSBC’s investment in the units of each fund, which at 31 December 2010 amounted to US$1.1bn (2009: US$1.8bn).
Non-money market investment funds
HSBC has established a large number of non-money market investment funds to enable customers to invest in a range of assets, typically equities and debt securities.
HSBC’s maximum exposure to non-money market investment funds is represented by its investment in the units of each fund which at 31 December 2010 amounted to US$8.6bn (2009: US$6.8bn).
HSBC also establishes SPEs in the normal course of business for a number of purposes, for example, structured credit transactions for customers, to provide finance to public and private sector infrastructure projects, and for asset and structured finance transactions.
In certain transactions HSBC is exposed to risk often referred to as gap risk. Gap risk typically arises in transactions where the aggregate potential claims against the SPE by HSBC pursuant to one or more derivatives could be greater than the value of the collateral held by the SPE and securing such derivatives. HSBC often mitigates such gap risk by incorporating in the SPE transaction features which allow for deleveraging, a managed liquidation of the portfolio, or other mechanisms including trade restructuring or unwinding the trade. Following the inclusion of such risk reduction mechanisms, HSBC has, in certain circumstances, retained all or a portion of the underlying exposure in the transaction. In these circumstances, HSBC assesses whether the exposure retained causes a requirement under IFRSs to consolidate the SPE. When this retained exposure represents ABSs, it has been included in ‘Nature of HSBC’s exposures’ on page 129.
Third-party sponsored SPEs
Through standby liquidity facility commitments, HSBC has exposure to third-party sponsored SIVs, conduits and securitisations under normal banking arrangements on standard market terms. These exposures are not considered significant to HSBC’s operations.
Additional off-balance sheet arrangements and commitments
Additional off-balance sheet commitments such as financial guarantees, letters of credit and commitments to lend are disclosed in Note 41.
Leveraged finance transactions
Loan commitments in respect of leveraged finance transactions are accounted for as derivatives where it is HSBC’s intention to sell the loan after origination. Further information is provided on pages 138 and 139.
364
Notes on the Financial Statements(continued)
44 Legal proceedings, investigations and regulatory matters
HSBC is party to legal proceedings, investigations and regulatory matters in a number of jurisdictions including the UK, Hong Kong and the US arising out of its normal business operations. Apart from the matters described below, HSBC considers that none of these matters is material, either individually or in the aggregate. HSBC recognises a provision for a liability in relation to these matters when it is probable that an outflow of economic benefits will be required to settle an obligation which has arisen as a result of past events, and for which a reliable estimate can be made of the amount of the obligation. While the outcome of these matters is inherently uncertain, management believes that, based on the information available to it, appropriate provisions have been made in respect of legal proceedings, investigations and regulatory matters as at 31 December 2010 (see note 33, Provisions).
As a result of an August 2002 restatement of previously reported consolidated financial statements and other corporate events, including the 2002 settlement with 46 State Attorneys General relating to real estate lending practices, Household International (now HSBC Finance) and certain former officers were named as defendants in a class action law suit,Jaffe v Household International Inc, et alNo 2. C 5893 (N.D.Ill, filed 19 August 2002). The complaint asserted claims under the US Securities Exchange Act of 1934, on behalf of all persons who acquired and disposed of Household International common stock between 30 July 1999 and 11 October 2002. The claims alleged that the defendants knowingly or recklessly made false and misleading statements of material fact relating to Household’s Consumer Lending operations, including collections, sales and lending practices, some of which ultimately led to the 2002 State settlement agreement, and facts relating to accounting practices evidenced by the restatement. Following a jury trial concluded in April 2009, which was decided partly in favour of the plaintiffs, the Court issued a ruling on 22 November 2010, within the second phase of the case to determine actual damages, that claim forms should be mailed to class members, and also set out a method for calculating damages for class members who filed claims. At subsequent hearings the Court has allowed HSBC Finance to take limited discovery on the issue of whether investors relied on the ‘misleading statements’ at the time they made their investments and also reserved on the issue of whether HSBC Finance would ultimately be entitled to a jury trial on the issue of reliance.
Despite the jury verdict and the 22 November 2010 ruling, HSBC continues to believe that it has meritorious defences, and intends to seek an appeal of the Court’s rulings. Lead Plaintiffs, in Court filings, have estimated that damages could range ‘somewhere between US$2.4bn to US$3.2bn to class members’, before pre-judgement interest. The timing and outcome of the resolution of this matter is uncertain. Given the complexity and uncertainties associated with the actual determination of damages, including but not limited to the number of class members that may file valid claims, the number of claims that can be substantiated by class members providing adequate documentation, the reduction of trading losses by any trading gains made over the relevant period, the determination of reliance by class members on the financial statements, and whether any given class member was the beneficial owner of the shares, HSBC is unable at this time to estimate reliably the amount of any damages, or range of possible damages, that could arise, but they could be significant.
Bernard L. Madoff Investment Securities LLC
In December 2008, Bernard L. Madoff (‘Madoff’) was arrested for running a Ponzi scheme and a trustee was appointed for the liquidation of his firm, Bernard L. Madoff Investment Securities LLC (‘Madoff Securities’), an SEC-registered broker-dealer and investment adviser. Since his appointment, the trustee has been recovering assets and processing claims of Madoff Securities customers. Madoff subsequently pleaded guilty to various charges and is serving a 150-year prison sentence. He has acknowledged, in essence, that while purporting to invest his customers’ money in securities and, upon request, return their profits and principal, he in fact never invested in securities and used other customers’ money to fulfil requests for the return of profits and principal. The relevant US authorities are continuing their investigations into his fraud, and have brought charges against others.
Various non-US HSBC companies provided custodial, administration and similar services to a number of funds incorporated outside the US whose assets were invested with Madoff Securities.
Based on information provided by Madoff Securities, as at 30 November 2008, the purported aggregate value of these funds was US$8.4bn, an amount that includes fictitious profits reported by Madoff. Based on information available to HSBC to date, we estimate that the funds’ actual transfers to Madoff Securities minus their actual withdrawals from Madoff Securities during the time that HSBC serviced the funds totalled approximately US$4.3bn.
365
Notes on the Financial Statements(continued)
Plaintiffs (including funds, fund investors, and the Madoff Securities trustee) have commenced Madoff-related proceedings against numerous defendants in a multitude of jurisdictions. Various HSBC companies have been named as defendants in suits in the US, Ireland, Luxembourg, and other jurisdictions. The suits (which include US class actions) allege that the HSBC defendants knew or should have known of Madoff’s fraud and breached various duties to the funds and fund investors. In December 2010, the Madoff Securities trustee commenced suits against various HSBC companies in the US bankruptcy court and in the English High Court. The US action (which also names certain funds, investment managers, and other entities and individuals) seeks US$9bn in damages and additional recoveries from HSBC and the various co-defendants. It seeks damages against HSBC for allegedly aiding and abetting Madoff’s fraud and breach of fiduciary duty. It also seeks, pursuant to US bankruptcy law, recovery of unspecified amounts received by HSBC from funds invested with Madoff, including amounts that HSBC received when it redeemed units HSBC held in the various funds. HSBC acquired those fund units in connection with financing transactions HSBC had entered into with various clients. The trustee’s US bankruptcy law claims also seek recovery of fees earned by HSBC for providing custodial, administration and similar services to the funds. The trustee’s English action seeks recovery of unspecified transfers of money from Madoff Securities to or through HSBC, on the ground that the HSBC defendants actually or constructively knew of Madoff’s fraud.
Between October 2009 and July 2010, Fairfield Sentry Limited and Fairfield Sigma Limited (‘Fairfield’), funds whose assets were directly or indirectly invested with Madoff Securities, commenced multiple suits in the British Virgin Islands and the US against numerous fund shareholders, including various HSBC companies that acted as nominees for clients of HSBC’s private banking business and other clients who invested in the Fairfield funds. The Fairfield actions seek restitution of amounts paid to the defendants in connection with share redemptions, on the ground that such payments were made by mistake, based on inflated values resulting from Madoff’s fraud.
There are many factors which may affect the range of possible outcomes, and the resulting financial impact, of the various Madoff-related proceedings, including but not limited to the circumstances of the fraud, the multiple jurisdictions in which the proceedings have been brought and the number of different plaintiffs and defendants in such proceedings. The cases where HSBC companies are named as a defendant are at an early stage. For these reasons, among others, it is not practicable at this time for HSBC to estimate reliably the aggregate liabilities, or ranges of liabilities, that might arise as a result of all such claims but they could be significant. In any event, HSBC considers that it has good defences to these claims and will continue to defend them vigorously.
Payment Protection Insurance
Following an extensive period of consultation, on 10 August 2010 the Financial Services Authority (‘FSA’) published Policy Statement 10/12 (‘PS 10/12’) on the assessment and redress of Payment Protection Insurance (‘PPI’) complaints. This included (i) new handbook guidance setting out how complaints are to be handled, and ‘redressed fairly’ where appropriate; (ii) an explanation of when and why firms should analyse their past complaints to identify if there are serious flaws in sales practices that may have affected complainants and non-complainants; and (iii) an Open Letter setting out common sales failings to help firms identify bad practices.
After extensive consideration, the British Bankers Association (‘BBA’), as the representative body of UK banks, sent a formal pre-action protocol letter to the FSA and the Financial Ombudsman Service (‘FOS’) setting out its concerns and what it considered to be the flaws identified in PS 10/12 and Guidance issued by FOS on the handling of PPI complaints. The letter indicated that, absent a satisfactory reply, it was the BBA’s intention to apply to the High Court for a Judicial Review of both PS 10/12 and the FOS Guidance. The FSA and FOS responded on 28 September 2010 denying that they had acted unlawfully in introducing the Policy Statement or relying on the Guidance.
On 8 October 2010, an application for Judicial Review was issued by the BBA seeking an order to quash PS 10/12 and the FOS Guidance. The FSA subsequently issued a statement on 24 November 2010 seeking to clarify aspects of PS 10/12 and the Open Letter. The FSA and FOS filed defences to the Judicial Review application on 10 December 2010. The Judicial Review application was heard by the Court on 25 – 28 January 2011, and judgement is currently awaited.
HSBC believes that the BBA has a strongly arguable case against both the FSA and the FOS. If the Court ultimately concludes, however, after any appeals of the judgement that may follow from any of the parties, that PS 10/12 and the FOS Guidance stand, in whole or in part, then these would need to be taken into consideration when determining complaints alleging the mis-sale of PPI.
If, contrary to HSBC’s current assessment, a decision is reached in the case that results in a potential liability for HSBC, a large number of different outcomes is possible, each of which would have a different financial impact.
366
Notes on the Financial Statements(continued)
There are many factors affecting the range of possible outcomes, and the resulting financial impact, including the extent to which one or both of PS 10/12 and the FOS Guidance are upheld, and the underlying rationale for each decision; the ways in which PS 10/12 and or the FOS Guidance are found to impose additional requirements over and above the common law and the FSA Conduct of Business rules in force at the time relating to the sale of general insurance products, and in the handling of firms’ PPI complaints; the effect of any decision on the nature and volume of customer complaints; and the extent to which, if at all, HSBC might be required to take action, and the nature of any such action, in relation to non-complainants. The extent of any redress that may be required as a result of a decision to uphold PS 10/12 and the FOS Guidance, in whole or in part, would also depend on the facts and circumstances of each individual customer’s case. For these reasons, among others, HSBC does not at this time consider it practicable to provide a reliable estimate or range of estimates of the potential financial impact of an adverse decision.
Pending resolution of the dispute, HSBC continues to review all complaints received which allege that PPI has been mis-sold and, where possible, seeks to resolve them. Where HSBC considers it is not in a position to reach a final decision on a complaint until the conclusion of the application for Judicial Review of PS 10/12 and the FOS Guidance and any subsequent appeals, it informs the complainant that this is the case.
In December 2007, the Group decided to cease selling PPI products in the UK and a phased withdrawal was completed across the HSBC, first direct and M&S Money brands during 2008. HFC Bank Ltd (‘HFC’) ceased selling single premium PPI in 2008 and sales of regular premium PPI will reduce as HFC exits its remaining retail relationships. During the consultation process in 2009, the FSA reported that it had obtained agreement from firms representing 40% of the market for face to face single premium PPI sales to review all such sales since July 2007. No HSBC subsidiary or associate was included in that group of firms.
Regulatory and law enforcement agencies investigations
HSBC Bank USA entered into a consent cease and desist order with the Office of the Comptroller of the Currency and the indirect parent of that company, HSBC North America, entered into a consent cease and desist order with the Federal Reserve Board in the first week of October 2010. These actions require improvements for an effective compliance risk management programme across the Group’s US businesses, including US Bank Secrecy Act (‘BSA’) and Anti Money Laundering (‘AML’) compliance. Steps continue to be taken to address the requirements of these Orders and to ensure that compliance and effective policies and procedures are maintained.
Various HSBC Group companies are the subject of ongoing investigations, including Grand Jury subpoenas and other requests for information, by US Government agencies, including the US Attorney’s Office, the US Department of Justice and the New York County District Attorney’s Office. These investigations pertain to, among other matters, HSBC Bank USA’s bank note and foreign correspondent banking businesses and its compliance with BSA and AML controls, as well as various HSBC companies’ compliance with Office of Foreign Asset Control (‘OFAC’) requirements, and adherence by certain customers to US tax reporting requirements.
The consent cease and desist orders do not preclude additional enforcement actions against HSBC Bank USA or HSBC North America by bank regulatory or law enforcement agencies, including actions to recover civil money penalties, fines and other financial penalties relating to activities which were the subject of the cease and desist orders. In addition, it is likely that there could be some form of formal enforcement action in respect of some or all of the ongoing investigations. Actual or threatened enforcement actions against other financial institutions for breaches of BSA, AML and OFAC requirements have resulted in settlements involving fines and penalties, some of which have been significant depending on the individual circumstances of each action. The ongoing investigations are at an early stage. Based on the facts currently known, it is not practicable at this time for HSBC to determine the terms on which the ongoing investigations will be resolved or the timing of such resolution or for HSBC to estimate reliably the amounts, or range of possible amounts, of any fines and/or penalties. As matters progress, it is possible that any fines and/or penalties could be significant.
367
Notes on the Financial Statements(continued)
45 Related party transactions
Related parties of the Group and HSBC Holdings include subsidiaries, associates, joint ventures, post-employment benefit plans for HSBC employees, Key Management Personnel, close family members of Key Management Personnel and entities which are controlled, jointly controlled or significantly influenced, or for which significant voting power is held, by Key Management Personnel or their close family members.
Key Management Personnel are defined as those persons having authority and responsibility for planning, directing and controlling the activities of HSBC Holdings, being the Directors and Group Managing Directors of HSBC Holdings.
Compensation of Key Management Personnel
| | | | | | | | | | | | | |
| | | HSBC |
| | | 2010 | | | 2009 | | | 2008 | |
| | | US$m | | | US$m | | | U$m | |
| | | | | | | | | | | | |
| Short-term employee benefits | | | 39 | | | | 22 | | | | 31 | |
| Post-employment benefits | | | 3 | | | | 3 | | | | 5 | |
| Other long-term benefits | | | 1 | | | | – | | | | – | |
| Termination benefits | | | – | | | | – | | | | – | |
| Share-based payments | | | 49 | | | | 27 | | | | 16 | |
| | | | | | | | |
| | | | | | | | | | | | | |
| | | | 92 | | | | 52 | | | | 52 | |
| | | | | | | | |
Transactions, arrangements and agreements involving related parties
Particulars of advances (loans and quasi-loans), credits and guarantees entered into by subsidiaries of HSBC Holdings during 2010 with Directors, disclosed pursuant to section 413 of the Companies Act 2006, are shown below:
| | | | | | | | | |
| | | At 31 December |
| | | 2010 | | | 2009 | |
| | | US$m | | | US$m | |
| | | | | | | | |
| Advances and credits | | | 9 | | | | 5 | |
Particulars of transactions with related parties, disclosed pursuant to the requirements of IAS 24, are shown below. The disclosure of the year-end balance and the highest amounts outstanding during the year in the table below is considered to be the most meaningful information to represent the amount of the transactions and the amount of outstanding balances during the year.
| | | | | | | | | | | | | | | | | |
| | | 2010 | | 2009 |
| | | | | | | Highest | | | | | | | Highest | |
| | | | | | | amounts | | | | | | | amounts | |
| | | Balance at | | | outstanding | | | Balance at | | | outstanding | |
| | | 31 December | | | during year | | | 31 December | | | during year | |
| | | US$m | | | US$m | | | US$m | | | US$m | |
Key Management Personnel1 | | | | | | | | | | | | | | | | |
| Advances and credits | | | 901 | | | | 1,681 | | | | 736 | | | | 1,407 | |
| Guarantees | | | 27 | | | | 31 | | | | 32 | | | | 34 | |
| | |
| 1 | | Includes Key Management Personnel, close family members of Key Management Personnel and entities which are controlled, jointly controlled or significantly influenced, or for which significant voting power is held, by Key Management Personnel or their close family members. |
Some of the transactions were connected transactions, as defined by the Rules Governing The Listing of Securities on The Stock Exchange of Hong Kong Limited but were exempt from any disclosure requirements under the provisions of those Rules. The above transactions were made in the ordinary course of business and on substantially the same terms, including interest rates and security, as for comparable transactions with persons of a similar standing or, where applicable, with other employees. The transactions did not involve more than the normal risk of repayment or present other unfavourable features.
368
Notes on the Financial Statements(continued)
Shareholdings, options and other securities of Key Management Personnel
| | | | | | | | | |
| | | At 31 December |
| | | 2010 | | | 2009 | |
| | | (000s) | | | (000s) | |
| | | | | | | | | |
| Number of options held over HSBC Holdings ordinary shares under employee share plans | | | 602 | | | | 1,033 | |
| Number of HSBC Holdings ordinary shares held beneficially and non-beneficially | | | 13,395 | | | | 19,567 | |
| Number of HSBC Holdings preference shares held beneficially and non-beneficially | | | – | | | | 8 | |
| Number of HSBC Holdings 8.125% Perpetual Subordinated Capital Securities held beneficially and non-beneficially | | | – | | | | 25 | |
| | | | | | |
| | | | | | | | | |
| | | | 13,997 | | | | 20,633 | |
| | | | | | |
Transactions with other related parties of HSBC
Associates and joint ventures
The Group provides certain banking and financial services to associates and joint ventures, including loans, overdrafts, interest and non-interest bearing deposits and current accounts. Details of the interests in associates and joint ventures are given in Note 21. Transactions and balances during the year with associates and joint ventures were as follows:
| | | | | | | | | | | | | | | | | |
| | | 2010 | | 2009 |
| | | Highest | | | | | | | Highest | | | | |
| | | balance during | | | Balance at | | | balance during | | | Balance at | |
| | | the year | 1 | | 31 December | 1 | | the year | 1 | | 31 December | 1 |
| | | US$m | | | US$m | | | US$m | | | US$m | |
| Amounts due from joint ventures: | | | | | | | | | | | | | | | | |
| – subordinated | | | 5 | | | | 5 | | | | – | | | | – | |
| – unsubordinated | | | 514 | | | | 412 | | | | 423 | | | | 378 | |
| Amounts due from associates: | | | | | | | | | | | | | | | | |
| – subordinated | | | 16 | | | | – | | | | 17 | | | | 17 | |
| – unsubordinated | | | 2,248 | | | | 1,702 | | | | 1,343 | | | | 1,239 | |
| | | | | | | | | | | |
| | | | | | | | | | | | | | | | | |
| | | | 2,783 | | | | 2,119 | | | | 1,783 | | | | 1,634 | |
| | | | | | | | | | | |
| Amounts due to joint ventures | | | 151 | | | | 134 | | | | 130 | | | | 129 | |
| Amounts due to associates | | | 700 | | | | 527 | | | | 1,494 | | | | 136 | |
| | | | | | | | | | | |
| | | | | | | | | | | | | | | | | |
| | | | 851 | | | | 661 | | | | 1,624 | | | | 265 | |
| | | | | | | | | | | |
| | |
| 1 | | The disclosure of the year-end balance and the highest balance during the year is considered the most meaningful information to represent transactions during the year. |
The above outstanding balances arose from the ordinary course of business and on substantially the same terms, including interest rates and security, as for comparable transactions with third-party counterparties.
Post-employment benefit plans
At 31 December 2010, US$4.7bn (2009: US$4.2bn) of HSBC post-employment benefit plan assets were under management by HSBC companies. Fees of US$17m (2009: US$15m) were earned by HSBC companies for these management services provided to its post-employment benefit plans. HSBC’s post-employment benefit plans had placed deposits of US$1,840m (2009: US$929m) with its banking subsidiaries, on which interest payable to the schemes amounted to US$4m (2009: US$3m). The above outstanding balances arose from the ordinary course of business and on substantially the same terms, including interest rates and security, as for comparable transactions with third-party counterparties.
HSBC Bank (UK) Pension Scheme entered into swap transactions with HSBC as part of the management of the inflation and interest rate sensitivity of its liabilities. At 31 December 2010, the gross notional value of the swaps was US$22.9bn (2009: US$23.7bn), the swaps had a positive fair value of US$2.2bn (2009: positive fair value of US$1.0bn) to the scheme and HSBC had delivered collateral of US$3.3bn (2009: US$2.8bn) to the scheme in respect of these swaps, on which HSBC earned interest amounting to nil (2009: US$7m). All swaps were executed at prevailing market rates and within standard market bid/offer spreads.
In order to satisfy diversification requirements, there are special collateral provisions for the swap transactions between HSBC and the scheme. The collateral agreement stipulates that the scheme never posts collateral to HSBC. Collateral is posted to the scheme by HSBC at an amount that provides the Trustee with a high level of confidence that would be sufficient to replace the swaps in the event of default by HSBC Bank plc. With the exception of the
369
Notes on the Financial Statements(continued)
special collateral arrangements detailed above, all other aspects of the swap transactions between HSBC and the scheme are on substantially the same terms as comparable transactions with third-party counterparties.
On 17 June 2010, HSBC Bank plc made a £1,760m (US$2,638m) special contribution to accelerate the reduction of the deficit of the HSBC Bank (UK) Pension Scheme. On the same day the Scheme used the contribution to acquire debt securities with a fair value of £1,760m (US$2,638m) from HSBC in a transaction at an arm’s length value determined by the Scheme’s independent third-party advisors.
HSBC International Staff Retirements Benefits Scheme entered into swap transactions with HSBC to manage the inflation and interest rate sensitivity of the liabilities and selected assets. At 31 December 2010, the gross notional value of the swaps was US$1.8bn (2009: US$1.8bn) and the swaps had a net positive fair value of US$77m to the scheme (2009: US$27m).
Details of HSBC Holdings’ principal subsidiaries are shown in Note 26. Transactions and balances during the year with subsidiaries were as follows:
| | | | | | | | | | | | | | | | | |
| | | 2010 | | 2009 |
| | | Highest | | | | | | | Highest | | | | |
| | | balance during | | | Balance at | | | balance during | | | Balance at | |
| | | the year | 1 | | 31 December | 1 | | the year | 1 | | 31 December | 1 |
| | | US$m | | | US$m | | | US$m | | | US$m | |
Assets | | | | | | | | | | | | | | | | |
| Cash at bank | | | 459 | | | | 459 | | | | 443 | | | | 224 | |
| Derivatives | | | 3,219 | | | | 2,327 | | | | 3,682 | | | | 2,981 | |
| Loans and advances | | | 23,212 | | | | 21,238 | | | | 26,156 | | | | 23,212 | |
| Financial investments | | | 2,606 | | | | 2,025 | | | | 2,629 | | | | 2,455 | |
| Investments in subsidiaries | | | 92,899 | | | | 92,899 | | | | 90,914 | | | | 86,247 | |
| | | | | | | | | | | |
| | | | | | | | | | | | | | | | | |
| Total related party assets | | | 122,395 | | | | 118,948 | | | | 123,824 | | | | 115,119 | |
| | | | | | | | | | | |
Liabilities | | | | | | | | | | | | | | | | |
| Amounts owed to HSBC undertakings | | | 4,580 | | | | 2,932 | | | | 5,669 | | | | 3,711 | |
| Derivatives | | | 1,677 | | | | 827 | | | | 1,324 | | | | 362 | |
| Subordinated liabilities: | | | | | | | | | | | | | | | | |
| – at amortised cost | | | 3,907 | | | | 2,464 | | | | 3,907 | | | | 3,907 | |
| – designated at fair value | | | 4,507 | | | | 4,259 | | | | 4,360 | | | | 4,360 | |
| | | | | | | | | | | |
| | | | | | | | | | | | | | | | | |
| Total related party liabilities | | | 14,671 | | | | 10,482 | | | | 15,260 | | | | 12,340 | |
| | | | | | | | | | | |
| Guarantees | | | 46,988 | | | | 46,988 | | | | 47,341 | | | | 35,073 | |
| Commitments | | | 3,240 | | | | 2,720 | | | | 3,241 | | | | 3,240 | |
| | |
| 1 | | The disclosure of the year-end balance and the highest balance during the year is considered the most meaningful information to represent transactions during the year. The above outstanding balances arose in the ordinary course of business and are on substantially the same terms, including interest rates and security, as for comparable transactions with third-party counterparties, with the exception of US$160m (2009: US$160m) in respect of loans to HSBC subsidiaries from HSBC Holdings and US$506m (2009: US$529m) in respect of loans from HSBC subsidiaries to HSBC Holdings made at an agreed zero per cent interest rate. |
Some employees of HSBC Holdings are members of the HSBC Bank (UK) Pension Scheme, which is sponsored by a separate Group company. HSBC Holdings incurs a charge for these employees equal to the contributions paid into the scheme on their behalf. Disclosure in relation to the scheme is made in Note 7 to the accounts.
46 Events after the balance sheet date
A fourth interim dividend for 2010 of US$0.12 per ordinary share (a distribution of approximately US$2,125m) was declared by the Directors after 31 December 2010.
These accounts were approved by the Board of Directors on 28 February 2011 and authorised for issue.
The information set out in these accounts does not constitute the company’s statutory accounts for the years ended 31 December 2010 or 2009. Those accounts have been reported on by the company’s auditors: their reports were unqualified and did not contain a statement under section 498(2) or (3) of the Companies Act 2006. The accounts for 2009 have been delivered to the Registrar of Companies and those for 2010 will be delivered in due course.
370
Shareholder Information
Shareholder information
| | | | | |
| | | Page |
| | | 371 | |
| | | | | |
| | | 371 | |
| | | | | |
| | | 372 | |
| | | | | |
| | | 372 | |
| | | | | |
| | | 372 | |
| | | | | |
| | | 373 | |
| | | | | |
| | | 373 | |
| | | | | |
| | | 374 | |
| | | | | |
| | | 374 | |
| | | | | |
| | | 375 | |
| | | | | |
| | | 376 | |
| | | | | |
| | | | Page |
| | | 378 | (a) |
| | | | | |
| | | 378 | (a) |
| | | | | |
| | | 378 | (a) |
| | | | | |
| | | 378 | (a) |
| | | | | |
| | | 378 | (b) |
| | | | | |
| | | 378 | (c) |
| | | | | |
| | | 378 | (d) |
| | | | | |
| | | 378 | (e) |
| | | | | |
| | | 379 | |
| | | | | |
| | | 380 | |
Fourth interim dividend for 2010
The Directors have declared a fourth interim dividend for 2010 of US$0.12 per ordinary share. Information on the scrip dividend scheme and currencies in which shareholders may elect to have the cash dividend paid will be sent to shareholders on or about 30 March 2011. The timetable for the dividend is:
| | | | | |
| Announcement | | 28 February 2011 | |
| Shares quoted ex-dividend in London, Hong Kong, Paris and Bermuda | | 16 March 2011 | |
| ADSs quoted ex-dividend in New York | | 16 March 2011 | |
| Record date in Hong Kong | | 17 March 2011 | |
Record date in London, New York, Paris and Bermuda1 | | 18 March 2011 | |
Mailing ofAnnual Report and Accounts 2010and/orAnnual Review 2010, Notice of Annual General Meeting and dividend documentation | | 30 March 2011 | |
| Final date for receipt by registrars of forms of election, Investor Centre electronic instructions and revocations of standing instructions for scrip dividends | | 20 April 2011 | |
| Exchange rate determined for payment of dividends in sterling and Hong Kong dollars | | 27 April 2011 | |
| Payment date: dividend warrants, new share certificates or transaction advices and notional tax vouchers mailed and shares credited to stock accounts in CREST | | 5 May 2011 | |
| | |
| 1 | | Removals to and from the Overseas Branch register of shareholders in Hong Kong will not be permitted on this date. |
Interim dividends for 2011
The Board has adopted a policy of paying quarterly interim dividends on the ordinary shares. Under this policy it is intended to have a pattern of three equal interim dividends with a variable fourth interim dividend. It is envisaged that the first interim dividend in respect of 2011 will be US$0.09 per ordinary share. The proposed timetables for the dividends in respect of 2011 are:
| | | | | | | | | | | | | | | | | |
| | | Interim dividends for 2011 |
| | | First | | Second | | Third | | Fourth |
| | | | | | | | | |
| Announcement | | 3 May 2011 | | 1 August 2011 | | 7 November 2011 | | 27 February 2012 |
| Shares quoted ex-dividend in London, Hong Kong, Paris and Bermuda | | 18 May 2011 | | 17 August 2011 | | 23 November 2011 | | 14 March 2012 |
| ADSs quoted ex-dividend in New York | | 18 May 2011 | | 17 August 2011 | | 23 November 2011 | | 14 March 2012 |
| Record date in Hong Kong | | 19 May 2011 | | 18 August 2011 | | 24 November 2011 | | 15 March 2012 |
Record date in London, New York, Paris and Bermuda1 | | 20 May 2011 | | 19 August 2011 | | 25 November 2011 | | 16 March 2012 |
| Payment date | | 6 July 2011 | | 6 October 2011 | | 18 January 2012 | | 2 May 2012 |
| | |
| 1 | | Removals to and from the Overseas Branch Register of shareholders in Hong Kong will not be permitted on these dates. |
Dividends are declared in US dollars and, at the election of the shareholder, paid in cash in one of, or in a combination of, US dollars, sterling and Hong Kong dollars, or, subject to the Board’s determination that a scrip dividend is to be offered in respect of that dividend, may be satisfied in whole or in part by the issue of new shares in lieu of a cash dividend.
371
Shareholder Information(continued)
HSBC Holdings ordinary shares trade under the following stock symbols:
| | | |
| London Stock Exchange | | HSBA |
| Hong Kong Stock Exchange | | 5 |
| New York Stock Exchange (ADS) | | HBC |
| Euronext Paris | | HSB |
| Bermuda Stock Exchange | | HSBC |
At 31 December 2010 the share register recorded the following details:
| | | | | | | | | |
| | | Number of | | | Total | |
| Ordinary shares held | | shareholders | | | shares held | |
| | | | | | | | | |
| 1-100 | | | 33,908 | | | | 1,050,278 | |
| 101-400 | | | 31,146 | | | | 7,620,110 | |
| 401-500 | | | 8,176 | | | | 3,678,368 | |
| 501-1,000 | | | 33,298 | | | | 24,239,122 | |
| 1,001-5,000 | | | 73,788 | | | | 171,912,626 | |
| 5,001-10,000 | | | 18,775 | | | | 132,126,979 | |
| 10,001-20,000 | | | 10,913 | | | | 151,898,993 | |
| 20,001-50,000 | | | 6,648 | | | | 204,466,829 | |
| 50,001-200,000 | | | 3,223 | | | | 298,496,753 | |
| 200,001-500,000 | | | 754 | | | | 237,056,817 | |
| 500,001 and above | | | 1,104 | | | | 16,453,609,027 | |
| | | | | |
| | | | | | | | | |
| Total | | | 221,733 | | | | 17,686,155,902 | |
| | | | | |
The 2011 Annual General Meeting will be held at the Barbican Hall, Barbican Centre, London EC2 on Friday, 27 May 2011 at 11.00am.
An informal meeting of shareholders will be held at 1 Queen’s Road Central, Hong Kong on Thursday, 19 May 2011 at 4.30pm.
All resolutions considered at the 2010 Annual General Meeting were passed on a poll as follows:
| | | | | | | | | | | | | | | |
| | | | | Total votes |
| Resolution | | For1 | | | Against | | | Vote withheld2 | |
| 1 | | To receive the Report and Accounts for 2009 | | | 6,944,544,740 | | | | 39,714,613 | | | | 430,598,977 | |
| 2 | | To approve the Directors’ Remuneration Report for 2009 | | | 5,730,566,528 | | | | 856,535,768 | | | | 820,187,860 | |
| 3 | | To re-elect the following as Directors: | | | | | | | | | | | | |
| | | (a) R A Fairhead | | | 7,296,815,167 | | | | 101,823,159 | | | | 15,277,590 | |
| | | (b) M F Geoghegan | | | 7,334,050,341 | | | | 32,961,299 | | | | 47,188,185 | |
| | | (c) S K Green | | | 6,977,475,948 | | | | 323,769,338 | | | | 112,927,709 | |
| | | (d) G Morgan | | | 7,268,685,057 | | | | 130,023,850 | | | | 15,410,295 | |
| | | (e) N R N Murthy | | | 7,378,931,192 | | | | 19,477,921 | | | | 15,363,215 | |
| | | (f) S M Robertson | | | 7,153,405,009 | | | | 244,795,070 | | | | 15,607,399 | |
| | | (g) J L Thornton | | | 6,704,405,938 | | | | 234,358,448 | | | | 469,120,496 | |
| | | (h) Sir Brian Williamson | | | 7,380,522,401 | | | | 18,038,078 | | | | 15,323,823 | |
| 4 | | To reappoint the Auditor at remuneration to be determined by the Group Audit Committee | | | 7,359,819,272 | | | | 18,027,604 | | | | 36,351,240 | |
| 5 | | To authorise the Directors to allot shares | | | 7,264,724,799 | | | | 135,841,801 | | | | 16,628,621 | |
| 6 | | To disapply pre-emption rights (Special Resolution) | | | 7,319,169,089 | | | | 79,046,168 | | | | 18,836,871 | |
| 7 | | To alter the Articles of Association (Special Resolution) | | | 7,362,315,126 | | | | 32,851,046 | | | | 21,846,012 | |
| 8 | | To approve the extension of the term of the Share Incentive Plan and the establishment of new share ownership plans | | | 7,358,291,988 | | | | 28,253,519 | | | | 30,640,176 | |
| 9 | | To approve general meetings (other than annual general meetings) being called on a minimum of 14 clear days’ notice (Special Resolution) | | | 7,050,768,076 | | | | 322,799,315 | | | | 43,639,277 | |
| | |
| 1 | | Includes discretionary votes. |
| |
| 2 | | A ‘Vote Withheld’ is not a ‘vote’ in law and is not counted in the calculation of the votes ‘For’ and ‘Against’ the resolution. |
372
Shareholder Information(continued)
Interim Management Statements and Interim Results
Interim Management Statements are expected to be issued on or around 12 May 2011 and 9 November 2011. The Interim Results for the six months to 30 June 2011 are expected to be issued on 1 August 2011.
Shareholder enquiries and communications
Any enquiries relating to shareholdings on the share register, for example transfers of shares, change of name or address, lost share certificates or dividend cheques, should be sent to the Registrars at the address given below. The Registrars offer an online facility, Investor Centre, which enables shareholders to manage their shareholding electronically.
| | | | | |
| Principal Register: | | Hong Kong Overseas Branch Register: | | Bermuda Overseas Branch Register: |
| | | | | |
| Computershare Investor Services PLC | | Computershare Hong Kong Investor | | Investors Relations Team |
| The Pavilions | | Services Limited | | HSBC Bank Bermuda Limited |
| Bridgwater Road | | Rooms 1712-1716, 17thFloor | | 6 Front Street |
| Bristol BS99 6ZZ | | Hopewell Centre | | Hamilton HM 11 |
| United Kingdom | | 183 Queen’s Road East | | Bermuda |
| Telephone: 44 (0) 870 702 0137 | | Hong Kong | | Telephone: 1 441 299 6737 |
| Email via website: | | Telephone: 852 2862 8555 | | Email: |
| www.investorcentre.co.uk/contactus | | Email: hsbc.ecom@computershare.com.hk | | hbbm.shareholder.services@hsbc.bm |
| | | | | |
| Investor Centre: | | Investor Centre: | | Investor Centre: |
| www.investorcentre.co.uk | | www.computershare.com/hk/investors | | www.computershare.com/investor/bm |
Any enquiries relating to ADSs should be sent to the depositary:
BNY Mellon Shareowner Services
PO Box 358516
Pittsburgh, PA 15252-8516
USA
Telephone (US): 1 877 283 5786
Telephone (International): 1 201 680 6825
Email: shrrelations@bnymellon.com
Website: www.bnymellon.com/shareowner
Any enquiries relating to shares held through Euroclear France, the settlement and central depositary system for Euronext Paris, should be sent to the paying agent:
HSBC France
103, avenue des Champs Elysées
75419 Paris Cedex 08
France
Telephone: 33 1 40 70 22 56
Email: ost-agence-des-titres-hsbc-reims.hbfr-do@hsbc.fr
Website: www.hsbc.fr
If you have been nominated to receive general shareholder communications directly from HSBC Holdings, it is important to remember that your main contact in terms of your investment remains as it was (the registered shareholder, or perhaps custodian or broker, who administers the investment on your behalf). Therefore any changes or queries relating to your personal details and holding (including any administration thereof) must continue to be directed to your existing contact at your investment manager or custodian. HSBC Holdings cannot guarantee dealing with matters directed to it in error.
Further copies of thisAnnual Report and Accounts 2010may be obtained by writing to the following departments:
| | | | | |
For those inEurope, the Middle East
and Africa: | | For those in Asia-Pacific: | | For those in the Americas: |
| | | | | |
Group Communications
HSBC Holdings plc
8 Canada Square
London E14 5HQ
United Kingdom | | Group Communications (Asia)
The Hongkong and Shanghai Banking
Corporation Limited 1 Queen’s Road Central Hong Kong | | Internal Communications
HSBC – North America
26525 N Riverwoods Boulevard
Mettawa, Illinois 60045
USA |
373
Shareholder Information(continued)
Electronic communications
Shareholders may at any time choose to receive corporate communications in printed form or to receive a notification of their availability on HSBC’s website. To receive future notifications of the availability of a corporate communication on HSBC’s website by email, or revoke or amend an instruction to receive such notifications by email, go to www.hsbc.com/ecomms. If you provide an email address to receive electronic communications from HSBC, we will also send notifications of your dividend entitlements by email. If you received a notification of the availability of this document on HSBC’s website and would like to receive a printed copy of it, or if you would like to receive future corporate communications in printed form, please write or send an email to the appropriate Registrars at the address given above. Printed copies will be provided without charge.
Chinese translation
A Chinese translation of thisAnnual Report and Accounts 2010is available upon request after 30 March 2011 from the Registrars:
| | | |
| Computershare Hong Kong Investor Services Limited | | Computershare Investor Services PLC |
Rooms 1712-1716, 17th Floor | | The Pavilions |
| Hopewell Centre | | Bridgwater Road |
| 183 Queen’s Road East | | Bristol BS99 6ZZ |
| Hong Kong | | United Kingdom |
Please also contact the Registrars if you wish to receive Chinese translations of future documents or if you have received a Chinese translation of this document and do not wish to receive such translations in future.
Enquiries relating to HSBC’s strategy or operations may be directed to:
| | | | | |
| Manager Investor Relations | | SVP Investor Relations | | Head of Investor Relations, Asia-Pacific |
| HSBC Holdings plc | | HSBC North America Holdings Inc. | | The Hongkong and Shanghai Banking |
| 8 Canada Square | | 26525 N Riverwoods Boulevard | | Corporation Limited |
| London E14 5HQ | | Mettawa, Illinois 60045 | | 1 Queen’s Road Central |
| United Kingdom | | USA | | Hong Kong |
| Telephone: 44 (0)20 7991 8041 | | 1 224 544 4400 | | 852 2822 4908 |
| Facsimile: 44 (0)845 587 0225 | | 1 224 552 4400 | | 852 2537 5109 |
| Email: investorrelations@hsbc.com | | investor.relations.usa@us.hsbc.com | | investorrelations@hsbc.com.hk |
Where more information about HSBC is available
ThisAnnual Report and Accounts 2010, and other information on HSBC, may be viewed on HSBC’s website: www.hsbc.com.
Reports, statements and information that HSBC Holdings files with the Securities and Exchange Commission are available at www.sec.gov. Investors can also request hard copies of these documents upon payment of a duplicating fee, by writing to the SEC at the Office of Investor Education and Advocacy, 100 F Street N.E., Washington, DC 20549-0123 or by emailing PublicInfo@sec.gov. Investors should call the Commission at (202) 551 8090 if they require further assistance. Investors may also obtain the reports and other information that HSBC Holdings files at www.nyse.com (telephone number (1) 212 656 3000).
374
Shareholder Information(continued)
375
Shareholder Information(continued)
Taxation of shares and dividends
The following is a summary, under current law, of certain UK tax considerations that are likely to be material to the ownership and disposition of shares. The summary does not purport to be a comprehensive description of all the tax considerations that may be relevant to a holder of shares. In particular, the summary deals principally with shareholders who are resident solely in the UK for UK tax purposes and only with holders who hold the shares as investments and who are the beneficial owners of the shares, and does not address the tax treatment of certain classes of holders such as dealers in securities. Holders and prospective purchasers should consult their own advisers regarding the tax consequences of an investment in shares in light of their particular circumstances, including the effect of any national, state or local laws.
Currently no tax is withheld from dividends paid by HSBC Holdings. However, dividends are paid with an associated tax credit which is available for set-off by certain shareholders against any liability they may have to UK income tax. Currently, the associated tax credit is equivalent to 10% of the combined cash dividend and tax credit, i.e. one-ninth of the cash dividend.
For individual shareholders who are resident in the UK for taxation purposes and liable to UK income tax at the basic rate, no further UK income tax liability arises on the receipt of a dividend from HSBC Holdings. Individual shareholders who are liable to UK income tax at the higher rate or additional rate are taxed on the combined amount of the dividend and the tax credit at the dividend upper rate (currently 32.5%) and the dividend additional rate (currently 42.5%), respectively. The tax credit is available for set-off against the dividend upper rate and the dividend additional rate liability. Individual UK resident shareholders are not entitled to any tax credit repayment.
Although non-UK resident shareholders are generally not entitled to any repayment of the tax credit in respect of any UK dividend received, some such shareholders may be so entitled under the provisions of a double taxation agreement between their country of residence and the UK. However, in most cases no amount of the tax credit is, in practice, repayable.
Information on the taxation consequences of the HSBC Holdings scrip dividends offered in lieu of the 2009 fourth interim dividend and the first, second and third interim dividends for 2010 was set out in the Secretary’s letters to shareholders of 30 March, 2 June, 1 September and 1 December 2010. In no case, was the difference between the cash dividend foregone and the market value of the scrip dividend in excess of 15% of the market value. Accordingly, the amount of the dividend income chargeable to tax, and, the acquisition price of HSBC Holdings US$0.50 ordinary shares (the ‘shares’) for UK capital gains tax purposes, was the cash dividend foregone.
Taxation of capital gains
The computation of the capital gains tax liability arising on disposals of shares in HSBC Holdings by shareholders subject to UK tax on capital gains can be complex, partly depending on whether, for example, the shares were purchased since April 1991, acquired in 1991 in exchange for shares in The Hongkong and Shanghai Banking Corporation Limited, or acquired subsequent to 1991 in exchange for shares in other companies.
For capital gains tax purposes, the acquisition cost for ordinary shares is adjusted to take account of subsequent rights and capitalisation issues. Any capital gain arising on a disposal by a UK company may also be adjusted to take account of indexation allowance. If in doubt, shareholders are recommended to consult their professional advisers.
Stamp duty and stamp duty reserve tax
Transfers of shares by a written instrument of transfer generally will be subject to UK stamp duty at the rate of 0.5% of the consideration paid for the transfer, and such stamp duty is generally payable by the transferee.
An agreement to transfer shares, or any interest therein, normally will give rise to a charge to stamp duty reserve tax at the rate of 0.5% of the consideration. However, provided an instrument of transfer of the shares is executed pursuant to the agreement and duly stamped before the date on which the stamp duty reserve tax becomes payable, under the current practice of UK HM Revenue and Customs it will not be necessary to pay the stamp duty reserve tax, nor to apply for such tax to be cancelled. Stamp duty reserve tax is generally payable by the transferee.
Paperless transfers of shares within CREST, the UK’s paperless share transfer system, are liable to
376
Shareholder Information(continued)
stamp duty reserve tax at the rate of 0.5% of the consideration. In CREST transactions, the tax is calculated and payment made automatically. Deposits of shares into CREST generally will not be subject to stamp duty reserve tax, unless the transfer into CREST is itself for consideration. Following the case HSBC pursued before the European Court of Justice (Case C-569/07 HSBC Holdings plc and Vidacos Nominees v The Commissioners for HM Revenue & Customs) HMRC now accepts that the charge to stamp duty reserve tax at 1.5% on the issue of shares to a depositary receipt issuer or a clearance service located within the European Union is prohibited.
The following is a summary, under current law, of the principal UK tax and US federal income tax considerations that are likely to be material to the ownership and disposition of shares or ADSs by a holder that is a resident of the US for US federal income tax purposes (a ‘US holder’) and who is not resident or ordinarily resident in the UK for UK tax purposes. The summary does not purport to be a comprehensive description of all of the tax considerations that may be relevant to a holder of shares or ADSs. In particular, the summary deals only with US holders that hold shares or ADSs as capital assets, and does not address the tax treatment of holders that are subject to special tax rules, such as banks, tax-exempt entities, insurance companies, dealers in securities or currencies, persons that hold shares or ADSs as part of an integrated investment (including a ‘straddle’) comprised of a share or ADS and one or more other positions, and persons that own, directly or indirectly, 10% or more of the voting stock of HSBC Holdings. This discussion is based on laws, treaties, judicial decisions and regulatory interpretations in effect on the date hereof, all of which are subject to change. Under the current income tax treaty between the UK and the US, US holders are no longer entitled to claim a special foreign tax credit in respect of dividends.
Holders and prospective purchasers should consult their own advisers regarding the tax consequences of an investment in shares or ADSs in light of their particular circumstances, including the effect of any national, state or local laws.
Any US federal tax advice included in thisAnnual Reportis for informational purposes only; it was not intended or written to be used, and cannot be used, for the purpose of avoiding US federal tax penalties.
Currently no tax is withheld from dividends paid by HSBC Holdings. A US holder must include cash dividends paid on the shares or ADSs in ordinary income on the date that such holder or the ADS depositary receives them, translating dividends paid in UK pounds sterling into US dollars using the exchange rate in effect on the date of receipt. A US holder that elects to receive shares in lieu of a cash dividend must include in ordinary income the fair market value of such shares on the dividend payment date, and the tax basis of those shares will equal such fair market value.
Subject to certain exceptions for positions that are held for less than 61 days or are hedged, and subject to a foreign corporation being considered a ‘qualified foreign corporation’ (which includes not being classified for US federal income tax purposes as a passive foreign investment company), certain dividends (‘qualified dividends’) received by an individual US holder before 2013 generally will be subject to US taxation at a maximum rate of 15%. Based on the company’s audited financial statements and relevant market and shareholder data, HSBC Holdings does not anticipate being classified as a passive foreign investment company. Accordingly, dividends paid on the shares or ADSs generally should be treated as qualified dividends.
Taxation of capital gains
Gains realised by a US holder on the sale or other disposition of shares or ADSs normally will not be subject to UK taxation unless at the time of the sale or other disposition the holder carries on a trade, profession or vocation in the UK through a branch or agency or permanent establishment and the shares or ADSs are or have been used, held or acquired for the purposes of such trade, profession, vocation, branch or agency or permanent establishment. Such gains will be included in income for US tax purposes, and will be long-term capital gains if the shares or ADSs were held for more than one year. A long-term capital gain realised by an individual holder before 2013 generally will be subject to US tax at a maximum rate of 15%.
Shares or ADSs held by an individual whose domicile is determined to be the US for the purposes of the United States-United Kingdom Double Taxation Convention relating to estate and gift taxes (the ‘Estate Tax Treaty’) and who is not for such purposes a national of the UK will not, provided any US Federal estate or gift tax chargeable has been
377
Shareholder Information(continued)
paid, be subject to UK inheritance tax on the individual’s death or on a lifetime transfer of shares or ADSs except in certain cases where the shares or ADSs (i) are comprised in a settlement (unless, at the time of the settlement, the settlor was domiciled in the US and was not a national of the UK), (ii) is part of the business property of a UK permanent establishment of an enterprise, or (iii) pertains to a UK fixed base of an individual used for the performance of independent personal services. In such cases, the Estate Tax Treaty generally provides a credit against US Federal tax liability for the amount of any tax paid in the UK in a case where the shares or ADSs are subject to both UK inheritance tax and to US Federal estate or gift tax.
Stamp duty and stamp duty reserve tax – ADSs
If shares are transferred to a clearance service or depository receipt (‘ADR’) issuer located outside the European Union (which will include a transfer of shares to the Depository) UK stamp duty and/or stamp duty reserve tax will be payable. The stamp duty or stamp duty reserve tax is generally payable on the consideration for the transfer and is payable at the aggregate rate of 1.5%.
The amount of stamp duty reserve tax payable on such a transfer will be reduced by any stamp duty paid in connection with the same transfer.
No stamp duty will be payable on the transfer of, or agreement to transfer, an ADS, provided that the ADR and any separate instrument of transfer or written agreement to transfer remain at all times outside the UK, and provided further that any such transfer or written agreement to transfer is not executed in the UK. No stamp duty reserve tax will be payable on a transfer of, or agreement to transfer, an ADS effected by the transfer of an ADR.
US backup withholding tax and information reporting
Distributions made on shares or ADSs and proceeds from the sale of shares or ADSs that are paid within the US, or through certain financial intermediaries to US holders, are subject to information reporting and may be subject to a US ‘backup’ withholding tax unless, in general, the US holder complies with certain certification procedures or is a corporation or other person exempt from such withholding. Holders that are not US persons generally are not subject to information reporting or backup withholding tax, but may be required to comply with applicable certification procedures to establish that they are not US persons in order to avoid the application of such information reporting requirements or backup withholding tax to payments received within the US or through certain financial intermediaries.
378
Shareholder Information(continued)
Information about the enforceability of judgements made in the US
HSBC Holdings is a public limited company incorporated in England and Wales. Most of the Directors and executive officers live outside the US. As a result, it may not be possible to serve process on such persons or HSBC Holdings in the US or to enforce judgements obtained in US courts against them or HSBC Holdings based on civil liability provisions of the securities laws of the US. There is doubt as to whether English courts would enforce:
| • | | certain civil liabilities under US securities laws in original actions; or |
| |
| • | | judgements of US courts based upon these civil liability provisions. |
| | | In addition, awards of punitive damages in actions brought in the US or elsewhere may be unenforceable in the UK. The enforceability of any judgement in the UK will depend on the particular facts of the case as well as the laws and treaties in effect at the time. |
Exchange controls and other limitations affecting equity security holders
There are currently no UK laws, decrees or regulations which would prevent the import or export of capital or remittance of distributable profits by way of dividends and other payments to holders of HSBC Holdings’ equity securities who are not residents of the UK. There are also no restrictions under the laws of the UK or the terms of the Memorandum and Articles of Association concerning the right of non-resident or foreign owners to hold HSBC Holdings’ equity securities or, when entitled to vote, to do so.
Dividends on the ordinary shares of HSBC Holdings
HSBC Holdings has paid dividends on its ordinary shares every year without interruption since it became the HSBC Group holding company by a scheme of arrangement in 1991. The dividends declared, per ordinary share, in respect of each of the last five years were:
| | | | | | | | | | | | | | | | | | | | | | | | | |
| | | | | | | First | | | Second | | | Third | | | Fourth | | | | |
| | | | | | | interim | | | interim | | | interim | | | interim1 | | | Total2 | |
| | 2010 | | | US$ | | | 0.080 | | | | 0.080 | | | | 0.080 | | | | 0.120 | | | | 0.360 | |
| | | | | £ | | | 0.053 | | | | 0.051 | | | | 0.051 | | | | 0.077 | | | | 0.232 | |
| | | | | HK$ | | | 0.622 | | | | 0.621 | | | | 0.622 | | | | 0.933 | | | | 2.798 | |
| | | | | | | | | | | | | | | | | | | | | | | | | |
| | 2009 | | | US$ | | | 0.080 | | | | 0.080 | | | | 0.080 | | | | 0.100 | | | | 0.340 | |
| | | | | £ | | | 0.048 | | | | 0.050 | | | | 0.048 | | | | 0.062 | | | | 0.208 | |
| | | | | HK$ | | | 0.620 | | | | 0.620 | | | | 0.620 | | | | 0.775 | | | | 2.635 | |
| | | | | | | | | | | | | | | | | | | | | | | | | |
| | 2008 | | | US$ | | | 0.180 | | | | 0.180 | | | | 0.180 | | | | 0.100 | | | | 0.640 | |
| | | | | £ | | | 0.090 | | | | 0.100 | | | | 0.124 | | | | 0.069 | | | | 0.383 | |
| | | | | HK$ | | | 1.403 | | | | 1.398 | | | | 1.395 | | | | 0.775 | | | | 4.971 | |
| | | | | | | | | | | | | | | | | | | | | | | | | |
| | 2007 | | | US$ | | | 0.170 | | | | 0.170 | | | | 0.170 | | | | 0.390 | | | | 0.900 | |
| | | | | £ | | | 0.085 | | | | 0.084 | | | | 0.086 | | | | 0.194 | | | | 0.449 | |
| | | | | HK$ | | | 1.328 | | | | 1.322 | | | | 1.325 | | | | 3.041 | | | | 7.016 | |
| | | | | | | | | | | | | | | | | | | | | | | | | |
| | 2006 | | | US$ | | | 0.150 | | | | 0.150 | | | | 0.150 | | | | 0.360 | | | | 0.810 | |
| | | | | £ | | | 0.082 | | | | 0.079 | | | | 0.078 | | | | 0.183 | | | | 0.422 | |
| | | | | HK$ | | | 1.164 | | | | 1.167 | | | | 1.168 | | | | 2.799 | | | | 6.298 | |
| | |
| 1 | | The fourth interim dividend for 2010 of US$0.12 per share has been translated into pounds sterling and Hong Kong dollars at the closing rate on 31 December 2010. The dividend will be paid on 5 May 2011. |
| |
| 2 | | The above dividends declared are accounted for as disclosed in Note 11 on the Financial Statements. |
American Depositary Shares
A holder of HSBC Holdings’ American Depositary Shares (‘ADS’s) may have to pay, either directly or indirectly (via the intermediary through whom their ADSs are held) fees to the Bank of New York Mellon as depositary. Fees may be paid or recovered
in several ways: by deduction from amounts distributed; by selling a portion of the distributable property; by annual charge deducted from dividend distributions, by directly invoicing the holder, or by charging the intermediaries who act for them. The fees for which the holders of the HSBC ADSs will be responsible include:
378(a)
Shareholder Information(continued)
| | | |
| For: | | HSBC ADS holders must pay: |
| | | |
| Each issuance of HSBC ADSs, including as a result of a distribution of shares (through stock dividend or stock split or rights or other property) | | US$5.00 (or less) per 100 HSBC ADSs or portion thereof |
| | | |
| Each cancellation of HSBC ADSs, including if the deposit agreement terminates | | US$5.00 (or less) per 100 HSBC ADSs or portion thereof |
| | | |
| Transfer and registration of shares on our share register from the holder’s name to the name of The Bank of New York Mellon or its agent when the holder deposits or withdraws shares | | Registration or transfer fees (of which there currently are none) |
| | | |
| Conversion of non-US currency to US dollars | | Charges and expenses incurred by The Bank of New York Mellon with respect to the conversion |
| | | |
| Each cash distribution to HSBC ADS holders | | US$0.02 or less per ADS |
| | | |
| Cable, telex and facsimile transmission expenses | | As provided in the Deposit Agreement |
| | | |
| Transfers or issues of HSBC ordinary shares to the depositary in exchange for HSBC ADSs | | Subject to the exceptions described in the ‘Stamp duty and stamp duty reserve tax’ paragraphs in the Shareholder Information section on page 481, stamp duty or stamp duty reserve tax equal to 1.5% (rounded up, in the case of stamp duty, to the nearest £5) of the amount of the consideration given for the transfer, or the value of the shares if there is no such consideration, or their issue price |
| | | |
| Distribution of securities to holders of deposited securities which are distributed by the depositary to ADS holders | | A fee equivalent to the fee that would be payable if securities distributed to you had been shares and the shares had been deposited for issuance of ADSs |
| | | |
Any charges incurred by the depositary or its agents for
servicing the deposited securities | | As applicable |
The depositary may generally refuse to provide fee-attracting services until its fees for those services are paid.
The depositary has agreed to reimburse us for expenses incurred in the administration and maintenance of our ADS programme. There are limits on the amount of expenses for which the
depositary will reimburse us. The amount of reimbursement available is not tied to the amount of fees the depositary collects from holders of ADSs. In respect of the year ended 31 December 2010, the depositary reimbursed a total of US$333,888 to us relating to the administration of the programme, as detailed below:
| | | | | |
| | | 2010 | |
| Category of expense | | US$ | |
| | | | | |
| Stock exchange listing fees | | | 126,320 | |
| | | | | |
| Fulfilment costs | | | 207,568 | |
| | | |
| – shareholder meeting costs (printing and distribution of materials and vote tabulation) | | | 22,367 | |
| – beneficial holder searches | | | 177,887 | |
| – sundry costs including: postage and envelopes for mailing annual and interim financial reports, dividend warrants, electronic filing of US Federal tax information, mailing required tax forms, stationery, postage, facsimile and telephone calls | | | 7,314 | |
| | | |
HSBC Holdings ordinary shares are listed or admitted to trading on the London Stock Exchange, the Hong Kong Stock Exchange (‘HKSE’), Euronext Paris, the New York Stock Exchange (‘NYSE’) and the Bermuda Stock Exchange. HSBC Holdings maintains its principal share register in England and overseas branch share registers in Hong Kong and Bermuda (collectively, the ‘share register’).
As at 31 December 2010, there were a total of 221,733 holders of record of HSBC Holdings ordinary shares on the share register.
As at 31 December 2010, a total of 18,643,685 of the HSBC Holdings ordinary shares were
registered in the HSBC Holdings’ share register in the name of 14,248 holders of record with addresses in the US. These shares represented 0.11% of the total HSBC Holdings ordinary shares in issue.
As at 31 December 2010, there were 9,116 holders of record of ADSs holding approximately 146.5m ADSs, representing approximately 732.5m HSBC Holdings ordinary shares. 8,927 of these holders had addresses in the US, holding approximately 146.5m ADSs, representing 732.5m HSBC Holdings ordinary shares. As at 31 December 2010, approximately 4.14% of the HSBC Holdings ordinary shares were represented by ADSs held by holders of record with addresses in the US.
378(b)
Shareholder Information(continued)
The following table shows, for the years, calendar quarters and months indicated, the highest and lowest prices for the HSBC Holdings ordinary shares and ADSs. These are based on mid-market prices at close of business on the London Stock
Exchange, HKSE, Euronext Paris, NYSE and the Bermuda Stock Exchange, as adjusted for the 5-for-12 rights issue completed in April 2009.
Past share price performance should not be regarded as a guide to future performance.
High and low mid-market closing prices
| | | | | | | | | | | | | | | | | | | | | | | | | | | | | | | | | | | | | | | | | |
| | | London | | | Hong Kong | | | New York | | | Paris | | | Bermuda | |
| | | US$0.50 shares | | | US$0.50 shares | | | ADSs1 | | | US$0.50 shares | | | US$0.50 shares | |
| | | High | | | Low | | | High | | | Low | | | High | | | Low | | | High | | | Low | | | High | | | Low | |
| | | pence | | | pence | | | HK$ | | | HK$ | | | US$ | | | US$ | | | euro | | | euro | | | US$ | | | US$ | |
| | | | | | | | | | | | | | | | | | | | | | | | | | | | | | | | | | | | | | | | | |
2010 | | | 740 | | | | 596 | | | | 92.4 | | | | 69.6 | | | | 59.3 | | | | 44.4 | | | | 8.3 | | | | 7.2 | | | | 11.6 | | | | 8.8 | |
| 2009 | | | 761 | | | | 304 | | | | 98.0 | | | | 30.6 | | | | 64.0 | | | | 22.0 | | | | 8.6 | | | | 3.3 | | | | 12.5 | | | | 4.6 | |
| 2008 | | | 809 | | | | 534 | | | | 125.4 | | | | 67.4 | | | | 79.5 | | | | 41.3 | | | | 10.3 | | | | 5.5 | | | | 15.9 | | | | 8.0 | |
| 2007 | | | 840 | | | | 700 | | | | 140.6 | | | | 119.2 | | | | 90.3 | | | | 74.8 | | | | 12.4 | | | | 9.7 | | | | 17.6 | | | | 14.8 | |
| 2006 | | | 896 | | | | 796 | | | | 139.1 | | | | 114.5 | | | | 89.3 | | | | 73.0 | | | | 13.2 | | | | 11.5 | | | | 17.6 | | | | 14.7 | |
| | | | | | | | | | | | | | | | | | | | | | | | | | | | | | | | | | | | | | | | | |
2010 | | | | | | | | | | | | | | | | | | | | | | | | | | | | | | | | | | | | | | | | |
4th Quarter | | | 695 | | | | 644 | | | | 88.2 | | | | 79.0 | | | | 56.9 | | | | 50.6 | | | | 8.1 | | | | 7.4 | | | | 11.0 | | | | 9.7 | |
3rd Quarter | | | 680 | | | | 596 | | | | 82.7 | | | | 71.2 | | | | 53.7 | | | | 45.7 | | | | 8.2 | | | | 7.2 | | | | 10.6 | | | | 8.9 | |
2nd Quarter | | | 713 | | | | 615 | | | | 84.6 | | | | 69.6 | | | | 55.0 | | | | 44.4 | | | | 8.1 | | | | 7.2 | | | | 10.7 | | | | 8.8 | |
1st Quarter | | | 740 | | | | 648 | | | | 92.4 | | | | 78.4 | | | | 59.3 | | | | 50.3 | | | | 8.3 | | | | 7.4 | | | | 11.6 | | | | 10.2 | |
| | | | | | | | | | | | | | | | | | | | | | | | | | | | | | | | | | | | | | | | | |
| 2009 | | | | | | | | | | | | | | | | | | | | | | | | | | | | | | | | | | | | | | | | |
4th Quarter | | | 761 | | | | 668 | | | | 98.0 | | | | 85.3 | | | | 64.0 | | | | 54.9 | | | | 8.6 | | | | 7.5 | | | | 12.5 | | | | 11.0 | |
3rd Quarter | | | 730 | | | | 493 | | | | 91.8 | | | | 61.4 | | | | 59.5 | | | | 39.9 | | | | 8.1 | | | | 5.7 | | | | 11.6 | | | | 8.2 | |
2nd Quarter | | | 578 | | | | 411 | | | | 70.8 | | | | 42.9 | | | | 45.5 | | | | 29.5 | | | | 6.6 | | | | 4.4 | | | | 9.2 | | | | 6.9 | |
1st Quarter | | | 594 | | | | 304 | | | | 71.8 | | | | 30.6 | | | | 45.0 | | | | 22.0 | | | | 6.3 | | | | 3.3 | | | | 8.6 | | | | 4.6 | |
| | | | | | | | | | | | | | | | | | | | | | | | | | | | | | | | | | | | | | | | | |
2011 | | | | | | | | | | | | | | | | | | | | | | | | | | | | | | | | | | | | | | | | |
| January | | | 715 | | | | 651 | | | | 88.0 | | | | 80.1 | | | | 56.6 | | | | 51.6 | | | | 8.6 | | | | 7.7 | | | | 11.5 | | | | 9.7 | |
| | | | | | | | | | | | | | | | | | | | | | | | | | | | | | | | | | | | | | | | | |
2010 | | | | | | | | | | | | | | | | | | | | | | | | | | | | | | | | | | | | | | | | |
| December | | | 672 | | | | 651 | | | | 82.0 | | | | 79.2 | | | | 52.7 | | | | 50.9 | | | | 8.0 | | | | 7.6 | | | | 10.2 | | | | 9.7 | |
| November | | | 695 | | | | 644 | | | | 88.2 | | | | 79.0 | | | | 56.9 | | | | 50.6 | | | | 8.1 | | | | 7.5 | | | | 11.0 | | | | 10.4 | |
| October | | | 671 | | | | 649 | | | | 84.0 | | | | 79.7 | | | | 53.1 | | | | 51.7 | | | | 7.7 | | | | 7.4 | | | | 10.6 | | | | 10.1 | |
| September | | | 680 | | | | 645 | | | | 82.6 | | | | 76.5 | | | | 53.1 | | | | 50.1 | | | | 8.2 | | | | 7.5 | | | | 10.6 | | | | 9.7 | |
| August | | | 680 | | | | 630 | | | | 82.7 | | | | 75.8 | | | | 53.7 | | | | 48.6 | | | | 8.2 | | | | 7.6 | | | | 10.6 | | | | 9.7 | |
| July | | | 666 | | | | 596 | | | | 80.9 | | | | 71.2 | | | | 51.6 | | | | 45.7 | | | | 7.9 | | | | 7.2 | | | | 10.6 | | | | 8.9 | |
| | |
| 1 | | In New York each ADS represents 5 underlying ordinary shares. |
Memorandum and Articles of Association
The disclosure under the caption ‘Memorandum and Articles of Association’ contained on Form 20-F for the years ended 31 December 2000 and 2001 is incorporated by reference herein, together with the disclosure below.
Subject to the provisions of the Companies Act 2006 and provided that the Articles are complied with, a Director, notwithstanding his office:
| • | | may enter into or otherwise be interested in any contract, arrangement, transaction or proposal with HSBC Holdings or in which HSBC Holdings is otherwise interested; |
| |
| • | | may hold any other office or place of profit under HSBC Holdings (except that of auditor or auditor of a subsidiary of HSBC Holdings) in |
| | | conjunction with the office of Director and may act by himself or through his firm in a professional capacity for HSBC Holdings, and in any such case on such terms as to remuneration and otherwise as the Board may arrange; |
| |
| • | | may be a director or other officer, or employed by, or a party to any transaction or arrangement with or otherwise interested in, any company promoted by HSBC Holdings or in which HSBC Holdings is otherwise interested or as regards which HSBC Holdings has any powers of appointment; and |
| |
| • | | shall not be liable to account to HSBC Holdings for any profit, remuneration or other benefit realised by any such office, employment, contract, arrangement, transaction or proposal or from any interest in any body corporate and no such contract, arrangement, transaction, proposal or interest shall be avoided on the |
378(c)
Shareholder Information(continued)
| | | grounds of any such interest or benefit nor shall the receipt of any such profit, remuneration or any other benefit constitute a breach of his or her duty under the Companies Act 2006 not to accept benefits from third parties. |
Since 1 October 2008, the Board may authorise any matter proposed to it which would, if not so authorised, involve a breach by a Director of his or her duty to avoid conflicts of interest under the Companies Act 2006, including, without limitation, any matter which relates to a situation in which a Director has, or can have, an interest which conflicts, or possibly may conflict, with the interest of HSBC Holdings (including the exploitation of any property, information or opportunity, whether or not HSBC Holdings could take advantage of it, but excluding any situation which cannot reasonably be regarded as likely to give rise to a conflict of interest). Any such authorisation will be effective only if:
| • | | any requirement as to quorum at the meeting at which the matter is considered is met without counting the Director in question or any other interested Director; and |
| • | | the matter was agreed to without their voting or would have been agreed to if their votes had not been counted. |
The Board may (whether at the time of the giving of the authorisation or subsequently) make any such authorisation subject to any limits or conditions it expressly imposes but such authorisation is otherwise given to the fullest extent permitted. The Board may vary or terminate any such authorisation at any time.
A Director shall be under no duty to HSBC Holdings with respect to any information which he obtains or has obtained otherwise than as a Director of HSBC Holdings and in respect of which he has a duty of confidentiality to another person.
There is no mandatory retirement age for Directors of HSBC Holdings.
History and development of HSBC
| | | |
1865 | | The founding member of the HSBC Group, The Hongkong and Shanghai Banking Corporation, is established in both Hong Kong and Shanghai. |
| | | |
1959 | | The Mercantile Bank of India Limited and The British Bank of the Middle East, now HSBC Bank Middle East Limited, are purchased. |
| | | |
1965 | | A 51% interest (subsequently increased to 62.14%) is acquired in Hang Seng Bank Limited. Hang Seng Bank is the fourth-largest listed bank in Hong Kong by market capitalisation. |
| | | |
1980 | | A 51% interest in Marine Midland Banks, Inc., now HSBC USA, Inc, is acquired (with the remaining interest acquired in 1987). |
| | | |
1981 | | The Hongkong and Shanghai Banking Corporation incorporates its then existing Canadian operations. HSBC Bank Canada subsequently makes numerous acquisitions, expanding rapidly to become the largest foreign-owned bank in Canada. |
| | | |
1987 | | A 14.9% interest in Midland Bank plc, now HSBC Bank plc, one of the UK’s principal clearing banks, is purchased. |
| | | |
1991 | | HSBC Holdings plc is established as the parent company of the HSBC Group. |
| | | |
1992 | | We purchase the remaining interest in Midland Bank plc. |
| | | |
1993 | | As a consequence of the Midland acquisition, our Head Office is transferred from Hong Kong to London in January. |
| | | |
1997 | | We assume selected assets, liabilities and subsidiaries of Banco Bamerindus do Brasil S.A., now HSBC Bank Brazil, following the intervention of the Central Bank of Brazil, and in Argentina completes the acquisition of Grupo Roberts, now part of HSBC Bank Argentina S.A. |
| | | |
1999 | | We acquire Republic New York Corporation, subsequently merged with HSBC USA, Inc., and Safra Republic Holdings S.A. |
| | | |
2000 | | We complete our acquisition of 99.99% of the issued share capital of Crédit Commercial de France S.A., now HSBC France. |
| | | |
2002 | | We acquire 99.59% of Grupo Financiero Bital, S.A. de C.V., the holding company of what is now HSBC Mexico. |
| | | |
2003 | | We acquire Household International, Inc., now HSBC Finance Corporation. |
| | | |
2003 | | We acquire Banco Lloyds TSB S.A.—Banco Múltiplo in Brazil and the country’s leading consumer finance company, Losango Promotora de Vendas Limitada. |
| | | |
2004 | | HSBC Bank USA, Inc. merges with HSBC Bank & Trust (Delaware) N.A. to form HSBC Bank USA, N.A. |
| | | |
2004 | | We completed the acquisition of The Bank of Bermuda Limited. |
| | | |
2004 | | We acquire Marks and Spencer Retail Financial Services Holdings Limited, which trades as Marks and Spencer Money (‘M&S Money’) in the UK. |
| | | |
2004 | | We acquire 19.9% of Bank of Communications, and Hang Seng Bank acquires 15.98% of Industrial Bank. |
378(d)
Shareholder Information(continued)
| | | |
2005 | | We increase our holding in Ping An Insurance to 19.9%, having made its initial investment in 2002. Ping An Insurance is the second-largest life insurer and the third-largest property and casualty insurer in mainland China. |
| | | |
2005 | | HSBC Finance completes the acquisition of Metris Companies Inc., making HSBC the fifth-largest issuer of MasterCard and Visa cards in the USA. |
| | | |
2006 | | We acquire Grupo Banistmo S.A. (‘Banistmo’), the leading banking group in Central America, through a tender offer to acquire 99.98% of the outstanding shares of Banistmo. |
| | | |
2007 | | Our three associates in mainland China, Industrial Bank, Ping An Insurance and Bank of Communications, issue new shares. We do not subscribe and, as a result, our interests in the associates’ equity decrease from 15.98% to 12.78%, from 19.90% to 16.78% and from 19.90% to 18.60%, respectively. Subsequently, we increase our holding in Bank of Communications from 18.60% to 19.01%. |
| | | |
2008 | | We acquire the assets, liabilities and operations of The Chinese Bank in Taiwan. |
| | | |
2008 | | We complete the sale of our seven French regional banks. |
| | | |
2009 | | In May, we complete the acquisition of 88.89% of PT Bank Ekonomi Raharja Tbk in Indonesia. |
Differences in HSBC Holdings/New York Stock Exchange corporate governance practices
Under the NYSE’s corporate governance rules for listed companies and the applicable rules of the SEC, as a NYSE-listed foreign private issuer, HSBC Holdings must disclose any significant ways in which its corporate governance practices differ from those followed by US companies subject to NYSE listing standards. HSBC Holdings believes the following to be the significant differences between its corporate governance practices and NYSE corporate governance rules applicable to US companies.
US companies listed on the NYSE are required to adopt and disclose corporate governance guidelines. The Listing Rules of the FSA require each listed company incorporated in the UK to include in itsAnnual Report and Accountsa statement of how it has applied the principles of the Combined Code and a statement as to whether or not it has complied with the code provisions of the Combined Code throughout the accounting period covered by theAnnual Report and Accounts. A company that has not complied with the Code provisions, or complied with only some of the Code provisions or (in the case of provisions whose requirements are of a continuing nature) complied for only part of an accounting period covered by the report, must specify the Code provisions with which it has not complied, and (where relevant) for what
part of the reporting period such non-compliance continued, and give reasons for any non-compliance. As stated above, HSBC Holdings complied throughout 2010 with the applicable code provisions of the Combined Code. The Combined Code does not require HSBC Holdings to disclose the full range of corporate governance guidelines with which it complies.
Under NYSE standards, companies are required to have a nominating/corporate governance committee, composed entirely of independent directors. In addition to identifying individuals qualified to become Board members, this committee must develop and recommend to the Board a set of corporate governance principles. Our Nomination Committee complies with the Combined Code, which requires a majority of members to be independent. The majority of members of the Committee during 2010 were independent non-executive Directors. Lord Green succeeded Sir Brian Williamson as chairman of the Nomination Committee on 26 February 2010 and served until his retirement on 3 December 2010 when he was succeeded by D J Flint, upon his appointment as Group Chairman. The Committee’s terms of reference do not require the Committee to develop and recommend corporate governance principles for HSBC Holdings. As stated above, HSBC Holdings is subject to the corporate governance principles of the Combined Code.
Pursuant to NYSE listing standards, non-management directors must meet on a regular basis without management present and independent directors must meet separately at least once per year.
During 2010, the HSBC Holdings’ non- executive Directors and the Group Chairman met three times without the other executive Directors and the non-executive Directors and Group Chairman and Group Chief Executive met once without the other executive Directors. HSBC Holdings’ practice, in this regard, complies with the Combined Code.
In accordance with the requirements of the Combined Code, HSBC Holdings discloses in its annual report how the Board, its committees and the Directors are evaluated (on page 194) and provides extensive information regarding Directors’ compensation in the Directors’ Remuneration Report (on pages 220 to 233). The terms of reference of HSBC Holdings’ Audit, Nomination, Remuneration and Risk Committees are available at www.hsbc.com/boardcommittees.
NYSE listing standards require US companies to adopt a code of business conduct and ethics for directors, officers and employees, and promptly
378(e)
Shareholder Information(continued)
disclose any waivers of the code for directors or executive officers. In December 2009, the Board endorsed three Group Values statements underpinned by the continued use of our Business Principles, in replacement of the Group Business Principles and Values. In addition to the Group Values statements and Business Principles (and previously the Group Business Principles and Values), which apply to the employees of all our companies, pursuant to the requirements of the Sarbanes-Oxley Act the Board of HSBC Holdings has adopted a Code of Ethics applicable to the Group Chairman and the Group Chief Executive, as the principal executive officers, and to the Group Finance Director and Group Chief Accounting Officer. HSBC Holdings’ Code of Ethics is available on www.hsbc.com/codeofethics or from the Group Company Secretary at 8 Canada Square, London E14 5HQ. If the Board amends or waives the provisions of the Code of Ethics, details of the amendment or waiver will appear at the same website address. During 2010, HSBC Holdings made no amendments to its Code of Ethics and granted no waivers from its provisions. The references to the standards to be followed by all employees reflect the Board’s endorsement of Group Values statements underpinned by the continued use of our Business Principles. The Group Values statements and Business Principles are available on www.hsbc.com/groupvalues.
Under NYSE listing rules applicable to US companies, independent directors must comprise a majority of the Board of directors. Currently, two thirds of HSBC Holdings’ Directors are independent.
Under the Combined Code the HSBC Holdings Board determines whether a Director is independent in character and judgement and whether there are relationships or circumstances which are likely to affect, or could appear to affect, the Director’s judgement. Under the NYSE rules a director cannot qualify as independent unless the board affirmatively determines that the director has no material relationship with the listed company; in addition the NYSE rules prescribe a list of circumstances in which a director cannot be independent. The Combined Code requires a company’s board to assess director independence by affirmatively concluding that the director is independent of management and free from any business or other relationship that could materially interfere with the exercise of independent judgement. Lastly, a chief executive officer of a US company listed on the NYSE must annually certify that he or she is not aware of any violation by the company of NYSE corporate governance standards. In accordance with NYSE listing rules applicable to foreign private issuers, HSBC Holdings’ Group Chief Executive is not required to provide the NYSE with this annual compliance certification. However, in accordance with rules applicable to both US companies and foreign private issuers, the Group Chief Executive is required promptly to notify the NYSE in writing after any executive officer becomes aware of any material non-compliance with the NYSE corporate governance standards applicable to HSBC Holdings.
HSBC Holdings is required to submit annual and interim written affirmations of compliance with applicable NYSE corporate governance standards, similar to the affirmations required of NYSE-listed US companies.
378(f)
| | | | | |
| Form 20-F Item Number and Caption | | Location | | Page |
| |
| PART I | | | | |
| | | | | |
| 1. Identity of Directors, Senior Management and | | Not required for Annual Report | | — |
| Advisers | | | | |
| | | | | |
| 2. Offer Statistics and Expected Timetable | | Not required for Annual Report | | — |
| | | | | |
| 3. Key Information | | | | |
| | | | | |
| A. Selected Financial Data | | Consolidated income statement, | | 16, 29, 378(a) |
| | | Consolidated balance sheet, Shareholder | | |
| | | information | | |
| | | | | |
| B. Capitalisation and Indebtedness | | Not required for Annual Report | | — |
| | | | | |
| C. Reasons for the Offer and use of Proceeds | | Not required for Annual Report | | — |
| | | | | |
| D. Risk Factors | | Challenges and Uncertainties | | 88-93 |
| | | | | |
| 4. Information on the Company | | | | |
| | | | | |
| A. History and Development of the Company | | Operating and Financial Review | | 11-85, 392 |
| | | | | |
| | | Shareholder Information | | 371 – 378(f) |
| | | | | |
| B. Business Overview | | Operating and Financial Review | | 11-85(a) |
| | | | | |
| | | Regulation and Supervision | | 85(b) – 85(f) |
| | | | | |
| C. Organisational Structure | | Principal Activities | | 10 |
| | | | | |
| | | Organisational Structure Chart | | 375 |
| | | | | |
| | | Note 26 – Notes on the Financial | | 338-340 |
| | | Statements | | |
| | | | | |
| D. Property, Plants and Equipment | | Property | | 81 |
| | | | | |
| | | Note 25 – Notes on the Financial | | 336-338 |
| | | Statements | | |
| | | | | |
| 4 A. Unresolved Staff Comments | | Not Applicable | | — |
| | | | | |
| 5. Operating and Financial Review and Prospects | | | | |
| | | | | |
| A. Operating Results | | Operating and Financial Review | | 11-85(a) |
| | | | | |
| B. Liquidity and Capital Resources | | Risk | | 140-145, |
| | | | | 168-171, |
| | | | | 177-182 |
| | | | | |
| C. Research and Development, Patents and | | Not Applicable | | — |
| Licences, etc. | | | | |
| | | | | |
| D. Trend Information | | Operating and Financial Review | | 11-85(a) |
| | | | | |
| E. Off-Balance Sheet Arrangements | | Note 41 – Notes on the Financial | | 358-359 |
| | | Statements | | |
| | | | | |
| | | Note 43 – Notes on the Financial | | 361-364 |
| | | Statements | | |
| | | | | |
| F. Contractual Obligations | | Operating and Financial Review | | 31(l) |
| | | | | |
| 6. Directors, Senior Management and Employees | | | | |
| | | | | |
| Form 20-F Item Number and Caption | | Location | | Page |
| |
| A. Directors and Senior Management | | Governance | | 183-188 |
| | | | | |
| B. Compensation | | Directors’ Remuneration Report | | 220-233 |
| | | | | |
| C. Board Practices | | Report of the Directors | | 189-190 |
| | | | | |
| | | Directors’ Remuneration Report | | 228-229 |
| | | | | |
| | | Directors’ Remuneration Report | | 231 |
| | | | | |
| D. Employees | | Governance | | 206-207 |
| | | | | |
| E. Share Ownership | | Governance | | 204-206 |
| | | | | |
| | | Directors’ Remuneration Report | | 232-233 |
| | | | | |
| 7. Major Shareholders and Related Party Transactions | | | | |
| | | | | |
| A. Major Shareholders | | Governance | | 218 |
| | | | | |
| B. Related Party Transactions | | Note 45 - Notes on the Financial | | 368-370 |
| | | Statements | | |
| | | | | |
| C. Interests of Experts and Counsel | | Not required for Annual Report | | — |
| | | | | |
| 8. Financial Information | | | | |
| | | | | |
| A. Consolidated Statements and Other Financial | | Statements | | 237-370 |
| Information Financial | | | | |
| | | | | |
| | | Legal Proceedings | | 82-83 |
| | | | | |
| | | Note 44 – Notes on the Financial | | 365-367 |
| | | Statements | | |
| | | | | |
| | | Shareholder Information | | 371-372 |
| | | | | |
| B. Significant Changes | | Not Applicable | | — |
| | | | | |
| 9. The Offer and Listing | | | | |
| | | | | |
| A. Offer and Listing Details | | Shareholder Information | | 378(b) – 378(c) |
| | | | | |
| B. Plan of Distribution | | Not required for Annual Report | | — |
| | | | | |
| C. Markets | | Shareholder Information | | 378(b) – 378(c) |
| | | | | |
| D. Selling Shareholders | | Not required for Annual Report | | — |
| | | | | |
| E. Dilution | | Not required for Annual Report | | — |
| | | | | |
| F. Expenses of the Issue | | Not required for Annual Report | | — |
| | | | | |
| 10. Additional Information | | | | |
| | | | | |
| A. Share Capital | | Not required for Annual Report | | — |
| | | | | |
| B. Memorandum and Articles of Association | | Shareholder Information | | 378(c)-378(d) |
| | | | | |
| C. Material Contracts | | Not Applicable | | — |
| | | | | |
| D. Exchange Controls | | Exchange controls and other limitations | | 378(a) |
| | | affecting security holders | | |
| | | | | |
| E. Taxation | | Shareholder Information | | 377-378 |
2
| | | | | |
| Form 20-F Item Number and Caption | | Location | | Page |
| |
| F. Dividends and Paying Agents | | Not required for Annual Report | | — |
| | | | | |
| G. Statements by Experts | | Not required for Annual Report | | — |
| | | | | |
| H. Documents on Display | | Shareholder Information | | 374 |
| | | | | |
| I. Subsidiary Information | | Not Applicable | | — |
| | | | | |
| 11. Quantitative and Qualitative Disclosures | | Management of Risk | | 145-154 |
| About Market Risk | | | | |
| | | | | |
| | | Note 20 and 36 – Notes on the Financial | | 322-326, |
| | | Statements | | 351 |
| | | | | |
| 12. Description of Securities Other than Equity Securities | | | | |
| | | | | |
| A. Debt Securities | | Not required for Annual Report | | — |
| | | | | |
| B. Warrants and Rights | | Not required for Annual Report | | — |
| | | | | |
| C. Other Securities | | Not required for Annual Report | | — |
| | | | | |
| D. American Depositary Shares | | Shareholder Information | | 378(a) – 378(b) |
| | | | | |
| PART II | | | | |
| | | | | |
| 13. Defaults, Dividends Arrearages and | | Not Applicable | | — |
| Delinquencies | | | | |
| | | | | |
| 14. Material Modifications to the Rights of | | Not Applicable | | — |
| Securities Holders and Use of Proceeds | | | | |
| | | | | |
| 15. Controls and Procedures | | Report of Independent Registered Public Accounting Firm to the Board of Directors and shareholders of HSBC Holdings plc
Disclosure Controls | | 235-236
80(h) |
| | | | | |
| 16. [Reserved] | | | | |
| | | | | |
| A. Audit Committee Financial Expert | | Report of the Directors | | 195 |
| | | | | |
| B. Code of Ethics | | Report of the Directors | | 378(f) |
| | | | | |
| C. Principal Accountant Fees and Services | | Report of the Directors | | 197 |
| | | | | |
| | | Note 8 – Notes on the Financial | | 285 |
| | | Statements | | |
| | | | | |
| D. Exemptions from the Listing Standards for | | Not Applicable | | — |
| Audit Committees | | | | |
| | | | | |
| E. Purchases of Equity Securities by the Issuer | | Report of the Directors | | 218 |
| and Affiliated Purchasers | | | | |
| | | | | |
| F. Changes in Registrant’s Certifying Accountant | | Not Applicable | | — |
| | | | | |
| G. Corporate Governance | | Shareholder Information | | 378(e) – 378(f) |
| | | | | |
| PART III | | | | |
| | | | | |
| 17. Financial Statements | | Not Applicable | | — |
| | | | | |
| 18. Financial Statements | | Financial Statements | | 238-370 |
| | | | | |
| 19. Exhibits (including Certifications) | | | | * |
3
Shareholder Information(continued)
Glossary of accounting terms and US equivalents
Glossary of accounting terms and US equivalents
| | | |
| Accounting term | | US equivalent or brief description |
| | | |
| Accounts | | Financial Statements |
| Articles of Association | | Bylaws |
| Associates | | Long-term equity investments accounted for using the equity method |
| Attributable profit | | Net income |
| Balance sheet | | Statement of financial position |
| Bills | | Notes |
| Called up share capital | | Ordinary shares, issued and fully paid |
| Capital allowances | | Tax depreciation allowances |
| Creditors | | Payables |
| Debtors | | Receivables |
| Deferred tax | | Deferred income tax |
| Depreciation | | Amortisation |
| Finance lease | | Capital lease |
| Freehold | | Ownership with absolute rights in perpetuity |
Interests in associates and
joint ventures | | Long-term equity investments accounted for using the equity method |
| Loans and advances | | Lendings |
| Loan capital | | Long-term debt |
| Nominal value | | Par value |
| One-off | | Non-recurring |
| Ordinary shares | | Common stock |
| Overdraft | | A line of credit, contractually repayable on demand unless a fixed-term has been
agreed, established through a customer’s current account |
| Preference shares | | Preferred stock |
| Premises | | Real estate |
| Provisions | | Liabilities |
| Share capital | | Ordinary shares or common stock issued and fully paid |
| Shareholders’ equity | | Stockholders’ equity |
| Share premium account | | Additional paid-in capital |
| Shares in issue | | Shares outstanding |
| Write-offs | | Charge-offs |
379
Shareholder Information(continued)
Glossary
| | | |
| Abbreviation | | Brief description |
| | | |
| A | | |
ABS1 | | Asset-backed security |
| ADR | | American Depositary Receipt |
| ADS | | American Depositary Share |
| Advance | | HSBC Advance, a global banking proposition for the mass-affluent segment of customers |
| AIEA | | Average interest-earning assets |
| ALCO | | Asset and Liability Management Committee |
| ARM | | Adjustable-rate mortgage |
| ASF | | Asset and Structured Finance |
| ATM | | Automated teller machine |
| | | |
| B | | |
| Bank of Communications | | Bank of Communications Co., Limited, mainland China’s fourth largest bank by market capitalisation |
| Bank Ekonomi | | PT Bank Ekonomi Raharja Tbk |
| Bao Viet | | BaoViet Holdings, an insurance and financial services company in Vietnam |
| Barion | | Barion Funding Limited, a term funding vehicle |
| Basel Committee | | Basel Committee on Banking Supervision |
| Basel I | | 1988 Basel Capital Accord |
Basel II1 | | 2006 Basel Capital Accord |
Basel III1 | | Basel Committee’s reforms to strengthen global capital and liquidity rules |
| BBA | | British Bankers’ Association |
| Bps | | Basis points. One basis point is equal to one hundredth of a percentage point |
| Brazilian operations | | HSBC Bank Brasil S.A.–Banco Múltiplo and subsidiaries, plus HSBC Serviços e Participações Limitada |
| | | |
| C | | |
| CARD Act | | Credit Card Accountability, Responsibility and Disclosure Act, US |
| CD | | Certificate of deposit |
CDS1 | | Credit default swap |
CDO1 | | Collateralised debt obligation |
| CDPC | | Credit derivative product companies |
| CGU | | Cash-generating unit |
| CMB | | Commercial Banking, a customer group |
CNAV1 | | Constant Net Asset Value |
| Combined Code | | Combined Code on Corporate Governance issued by the Financial Reporting Council |
CP1 | | Commercial paper |
| CPI | | Consumer price index |
CRR1 | | Customer risk rating |
| | | |
| D | | |
| DPF | | Discretionary participation feature of insurance and investment contracts |
| | | |
| E | | |
| EPS | | Earnings per share |
| EU | | European Union |
| | | |
| F | | |
| Fannie Mae | | Federal National Mortgage Association, US |
| Financiera Independencia | | Financiera Independencia S.A.B. de C.V. |
| Freddie Mac | | Federal Home Loan Mortgage Corporation, US |
| FSA | | Financial Services Authority (UK) |
| FTSE | | Financial Times – Stock Exchange index |
| | | |
| G | | |
| G20 | | Leaders, Finance Ministers and Central Bank Governors of the Group of Twenty |
| GAAP | | Generally Accepted Accounting Principles |
| GB&M | | Global Banking and Markets, a global business |
| GDP | | Gross domestic product |
| Ginnie Mae | | Government National Mortgage Association, US |
| Global Markets | | HSBC’s treasury and capital markets services in Global Banking and Markets |
| GMB | | Group Management Board |
| GMO | | Group Management Office |
| GPB | | Global Private Banking |
| Group | | HSBC Holdings together with its subsidiary undertakings |
| G-SIFI | | Global Systemically Important Financial Institution |
380
Shareholder Information(continued)
| | | |
| Abbreviation | | Brief description |
| | | |
| H | | |
| Hang Seng Bank | | Hang Seng Bank Limited, one of Hong Kong’s largest banks |
HELoC1 | | Home equity lines of credit |
| HFC | | HFC Bank Limited, the UK-based consumer finance business acquired through the acquisition by HSBC of HSBC Finance |
| HIBOR | | Hong Kong Interbank Offer Rate |
| HNAH | | HSBC North American Holdings Inc. |
| Hong Kong | | The Hong Kong Special Administrative Region of the People’s Republic of China |
| HSBC | | HSBC Holdings together with its subsidiary undertakings |
| HSBC Assurances | | HSBC Assurances, comprising Erisa S.A., the French life insurer, and Erisa I.A.R.D., the property and casualty insurer (together, formerly Erisa) |
| HSBC Bank | | HSBC Bank plc, formerly Midland Bank plc |
| HSBC Bank Argentina | | HSBC Bank Argentina S.A. |
| HSBC Bank Bermuda | | HSBC Bank Bermuda Limited formerly The Bank of Bermuda Limited |
| HSBC Bank Malaysia | | HSBC Bank Malaysia Berhad |
| HSBC Bank Middle East | | HSBC Bank Middle East Limited, formerly The British Bank of the Middle East |
| HSBC Bank Panama | | HSBC Bank (Panama) S.A., formerly Grupo Banistmo S.A. |
| HSBC Bank USA | | HSBC’s retail bank in the US, HSBC Bank USA, N.A. (formerly HSBC Bank USA, Inc.) |
| HSBC Finance | | HSBC Finance Corporation, the US consumer finance company (formerly Household International, Inc.) |
| HSBC France | | HSBC’s French banking subsidiary, formerly CCF S.A. |
| HSBC Holdings | | HSBC Holdings plc, the parent company of HSBC |
| HSBC Mexico | | HSBC México S.A., the commercial banking subsidiary of Grupo Financiero HSBC, S.A. de C.V. |
| HSBC Premier | | HSBC’s premium global banking service |
| HSBC Private Bank (Suisse) | | HSBC Private Bank (Suisse) S.A., HSBC’s private bank in Switzerland |
| | | |
| I | | |
| IAS | | International Accounting Standard |
| IASB | | International Accounting Standards Board |
| IFRIC | | International Financial Reporting Interpretations Committee |
| IFRSs | | International Financial Reporting Standards |
| Industrial Bank | | Industrial Bank Co. Limited, a national joint-stock bank in mainland China held by Hang Seng Bank |
| IPO | | Initial public offering |
IRB1 | | Internal ratings-based |
| | | |
| K | | |
| | | |
| KPI | | Key performance indicator |
| KPMG | | KPMG Audit Plc and its affiliates |
| | | |
| L | | |
LGD1 | | Loss given default |
| LIBOR | | London Interbank Offer Rate |
| Losango | | Losango Promoções e Vendas Ltda, the Brazilian consumer finance company |
| | | |
| M | | |
| M&S Money | | Marks and Spencer Retail Financial Services Holdings Limited |
| Madoff Securities | | Bernard L Madoff Investment Securities LLC |
| Mainland China | | People’s Republic of China excluding Hong Kong |
| Malachite | | Malachite Funding Limited, a term funding vehicle |
| Mazarin | | Mazarin Funding Limited, an asset-backed CP conduit |
MBS1 | | US mortgage-backed security |
Monoline1 | | Monoline insurance company |
| MSCI | | Morgan Stanley Capital International index |
| | | |
| N | | |
| NYSE | | New York Stock Exchange |
| | | |
| O | | |
| OFAC | | Office of Foreign Asset Control |
OTC1 | | Over-the-counter |
| | | |
| P | | |
PD1 | | Probability of default |
| Performance Shares | | Awards of HSBC Holdings ordinary shares under employee share plans that are subject to corporate performance conditions |
| PFS | | Personal Financial Services, a customer group |
| Ping An Insurance | | Ping An Insurance (Group) Company of China, Limited, the second-largest life insurer in the PRC |
| PPI | | Payment protection insurance product |
| PRC | | People’s Republic of China |
| Premier | | See HSBC Premier |
| PVIF | | Present value of in-force long-term insurance business |
381
Shareholder Information(continued)
| | | |
| Abbreviation | | Brief description |
| | | |
| R | | |
| Repo | | Sale and repurchase transaction |
| Restricted Shares | | Awards of Restricted Shares define the number of HSBC Holdings ordinary shares to which the employee will become entitled, generally between one and three years from the date of the award, and normally subject to the individual remaining in employment |
| Reverse repo | | Security purchased under commitments to sell |
| RPI | | Retail price index (UK) |
| | | |
| S | | |
| S&P | | Standard and Poor’s rating agency |
| SEC | | Securities and Exchange Commission (US) |
| SIC | | Securities investment conduit |
SIV1 | | Structured investment vehicle |
| SME | | Small and medium-sized enterprise |
| Solitaire | | Solitaire Funding Limited, a special purpose entity managed by HSBC |
SPE1 | | Special purpose entity |
| STIP | | Short-term income protection insurance product |
| | | |
| T | | |
| The Hongkong and Shanghai Banking Corporation | | The Hongkong and Shanghai Banking Corporation Limited, the founding member of the HSBC Group |
| TSR | | Total shareholder return |
| | | |
| U | | |
| UAE | | United Arab Emirates |
| UK | | United Kingdom |
| US | | United States of America |
| | | |
| V | | |
VAR1 | | Value at risk |
| Visa | | Visa Inc. |
| | |
| 1 | | Full definition included in Glossary of Terms on page 383. |
382
Shareholder Information(continued)
| | | |
| Term | | Definition |
| | | |
| A | | |
Adjustable-rate mortgages
(‘ARM’s) | | Mortgage loans in the US on which the interest rate is periodically changed based on a reference price. These are included within ‘affordability mortgages’. |
| | | |
| Affordability mortgages | | Mortgage loans where the customer’s monthly payments are set out at a low initial rate, either variable or fixed, before resetting to a higher rate once the introductory period is over. |
| | | |
| Agency exposures | | Exposures to near or quasi-government agencies including public sector entities fully owned by government carrying out non-commercial activities, provincial and local government authorities, development banks and funds set up by government. |
| | | |
| Alt-A | | A US description for loans regarded as lower risk than sub-prime, but with higher risk characteristics than lending under normal criteria. |
| | | |
| Arrears | | Customers are said to be in arrears (or in a state of delinquency) when they are behind in fulfilling their obligations, with the result that an outstanding loan is unpaid or overdue. When a customer is in arrears, the total outstanding loans on which payments are overdue are described as delinquent. |
| | | |
Asset-backed securities
(‘ABS’s) | | Securities that represent an interest in an underlying pool of referenced assets. The referenced pool can comprise any assets which attract a set of associated cash flows but are commonly pools of residential or commercial mortgages. |
| | | |
| B | | |
| Back-testing | | A statistical technique used to monitor and assess the accuracy of a model, and how that model would have performed had it been applied in the past. |
| | | |
| Basel II | | The capital adequacy framework issued by the Basel Committee on Banking Supervision in June 2006 in the form of the ‘International Convergence of Capital Measurement and Capital Standards’. |
| | | |
| Basel III | | In December 2010, the Basel Committee issued final rules ‘Basel III: A global regulatory framework for more resilient banks and banking systems’ and ‘Basel III: International framework for liquidity risk measurement, standards and monitoring’. Together these documents present the Basel Committee’s reforms to strengthen global capital and liquidity rules with the goal of promoting a more resilient banking sector. The new requirements will be phased in starting 1 January 2013 with full implementation by 1 January 2019. |
| | | |
| C | | |
| Capital conservation buffer | | A capital buffer, prescribed by regulators under Basel III, and designed to ensure banks build up capital buffers outside periods of stress which can be drawn down as losses are incurred. Should a bank’s capital levels fall within the capital conservation buffer range, capital distributions will be constrained by the regulators. |
| | | |
| Capital planning buffer | | A capital buffer, prescribed by the FSA under Basel II, and designed to ensure banks build up capital buffers outside periods of stress which can be drawn down as losses are incurred. Should a bank’s capital levels fall within the capital planning buffer range, a period of heightened regulatory interaction would be triggered. |
| | | |
Collateralised debt obligation
(‘CDO’) | | A security issued by a third-party which references ABSs and/or certain other related assets purchased by the issuer. CDOs may feature exposure to sub-prime mortgage assets through the underlying assets. |
| | | |
Collectively assessed
impairment | | Impairment assessment on a collective basis for homogeneous groups of loans that are not considered individually significant and to cover losses which have been incurred but have not yet been identified on loans subject to individual assessment. |
| | | |
| Commercial paper (‘CP’) | | An unsecured, short-term debt instrument issued by a corporation, typically for the financing of accounts receivable, inventories and meeting short-term liabilities. The debt is usually issued at a discount, reflecting prevailing market interest rates. |
| | | |
| Commercial real estate | | Any real estate investment, comprising buildings or land, intended to generate a profit, either from capital gain or rental income. |
| | | |
| Common equity tier 1 capital | | The highest quality form of regulatory capital under Basel III that comprises common shares issued and related share premium, retained earnings and other reserves excluding the cash flow hedging reserve, less specified regulatory adjustments. |
| | | |
| Conduits | | HSBC sponsors and manages multi-seller conduits and securities investment conduits (‘SIC’s). The multi-seller conduits hold interests in diversified pools of third-party assets such as vehicle loans, trade receivables and credit card receivables funded through the issuance of short-dated commercial paper and supported by a liquidity facility. The SICs hold predominantly asset-backed securities referencing such items as commercial and residential mortgages, vehicle loans and credit card receivables funded through the issuance of both long-term and short-term debt. |
| | | |
Constant net asset value fund
(‘CNAV’) | | A fund that prices its assets on an amortised cost basis, subject to the amortised book value of the portfolio remaining within 50 basis points of its market value. |
| | | |
| Contractual maturities | | The date on which the final payment (principal or interest) of any financial instrument is due to be paid, at which point all the remaining outstanding principal and interest have been repaid. |
| | | |
| Core tier 1 capital | | The highest quality form of regulatory capital that comprises total shareholders’ equity and related non-controlling interests, less goodwill and intangible assets and certain other regulatory adjustments. |
| | | |
| Countercyclical capital buffer | | A capital buffer, prescribed by regulators under Basel III, which aims to ensure that capital requirements take account of the macro-financial environment in which banks operate. This will provide the banking sector with additional capital to protect it against potential future losses, when excess credit growth in the financial system as a whole is associated with an increase in system-wide risk. |
383
Shareholder Information(continued)
| | | |
| Term | | Definition |
| | | |
| Credit default swap | | A derivative contract whereby a buyer pays a fee to a seller in return for receiving a payment in the event of a defined credit event (e.g. bankruptcy, payment default on a reference asset or assets, or downgrades by a rating agency) on an underlying obligation (which may or may not be held by the buyer). |
| | | |
Credit derivative product
companies (‘CDPC’s) | | Independent companies that specialise in selling credit default protection on corporate exposures in the form of credit derivatives. |
| | | |
| Credit enhancements | | Facilities used to enhance the creditworthiness of financial obligations and cover losses due to asset default. |
| | | |
| Credit risk | | Risk of financial loss if a customer or counterparty fails to meet an obligation under a contract. It arises mainly from direct lending, trade finance and leasing business, but also from products such as guarantees, derivatives and debt securities. |
| | | |
| Credit risk adjustment | | An adjustment to the valuation of OTC derivative contracts to reflect the creditworthiness of OTC derivative counterparties. |
| | | |
| Credit risk mitigation | | A technique to reduce the credit risk associated with an exposure by application of credit risk mitigants such as collateral, guarantee and credit protection. |
| | | |
| Credit risk spread | | The premium over the benchmark or risk-free rate required by the market to accept a lower credit quality. The yield spread between securities with the same coupon rate and maturity structure but with different associated credit risks. The yield spread rises as the credit rating worsens. |
| | | |
| Customer deposits | | Money deposited by account holders. Such funds are recorded as liabilities. |
| | | |
| Customer risk rating (‘CRR’) | | A scale of 23 grades measuring internal obligor probability of default. |
| | | |
| D | | |
| Debt restructuring | | A restructuring by which the terms and provisions of outstanding debt agreements are changed. This is often done in order to improve cash flow and the ability of the borrower to repay the debt. It can involve altering the repayment schedule as well as debt or interest charge reduction. |
| | | |
| Debt securities | | Assets on the Group’s balance sheet representing certificates of indebtedness of credit institutions, public bodies or other undertakings, excluding those issued by Central Banks. |
| | | |
| Debt securities in issue | | Transferable certificates of indebtedness of the Group to the bearer of the certificates. These are liabilities of the Group and include certificates of deposits. |
| | | |
| Deed-in-lieu | | An arrangement in which a borrower surrenders the deed for a property to the lender without going through foreclosure proceedings and is subsequently released from any further obligations on the loan. |
| | | |
| Delinquency | | See ‘Arrears’. |
| | | |
| E | | |
| Economic capital | | The internally calculated capital requirement which is deemed necessary by HSBC to support the risks to which it is exposed at a confidence level consistent with a target credit rating of AA. |
| | | |
| Economic profit | | The difference between the return on financial capital invested by shareholders and the cost of that capital. Economic profit may be expressed as a whole number or as a percentage. |
| | | |
| Equity risk | | The risk arising from positions, either long or short, in equities or equity-based instruments, which create exposure to a change in the market price of the equities or equity instruments. |
| | | |
| Expected loss (‘EL’) | | A regulatory calculation of the amount expected to be lost on an exposure using a 12 month time horizon and downturn loss estimates. EL is calculated by multiplying the Probability of Default (a percentage) by the Exposure at Default (an amount) and Loss Given Default (a percentage). |
| | | |
| Exposure | | A claim, contingent claim or position which carries a risk of financial loss. |
| | | |
| Exposure at default (‘EAD’) | | The amount expected to be outstanding after any credit risk mitigation, if and when the counterparty defaults. EAD reflects drawn balances as well as allowance for undrawn amounts of commitments and contingent exposures. |
| | | |
| F | | |
| Fair value adjustment | | An adjustment to the fair value of a financial instrument which is determined using a valuation technique (level 2 and level 3) to include additional factors that would be considered by a market participant that are not incorporated within the valuation model. |
| | | |
| First lien | | A security interest granted over an item of property to secure the repayment of a debt that places its holder first in line to collect repayment from the sale of the underlying collateral in the event of a default on the debt. |
| | | |
| Forbearance strategies | | Strategies that are employed in order to improve the management of customer relationships, maximise collection opportunities and, if possible, avoid foreclosure or repossession. Such arrangements include extended payment terms, a reduction in interest or principal repayments, approved external debt management plans, the deferral of foreclosures, other modifications and loan restructures. |
| | | |
| Funded exposures | | A funded exposure is one where the notional amount of a contract is or has been exchanged. |
| | | |
| Funding risk | | A form of liquidity risk arising when the liquidity needed to fund illiquid asset positions cannot be obtained at the expected terms and when required. |
| | | |
| G | | |
Government-sponsored
enterprises (‘GSE’s) | | A group of financial services enterprises created by the US Congress. Their function is to reduce the cost of capital for certain borrowing sectors of the economy, and to make them more efficient and transparent. Examples in the residential mortgage borrowing segment are Freddie Mac and Fannie Mae. GSEs carry the implicit backing, but are not direct obligations of, the US Government. |
384
Shareholder Information(continued)
| | | |
| Term | | Definition |
| | | |
| H | | |
Historical rating transition
matrices (‘HRTM’) | | HRTMs show the probability of a counterparty with a particular rating moving to a different rating over a defined time horizon. |
| | | |
Home Equity Lines of Credit
(‘HELoC’s) | | A form of revolving credit facility provided to US customers, which is supported by a first or second lien charge over residential property. |
| | | |
| I | | |
| Impaired loans | | Loans where the Group does not expect to collect all the contractual cash flows or expects to collect them later than they are contractually due. |
| | | |
| Impairment allowances | | Management’s best estimate of losses incurred in the loan portfolios at the balance sheet date. |
| | | |
Individually assessed
impairment | | Exposure to loss is assessed on all individually significant accounts and all other accounts that do not qualify for collective assessment. |
| | | |
| Insurance risk | | A risk, other than a financial risk, transferred from the holder of a contract to the insurance provider. The principal insurance risk is that, over time, the combined cost of claims, administration and acquisition of the contract may exceed the aggregate amount of premiums received and investment income. |
| | | |
Internal Capital Adequacy
Assessment Process | | The Group’s own assessment of the levels of capital that it needs to hold through an examination of its risk profile from regulatory and economic capital viewpoints. |
| | | |
| Internal Model Method (‘IMM’) | | One of three approaches defined by Basel II to determine exposure values for counterparty credit risk. |
| | | |
Internal ratings-based approach
(‘IRB’) | | A method of calculating credit risk capital requirements using internal, rather than supervisory, estimates of risk parameters. |
| | | |
| Invested capital | | Equity capital invested in HSBC by its shareholders. |
| | | |
| IRB advanced approach | | A method of calculating credit risk capital requirements using internal PD, LGD and EAD models. |
| | | |
| IRB foundation approach | | A method of calculating credit risk capital requirements using internal PD models but with supervisory estimates of LGD and conversion factors for the calculation of EAD. |
| | | |
| ISDA | | International Swaps and Derivatives Association. |
| | | |
| ISDA Master agreement | | Standardised contract developed by ISDA used as an umbrella under which bilateral derivatives contracts are entered into. |
| | | |
| K | | |
| Key management personnel | | Directors and Group Managing Directors of HSBC Holdings. |
| | | |
| L | | |
| Level 1 - quoted market price | | Financial instruments with quoted prices for identical instruments in active markets. |
| | | |
Level 2 - valuation technique
using observable inputs | | Financial instruments with quoted prices for similar instruments in active markets or quoted prices for identical or similar instruments in inactive markets and financial instruments valued using models where all significant inputs are observable. |
| | | |
Level 3 - valuation technique
with significant unobservable
inputs | | Financial instruments valued using valuation techniques where one or more significant inputs are unobservable. |
| | | |
| Leveraged finance | | Funding provided for entities with higher than average indebtedness, which typically arises from sub-investment grade acquisitions or event-driven financing. |
| | | |
| Leverage ratio | | A measure, prescribed by regulators under Basel III, which is the ratio of tier 1 capital to total exposures. Total exposures include on-balance sheet items, off-balance sheet items and derivatives, and should generally follow the accounting measure of exposure. This supplementary measure to the risk-based capital requirements is intended to constrain the build-up of excess leverage in the banking sector. |
| | | |
| Liquidity risk | | The risk that HSBC does not have sufficient financial resources to meet its obligations as they fall due, or will have to do so at an excessive cost. This risk arises from mismatches in the timing of cash flows. |
| | | |
| Loan modification | | An account management action that results in a change to the original terms and conditions of a loan either temporarily or permanently without resetting its delinquency status, except in case of a ‘modification re-age’ where delinquency status is also reset to up-to-date. Account modifications may include revisions to one or more terms of the loan including, but not limited to, a change in interest rate, extension of the amortisation period, reduction in payment amount and partial forgiveness or deferment of principal. |
| | | |
| Loan re-age | | An account management action that results in the resetting of the contractual delinquency status of an account to up-to-date upon fulfilment of certain requirements which indicate that payments are expected to be made in accordance with the contractual terms. |
| | | |
| Loans past due | | Loans on which repayments are overdue. |
| | | |
| Loan-to-value ratio (‘LTV’) | | A mathematical calculation that expresses the amount of the loan as a percentage of the value of security. A high LTV indicates that there is less cushion to protect the lender against house price falls or increases in the loan if repayments are not made and interest is added to the outstanding loan balance. |
| | | |
| Loss given default (‘LGD’) | | The estimated ratio (percentage) of the loss on an exposure to the amount outstanding at default (EAD) upon default of a counterparty. |
| | | |
| Loss severity | | The realised amount of losses incurred (including ancillary amounts owed) when a loan is foreclosed or disposed of through the arrangement with the borrower. The loss severity is represented as a percentage of the outstanding loan balance. |
385
Shareholder Information(continued)
| | | |
| Term | | Definition |
| | | |
| M | | |
| Market risk | | The risk that movements in market risk factors, including foreign exchange rates and commodity prices, interest rates, credit spreads and equity prices will reduce income or portfolio values. |
| | | |
Medium term notes
(‘MTN’s) | | Notes issued by corporates across a range of maturities. MTNs are frequently issued by corporates under MTN Programmes whereby notes are offered on a regular and continuous basis to investors. |
| | | |
Monoline insurers
(‘monolines’) | | Entities which specialise in providing credit protection to the holders of debt instruments in the event of default by the debt security counterparty. This protection is typically held in the form of derivatives such as CDS’s referencing the underlying exposures held. |
| | | |
Mortgage-backed securities
(‘MBS’s) | | Securities that represent interests in groups of mortgages, which may be on residential or commercial properties. Investors in these securities have the right to cash received from future mortgage payments (interest and/or principal). When the MBS references mortgages with different risk profiles, the MBS is classified according to the highest risk class. |
| | | |
| Mortgage-related assets | | Assets which are referenced to underlying mortgages. |
| | | |
| Mortgage vintage | | The year a mortgage was originated. |
| | | |
| N | | |
| Negative equity mortgages | | Equity is the value of the asset less the outstanding balance on the loan. Negative equity arises when the value of the property purchased is below the balance outstanding on the loan. |
| | | |
| Net asset value per share | | Total shareholders’ equity, less non-cumulative preference shares and capital securities, divided by the number of ordinary shares in issue. |
| | | |
| Net interest income | | The amount of interest received or receivable on assets net of interest paid or payable on liabilities. |
| | | |
| Net principal exposure | | The gross principal amount of a financial asset after taking account of credit protection purchased but excluding the effect of any counterparty credit valuation adjustment to that protection. It includes assets that benefit from monoline protection, except where this protection is purchased with a CDS. |
| | | |
| Non-conforming mortgages | | US mortgages that do not meet normal lending criteria. Examples include mortgages where the expected level of documentation is not provided (such as with income self-certification), or where poor credit history increases the risk and results in pricing at a higher than normal lending rate. |
| | | |
| O | | |
Overnight Index Swap
(‘OIS’) discounting | | A method of valuing collateralised interest rate derivatives which uses a discount curve that reflects the overnight interest rate typically earned or paid in respect of collateral received. |
| | | |
| Operational risk | | The risk of loss resulting from inadequate or failed internal processes, people and systems or from external events, including legal risk. |
| | | |
| Over-the-counter (‘OTC’) | | A bilateral transaction (e.g. derivatives) that is not exchange traded and that is valued using valuation models. |
| | | |
| P | | |
| Performance Shares | | Awards of HSBC Holdings ordinary shares under employee share plans that are subject to the achievement of corporate performance conditions. |
| | | |
| Prime | | A US description for mortgages granted to the most creditworthy category of borrowers. |
| | | |
| Private equity investments | | Equity securities in operating companies not quoted on a public exchange, often involving the investment of capital in private companies or the acquisition of a public company that results in its delisting. |
| | | |
| Probability of default (‘PD’) | | The probability that an obligor will default within a one-year time horizon. |
| | | |
| R | | |
| Regulatory capital | | The capital which HSBC holds, determined in accordance with rules established by the FSA for the consolidated Group and by local regulators for individual Group companies. |
| | | |
| Renegotiated loans | | Loans whose terms have been renegotiated and are treated as up-to-date loans for measurement purposes once the specified number and/or amount of qualifying payments required under the new arrangements have been received. |
| | | |
| Restricted Shares | | Awards of HSBC Holdings ordinary shares to which employees will normally become entitled, generally between one and three years, subject to remaining an employee. |
| | | |
| Retail loans | | Money lent to individuals rather than institutions. This includes both secured and unsecured loans such as mortgages and credit card balances. |
| | | |
| Return on equity | | Profit attributable to ordinary shareholders divided by average invested capital. |
| | | |
| Risk appetite | | An assessment of the types and quantum of risks to which HSBC wishes to be exposed. |
| | | |
Risk-weighted assets
(‘RWA’s) | | Calculated by assigning a degree of risk expressed as a percentage (risk weight) to an exposure in accordance with the applicable Standardised or IRB approach rules. |
| | | |
| S | | |
| Seasoning | | The emergence of credit loss patterns in portfolios over time. |
| | | |
| Second lien | | A security interest granted over an item of property to secure the repayment of a debt that is issued against the same collateral as a first lien but that is subordinate to it. In the case of default, repayment for this debt will only be received after the first lien has been repaid. |
386
Shareholder Information(continued)
| | | |
| Term | | Definition |
| | | |
| Securitisation | | A transaction or scheme whereby the credit risk associated with an exposure, or pool of exposures, is tranched and where payments to investors in the transaction or scheme are dependent upon the performance of the exposure or pool of exposures. A traditional securitisation involves the transfer of the exposures being securitised to an SPE which issues securities. In a synthetic securitisation, the tranching is achieved by the use of credit derivatives and the exposures are not removed from the balance sheet of the originator. |
| | | |
| Short sale | | In relation to credit risk management, a ‘short sale’ is an arrangement in which a bank permits the borrower to sell the property for less than the amount outstanding under a loan agreement. The proceeds are used to reduce the outstanding loan balance and the borrower is subsequently released from any further obligations on the loan. |
| | | |
| Single-issuer liquidity facility | | A liquidity or stand-by line provided to a corporate customer which is different from a similar line provided to a conduit funding vehicle. |
| | | |
| Sovereign exposures | | Exposures to governments, ministries, departments of governments, embassies, consulates and exposures on account of cash balances and deposits with central banks. |
| | | |
Special purpose entities
(‘SPE’s) | | A corporation, trust or other non-bank entity, established for a narrowly defined purpose, including for carrying on securitisation activities. The structure of the SPE and its activities are intended to isolate its obligations from those of the originator and the holders of the beneficial interests in the securitisation. |
| | | |
| Standardised approach | | In relation to credit risk, a method for calculating credit risk capital requirements using External Credit Assessment Institutions (‘ECAI’) ratings and supervisory risk weights. In relation to operational risk, a method of calculating the operational capital requirement by the application of a supervisory defined percentage charge to the gross income of eight specified business lines. |
| | | |
| Structured finance / notes | | An instrument whose return is linked to the level of a specified index or the level of a specified asset. The return on a structured note can be linked to equities, interest rates, foreign exchange, commodities or credit. Structured notes may or may not offer full or partial capital protection in the event of a decline in the underlying index or asset. |
| | | |
Structured Investment Vehicles
(‘SIV’s) | | Special purpose entities which invest in diversified portfolios of interest-earning assets, generally funded through issues of commercial paper, medium-term notes and other senior debt to take advantage of the spread differentials between the assets in the SIV and the funding cost. |
| | | |
| Student loan related assets | | Securities with collateral relating to student loans. |
| | | |
| Subordinated liabilities | | Liabilities which rank after the claims of other creditors of the issuer in the event of insolvency or liquidation. |
| | | |
| Sub-prime | | A US description for customers with high credit risk, for example those who have limited credit histories, modest incomes, high debt-to-income ratios, high loan-to-value ratios (for real estate secured products) or have experienced credit problems caused by occasional delinquencies, prior charge-offs, bankruptcy or other credit-related problems. |
| | | |
| T | | |
| Tier 1 capital | | A component of regulatory capital, comprising core tier 1 and other tier 1 capital. Other tier 1 capital includes qualifying capital instruments such as non-cumulative perpetual preference shares and hybrid capital securities. |
| | | |
| Tier 2 capital | | A component of regulatory capital, comprising qualifying subordinated loan capital, related non-controlling interests, allowable collective impairment allowances and unrealised gains arising on the fair valuation of equity instruments held as available-for-sale. Tier 2 capital also includes reserves arising from the revaluation of properties. |
| | | |
| Troubled debt restructuring | | A US description for restructuring a debt whereby the creditor for economic or legal reasons related to a debtor’s financial difficulties grants a concession to the debtor that it would not otherwise consider. |
| | | |
| U | | |
| Unfunded exposures | | An exposure where the notional amount of a contract has not been exchanged. |
| | | |
US Government agency and US
Government sponsored
enterprises mortgage-related
assets | | Securities that are guaranteed by US Government agencies such as the Government National Mortgage Association (‘Ginnie Mae’), or by US Government sponsored entities including the Federal National Mortgage Association (‘Fannie Mae’) and the Federal Home Loan Mortgage Corporation (‘Freddie Mac’); |
| | | |
| V | | |
Value-at-risk
(‘VAR’) | | A measure of the loss that could occur on risk positions as a result of adverse movements in market risk factors (e.g. rates, prices, volatilities) over a specified time horizon and to a given level of confidence. |
| | | |
| W | | |
| Wholesale loans | | Money lent to sovereign borrowers, banks, non-bank financial institutions and corporate entities. |
| | | |
| Write-down | | Reduction in the carrying value of an asset due to impairment or fair value movements. |
| | | |
| Wrong-way risk | | An adverse correlation between the counterparty’s probability of default and the mark-to-market value of the underlying transaction. |
387
Shareholder Information(continued)
|
| Accounting 250 |
| developments (future) 252 |
| policies (critical) 33 |
| policies (significant) 128, 253 |
| Accounts |
| approval 370 |
| basis of preparation 37, 250 |
| Acquisitions and disposals 14, 340 |
| Actuarial assumptions 281 |
| American Depositary Shares 378(a) |
| Annual General Meeting 219, 372 |
| Areas of special interest 103 |
| Asset-backed securities 129, 133 |
| Assets |
| average balance sheet 18 |
| by country 303 |
| by customer group 37 |
| by geographical region 50, 302 |
| charged as security 352 |
| deferred tax 292 |
| held in custody and under administration 81 |
| intangible 332 |
| maturity analysis 350 |
| other 340 |
| trading 307 |
| underlying/reported reconciliation 31 |
| Associates and joint ventures |
| interests in 330 |
| share of profit in 28, 28(h) |
| transactions with 369 |
| Audit committee 195 |
| Auditors’ remuneration 285 |
| Auditors’ Report 235 |
|
| Balance sheet |
| average 18, 31(b) |
| consolidated 29, 240 |
| data 29, 47(d), 48, 54, 58, 64, 69, 74, 79, 302 |
| HSBC Holdings 245 |
| insurance manufacturing subsidiaries 159 |
| underlying/reported reconciliation 31 |
| Bank payroll tax 212 |
| Basel Committee 90, 178, 181 |
| Board of Directors 183, 189 |
| Brand perception 13 |
|
| Calendar (dividends) 371 |
| Capital |
| measurement and allocation 178 |
| regulatory 178 |
| return on invested capital 3 |
| risk 87 |
| structure 180 |
| Capital and performance ratios 2,3 |
| Cash flow |
| accounting policy 270 |
| consolidated statement 241 |
| HSBC Holdings 246 |
| notes 356 |
| projected scenario analysis 142 |
| Cautionary statement regarding forward-looking statements 3(a) |
| Certificates of deposit 31(p) |
| Challenges and uncertainties 88 |
| Client assets 46 |
|
| Collateral and credit enhancements 96, 114 |
| Commercial Banking 42, 303 |
| underlying/reported profit 15, 47(b) |
| Commercial real estate 105 |
| Committees (Board) 194 |
| Communication with shareholders 218, 373 |
| Community investment 213 |
| Compliance risk 88, 155 |
| Concentration of exposure 97 |
| Conduits 131, 362 |
| Constant currency 14 |
Contentsinside front cover |
| Contingent liabilities and contractual commitments 358 |
| Contractual obligations 31(l) |
| Corporate governance |
| codes 194 |
| report 183 |
| Corporate sustainability 212 |
| committee 202 |
| governance 213 |
| risk 173 |
| Cost efficiency ratio 3, 27, 302 |
| Credit coverage ratios 3 |
| Credit exposure 95 |
| Credit quality 93 |
| classifications 114 |
| Credit risk 93 |
| management thereof 93, 312 |
| insurance 165 |
| Critical accounting policies 33 |
| Cross-border exposures 95, 102 |
| Customer accounts |
| underlying/reported reconciliation 31(a) |
| Customer recommendation 13 |
| Customer groups and global businesses 37 |
|
| Daily distribution of revenues 147 |
| Data security 83 |
| Dealings in HSBC Holdings plc shares 218 |
| Debt securities in issue 319, 341 |
| accounting policy 270 |
Defined termsinside front cover |
| Deposits 31(n), 139, 141 |
| accounting policy 270 |
| average balances and average rates 18 |
| other time deposits 31(p) |
| Derivatives 97, 98, 322 |
| accounting policy 261 |
| Directors |
| appointments and re-election 193 |
| biographies 183 |
| Board of directors 189 |
| bonus 225 |
| emoluments 224, 284 |
| fees 230 |
| interests 204 |
| non-executive 229 |
| other directorships 229 |
| pensions 231 |
| remuneration (executive) 223 |
| remuneration (principles) 222 |
| service contracts 228 |
| share plans 232 |
| Disclosure controls 80(h) |
| Dividends 2, 217, 218, 295, 371, 378(a) |
| Donations 213 |
388
Shareholder Information(continued)
|
| Earnings per share 2, 227, 296 |
| Economic background |
| Europe 51, 53(a) |
| Hong Kong 56, 57(a) |
| Latin America 76, 78(a) |
| Middle East 66, 68(a) |
| North America 71, 73(a) |
| Rest of Asia-Pacific 60, 63(a) |
| Economic profit 32, 227 |
| Efficiency and revenue mix ratios 3 |
| Employees 206 |
| compensation and benefits 211, 274 |
| disabled 207 |
| engagement 12 |
| issues 213 |
| numbers 26, 206, 374 |
| remuneration policy 207 |
| Enforceability of judgements 378(a) |
| Enquiries (from shareholders) 373 |
| Environmental management 213 |
| Equity 242 |
| Equity securities 149 |
| Europe |
| balance sheet data 54, 302 |
| economic background 51, 53(a) |
| lending 100 |
| loan impairment charges/allowances 122 |
| loans and advances to customers 100, 101 |
| principal operations 51 |
| profit/(loss) 51, 54, 298 |
| profit/(loss) by country 52 |
| regulation and supervision (UK) 85(b) |
| review of business performance 51, 53(a) |
| underlying/reported profit 15, 80(b) |
| Eurozone exposures 103 |
| Events after the balance sheet date 370 |
| Exchange controls 378(a) |
| Exposures 95, 97, 103, 128 |
|
| Fair value |
| accounting policy 254 |
| governance structure 309 |
| valuation bases 312 |
| Fee income (net) 19, 28(c) |
| Financial assets |
| accounting policy 255, 263 |
| designated at fair value 321 |
| not qualifying for de-recognition 329 |
| reclassification 320 |
| Financial assets and liabilities |
| accounting policy 35, 255, 263 |
| by measurement basis 303 |
| Financial guarantee contracts |
| accounting policy 268 |
| Financial highlights 2 |
| Financial instruments |
| accounting policy (fair value) 34, 259 |
| at fair value 308 |
| credit quality 114, 115 |
| net income from 21, 28(d), 271 |
| not at fair value 318 |
| Financial investments 326 |
| accounting policy 259 |
| gains less losses from 22, 28(e) |
| Financial liabilities designated at fair value 341 |
| Financial risks (insurance) 161 |
| Financial Services Compensation Scheme 359 |
| Financial statements 237 |
| Five-year comparison 16, 29 |
| |
| Footnotes 83, 174, 182, 249 |
| Forbearance 113 |
| Foreclosures 83 |
| Foreign currencies/exchange |
| accounting policy 267 |
| exposures 351 |
| rates 16, 29 |
| Funds under management 81 |
|
| Geographical regions 50 |
| Global Banking and Markets 44 |
| balance sheet data 47(d) |
| underlying/reported profit 15, 47(c) |
| Global Private Banking 46 |
| underlying/reported profit 15, 47(e) |
| Glossary 380 |
| Going concern 204 |
| Goodwill |
| accounting policy 34, 263 |
| and intangible assets 332 |
| Governance codes 183 |
HSBC Holdings/New York Stock Exchange corporate
governance differences 378(e) |
| Group CEO’s Business Review 7 |
| Group Chairman’s Statement 4 |
| Group Management Board 194 |
|
| Health and safety 214 |
| Highlights 1 |
| History and development of HSBC 378(d) |
| Hong Kong |
| balance sheet data 58, 302 |
| economic background 56, 57(a) |
| lending 100 |
| loan impairment charges/allowances 122 |
| principal operations 56 |
| profit/(loss) 56, 58, 298 |
| regulation and supervision 85(c) |
| review of performance 56, 57(a) |
| underlying/reported profit 15, 80(c) |
| HSBC Holdings plc |
| balance sheet 245 |
| cash flow 144, 246 |
| credit risk 128 |
| deferred tax 295 |
| dividends 295 |
| employee compensation 284 |
| financial assets and liabilities 306 |
| liquidity and funding management 144 |
| market risk 152 |
| maturity analysis of assets and liabilities 350 |
| net income from financial instruments 271 |
| share plans 232, 289 |
| statement of changes in equity 247 |
| structural foreign exchange exposures 152 |
| subordinated liabilities 349 |
| transactions with subsidiaries 370 |
|
| Impairment |
| accounting policy 33, 255 |
| allowances 119 |
| assessment 94 |
| charges 24, 28(g), 124 |
| impaired loans and advances 118 |
| losses as percentage of loans and advances 126 |
| methodologies 131 |
| movement by industry and geographical region 121, 122 |
| Income statement (consolidated) 16, 28(a), 238 |
| Information on HSBC (availability thereof) 374 |
389
Shareholder Information(continued)
| |
| Insurance |
| accounting policy 268 |
claims incurred (net) and movements in liabilities to
policyholders 24, 28(f), 272 |
| liabilities under contracts issued 343 |
| net earned premiums 22, 28(e), 272 |
| products 156 |
| PVIF business 170 |
| risk management 155 |
| Interest income/expense (net) 18, 28(c) |
| accounting policy 253 |
| analysis of changes 31(i) |
| average balance sheet 18 |
| sensitivity 149 |
| Interim management statements 373 |
| Internal control 202 |
| management’s assessment 80(h) |
| IFRS and Hong Kong Financial Reporting Standards comparison 250 |
| Investor relations 374 |
|
| Key performance indicators 11 |
|
| Latin America |
| balance sheet data 79, 302 |
| economic background 76, 78(a) |
| lending 100, 101 |
| loan impairment charges/allowances 122 |
| loans and advances to customers 101 |
| principal operations 76 |
| profit/(loss) 76, 79, 298 |
| profit/(loss) by country 77 |
| review of performance 76, 78(a) |
| underlying/reported profit 15, 80(g) |
| Lease commitments 359 |
| accounting policy 265 |
| Legal |
| challenges and uncertainties 88 |
| proceedings, investigations and regulatory 82, 365 |
| risk 154 |
| Leveraged finance transactions 138, 364 |
| Liabilities |
| average balance sheet 18 |
| by geographical region 302 |
| deferred tax 292 |
| maturity analysis 350 |
| other 342 |
| retirement benefit 274 |
| subordinated 346 |
| trading 340 |
| underlying/reported reconciliation 31 |
| Life insurance business 156 |
| Liquidity and funding 140 |
| challenges and uncertainties 88 |
| management of risk 142 |
| insurance 168 |
| policies and procedures 140 |
| primary sources of funding 141 |
| Loans and advances |
| accounting policy 255 |
| collateral 96 |
| concentration of exposure 98 |
| credit quality of 93 |
| delinquency in the US 112 |
| impairment 118–127 |
| maturity and interest sensitivity 31(m) |
| modifications and re-ageing 114 |
| past due 117 |
| renegotiated 113 |
| to banks by geographical region 101 |
| |
| by country 101 |
to customers by industry sector and geographical
region 99, 100 |
| underlying/reported reconciliation 31(a) |
| write-off 94 |
|
| Madoff 82, 365 |
| Market capitalisation 3 |
| Market risk 145 |
| insurance 162 |
| sensitivity analysis 149 |
| Maturity analysis of assets and liabilities 350 |
| Maximum exposure to credit risk 95 |
| Memorandum and Articles of Association 378(c) |
| Middle East |
| balance sheet data 69, 302 |
| economic background 66, 68(a) |
| lending 100 |
| loan impairment charges/allowances 119, 122, 125, 126 |
| loans and advances to customers 101, 105 |
| principal operations 66 |
| profit/(loss) 66, 69, 298 |
| review of performance 66, 68(a) |
| underlying/reported profit 15, 80(e) |
| wholesale lending 105 |
| Money market funds 363 |
| Monoline insurers 137 |
| Mortgages |
| lending 107, 111 |
| mortgage-backed securities 131, 136 |
| representations and warranties 139 |
|
| Nomination committee 201 |
| Non-controlling interests 352 |
| Non-interest income |
| accounting policy 254 |
| Non-life insurance business 156 |
| Non-money market investment funds 364 |
| Non-statutory accounts 370(a) |
| Non-trading portfolios 148 |
| North America |
| balance sheet data 74, 302 |
| economic background 71, 73(a) |
| lending 100, 101 |
| loan delinquency in the US 112 |
| loan impairment charges/allowances 119, 122, 125, 126, 127 |
| loans and advances to customers 101 |
| mortgage lending 108 |
| personal lending 110 |
| principal operations 71 |
| profit/(loss) 71, 74, 298 |
| regulation and supervision (US) 85(c) |
| review of performance 71, 73(a) |
| underlying/reported profit 15, 80(f) |
|
| Operating expenses 26, 28(h) |
| Operating income 23, 28(f), 273, 303 |
| Operational risk 154 |
| challenges and uncertainties 88 |
| Organisational structure chart 375 |
| Other 47, 47(f) |
|
| Payment protection insurance 366 |
| Pensions 274 |
| accounting policy 266 |
| defined benefit plans 151, 274 |
| for directors 231 |
390
Shareholder Information(continued)
| |
| risk 172 |
| Performance and context 220 |
| Personal Financial Services 40 |
| underlying/reported profit 15, 47(a) |
| Personal lending 106 |
| Pillar 1, 2 and 3 178 |
| Principal activities 10 |
| Products and services 38, 156, 297 |
| Profit before tax |
| by country 52, 61, 67, 72 |
| by customer group 37, 48, 54, 58, 64, 69, 74, 79 |
| by geographical region 50, 51, 54, 56, 58, 60, 64, 66, 69, 71, 74, 76, 79 |
| consolidated 16 |
| data 16 |
| underlying/reported reconciliations 14 |
| Project Merlin 211 |
| Property, plant and equipment 81, 336 |
| accounting policy 265 |
| Provisions 346 |
| accounting policy 267 |
| PVIF 170 |
|
| Ratios |
| advances to core funding 142 |
| capital 2, 181 |
| credit coverage 3 |
| cost efficiency 3, 27 |
| dividends per share 2 |
| earnings per share 2 |
| earnings to combined fixed charges 31(l) |
| financial 2 |
| key performance indicators 12 |
| performance 3, 302 |
| Regulation and supervision 85(b) |
| challenges and uncertainties 90 |
| future developments 181 |
| investigations 82, 367 |
| Related party transactions 368 |
| Remuneration |
| committee 201 |
| members 222 |
| policy 207 |
| principles 222 |
| regulation 221 |
| report 220 |
| Renegotiated loans 113 |
| Repricing gap 148 |
| Reputational risk 172 |
| Residual value risk 174 |
| Rest of Asia-Pacific |
| balance sheet data 64, 302 |
| economic background 60, 63(a) |
| lending 100, 101 |
| loan impairment charges/allowances 122 |
| loans and advances to customers 101 |
| principal operations 60 |
| profit/(loss) 60, 61, 64, 298 |
| review of performance 62, 63(a) |
| underlying/reported profit 15, 80(d) |
| Rights issue |
| accounting policy 270 |
| Risk |
| appetite 87 |
| committee 197 |
| compliance 155 |
| contingent liquidity 143 |
| counterparty 90 |
| credit 93, 165 |
| credit spread 148 |
| economic 89 |
| elements in loan portfolio 139(a) |
| |
| gap risk 148 |
| governance 87 |
| insurance operations 155, 157, 159 |
| legal 154 |
| liquidity and funding management 140, 168 |
| management 87, 93 |
| market 89, 145, 162 |
| operational 154 |
| pension 172 |
| political 89 |
| profile 86 |
| rating scales 114 |
| regulation 90 |
| reputational 172 |
| residual value 174 |
| scenario stress testing 88 |
| security and fraud 155 |
| sustainability 173 |
| top and emerging 10, 199 |
| Risk-weighted assets 2, 29, 50, 181 |
|
| Sale and repurchase agreements |
| accounting policy 261 |
| Securities held for trading 97 |
| Securitisations 128, 363 |
| Security and fraud risk 155 |
| Segmental analysis 296 |
| accounting policy 254 |
| Senior management |
| biographies 187 |
| remuneration 212 |
| Share-based payments 286 |
| accounting policy 266 |
| Share capital 29, 214, 353 |
| accounting policy 270 |
| notifiable interests in 218 |
| ownership guidelines 228 |
| rights and obligations 214 |
| Share information 3 |
| Share plans |
| discretionary plans 208 |
| for directors 232 |
| for employees 207 |
| HSBC Bank Bermuda plans 210, 356 |
| HSBC Finance plans 210, 291, 355 |
| HSBC France plans 209, 290, 355 |
| HSBC Invest Direct (India) plans 211 |
| Performance Shares and Restricted Share awards 226, 286, 289 |
| Shareholder (communications with) 217, 373 |
| profile 372 |
| Short-term borrowings 31(l) |
| Special purpose entities 361 |
| Staff numbers 26, 274 |
| Statement of changes in equity 242, 247 |
| Statement of comprehensive income 239 |
| Stock symbols 372 |
| Strategic direction 10, 12, 40, 42, 44, 46 |
| Structural foreign exchange exposure 351 |
| Subsidiaries 338 |
| accounting policy 263 |
| Supplier payment policy 214 |
|
| Taxation |
| accounting policy 36, 265 |
| challenges and uncertainties 88 |
| deferred tax 292 |
| expense 28, 28(i), 291 |
| of shares and dividends 376 |
| Tier 1 capital 2, 180, 181 |
391
Shareholder Information(continued)
| |
| Total shareholder return 3, 227, 228 |
| Trading assets 307 |
| accounting policy 258 |
| Trading income (net) 20, 28(d) |
| Trading liabilities 340 |
| accounting policy 258 |
| Trading market (nature of) 378(b) |
| Trading portfolios 146, 147 |
| Troubled debt restructurings 139(b) |
|
| Underlying performance 14 |
391(a)
Shareholder Information(continued)
HSBC HOLDINGS PLC
Incorporated in England on 1 January 1959 with limited liability under the UK Companies Act
Registered in England: number 617987
REGISTERED OFFICE AND
GROUP MANAGEMENT OFFICE
8 Canada Square
London E14 5HQ
United Kingdom
Telephone: 44 (0) 20 7991 8888
Facsimile: 44 (0) 20 7992 4880
Web: www.hsbc.com
REGISTRARS
Principal Register
Computershare Investor Services PLC
The Pavilions
Bridgwater Road
Bristol BS99 6ZZ
United Kingdom
Telephone: 44 (0) 870 702 0137
United Kingdom
Email: via website
Web: www.investorcentre.co.uk/contactus
Hong Kong Overseas Branch Register
Computershare Hong Kong Investor Services Limited
Rooms 1712-1716, 17th floor
Hopewell Centre
183 Queen’s Road East
Hong Kong
Telephone: 852 2862 8555
Email: hsbc.ecom@computershare.com.hk
Web: www.computershare.com/hk/investors
Bermuda Overseas Branch Register
Corporate Shareholder Services
HSBC Bank Bermuda Limited
6 Front Street
Hamilton HM11
Bermuda
Telephone: 1 441 299 6737
Email: hbbm.shareholder.services@hsbc.bm
Web: www.computershare.com/investor/bm
ADR Depositary
BNY Mellon Shareowner Services
PO Box 358516
Pittsburgh
PA15252 - 8516
USA
Telephone (US): 1 877 283 5786
Telephone (International): 1 201 680 6825
Email: shrrelations@bnymellon.com
Web: www.bnymellon.com/shareowner
Paying Agent (France)
HSBC France
103 avenue des Champs Elysées
75419 Paris Cedex 08
France
Telephone: 33 1 40 70 22 56
Email: ost-agence-des-titres-hsbc-reims.hbfr-
do@hsbc.fr
Web: www.hsbc.fr
STOCKBROKERS
Goldman Sachs International
Peterborough Court
133 Fleet Street
London EC4A 2BB
United Kingdom
HSBC Bank plc
8 Canada Square
London E14 5HQ
United Kingdom
392
Item 19. Exhibits
Documents filed as exhibits to this Form 20-F:
| | | |
| Exhibit | | |
| Number | | Description |
| | | |
| 1.1 | | Memorandum and Articles of Association of HSBC Holdings plc. |
| | | |
| 2.1 | | The total amount of long-term debt securities of HSBC Holdings plc authorized under any instrument does not exceed 10 percent of the total assets of the Group on a consolidated basis. HSBC Holdings plc hereby agrees to furnish to the Commission, upon its request, a copy of any instrument defining the rights of holders of long-term debt of HSBC Holdings plc or of its subsidiaries for which consolidated or unconsolidated financial statements are required to be filed. |
| | | |
| 4.1 | | Service Agreement dated February 14, 2011 between HSBC Holdings plc and Douglas Jardine Flint. |
| | | |
| 4.2 | | Service Agreement dated May 24, 2007 between HSBC Holdings plc and Stephen Keith Green, as amended February 28, 2008. *** |
| | | |
| 4.3 | | Service Agreement dated May 24, 2007 between HSBC Asia Holdings BV and Michael F. Geoghegan, as amended February 1, 2010. * |
| | | |
| 4.4 | | Service Agreement dated February 4, 2011 between HSBC Holdings plc and Iain Mackay. |
| | | |
| 4.5 | | Service Agreement dated August 29, 2008 between The Hong Kong and Shanghai Banking Corporation Limited and Vincent Cheng Hoi Chuen.** |
| | | |
| 4.6 | | Service Agreement dated February 14, 2011 between HSBC Asia Holdings B.V. and Alexander Flockhart. |
| | | |
| 4.7 | | Service Agreement dated February 10, 2011 between HSBC Asia Holdings B.V. and Stuart Gulliver. |
| | | |
| 7.1 | | Computation of ratios of earnings to combined fixed charges (and preference share dividends). |
| | | |
| 8.1 | | Subsidiaries of HSBC Holdings plc (set forth in Note 26 to the consolidated financial statements included in this Form 20-F). |
| | | |
| 12.1 | | Certificate of HSBC Holdings plc’s Group Chief Executive pursuant to Section 302 of the Sarbanes-Oxley Act of 2002. |
| | | |
| 12.2 | | Certificate of HSBC Holdings plc’s Group Finance Director pursuant to Section 302 of the Sarbanes-Oxley Act of 2002. |
| | | |
| 13.1 | | Annual Certification of HSBC Holdings plc’s Group Chief Executive and Group Finance Director pursuant to Section 906 of the Sarbanes-Oxley Act of 2002. |
| | | |
| 14.1 | | Consent of KPMG Audit plc. |
| | | |
| Exhibit | | |
| Number | | Description |
| | | |
| 14.2 | | Pages of HSBC Holdings plc’s 2000 Form 20-F/A dated February 26, 2001 relating to the Memorandum and Articles of Association of HSBC Holdings plc that are incorporated by reference into this Form 20-F. **** |
| | | |
| 14.3 | | Pages of HSBC Holdings plc’s 2001 Form 20-F dated March 13, 2002 relating to the Memorandum and Articles of Association of HSBC Holdings plc that are incorporated by reference into this Form 20-F. *** |
| | | |
| 23.1 | | Consent of Estella Chiu. |
| | | |
| 23.2 | | Consent of Mercer. |
| | | |
| 23.3 | | Consent of Towers Watson. |
| | |
| * | | As previously filed with the Securities and Exchange Commission as an exhibit to HSBC Holdings plc’s Form 20-F dated March 15, 2010. |
| |
| ** | | As previously filed with the Securities and Exchange Commission as an exhibit to HSBC Holdings plc’s Form 20-F dated March 10, 2009. |
| |
| *** | | As previously filed with the Securities and Exchange Commission as an exhibit to HSBC Holdings plc’s Form 20-F dated March 20, 2008. |
| |
| **** | | As previously filed with the Securities and Exchange Commission as an exhibit to HSBC Holdings plc’s Form 20-F dated March 20, 2006. |
SIGNATURES
The registrant hereby certifies that it meets all of the requirements for filing on Form 20-F and that it has duly caused and authorized the undersigned to sign this annual report on its behalf.
| | | | | |
| | HSBC Holdings plc
| |
| | By: | /s/ I J Mackay | |
| | | Name: | Iain J Mackay | |
| | | Title: | Group Finance Director | |
| |
Dated: 8 March 2011