As filed with the Securities and Exchange Commission on March 10, 2009.
SECURITIES AND EXCHANGE COMMISSION
WASHINGTON, D.C. 20549
FORM 20-F
| | |
 | REGISTRATION STATEMENT PURSUANT TO SECTION 12(b) OR 12(g) OF THE SECURITIES EXCHANGE ACT OF 1934 |
| | |
| | or |
| | |
 | ANNUAL REPORT PURSUANT TO SECTION 13 OR 15(d) OF THE SECURITIES EXCHANGE ACT OF 1934 For the fiscal year ended December 31, 2008 |
| | |
| | or |
| | |
| TRANSITION REPORT PURSUANT TO SECTION 13 OR 15(d) OF THE SECURITIES EXCHANGE ACT OF 1934 |
| | |
| | or |
| SHELL COMPANY REPORT PURSUANT TO SECTION 13 OR 15(d) OF THE SECURITIES EXCHANGE ACT OF 1934 |
| | Date of event requiring this shell company report . . . . . . . . . . . . . . . |
For the transition period from N/A to N/A
Commission file number: 1-14930
HSBC Holdings plc
(Exact name of Registrant as specified in its charter)
| N/A | United Kingdom |
| (Translation of Registrant’s name into English) | (Jurisdiction of incorporation or organisation) |
8 Canada Square
London E14 5HQ
United Kingdom
(Address of principal executive offices)
Russell C Picot
8 Canada Square
London E14 5HQ
United Kingdom
Tel +44 (0) 20 7991 8888
Fax +44 (0) 20 7992 4880
(Name, Telephone, Email and/or Facsimile number and Address of Company Contact Person)
Securities registered or to be registered pursuant to Section 12(b) of the Securities Exchange Act of 1934:
| Title of each class | Name of each exchange on which registered |
| | |
| Ordinary Shares, nominal value US$0.50 each. | London Stock Exchange
Hong Kong Stock Exchange
Euronext Paris
Bermuda Stock Exchange
New York Stock Exchange* |
American Depository Shares, each representing 5 Ordinary
Shares of nominal value US$0.50 each. | New York Stock Exchange |
| 6.20% Non-Cumulative Dollar Preference Shares, Series A | New York Stock Exchange* |
| American Depositary Shares, each representing one-fortieth of a Share of 6.20% | |
| Non-Cumulative Dollar Preference Shares, Series A | New York Stock Exchange |
| 5.25% Subordinated Notes 2012 | New York Stock Exchange |
| 6.5% Subordinated Notes 2036 | New York Stock Exchange |
| 6.5% Subordinated Notes 2037 | New York Stock Exchange |
| 6.8% Subordinated Notes Due 2038 | New York Stock Exchange |
8.125% Perpetual Subordinated Capital Securities
Exchangeable at the Issuer’s Option into
Non-Cumulative Dollar Preference Shares | New York Stock Exchange |
| | |
Securities registered or to be registered pursuant to Section 12(g) of the Securities Exchange Act of 1934: None
Securities for which there is a reporting obligation pursuant to Section 15(d) of the Securities Exchange Act of 1934: None
Indicate the number of outstanding shares of each of the issuer’s classes of capital or common stock as of the period covered by the annual report:
| Ordinary Shares, nominal value US$0.50 each | 12,105,265,082 |
Indicate by check mark if the registrant is a well-known seasoned issuer, as defined in Rule 405 of the Securities Act.
| Yes | No |
If this report is an annual or transition report, indicate by check mark if the registrant is not required to file reports pursuant to Section 13 or 15(d) of the Securities Exchange Act of 1934.
| Yes | No. |
Indicate by check mark whether the registrant (1) has filed all reports required to be filed by Section 13 or 15(d) of the Securities Exchange Act of 1934 during the preceding 12 months (or for such shorter period that the registrant was required to file such reports), and (2) has been subject to such filing requirements for the past 90 days.
| Yes | No |
Indicate by check mark whether the registrant is a large accelerated filer, an accelerated filer, or a non-accelerated filer. See definition of “accelerated filer and large accelerated filer” in Rule 12b-2 of the Exchange Act. (Check one):
| Large accelerated filter | Accelerated filter | Non-accelerated filter |
Indicate by check mark which basis of accounting the registrant has used to prepare the financial statements included in this filing:
| U.S. GAAP | International Financial Reporting Standards as issued by the
International Accounting Standards Board | Other |
If “Other” has been checked in response to the previous question indicate by check mark which financial statement item the registrant has elected to follow.
| Item 17 | Item 18 |
If this is an annual report, indicate by check mark whether the registrant is a shell company (as defined in Rule 12b-2 of the Exchange Act).
| Yes | No |
* Not for trading, but only in connection with the registration of American Depositary Shares.
Back to Contents
| H S B C H O L D I N G S P L C |
| |
| Annual Report and Accounts 2008 |
| | |
| | |
| | |
Headquartered in London, HSBC is one of the largest banking and financial services organisations in the world. Its international network comprises some 10,000 properties in 86 countries and territories in Europe; Hong Kong; Rest of Asia-Pacific, including the Middle East and Africa; North America and Latin America.
With listings on the London, Hong Kong, New York, Paris and Bermuda stock exchanges, shares in HSBC Holdings plc are held by over 210,000 shareholders in 120 countries and territories. The shares are traded on the New York Stock Exchange in the form of American Depositary Shares.
HSBC provides a comprehensive range of financial services to more than 100 million customers through four customer groups and global businesses: Personal Financial Services (including consumer finance); Commercial Banking; Global Banking and Markets; and Private Banking.
Certain defined terms
| | | |
| | | |
| Unless the context requires otherwise, ‘HSBC Holdings’ means HSBC Holdings plc and ‘HSBC’ or the ‘Group’ means HSBC Holdings together with its subsidiaries. Within this document the Hong Kong Special Administrative Region of the | | People’s Republic of China is referred to as ‘Hong Kong’. When used in the terms ‘shareholders’ equity’ and ‘total shareholders’ equity’, ‘shareholders’ means holders of HSBC Holdings ordinary shares and those preference shares classified as equity. |
Back to Contents
| H S B C H O L D I N G S P L C |
| |
| Contents |
| | |
| | |
| | |
1
Back to Contents
| H S B C H O L D I N G S P L C |
| |
| Financial Highlights |
| | |
| | |
| Highlights / Ratios |
| For the year |
| | |
| • | Total operating income up by 1 per cent to US$88,571 million (2007: US$87,601 million). |
| | |
| • | Net operating income before loan impairment charges up by 3 per cent to US$81,682 million (2007:US$78,993 million). |
| | |
| • | Group pre-tax profit down by 62 per cent to US$9,307 million (2007: US$24,212 million). |
| | |
| • | Profit attributable to shareholders of the parent company down by 70 per cent to US$5,728 million (2007:US$19,133 million). |
| | |
| • | Return on average shareholders’ equity of 4.7 per cent (2007: 15.9 per cent). |
| | |
| • | Earnings per ordinary share down by 72 per cent to US$0.47 (2007: US$1.65). |
| | |
| At the year-end1 |
| | |
| • | Total equity down by 26 per cent to US$100,229 million (2007: US$135,416 million). |
| | |
| • | Customer accounts and deposits by banks up by 1 per cent to US$1,245,411 million (2007:US$1,228,321 million). |
| | |
| • | Risk-weighted assets up by 2 per cent to US$1,147,974 million (2007: US$1,123,782 million). |
| | |
| Dividends and capital position1 |
| | |
| • | Total dividends declared in respect of 2008 of US$0.64 per share, a decrease of 28.9 per cent over dividends for2007; fourth interim dividend for 2008 of US$0.10 per share, a decrease of 74.4 per cent. |
| | |
| • | Tier 1 ratio of 8.3 per cent and total capital ratio of 11.4 per cent. |
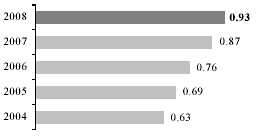
| | Dividends per share2
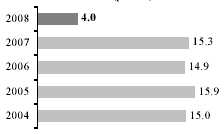
(US dollars) | | Return on average invested capital
(per cent) | |
| |  | |  | |
| | | | | |
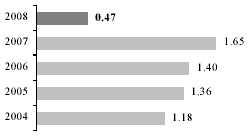
| | Earnings per share
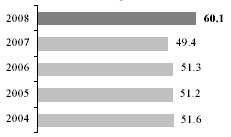
(US dollars) | | Cost efficiency ratio
(per cent) | |
| |  | |  | |
For footnotes, see page 5.
2
Back to Contents
| Capital and performance ratios | | | | |
| | | | | |
| | 2008 | | 2007 | |
| | % | | % | |
| Capital ratios1 | | | | |
| Tier 1 ratio | 8.3 | | 9.3 | |
| Total capital ratio | 11.4 | | 13.6 | |
| | | | | |
| Performance ratios | | | | |
| Return on average invested capital3 | 4.0 | | 15.3 | |
| Return on average total shareholders’ equity4 | 4.7 | | 15.9 | |
| Post-tax return on average total assets | 0.26 | | 0.97 | |
| Post-tax return on average risk-weighted assets | 0.55 | | 1.95 | |
| | | | | |
| Credit coverage ratios | | | | |
| Loan impairment charges as a percentage of total operating income | 27.24 | | 19.61 | |
| Loan impairment charges as a percentage of average gross customer advances | 2.46 | | 1.97 | |
| Total impairment allowances outstanding as a percentage of impaired loans at the year-end | 94.3 | | 98.1 | |
| | | | | |
| Efficiency and revenue mix ratios | | | | |
| Cost efficiency ratio5 | 60.1 | | 49.4 | |
| As a percentage of total operating income: | | | | |
| – net interest income | 48.1 | | 43.1 | |
| – net fee income | 22.6 | | 25.1 | |
| – net trading income | 7.4 | | 11.2 | |
| | | | | |
| Financial ratios | | | | |
| Loans and advances to customers as a percentage of customer accounts | 83.6 | | 89.5 | |
| Average total shareholders’ equity to average total assets | 4.87 | | 5.69 | |
| | | | | |
| Share information at the year-end | | | | |
| | | | | |
| | 2008 | | 2007 | |
| US$0.50 ordinary shares in issue (million) | 12,105 | | 11,829 | |
| Market capitalisation (billion) | US$114 | | US$198 | |
| Closing market price per ordinary share: | | | | |
| – London | £6.62 | | £8.42 | |
| – Hong Kong | HK$73.70 | | HK$131.70 | |
| Closing market price per American Depositary Share7 | US$48.67 | | US$83.71 | |
| | | | | | | |
| | Over 1 year | | Over 3 years | | Over 5 years | |
| HSBC total shareholder return to 31 December 20088 | 84.5 | | 84.5 | | 98.5 | |
| Benchmarks: | | | | | | |
| – FTSE 1009 | 71.7 | | 88.1 | | 118.3 | |
| – MSCI World10 | 81.8 | | 93.6 | | 123.7 | |
| – MSCI Banks11 | 63.0 | | 60.8 | | 82.7 | |
| For footnotes, see page 5. | | | | | | |
3
Back to Contents
| H S B C H O L D I N G S P L C |
| |
| Financial Highlights(continued) |
| | |
| | |
| 5-year comparison |
| Five-year comparison | | | | | | | | | | |
| | 2008 | | 2007 | | 2006 | | 2005 | | 200412 | |
| | US$m | | US$m | | US$m | | US$m | | US$m | |
| For the year | | | | | | | | | | |
| Net interest income | 42,563 | | 37,795 | | 34,486 | | 31,334 | | 31,099 | |
| Other operating income | 46,008 | | 49,806 | | 35,584 | | 30,370 | | 24,889 | |
| Loan impairment charges and other credit risk provisions | (24,937 | ) | (17,242 | ) | (10,573 | ) | (7,801 | ) | (6,191 | ) |
| Total operating expenses | (49,099 | ) | (39,042 | ) | (33,553 | ) | (29,514 | ) | (26,487 | ) |
| Profit before tax | 9,307 | | 24,212 | | 22,086 | | 20,966 | | 18,943 | |
| Profit attributable to shareholders of the parent company | 5,728 | | 19,133 | | 15,789 | | 15,081 | | 12,918 | |
| Dividends2 | 11,301 | | 10,241 | | 8,769 | | 7,750 | | 6,932 | |
| | | | | | | | | | | |
| At the year-end | | | | | | | | | | |
| Called up share capital | 6,053 | | 5,915 | | 5,786 | | 5,667 | | 5,587 | |
| Total shareholders’ equity | 93,591 | | 128,160 | | 108,352 | | 92,432 | | 85,522 | |
| Capital resources1,13 | 131,460 | | 152,640 | | 127,074 | | 105,449 | | 90,780 | |
| Customer accounts | 1,115,327 | | 1,096,140 | | 896,834 | | 739,419 | | 693,072 | |
| Undated subordinated loan capital | 2,843 | | 2,922 | | 3,219 | | 3,474 | | 3,686 | |
| Preferred securities and dated subordinated loan capital14 | 50,307 | | 49,472 | | 42,642 | | 35,856 | | 32,914 | |
| Loans and advances to customers15 | 932,868 | | 981,548 | | 868,133 | | 740,002 | | 672,891 | |
| Total assets | 2,527,465 | | 2,354,266 | | 1,860,758 | | 1,501,970 | | 1,279,974 | |
| | | | | | | | | | | |
| | US$ | | US$ | | US$ | | US$ | | US$ | |
| Per ordinary share | | | | | | | | | | |
| Basic earnings | 0.47 | | 1.65 | | 1.40 | | 1.36 | | 1.18 | |
| Diluted earnings | 0.47 | | 1.63 | | 1.39 | | 1.35 | | 1.17 | |
| Dividends | 0.93 | | 0.87 | | 0.76 | | 0.69 | | 0.63 | |
| Net asset value at year-end16 | 7.44 | | 10.72 | | 9.24 | | 8.03 | | 7.66 | |
| | | | | | | | | | | |
| Share information | | | | | | | | | | |
| US$0.50 ordinary shares in issue (millions) | 12,105 | | 11,829 | | 11,572 | | 11,334 | | 11,172 | |
| | | | | | | | | | | |
| | % | | % | | % | | % | | % | |
| Financial ratios | | | | | | | | | | |
| Dividend payout ratio17 | 197.9 | | 52.7 | | 54.3 | | 50.7 | | 53.4 | |
| Post-tax return on average total assets | 0.26 | | 0.97 | | 1.00 | | 1.06 | | 1.14 | |
| Return on average total shareholders’ equity | 4.7 | | 15.9 | | 15.7 | | 16.8 | | 16.3 | |
| Loans and advances to customers as a percentage of customer accounts | 83.6 | | 89.5 | | 96.8 | | 100.1 | | 97.1 | |
| | | | | | | | | | | |
| Average total shareholders’ equity to average total assets | 4.87 | | 5.69 | | 5.97 | | 5.96 | | 6.35 | |
| | | | | | | | | | | |
| Capital ratios1 | | | | | | | | | | |
| Tier 1 ratio | 8.3 | | 9.3 | | 9.4 | | 9.0 | | 8.9 | |
| Total capital ratio | 11.4 | | 13.6 | | 13.5 | | 12.8 | | 12.0 | |
| | | | | | | | | | | |
| Foreign exchange translation rates to US$ | | | | | | | | | | |
| Closing | – £:US$1 | 0.686 | | 0.498 | | 0.509 | | 0.581 | | 0.517 | |
| | – €:US$1 | 0.717 | | 0.679 | | 0.759 | | 0.847 | | 0.733 | |
| Average | – £:US$1 | 0.545 | | 0.500 | | 0.543 | | 0.550 | | 0.546 | |
| | – €:US$1 | 0.684 | | 0.731 | | 0.797 | | 0.805 | | 0.805 | |
| | | | | | | | | | | |
| For footnotes, see page 5. | | | | | | | | | | |
4
Back to Contents
| Consolidated Financial Statements |
The consolidated financial statements of HSBC and the separate financial statements of HSBC Holdings have been prepared in accordance with International Financial Reporting Standards (‘IFRSs’) as issued by the International Accounting Standards Board (‘IASB’) and as endorsed by the European Union (‘EU’). EU-endorsed IFRSs may differ from IFRSs as issued by the IASB if, at any point in time, new or amended IFRSs have not been endorsed by the EU. At 31 December 2008, there were no unendorsed standards effective for the year ended 31 December 2008 affecting these consolidated and separate financial statements, and there was no difference between IFRSs endorsed by the EU and IFRSs issued by the IASB in terms of their application to HSBC. Accordingly, HSBC’s financial statements for the year ended 31 December 2008 are prepared in accordance with IFRSs as issued by the IASB.
HSBC uses the US dollar as its presentation currency because the US dollar and currencies linked to it form the major currency bloc in which HSBC transacts its business. Unless otherwise stated, the information presented in this document has been prepared in accordance with IFRSs.
When reference to ‘underlying’ or ‘underlying basis’ is made in tables or commentaries, comparative information has been expressed at constant currency (see page 23) and adjusted for the effects of acquisitions and disposals. A reconciliation of reported and underlying profit before tax is presented on page 22.
| Footnotes to ‘Financial Highlights’ |
| | |
| 1 | The calculation of capital resources, capital ratios and risk-weighted assets for 31 December 2008 is on a Basel II basis. Comparatives are on a Basel I basis. |
| 2 | Dividends recorded in the financial statements are dividends per ordinary share declared in a year and are not dividends in respect of, or for, that year. First, second and third interim dividends for 2008, each of US$0.18 per ordinary share, were paid on 9 July 2008, 8 October 2008 and 14 January 2009, respectively. Note 12 on the Financial Statements provides more information on the dividends declared in 2008. On 2 March 2009 the Directors declared a fourth interim dividend for 2008 of US$0.10 per ordinary share in lieu of a final dividend, which will be payable to ordinary shareholders on 6 May 2009 in cash in US dollars, or in pounds sterling or Hong Kong dollars at exchange rates to be determined on 27 April 2009, with a scrip dividend alternative. The reserves available for distribution at 31 December 2008 were US$18,838 million. |
| |
| |
| | Quarterly dividends of US$15.50 per 6.20 per cent non-cumulative Series A US dollar preference share, equivalent to a dividend of US$0.3875 per Series A ADS, each of which represents one-fortieth of a Series A dollar preference share, were paid on 17 March 2008, 16 June 2008, 15 September 2008 and 15 December 2008. |
| | Quarterly coupons per 8.125 per cent capital securities of US$0.541 and US$0.508 were paid on 15 July 2008 and 15 October 2008 respectively. |
| 3 | The definition of return on average invested capital and a reconciliation to the equivalent GAAP measures are set out on page 19. |
| 4 | The return on average total shareholders’ equity is defined as profit attributable to shareholders of the parent company divided by average total shareholders’ equity. |
| 5 | The cost efficiency ratio is defined as total operating expenses divided by net operating income before loan impairment charges and other credit risk provisions. |
| 6 | This footnote is intentionally left blank. |
| 7 | Each American Depositary Share (‘ADS’) represents five ordinary shares. |
| 8 | Total shareholder return is defined on page 19. |
| 9 | The Financial Times Stock Exchange 100 Index. |
| 10 | The Morgan Stanley Capital International World Index. |
| 11 | The Morgan Stanley Capital International World Bank Index |
| 12 | Data for 2004 exclude the provisions of IAS 32, IAS 39 and IFRS 4, which were adopted with effect from 1 January 2005. |
| 13 | Capital resources are total regulatory capital, the calculation of which is set out on page 278. |
| 14 | Includes perpetual preferred securities, details of which can found in Note 32 on the Financial Statements. |
| 15 | Net of impairment allowances. |
| 16 | The definition of net asset value per share is total shareholders’ equity, less non-cumulative preference shares and capital securities, divided by the number of ordinary shares in issue. |
| 17 | Dividends per share expressed as a percentage of earnings per share. |
5
Back to Contents
| H S B C H O L D I N G S P L C |
| |
| Cautionary Statement Regarding Forward-Looking Statements |
| | |
| | |
| Cautionary Statement |
| | TheAnnual Reportand Accounts 2008 contains certain forward-looking statements with respect to the financial condition, results of operations and business of HSBC. |
| | | | |
| | Statements that are not historical facts, including statements about HSBC’s beliefs and expectations, are forward-looking statements. Words such as ‘expects’, ‘anticipates’, ‘intends’, ‘plans’, ‘believes’, ‘seeks’, ‘estimates’, ‘potential’ and ‘reasonably possible’, variations of these words and similar expressions are intended to identify forward-looking statements. These statements are based on current plans, estimates and projections, and therefore undue reliance should not be placed on them. Forward-looking statements speak only as of the date they are made, and it should not be assumed that they have been revised or updated in the light of new information or future events. |
| | | | |
| | Written and/or oral forward-looking statements may also be made in the periodic reports to the United States Securities and Exchange Commission, summary financial statements to shareholders, proxy statements, offering circulars and prospectuses, press releases and other written materials, and in oral statements made by HSBC’s Directors, officers or employees to third parties, including financial analysts. |
| | | | |
| | Forward-looking statements involve inherent risks and uncertainties. Readers are cautioned that a number of factors could cause actual results to differ, in some instances materially, from those anticipated or implied in any forward-looking statement. These factors include, among others: |
| | | | |
| | • | changes in general economic conditions in the markets in which HSBC operates, such as: |
| | | | |
| | | – | continuing or deepening recessions and fluctuations in employment; |
| | | | |
| | | – | changes in foreign exchange rates, in both market exchange rates (for example, between the US dollar and pound sterling) and government-established exchange rates (for example, between the Hong Kong dollar and US dollar); |
| | | | |
| | | – | volatility in interest rates; |
| | | | |
| | | – | volatility in equity markets, including in the smaller and less liquid trading markets in Asia and Latin America; |
| | | | |
| | | – | lack of liquidity in wholesale funding markets; |
| | | – | illiquidity and downward price pressure in national real estate markets, particularly consumer-owned real estate markets; |
| | | | |
| | | – | the length and severity of current market turmoil; |
| | | | |
| | | – | the impact of lower than expected investment returns on the funding of private and public sector defined benefit pensions; |
| | | | |
| | | – | the effect of unexpected changes in actuarial assumptions on longevity which would influence the funding of private and public sector defined benefit pensions; and |
| | | | |
| | | – | consumer perception as to the continuing availability of credit, and price competition in the market segments served by HSBC. |
| | | | |
| | • | changes in government policy and regulation, including: |
| | | | |
| | | – | the monetary, interest rate and other policies of central banks and other regulatory authorities, including the UK Financial Services Authority, the Bank of England, the Hong Kong Monetary Authority, the US Federal Reserve, the US Securities and Exchange Commission, the US Office of the Comptroller of the Currency, the European Central Bank, the People’s Bank of China and the central banks of other leading economies and markets where HSBC operates; |
| | | | |
| | | – | expropriation, nationalisation, confiscation of assets and changes in legislation relating to foreign ownership; |
| | | | |
| | | – | initiatives by local, state and national regulatory agencies or legislative bodies to revise the practices, pricing or responsibilities of financial institutions serving their consumer markets; |
| | | | |
| | | – | changes in bankruptcy legislation in the principal markets in which HSBC operates and the consequences thereof; |
| | | | |
| | | – | general changes in government policy that may significantly influence investor decisions, in particular in markets in which HSBC operates, including financial institutions newly taken into state ownership on a full or partial basis; |
| | | | |
| | | – | extraordinary government actions as a result of current market turmoil; |
6
Back to Contents
| | – | other unfavourable political or diplomaticdevelopments producing social instability orlegal uncertainty which in turn may affectdemand for HSBC’s products and services; |
| | | |
| | – | the costs, effects and outcomes of regulatoryreviews, actions or litigation, including anyadditional compliance requirements; and |
| | | |
| | – | the effects of competition in the marketswhere HSBC operates including increasedcompetition from non-bank financialservices companies, including securitiesfirms. |
| | • | | factors specific to HSBC: |
| | | | |
| | | – | the success of HSBC in adequately identifying the risks it faces, such as the incidence of loan losses or delinquency, and managing those risks (through account management, hedging and other techniques). Effective risk management depends on, among other things, HSBC’s ability through stress testing and other techniques to prepare for events that cannot be captured by the statistical models it uses. |
| | | | |
| | | – | the success of HSBC in addressing operational, legal and regulatory and litigation challenges. |
7
Back to Contents
| H S B C H O L D I N G S P L C |
| |
| Group Chairman’s Statement |
| | |
| | |
| Group Chairman’s Statement |
2008 was the most extraordinary year for the global economy and financial services in well over half a century. It marked the first crisis of the era of globalised securitisation. And it also marked the first crisis of the just-in-time global economy as the impact of the financial crisis fed rapidly straight into the performance of the real economy.
Causes of the crisis
|
| | |
| The causes of the crisis are complex and interrelated. But we can clearly see that a number of different factors contributed: |
| | |
| • | First, the global financial imbalances that arosefrom the accelerating global economic shifttowards emerging markets. The rapid growth ofemerging economies created a macro-economictriangle, made up of: the major consumermarkets, in particular the US but also a numberof other Western economies; major producernations – notably a number of fast-growingemerging markets which have beenmanufacturing a vast range of goods forconsumption in the West; and resource providerswhose wealth of hydrocarbons and othercommodities have helped power the producereconomies and have thus commanded such highprices until recently. This macro-economictriangle delivered high rates of growth, but alsocreated major financial imbalances as producernations and resource providers accumulatedmassive reserves whilst the US and otherconsumer markets ran significant and growingdeficits. |
| | |
| • | Second, cheap credit. A large proportion of theaccumulated savings of the producers andresource providers was invested in the world’sreserve currency, the US dollar, keeping rates low. This cheap money fuelled a consumer |
| | boom and rising house prices. It encouragedincreased borrowing by banks and by theircustomers, fuelling asset price bubblesparticularly in housing markets. Loose monetaryconditions in the US and in much of theemerging world gave added strength to thisalready potent cocktail. |
| | |
| • | Third, securitisation based on overly complexproduct structures. The complexity and opacityof certain financial instruments reached a pointwhere even senior and experienced bankers andprofessional investors had trouble understandingthem. This meant that people were selling andbuying assets whose risks they had not properlyassessed. |
| | |
| • | And finally, excessive gearing. Many banksbecame overgeared and too dependent onwholesale funding, which they assumed,incorrectly, would never dry up. Assets werecreated on the back of ever higher leverage, bothdirect and indirect. And when the securitisationmarket began to collapse, banks foundthemselves with assets that they could neithersell nor fund, so forcing large losses on the assetside and a funding challenge on the liability sidefor which they were entirely unprepared. |
| | |
| The result has been unprecedented stress in the financial system, and it has led to a major breakdown in trust. In many countries, huge support from taxpayers has been required in order to stabilise the system. |
| | |
| Failings in the banking industry |
| | |
| The industry has done many things wrong. It is important to remember that many ordinary bankers have always sought to provide good service to their customers; but we must also recognise that there have been too many who have profoundly damaged the industry’s reputation. |
| | |
| Inappropriate products were sold inappropriately by many. Compensation practices ran out of control and perverse incentives led to dangerous outcomes. There is genuine and widespread anger that the contributors to the crisis were in some cases amongst the biggest beneficiaries of the system. |
| | |
| Underlying all these events is a question about the culture and ethics of the industry. It is as if, too often, people had given up asking whether something was the right thing to do, and focused only whether it was legal and complied with the rules. The industry needs to recover a sense of what is right and suitable as a key impulse for doing business. |
8
Back to Contents
HSBC strategy intact
We at HSBC were not immune from the crisis. But we have built our business on very strong foundations and are able to report results which demonstrate our ability to withstand the storm.
Our strategy has been tested and remains intact. We will continue to build our business by focusing on faster-growing markets around the world and on businesses where international connectivity is important – all from a position of financial strength. If anything, the current crisis validates our renewed focus over the last few years on fast-growing economies, since it will accelerate the shift in the world’s centre of economic gravity from west to east.
Our robust balance sheet and liquidity means that we have continued to lend. In 2008, we grew our lending to commercial customers by 10 per cent on an underlying basis. Lending to personal customers increased in all regions except North America. And our brand strength continues to underpin our performance. It was noticeable that, at times of stress in many markets, HSBC was a beneficiary of funds flowing in. Recently, the HSBC brand was recognised as the number one brand in banking by Brand Finance.
Profitable from a broad-based earnings platform
Excluding the goodwill impairment on our North America Personal Financial Services business, HSBC reported a pre-tax profit for 2008 of US$19.9 billion, a decline of 18 per cent. On a reported basis, pre-tax profit was US$9.3 billion, down 62 per cent. Within this were some strong regional and business line performances. However, there is one area on which I would like to comment.
For North America, we reported a loss of US$15.5 billion including the goodwill impairment charge of US$10.6 billion in Personal Financial Services. The significant deterioration in US employment and economic outlook in the fourth quarter of 2008 were the primary factors in causing us to write off all the remaining goodwill carried on our balance sheet in respect of our Personal Financial Services business in North America.
The management team has worked tirelessly to address this problem acquisition in the US and we have considered all viable options. We saw the disruption in sub-prime lending as early as 2006 and sharply scaled back in 2007 while others continued
to grow. We also devoted considerable resources to helping our customers. Virtually no one then foresaw the subsequent scale of the deterioration in the US economy and financial markets. It is now clear that models of direct personal lending that depend on wholesale markets for funding are no longer viable. In light of this, we have taken the difficult decision that, with the exception of credit cards, we will write no further consumer finance business through the HFC and Beneficial brands in the US and close the majority of the network. Thus, in terms of new business, we are drawing a line and we will run off our existing business, providing all necessary support to HSBC Finance to enable it to do so in a measured way and meet all its commitments.
HSBC has a reputation for telling it as it is. With the benefit of hindsight, this is an acquisition we wish we had not undertaken.
The US remains the world’s largest economy and HSBC remains committed to the US, which we see as a core market for HSBC. HSBC Bank in the US is not affected by the restructure. In the immediate future we will focus on those businesses and customers for whom our global connectivity gives us advantage – primarily in corporate and commercial business, and in Private and Premier banking.
Performance overview and strategic activity
In this difficult environment, we missed our profitability targets. We hit our capital target with our tier 1 ratio at 8.3 per cent. We maintained a very conservative advances-to-deposits ratio at 84 per cent. We grew lending in each region outside North America on an underlying basis. And we constrained costs, with the cost efficiency ratio improving to 47.2 per cent, excluding the goodwill impairment mentioned above. We also continued implementation of OneHSBC, our programme to enhance customer experience and improve cost efficiency through standardising products, processes and technology around the world.
We also acquired businesses in strategic areas – we acquired the assets, liabilities and operations of The Chinese Bank in Taiwan in March; IL&FS Investsmart, a retail brokerage in India in May; and, in October, the acquisition of Bank Ekonomi in Indonesia was announced. The first two are complete and being integrated, the last is expected to be completed in the second quarter. The most notable disposal was the sale of our regional bank network in France for a consideration of US$3.2 billion.
9
Back to Contents
| H S B C H O L D I N G S P L C |
| |
| Group Chairman’s Statement(continued) |
| | |
| | |
| Group Chairman's Statement |
Thank you to our people
This was an extraordinary year and made extraordinary demands on many of our people. I want to express my sincere thanks for all their efforts and achievements. Our industry has rightly been under considerable public scrutiny and banks have been indiscriminately bunched together. It is through our staff that HSBC’s distinctive character stands out for our customers and it is they who ensure that not all banks are the same.
Dividend declaration and progressive dividend policy
The Directors have declared a fourth interim dividend for 2008 of US$0.10 per ordinary share (in lieu of a final dividend) which, together with the first three interim dividends for 2008 of US$0.18 already paid, will make a total distribution in respect of the year of US$0.64 per ordinary share. The payments in total represent a decrease of 29 per cent in US dollar terms compared with 2007 and of 15 per cent in sterling terms. The dividend will be payable on 6 May 2009 to shareholders on the register at the close of business on 20 March 2009.
After 15 years of double-digit dividend growth, we did not make the decision to lower the dividend lightly. Very careful consideration was given to the current operating environment and the increased uncertainty over both the supply of capital required in an increasingly volatile financial world and a pro-cyclical regulatory capital framework.
For 2009, HSBC has rebased the envisaged dividend per share for the first three interim dividends to US$0.08 to reflect the impact of the enlarged ordinary share capital following the Rights Issue we are announcing today, prevailing business conditions and capital requirements. The dividend payments remain substantial and reflect management’s long-term confidence in the business. HSBC will continue to aim to pay progressive dividends in line with the long-term growth of the business.
Maintaining HSBC’s financial strength
The logic of maintaining HSBC’s distinctive financial strength which we have applied to our dividend also applies to our capital position. We have announced today a Rights Issue to strengthen further our capital ratios. We propose to raise, on a fully underwritten basis, approximately US$17.7 billion of equity which will increase our capital ratios by 150 basis points, strengthening the core equity tier 1 ratio to 8.5 per cent and the tier 1 ratio to 9.8 per cent, both on a pro forma basis as at
31 December 2008. I shall be writing to all shareholders with full details.
Over the past 12 months, many of our competitors have received significant government capital injections – something we said we could not envisage – or have raised capital from shareholders and other investors. Higher regulatory capital requirements, in part from the effect of the economic downturn on capital requirements under the Basel II regime, as well as changing market sentiment on appropriate levels of leverage, have also raised expectations regarding capital levels. We are determined that HSBC should maintain its signature financial strength and we are now raising the top of our target range for the tier 1 ratio so that the range will be from 7.5 per cent to 10 per cent.
Planned internal capital generation remains strong and this capital raising will enhance our ability to deal with the impact of an uncertain economic environment and to respond to unforeseen events. Importantly, it will also give us options with respect to opportunities which we believe will present themselves to those with superior financial strength. These may involve organic investment in the continued taking of market share from more capital constrained competitors. There may also be opportunities to grow through targeted acquisitions by taking advantage of attractive valuations where the opportunities in question align with our strategy and the risks are understood.
Culture and compensation
We believe in the profound importance of culture and ethics in business. HSBC’s longstanding traditions of financial strength, long-term customer relationships and conservative management are as important today as ever. They have not always been fashionable and we have not always been perfect. One of the consequences of the crisis – and rightly – is that we are going to see a fundamental re-evaluation of the rules and regulations that govern our business. But we should remember that no amount of rules and regulations will be sufficient if the culture does not encourage people to do the right thing. It is the responsibility of Boards to supervise and management to embed a sustainable culture into the very fibre of the organisation. For HSBC, there is nothing more important.
We also intend to play our part in rebuilding public trust in our industry. This means we must be willing to take part in and shape the debate on how our industry should evolve in the coming years, based on the lessons which must be learnt from this crisis. In particular, we strongly believe that the
10
Back to Contents
industry must respond to the requirement for a more sober and reasonable approach to compensation. At HSBC, we are committed to the principle of sensible market-related pay, structured to align executive actions with long-term shareholder interests. A small number of individuals in a market system will inevitably receive compensation that is high in absolute terms, but this must be genuinely linked to long-term shareholder interests. It is clear that the banking industry got it wrong in the go-go years: we will play our part in helping the industry respond appropriately to the new realities.
It is right therefore that in HSBC’s case, I outline our present position. As Chairman I elected in 2007 to no longer receive any cash bonus award; any variable compensation would be delivered through performance share awards – which would only vest if performance hurdles are met. And no performance share awards will be made in the Group in respect of 2008. Mike Geoghegan, Group Chief Executive, and Stuart Gulliver, Chief Executive Global Banking and Markets, and Douglas Flint, Group Finance Director, have asked the Remuneration Committee not to consider them for any bonus award for 2008. No cash bonus award will be made to any Executive Director for 2008. Full details on Directors’ remuneration can be found in theAnnual Report.
Learning the lessons
We are living through a genuinely global crisis; it cannot be solved by one nation alone. Governments need to work together with our industry to tackle the root causes of the crisis, while maintaining the open, globalised markets that have helped spread prosperity in the last two decades. Protectionism, both in trade and in capital flows, is a threat and in all its forms must be resisted.
We must also urgently improve governance and regulation to create a more stable financial framework. The globalisation of financial markets contrasts sharply with the domestic agenda of the regulatory regimes that underpin it. We support intergovernmental efforts to enhance the coordination of regulatory oversight, since we believe that this is essential to the stable development of the international capital markets for the benefit of the common good.
Continued economic strain
The coming twelve months will be difficult. We expect parts of Asia, the Middle East and Latin America to continue to outperform Western economies, but to be constrained by the global downturn.
We see unemployment rising through 2009 into 2010 in both the US and the UK, together with continuing declines in housing markets. We should remember that the US is the driver of the global economy and global growth depends on the US recovery.
We remain confident that HSBC is well-placed in today’s environment and that our strength leads to opportunity. Our strategy has served HSBC well and positions it for long-term growth with attractive returns. HSBC continues to combine its position as the world’s leading emerging markets bank with an extensive international network across both developed and faster growing markets. At the same time, as the financial system exhibits stress, our competitive position is improving as the capacity and capabilities of financial institutions are constrained by lack of capital and funding; many of them are also focusing more on their domestic markets.
Further strengthening our capital base will enhance our ability to deal with the impact of an uncertain economic environment and to respond to unforeseen events, as well as giving us options regarding opportunities which will undoubtedly present themselves to those with superior financial strength.

S K Green,Group Chairman
2 March 2009
11
Back to Contents
| H S B C H O L D I N G S P L C |
| |
| Report of the Directors: Operating and Financial Review |
| | |
| | |
| Principal activities / Strategic direction / Challenges and uncertainties |
HSBC is one of the largest banking and financial services organisations in the world, with a market capitalisation of US$114 billion at 31 December 2008.
Through its subsidiaries and associates, HSBC provides a comprehensive range of banking and related financial services. Headquartered in London, HSBC operates through long-established businesses and has an international network of some 10,000 properties in 86 countries and territories in five geographical regions: Europe; Hong Kong; Rest of Asia-Pacific, including the Middle East and Africa; North America and Latin America. Within these regions, a comprehensive range of financial services is offered to personal, commercial, corporate, institutional, investment and private banking clients. Services are delivered primarily by domestic banks, typically with large retail deposit bases, and consumer finance operations. Taken together, the five largest customers of HSBC do not account for more than one per cent of HSBC’s income.
There were no significant acquisitions during the year (for details of acquisitions see page 418). HSBC disposed of its seven French regional banks for US$3.2 billion in July 2008 (see pages 418 and 458).
HSBC’s strategic direction reflects its position as ‘The world’s local bank’, combining the largest global emerging markets banking business and a uniquely cosmopolitan customer base with an extensive international network and substantial financial strength.
The Group’s strategy is aligned with key trends which are shaping the global economy. In particular, HSBC recognises that, over the long term, developing markets are growing faster than the mature economies, world trade is expanding at a greater rate than gross domestic product and life expectancy is lengthening virtually everywhere. Against this backdrop, HSBC’s strategy is focused on delivering superior growth and earnings over time by building on the Group’s heritage and skills. Its origins in trade in Asia have had a considerable influence over the development of the Group and, as a consequence, HSBC has an established and longstanding presence in many countries. The combination of local knowledge and international breadth is supported by a substantial financial capability founded on balance sheet strength, largely attributable to the scale of the Group’s retail deposit bases.
HSBC is, therefore, continuing to invest primarily in the faster growing markets and, in the more developed markets, by focusing on businesses which have international connectivity. Central to these reshaping activities is a policy of maintaining HSBC’s capital strength and strong liquidity position.
The Group has identified three main business models for its customer groups and global businesses that embody HSBC’s areas of natural advantage:
| | • | businesses with international customers forwhom developing markets connectivity iscrucial – Global Banking and Markets, PrivateBanking, the large business segment ofCommercial Banking and the mass affluentsegment of Personal Financial Services; |
| | | |
| | • | businesses with local customers whereefficiency can be enhanced through global scale– the small business segment of CommercialBanking and the mass market segment ofPersonal Financial Services; and |
| | | |
| | • | products where global scale is possible throughbuilding efficiency, expertise and brand – globalproduct platforms such as global transactionbanking. |
The means of executing the strategy, and further utilising the linkages within the Group, are clear:
| • | the HSBC brand and global networks will beleveraged to reach new customers and offerfurther services to existing clients; |
| | |
| • | efficiency will be enhanced by taking fulladvantage of local, regional and globaleconomies of scale, in particular by adoptinga common systems architecture whereverpossible; and |
| | |
| • | objectives and incentives will be aligned tomotivate and reward staff for being fullyengaged in delivering the strategy. |
| Challenges and uncertainties |
|
Current economic and market conditions may adversely affect HSBC’s results.
The global economy has entered the most severe downturn for 80 years, with the financial services industry facing extraordinary turbulence. A shortage of liquidity, lack of funding, pressure on capital and extreme price volatility across a wide range of asset classes are putting financial institutions under considerable pressure. This is leading governments and central banks to undertake unprecedented intervention designed to stabilise the global and
12
Back to Contents
domestic financial systems, to stimulate new lending and to support systemically important institutions at risk of failing. Many developed economies have entered recession and growth has slowed in many emerging countries, with serious adverse consequences for asset values, employment, consumer confidence and levels of economic activity. Commodity prices have significantly retrenched, in many cases from recent historical highs, interest rate yield curves have flattened, interest rates have fallen in absolute terms and trade flows have contracted. Global equity markets have experienced severe declines and various currencies, including sterling, have depreciated significantly against the US dollar. Emerging markets have suffered as portfolio investments have been repatriated and cross-border inter-bank funding has been withdrawn. Numerous governments and central banks have responded by proposing programmes to make substantial funds and guarantees available to boost liquidity and confidence in their financial systems, as well as cutting taxes and lowering interest rates. It is not known whether these responses will be effective in addressing the severe economic and market conditions or whether recently proposed measures will be implemented as initially proposed.
HSBC’s earnings are affected by global and local economic and market conditions. Dramatic declines in 2007 and 2008 in the housing markets in the US, the UK and elsewhere have combined with increasing unemployment to affect negatively the credit performance of real estate-related exposures, resulting in significant write-downs of asset values by financial institutions, including HSBC. These write-downs, initially of asset-backed securities but spreading to other securities and loans, have caused many financial institutions to seek additional capital, to reduce or eliminate dividends, to merge with larger and stronger competitors or, in some cases, to fail.
A worsening of these conditions may exacerbate the impact of these difficult market conditions on HSBC and other financial institutions and could have an adverse effect on HSBC’s operating results. In particular, the Group may face the following challenges in connection with these events:
| • | HSBC’s ability to assess the creditworthiness ofits customers or to estimate the values of itsassets may be impaired if the models andtechniques it uses become less accurate in theirpredictions of future behaviour, valuations orestimates. The process HSBC uses to estimatelosses inherent in its credit exposure or assessthe value of certain assets requires difficult, |
| | subjective and complex judgements. Theseinclude forecasts of economic conditions andhow predicted economic scenarios might impairthe ability of HSBC’s borrowers to repay theirloans or might affect the value of assets. As aconsequence, this process may be less capableof making accurate estimates which, in turn,may undermine the reliability of the process. |
| | |
| • | The demand for borrowing from creditworthycustomers may diminish as economic activityslows. |
| | |
| • | Lower interest rates will reduce net interestincome earned by HSBC on its excess deposits. |
| | |
| • | HSBC’s ability to borrow from other financialinstitutions or to engage in funding transactionson favourable terms, or at all, could beadversely affected by further disruption in thecapital markets or deteriorating investorsentiment. |
| | |
| • | Market developments may affect consumerconfidence and may cause declines in creditcard usage and adverse changes in paymentpatterns, leading to increases in delinquenciesand default rates, write-offs and loanimpairment charges beyond HSBC’sexpectations. |
| | |
| • | Loan impairment allowances and write-offs arelikely to rise as a result of a deterioration inpayment patterns and increased delinquenciesand default rates caused by weakeningconsumer confidence and increased businessfailures. A worsening of these economic factorsmay exacerbate the adverse effects of thesedifficult market conditions on HSBC and othersin the financial services industry. |
| | |
| • | HSBC expects to face increased regulation andsupervision of the financial services industry,following new or proposed regulatory measuresin countries in which it operates. |
| | |
| • | Trade and capital flows may further contract asa result of protectionist measures beingintroduced in certain markets. |
| | |
| • | Increased government ownership andcontrol over financial institutions and furtherconsolidation in the financial industry, whichcould significantly alter the competitivelandscape. |
As a worldwide financial institution, HSBC is exposed to these developments across all its businesses, both directly and through their impact on its customers and clients. Local variations exist, however, reflecting regional circumstances and
13
Back to Contents
| H S B C H O L D I N G S P L C |
| |
| Report of the Directors: Operating and Financial Review(continued) |
| | |
| | |
| Challenges and uncertainties |
presenting challenges to HSBC which are specific to those areas.
Europe
In the UK, the economy has entered recession and the currency has fallen in value against the US dollar, the yen and the euro. Changes in the marketplace are emerging following the part-nationalisation of some major financial institutions, and political interaction with the regulatory environment is becoming more frequent as the government seeks to stimulate lending to preserve economic activity. A period of low interest rates will reduce deposit spreads and HSBC’s retail business model will be more dependent on transactional fees and lending margin. Pension funding requirements, in particular for UK defined benefit schemes, will place increased financing demands on corporates, which may lead to unfunded commitments being drawn down, adding to pressure on system liquidity. The recent deterioration in credit quality is expected to continue as the economy contracts, with loan impairment charges rising as a result. Market volatility is also expected to continue.
In France, changes in the marketplace are slowly emerging following government measures to stimulate lending and preserve economic activity. A period of low interest rates will not adversely impact spreads in the short-term but will have an adverse effect in later years. HSBC’s retail business model is dependent on banking fees to maintain profitability and a recovery in financial markets is necessary in order to enhance brokerage and management fees and stimulate fund management activities. Deterioration in credit quality is expected to continue as the economy contracts, with commercial loan impairment charges rising as a result. Personal loan impairment charges are expected to remain at around current levels unless there is a very deep recession.
Conditions are likely to remain difficult in a number of markets in which HSBC currently trades and volatility is expected to continue.
Hong Kong and Rest of Asia-Pacific
In Asia-Pacific, a prolonged period of low interest rates is expected which will put pressure on HSBC’s net interest income from its strong deposit base. With capital market and currency volatility endemic, customers are likely to seek capital protection and become increasingly rate and risk sensitive, seeking out products which offer deposit insurance and government guarantees. Regulatory reforms in the areas of wealth management product complexity,
sales requirements and liquidity and reserve ratios are likely, and these will lead to a higher cost of compliance, greater standardisation and slower product approvals. International trade is expected to continue to contract, affecting import and export volumes and reducing HSBC’s earnings from trade financing. The quality of the asset book will deteriorate if economic factors beyond HSBC’s control do not improve, reducing customer credit ratings and, as a consequence, increasing risk- weighted asset allocations and capital requirements. This could be exacerbated if capital continues to be repatriated from emerging markets to more developed economies to take advantage of lower asset prices, adversely affecting emerging markets’ balance of payments and foreign exchange reserves. However, Asia is expected to adapt quickly to secure recovery from the global recession, led by mainland China and India.
The fall in global demand for oil products and related prices, and the contraction in financial surpluses held by key oil-producing countries following the declines in capital markets, will reduce the ability of some countries in the Middle East to maintain spending, borrowing and investment domestically and internationally. This will result in the cancellation or postponement of infrastructure projects which, together with weakening property prices, is expected to reduce both credit cover and revenue streams for financial institutions. The availability of economically priced, long-term funding is likely to contract. Business activity and private investment will also slow as consumer confidence declines. These factors will combine to place pressure on net revenues and on capital requirements.
North America
In the US, the steep decline in the housing market, with falling home prices and increasing foreclosures, and rising unemployment have resulted in significant write-downs of loans and advances and mortgage-backed securities. The effect of these write-downs subsequently spread to other capital market activities, leading many financial institutions to seek additional capital, merge with larger and stronger institutions and, in some cases, fail. Many lenders reduced or stopped providing funding to borrowers, including to other financial institutions. This market turmoil and resultant tightening of credit have led to an increased level of delinquencies, a fall in consumer confidence, increased market volatility and a widespread reduction in business activity in general. To date, various government intervention measures designed to stabilise the markets, including
14
Back to Contents
the decision of the Federal Reserve to reduce interest rates to unprecedentedly low levels, appear to be having an impact on the trading of both guaranteed and non-guaranteed debt in early 2009. A prolonged period of low Federal funds rates will put pressure on deposit spreads earned on HSBC’s deposit base. It is likely that these conditions will continue to adversely affect the Group’s results into 2010, the degree to which remains uncertain.
Latin America
Markets in Latin America are expected to be affected by recession in the developed world, particularly in the US. Output will fall as a decline in the demand for exports will adversely affect the export sector, and these factors are likely to combine with currency volatility to weaken the balance sheets of financial institutions. This may lead to a further contraction in the availability of credit, increasing the likelihood of bankruptcies and unemployment and reducing economic activity and consumption. Lower commodity prices and reduced remittance inflows are likely to affect economies in the region, particularly in Mexico and Central America. Exchange rates are likely to remain under pressure as growth stalls, and inflation may rise. The possibility of a combined credit crunch and stagflation in Latin America cannot be ruled out. The authorities may react with stricter prudential regulation and price controls. Public finances will come under strain if oil and other commodity prices remain low, restricting the authorities’ room for manoeuvre.
Risks associated with liquidity and funding, which are inherent in HSBC’s business, have been greatly increased by the current global market conditions
HSBC’s business model depends upon its ability to access financial resources whenever required to meet its obligations. To this end, HSBC seeks to maintain a diversified and stable funding base comprising core retail and corporate customer deposits and institutional balances and to augment this with wholesale funding and portfolios of highly liquid assets diversified by currency and maturity which are held to enable HSBC to respond to unforeseen liquidity requirements. HSBC’s earnings are affected by its ability to properly value financial instruments. In certain illiquid markets, determining the value at which financial instruments can be realised is highly subjective, and processes to ascertain value and estimates of value, both of which require substantial elements of judgement, assumptions and estimates (which may change over time), are required. Increased illiquidity adds to
uncertainty over the accessibility of financial resources and may reduce capital resources as valuations decline. Rating agencies, which determine HSBC’s own credit ratings and thereby influence the Group’s cost of funds, take into consideration management effectiveness and the success with which HSBC’s liquidity risk factors are managed. Actions by third parties and independent market participants, such as rating agency downgrades of instruments to which HSBC has exposure, can result in reduced liquidity and valuations of those instruments. HSBC’s liquidity could also be constrained by an inability to access the debt capital markets due to a variety of unforeseen market dislocations or interruptions.
The extreme market conditions facing the financial services industry have been reflected in shortages of liquidity, lack of funding, pressure on capital and extreme price volatility across a wide range of asset classes. Illiquidity of these assets has prevented the realisation of existing asset positions and has constrained risk distribution in ongoing banking activities. The extreme market conditions, which have highlighted the importance of a strong diversified core deposit base, have also lead to increased competition for such deposits and the risk of deposit migration. HSBC’s Global Banking and Markets business operates in the markets affected by illiquidity and extreme price volatility, either directly or indirectly, through exposures to securities, loans, derivatives and other commitments, and HSBC has made substantial write-downs and impairments on illiquid legacy credit and structured credit positions. While it is difficult to predict how long the conditions described above will exist and which of HSBC’s markets, products and other businesses will be affected, continuation of these factors could have an adverse effect on the Group’s results.
HSBC has significant exposure to counterparty risk
HSBC’s ability to engage in routine transactions to fund its operations and manage its risks could be adversely affected by the actions and commercial soundness of other financial services institutions. Financial institutions are extremely interdependent because of trading, clearing, counterparty or other relationships. As a consequence, a default by, or decline in market confidence in, individual institutions, or anxiety about the financial services industry generally, can lead to further individual and/or systemic difficulties, defaults and losses. HSBC has exposure to virtually all major industries and counterparties, and it routinely executes
15
Back to Contents
| H S B C H O L D I N G S P L C |
| |
| Report of the Directors: Operating and Financial Review (continued) |
| | |
| | |
| Challenges and uncertainties / KPIs |
transactions with counterparties in financial services, including brokers and dealers, commercial banks, investment banks, mutual and hedge funds, and other institutional clients. Many of these transactions expose HSBC to credit risk in the event of default by its counterparty or client. Where counterparty risk has been mitigated by taking collateral, HSBC’s credit risk may be exacerbated if the collateral it holds cannot be realised or has to be liquidated at prices which are insufficient to recover the full amount of its loan or derivative exposure. The failure of one of HSBC’s counterparties could have an adverse effect on its results.
HSBC operates in a highly competitive environment, and competition could intensify as a result of current global market conditions
Consolidation in the financial services industry is increasingly concentrating activity in companies that are capable of offering a wide array of financial products at competitive prices, with globalisation exposing HSBC to competition in capital markets and financial services at global and local levels alike. In addition, technological advances, the growth of e-commerce, regulatory developments and public sector participation or guarantees have made it possible for non-depository institutions to offer products and services that traditionally were the preserve of banks. The prominence in recent years of sovereign wealth funds, private equity and hedge funds as alternative sources of funding – which has increased competition for traditional financial institutions – may ease as investors seek safer, more traditional alternatives. Competition mayfurther intensifyor the competitive landscape may change as the consolidation of financial services companies continues and others are brought into part or full public ownership in response to the current market conditions. HSBC’s ability to grow its businesses, and therefore its earnings, is affected by these competitive pressures and is dependent on HSBC’s ability to attract and retain talented and dedicated employees.
HSBC is subject to political and economic risks in the countries in which it operates
HSBC operates through an international network of subsidiaries and affiliates in 86 countries and territories around the world. Its results are therefore subject to the risk of loss from unfavourable political developments, currency fluctuations, social instability and change in government policies on such matters as expropriation, authorisations, international ownership, interest-rate caps, limits
on dividend flows and tax in the jurisdictions in which it operates. These factors may also negatively affect revenues from the trading of securities and investment in securities, the effect being accentuated through certain international trading markets, particularly those in emerging market countries, being typically smaller, less liquid and more volatile than developed trading markets. HSBC’s subsidiaries’ and affiliates’ ability to pay dividends could be restricted by changes to official banking measures, exchange controls and other requirements. Because HSBC prepares its accounts in US dollars, while a substantial part of its assets, liabilities, assets under management, revenues and expenses are denominated in other currencies, changes in foreign exchange rates have an effect on its reported income and shareholders’ equity. For a detailed discussion of global and regional factors that impact the results of HSBC’s operations, see page 12.
Operational risks are inherent in HSBC’s business
HSBC is exposed to many types of operational risk, including fraudulent and other criminal activities (both internal and external), breakdowns in processes or procedures and systems failure or non-availability. HSBC is also subject to the risk of disruption of its business arising from events that are wholly or partially beyond its control (for example natural disasters, acts of terrorism, epidemics and transport or utility failures) which may give rise to losses in service to customers and/or economic loss to HSBC. All of these risks are also applicable where HSBC relies on outside suppliers or vendors to provide services to it and its customers.
HSBC is subject to legal risks, which have an adverse effect on the Group’s reputation
The risks to HSBC’s reputation arise from a variety of sources with the potential to cause harm to the Group and its ability to operate. These issues require the Group to deal appropriately with potential conflicts of interest; legal and regulatory requirements; ethical issues; anti-money laundering laws or regulations; privacy laws; information security policies; sales and trading practices; and the conduct of companies with which it is associated. Failure to address these issues appropriately may give rise to additional legal and compliance risk to HSBC, with an increase in the number of litigation claims and the amount of damages asserted against HSBC, or subject HSBC to regulatory enforcement actions, fines or penalties.
16
Back to Contents
Increased regulation of the financial services industry could have an adverse effect on HSBC’s operations
HSBC, its subsidiaries and its affiliates are subject to extensive and increasing regulation, accounting standards and interpretations thereof and legislation in the various countries in which the Group operates. From time to time, new laws are introduced, including tax, consumer protection, privacy and other legislation, which affect the operating environment in which the Group operates. As aresult ofthe recent interventions by governments in response to global economic conditions, it is widely expected that there will be a substantial increase in government regulation and supervision of the financial services industry, including the imposition of higher capital requirements and restrictions on certain types of transaction structure. If enacted, such new regulations could require additional capital to be injected into HSBC’s subsidiaries and affiliates, require HSBC to enter into business transactions that are not otherwise part of its current Group strategy, prevent HSBC from continuing current lines of operations, restrict the type or volume of transactions HSBC may enter into, limit HSBC’s subsidiaries’ and affiliates’ ability to declare dividends to HSBC, or set limits on or require the modification of rates or fees that HSBC charges on certain loan or other products. HSBC may also face increased compliance costs and limitations on its ability to pursue business opportunities. Separately, the Basel II Accord’s requirement for financial institutions to increase their capital in response to deteriorating market conditions may have secondary effects on lending, which could exacerbate the current market downturn. These measures, alone or in combination, could have an adverse effect on HSBC’s operations.
In the UK for example, the Banking Act 2009 includes a ‘Special Resolutions Regime’ which gives wide powers in respect of UK banks and their parent companies to the UK Treasury, the FSA and the Bank of England in circumstances where any such UK bank has encountered, or is likely to encounter, financial difficulties.
HSBC is subject to tax-related risks in the countries in which it operates, which could have an adverse effect on its operating results
HSBC is subject to the substance and interpretation of tax laws in all countries in which it operates.
A number of double taxation agreements entered into between countries also affect the taxation of the Group. Tax risk is the risk associated with changes in tax law or in the interpretation of tax law. It also includes the risk of changes in tax rates and the risk of consequences arising from failure to comply with procedures required by tax authorities. Failure to manage tax risks could lead to increased tax charges, including financial or operating penalties, for not complying as required with tax laws.
| Key performance indicators |
|
The Board of Directors and the Group Management Board monitor HSBC’s progress against its strategic objectives. Progress is assessed by comparison with the Group’s strategy, its operating plan targets and its historical performance using both financial and non-financial measures.
As a prerequisite for the vesting of Performance Shares, the Remuneration Committee must satisfy itself that HSBC Holdings’ financial performance has shown a sustained improvement in the period since the award date. In determining this, the Remuneration Committee will take account of all relevant factors but in particular comparisons against the total shareholder return (‘TSR’) comparator group with regard to the financial key performance indicators (‘KPIs’) described below.
Financial KPIs
To support the Group’s strategy and ensure that HSBC’s performance can be monitored, management utilises a number of financial KPIs. The table below presents these KPIs for the period from 2004 to 2008. At a business level, the KPIs are complemented by a range of benchmarks which are relevant to the planning process and to reviewing business performance.
HSBC has published a number of key targets against which future performance can be measured. Financial targets have been set as follows: the return on average total shareholders’ equity over the medium term has been set at 15-19 per cent; the cost efficiency ratio has been set in the range of 48-52 per cent; and the TSR in the top half of that achieved by peers. The cost efficiency ratio has been set as a range within which the business is expected to remain in order to accommodate the need for continued investment in support of future business growth.
17
Back to Contents
| H S B C H O L D I N G S P L C |
| |
| Report of the Directors: Operating and Financial Review (continued) |
| | |
| | |
| KPIs |
Financial KPIs – trend analysis
| | 2008 | | | 2007 | | | 2006 | | | 2005 | | | 2004 | | |
| | % | | | % | | | % | | | % | | | % | | |
| | | | | | | | | | | | | | | | |
| Revenue growth1 | 3.4 | | | 20.8 | | | 13.4 | | | 12.2 | | | – | | |
| Revenue mix2 | | | | | | | | | | | | | | | |
| Net interest income | 52.1 | | | 47.8 | | | 52.8 | | | 54.4 | | | 60.6 | | |
| Net fee income | 24.5 | | | 27.9 | | | 26.3 | | | 25.1 | | | 25.2 | | |
| Other income3 | 23.4 | | | 24.3 | | | 20.9 | | | 20.5 | | | 14.2 | | |
| Cost efficiency4 | 60.1 | | | 49.4 | | | 51.3 | | | 51.2 | | | 51.6 | | |
| Credit performance as measured by risk adjusted margin5 | 4.8 | | | 6.0 | | | 6.3 | | | 6.3 | | | 6.8 | | |
| Return on average invested capital6 | 4.0 | | | 15.3 | | | 14.9 | | | 15.9 | | | 15.0 | | |
| Dividends per share growth7 | (28.9 | ) | | 11.1 | | | 11.0 | | | 10.6 | | | 10.0 | | |
| Basic earnings per ordinary share8(US$) | 0.47 | | | 1.65 | | | 1.40 | | | 1.36 | | | 1.18 | | |
| Return on average total shareholders’ equity9 | 4.7 | | | 15.9 | | | 15.7 | | | 16.8 | | | 16.3 | | |
| | | | | | | | | | | | | | | | |
| | | | | | | | | | | | | | | | |
| | Over | | | Over | | | Over | | | | | | | | |
| | 1 year | | | 3 years | | | 5 years | | | | | | | | |
| Total shareholder return | | | | | | | | | | | | | | | |
| HSBC TSR | 84.5 | | | 84.5 | | | 98.5 | | | | | | | | |
| Benchmarks: | | | | | | | | | | | | | | | |
| – FTSE 100 | 71.7 | | | 88.1 | | | 118.3 | | | | | | | | |
| – MSCI World | 81.8 | | | 93.6 | | | 123.7 | | | | | | | | |
| – MSCI Banks | 63.0 | | | 60.8 | | | 82.7 | | | | | | | | |
| | |
| 1 | The percentage increase in net operating income before loan impairment and other credit risk charges since the previous year. |
| 2 | As a percentage of net operating income before loan impairment charges and other credit risk provisions. |
| 3 | Other income comprises net operating income before loan impairment charges and other credit risk provisions less net interest income and net fee income. |
| 4 | Total operating expenses divided by net operating income before loan impairment and other credit risk charges. |
| 5 | Net operating income divided by average risk-weighted assets. |
| 6 | Profit attributable to ordinary shareholders divided by average invested capital. |
| 7 | The percentage increase in dividends per share since the previous year, based on the dividends paid in respect of the year to which the dividend relates. |
| 8 | Basic earnings per ordinary share is defined in Note 13 on the Financial Statements. |
| 9 | The return on average total shareholders’ equity is defined as profit attributable to shareholders of the parent company divided by the average total shareholders’ equity. |
Revenue growth provides an important guide to the Group’s success in generating business. In 2008, total revenue grew by 3.4 per cent to US$81.7 billion, 2.1 per cent on an underlying basis, reflecting the resilience of HSBC’s income generating capabilities in these exceptionally difficult economic circumstances.
Revenue mix represents the relative distribution of revenue streams between net interest income, net fee income and other revenue. It is used to understand how changing economic factors affect the Group, to highlight dependence on balance sheet utilisation for income generation and to indicate success in cross-selling fee-based services to customers with loan facilities. This understanding assists management in making business investment decisions. Comparison of the revenue mix between 2005 and 2007 shows a trend of net fee income increasing at a faster rate than net interest income. This trend has been reversed in 2008 as net fee income’s contribution fell by 3.4 percentage points mainly due to lower fees on cards and equity-related products.
Cost efficiency is a relative measure that indicates the consumption of resources in generating revenue. Management uses this to assess the success of technology utilisation and, more generally, the productivity of the Group’s distribution platforms and sales forces. The cost efficiency ratio for 2008 deteriorated by 10.7 percentage points to 60.1 per cent. This included writing off goodwill in the US.
Credit performance as measured by risk-adjusted margin is an important gauge for assessing whether credit is correctly priced so that the returns available after recognising impairment charges meet the Group’s required return parameters. The ratio for 2008 was 4.8 per cent, showing a decline of 1.2 percentage points over 2007, as loan impairment charges rose at a faster rate than income on higher average risk-weighted assets.
18
Back to Contents
Return on average invested capital measures the return on the capital investment made in the business, enabling management to benchmark HSBC against competitors. In 2008, the ratio of 4.0 per cent was 11.3 percentage points lower than that reported in 2007. This decrease reflected the decline in profit driven by goodwill impairment, the significant increase in loan impairment charges, write-downs in credit trading, leveraged and acquisition finance, and monoline exposures. The comparative period included dilution gains which were not repeated.
HSBC aims to deliver sustaineddividend per share growth for its shareholders. The total dividend for 2008, based on the year to which the dividends relate (rather than when they were paid), amounts to US$0.64, a reduction of 28.9 per cent on 2007, reflecting the decline in profitability, prevailing business conditions and capital requirements. This basis differs from the disclosure in the five-year comparison on page 4.
Basic earnings per share (‘EPS’) is a ratio that shows the level of earnings generated per ordinary share. EPS is one of two KPIs used in rewarding employees and is discussed in more detail in the Director’s Remuneration Report on page 315. EPS for 2008 was US$0.47, a decline of 71.5 per cent on 2007. This, in part, reflected the effect of recognising goodwill impairment in North America as well as the broad based impact of the global economic crisis. In 2007, EPS grew by 17.9 per cent over that reported in 2006.
Return on average total shareholders’ equitymeasures the return on average shareholders’ investment in the business. This enables management to benchmark Group performance against competitors and its own targets. In 2008, the ratio was 4.7 per cent or 11.2 percentage points lower than in 2007 of which 8.6 percentage points related to the goodwill impairment recognised. This absolute performance is not regarded as satisfactory, being lower than management’s target range of between 15 and 19 per cent.
Total shareholder return (‘TSR’) is used as a method of assessing the overall return to shareholders on their investment in HSBC, and is defined as the growth in share value and declared dividend income during the relevant period. TSR is a key performance measure in rewarding employees. In calculating TSR, dividend income is assumed to be invested in the underlying shares. The TSR benchmark is an index set at 100 and measured over one, three and five years for the purpose of comparison with the performance of a group of competitor banks which reflect HSBC’s range and
breadth of activities. As the comparator group includes companies listed on overseas markets, a common currency is used to ensure that TSR is measured on a consistent basis. The TSR levels at the end of 2008 were 84.5, 84.5, and 98.5 over one, three and five years respectively. HSBC’s TSR over all periods, while disappointing in absolute terms, has significantly outperformed the peer group as the current financial crisis has had a significantly more adverse impact on their performance and rating.
Management believes that financial KPIs must remain relevant to the business so they may be changed over time to reflect changes in the Group’s composition and the strategies employed.
Non-financial KPIs
HSBC has chosen four non-financial KPIs which are important to the future success of the Group in delivering its strategic objectives. These non-financial KPIs are currently reported internally within HSBC on a local basis.
Employee engagement
Employee engagement is a measure of employees’ emotional and rational attachment to HSBC. It is critical to the long-term success of the Group and, as such, an employee engagement target was included in the 2008 objectives for Group Executives (see Directors’ Remuneration Report, page 315).
In 2008, HSBC conducted its second Global People Survey of HSBC’s permanent workforce worldwide. The 2008 participation rate of 93 per cent improved on the 2007 figure of 88 per cent, which was already around the highest in the industry.
The Group’s employee engagement score rose from 60 per cent in 2007 to 67 per cent in 2008. In achieving 67 per cent, HSBC exceeded its target for 2008 of 62 per cent, the external global norm and the sector norm. Its 2009 target is 69 per cent.
The 2008 survey covered 13 dimensions which included assessing for the first time whether action had been perceived to have been taken on the results of the 2007 survey. Employees rated HSBC above the external global norm across all dimensions. HSBC exceeded the external best-in-class norm for Corporate Sustainability, and the dimensions covering Strategy and Vision, Reputation, Direct Manager and Leadership were close to this norm.
19
Back to Contents
| H S B C H O L D I N G S P L C |
| |
| Report of the Directors: Business Review(continued) |
| | |
| | |
| Reconciliation of reported and underlying profit before tax |
Brand perception
In order to manage the HSBC brand most effectively, the Group tracks brand health amongst Personal Financial Services and Commercial Banking customers in each of HSBC’s major markets. The survey is conducted on a consistent basis by accredited, independent, third-party organisations. A weighted scorecard of brand measures produces an overall score for each market on a 100-point scale, which is then benchmarked against HSBC’s main competitors. The scores from each market are then weighted according to the risk-adjusted revenues in that market to obtain the overall Group score.
In 2008, Personal Financial Services customers judged HSBC’s brand to be 9 points stronger than its competitors (+9), up from 6 points in 2007 and above the 8 point target. Commercial Banking customers judged the brand to be 6 points higher than HSBC’s competitors (+6), the same as in 2007.
For 2009, HSBC will track brand health in more countries. During 2008, competitors were acquired or withdrew from certain markets, so HSBC re-benchmarked its 2008 performance in respect of both brand and customer satisfaction for Personal Financial Services and Commercial Banking. For 2009, the benchmark is +4 with a target of +5 for the former and, for the latter, the equivalent numbers are +6 and +7, respectively.
Customer satisfaction
Customer recommendation is an important driver of business growth for HSBC. HSBC uses a consistent measure of customer recommendation around the world to continue to improve the services provided by the Group to customers of Personal Financial Services and Commercial Banking. This measurement is carried out by accredited, independent, third-party organisations and the resulting recommendation scores are benchmarked against competitors.
The 2008 customer recommendation target for Personal Financial Services increased from +1 to +2, failing to meet the target of +3 by a small margin. Commercial Banking met the target of +7 over competitors, up from +6 in 2007.
In 2009, HSBC has adopted a new benchmark of +1 and a 2009 target of +3 for Personal Financial Services and a benchmark of +4 and a target of +4 for Commercial Banking.
IT performance and systems reliability
HSBC tracks two key measures as indicators of IT performance; namely, the number of customer transactions processed and the reliability and resilience of systems measured in terms of service availability targets.
Number of customer transactions processed
The number of customer transactions processed reflects the dependency on IT in the delivery channels that customers use to interact with HSBC. Monitoring the volumes by channel enables the Group to allocate resources appropriately. Overall, the results show the desired decrease in staff-assisted transactions. Self-service transactions increased as a result of the redesign of the Group’s distribution network and the continuing rollout of One HSBC Technologies, HSBC’s project to standardise its primary systems, products and processes. Internet transactions unexpectedly decreased as a direct result of lower online trading volumes in retail securities in 2008. To improve efficiency HSBC aims to manage the rate of increase in IT transaction processing costs to below the volume increase. The following chart shows the 2005 to 2008 volumes per delivery channel:
Number of customer transactions (millions)
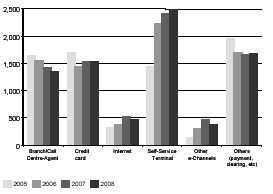
Percentage of IT services meeting or exceeding targets
HSBC’s IT function establishes with its end-users service levels for systems performance, such as systems running 99.9 per cent of the time or credit card authorisations within two seconds, and monitors the achievement of each of these commitments. The following chart shows the percentage of IT services meeting or exceeding the agreed service targets by region. Overall, the results show a trend of improving service performance.
20
Back to Contents
Percentage of IT services meeting or exceeding targets
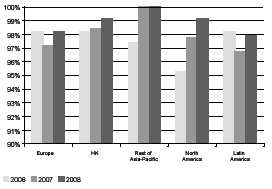
| Reconciliation of reported and underlying profit before tax |
|
HSBC measures its performance internally on a like-for-like basis by eliminating the effects of foreign currency translation differences, acquisitions, disposals and gains from the dilution of the Group’s interests in associates in 2007, which distort a year-on-year comparison. HSBC refers to this as its underlying performance.
The tables below compare HSBC’s underlying performance in 2008 with 2007, and 2007 with 2006. Equivalent tables are provided for each of HSBC’s customer groups and geographical segments in their respective sections below.
The foreign currency translation differences were mainly due to the strengthening of the US dollar against sterling in the second half of 2008 and its relative weakness against the euro and the Chinese renminbi in 2008 compared with 2007. The Group’s reported profit before tax in 2008 was 62 per cent lower than in 2007, with the effect of the change in foreign currency translation rates making a negligible difference. Comparing 2007 with 2006, the reported profit before tax growth was 10 per
cent, of which 4 per cent was explained by exchange rate movements.
The following acquisitions and disposals, which are listed in chronological order, affected both comparisons:
| • | the acquisition of HSBC’s partner’s shares inlife insurer, Erisa S.A., and property andcasualty insurer, Erisa I.A.R.D. (togetherrenamed ‘HSBC Assurances’) in France inMarch 2007; |
| | |
| • | the deemed disposals of the stakes in Ping AnInsurance (Group) Company of China, Limited(‘Ping An Insurance’), Bank of CommunicationsCo., Limited (‘Bank of Communications’) andIndustrial Bank Co. Limited (‘Industrial Bank’),as a consequence of their share offerings on thedomestic ‘A’ share market in mainland China inthe first half of 2007, and of the stakes inFinanciera Independencia S.A.B. de C.V. (‘Financiera Independencia’) in Mexico andVietnam Technological and Commercial JointStock Bank (‘Techcombank’) following theirshare issues; |
| | |
| • | the disposal of the Hamilton Insurance Company Limited and Hamilton Life AssuranceCompany Limited in the UK in October 2007; |
| | |
| • | the sale of Wealth and Tax Advisory Services toits management in December 2007; |
| | |
| • | the acquisition of the assets, liabilities andoperations of The Chinese Bank Co., Ltd. (‘The Chinese Bank’) in Taiwan in March 2008; |
| | |
| • | the sale of HSBC’s UK merchant acquiringbusiness to a joint venture 49 per cent owned bythe Group in June 2008; and |
| | |
| • | the disposal of seven French regional bankingsubsidiaries in July 2008. |
21
Back to Contents
| H S B C H O L D I N G S P L C |
| |
| Report of the Directors: Operating and Financial Review(continued) |
| | |
| | |
| Reconciliation of reported and underlying profit before tax / Financial summary |
Reconciliation of reported and underlying profit before tax
| | 2008 compared with 2007 | |
| |
|
|
|
|
|
|
|
|
|
|
|
|
|
|
|
|
|
|
| | | | 2007 | | | | | | | | | | | | | | | |
| | | | acquisitions, | | | | 2007 | | 2008 | | | | | | | | | |
| | | | disposals | | | | at 2008 | | acquisitions | | | | | | | | | |
| | 2007 as | | & dilution | | Currency | | exchange | | and | | Underlying | | 2008 as | | Reported | | Underlying | |
| | reported | | gains1 | | translation2 | | rates3 | | disposals1 | | change | | reported | | change | | change | |
| HSBC | US$m | | US$m | | US$m | | US$m | | US$m | | US$m | | US$m | | % | | % | |
| | | | | | | | | | | | | | | | | | | |
| Net interest income | 37,795 | | (389 | ) | (4 | ) | 37,402 | | 250 | | 4,911 | | 42,563 | | 13 | | 13 | |
| Net fee income | 22,002 | | (239 | ) | (152 | ) | 21,611 | | 18 | | (1,605 | ) | 20,024 | | (9 | ) | (7 | ) |
| Other income4 | 19,196 | | (1,232 | ) | (329 | ) | 17,635 | | 3,148 | | (1,688 | ) | 19,095 | | (1 | ) | (10 | ) |
| |
| |
| |
| |
| |
| |
| |
| | | | | |
| Net operating income5 | 78,993 | | (1,860 | ) | (485 | ) | 76,648 | | 3,416 | | 1,618 | | 81,682 | | 3 | | 2 | |
| Loan impairment charges and other credit risk provisions | (17,242 | ) | 31 | | 113 | | (17,098 | ) | (6 | ) | (7,833 | ) | (24,937 | ) | (45 | ) | (46 | ) |
| |
| |
| |
| |
| |
| |
| |
| | | | | |
| Net operating income | 61,751 | | (1,829 | ) | (372 | ) | 59,550 | | 3,410 | | (6,215 | ) | 56,745 | | (8 | ) | (10 | ) |
| Operating expenses (excluding goodwill impairment) | (39,042 | ) | 514 | | 301 | | (38,227 | ) | (198 | ) | (110 | ) | (38,535 | ) | 1 | | – | |
| Goodwill impairment | – | | – | | – | | – | | – | | (10,564 | ) | (10,564 | ) | n/a | | n/a | |
| |
| |
| |
| |
| |
| |
| |
| | | | | |
| Operating profit | 22,709 | | (1,315 | ) | (71 | ) | 21,323 | | 3,212 | | (16,889 | ) | 7,646 | | (66 | ) | (79 | ) |
| Income from associates | 1,503 | | (12 | ) | 107 | | 1,598 | | – | | 63 | | 1,661 | | 11 | | 4 | |
| |
| |
| |
| |
| |
| |
| |
| | | | | |
| Profit before tax | 24,212 | | (1,327 | ) | 36 | | 22,921 | | 3,212 | | (16,826 | ) | 9,307 | | (62 | ) | (73 | ) |
| |
| |
| |
| |
| |
| |
| |
| | | | | |
| | 2007 compared with 2006 | |
| |
|
|
|
|
|
|
|
|
|
|
|
|
|
|
|
|
|
|
| | | | | | | | | | 2007 | | | | | | | | | |
| | | | 2006 | | | | 2006, | | acquisitions | | | | | | | | | |
| | | | acquisitions | | | | at 2007 | | disposals | | Under- | | | | | | | |
| | 2006 as | | and | | Currency | | exchange | | & dilution | | lying | | 2007 as | | Reported | | Underlying | |
| | reported | | disposals1 | | translation2 | | rates6 | | gains1 | | change | | reported | | change | | change | |
| HSBC | US$m | | US$m | | US$m | | US$m | | US$m | | US$m | | US$m | | % | | % | |
| | | | | | | | | | | | | | | | | | | |
| Net interest income | 34,486 | | (3 | ) | 1,086 | | 35,569 | | 794 | | 1,432 | | 37,795 | | 10 | | 4 | |
| Net fee income | 17,182 | | 53 | | 750 | | 17,985 | | (47 | ) | 4,064 | | 22,002 | | 28 | | 23 | |
| Other income4 | 13,698 | | (53 | ) | 733 | | 14,378 | | 1,113 | | 3,705 | | 19,196 | | 40 | | 26 | |
| |
| |
| |
| |
| |
| |
| |
| | | | | |
| Net operating income5 | 65,366 | | (3 | ) | 2,569 | | 67,932 | | 1,860 | | 9,201 | | 78,993 | | 21 | | 14 | |
| Loan impairment charges and other credit risk provisions | (10,573 | ) | – | | (243 | ) | (10,816 | ) | (133 | ) | (6,293 | ) | (17,242 | ) | (63 | ) | (58 | ) |
| |
| |
| |
| |
| |
| |
| |
| | | | | |
| Net operating income | 54,793 | | (3 | ) | 2,326 | | 57,116 | | 1,727 | | 2,908 | | 61,751 | | 13 | | 5 | |
| Operating expenses | (33,553 | ) | 2 | | (1,536 | ) | (35,087 | ) | (397 | ) | (3,558 | ) | (39,042 | ) | (16 | ) | (10 | ) |
| |
| |
| |
| |
| |
| |
| |
| | | | | |
| Operating profit | 21,240 | | (1 | ) | 790 | | 22,029 | | 1,330 | | (650 | ) | 22,709 | | 7 | | (3 | ) |
| Income from associates | 846 | | – | | 20 | | 866 | | (41 | ) | 678 | | 1,503 | | 78 | | 78 | |
| |
| |
| |
| |
| |
| |
| |
| | | | | |
| Profit before tax | 22,086 | | (1 | ) | 810 | | 22,895 | | 1,289 | | 28 | | 24,212 | | 10 | | – | |
| |
| |
| |
| |
| |
| |
| |
| | | | | |
For footnotes, see page 143.
22
Back to Contents
Consolidated financial statements
The consolidated financial statements of HSBC and the separate financial statements of HSBC Holdings have been prepared in accordance with International Financial Reporting Standards (‘IFRSs’) as issued by the International Accounting Standards Board (‘IASB’) and as endorsed by the European Union (‘EU’). EU-endorsed IFRSs may differ from IFRSs as issued by the IASB if, at any point in time, new or amended IFRSs have not been endorsed by the EU. At 31 December 2008, there were no unendorsed standards effective for the year ended 31 December 2008 affecting these consolidated and separate financial statements, and there was no difference between IFRSs endorsed by the EU and IFRSs issued by the IASB in terms of their application to HSBC. Accordingly, HSBC’s financial statements for the year ended 31 December 2008 are prepared in accordance with IFRSs as issued by the IASB.
HSBC uses the US dollar as its presentation currency because the US dollar and currencies linked to it form the major currency bloc in which HSBC transacts its business. Unless otherwise stated, the accounting information presented in this document has been prepared in accordance with IFRSs.
Constant currency
Constant currency comparatives for 2007 and 2006 used in the 2008 and 2007 commentaries, respectively, are computed by retranslating into US dollars, for non-US dollar branches, subsidiaries, joint ventures and associates:
| • | the income statements for 2007 and 2006 at theaverage rates of exchange for 2008 and 2007,respectively; and |
| | |
| • | the balance sheets at 31 December 2007 and2006 at the prevailing rates of exchange on31 December 2008 and 2007, respectively. |
No adjustment has been made to the exchange rates used to translate foreign currency denominated assets and liabilities into the functional currencies of any HSBC branches, subsidiaries, joint ventures or associates. When reference is made to ‘constant currency’ in tables or commentaries, comparative data reported in the functional currencies of HSBC’s operations have been translated at the appropriate exchange rates applied in the current period on the basis described above.
23
Back to Contents
| H S B C H O L D I N G S P L C |
| |
| Report of the Directors: Operating and Financial Review(continued) |
| | |
| | |
| Financial summary > Income statement |
| Income statement | | | | | | | | | |
| | 2008 | | | 2007 | | | 2006 | | |
| | US$m | | | US$m | | | US$m | | |
| | | | | | | | | | |
| Interest income | 91,301 | | | 92,359 | | | 75,879 | | |
| Interest expense | (48,738 | ) | | (54,564 | ) | | (41,393 | ) | |
| Net interest income | 42,563 | | | 37,795 | | | 34,486 | | |
| Fee income | 24,764 | | | 26,337 | | | 21,080 | | |
| Fee expense | (4,740 | ) | | (4,335 | ) | | (3,898 | ) | |
| Net fee income | 20,024 | | | 22,002 | | | 17,182 | | |
| Trading income excluding net interest income | 847 | | | 4,458 | | | 5,619 | | |
| Net interest income on trading activities | 5,713 | | | 5,376 | | | 2,603 | | |
| Net trading income | 6,560 | | | 9,834 | | | 8,222 | | |
| Changes in fair value of long-term debt issued and related derivatives | 6,679 | | | 2,812 | | | (35 | ) | |
| Net income/(expense) from other financial instruments designated at fair value | (2,827 | ) | | 1,271 | | | 692 | | |
| Net income from financial instruments designated at fair value | 3,852 | | | 4,083 | | | 657 | | |
| Gains less losses from financial investments | 197 | | | 1,956 | | | 969 | | |
| Gains arising from dilution of interests in associates | – | | | 1,092 | | | – | | |
| Dividend income | 272 | | | 324 | | | 340 | | |
| Net earned insurance premiums | 10,850 | | | 9,076 | | | 5,668 | | |
| Gains on disposal of French regional banks | 2,445 | | | – | | | – | | |
| Other operating income | 1,808 | | | 1,439 | | | 2,546 | | |
| |
| | |
| | |
| | |
| Total operating income | 88,571 | | | 87,601 | | | 70,070 | | |
| Net insurance claims incurred and movement in liabilities to policyholders . | (6,889 | ) | | (8,608 | ) | | (4,704 | ) | |
| |
| | |
| | |
| | |
| Net operating income before loan impairment charges and othercredit risk provisions | 81,682 | | | 78,993 | | | 65,366 | | |
| Loan impairment charges and other credit risk provisions | (24,937 | ) | | (17,242 | ) | | (10,573 | ) | |
| |
| | |
| | |
| | |
| Net operating income | 56,745 | | | 61,751 | | | 54,793 | | |
| |
| | |
| | |
| | |
| Employee compensation and benefits | (20,792 | ) | | (21,334 | ) | | (18,500 | ) | |
| General and administrative expenses | (15,260 | ) | | (15,294 | ) | | (12,823 | ) | |
| Depreciation and impairment of property, plant and equipment | (1,750 | ) | | (1,714 | ) | | (1,514 | ) | |
| Amortisation and impairment of intangible assets | (733 | ) | | (700 | ) | | (716 | ) | |
| Goodwill impairment | (10,564 | ) | | – | | | – | | |
| |
| | |
| | |
| | |
| Total operating expenses | (49,099 | ) | | (39,042 | ) | | (33,553 | ) | |
| |
| | |
| | |
| | |
| Operating profit | 7,646 | | | 22,709 | | | 21,240 | | |
| Share of profit in associates and joint ventures | 1,661 | | | 1,503 | | | 846 | | |
| |
| | |
| | |
| | |
| Profit before tax | 9,307 | | | 24,212 | | | 22,086 | | |
| Tax expense | (2,809 | ) | | (3,757 | ) | | (5,215 | ) | |
| |
| | |
| | |
| | |
| Profit for the year | 6,498 | | | 20,455 | | | 16,871 | | |
| |
| | |
| | |
| | |
| Profit attributable to shareholders of the parent company | 5,728 | | | 19,133 | | | 15,789 | | |
| Profit attributable to minority interests | 770 | | | 1,322 | | | 1,082 | | |
| | | | | | | | | | |
2008 compared with 2007
Reported pre-tax profits in 2008 fell by 62 per cent to US$9.3 billion and earnings per share declined to US$0.47. In a year characterised by a significant deterioration in the credit markets and by unprecedented illiquidity in most asset classes, return on average total shareholders’ equity fell to 4.7 per cent.
The fall in profit before tax was exacerbated by recognition of a US$10.6 billion impairment
charge which wrote off in full the goodwill carried on the balance sheet in respect of the Group’s investment in its North America Personal Financial Services business. This non-cash charge arose substantially in the second half of 2008 as heightened risk premia in the market increased discount rates and cash flows estimated from ongoing activities fell as the US economy continued to decline and the outlook for the business deteriorated.
Asian performance was strong, generating profit
24
Back to Contents
before tax of US$11.9 billion, broadly in line with results excluding the dilution gains which arose in 2007 when HSBC did not participate in share offerings by its mainland Chinese associates. Within Asia, Global Banking and Markets’ results were strongly ahead, driven by foreign exchange, Rates and securities services. Balance Sheet Management revenues rose significantly from positioning ahead of interest rate cuts, and were especially strong in Europe despite losses from the defaults of certain financial sector companies.
With the exception of Personal Financial Services, which incurred significant losses in North America, all customer groups remained profitable. Commercial Banking and Private Banking delivered results broadly in line with 2007, while Global Banking and Markets’ profits declined.
Performance was overshadowed by a US$7.7 billion rise in loan impairment charges and other credit risk provisions, largely from the US consumer finance business, and a further US$5.4 billion in trading write-downs on illiquid legacy positions in credit trading, leveraged and acquisition finance and monoline credit exposure in Global Banking and Markets. Increases in loan impairment charges and other credit risk provisions in Personal Financial Services and Commercial Banking, the latter rising rapidly in the second half of 2008 from a low base, occurred as the global economy slowed. Global Banking and Markets also experienced a rise in loan impairment charges and other credit risk provisions as refinancing options dried up for a number of companies as the market for long-term asset financing became increasingly illiquid. The market turmoil also led to impairments on equity securities in the available-for-sale portfolio.
| | The following items were significant: |
| | |
| • | the non-recurrence of US$1.1 billion of gains which arose in 2007 on the dilution of the Group’s stakes in various associates; |
| | |
| • | a US$3.9 billion increase (from US$2.8 billion in 2007 to US$6.7 billion) in fair value gains from wider credit spreads recorded predominantly on HSBC’s own long-term debt designated at fair value. These gains are reported in the ‘Other’ segment, are not allocated to customer groups and are not included within regulatory capital calculations; |
| | |
| • | the gain of US$2.4 billion on the sale of the French regional banks; and |
| | |
| • | a charge against trading income of US$984 million following the alleged fraud in December 2008 relating to Bernard L Madoff |
Investment Securities LLC (‘Madoff Securities’).
On an underlying basis, profit before tax declined by 73 per cent compared with 2007. The difference between the reported and underlying results is explained on page 21. Except where stated otherwise, the commentaries in the Financial Summary are on an underlying basis.
2007 compared with 2006
The strength of HSBC’s geographically diversified business model was demonstrated by profit growth in a year in which financial markets experienced significant dislocation and the credit environment, particularly in the US, deteriorated markedly. Pre-tax profits in 2007 increased by 10 per cent to US$24.2 billion and earnings per share rose by 18 per cent to US$1.65. Despite difficult market conditions, the return on shareholders’ equity exceeded 15 per cent, capital ratios remained strong, revenue growth was in double digits and the cost efficiency ratio improved. For the first time in recent years, pre-tax profits from the Group’s emerging markets operations exceeded 60 per cent of total profits.
On an underlying basis, profit before tax was broadly in line with 2006.
The Group had a notably strong year in most emerging markets. Vigorous economic activity, strong trade flows and buoyant equity markets helped drive broadly based profit growth, with profits in all customer groups ahead of 2006. A strong performance in Asia in all customer groups compensated for the effect of deteriorating conditions in the US and slower growth in other mature markets. Commercial Banking and Private Banking again delivered record results, as did many of the businesses within Global Banking and Markets, including foreign exchange, payments and cash management, equities, HSBC Global Asset Management and securities services.
The deterioration in credit quality which began in 2006 in a particular portfolio of purchased mortgages in the US consumer finance business widened in the second half of 2007, leading to significantly increased loan impairment charges in the US as economic conditions deteriorated and global market liquidity for asset-backed securities dried up. This lack of liquidity adversely affected credit trading and asset-backed securities businesses within Global Banking and Markets, where de-leveraging of traded markets contributed to volatility and lower valuations. The effect of these factors was partially offset by a gain on HSBC’s own debt designated at fair value.
25
Back to Contents
| H S B C H O L D I N G S P L C |
| |
| Report of the Directors: Operating and Financial Review(continued) |
| | |
| | |
| Financial summary > Group performance > Net interest income / net fee income |
Group performance by income and expense item
Net interest income
| | 2008 | | 2007 | | 2006 | |
| Net interest income1(US$m) | 42,563 | | 37,795 | | 34,486 | |
| Average interest-earning assets (US$m) | 1,466,622 | | 1,296,701 | | 1,113,404 | |
| Gross interest yield2(per cent) | 6.23 | | 7.12 | | 6.82 | |
| Net interest spread3(per cent) | 2.87 | | 2.86 | | 2.94 | |
| Net interest margin4(per cent) | 2.90 | | 2.91 | | 3.10 | |
| 1 | Net interest income includes the cost of funding trading assets, while the related external revenues are reported in trading income. In HSBC’s customer group results, the cost of funding trading assets is included with Global Banking and Markets’ net trading income as an interest expense. |
| | |
| 2 | Gross interest yield is the average annualised interest rate earned on average interest-earning assets (‘AIEA’). |
| | |
| 3 | Net interest spread is the difference between the average annualised interest rate earned on AIEA, net of amortised premiums and loan fees, and the average annualised interest rate paid on average interest-bearing funds. |
| | |
| 4 | Net interest margin is net interest income expressed as an annualised percentage of AIEA. |
| | |
2008 compared with 2007
Reported net interest income of US$42.6 billion rose by 13 per cent compared with 2007, 13 per cent on an underlying basis.
Growth in net interest income was driven by significantly higher revenues in Balance Sheet Management, in part reflecting favourable positioning to take advantage of falling interest rates. Lending and deposit balances also grew strongly, while progressive reductions in central bank reference rates led to a decline in both asset yields and the cost of funds. Overall, spreads narrowed on an underlying basis.
Average interest-earning assets increased to US$1,467 billion, led by growth in average loans and advances to customers. This was mainly due to an increase in average term lending balances in Europe and Asia.
An increase in average interest-bearing liabilities was driven by growth in average customer accounts, notably in Europe. HSBC attracted substantial deposits from customers who valued HSBC’s perceived strength at a time of global financial market turmoil and customers also expressed a preference for security and liquidity following declines in equity markets.
Interest rates were cut aggressively in many countries during 2008, as central banks reduced their reference rates as part of stimulus programmes introduced in response to deteriorating economic conditions. This contributed to a decline in asset yields. The cost of funds also fell, but this was less significant than the decline in yields as spreads narrowed overall on an underlying basis.
In North America, net interest income was also adversely affected by rises in loan modifications designed to reduce the payment burden on the Group’s customers, and impaired loans.
2007 compared with 2006
Reported net interest income increased by 10 per cent to US$37.8 billion, 4 per cent on an underlying basis. The increase was driven by an underlying 10 per cent rise in average interest earning assets to US$1,297 billion, partly offset by a decline in spreads as funding costs rose more than yields.
The growth in average interest earning assets was due to a 6 per cent rise in average loans and advances to customers. HSBC continued to focus on competitive liability products, with average deposits and current account balances rising by 16 per cent, driven by customer acquisition in Rest of Asia-Pacific and deposit balance growth in North America, Europe and Hong Kong.
Balance Sheet Management revenues increased compared with 2006, particularly in Hong Kong and Rest of Asia-Pacific as deposits grew strongly.
Lending spreads in 2007 reflected the continued benign corporate and commercial credit conditions that have existed in the last three or four years. However, some upward re-pricing occurred in personal lending as a result of growing delinquency and restricted credit appetite and, as market liquidity diminished in the last four months of 2007, the value and cost of funds, including the cost of funding HSBC’s trading activities, rose markedly.
26
Back to Contents
Net fee income
| | 2008 | | 2007 | | 2006 | |
| | US$m | | US$m | | US$m | |
| Cards | 5,844 | | 6,496 | | 5,367 | |
| Account services | 4,353 | | 4,359 | | 3,633 | |
| Funds under management | 2,757 | | 2,975 | | 2,718 | |
| Insurance | 1,771 | | 1,836 | | 1,358 | |
| Broking income | 1,738 | | 2,012 | | 1,354 | |
| Credit facilities | 1,313 | | 1,138 | | 922 | |
| Global custody | 1,311 | | 1,404 | | 797 | |
| Imports/exports | 1,014 | | 866 | | 780 | |
| Remittances | 610 | | 556 | | 472 | |
| Unit trusts | 502 | | 875 | | 520 | |
| Corporate finance | 381 | | 409 | | 255 | |
| Underwriting | 325 | | 367 | | 286 | |
| Trust income | 325 | | 299 | | 248 | |
| Taxpayer financial services | 168 | | 252 | | 263 | |
| Maintenance income on operating leases | 130 | | 139 | | 122 | |
| Mortgage servicing | 120 | | 109 | | 97 | |
| Other | 2,102 | | 2,245 | | 1,888 | |
| |
| |
| |
| |
| Total fee income | 24,764 | | 26,337 | | 21,080 | |
| Less: fee expense | (4,740 | ) | (4,335 | ) | (3,898 | ) |
| |
| |
| |
| |
| Net fee income | 20,024 | | 22,002 | | 17,182 | |
| |
| |
| |
| |
| | | | | | |
2008 compared with 2007
Reported net fee income declined by 9 per cent to US$20 billion, 7 per cent lower on an underlying basis.
Lower equity market-related revenues, notably in Hong Kong, were driven by weakened investor sentiment, and reflected in the fall of 17 per cent in the aggregate of broking income, global custody and unit trust income. Similarly, fund management fees declined as equity markets retreated and lower performance fees were earned.
HSBC announced revisions to its credit card fee charging policies in the US in 2007, and this fed through as expected in the form of a substantial decline in overlimit fees, further compounded by lower cash advance and interchange fee income as a result of reduced volumes. In the UK, the divestment in 2008 of the card acquiring business resulted in reduced card acquiring fees. Offsetting these factors were rises in card fees in Hong Kong, the Middle East, India and Turkey.
Fee income from credit facilities rose, notably in the Middle East, in line with customer volumes. Growth in fee income from trade and supply chain products reflected higher volumes and customer acquisition in India and, to a greater extent in the Middle East, increased activity driven by commodity price inflation.
2007 compared with 2006
Reported net fee income increased by 28 per cent to US$22 billion, 23 per cent on an underlying basis.
The rise in card fee income was mainly in the US and Mexico. Income growth in the US was driven by higher late and over-limit fees in addition to higher balances. Revenue from enhancement services on cards also increased. In Mexico, the credit card business continued to grow, both in balances and in transaction volumes.
Higher income from funds under management products, broking services, unit trusts and global custody was driven by buoyant stock markets in Hong Kong and throughout the Rest of Asia-Pacific region, enhanced by the launch of new investment schemes.
Increased account services income was due to higher levels of customer activity in Europe, North America and Latin America. In the US, growth in credit card balances triggered an increased use of the Intellicheck service. In the UK, growth in the sale of fee-based packaged accounts contributed to a rise in account services fees.
An increase in insurance fees was driven by higher life insurance commission income, boosted by new product offerings in Hong Kong.
27
Back to Contents
| H S B C H O L D I N G S P L C |
| |
| Report of the Directors: Operating and Financial Review(continued) |
| | |
| | |
| Financial summary > Group performance > Net trading income / Net income from financial instruments at FV |
| Net trading income | | | | | | | |
| |
| | | 2008 | | 2007 | | 2006 | |
| | | US$m | | US$m | | US$m | |
| Trading activities | | 2,988 | | 4,521 | | 5,465 | |
| Net interest income on trading activities | | 5,713 | | 5,376 | | 2,603 | |
| Other trading income – hedge ineffectiveness: | | | | | | | |
| – on cash flow hedges | | (40 | ) | (77 | ) | (122 | ) |
| – on fair value hedges | | 5 | | 19 | | 16 | |
| Non-qualifying hedges | | (1,122 | ) | (5 | ) | 260 | |
| Losses on collapse of Madoff Securities | | (984 | ) | – | | – | |
| | |
| |
| |
| |
| Net trading income1,2 | | 6,560 | | 9,834 | | 8,222 | |
| | |
| |
| |
| |
| 1 | The cost of internal funding of trading assets was US$5,547 million (2007: US$5,433 million; 2006: US$2,658 million) and is excluded from the reported ‘Net trading income’ line and included in ‘Net interest income’. However, this cost is reinstated in ‘Net trading income’ in HSBC’s customer group and global business reporting. |
| | |
| 2 | Net trading income includes US$529 million (2007: US$34 million), associated with changes in the fair value of issued structured notes and other hybrid instrument liabilities derived from movements in HSBC issuance spreads. |
| |
2008 compared with 2007
Reported net trading income fell by 33 per cent to US$6.6 billion, 32 per cent lower on an underlying basis.
Net income from trading activities declined by 81 per cent, driven by the continuing effect of the market turmoil which led to US$5.4 billion of write-downs on legacy monoline credit exposures, credit trading and leveraged and acquisition finance loans. More information about the losses, the associated assets and residual exposure is provided in ‘Impact of Market Turmoil’ on pages 144 to 162.
Record foreign exchange trading income was due to increased customer volumes and market volatility across all regions, as investors sought to reduce risk in the second half of 2008, driving growth in global foreign exchange trading as demand for assets denominated in US dollars and Japanese Yen increased.
Rates trading income rose substantially, with record revenues in the first half of 2008 due to favourable positioning against movements in interest rate yield curves as central banks responded to the market turmoil by lowering short-term interest rates. Revenues were also boosted by an increased number of deals, widening spreads and increased customer demand for trading and hedging products.
The decline in equities trading income reflected weaker equity markets, particularly in Hong Kong, where demand for structured equity products fell. In addition, following the alleged fraud at Madoff Securities, HSBC wrote off the value of units it held in funds that had invested with the company and took a US$984 million charge. The units had been acquired in connection with various financing transactions HSBC had entered into with institutional clients.
The decline in non-qualifying hedges related to mark-to-market losses on cross-currency swaps as the US dollar appreciated and on interest rate swaps as interest rates fell in late 2008.
Widening credit spreads led to further gains on credit default swap transactions in parts of the Global Banking portfolio.
2007 compared with 2006
Reported net trading income increased by 20 per cent to US$9.8 billion, 13 per cent on an underlying basis.
Net interest income on trading activities more than doubled, mainly due to increased holdings of shorter maturity assets in the UK.
Net trading income was significantly affected by a total of US$2.1 billion of write-downs on credit trading, leveraged and acquisition financing positions, and monoline credit exposures, resulting from deterioration in the credit market in the second half of 2007. The write-downs arose mainly in the US and, to a lesser extent, the UK.
Income from foreign exchange trading increased by 40 per cent to a record result. Revenues were driven by higher customer volumes, against the backdrop of a weakening US dollar and greater market volatility.
Trading income from structured derivatives fell by 26 per cent. The structured credit business incurred losses in the second half of the year in the difficult trading conditions. This was partly offset by higher trading income from other structured derivative products, following investment made in technical expertise and systems in previous years.
Record results were achieved in the equities business, reflecting strong growth across all regions, particularly Europe.
28
Back to Contents
Net income from financial instruments designated at fair value
| | | | 2008 | | | 2007 | | | 2006 | | |
| | | | US$m | | | US$m | | | US$m | | |
| Net income arising from: | | | | | | | | | |
| – | | financial assets held to meet liabilities under insurance and | | | | | | | | | |
| | | investment contracts | (5,064 | ) | | 2,056 | | | 1,552 | | |
| – | | liabilities to customers under investment contracts | 1,751 | | | (940 | ) | | (1,008 | ) | |
| – | | HSBC’s long-term debt issued and related derivatives | 6,679 | | | 2,812 | | | (35 | ) | |
| | | – change in own credit spread on long-term debt | 6,570 | | | 3,055 | | | (388 | ) | |
| | | – other changes in fair value1 | 109 | | | (243 | ) | | 353 | | |
| – | | other instruments designated at fair value and related derivatives | 486 | | | 155 | | | 148 | | |
| | | |
| | |
| | |
| | |
| Net income from financial instruments designated at fair value | 3,852 | | | 4,083 | | | 657 | | |
| |
| | |
| | |
| | |
| Financial assets designated at fair value at 31 December | 28,533 | | | 41,564 | | | 20,573 | | |
| Financial liabilities designated at fair value at 31 December | 74,587 | | | 89,939 | | | 70,211 | | |
| 1 | Includes gains and losses arising from changes in the fair value of derivatives that are managed in conjunction with HSBC’s long-term debt issued. |
| |
HSBC designates certain financial instruments at fair value to remove or reduce accounting mismatches in measurement or recognition, or where financial instruments are managed and their performance is evaluated together on a fair value basis. All income and expense from financial instruments designated at fair value are included in this line except for interest arising from HSBC’s issued debt securities and related derivatives managed in conjunction with those debt securities, which is recognised in ‘Interest expense’.
HSBC principally uses the fair value designation in the following instances:
| • | for certain fixed-rate long-term debt issueswhose rate profile has been changed to floatingthrough interest rate swaps as part of adocumented interest rate management strategy.
Approximately US$59 billion (2007:US$66 billion) of the Group’s debt issues havebeen accounted for using the fair value option. The movement in fair value of these debt issuesincludes the effect of own credit spread changesand any ineffectiveness in the economicrelationship between the related swaps andown debt. As credit spreads widen or narrow,accounting profits or losses are booked,respectively. The size and direction of theaccounting consequences of changes in owncredit spread and ineffectiveness can be volatilefrom year to year, but do not alter the cash flowsenvisaged as part of the documented interest ratemanagement strategy; as a consequence of this,gains and losses arising from changes in owncredit spread on long-term debt are not regardedinternally as part of managerial performance.Similarly, such gains and losses are ignored inthe calculation of regulatory capital. |
| • | for approximately US$11 billion (2007:US$17 billion) of financial assets held to meetliabilities under insurance contracts, and certainliabilities under investment contracts withdiscretionary participation features; and |
| | |
| • | for approximately US$7 billion (2007:US$14 billion) of financial assets held to meetliabilities under unit-linked and other investmentcontracts. |
2008 compared with 2007
Reported net income from financial instruments designated at fair value decreased by US$231 million to US$3.9 billion in 2008.
Credit spreads widened significantly during the year, leading to US$6.6 billion of positive fair value movements on certain long-term debt issued by the Group, compared with US$3.1 billion in 2007. These fair value movements will fully reverse over the life of the debt. The cumulative fair value adjustment at 31 December 2008 amounted to US$8.0 billion.
A negative movement of US$5.1 billion was recorded in the fair value of assets held to back insurance and investment contracts, compared with a positive movement of US$2.1 billion in 2007. This reflected investment losses driven by falling equity and bond markets, predominantly affecting the value of assets held in unit-linked and participating funds in Hong Kong, France and the UK. The negative movement in fair value is partially offset by a corresponding reduction in ‘Net insurance claims and movement in liabilities to policyholders’, where unit-linked policyholders in particular participate in the investment performance experienced on the investment portfolios held to support the liabilities.
29
Back to Contents
| H S B C H O L D I N G S P L C |
| |
| Report of the Directors: Operating and Financial Review(continued) |
| | |
| | |
| Financial summary > Group performance > Gains less losses from financial investments / Dilution gains / Net earned insurance premiums |
For assets held to meet liabilities under investment contracts the corresponding reduction in the liability to customers is also reported within net income from financial instruments designated at fair value. A reduction of US$1.8 billion in the movement in fair value of liabilities held under investment contracts compared with an increase in the fair value of liabilities of US$940 million in 2007.
2007 compared with 2006
Credit spreads widened significantly in the second half of 2007, leading to a substantial increase in net income from financial instruments designated at fair value compared with 2006. This was primarily driven by a widening in credit spreads on certain fixed-rate long-term debt issued by HSBC Holdings
and its subsidiaries. These cumulative gains will fully reverse over the life of the debt. The cumulative adjustments to reserves (when the policy is applied for the first time) and the income statement (subsequent applications of the policy), reflecting the change in own credit spread since the fair value option was available, was US$1.6 billion after taking into account the US$3.1 billion credit in 2007.
Income from assets held to meet liabilities under insurance and investment contracts also rose, by 32 per cent, reflecting primarily premium growth and higher investment returns on the portfolios held by the insurance businesses in the UK and Hong Kong. The change in fair value of liabilities under investment contracts declined by 7 per cent.
Gains less losses from financial investments
| | 2008 | | 2007 | | 2006 | |
| | US$m | | US$m | | US$m | |
| Net gain from disposal of: | | | | | | |
| – debt securities | 19 | | 120 | | 252 | |
| – equity securities | 1,216 | | 1,864 | | 702 | |
| – other financial investments | 4 | | 14 | | 15 | |
| |
| |
| |
| |
| | 1,239 | | 1,998 | | 969 | |
| Impairment of available-for-sale equity securities | (1,042 | ) | (42 | ) | – | |
| |
| |
| |
| |
| Gains less losses from financial investments | 197 | | 1,956 | | 969 | |
| |
| |
| |
| |
2008 compared 2007
Reported gains less losses of US$197 million from financial investments during 2008 were 90 per cent lower than in 2007, 93 per cent lower on an underlying basis. A reduction in net gains from disposals was compounded by significant impairments recognised on equity securities held in the available-for-sale portfolio as certain investments were marked down to reflect the prevailing market conditions.
The redemption of Visa Inc. (‘Visa’) shares following its IPO resulted in significant gains, and there were further gains from the sale of MasterCard Inc. (‘MasterCard’) shares. These were more than offset by losses in Principal Investments and the non-recurrence of various significant gains in 2007, mostly in respect of Euronext, the European stock exchange, and a credit bureau in Brazil.
Declining equity markets caused impairments to be recognised against a number of strategic investments in Asia, held in the available-for-sale portfolio and on private equity investments, mainly in Europe. The market turmoil in the US also led to impairments against investments in various US financial institutions.
2007 compared with 2006
Net gains of US$2.0 billion were reported by HSBC as a result of the disposal of financial investments during 2007, a two-fold increase over 2006 and 93 per cent higher on an underlying basis.
The increase was driven by the sale of shares and various equity investments in all regions, including holdings in Euronext (the European stock exchange), MasterCard in North America and a credit bureau in Brazil. In Private Banking, a gain of US$91 million arose from the sale of a further holding in the Hermitage Fund, compared with US$117 million in 2006. The gains in 2007 were marginally offset by the non-recurrence of a US$101 million gain on the sale of part of HSBC’s stake in UTI Bank Limited in 2006.
30
Back to Contents
Gains arising from dilution of interests in associates
In 2007, HSBC’s associates, Industrial Bank, Ping An Insurance and Bank of Communications in mainland China, Financiera Independencia in Mexico and Techcombank in Vietnam issued new shares for which HSBC did not subscribe. As a
Net earned insurance premiums
consequence of the new monies raised by the associates, HSBC’s share of their underlying assets increased by US$1.1 billion, notwithstanding the reduction in the Group’s interests. These gains were presented in the income statement as ‘Gains arising from dilution of interests in associates’, and should be regarded as exceptional.
| | 2008 | | 2007 | | 2006 | |
| | US$m | | US$m | | US$m | |
| Gross insurance premium income | 12,547 | | 11,001 | | 6,455 | |
| Reinsurance premiums | (1,697 | ) | (1,925 | ) | (787 | ) |
| |
| |
| |
| |
| Net earned insurance premiums | 10,850 | | 9,076 | | 5,668 | |
| |
| |
| |
| |
2008 compared with 2007
Reported net earned insurance premiums amounted to US$10.9 billion, 20 per cent higher than in 2007. HSBC acquired the remaining interest in HSBC Assurances in France in March 2007 and, in October 2007, sold the Hamilton Insurance Company Limited and Hamilton Life Assurance Company Limited in the UK. On an underlying basis, net earned insurance premiums increased by 14 per cent.
Growth in net earned insurance premiums was driven by a continued strong performance from the UK life assurance business, mainly as a result of higher sales of the Guaranteed Income Bond, a non-linked product that was launched in June 2007. The introduction of enhanced life assurance benefits to certain pension products, which led to these products being reclassified as insurance contracts, also resulted in higher premiums.
The Hong Kong insurance business also performed well with respect to premium growth, due to stronger sales of products with discretionary participation features (‘DPF’) and an increase in regular premiums partly offset by a reduction in unit-linked premiums.
In France, HSBC Assurances performed well in a declining market, as three promotional campaigns during the year contributed to growth in sales of policies with DPF. However, a significant one-off reinsurance transaction undertaken during 2008 caused net earned insurance premiums to decrease compared with 2007.
2007 compared with 2006
Reported net earned insurance premiums of US$9.1 billion were 60 per cent higher than in 2006, boosted by HSBC’s acquisition in the first half of 2007 of the remaining shares in HSBC Assurances in France and the purchase of HSBC Bank Panama in Central America in late 2006. Underlying net insurance premiums grew by 21 per cent.
Growth in net earned insurance premiums was achieved in all regions except North America, primarily from new business growth in the life insurance business in Europe, Hong Kong and Latin America. An increase in net earned premiums was recorded in the UK due to higher sales of Guaranteed Income Bonds and the introduction of enhanced death benefits to pension contracts. New product launches also aided growth in Hong Kong. In Latin America, higher premiums in Brazil were driven by increased sales of pension products with linked-life policies.
In non-life insurance, the UK benefited from a decision to reduce the proportion of risk and corresponding premiums ceded to reinsurers compared with 2006. The Latin American business also performed well, led by growth in motor premiums in Argentina. However, results in North America declined, as a reduction in loan volumes led to a fall in credit insurance sales and HSBC stopped reinsuring credit insurance for other lenders.
31
Back to Contents
| H S B C H O L D I N G S P L C |
| |
| Report of the Directors: Operating and Financial Review(continued) |
| | |
| | |
| Financial summary > Group performance > Other operating income / Net insurance claims incurred |
Other operating income
| | 2008 | | 2007 | | 2006 | |
| | US$m | | US$m | | US$m | |
| Rent received | 606 | | 630 | | 687 | |
| Gains/(losses) recognised on assets held for sale | (130 | ) | 5 | | 28 | |
| Valuation gains/(losses) on investment properties | (92 | ) | 152 | | 164 | |
| Gain on disposal of property, plant and equipment, intangible assets and non-financial investments | 465 | | 213 | | 781 | |
| Change in present value of in-force long-term insurance business | 286 | | (145 | ) | 40 | |
| Gain on repurchase of 8 Canada Square | 416 | | – | | – | |
| Other | 257 | | 584 | | 846 | |
| |
| |
| |
| |
| Other operating income | 1,808 | | 1,439 | | 2,546 | |
| |
| |
| |
| |
2008 compared with 2007
Reported other operating income of US$1.8 billion was 26 per cent higher than in 2007. This included gains of US$425 million on the sale of the card merchant acquiring business in the UK and US$71 million on the sale of HSBC’s entire stake in Financiera Independencia, a Mexican consumer lending company. On an underlying basis, other operating income fell by 23 per cent.
The difficult property market conditions in the UK led to a loss in value of a property fund, lower income from the sale of property fund assets and a reduction in Group real estate disposals in 2008. Similarly, in Hong Kong revaluation gains on investment properties did not recur.
Life assurance enhancements to pension products resulted in increased present value of in-force long-term insurance (‘PVIF’) business, which also benefited from the non-recurrence of regulatory changes in 2007 in the UK.
During 2008, HSBC recognised a gain of US$416 million in respect of the purchase of the subsidiary of Metrovacesa which owned the property and long leasehold comprising 8 Canada Square, London. See Note 23 on the Financial Statements.
Other operating income declined, driven by losses on sale of the Canadian vehicle finance business and other loan portfolios in 2008, in addition to the non-recurrence of gains on disposal of fixed assets and private equity investments in 2007.
2007 compared with 2006
Reported other operating income of US$1.4 billion was 43 per cent lower than in 2006, 51 per cent lower on an underlying basis.
Significant decreases in gain on disposal of property and other income were driven by lower proceeds from the sale of real estate in the declining US property market. This was compounded by the non-recurrence of income earned on asset disposals in 2006, including the sale of the former head office building of Hang Seng Bank in Hong Kong and properties in Japan and India, and the transfer of the credit card acquiring business into a joint venture with Global Payments Inc. A gain on the sale and leaseback of a London building in 2007 and the non-recurrence of a loss on sale on asset disposals in 2006 partially offset these factors.
Although HSBC sold its Canary Wharf headquarters building at 8 Canada Square in 2007, the gain remained unrecognised as the Group continued to provide bridge finance for the debt portion of the transaction.
PVIF business declined, primarily due to a change in the calculation methodology employed in the UK as HSBC implemented regulatory changes to the rules governing the calculation of insurance liabilities. This had a marginally positive effect on profit as there was a corresponding reduction in policyholder liabilities. Income rose in Mexico due to a refinement of the income recognition methodology in respect of long-term insurance contracts.
32
Back to Contents
Net insurance claims incurred and movement in liabilities to policyholders
| | 2008 | | 2007 | | 2006 | |
| | US$m | | US$m | | US$m | |
| Insurance claims incurred and movement in liabilities to policyholders: | | | | | | |
| – gross | 9,206 | | 9,550 | | 5,072 | |
| – reinsurers’ share | (2,317 | ) | (942 | ) | (368 | ) |
| |
| |
| |
| |
| – net1 | 6,889 | | 8,608 | | 4,704 | |
| |
| |
| |
| |
| 1 | Net insurance claims incurred and movement in liabilities to policyholders arise from both life and non-life insurance business. For non-life business, amounts reported represent the cost of claims paid during the year and the estimated cost of notified claims. For life business, the main element of claims is the liability to policyholders created on the initial underwriting of the policy and any subsequent movement in the liability that arises, primarily from the attribution of investment performance to savings-related policies. Consequently, claims rise in line with increases in sales of savings-related business and with investment market growth. |
2008 compared with 2007
Reported net insurance claims incurred and movement in liabilities to policyholders decreased by 20 per cent to US$6.9 billion. HSBC acquired the remaining interest in HSBC Assurances in France in March 2007 and, in October 2007, sold the Hamilton Insurance Company Limited and Hamilton Life Assurance Company Limited in the UK. On an underlying basis, net insurance claims incurred and movement in liabilities to policyholders fell by 22 per cent.
The reduction in net insurance claims incurred and movement in liabilities to policyholders primarily reflected the impact of markedly weaker investment markets worldwide. This led to a reduction in liabilities to policyholders on unit-linked and, to a certain extent, participating policies where policyholders participate in the investment performance of the assets supporting the liabilities. As noted above, the losses experienced on the assets held to support insurance contract liabilities are reported in ‘Net income from financial instruments designated at fair value’.
The decline arising from market value movements was partially offset by an increase in claims incurred and movement in liabilities to policyholders driven by new business growth, most significantly in France, the UK and Hong Kong. In addition, 2007 was affected by the implementation of an FSA regulatory change, which led to lower gross liability valuations in that year, along with a reduction in the corresponding reinsurers’ share.
A significant increase in the reinsurers’ share of claims incurred and movement in liabilities to policyholders was primarily driven by the above regulatory change plus an increase in a reserve provision on a unit-linked product in Hong Kong, which was fully reinsured. In addition, a significant one-off reinsurance transaction was undertaken in France during 2008.
2007 compared with 2006
Reported net insurance claims incurred and movement in liabilities to policyholders of US$8.6 billion were 83 per cent higher than in 2006 following the acquisition of the remaining shares in HSBC Assurances in France in March 2007 and HSBC Bank Panama in late 2006. The increase was 32 per cent on an underlying basis.
Growth in net insurance claims incurred and movement in liabilities to policyholders was largely driven by the life insurance business. This reflected a combination of business growth, and was in line with higher net earned insurance premiums and, where policyholders participate in the investment performance of the assets supporting the liabilities, higher investment returns on unit-linked and participating policies. This was most notable in Hong Kong, the UK and Brazil. There was an offsetting increase in ‘Net income from financial instruments designated at fair value’ which reflected these investment returns. In addition, FSA rule changes in the UK led to a lower valuation of the liabilities to policyholders on life policies.
33
Back to Contents
| H S B C H O L D I N G S P L C |
| |
| Report of the Directors: Operating and Financial Review(continued) |
| | |
| | |
| Financial summary > Group performance > Loan impairment charges |
Loan impairment charges and other credit risk provisions
| | 2008 | | | 2007 | | | 2006 | | |
| | US$m | | | US$m | | | US$m | | |
| Loan impairment charges | | | | | | | | | |
| New allowances net of allowance releases | 24,965 | | | 18,182 | | | 11,326 | | |
| Recoveries of amounts previously written off | (834 | ) | | (1,005 | ) | | (779 | ) | |
| |
| | |
| | |
| | |
| | 24,131 | | | 17,177 | | | 10,547 | | |
| | | | | | | | | | |
| Individually assessed allowances | 2,064 | | | 796 | | | 458 | | |
| Collectively assessed allowances | 22,067 | | | 16,381 | | | 10,089 | | |
| | | | | | | | | | |
| Impairment of available-for-sale debt securities | 737 | | | 44 | | | 21 | | |
| Other credit risk provisions | 69 | | | 21 | | | 5 | | |
| |
| | |
| | |
| | |
| Loan impairment charges and other credit risk provisions | 24,937 | | | 17,242 | | | 10,573 | | |
| |
| | |
| | |
| | |
| | | | | | | | | | |
| | % | | | % | | | % | | |
| | | | | | | | | | |
| As a percentage of net operating income before loan impairment charges and other credit risk provisions | 30.5 | | | 21.8 | | | 16.2 | | |
| Impairment charges on loans and advances to customers as a percentage of gross average loans and advances to customers | 2.5 | | | 2.0 | | | 1.4 | | |
| | | | | | | | | | |
| | US$m | | | US$m | | | US$m | | |
| Customer impaired loans | 25,352 | | | 19,582 | | | 15,071 | | |
| Customer loan impairment allowances | 23,909 | | | 19,205 | | | 13,578 | | |
2008 compared with 2007
Reported loan impairment charges and other credit risk provisions were US$24.9 billion in 2008, an increase of 45 per cent over 2007, 46 per cent on an underlying basis.
A deterioration in credit quality was experienced across all customer groups and geographical regions as the global economy slowed. The rise in Group loan impairment charges and other credit risk provisions also reflected an underlying 8 per cent increase in lending to customers (excluding the financial sector and settlement accounts).
Loan impairment charges rose significantly in the US by 38 per cent to US$16.3 billion, due to credit quality deterioration across all US portfolios in Personal Financial Services.
In the US consumer lending portfolio, loan impairment charges rose as delinquency rates deteriorated sharply and the economy declined markedly in the second half of 2008, most notably in the first lien portfolio. This was particularly apparent in the geographical regions most affected by house price depreciation and rising unemployment rates. In mortgage services, loan impairment charges rose as 2005 and 2006 vintages matured and moved into the later stages of delinquency. This was partly offset by the benefit of lower balances as run-off continued, albeit at a slowing pace as house price depreciation restricted refinancing options for customers. In HSBC USA, loan impairment charges rose as credit quality worsened across the real estate secured portfolio and private label cards. Delinquencies rose
in the prime first lien residential mortgage portfolio, Home Equity Line of Credit and Home Equity Loan second lien portfolios. The higher delinquency rate for prime first lien mortgages was in part due to lower balances following US$7.0 billion of portfolio sales during the year.
Loan impairment charges in the US card and retail services portfolios rose, again driven by increasing unemployment, portfolio seasoning, higher levels of personal bankruptcy filings and continued weakness in the US economy which was most apparent in regions with the most significant declines in house prices and rising unemployment.
Loan impairment charges in Commercial Banking in North America more than doubled from a low base in 2007, due to deterioration across the commercial real estate, middle market and corporate banking portfolios in the US and, to a lesser extent, higher loan impairment charges against firms in the manufacturing, export and commercial real estate sectors in Canada.
In the UK, a modest decline in loan impairment charges in Personal Financial Services reflected the non-recurrence of a methodology change at HFC in 2007 which resulted in higher impairment charges. Credit quality in the Personal Financial Services portfolio remained broadly stable, reflecting early risk mitigation through the tightening of lending controls and the sale of non-core credit card portfolios during the year. Credit quality in the unsecured portfolios deteriorated slightly in 2008, particularly in the second half of the year, due to the weakening UK economy. Loan impairment charges in the commercial portfolio rose in 2008 as the
34
Back to Contents
weakening property market led to higher impairment charges against construction companies and businesses dependent upon the real estate sector, particularly in the final quarter of the year. Impairment charges against banks rose due to some exposure to the Icelandic banks in 2008. In addition, rising levels of personal indebtedness resulted in lower releases and recoveries of charges than in 2007.
Higher loan impairment and other credit risk provisions within Global Banking and Markets in Europe reflected increased charges against certain corporate accounts and impairment recorded on available-for-sale debt securities.
In Mexico, loan impairment charges rose by US$513 million or 69 per cent, primarily in the credit card portfolio. This was due to a combination of higher lending volumes from organic expansion and higher delinquency rates which were driven by a deterioration in credit quality as the portfolio continued to season and move into the later stages of delinquency. Management took action to enhance collection activity and improve the quality of new business. Impairment charges in the commercial portfolio also rose due to credit quality deterioration among small and medium-sized enterprises as the economy weakened.
In Hong Kong, the rise in loan impairment charges was driven by weakness in parts of the export sector within the commercial portfolio in the second half of 2008. In Global Banking and Markets, credit impairment charges within Balance Sheet Management principally reflected losses on debt securities and paper issued by financial institutions previously rated at investment grade which failed in the year.
In Rest of Asia-Pacific, the growth in loan impairment charges reflected a combination of the expansion of consumer lending and credit quality deterioration in India and the Middle East. In addition, higher impairment charges in Commercial Banking were driven by a deterioration in credit quality in the second half of the year.
For the Group as a whole, the aggregate outstanding customer loan impairment allowances at 31 December 2008 of US$23.9 billion represented 2.6 per cent of gross customer advances (net of reverse repos and settlement accounts), compared with 2.0 per cent at the end of 2007.
2007 compared with 2006
Reported loan impairment charges and other credit risk provisions were US$17.2 billion, a 63 per cent increase over 2006.
Loan impairment charges increased by 58 per cent, reflecting substantially higher losses in the US consumer finance loan book, primarily in mortgage lending, but also in the credit cards portfolio in the final part of the year. US delinquency rates increased during 2007 as falling house prices constrained customers’ ability to refinance their loans.
The rise in Group charges also reflected an underlying 7 per cent increase in lending to customers (excluding lending to the financial sector and settlement accounts).
In North America, loan impairment charges increased by 79 per cent to US$12.2 billion. The main factor driving this deterioration was the impact of the weaker housing market on both economic activity and the ability of borrowers to extend or refinance debt. In addition, seasoning and mix change within the credit cards portfolio, and increases in bankruptcy filings after the exceptionally low levels seen in 2006 following changes in legislation, added to loan impairment charges.
The real estate secured portfolios experienced continuing deterioration in credit quality as a lack of demand for securitised sub-prime mortgages and falls in house prices severely restricted refinancing options for many customers. Loan impairment charges rose by 41 per cent to US$3.1 billion and by 139 per cent to US$4.1 billion in the mortgage services business and in consumer lending, respectively. Delinquency rates exceeded recent historical trends, particularly for those loans originated in 2005 and 2006. Performance was weakest in housing markets which had previously experienced the steepest home price appreciation, as well as in second lien products and stated income products.
US card services experienced an increase in loan impairment charges from a combination of growth in balances, higher losses in the final part of the year as the economy slowed, a rise in bankruptcy rates to near historical levels, and a shift in portfolio mix to higher levels of non-prime loans.
In the UK, loan impairment charges rose, primarily in the consumer finance business. Delinquency rates on mortgages in the UK offered through HSBC Finance remained stable throughout 2007, with delinquency rates for loans offered in 2006 and 2007 lower than in the preceding two
35
Back to Contents
| H S B C H O L D I N G S P L C |
| |
| Report of the Directors: Operating and Financial Review(continued) |
| | |
| | |
| Financial summary > Group performance > Operating expenses |
years. In the rest of the UK business, loan impairment charges in the second half of 2007 were lower than in the first half of the year, as overall credit quality improved following measures taken to tighten underwriting standards and improve the credit quality of new business. Although losses from mortgage lending remained low, maximum loan to value ratios were reduced during the year to mitigate the effects of a possible housing market downturn.
In Mexico, higher loan impairment charges were driven by strong growth in loan balances, a deterioration in credit quality and portfolio seasoning.
For the Group as a whole, the aggregate outstanding customer loan impairment allowances at 31 December 2007 of US$19.2 billion represented 2.0 per cent of gross customer advances (net of reverse repos and settlement accounts), compared with 1.6 per cent at the end of 2006.
Impaired loans to customers were US$18.3 billion at 31 December 2007 compared with US$13.8 billion at 31 December 2006. On a constant currency basis, impaired loans to customers were 28 per cent higher than in 2006 compared with customer lending growth (excluding loans to the financial sector and settlement accounts) of 7 per cent.
Operating expenses
| | 2008 | | 2007 | | 2006 | |
| | US$m | | US$m | | US$m | |
| By expense category | | | | | | |
| Employee compensation and benefits1 | 20,792 | | 21,334 | | 18,500 | |
| Premises and equipment (excluding depreciation and impairment) | 4,305 | | 3,966 | | 3,389 | |
| General and administrative expenses | 10,955 | | 11,328 | | 9,434 | |
| |
| |
| |
| |
| Administrative expenses | 36,052 | | 36,628 | | 31,323 | |
| Depreciation and impairment of property, plant and equipment | 1,750 | | 1,714 | | 1,514 | |
| Amortisation and impairment of intangible assets | 733 | | 700 | | 716 | |
| Goodwill impairment | 10,564 | | – | | – | |
| |
| |
| |
| |
| Total operating expenses | 49,099 | | 39,042 | | 33,553 | |
| |
| |
| |
| |
| | | |
| | At 31 December | |
| |
|
|
|
|
| |
| | 2008 | | 2007 | | 2006 | |
| Staff numbers (full-time equivalent) | | | | | | |
| Europe | 82,093 | | 82,166 | | 78,311 | |
| Hong Kong | 29,330 | | 27,655 | | 27,586 | |
| Rest of Asia-Pacific | 98,159 | | 88,573 | | 72,265 | |
| North America | 44,725 | | 52,722 | | 55,642 | |
| Latin America | 58,559 | | 64,404 | | 64,900 | |
| |
| |
| |
| |
| Total staff numbers | 312,866 | | 315,520 | | 298,704 | |
| |
| |
| |
| |
| 1 | A charge of US$135 million was realised in 2006 arising from the waiver of the TSR-related performance condition in respect of the 2003 awards under the HSBC Holdings Group Share Option Plan. |
| |
2008 compared with 2007
Reported operating expenses increased by US$10.1 billion to US$49.1 billion, due to an impairment charge of US$10.6 billion to fully write off goodwill in Personal Financial Services in North America. Excluding this, operating expenses remained broadly in line on both reported and underlying bases.
Employee compensation and benefits fell marginally. Lower discretionary bonuses reflected weaker performance in the current economic conditions. A review of actuarial assumptions on employees’ defined benefit pensions resulted in lower service costs in the UK. The restructuring of the consumer finance business in North America led to reduced headcount and lower costs. This was partially offset by higher salaries and increased
headcount to support business expansion, mainly in Asia. Restructuring costs were incurred primarily in Latin America and Europe.
Premises and equipment costs increased primarily in the UK and the Rest of Asia-Pacific region, driven by investment in technology and extensions and improvements to the branch and ATM networks. As a consequence, repairs and maintenance costs rose. Commercial property rental costs also increased as a result of higher prices, new rentals and sale and leaseback deals.
General and administrative expenses decreased, primarily due to a one-off recovery of US$110 million of previous years’ transactional taxes in Brazil and the non-recurrence of a number of one-off items in 2007, most notably (i) ex-gratia payments made in the UK in respect of overdraft
36
Back to Contents
fees, (ii) the provision for reimbursement of certain charges on historic will trusts and other related services in the UK, (iii) the indemnification agreement with Visa ahead of Visa’s IPO, and (iv) restructuring charges in the US consumer finance business incurred in 2007. These were partly offset by an increase in the Financial Services compensation scheme levy in the UK and an increase in a litigation provision in Asia.
Goodwill impairment amounting to US$10.6 billion was booked following the continued deterioration in economic and credit conditions in North America. For further information see Note 22 on the Financial Statements.
2007 compared with 2006
Reported operating expenses increased byUS$5.5 billion to US$39.0 billion. On an underlying basis, cost growth was 10 per cent.
Employee compensation and benefitsrose due to increased headcount employed to support business expansion in Rest of Asia-Pacific and Europe and higher salaries and bonuses. Salary increases reflected inflationary pressures and performance as bonuses rose in response to revenue growth. A change in actuarial assumptions regarding the staff defined benefit pension scheme in the UK led to increased costs. Staff numbers in North America fell as the consumer finance business was restructured, resulting in the discontinuation of certain business channels in mortgage services and the closing of branch offices in consumer lending.
Premises and equipment costsincreased on investments in technology, straight-through
processing and extending and improving the branch and ATM networks. In particular, there was investment in the distribution platform in Latin America, Middle East, India and mainland China. The retail bank branch network in North America was extended both within and beyond the Group’s traditional spheres of operation to support the expansion of retail and Commercial Banking businesses, increasing premises and equipment costs as a consequence. Commercial property rental costs rose in Hong Kong’s dynamic economy, the effect magnified by a sale and leaseback agreement on a headquarters building in 2006. In France, the IT systems inherited with the acquisition of HSBC France were replaced with HSBC’s universal banking platform.
General and administrative expensesrose in support of the business expansion and a number of one-off costs. Higher transaction volumes drove processing costs and transactional taxes while business expansion was supported by marketing expenditure. In the UK, ex-gratia payments of US$227 million were expensed in respect of overdraft fees applied in previous years and a provision of US$169 million was raised for reimbursement of certain charges on historic will trusts and other related services. In the US, the business incurred US$70 million of one-off costs arising from the indemnification agreement with Visa ahead of its planned IPO. The US consumer finance business incurred restructuring charges of US$103 million resulting from the discontinuation of the wholesale and correspondent channels in mortgage services and the closing of branch offices in consumer lending.
Cost efficiency ratios
| | 2008 | | | 2007 | | | 2006 | | |
| | % | | | % | | | % | | |
| HSBC | 60.1 | | | 49.4 | | | 51.3 | | |
| | | | | | | | | | |
| Personal Financial Services | 76.4 | | | 50.3 | | | 49.7 | | |
| Europe | 62.7 | | | 64.8 | | | 59.2 | | |
| Hong Kong | 32.2 | | | 27.2 | | | 32.2 | | |
| Rest of Asia-Pacific | 73.5 | | | 73.9 | | | 71.1 | | |
| North America | 106.8 | | | 42.3 | | | 42.3 | | |
| Latin America | 59.7 | | | 61.3 | | | 65.6 | | |
| | | | | | | | | | |
| Commercial Banking | 43.0 | | | 44.8 | | | 43.7 | | |
| Europe | 44.2 | | | 49.3 | | | 46.7 | | |
| Hong Kong | 26.2 | | | 24.9 | | | 26.1 | | |
| Rest of Asia-Pacific | 41.0 | | | 42.9 | | | 42.5 | | |
| North America | 46.1 | | | 45.1 | | | 44.9 | | |
| Latin America | 55.0 | | | 54.3 | | | 55.9 | | |
37
Back to Contents
| H S B C H O L D I N G S P L C |
| |
| Report of the Directors: Operating and Financial Review(continued) |
| | |
| | |
| Financial summary > Group performance > Share of profit in associates and joint ventures / Economic profit |
Share of profit in associates and joint ventures
| | 2008 | | 2007 | | 2006 | |
| | US$m | | US$m | | US$m | |
| Bank of Communications | 741 | | 445 | | 259 | |
| Ping An Insurance | 324 | | 518 | | 245 | |
| Industrial Bank | 221 | | 128 | | 71 | |
| The Saudi British Bank | 251 | | 216 | | 258 | |
| Other | 63 | | 159 | | (10 | ) |
| |
| |
| |
| |
| Share of profit in: | | | | | | |
| – associates | 1,600 | | 1,466 | | 823 | |
| – joint ventures | 61 | | 37 | | 23 | |
| |
| |
| |
| |
| Share of profit in associates and joint ventures | 1,661 | | 1,503 | | 846 | |
|
| |
| |
| |
2008 compared with 2007
Share of profit in associates and joint ventures was US$1.7 billion, an increase of 11 per cent compared with 2007, and 4 per cent on an underlying basis.
This increase was driven by higher contributions from Bank of Communications, Industrial Bank, and The Saudi British Bank, partly offset by lower profits from Ping An Insurance.
HSBC’s share of profits from the Bank of Communications rose by 52 per cent to US$741 million, primarily driven by increased margins, as yields rose following higher base rates in mainland China through most of 2008, and balance sheet growth. Growth in revenues from the asset custody business, financial advisory services and bank card transactions also drove higher profits.
HSBC’s share of profits from Ping An Insurance decreased by 43 per cent, primarily due to the impairment of Ping An Insurance’s investment in Fortis SA/NV and Fortis N.V. (‘Fortis Investments’), following significant declines in its market value.
Profits from the Saudi British Bank were higher by 16 per cent due to strong balance sheet growth, particularly in the lending portfolio, augmented by higher fees from cards, account services and trade.
Profits from Industrial Bank grew by 72 per cent, driven by increased investment income and balance sheet growth.
The share of profits from joint ventures rose due to growth in HSBC Saudi Arabia Ltd and the recognition of profits in HSBC Merchant Services UK Ltd, the new merchant acquiring venture with Global Payments Inc.
An adjustment to the embedded value of HSBC Assurances in 2007 did not recur.
2007 compared with 2006
Share of profit in associates and joint ventures of US$1.5 billion was 78 per cent higher than in 2006, on both reported and underlying bases.
Profit from associates and joint ventures rose due to increased contributions from HSBC’s strategic investments in mainland China. Profit from Bank of Communications, Ping An Insurance and Industrial Bank improved significantly, driven largely by the thriving local economy.
HSBC’s share of profit from Ping An Insurance rose by 101 per cent to US$518 million as a result of robust growth, notably from life insurance products, and the realisation of synergistic gains across Ping An Insurance’s other business offerings.
Profit from the Bank of Communications rose by 64 per cent to US$445 million as a result of improved performance across the associate’s various product offerings. Increased income from credit and treasury products and significant growth in fee income contributed to the increase in profits.
HSBC’s share of profits from the Saudi British Bank decreased by 22 per cent toUS$216 million, driven by the effects of a significant correction to the local stock market in the second half of 2006.
A US$73 million adjustment to the embedded value of HSBC Assurances, an associate in France, resulted in an increase in profits from associates.
38
Back to Contents
Economic profit
HSBC’s internal performance measures include economic profit, a calculation which compares the return on financial capital invested in HSBC by its shareholders with the cost of that capital. HSBC prices its cost of capital internally and the difference between that cost and the post-tax profit attributable to ordinary shareholders (less goodwill previously amortised in respect of the French regional banks sold in 2008) represents the amount of economic profit generated. Economic profit generated is used by management as a means of deciding where to allocate resources so that they will be most productive.
In order to concentrate on external factors rather than measurement bases, HSBC emphasises the trend in economic profit ahead of absolute amounts within business units. In order to ensure consistency and comparability with the five-year strategic plan completed in 2008, the cost of capital on a consolidated basis remains at 10 per cent.
Economic profit decreased by US$14.8 billion to a loss of US$8.2 billion. Profit attributable fell, while average shareholders’ equity increased marginally. The decline in profit was predominately driven by the US$10.6 billion goodwill impairment charge relating to the North American Personal Financial Services business, alongside a significant increase in loan impairment charges and write-downs in credit trading, leveraged and acquisition finance, and monoline exposures. The comparative period included dilution gains of US$1.0 billion (excluding minority interests) which were not repeated. These effects were partially offset by fair value gains on own debt, driven by a widening of credit spreads, of US$6.6 billion compared with US$3.1 billion in 2007. The lower return on average invested capital led to a decrease in economic profit and an erosion in economic spread, which fell by 11.3 percentage points compared with 2007. Excluding the goodwill impairment charge, the economic profit spread decreased by 3.6 percentage points compared with 2007.
| | 2008 | | 2007 | |
| |
|
|
| |
|
|
| |
| | US$m | | % | 1 | US$m | | % | 1 |
| | | | | | | | | |
| Average total shareholders’ equity | 122,292 | | | | 120,346 | | | |
| Adjusted by: | | | | | | | | |
| Goodwill previously amortised or written off | 8,152 | | | | 8,172 | | | |
| Property revaluation reserves | (828 | ) | | | (898 | ) | | |
| Reserves representing unrealised losses on effective cash flow hedges | 997 | | | | 425 | | | |
| Reserves representing unrealised (gains)/losses on available-for-sale securities | 9,163 | | | | (1,918 | ) | | |
| Preference shares and other equity instruments | (2,685 | ) | | | (1,405 | ) | | |
| |
| | | |
| | | |
| Average invested capital2 | 137,091 | | | | 124,722 | | | |
| |
| | | |
| | | |
| Return on invested capital3 | 5,497 | | 4.0 | | 19,043 | | 15.3 | |
| Benchmark cost of capital | (13,709 | ) | (10.0 | ) | (12,472 | ) | (10.0 | ) |
| |
| |
| |
| |
| |
| Economic profit/(loss) and spread | (8,212 | ) | (6.0 | ) | 6,571 | | 5.3 | |
|
| |
| |
| |
| |
| 1 | Expressed as a percentage of average invested capital. |
| 2 | Average invested capital is measured as average total shareholders’ equity after: |
| | – | adding back the average balance of goodwill amortised pre-transition to IFRSs or subsequently written-off, directly to reserves (less goodwill previously amortised in respect of the French regional banks sold in 2008); |
| | – | deducting the average balance of HSBC’s revaluation surplus relating to property held for own use. This reserve was generated when determining the deemed carrying cost of such properties on transition to IFRSs and will run down over time as the properties are sold; |
| | – | deducting average preference shares and other equity instruments issued by HSBC Holdings, and; |
| | – | deducting average reserves for unrealised gains/(losses) on effective cash flow hedges and available-for-sale securities. |
| 3 | Return on invested capital is based on the profit attributable to ordinary shareholders of the parent company less goodwill previously amortised in respect of the French regional banks sold in 2008. |
39
Back to Contents
| H S B C H O L D I N G S P L C |
| |
| Report of the Directors: Operating and Financial Review(continued) |
| | |
| | |
| Financial summary > Balance sheet > Movement in 2008 |
Balance sheet
| | At 31 December | |
| |
| |
| | 2008 | | 2007 | | 2006 | |
| | US$m | | US$m | | US$m | |
| ASSETS | | | | | | |
| Cash and balances at central banks | 52,396 | | 21,765 | | 12,732 | |
| Trading assets | 427,329 | | 445,968 | | 328,147 | |
| Financial assets designated at fair value | 28,533 | | 41,564 | | 20,573 | |
| Derivatives | 494,876 | | 187,854 | | 103,702 | |
| Loans and advances to banks | 153,766 | | 237,366 | | 185,205 | |
| Loans and advances to customers | 932,868 | | 981,548 | | 868,133 | |
| Financial investments | 300,235 | | 283,000 | | 204,806 | |
| Other assets | 137,462 | | 155,201 | | 137,460 | |
| |
| |
| |
| |
| Total assets | 2,527,465 | | 2,354,266 | | 1,860,758 | |
| |
| |
| |
| |
| LIABILITIES AND EQUITY | | | | | | |
| Liabilities | | | | | | |
| Deposits by banks | 130,084 | | 132,181 | | 99,694 | |
| Customer accounts | 1,115,327 | | 1,096,140 | | 896,834 | |
| Trading liabilities | 247,652 | | 314,580 | | 226,608 | |
| Financial liabilities designated at fair value | 74,587 | | 89,939 | | 70,211 | |
| Derivatives | 487,060 | | 183,393 | | 101,478 | |
| Debt securities in issue | 179,693 | | 246,579 | | 230,325 | |
| Liabilities under insurance contracts | 43,683 | | 42,606 | | 17,670 | |
| Other liabilities | 149,150 | | 113,432 | | 103,010 | |
| |
| |
| |
| |
| Total liabilities | 2,427,236 | | 2,218,850 | | 1,745,830 | |
| |
| |
| |
| |
| Equity | | | | | | |
| Total shareholders’ equity | 93,591 | | 128,160 | | 108,352 | |
| Minority interests | 6,638 | | 7,256 | | 6,576 | |
| |
| |
| |
| |
| Total equity | 100,229 | | 135,416 | | 114,928 | |
| |
| |
| |
| |
| Total equity and liabilities | 2,527,465 | | 2,354,266 | | 1,860,758 | |
| |
| |
| |
| |
A more detailed consolidated balance sheet is contained in the Financial Statements on page 334.
Movement from 31 December 2007 to 31 December 2008
Total assets amounted to US$2.5 trillion, 7 per cent higher than at 31 December 2007. After excluding currency movements, the disposal of HSBC’s French regional subsidiaries and the acquisition of the assets, liabilities and operations of The Chinese Bank in 2008, underlying assets rose by 22 per cent, driven by growth in derivative assets.
The expansion in the Group’s balance sheet was largely attributable to increases in derivative assets and liabilities, and was due to growth in the fair value of these positions rather than a rise in their notional contract amounts. Excluding the growth in derivative liabilities, customer accounts formed an increasing share of the Group’s liabilities as depositors and savers responded to HSBC’s reputation for strength and security. As a result, a proportion of the Group’s funding repayable on demand or within one year rose. For information on the Group’s management of liquidity, see pages 235 to 240.
The Group’s tier 1 capital ratio declined from 9.3 per cent to 8.3 per cent. For detail on regulatory capital and risk weighted assets, see pages 274 to 280.
The following commentary is on an underlying basis.
Assets
The Group’s cash and balances at central banks rose substantially, particularly in Hong Kong as additional liquidity was injected into the banking system, and in the US where excess liquidity was required in the short-term as part of a planned transfer of assets between the Group’s subsidiaries.
Trading assets increased by 11 per cent. The majority of the rise occurred on 30 September 2008, following the Group’s consolidation of five Constant Net Asset Value (‘CNAV’) funds with assets of around US$40 billion. The decision to consolidate these funds was based on actions taken to support them. For further details of these actions, see page 180. The rise was partly offset by the reclassification of US$18 billion of trading assets
40
Back to Contents
partly to ‘Loans and Advances’ and partly to ‘Financial investments’ following the changes to International Accounting Standard 39 – ‘Financial Instruments – Recognition and Measurement’ (‘IAS39’) issued in October 2008 by the IASB.
Excluding these effects, trading assets remained broadly unchanged as rises in Europe and Asia, where the Group increased its holdings of government bonds, were offset by the run-off of the mortgage-backed securities portfolio in the US and a reduction in debt securities held for balance sheet management purposes due to changes in liquidity and risk preference.
An 18 per cent decline infinancial assets designated at fair value was driven by falling equity markets, which reduced the value of assets held to meet life insurance liabilities, particularly in Hong Kong and France. To the extent that these liabilities related to unit-linked and participating insurance contracts, there was a corresponding decline inliabilities under insurance contracts. The underperformance of certain investment products also led clients to withdraw funds.
Derivative assets rose significantly, led by an increase in interest rate derivatives with further growth in credit and foreign exchange derivatives. The global falls in interest rates resulted in significant gaps between the fixed and floating legs of interest rate swaps, leading to substantial mark-to-market increases in the value of interest rate swap positions. Widening credit spreads and increasing market volatility caused mark-to-market increases in the value of credit derivatives held in the UK and the US. Foreign exchange derivative asset growth was driven by a combination of increased volumes and mark-to-market rises in existing positions in the UK. Under IFRS, only limited netting is allowed between derivative assets and liabilities with the same counterparty, and the balance sheet value is therefore significantly higher than the credit exposure. For information on maximum exposure to credit risk, see pages 197 to 200.
A 29 per cent decline inloans and advances to banks occurred mainly in Hong Kong and the UK where Balance Sheet Management invested a greater proportion of its assets in government and government-guaranteed debt.
HSBC also reduced counterparty credit risk in the UK by channelling an increasing proportion of lending to banks through the London Clearing House in the form of reverse repos. This is recorded within customer loans even when the end counterparty is a bank, which means the fall inloans and advances to banks and the rise inloans and advances to
customersare magnified. The rise in loans and advances to customers was also inflated by the reclassification of US$15 billion of assets following changes to IAS39 isused in October 2008.
Further increases inloans and advances to customers were due to growth in mortgage lending in Europe and Asia, as well as to a rise in overdraft balances to customers whose exposures are managed net but reported gross under IFRS. These rises were offset by a reduction in customer lending in the US due to the run-off of the mortgage services portfolio, the sale of certain loan portfolios at HSBC USA, tighter underwriting criteria which restricted originations in the consumer lending and credit card portfolios, and the cessation of most new originations in the US vehicle finance portfolio.
Financial investments grew by 15 per cent as Balance Sheet Management assets were increasingly classified as available-for-sale financial investments rather than trading assets. As noted above, there was also a rise in financial investments in the UK as the Group placed a greater proportion of surplus funds in government issued or guaranteed debt. The growth in the Group’s financial investments was partly offset by a reduction in holdings of asset-backed securities, including those held through special purpose entities, which decreased due to a combination of asset sales, amortisation and write-downs. For details of the Group’s asset-backed securities portfolios, see pages 145 to 158.
Liabilities
Deposits by banks rose by 14 per cent, driven, in particular, by increases in France, due to a rise in repo activity to finance increased trading activity, and in Hong Kong, where banks responded to HSBC’s reputation for strength and security and deposited their surplus liquidity with the Group.
Customer account balances grew by 16 per cent, driven by strong inflows from customers attracted by HSBC’s relative financial strength as they withdrew funds from more volatile investments.
Trading liabilities declined 9 per cent as a fall in third-party funding requirements allowed a reduction in liabilities in Hong Kong, and repo transactions were reduced in Europe to manage liquidity and counterparty credit risk.
A significant widening of credit spreads led to further falls in the fair value of the Group’s own debt which reducedfinancial liabilities designated at fair value. This was compounded by a decline in liabilities in the UK due to the underperformance of certain investment products.
41
Back to Contents
| H S B C H O L D I N G S P L C |
| |
| Report of the Directors: Operating and Financial Review(continued) |
| | |
| | |
| Financial summary > Balance sheet > Movement in 2008 / Average balance sheet and NII |
Derivative businesses are managed within market risk limits, and as a consequence the value ofderivative liabilitiesbroadly matched the value of derivative assets.
A decline of 22 per cent indebt securities in issue was driven by the US as maturing debt securities did not need replacing as the funding requirements of the consumer finance business declined as its balance sheet contracted. There was also a reduction in debt securities in issue in line with the decrease in holdings of asset-backed securities.
Liabilities under insurance contracts increased by 10 per cent, largely due to new business sales in Hong Kong, France and the UK, partly offset by reduced liabilities on unit-linked policies.
Other liabilities rose by 50 per cent due to the consolidation of the CNAV funds described above.
Equity
Total shareholders’ equity declined by 19 per cent, which mainly arose from a decline in the available-for-sale reserve. The continuing market turmoil led to falls in the market values of assets held in HSBC’s available-for-sale portfolio. These declines mainly represented market illiquidity rather than impairment of the assets concerned, but they nonetheless reduced the value of the available-for-sale reserve from a positive reserve of US$0.9 billion to a negative reserve of US$20.6 billion.
Average balance sheet and net interest income
Average balances and related interest are shown for the domestic operations of HSBC’s principal commercial banks by geographical region. ‘Other operations’ comprise the operations of the principal Commercial Banking and consumer finance entities outside their domestic markets and all other banking operations, including investment banking balances and transactions.
Average balances are based on daily averages for the principal areas of HSBC’s banking activities with monthly or less frequent averages used elsewhere.
Balances and transactions with fellow subsidiaries are reported gross in the principal Commercial Banking and consumer finance entities within ‘Other interest-earning assets’ and ‘Other interest-bearing liabilities’ as appropriate and the elimination entries are included within ‘Other operations’ in those two categories.
Net interest margin numbers are calculated by dividing net interest income as reported in the income statement by the average interest-earning assets from which interest income is reported within the ‘Net interest income’ line of the income statement. Interest income and interest expense arising from trading assets and liabilities and the funding thereof is included within ‘Net trading income’ in the income statement.
42
Back to Contents
Assets
| | | 2008 | | 2007 | | 2006 |
| | |
| |
| |
|
| | | Average | | Interest | | | | Average | | Interest | | | | Average | | Interest | | | |
| | | balance | | income | | Yield | | balance | | income | | Yield | | balance | | income | | Yield | |
| | | US$m | | US$m | | % | | US$m | | US$m | | % | | US$m | | US$m | | % | |
| Summary | | | | | | | | | | | | | | | | | | | |
| Total interest-earning assets (itemised below) | 1,466,622 | | 91,301 | | 6.23 | | 1,296,701 | | 92,359 | | 7.12 | | 1,113,404 | | 75,879 | | 6.82 | |
| Trading assets7 | | 428,539 | | 16,742 | | 3.91 | | 374,973 | | 17,562 | | 4.68 | | 288,605 | | 12,445 | | 4.31 | |
| Financial assets designated at fair value8 | 37,303 | | 1,108 | | 2.97 | | 14,899 | | 813 | | 5.46 | | 7,681 | | 290 | | 3.78 | |
| Impairment provisions | (20,360 | ) | | | | | (15,309 | ) | | | | | (11,864 | ) | | | | |
| Non-interest-earning assets | 596,885 | | | | | | 440,686 | | | | | | 291,741 | | | | | |
| |
| |
| | | |
| |
| | | |
| |
| | | |
| Total assets and interest income | 2,508,989 | | 109,151 | | 4.35 | | 2,111,950 | | 110,734 | | 5.24 | | 1,689,567 | | 88,614 | | 5.24 | |
| |
| |
| | | |
| |
| | | |
| |
| | | |
| Short-term funds and loans and advances to banks | | | | | | | | | | | | | | | | | | |
| Europe | HSBC Bank | 46,703 | | 2,187 | | 4.68 | | 49,910 | | 2,592 | | 5.19 | | 33,856 | | 1,536 | | 4.54 | |
| | HSBC Private Banking Holdings (Suisse) | 8,040 | | 333 | | 4.14 | | 5,295 | | 229 | | 4.32 | | 4,956 | | 190 | | 3.83 | |
| | HSBC France | 35,801 | | 1,495 | | 4.18 | | 31,591 | | 1,294 | | 4.10 | | 20,197 | | 690 | | 3.42 | |
| Hong Kong | Hang Seng Bank | 17,402 | | 587 | | 3.37 | | 13,054 | | 609 | | 4.67 | | 10,360 | | 483 | | 4.66 | |
| | The Hongkong and Shanghai Banking Corporation | 47,244 | | 1,344 | | 2.84 | | 50,210 | | 2,352 | | 4.68 | | 38,802 | | 1,645 | | 4.24 | |
| Rest of Asia-Pacific | The Hongkong and Shanghai Banking Corporation | 27,907 | | 881 | | 3.16 | | 19,286 | | 810 | | 4.20 | | 13,388 | | 520 | | 3.88 | |
| | HSBC Bank Malaysia | 4,659 | | 165 | | 3.54 | | 2,861 | | 103 | | 3.60 | | 2,492 | | 87 | | 3.49 | |
| | HSBC Bank Middle East | 6,028 | | 188 | | 3.12 | | 6,328 | | 324 | | 5.12 | | 4,279 | | 208 | | 4.86 | |
| North America | HSBC Bank USA | 9,595 | | 328 | | 3.42 | | 9,393 | | 477 | | 5.08 | | 8,422 | | 465 | | 5.52 | |
| | HSBC Bank Canada | 3,354 | | 107 | | 3.19 | | 3,810 | | 174 | | 4.57 | | 3,167 | | 138 | | 4.36 | |
| Latin America | HSBC Mexico | 3,682 | | 247 | | 6.71 | | 3,555 | | 239 | | 6.72 | | 3,395 | | 227 | | 6.69 | |
| | Brazilian operations9 | 7,959 | | 951 | | 11.95 | | 5,790 | | 645 | | 11.14 | | 4,129 | | 572 | | 13.85 | |
| | HSBC Bank Panama | 1,133 | | 30 | | 2.65 | | 897 | | 33 | | 3.68 | | 130 | | 9 | | 6.92 | |
| | HSBC Bank Argentina | 612 | | 43 | | 7.03 | | 304 | | 16 | | 5.26 | | 196 | | 8 | | 4.08 | |
| Other operations | | 19,992 | | 760 | | 3.80 | | 19,087 | | 898 | | 4.70 | | 16,686 | | 618 | | 3.70 | |
| | |
| |
| | | |
| |
| | | |
| |
| | | |
| | | 240,111 | | 9,646 | | 4.02 | | 221,371 | | 10,795 | | 4.88 | | 164,455 | | 7,396 | | 4.50 | |
| | |
| |
| | | |
| |
| | | |
| |
| | | |
For footnotes, see page 143.
43
Back to Contents
| H S B C H O L D I N G S P L C |
| |
| Report of the Directors: Operating and Financial Review(continued) |
| | |
| | |
| Financial summary > Balance sheet > Average balance sheet and NII |
Assets (continued)
| | | 2008 | | 2007 | | 2006 | |
| | |
| |
| |
| |
| | | Average | | Interest | | | | Average | | Interest | | | | Average | | Interest | | | |
| | | balance | | income | | Yield | | balance | | income | | Yield | | balance | | income | | Yield | |
| | | US$m | | US$m | | % | | US$m | | US$m | | % | | US$m | | US$m | | % | |
| Loans and advances to customers | | | | | | | | | | | | | | | | | | |
| Europe | HSBC Bank | 288,214 | | 18,587 | | 6.45 | | 237,231 | | 18,078 | | 7.62 | | 226,528 | | 14,166 | | 6.25 | |
| | HSBC Private Banking Holdings (Suisse) | 12,355 | | 494 | | 4.00 | | 9,805 | | 507 | | 5.17 | | 7,134 | | 338 | | 4.74 | |
| | HSBC France | 73,455 | | 3,604 | | 4.91 | | 68,027 | | 3,219 | | 4.73 | | 52,990 | | 2,463 | | 4.65 | |
| | HSBC Finance | 4,808 | | 505 | | 10.50 | | 5,492 | | 611 | | 11.13 | | 5,932 | | 671 | | 11.31 | |
| Hong Kong | Hang Seng Bank | 42,304 | | 1,589 | | 3.76 | | 37,827 | | 2,120 | | 5.60 | | 34,416 | | 1,952 | | 5.67 | |
| | The Hongkong and Shanghai BankingCorporation | 54,628 | | 2,291 | | 4.19 | | 48,134 | | 2,901 | | 6.03 | | 47,292 | | 2,843 | | 6.01 | |
| Rest of Asia-Pacific | The Hongkong and Shanghai BankingCorporation | 77,741 | | 5,163 | | 6.64 | | 59,286 | | 4,321 | | 7.29 | | 52,159 | | 3,449 | | 6.61 | |
| | HSBC Bank Malaysia | 8,407 | | 553 | | 6.58 | | 7,467 | | 507 | | 6.79 | | 6,292 | | 430 | | 6.83 | |
| | HSBC Bank Middle East | 23,697 | | 1,549 | | 6.54 | | 15,125 | | 1,200 | | 7.93 | | 12,757 | | 957 | | 7.50 | |
| North America | HSBC Bank USA | 93,088 | | 5,758 | | 6.19 | | 90,091 | | 6,585 | | 7.31 | | 88,563 | | 6,141 | | 6.93 | |
| | HSBC Finance | 140,957 | | 15,835 | | 11.23 | | 153,658 | | 18,086 | | 11.77 | | 147,336 | | 17,061 | | 11.58 | |
| | HSBC Bank Canada | 48,331 | | 2,455 | | 5.08 | | 43,570 | | 2,598 | | 5.96 | | 35,055 | | 2,037 | | 5.81 | |
| Latin America | HSBC Mexico | 17,252 | | 2,565 | | 14.87 | | 16,469 | | 2,187 | | 13.28 | | 13,193 | | 1,532 | | 11.61 | |
| | Brazilian operations9 | 19,642 | | 4,879 | | 24.84 | | 13,569 | | 3,895 | | 28.71 | | 9,461 | | 3,244 | | 34.29 | |
| | HSBC Bank Panama | 8,620 | | 810 | | 9.40 | | 8,113 | | 778 | | 9.59 | | 1,189 | | 92 | | 7.74 | |
| | HSBC Bank Argentina | 2,136 | | 378 | | 17.70 | | 1,667 | | 241 | | 14.46 | | 838 | | 107 | | 12.77 | |
| Other operations | | 28,027 | | 1,707 | | 6.09 | | 21,318 | | 1,790 | | 8.40 | | 19,795 | | 1,528 | | 7.72 | |
| | |
| |
| | | |
| |
| | | |
| |
| | | |
| | | 943,662 | | 68,722 | | 7.28 | | 836,849 | | 69,624 | | 8.32 | | 760,930 | | 59,011 | | 7.76 | |
| | |
| |
| | | |
| |
| | | |
| |
| | | |
| Financial investments | | | | | | | | | | | | | | | | | | |
| Europe | HSBC Bank | 83,725 | | 3,840 | | 4.59 | | 45,885 | | 2,431 | | 5.30 | | 42,726 | | 1,977 | | 4.63 | |
| | HSBC Private Banking Holdings (Suisse) | 12,018 | | 553 | | 4.60 | | 10,372 | | 511 | | 4.93 | | 8,729 | | 391 | | 4.48 | |
| | HSBC France | 14,862 | | 795 | | 5.35 | | 10,357 | | 511 | | 4.93 | | 2,545 | | 95 | | 3.73 | |
| Hong Kong | Hang Seng Bank | 24,031 | | 1,063 | | 4.42 | | 30,791 | | 1,550 | | 5.03 | | 27,288 | | 1,224 | | 4.49 | |
| | The Hongkong and Shanghai Banking Corporation | 15,361 | | 563 | | 3.67 | | 20,717 | | 1,017 | | 4.91 | | 20,362 | | 911 | | 4.47 | |
| Rest of Asia-Pacific | The Hongkong and Shanghai BankingCorporation | 31,992 | | 1,507 | | 4.71 | | 23,739 | | 1,065 | | 4.49 | | 17,179 | | 737 | | 4.29 | |
| | HSBC Bank Malaysia | 937 | | 36 | | 3.84 | | 1,515 | | 56 | | 3.70 | | 954 | | 36 | | 3.77 | |
| | HSBC Bank Middle East | 5,671 | | 144 | | 2.54 | | 3,654 | | 174 | | 4.76 | | 1,387 | | 72 | | 5.19 | |
| North America | HSBC Bank USA | 25,089 | | 1,232 | | 4.91 | | 23,373 | | 1,189 | | 5.09 | | 22,214 | | 1,109 | | 4.99 | |
| | HSBC Finance | 2,908 | | 143 | | 4.92 | | 4,072 | | 229 | | 5.62 | | 3,724 | | 200 | | 5.37 | |
| | HSBC Bank Canada | 7,037 | | 197 | | 2.80 | | 6,068 | | 258 | | 4.25 | | 4,351 | | 174 | | 4.00 | |
| Latin America | HSBC Mexico | 3,470 | | 244 | | 7.03 | | 3,327 | | 319 | | 9.59 | | 4,049 | | 427 | | 10.55 | |
| | Brazilian operations9 | 6,758 | | 853 | | 12.62 | | 5,596 | | 672 | | 12.01 | | 3,862 | | 501 | | 12.97 | |
| | HSBC Bank Panama | 618 | | 47 | | 7.61 | | 709 | | 58 | | 8.18 | | 429 | | 21 | | 4.90 | |
| | HSBC Bank Argentina | 287 | | 47 | | 16.38 | | 563 | | 68 | | 12.08 | | 311 | | 38 | | 12.22 | |
| Other operations | | 29,632 | | 1,354 | | 4.57 | | 27,252 | | 1,407 | | 5.16 | | 24,742 | | 1,191 | | 4.81 | |
| | |
| |
| | | |
| |
| | | |
| |
| | | |
| | | 264,396 | | 12,618 | | 4.77 | | 217,990 | | 11,515 | | 5.28 | | 184,852 | | 9,104 | | 4.93 | |
| | |
| |
| | | |
| |
| | | |
| |
| | | |
For footnotes, see page 143.
44
Back to Contents
| | | 2008 | | 2007 | | 2006 | |
| | |
|
|
|
|
| |
|
|
|
|
| |
|
|
|
|
| |
| | | Average | | Interest | | | | Average | | Interest | | | | Average | | Interest | | | |
| | | balance | | income | | Yield | | balance | | income | | Yield | | balance | | income | | Yield | |
| | | US$m | | US$m | | % | | US$m | | US$m | | % | | US$m | | US$m | | % | |
| Other interest-earning assets | | | | | | | | | | | | | | | | | | |
| Europe | HSBC Bank | 25,885 | | 630 | | 2.43 | | 11,170 | | 652 | | 5.84 | | 9,938 | | 652 | | 6.56 | |
| | HSBC Private Banking | | | | | | | | | | | | | | | | | | |
| | Holdings (Suisse) | 21,189 | | 875 | | 4.13 | | 16,360 | | 882 | | 5.39 | | 14,558 | | 732 | | 5.03 | |
| | HSBC France | 23,414 | | 630 | | 2.69 | | 12,158 | | 419 | | 3.45 | | 6,434 | | 173 | | 2.69 | |
| |
| Hong Kong | Hang Seng Bank | 1,629 | | 48 | | 2.95 | | 832 | | 42 | | 5.05 | | 538 | | 28 | | 5.20 | |
| | The Hongkong and | | | | | | | | | | | | | | | | | | |
| | Shanghai Banking | | | | | | | | | | | | | | | | | | |
| | Corporation | 33,571 | | 949 | | 2.83 | | 27,057 | | 1,237 | | 4.57 | | 19,246 | | 909 | | 4.72 | |
| Rest of | The Hongkong and | | | | | | | | | | | | | | | | | | |
| Asia-Pacific | Shanghai Banking | | | | | | | | | | | | | | | | | | |
| | Corporation | 24,492 | | 352 | | 1.44 | | 11,137 | | 588 | | 5.28 | | 6,938 | | 449 | | 6.47 | |
| | HSBC Bank Malaysia | 212 | | 7 | | 3.30 | | 231 | | 12 | | 5.19 | | 178 | | 10 | | 5.62 | |
| | HSBC Bank Middle East | 843 | | 63 | | 7.47 | | 758 | | 52 | | 6.86 | | 380 | | 32 | | 8.42 | |
| North America | HSBC Bank USA | 3,091 | | 188 | | 6.08 | | 3,731 | | 231 | | 6.19 | | 1,867 | | 82 | | 4.39 | |
| | HSBC Finance | 2,638 | | 63 | | 2.39 | | 1,724 | | 89 | | 5.16 | | 767 | | 43 | | 5.61 | |
| | HSBC Bank Canada | 1,025 | | 25 | | 2.44 | | 960 | | 31 | | 3.23 | | 1,006 | | 32 | | 3.18 | |
| Latin America | HSBC Mexico | 193 | | 2 | | 1.04 | | – | | – | | – | | – | | – | | – | |
| | Brazilian operations9 | 1,438 | | 147 | | 10.22 | | 840 | | 75 | | 8.93 | | 1,004 | | 190 | | 18.92 | |
| | HSBC Bank Panama | 1,807 | | 23 | | 1.27 | | 1,351 | | 40 | | 2.96 | | – | | – | | – | |
| | HSBC Bank Argentina | 58 | | 1 | | 1.72 | | 39 | | 1 | | 2.56 | | 23 | | 3 | | 13.04 | |
| |
| Other operations | | (123,032 | ) | (3,688 | ) | | | (67,857 | ) | (3,926 | ) | | | (59,710 | ) | (2,967 | ) | | |
| | |
| |
| | | |
| |
| | | |
| |
| | | |
| | | 18,453 | | 315 | | 1.71 | | 20,491 | | 425 | | 2.07 | | 3,167 | | 368 | | 11.62 | |
| | |
| |
| | | |
| |
| | | |
| |
| | | |
| |
| Total interest-earning assets | | | | | | | | | | | | | | | | | | |
| Europe | HSBC Bank | 444,527 | | 25,244 | | 5.68 | | 344,196 | | 23,753 | | 6.90 | | 313,048 | | 18,331 | | 5.86 | |
| | HSBC Private Banking | | | | | | | | | | | | | | | | | | |
| | Holdings (Suisse) | 53,602 | | 2,255 | | 4.21 | | 41,832 | | 2,129 | | 5.09 | | 35,377 | | 1,651 | | 4.67 | |
| | HSBC France | 147,532 | | 6,524 | | 4.42 | | 122,133 | | 5,443 | | 4.46 | | 82,166 | | 3,421 | | 4.16 | |
| | HSBC Finance | 4,808 | | 505 | | 10.50 | | 5,492 | | 611 | | 11.13 | | 5,932 | | 671 | | 11.31 | |
| |
| Hong Kong | Hang Seng Bank | 85,366 | | 3,287 | | 3.85 | | 82,504 | | 4,321 | | 5.24 | | 72,602 | | 3,687 | | 5.08 | |
| | The Hongkong and | | | | | | | | | | | | | | | | | | |
| | Shanghai Banking | | | | | | | | | | | | | | | | | | |
| | Corporation | 150,804 | | 5,147 | | 3.41 | | 146,118 | | 7,507 | | 5.14 | | 125,702 | | 6,308 | | 5.02 | |
| Rest of | The Hongkong and | | | | | | | | | | | | | | | | | | |
| Asia-Pacific | Shanghai Banking | | | | | | | | | | | | | | | | | | |
| | Corporation | 162,132 | | 7,903 | | 4.87 | | 113,448 | | 6,784 | | 5.98 | | 89,664 | | 5,155 | | 5.75 | |
| | HSBC Bank Malaysia | 14,215 | | 761 | | 5.35 | | 12,074 | | 678 | | 5.62 | | 9,916 | | 563 | | 5.68 | |
| | HSBC Bank Middle East | 36,239 | | 1,944 | | 5.36 | | 25,865 | | 1,750 | | 6.77 | | 18,803 | | 1,269 | | 6.75 | |
| |
| North America | HSBC Bank USA | 130,863 | | 7,506 | | 5.74 | | 126,588 | | 8,482 | | 6.70 | | 121,066 | | 7,797 | | 6.44 | |
| | HSBC Finance | 146,503 | | 16,041 | | 10.95 | | 159,454 | | 18,404 | | 11.54 | | 151,827 | | 17,304 | | 11.40 | |
| | HSBC Bank Canada | 59,747 | | 2,784 | | 4.66 | | 54,408 | | 3,061 | | 5.63 | | 43,579 | | 2,381 | | 5.46 | |
| |
| Latin America | HSBC Mexico | 24,597 | | 3,058 | | 12.43 | | 23,351 | | 2,745 | | 11.76 | | 20,637 | | 2,186 | | 10.59 | |
| | Brazilian operations9 | 35,797 | | 6,830 | | 19.08 | | 25,795 | | 5,287 | | 20.50 | | 18,456 | | 4,507 | | 24.42 | |
| | HSBC Bank Panama | 12,178 | | 910 | | 7.47 | | 11,070 | | 909 | | 8.21 | | 1,748 | | 122 | | 6.98 | |
| | HSBC Bank Argentina | 3,093 | | 469 | | 15.16 | | 2,573 | | 326 | | 12.67 | | 1,368 | | 156 | | 11.40 | |
| |
| Other operations | | (45,381 | ) | 133 | | | | (200 | ) | 169 | | | | 1,513 | | 370 | | | |
| | |
| |
| | | |
| |
| | | |
| |
| | | |
| |
| | | 1,466,622 | | 91,301 | | 6.23 | | 1,296,701 | | 92,359 | | 7.12 | | 1,113,404 | | 75,879 | | 6.82 | |
| | |
| |
| | | |
| |
| | | |
| |
| | | |
| For footnotes, see page 143. | | | | | | | | | | | | | | | | | | |
45
Back to Contents
| H S B C H O L D I N G S P L C |
| |
| Report of the Directors: Operating and Financial Review(continued) |
| | |
| | |
| Financial summary > Balance sheet > Average balance sheet and NII |
Total equity and liabilities
| | | 2008 | | 2007 | | 2006 | |
| | |
|
|
|
|
| |
|
|
|
|
| |
|
|
|
|
| |
| | | Average | | Interest | | | | Average | | Interest | | | | Average | | Interest | | | |
| | | balance | | expense | | Cost | | balance | | expense | | Cost | | balance | | expense | | Cost | |
| | | US$m | | US$m | | % | | US$m | | US$m | | % | | US$m | | US$m | | % | |
| Summary | | | | | | | | | | | | | | | | | | | |
| Total interest-bearing liabilities (itemised | | | | | | | | | | | | | | | | | | |
| below) | | 1,451,842 | | 48,738 | | 3.36 | | 1,279,460 | | 54,564 | | 4.26 | | 1,067,646 | | 41,393 | | 3.88 | |
| Trading liabilities | 277,940 | | 11,029 | | 3.97 | | 250,572 | | 12,186 | | 4.86 | | 224,050 | | 9,842 | | 4.39 | |
| Financial liabilities designated at fair value | | | | | | | | | | | | | | | | | | |
| (excluding own debt issued) | 21,266 | | 345 | | 1.62 | | 20,827 | | 224 | | 1.07 | | 12,537 | | 13 | | 0.10 | |
| Non-interest-bearing current accounts | 98,193 | | | | | | 83,958 | | | | | | 71,744 | | | | | |
| Total equity and other non-interest-bearing | | | | | | | | | | | | | | | | | | |
| liabilities | | 659,747 | | | | | | 477,133 | | | | | | 313,590 | | | | | |
| | |
| |
| | | |
| |
| | | |
| |
| | | |
| Total equity and liabilities | 2,508,988 | | 60,112 | | 2.40 | | 2,111,950 | | 66,974 | | 3.17 | | 1,689,567 | | 51,248 | | 3.03 | |
| |
| |
| | | |
| |
| | | |
| |
| | | |
| |
| Deposits by banks10 | | | | | | | | | | | | | | | | | | |
| Europe | HSBC Bank | 48,167 | | 1,875 | | 3.89 | | 44,787 | | 2,148 | | 4.80 | | 32,825 | | 1,311 | | 3.99 | |
| | HSBC Private Banking | | | | | | | | | | | | | | | | | | |
| | Holdings (Suisse) | 4,493 | | 105 | | 2.34 | | 690 | | 22 | | 3.19 | | 1,030 | | 33 | | 3.20 | |
| | HSBC France | 37,851 | | 1,672 | | 4.42 | | 30,816 | | 1,358 | | 4.41 | | 23,171 | | 886 | | 3.82 | |
| |
| Hong Kong | Hang Seng Bank | 1,696 | | 55 | | 3.24 | | 2,993 | | 123 | | 4.11 | | 2,031 | | 84 | | 4.14 | |
| | The Hongkong and | | | | | | | | | | | | | | | | | | |
| | Shanghai Banking | | | | | | | | | | | | | | | | | | |
| | Corporation | 3,665 | | 70 | | 1.91 | | 3,634 | | 150 | | 4.13 | | 2,745 | | 125 | | 4.55 | |
| Rest of | The Hongkong and | | | | | | | | | | | | | | | | | | |
| Asia-Pacific | Shanghai Banking | | | | | | | | | | | | | | | | | | |
| | Corporation | 16,232 | | 450 | | 2.77 | | 10,247 | | 445 | | 4.34 | | 6,276 | | 246 | | 3.92 | |
| | HSBC Bank Malaysia | 338 | | 10 | | 2.96 | | 375 | | 12 | | 3.20 | | 280 | | 9 | | 3.21 | |
| | HSBC Bank Middle East | 1,680 | | 29 | | 1.73 | | 672 | | 32 | | 4.76 | | 453 | | 23 | | 5.08 | |
| |
| North America | HSBC Bank USA | 11,015 | | 220 | | 2.00 | | 6,933 | | 414 | | 5.97 | | 3,695 | | 208 | | 5.63 | |
| | HSBC Bank Canada | 1,391 | | 41 | | 2.95 | | 1,681 | | 93 | | 5.53 | | 1,520 | | 68 | | 4.47 | |
| |
| Latin America | HSBC Mexico | 822 | | 32 | | 3.89 | | 983 | | 63 | | 6.41 | | 781 | | 50 | | 6.40 | |
| | Brazilian operations9 | 2,790 | | 190 | | 6.81 | | 1,549 | | 106 | | 6.84 | | 1,033 | | 101 | | 9.78 | |
| | HSBC Bank Panama | 1,016 | | 43 | | 4.23 | | 1,137 | | 66 | | 5.80 | | 349 | | 17 | | 4.87 | |
| | HSBC Bank Argentina | 27 | | 1 | | 3.70 | | 117 | | 9 | | 7.69 | | 72 | | 5 | | 6.94 | |
| |
| Other operations | | 4,564 | | 166 | | 3.64 | | 4,495 | | 291 | | 6.47 | | 5,304 | | 334 | | 6.30 | |
| | |
| |
| | | |
| |
| | | |
| |
| | | |
| | | 135,747 | | 4,959 | | 3.65 | | 111,109 | | 5,332 | | 4.80 | | 81,565 | | 3,500 | | 4.29 | |
| | |
| |
| | | |
| |
| | | |
| |
| | | |
| |
| Financial liabilities designated at fair | | | | | | | | | | | | | | | | | | |
| value – own debt issued11 | | | | | | | | | | | | | | | | | | |
| |
| Europe | HSBC Holdings | 18,675 | | 721 | | 3.86 | | 15,142 | | 822 | | 5.43 | | 15,132 | | 745 | | 4.92 | |
| | HSBC Bank | 8,805 | | 529 | | 6.01 | | 9,907 | | 525 | | 5.30 | | 7,888 | | 373 | | 4.73 | |
| | HSBC France | 1,515 | | 79 | | 5.21 | | 143 | | 11 | | 7.69 | | | | | | | |
| |
| Hong Kong | Hang Seng Bank | 127 | | 6 | | 4.72 | | 126 | | 6 | | 4.76 | | | | | | | |
| |
| North America | HSBC Bank USA | 1,504 | | 67 | | 4.45 | | 1,620 | | 125 | | 7.72 | | 1,892 | | 116 | | 6.13 | |
| | HSBC Finance | 32,126 | | 1,563 | | 4.87 | | 31,889 | | 2,079 | | 6.52 | | 29,917 | | 1,877 | | 6.27 | |
| |
| Other operations | | 1,083 | | 168 | | 15.51 | | – | | – | | – | | 461 | | 49 | | 10.63 | |
| | |
| |
| | | |
| |
| | | |
| |
| | | |
| |
| | | 63,835 | | 3,133 | | 4.91 | | 58,827 | | 3,568 | | 6.07 | | 55,290 | | 3,160 | | 5.72 | |
| | |
| |
| | | |
| |
| | | |
| |
| | | |
| For footnotes, see page 143. |
46
Back to Contents
| | | 2008 | | 2007 | | 2006 | |
| | |
|
|
|
|
| |
|
|
|
|
| |
|
|
|
|
| |
| | | Average | | Interest | | | | Average | | Interest | | | | Average | | Interest | | | |
| | | balance | | expense | | Cost | | balance | | expense | | Cost | | balance | | expense | | Cost | |
| | | US$m | | US$m | | % | | US$m | | US$m | | % | | US$m | | US$m | | % | |
| Customer accounts12 | | | | | | | | | | | | | | | | | | |
| Europe | HSBC Bank | 305,702 | | 10,092 | | 3.30 | | 270,965 | | 10,576 | | 3.90 | | 221,369 | | 7,031 | | 3.18 | |
| | HSBC Private Banking | | | | | | | | | | | | | | | | | | |
| | Holdings (Suisse) | 37,778 | | 1,349 | | 3.57 | | 30,955 | | 1,485 | | 4.80 | | 25,346 | | 1,069 | | 4.22 | |
| | HSBC France | 39,428 | | 1,583 | | 4.01 | | 31,845 | | 1,226 | | 3.85 | | 23,579 | | 752 | | 3.19 | |
| |
| Hong Kong | Hang Seng Bank | 66,142 | | 914 | | 1.38 | | 61,227 | | 1,900 | | 3.10 | | 54,267 | | 1,712 | | 3.15 | |
| | The Hongkong and | | | | | | | | | | | | | | | | | | |
| | Shanghai Banking | | | | | | | | | | | | | | | | | | |
| | Corporation | 139,169 | | 1,365 | | 0.98 | | 125,478 | | 3,499 | | 2.79 | | 104,441 | | 2,934 | | 2.81 | |
| Rest of | The Hongkong and | | | | | | | | | | | | | | | | | | |
| Asia-Pacific | Shanghai Banking | | | | | | | | | | | | | | | | | | |
| | Corporation | 96,476 | | 2,869 | | 2.97 | | 76,052 | | 2,645 | | 3.48 | | 56,760 | | 1,903 | | 3.35 | |
| | HSBC Bank Malaysia | 10,266 | | 295 | | 2.87 | | 8,823 | | 260 | | 2.95 | | 7,260 | | 212 | | 2.92 | |
| | HSBC Bank Middle East | 19,922 | | 422 | | 2.12 | | 15,685 | | 578 | | 3.69 | | 11,713 | | 411 | | 3.51 | |
| |
| North America | HSBC Bank USA | 86,701 | | 2,069 | | 2.39 | | 78,138 | | 3,051 | | 3.90 | | 71,031 | | 2,490 | | 3.51 | |
| | HSBC Bank Canada | 34,090 | | 967 | | 2.84 | | 30,060 | | 1,090 | | 3.63 | | 25,277 | | 804 | | 3.18 | |
| |
| Latin America | HSBC Mexico | 14,612 | | 561 | | 3.84 | | 14,230 | | 548 | | 3.85 | | 13,625 | | 471 | | 3.46 | |
| | Brazilian operations9 | 26,288 | | 3,110 | | 11.83 | | 19,581 | | 2,163 | | 11.05 | | 14,887 | | 2,056 | | 13.81 | |
| | HSBC Bank Panama | 7,761 | | 296 | | 3.81 | | 7,604 | | 314 | | 4.13 | | 998 | | 34 | | 3.41 | |
| | HSBC Bank Argentina | 2,266 | | 145 | | 6.40 | | 1,892 | | 85 | | 4.49 | | 983 | | 41 | | 4.17 | |
| |
| Other operations | | 64,253 | | 1,952 | | 3.04 | | 55,351 | | 2,297 | | 4.15 | | 49,846 | | 1,811 | | 3.63 | |
| | |
| |
| | | |
| |
| | | |
| |
| | | |
| |
| | | 950,854 | | 27,989 | | 2.94 | | 827,886 | | 31,717 | | 3.83 | | 681,382 | | 23,731 | | 3.48 | |
| | |
| |
| | | |
| |
| | | |
| |
| | | |
| |
| Debt securities in issue | | | | | | | | | | | | | | | | | | |
| Europe | HSBC Bank | 86,216 | | 4,001 | | 4.64 | | 64,168 | | 3,753 | | 5.85 | | 45,870 | | 2,047 | | 4.46 | |
| | HSBC France | 30,815 | | 1,447 | | 4.70 | | 28,757 | | 1,207 | | 4.20 | | 19,818 | | 633 | | 3.19 | |
| | HSBC Finance | 215 | | 8 | | 3.72 | | 240 | | 18 | | 7.50 | | 548 | | 32 | | 5.84 | |
| |
| Hong Kong | Hang Seng Bank | 1,685 | | 57 | | 3.38 | | 1,734 | | 80 | | 4.61 | | 1,622 | | 64 | | 3.95 | |
| Rest of | The Hongkong and | | | | | | | | | | | | | | | | | | |
| Asia-Pacific | Shanghai Banking | | | | | | | | | | | | | | | | | | |
| | Corporation | 8,995 | | 640 | | 7.12 | | 8,979 | | 559 | | 6.23 | | 7,990 | | 438 | | 5.48 | |
| | HSBC Bank Malaysia | 475 | | 20 | | 4.21 | | 318 | | 13 | | 4.09 | | 371 | | 13 | | 3.50 | |
| | HSBC Bank Middle East | 2,650 | | 90 | | 3.40 | | 2,086 | | 119 | | 5.70 | | – | | – | | – | |
| |
| North America | HSBC Bank USA | 21,922 | | 852 | | 3.89 | | 25,724 | | 1,232 | | 4.79 | | 28,832 | | 1,407 | | 4.88 | |
| | HSBC Finance | 98,096 | | 3,765 | | 3.84 | | 115,520 | | 5,311 | | 4.60 | | 112,353 | | 5,047 | | 4.49 | |
| | HSBC Bank Canada | 16,957 | | 604 | | 3.56 | | 14,771 | | 640 | | 4.33 | | 10,616 | | 460 | | 4.33 | |
| |
| Latin America | HSBC Mexico | 2,693 | | 243 | | 9.02 | | 1,147 | | 110 | | 9.59 | | 249 | | 23 | | 9.24 | |
| | Brazilian operations9 | 1,859 | | 156 | | 8.39 | | 1,417 | | 115 | | 8.12 | | 700 | | 70 | | 10.00 | |
| | HSBC Bank Panama | 556 | | 33 | | 5.94 | | 607 | | 45 | | 7.41 | | 35 | | 2 | | 5.71 | |
| | HSBC Bank Argentina | 2 | | – | | – | | 12 | | – | | – | | – | | – | | – | |
| |
| Other operations | | 13,691 | | 66 | | 0.48 | | 6,446 | | (13 | ) | (0.20 | ) | 3,070 | | 108 | | 3.52 | |
| | |
| |
| | | |
| |
| | | |
| |
| | | |
| | | 286,827 | | 11,982 | | 4.18 | | 271,926 | | 13,189 | | 4.85 | | 232,074 | | 10,344 | | 4.46 | |
| | |
| |
| | | |
| |
| | | |
| |
| | | |
| |
| For footnotes, see page 143. | | | | | | | | | | | | | | | | | | |
47
Back to Contents
| H S B C H O L D I N G S P L C |
| |
| Report of the Directors: Operating and Financial Review(continued) |
| | |
| | |
| Financial summary > Balance sheet > Average balance sheet and NII |
Total equity and liabilities(continued)
| | | 2008 | | 2007 | | 2006 | |
| | |
|
|
|
|
| |
|
|
|
|
| |
|
|
|
|
| |
| | | Average | | Interest | | | | Average | | Interest | | | | Average | | Interest | | | |
| | | balance | | expense | | Cost | | balance | | expense | | Cost | | balance | | expense | | Cost | |
| | | US$m | | US$m | | % | | US$m | | US$m | | % | | US$m | | US$m | | % | |
| Other interest-bearing liabilities | | | | | | | | | | | | | | | | | | |
| Europe | HSBC Bank | 38,906 | | 1,134 | | 2.91 | | 22,035 | | 1,302 | | 5.91 | | 23,196 | | 1,026 | | 4.42 | |
| | HSBC Private Banking | | | | | | | | | | | | | | | | | | |
| | Holdings (Suisse) | 4,203 | | 135 | | 3.21 | | 3,427 | | 163 | | 4.76 | | 3,545 | | 155 | | 4.37 | |
| | HSBC France | 33,920 | | 1,361 | | 4.01 | | 27,830 | | 979 | | 3.52 | | 13,476 | | 488 | | 3.62 | |
| | HSBC Finance | 3,712 | | 191 | | 5.15 | | 4,557 | | 227 | | 4.98 | | 4,211 | | 219 | | 5.20 | |
| |
| Hong Kong | Hang Seng Bank | 1,258 | | 41 | | 3.26 | | 2,278 | | 114 | | 5.00 | | 1,378 | | 64 | | 4.64 | |
| | The Hongkong and | | | | | | | | | | | | | | | | | | |
| | Shanghai Banking | | | | | | | | | | | | | | | | | | |
| | Corporation | 10,557 | | 288 | | 2.73 | | 9,866 | | 535 | | 5.42 | | 8,140 | | 365 | | 4.48 | |
| Rest of | The Hongkong and | | | | | | | | | | | | | | | | | | |
| Asia-Pacific | Shanghai Banking | | | | | | | | | | | | | | | | | | |
| | Corporation | 23,685 | | 466 | | 1.97 | | 12,631 | | 580 | | 4.59 | | 13,425 | | 629 | | 4.69 | |
| | HSBC Bank Malaysia | 338 | | 7 | | 2.07 | | 232 | | 6 | | 2.59 | | 235 | | 9 | | 3.83 | |
| | HSBC Bank Middle East | 1,918 | | 89 | | 4.64 | | 1,168 | | 81 | | 6.93 | | 1,046 | | 63 | | 6.02 | |
| |
| North America | HSBC Bank USA | 10,490 | | 468 | | 4.46 | | 13,602 | | 587 | | 4.32 | | 11,966 | | 1,211 | | 10.12 | |
| | HSBC Finance | 4,670 | | 141 | | 3.02 | | 1,941 | | 113 | | 5.82 | | 542 | | 18 | | 3.32 | |
| | HSBC Bank Canada | 1,306 | | 19 | | 1.45 | | 1,151 | | 27 | | 2.35 | | 1,134 | | 22 | | 1.94 | |
| | HSBC Markets Inc | 10,349 | | 78 | | 0.75 | | 8,889 | | 255 | | 2.87 | | 2,883 | | 88 | | 3.05 | |
| |
| Latin America | HSBC Mexico | 187 | | 20 | | 10.70 | | 207 | | 16 | | 7.73 | | 135 | | 8 | | 5.93 | |
| | Brazilian operations9 | 2,340 | | 207 | | 8.85 | | 1,103 | | 182 | | 16.50 | | 817 | | 105 | | 12.85 | |
| | HSBC Bank Panama | 917 | | 3 | | 0.33 | | 574 | | 9 | | 1.57 | | – | | – | | – | |
| | HSBC Bank Argentina | 92 | | 6 | | 6.52 | | 95 | | 4 | | 4.21 | | 79 | | 10 | | 12.66 | |
| |
| Other operations | | (134,269 | ) | (3,979 | ) | | | (101,874 | ) | (4,422 | ) | | | (68,873 | ) | (3,822 | ) | | |
| | |
| |
| | | |
| |
| | | |
| |
| | | |
| | | 14,579 | | 675 | | 4.63 | | 9,712 | | 758 | | 7.80 | | 17,335 | | 658 | | 3.80 | |
| | |
| |
| | | |
| |
| | | |
| |
| | | |
| |
| Total interest-bearing liabilities | | | | | | | | | | | | | | | | | | |
| Europe | HSBC Bank | 487,796 | | 17,631 | | 3.61 | | 411,862 | | 18,304 | | 4.44 | | 331,148 | | 11,788 | | 3.56 | |
| | HSBC Private Banking | | | | | | | | | | | | | | | | | | |
| | Holdings (Suisse) | 46,474 | | 1,589 | | 3.42 | | 35,072 | | 1,670 | | 4.76 | | 29,921 | | 1,257 | | 4.20 | |
| | HSBC France | 143,529 | | 6,142 | | 4.28 | | 119,391 | | 4,781 | | 4.00 | | 80,044 | | 2,759 | | 3.45 | |
| | HSBC Finance | 3,927 | | 199 | | 5.07 | | 4,797 | | 245 | | 5.11 | | 4,759 | | 251 | | 5.27 | |
| Hong Kong | Hang Seng Bank | 70,908 | | 1,073 | | 1.51 | | 68,358 | | 2,223 | | 3.25 | | 59,298 | | 1,924 | | 3.24 | |
| | The Hongkong and | | | | | | | | | | | | | | | | | | |
| | Shanghai Banking | | | | | | | | | | | | | | | | | | |
| | Corporation | 153,391 | | 1,723 | | 1.12 | | 138,978 | | 4,184 | | 3.01 | | 115,326 | | 3,424 | | 2.97 | |
| Rest of | The Hongkong and | | | | | | | | | | | | | | | | | | |
| Asia-Pacific | Shanghai Banking | | | | | | | | | | | | | | | | | | |
| | Corporation | 145,388 | | 4,425 | | 3.04 | | 107,909 | | 4,229 | | 3.92 | | 84,451 | | 3,216 | | 3.81 | |
| | HSBC Bank Malaysia | 11,417 | | 332 | | 2.91 | | 9,748 | | 291 | | 2.99 | | 8,146 | | 243 | | 2.98 | |
| | HSBC Bank Middle East | 26,170 | | 630 | | 2.41 | | 19,611 | | 810 | | 4.13 | | 13,212 | | 497 | | 3.76 | |
| North America | HSBC Bank USA | 131,632 | | 3,676 | | 2.79 | | 126,017 | | 5,409 | | 4.29 | | 117,416 | | 5,432 | | 4.63 | |
| | HSBC Finance | 134,892 | | 5,469 | | 4.05 | | 149,350 | | 7,503 | | 5.02 | | 142,812 | | 6,942 | | 4.86 | |
| | HSBC Bank Canada | 53,744 | | 1,631 | | 3.03 | | 47,663 | | 1,850 | | 3.88 | | 38,547 | | 1,354 | | 3.51 | |
| | HSBC Markets Inc | 10,349 | | 78 | | 0.75 | | 8,889 | | 255 | | 2.87 | | 2,883 | | 88 | | 3.05 | |
| Latin America | HSBC Mexico | 18,314 | | 856 | | 4.67 | | 16,567 | | 737 | | 4.45 | | 14,790 | | 552 | | 3.73 | |
| | Brazilian operations9 | 33,277 | | 3,663 | | 11.01 | | 23,650 | | 2,566 | | 10.85 | | 17,437 | | 2,332 | | 13.37 | |
| | HSBC Bank Panama | 10,250 | | 375 | | 3.66 | | 9,922 | | 434 | | 4.37 | | 1,383 | | 53 | | 3.83 | |
| | HSBC Bank Argentina | 2,387 | | 152 | | 6.37 | | 2,116 | | 98 | | 4.63 | | 1,134 | | 56 | | 4.94 | |
| Other operations | | (32,003 | ) | (906 | ) | | | (20,440 | ) | (1,025 | ) | | | 4,939 | | (775 | ) | | |
| | |
| |
| | | |
| |
| | | |
| |
| | | |
| | | 1,451,842 | | 48,738 | | 3.36 | | 1,279,460 | | 54,564 | | 4.26 | | 1,067,646 | | 41,393 | | 3.88 | |
| | |
| |
| | | |
| |
| | | |
| |
| | | |
| |
| For footnotes, see page 143. | | | | | | | | | | | | | | | | | | |
48
Back to Contents
| Net interest margin13 | | | | | | |
| | | 2008 | | 2007 | | 2006 | |
| | | % | | % | | % | |
| |
| Europe | HSBC Bank | 1.71 | | 1.58 | | 2.09 | |
| | HSBC Private Banking Holdings (Suisse) | 1.24 | | 1.10 | | 1.11 | |
| | HSBC France | 0.26 | | 0.54 | | 0.81 | |
| | HSBC Finance | 6.36 | | 6.66 | | 7.08 | |
| Hong Kong | Hang Seng Bank | 2.59 | | 2.54 | | 2.43 | |
| | The Hongkong and Shanghai Banking Corporation | 2.27 | | 2.27 | | 2.29 | |
| |
| Rest of Asia-Pacific | The Hongkong and Shanghai Banking Corporation | 2.15 | | 2.25 | | 2.16 | |
| | HSBC Bank Malaysia | 3.02 | | 3.21 | | 3.23 | |
| | HSBC Bank Middle East | 3.63 | | 3.63 | | 4.11 | |
| North America | HSBC Bank USA | 2.93 | | 2.43 | | 1.95 | |
| | HSBC Finance | 7.22 | | 6.84 | | 6.83 | |
| | HSBC Bank Canada | 1.93 | | 2.23 | | 2.36 | |
| Latin America | HSBC Mexico | 8.95 | | 8.60 | | 7.92 | |
| | Brazilian operations9 | 8.85 | | 10.55 | | 11.78 | |
| | HSBC Bank Panama | 4.39 | | 4.29 | | 3.94 | |
| | HSBC Bank Argentina | 10.25 | | 8.86 | | 7.31 | |
| | |
| |
| |
| |
| | | 2.90 | | 2.91 | | 3.10 | |
| | |
| |
| |
| |
| Distribution of average total assets | | | | | | |
| |
| | | 2008 | | 2007 | | 2006 | |
| | | % | | % | | % | |
| Europe | HSBC Bank | 36.7 | | 34.6 | | 30.6 | |
| | HSBC Private Banking Holdings (Suisse) | 2.3 | | 2.2 | | 2.3 | |
| | HSBC France | 13.8 | | 12.0 | | 10.0 | |
| | HSBC Finance | 0.2 | | 0.3 | | 0.5 | |
| Hong Kong | Hang Seng Bank | 3.9 | | 4.4 | | 4.3 | |
| | The Hongkong and Shanghai Banking Corporation | 9.5 | | 10.1 | | 10.7 | |
| Rest of Asia-Pacific | The Hongkong and Shanghai Banking Corporation | 8.8 | | 6.9 | | 6.0 | |
| | HSBC Bank Malaysia | 0.6 | | 0.7 | | 0.6 | |
| | HSBC Bank Middle East | 1.8 | | 1.4 | | 1.3 | |
| North America | HSBC Bank USA | 11.2 | | 10.1 | | 11.3 | |
| | HSBC Finance | 6.2 | | 8.3 | | 10.0 | |
| | HSBC Bank Canada | 2.9 | | 3.3 | | 2.4 | |
| Latin America | HSBC Mexico | 1.5 | | 2.5 | | 1.7 | |
| | Brazilian operations9 | 2.1 | | 1.6 | | 1.5 | |
| | HSBC Bank Panama | 0.6 | | 0.7 | | 0.2 | |
| | HSBC Bank Argentina | 0.2 | | 0.2 | | 0.1 | |
| |
| Other operations (including consolidation adjustments) | (2.3 | ) | 0.7 | | 6.5 | |
| |
| |
| |
| |
| | | 100.0 | | 100.0 | | 100.0 | |
| |
| |
| |
| |
| | | | | | | |
| For footnotes, see page 143. | | | | | | |
49
Back to Contents
| H S B C H O L D I N G S P L C |
| |
| Report of the Directors: Operating and Financial Review(continued) |
| | |
| | |
| Financial summary > Balance sheet > Changes in NII |
Analysis of changes in net interest income
The following table allocates changes in net interest income between volume and rate for 2008 compared with 2007, and for 2007 compared with 2006.
Interest income
| | | | | | | | |
| | | | | | | | | | |
| | | | | | | | | | |
| | | | | Increase/(decrease) | | | | Increase/(decrease) | | | |
| | | | | in 2008 compared with 2007 | | | | in 2007 compared with 2006 | | | |
| | | |
|
|
|
| | |
|
|
|
| | | |
| | | 2008 | | Volume | | Rate | | 2007 | | Volume | | Rate | | 2006 | |
| | | US$m | | US$m | | US$m | | US$m | | US$m | | US$m | | US$m | |
| Short-term funds and loans and advances to banks | | | | | | | | | | | | | | |
| Europe | HSBC Bank | 2,187 | | (166 | ) | (239 | ) | 2,592 | | 729 | | 327 | | 1,536 | |
| | HSBC Private Banking Holdings (Suisse) | 333 | | 119 | | (15 | ) | 229 | | 13 | | 26 | | 190 | |
| | HSBC France | 1,495 | | 173 | | 28 | | 1,294 | | 390 | | 214 | | 690 | |
| Hong Kong | Hang Seng Bank | 587 | | 203 | | (225 | ) | 609 | | 126 | | – | | 483 | |
| | The Hongkong and ShanghaiBanking Corporation | 1,344 | | (139 | ) | (869 | ) | 2,352 | | 484 | | 223 | | 1,645 | |
| Rest of Asia-Pacific | The Hongkong and Shanghai Banking Corporation | 881 | | 362 | | (291 | ) | 810 | | 229 | | 61 | | 520 | |
| | HSBC Bank Malaysia | 165 | | 65 | | (3 | ) | 103 | | 13 | | 3 | | 87 | |
| | HSBC Bank Middle East | 188 | | (15 | ) | (121 | ) | 324 | | 100 | | 16 | | 208 | |
| North America | HSBC Bank USA | 328 | | 10 | | (159 | ) | 477 | | 54 | | (42 | ) | 465 | |
| | HSBC Bank Canada | 107 | | (21 | ) | (46 | ) | 174 | | 28 | | 8 | | 138 | |
| Latin America | HSBC Mexico | 247 | | 9 | | (1 | ) | 239 | | 11 | | 1 | | 227 | |
| | Brazilian operations9 | 951 | | 242 | | 64 | | 645 | | 230 | | (157 | ) | 572 | |
| | HSBC Bank Panama | 30 | | 9 | | (12 | ) | 33 | | 24 | | – | | 9 | |
| | HSBC Bank Argentina | 43 | | 16 | | 11 | | 16 | | 4 | | 4 | | 8 | |
| Other operations | | 760 | | 43 | | (181 | ) | 898 | | 89 | | 191 | | 618 | |
| | |
| | | | | |
| | | | | |
| |
| | | 9,646 | | 915 | | (2,064 | ) | 10,795 | | 2,561 | | 838 | | 7,396 | |
| | |
| | | | | |
| | | | | |
| |
| Loans and advances to customers | | | | | | | | | | | | | | |
| Europe | HSBC Bank | 18,587 | | 3,885 | | (3,376 | ) | 18,078 | | 669 | | 3,243 | | 14,166 | |
| | HSBC Private Banking Holdings (Suisse) | 494 | | 132 | | (145 | ) | 507 | | 127 | | 42 | | 338 | |
| | HSBC France | 3,604 | | 257 | | 128 | | 3,219 | | 699 | | 57 | | 2,463 | |
| | HSBC Finance | 505 | | (76 | ) | (30 | ) | 611 | | (50 | ) | (10 | ) | 671 | |
| Hong Kong | Hang Seng Bank | 1,589 | | 251 | | (782 | ) | 2,120 | | 193 | | (25 | ) | 1,952 | |
| | The Hongkong and ShanghaiBanking Corporation | 2,291 | | 392 | | (1,002 | ) | 2,901 | | 51 | | 7 | | 2,843 | |
| Rest of Asia-Pacific | The Hongkong and ShanghaiBanking Corporation | 5,163 | | 1,345 | | (503 | ) | 4,321 | | 471 | | 401 | | 3,449 | |
| | HSBC Bank Malaysia | 553 | | 64 | | (18 | ) | 507 | | 80 | | (3 | ) | 430 | |
| | HSBC Bank Middle East | 1,549 | | 680 | | (331 | ) | 1,200 | | 178 | | 65 | | 957 | |
| North America | HSBC Bank USA | 5,758 | | 219 | | (1,046 | ) | 6,585 | | 106 | | 338 | | 6,141 | |
| | HSBC Finance | 15,835 | | (1,495 | ) | (756 | ) | 18,086 | | 732 | | 293 | | 17,061 | |
| | HSBC Bank Canada | 2,455 | | 284 | | (427 | ) | 2,598 | | 495 | | 66 | | 2,037 | |
| Latin America | HSBC Mexico | 2,565 | | 104 | | 274 | | 2,187 | | 380 | | 275 | | 1,532 | |
| | Brazilian operations9 | 4,879 | | 1,744 | | (760 | ) | 3,895 | | 1,409 | | (758 | ) | 3,244 | |
| | HSBC Bank Panama | 810 | | 49 | | (17 | ) | 778 | | 686 | | – | | 92 | |
| | HSBC Bank Argentina | 378 | | 68 | | 69 | | 241 | | 106 | | 28 | | 107 | |
| Other operations | | 1,707 | | 564 | | (647 | ) | 1,790 | | 118 | | 144 | | 1,528 | |
| | |
| | | | | |
| | | | | |
| |
| | | 68,722 | | 8,887 | | (9,789 | ) | 69,624 | | 5,891 | | 4,722 | | 59,011 | |
| | |
| | | | | |
| | | | | |
| |
| |
| For footnotes, see page 143. | | | | | | | | | | | | | | |
50
Back to Contents
| | | | | | | | |
| | | | | | | | |
| | | | | Increase/(decrease) in | | | | Increase/(decrease) | | | |
| | | | | 2008 compared with 2007 | | | | in 2007 compared with 2006 | | | |
| | | |
|
|
|
| | |
|
|
|
| | | |
| | | 2008 | | Volume | | Rate | | 2007 | | Volume | | Rate | | 2006 | |
| | | US$m | | US$m | | US$m | | US$m | | US$m | | US$m | | US$m | |
| Financial investments | | | | | | | | | | | | | | |
| Europe | HSBC Bank | 3,840 | | 2,006 | | (597 | ) | 2,431 | | 146 | | 308 | | 1,977 | |
| | HSBC Private BankingHoldings (Suisse) | 553 | | 81 | | (39 | ) | 511 | | 74 | | 46 | | 391 | |
| | HSBC France | 795 | | 222 | | 62 | | 511 | | 291 | | 125 | | 95 | |
| Hong Kong | Hang Seng Bank | 1,063 | | (340 | ) | (147 | ) | 1,550 | | 157 | | 169 | | 1,224 | |
| | The Hongkong and Shanghai Banking Corporation | 563 | | (263 | ) | (191 | ) | 1,017 | | 16 | | 90 | | 911 | |
| Rest of Asia-Pacific | The Hongkong and Shanghai Banking Corporation | 1,507 | | 371 | | 71 | | 1,065 | | 281 | | 47 | | 737 | |
| | HSBC Bank Malaysia | 36 | | (21 | ) | 1 | | 56 | | 21 | | (1 | ) | 36 | |
| | HSBC Bank Middle East | 144 | | 96 | | (126 | ) | 174 | | 118 | | (16 | ) | 72 | |
| North America | HSBC Bank USA | 1,232 | | 87 | | (44 | ) | 1,189 | | 58 | | 22 | | 1,109 | |
| | HSBC Finance | 143 | | (65 | ) | (21 | ) | 229 | | 19 | | 10 | | 200 | |
| | HSBC Bank Canada | 197 | | 41 | | (102 | ) | 258 | | 69 | | 15 | | 174 | |
| Latin America | HSBC Mexico | 244 | | 14 | | (89 | ) | 319 | | (76 | ) | (32 | ) | 427 | |
| | Brazilian operations9 | 853 | | 140 | | 41 | | 672 | | 225 | | (54 | ) | 501 | |
| | HSBC Bank Panama | 47 | | (7 | ) | (4 | ) | 58 | | 37 | | – | | 21 | |
| | HSBC Bank Argentina | 47 | | (33 | ) | 12 | | 68 | | 31 | | (1 | ) | 38 | |
| Other operations | | 1,354 | | 123 | | (176 | ) | 1,407 | | 121 | | 95 | | 1,191 | |
| | |
| | | | | |
| | | | | |
| |
| | | 12,618 | | 2,450 | | (1,347 | ) | 11,515 | | 1,634 | | 777 | | 9,104 | |
| | |
| | | | | |
| | | | | |
| |
| |
| Interest expense | | | | | | | | | | | | | | |
| Deposits by banks | | | | | | | | | | | | | | |
| Europe | HSBC Bank | 1,875 | | 162 | | (435 | ) | 2,148 | | 477 | | 360 | | 1,311 | |
| | HSBC Private BankingHoldings (Suisse) | 105 | | 121 | | (38 | ) | 22 | | (11 | ) | – | | 33 | |
| | HSBC France | 1,672 | | 310 | | 4 | | 1,358 | | 292 | | 180 | | 886 | |
| Hong Kong | Hang Seng Bank | 55 | | (53 | ) | (15 | ) | 123 | | 40 | | (1 | ) | 84 | |
| | The Hongkong and Shanghai Banking Corporation | 70 | | 1 | | (81 | ) | 150 | | 40 | | (15 | ) | 125 | |
| Rest of Asia-Pacific | The Hongkong and ShanghaiBanking Corporation | 450 | | 260 | | (255 | ) | 445 | | 156 | | 43 | | 246 | |
| | HSBC Bank Malaysia | 10 | | (1 | ) | (1 | ) | 12 | | 3 | | – | | 9 | |
| | HSBC Bank Middle East | 29 | | 48 | | (51 | ) | 32 | | 11 | | (2 | ) | 23 | |
| North America | HSBC Bank USA | 220 | | 244 | | (438 | ) | 414 | | 182 | | 24 | | 208 | |
| | HSBC Bank Canada | 41 | | (16 | ) | (36 | ) | 93 | | 7 | | 18 | | 68 | |
| Latin America | HSBC Mexico | 32 | | (10 | ) | (21 | ) | 63 | | 13 | | – | | 50 | |
| | Brazilian operations9 | 190 | | 85 | | (1 | ) | 106 | | 50 | | (45 | ) | 101 | |
| | HSBC Bank Panama | 43 | | (7 | ) | (16 | ) | 66 | | 49 | | – | | 17 | |
| | HSBC Bank Argentina | 1 | | (7 | ) | (1 | ) | 9 | | 3 | | 1 | | 5 | |
| Other operations | | 166 | | 4 | | (129 | ) | 291 | | (51 | ) | 8 | | 334 | |
| | |
| | | | | |
| | | | | |
| |
| | | 4,959 | | 1,183 | | (1,556 | ) | 5,332 | | 1,267 | | 565 | | 3,500 | |
| | |
| | | | | |
| | | | | |
| |
| |
| For footnotes, see page 143. | | | | | | | | | | | | | | |
51
Back to Contents
| H S B C H O L D I N G S P L C |
| |
| Report of the Directors: Operating and Financial Review(continued) |
| | |
| | |
| Financial summary > Balance sheet > Changes in NII / Share capital and reserves |
Interest expense (continued)
| | | | | | | | |
| | | | | | | | |
| | | | | Increase/(decrease) | | | | Increase/(decrease) | | | |
| | | | | in 2008 compared with 2007 | | | | in 2007 compared with 2006 | | | |
| | | |
|
|
|
| | |
|
|
|
| | | |
| | | 2008 | | Volume | | Rate | | 2007 | | Volume | | Rate | | 2006 | |
| | | US$m | | US$m | | US$m | | US$m | | US$m | | US$m | | US$m | |
| Customer accounts | | | | | | | | | | | | | | |
| Europe | HSBC Bank | 10,092 | | 1,355 | | (1,839 | ) | 10,576 | | 1,577 | | 1,968 | | 7,031 | |
| | HSBC Private BankingHoldings (Suisse) | 1,349 | | 328 | | (464 | ) | 1,485 | | 237 | | 179 | | 1,069 | |
| | HSBC France | 1,583 | | 292 | | 65 | | 1,226 | | 264 | | 210 | | 752 | |
| Hong Kong | Hang Seng Bank | 914 | | 152 | | (1,138 | ) | 1,900 | | 219 | | (31 | ) | 1,712 | |
| | The Hongkong and Shanghai Banking Corporation | 1,365 | | 382 | | (2,516 | ) | 3,499 | | 591 | | (26 | ) | 2,934 | |
| Rest of Asia-Pacific | The Hongkong and Shanghai Banking Corporation | 2,869 | | 711 | | (487 | ) | 2,645 | | 646 | | 96 | | 1,903 | |
| | HSBC Bank Malaysia | 295 | | 43 | | (8 | ) | 260 | | 46 | | 2 | | 212 | |
| | HSBC Bank Middle East | 422 | | 156 | | (312 | ) | 578 | | 139 | | 28 | | 411 | |
| North America | HSBC Bank USA | 2,069 | | 334 | | (1,316 | ) | 3,051 | | 249 | | 312 | | 2,490 | |
| | HSBC Bank Canada | 967 | | 146 | | (269 | ) | 1,090 | | 152 | | 134 | | 804 | |
| Latin America | HSBC Mexico | 561 | | 15 | | (2 | ) | 548 | | 21 | | 56 | | 471 | |
| | Brazilian operations9 | 3,110 | | 741 | | 206 | | 2,163 | | 648 | | (541 | ) | 2,056 | |
| | HSBC Bank Panama | 296 | | 6 | | (24 | ) | 314 | | 280 | | – | | 34 | |
| | HSBC Bank Argentina | 145 | | 17 | | 43 | | 85 | | 38 | | 6 | | 41 | |
| Other operations | | 1,952 | | 369 | | (714 | ) | 2,297 | | 200 | | 286 | | 1,811 | |
| | |
| | | | | |
| | | | | |
| |
| | | 27,989 | | 4,710 | | (8,438 | ) | 31,717 | | 5,098 | | 2,888 | | 23,731 | |
| | |
| | | | | |
| | | | | |
| |
| Financial liabilities designated at fair value –own debt issued | 3,133 | | 304 | | (739 | ) | 3,568 | | 196 | | 212 | | 3,160 | |
| |
| | | | | |
| | | | | |
| |
| Debt securities in issue | | | | | | | | | | | | | | |
| Europe | HSBC Bank | 4,001 | | 1,290 | | (1,042 | ) | 3,753 | | 816 | | 890 | | 2,047 | |
| | HSBC France | 1,447 | | 86 | | 154 | | 1,207 | | 285 | | 289 | | 633 | |
| | HSBC Finance | 8 | | (2 | ) | (8 | ) | 18 | | (18 | ) | 4 | | 32 | |
| Hong Kong | Hang Seng Bank | 57 | | (2 | ) | (21 | ) | 80 | | 4 | | 12 | | 64 | |
| Rest of Asia-Pacific | The Hongkong and ShanghaiBanking Corporation | 640 | | 1 | | 80 | | 559 | | 54 | | 67 | | 438 | |
| | HSBC Bank Malaysia | 20 | | 6 | | 1 | | 13 | | (2 | ) | 2 | | 13 | |
| | HSBC Bank Middle East | 90 | | 32 | | (61 | ) | 119 | | 119 | | – | | – | |
| North America | HSBC Bank USA | 852 | | (182 | ) | (198 | ) | 1,232 | | (152 | ) | (23 | ) | 1,407 | |
| | HSBC Finance | 3,765 | | (802 | ) | (744 | ) | 5,311 | | 142 | | 122 | | 5,047 | |
| | HSBC Bank Canada | 604 | | 95 | | (131 | ) | 640 | | 180 | | – | | 460 | |
| Latin America | HSBC Mexico | 243 | | 148 | | (15 | ) | 110 | | 83 | | 4 | | 23 | |
| | Brazilian operations9 | 156 | | 36 | | 5 | | 115 | | 72 | | (27 | ) | 70 | |
| | HSBC Bank Panama | 33 | | (4 | ) | (8 | ) | 45 | | 43 | | – | | 2 | |
| | HSBC Bank Argentina | – | | – | | – | | – | | – | | – | | – | |
| Other operations | | 66 | | (14 | ) | 93 | | (13 | ) | 119 | | (240 | ) | 108 | |
| | |
| | | | | |
| | | | | |
| |
| | | 11,982 | | (723 | ) | (1,930 | ) | 13,189 | | 1,777 | | 1,068 | | 10,344 | |
| | |
| | | | | |
| | | | | |
| |
52
Back to Contents
Share capital and reserves
Authorised share capital
The authorised share capital of HSBC Holdings at 31 December 2008 was US$7,500,100,000 divided into 15,000 million ordinary shares of US$0.50 each and 10 million non-cumulative preference shares of US$0.01 each; £401,500 divided into 10 million non-cumulative preference shares of £0.01 each and 301,500 non-voting deferred shares of £1 each; and €100,000 divided into 10 million non-cumulative preference shares of €0.01 each.
The percentage of the total authorised share capital of HSBC Holdings at 31 December 2008 represented by the numbers of ordinary shares of US$0.50 each, non-cumulative preference shares of £0.01 each, non-cumulative preference shares of US$0.01 each, non-cumulative preference shares of €0.01 each and non-voting deferred shares of £1 each was approximately 99.9890, 0.0019, 0.0013, 0.0019 and 0.0059 per cent respectively.
Issued share capital
The issued share capital of HSBC Holdings at 31 December 2008 was US$6,052,647,041 divided into 12,105,265,082 ordinary shares of US$0.50 each and 1,450,000 non-cumulative preference shares of US$0.01 each; and £301,500 comprising 301,500 non-voting deferred shares of £1 each.
The percentage of the total issued share capital of HSBC Holdings at 31 December 2008 represented by the ordinary shares of US$0.50 each, non-cumulative preference shares of US$0.01 each and non-voting deferred shares of £1 each was approximately 99.9925, 0.0002, and 0.0073 per cent respectively.
Rights and obligations attaching to shares
The rights and obligations attaching to each class of share in the authorised share capital of HSBC Holdings are set out in the Articles of Association of HSBC Holdings. Set out below is a summary of the rights and obligations attaching to each class of shares with respect to voting, dividends, capital and, in the case of the preference shares, redemption.
To be registered, a transfer of shares must be in relation to a share which is fully paid up and on which the Company has no lien and to one class of shares denominated in the same currency. The transfer must be in favour of a single transferee or no more than four joint transferees and it must be duly stamped (if required). The transfer must be delivered to the registered office of the Company or to its
Registrars accompanied by the certificate to which it relates or such other evidence that proves the title of the transferor.
If a shareholder or any person appearing to be interested in the Company’s shares has been sent a notice under section 793 of the Companies Act 2006 (which confers upon public companies the power to require information from any person whom the Company knows or has reasonable cause to believe to be interested in the shares) and has failed in relation to any shares (the ‘default shares’) to supply the information requested within the period set out in the notice, then the member is not entitled to be present at or to vote the default shares at any general meeting or to exercise any other right conferred by being a shareholder. If the default shares represent at least 0.25 per cent in nominal value of the issued shares of that class any dividend shall be withheld by the Company, without interest and no election for the scrip dividend alternative may be made. No transfer of any shares held by the member will be registered, except in limited circumstances.
Ordinary shares
Subject to the Companies Act 2006 and the Articles of Association of HSBC Holdings, in a general meeting of HSBC Holdings, every holder of ordinary shares who is present in person or by proxy shall on a show of hands have one vote and every holder of ordinary shares present in person or by proxy shall on a poll have one vote for every share he or she holds. Where any shareholder is, under the rules governing the listing of securities on any stock exchange on which all or any shares of HSBC Holdings are for the time being listed or traded, required to abstain from voting on any particular resolution or restricted to voting only for or only against any particular resolution, any votes cast by or on behalf of such holder in contravention of such requirement or restriction will not be counted.
Subject to the Companies Act 2006 and the Articles of Association of HSBC Holdings, HSBC Holdings may, by ordinary resolution, declare dividends to be paid to the holders of ordinary shares, however, no dividend shall exceed the amount recommended by the Board. The Board may pay interim dividends as appears to the Board to be justified by the profits of HSBC Holdings available for distribution. All dividends shall be apportioned and paid proportionately to the percentage of the nominal amount paid up on the shares during any portion or portions of the period in respect of which the dividend is paid, but if any share is issued on terms providing that it shall rank for dividend as from a particular date, it shall rank for dividend
53
Back to Contents
| H S B C H O L D I N G S P L C |
| |
| Report of the Directors: Operating and Financial Review(continued) |
| | |
| | |
| Financial summary > Balance sheet > Share capital and reserves |
accordingly. Subject to the Articles of Association of HSBC Holdings, the Board may, with the prior authority of an ordinary resolution of HSBC Holdings and subject to such terms and conditions as the Board may determine, offer to any holders of ordinary shares the right to elect to receive ordinary shares of the same or a different currency, credited as fully paid, instead of cash in any currency in respect of the whole (or some part, to be determined by the Board) of any dividend specified by the ordinary resolution. At the 2007 Annual General Meeting shareholders gave authority to the Directors to offer a scrip dividend alternative until the conclusion of the Annual General Meeting in 2012.
Subject to the relevant insolvency laws and the Articles of Association of HSBC Holdings, if HSBC Holdings is wound up, the assets available for distribution among the holders of ordinary shares will be distributed among such holders in proportion to the number of ordinary shares held by them respectively, such distribution to be adjusted to take account of any amount remaining unpaid on a holder’s share. On a winding up, the liquidator may, with the sanction of a special resolution of HSBC Holdings and any other sanction required by law, divide among the shareholders in specie the whole or any part of the assets of HSBC Holdings and may, for that purpose, value any assets and determine how the division shall be carried out as between the shareholders or different classes of shareholders.
Preference shares
The non-cumulative preference shares of £0.01 each, the non-cumulative preference shares of US$0.01 each (the ‘Dollar Preference Shares’) and the non-cumulative preference shares of €0.01 each carry the same rights and obligations under the Articles of Association save in respect of the timing of and payment of proceeds from the redemption of each class of share, to the extent issued, and certain rights and obligations that attach to each class of preference share as determined by the Board prior to allotment of the relevant preference shares. The Dollar Preference Shares are the only class of the preference shares which have been issued and allotted to date.
Holders of the preference shares will only be entitled to attend and vote at general meetings of HSBC Holdings if any dividend payable on the relevant preference shares in respect of such period as the Board shall determine prior to allotment thereof (which, in the case of the Dollar Preference Shares in issue at 2 March 2009, is four consecutive dividend payment dates) is not paid in full or in such other circumstances, and upon and subject to such
terms, as the Board may determine prior to allotment of the relevant preference shares. Whenever holders of the relevant preference shares are entitled to vote on a resolution at a general meeting, on a show of hands every such holder who is present in person or by proxy shall have one vote and on a poll every such holder who is present in person or by proxy shall have one vote per preference share held by him or her or such number of votes per share as the Board shall determine prior to allotment of such share.
Subject to the Articles of Association, holders of the relevant preference shares shall have the right to a non-cumulative preferential dividend at such rate, on such dates and on such other terms and conditions as may be determined by the Board prior to allotment thereof in priority to the payment of any dividend to the holders of ordinary shares and any other class of shares of HSBC Holdings in issue (other than (i) the other preference shares in issue and any other shares expressed to rankpari passu therewith as regards income; and (ii) any shares which by their terms rank in priority to the relevant preference shares as regards income). Dividends on the Dollar Preference Shares in issue at 2 March 2009 are paid quarterly at the sole and absolute discretion of the Board of Directors. The Board of Directors will not declare a dividend on the Dollar Preference Shares if payment of the dividend would cause HSBC Holdings not to meet the applicable capital adequacy requirements of the FSA or the profit of HSBC Holdings available for distribution as dividends is not sufficient to enable HSBC Holdings to pay in full both dividends on the relevant preference shares and dividends on any other shares that are scheduled to be paid on the same date and that have an equal right to dividends. HSBC Holdings may not declare or pay dividends on any class of its shares ranking lower in the right to dividends than the preference shares nor redeem nor purchase in any manner any of its other shares ranking equal with or lower than the preference shares unless it has paid in full, or set aside an amount to provide for payment in full, the dividends on the preference shares for the then-current dividend period.
The preference shares carry no rights to participate in the profits or assets of HSBC Holdings other than as set out in the Articles of Association and subject to the Companies Act 1985, do not confer any right to participate in any offer or invitation by way of rights or otherwise to subscribe for additional shares in HSBC Holdings, do no not confer any right of conversion and do not confer any right to participate in any issue or bonus shares or
54
Back to Contents
shares issued by way of capitalisation of reserves.
Subject to the relevant insolvency laws and the Articles of Association of HSBC Holdings, holders of the relevant preference shares have the right in a winding up of HSBC Holdings to receive out of the assets of HSBC Holdings available for distribution to its shareholders, in priority to any payment to the holders of the ordinary shares and any other class of shares of HSBC Holdings in issue (other than (i) the other relevant preference shares and any other shares expressed to rankpari passu therewith as regards repayment of capital; and (ii) any shares which by their terms rank in priority to the relevant preference shares as regards repayment of capital), a sum equal to any unpaid dividend on the relevant preference shares which is payable as a dividend in accordance with or pursuant to the Articles of Association and the amount paid up or credited as paid up on the relevant preference shares together with such premium (if any) as may be determined by the Board prior to allotment thereof.
HSBC Holdings may redeem the relevant preference shares in accordance with the Articles of Association and the terms on which the relevant preference shares were issued and allotted. In the case of the Dollar Preference Shares in issue at 2 March 2009, HSBC Holdings may redeem such shares in whole at any time on or after 16 December 2010, subject to prior notification to the FSA.
Non-voting deferred shares
The non-voting deferred shares are held by a subsidiary undertaking of HSBC Holdings. Holders of the non-voting deferred shares are not entitled to receive dividends on these shares. In addition, on winding up or other return of capital, holders are entitled to receive the amount paid up on their shares after distribution to ordinary shareholders of £10 million in respect of each ordinary share held by them. The holders of the non-voting deferred shares are not entitled to receive notice of or to attend (either personally or by proxy) any general meeting of HSBC Holdings or to vote (either personally or by proxy) on any resolution to be proposed thereat.
The following events occurred during the year in relation to the share capital of HSBC Holdings:
| Scrip dividends |
| | |
| 1. | 36,524,050 ordinary shares were issued at par in January 2008 to shareholders who elected to receive new shares in lieu of the third interim dividend for 2007. The market value per share used to calculate shareholders’ entitlements to |
| | new shares was US$16.821, being the US dollar equivalent of £8.132. |
| | |
| 2. | 136,165,605 ordinary shares were issued at par in May 2008 to shareholders who elected to receive new shares in lieu of the fourth interim dividend for 2007. The market value per share used to calculate shareholders’ entitlements to new shares was US$16.4022, being the US dollar equivalent of £8.132. |
| |
| 3. | 15,191,514 ordinary shares were issued at par in July 2008 to shareholders who elected to receive new shares in lieu of the first interim dividend for 2008. The market value per share used to calculate shareholders’ entitlements to new shares was US$16.8421, being the US dollar equivalent of £8.519. |
| |
| 4. | 47,687,930 ordinary shares were issued at par in October 2008 to shareholders who elected to receive new shares in lieu of the second interim dividend for 2008. The market value per share used to calculate shareholders’ entitlements to new shares was US$15.2466, being the US dollar equivalent of £8.266. |
| | |
| All-Employee share plans |
| | |
| 5. | In connection with the exercise of options under the HSBC Holdings savings-related share option plans: 27,491,176 ordinary shares were issued at prices ranging from £5.3496 to £7.6736 per share; 1,782,367 ordinary shares were issued at prices ranging from HK$103.4401 to HK$108.4483 per share; 805,885 ordinary shares were issued at prices ranging from US$13.3290 to US$14.7478 per share; and 46,698 ordinary shares were issued at €10.4217 per share. Options over 18,163,336 ordinary shares lapsed. |
| |
| 6. | 2,667,632 ordinary shares were issued at €8.3124 per share in connection with a Plan d’Epargne Entreprise for the benefit of non-UK resident employees of HSBC France and its subsidiaries. |
| |
| 7. | Options over 32,951,305 ordinary shares were granted at nil consideration on 30 April 2008 to nearly 70,000 HSBC employees resident in nearly 70 countries and territories under the HSBC Holdings savings-related share option plans. |
| | |
| Discretionary share incentive plans |
| | |
| 8. | 4,050,585 ordinary shares were issued at prices ranging from £6.2767 to £7.460 per share in connection with the exercise of options under |
55
Back to Contents
| H S B C H O L D I N G S P L C |
| |
| Report of the Directors: Operating and Financial Review(continued) |
| | |
| | |
| Financial summary > Balance sheet > Share capital and reserves / Short-term borrowings > Contractual obligations / Ratios |
| the HSBC Holdings Executive Share Option Scheme. Options over 223,951 ordinary shares lapsed. |
| |
| 9. | 3,734,125 ordinary shares were issued at prices ranging from £6.9100 to £8.7120 per share in connection with the exercise of options under the HSBC Holdings Group Share Option Plan. Options over 5,889,067 ordinary shares lapsed. |
|
| |
| 10. | No options were exercised under and no ordinary shares were issued in connection with the HSBC Share Plan. Options over 224,728 ordinary shares lapsed. |
| | |
| | HSBC Finance |
| | |
| 11. | 65,198 ordinary shares were issued at prices ranging from US$14.59 to US$16.71 per share in connection with the vesting of Restricted Stock Rights under HSBC Finance share plans that have been converted into rights over HSBC Holdings ordinary shares. |
|
| |
| | Authority to purchase ordinary shares |
| | |
| 12. | At the Annual General Meeting in 2008, shareholders renewed the authority for the Company to make market purchases of ordinary shares. The authority is to make market purchases of up to 1,186,700,000 ordinary shares. The Directors have not exercised this authority. In accordance with the terms of a waiver granted by the Hong Kong Stock Exchange on 19 December 2005, HSBC Holdings will comply with the applicable law and regulation in the UK in relation to the holding of any shares in treasury and with the |
|
| | conditions of the waiver, in connection withany shares it may hold in treasury. |
| | |
| Authority to allot shares |
| | |
| 13. | At the Annual General Meeting in 2008 shareholders renewed the general authority for the Directors to allot new shares. The general authority is to allot up to 2,373,400,000 ordinary shares, 10,000,000 non-cumulative preference shares of £0.01 each, 8,550,000 non-cumulative preference shares of US$0.01 each and 10,000,000 non-cumulative preference shares of €0.01 each. Within this, the Directors have authority to allot up to a maximum of 593,350,000 ordinary shares wholly for cash to persons other than existing shareholders. |
| | |
Other than as described in paragraphs 1 to 6 and 8 to 10 above, the Directors did not allot any shares during 2008.
Short-term borrowings
HSBC includes short-term borrowings within customer accounts, deposits by banks and debt securities in issue and does not show short-term borrowings separately on the balance sheet. Short- term borrowings are defined by the US Securities and Exchange Commission (‘SEC’) as Federal funds purchased and securities sold under agreements to repurchase, commercial paper and other short-term borrowings. HSBC’s only significant short-term borrowings are securities sold under agreements to repurchase and certain debt securities in issue. Additional information on these is provided in the tables below.
| | | 2008 | | 2007 | | 2006 | |
| | | US$m | | US$m | | US$m | |
| Securities sold under agreements to repurchase | | | | | | | |
| Outstanding at 31 December | | 145,180 | | 140,001 | | 97,139 | |
| Average amount outstanding during the year | | 177,256 | | 129,779 | | 102,715 | |
| Maximum quarter-end balance outstanding during the year | | 190,651 | | 148,601 | | 109,689 | |
| |
| Weighted average interest rate during the year | | 3.8% | | 5.4% | | 4.3% | |
| Weighted average interest rate at the year-end | | 2.9% | | 4.8% | | 4.6% | |
| |
| Short-term bonds | | | | | | | |
| Outstanding at 31 December | | 40,279 | | 51,792 | | 37,906 | |
| Average amount outstanding during the year | | 45,330 | | 39,153 | | 37,729 | |
| Maximum quarter-end balance outstanding during the year | | 55,842 | | 51,792 | | 38,907 | |
| |
| Weighted average interest rate during the year | | 5.0% | | 7.0% | | 5.1% | |
| Weighted average interest rate at the year-end | | 3.1% | | 6.5% | | 4.8% | |
56
Back to Contents
Contractual obligations
The table below provides details of HSBC’s material contractual obligations as at 31 December 2008.
| | | | Payments due by period | | | |
| |
|
|
|
|
|
|
| |
| | | | Less than | | | | More than | |
| | Total | | 1 year | | 1–5 years | | 5 years | |
| | US$m | | US$m | | US$m | | US$m | |
| | | | | | | | | |
| Long-term debt obligations | 254,946 | | 92,191 | | 99,353 | | 63,402 | |
| Term deposits and certificates of deposit | 256,661 | | 245,672 | | 10,989 | | – | |
| Capital (finance) lease obligations | 979 | | 55 | | 188 | | 736 | |
| Operating lease obligations | 4,139 | | 766 | | 1,800 | | 1,573 | |
| Purchase obligations | 1,541 | | 948 | | 593 | | – | |
| Short positions in debt securities and equity shares | 66,774 | | 52,679 | | 4,477 | | 9,618 | |
| Current tax liability | 1,822 | | 1,822 | | – | | – | |
| Pension obligations | 15,137 | | 1,208 | | 5,393 | | 8,536 | |
| |
| |
| |
| |
| |
| | 601,999 | | 395,341 | | 122,793 | | 83,865 | |
| |
| |
| |
| |
| |
Ratios of earnings to combined fixed charges (and preference share dividends)
| | | 2008 | | 2007 | | 2006 | | 2005 | | 2004 | |
| | | % | | % | | % | | % | | % | |
| Ratios of earnings to combined fixed charges and preferenceshare dividends | | | | | | | | | | | |
| Ratios in accordance with IFRSs | | | | | | | | | | | |
| – excluding interest on deposits | | 2.97 | | 6.96 | | 7.22 | | 9.16 | | 8.64 | |
| – including interest on deposits | | 1.13 | | 1.34 | | 1.40 | | 1.59 | | 1.86 | |
| |
| Ratios in accordance with UK GAAP | | | | | | | | | | | |
| – excluding interest on deposits | | – | | – | | – | | – | | 8.07 | |
| – including interest on deposits | | – | | – | | – | | – | | 1.81 | |
| |
| Ratios of earnings to combined fixed charges | | | | | | | | | | | |
| Ratios in accordance with IFRSs | | | | | | | | | | | |
| – excluding interest on deposits | | 3.17 | | 7.52 | | 7.93 | | 9.60 | | 8.64 | |
| – including interest on deposits | | 1.14 | | 1.34 | | 1.41 | | 1.59 | | 1.86 | |
| |
| Ratios in accordance with UK GAAP | | | | | | | | | | | |
| – excluding interest on deposits | | – | | – | | – | | – | | 8.07 | |
| – including interest on deposits | | – | | – | | – | | – | | 1.81 | |
For the purpose of calculating the ratios, earnings consist of income from continuing operations before taxation and minority interests, plus fixed charges, and after deduction of the unremitted pre-tax income of associated undertakings. Fixed charges consist of total interest expense, including or excluding interest on deposits, as appropriate, dividends on preference shares and other equity instruments, as applicable, and the proportion of rental expense deemed representative of the interest factor.
57
Back to Contents
| H S B C H O L D I N G S P L C |
| |
| Report of the Directors: Operating and Financial Review(continued) |
| | |
| | |
| Financial summary > Balance sheet > Loan maturities / Deposits |
Loan maturity and interest sensitivity analysis
At 31 December 2008, the geographical analysis of loan maturity and interest sensitivity by loan type on a contractual repayment basis was as follows:
| | | | | | | Rest | | | | | | | |
| | | | | Hong | | of Asia- | | North | | Latin | | | |
| | | Europe | | Kong | | Pacific | | America | | America | | Total | |
| | | US$m | | US$m | | US$m | | US$m | | US$m | | US$m | |
| Maturity of 1 year or less | | | | | | | | | | | | | |
| Loans and advances to banks | | 58,520 | | 29,258 | | 35,668 | | 10,966 | | 11,919 | | 146,331 | |
| | |
| |
| |
| |
| |
| |
| |
| Commercial loans to customers | | | | | | | | | | | | | |
| Commercial, industrial and international trade | | 83,772 | | 14,666 | | 31,433 | | 5,611 | | 8,827 | | 144,309 | |
| Real estate and other property related | | 18,430 | | 6,253 | | 6,071 | | 9,527 | | 1,497 | | 41,778 | |
| Non-bank financial institutions | | 57,853 | | 1,070 | | 4,188 | | 21,490 | | 1,116 | | 85,717 | |
| Governments | | 1,121 | | 117 | | 1,260 | | 243 | | 309 | | 3,050 | |
| Other commercial | | 35,652 | | 1,919 | | 5,648 | | 8,737 | | 1,955 | | 53,911 | |
| | |
| |
| |
| |
| |
| |
| |
| | | 196,828 | | 24,025 | | 48,600 | | 45,608 | | 13,704 | | 328,765 | |
| Hong Kong Government Home Ownership Scheme | | – | | 442 | | – | | – | | – | | 442 | |
| Residential mortgages and other personal loans | | 30,336 | | 13,476 | | 13,972 | | 36,119 | | 8,382 | | 102,285 | |
| | |
| |
| |
| |
| |
| |
| |
| Loans and advances to customers | | 227,164 | | 37,943 | | 62,572 | | 81,727 | | 22,086 | | 431,492 | |
| | |
| |
| |
| |
| |
| |
| |
| | | 285,684 | | 67,201 | | 98,240 | | 92,693 | | 34,005 | | 577,823 | |
| | |
| |
| |
| |
| |
| |
| |
| |
| Maturity after 1 year but within 5 years | | | | | | | | | | | | | |
| Loans and advances to banks | | 3,152 | | 388 | | 398 | | 442 | | 190 | | 4,570 | |
| | |
| |
| |
| |
| |
| |
| |
| Commercial loans to customers | | | | | | | | | | | | | |
| Commercial, industrial and international trade | | 23,889 | | 4,943 | | 7,360 | | 8,087 | | 3,640 | | 47,919 | |
| Real estate and other property related | | 13,760 | | 13,716 | | 6,182 | | 8,002 | | 790 | | 42,450 | |
| Non-bank financial institutions | | 3,419 | | 594 | | 1,111 | | 3,112 | | 1,185 | | 9,421 | |
| Governments | | 323 | | 784 | | 355 | | 78 | | 769 | | 2,309 | |
| Other commercial | | 11,839 | | 3,365 | | 4,130 | | 3,214 | | 2,072 | | 24,620 | |
| | |
| |
| |
| |
| |
| |
| |
| | | 53,230 | | 23,402 | | 19,138 | | 22,493 | | 8,456 | | 126,719 | |
| Hong Kong Government Home Ownership Scheme | | – | | 1,404 | | – | | – | | – | | 1,404 | |
| Residential mortgages and other personal loans | | 31,595 | | 8,991 | | 9,948 | | 52,234 | | 5,755 | | 108,523 | |
| | |
| |
| |
| |
| |
| |
| |
| Loans and advances to customers | | 84,825 | | 33,797 | | 29,086 | | 74,727 | | 14,211 | | 236,646 | |
| | |
| |
| |
| |
| |
| |
| |
| | | 87,977 | | 34,185 | | 29,484 | | 75,169 | | 14,401 | | 241,216 | |
| | |
| |
| |
| |
| |
| |
| |
| | | | | | | | | | | | | | |
Interest rate sensitivity of loans and advances to banks and commercial loans to customers Fixed interest rate | | 11,333 | | 185 | | 2,734 | | 5,066 | | 2,460 | | 21,778 | |
| Variable interest rate | | 45,049 | | 23,605 | | 16,802 | | 17,869 | | 6,186 | | 109,511 | |
| | |
| |
| |
| |
| |
| |
| |
| | | 56,382 | | 23,790 | | 19,536 | | 22,935 | | 8,646 | | 131,289 | |
| | |
| |
| |
| |
| |
| |
| |
| |
| Maturity after 5 years | | | | | | | | | | | | | |
| Loans and advances to banks | | 340 | | – | | 75 | | 50 | | 2,463 | | 2,928 | |
| | |
| |
| |
| |
| |
| |
| |
| Commercial loans to customers | | | | | | | | | | | | | |
| Commercial, industrial and international trade | | 13,386 | | 577 | | 1,354 | | 1,480 | | 815 | | 17,612 | |
| Real estate and other property related | | 8,180 | | 4,560 | | 1,019 | | 3,209 | | 512 | | 17,480 | |
| Non-bank financial institutions | | 551 | | 738 | | 88 | | 2,958 | | 63 | | 4,398 | |
| Governments | | 420 | | 50 | | 145 | | 31 | | 539 | | 1,185 | |
| Other commercial | | 15,923 | | 1,514 | | 1,428 | | 991 | | 535 | | 20,391 | |
| | |
| |
| |
| |
| |
| |
| |
| | | 38,460 | | 7,439 | | 4,034 | | 8,669 | | 2,464 | | 61,066 | |
| | | | | | | | | | | | | | |
| Hong Kong Government Home Ownership Scheme | | – | | 2,036 | | – | | – | | – | | 2,036 | |
| Residential mortgages and other personal loans | | 79,601 | | 19,738 | | 13,491 | | 107,181 | | 5,526 | | 225,537 | |
| | |
| |
| |
| |
| |
| |
| |
| Loans and advances to customers | | 118,061 | | 29,213 | | 17,525 | | 115,850 | | 7,990 | | 288,639 | |
| | |
| |
| |
| |
| |
| |
| |
| | | 118,401 | | 29,213 | | 17,600 | | 115,900 | | 10,453 | | 291,567 | |
| | |
| |
| |
| |
| |
| |
| |
| Interest rate sensitivity of loans and advances to banks and commercial loans to customers | | | | | | | | | | | | | |
| Fixed interest rate | | 7,607 | | – | | 942 | | 1,128 | | 619 | | 10,296 | |
| Variable interest rate | | 31,193 | | 7,439 | | 3,167 | | 7,591 | | 4,308 | | 53,698 | |
| | |
| |
| |
| |
| |
| |
| |
| | | 38,800 | | 7,439 | | 4,109 | | 8,719 | | 4,927 | | 63,994 | |
| | |
| |
| |
| |
| |
| |
| |
58
Back to Contents
Deposits
The following tables summarise the average amount of bank deposits, customer deposits and certificates of deposit (‘CDs’) and other money market instruments (which are included within ‘Debt securities in issue’ in the balance sheet), together
with the average interest rates paid thereon for each of the past three years. The geographical analysis of average deposits is based on the location of the office in which the deposits are recorded and excludes balances with HSBC companies. The ‘Other’ category includes securities sold under agreements to repurchase.
| | | 2008 | | 2007 | | 2006 | |
| | |
|
|
| |
|
|
| |
|
|
| |
| | | Average | | Average | | Average | | Average | | Average | | Average | |
| | | balance | | rate | | balance | | rate | | balance | | rate | |
| | | US$m | | % | | US$m | | % | | US$m | | % | |
| Deposits by banks | | | | | | | | | | | | | |
| |
| Europe | | | | | | | | | | | | | |
| Demand and other – non-interest bearing | | 5,231 | | – | | 6,359 | | – | | 9,814 | | – | |
| Demand – interest bearing | | 19,204 | | 3.2 | | 11,036 | | 3.8 | | 8,368 | | 3.7 | |
| Time | | 43,695 | | 3.9 | | 38,470 | | 4.7 | | 27,447 | | 4.0 | |
| Other | | 31,098 | | 4.4 | | 28,770 | | 4.8 | | 23,396 | | 3.5 | |
| | |
| | | |
| | | |
| | | |
| | | 99,228 | | | | 84,635 | | | | 69,025 | | | |
| | |
| | | |
| | | |
| | | |
| Hong Kong | | | | | | | | | | | | | |
| Demand and other – non-interest bearing | | 1,375 | | – | | 1,331 | | – | | 1,031 | | – | |
| Demand – interest bearing | | 2,780 | | 2.0 | | 2,420 | | 4.3 | | 2,428 | | 4.6 | |
| Time | | 1,583 | | 2.7 | | 3,267 | | 4.5 | | 2,016 | | 4.3 | |
| Other | | 178 | | 3.4 | | 251 | | 0.4 | | 362 | | 3.3 | |
| | |
| | | |
| | | |
| | | |
| | | 5,916 | | | | 7,269 | | | | 5,837 | | | |
| | |
| | | |
| | | |
| | | |
| Rest of Asia-Pacific | | | | | | | | | | | | | |
| Demand and other – non-interest bearing | | 1,911 | | – | | 1,897 | | – | | 1,618 | | – | |
| Demand – interest bearing | | 4,332 | | 2.3 | | 3,167 | | 2.4 | | 1,960 | | 2.4 | |
| Time | | 10,342 | | 3.5 | | 6,433 | | 5.1 | | 3,645 | | 4.8 | |
| Other | | 3,769 | | 3.3 | | 2,768 | | 4.8 | | 2,157 | | 4.5 | |
| | |
| | | |
| | | |
| | | |
| | | 20,354 | | | | 14,265 | | | | 9,380 | | | |
| | |
| | | |
| | | |
| | | |
| North America | | | | | | | | | | | | | |
| Demand and other – non-interest bearing | | 761 | | – | | 827 | | – | | 767 | | – | |
| Demand – interest bearing | | 5,684 | | 1.7 | | 3,759 | | 4.8 | | 3,033 | | 5.3 | |
| Time | | 7,941 | | 2.3 | | 6,746 | | 6.0 | | 3,543 | | 5.4 | |
| Other | | 449 | | 1.6 | | 169 | | 7.1 | | 699 | | 5.6 | |
| | |
| | | |
| | | |
| | | |
| | | 14,835 | | | | 11,501 | | | | 8,042 | | | |
| | |
| | | |
| | | |
| | | |
| Latin America | | | | | | | | | | | | | |
| Demand and other – non-interest bearing | | 366 | | – | | 808 | | – | | 702 | | – | |
| Demand – interest bearing | | 81 | | 2.5 | | 153 | | 5.9 | | 96 | | 6.3 | |
| Time | | 3,357 | | 5.6 | | 2,690 | | 6.5 | | 1,732 | | 5.5 | |
| Other | | 1,254 | | 7.8 | | 1,010 | | 8.0 | | 683 | | 9.4 | |
| | |
| | | |
| | | |
| | | |
| | | 5,058 | | | | 4,661 | | | | 3,213 | | | |
| | |
| | | |
| | | |
| | | |
| Total | | | | | | | | | | | | | |
| Demand and other – non-interest bearing | | 9,644 | | – | | 11,222 | | – | | 13,932 | | – | |
| Demand – interest bearing | | 32,081 | | 2.7 | | 20,535 | | 3.8 | | 15,885 | | 4.5 | |
| Time | | 66,918 | | 3.7 | | 57,606 | | 4.9 | | 38,383 | | 4.5 | |
| Other | | 36,748 | | 4.5 | | 32,968 | | 5.0 | | 27,297 | | 3.9 | |
| | |
| | | |
| | | |
| | | |
| | | 145,391 | | | | 122,331 | | | | 95,497 | | | |
| | |
| | | |
| | | |
| | | |
59
Back to Contents
| H S B C H O L D I N G S P L C |
| |
| Report of the Directors: Operating and Financial Review(continued) |
| | |
| | |
| Financial summary > Balance sheet > Deposits / CDs // Critical accounting policies |
| | 2008 | | 2007 | | 2006 | |
| |
|
|
| |
|
|
| |
|
|
| |
| | Average | | Average | | Average | | Average | | Average | | Average | |
| | balance | | rate | | balance | | rate | | balance | | rate | |
| | US$m | | % | | US$m | | % | | US$m | | % | |
| Customer accounts | | | | | | | | | | | | |
| Europe | | | | | | | | | | | | |
| | | | | | | | | | | | | |
| Demand and other – non-interest bearing | 39,610 | | – | | 34,585 | | – | | 33,000 | | – | |
| Demand – interest bearing | 225,034 | | 2.9 | | 210,692 | | 3.5 | | 173,150 | | 2.7 | |
| Savings | 73,479 | | 4.3 | | 62,002 | | 4.6 | | 50,525 | | 3.9 | |
| Time | 83,208 | | 3.8 | | 69,476 | | 4.9 | | 59,374 | | 4.2 | |
| Other | 26,651 | | 3.9 | | 14,741 | | 4.5 | | 9,249 | | 4.1 | |
| |
| | | |
| | | |
| | | |
| | 447,982 | | | | 391,496 | | | | 325,298 | | | |
| |
| | | |
| | | |
| | | |
| Hong Kong | | | | | | | | | | | | |
| Demand and other – non-interest bearing | 15,620 | | – | | 14,214 | | – | | 13,011 | | – | |
| Demand – interest bearing | 126,199 | | 0.4 | | 107,053 | | 2.2 | | 88,754 | | 2.4 | |
| Savings | 65,068 | | 2.4 | | 63,649 | | 3.9 | | 58,883 | | 3.8 | |
| Time | 27,659 | | 2.3 | | 26,712 | | 3.9 | | 20,454 | | 3.6 | |
| Other | 1,563 | | 1.2 | | 1,164 | | 4.3 | | 51 | | 3.9 | |
| |
| | | |
| | | |
| | | |
| | 236,109 | | | | 212,792 | | | | 181,153 | | | |
| |
| | | |
| | | |
| | | |
| Rest of Asia-Pacific | | | | | | | | | | | | |
| Demand and other – non-interest bearing | 22,721 | | – | | 16,438 | | – | | 13,107 | | – | |
| Demand – interest bearing | 55,653 | | 1.9 | | 41,089 | | 2.4 | | 29,816 | | 2.1 | |
| Savings | 68,968 | | 3.6 | | 57,950 | | 4.2 | | 42,153 | | 4.3 | |
| Time | 15,226 | | 3.3 | | 11,538 | | 4.6 | | 10,246 | | 4.5 | |
| Other | 1,359 | | 2.8 | | 1,835 | | 4.5 | | 2,233 | | 3.5 | |
| |
| | | |
| | | |
| | | |
| | 163,927 | | | | 128,850 | | | | 97,555 | | | |
| |
| | | |
| | | |
| | | |
| North America | | | | | | | | | | | | |
| Demand and other – non-interest bearing | 16,759 | | – | | 15,175 | | – | | 13,662 | | – | |
| Demand – interest bearing | 18,261 | | 1.6 | | 15,389 | | 3.3 | | 14,406 | | 2.9 | |
| Savings | 87,001 | | 2.5 | | 79,529 | | 3.3 | | 65,216 | | 2.8 | |
| Time | 17,838 | | 3.2 | | 17,655 | | 5.9 | | 21,124 | | 5.4 | |
| Other | 5,123 | | 2.4 | | 3,234 | | 3.7 | | 3,339 | | 2.0 | |
| |
| | | |
| | | |
| | | |
| | 144,982 | | | | 130,982 | | | | 117,747 | | | |
| |
| | | |
| | | |
| | | |
| Latin America | | | | | | | | | | | | |
| Demand and other – non-interest bearing | 12,507 | | – | | 10,530 | | – | | 7,995 | | – | |
| Demand – interest bearing | 4,994 | | 1.9 | | 5,662 | | 2.1 | | 5,438 | | 1.6 | |
| Savings | 31,442 | | 10.3 | | 24,861 | | 8.8 | | 16,512 | | 11.3 | |
| Time | 15,179 | | 5.2 | | 12,443 | | 5.9 | | 7,665 | | 5.9 | |
| Other | 949 | | 8.2 | | 1,212 | | 9.5 | | 2,145 | | 13.4 | |
| |
| | | |
| | | |
| | | |
| | 65,071 | | | | 54,708 | | | | 39,755 | | | |
| |
| | | |
| | | |
| | | |
| Total | | | | | | | | | | | | |
| Demand and other – non-interestbearing | 107,217 | | – | | 90,942 | | – | | 80,775 | | – | |
| Demand – interest bearing | 430,141 | | 1.9 | | 379,885 | | 3.0 | | 311,564 | | 2.6 | |
| Savings | 325,958 | | 3.9 | | 287,991 | | 4.4 | | 233,289 | | 4.1 | |
| Time | 159,110 | | 3.6 | | 137,824 | | 4.9 | | 118,863 | | 4.5 | |
| Other | 35,645 | | 3.6 | | 22,186 | | 4.7 | | 17,017 | | 4.8 | |
| |
| | | |
| | | |
| | | |
| | 1,058,071 | | | | 918,828 | | | | 761,508 | | | |
| |
| | | |
| | | |
| | | |
| CDs and other money market instruments | | | | | | | | | | | | |
| Europe | 74,007 | | 4.5 | | 66,164 | | 5.0 | | 48,238 | | 4.2 | |
| Hong Kong | 745 | | 3.0 | | 941 | | 3.9 | | 1,191 | | 3.5 | |
| Rest of Asia-Pacific | 7,614 | | 6.4 | | 7,230 | | 6.0 | | 6,621 | | 5.6 | |
| North America | 22,278 | | 3.3 | | 23,735 | | 5.4 | | 23,472 | | 4.6 | |
| Latin America | 3,036 | | 7.8 | | 1,526 | | 6.8 | | 318 | | 10.7 | |
| |
| | | |
| | | |
| | | |
| | 107,680 | | 4.5 | | 99,596 | | 5.2 | | 79,840 | | 4.5 | |
| |
| | | |
| | | |
| | | |
60
Back to Contents
Certificates of deposit and other time deposits
At 31 December 2008, the maturity analysis of CDs and other wholesale time deposits, by remaining maturity, was as follows:
| | | | After | | After | | | | | |
| | | | 3 months | | 6 months | | | | | |
| | 3 months | | but within | | but within | | After | | | |
| | or less | | 6 months | | 12 months | | 12 months | | Total | |
| | US$m | | US$m | | US$m | | US$m | | US$m | |
| Europe | | | | | | | | | | |
| Certificates of deposit | 23,911 | | 483 | | 192 | | – | | 24,586 | |
| Time deposits: | | | | | | | | | | |
| – banks | 34,951 | | 1,943 | | 2,418 | | 4,649 | | 43,961 | |
| – customers | 78,562 | | 5,140 | | 4,135 | | 1,598 | | 89,435 | |
| |
| |
| |
| |
| |
| |
| | 137,424 | | 7,566 | | 6,745 | | 6,247 | | 157,982 | |
| |
| |
| |
| |
| |
| |
| Hong Kong | | | | | | | | | | |
| Certificates of deposit | 145 | | 137 | | 280 | | 904 | | 1,466 | |
| Time deposits: | | | | | | | | | | |
| – banks | 1,031 | | 5 | | – | | 67 | | 1,103 | |
| – customers | 21,898 | | 1,057 | | 274 | | 419 | | 23,648 | |
| |
| |
| |
| |
| |
| |
| | 23,074 | | 1,199 | | 554 | | 1,390 | | 26,217 | |
| |
| |
| |
| |
| |
| |
| Rest of Asia-Pacific | | | | | | | | | | |
| Certificates of deposit | 2,324 | | 1,383 | | 928 | | 248 | | 4,883 | |
| Time deposits: | | | | | | | | | | |
| – banks | 3,912 | | 887 | | 310 | | 164 | | 5,273 | |
| – customers | 13,106 | | 1,651 | | 670 | | 1,490 | | 16,917 | |
| |
| |
| |
| |
| |
| |
| | 19,342 | | 3,921 | | 1,908 | | 1,902 | | 27,073 | |
| |
| |
| |
| |
| |
| |
| North America | | | | | | | | | | |
| Time deposits: | | | | | | | | | | |
| – banks | 10,209 | | 2 | | 5 | | 201 | | 10,417 | |
| – customers | 13,882 | | 720 | | 248 | | 310 | | 15,160 | |
| |
| |
| |
| |
| |
| |
| | 24,091 | | 722 | | 253 | | 511 | | 25,577 | |
| |
| |
| |
| |
| |
| |
| Latin America | | | | | | | | | | |
| Certificates of deposit | 1,161 | | 640 | | 60 | | 316 | | 2,177 | |
| Time deposits: | | | | | | | | | | |
| – banks | 2,360 | | 1,446 | | 389 | | 264 | | 4,459 | |
| – customers | 10,357 | | 1,389 | | 1,071 | | 359 | | 13,176 | |
| |
| |
| |
| |
| |
| |
| | 13,878 | | 3,475 | | 1,520 | | 939 | | 19,812 | |
| |
| |
| |
| |
| |
| |
| Total | | | | | | | | | | |
| Certificates of deposit | 27,541 | | 2,643 | | 1,460 | | 1,468 | | 33,112 | |
| Time deposits: | | | | | | | | | | |
| – banks | 52,463 | | 4,283 | | 3,122 | | 5,345 | | 65,213 | |
| – customers | 137,805 | | 9,957 | | 6,398 | | 4,176 | | 158,336 | |
| |
| |
| |
| |
| |
| |
| | 217,809 | | 16,883 | | 10,980 | | 10,989 | | 256,661 | |
| |
| |
| |
| |
| |
| |
The geographical analysis of deposits is based on the location of the office in which the deposits are recorded and excludes balances with HSBC companies. The majority of certificates of deposit and time deposits are in amounts of US$100,000 and over or the equivalent in other currencies.
| Critical accounting policies |
|
| (Audited) |
Introduction
The results of HSBC are sensitive to the accounting policies, assumptions and estimates that underlie the preparation of its consolidated financial statements. The significant accounting policies used in the preparation of the consolidated financial statements are described in Note 2 on the Financial Statements.
When preparing the financial statements, it is the Directors’ responsibility under UK company law to select suitable accounting policies and to make judgements and estimates that are reasonable and prudent.
The accounting policies that are deemed critical to HSBC’s results and financial position, in terms of the materiality of the items to which the policy is applied, and which involve a high degree of judgement including the use of assumptions and estimation, are discussed below.
61
Back to Contents
| H S B C H O L D I N G S P L C |
| |
| Report of the Directors: Operating and Financial Review(continued) |
| | |
| | |
| Critical accounting policies |
Impairment of loans and advances
HSBC’s accounting policy for losses arising from the impairment of customer loans and advances is described in Note 2g on the Financial Statements. Loan impairment allowances represent management’s best estimate of losses incurred in the loan portfolios at the balance sheet date.
Management is required to exercise judgement in making assumptions and estimations when calculating loan impairment allowances on both individually and collectively assessed loans and advances. Of the Group’s total loans and advances to customers before impairment allowances of US$957 billion (2007: US$1,001 billion), US$6.9 billion or 1 per cent (2007: US$6.5 billion; 1 per cent) were individually assessed for impairment, and US$950 billion or 99 per cent (2007: US$994 billion; 99 per cent) were collectively assessed for impairment.
The most significant judgemental area is the calculation of collective impairment allowances. HSBC’s most significant geographical area of exposure to collectively assessed loans and advances is North America, which comprised US$271 billion or 29 per cent (2007: US$301 billion; 30 per cent) of HSBC’s total collectively assessed loans and advances. Collective impairment allowances in North America were US$15.9 billion, representing 77 per cent (2007: US$11.9 billion; 72 per cent) of the total collectively assessed loan impairment allowance.
HSBC uses two alternative methods to calculate collective impairment allowances on homogeneous groups of loans that are not considered individually significant:
| | • | when appropriate empirical information is available, HSBC utilises roll-rate methodology.
This methodology employs statistical analysis of historical data and experience of delinquency and default to estimate the likelihood that loans will progress through the various stages of delinquency and ultimately prove irrecoverable. The estimated loss is the difference between the present value of expected future cash flows, discounted at the original effective interest rate of the portfolio, and the carrying amount of the portfolio; and |
| | | |
| | • | in other cases, when the portfolio size is smallor when information is insufficient or notreliable enough to adopt a roll-ratemethodology, HSBC adopts a formulaicapproach which allocates progressively higherpercentage loss rates the longer a customer’s |
| | | loan is overdue. Loss rates are based on historical experience. |
Both methodologies are subject to estimation uncertainty, in part because it is not practicable to identify losses on an individual loan basis because of the large number of individually insignificant loans in the portfolio.
In addition, the use of statistically assessed historical information is supplemented with significant management judgement to assess whether current economic and credit conditions are such that the actual level of inherent losses is likely to be greater or less than that suggested by historical experience. In normal circumstances, historical experience provides the most objective and relevant information from which to assess inherent loss within each portfolio. In certain circumstances, historical loss experience provides less relevant information about the inherent loss in a given portfolio at the balance sheet date, for example, where there have been changes in economic, regulatory or behavioural conditions such that the most recent trends in the portfolio risk factors are not fully reflected in the statistical models. In these circumstances, such risk factors are taken into account when calculating the appropriate levels of impairment allowances, by adjusting the impairment allowances derived solely from historical loss experience.
This key area of judgement is subject to uncertainty and is highly sensitive to factors such as loan portfolio growth, product mix, unemployment rates, bankruptcy trends, geographic concentrations, loan product features, economic conditions such as national and local trends in housing markets, the level of interest rates, portfolio seasoning, account management policies and practices, changes in laws and regulations, and other factors that can affect customer payment patterns. Different factors are applied in different regions and countries to reflect different economic conditions and laws and regulations. The assumptions underlying this judgement are highly subjective. The methodology and the assumptions used in calculating impairment losses are reviewed regularly in the light of differences between loss estimates and actual loss experience. For example, roll rates, loss rates and the expected timing of future recoveries are regularly benchmarked against actual outcomes to ensure they remain appropriate.
The total amount of the Group’s impairment allowances on homogeneous groups of loans is inherently uncertain because it is highly sensitive to changes in economic and credit conditions across a
62
Back to Contents
large number of geographical areas. Economic and credit conditions within geographical areas are influenced by many factors with a high degree of interdependency so that there is no single factor to which the Group’s loan impairment allowances as a whole are sensitive. However, HSBC’s loan impairment allowances are particularly sensitive to general economic and credit conditions in North America. For example, a 10 per cent increase in impairment allowances on collectively assessed loans and advances in North America would increase loan impairment allowances by US$1.6 billion at 31 December 2008 (2007: US$1.2 billion). It is possible that the outcomes within the next financial year could be different from the assumptions built into the models, resulting in a material adjustment to the carrying amount of loans and advances.
Goodwill impairmentHSBC’s accounting policy for goodwill is described in Note 2(p) on the Financial Statements. Note 22 on the Financial Statements lists the Group’s cash generating units (‘CGUs’) by geographical region and global business. Total goodwill for the Group amounted to US$22 billion as at 31 December 2008 (2007: US$34 billion).
The process of identifying and evaluating goodwill impairment is inherently uncertain because it requires significant management judgement in making a series of estimations, the results of which are highly sensitive to the assumptions used. The review of goodwill impairment represents management’s best estimate of the factors below:
| | • | the future cash flows of the CGUs are sensitiveto the cash flows projected for the periods forwhich detailed forecasts are available, and toassumptions regarding the long-term pattern ofsustainable cash flows thereafter. Forecasts arecompared with actual performance andverifiable economic data in future years;however, the cash flow forecasts necessarily andappropriately reflect management’s view offuture business prospects at the time of theassessment; and |
| | | |
| | • | the discount rate used to discount the futureexpected cash flows is based on the cost ofcapital assigned to an individual CGU, and canhave a significant effect on the CGU’svaluation. The cost of capital percentage isgenerally derived from a Capital Asset PricingModel, which incorporates inputs reflecting anumber of financial and economic variables,including the risk-free interest rate in thecountry concerned and a premium to reflect the |
| | | inherent risk of the business being evaluated. These variables are subject to fluctuations in external market rates and economic conditions outside of management’s control and are therefore established on the basis of significant management judgement and are subject to uncertainty. |
When this exercise demonstrates that the expected cash flows of a CGU have declined and/or that its cost of capital has increased, the effect is to reduce the CGU’s estimated recoverable amount. If this results in an estimated recoverable amount that is lower than the carrying value of the CGU, a charge for impairment of goodwill will be recognised in HSBC’s income statement for the year.
The accuracy of forecast cash flows is subject to a high degree of uncertainty in volatile market conditions. In such market conditions, management retests goodwill for impairment more frequently than annually to ensure that the assumptions on which the cash flow forecasts are based continue to reflect current market conditions and management’s best estimate of future business prospects.
Given the extraordinary market events experienced globally during the second half of 2008, HSBC performed an additional impairment test on all the CGUs within the Group as at 31 December 2008. As a result, HSBC recognised an impairment charge of US$10.6 billion on Personal Financial Services – North America as at 31 December 2008 (2007: nil). Management concluded that the recoverable amount of the other CGUs to which goodwill has been allocated exceeded their carrying value. However, in the event of further significant deterioration in the economic and credit conditions beyond the levels already reflected by management in the cash flow forecasts for the CGUs, a material adjustment to a CGU’s recoverable amount may occur which may result in the recognition of an impairment charge in the income statement.
Note 22 on the Financial Statements includes details of the CGUs with significant balances of goodwill, states the key assumptions used to assess the goodwill in each of those CGUs for impairment, and provides a discussion of the sensitivity of the carrying value of goodwill to changes in key assumptions.
Valuation of financial instruments
HSBC’s accounting policy for determining the fair value of financial instruments is described in Note 2d on the Financial Statements.
63
Back to Contents
| H S B C H O L D I N G S P L C |
| |
| Report of the Directors: Operating and Financial Review(continued) |
| | |
| | |
| Critical accounting policies |
The best evidence of fair value is a quoted price in an actively traded market. In the event that the market for a financial instrument is not active, a valuation technique is used. The majority of valuation techniques employ only observable market data, and so the reliability of the fair value measurement is high. However, certain financial instruments are valued on the basis of valuation techniques that feature one or more significant market inputs that are unobservable. Valuation techniques that rely to a greater extent on unobservable inputs require a higher level of management judgement to calculate a fair value than those based wholly on observable inputs.
Valuation techniques used to calculate fair values include comparisons with similar financial instruments for which market observable prices exist, discounted cash flow analysis, option pricing models and other valuation techniques commonly used by market participants. Valuation techniques incorporate assumptions that other market participants would use in their valuations, including assumptions about interest rate yield curves, exchange rates, volatilities, and prepayment and default rates. When valuing instruments by reference to comparable instruments, management takes into account the maturity, structure and rating of the instrument with which the position held is being compared.
The main assumptions and estimates which management considers when applying a model with valuation techniques are:
| | • | the likelihood and expected timing of futurecash flows on the instrument. These cash flowsare usually governed by the terms of theinstrument, although management judgementmay be required when the ability of thecounterparty to service the instrument inaccordance with the contractual terms is indoubt. Future cash flows may be sensitive tochanges in market rates; |
| | | |
| | • | selecting an appropriate discount rate forthe instrument. Management bases thedetermination of this rate on its assessment ofwhat a market participant would regard as theappropriate spread of the rate for the instrumentover the appropriate risk-free rate; and |
| | | |
| | • | judgement to determine what model to use tocalculate fair value in areas where the choice ofvaluation model is particularly subjective, forexample, when valuing complex derivativeproducts. |
When applying a model with unobservable inputs, estimates are made to reflect uncertainties in fair values resulting from a lack of market data inputs, for example, as a result of illiquidity in the market. For these instruments, the fair value measurement is less reliable. Inputs into valuations based on unobservable data are inherently uncertain because there are little or no current market data available from which to determine the level at which an arm’s length transaction would occur under normal business conditions. However, in most cases there are some market data available on which to base a determination of fair value, for example historical data, and the fair values of most financial instruments will be based on some market observable inputs even where the unobservable inputs are significant.
An analysis of the basis for valuation of financial instruments measured at fair value in the financial statements is provided on page 162. The value of financial assets and liabilities that use a valuation technique are US$876 billion (2007: US$626 billion) and US$671 billion (2007: US$401 billion) or 71 per cent (2007: 66 per cent) and 83 per cent (2007: 68 per cent) of total assets and total liabilities measured at fair value, respectively. A sensitivity analysis of fair values for financial instruments with significant unobservable inputs to reasonably possible alternative assumptions and a range of assumptions and inputs used in valuation models in respect of instruments of particular interest in the current market turmoil can be found on page 164. Given the uncertainty and subjective nature of valuing financial instruments at fair value, it is possible that the outcomes in the next financial year could differ from the assumptions used, and this could result in a material adjustment to the carrying amount of financial instruments measured at fair value.
Impairment of available-for-sale financial assets
HSBC’s accounting policy for impairment of available-for-sale financial assets is described in Note 2(j) on the Financial Statements.
Available-for-sale financial assets are measured at fair value, and changes in fair value are recognised in equity in the available-for-sale fair value reserve until the financial assets are either sold or become impaired. An impairment loss is recognised if there is objective evidence of impairment as a result of loss events which have an impact on the estimated future cash flows of the financial asset that can be reliably estimated. If an available-for-sale financial asset becomes impaired, the entire balance in equity
64
Back to Contents
relating to that asset is removed from equity and recognised in the income statement as an impairment loss. A further decline in the fair value of an available-for-sale debt security subsequent to the initial impairment is recognised in the income statement when there is further objective evidence of impairment.
At 31 December 2008 the Group’s total available-for-sale financial assets amounted to US$286 billion (2007: US$273 billion), of which US$279 billion or 98 per cent (2007: US$261 billion; 95 per cent) were debt securities. At 31 December 2008, the available-for-sale fair value reserve relating to debt securities amounted to a deficit of US$21.4 billion (2007: deficit of US$2.4 billion). A deficit in the available-for-sale fair value reserve occurs on an available-for-sale debt security when the fair value of the security is less than the security’s acquisition cost (net of any principal repayments and amortisation) less any previous impairment loss recognised in the income statement, but there is no evidence of any impairment or, if an impairment was previously recognised, any subsequent impairment.
Management is required to exercise judgement in determining whether there is objective evidence that an impairment loss has occurred. Once an impairment has been identified, the amount of impairment loss is measured in relation to the fair value of the asset. More information on assumptions and estimates requiring management judgement relating to the determination of fair values of financial instruments is provided above in ‘Valuation of financial instruments’.
The objective evidence required to determine whether an available-for-sale debt security is impaired comprises evidence of the occurrence of a loss event and evidence that the loss event results in a decrease in estimated future cash flows. Where cash flows are readily determinable, a low level of judgement may be involved. Where determination of estimated future cash flows requires consideration of a number of variables, some of which may be unobservable in current market conditions, more significant judgement is required.
The most significant judgements concern more complex instruments, such as asset-backed securities (‘ABS’s), where it is necessary to consider factors such as the estimated future cash flows on underlying pools of collateral, the extent and depth of market price declines and changes in credit ratings. The review of estimated future cash flows on underlying collateral is subject to estimation uncertainties where the assessment is based on historical information on pools of assets, and
judgement is required to determine whether historical performance is likely to be representative of current economic and credit conditions. A description of these securities is included in the ‘Impact of market turmoil’ section under ‘Nature and extent of HSBC’s exposures’ on page 150 and a more detailed description of the assumptions and estimates used in assessing these securities for impairment is disclosed in the section ‘Assessing available-for-sale assets for impairment’ on page 170.
There is no single factor to which the Group’s charge for impairment of available-for-sale debt securities is particularly sensitive, because of the range of different types of securities held, the range of geographical areas in which those securities are held, and the wide range of factors which can affect the occurrence of loss events and the cash flows of securities, including different types of collateral.
Management’s current assessment of the holdings of available-for-sale ABSs with the most sensitivity to possible future impairment is focused on sub-prime and Alt-A residential mortgage-backed securities (‘MBSs’). The Group’s principal exposure to these securities is in the Global Banking and Markets’ business. Excluding holdings in certain special purpose entities where significant first loss risks are borne by external investors, the available-for-sale holdings in these categories within Global Banking and Markets amounted to US$5.2 billion at 31 December 2008 (2007: US$11.8 billion). The deficit in the available-for-sale fair value reserve as at 31 December 2008 in relation to these securities was US$5.9 billion (2007: US$1.1 billion).
The main factors in the reduction in fair value of these securities over the period were the effects of reduced market liquidity and negative market sentiment. The level of actual credit losses experienced was low in 2008, notwithstanding the deterioration in the performance of the underlying mortgages in the period as US house prices fell and defaults increased. The absence of material credit losses is judged to be attributable to the seniority of the tranches held by HSBC as well as the priority for cash flow held by these tranches.
Further details of the nature and extent of HSBC’s exposures to asset backed securities classified as available-for-sale are provided in ‘Impact of market turmoil–nature and extent of HSBC’s exposures’ on page 150.
It is reasonably possible that outcomes in the next financial year could be different from the assumptions and estimates used in identifying
65
Back to Contents
| H S B C H O L D I N G S P L C |
| |
| Report of the Directors:Operating and Financial Review(continued) |
| |
| | |
| Critical accounting policies / Customer groups > Summary |
impairment on available-for-sale debt securities, as a result of which, evidence of impairment may be identified in available-for-sale debt securities which had previously been determined not to be impaired. It is possible that this could result in the recognition of material impairment losses in the next financial year.
Deferred tax assets
HSBC’s accounting policy for the recognition of deferred tax assets is described in Note 2s on the Financial Statements. A deferred tax asset is recognised to the extent that it is probable that future taxable profits will be available against which deductible temporary differences can be utilised. The recognition of a deferred tax asset relies on management’s judgements surrounding the probability and sufficiency of future taxable profits, future reversals of existing taxable temporary differences and ongoing tax planning strategies.
HSBC’s most significant judgements are around the US deferred tax assets, where there has been a recent history of losses in HSBC’s US operations. Net US deferred tax assets amounted to US$5.0 billion or 71 per cent (2007: US$3.7 billion; 70 per cent) of total net deferred tax assets recognised on the Group’s balance sheet.
The amount of US deferred tax assets recognised is based on the evidence available about conditions at the balance sheet date, and requires significant judgements to be made by management, especially those based on management’s projections of credit losses and the timing of recovery in the US economy. Management’s judgement takes into consideration the impact of both positive and negative evidence, including historical financial performance, projections of future taxable income, future reversals of existing taxable temporary differences, and the availability of loss carrybacks. The recognition of the deferred tax asset is mainly dependent upon the projection of future taxable profits, future reversals of existing taxable temporary differences and the capacity to carry back net operating losses arising in 2009.
Tax losses were incurred in HSBC’s US operations in 2008. Management has evaluated the factors contributing to the losses to determine whether the factors leading to the losses are temporary or indicative of a permanent decline in earnings. Based on its analysis, management has
determined that the losses were primarily caused by increases in credit losses in the US due to the current housing and credit market conditions, as well as continued weakening in the general economy, which has led to higher unemployment levels and, consequently, higher credit losses.
In the US, management’s projections of future taxable income are based on business plans, future capital requirements and ongoing tax planning strategies. These projections include assumptions about the depth and severity of further house price depreciation, assumptions about the US recession, including unemployment levels and their related impact on credit losses, and assumptions about ongoing capital support from HSBC.
The assumptions surrounding future expected credit losses in the US represent the most subjective areas of judgement in management’s projections of future taxable income.
Management’s forecasts support the assumption that it is probable that the results of future operations will generate sufficient taxable income to utilise the deferred tax assets. In management’s judgement, the recent market conditions, which have resulted in losses being incurred in the US over the last two years, will create significant downward pressure and volatility on the profit or loss before tax in the next few years. To reflect this, the assessment of recoverability of the deferred tax asset in the US significantly discounts any future expected taxable income and relies to a greater extent on continued capital support to the US operations from HSBC, including tax planning strategies implemented in relation to such support. The most significant tax planning strategy is HSBC’s investment of capital into its US operations to ensure the utilisation of the net operating loss carry forwards. This strategy provides substantial support for the recoverability of the deferred tax assets. HSBC expects that its US operations will continue to be dependent upon its capital support, and will continue to execute their business strategies and plans until they return to profitability. Based on management’s forecasts, HSBC expects to provide capital support to its US operations in each of the next three years. If HSBC were to decide, however, not to provide this ongoing support, the full recovery of the deferred tax asset may no longer be probable and could result in a material adjustment to the deferred tax asset which would be recognised in the income statement.
66
Back to Contents
The Group Chairman and Group Finance Director, with the assistance of other members of management, carried out an evaluation of the effectiveness of the design and operation of HSBC Holdings’ disclosure controls and procedures as of 31 December 2008. Based upon that evaluation, the Group Chairman and Group Finance Director concluded that HSBC’s disclosure controls and procedures as of 31 December 2008 were effective to provide reasonable assurance that information required to be disclosed in the reports which the company files and submits under the US Securities Exchange Act of 1934, as amended, is recorded, processed, summarised and reported as and when required. There are inherent limitations to the effectiveness of any system of disclosure controls and procedures, including the possibility of human error and the circumvention or overriding of the controls and procedures. Accordingly, even effective disclosure controls and procedures can only provide reasonable assurance of achieving their control objectives.
There has been no change in HSBC Holdings’ internal control over financial reporting during the year ended 31 December 2008 that has materially affected, or is reasonably likely to materially affect, HSBC Holdings’ internal control over financial reporting.
| Management’s assessment of internal control over financial reporting |
|
| |
Management is responsible for establishing and maintaining an adequate internal control structure and procedures for financial reporting, and has completed an assessment of the effectiveness of the Group’s internal control over financial reporting as of 31 December 2008. In making the assessment, management used the framework for Director’s internal control evaluation contained within the Combined Code (‘The Revised Turnbull Guidance’), as well as the criteria established by the Committee of Sponsoring Organisations of the Treadway Commission (‘COSO’) in ‘Internal Control-Integrated Framework’.
Based on the assessment performed, management concluded that as at 31 December 2008, the Group’s internal control over financial reporting was effective.
KPMG Audit Plc, which has audited the consolidated financial statements of the Group for the year ended 31 December 2008, has also audited the effectiveness of the Group’s internal control over financial reporting under Auditing Standard No.5 of the Public Company Accounting Oversight Board (United States) as stated in their report on pages 330 and 331.
66a
Back to Contents
Summary
HSBC manages its business through two customer groups, Personal Financial Services and Commercial Banking, and two global businesses, Global Banking and Markets (previously Corporate, Investment Banking and Markets), and Private Banking. Personal Financial Services incorporates the Group’s consumer finance businesses; the largest of these is HSBC Finance Corporation (‘HSBC Finance’).
All commentaries on the customer groups and global businesses are on an underlying basis unless stated otherwise.
| Profit/(loss) before tax |
| | | | | | | | | | | | | | |
| | | 2008 | | 2007 | | 2006 | |
| | |
|
|
| |
|
|
| |
|
|
| |
| | | US$m | | % | | US$m | | % | | US$m | | % | |
| | | | | | | | | | | | | | |
| Personal Financial Services | | (10,974 | ) | (117.9 | ) | 5,900 | | 24.4 | | 9,457 | | 42.8 | |
| Commercial Banking | | 7,194 | | 77.3 | | 7,145 | | 29.5 | | 5,997 | | 27.2 | |
| Global Banking and Markets | | 3,483 | | 37.4 | | 6,121 | | 25.3 | | 5,806 | | 26.3 | |
| Private Banking | | 1,447 | | 15.6 | | 1,511 | | 6.2 | | 1,214 | | 5.5 | |
| Other13 | | 8,157 | | 87.6 | | 3,535 | | 14.6 | | (388 | ) | (1.8 | ) |
| | |
| |
| |
| |
| |
| |
| |
| | | 9,307 | | 100.0 | | 24,212 | | 100.0 | | 22,086 | | 100.0 | |
| | |
| |
| |
| |
| |
| |
| |
| | | | | | | | | | | | | | |
| | | | | | | | | | | | | | |
| Total assets15 | | | | | | | | | |
| | | | | | | | | | |
| | | At 31 December | |
| | |
|
|
|
|
|
|
| |
| | | 2008 | | 2007 | |
| | | US$m | | % | | US$m | | % | |
| | | | | | | | | | |
| Personal Financial Services | | 514,419 | | 20.4 | | 621,356 | | 26.4 | |
| Commercial Banking | | 249,218 | | 9.9 | | 307,944 | | 13.1 | |
| Global Banking and Markets | | 1,896,630 | | 75.0 | | 1,561,468 | | 66.3 | |
| Private Banking | | 133,216 | | 5.3 | | 130,893 | | 5.6 | |
| Other | | 135,001 | | 5.3 | | 155,685 | | 6.6 | |
| Intra-HSBC items | | (401,019 | ) | (15.9 | ) | (423,080 | ) | (18.0 | ) |
| | |
| |
| |
| |
| |
| | | 2,527,465 | | 100.0 | | 2,354,266 | | 100.0 | |
| | |
| |
| |
| |
| |
| | | | | | | | | | |
| For footnotes, see page 145. | | | | | | | | | |
| | | | | | | | | | |
Basis of preparation
The results are presented in accordance with the accounting policies used in the preparation of HSBC’s consolidated financial statements. HSBC’s operations are closely integrated and, accordingly, the presentation of customer group data includes internal allocations of certain items of income and expense. These allocations include the costs of certain support services and Group Management Office (‘GMO’) functions, to the extent that these
can be meaningfully attributed to operational business lines. While such allocations have been made on a systematic and consistent basis, they necessarily involve a degree of subjectivity.
Where relevant, income and expense amounts presented include the results of inter-segment funding as well as inter-company and inter-business line transactions. All such transactions are undertaken on arm’s length terms.
67
Back to Contents
| H S B C H O L D I N G S P L C |
| |
| Report of the Directors:Operating and Financial Review(continued) |
| |
| | |
| Customer groups > Personal Financial Services |
| Personal Financial Services |
| |
| Profit/(loss) before tax |
| |
| | | 2008 | | | 2007 | | | 2006 | |
| | | US$m | | | US$m | | | US$m | |
| | | | | | | | | | |
| Net interest income | | 29,419 | | | 29,069 | | | 26,076 | |
| Net fee income | | 10,107 | | | 11,742 | | | 8,762 | |
| Trading income excluding net interest income | | 175 | | | 38 | | | 391 | |
| Net interest income on trading activities | | 79 | | | 140 | | | 220 | |
| Net trading income16 | | 254 | | | 178 | | | 611 | |
| Net income/(expense) from financial instruments designated at fair value | | (2,912 | ) | | 1,333 | | | 739 | |
| Gains less losses from financial investments | | 663 | | | 351 | | | 78 | |
| Dividend income | | 90 | | | 55 | | | 31 | |
| Net earned insurance premiums | | 10,083 | | | 8,271 | | | 5,130 | |
| Other operating income | | 259 | | | 387 | | | 782 | |
| | |
| | |
| | |
| |
| Total operating income | | 47,963 | | | 51,386 | | | 42,209 | |
| Net insurance claims17 | | (6,474 | ) | | (8,147 | ) | | (4,365 | ) |
| | |
| | |
| | |
| |
| Net operating income5 | | 41,489 | | | 43,239 | | | 37,844 | |
| Loan impairment charges and other credit risk provisions | | (21,220 | ) | | (16,172 | ) | | (9,949 | ) |
| | |
| | |
| | |
| |
| Net operating income | | 20,269 | | | 27,067 | | | 27,895 | |
| Operating expenses (excluding goodwill impairment) | | (21,140 | ) | | (21,757 | ) | | (18,818 | ) |
| Goodwill impairment | | (10,564 | ) | | – | | | – | |
| | |
| | |
| | |
| |
| Operating profit/(loss) | | (11,435 | ) | | 5,310 | | | 9,077 | |
| Share of profit in associates and joint ventures | | 461 | | | 590 | | | 380 | |
| | |
| | |
| | |
| |
| Profit/(loss) before tax | | (10,974 | ) | | 5,900 | | | 9,457 | |
| | |
| | |
| | |
| |
| By geographical region | | | | | | | | | |
| Europe | | 1,658 | | | 1,581 | | | 1,909 | |
| Hong Kong | | 3,428 | | | 4,212 | | | 2,880 | |
| Rest of Asia-Pacific | | 500 | | | 760 | | | 477 | |
| North America | | (17,228 | ) | | (1,546 | ) | | 3,391 | |
| Latin America | | 668 | | | 893 | | | 800 | |
| | |
| | |
| | |
| |
| | | (10,974 | ) | | 5,900 | | | 9,457 | |
| | |
| | |
| | |
| |
| | | | | | | | | | |
| | | % | | | % | | | % | |
| | | | | | | | | | |
| Share of HSBC’s profit before tax | | (117.9 | ) | | 24.4 | | | 42.8 | |
| Cost efficiency ratio | | 76.4 | | | 50.3 | | | 49.7 | |
| | | | | | | | | | |
| Balance sheet data15 |
| | | US$m | | | US$m | | | US$m | |
| | | | | | | | | | |
| Loans and advances to customers (net) | | 401,402 | | | 464,726 | | | 448,545 | |
| Total assets | | 514,419 | | | 621,356 | | | 602,342 | |
| Customer accounts | | 440,338 | | | 450,071 | | | 388,468 | |
| | | | | | | | | | |
| For footnotes, see page 143. |
| Strategic direction |
| | |
| HSBC’s strategy for Personal Financial Services is to use its global reach and local knowledge to grow profitably in selected markets. The strategy focuses on growth in: |
| | |
| – | markets where HSBC already has scale, such asHong Kong and the UK; and |
| | |
| – | markets where HSBC can build or acquire scale,particularly in Asia-Pacific, Latin America,Turkey and the Middle East. |
| | |
| | Within these markets, there are two key target segments: |
| | |
| – | customers who value seamless internationalbanking and wealth management; and |
| | |
| – | customers who are confident about using directchannels (internet, ATM, telephone, mobile) toaccess financial services. |
| | |
| Financial performance in 2008 |
| | |
| • | The reported loss before tax of US$11.0 billioncompared with a profit of US$5.9 billion in2007, driven substantially by higher loanimpairment charges and a goodwill impairmentcharge of US$10.6 billion which wrote down infull the goodwill relating to the North AmericanPersonal Financial Services business. Excludingthe loss before tax incurred in this business, pre-tax profits fell by 17 per cent on an underlyingbasis, with an increase in loan impairmentsand lower fee income more than offsetting anincrease in revenue from deposit growth andhigher gains on the sale of MasterCard and Visashares. |
| | |
| • | Net fee income fell by 13 per cent. This wasdriven by weak market sentiment, whichresulted in lower fees from retail securities andinvestments, particularly in Hong Kong, andchanges in fee billing practices in the credit cardbusiness to improve the customer proposition inNorth America. |
| | |
| • | A net expense of US$2.9 billion was recordedon financial instruments designated at fair value,compared with income of US$1.3 billion in2007. This was largely due to the fall in value ofassets held to meet liabilities under insuranceand investment contracts driven by poor equitymarket performances, predominantly affectingoperations in Hong Kong, the UK and France.
For assets held to meet liabilities under unit-linked and, to a certain extent, participatinginsurance contracts, the movement from incometo expense was offset by a corresponding |
68
Back to Contents
| | reduction in policyholder liabilities whereinvestment losses can be passed topolicyholders. |
| | |
| • | Loan impairment charges rose by 32 per cent,primarily due to further deterioration in creditquality in the North American PersonalFinancial Services business. Delinquency ratesincreased across all portfolios in HSBC Finance,particularly consumer lending, and in the realestate secured portfolios in HSBC USA,following the sustained downturn in the housingmarket and the onset of economic recession. |
| | |
| • | A rise in loan impairments in Mexico,Turkey and India was attributable to higherdelinquencies following growth of the creditcard and personal loan portfolios. Actions takento curtail asset growth in these markets focusedon tightening lending criteria and deployingadvanced credit analytics. |
| | |
| • | Operating expenses were 48 per cent higher,largely due to the goodwill impairment charge. Excluding this, operational costs were slightlylower, driven by a 12 per cent reduction inNorth America following initiatives taken since2007 to cease originations in mortgage services,limit new originations in consumer lending andreduce marketing spend in cards. This benefitwas partially offset by investment in businessexpansion in mainland China and Japan and anincrease in restructuring costs and union-agreedsalaries in Latin America. |
| | |
| • | Profit before tax increased in Europe, with asolid performance in the UK partially offset by afall in Turkey as an investment in 98 additionalbranches was made in order to attain nationwidecoverage. Profits were lower in France. |
| | |
| • | In the Middle East, profit rose by 17 per cent on2007, with strong growth in revenue from cards. |
| | |
| Business highlights in 2008 |
| | |
| • | HSBC Premier (‘Premier’), which offers massaffluent customers a seamless internationalbanking and wealth management service, grewto 2.6 million customers in 2008. During theyear, the service was extended to a further sixcountries, taking the total to 41. 472,000 netnew customers joined Premier, of whom80 per cent were new to the Group. |
| • | The strength of the HSBC brand helpedattract an increase in customer accountsof US$50 billion, or 13 per cent, toUS$440 billion, despite the low interest rateenvironment. In North America, net loans andadvances to customers fell by 16 per cent asHSBC reduced its balance sheet and lowered itsrisk profile in the US. Excluding North America,lending increased by 10 per cent, demonstratingHSBC’s commitment to supporting its corecustomer base. At 31 December 2008, theadvances-to-deposits ratio was 91 per cent,compared with 106 per cent at the end ofDecember 2007. |
| | |
| • | The HSBC Direct online savings offering inthe US performed well in difficult marketconditions. Average balances increased byUS$2.0 billion to US$13.2 billion, reducing theoverall funding costs of the US PersonalFinancial Services business. |
| | |
| • | In the UK, HSBC launched a RateMatchermortgage promotion to attract quality customersfacing an interest rate reset in the near term. HSBC attracted a strong flow of new businesstotalling US$9.9 billion during the campaign. InDecember 2008, HSBC announced that the bankwill make available up to £15 billion of UKresidential mortgages in 2009. |
| | |
| • | Consistent with HSBC’s strategy to increase thesale of insurance products to existing customers,the major life businesses in Europe and Asiagrew and underlying net premium income roseby 15 per cent. However, declining worldwideequity markets led to a reduction in insuranceprofits compared with 2007. |
| | |
| • | In the US, declining house prices, risingunemployment and increasing bankruptciesfuelled growing customer delinquencies. HSBCcontinued to take measures to help customersmanage their mortgage repayments and avoidforeclosure. During 2008, HSBC Financeexpanded its mortgage loan modificationprogramme which included longer-termmodifications. The loan obligations of over92,000 customers with aggregate mortgages ofUS$13.5 billion were modified during 2008,helping to maximise cash flow for HSBC andpreserve home ownership for customers. |
69
Back to Contents
| H S B C H O L D I N G S P L C |
| |
| Report of the Directors: Operating and Financial Review(continued) |
| | |
| | |
| Customer groups > Personal Financial Services |
Subsequent developments
The branch-based US consumer lending business of HSBC Finance has historically focused on sub-prime customers who rely on drawing cash against the equity in their homes to help meet their cash needs. Unsecured consumer lines of credit have served as a means of generating new customer accounts, with the potential to subsequently provide the customer with a mortgage product, typically a secured debt consolidation loan. As a result, the bulk of the mortgage lending products sold in the US consumer lending branch network have been for refinancing and debt consolidation rather than for house purchase.
The unprecedented deterioration in the US housing market over the last two years, including declining property values and lower secondary market demand for sub-prime mortgages, has undermined the ability of many real estate loan customers to make payments or refinance their loans. In many cases, there is no equity in their homes or, if there is, few institutions are willing to finance its withdrawal. As a result, loan originations in this business have fallen dramatically for both HSBC Finance and the industry as a whole. Management believes it will take years before property values return to the levels seen prior to the decline and, as such, has concluded that recovery in the sub-prime mortgage lending business is uncertain and the industry is unlikely to stabilise for a number of years. Management also expects that changes in regulation and practice will make it problematic to plan and execute a sub-prime lending business strategy with a reasonable degree of confidence.
Given the above, in 2008 HSBC began to reposition its US consumer lending business to reduce risk by tightening lending criteria and expanding its lending to include government sponsored entity and conforming loan products. As part of this repositioning, HSBC intended to place greater emphasis on unsecured loan products while decreasing secured loan production. To date, the results of this repositioning effort have not met expectations, in part due to the continued deterioration in the economy, leading management to re-evaluate whether, given the Group’s risk appetite, the initiative can produce the volume necessary to ensure that the consumer lending business will return to profitability in the foreseeable future.
As a consequence, at the end of February 2009, the Board of HSBC endorsed management’s recommendation to discontinue as soon as practicable originations of all products by the branch-based US consumer lending business of HSBC Finance. At 31 December 2008 this business had outstanding balances of US$62 billion comprising US$46 billion in real estate secured and US$16 billion in unsecured loan balances. HSBC will continue to service and collect the existing loan portfolio as it runs off, and will continue the Group’s efforts to help customers in need of loan modification and other account management programmes to maximise collection and preserve, as far as possible, home ownership. In the US, substantially all consumer lending branches branded HFC and Beneficial will cease taking loan applications and will be closed. HSBC Finance will also continue to run-off the loan portfolios of its mortgage services business and its vehicle finance business. HSBC will provide all necessary support to HSBC Finance to enable it to run off these businesses in a measured way and to meet all its commitments.
The operations of HSBC’s other US Personal Financial Services businesses, including its card business, and the retail bank branch business of HSBC USA are unaffected by this decision. HSBC USA will continue to service its customers with real estate secured and unsecured products.
HSBC expects as a result of this decision affecting the US consumer lending business of HSBC Finance that total revenue will fall by approximately US$50 million in 2009 and operating expenses by approximately US$700 million on an annualised basis. Closure costs of up to US$195 million will be incurred, predominantly related to one-off termination and other employee benefit costs, a substantial portion of which will be recorded in the first half of 2009.
In addition, a non-cash charge of approximately US$70 million is expected to be incurred in relation to the impairment of fixed assets associated with the consumer lending branch network, also to be recognised in the first half of 2009.
Employees supporting originations operations will be evaluated for service elsewhere in HSBC’s operations, but it is currently expected that approximately 6,100 employees will be displaced.
70
Back to Contents
| Reconciliation of reported and underlying profit/(loss) before tax |
| | 2008 compared with 2007 | |
| |
|
|
|
|
|
|
|
|
|
|
|
|
|
|
| |
| | | | 2007 | | | | | | | | | | | | | | | |
| | | | acquisitions, | | | | 2007 | | 2008 | | | | | | | | | |
| | 2007 | | disposals | | | | at 2008 | | acquisitions | | Under- | | 2008 | | Re- | | Under- | |
| | as | | & dilution | | Currency | | exchange | | and | | lying | | as | | ported | | lying | |
| Personal Financial | reported | | gains | 1 | translation | 2 | rates | 3 | disposals | 1 | change | | reported | | change | | change | |
| Services | US$m | | US$m | | US$m | | US$m | | US$m | | US$m | | US$m | | % | | % | |
| | | | | | | | | | | | | | | | | | | |
| Net interest income | 29,069 | | (224 | ) | (126 | ) | 28,719 | | 215 | | 485 | | 29,419 | | 1 | | 2 | |
| Net fee income | 11,742 | | (21 | ) | (105 | ) | 11,616 | | (9 | ) | (1,500 | ) | 10,107 | | (14 | ) | (13 | ) |
| Other income4 | 2,428 | | (91 | ) | (10 | ) | 2,327 | | 83 | | (447 | ) | 1,963 | | (19 | ) | (19 | ) |
| |
| |
| |
| |
| |
| |
| |
| | | | | |
| Net operating income5 | 43,239 | | (336 | ) | (241 | ) | 42,662 | | 289 | | (1,462 | ) | 41,489 | | (4 | ) | (3 | ) |
| Loan impairment charges | | | | | | | | | | | | | | | | | | |
| and other credit risk | | | | | | | | | | | | | | | | | | |
| provisions | (16,172 | ) | 4 | | 75 | | (16,093 | ) | (3 | ) | (5,124 | ) | (21,220 | ) | (31 | ) | (32 | ) |
| |
| |
| |
| |
| |
| |
| |
| | | | | |
| Net operating income | 27,067 | | (332 | ) | (166 | ) | 26,569 | | 286 | | (6,586 | ) | 20,269 | | (25 | ) | (25 | ) |
| Operating expenses | | | | | | | | | | | | | | | | | | |
| (excluding goodwill | | | | | | | | | | | | | | | | | | |
| impairment) | (21,757 | ) | 236 | | 117 | | (21,404 | ) | (98 | ) | 362 | | (21,140 | ) | 3 | | 2 | |
| Goodwill impairment | – | | – | | – | | – | | – | | (10,564 | ) | (10,564 | ) | n/a | | n/a | |
| |
| |
| |
| |
| |
| |
| |
| | | | | |
| Operating profit/(loss) | 5,310 | | (96 | ) | (49 | ) | 5,165 | | 188 | | (16,788 | ) | (11,435 | ) | (315 | ) | (325 | ) |
| Income from associates | 590 | | – | | 52 | | 642 | | – | | (181 | ) | 461 | | (22 | ) | (28 | ) |
| |
| |
| |
| |
| |
| |
| |
| | | | | |
| Profit/(loss) before tax | 5,900 | | (96 | ) | 3 | | 5,807 | | 188 | | (16,969 | ) | (10,974 | ) | (286 | ) | (292 | ) |
| |
| |
| |
| |
| |
| |
| |
| | | | | |
| | | | | | | | 2007 compared with 2006 | | | | | | | | | |
| |
|
|
|
|
|
|
|
|
|
|
|
|
|
|
| |
| | | | | | | | | | 2007 | | | | | | | | | |
| | | | 2006 | | | | 2006 | | acquisitions, | | | | | | | | | |
| | 2006 | | acquisitions | | | | at 2007 | | disposals | | Under- | | 2007 | | Re- | | Under- | |
| | as | | and | | Currency | | exchange | | & dilution | | lying | | as | | ported | | lying | |
| Personal Financial | reported | | disposals | 1 | translation | 2 | rates | 6 | gains | 1 | change | | reported | | change | | change | |
| Services | US$m | | US$m | | US$m | | US$m | | US$m | | US$m | | US$m | | % | | % | |
| | | | | | | | | | | | | | | | | | | |
| Net interest income | 26,076 | | (3 | ) | 746 | | 26,819 | | 653 | | 1,597 | | 29,069 | | 11 | | 6 | |
| Net fee income | 8,762 | | 53 | | 322 | | 9,137 | | (77 | ) | 2,682 | | 11,742 | | 34 | | 30 | |
| Other income4 | 3,006 | | (53 | ) | 87 | | 3,040 | | (38 | ) | (574 | ) | 2,428 | | (19 | ) | (19 | ) |
| |
| |
| |
| |
| |
| |
| |
| | | | | |
| Net operating income5 | 37,844 | | (3 | ) | 1,155 | | 38,996 | | 538 | | 3,705 | | 43,239 | | 14 | | 10 | |
| Loan impairment charges | | | | | | | | | | | | | | | | | | |
| and other credit risk | | | | | | | | | | | | | | | | | | |
| provisions | (9,949 | ) | – | | (205 | ) | (10,154 | ) | (72 | ) | (5,946 | ) | (16,172 | ) | (63 | ) | (59 | ) |
| |
| |
| |
| |
| |
| |
| |
| | | | | |
| Net operating income | 27,895 | | (3 | ) | 950 | | 28,842 | | 466 | | (2,241 | ) | 27,067 | | (3 | ) | (8 | ) |
| Operating expenses | (18,818 | ) | 2 | | (753 | ) | (19,569 | ) | (285 | ) | (1,903 | ) | (21,757 | ) | (16 | ) | (10 | ) |
| |
| |
| |
| |
| |
| |
| |
| | | | | |
| Operating profit | 9,077 | | (1 | ) | 197 | | 9,273 | | 181 | | (4,144 | ) | 5,310 | | (42 | ) | (45 | ) |
| Income from associates | 380 | | – | | 13 | | 393 | | 6 | | 191 | | 590 | | 55 | | 49 | |
| |
| |
| |
| |
| |
| |
| |
| | | | | |
| Profit before tax | 9,457 | | (1 | ) | 210 | | 9,666 | | 187 | | (3,953 | ) | 5,900 | | (38 | ) | (41 | ) |
| |
| |
| |
| |
| |
| |
| |
| | | | | |
| |
| For footnotes, see page 143. |
71
Back to Contents
| H S B C H O L D I N G S P L C |
| |
| Report of the Directors: Operating and Financial Review(continued) |
| | |
| | |
| Customer groups > Commercial Banking |
| Commercial Banking | | | | | | | | |
| |
| Profit before tax | | | | | | | | |
| |
| | 2008 | | | 2007 | | | 2006 | |
| | US$m | | | US$m | | | US$m | |
| | | | | | | | | |
| Net interest income | 9,494 | | | 9,055 | | | 7,514 | |
| Net fee income | 4,097 | | �� | 3,972 | | | 3,207 | |
Trading income excludingnet interest income | 369 | | | 265 | | | 204 | |
| Net interest income on trading activities | 17 | | | 31 | | | 20 | |
| | | | | | | | | |
| Net trading income16 | 386 | | | 296 | | | 224 | |
Net income/(expense) fromfinancial instrumentsdesignated at fair value | (224 | ) | | 22 | | | (22 | ) |
| Gains less losses from financial investments | 193 | | | 90 | | | 44 | |
| Dividend income | 88 | | | 8 | | | 6 | |
| Net earned insurancepremiums | 679 | | | 733 | | | 258 | |
| Other operating income | 939 | | | 165 | | | 250 | |
| |
| | |
| | |
| |
| Total operating income | 15,652 | | | 14,341 | | | 11,481 | |
| Net insurance claims17 | (335 | ) | | (391 | ) | | (96 | ) |
| |
| | |
| | |
| |
| Net operating income5 | 15,317 | | | 13,950 | | | 11,385 | |
Loan impairment chargesand other credit riskprovisions | (2,173 | ) | | (1,007 | ) | | (697 | ) |
| |
| | |
| | |
| |
| Net operating income | 13,144 | | | 12,943 | | | 10,688 | |
| |
| Total operating expenses | (6,581 | ) | | (6,252 | ) | | (4,979 | ) |
| |
| | |
| | |
| |
| Operating profit | 6,563 | | | 6,691 | | | 5,709 | |
| Share of profit in associates and joint ventures | 631 | | | 454 | | | 288 | |
| |
| | |
| | |
| |
| Profit before tax | 7,194 | | | 7,145 | | | 5,997 | |
| |
| | |
| | |
| |
| |
| By geographical region | | | | | | | | |
| Europe | 2,722 | | | 2,516 | | | 2,234 | |
| Hong Kong | 1,315 | | | 1,619 | | | 1,321 | |
| Rest of Asia-Pacific | 1,793 | | | 1,350 | | | 1,034 | |
| North America | 658 | | | 920 | | | 957 | |
| Latin America | 706 | | | 740 | | | 451 | |
| |
| | |
| | |
| |
| | 7,194 | | | 7,145 | | | 5,997 | |
| |
| | |
| | |
| |
| |
| | % | | | % | | | % | |
| | | | | | | | | |
| Share of HSBC’s profit before tax | 77.3 | | | 29.5 | | | 27.2 | |
| Cost efficiency ratio | 43.0 | | | 44.8 | | | 43.7 | |
| |
| Balance sheet data15 | | | | | | | | |
| | US$m | | | US$m | | | US$m | |
| | | | | | | | | |
Loans and advances tocustomers (net) | 203,949 | | | 220,068 | | | 172,976 | |
| Total assets | 249,218 | | | 307,944 | | | 228,668 | |
| Customer accounts | 235,879 | | | 237,987 | | | 190,853 | |
| |
| For footnotes, see page 143. |
Strategic direction |
| | |
| HSBC’s Commercial Banking strategy is focused on two key initiatives: |
| | |
| – | to be the leading international business bank,using HSBC’s extensive geographical networktogether with product expertise in payments,trade, receivables finance and foreign exchangeto actively support customers trading andinvesting across borders; and |
| | |
| – | to be the best bank for small businesses in targetmarkets, building global scale and creatingefficiencies by sharing best practice, includingcustomer experience and credit scoring, andselectively rolling out the direct banking model. |
| | |
| Financial performance in 2008 |
| | |
| • | Reported pre-tax profit was broadly in line with 2007 at US$7.2 billion as revenue growth was offset by the rise in loan impairment charges and operating costs. Pre-tax profit growth was evident in emerging markets, with their contribution increasing to 56 per cent excluding a gain of US$425 million on the disposal of the UK merchant acquiring division, recorded in ‘Other operating income’. Profit growth was most significant in Australia, India, mainland China, United Arab Emirates (‘UAE’), Turkey, Brazil and Argentina. |
| | |
| • | HSBC remained committed to new lending, increasing lending balances by 10 per cent. Deposit growth of 15 per cent was driven by brand strength, particularly in the UK, the US and Hong Kong. |
| | |
| • | Balance sheet growth drove a 7 per cent rise innet interest income, notwithstanding the adverseaffect of widespread reductions in interest rateson liability spreads. This was partly offset byhigher lending spreads from improved pricing. |
| | |
| • | Net fee income rose by 8 per cent with incomefrom trade services and foreign exchangegrowing particularly strongly. |
| | |
| • | Other income was boosted by a number ofsignificant gains, notably from the sale of sharesin MasterCard and Visa. |
| | |
| • | Loan impairment charges increased fromUS$1.0 billion in 2007 to US$2.2 billion, as thepreviously benign credit environment wasreplaced by economic slowdown in mostcountries. Loan impairment charges increasedby 44 basis points to 1 per cent of averagereported assets, with most of the increasecoming in the second half of 2008. |
72
Back to Contents
| • | The cost efficiency ratio improved to 44.2 percent excluding the US$425 million gains notedabove. Costs were tightly controlled in Europeand North America, but grew elsewhere as theGroup continued to expand operations inemerging markets, particularly in Asia. |
| | |
| • | Customer numbers grew to 2.9 million, withcontinuing recruitment of new customersthrough existing operations and gains from theacquisition of the assets, liabilities andoperations of The Chinese Bank in Taiwan,despite a reduction from the sale of the Frenchregional banks. |
| | |
| Business highlights in 2008 |
| | |
| Commercial Banking achieved key objectives toward its international business strategy in 2008 as the proportion of its total revenues derived from international customers and products increased. |
| | |
| • | Revenue from foreign exchange and trade and supply chain products grew strongly, with increases of 66 per cent and 27 per cent, respectively. This was driven by improved cross-selling of products, particularly in foreign exchange, as customers sought protection from volatile currency movements. A number of initiatives were launched to extend foreign exchange services, which included enhancing relationship management in the US and UAE, and introducing dedicated sales desks in India. |
| | |
| • | The volume of international trade finance increased significantly and revenue grew commensurately as HSBC benefited from higher commodity prices, the reintermediation of traditional trade instruments in respect of which the Group demonstrated continued capacity to lend, and improved pricing reflecting market trends. HSBC’s growth outpaced market growth in a number of key countries, particularly in Asia and the Middle East. |
| | |
| • | Successful Global Links referrals nearlydoubled to 5,600, with the aggregate transactionvalue exceeding US$11 billion, an increase of96 per cent. The use of electronic accountopening ‘SmartForms’ improved customerexperience. |
| | |
| | In support of its strategy to be the best bank for small businesses, HSBC focused on deposit gathering and transaction banking, and was particularly successful in attracting customer deposits. |
| | |
| • | With over US$100 billion in customer deposits,HSBC’s small and micro segments are a |
| | significant source of funding for Commercial Banking, generating over twice as much in liabilities as loans and advances to customers. Customer numbers in the small and micro segments rose by 7 per cent to 2.6 million. In Taiwan, the acquisition of the assets, liabilities and operations of The Chinese Bank expanded the branch network to 33 and added over 15,000 small business customers. |
| | |
| • | Customer loyalty was evidenced by an increasein the use of internet banking, with the numberof active users of Business Internet Bankinggrowing by 16 per cent and the number oftransactions by 18 per cent. |
| | |
| • | New small business offerings continued to beinitiated. BusinessDirect was extended to sevencountries and total customer numbers exceeded180,000. BusinessVantage was launched inIndonesia while, in the US, the autumnmarketing campaign led to over 9,000 newaccounts. New business card products wererolled out in a further six countries. |
| | |
| • | The announcement of HSBC’s US$5 billionInternational SME Fund in December under-scored the Group’s commitment to lending tosmall and medium-sized enterprises, and led tosignificant interest from existing andprospective customers. Specific initiatives werelaunched in the UK, Hong Kong, France andMalta. |
| | |
| | Commercial Banking increased its intra-Group referrals, in part by extending the Global Links platform to facilitate cross-customer group referrals. |
| | |
| • | In Hong Kong and India, an initiative toincrease referrals across customer groupsresulted in a two-fold rise in the number ofPremier account referrals, and significantgrowth in referrals from Personal FinancialServices to Commercial Banking. Similarprogrammes in the UK contributed to sales ofPremier accounts and mortgage products, andplans are underway to extend these programmesto other regions in 2009. |
| | |
| • | Referrals to Private Banking grew by 30 percent, and led to US$2.7 billion in new assetsunder management, while referrals from PrivateBanking led to a three-fold increase in newrelationships. |
| | |
| • | Sales of Global Markets products wereparticularly strong in foreign exchange underCommercial Banking’s strategy to be theleading bank for international business. |
73
Back to Contents
| H S B C H O L D I N G S P L C |
| |
| Report of the Directors: Operating and Financial Review(continued) |
| | |
| | |
| Customer groups > Commercial Banking / Global Banking and Markets |
Reconciliation of reported and underlying profit before tax
| 2008 compared with 2007 | |
| |
|
|
|
|
|
|
|
|
|
|
|
|
|
|
|
|
| |
| | | | 2007 | | | | | | | | | | | | | | | |
| | | | acquisitions, | | | | 2007 | | 2008 | | | | | | | | | |
| | 2007 | | disposals | | | | at 2008 | | acquisitions | | Under- | | 2008 | | Re- | | Under- | |
| | as | | & dilution | | Currency | | exchange | | and | | lying | | as | | ported | | lying | |
| | reported | | gains1 | | translation2 | | rates3 | | disposals1 | | change | | reported | | change | | change | |
| Commercial Banking | US$m | | US$m | | US$m | | US$m | | US$m | | US$m | | US$m | | % | | % | |
| | | | | | | | | | | | | | | | | | | |
| Net interest income | 9,055 | | (166 | ) | (77 | ) | 8,812 | | 41 | | 641 | | 9,494 | | 5 | | 7 | |
| Net fee income | 3,972 | | (113 | ) | (76 | ) | 3,783 | | 27 | | 287 | | 4,097 | | 3 | | 8 | |
| Other income4 | 923 | | (7 | ) | (28 | ) | 888 | | 525 | | 313 | | 1,726 | | 87 | | 35 | |
| |
| |
| |
| |
| |
| |
| |
| | | | | |
| Net operating income5 | 13,950 | | (286 | ) | (181 | ) | 13,483 | | 593 | | 1,241 | | 15,317 | | 10 | | 9 | |
| Loan impairment charges and other credit risk provisions | (1,007 | ) | 3 | | 36 | | (968 | ) | (3 | ) | (1,202 | ) | (2,173 | ) | (116 | ) | (124 | ) |
| |
| |
| |
| |
| |
| |
| |
| | | | | |
| Net operating income | 12,943 | | (283 | ) | (145 | ) | 12,515 | | 590 | | 39 | | 13,144 | | 2 | | – | |
| Operating expenses | (6,252 | ) | 180 | | 47 | | (6,025 | ) | (106 | ) | (450 | ) | (6,581 | ) | (5 | ) | (7 | ) |
| |
| |
| |
| |
| |
| |
| |
| | | | | |
| Operating profit | 6,691 | | (103 | ) | (98 | ) | 6,490 | | 484 | | (411 | ) | 6,563 | | (2 | ) | (6 | ) |
| Income from associates | 454 | | – | | 26 | | 480 | | – | | 151 | | 631 | | 39 | | 31 | |
| |
| |
| |
| |
| |
| |
| |
| | | | | |
| Profit before tax | 7,145 | | (103 | ) | (72 | ) | 6,970 | | 484 | | (260 | ) | 7,194 | | 1 | | (4 | ) |
| |
| |
| |
| |
| |
| |
| |
| | | | | |
| | 2007 compared with 2006 | |
| |
|
|
|
|
|
|
|
|
|
|
|
|
|
|
|
|
| |
| | | | | | | | | | 2007 | | | | | | | | | |
| | | | 2006 | | | | 2006 | | acquisitions, | | | | | | | | | |
| | 2006 | | acquisitions | | | | at 2007 | | disposals | | Under- | | 2007 | | Re- | | Under- | |
| | as | | and | | Currency | | exchange | | & dilution | | lying | | as | | ported | | lying | |
| | reported | | disposals1 | | translation2 | | rates6 | | gains1 | | change | | reported | | change | | change | |
| Commercial Banking | US$m | | US$m | | US$m | | US$m | | US$m | | US$m | | US$m | | % | | % | |
| | | | | | | | | | | | | | | | | | | |
| Net interest income | 7,514 | | – | | 382 | | 7,896 | | 114 | | 1,045 | | 9,055 | | 21 | | 13 | |
| Net fee income | 3,207 | | – | | 189 | | 3,396 | | 17 | | 559 | | 3,972 | | 24 | | 16 | |
| Other income4 | 664 | | – | | 27 | | 691 | | 48 | | 184 | | 923 | | 39 | | 27 | |
| |
| |
| |
| |
| |
| |
| |
| | | | | |
| Net operating income5 | 11,385 | | – | | 598 | | 11,983 | | 179 | | 1,788 | | 13,950 | | 23 | | 15 | |
| Loan impairment charges and other credit risk provisions | (697 | ) | – | | (47 | ) | (744 | ) | (61 | ) | (202 | ) | (1,007 | ) | (44 | ) | (27 | ) |
| |
| |
| |
| |
| |
| |
| |
| | | | | |
| Net operating income | 10,688 | | – | | 551 | | 11,239 | | 118 | | 1,586 | | 12,943 | | 21 | | 14 | |
| Operating expenses | (4,979 | ) | – | | (291 | ) | (5,270 | ) | (73 | ) | (909 | ) | (6,252 | ) | (26 | ) | (17 | ) |
| |
| |
| |
| |
| |
| |
| |
| | | | | |
| Operating profit | 5,709 | | – | | 260 | | 5,969 | | 45 | | 677 | | 6,691 | | 17 | | 11 | |
| Income from associates | 288 | | – | | 9 | | 297 | | 1 | | 156 | | 454 | | 58 | | 53 | |
| |
| |
| |
| |
| |
| |
| |
| | | | | |
| Profit before tax | 5,997 | | – | | 269 | | 6,266 | | 46 | | 833 | | 7,145 | | 19 | | 13 | |
| |
| |
| |
| |
| |
| |
| |
| | | | | |
For footnotes, see page 143.
74
Back to Contents
Global Banking and Markets
Profit before tax
| | 2008 | | | 2007 | | | 2006 | | |
| | US$m | | | US$m | | | US$m | | |
| | | | | | | | | | |
| Net interest income | 8,541 | | | 4,430 | | | 3,168 | | |
| Net fee income | 4,291 | | | 4,901 | | | 3,718 | | |
| Trading income excluding net interest income | 157 | | | 3,503 | | | 4,890 | | |
| Net interest income/ (expense) on trading activities | 324 | | | (236 | ) | | (379 | ) | |
| Net trading income16 | 481 | | | 3,267 | | | 4,511 | | |
| Net income/(expense)from financial instruments designatedat fair value | (438 | ) | | (164 | ) | | 20 | | |
| Gains less losses from financial investments | (327 | ) | | 1,313 | | | 534 | | |
| Dividend income | 76 | | | 222 | | | 235 | | |
Net earned insurance premiums | 105 | | | 93 | | | 73 | | |
| Other operating income | 868 | | | 1,218 | | | 1,378 | | |
| |
| | |
| | |
| | |
| Total operating income | 13,597 | | | 15,280 | | | 13,637 | | |
| Net insurance claims17 | (79 | ) | | (70 | ) | | (62 | ) | |
| |
| | |
| | |
| | |
| Net operating income5 | 13,518 | | | 15,210 | | | 13,575 | | |
| Loan impairment (charges)/ recoveries and other credit risk provisions | (1,471 | ) | | (38 | ) | | 119 | | |
| |
| | |
| | |
| | |
| Net operating income | 12,047 | | | 15,172 | | | 13,694 | | |
| Total operating expenses | (9,092 | ) | | (9,358 | ) | | (7,991 | ) | |
| |
| | |
| | |
| | |
| Operating profit | 2,955 | | | 5,814 | | | 5,703 | | |
| Share of profit in associates and joint ventures | 528 | | | 307 | | | 103 | | |
| |
| | |
| | |
| | |
| Profit before tax | 3,483 | | | 6,121 | | | 5,806 | | |
| |
| | |
| | |
| | |
| By geographical region | | | | | | | | | |
| Europe | 195 | | | 2,527 | | | 2,304 | | |
| Hong Kong | 1,436 | | | 1,578 | | | 955 | | |
| Rest of Asia-Pacific | 3,786 | | | 2,464 | | | 1,649 | | |
| North America | (2,575 | ) | | (965 | ) | | 423 | | |
| Latin America | 641 | | | 517 | | | 475 | | |
| |
| | |
| | |
| | |
| | 3,483 | | | 6,121 | | | 5,806 | | |
| |
| | |
| | �� |
| | |
| | % | | | % | | | % | | |
| | | | | | | | | | |
| Share of HSBC’s profit before tax | 37.4 | | | 25.3 | | | 26.3 | | |
| Cost efficiency ratio | 67.3 | | | 61.5 | | | 58.9 | | |
For footnotes, see page 143.
| Strategic direction |
| | |
| In 2008, Global Banking and Markets continued to pursue its ‘emerging markets-led and financing-focused’ strategy, which was introduced in 2006 and fully implemented in 2007. HSBC’s strategy is to be a leading wholesale bank by: |
| | |
| – | utilising HSBC’s extensive distributionnetwork; |
| | |
| – | developing Global Banking and Markets’hub-and-spoke business model; and |
| | |
| – | continuing to build capabilities in major hubsto support the delivery of an advanced suiteof services to corporate, institutional andgovernment clients across the HSBC network. |
| | |
| Ensuring that this combination of product depth and distribution strength meets the needs of existing and new clients will allow Global Banking and Markets to achieve its strategic goals. |
| | |
| Financial performance in 2008 |
| | |
| • | Global Banking and Markets delivered apre-tax profit of US$3.5 billion, a decline ofUS$2.6 billion or 43 per cent compared with2007. Although credit trading was significantlyimpacted by the adverse market conditions,revenues in other core businesses grew stronglyin both developed and emerging markets. At constant exchange rates, total operatingexpenses were slightly below 2007 with aprogressive decline over the last four half-years. |
| | |
| • | Core businesses such as foreign exchange,Rates, Balance Sheet Management andfinancing and equity capital markets postedrecord revenues. |
| | |
| • | In 2008, some US$5.4 billion of write-downswere absorbed on legacy positions in credittrading, leveraged and acquisition financing andmonoline credit exposures. This compared withUS$2.1 billion of write-downs recorded in 2007. Results for 2008 included a US$529 million fairvalue gain on the widening of credit spreads onstructured liabilities. |
| | |
| • | In addition, because of an alleged fraud, HSBCwrote off the value of units in funds whichhad invested with Madoff Securities, andtook a charge against trading income ofUS$984 million in the equities business inDecember 2008. The units had been acquired inconnection with various financing transactionsentered into with institutional clients. |
75
Back to Contents
| H S B C H O L D I N G S P L C |
| |
| Report of the Directors: Operating and Financial Review(continued) |
| | |
| | |
| Customer groups > Global Banking and Markets |
Management view of total operating income
| | 2008 | | | 2007 | | | 2006 | | |
| | US$m | | | US$m | | | US$m | | |
| | | | | | | | | | |
| Global Markets18 | 2,676 | | | 5,720 | | | 6,059 | | |
| Credit | (5,502 | ) | | (1,319 | ) | | 931 | | |
| Rates | 2,033 | | | 1,291 | | | 1,207 | | |
| Foreign exchange | 3,842 | | | 2,178 | | | 1,552 | | |
| Equities | (64 | ) | | 1,177 | | | 721 | | |
| Securities services | 2,116 | | | 1,926 | | | 1,378 | | |
| Asset and structured finance | 251 | | | 467 | | | 270 | | |
| Global Banking | 5,718 | | | 4,190 | | | 3,388 | | |
| Financing and equity capital markets | 3,572 | | | 2,186 | | | 1,730 | | |
| Payments and cash management | 1,665 | | | 1,632 | | | 1,257 | | |
| Other transaction services | 481 | | | 372 | | | 401 | | |
| Balance Sheet Management | 3,618 | | | 1,226 | | | 713 | | |
| Global Asset Management | 934 | | | 1,336 | | | 1,061 | | |
| Principal Investments | (415 | ) | | 1,253 | | | 686 | | |
| Other19 | 1,066 | | | 1,555 | | | 1,730 | | |
| |
| | |
| | |
| | |
| Total operating income | 13,597 | | | 15,280 | | | 13,637 | | |
| |
| | |
| | |
| | |
Comparative information has been adjusted to reflect the current management view.
For footnotes, see page 143.
| • | Loan impairment charges and other credit riskprovisions of US$1.5 billion were higherthan in 2007, reflecting loan impairmentcharges resulting from the deteriorating creditenvironment, coupled with a relatively modestimpairment charge within the available-for-saleportfolio, taken through the income statementand detailed below. |
| | |
| • | Within the Group’s available-for-sale portfolio,continuing illiquidity in asset-backed securitiesmarkets led to further write-downs. However,due to the underlying credit quality and seniorityof the tranches held by HSBC, only a relativelymodest impairment charge of US$279 millionwas identified on securities with a nominalvalue of US$570 million and was taken to theincome statement. The expected cash flowimpairment on these securities wasUS$86 million. A further US$293 millionimpairment was absorbed by income noteholders who take the first loss on positionswithin the securities investment conduits(‘SIC’s) now consolidated in HSBC’s accounts.Further details on the SICs are provided onpages 174 to 179. |
| | Business highlights in 2008 |
| | |
| • | The success of Global Banking and Markets’two-year-old ‘emerging markets-led andfinancing-focused’ strategy was recognised bya number of key industry awards, including‘Sterling Bond House’, ‘Islamic Bond House’,‘Middle East Loan House’ and ‘Latin AmericaBond House’ inInternational FinancingReview; ‘Best Emerging Markets Bank’, ‘BestInvestment Bank in the Middle East’ and ‘BestDebt House in Europe’ inEuromoney; ‘BestBond House’ in Asia inFinanceAsia,AsiamoneyandThe Asset; ‘Bond House of the Year’ inLatin Finance; and ‘Emerging Markets Managerof the Year’ inEuropean Pensions. |
| | |
| • | In Global Markets, foreign exchange revenuesrose by 76 per cent to a record US$3.8 billiondue to increased market volatility and higherlevels of customer activity. While foreignexchange revenues rose in all regions,performance was notably strong in Europe,where revenues rose by 75 per centto US$1.4 billion, in the Rest of Asia-Pacificregion, and in North America, where revenuesmore than doubled. |
| | |
| • | The Rates business also reported recordrevenues, reflecting increased customer activityagainst a backdrop of greater market volatility. |
| | |
| • | Securities services revenues grew despite thelower interest rate environment, benefiting fromnew customer flows and additional businessfrom existing customers. Assets under custodydecreased by 34 per cent to US$3.6 trillion,driven by the downturn in the equity marketsand the net redemptions experienced across theindustry in the final quarter. |
| | |
| • | Growth in Global Banking was driven byimproved margins in the credit and lendingbusiness and substantial gains on credit defaultswap transactions in certain portfolios.Payments and cash management continued todeliver revenue growth, primarily due to stronggrowth in liability balances, although marginsnarrowed in the latter part of the year. |
| | |
| • | Balance Sheet Management income rose inEurope, Asia and North America, reflectingpositioning ahead of rate reductions by anumber of central banks. |
| | |
| • | In Principal Investments, markets remainedclosed for realisations and certain private equityholdings were marked down to reflect marketconditions. |
76
Back to Contents
| • | In Global Asset Management, althoughunderlying management fees remained strong,overall revenues fell, primarily due to the costsassociated with the provision of support tocertain money market funds. A fall in |
performance fees reflected a 20 per cent decrease in funds under management following recent equity market declines. Nevertheless, HSBC remained one of the leading emerging markets asset managers.
Reconciliation of reported and underlying profit before tax
| | 2008 compared with 2007 | |
| |
|
|
|
|
|
|
|
|
|
|
|
|
|
|
|
|
| |
| | | | 2007 | | | | | | | | | | | | | | | |
| | | | acquisitions, | | | | 2007 | | 2008 | | | | | | | | | |
| | 2007 | | disposals | | | | at 2008 | | acquisitions | | Under- | | 2008 | | Re- | | Under- | |
| | as | | & dilution | | Currency | | exchange | | and | | lying | | as | | ported | | lying | |
| | reported | | gains1 | | translation2 | | rates3 | | disposals1 | | change | | reported | | change | | change | |
| Global Banking andMarkets | US$m | | US$m | | US$m | | US$m | | US$m | | US$m | | US$m | | % | | % | |
| | | | | | | | | | | | | | | | | | | |
| Net interest income | 4,430 | | – | | (32 | ) | 4,398 | | – | | 4,143 | | 8,541 | | 93 | | 94 | |
| Net fee income | 4,901 | | – | | (46 | ) | 4,855 | | – | | (564 | ) | 4,291 | | (12 | ) | (12 | ) |
| Other income4 | 5,879 | | – | | (57 | ) | 5,822 | | – | | (5,136 | ) | 686 | | (88 | ) | (88 | ) |
| |
| |
| |
| |
| |
| |
| |
| | | | | |
| Net operating income5 | 15,210 | | – | | (135 | ) | 15,075 | | – | | (1,557 | ) | 13,518 | | (11 | ) | (10 | ) |
Loan impairment charges and other credit risk provisions | (38 | ) | – | | 1 | | (37 | ) | – | | (1,434 | ) | (1,471 | ) | (3,771 | ) | (3,876 | ) |
| |
| |
| |
| |
| |
| |
| |
| | | | | |
| Net operating income | 15,172 | | – | | (134 | ) | 15,038 | | – | | (2,991 | ) | 12,047 | | (21 | ) | (20 | ) |
| Operating expenses | (9,358 | ) | – | | 175 | | (9,183 | ) | – | | 91 | | (9,092 | ) | 3 | | 1 | |
| |
| |
| |
| |
| |
| |
| |
| | | | | |
| Operating profit | 5,814 | | – | | 41 | | 5,855 | | – | | (2,900 | ) | 2,955 | | (49 | ) | (50 | ) |
| Income from associates | 307 | | – | | 18 | | 325 | | – | | 203 | | 528 | | 72 | | 62 | |
| |
| |
| |
| |
| |
| |
| |
| | | | | |
| Profit before tax | 6,121 | | – | | 59 | | 6,180 | | – | | (2,697 | ) | 3,483 | | (43 | ) | (44 | ) |
| |
| |
| |
| |
| |
| |
| |
| | | | | |
| | 2007 compared with 2006 | |
| |
|
|
|
|
|
|
|
|
|
|
|
|
|
|
|
|
| |
| | | | | | | | | | 2007 | | | | | | | | | |
| | | | 2006 | | | | 2006 | | acquisitions, | | | | | | | | | |
| | 2006 | | acquisitions | | | | at 2007 | | disposals | | Under- | | 2007 | | Re- | | Under- | |
| | as | | and | | Currency | | exchange | | & dilution | | lying | | as | | ported | | lying | |
| | reported | | disposals1 | | translation2 | | rates6 | | gains1 | | change | | reported | | change | | change | |
| Global Banking andMarkets | US$m | | US$m | | US$m | | US$m | | US$m | | US$m | | US$m | | % | | % | |
| | | | | | | | | | | | | | | | | | | |
| Net interest income | 3,168 | | – | | 175 | | 3,343 | | 25 | | 1,062 | | 4,430 | | 40 | | 32 | |
| Net fee income | 3,718 | | – | | 182 | | 3,900 | | 9 | | 992 | | 4,901 | | 32 | | 25 | |
| Other income4 | 6,689 | | – | | 360 | | 7,049 | | 10 | | (1,180 | ) | 5,879 | | (12 | ) | (17 | ) |
| |
| |
| |
| |
| |
| |
| |
| | | | | |
| Net operating income5 | 13,575 | | – | | 717 | | 14,292 | | 44 | | 874 | | 15,210 | | 12 | | 6 | |
Loan impairment charges and other credit risk provisions | 119 | | – | | 6 | | 125 | | – | | (163 | ) | (38 | ) | (132 | ) | (130 | ) |
| |
| |
| |
| |
| |
| |
| |
| | | | | |
| Net operating income | 13,694 | | – | | 723 | | 14,417 | | 44 | | 711 | | 15,172 | | 11 | | 5 | |
| Operating expenses | (7,991 | ) | – | | (406 | ) | (8,397 | ) | (35 | ) | (926 | ) | (9,358 | ) | (17 | ) | (11 | ) |
| |
| |
| |
| |
| |
| |
| |
| | | | | |
| Operating profit | 5,703 | | – | | 317 | | 6,020 | | 9 | | (215 | ) | 5,814 | | 2 | | (4 | ) |
| Income from associates | 103 | | – | | (4 | ) | 99 | | 2 | | 206 | | 307 | | 198 | | 208 | |
| |
| |
| |
| |
| |
| |
| |
| | | | | |
| Profit before tax | 5,806 | | – | | 313 | | 6,119 | | 11 | | (9 | ) | 6,121 | | 5 | | – | |
| |
| |
| |
| |
| |
| |
| |
| | | | | |
For footnotes, see page 143.
77
Back to Contents
| H S B C H O L D I N G S P L C |
| |
| Report of the Directors: Operating and Financial Review(continued) |
| | |
| | |
| Customer groups > Global Banking and Markets / Private Banking |
Balance sheet data significant to Global Banking and Markets15
| | Year ended 31 December 2008 | |
| |
|
|
|
|
|
|
|
|
|
|
| |
| | | | | | Rest of | | | | | | | |
| | | | Hong | | Asia- | | North | | Latin | | | |
| | Europe | | Kong | | Pacific | | America | | America | | Total | |
| | US$m | | US$m | | US$m | | US$m | | US$m | | US$m | |
| | | | | | | | | | | | | |
| Trading assets20 | 281,089 | | 45,398 | | 19,606 | | 74,498 | | 5,004 | | 425,595 | |
| Derivative assets | 303,265 | | 26,989 | | 26,506 | | 125,848 | | 5,145 | | 487,753 | |
| Loans and advances to: | | | | | | | | | | | | |
| – customers (net) | 185,818 | | 23,042 | | 34,590 | | 35,583 | | 8,273 | | 287,306 | |
| – banks (net) | 49,508 | | 20,970 | | 26,710 | | 9,238 | | 12,574 | | 119,000 | |
| Financial investments20 | 105,546 | | 46,964 | | 37,346 | | 39,841 | | 8,179 | | 237,876 | |
| Total assets | 1,131,721 | | 225,853 | | 172,049 | | 318,139 | | 48,868 | | 1,896,630 | |
| Deposits by banks | 79,509 | | 11,509 | | 13,205 | | 16,244 | | 3,871 | | 124,338 | |
| Customer accounts | 199,687 | | 30,866 | | 50,605 | | 23,844 | | 15,384 | | 320,386 | |
| Trading liabilities | 144,759 | | 13,056 | | 3,687 | | 72,325 | | 2,546 | | 236,373 | |
| Derivative liabilities | 300,200 | | 28,536 | | 26,481 | | 122,699 | | 4,615 | | 482,531 | |
| | Year ended 31 December 2007 | |
| |
|
|
|
|
|
|
|
|
|
|
| |
| | | | | | Rest of | | | | | | | |
| | | | Hong | | Asia- | | North | | Latin | | | |
| | Europe | | Kong | | Pacific | | America | | America | | Total | |
| | | | | | | | | | | | | |
| Trading assets20 | 294,078 | | 26,877 | | 19,732 | | 93,395 | | 8,570 | | 442,652 | |
| Derivative assets | 102,409 | | 11,492 | | 10,234 | | 56,531 | | 1,814 | | 182,480 | |
| Loans and advances to: | | | | | | | | | | | | |
| – customers (net) | 163,066 | | 19,171 | | 32,106 | | 26,186 | | 9,935 | | 250,464 | |
| – banks (net) | 89,651 | | 53,725 | | 30,853 | | 14,938 | | 10,339 | | 199,506 | |
| Financial investments20 | 94,416 | | 46,765 | | 39,448 | | 33,273 | | 10,155 | | 224,057 | |
| Total assets | 892,712 | | 215,801 | | 155,106 | | 252,804 | | 45,045 | | 1,561,468 | |
| Deposits by banks | 85,315 | | 6,251 | | 17,174 | | 14,825 | | 2,830 | | 126,395 | |
| Customer accounts | 163,713 | | 37,364 | | 54,120 | | 30,732 | | 13,950 | | 299,879 | |
| Trading liabilities | 201,010 | | 15,939 | | 8,601 | | 73,081 | | 4,998 | | 303,629 | |
| Derivative liabilities | 104,687 | | 10,865 | | 9,656 | | 53,058 | | 1,986 | | 180,252 | |
| | Year ended 31 December 2006 | |
| |
|
|
|
|
|
|
|
|
|
|
| |
| | | | | | Rest of | | | | | | | |
| | | | Hong | | Asia- | | North | | Latin | | | |
| | Europe | | Kong | | Pacific | | America | | America | | Total | |
| | | | | | | | | | | | | |
| Trading assets20 | 165,116 | | 30,895 | | 14,726 | | 105,645 | | 7,575 | | 323,957 | |
| Derivative assets | 53,223 | | 6,259 | | 6,575 | | 32,357 | | 1,230 | | 99,644 | |
| Loans and advances to: | | | | | | | | | | | | |
| – customers (net) | 140,277 | | 20,270 | | 24,311 | | 17,215 | | 8,147 | | 210,220 | |
| – banks (net) | 63,788 | | 45,023 | | 22,171 | | 15,862 | | 9,704 | | 156,548 | |
| Financial investments20 | 54,009 | | 48,407 | | 20,890 | | 30,496 | | 8,169 | | 161,971 | |
| Total assets | 526,468 | | 182,540 | | 109,535 | | 203,639 | | 37,564 | | 1,059,746 | |
| Deposits by banks | 65,963 | | 4,363 | | 9,849 | | 9,664 | | 3,115 | | 92,954 | |
| Customer accounts | 139,416 | | 24,530 | | 36,623 | | 23,711 | | 11,685 | | 235,965 | |
| Trading liabilities | 97,015 | | 17,292 | | 6,243 | | 88,275 | | 4,898 | | 213,723 | |
| Derivative liabilities | 55,581 | | 6,376 | | 6,149 | | 32,148 | | 1,266 | | 101,520 | |
For footnotes, see page 143.
78
Back to Contents
Private Banking
Profit before tax
| | 2008 | | | 2007 | | | 2006 | | |
| | US$m | | | US$m | | | US$m | | |
| | | | | | | | | | |
| Net interest income | 1,612 | | | 1,216 | | | 1,011 | | |
| Net fee income | 1,476 | | | 1,615 | | | 1,323 | | |
Trading income excludingnet interest income | 408 | | | 525 | | | 362 | | |
Net interest incomeon trading activities | 14 | | | 9 | | | 2 | | |
| Net trading income16 | 422 | | | 534 | | | 364 | | |
Net income/(expense) from financial instrumentsdesignated at fair value | – | | | (1 | ) | | 1 | | |
| Gains less losses from financial investments | 64 | | | 119 | | | 166 | | |
| Dividend income | 8 | | | 7 | | | 5 | | |
| Other operating income | 49 | | | 58 | | | 61 | | |
| |
|
| |
|
| |
|
| |
| Total operating income | 3,631 | | | 3,548 | | | 2,931 | | |
| Net insurance claims17 | – | | | – | | | – | | |
| |
|
| |
|
| |
|
| |
| Net operating income5 | 3,631 | | | 3,548 | | | 2,931 | | |
Loan impairment chargesand other credit riskprovisions | (68 | ) | | (14 | ) | | (33 | ) | |
| |
|
| |
|
| |
|
| |
| Net operating income | 3,563 | | | 3,534 | | | 2,898 | | |
| Total operating expenses | (2,116 | ) | | (2,025 | ) | | (1,685 | ) | |
| |
|
| |
|
| |
|
| |
| Operating profit | 1,447 | | | 1,509 | | | 1,213 | | |
| Share of profit in associates and joint ventures | – | | | 2 | | | 1 | | |
| |
|
| |
|
| |
|
| |
| Profit before tax | 1,447 | | | 1,511 | | | 1,214 | | |
| |
|
| |
|
| |
|
| |
| By geographical region | | | | | | | | | |
| Europe | 998 | | | 915 | | | 805 | | |
| Hong Kong | 237 | | | 305 | | | 201 | | |
| Rest of Asia-Pacific | 113 | | | 92 | | | 80 | | |
| North America | 83 | | | 174 | | | 114 | | |
| Latin America | 16 | | | 25 | | | 14 | | |
| |
|
| |
|
| |
|
| |
| | 1,447 | | | 1,511 | | | 1,214 | | |
| |
|
| |
|
| |
|
| |
| |
| | % | | | % | | | % | | |
| Share of HSBC’s profitbefore tax | 15.6 | | | 6.2 | | | 5.5 | | |
| Cost efficiency ratio | 58.3 | | | 57.1 | | | 57.5 | | |
| | | | | | | | | | |
| Balance sheet data15 | | | | | | | | | |
| | US$m | | | US$m | | | US$m | | |
| Loans and advances to customers (net) | 37,590 | | | 43,612 | | | 34,297 | | |
| Total assets | 133,216 | | | 130,893 | | | 106,178 | | |
| Customer accounts | 116,683 | | | 106,197 | | | 80,303 | | |
| |
| | | | | | | | | | |
| For footnotes, see page 143. |
| Strategic direction |
| | |
| The strategy for Private Banking is to be the world’s leading international private bank, known for excellent client experience and global connections. |
| | |
| – | HSBC’s global network, strong capital positionand recognised brand provide a base from whichPrivate Banking attracts and retains clients andserves their complex international needs. It usesboth traditional and innovative ways ofmanaging and preserving the wealth of high networth individuals while optimising returns. |
| | |
| – | Private Banking has built a network of domesticand international operations that providediversified revenue streams, helped by productleadership in areas such as credit, hedge funds,emerging markets, investment advice and estateplanning. This is achieved by attracting,retaining and motivating talented individuals, byproviding close communication between clientsand staff, and by making targeted investments inIT, marketing and branding initiatives. |
| Financial performance in 2008 |
| | |
| • | Reported pre-tax profit fell by 4 per cent asclients moved progressively to a moreconservative investment stance in the turbulentmarkets. This trend was reflected in reducedtrading income in Asia, lower fee income inEurope and higher loan impairment charges andother credit risk provisions. By contrast, netinterest income grew strongly in Europe. On anunderlying basis, pre-tax profit decreased by3 per cent. |
| | |
| • | Net interest income rose by 34 per cent toUS$1.6 billion as a result of an increase incustomer deposit balances in Switzerland, theUK and Hong Kong as customers reduced riskin response to market turbulence, choosingHSBC for its strength and switching frominvestment securities to cash deposits. Spreadsimproved as interest rates declined sharply. |
| | |
| • | Net fee income decreased by 4 per cent toUS$1.5 billion, driven by a fall in funds undermanagement in all regions as a result of equitymarket declines and clients switching fromsecurities into cash deposits. Transactionvolumes also fell, particularly in the fourthquarter. |
79
Back to Contents
| H S B C H O L D I N G S P L C |
| |
| Report of the Directors: Operating and Financial Review(continued) |
| | |
| | |
| Customer groups > Private Banking |
| • | Trading income fell by 21 per cent toUS$422 million, driven by lower demand forstructured products in Asia following the declinein the Hong Kong stock market which led toclients preferring more stable cash deposits. Partly offsetting this was an increase in foreignexchange trading revenue in the volatilecurrency markets. |
| | |
| • | Gains less losses from financial investmentsdecreased by 47 per cent to US$64 million dueto lower gains from the disposal of HSBC’sresidual holding in the Hermitage Fund in 2008,compared with 2007. |
| | |
| • | Loan impairment charges and other credit riskprovisions increased by US$54 million toUS$68 million, primarily due to a loss on abond position in a failed US bank and higherprovisions on real estate-related products. |
| | |
| • | Operating expenses grew by 9 per cent toUS$2.1 billion, mainly due to the non-recurrence of a one-off pension-related creditrecognised in 2007. Staff numbers increased inAsia and Europe in late 2007 and the first halfof 2008, leading to higher costs, although thesereduced in the second half of the year. As aresult, the cost efficiency ratio worsened by1.9 percentage points to 58.3 per cent. |
Client assets
| | 2008 | | | 2007 | |
| | US$bn | | | US$bn | |
| | | | | | |
| At 1 January | 421 | | | 333 | |
| Net new money | 24 | | | 36 | |
| Value change | (71 | ) | | 19 | |
| Exchange and other | (22 | ) | | 33 | |
| |
|
| |
| |
| At 31 December | 352 | | | 421 | |
| |
|
| |
| |
Client assets by investment class
| | 2008 | | | 2007 | |
| | US$bn | | | US$bn | |
| | | | | | |
| Equities | 53 | | | 81 | |
| Bonds | 57 | | | 64 | |
| Structured products | 7 | | | 12 | |
| Funds | 87 | | | 123 | |
| Cash, fiduciary deposits and other | 148 | | | 141 | |
| |
| | |
| |
| | 352 | | | 421 | |
| |
|
| |
| |
| • | Reported client assets decreased by 16 per centto US$352 billion in 2008, due to the decline inequity market values in all regions. Net newmoney flows continued to be strong, particularlyin Europe, as clients were attracted by HSBC’sstrong capital base during the market turbulence.
However, reduced leverage had a US$5.9 billion |
| | effect on net new money flows compared with2007 and some outflows of client deposits wereexperienced in the fourth quarter following theintroduction of government guarantees to certaincompetitor banks. |
| | |
| • | Total client assets declined by 12 per cent on areported basis to US$433 billion, with net newmoney of US$30 billion. ‘Total client assets’ is ameasure equivalent to many industry definitionsof assets under management which includesome non-financial assets held in client trusts. |
Business highlights in 2008
| • | Inward referrals from other customer groups inHSBC resulted in US$6.8 billion of net newmoney compared with US$5.7 billion in 2007. |
| | |
| • | The proportion of trading volumes that weretransacted with Global Banking and Marketsincreased as more systems and processes wereconnected. |
| | |
| • | Investments in emerging markets continuedas Private Banking clients invested overUS$1 billion in various HSBC Private Equityand fund offerings. |
| | |
| • | TheEuromoney2009 Private Banking Surveyplaced HSBC Private Bank second overall in theGlobal Private Bank category, up from third in2008. HSBC Private Bank was also awarded‘Best Private Bank in Asia’ and ‘Best PrivateBank in the Middle East’. At the InternationalWealth Management Summit, HSBC won‘Outstanding Global Private Banker’ awarded tothe Global CEO of HSBC Private Bank, and‘Outstanding Private Bank’ in the Middle East. |
| | |
| • | In 2008, HSBC announced that it would mergeits two Swiss private banks under the HSBC
Private Bank brand. The merger is expected toresult in future strategic and cost benefits. |
| | |
| • | Following a comprehensive review in 2008,HSBC Private Bank launched a fresh imagecampaign in 2009, including the aim to be ‘Theworld’s private bank’ in alignment with theGroup’s recognised global brand strategy. Thelaunch was combined with a targeted advertisingand marketing campaign. |
| | |
| • | Offices in Guangzhou, Shanghai and Beijingwere formally opened as part of the launch ofPrivate Banking operations in mainland China. Preparations were also made for a launch ofdomestic operations in Russia in 2009. |
80
Back to Contents
Reconciliation of reported and underlying profit before tax
| | | | | | | | 2008 compared with 2007 | | | | | | | | | |
| |
|
|
|
|
|
|
|
|
|
|
|
|
|
|
| |
| | | | 2007 | | | | | | | | | | | | | | | |
| | | | acquisitions, | | | | 2007 | | 2008 | | | | | | | | | |
| | 2007 | | disposals | | | | at 2008 | | acquisitions | | | | 2008 | | | | | |
| | as | | & dilution | | Currency | | exchange | | and | | Underlying | | as | | Reported | | Underlying | |
| | reported | | gains1 | | translation2 | | rates3 | | disposals1 | | change | | reported | | change | | change | |
| Private Banking | US$m | | US$m | | US$m | | US$m | | US$m | | US$m | | US$m | | % | | % | |
| | | | | | | | | | | | | | | | | | | |
| Net interest income | 1,216 | | 1 | | (12 | ) | 1,205 | | – | | 407 | | 1,612 | | 33 | | 34 | |
| Net fee income | 1,615 | | (105 | ) | 26 | | 1,536 | | – | | (60 | ) | 1,476 | | (9 | ) | (4 | ) |
| Other income4 | 717 | | (18 | ) | 5 | | 704 | | – | | (161 | ) | 543 | | (24 | ) | (23 | ) |
| |
| |
| |
| |
| |
| |
| |
| | | | | |
| Net operating income5 | 3,548 | | (122 | ) | 19 | | 3,445 | | – | | 186 | | 3,631 | | 2 | | 5 | |
| Loan impairment charges and other credit risk provisions | (14 | ) | – | | – | | (14 | ) | – | | (54 | ) | (68 | ) | (386 | ) | (386 | ) |
| |
| |
| |
| |
| |
| |
| |
| | | | | |
| Net operating income | 3,534 | | (122 | ) | 19 | | 3,431 | | – | | 132 | | 3,563 | | 1 | | 4 | |
| Operating expenses | (2,025 | ) | 98 | | (17 | ) | (1,944 | ) | – | | (172 | ) | (2,116 | ) | (4 | ) | (9 | ) |
| |
| |
| |
| |
| |
| |
| |
| | | | | |
| Operating profit | 1,509 | | (24 | ) | 2 | | 1,487 | | – | | (40 | ) | 1,447 | | (4 | ) | (3 | ) |
| Income from associates | 2 | | – | | – | | 2 | | – | | (2 | ) | – | | (100 | ) | (100 | ) |
| |
|
|
| |
| |
| |
| |
| |
| | | | | |
| Profit before tax | 1,511 | | (24 | ) | 2 | | 1,489 | | – | | (42 | ) | 1,447 | | (4 | ) | (3 | ) |
| |
| |
| |
| |
| |
| |
| |
| | | | | |
| | | | | | | | 2007 compared with 2006 | | | | | | | | | |
| |
|
|
|
|
|
|
|
|
|
|
|
|
|
|
| |
| | | | | | | | | | 2007 | | | | | | | | | |
| | | | 2006 | | | | 2006 | | acquisitions, | | | | | | | | | |
| | 2006 | | acquisitions | | | | at 2007 | | disposals | | | | 2007 | | | | | |
| | as | | and | | Currency | | exchange | | & dilution | | Underlying | | as | | Reported | | Underlying | |
| | reported | | disposals1 | | translation2 | | rates6 | | gains1 | | change | | reported | | change | | change | |
| Private Banking | US$m | | US$m | | US$m | | US$m | | US$m | | US$m | | US$m | | % | | % | |
| | | | | | | | | | | | | | | | | | | |
| Net interest income | 1,011 | | – | | 24 | | 1,035 | | 2 | | 179 | | 1,216 | | 20 | | 17 | |
| Net fee income | 1,323 | | – | | 32 | | 1,355 | | 4 | | 256 | | 1,615 | | 22 | | 19 | |
| Other income4 | 597 | | – | | 7 | | 604 | | 1 | | 112 | | 717 | | 20 | | 19 | |
| |
| |
| |
| |
| |
| |
| |
| | | | | |
| Net operating income5 | 2,931 | | – | | 63 | | 2,994 | | 7 | | 547 | | 3,548 | | 21 | | 18 | |
| Loan impairment charges and other credit risk provisions | (33 | ) | – | | – | | (33 | ) | – | | 19 | | (14 | ) | 58 | | 58 | |
| |
| |
| |
| |
| |
| |
| |
| | | | | |
| Net operating income | 2,898 | | – | | 63 | | 2,961 | | 7 | | 566 | | 3,534 | | 22 | | 19 | |
| Operating expenses | (1,685 | ) | – | | (40 | ) | (1,725 | ) | (4 | ) | (296 | ) | (2,025 | ) | (20 | ) | (17 | ) |
| |
| |
| |
| |
| |
| |
| |
| | | | | |
| Operating profit | 1,213 | | – | | 23 | | 1,236 | | 3 | | 270 | | 1,509 | | 24 | | 22 | |
| Income from associates | 1 | | – | | – | | 1 | | – | | 1 | | 2 | | 100 | | 100 | |
| |
| |
| |
| |
| |
| |
| |
| | | | | |
| Profit before tax | 1,214 | | – | | 23 | | 1,237 | | 3 | | 271 | | 1,511 | | 24 | | 22 | |
| |
| |
| |
| |
| |
| |
| |
| | | | | |
| For footnotes, see page 143. |
|
81
Back to Contents
| H S B C H O L D I N G S P L C |
| |
| Report of the Directors: Operating and Financial Review(continued) |
| | |
| | |
| Customer groups > Other |
Other
Profit/(loss) before tax
| | 2008 | | | 2007 | | | 2006 | |
| | US$m | | | US$m | | | US$m | |
| | | | | | | | | |
| Net interest expense | (956 | ) | | (542 | ) | | (625 | ) |
| Net fee income/(expense) | 53 | | | (228 | ) | | 172 | |
| Trading income/(expense) excluding net interest income | (262 | ) | | 127 | | | (228 | ) |
| Net interest income/(expense) on trading activities | (268 | ) | | (1 | ) | | 82 | |
| Net trading income/(expense)16 | (530 | ) | | 126 | | | (146 | ) |
| Changes in fair value of long-term debt issued and related derivatives | 6,679 | | | 2,812 | | | (35 | ) |
| Net income/(expense) from other financial instruments designated at fair value | 747 | | | 81 | | | (46 | ) |
| Net income/(expense) from financial instruments designated at fair value | 7,426 | | | 2,893 | | | (81 | ) |
| Gains less losses from financial investments | (396 | ) | | 83 | | | 147 | |
| Gains arising from dilution of interests in associates | – | | | 1,092 | | | – | |
| Dividend income | 10 | | | 32 | | | 63 | |
| Net earned insurance premiums | (17 | ) | | (21 | ) | | 207 | |
| Gains on disposal of French regional banks | 2,445 | | | – | | | – | |
| Other operating income | 4,261 | | | 3,523 | | | 3,254 | |
| |
| | |
| | |
| |
| Total operating income | 12,296 | | | 6,958 | | | 2,991 | |
| Net insurance claims17 | (1 | ) | | – | | | (181 | ) |
| |
| | |
| | |
| |
| Net operating income5 | 12,295 | | | 6,958 | | | 2,810 | |
| Loan impairment charges and other credit risk provisions | (5 | ) | | (11 | ) | | (13 | ) |
| |
| | |
| | |
| |
| Net operating income | 12,290 | | | 6,947 | | | 2,797 | |
| Total operating expenses | (4,174 | ) | | (3,562 | ) | | (3,259 | ) |
| |
| | |
| | |
| |
| Operating profit/(loss) | 8,116 | | | 3,385 | | | (462 | ) |
| Share of profit in joint ventures and associates | 41 | | | 150 | | | 74 | |
| |
| | |
| | |
| |
| Profit/(loss) before tax | 8,157 | | | 3,535 | | | (388 | ) |
| |
| | |
| | |
| |
| By geographical region | | | | | | | | |
| Europe | 5,296 | | | 1,056 | | | (278 | ) |
| Hong Kong | (955 | ) | | (375 | ) | | (175 | ) |
| Rest of Asia-Pacific | 276 | | | 1,343 | | | 287 | |
| North America | 3,534 | | | 1,508 | | | (217 | ) |
| Latin America | 6 | | | 3 | | | (5 | ) |
| |
| | |
| | |
| |
| | 8,157 | | | 3,535 | | | (388 | ) |
| |
| | |
| | |
| |
| | % | | | % | | | % | |
| | | | | | | | | |
| Share of HSBC’s profit before tax | 87.6 | | | 14.6 | | | (1.8 | ) |
| Cost efficiency ratio | 33.9 | | | 51.2 | | | 116.0 | |
| | | | | | | | | |
| For footnotes, see page 143. | | | | | | | | |
Notes
| • | Reported profit before tax in Other wasUS$8.2 billion, compared with US$3.5 billionin 2007. For a description of the main itemsreported under ‘Other’, see footnote 14 on page143. |
| | |
| • | Net income from financial instrumentsdesignated at fair value amounted toUS$7.4 billion in 2008, compared withUS$2.9 billion in 2007. This largely related tofair value gains on own debt issued by HSBC Holdings and its North American and Europeansubsidiaries and resulted primarily from thewidening of credit spreads. These gains willreverse over the life of the debt. |
| | |
| • | A loss of US$396 million reported in ‘Gains lesslosses from financial investments’ includedimpairments related to non-trading strategicequity investments, classified as available forsale, following significant declines in equitymarket prices. These investments were primarilyin Asian financial services companies which areheld for the long term. |
| | |
| • | In 2007, the results included dilution gains ofUS$1.1 billion following share offerings madeby HSBC’s associates, Ping An Insurance, Bankof Communications and Industrial Bank inmainland China, Financiera Independencia inMexico and Techcombank in Vietnam. |
| | |
| • | Other gains included a US$2.4 billion pre-taxprofit from the sale of seven regional banks inFrance. |
| | |
| • | HSBC recognised a gain of US$416 million inrespect of the purchase of the subsidiary ofMetrovacesa which owned the property andlong leasehold land comprising 8 CanadaSquare, London. See Note 23 on the FinancialStatements for further details. |
| | |
| • | HSBC continued to increase the scope ofactivities undertaken at its Group ServiceCentres (‘GSCs’) which are accounted forwithin Other. Employee numbers increasedaccordingly and an additional GSC was openedwhich, together, contributed to a rise inoperating expenses. In North America, costs atthe IT Service Centres declined in line withreduced operations in the region. Substantiallyall service centre costs are recharged to HSBC’scustomer groups and reported under ‘Otheroperating income’. |
82
Back to Contents
Balance sheet data15
| | 2008 | | 2007 | | 2006 | |
| | US$m | | US$m | | US$m | |
| | | | | | | |
| Loans and advances to customers (net) | 2,621 | | 2,678 | | 2,095 | |
| Total assets | 135,001 | | 155,685 | | 137,291 | |
| Customer accounts | 2,041 | | 2,006 | | 1,245 | |
Reconciliation of reported and underlying profit/(loss) before tax
| | | | | | | | 2008 compared with 2007 | | | | | | | | | |
| |
|
|
|
|
|
|
|
|
|
|
|
|
|
|
| |
| | | | 2007 | | | | | | | | | | | | | | | |
| | | | acquisitions, | | | | 2007 | | 2008 | | | | | | | | | |
| | 2007 | | disposals | | | | at 2008 | | acquisitions | | | | 2008 | | | | | |
| | as | | & dilution | | Currency | | exchange | | and | | Underlying | | as | | Reported | | Underlying | |
| | reported | | gains1 | | translation2 | | rates3 | | disposals1 | | change | | reported | | change | | change | |
| Other | US$m | | US$m | | US$m | | US$m | | US$m | | US$m | | US$m | | % | | % | |
| | | | | | | | | | | | | | | | | | | |
| Net interest expense | (542 | ) | – | | (38 | ) | (580 | ) | (6 | ) | (370 | ) | (956 | ) | (76 | ) | (64 | ) |
| (Net fee income/(expense) | (228 | ) | – | | 49 | | (179 | ) | – | | 232 | | 53 | | 123 | | 130 | |
| Other income4 | 7,728 | | (1,116 | ) | 36 | | 6,648 | | 2,540 | | 4,010 | | 13,198 | | 71 | | 60 | |
| |
| |
| |
| |
| |
| |
| |
| | | | | |
| Net operating income5 | 6,958 | | (1,116 | ) | 47 | | 5,889 | | 2,534 | | 3,872 | | 12,295 | | 77 | | 66 | |
| Loan impairment charges and other credit risk provisions | (11 | ) | 24 | | 1 | | 14 | | – | | (19 | ) | (5 | ) | 55 | | (136 | ) |
| |
| |
| |
| |
| |
| |
| |
| | | | | |
| Net operating income | 6,947 | | (1,092 | ) | 48 | | 5,903 | | 2,534 | | 3,853 | | 12,290 | | 77 | | 65 | |
| Operating expenses | (3,562 | ) | – | | (15 | ) | (3,577 | ) | 6 | | (603 | ) | (4,174 | ) | (17 | ) | (17 | ) |
| |
| |
| |
| |
| |
| |
| |
| | | | | |
| Operating profit | 3,385 | | (1,092 | ) | 33 | | 2,326 | | 2,540 | | 3,250 | | 8,116 | | 140 | | 140 | |
| Income from associates | 150 | | (12 | ) | 11 | | 149 | | – | | (108 | ) | 41 | | (73 | ) | (72 | ) |
| |
| |
| |
| |
| |
| |
| |
| | | | | |
| Profit before tax | 3,535 | | (1,104 | ) | 44 | | 2,475 | | 2,540 | | 3,142 | | 8,157 | | 131 | | 127 | |
| |
| |
| |
| |
| |
| |
| |
| | | | | |
| | | | | | | | 2007 compared with 2006 | | | | | | | | | |
| |
|
|
|
|
|
|
|
|
|
|
|
|
|
|
| |
| | | | | | | | | | 2007 | | | | | | | | | |
| | | | 2006 | | | | 2006, | | acquisitions | | | | | | | | | |
| | 2006 | | acquisitions | | | | at 2007 | | disposals | | | | 2007 | | | | | |
| | as | | and | | Currency | | exchange | | & dilution | | Underlying | | as | | Reported | | Underlying | |
| | reported | | disposals1 | | translation2 | | rates6 | | gains1 | | change | | reported | | change | | change | |
| Other | US$m | | US$m | | US$m | | US$m | | US$m | | US$m | | US$m | | % | | % | |
| | | | | | | | | | | | | | | | | | | |
| Net interest income | (625 | ) | – | | (22 | ) | (647 | ) | – | | 105 | | (542 | ) | 13 | | 16 | |
| Net fee income | 172 | | – | | 25 | | 197 | | – | | (425 | ) | (228 | ) | (233 | ) | (216 | ) |
| Other income4 | 3,263 | | – | | 77 | | 3,340 | | 1,092 | | 3,296 | | 7,728 | | 137 | | 99 | |
| |
| |
| |
| |
| |
| |
| |
| | | | | |
| Net operating income5 | 2,810 | | – | | 80 | | 2,890 | | 1,092 | | 2,976 | | 6,958 | | 148 | | 103 | |
| Loan impairment charges and other credit risk provisions | (13 | ) | – | | 3 | | (10 | ) | – | | (1 | ) | (11 | ) | 15 | | (10 | ) |
| |
| |
| |
| |
| |
| |
| |
| | | | | |
| Net operating income | 2,797 | | – | | 83 | | 2,880 | | 1,092 | | 2,975 | | 6,947 | | 148 | | 103 | |
| Operating expenses | (3,259 | ) | – | | (90 | ) | (3,349 | ) | – | | (213 | ) | (3,562 | ) | (9 | ) | (6 | ) |
| |
| |
| |
| |
| |
| |
| |
| | | | | |
| Operating profit/(loss) | (462 | ) | – | | (7 | ) | (469 | ) | 1,092 | | 2,762 | | 3,385 | | 833 | | 589 | |
| Income from associates | 74 | | – | | 2 | | 76 | | (50 | ) | 124 | | 150 | | 103 | | 163 | |
| |
| |
| |
| |
| |
| |
| |
| | | | | |
| Profit/(loss) before tax | (388 | ) | – | | (5 | ) | (393 | ) | 1,042 | | 2,886 | | 3,535 | | 1,011 | | 734 | |
| |
| |
| |
| |
| |
| |
| |
| | | | | |
| For footnotes, see page 143. |
83
Back to Contents
| H S B C H O L D I N G S P L C |
| |
| Report of the Directors: Operating and Financial Review(continued) |
| | |
| | |
Customer groups > Profit/(loss) before tax |
Analysis by customer group and global business
Profit/(loss) before tax
| | 2008 | | |
| |
|
|
|
|
|
|
|
|
|
|
|
|
|
|
|
|
|
|
|
|
|
| | Personal | | | | | | Global | | | | | | | | | Inter- | | | | | |
| | Financial | | | Commercial | | | Banking & | | | Private | | | | | | segment | | | | | |
| | Services | | | Banking | | | Markets | | | Banking | | | Other | 14 | | elimination | 21 | | Total | | |
| Total | US$m | | | US$m | | | US$m | | | US$m | | | US$m | | | US$m | | | US$m | | |
| | | | | | | | | | | | | | | | | | | | | | |
| Net interest income/(expense) | 29,419 | | | 9,494 | | | 8,541 | | | 1,612 | | | (956 | ) | | (5,547 | ) | | 42,563 | | |
| Net fee income | 10,107 | | | 4,097 | | | 4,291 | | | 1,476 | | | 53 | | | – | | | 20,024 | | |
| Trading income/(expense) excluding net interest income | 175 | | | 369 | | | 157 | | | 408 | | | (262 | ) | | – | | | 847 | | |
| Net interest income/(expense) on trading activities | 79 | | | 17 | | | 324 | | | 14 | | | (268 | ) | | 5,547 | | | 5,713 | | |
| Net trading income/(expense)16 | 254 | | | 386 | | | 481 | | | 422 | | | (530 | ) | | 5,547 | | | 6,560 | | |
| Changes in fair value of long-term debt issued and related derivatives | – | | | – | | | – | | | – | | | 6,679 | | | – | | | 6,679 | | |
| Net income/(expense) from other financial instruments designated at fair value | (2,912 | ) | | (224 | ) | | (438 | ) | | – | | | 747 | | | – | | | (2,827 | ) | |
| Net income/(expense) from financial instruments designated at fair value | (2,912 | ) | | (224 | ) | | (438 | ) | | – | | | 7,426 | | | – | | | 3,852 | | |
| Gains less losses from financial investments | 663 | | | 193 | | | (327 | ) | | 64 | | | (396 | ) | | – | | | 197 | | |
| Dividend income | 90 | | | 88 | | | 76 | | | 8 | | | 10 | | | – | | | 272 | | |
| Net earned insurance premiums | 10,083 | | | 679 | | | 105 | | | – | | | (17 | ) | | – | | | 10,850 | | |
| Gains on disposal of French regional banks | – | | | – | | | – | | | – | | | 2,445 | | | – | | | 2,445 | | |
| Other operating income | 259 | | | 939 | | | 868 | | | 49 | | | 4,261 | | | (4,568 | ) | | 1,808 | | |
| |
| | |
| | |
| | |
| | |
| | |
| | |
| | |
| Total operating income | 47,963 | | | 15,652 | | | 13,597 | | | 3,631 | | | 12,296 | | | (4,568 | ) | | 88,571 | | |
| Net insurance claims17 | (6,474 | ) | | (335 | ) | | (79 | ) | | – | | | (1 | ) | | – | | | (6,889 | ) | |
| |
| | |
| | |
| | |
| | |
| | |
| | |
| | |
| Net operating income5 | 41,489 | | | 15,317 | | | 13,518 | | | 3,631 | | | 12,295 | | | (4,568 | ) | | 81,682 | | |
| Loan impairment charges and other credit risk provisions | (21,220 | ) | | (2,173 | ) | | (1,471 | ) | | (68 | ) | | (5 | ) | | – | | | (24,937 | ) | |
| |
| | |
| | |
| | |
| | |
| | |
| | |
| | |
| Net operating income | 20,269 | | | 13,144 | | | 12,047 | | | 3,563 | | | 12,290 | | | (4,568 | ) | | 56,745 | | |
| Operating expenses (excluding goodwill impairment) | (21,140 | ) | | (6,581 | ) | | (9,092 | ) | | (2,116 | ) | | (4,174 | ) | | 4,568 | | | (38,535 | ) | |
| Goodwill impairment | (10,564 | ) | | – | | | – | | | – | | | – | | | – | | | (10,564 | ) | |
| |
| | |
| | |
| | |
| | |
| | |
| | |
| | |
| Operating profit/(loss) | (11,435 | ) | | 6,563 | | | 2,955 | | | 1,447 | | | 8,116 | | | – | | | 7,646 | | |
| Share of profit in associates and joint ventures | 461 | | | 631 | | | 528 | | | – | | | 41 | | | – | | | 1,661 | | |
| |
| | |
| | |
| | |
| | |
| | |
| | |
| | |
| Profit/(loss) before tax | (10,974 | ) | | 7,194 | | | 3,483 | | | 1,447 | | | 8,157 | | | – | | | 9,307 | | |
| |
| | |
| | |
| | |
| | |
| | |
| | |
| | |
| | | | | | | | | | | | | | | | | | | | | | |
| | % | | | % | | | % | | | % | | | % | | | | | | % | | |
| Share of HSBC’s profit before tax | (117.9 | ) | | 77.3 | | | 37.4 | | | 15.6 | | | 87.6 | | | | | | 100.0 | | |
| Cost efficiency ratio | 76.4 | | | 43.0 | | | 67.3 | | | 58.3 | | | 33.9 | | | | | | 60.1 | | |
| | | | | | | | | | | | | | | | | | | | | | |
| | US$m | | | US$m | | | US$m | | | US$m | | | US$m | | | | | | US$m | | |
| Balance sheet data15 | | | | | | | | | | | | | | | | | | | | | |
| Loans and advances to customers (net) | 401,402 | | | 203,949 | | | 287,306 | | | 37,590 | | | 2,621 | | | | | | 932,868 | | |
| Total assets | 514,419 | | | 249,218 | | | 1,896,630 | | | 133,216 | | | 135,001 | | | (401,019 | ) | | 2,527,465 | | |
| Customer accounts | 440,338 | | | 235,879 | | | 320,386 | | | 116,683 | | | 2,041 | | | | | | 1,115,327 | | |
| | | | | | | | | | | | | | | | | | | | | | |
| For footnotes, see page 143. | | | | | | | | | | | | | | | | | | | | | |
84
Back to Contents
| | 2007 | | |
| |
|
|
|
|
|
|
|
|
|
|
|
|
|
|
|
|
|
|
|
|
|
| | Personal | | | | | | Global | | | | | | | | | Inter- | | | | | |
| | Financial | | | Commercial | | | Banking & | | | Private | | | | | | segment | | | | | |
| | Services | | | Banking | | | Markets | | | Banking | | | Other | 14 | | elimination | 21 | | Total | | |
| Total | US$m | | | US$m | | | US$m | | | US$m | | | US$m | | | US$m | | | US$m | | |
| | | | | | | | | | | | | | | | | | | | | | |
| Net interest income/(expense) | 29,069 | | | 9,055 | | | 4,430 | | | 1,216 | | | (542 | ) | | (5,433 | ) | | 37,795 | | |
| Net fee income/(expense) | 11,742 | | | 3,972 | | | 4,901 | | | 1,615 | | | (228 | ) | | – | | | 22,002 | | |
| Trading income excluding net interest income | 38 | | | 265 | | | 3,503 | | | 525 | | | 127 | | | – | | | 4,458 | | |
| Net interest income/(expense) on trading activities | 140 | | | 31 | | | (236 | ) | | 9 | | | (1 | ) | | 5,433 | | | 5,376 | | |
| Net trading income16 | 178 | | | 296 | | | 3,267 | | | 534 | | | 126 | | | 5,433 | | | 9,834 | | |
| Changes in fair value of long-term debt issued and related derivatives | – | | | – | | | – | | | – | | | 2,812 | | | – | | | 2,812 | | |
| Net income/(expense) from other financial instruments designated at fair value | 1,333 | | | 22 | | | (164 | ) | | (1 | ) | | 81 | | | – | | | 1,271 | | |
| Net income/(expense) from financial instruments designated at fair value | 1,333 | | | 22 | | | (164 | ) | | (1 | ) | | 2,893 | | | – | | | 4,083 | | |
| Gains less losses from financial investments | 351 | | | 90 | | | 1,313 | | | 119 | | | 83 | | | – | | | 1,956 | | |
| Gains arising from dilution of interests in associates | – | | | – | | | – | | | – | | | 1,092 | | | – | | | 1,092 | | |
| Dividend income | 55 | | | 8 | | | 222 | | | 7 | | | 32 | | | – | | | 324 | | |
| Net earned insurance premiums . | 8,271 | | | 733 | | | 93 | | | – | | | (21 | ) | | – | | | 9,076 | | |
| Other operating income | 387 | | | 165 | | | 1,218 | | | 58 | | | 3,523 | | | (3,912 | ) | | 1,439 | | |
| |
| | |
| | |
| | |
| | |
| | |
| | |
| | |
| Total operating income | 51,386 | | | 14,341 | | | 15,280 | | | 3,548 | | | 6,958 | | | (3,912 | ) | | 87,601 | | |
| Net insurance claims17 | (8,147 | ) | | (391 | ) | | (70 | ) | | – | | | – | | | – | | | (8,608 | ) | |
| |
| | |
| | |
| | |
| | |
| | |
| | |
| | |
| Net operating income5 | 43,239 | | | 13,950 | | | 15,210 | | | 3,548 | | | 6,958 | | | (3,912 | ) | | 78,993 | | |
| Loan impairment charges and other credit risk provisions | (16,172 | ) | | (1,007 | ) | | (38 | ) | | (14 | ) | | (11 | ) | | – | | | (17,242 | ) | |
| |
| | |
| | |
| | |
| | |
| | |
| | |
| | |
| Net operating income | 27,067 | | | 12,943 | | | 15,172 | | | 3,534 | | | 6,947 | | | (3,912 | ) | | 61,751 | | |
| Total operating expenses | (21,757 | ) | | (6,252 | ) | | (9,358 | ) | | (2,025 | ) | | (3,562 | ) | | 3,912 | | | (39,042 | ) | |
| |
| | |
| | |
| | |
| | |
| | |
| | |
| | |
| Operating profit | 5,310 | | | 6,691 | | | 5,814 | | | 1,509 | | | 3,385 | | | – | | | 22,709 | | |
| Share of profit in associates and joint ventures | 590 | | | 454 | | | 307 | | | 2 | | | 150 | | | – | | | 1,503 | | |
| |
| | |
| | |
| | |
| | |
| | |
| | |
| | |
| Profit before tax | 5,900 | | | 7,145 | | | 6,121 | | | 1,511 | | | 3,535 | | | – | | | 24,212 | | |
| |
| | |
| | |
| | |
| | |
| | |
| | |
| | |
| | | | | | | | | | | | | | | | | | | | | | |
| | % | | | % | | | % | | | % | | | % | | | | | | % | | |
| | | | | | | | | | | | | | | | | | | | | | |
| Share of HSBC’s profit before tax | 24.4 | | | 29.5 | | | 25.3 | | | 6.2 | | | 14.6 | | | | | | 100.0 | | |
| Cost efficiency ratio | 50.3 | | | 44.8 | | | 61.5 | | | 57.1 | | | 51.2 | | | | | | 49.4 | | |
| | | | | | | | | | | | | | | | | | | | | | |
| | US$m | | | US$m | | | US$m | | | US$m | | | US$m | | | | | | US$m | | |
| Balance sheet data15 | | | | | | | | | | | | | | | | | | | | | |
| Loans and advances to customers (net) | 464,726 | | | 220,068 | | | 250,464 | | | 43,612 | | | 2,678 | | | | | | 981,548 | | |
| Total assets | 621,356 | | | 307,944 | | | 1,561,468 | | | 130,893 | | | 155,685 | | | (423,080 | ) | | 2,354,266 | | |
| Customer accounts | 450,071 | | | 237,987 | | | 299,879 | | | 106,197 | | | 2,006 | | | | | | 1,096,140 | | |
| | | | | | | | | | | | | | | | | | | | | | |
| For footnotes, see page 143. | | | | | | | | | | | | | | | | | | | | | |
85
Back to Contents
| H S B C H O L D I N G S P L C |
| |
| Report of the Directors: Operating and Financial Review(continued) |
| | |
| | |
Customer groups > Profit/(loss) before tax // Geographical regions > Summary |
Profit/(loss) before tax (continued)
| | 2006 | | |
| |
|
|
|
|
|
|
|
|
|
|
|
|
|
|
|
|
|
|
|
|
|
| | Personal | | | | | | Global | | | | | | | | | Inter- | | | | | |
| | Financial | | | Commercial | | | Banking & | | | Private | | | | | | segment | | | | | |
| | Services | | | Banking | | | Markets | | | Banking | | | Other | 14 | | elimination | 21 | | Total | | |
| Total | US$m | | | US$m | | | US$m | | | US$m | | | US$m | | | US$m | | | US$m | | |
| | | | | | | | | | | | | | | | | | | | | | |
| Net interest income/(expense) | 26,076 | | | 7,514 | | | 3,168 | | | 1,011 | | | (625 | ) | | (2,658 | ) | | 34,486 | | |
| Net fee income | 8,762 | | | 3,207 | | | 3,718 | | | 1,323 | | | 172 | | | – | | | 17,182 | | |
| Trading income/(expense) excluding net interest income . | 391 | | | 204 | | | 4,890 | | | 362 | | | (228 | ) | | – | | | 5,619 | | |
| Net interest income/ (expense) on trading activities | 220 | | | 20 | | | (379 | ) | | 2 | | | 82 | | | 2,658 | | | 2,603 | | |
| Net trading income/(expense)16 | 611 | | | 224 | | | 4,511 | | | 364 | | | (146 | ) | | 2,658 | | | 8,222 | | |
| Changes in fair value of long-term debt issued and related derivatives | – | | | – | | | – | | | – | | | (35 | ) | | – | | | (35 | ) | |
| Net income/(expense) from other financial instruments designated at fair value | 739 | | | (22 | ) | | 20 | | | 1 | | | (46 | ) | | – | | | 692 | | |
| Net income/(expense) from financial instruments designated at fair value | 739 | | | (22 | ) | | 20 | | | 1 | | | (81 | ) | | – | | | 657 | | |
| Gains less losses from financial investments | 78 | | | 44 | | | 534 | | | 166 | | | 147 | | | – | | | 969 | | |
| Dividend income | 31 | | | 6 | | | 235 | | | 5 | | | 63 | | | – | | | 340 | | |
| Net earned insurance premiums | 5,130 | | | 258 | | | 73 | | | – | | | 207 | | | – | | | 5,668 | | |
| Other operating income | 782 | | | 250 | | | 1,378 | | | 61 | | | 3,254 | | | (3,179 | ) | | 2,546 | | |
| |
| | |
| | |
| | |
| | |
| | |
| | |
| | |
| Total operating income | 42,209 | | | 11,481 | | | 13,637 | | | 2,931 | | | 2,991 | | | (3,179 | ) | | 70,070 | | |
| Net insurance claims17 | (4,365 | ) | | (96 | ) | | (62 | ) | | – | | | (181 | ) | | – | | | (4,704 | ) | |
| |
| | |
| | |
| | |
| | |
| | |
| | |
| | |
| Net operating income5 | 37,844 | | | 11,385 | | | 13,575 | | | 2,931 | | | 2,810 | | | (3,179 | ) | | 65,366 | | |
| Loan impairment (charges)/recoveries and other credit risk provisions | (9,949 | ) | | (697 | ) | | 119 | | | (33 | ) | | (13 | ) | | – | | | (10,573 | ) | |
| |
| | |
| | |
| | |
| | |
| | |
| | |
| | |
| Net operating income | 27,895 | | | 10,688 | | | 13,694 | | | 2,898 | | | 2,797 | | | (3,179 | ) | | 54,793 | | |
| Total operating expenses | (18,818 | ) | | (4,979 | ) | | (7,991 | ) | | (1,685 | ) | | (3,259 | ) | | 3,179 | | | (33,553 | ) | |
| |
| | |
| | |
| | |
| | |
| | |
| | |
| | |
| Operating profit/(loss) | 9,077 | | | 5,709 | | | 5,703 | | | 1,213 | | | (462 | ) | | – | | | 21,240 | | |
| Share of profit in associates and joint ventures | 380 | | | 288 | | | 103 | | | 1 | | | 74 | | | – | | | 846 | | |
| |
| | |
| | |
| | |
| | |
| | |
| | |
| | |
| Profit/(loss) before tax | 9,457 | | | 5,997 | | | 5,806 | | | 1,214 | | | (388 | ) | | – | | | 22,086 | | |
| |
| | |
| | |
| | |
| | |
| | |
| | |
| | |
| | | | | | | | | | | | | | | | | | | | | | |
| | % | | | % | | | % | | | % | | | % | | | | | | % | | |
| | | | | | | | | | | | | | | | | | | | | | |
| Share of HSBC’s profit before tax | 42.8 | | | 27.2 | | | 26.3 | | | 5.5 | | | (1.8 | ) | | | | | 100.0 | | |
| Cost efficiency ratio | 49.7 | | | 43.7 | | | 58.9 | | | 57.5 | | | 116.0 | | | | | | 51.3 | | |
| | | | | | | | | | | | | | | | | | | | | | |
| | US$m | | | US$m | | | US$m | | | US$m | | | US$m | | | | | | US$m | | |
| Balance sheet data15 | | | | | | | | | | | | | | | | | | | | | |
| Loans and advances to customers (net) | 448,545 | | | 172,976 | | | 210,220 | | | 34,297 | | | 2,095 | | | | | | 868,133 | | |
| Total assets | 602,342 | | | 228,668 | | | 1,059,746 | | | 106,178 | | | 137,291 | | | (273,467 | ) | | 1,860,758 | | |
| Customer accounts | 388,468 | | | 190,853 | | | 235,965 | | | 80,303 | | | 1,245 | | | | | | 896,834 | | |
| | | | | | | | | | | | | | | | | | | | | | |
| For footnotes, see page 143. | | | | | | | | | | | | | | | | | | | | | |
86
Back to Contents
Additional information on results in 2008 may be found in the ‘Financial Summary’ on pages 23 to 38.
Summary
Europe
HSBC’s principal banking operations in Europe are HSBC Bank plc (‘HSBC Bank’) in the UK, HSBC France, HSBC Bank A.S. in Turkey, HSBC Bank Malta p.l.c., HSBC Private Bank (Suisse) S.A., HSBC Trinkaus & Burkhardt AG and HSBC Guyerzeller Bank AG. Through these operations HSBC provides a wide range of banking, treasury and financial services to personal, commercial and corporate customers across Europe.
Hong Kong
HSBC’s principal banking subsidiaries in Hong Kong are The Hongkong and Shanghai Banking Corporation Limited (‘The Hongkong and Shanghai Banking Corporation’) and Hang Seng Bank Limited (‘Hang Seng Bank’). The former is the largest bank incorporated in Hong Kong and is HSBC’s flagship bank in the Asia-Pacific region. It is one of Hong Kong’s three note-issuing banks, accounting for more than 65 per cent by value of banknotes in circulation in 2007.
Rest of Asia-Pacific (including the Middle East)
HSBC offers personal, commercial, global banking and markets services in mainland China, mainly through its local subsidiary, HSBC Bank (China) Company Limited (‘HSBC Bank China’). HSBC also participates indirectly in mainland China through its three associates, Bank of Communications (19.01 per cent owned), Ping An Insurance (16.78 per cent) and Industrial Bank (12.78 per cent), and has a further interest of 8 per cent in Bank of Shanghai.
Outside Hong Kong and mainland China, HSBC conducts business in 20 countries in the Asia-Pacific region, primarily through branches and subsidiaries of The Hongkong and Shanghai Banking Corporation, with particularly strong coverage in India, Indonesia, South Korea, Singapore and Taiwan. HSBC’s presence in the Middle East is led by HSBC Bank Middle East Limited (‘HSBC Bank Middle East’), whose network of branches, together with HSBC’s subsidiaries and associates, gives it the widest coverage in the region; in Australia by HSBC Bank Australia Limited; and in Malaysia by HSBC Bank Malaysia Berhad (‘HSBC Bank Malaysia’), which is the largest foreign-owned bank in the country by operating income and pre-tax profits. HSBC’s associate in Saudi Arabia, The Saudi British Bank (40 per cent owned), is the Kingdom’s fifth largest bank by total assets.
North America
HSBC’s North American businesses are located in the US, Canada and Bermuda. Operations in the US are primarily conducted through HSBC Bank USA, N.A. (‘HSBC Bank USA’) which is concentrated in New York State, and HSBC Finance, a national consumer finance company based in the Chicago metropolitan area. HSBC Markets (USA) Inc. is the intermediate holding company of,inter alia, HSBC Securities (USA) Inc., a registered broker and dealer of securities and a registered futures commission merchant. HSBC Bank Canada and The Bank of Bermuda Limited (‘Bank of Bermuda’) operate in their respective countries.
Latin America
HSBC’s operations in Latin America principally comprise HSBC México, S.A. (‘HSBC Mexico’), HSBC Bank Brasil S.A.-Banco Múltiplo (‘HSBC Bank Brazil’), HSBC Bank Argentina S.A. (‘HSBC Bank Argentina’) and HSBC Bank (Panama) S.A. (‘HSBC Bank Panama’), which owns subsidiaries in Costa Rica, Honduras, Colombia, Nicaragua and El Salvador. HSBC is also represented by subsidiaries in Chile, the Bahamas, Peru, Paraguay and Uruguay and by a representative office in Venezuela. In addition to banking services, HSBC operates insurance businesses in Mexico, Argentina, Brazil, Panama, Honduras and El Salvador. In Brazil, HSBC offers consumer finance products through its subsidiary, Losango.
87
Back to Contents
| H S B C H O L D I N G S P L C |
| |
| Report of the Directors: Operating and Financial Review(continued) |
| | |
| | |
Geographical regions > Summary / Europe |
In the analysis of profit by geographical regions that follows, operating income and operating expenses
include intra-HSBC items of US$2,492 million (2007: US$1,985 million; 2006: US$1,494 million).
| Profit/(loss) before tax | | | | | | | | | | | | | | | | | | |
| | 2008 | | | 2007 | | | 2006 | | |
|
| | |
| | |
| | |
| | US$m | | | % | | | US$m | | | % | | | US$m | | | % | | |
| | | | | | | | | | | | | | | | | | | |
| Europe | 10,869 | | | 116.7 | | | 8,595 | | | 35.5 | | | 6,974 | | | 31.5 | | |
| Hong Kong | 5,461 | | | 58.7 | | | 7,339 | | | 30.3 | | | 5,182 | | | 23.5 | | |
| Rest of Asia-Pacific | 6,468 | | | 69.5 | | | 6,009 | | | 24.8 | | | 3,527 | | | 16.0 | | |
| North America | (15,528 | ) | | (166.8 | ) | | 91 | | | 0.4 | | | 4,668 | | | 21.1 | | |
| Latin America | 2,037 | | | 21.9 | | | 2,178 | | | 9.0 | | | 1,735 | | | 7.9 | | |
| |
| | |
| | |
| | |
| | |
| | |
| | |
| | 9,307 | | | 100.0 | | | 24,212 | | | 100.0 | | | 22,086 | | | 100.0 | | |
| |
| | |
| | |
| | |
| | |
| | |
| | |
| Total assets15 | | | | | | | | | | | | |
| | At 31 December | | |
| |
|
|
|
|
|
|
|
|
|
| | |
| | 2008 | | | 2007 | | |
| | US$m | | | % | | | US$m | | | % | | |
| | | | | | | | | | | | | |
| Europe | 1,343,011 | | | 53.1 | | | 1,236,633 | | | 52.5 | | |
| Hong Kong | 407,151 | | | 16.1 | | | 356,894 | | | 15.2 | | |
| Rest of Asia-Pacific | 262,305 | | | 10.4 | | | 243,205 | | | 10.3 | | |
| North America | 552,612 | | | 21.9 | | | 549,285 | | | 23.3 | | |
| Latin America | 97,944 | | | 3.9 | | | 101,088 | | | 4.3 | | |
| Intra-HSBC items | (135,558 | ) | | (5.4 | ) | | (132,839 | ) | | (5.6 | ) | |
| |
| | |
| | |
| | |
| | |
| | 2,527,465 | | | 100.0 | | | 2,354,266 | | | 100.0 | | |
| |
| | |
| | |
| | |
| | |
| For footnote, see page 143. | | | | | | | | | | | | |
88
Back to Contents
Europe
Profit/(loss) before tax by country within customer groups and global businesses
| | Personal | | | | Global | | | | | | | |
| | Financial | | Commercial | | Banking & | | Private | | | | | |
| | Services | | Banking | | Markets | 21 | Banking | | Other | | Total | |
| | US$m | | US$m | | US$m | | US$m | | US$m | | US$m | |
| 2008 | | | | | | | | | | | | |
| United Kingdom | 1,546 | | 2,361 | | (469 | ) | 250 | | 2,997 | | 6,685 | |
| France22 | 139 | | 176 | | 273 | | 10 | | 2,242 | | 2,840 | |
| Germany | – | | 31 | | 184 | | 32 | | (22 | ) | 225 | |
| Malta | 59 | | 67 | | 16 | | – | | – | | 142 | |
| Switzerland | – | | – | | – | | 553 | | – | | 553 | |
| Turkey | 3 | | 91 | | 130 | | – | | – | | 224 | |
| Other | (89 | ) | (4 | ) | 61 | | 153 | | 79 | | 200 | |
| |
| |
| |
| |
| |
| |
| |
| | 1,658 | | 2,722 | | 195 | | 998 | | 5,296 | | 10,869 | |
| |
| |
| |
| |
| |
| |
| |
| | | | | | | | | | | | | |
| 2007 | | | | | | | | | | | | |
| United Kingdom | 1,221 | | 2,064 | | 1,214 | | 317 | | 976 | | 5,792 | |
| France22 | 173 | | 192 | | 692 | | 25 | | (49 | ) | 1,033 | |
| Germany | – | | 36 | | 195 | | 45 | | 19 | | 295 | |
| Malta | 45 | | 67 | | 45 | | – | | – | | 157 | |
| Switzerland | – | | – | | – | | 475 | | – | | 475 | |
| Turkey | 144 | | 75 | | 118 | | (1 | ) | – | | 336 | |
| Other | (2 | ) | 82 | | 263 | | 54 | | 110 | | 507 | |
| |
| |
| |
| |
| |
| |
| |
| | 1,581 | | 2,516 | | 2,527 | | 915 | | 1,056 | | 8,595 | |
| |
| |
| |
| |
| |
| |
| |
| 2006 | | | | | | | | | | | | |
| United Kingdom | 1,496 | | 1,801 | | 1,299 | | 380 | | (185 | ) | 4,791 | |
| France22 | 174 | | 236 | | 545 | | 22 | | (107 | ) | 870 | |
| Germany | – | | 29 | | 114 | | 41 | | 16 | | 200 | |
| Malta | 42 | | 50 | | 29 | | – | | – | | 121 | |
| Switzerland | – | | – | | – | | 305 | | – | | 305 | |
| Turkey | 121 | | 50 | | 64 | | – | | (18 | ) | 217 | |
| Other | 76 | | 68 | | 253 | | 57 | | 16 | | 470 | |
| |
| |
| |
| |
| |
| |
| |
| | 1,909 | | 2,234 | | 2,304 | | 805 | | (278 | ) | 6,974 | |
| |
| |
| |
| |
| |
| |
| |
Loans and advances to customers (net) by country
| | At 31 December | |
| |
|
|
|
|
| |
| | 2008 | | 2007 | | 2006 | |
| | US$m | | US$m | | US$m | |
| | | | | | | |
| United Kingdom | 313,065 | | 326,927 | | 305,758 | |
| France22 | 70,896 | | 81,473 | | 55,491 | |
| Germany | 5,756 | | 6,411 | | 4,439 | |
| Malta | 4,343 | | 4,157 | | 3,456 | |
| Switzerland | 12,708 | | 13,789 | | 9,151 | |
| Turkey | 6,125 | | 7,974 | | 5,233 | |
| Other | 13,298 | | 11,544 | | 8,971 | |
| |
| |
| |
| |
| | 426,191 | | 452,275 | | 392,499 | |
| |
| |
| |
| |
Customer accounts by country
| | At 31 December | |
| |
|
|
|
|
| |
| | 2008 | | 2007 | | 2006 | |
| | US$m | | US$m | | US$m | |
| | | | | | | |
| United Kingdom | 351,253 | | 367,363 | | 318,614 | |
| France22 | 74,826 | | 64,905 | | 43,372 | |
| Germany | 11,611 | | 10,282 | | 11,607 | |
| Malta | 5,604 | | 5,947 | | 4,529 | |
| Switzerland | 44,643 | | 41,015 | | 30,062 | |
| Turkey | 5,845 | | 6,473 | | 4,140 | |
| Other | 8,694 | | 8,969 | | 7,041 | |
| |
| |
| |
| |
| | 502,476 | | 504,954 | | 419,365 | |
| |
| |
| |
| |
For footnotes, see page 143.
89
Back to Contents
| H S B C H O L D I N G S P L C |
| |
| Report of the Directors: Operating and Financial Review(continued) |
| | |
| | |
| Geographical regions > Europe > 2008 |
| Profit before tax | | | | | | | | | |
| | 2008 | | | 2007 | | | 2006 | | |
| Europe | US$m | | | US$m | | | US$m | | |
| | | | | | | | | | |
| Net interest income | 9,696 | | | 7,746 | | | 8,289 | | |
| Net fee income | 7,492 | | | 8,431 | | | 7,108 | | |
| Net trading income | 5,357 | | | 6,943 | | | 4,529 | | |
| Changes in fair value of long-term debt issued and related derivatives | 2,939 | | | 1,059 | | | 28 | | |
| Net income/(expense) from other financial instruments designated at fair value | (1,826 | ) | | 167 | | | 116 | | |
| Net income from financial instruments designated at fair value | 1,113 | | | 1,226 | | | 144 | | |
| Gains less losses from financial investments | 418 | | | 1,326 | | | 624 | | |
| Dividend income | 130 | | | 171 | | | 183 | | |
| Net earned insurance premiums | 5,299 | | | 4,010 | | | 1,298 | | |
| Gains on disposal of French regional banks | 2,445 | | | – | | | – | | |
| Other operating income | 2,096 | | | 1,193 | | | 1,428 | | |
| |
| | |
| | |
| | |
| Total operating income | 34,046 | | | 31,046 | | | 23,603 | | |
| Net insurance claims incurred and movement in liabilities to policyholders | (3,367 | ) | | (3,479 | ) | | (531 | ) | |
| |
| | |
| | |
| | |
| Net operating income before loan impairment charges and othercredit risk provisions | 30,679 | | | 27,567 | | | 23,072 | | |
| Loan impairment charges and other credit risk provisions | (3,754 | ) | | (2,542 | ) | | (2,155 | ) | |
| |
| | |
| | |
| | |
| Net operating income | 26,925 | | | 25,025 | | | 20,917 | | |
| Total operating expenses | (16,072 | ) | | (16,525 | ) | | (13,871 | ) | |
| |
| | |
| | |
| | |
| Operating profit | 10,853 | | | 8,500 | | | 7,046 | | |
| Share of profit/(loss) in associates and joint ventures | 16 | | | 95 | | | (72 | ) | |
| |
| | |
| | |
| | |
| Profit before tax | 10,869 | | | 8,595 | | | 6,974 | | |
| |
| | |
| | |
| | |
| | % | | | % | | | % | | |
| Share of HSBC’s profit before tax | 116.7 | | | 35.5 | | | 31.5 | | |
| Cost efficiency ratio | 52.4 | | | 59.9 | | | 60.1 | | |
| Year-end staff numbers (full-time equivalent) | 82,093 | | | 82,166 | | | 78,311 | | |
| Balance sheet data15 | | | | | | |
| | At 31 December | |
| |
|
|
|
|
| |
| | 2008 | | 2007 | | 2006 | |
| | US$m | | US$m | | US$m | |
| | | | | | | |
| Loans and advances to customers (net) | 426,191 | | 452,275 | | 392,499 | |
| Loans and advances to banks (net) | 61,949 | | 104,527 | | 76,830 | |
| Trading assets, financial assets designated at fair value and financial investments20 | 433,885 | | 445,258 | | 242,010 | |
| Total assets | 1,343,011 | | 1,236,633 | | 867,032 | |
| Deposits by banks | 80,847 | | 87,491 | | 67,821 | |
| Customer accounts | 502,476 | | 504,954 | | 419,365 | |
| | | | | | | |
| For footnotes, see page 143. |
| All commentaries on Europe are on an underlying basis unless stated otherwise. |
| | | | | | | |
2008 compared with 2007
Economic briefing
In theUK, growth in gross domestic product (‘GDP’) decelerated markedly in 2008 to 0.7 per cent from 3.0 per cent in 2007, with a technical recession of two successive quarterly contractions in GDP confirmed during the second half of the year. Weakness proved widespread across most of the
economy, prompting a sharp deterioration in labour market conditions as unemployment hit a 9-year high of 6.1 per cent in November 2008. Consumer Price Index (‘CPI’) inflation reached a decade-long high of 5.2 per cent in September 2008 before falling back to 3.1 per cent by the year-end, still some way above the Bank of England’s 2 per cent target. House prices continued to fall throughout the year and housing activity decreased sharply. The Bank of
90
Back to Contents
England reduced interest rates by 350 basis points during 2008, to finish the year at 2 per cent, as policymakers sought to mitigate the worst effects of the economic slowdown.
The expansion of theeurozone economy slowed sharply in 2008, with GDP growth of 0.7 per cent following a 2.6 per cent expansion in 2007. As in the UK, conditions deteriorated markedly as the year progressed and three successive quarterly declines in GDP were recorded during 2008, confirming that the economy had entered a period
of recession. Consumer spending growth proved subdued following the sharp rise in oil prices during the first of half of 2008 and a progressive increase in the unemployment rate towards the year-end. Inflation remained a concern for much of 2008, hitting a peak of 4.0 per cent in July before falling rapidly to 1.6 per cent in December. The European Central Bank, having initially raised interest rates by 25 basis points in July, cut them by 175 basis points to finish the year at 2.5 per cent.
Reconciliation of reported and underlying profit before tax
| | 2008 compared with 2007 | |
| |
|
|
|
|
|
|
|
|
|
|
|
|
|
|
|
|
| |
| | | | 2007 | | | | | | | | | | | | | | | |
| | | | acquisitions, | | | | 2007 | | 2008 | | | | | | | | | |
| | | | disposals | | | | at 2008 | | acquisitions | | Under- | | | | | | | |
| | 2007 as | | & dilution | | Currency | | exchange | | and | | lying | | 2008 as | | Reported | | Underlying | |
| | reported | | gains | 1 | translation | 2 | rates | 3 | disposals | 1 | change | | reported | | change | | change | |
| Europe | US$m | | US$m | | US$m | | US$m | | US$m | | US$m | | US$m | | % | | % | |
| | | | | | | | | | | | | | | | | | | |
| Net interest income | 7,746 | | (390 | ) | (224 | ) | 7,132 | | 219 | | 2,345 | | 9,696 | | 25 | | 33 | |
| Net fee income | 8,431 | | (134 | ) | (244 | ) | 8,053 | | 15 | | (576 | ) | 7,492 | | (11 | ) | (7 | ) |
| Other income4 | 11,390 | | (121 | ) | (380 | ) | 10,889 | | 3,007 | | (405 | ) | 13,491 | | 18 | | (4 | ) |
| |
| |
| |
| |
| |
| |
| |
| | | | | |
| Net operating income5 | 27,567 | | (645 | ) | (848 | ) | 26,074 | | 3,241 | | 1,364 | | 30,679 | | 11 | | 5 | |
Loan impairment charges and other credit risk provisions | (2,542 | ) | 30 | | 152 | | (2,360 | ) | (6 | ) | (1,388 | ) | (3,754 | ) | (48 | ) | (59 | ) |
| |
| |
| |
| |
| |
| |
| |
| | | | | |
| Net operating income | 25,025 | | (615 | ) | (696 | ) | 23,714 | | 3,235 | | (24 | ) | 26,925 | | 8 | | – | |
| Operating expenses | (16,525 | ) | 416 | | 531 | | (15,578 | ) | (88 | ) | (406 | ) | (16,072 | ) | 3 | | (3 | ) |
| |
| |
| |
| |
| |
| |
| |
| | | | | |
| Operating profit | 8,500 | | (199 | ) | (165 | ) | 8,136 | | 3,147 | | (430 | ) | 10,853 | | 28 | | (5 | ) |
| Income from associates | 95 | | (12 | ) | 14 | | 97 | | – | | (81 | ) | 16 | | (83 | ) | (84 | ) |
| |
| |
| |
| |
| |
| |
| |
| | | | | |
| Profit before tax | 8,595 | | (211 | ) | (151 | ) | 8,233 | | 3,147 | | (511 | ) | 10,869 | | 26 | | (6 | ) |
| |
| |
| |
| |
| |
| |
| |
| | | | | |
| | |
For footnotes, see page 143.
| |
| |
Review of business performance
HSBC’s European operations reported a pre-tax profit of US$10.9 billion, compared with US$8.6 billion in 2007, an increase of 26 per cent.
These results included gains of US$2.4 billion on the disposal of seven regional banks in France in July 2008, and of US$425 million on the sale of the card acquiring business in the UK to a joint venture with Global Payments, Inc. in June 2008. Excluding these disposals and, in 2007, the acquisition of HSBC Assurances and the disposal of Hamilton Insurance Company Limited and Hamilton Life Assurance Company Limited and substantial fair value gains on own debt, underlying pre-tax profits fell by 33 per cent. This primarily reflected a sharp decline in Global Banking and Markets’ revenues, which was mainly attributable to the deterioration in credit markets, the continuing illiquidity in asset-backed securities markets which led to further
write-downs, and a US$854 million charge within the equities business following the alleged fraud at Madoff Securities. Personal Financial Services and Private Banking delivered underlying growth.
Net interest income increased by 33 per cent. There was significant growth in Balance Sheet Management revenues, which reflected favourable interest rate risk positioning in expectation of interest rate cuts by central banks. Net interest income also benefited from necessarily selective incremental lending as credit availability generally contracted. In Global Banking, net interest income was boosted by improved spreads.
Falling confidence in the UK banking sector necessitated government intervention in a number of competitor banks. HSBC experienced a strong increase in customer numbers, with corresponding growth in liability balances as the market turmoil intensified. The volume benefit was partially offset
91
Back to Contents
| H S B C H O L D I N G S P L C |
| |
| Report of the Directors: Operating and Financial Review(continued) |
| | |
| | |
| Geographical regions > Europe > 2008 / 2007 |
by narrowing deposit spreads, as base rates were cut in the UK, and increased funding costs, principally for trading activities, in France. Higher net interest income from the expansion of credit card lending and commercial loan portfolio growth in the small and mid-market customer segments in Turkey was partially offset by narrower spreads following credit card interest rate cap reductions by the central bank.
Net fee income fell by 7 per cent, with lower fees from mergers and acquisitions and equity capital markets due to origination and execution difficulties, coupled with a rise in brokerage expenses in line with increased trading activity in France. Lower performance and management fees in the UK and France as the value of funds under management reduced, reflected the decline in global equity markets. Increased customer acquisition partly offset this, with higher fees derived from growth in packaged accounts and transaction volumes in France and credit card fees in Turkey.
Trading income was 20 per cent lower than in 2007, falling significantly in Global Banking and Markets due to further write-downs on legacy exposures in credit, structured credit derivatives and leveraged and acquisition finance caused by the ongoing turmoil in the credit markets. In addition, a US$854 million charge was taken in equities in respect of the alleged fraud at Madoff Securities. US$11.4 billion and US$2.4 billion of held-for-trading financial assets were reclassified under revised IFRS rules as loans and receivables and available for sale, respectively, preventing any further mark-to-market trading losses on these assets. If these reclassifications had not been made, the profit before tax would have been US$2.6 billion lower.
Excluding the write-downs on legacy exposures and the charge relating to Madoff Securities, trading income grew by 11 per cent, driven by a significant increase in foreign exchange revenues against the backdrop of greater market volatility, and robust revenues in the Rates business, which was positioned to take advantage of falling interest rates. The widening of credit spreads, particularly in the second half of 2008, contributed to fair value gains on structured liabilities and on credit protection bought in the form of credit default swaps.
Net income from financial instruments designated at fair value increased by 36 per cent, primarily due to fair value gains from the effect of widening credit spreads on certain fixed-rate long-term debt issued by HSBC Holdings. This movement was partly offset by a reduction in the value of assets held to meet liabilities under insurance and
investment contracts. The reduction in fair value of assets held to meet liabilities under unit-linked insurance contracts is offset by a corresponding reduction in ‘Net insurance claims and liabilities to policyholders’. The fair value gains on HSBC’s own debt will fully reverse over the life of the debt.
Gains less losses from financial investments of US$418 million were US$915 million lower than in 2007 as there were fewer disposal opportunities in 2008 and the significant realisations from equity investments in the UK and France in 2007 did not recur. Gains largely reflected the sale of MasterCard shares in 2008.
Net earned insurance premiums increased by 22 per cent, largely due to growth in the Guaranteed Income Bond launched in June 2007 and the introduction of enhanced death benefits to certain pension products in the UK. In France, HSBC Assurances performed well in a declining market, as the launch of new guaranteed rate products contributed to 3 per cent growth in gross earned premiums. However, net earned insurance premiums fell following a significant re-insurance transaction undertaken in the first half of 2008.
Other operating income increased by 33 per cent. This was primarily due to recognition of the gain in respect of the purchase of the subsidiary of Metrovacesa which owned the property and long leasehold land comprising 8 Canada Square, London. See Note 23 on the Financial Statements for further details. The growth in revenue also reflected the non-recurrence of a decrease in the value of PVIF business in 2007 following regulatory changes to the rules governing the calculation of insurance liabilities. In addition, there was a favourable embedded value adjustment following HSBC’s introduction of enhanced benefits to existing commercial pension products in the first half of 2008. These benefits were partially offset by costs associated with the support of money market funds in the global asset management business.
Net insurance claims incurred and movement in liabilities to policyholders decreased by 5 per cent as a reduction in insurance liabilities reflected the fall in value of market-linked funds. This was partially offset by an increase in liabilities following increased sales of the Guaranteed Income Bond and the implementation of FSA rule changes in 2007 which lowered the liability valuation on life policies.
Loan impairment chargesand credit risk provisions rose by 59 per cent to US$3.8 billion; in the UK, primarily in Global Banking and Markets. The deteriorating credit environment resulted in a rise in loan impairment charges, largely reflecting an
92
Back to Contents
exposure to a single European property company, and additional credit risk provisions on debt securities held within the Group’s available-for-sale portfolio, mainly in Solitaire Funding Limited (‘Solitaire’), a special purpose entity managed by HSBC. A modest improvement in the UK personal finance sector reflected the non-recurrence of a change in the methodology in the consumer finance business which resulted in a higher charge in 2007. Excluding this factor, delinquency rates in cards were marginally higher and there was a rise in impairments in the consumer finance business driven by worsening economic conditions and credit quality deterioration, partly offset by action taken to mitigate risk through the continued application of strict lending criteria and the sale of non-core credit card portfolios.
Credit conditions weakened in the commercial business and specific loan impairment charges increased in the UK and France due to the deteriorating credit environment in the second half of 2008. In Turkey, credit card and personal loan delinquency rates were significantly higher, resulting in the implementation of tighter underwriting criteria, reduced credit limits and revised account management policies throughout 2008.
Operating costs increased by 3 per cent to US$16.1 billion. Costs in the UK were in line with 2007, which included ex-gratia payments expensed in respect of overdraft fees applied in previous years and a provision for reimbursement of certain charges on historic will trusts and other related services. Excluding these items, costs rose as a result of an increase in the Financial Services Compensation Scheme levy, restructuring costs and increased rental charges following the sale and leaseback of branch properties, partially offset by lower performance-related pay and a reduction in defined benefit pension scheme costs due to a change in actuarial assumptions.
Operating costs in France decreased slightly with lower performance-related pay and a reduction in pension and retirement healthcare costs following the transfer of certain obligations to a third-party offsetting the higher costs of a voluntary retirement programme.
There was investment in premises and new staff to support business expansion in Turkey, Russia and central and eastern Europe. In 2008, 112 new branches opened and staff numbers increased by 30 per cent in these markets.
Share of profit in associates and joint ventures declined by 84 per cent to US$16 million with 2007
benefiting from an adjustment to the embedded value of HSBC Assurances. The absence of this gain was partially offset by increased joint venture profits following the sale of the card acquiring business in the UK.
2007 compared with 2006
Economic briefing
In the UK, GDP growth accelerated in 2007 to 3.1 per cent from 2.9 per cent in 2006, mainly as a result of buoyant consumer and investment spending. Net trade depressed GDP growth through 2007, and the current account deficit reached a record 5.7 per cent of GDP in the third quarter of the year. Employment growth was fairly subdued, rising by approximately 0.7 per cent during the year. CPI inflation reached a decade-long high of 3.1 per cent in March but subsequently fell back to 2.1 per cent by the year-end, close to the Bank of England’s 2 per cent target. After a strong start to the year, nominal house prices declined and housing activity diminished in the final months of 2007. The Bank of England raised interest rates by 75 basis points during 2007 to a peak of 5.75 per cent, but subsequently reduced them to 5.5 per cent at the end of 2007.
The expansion of theeurozone economy continued steadily in 2007, with GDP growth of 2.7 per cent. As in the UK, much of the momentum came from strength in business investment and exports as global demand remained strong, particularly from emerging markets. Consumption was relatively subdued, despite declining unemployment, although fiscal reforms (particularly in Germany) are believed to have depressed household expenditure. Eurozone inflation increased steadily during the second half of the year to an annual rate of 3.1 per cent in December, driven largely by rises in food and energy prices. The European Central Bank (‘ECB’) raised interest rates by 50 basis points during 2007, to finish the year at 4 per cent.
Review of business performance
European operations reported a pre-tax profit of US$8.6 billion, compared with US$7.0 billion in 2006, an increase of 23 per cent. On an underlying basis, pre-tax profits improved by 13 per cent.
In March 2007, HSBC acquired its partner’s shares in life, property and casualty insurer, HSBC Assurances. The results of HSBC Assurances are excluded from the commentary below, which is on an underlying basis.
93
Back to Contents
| H S B C H O L D I N G S P L C |
| |
| Report of the Directors: Operating and Financial Review(continued) |
| | |
| | |
| Geographical regions > Europe > 2007 |
Reconciliation of reported and underlying profit before tax
| | 2007 compared with 2006 | |
| |
|
|
|
|
|
|
|
|
|
|
|
|
|
|
|
|
|
|
| | | | | | | | | | 2007 | | | | | | | | | |
| | | | 2006 | | | | 2006 | | acquisitions, | | | | | | | | | |
| | 2006 | | acquisitions | | | | at 2007 | | disposals | | Under- | | 2007 | | Re- | | Under- | |
| | as | | and | | Currency | | exchange | | & dilution | | lying | | as | | ported | | lying | |
| | reported | | disposals | 1 | translation | 2 | rates | 6 | gains | 1 | change | | reported | | change | | change | |
| Europe | US$m | | US$m | | US$m | | US$m | | US$m | | US$m | | US$m | | % | | % | |
| | | | | | | | | | | | | | | | | | | |
| Net interest income | 8,289 | | (3 | ) | 635 | | 8,921 | | 419 | | (1,594 | ) | 7,746 | | (7 | ) | (18 | ) |
| Net fee income | 7,108 | | 53 | | 586 | | 7,747 | | (133 | ) | 817 | | 8,431 | | 19 | | 11 | |
| Other income4 | 7,675 | | (53 | ) | 576 | | 8,198 | | (90 | ) | 3,282 | | 11,390 | | 48 | | 40 | |
| |
| |
| |
| |
| |
| |
| |
| | | | | |
| Net operating income5 | 23,072 | | (3 | ) | 1,797 | | 24,866 | | 196 | | 2,505 | | 27,567 | | 19 | | 10 | |
| Loan impairment charges and other credit risk provisions | (2,155 | ) | – | | (147 | ) | (2,302 | ) | – | | (240 | ) | (2,542 | ) | (18 | ) | (10 | ) |
| |
| |
| |
| |
| |
| |
| |
| | | | | |
| Net operating income | 20,917 | | (3 | ) | 1,650 | | 22,564 | | 196 | | 2,265 | | 25,025 | | 20 | | 10 | |
| Operating expenses | (13,871 | ) | 2 | | (1,076 | ) | (14,945 | ) | (51 | ) | (1,529 | ) | (16,525 | ) | (19 | ) | (10 | ) |
| |
| |
| |
| |
| |
| |
| |
| | | | | |
| Operating profit | 7,046 | | (1 | ) | 574 | | 7,619 | | 145 | | 736 | | 8,500 | | 21 | | 10 | |
| | | | | | | | | | | | | | | | | | | |
| Income/(expense) from associates | (72 | ) | – | | (6 | ) | (78 | ) | (50 | ) | 223 | | 95 | | 232 | | 286 | |
| |
| |
| |
| |
| |
| |
| |
| | | | | |
| Profit before tax | 6,974 | | (1 | ) | 568 | | 7,541 | | 95 | | 959 | | 8,595 | | 23 | | 13 | |
| |
| |
| |
| |
| |
| |
| |
| | | | | |
| | | | | | | | | | | | | | | | | | | |
| For footnotes, see page 143. |
| | | | | | | | | | | | | | | | | | | |
In Commercial Banking, growth in deposit and lending balances in the UK and ongoing business expansion in Turkey and Malta led to steady growth in revenues. This was partly offset by increased loan impairment charges and higher costs associated with business expansion. In Global Banking and Markets, higher income from most businesses was offset by trading losses in Credit and Rates and increased costs. Strong profit growth in Private Banking was driven by an increased client appetite for discretionary portfolios, a rise in lending volumes and further improvements in cross-referrals. In Personal Financial Services, a fall in pre-tax profits reflected ex gratia payments expensed in respect of overdraft fees applied in previous years and a provision for reimbursement of certain charges on historic will trusts and other related services. The ‘Other’ segment benefited from a US$1.3 billion fair value gain in HSBC’s own debt.
Net interest income declined by 18 per cent, mainly because the expansion of trading activities in both the UK and France resulted in higher funding costs, with the related revenues reported in the trading income line. This was partly offset by higher net interest income in the personal and commercial businesses.
In the UK, Personal Financial Services’ spreads widened in a rising interest rate environment and competitive pricing attracted higher balances. This was mitigated by lower spreads on mortgages as customers switched to fixed rate products. In
Commercial Banking, higher net interest income was largely driven by growth in the UK, Turkey, Germany and Malta. In the UK, a negotiated rate deposit product launched in previous years continued to be instrumental in driving higher deposit balances. Strong growth in corporate and structured banking for micro customers, together with expansion in lending to small and mid-market customers, contributed to higher lending balances although this benefit was partially constrained by spread compression in the competitive market.
Revenues from transactional balances held within the payments and cash management business increased by 13 per cent, as credit market dislocation in the second half of the year caused customers to hold higher cash balances. After several years of decline, balance sheet management revenues in Europe increased.
In Turkey, higher net interest income was driven by new customer acquisition. In Switzerland, the Private Banking business earned higher net interest income from lending to existing clients as they further leveraged their portfolios.
Net fee income rose by 11 per cent. Account services increased on higher customer balances and volumes of transactions in the UK and France, supported by sales of fee-earning packaged accounts. Card fees increased in the UK, mainly on interchange and acquiring fees, and in Turkey, on interchange and cash advance fees. This was partly offset by a reduction in credit card default fees in the
94
Back to Contents
UK following regulatory intervention by the OFT in 2006. Broking income increased in the UK, Germany and Switzerland, mainly driven by growth in client assets and transaction volumes. Funds under management fell on lower income from the Hermitage Fund following the part sale of HSBC’s investment in it.
Trading income rose by 41 per cent, driven by the equities business and foreign exchange trading, where income increased strongly, with volume and profitability reflecting market volatility. The increase was partly offset by write-downs in credit, structured derivatives and leveraged and acquisition finance. Net trading income increased following the strategic decision to expand the collateralised lending and structured derivatives businesses, the funding costs of which are reported in net interest income.
Credit spreads, primarily on certain fixed-rate long-term debt issued by HSBC Holdings and its subsidiaries, widened significantly in the second half of 2007, leading to a sevenfold increase innet income from financial instruments designated at fair value compared with 2006. These cumulative gains will fully reverse over the life of the debt.
The sale of shareholdings and various equity investments in the UK and France, including Euronext (the European stock exchange), contributed togains from financial investments of US$1.3 billion, an increase of 101 per cent on 2006.
Net earned insurance premiums increased by 50 per cent to US$4.0 billion, including growth of the Guaranteed Income Bond and motor insurance, and the introduction of enhanced death benefits to pension contracts in the UK. Premiums also grew in the UK because of a higher retention of risk in the non-life business compared with 2006, when a greater proportion of risk and corresponding premiums were ceded to reinsurers. There were also significant contributions from the reinsurance business in Ireland and the life assurance business in Malta.
Other operating incomedeclined by 25 per cent. This largely resulted from a fall in the value of in-force business in UK insurance, driven by a change in the calculation methodology of the PVIF business in the first half of 2007 when HSBC implemented regulatory changes to the rules governing the
calculation of insurance liabilities. This had a marginally positive effect on profit as there was a corresponding reduction in policyholder liabilities.
Net insurance claims incurred and movement in liabilities to policyholders grew by 121 per cent to US$3.5 billion. This growth, which paralleled the growth in net earned insurance premiums, included the effect of higher risk retention in the non-life business, although it was offset by FSA rule changes which led to lower claims valuations on life policies. There was also a rise in flood-related claims in the UK after record rainfalls during the summer.
Loan impairment chargesrose by 10 per cent to US$2.5 billion. Overall credit quality remained broadly stable. In the UK, loan impairment charges rose, primarily in consumer finance lending outside HSBC Bank; within HSBC Bank, steps taken in 2006 to tighten underwriting standards led to an improvement in loan impairment trends. Corporate loan impairment charges remained low in absolute terms, although they were 23 per cent higher than in 2006, principally reflecting the effect of Individual Voluntary Arrangements on micro businesses and impairments on two large corporate accounts in the UK.
Operating costsincreased by 10 per cent to US$16.5 billion, in line with the growth in net operating income before loan impairment charges. In the UK, a change in actuarial assumptions regarding the principal staff defined benefit pension scheme led to increased costs. Ex-gratia payments were expensed in respect of overdraft fees applied in previous years and a provision for reimbursement of certain charges on historic will trusts and other related services was raised which totalled US$396 million. Cost increases also reflected investments in technology, higher payments and cash management transaction volumes, investments in the French structured derivatives business to support revenue growth and, in Turkey, technical infrastructure and additional headcount in support of business expansion.
Share of profit in associates and joint ventures rose by US$167 million, largely as a result of a US$73 million adjustment to the embedded value of HSBC Assurances in France prior to the acquisition of its remaining share capital, following which it was accounted for as a subsidiary.
95
Back to Contents
| H S B C H O L D I N G S P L C |
| |
| Report of the Directors: Operating and Financial Review(continued) |
| | |
| | |
| Geographical regions > Europe > Profit/(loss) before tax by customer group |
Analysis by customer group and global business
Profit/(loss) before tax
| | 2008 |
| |
|
|
|
|
|
|
|
|
|
|
|
|
|
|
|
|
|
|
|
|
| | Personal | | | | | | Global | | | | | | | | | Inter- | | | | |
| | Financial | | | Commercial | | | Banking & | | | Private | | | | | | segment | | | | |
| | Services | | | Banking | | | Markets | | | Banking | | | Other | | | elimination | 21 | | Total | |
| Europe | US$m | | | US$m | | | US$m | | | US$m | | | US$m | | | US$m | | | US$m | |
| | | | | | | | | | | | | | | | | | | | | |
| Net interest income/(expense) | 6,464 | | | 3,435 | | | 3,488 | | | 1,046 | | | (459 | ) | | (4,278 | ) | | 9,696 | |
| Net fee income | 2,612 | | | 2,025 | | | 1,763 | | | 1,020 | | | 72 | | | – | | | 7,492 | |
| Trading income/(expense) excluding net interest income | 47 | | | 71 | | | 1,513 | | | 198 | | | (138 | ) | | – | | | 1,691 | |
Net interest income/(expense) on trading activities | – | | | 12 | | | (655 | ) | | 14 | | | 17 | | | 4,278 | | | 3,666 | |
| Net trading income/(expense)16 | 47 | | | 83 | | | 858 | | | 212 | | | (121 | ) | | 4,278 | | | 5,357 | |
Changes in fair value of long-term debt issued and related derivatives | – | | | – | | | – | | | – | | | 2,939 | | | – | | | 2,939 | |
Net income/(expense) from other financial instruments designated at fair value | (1,634 | ) | | (214 | ) | | (611 | ) | | – | | | 633 | | | – | | | (1,826 | ) |
Net income/(expense) from financial instruments designated at fair value | (1,634 | ) | | (214 | ) | | (611 | ) | | – | | | 3,572 | | | – | | | 1,113 | |
| Gains less losses from financial investments | 281 | | | 132 | | | (30 | ) | | 62 | | | (27 | ) | | – | | | 418 | |
| Dividend income | 35 | | | 74 | | | 25 | | | 5 | | | (9 | ) | | – | | | 130 | |
| Net earned insurance premiums . | 4,927 | | | 391 | | | – | | | – | | | (19 | ) | | – | | | 5,299 | |
| Gains on disposal of French regional banks | – | | | – | | | – | | | – | | | 2,445 | | | – | | | 2,445 | |
| Other operating income | 230 | | | 620 | | | 398 | | | 16 | | | 832 | | | – | | | 2,096 | |
| |
| | |
| | |
| | |
| | |
| | |
| | |
| |
| Total operating income | 12,962 | | | 6,546 | | | 5,891 | | | 2,361 | | | 6,286 | | | – | | | 34,046 | |
| Net insurance claims17 | (3,224 | ) | | (143 | ) | | – | | | – | | | – | | | – | | | (3,367 | ) |
| |
| | |
| | |
| | |
| | |
| | |
| | |
| |
| Net operating income5 | 9,738 | | | 6,403 | | | 5,891 | | | 2,361 | | | 6,286 | | | – | | | 30,679 | |
| Loan impairment charges and other credit risk provisions | (1,971 | ) | | (867 | ) | | (875 | ) | | (38 | ) | | (3 | ) | | | | | (3,754 | ) |
| |
| | |
| | |
| | |
| | |
| | |
| | |
| |
| Net operating income | 7,767 | | | 5,536 | | | 5,016 | | | 2,323 | | | 6,283 | | | – | | | 26,925 | |
| Total operating expenses | (6,107 | ) | | (2,830 | ) | | (4,823 | ) | | (1,325 | ) | | (987 | ) | | – | | | (16,072 | ) |
| |
| | |
| | |
| | |
| | |
| | |
| | |
| |
| Operating profit | 1,660 | | | 2,706 | | | 193 | | | 998 | | | 5,296 | | | – | | | 10,853 | |
| Share of profit/(loss) in associates and joint ventures | (2 | ) | | 16 | | | 2 | | | – | | | – | | | – | | | 16 | |
| |
| | |
| | |
| | |
| | |
| | |
| | |
| |
| Profit before tax | 1,658 | | | 2,722 | | | 195 | | | 998 | | | 5,296 | | | – | | | 10,869 | |
| |
| | |
| | |
| | |
| | |
| | |
| | |
| |
| | % | | | % | | | % | | | % | | | % | | | | | | % | |
| | | | | | | | | | | | | | | | | | | | | |
| Share of HSBC’s profit before tax | 17.8 | | | 29.2 | | | 2.1 | | | 10.7 | | | 56.9 | | | | | | 116.7 | |
| Cost efficiency ratio | 62.7 | | | 44.2 | | | 81.9 | | | 56.1 | | | 15.7 | | | | | | 52.4 | |
| |
| Balance sheet data15 | | | | | | | | | | | | | | | | | | | | |
| | US$m | | | US$m | | | US$m | | | US$m | | | US$m | | | | | | US$m | |
| | | | | | | | | | | | | | | | | | | | | |
| Loans and advances to customers (net) | 126,909 | | | 87,245 | | | 185,818 | | | 25,722 | | | 497 | | | | | | 426,191 | |
| Total assets | 171,962 | | | 107,495 | | | 1,131,721 | | | 84,485 | | | 64,423 | | | (217,075 | ) | | 1,343,011 | |
| Customer accounts | 145,411 | | | 91,188 | | | 199,687 | | | 66,007 | | | 183 | | | | | | 502,476 | |
| | | | | | | | | | | | | | | | | | | | | |
| For footnotes, see page 143. |
96
Back to Contents
| | 2007 |
| |
|
|
|
|
|
|
|
|
|
|
|
|
|
|
|
|
|
|
|
|
| | Personal | | | | | | Global | | | | | | | | | Inter- | | | | |
| | Financial | | | Commercial | | | Banking & | | | Private | | | | | | segment | | | | |
| | Services | | | Banking | | | Markets | | | Banking | | | Other | | | elimination | 21 | | Total | |
| Europe | US$m | | | US$m | | | US$m | | | US$m | | | US$m | | | US$m | | | US$m | |
| |
| Net interest income | 6,604 | | | 3,419 | | | 1,361 | | | 793 | | | 86 | | | (4,517 | ) | | 7,746 | |
| Net fee income/(expense) | 3,060 | | | 2,194 | | | 2,316 | | | 1,032 | | | (171 | ) | | – | | | 8,431 | |
| Trading income excluding net interest income | 60 | | | 36 | | | 2,657 | | | 161 | | | 89 | | | – | | | 3,003 | |
| Net interest income/(expense) on trading activities | (7 | ) | | 30 | | | (610 | ) | | 9 | | | 1 | | | 4,517 | | | 3,940 | |
| Net trading income16 | 53 | | | 66 | | | 2,047 | | | 170 | | | 90 | | | 4,517 | | | 6,943 | |
| Changes in fair value of long- term debt issued and related derivatives | – | | | – | | | – | | | – | | | 1,059 | | | – | | | 1,059 | |
Net income/(expense) from other financial instruments designated at fair value | 126 | | | 31 | | | (185 | ) | | – | | | 195 | | | – | | | 167 | |
Net income/(expense) from financial instruments designated at fair value | 126 | | | 31 | | | (185 | ) | | – | | | 1,254 | | | – | | | 1,226 | |
| Gains less losses from financial investments | 50 | | | 36 | | | 1,100 | | | 115 | | | 25 | | | – | | | 1,326 | |
| Dividend income | 1 | | | 4 | | | 155 | | | 7 | | | 4 | | | – | | | 171 | |
| Net earned insurance premiums . | 3,511 | | | 521 | | | – | | | – | | | (22 | ) | | – | | | 4,010 | |
| Other operating income/ (expense) | 54 | | | (35 | ) | | 853 | | | 8 | | | 301 | | | 12 | | | 1,193 | |
| |
| | |
| | |
| | |
| | |
| | |
| | |
| |
| Total operating income | 13,459 | | | 6,236 | | | 7,647 | | | 2,125 | | | 1,567 | | | 12 | | | 31,046 | |
| Net insurance claims17 | (3,214 | ) | | (265 | ) | | – | | | – | | | – | | | – | | | (3,479 | ) |
| |
| | |
| | |
| | |
| | |
| | |
| | |
| |
| Net operating income5 | 10,245 | | | 5,971 | | | 7,647 | | | 2,125 | | | 1,567 | | | 12 | | | 27,567 | |
| Loan impairment (charges)/recoveries and other credit risk provisions | (2,044 | ) | | (515 | ) | | 26 | | | (4 | ) | | (5 | ) | | – | | | (2,542 | ) |
| |
| | |
| | |
| | |
| | |
| | |
| | |
| |
| Net operating income | 8,201 | | | 5,456 | | | 7,673 | | | 2,121 | | | 1,562 | | | 12 | | | 25,025 | |
| Total operating expenses | (6,635 | ) | | (2,941 | ) | | (5,150 | ) | | (1,208 | ) | | (579 | ) | | (12 | ) | | (16,525 | ) |
| |
| | |
| | |
| | |
| | |
| | |
| | |
| |
| Operating profit | 1,566 | | | 2,515 | | | 2,523 | | | 913 | | | 983 | | | – | | | 8,500 | |
| Share of profit in associates and joint ventures | 15 | | | 1 | | | 4 | | | 2 | | | 73 | | | – | | | 95 | |
| |
| | |
| | |
| | |
| | |
| | |
| | |
| |
| Profit before tax | 1,581 | | | 2,516 | | | 2,527 | | | 915 | | | 1,056 | | | – | | | 8,595 | |
| |
| | |
| | |
| | |
| | |
| | |
| | |
| |
| | % | | | % | | | % | | | % | | | % | | | | | | % | |
| | | | | | | | | | | | | | | | | | | | | |
| Share of HSBC’s profitbefore tax | 6.5 | | | 10.4 | | | 10.4 | | | 3.8 | | | 4.4 | | | | | | 35.5 | |
| Cost efficiency ratio | 64.8 | | | 49.3 | | | 67.3 | | | 56.8 | | | 36.9 | | | | | | 59.9 | |
| |
| Balance sheet data15 | | | | | | | | | | | | | | | | | | | | |
| | US$m | | | US$m | | | US$m | | | US$m | | | US$m | | | | | | US$m | |
| | | | | | | | | | | | | | | | | | | | | |
| Loans and advances to customers (net) | 151,687 | | | 106,846 | | | 163,066 | | | 30,195 | | | 481 | | | | | | 452,275 | |
| Total assets | 240,361 | | | 168,846 | | | 892,712 | | | 83,740 | | | 96,346 | | | (245,372 | ) | | 1,236,633 | |
| Customer accounts | 178,757 | | | 99,704 | | | 163,713 | | | 62,055 | | | 725 | | | | | | 504,954 | |
| | | | | | | | | | | | | | | | | | | | | |
| For footnotes, see page 143. |
97
Back to Contents
| H S B C H O L D I N G S P L C |
| |
| Report of the Directors: Operating and Financial Review(continued) |
| | |
| | |
| Geographical regions > Europe > Profit/(loss) before tax by customer group // Hong Kong |
Analysis by customer group and global business(continued)
Profit/(loss) before tax
| | 2006 | |
| |
|
|
|
|
|
|
|
|
|
|
|
|
|
|
|
|
|
|
|
|
| | Personal | | | | | | Global | | | | | | | | | Inter- | | | | |
| | Financial | | | Commercial | | | Banking & | | | Private | | | | | | segment | | | | |
| | Services | | | Banking | | | Markets | | | Banking | | | Other | | | elimination | 21 | | Total | |
| Europe | US$m | | | US$m | | | US$m | | | US$m | | | US$m | | | US$m | | | US$m | |
| |
| Net interest income | 5,653 | | | 2,923 | | | 1,222 | | | 675 | | | 14 | | | (2,198 | ) | | 8,289 | |
| Net fee income | 2,533 | | | 1,707 | | | 1,673 | | | 869 | | | 326 | | | – | | | 7,108 | |
| Trading income/(expense) excluding net interest income | 119 | | | 27 | | | 2,636 | | | 99 | | | (39 | ) | | – | | | 2,842 | |
| Net interest income/(expense) on trading activities | (6 | ) | | 15 | | | (523 | ) | | 2 | | | 1 | | | 2,198 | | | 1,687 | |
| Net trading income/(expense)16 | 113 | | | 42 | | | 2,113 | | | 101 | | | (38 | ) | | 2,198 | | | 4,529 | |
| Changes in fair value of long-term debt issued and related derivatives | – | | | – | | | – | | | – | | | 28 | | | – | | | 28 | |
| Net income/(expense) from other financial instruments designated at fair value | 80 | | | 27 | | | 11 | | | – | | | (2 | ) | | – | | | 116 | |
| Net income/(expense) from financial instruments designated at fair value | 80 | | | 27 | | | 11 | | | – | | | 26 | | | – | | | 144 | |
| Gains less losses from financialinvestments | 37 | | | 22 | | | 413 | | | 149 | | | 3 | | | – | | | 624 | |
| Dividend income | 2 | | | 3 | | | 171 | | | 5 | | | 2 | | | – | | | 183 | |
| Net earned insurance premiums . | 979 | | | 110 | | | – | | | – | | | 209 | | | – | | | 1,298 | |
| Other operating income | 128 | | | 103 | | | 957 | | | 13 | | | 256 | | | (29 | ) | | 1,428 | |
| |
| | |
| | |
| | |
| | |
| | |
| | |
| |
| Total operating income | 9,525 | | | 4,937 | | | 6,560 | | | 1,812 | | | 798 | | | (29 | ) | | 23,603 | |
| Net insurance claims17 | (331 | ) | | (19 | ) | | – | | | – | | | (181 | ) | | – | | | (531 | ) |
| |
| | |
| | |
| | |
| | |
| | |
| | |
| |
| Net operating income5 | 9,194 | | | 4,918 | | | 6,560 | | | 1,812 | | | 617 | | | (29 | ) | | 23,072 | |
| Loan impairment (charges)/recoveries and other credit risk provisions | (1,838 | ) | | (386 | ) | | 64 | | | 2 | | | 3 | | | – | | | (2,155 | ) |
| |
| | |
| | |
| | |
| | |
| | |
| | |
| |
| Net operating income | 7,356 | | | 4,532 | | | 6,624 | | | 1,814 | | | 620 | | | (29 | ) | | 20,917 | |
| Total operating expenses | (5,447 | ) | | (2,298 | ) | | (4,224 | ) | | (1,010 | ) | | (921 | ) | | 29 | | | (13,871 | ) |
| |
| | |
| | |
| | |
| | |
| | |
| | |
| |
| Operating profit/(loss) | 1,909 | | | 2,234 | | | 2,400 | | | 804 | | | (301 | ) | | – | | | 7,046 | |
| Share of profit/(loss) in associates and joint ventures | – | | | – | | | (96 | ) | | 1 | | | 23 | | | – | | | (72 | ) |
| |
| | |
| | |
| | |
| | |
| | |
| | |
| |
| Profit/(loss) before tax | 1,909 | | | 2,234 | | | 2,304 | | | 805 | | | (278 | ) | | – | | | 6,974 | |
| |
| | |
| | |
| | |
| | |
| | |
| | |
| |
| | % | | | % | | | % | | | % | | | % | | | | | | % | |
| | | | | | | | | | | | | | | | | | | | | |
| Share of HSBC’s profit before tax | 8.6 | | | 10.1 | | | 10.4 | | | 3.6 | | | (1.2 | ) | | | | | 31.5 | |
| Cost efficiency ratio | 59.2 | | | 46.7 | | | 64.4 | | | 55.7 | | | 149.3 | | | | | | 60.1 | |
| |
| Balance sheet data15 | | | | | | | | | | | | | | | | | | | | |
| | US$m | | | US$m | | | US$m | | | US$m | | | US$m | | | | | | US$m | |
| | | | | | | | | | | | | | | | | | | | | |
| Loans and advances to customers (net) | 147,507 | | | 81,430 | | | 140,277 | | | 23,283 | | | 2 | | | | | | 392,499 | |
| Total assets | 227,609 | | | 111,510 | | | 526,468 | | | 68,380 | | | 85,183 | | | (152,118 | ) | | 867,032 | |
| Customer accounts | 152,411 | | | 80,312 | | | 139,416 | | | 47,223 | | | 3 | | | | | | 419,365 | |
| | | | | | | | | | | | | | | | | | | | | |
| For footnotes, see page 143. |
98
Back to Contents
Hong Kong
Profit/(loss) before tax by customer group and global business
| | 2008 | | 2007 | | 2006 | |
| | US$m | | US$m | | US$m | |
| | | | | | | |
| Personal Financial Services | 3,428 | | 4,212 | | 2,880 | |
| Commercial Banking | 1,315 | | 1,619 | | 1,321 | |
| Global Banking and Markets | 1,436 | | 1,578 | | 955 | |
| Private Banking | 237 | | 305 | | 201 | |
| Other | (955 | ) | (375 | ) | (175 | ) |
| |
| |
| |
| |
| | 5,461 | | 7,339 | | 5,182 | |
| |
| |
| |
| |
Profit before tax
| | 2008 | | | 2007 | | | 2006 | | |
| | US$m | | | US$m | | | US$m | | |
| | | | | | | | | | |
| Net interest income | 5,698 | | | 5,483 | | | 4,685 | | |
| Net fee income | 2,580 | | | 3,362 | | | 2,056 | | |
| Net trading income | 1,193 | | | 1,242 | | | 617 | | |
| Changes in fair value of long-term debt issued and related derivatives | 3 | | | 2 | | | – | | |
| Net income/(expense) from other financial instruments designated at fairvalue | (1,194 | ) | | 674 | | | 260 | | |
| Net income/(expense) from financial instruments designated at fair value | (1,191 | ) | | 676 | | | 260 | | |
| Gains less losses from financial investments | (309 | ) | | 94 | | | 162 | | |
| Dividend income | 41 | | | 31 | | | 61 | | |
| Net earned insurance premiums | 3,247 | | | 2,797 | | | 2,628 | | |
| Other operating income | 817 | | | 845 | | | 834 | | |
| |
| | |
| | |
| | |
| Total operating income | 12,076 | | | 14,530 | | | 11,303 | | |
| Net insurance claims incurred and movement in liabilities to policyholders | (1,922 | ) | | (3,208 | ) | | (2,699 | ) | |
| |
| | |
| | |
| | |
| Net operating income before loan impairment charges and other credit risk provisions | 10,154 | | | 11,322 | | | 8,604 | | |
| Loan impairment charges and other credit risk provisions | (765 | ) | | (231 | ) | | (172 | ) | |
| |
| | |
| | |
| | |
| Net operating income | 9,389 | | | 11,091 | | | 8,432 | | |
| Total operating expenses | (3,943 | ) | | (3,780 | ) | | (3,269 | ) | |
| |
| | |
| | |
| | |
| Operating profit | 5,446 | | | 7,311 | | | 5,163 | | |
| Share of profit in associates and joint ventures | 15 | | | 28 | | | 19 | | |
| |
| | |
| | |
| | |
| Profit before tax | 5,461 | | | 7,339 | | | 5,182 | | |
| |
| | |
| | |
| | |
| | | | | | | | | | |
| | % | | | % | | | % | | |
| | | | | | | | | | |
| Share of HSBC’s profit before tax | 58.7 | | | 30.3 | | | 23.5 | | |
| Cost efficiency ratio | 38.8 | | | 33.4 | | | 38.0 | | |
| Year-end staff numbers (full-time equivalent) | 29,330 | | | 27,655 | | | 27,586 | | |
Balance sheet data15
| | At 31 December | |
|
|
|
|
|
| |
| | 2008 | | 2007 | | 2006 | |
| | US$m | | US$m | | US$m | |
| | | | | | | |
| Loans and advances to customers (net) | 100,220 | | 89,638 | | 84,282 | |
| Loans and advances to banks (net) | 29,646 | | 63,737 | | 50,359 | |
| Trading assets, financial assets designated at fair value, andfinancial investments | 122,602 | | 102,180 | | 103,734 | |
| Total assets | 407,151 | | 356,894 | | 318,857 | |
| Deposits by banks | 11,769 | | 6,420 | | 4,799 | |
| Customer accounts | 250,517 | | 234,488 | | 196,691 | |
For footnote, see page 143.
All commentaries on Hong Kong are on an underlying basis unless stated otherwise.
99
Back to Contents
| H S B C H O L D I N G S P L C |
| |
| Report of the Directors: Operating and Financial Review(continued) |
| | |
| | |
| Geographical regions > Hong Kong > 2008 / 2007 |
2008 compared with 2007
Economic briefing
Hong Kong’s GDP growth slowed to 2.5 per cent in 2008 from 6.4 per cent in 2007. After performing strongly during the early months of the year, the economy slowed sharply and a technical recession was confirmed with the release of the third quarter GDP statistics. External demand proved especially weak during the second half of 2008 and the growth in private consumption also slowed sharply. The unemployment rate rose from a ten-year low of
3.2 per cent in August 2008 to 4.1 per cent by the year-end. Consumer price inflation proved volatile during the year, rising to a ten-year high of 6.3 per cent in July before slowing to 2.1 per cent by December 2008, although this movement largely reflected the trends in food and energy prices. In response to interest rate cuts in the US, Hong Kong cut its base interest rate on seven occasions during 2008, finishing the year at 0.5 per cent compared with 5.75 per cent at the end of 2007. The Hang Seng Index fell by 48 per cent during 2008.
Reconciliation of reported and underlying profit before tax
| | 2008 compared with 2007 | |
| |
|
|
|
|
|
|
|
|
|
|
|
|
|
|
|
|
|
|
| | | | 2007 | | | | | | | | | | | | | | | |
| | | | acquisitions, | | | | 2007 | | 2008 | | | | | | | | | |
| | 2007 | | disposals | | | | at 2008 | | acquisitions | | Under- | | 2008 | | Re- | | Under- | |
| | as | | & dilution | | Currency | | exchange | | and | | lying | | as | | ported | | lying | |
| | reported | | gains | 1 | translation | 2 | rates | 3 | disposals | 1 | change | | reported | | change | | change | |
| Hong Kong | US$m | | US$m | | US$m | | US$m | | US$m | | US$m | | US$m | | % | | % | |
| | | | | | | | | | | | | | | | | | | |
| Net interest income | 5,483 | | – | | 15 | | 5,498 | | – | | 200 | | 5,698 | | 4 | | 4 | |
| Net fee income | 3,362 | | – | | 9 | | 3,371 | | – | | (791 | ) | 2,580 | | (23 | ) | (23 | ) |
| Other income4 | 2,477 | | (1 | ) | 3 | | 2,479 | | – | | (603 | ) | 1,876 | | (24 | ) | (24 | ) |
| |
| |
| |
| |
| |
| |
| |
| | | | | |
| Net operating income5 | 11,322 | | (1 | ) | 27 | | 11,348 | | – | | (1,194 | ) | 10,154 | | (10 | ) | (11 | ) |
| Loan impairment charges and other credit risk provisions | (231 | ) | 1 | | (1 | ) | (231 | ) | – | | (534 | ) | (765 | ) | (231 | ) | (231 | ) |
| |
| |
| |
| |
| |
| |
| |
| | | | | |
| Net operating income | 11,091 | | – | | 26 | | 11,117 | | – | | (1,728 | ) | 9,389 | | (15 | ) | (16 | ) |
| Operating expenses | (3,780 | ) | – | | (9 | ) | (3,789 | ) | – | | (154 | ) | (3,943 | ) | (4 | ) | (4 | ) |
| |
| |
| |
| |
| |
| |
| |
| | | | | |
| Operating profit | 7,311 | | – | | 17 | | 7,328 | | – | | (1,882 | ) | 5,446 | | (26 | ) | (26 | ) |
| Income from associates | 28 | | – | | – | | 28 | | – | | (13 | ) | 15 | | (46 | ) | (46 | ) |
| |
| |
| |
| |
| |
| |
| |
| | | | | |
| Profit before tax | 7,339 | | – | | 17 | | 7,356 | | – | | (1,895 | ) | 5,461 | | (26 | ) | (26 | ) |
| |
| |
| |
| |
| |
| |
| |
| | | | | |
For footnotes, see page 143.
Review of business performance
Hong Kong reported pre-tax profits of US$5.5 billion, a 26 per cent decline compared with record profits of US$7.3 billion in 2007. Lower revenues largely reflected a decline in wealth management and insurance income as economic conditions deteriorated. Revenue decline was compounded by impairment charges recognised on certain investments, which arose as a consequence of significant falls in equity market prices. Offsetting this, in part, was considerably stronger balance sheet management income from treasury positions which correctly anticipated the decline in interest rates.
Net interest income rose by 4 per cent, driven by the strong Balance Sheet Management performance in Global Banking and Markets mainly driven by liquidity generated by retail banking in the environment of falling short-term interest rates.
Savings and deposit balances grew strongly, particularly in Personal Financial Services, as customers revealed a preference for security and liquidity following declines in equity markets. Deposit growth was augmented by the launch of campaigns offering both preferential time deposit rates and an enhanced HSBC online platform. The significant decline in interest rates during 2008 led to a narrowing of deposit spreads.
Customer lending volumes were 11 per cent higher, due in part to an 11 per cent rise in mortgage balances. Lending margins narrowed, however, due to interest rate cuts, particularly affecting mortgage lending and other loans linked to HIBOR. Balances outstanding on credit cards rose, driven by increased cardholder spending, and spreads on this business increased due to lower funding costs. Nearly one million new cards were issued in the year, bringing the total cards in circulation to 5.3 million. Volumes
100
Back to Contents
of trade finance grew strongly, driven by demand from corporates with international trade requirements, and commercial lending balances rose, particularly during the first half of the year.
Fee incomedeclined by 23 per cent, driven by lower equity market-related revenues. Weak market sentiment led to lower volumes of retail brokerage and a decrease in income from wealth management activity. This was partly offset by a rise in fees from cards following increases in both cards in circulation and cardholder spending. Fees from account services rose due to greater customer activity and there were higher fees generated from bundled products.
Trading incomewas 4 per cent lower, driven by further write-downs of US$0.2 billion in Global Banking and Markets on a legacy monoline exposure. Excluding these write-downs, trading income grew due to a rise in foreign exchange and rates income as continuing market volatility generated increased trading opportunities and demand for active hedging products.
The net loss of US$1.2 billion onfinancial instruments designated at fair valuecompared with income of US$676 million in 2007. The loss reflected a decline in the value of assets linked to the insurance business. To a large extent, these losses are attributable to policyholders, with an equivalent reduction innet insurance claims and movement in liabilities to policyholders. While the decline in the value of assets which relate to unit-linked products is allocated to policyholders in full, the portion of decline in the value passed on to clients who have products with discretionary participation features and guarantees may be restricted.
Losses from financial investmentsof US$309 million reflected impairments required on investments which have experienced significant falls in equity market prices. These equity investments are classified as available for sale, are not held for trading, and remain part of the strategic positioning of HSBC’s businesses in Asia. These losses were partly offset by an aggregate gain of US$203 million from the redemption of shares in the Visa initial public offering (‘IPO’) and the disposal of MasterCard shares.
Net earned insurance premiumsincreased by 16 per cent to US$3.2 billion, largely due to growth in the life insurance business, in particular for policies with discretionary participation features.
Net insurance claims and movement in liabilities to policyholdersfell by 40 per cent, reflecting the decline in asset values noted above
partly offset by increases due to growth in premiums.
Loan impairment chargesand other credit risk provisions rose markedly from the previously low level to US$765 million as economic conditions deteriorated. Within these charges were exposures to financial institutions held within Global Banking and Markets, which resulted in other credit risk provisions. In Commercial Banking, the combination of an absence of significant recoveries recorded in 2007 and weakness among certain exporters in Hong Kong, who were affected by reduced demand from the US and other developed countries, raised loan impairment charges. As local businesses responded to the economic environment, unemployment rose in the second half of 2008. Credit policies were consequently adjusted across certain products as delinquency and bankruptcy increased in Hong Kong. Although property market declines reduced equity levels for residential mortgage customers, the impact on loan impairment charges was limited as this lending was well-secured and regulatory restrictions constrained origination loan-to-value ratios to below 70 per cent.
Operating expenses rose by 4 per cent. Staff costs declined by 3 per cent despite wage increases and a rise in the number of customer-facing staff, largely due to lower performance-related costs in Global Banking and Markets. Staff numbers were higher than in 2007 notwithstanding reductions within the branch network for lower business volumes in the latter part of 2008. IT costs rose as investment in systems continued. Marketing costs were lower following active management of costs while property rental costs increased due to higher market rental rates. Overall, cost growth was curtailed in response to the more difficult economic climate.
2007 compared with 2006
Economic briefingHong Kong’s economy remained robust during 2007, with the annual rate of growth of 6.3 per cent. Domestic consumption was the major contributor to economic expansion, supported by the strong labour market. The unemployment rate fell to 3.4 per cent, a nine year low, as the supply of labour remained very tight. Global increases in food and oil prices affected Hong Kong, but the territory also experienced wage inflation, rising import prices and growth in property rental costs. Inflation increased as a result, exceeding 3 per cent in the final quarter of the year.
In response to interest rate cuts in the US and capital inflows into the local market, Hong Kong’s
101
Back to Contents
| H S B C H O L D I N G S P L C |
| |
| Report of the Directors: Operating and Financial Review(continued) |
| | |
| | |
| Geographical regions > Hong Kong > 2007 |
main interest rate was cut on three separate occasions during the final months of 2007, with the prime rate ending the year at 6.75 per cent, down by one per cent from its high for the year. Local asset markets benefited accordingly. The previously very strong levels of export growth slowed in the second half of 2007, as demand from the US moderated and
the reduction in mainland China’s export tax rebate in July temporarily affected Hong Kong’s re-exports. Despite relatively modest trade growth, external demand for Hong Kong’s services remained strong due to the buoyant tourism sector and increasing cross-border business activities, especially within the financial sector.
Reconciliation of reported and underlying profit before tax
| | 2007 compared with 2006 | |
| |
|
|
|
|
|
|
|
|
|
|
|
|
|
|
|
|
| |
| | | | | | | | | | 2007 | | | | | | | | | |
| | | | 2006 | | | | 2006 | | acquisitions, | | | | | | | | | |
| | 2006 | | acquisitions | | | | at 2007 | | disposals | | Under- | | 2007 | | Re- | | Under- | |
| | as | | and | | Currency | | exchange | | & dilution | | lying | | as | | ported | | lying | |
| | reported | | disposals | 1 | translation | 2 | rates | 6 | gains | 1 | change | | reported | | change | | change | |
| Hong Kong | US$m | | US$m | | US$m | | US$m | | US$m | | US$m | | US$m | | % | | % | |
| | | | | | | | | | | | | | | | | | | |
| Net interest income | 4,685 | | – | | (15 | ) | 4,670 | | – | | 813 | | 5,483 | | 17 | | 17 | |
| Net fee income | 2,056 | | – | | (6 | ) | 2,050 | | – | | 1,312 | | 3,362 | | 64 | | 64 | |
| Other income4 | 1,863 | | – | | (6 | ) | 1,857 | | – | | 620 | | 2,477 | | 33 | | 33 | |
| |
| |
| |
| |
| |
| |
| |
| | | | | |
| Net operating income5 | 8,604 | | – | | (27 | ) | 8,577 | | – | | 2,745 | | 11,322 | | 32 | | 32 | |
| Loan impairment charges and other credit risk provisions | (172 | ) | – | | 1 | | (171 | ) | – | | (60 | ) | (231 | ) | (34 | ) | (35 | ) |
| |
| |
| |
| |
| |
| |
| |
| | | | | |
| Net operating income | 8,432 | | – | | (26 | ) | 8,406 | | – | | 2,685 | | 11,091 | | 32 | | 32 | |
| Operating expenses | (3,269 | ) | – | | 9 | | (3,260 | ) | – | | (520 | ) | (3,780 | ) | (16 | ) | (16 | ) |
| |
| |
| |
| |
| |
| |
| |
| | | | | |
| Operating profit | 5,163 | | – | | (17 | ) | 5,146 | | – | | 2,165 | | 7,311 | | 42 | | 42 | |
| Income from associates | 19 | | – | | – | | 19 | | – | | 9 | | 28 | | 47 | | 47 | |
| |
| |
| |
| |
| |
| |
| |
| | | | | |
| Profit before tax | 5,182 | | – | | (17 | ) | 5,165 | | – | | 2,174 | | 7,339 | | 42 | | 42 | |
| |
| |
| |
| |
| |
| |
| |
| | | | | |
| For footnotes, see page 143. |
| |
| |
Review of business performance
HSBC’s operations in Hong Kong reported a record pre-tax profit of US$7.3 billion, an increase of 42 per cent compared with US$5.2 billion in 2006. The underlying change was in line with the reported change. Net operating income increased by 32 per cent, double the rate of growth in operating expenses.
In Personal Financial Services, record results reflected increased fee income, particularly from retail brokerage and investment products, as well as growth in net interest income from higher deposit balances and lending. In Commercial Banking, results were driven by balance sheet growth from customer acquisition, increased trade flows and the expansion of supporting businesses into mainland China. In Global Banking and Markets, income growth reflected improved performance in balance sheet management and strong results from the trading businesses and securities services in the buoyant economic environment. Higher demand for structured products and mutual funds drove the increase in Private Banking profits. Cost efficiency ratios improved in all customer groups.
Net interest income rose by 17 per cent, driven by growth in asset and liability products in the personal, commercial and corporate businesses. Net interest income from Global Banking and Markets increased by 79 per cent as balance sheet management revenues recovered and deposits grew strongly with higher spreads. A rise in liabilities to fund trading activities reduced net interest income, with a corresponding rise in trading income. Personal Financial Services’ net interest income grew by 16 per cent as wider spreads were recorded on higher deposit balances, with the relaunch of HSBC Premier contributing to the growth in deposit balances. Card balances were also higher following a number of promotional programmes during the year. In Commercial Banking, strong economic growth helped generate demand for savings products and this, combined with strong customer acquisition, resulted in higher net interest from the investment of deposits.
Buoyant stock market activity drove an increase infee income. Broking and global custody income rose as larger trading volumes were registered on higher stock exchange daily turnover. This was
102
Back to Contents
enhanced by the launch of new investment schemes, awareness campaigns and the adoption of a new portfolio wealth management sales tool in the branch network. An increase in IPO activity in Hong Kong, mainly derived from mainland China, had a positive effect on underwriting fees. Life insurance commission income increased, boosted by new product offerings. Credit card fee income also rose, driven by increased cards in circulation and a rise in cardholder balances.
Trading incomegrowth was achieved throughout the Global Markets business and particularly in foreign exchange, assisted by investments made in recent years to extend the product range and customer base. Structured equity growth continued, driven by the bank’s product offering linked to the Hong Kong Stock Exchange, which rose significantly. HSBC had only very limited exposure to asset-based securities and structured credit products in Hong Kong.
Net earned insurance premiums increased by 7 per cent to US$2.8 billion, as the life assurance business expanded with the launch of new products.
Other operating income was largely in line with 2006, notwithstanding the non-recurrence of income on the sale of the former head office building of Hang Seng Bank and the transfer of the credit card
acquiring business into a joint venture with Global Payments Inc.
Net insurance claimsincurred and movement in liabilitiesto policyholders increased by 19 per cent to US$3.2 billion. The increase was more significant than premium growth because many of the liabilities were related to life policies. Policyholders participate in the investment performance of assets supporting these liabilities and the investment return on these assets is shown in ‘Net income from financial instruments designated at fair value’.
Loan impairment charges continued at a low level and in line with 2006 at US$231 million, despite strong balance sheet growth. This reflected good credit quality and robust economic conditions.
Operating expenses increased by 16 per cent. Staff costs rose by 23 per cent on wage inflation and the recruitment of additional staff, mainly in Commercial Banking and Global Banking and Markets. Performance-related bonuses grew in response to revenue growth. Higher marketing and IT costs reflected business growth and the launch of new initiatives. As commercial rents rose in Hong Kong’s dynamic economy, property rental costs increased, the effect magnified by the sale and leaseback agreement on Hang Seng Bank’s head office in 2006.
103
Back to Contents
| H S B C H O L D I N G S P L C |
| |
| Report of the Directors: Operating and Financial Review(continued) |
| | |
| | |
| Geographical regions > Hong Kong > Profit/(loss) before tax by customer group |
Analysis by customer group and global business
Profit/(loss) before tax
| | 2008 | | |
| |
| |
| | Personal | | | | | | Global | | | | | | | | | Inter- | | | | | |
| | Financial | | | Commercial | | | Banking & | | | Private | | | | | | segment | | | | | |
| | Services | | | Banking | | | Markets | | | Banking | | | Other | | | elimination | 21 | | Total | | |
| Hong Kong | US$m | | | US$m | | | US$m | | | US$m | | | US$m | | | US$m | | | US$m | | |
| | | | | | | | | | | | | | | | | | | | | | |
| Net interest income/(expense) | 3,381 | | | 1,498 | | | 1,524 | | | 214 | | | (669 | ) | | (250 | ) | | 5,698 | | |
| Net fee income | 1,441 | | | 548 | | | 414 | | | 163 | | | 14 | | | – | | | 2,580 | | |
| Trading income excluding net interest income | 143 | | | 79 | | | 483 | | | 120 | | | 30 | | | – | | | 855 | | |
| Net interest/(expense) income on trading activities | 11 | | | 1 | | | 244 | | | – | | | (168 | ) | | 250 | | | 338 | | |
| Net trading income/(expense)16 | 154 | | | 80 | | | 727 | | | 120 | | | (138 | ) | | 250 | | | 1,193 | | |
| Changes in fair value of long- term debt issued and related derivatives | – | | | – | | | – | | | – | | | 3 | | | – | | | 3 | | |
| Net income/(expense) from other financial instruments designated at fair value | (1,291 | ) | | (10 | ) | | 39 | | | – | | | 68 | | | – | | | (1,194 | ) | |
| Net income/(expense) from financial instruments designated at fair value | (1,291 | ) | | (10 | ) | | 39 | | | – | | | 71 | | | – | | | (1,191 | ) | |
| Gains less losses from financial investments | 156 | | | 32 | | | (109 | ) | | – | | | (388 | ) | | – | | | (309 | ) | |
| Dividend income | 3 | | | 2 | | | 17 | | | – | | | 19 | | | – | | | 41 | | |
| Net earned insurance premiums | 3,047 | | | 181 | | | 17 | | | – | | | 2 | | | – | | | 3,247 | | |
| Other operating income | 132 | | | 38 | | | 101 | | | 8 | | | 906 | | | (368 | ) | | 817 | | |
| |
| | |
| | |
| | |
| | |
| | |
| | |
| | |
| Total operating income | 7,023 | | | 2,369 | | | 2,730 | | | 505 | | | (183 | ) | | (368 | ) | | 12,076 | | |
| Net insurance claims17 | (1,773 | ) | | (136 | ) | | (11 | ) | | – | | | (2 | ) | | – | | | (1,922 | ) | |
| |
| | |
| | |
| | |
| | |
| | |
| | |
| | |
| Net operating income5 | 5,250 | | | 2,233 | | | 2,719 | | | 505 | | | (185 | ) | | (368 | ) | | 10,154 | | |
| Loan impairment (charges)/recoveries and other credit risk provisions | (134 | ) | | (335 | ) | | (284 | ) | | (13 | ) | | 1 | | | – | | | (765 | ) | |
| |
| | |
| | |
| | |
| | |
| | |
| | |
| | |
| Net operating income/(expense) | 5,116 | | | 1,898 | | | 2,435 | | | 492 | | | (184 | ) | | (368 | ) | | 9,389 | | |
| Total operating expenses | (1,691 | ) | | (584 | ) | | (1,000 | ) | | (255 | ) | | (781 | ) | | 368 | | | (3,943 | ) | |
| |
| | |
| | |
| | |
| | |
| | |
| | |
| | |
| Operating profit/(loss) | 3,425 | | | 1,314 | | | 1,435 | | | 237 | | | (965 | ) | | – | | | 5,446 | | |
| Share of profit in associates and joint ventures | 3 | | | 1 | | | 1 | | | – | | | 10 | | | – | | | 15 | | |
| |
| | |
| | |
| | |
| | |
| | |
| | |
| | |
| Profit/(loss) before tax | 3,428 | | | 1,315 | | | 1,436 | | | 237 | | | (955 | ) | | – | | | 5,461 | | |
| |
| | |
| | |
| | |
| | |
| | |
| | |
| | |
| | | | | | | | | | | | | | | | | | | | | | |
| | % | | | % | | | % | | | % | | | % | | | | | | % | | |
| | | | | | | | | | | | | | | | | | | | | | |
| Share of HSBC’s profit before tax | 36.9 | | | 14.1 | | | 15.4 | | | 2.6 | | | (10.3 | ) | | | | | 58.7 | | |
| Cost efficiency ratio | 32.2 | | | 26.2 | | | 36.8 | | | 50.5 | | | (422.2 | ) | | | | | 38.8 | | |
| | | | | | | | | | | | | | | | | | | | | | |
| Balance sheet data15 | | | | | | | | | | | | | | | | | | | | | |
| | US$m | | | US$m | | | US$m | | | US$m | | | US$m | | | | | | US$m | | |
| | | | | | | | | | | | | | | | | | | | | | |
| Loans and advances to customers (net) | 41,447 | | | 30,331 | | | 23,042 | | | 3,605 | | | 1,795 | | | | | | 100,220 | | |
| Total assets | 75,419 | | | 36,428 | | | 225,853 | | | 28,800 | | | 66,192 | | | (25,541 | ) | | 407,151 | | |
| Customer accounts | 145,002 | | | 54,869 | | | 30,866 | | | 19,416 | | | 364 | | | | | | 250,517 | | |
| | | | | | | | | | | | | | | | | | | | | | |
| For footnotes, see page 143. |
104
Back to Contents
| | 2007 | |
| |
|
|
|
|
|
|
|
|
|
|
|
|
|
|
|
|
|
|
|
| |
| | Personal | | | | | | Global | | | | | | | | | Inter- | | | | | |
| | Financial | | | Commercial | | | Banking & | | | Private | | | | | | segment | | | | | |
| | Services | | | Banking | | | Markets | | | Banking | | | Other | | | elimination | 21 | | Total | | |
| Hong Kong | US$m | | | US$m | | | US$m | | | US$m | | | US$m | | | US$m | | | US$m | | |
| | | | | | | | | | | | | | | | | | | | | | |
| Net interest income/(expense) | 3,342 | | | 1,540 | | | 986 | | | 70 | | | (767 | ) | | 312 | | | 5,483 | | |
| Net fee income | 1,973 | | | 526 | | | 682 | | | 179 | | | 2 | | | – | | | 3,362 | | |
| Trading income excluding net interest income | 188 | | | 63 | | | 553 | | | 280 | | | 186 | | | – | | | 1,270 | | |
| Net interest income on trading activities | 5 | | | – | | | 241 | | | – | | | 38 | | | (312 | ) | | (28 | ) | |
| Net trading income16 | 193 | | | 63 | | | 794 | | | 280 | | | 224 | | | (312 | ) | | 1,242 | | |
| Changes in fair value of long-term debt issued and related derivatives | – | | | – | | | – | | | – | | | 2 | | | – | | | 2 | | |
| Net income/(expense) from other financial instruments designated at fair value | 820 | | | (13 | ) | | 7 | | | – | | | (140 | ) | | – | | | 674 | | |
| Net income/(expense) from financial instruments designated at fair value | 820 | | | (13 | ) | | 7 | | | – | | | (138 | ) | | – | | | 676 | | |
| Gains less losses from financial investments | – | | | – | | | 38 | | | 1 | | | 55 | | | – | | | 94 | | |
| Dividend income | 2 | | | 1 | | | 6 | | | – | | | 22 | | | – | | | 31 | | |
| Net earned insurance premiums | 2,654 | | | 130 | | | 13 | | | – | | | – | | | – | | | 2,797 | | |
| Other operating income | 153 | | | 28 | | | 114 | | | 6 | | | 881 | | | (337 | ) | | 845 | | |
| |
| | |
| | |
| | |
| | |
| | |
| | |
| | |
| Total operating income | 9,137 | | | 2,275 | | | 2,640 | | | 536 | | | 279 | | | (337 | ) | | 14,530 | | |
| Net insurance claims17 | (3,116 | ) | | (82 | ) | | (10 | ) | | – | | | – | | | – | | | (3,208 | ) | |
| |
| | |
| | |
| | |
| | |
| | |
| | |
| | |
| Net operating income5 | 6,021 | | | 2,193 | | | 2,630 | | | 536 | | | 279 | | | (337 | ) | | 11,322 | | |
| Loan impairment charges and other credit risk provisions | (175 | ) | | (28 | ) | | (28 | ) | | – | | | – | | | – | | | (231 | ) | |
| |
| | |
| | |
| | |
| | |
| | |
| | |
| | |
| Net operating income | 5,846 | | | 2,165 | | | 2,602 | | | 536 | | | 279 | | | (337 | ) | | 11,091 | | |
| Total operating expenses | (1,639 | ) | | (547 | ) | | (1,025 | ) | | (231 | ) | | (675 | ) | | 337 | | | (3,780 | ) | |
| |
| | |
| | |
| | |
| | |
| | |
| | |
| | |
| Operating profit/(loss) | 4,207 | | | 1,618 | | | 1,577 | | | 305 | | | (396 | ) | | – | | | 7,311 | | |
| Share of profit in associates and joint ventures | 5 | | | 1 | | | 1 | | | – | | | 21 | | | – | | | 28 | | |
| |
| | |
| | |
| | |
| | |
| | |
| | |
| | |
| Profit/(loss) before tax | 4,212 | | | 1,619 | | | 1,578 | | | 305 | | | (375 | ) | | – | | | 7,339 | | |
| |
| | |
| | |
| | |
| | |
| | |
| | |
| | |
| | | | | | | | | | | | | | | | | | | | | | |
| | % | | | % | | | % | | | % | | | % | | | | | | % | | |
| | | | | | | | | | | | | | | | | | | | | | |
| Share of HSBC’s profit before tax | 17.4 | | | 6.7 | | | 6.5 | | | 1.3 | | | (1.6 | ) | | | | | 30.3 | | |
| Cost efficiency ratio | 27.2 | | | 24.9 | | | 39.0 | | | 43.1 | | | 241.9 | | | | | | 33.4 | | |
| |
| Balance sheet data15 | | | | | | | | | | | | | | | | | | | | | |
| | US$m | | | US$m | | | US$m | | | US$m | | | US$m | | | | | | US$m | | |
| | | | | | | | | | | | | | | | | | | | | | |
| Loans and advances to customers (net) | 38,197 | | | 25,890 | | | 19,171 | | | 4,329 | | | 2,051 | | | | | | 89,638 | | |
| Total assets | 66,002 | | | 32,059 | | | 215,801 | | | 17,484 | | | 53,227 | | | (27,679 | ) | | 356,894 | | |
| Customer accounts | 129,159 | | | 51,562 | | | 37,364 | | | 15,649 | | | 754 | | | | | | 234,488 | | |
| |
| For footnotes, see page 143. |
105
Back to Contents
| H S B C H O L D I N G S P L C |
| |
| Report of the Directors: Operating and Financial Review(continued) |
| | |
| | |
| Geographical regions > Hong Kong > Profit/(loss) before tax by customer group // Rest of Asia-Pacific |
| Analysis by customer group and global business(continued) |
| |
| Profit/(loss) before tax |
| |
| | 2006 | |
| |
|
|
|
|
|
|
|
|
|
|
|
|
|
|
|
|
|
|
|
| |
| | Personal | | | | | | Global | | | | | | | | | Inter- | | | | | |
| | Financial | | | Commercial | | | Banking & | | | Private | | | | | | segment | | | | | |
| | Services | | | Banking | | | Markets | | | Banking | | | Other | | | elimination | 21 | | Total | | |
| Hong Kong | US$m | | | US$m | | | US$m | | | US$m | | | US$m | | | US$m | | | US$m | | |
| |
| Net interest income/(expense) | 2,882 | | | 1,344 | | | 553 | | | 76 | | | (646 | ) | | 476 | | | 4,685 | | |
| Net fee income/(expense) | 977 | | | 454 | | | 534 | | | 123 | | | (32 | ) | | – | | | 2,056 | | |
| Trading income excluding net interest income | 84 | | | 57 | | | 573 | | | 176 | | | 34 | | | – | | | 924 | | |
| Net interest income on trading activities | 4 | | | – | | | 88 | | | – | | | 77 | | | (476 | ) | | (307 | ) | |
| Net trading income16 | 88 | | | 57 | | | 661 | | | 176 | | | 111 | | | (476 | ) | | 617 | | |
Changes in fair value of long-term debt issued and related derivatives | – | | | – | | | – | | | – | | | – | | | – | | | – | | |
Net income/(expense) from other financial instruments designated at fair value | 373 | | | (53 | ) | | 5 | | | 1 | | | (66 | ) | | – | | | 260 | | |
Net income/(expense) from financial instruments designated at fair value | 373 | | | (53 | ) | | 5 | | | 1 | | | (66 | ) | | – | | | 260 | | |
| Gains less losses from financial investments | 14 | | | – | | | (1 | ) | | 9 | | | 140 | | | – | | | 162 | | |
| Dividend income | 1 | | | 1 | | | 2 | | | – | | | 57 | | | – | | | 61 | | |
| Net earned insurance premiums | 2,519 | | | 95 | | | 14 | | | – | | | – | | | – | | | 2,628 | | |
| Other operating income | 202 | | | 33 | | | 81 | | | 13 | | | 781 | | | (276 | ) | | 834 | | |
| |
| | |
| | |
| | |
| | |
| | |
| | |
| | |
| Total operating income | 7,056 | | | 1,931 | | | 1,849 | | | 398 | | | 345 | | | (276 | ) | | 11,303 | | |
| Net insurance claims17 | (2,638 | ) | | (50 | ) | | (11 | ) | | – | | | – | | | – | | | (2,699 | ) | |
| |
| | |
| | |
| | |
| | |
| | |
| | |
| | |
| Net operating income5 | 4,418 | | | 1,881 | | | 1,838 | | | 398 | | | 345 | | | (276 | ) | | 8,604 | | |
Loan impairment (charges)/recoveries and other credit risk provisions | (119 | ) | | (69 | ) | | 27 | | | – | | | (11 | ) | | – | | | (172 | ) | |
| |
| | |
| | |
| | |
| | |
| | |
| | |
| | |
| Net operating income | 4,299 | | | 1,812 | | | 1,865 | | | 398 | | | 334 | | | (276 | ) | | 8,432 | | |
| Total operating expenses | (1,422 | ) | | (491 | ) | | (911 | ) | | (197 | ) | | (524 | ) | | 276 | | | (3,269 | ) | |
| |
| | |
| | |
| | |
| | |
| | |
| | |
| | |
| Operating profit/(loss) | 2,877 | | | 1,321 | | | 954 | | | 201 | | | (190 | ) | | – | | | 5,163 | | |
| Share of profit in associates and joint ventures | 3 | | | – | | | 1 | | | – | | | 15 | | | – | | | 19 | | |
| |
| | |
| | |
| | |
| | |
| | |
| | |
| | |
| Profit/(loss) before tax | 2,880 | | | 1,321 | | | 955 | | | 201 | | | (175 | ) | | – | | | 5,182 | | |
| |
| | |
| | |
| | |
| | |
| | |
| | |
| | |
| | | | | | | | | | | | | | | | | | | | | | |
| | % | | | % | | | % | | | % | | | % | | | | | | % | | |
| | | | | | | | | | | | | | | | | | | | | | |
| Share of HSBC’s profit before tax | 13.0 | | | 6.0 | | | 4.3 | | | 0.9 | | | (0.7 | ) | | | | | 23.5 | | |
| Cost efficiency ratio | 32.2 | | | 26.1 | | | 49.6 | | | 49.5 | | | 151.9 | | | | | | 38.0 | | |
| |
| Balance sheet data15 | | | | | | | | | | | | | | | | | | | | | |
| | US$m | | | US$m | | | US$m | | | US$m | | | US$m | | | | | | US$m | | |
| | | | | | | | | | | | | | | | | | | | | | |
| Loans and advances to customers (net) | 35,445 | | | 23,520 | | | 20,270 | | | 3,081 | | | 1,966 | | | | | | 84,282 | | |
| Total assets | 57,977 | | | 30,137 | | | 182,540 | | | 22,492 | | | 49,866 | | | (24,155 | ) | | 318,857 | | |
| Customer accounts | 118,201 | | | 41,493 | | | 24,530 | | | 11,991 | | | 476 | | | | | | 196,691 | | |
| |
| For footnotes, see page 143. |
106
Back to Contents
| Rest of Asia-Pacific (including the Middle East) |
| |
| Profit/(loss) before tax by country within customer groups and global businesses |
| |
| | | Personal | | | | | | Global | | | | | | | | | | | |
| | | Financial | | | Commercial | | | Banking & | | | Private | | | | | | | | |
| | | Services | | | Banking | | | Markets | | | Banking | | | Other | | | Total | | |
| | | US$m | | | US$m | | | US$m | | | US$m | | | US$m | | | US$m | | |
| 2008 | | | | | | | | | | | | | | | | | | |
| Australia | 19 | | | 68 | | | 102 | | | – | | | (13 | ) | | 176 | | |
| India | (155 | ) | | 118 | | | 578 | | | 2 | | | 123 | | | 666 | | |
| Indonesia | (22 | ) | | 17 | | | 126 | | | – | | | – | | | 121 | | |
| Japan | (88 | ) | | (1 | ) | | 88 | | | 1 | | | 4 | | | 4 | | |
| Mainland China | 284 | | | 622 | | | 688 | | | (5 | ) | | 16 | | | 1,605 | | |
| | Associates | 393 | | | 558 | | | 335 | | | – | | | – | | | 1,286 | | |
| | Other mainland China | (109 | ) | | 64 | | | 353 | | | (5 | ) | | 16 | | | 319 | | |
| Malaysia | 94 | | | 96 | | | 171 | | | – | | | 8 | | | 369 | | |
| Middle East | 289 | | | 558 | | | 816 | | | 4 | | | 79 | | | 1,746 | | |
| | Egypt | 16 | | | 68 | | | 90 | | | – | | | 49 | | | 223 | | |
| | United Arab Emirates | 133 | | | 330 | | | 388 | | | 4 | | | 6 | | | 861 | | |
| | Other Middle East | 80 | | | 125 | | | 161 | | | – | | | 1 | | | 367 | | |
| |
| | |
| | |
| | |
| | |
| | |
| | |
| | Middle East (excluding Saudi Arabia) | 229 | | | 523 | | | 639 | | | 4 | | | 56 | | | 1,451 | | |
| | Saudi Arabia | 60 | | | 35 | | | 177 | | | – | | | 23 | | | 295 | | |
| Singapore | 104 | | | 83 | | | 337 | | | 110 | | | (37 | ) | | 597 | | |
| South Korea | (16 | ) | | (13 | ) | | 304 | | | – | | | 38 | | | 313 | | |
| Taiwan | (41 | ) | | 45 | | | 179 | | | – | | | (8 | ) | | 175 | | |
| Other | 32 | | | 200 | | | 397 | | | 1 | | | 66 | | | 696 | | |
| |
| | |
| | |
| | |
| | |
| | |
| | |
| | | 500 | | | 1,793 | | | 3,786 | | | 113 | | | 276 | | | 6,468 | | |
| |
| | |
| | |
| | |
| | |
| | |
| | |
| |
| 2007 | | | | | | | | | | | | | | | | | | |
| Australia | 41 | | | 37 | | | 42 | | | – | | | 4 | | | 124 | | |
| India | (70 | ) | | 88 | | | 429 | | | (1 | ) | | 83 | | | 529 | | |
| Indonesia | (7 | ) | | 29 | | | 86 | | | – | | | (4 | ) | | 104 | | |
| Japan | (34 | ) | | (3 | ) | | 75 | | | – | | | 5 | | | 43 | | |
| Mainland China | 494 | | | 397 | | | 369 | | | – | | | 1,101 | | | 2,361 | | |
| | Associates | 516 | | | 351 | | | 220 | | | – | | | 1,093 | | | 2,180 | | |
| | Other mainland China | (22 | ) | | 46 | | | 149 | | | – | | | 8 | | | 181 | | |
| Malaysia | 81 | | | 90 | | | 146 | | | – | | | 13 | | | 330 | | |
| Middle East | 245 | | | 482 | | | 495 | | | 3 | | | 82 | | | 1,307 | | |
| | Egypt | 10 | | | 46 | | | 65 | | | – | | | 32 | | | 153 | | |
| | United Arab Emirates | 108 | | | 262 | | | 242 | | | 3 | | | 2 | | | 617 | | |
| | Other Middle East | 83 | | | 101 | | | 116 | | | – | | | – | | | 300 | | |
| |
| | |
| | |
| | |
| | |
| | |
| | |
| | Middle East (excluding Saudi Arabia) | 201 | | | 409 | | | 423 | | | 3 | | | 34 | | | 1,070 | | |
| | Saudi Arabia | 44 | | | 73 | | | 72 | | | – | | | 48 | | | 237 | | |
| Singapore | 101 | | | 112 | | | 240 | | | 90 | | | 7 | | | 550 | | |
| South Korea | (44 | ) | | (20 | ) | | 159 | | | – | | | 28 | | | 123 | | |
| Taiwan | (52 | ) | | 27 | | | 144 | | | – | | | 4 | | | 123 | | |
| Other | 5 | | | 111 | | | 279 | | | – | | | 20 | | | 415 | | |
| |
| | |
| | |
| | |
| | |
| | |
| | |
| | | 760 | | | 1,350 | | | 2,464 | | | 92 | | | 1,343 | | | 6,009 | | |
| |
| | |
| | |
| | |
| | |
| | |
| | |
107
Back to Contents
| H S B C H O L D I N G S P L C |
| |
| Report of the Directors: Operating and Financial Review(continued) |
| | |
| | |
| Geographical regions > Rest of Asia-Pacific > 2008 |
Profit/(loss) before tax by country within customer groups and global businesses(continued)
| | Personal | | | | | | Global | | | | | | | | | | | |
| | Financial | | | Commercial | | | Banking & | | | Private | | | | | | | | |
| | Services | | | Banking | | | Markets | | | Banking | | | Other | | | Total | | |
| | US$m | | | US$m | | | US$m | | | US$m | | | US$m | | | US$m | | |
| 2006 | | | | | | | | | | | | | | | | | | |
| Australia | 76 | | | 32 | | | 46 | | | – | | | – | | | 154 | | |
| India | (24 | ) | | 46 | | | 277 | | | 2 | | | 92 | | | 393 | | |
| Indonesia | (22 | ) | | 46 | | | 69 | | | – | | | (22 | ) | | 71 | | |
| Japan | (3 | ) | | (2 | ) | | 49 | | | (1 | ) | | 80 | | | 123 | | |
| Mainland China | 276 | | | 241 | | | 167 | | | – | | | 24 | | | 708 | | |
| Associates | 274 | | | 210 | | | 86 | | | – | | | 5 | | | 575 | | |
| Other mainland China | 2 | | | 31 | | | 81 | | | – | | | 19 | | | 133 | | |
| Malaysia | 77 | | | 87 | | | 99 | | | (1 | ) | | 12 | | | 274 | | |
| Middle East | 235 | | | 356 | | | 396 | | | 2 | | | 46 | | | 1,035 | | |
| Egypt | 9 | | | 41 | | | 41 | | | – | | | 20 | | | 111 | | |
| United Arab Emirates | 70 | | | 209 | | | 145 | | | 3 | | | (2 | ) | | 425 | | |
| Other Middle East | 59 | | | 67 | | | 70 | | | (1 | ) | | (1 | ) | | 194 | | |
| |
| | |
| | |
| | |
| | |
| | |
| | |
| Middle East (excluding Saudi Arabia) | 138 | | | 317 | | | 256 | | | 2 | | | 17 | | | 730 | | |
| Saudi Arabia | 97 | | | 39 | | | 140 | | | – | | | 29 | | | 305 | | |
| Singapore | 73 | | | 90 | | | 145 | | | 68 | | | (11 | ) | | 365 | | |
| South Korea | (55 | ) | | (20 | ) | | 115 | | | – | | | 19 | | | 59 | | |
| Taiwan | (179 | ) | | 37 | | | 118 | | | – | | | 1 | | | (23 | ) | |
| Other | 23 | | | 121 | | | 168 | | | 10 | | | 46 | | | 368 | | |
| |
| | |
| | |
| | |
| | |
| | |
| | |
| | 477 | | | 1,034 | | | 1,649 | | | 80 | | | 287 | | | 3,527 | | |
| |
| | |
| | |
| | |
| | |
| | |
| | |
Loans and advances to customers (net) by country
| | At 31 December | | |
| |
| | |
| | 2008 | | | 2007 | | | 2006 | | |
| | US$m | | | US$m | | | US$m | | |
| | | | | | | | | | |
| Australia | 9,321 | | | 11,339 | | | 8,775 | | |
| India | 6,244 | | | 7,220 | | | 4,915 | | |
| Indonesia | 1,904 | | | 1,642 | | | 1,337 | | |
| Japan | 5,839 | | | 4,258 | | | 3,391 | | |
| Mainland China | 11,440 | | | 11,647 | | | 6,065 | | |
| Malaysia | 9,404 | | | 8,856 | | | 7,747 | | |
| Middle East (excluding Saudi Arabia) | 27,295 | | | 21,607 | | | 15,622 | | |
| Egypt | 2,473 | | | 1,853 | | | 965 | | |
| United Arab Emirates | 17,537 | | | 14,103 | | | 10,148 | | |
| Other Middle East | 7,285 | | | 5,651 | | | 4,509 | | |
| Singapore | 13,441 | | | 11,505 | | | 9,610 | | |
| South Korea | 5,336 | | | 7,124 | | | 6,260 | | |
| Taiwan | 4,329 | | | 3,658 | | | 3,974 | | |
| Other | 13,403 | | | 12,996 | | | 9,878 | | |
| |
|
| |
|
| |
|
| |
| | 107,956 | | | 101,852 | | | 77,574 | | |
| |
|
| |
|
| |
|
| |
108
Back to Contents
Customer accounts by country
| | At 31 December | | |
| |
| | |
| | 2008 | | | 2007 | | | 2006 | | |
| | US$m | | | US$m | | | US$m | | |
| | | | | | | | | | |
| Australia | 9,201 | | | 11,418 | | | 8,491 | | |
| India | 9,767 | | | 12,021 | | | 7,936 | | |
| Indonesia | 2,896 | | | 2,574 | | | 2,082 | | |
| Japan | 6,204 | | | 4,657 | | | 4,186 | | |
| Mainland China | 19,171 | | | 14,537 | | | 6,941 | | |
| Malaysia | 11,963 | | | 11,701 | | | 9,640 | | |
| Middle East (excluding Saudi Arabia) | 35,166 | | | 30,937 | | | 21,196 | | |
| Egypt | 5,363 | | | 4,056 | | | 2,703 | | |
| United Arab Emirates | 19,808 | | | 18,455 | | | 11,166 | | |
| Other Middle East | 9,995 | | | 8,426 | | | 7,327 | | |
| Singapore | 32,748 | | | 28,962 | | | 23,517 | | |
| South Korea | 4,383 | | | 5,760 | | | 3,890 | | |
| Taiwan | 9,689 | | | 9,426 | | | 7,675 | | |
| Other | 18,171 | | | 18,240 | | | 13,441 | | |
| |
| | |
| | |
| | |
| | 159,359 | | | 150,233 | | | 108,995 | | |
| |
| | |
| | |
| | |
| | | | | | | | | | |
| | | | | | | | | | |
2008 compared with 2007
Economic briefing
Growth in mainland China was steady during 2008, although lower than in previous years. Overall GDP growth totalled 9 per cent in 2008, down from 13 per cent in 2007, as weakness in key export markets led to a slowdown in industrial activity during the final months of the year. The tightening of monetary conditions in 2007 and early 2008 also contributed to the slowdown, although interest rates and reserve requirements were both reduced significantly during the final months of the year and a significant fiscal stimulus package was also announced. Consumer spending continued to advance at a strong pace with retail spending increasing by 21.6 per cent over the course of 2008. After accelerating to an eleven year high of 8.7 per cent in February 2008, consumer price inflation slowed to 1.2 per cent by the year-end, largely reflecting the movements in food and energy prices. The renminbi appreciated by more than 6 per cent against the US dollar during 2008, although the exchange rate was little changed during the second half of the year.
Japan’s economy slowed sharply during the course of 2008, with industrial activity declining rapidly during the final quarter of the year in response to much weaker external demand. Contractions were registered in both second and third quarter GDP data, confirming a technical recession, while the unemployment rate rose from 3.8 per cent in January 2008 to 4.4 per cent by the year-end. Inflationary pressures increased during the first half before subsiding during the final months of 2008, while measures of business confidence also fell sharply.
The economies of theMiddle East performed strongly for much of 2008, although inflationary concerns were a feature for much of the year, driven by the surge in oil prices to record levels and private and public investment expenditure. High oil revenues continued to boost fiscal and current account surpluses throughout the region during 2008, although the impact of the decline in oil prices during the final months of the year, together with the OPEC-mandated production cuts, are expected to lead to slower growth in 2009.
Elsewhere in Asia, most economies followed an uneven pattern of growth during 2008. Policymakers focused on the rise in inflation during the first half of the year, but the sharp slowdown in growth during the final months of 2008 came to dominate, with a series of monetary and fiscal policy measures being introduced across the region to stimulate activity. The sustained rise in inflation prompted the Reserve Bank ofIndia to tighten policy by raising both interest rates and reserve requirements during the first half of 2008, before then cutting the cash reserve ratio by 350 basis points and the repo rate by 250 basis points during the final quarter of the year. A recession was confirmed inSingapore after GDP contracted for three consecutive quarters in 2008, as an economic slowdown initially focused on specific industries turned more pervasive. After rising to a 26-year high of 7.5 per cent in June 2008, the annual rate of inflation slowed to 4.3 per cent by the year-end.
Inflation also proved the predominant concern inVietnam during the first half of 2008 as the annual rate of consumer price inflation more than doubled to 28.3 per cent, prompting the State Bank of Vietnam to sanction substantial interest rate
109
Back to Contents
| H S B C H O L D I N G S P L C |
| |
| Report of the Directors: Operating and Financial Review(continued) |
| | |
| | |
| Geographical regions > Rest of Asia-Pacific > 2008 |
Profit before tax
| | 2008 | | | 2007 | | | 2006 | | |
| Rest of Asia-Pacific (including the Middle East) | US$m | | | US$m | | | US$m | | |
| | | | | | | | | | |
| Net interest income | 5,493 | | | 4,143 | | | 3,047 | | |
| Net fee income | 2,558 | | | 2,246 | | | 1,622 | | |
| Net trading income | 2,444 | | | 1,643 | | | 1,181 | | |
| Changes in fair value of long-term debt issued and related derivatives | 1 | | | 1 | | | – | | |
| Net income/(expense) from other financial instruments designated at fair value | (172 | ) | | 110 | | | 79 | | |
| Net income/(expense) from financial instruments designated at fair value | (171 | ) | | 111 | | | 79 | | |
| Gains less losses from financial investments | 32 | | | 38 | | | 41 | | |
| Gains arising from dilution of interests in associates | – | | | 1,081 | | | – | | |
| Dividend income | 4 | | | 8 | | | 5 | | |
| Net earned insurance premiums | 197 | | | 226 | | | 174 | | |
| Other operating income | 1,064 | | | 798 | | | 765 | | |
| |
| | |
| | |
| | |
| Total operating income | 11,621 | | | 10,294 | | | 6,914 | | |
| Net insurance claims incurred and movement in liabilities to policyholders | 28 | | | (253 | ) | | (192 | ) | |
| |
| | |
| | |
| | |
| Net operating income before loan impairment charges and other credit risk provisions | 11,649 | | | 10,041 | | | 6,722 | | |
| Loan impairment charges and other credit risk provisions | (1,131 | ) | | (616 | ) | | (512 | ) | |
| |
| | |
| | |
| | |
| Net operating income | 10,518 | | | 9,425 | | | 6,210 | | |
| Total operating expenses | (5,663 | ) | | (4,764 | ) | | (3,548 | ) | |
| |
| | |
| | |
| | |
| Operating profit | 4,855 | | | 4,661 | | | 2,662 | | |
| Share of profit in associates and joint ventures | 1,613 | | | 1,348 | | | 865 | | |
| |
| | |
| | |
| | |
| Profit before tax | 6,468 | | | 6,009 | | | 3,527 | | |
| |
| | |
| | |
| | |
| | | | | | | | | | |
| | % | | | % | | | % | | |
| | | | | | | | | | |
| Share of HSBC’s profit before tax | 69.5 | | | 24.8 | | | 16.0 | | |
| Cost efficiency ratio | 48.6 | | | 47.4 | | | 52.8 | | |
| Year-end staff numbers (full-time equivalent) | 98,159 | | | 88,573 | | | 72,265 | | |
Balance sheet data15
| | At 31 December | |
|
| |
| | 2008 | | 2007 | | 2006 | |
| | US$m | | US$m | | US$m | |
| | | | | | | |
| Loans and advances to customers (net) | 107,956 | | 101,852 | | 77,574 | |
| Loans and advances to banks (net) | 36,141 | | 39,861 | | 27,517 | |
| Trading assets, financial assets designated at fair value, and financial investments | 61,223 | | 64,381 | | 41,585 | |
| Total assets | 262,305 | | 243,205 | | 175,010 | |
| Deposits by banks | 13,689 | | 17,560 | | 10,323 | |
| Customer accounts | 159,359 | | 150,233 | | 108,995 | |
For footnote, see page 143.
All commentaries on Rest of Asia-Pacific are on an underlying basis unless stated otherwise.
increases, before these measures were rapidly reversed during the final months of the year. Interest rate increases were also forthcoming inIndonesia between May and October 2008, although with growth levels maintaining a relatively robust level during much of the year, a tentative easing cycle was only initiated during the final weeks of 2008. Bank NegaraMalaysia proved the exception by refraining
from interest rate increases during the year, even as consumer price inflation accelerated to 8.5 per cent in July 2008, before cutting the policy rate to 3.25 per cent in November. The outlook for theSouth Korean economy was affected by the open nature of the economy and the relatively high levels of household and corporate sector indebtedness. Full year GDP rose by 2.5 per cent in 2008, down from
110
Back to Contents
5.0 per cent in 2007 and the weakest performance for ten years, while fourth quarter GDP fell by 3.4 per cent on a year-on-year basis. Rising food prices proved particularly problematic for thePhilippines during the first half of the year as inflation moved
well above the central bank’s targeted range, although the earlier tightening of monetary policy was partially reversed at the end of 2008. Growth slowed sharply inTaiwan during the course of the year, driven by deteriorating conditions overseas.
Reconciliation of reported and underlying profit before tax
| | 2008 compared with 2007 | |
| |
|
|
|
|
|
|
|
|
|
|
|
|
|
|
|
|
| |
| | | | 2007 | | | | | | | | | | | | | | | |
| | | | acquisitions, | | | | 2007 | | 2008 | | | | | | | | | |
| | | | disposals | | | | at 2008 | | acquisitions | | | | | | | | | |
| Rest of Asia-Pacific | 2007 as | | & dilution | | Currency | | exchange | | and | | Underlying | | 2008 as | | Reported | | Underlying | |
| (including the | reported | | gains | 1 | translation | 2 | rates | 3 | disposals | 1 | change | | reported | | change | | change | |
| Middle East) | US$m | | US$m | | US$m | | US$m | | US$m | | US$m | | US$m | | % | | % | |
| | | | | | | | | | | | | | | | | | | |
| Net interest income | 4,143 | | – | | 43 | | 4,186 | | 31 | | 1,276 | | 5,493 | | 33 | | 30 | |
| Net fee income | 2,246 | | – | | 24 | | 2,270 | | 3 | | 285 | | 2,558 | | 14 | | 13 | |
| Other income4 | 3,652 | | (1,081 | ) | 18 | | 2,589 | | 70 | | 939 | | 3,598 | | (1 | ) | 36 | |
| |
| |
| |
| |
| |
| |
| |
| | | | | |
| Net operating income5 | 10,041 | | (1,081 | ) | 85 | | 9,045 | | 104 | | 2,500 | | 11,649 | | 16 | | 28 | |
Loan impairment charges and other credit risk provisions | (616 | ) | – | | 14 | | (602 | ) | – | | (529 | ) | (1,131 | ) | (84 | ) | (88 | ) |
| |
| |
| |
| |
| |
| |
| |
| | | | | |
| Net operating income | 9,425 | | (1,081 | ) | 99 | | 8,443 | | 104 | | 1,971 | | 10,518 | | 12 | | 23 | |
| Operating expenses | (4,764 | ) | – | | (17 | ) | (4,781 | ) | (110 | ) | (772 | ) | (5,663 | ) | (19 | ) | (16 | ) |
| |
| |
| |
| |
| |
| |
| |
| | | | | |
| Operating profit | 4,661 | | (1,081 | ) | 82 | | 3,662 | | (6 | ) | 1,199 | | 4,855 | | 4 | | 33 | |
| Income from associates | 1,348 | | – | | 93 | | 1,441 | | – | | 172 | | 1,613 | | 20 | | 12 | |
| |
| |
| |
| |
| |
| |
| |
| | | | | |
| Profit before tax | 6,009 | | (1,081 | ) | 175 | | 5,103 | | (6 | ) | 1,371 | | 6,468 | | 8 | | 27 | |
| |
| |
| |
| |
| |
| |
| |
| | | | | |
For footnotes, see page 143.
Review of business performance
HSBC’s operations in Rest of Asia-Pacific performed strongly, reporting a pre-tax profit of US$6.5 billion compared with US$6.0 billion in 2007, an increase of 8 per cent. HSBC continued to increase its presence in key markets, augmenting organic growth with the integration of the operations of The Chinese Bank in Taiwan and the purchase of IL&FS Investsmart Ltd in India, which was completed in September. On an underlying basis, excluding the dilution gains on Chinese associates of US$1.1 billion recorded in 2007 and the acquisitions noted above, profit before tax increased by 27 per cent, with notable growth in the Middle East, South Korea, mainland China, India, and an increased contribution from associates in the region. Branches were added in mainland China, Indonesia, Japan, Malaysia and Bangladesh.
Net interest income increased by 30 per cent, with growth across most major countries and all customer groups. Deposit acquisition and related asset deployment across the region drove net interest income, though this volume growth was partly offset by deposit spread compression in the second half of the year due to declining interest rates, compounded by strong competition to acquire deposits.
In the Middle East, net interest income increased by 42 per cent, with deposit growth, notably in Personal Financial Services. This supported a strong rise in corporate lending balances aligned to trade and infrastructure investments, as well as increased personal lending, in particular credit cards. Asset spreads benefited from declines in local base rates following US dollar interest rate cuts, which resulted in a lower cost of funds.
In India, net interest income increased by 44 per cent as deposit balances in Personal Financial Services and Commercial Banking rose due to customer acquisition, notably among small businesses following the launch of the HSBC Direct for Business product. These deposits were deployed in increasing lending, where spreads improved on the corporate lending and credit card portfolios and mortgage spreads widened following a re-pricing in the second half of the year.
In mainland China, net interest income also rose due to deposit growth, as investors increasingly preferred deposits over market-led investments
111
Back to Contents
| H S B C H O L D I N G S P L C |
| |
| Report of the Directors: Operating and Financial Review(continued) |
| | |
| | |
| Geographical regions > Rest of Asia-Pacific > 2008 / 2007 |
as market sentiment deteriorated. This facilitated an increase in personal lending balances following branch network expansion and successful re-pricing initiatives on corporate and commercial loans.
There was strong growth in net interest income from Balance Sheet Management within Global Banking and Markets, due to lower funding costs and steeper yield curves, notably in Singapore, mainland China, India, Japan and the Middle East.
Net fee income rose by 13 per cent, driven by a growth in fees from personal credit cards and trade and supply chain services. Credit card fees rose, particularly in the Middle East and India, driven by increases in interchange fees from higher cardholder spending and late payment and over-limit fees from higher delinquencies (see below). Trade and supply chain services contributed strongly to fee income growth with an increase of 34 per cent in the Middle East, in part reflecting the significant rise in commodity prices in the first half of the year, demonstrably in the construction and infrastructure industries in the UAE. There were lower fees from investment products and broking across the region, driven by a decline in equity markets and weakened investor sentiment.
Fee income from credit facilities rose, notably in the Middle East, India, Australia and Singapore, reflecting increases in the number of customers.
Net trading income rose by 51 per cent, predominantly due to strong Rates and foreign exchange trading across the region as volatile market conditions continued, encouraging increased corporate hedging activity.
Growth was particularly strong in South Korea, mainland China and Australia due to strategic positioning of HSBC’s balance sheet to benefit from the interest rate cuts and foreign exchange volatility in 2008, and increased activity in these local markets. In the Middle East, market uncertainty regarding possible currency revaluations drove volatility and, together with robust client demand, led to growth in foreign exchange income. In India, foreign exchange and, to a lesser extent, Rates revenues rose, driven mainly by increased customer activity and high levels of market volatility.
A net loss fromfinancial instruments designated at fair value of US$171 million was recorded compared with income of US$111 million in 2007. Declines in equity markets affected unit-linked insurance products, particularly in Singapore. This was largely offset by a corresponding decrease in
liabilities to policyholders reflected innet insurance claims incurred and movement in liabilities to policyholders.
Net earned insurance premiums decreased by 17 per cent to US$197 million, mainly in Singapore and Malaysia due to lower sales of single premium unit-linked products. This was partly offset by an increase in the sale of general insurance products.
Loan impairment charges rose sharply, increasing by 88 per cent to US$1.1 billion, following a marked deterioration in credit quality across the region in the final quarter of the year. These charges rose most significantly in India, the Middle East and, to a lesser extent, in Australia.
In India, the rise was attributable to increased delinquency across personal lending portfolios, in response to which HSBC took action to restrict mortgage and personal lending. However, HSBC continued to extend credit to selected cards customers, which resulted in volume growth and also contributed to higher loan impairment charges.
In the Middle East, higher loan impairment charges were the result of volume growth and increased delinquency rates on personal lending. In Australia, higher delinquencies arose from the maturing of the cards portfolio and, to a lesser extent, volume growth, in addition to a credit risk provision related to an exposure to an Icelandic Bank. Partly offsetting this, loan impairment charges declined by 41 per cent in Taiwan due to an improvement in asset quality. Similarly, in Thailand, loan impairment charges were 69 per cent lower due to the non-recurrence of charges attributable to the down-grading of certain corporate customers.
Operating expenses increased by 16 per cent to US$5.7 billion. Significant investment in the region continued, notably in mainland China where 29 new outlets were opened and staff numbers increased. Related premises and equipment costs rose accordingly. Expansion was also pursued in Indonesia with the addition of new branches, and in Japan with the rollout of seven HSBC Premier centres. In the Middle East, operating expenses were 22 per cent higher in line with substantially increased levels of operating volumes and related headcount growth. In India, the rise in operating expenses was driven mainly by investment in IT, premises costs and an increase in collection activities as default rates rose. Business growth contributed to higher operating expenses in Australia. Litigation costs in the region rose.
112
Back to Contents
Growth in operating expenses at the Group Service and Software Development Centres was driven by increased volumes of activity as HSBC continued to implement a global resourcing strategy to minimise costs throughout the Group. All related costs are recharged to other Group entities and the income is reported withinOther operating income.
Profit from associates and joint ventures in the region increased by 12 per cent, notwithstanding a significant impairment recorded in Ping An Insurance in respect of its stake in Fortis Bank. Growth was strong across HSBC’s other principal associates, the Bank of Communications, Industrial Bank, and the Saudi British Bank.
2007 compared with 2006
Economic briefingMainland China’s economy continued to grow strongly, with GDP rising by 11.4 per cent in 2007, the fifth consecutive year of double-digit growth; this was despite a combination of measures aimed at curbing investment, such as increases in interest rates and reserve ratios required for banks. Economic performance remained primarily dependent on investment and exports. Bank loan growth also remained very strong. Export growth slowed from very high levels as the year progressed, reflecting the mild downturn in global trade. Consumer spending grew steadily in 2007, with retail sales rising by about 16 per cent. Inflationary pressures increased, with consumer price inflation exceeding 6 per cent towards the end of the year, mainly due to higher food prices. Mainland China’s foreign exchange reserves rose further, to more than US$1.5 trillion, while the renminbi appreciated by over 5 per cent against the US dollar in 2007.
Japan’s economy, the largest in the region, expanded modestly in 2007. Private capital investment decelerated after five years of firm growth but a rise in exports, especially to Asia, drove overall growth. Private consumption also made a positive contribution, helped by a gradual increase in employees’ income. Core consumer price inflation remained around zero throughout the course of the year.
In theMiddle East, economies continued to grow, although growth rates slowed slightly on those recorded in 2006, largely as a result of OPEC-mandated cuts in oil production. Underlying
economic performance was robust, however, led by continued non-oil sector growth. The catalyst for expansion was a fifth consecutive year of rising oil prices, which facilitated continued growth in public and private investment. Consumption rose as employment levels increased and low interest rates supported an ongoing expansion in credit. Strong population growth, accelerated in parts of the region by high levels of immigration, also boosted demand for credit. High oil revenues resulted in a further year of fiscal and current account surpluses throughout the Middle East, boosting reserves and holdings of overseas assets. Rapid economic growth, low interest rates and currency weakness increased inflation, however, fuelling demands in some quarters for adjustments to the long-standing dollar pegs. Regional equity markets recovered from their 2005-06 downturns to perform strongly in 2007.
Elsewhere in the region, the Indian economy expanded by 8.7 per cent in 2007, although there was evidence that recent interest rate rises and the strength of the rupee were slowing some areas of the economy, and inflationary pressures eased in 2007. The economies of Vietnam and Singapore recorded strong performances too, expanding by 8.5 per cent and 7.7 per cent, respectively in 2007. Growth was approximately 6 per cent in Indonesia and Malaysia. Domestic demand in all these countries has become an increasingly important source of GDP growth with investment, particularly in the construction sector, expanding rapidly. Inflationary pressures intensified in 2007, largely as a result of higher oil and food prices, but remained under control. The South Korean economy accelerated in 2007 as exports continued to flourish and household spending recovered from levels recorded in 2006. Concerns over liquidity growth prompted the central bank to increase interest rates by 50 basis points to 5 per cent during the year. A gradual cooling of demand and concerns over rapid exchange rate appreciation are expected to limit the scope for further interest rate rises in 2008. Buoyant exports supported economic growth in Taiwan, while domestic demand remained lacklustre due to a lack of government initiatives which is expected to continue beyond the presidential and parliamentary elections scheduled for 2008. Generally robust economic performances in the Philippines, Thailand, and Pakistan in 2007 were overshadowed to varying degrees by political risks.
113
Back to Contents
| H S B C H O L D I N G S P L C |
| |
| Report of the Directors: Operating and Financial Review(continued) |
| | |
| | |
| Geographical regions > Rest of Asia-Pacific > 2007 |
Reconciliation of reported and underlying profit before tax
| | 2007 compared with 2006 | |
| |
| |
| | | | | | | | | | 2007 | | | | | | | | | |
| | | | 2006 | | | | 2006 | | acquisitions, | | | | | | | | | |
| | 2006 | | acquisitions | | | | at 2007 | | disposals | | | | 2007 | | | | | |
| | as | | and | | Currency | | exchange | | & dilution | | Under-lying | | as | | Reported | | Underlying | |
| Rest of Asia-Pacific | reported | | disposals | 1 | translation | 2 | rates | 6 | gains | 1 | change | | reported | | change | | change | |
| (including the Middle East) | US$m | | US$m | | US$m | | US$m | | US$m | | US$m | | US$m | | % | | % | |
| | | | | | | | | | | | | | | | | | | |
| Net interest income | 3,047 | | – | | 140 | | 3,187 | | – | | 956 | | 4,143 | | 36 | | 30 | |
| Net fee income | 1,622 | | – | | 58 | | 1,680 | | – | | 566 | | 2,246 | | 38 | | 34 | |
| Other income4 | 2,053 | | – | | 108 | | 2,161 | | 1,081 | | 410 | | 3,652 | | 78 | | 19 | |
| |
| |
| |
| |
| |
| |
| |
| | | | | |
| Net operating income5 | 6,722 | | – | | 306 | | 7,028 | | 1,081 | | 1,932 | | 10,041 | | 49 | | 27 | |
Loan impairment charges and other credit risk provisions | (512 | ) | – | | (13 | ) | (525 | ) | – | | (91 | ) | (616 | ) | (20 | ) | (17 | ) |
| |
| |
| |
|
|
| |
| |
| |
| | | | | |
| Net operating income | 6,210 | | – | | 293 | | 6,503 | | 1,081 | | 1,841 | | 9,425 | | 52 | | 28 | |
| Operating expenses | (3,548 | ) | – | | (179 | ) | (3,727 | ) | – | | (1,037 | ) | (4,764 | ) | (34 | ) | (28 | ) |
| |
| |
| |
|
|
| |
| |
| |
| | | | | |
| Operating profit | 2,662 | | – | | 114 | | 2,776 | | 1,081 | | 804 | | 4,661 | | 75 | | 29 | |
| Income from associates | 865 | | – | | 25 | | 890 | | – | | 458 | | 1,348 | | 56 | | 51 | |
| |
| |
| |
|
|
| |
| |
| |
| | | | | |
| Profit before tax | 3,527 | | – | | 139 | | 3,666 | | 1,081 | | 1,262 | | 6,009 | | 70 | | 34 | |
| |
| |
| |
| |
| |
| |
| |
| | | | | |
For footnotes, see page 143.
Review of business performance
HSBC’s operations in Rest of Asia-Pacific reported a pre-tax profit of US$6.0 billion compared with US$3.5 billion in 2006, an increase of 70 per cent. On an underlying basis, excluding dilution gains of US$1.1 billion, profit before tax increased by 34 per cent, bolstered by sustained growth and business expansion across the region.
In Global Banking and Markets, profit before tax increased significantly, driven by an enhanced product offering combined with buoyant local markets. Commercial Banking revenue benefited from increased customer volumes as a result of new and enhanced banking services. In Personal Financial Services, profit before tax rose as a result of strong balance sheet growth and increased contributions from associates. Private Banking delivered a solid performance, underpinned by robust stock markets and increasing wealth in the region.
HSBC’s three associates in mainland China, Ping An Insurance, Bank of Communications and Industrial Bank, all raised new capital in 2007 in the ‘A’ share market in Shanghai in which HSBC, as a foreign investor, was unable to participate. The dilution of the Group’s interests was considerably less than its share of the new monies, resulting in gains of US$1.1 billion which should be regarded as exceptional.
Net interest income rose by 30 per cent. Continued expansion of the branch network, particularly in the populous markets of mainland
China, Indonesia and India, together with increased marketing expenditure and greater brand awareness, accelerated customer acquisition and growth in loans and deposits.
In the Middle East, the significant increase in net interest income was driven by balance sheet growth across all customer groups and augmented by improved spreads. The growth was underpinned by strong local economies, higher oil prices and demand for credit for infrastructure investment and trade.
In Global Banking and Markets, the rise in net interest income was driven by the recovery in Balance Sheet Management revenues and, as trade and investment flows increased, by higher transactional balances in the payments and cash management businesses.
In Personal Financial Services, net interest income rose by 23 per cent, driven by higher personal lending, credit cards and deposit balances. Growth was broad-based across the region. Commercial Banking net interest income grew by 29 per cent due to volume growth in both loans and deposits following an increase in customer numbers.
Fee income increased by 34 per cent. Buoyant stock markets stimulated customer appetite for unit trusts and other investment products. Strong investment sales were recorded in India, Philippines, South Korea, Singapore and mainland China. Security services increased, driven by a sustained level of transaction volumes and investment flows. In the Middle East, increases were registered in cards,
114
Back to Contents
global custody, credit facilities and insurance. Increased trade services income in the region reflected higher intra-regional trade flows, which were driven by the favourable economic conditions.
Strongtrading income growth was delivered, led by foreign exchange trading, where higher volumes were driven by increased volatility which, in turn, increased customer demand for risk management products.
Net earned insurance premiums rose by 24 per cent to US$226 million. This growth was mainly generated in Malaysia by the HSBC Amanah Takaful business which was launched in late 2006, offeringshariah-compliant insurance products.
Other operating income decreased by 2 per cent, partly because gains on disposals of certain businesses in Australia were recorded in 2006. Similarly, profits from the disposal of assets held for sale decreased due to the non-recurrence of profits on sale of properties in Japan and India.
Net insurance claims incurred and movement in liabilities to policyholders rose by 25 per cent to US$253 million, in line with the increase in premiums, mainly in Malaysia.
Loan impairment charges rose by 17 per cent to US$616 million as corporate loan impairment charges increased in several countries. In addition, loan impairment charges in India rose due to balance sheet growth and higher loss rates on credit cards. Partly offsetting these factors, loan impairment charges were significantly lower in Taiwan due to the non-recurrence of impairment charges in 2006 which resulted from regulatory intervention in the card market and the imposition of a government debt negotiation scheme. In Indonesia, performance improved on 2006 when loan impairment charges
were affected by the introduction of minimum repayment terms.
Operating expenses increased by 28 per cent in line with the rise in net operating income before loan impairment charges. Business expansion continued throughout the region. Staff costs in India, mainland China and the Middle East rose on increases in volume-driven headcount and performance-related bonuses, the latter due to higher revenue generation. Business expansion initiatives were taken in mainland China, where an additional 27 new branches or sub-branches were opened. In India, the branch network and the consumer finance and credit card businesses were all expanded. Marketing, technology and infrastructure costs were incurred in support of business expansion.
Share of profit in associates and joint ventures in the region rose by 51 per cent, mainly due to increased contributions from HSBC’s strategic investments in mainland China, Bank of Communications, Ping An Insurance and Industrial Bank. HSBC’s share of profit from Ping An Insurance rose by 101 per cent to US$518 million as a result of robust growth, notably from life insurance products, and the realisation of synergistic gains across Ping An Insurance’s other business offerings. Profit from the Bank of Communications rose by 64 per cent to US$445 million as a result of improved performance across the associate’s various product offerings. Increased income from credit and treasury products and significant growth in fee income contributed to the rise in profits. HSBC’s share of profits from the Saudi British Bank decreased by 22 per cent to US$216 million. This was largely due to the effects of a significant correction to the local stock market in the second half of 2006.
115
Back to Contents
| H S B C H O L D I N G S P L C |
| |
| Report of the Directors: Operating and Financial Review(continued) |
| | |
| | |
| Geographical regions > Rest of Asia-Pacific > Profit before tax by customer group |
Analysis by customer group and global business
Profit before tax
| | 2008 | |
| |
| | |
| | Personal | | | | | | Global | | | | | | | | | Inter- | | | | | |
| | Financial | | | Commercial | | | Banking & | | | Private | | | | | | segment | | | | | |
| Services | | | Banking | | | Markets | | | Banking | | | Other | | | elimination | 21 | | Total | | |
| Rest of Asia-Pacific (includingthe Middle East) | US$m | | | US$m | | | US$m | | | US$m | | | US$m | | | US$m | | | US$m | | |
| | | | | | | | | | | | | | | | | | | | | | |
| Net interest income | 2,360 | | | 1,444 | | | 1,886 | | | 106 | | | 185 | | | (488 | ) | | 5,493 | | |
| Net fee income | 819 | | | 597 | | | 1,048 | | | 77 | | | 17 | | | – | | | 2,558 | | |
| Trading income/(expense) excluding net interest income | 112 | | | 187 | | | 1,477 | | | 77 | | | (30 | ) | | – | | | 1,823 | | |
| Net interest income/(expense)on trading activities | (5 | ) | | – | | | 143 | | | – | | | (5 | ) | | 488 | | | 621 | | |
| Net trading income/(expense)16 | 107 | | | 187 | | | 1,620 | | | 77 | | | (35 | ) | | 488 | | | 2,444 | | |
Changes in fair value of long-term debt issued and related derivatives | – | | | – | | | – | | | – | | | 1 | | | – | | | 1 | | |
Net income/(expense) from other financial instruments designated at fair value | (172 | ) | | – | | | (4 | ) | | – | | | 4 | | | – | | | (172 | ) | |
Net income/(expense) from financial instruments designated at fair value | (172 | ) | | – | | | (4 | ) | | – | | | 5 | | | – | | | (171 | ) | |
| | | | | | | | | | | | | | | | | | | | | | |
| Gains less losses from financial investments | 29 | | | 3 | | | – | | | – | | | – | | | – | | | 32 | | |
| Dividend income | – | | | – | | | 4 | | | – | | | – | | | – | | | 4 | | |
| Net earned insurance premiums | 172 | | | 25 | | | – | | | – | | | – | | | – | | | 197 | | |
| Other operating income | 79 | | | 84 | | | 90 | | | 2 | | | 1,096 | | | (287 | ) | | 1,064 | | |
| |
| | |
| | |
| | |
| | |
| | |
| | |
| | |
| Total operating income | 3,394 | | | 2,340 | | | 4,644 | | | 262 | | | 1,268 | | | (287 | ) | | 11,621 | | |
| Net insurance claims17 | 42 | | | (14 | ) | | – | | | – | | | – | | | – | | | 28 | | |
| |
| | |
| | |
| | |
| | |
| | |
| | |
| | |
| Net operating income5 | 3,436 | | | 2,326 | | | 4,644 | | | 262 | | | 1,268 | | | (287 | ) | | 11,649 | | |
| Loan impairment charges and other credit risk provisions | (863 | ) | | (182 | ) | | (85 | ) | | (1 | ) | | – | | | – | | | (1,131 | ) | |
| |
| | |
| | |
| | |
| | |
| | |
| | |
| | |
| Net operating income | 2,573 | | | 2,144 | | | 4,559 | | | 261 | | | 1,268 | | | (287 | ) | | 10,518 | | |
| Total operating expenses | (2,527 | ) | | (953 | ) | | (1,298 | ) | | (148 | ) | | (1,024 | ) | | 287 | | | (5,663 | ) | |
| |
| | |
| | |
| | |
| | |
| | |
| | |
| | |
| Operating profit | 46 | | | 1,191 | | | 3,261 | | | 113 | | | 244 | | | – | | | 4,855 | | |
| Share of profit in associates and joint ventures | 454 | | | 602 | | | 525 | | | – | | | 32 | | | – | | | 1,613 | | |
| |
| | |
| | |
| | |
| | |
| | |
| | |
| | |
| Profit before tax | 500 | | | 1,793 | | | 3,786 | | | 113 | | | 276 | | | – | | | 6,468 | | |
| |
| | |
| | |
| | |
| | |
| | |
| | |
| | |
| | | | | | | | | | | | | | | | | | | | | | |
| | % | | | % | | | % | | | % | | | % | | | | | | % | | |
| | | | | | | | | | | | | | | | | | | | | | |
| Share of HSBC’s profit before tax | 5.4 | | | 19.3 | | | 40.7 | | | 1.2 | | | 2.9 | | | | | | 69.5 | | |
| Cost efficiency ratio | 73.5 | | | 41.0 | | | 28.0 | | | 56.5 | | | 80.8 | | | | | | 48.6 | | |
| | | | | | | | | | | | | | | | | | | | | | |
| Balance sheet data15 | | | | | | | | | | | | | | | | | | | | | |
| | US$m | | | US$m | | | US$m | | | US$m | | | US$m | | | | | | US$m | | |
| | | | | | | | | | | | | | | | | | | | | | |
| Loans and advances to customers (net) | 34,860 | | | 35,188 | | | 34,590 | | | 2,989 | | | 329 | | | | | | 107,956 | | |
| Total assets | 44,478 | | | 43,702 | | | 172,049 | | | 12,486 | | | 702 | | | (11,112 | ) | | 262,305 | | |
| Customer accounts | 56,531 | | | 36,350 | | | 50,605 | | | 14,475 | | | 1,398 | | | | | | 159,359 | | |
| | | | | | | | | | | | | | | | | | | | | | |
| For footnotes, see page 143. |
116
Back to Contents
| | 2007 | | |
| |
| | |
| | Personal | | | | | | Global | | | | | | | | | Inter- | | | | | |
| | Financial | | | Commercial | | | Banking & | | | Private | | | | | | segment | | | | | |
| | Services | | | Banking | | | Markets | | | Banking | | | Other | | | elimination | 21 | | Total | | |
| Rest of Asia-Pacific (including the Middle East) | US$m | | | US$m | | | US$m | | | US$m | | | US$m | | | US$m | | | US$m | | |
| Net interest income | 1,965 | | | 1,131 | | | 1,295 | | | 60 | | | 153 | | | (461 | ) | | 4,143 | | |
| Net fee income | 766 | | | 429 | | | 952 | | | 85 | | | 14 | | | – | | | 2,246 | | |
| Trading income/(expense) excluding net interest income | 72 | | | 129 | | | 1,000 | | | 71 | | | (70 | ) | | – | | | 1,202 | | |
| Net interest income/(expense) on trading activities | (2 | ) | | – | | | (22 | ) | | – | | | 4 | | | 461 | | | 441 | | |
| Net trading income/(expense)16 | 70 | | | 129 | | | 978 | | | 71 | | | (66 | ) | | 461 | | | 1,643 | | |
| Changes in fair value of long-term debt issued and related derivatives | – | | | – | | | – | | | – | | | 1 | | | – | | | 1 | | |
Net income/(expense) fromother financial instrumentsdesignated at fair value | 73 | | | 4 | | | (3 | ) | | (1 | ) | | 37 | | | – | | | 110 | | |
Net income/(expense) fromfinancial instrumentsdesignated at fair value | 73 | | | 4 | | | (3 | ) | | (1 | ) | | 38 | | | – | | | 111 | | |
| Gains less losses from financial investments | 5 | | | 4 | | | 28 | | | – | | | 1 | | | – | | | 38 | | |
| Gains arising from dilution of interests in associates | – | | | – | | | – | | | – | | | 1,081 | | | – | | | 1,081 | | |
| Dividend income | – | | | – | | | 2 | | | – | | | 6 | | | – | | | 8 | | |
| Net earned insurance premiums | 209 | | | 16 | | | – | | | – | | | 1 | | | – | | | 226 | | |
| Other operating income | 40 | | | 15 | | | 53 | | | 2 | | | 849 | | | (161 | ) | | 798 | | |
| |
| | |
| | |
| | |
| | |
| | |
| | |
| | |
| Total operating income | 3,128 | | | 1,728 | | | 3,305 | | | 217 | | | 2,077 | | | (161 | ) | | 10,294 | | |
| Net insurance claims17 | (246 | ) | | (7 | ) | | – | | | – | | | – | | | – | | | (253 | ) | |
| |
| | |
| | |
| | |
| | |
| | |
| | |
| | |
| Net operating income5 | 2,882 | | | 1,721 | | | 3,305 | | | 217 | | | 2,077 | | | (161 | ) | | 10,041 | | |
Loan impairment charges andother credit risk provisions | (552 | ) | | (61 | ) | | (3 | ) | | – | | | – | | | – | | | (616 | ) | |
| |
| | |
| | |
| | |
| | |
| | |
| | |
| | |
| Net operating income | 2,330 | | | 1,660 | | | 3,302 | | | 217 | | | 2,077 | | | (161 | ) | | 9,425 | | |
| Total operating expenses | (2,131 | ) | | (739 | ) | | (1,140 | ) | | (125 | ) | | (790 | ) | | 161 | | | (4,764 | ) | |
| |
| | |
| | |
| | |
| | |
| | |
| | |
| | |
| Operating profit | 199 | | | 921 | | | 2,162 | | | 92 | | | 1,287 | | | – | | | 4,661 | | |
| Share of profit in associates and joint ventures | 561 | | | 429 | | | 302 | | | – | | | 56 | | | – | | | 1,348 | | |
| |
| | |
| | |
| | |
| | |
| | |
| | |
| | |
| Profit before tax | 760 | | | 1,350 | | | 2,464 | | | 92 | | | 1,343 | | | – | | | 6,009 | | |
| |
| | |
| | |
| | |
| | |
| | |
| | |
| | |
| |
| | % | | | % | | | % | | | % | | | % | | | | | | % | | |
| | | | | | | | | | | | | | | | | | | | | | |
| Share of HSBC’s profitbefore tax | 3.1 | | | 5.6 | | | 10.2 | | | 0.4 | | | 5.5 | | | | | | 24.8 | | |
| Cost efficiency ratio | 73.9 | | | 42.9 | | | 34.5 | | | 57.6 | | | 38.0 | | | | | | 47.4 | | |
| |
| Balance sheet data15 | | | | | | | | | | | | | | | | | | | | | |
| | US$m | | | US$m | | | US$m | | | US$m | | | US$m | | | | | | US$m | | |
| | | | | | | | | | | | | | | | | | | | | | |
| Loans and advances tocustomers (net) | 34,486 | | | 32,159 | | | 32,106 | | | 2,955 | | | 146 | | | | | | 101,852 | | |
| Total assets | 42,337 | | | 39,743 | | | 155,106 | | | 9,294 | | | 4,756 | | | (8,031 | ) | | 243,205 | | |
| Customer accounts | 49,703 | | | 34,891 | | | 54,120 | | | 11,116 | | | 403 | | | | | | 150,233 | | |
| |
| For footnotes, see page 143. |
117
Back to Contents
| H S B C H O L D I N G S P L C |
| |
| Report of the Directors: Operating and Financial Review(continued) |
| | |
| | |
| Geographical regions > Rest of Asia-Pacific > Profit before tax by customer group // North America > 2008 |
Analysis by customer group and global business(continued)
Profit before tax
| | 2006 | | |
| |
| | |
| | Personal | | | | | | Global | | | | | | | | | Inter- | | | | | |
| | Financial | | | Commercial | | | Banking & | | | Private | | | | | | segment | | | | | |
| | Services | | | Banking | | | Markets | | | Banking | | | Other | | | elimination | 21 | | Total | | |
| Rest of Asia-Pacific (including the Middle East) | US$m | | | US$m | | | US$m | | | US$m | | | US$m | | | US$m | | | US$m | | |
| |
| Net interest income | 1,520 | | | 848 | | | 802 | | | 35 | | | 61 | | | (219 | ) | | 3,047 | | |
| Net fee income | 524 | | | 330 | | | 688 | | | 68 | | | 12 | | | – | | | 1,622 | | |
| Trading income/(expense)excluding net interest income | 61 | | | 86 | | | 717 | | | 74 | | | (3 | ) | | – | | | 935 | | |
| Net interest income on trading activities | – | | | – | | | – | | | – | | | 27 | | | 219 | | | 246 | | |
| Net trading income16 | 61 | | | 86 | | | 717 | | | 74 | | | 24 | | | 219 | | | 1,181 | | |
Changes in fair value of long-term debt issued and relatedderivatives | – | | | – | | | – | | | – | | | – | | | – | | | – | | |
Net income from other financialinstruments designated at fairvalue | 59 | | | 4 | | | 4 | | | – | | | 12 | | | – | | | 79 | | |
| Net income from financialinstruments designated at fair value | 59 | | | 4 | | | 4 | | | – | | | 12 | | | – | | | 79 | | |
| Gains less losses from financial investments | 2 | | | 2 | | | 38 | | | (1 | ) | | – | | | – | | | 41 | | |
| Dividend income | – | | | – | | | 1 | | | – | | | 4 | | | – | | | 5 | | |
| Net earned insurance premiums | 148 | | | 26 | | | – | | | – | | | – | | | – | | | 174 | | |
| Other operating income | 108 | | | 20 | | | 61 | | | – | | | 667 | | | (91 | ) | | 765 | | |
| |
| | |
| | |
| | |
| | |
| | |
| | |
| | |
| Total operating income | 2,422 | | | 1,316 | | | 2,311 | | | 176 | | | 780 | | | (91 | ) | | 6,914 | | |
| Net insurance claims17 | (180 | ) | | (11 | ) | | – | | | – | | | (1 | ) | | – | | | (192 | ) | |
| |
| | |
| | |
| | |
| | |
| | |
| | |
| | |
| Net operating income5 | 2,242 | | | 1,305 | | | 2,311 | | | 176 | | | 779 | | | (91 | ) | | 6,722 | | |
Loan impairment (charges)/recoveries and othercredit risk provisions | (545 | ) | | 29 | | | 5 | | | – | | | (1 | ) | | – | | | (512 | ) | |
| |
| | |
| | |
| | |
| | |
| | |
| | |
| | |
| Net operating income | 1,697 | | | 1,334 | | | 2,316 | | | 176 | | | 778 | | | (91 | ) | | 6,210 | | |
| Total operating expenses | (1,593 | ) | | (554 | ) | | (869 | ) | | (96 | ) | | (527 | ) | | 91 | | | (3,548 | ) | |
| |
| | |
| | |
| | |
| | |
| | |
| | |
| | |
| Operating profit | 104 | | | 780 | | | 1,447 | | | 80 | | | 251 | | | – | | | 2,662 | | |
| Share of profit in associatesand joint ventures | 373 | | | 254 | | | 202 | | | – | | | 36 | | | – | | | 865 | | |
| |
| | |
| | |
| | |
| | |
| | |
| | |
| | |
| Profit before tax | 477 | | | 1,034 | | | 1,649 | | | 80 | | | 287 | | | – | | | 3,527 | | |
| |
| | |
| | |
| | |
| | |
| | |
| | |
| | |
| |
| | % | | | % | | | % | | | % | | | % | | | | | | % | | |
| | | | | | | | | | | | | | | | | | | | | | |
| Share of HSBC’s profitbefore tax | 2.2 | | | 4.7 | | | 7.5 | | | 0.4 | | | 1.2 | | | | | | 16.0 | | |
| Cost efficiency ratio | 71.1 | | | 42.5 | | | 37.6 | | | 54.5 | | | 67.7 | | | | | | 52.8 | | |
| |
| Balance sheet data15 | | | | | | | | | | | | | | | | | | | | | |
| | US$m | | | US$m | | | US$m | | | US$m | | | US$m | | | | | | US$m | | |
| | | | | | | | | | | | | | | | | | | | | | |
| Loans and advances to customers (net) | 28,911 | | | 21,912 | | | 24,311 | | | 2,313 | | | 127 | | | | | | 77,574 | | |
| Total assets | 35,794 | | | 26,757 | | | 109,535 | | | 7,882 | | | – | | | (4,958 | ) | | 175,010 | | |
| Customer accounts | 38,557 | | | 24,228 | | | 36,623 | | | 8,929 | | | 658 | | | | | | 108,995 | | |
| |
| For footnotes, see page 143. |
118
Back to Contents
North America
Profit/(loss) before tax by country within customer groups and global businesses
| | Personal | | | | Global | | | | | | | |
| | Financial | | Commercial | | Banking & | | Private | | | | | |
| | Services | | Banking | | Markets | | Banking | | Other | | Total | |
| | US$m | | US$m | | US$m | | US$m | | US$m | | US$m | |
| 2008 | | | | | | | | | | | | |
| United States23 | (17,364 | ) | 226 | | (2,899 | ) | 67 | | 3,427 | | (16,543 | ) |
| Canada | 106 | | 380 | | 252 | | 5 | | 96 | | 839 | |
| Bermuda | 31 | | 51 | | 72 | | 11 | | 9 | | 174 | |
| Other | (1 | ) | 1 | | – | | – | | 2 | | 2 | |
| |
| |
| |
| |
| |
| |
| |
| | (17,228 | ) | 658 | | (2,575 | ) | 83 | | 3,534 | | (15,528 | ) |
| |
| |
| |
| |
| |
| |
| |
| |
| 2007 | | | | | | | | | | | | |
| United States | (1,824 | ) | 377 | | (1,243 | ) | 156 | | 1,468 | | (1,066 | ) |
| Canada | 265 | | 466 | | 239 | | 8 | | 5 | | 983 | |
| Bermuda | 13 | | 77 | | 39 | | 10 | | 34 | | 173 | |
| Other | – | | – | | – | | – | | 1 | | 1 | |
| |
| |
| |
| |
| |
| |
| |
| | (1,546 | ) | 920 | | (965 | ) | 174 | | 1,508 | | 91 | |
| |
| |
| |
| |
| |
| |
| |
| |
| 2006 | | | | | | | | | | | | |
| United States | 3,128 | | 442 | | 199 | | 107 | | (264 | ) | 3,612 | |
| Canada | 253 | | 437 | | 189 | | – | | 17 | | 896 | |
| Bermuda | 10 | | 78 | | 31 | | 7 | | 29 | | 155 | |
| Other | – | | – | | 4 | | – | | 1 | | 5 | |
| |
| |
| |
| |
| |
| |
| |
| | 3,391 | | 957 | | 423 | | 114 | | (217 | ) | 4,668 | |
| |
| |
| |
| |
| |
| |
| |
| | | | | | | | | | | | | |
| For footnote, see page 143. |
Loans and advances to customers (net) by country
| | At 31 December | |
| |
|
|
|
|
| |
| | 2008 | | 2007 | | 2006 | |
| | US$m | | US$m | | US$m | |
| | | | | | | |
| United States | 208,834 | | 233,706 | | 236,188 | |
| Canada | 44,866 | | 53,891 | | 39,584 | |
| Bermuda | 2,514 | | 2,263 | | 2,215 | |
| |
| |
| |
| |
| | 256,214 | | 289,860 | | 277,987 | |
| |
| |
| |
| |
| | | | | | | |
| Customer accounts by country | | | | | | |
| |
| | At 31 December | |
| |
|
|
|
|
| |
| | 2008 | | 2007 | | 2006 | |
| | US$m | | US$m | | US$m | |
| | | | | | | |
| United States | 101,963 | | 100,034 | | 84,560 | |
| Canada | 33,905 | | 37,061 | | 28,668 | |
| Bermuda | 7,664 | | 8,078 | | 7,694 | |
| |
| |
| |
| |
| | 143,532 | | 145,173 | | 120,922 | |
| |
| |
| |
| |
| | | | | | | |
2008 compared with 2007
Economic briefing
Economic conditions proved very difficult in theUS during 2008 as the economy entered a period of recession. Overall GDP growth slowed to just 1.1 per cent for the year, down from 2 per cent in 2007. In common with many other economies, much of this weakness was concentrated in the final months of 2008 as fourth quarter GDP registered the largest quarterly decline for 26 years. Economic
weakness proved broad-based across most areas of the economy, with the notable exception of net exports. Housing sales and residential construction activity both declined from already depressed levels, with house prices continuing to fall in most regions and mortgage delinquencies continuing to rise. Labour market conditions weakened throughout the course of the year as the unemployment rate rose from 4.9 per cent in January to a 15-year high of 7.2 per cent in December 2008. The annual rate of
119
Back to Contents
| H S B C H O L D I N G S P L C |
| |
| Report of the Directors: Operating and Financial Review(continued) |
| | |
| | |
| Geographical regions > North America > 2008 |
| Profit/(loss) before tax |
| | | 2008 | | | 2007 | | | 2006 | |
| North America | | US$m | | | US$m | | | US$m | |
| | | | | | | | | | |
| Net interest income | | 15,218 | | | 14,847 | | | 14,268 | |
| Net fee income | | 5,227 | | | 5,810 | | | 4,766 | |
| Net trading income/(expense) | | (3,135 | ) | | (542 | ) | | 1,358 | |
| Changes in fair value of long-term debt issued and related derivatives | | 3,736 | | | 1,750 | | | (63 | ) |
| Net income from other financial instruments designated at fair value | | 1 | | | – | | | – | |
| Net income/(expense) from financial instruments designated at fair value | | 3,737 | | | 1,750 | | | (63 | ) |
| Gains less losses from financial investments | | (120 | ) | | 245 | | | 58 | |
| Dividend income | | 77 | | | 105 | | | 85 | |
| Net earned insurance premiums | | 390 | | | 449 | | | 492 | |
| Other operating income | | 23 | | | 360 | | | 922 | |
| | |
| | |
| | |
| |
| Total operating income | | 21,417 | | | 23,024 | | | 21,886 | |
| Net insurance claims incurred and movement in liabilities to policyholders | | (238 | ) | | (241 | ) | | (259 | ) |
| | |
| | |
| | |
| |
Net operating income before loan impairment charges and other credit risk provisions | | 21,179 | | | 22,783 | | | 21,627 | |
| Loan impairment charges and other credit risk provisions | | (16,795 | ) | | (12,156 | ) | | (6,796 | ) |
| | |
| | |
| | |
| |
| Net operating income | | 4,384 | | | 10,627 | | | 14,831 | |
| Operating expenses (excluding goodwill impairment) | | (9,359 | ) | | (10,556 | ) | | (10,193 | ) |
| Goodwill impairment | | (10,564 | ) | | – | | | – | |
| | |
| | |
| | |
| |
| Operating profit/(loss) | | (15,539 | ) | | 71 | | | 4,638 | |
| Share of profit in associates and joint ventures | | 11 | | | 20 | | | 30 | |
| | |
| | |
| | |
| |
| Profit/(loss) before tax | | (15,528 | ) | | 91 | | | 4,668 | |
| | |
| | |
| | |
| |
| | | | | | | | | | |
| | | % | | | % | | | % | |
| | | | | | | | | | |
| Share of HSBC’s profit before tax | | (166.8 | ) | | 0.4 | | | 21.1 | |
| Cost efficiency ratio | | 94.1 | | | 46.3 | | | 47.1 | |
| Year-end staff numbers (full-time equivalent) | | 44,725 | | | 52,722 | | | 55,642 | |
| | | | | | | | |
| | | | | | | | |
| Balance sheet data15 | | | | | | | |
| | | At 31 December | |
| | |
|
|
|
|
| |
| | | 2008 | | 2007 | | 2006 | |
| | | US$m | | US$m | | US$m | |
| | | | | | | | |
| Loans and advances to customers (net) | | 256,214 | | 289,860 | | 277,987 | |
| Loans and advances to banks (net) | | 11,458 | | 16,566 | | 17,865 | |
Trading assets, financial assets designated at fair value, and financial investments20 | | 119,634 | | 133,998 | | 145,700 | |
| Total assets | | 552,612 | | 549,285 | | 505,638 | |
| Deposits by banks | | 18,181 | | 16,618 | | 11,484 | |
| Customer accounts | | 143,532 | | 145,173 | | 120,922 | |
| | | | | | | | |
| For footnotes, see page 143. |
| All commentaries on North America are on an underlying basis unless stated otherwise. |
consumer price inflation reached a 17-year high of 5.6 per cent in July 2008 before moderating sharply to stand at just 0.1 per cent by the year-end. A combination of falling asset values and weak employment conditions undermined consumer confidence and household spending growth turned negative during the second half of 2008. The Standard & Poor’s S&P 500 stock market index fell by 38 per cent during the year. Faced with this deterioration in economic activity and financial
conditions, the Federal Reserve lowered short-term interest rates by 425 basis points during the course of 2008, leaving the Funds’ target rate within a narrow range of between zero and 25 basis points, while a number of liquidity initiatives were also introduced.
Canadian GDP increased by 0.4 per cent during the first eleven months of 2008 compared with the equivalent period of 2007, with growth slowing markedly during the second half of the year, due predominantly to weaker external demand. Labour
120
Back to Contents
market conditions deteriorated as the unemployment rate rose from a historical low of 5.8 per cent in January 2008 to finish the year at 6.6 per cent. After rising to a level of 3.5 per cent in August 2008, the headline rate of consumer price inflation slowed to 1.2 per cent by the year-end. The core rate of
inflation remained below 2.0 per cent throughout the year. Responding to the deteriorating economic outlook, the Bank of Canada cut its overnight interest rate from 4.25 per cent at the end of 2007 to 1.5 per cent in December 2008.
| Reconciliation of reported and underlying profit/(loss) before tax |
| | | | | | | | | | | | | | | | | | | | |
| | | 2008 compared with 2007 | |
| | |
|
|
|
|
|
|
|
|
|
|
|
|
|
|
|
|
| |
| | | | | 2007 | | | | | | | | | | | | | | | |
| | | | | acquisitions, | | | | 2007 | | 2008 | | | | | | | | | |
| | | 2007 | | disposals | | | | at 2008 | | acquisitions | | Under- | | 2008 | | Re- | | Under- | |
| | | as | | & dilution | | Currency | | exchange | | and | | lying | | as | | ported | | lying | |
| | | reported | | gains | 1 | translation | 2 | rates | 3 | disposals | 1 | change | | reported | | change | | change | |
| North America | | US$m | | US$m | | US$m | | US$m | | US$m | | US$m | | US$m | | % | | % | |
| | | | | | | | | | | | | | | | | | | | |
| Net interest income | | 14,847 | | 1 | | 7 | | 14,855 | | – | | 363 | | 15,218 | | 2 | | 2 | |
| Net fee income | | 5,810 | | (105 | ) | 1 | | 5,706 | | – | | (479 | ) | 5,227 | | (10 | ) | (8 | ) |
| Other income4 | | 2,126 | | (18 | ) | (1 | ) | 2,107 | | – | | (1,373 | ) | 734 | | (65 | ) | (65 | ) |
| | |
| |
| |
| |
| |
| |
| |
| | | | | |
| Net operating income5 | | 22,783 | | (122 | ) | 7 | | 22,668 | | – | | (1,489 | ) | 21,179 | | (7 | ) | (7 | ) |
| Loan impairment charges and other credit risk provisions | | (12,156 | ) | – | | 12 | | (12,144 | ) | – | | (4,651 | ) | (16,795 | ) | (38 | ) | (38 | ) |
| | |
| |
| |
| |
| |
| |
| |
| | | | | |
| Net operating income | | 10,627 | | (122 | ) | 19 | | 10,524 | | – | | (6,140 | ) | 4,384 | | (59 | ) | (58 | ) |
| Operating expenses (excluding goodwill impairment) | | (10,556 | ) | 98 | | (6 | ) | (10,464 | ) | – | | 1,105 | | (9,359 | ) | 11 | | 11 | |
| Goodwill impairment | | – | | – | | – | | – | | – | | (10,564 | ) | (10,564 | ) | n/a | | n/a | |
| | |
| |
| |
| |
| |
| |
| |
| | | | | |
| Operating profit/(loss) | | 71 | | (24 | ) | 13 | | 60 | | – | | (15,599 | ) | (15,539 | ) | (21,986 | ) | (25,998 | ) |
| Income from associates | | 20 | | – | | – | | 20 | | – | | (9 | ) | 11 | | (45 | ) | (45 | ) |
| | |
| |
| |
| |
| |
| |
| |
| | | | | |
| Profit/(loss) before tax | | 91 | | (24 | ) | 13 | | 80 | | – | | (15,608 | ) | (15,528 | ) | (17,164 | ) | (19,510 | ) |
| | |
| |
| |
| |
| |
| |
| |
| | | | | |
| | | | | | | | | | | | | | | | | | | | |
| For footnotes, see page 143. |
| |
| |
Review of business performance
HSBC’s operations in North America reported a pre-tax loss of US$15.5 billion in 2008, compared with a pre-tax profit of US$91 million in 2007.
Net interest income in North America increased by 2 per cent to US$15.2 billion, driven by Balance Sheet Management activities in Global Banking and Markets which more than offset the decline in Personal Financial Services as lending reduced.
The significant increase in net interest income in the Balance Sheet Management business resulted from correct positioning in anticipation of lower interest rates. Net interest income was also boosted by higher balances within certain loan portfolios in Global Banking and Markets.
Net interest income fell in Personal Financial Services as asset balances declined and deposit spreads narrowed. Deposit spread compression was driven by the competitive environment for retail deposits in which HSBC refrained from passing on the full effects of interest rate cuts to customers.
Asset spreads widened, particularly in vehicle finance and credit cards and, to a lesser extent, the real estate secured portfolios as yields declined by less than funding costs in the lower interest rate environment, and the credit card portfolio benefited from APR floors. This was partly offset by a rise in non-performing loans, lower loan prepayments, increased volumes of loan modifications, and lower fees from reduced loan origination volumes. Funding costs declined as a result of lower base rates during the year.
Lending balances declined as the mortgage services portfolio continued to run-off, originations ceased during the year within the dealer and direct-to-consumer channels in vehicle finance, and tighter underwriting criteria in consumer lending constrained customer eligibility for finance. In addition, US$8.2 billion of mortgages were sold from the US real estate secured portfolios during the year. These factors were partly offset by a change in mix towards higher-yielding credit card loans and reduced levels of prepayments that resulted in loans remaining on the balance sheet longer. At the end of
121
Back to Contents
| H S B C H O L D I N G S P L C |
| |
| Report of the Directors: Operating and Financial Review(continued) |
| | |
| | |
| Geographical regions > North America > 2008 / 2007 |
February 2009, HSBC authorised the discontinuation as soon as practicable of all new receivable originations of all products by the branch-based consumer lending business of HSBC Finance in North America (see page 70).
Net fee income declined by 8 per cent, driven by reductions in US credit card fees following changes in fee practices implemented since the fourth quarter of 2007 and lower cash advance and interchange fees as a result of reduced volumes. Partly offsetting the decline were increased income from enhancement services due to higher customer acceptance rates of Account Secure Plus and Identity Protection Plan, a rise in syndication, credit and service fees in Commercial Banking and increased fees from asset management.
Trading losses were dominated by write-downs in Global Banking and Markets on legacy exposures as continuing turmoil in credit markets adversely affected valuations of credit and structured credit trading positions, monoline exposures and leveraged and acquisition finance loans. Continued deterioration in the fair value of the run-off portfolio of sub-prime residential mortgage loans held for sale also contributed to the loss. US$3.6 billion in leveraged loans, high yield notes and securities held for balance sheet management were reclassified in 2008 under revised IFRS rules from trading assets to loans and receivables and available for sale, preventing any further mark-to-market trading losses on these assets. If these reclassifications had not been made, the loss before tax would have been US$0.9 billion higher.
The losses on legacy assets were partly offset by strong performances in other trading areas as foreign exchange trading benefited from pronounced market volatility, Rates trading correctly anticipated central bank rate cuts and gains were generated on credit default swaps in Global Banking. Revenues from emerging markets trading and precious metals trading also rose as a result of ongoing market volatility and increased transaction volumes as prices of gold and platinum rose during 2008. Losses on non-qualifying hedge positions in interest rate swaps generated further trading losses. In 2007, the Decision One business, which was closed that year, recorded trading losses of US$263 million.
Net income from financial instruments designated at fair valuerose by US$2.0 billion to US$3.7 billion, primarily on HSBC’s fixed-rate long-term debt as credit spreads widened significantly in the second half of 2008 in the ongoing market turmoil. These gains, together with
those booked in previous years, will fully reverse over the life of the debt.
Gains less losses from financial investments declined, mainly due to losses on US government agency securities in 2008 and the non-recurrence of the sale of MasterCard shares, partly offset by gains from the Visa IPO in 2008.
Net earned insurance premiums decreased by 13 per cent to US$390 million, driven by lower credit related premiums in HSBC Finance due to declining loan volumes.
Other operating income declined due to losses on sale of the Canadian vehicle finance businesses and other loan portfolios in 2008, in addition to the non-recurrence of gains on disposal of fixed assets and a small portfolio of private equity investments in 2007.
Net insurance claims incurred and movement in liabilities to policyholders were broadly in line with 2007 at US$238 million.
Loan impairment chargesand other credit risk provisions rose sharply, by 38 per cent to US$16.8 billion, reflecting substantially higher impairment charges in HSBC Finance across all portfolios and, in HSBC USA, the deterioration of credit quality in prime residential mortgages, second lien portfolios and private label cards. The main factors driving this deterioration were the continued weakening of the US economy, which led to rising levels of unemployment and personal bankruptcy filings: higher early-stage delinquency and increased roll rates in consumer lending: the ageing of portfolios: and further declines in house prices which increased loss severity and reduced customers’ ability to refinance and access equity in their homes. Partly offsetting these factors was a reduction in overall lending as HSBC continued to actively reduce its balance sheet and lower its risk profile in the US.
In the Mortgage Services business, loan impairment charges rose by 14 per cent to US$3.5 billion as the 2005 and 2006 vintages continued to season and experience rising delinquency. Run-off of the portfolio slowed in light of continued house price depreciation which, along with the constrained credit environment, restricted refinancing options for personal customers. In consumer lending, loan impairment charges rose by 39 per cent to US$5.7 billion. In the second half of 2008, delinquency rates began to accelerate particularly in the first lien portfolios in the parts of the country most affected by house price depreciation and rising unemployment rates. In
122
Back to Contents
HSBC USA, loan impairment charges rose by 76 per cent to US$2.6 billion driven by credit quality deterioration across the Home Equity line of credit, Home Equity loan, prime first lien residential mortgage and private label card portfolios.
Loan impairment charges in US card and retail services rose, driven by portfolio seasoning and rising unemployment, particularly in the second half of 2008, higher levels of personal bankruptcy filings and lower recovery rates. As with mortgages, this was most notable in parts of the country most affected by house price falls and unemployment. Vehicle finance loan impairment charges rose as delinquencies rose and lower prices resulted in lower recoveries when repossessed vehicles were sold at auction.
Loan impairment charges in Commercial Banking grew to US$449 million from a low base, primarily driven by higher impairment losses due to deterioration across the middle market, commercial real estate and corporate banking portfolios in the US and among firms in the manufacturing, export and commercial real estate sectors in Canada. Higher loan impairment charges and other credit risk provisions in Global Banking and Markets reflected weaker credit fundamentals in the US in 2008.
Operating expensesincreased by 90 per cent, driven by US$10.6 billion of impairmentcharge recognised in respect of North America Personal Financial Services in 2008 to fully write off goodwill. Excluding the goodwill impairment charge, expenses were US$1.1 billion or 11 per cent lower. Staff costs declined, primarily in HSBC Finance, following decisions taken in 2007 to close the acquisition channels for new business in Mortgage Services and a number of consumer lending branches, and integrate the operations of the card businesses. HSBC USA made the decision to close its wholesale and third-party correspondent mortgage business in November 2008, while HSBC Finance took the decision to cease originations in the dealer and direct-to-consumer channels in the vehicle finance business in July 2008. Staff costs in Global Banking and Markets also fell as performance-related compensation and staff numbers both declined.
Other administrative costs decreased as origination activity declined, marketing costs in card and retail services reduced and branch costs in consumer lending fell as tightened underwriting criteria curtailed business and led to branch closures. This was partly offset by higher marketing and occupancy costs in the retail bank reflecting a continued expansion of the branch network,
increased community investment activities and higher deposit insurance, collection, payments and cash management and asset management costs in support of business growth.
2007 compared with 2006
Economic briefing
In theUS, GDP growth in 2007 was 2.2 per cent, 0.7 percentage points less than that recorded in 2006 as the housing-led downturn gathered pace. Consumer spending in 2007 grew by 2.9 per cent, the weakest annual expansion since 2003. Housing activity continued to weaken in 2007, with residential investment falling by 17 per cent during the year. Both new and existing home sales also declined to new lows in 2007. The unemployment rate averaged 4.6 per cent in 2007, with the average in the second half of the year slightly higher at 4.8 per cent. The trade deficit narrowed in 2007 as export growth strengthened. Consumer price inflation averaged around 4 per cent in the final quarter of 2007. This was largely due to higher energy prices; excluding food and energy, consumer price inflation averaged 2.3 per cent in the fourth quarter. The Federal Reserve lowered short-term interest rates by 100 basis points in the second half of 2007, from 5.25 per cent to 4.25 per cent, as policymakers attempted to mitigate the worst effects of the sub-prime related credit squeeze upon economic activity. 10-year note yields reached a high of 5.3 per cent in June 2007, before falling to 4 per cent by the year-end. Declines in the final months of 2007 left the S&P 500 stock market index practically unchanged compared with the end of 2006.
Canadian GDP increased by 2.4 per cent during the first eleven months of 2007 compared with the equivalent period of 2006. Domestic demand remained strong despite tighter credit conditions in the latter part of the year, supported by the robust labour market. The unemployment rate averaged 6 per cent for the year, reaching a historical low of 5.8 per cent in October. After hitting a high of 2.5 per cent in April, core consumer price inflation slowed to 1.5 per cent by the end of 2007. The Canadian dollar appreciated during the year, particularly in the second half. In July, the Bank of Canada raised its overnight interest rate from 4.25 per cent to 4.5 per cent before reversing this move in the final weeks of 2007.
Review of business performance
HSBC’s operations in North America experienced a significant fall in pre-tax profits of 98 per cent in 2007, on both reported and underlying bases.
123
Back to Contents
| H S B C H O L D I N G S P L C |
| |
| Report of the Directors: Operating and Financial Review(continued) |
| | |
| | |
| Geographical regions > North America > 2007 |
| Reconciliation of reported and underlying profit before tax |
| |
| | 2007 compared with 2006 |
| |
|
|
|
|
|
|
|
|
|
|
|
|
|
|
| |
| | | | | | | | | | 2007 | | | | | | | | | |
| | | | 2006 | | | | 2006 | | acquisitions, | | | | | | | | | |
| | 2006 | | acquisitions | | | | at 2007 | | disposals | | Under- | | 2007 | | Re- | | Under- | |
| | as | | and | | Currency | | exchange | | & dilution | | lying | | as | | ported | | lying | |
| | reported | | disposals | 1 | translation | 2 | rates | 6 | gains | 1 | change | | reported | | change | | change | |
| North America | US$m | | US$m | | US$m | | US$m | | US$m | | US$m | | US$m | | % | | % | |
| | | | | | | | | | | | | | | | | | | |
| Net interest income | 14,268 | | – | | 65 | | 14,333 | | – | | 514 | | 14,847 | | 4 | | 4 | |
| Net fee income | 4,766 | | – | | 26 | | 4,792 | | – | | 1,018 | | 5,810 | | 22 | | 21 | |
| Other income4 | 2,593 | | – | | 10 | | 2,603 | | 20 | | (497 | ) | 2,126 | | (18 | ) | (19 | ) |
| |
| |
| |
| |
| |
| |
| |
| | | | | |
| Net operating income5 | 21,627 | | – | | 101 | | 21,728 | | 20 | | 1,035 | | 22,783 | | 5 | | 5 | |
Loan impairment charges and other credit risk provisions | (6,796 | ) | – | | (3 | ) | (6,799 | ) | – | | (5,357 | ) | (12,156 | ) | (79 | ) | (79 | ) |
| |
| |
| |
| |
| |
| |
| |
| | | | | |
| Net operating income | 14,831 | | – | | 98 | | 14,929 | | 20 | | (4,322 | ) | 10,627 | | (28 | ) | (29 | ) |
| Operating expenses | (10,193 | ) | – | | (47 | ) | (10,240 | ) | (26 | ) | (290 | ) | (10,556 | ) | (4 | ) | (3 | ) |
| |
| |
| |
| |
|
|
| |
| |
| | | | | |
| Operating profit | 4,638 | | – | | 51 | | 4,689 | | (6 | ) | (4,612 | ) | 71 | | (98 | ) | (98 | ) |
| |
| Income from associates | 30 | | – | | 1 | | 31 | | – | | (11 | ) | 20 | | (33 | ) | (35 | ) |
| |
| |
| |
| |
| |
| |
| |
| | | | | |
| Profit before tax | 4,668 | | – | | 52 | | 4,720 | | (6 | ) | (4,623 | ) | 91 | | (98 | ) | (98 | ) |
| |
| |
| |
| |
| |
| |
| |
| | | | | |
| |
| For footnotes, see page 143. |
The US economy began to slow in the fourth quarter of 2007 and, increasingly, evidence suggested that some parts of the country were already in recession. As the housing market slump affected the real economy, the deterioration in credit quality that began in the mortgage services business extended to include other consumer finance businesses in the US. In HSBC, this was reflected in a 79 per cent rise in loan impairment charges and a loss before tax of US$1.5 billion in Personal Financial Services. In response to this, management took actions to manage exposure and realign the business, including stopping new mortgage purchases in mortgage services, tightening underwriting criteria, restricting the product range in consumer lending, decreasing credit lines and reducing the volume of balance transfers in credit cards, and restructuring the consumer lending branch network by closing some 400 branches of HSBC Finance to reflect expected lower demand. A loss of US$965 million in Global Banking and Markets arose from credit-related and liquidity event write-downs as asset-backed securities markets became illiquid and credit spreads widened markedly.
Net interest income rose by 4 per cent, as higher revenues from payments and cash management, commercial lending and cards were offset by lower mortgage balances, spread compression and higher non-performing balances.
Overall, average lending balances were 5 per cent higher, as growth in credit and private label cards and vehicle finance offset lower mortgage
balances. The benefits of higher volumes were largely offset as asset spreads narrowed due to higher funding costs. Also, although deposit balances rose, spreads reduced as the product mix shifted to higher yielding products. Business expansion and higher customer volumes drove growth in loans and deposits in Commercial Banking. A 43 per cent increase in revenue from payments and cash management was due to higher customer balances.
Net fee income rose as a result of higher personal card balances attracting late and over-limit fees. Fees from card services also rose, due to enhancement services on cards such as debt protection and identity protection. The Intellicheck service, which allows customers to pay their credit card balances over the telephone for a fee, proved popular with customers. Payments and cash management fees also increased on higher volumes generated. In the fourth quarter of 2007, HSBC changed fee practices on credit cards to ensure they fully reflected HSBC’s brand principles. This reduced income by US$55 million in 2007.
HSBC incurred atrading loss following write-downs in credit and structured derivatives, including US$282 million relating to monoline exposures, and in leveraged and acquisition finance, driven by deterioration in the credit market in the second half of the year. The write-downs were compounded by trading losses on purchased loans in the mortgage services’ wholesale business, in response to which HSBC closed the Decision One business. By
124
Back to Contents
contrast, foreign exchange trading performance was strong, supported by activity generated by a weakening dollar and volatile markets.
Net income from financial instruments designated at fair valuerose to US$1.8 billion,driven by significant fair value movements on HSBC’s own debt as a result of the widening of credit spreads and related derivatives in the second half of the year.
Gains less losses from financial investmentsof US$245 million were primarily attributable to the sale of shares in MasterCard.
Net earned insurance premiums decreased by 9 per cent to US$449 million, as the decline in loan volumes led to a fall in credit insurance sales and HSBC stopped reinsuring credit insurance for other lenders.
Other operating income decreased significantly, as higher losses were recorded on foreclosed properties due to the combined effect of an increase in the stock of such properties and a reduction in their value due to falling prices. In addition, there were lower gains on the sale of investments, mainly due to a significant one-off gain in the latter part of 2006.
Net insurance claims incurred and movement in liabilities to policyholders decreased by 7 per cent to US$241 million, in line with the change in net earned insurance premiums.
Loan impairment charges posted a steep rise, increasing by 79 per cent to US$12.2 billion, reflecting substantially higher charges in the US consumer finance loan book, primarily in mortgage lending but also in the credit cards portfolio in the final part of the year. The main factor driving this deterioration was the effect of the weaker housing market on both economic activity and the ability of borrowers to extend or refinance debt. In addition, seasoning and mix change within the credit cards portfolio and increases in bankruptcy filings after the exceptionally low levels seen in 2006, following changes in legislation, added to loan impairment charges.
The real estate secured portfolios experienced continuing deterioration in credit quality as a lack of demand for securitised sub-prime mortgages and falls in house prices severely restricted refinancing options for many customers. Loan impairment charges rose by 41 per cent to US$3.1 billion and by 139 per cent to US$4.1 billion in the mortgage services business and consumer lending,
respectively. Delinquency rates exceeded recent historical trends, particularly for those loans originated in 2005 and 2006. Performance was weakest in housing markets which had previously experienced the steepest home price appreciation, second lien products and stated income products.
US card services experienced a rise in loan impairment charges from a combination of factors, primarily a growth in balances, higher losses in the final part of the year as the economy slowed, a rise in bankruptcy rates to levels approaching those seen historically, and a shift in portfolio mix towards non-prime loans.
Loan impairment charges in Commercial Banking rose by 151 per cent to US$191 million, reflecting growth in the loan book, the increasing probability of default among commercial real estate loans in the US and a change in methodology for determining loan impairment allowances on a portfolio of revolving loans to small businesses. In addition, in Canada, loan impairment charges increased due to exposure to certain sectors affected by the strength of the Canadian dollar and an impairment charge for non-bank asset-backed commercial paper was also taken.
Operating expenses increased by 3 per cent, compared with growth in net operating income before loan impairment charges of 5 per cent. The retail bank branch network was extended both within and beyond the Group’s traditional spheres of operation to support the expansion of the Personal Financial Services and Commercial Banking businesses in the US and Canada. Premises and equipment expenses rose as a consequence. The consumer finance business incurred restructuring charges from the discontinuation of the wholesale and correspondent channels in mortgage services and the closing of branch offices in consumer lending. There were corresponding benefits in origination costs. The Canadian consumer finance business was also restructured in a similar fashion to the US. The business incurred US$70 million of one-off costs arising from the indemnification agreement with Visa ahead of Visa’s planned IPO. In the cards and consumer lending businesses, communication expenses increased due to higher mailing volumes on cards and consumer lending as credit collection policies were tightened. In the third quarter, however, expenditure on card marketing declined in line with a decision to slow lending growth.
Share of profit in associates and joint venturesdeclined to US$20 million.
125
Back to Contents
| H S B C H O L D I N G S P L C |
| |
| Report of the Directors: Operating and Financial Review(continued) |
| | |
| | |
| Geographical regions > North America > Profit/loss before tax by customer group |
Analysis by customer group and global business
Profit/(loss) before tax
| | 2008 | |
| |
|
|
|
|
|
|
|
|
|
|
|
|
|
|
|
|
|
|
| |
| | Personal | | | | | | Global | | | | | | | | | | | | | |
| | Financial | | | Commercial | | | Banking & | | | Private | | | | | | Intersegment | | | | |
| | Services | | | Banking | | | Markets | | | Banking | | | Other | | | elimination | 21 | | Total | |
| North America | US$m | | | US$m | | | US$m | | | US$m | | | US$m | | | US$m | | | US$m | |
| | | | | | | | | | | | | | | | | | | | | |
| Net interest income | 12,632 | | | 1,480 | | | 1,064 | | | 224 | | | 22 | | | (204 | ) | | 15,218 | |
| Net fee income/(expense) | 3,896 | | | 391 | | | 818 | | | 181 | | | (59 | ) | | – | | | 5,227 | |
Trading income/(expense) excluding net interest income | (250 | ) | | 5 | | | (3,516 | ) | | 10 | | | (128 | ) | | – | | | (3,879 | ) |
Net interest income/(expense) on trading activities | 66 | | | – | | | 584 | | | – | | | (110 | ) | | 204 | | | 744 | |
| Net trading income/(expense)16 | (184 | ) | | 5 | | | (2,932 | ) | | 10 | | | (238 | ) | | 204 | | | (3,135 | ) |
Changes in fair value of long-term debt issued and related derivatives | – | | | – | | | – | | | – | | | 3,736 | | | – | | | 3,736 | |
Net income/(expense) from other financial instruments designated at fair value | (2 | ) | | – | | | (1 | ) | | – | | | 4 | | | – | | | 1 | |
Net income/(expense) from financial instruments designated at fair value | (2 | ) | | – | | | (1 | ) | | – | | | 3,740 | | | – | | | 3,737 | |
| Gains less losses from financial investments | 65 | | | 5 | | | (209 | ) | | – | | | 19 | | | – | | | (120 | ) |
| Dividend income | 36 | | | 11 | | | 27 | | | 3 | | | – | | | – | | | 77 | |
| Net earned insurance premiums | 390 | | | – | | | – | | | – | | | – | | | – | | | 390 | |
| Other operating income/(expense) | (426 | ) | | 140 | | | 240 | | | 20 | | | 1,419 | | | (1,370 | ) | | 23 | |
| |
| | |
| | |
| | |
| | |
| | |
| | |
| |
| Total operatingincome/(expense) | 16,407 | | | 2,032 | | | (993 | ) | | 438 | | | 4,903 | | | (1,370 | ) | | 21,417 | |
| Net insurance claims17 | (238 | ) | | – | | | – | | | – | | | – | | | – | | | (238 | ) |
| |
| | |
| | |
| | |
| | |
| | |
| | |
| |
| Net operating income/(expense)5 | 16,169 | | | 2,032 | | | (993 | ) | | 438 | | | 4,903 | | | (1,370 | ) | | 21,179 | |
Loan impairment charges and other credit risk provisions | (16,132 | ) | | (449 | ) | | (198 | ) | | (16 | ) | | – | | | – | | | (16,795 | ) |
| |
| | |
| | |
|
| |
| | |
| | |
| | |
| |
| Net operating income/(expense) | 37 | | | 1,583 | | | (1,191 | ) | | 422 | | | 4,903 | | | (1,370 | ) | | 4,384 | |
| Operating expenses (excluding goodwill impairment) | (6,701 | ) | | (937 | ) | | (1,384 | ) | | (339 | ) | | (1,368 | ) | | 1,370 | | | (9,359 | ) |
| Goodwill impairment | (10,564 | ) | | – | | | – | | | – | | | – | | | – | | | (10,564 | ) |
| |
| | |
| | |
| | |
| | |
| | |
| | |
| |
| Operating profit/(loss) | (17,228 | ) | | 646 | | | (2,575 | ) | | 83 | | | 3,535 | | | – | | | (15,539 | ) |
| Share of profit/(loss) in associates and joint ventures | – | | | 12 | | | – | | | – | | | (1 | ) | | – | | | 11 | |
| |
| | |
| | |
| | |
| | |
| | |
| | |
| |
| Profit/(loss) before tax | (17,228 | ) | | 658 | | | (2,575 | ) | | 83 | | | 3,534 | | | – | | | (15,528 | ) |
| |
| | |
| | |
| | |
| | |
| | |
| | |
| |
| | | | | | | | | | | | | | | | | | | | | |
| | % | | | % | | | % | | | % | | | % | | | | | | % | |
| | | | | | | | | | | | | | | | | | | | | |
| Share of HSBC’s profitbefore tax | (185.1 | ) | | 7.1 | | | (27.7 | ) | | 0.9 | | | 38.0 | | | | | | (166.8 | ) |
| Cost efficiency ratio | 106.8 | | | 46.1 | | | (139.4 | ) | | 77.4 | | | 27.9 | | | | | | 94.1 | |
| Balance sheet data15 | | | | | | | | | | | | | | | | | | | | |
| | US$m | | | US$m | | | US$m | | | US$m | | | US$m | | | | | | US$m | |
| | | | | | | | | | | | | | | | | | | | | |
| Loans and advances to customers (net) | 179,663 | | | 35,725 | | | 35,583 | | | 5,243 | | | – | | | | | | 256,214 | |
| Total assets | 192,240 | | | 42,211 | | | 318,139 | | | 7,054 | | | 3,323 | | | (10,355 | ) | | 552,612 | |
| Customer accounts | 65,830 | | | 39,105 | | | 23,844 | | | 14,657 | | | 96 | | | | | | 143,532 | |
For footnotes, see page 143.
126
Back to Contents
| | 2007 | |
| |
|
|
|
|
|
|
|
|
|
|
|
|
|
|
|
|
|
|
| |
| | Personal | | | | | | Global | | | | | | | | | Inter- | | | | |
| | Financial | | | Commercial | | | Banking & | | | Private | | | | | | segment | | | | |
| | Services | | | Banking | | | Markets | | | Banking | | | Other | | | elimination | 21 | | Total | |
| North America | US$m | | | US$m | | | US$m | | | US$m | | | US$m | | | US$m | | | US$m | |
| | | | | | | | | | | | | | | | | | | | | |
| Net interest income/(expense) | 13,175 | | | 1,558 | | | 378 | | | 273 | | | (17 | ) | | (520 | ) | | 14,847 | |
| Net fee income/(expense) | 4,571 | | | 338 | | | 701 | | | 279 | | | (79 | ) | | – | | | 5,810 | |
Trading income/(expense) excluding net interest income | (349 | ) | | (2 | ) | | (871 | ) | | 11 | | | (78 | ) | | – | | | (1,289 | ) |
Net interest income/(expense) on trading activities | 134 | | | – | | | 137 | | | – | | | (44 | ) | | 520 | | | 747 | |
| Net trading income/(expense)16 | (215 | ) | | (2 | ) | | (734 | ) | | 11 | | | (122 | ) | | 520 | | | (542 | ) |
Changes in fair value of long-term debt issued and related derivatives | – | | | – | | | – | | | – | | | 1,750 | | | – | | | 1,750 | |
Net income/(expense) from other financial instruments designated at fair value | – | | | – | | | 11 | | | – | | | (11 | ) | | – | | | – | |
Net income from financial instruments designated at fair value | – | | | – | | | 11 | | | – | | | 1,739 | | | – | | | 1,750 | |
| Gains less losses from financialinvestments | 176 | | | (1 | ) | | 65 | | | 2 | | | 3 | | | – | | | 245 | |
| Dividend income | 47 | | | 1 | | | 57 | | | – | | | – | | | – | | | 105 | |
| Net earned insurance premiums | 449 | | | – | | | – | | | – | | | – | | | – | | | 449 | |
| Other operating income/(expense) | (5 | ) | | 88 | | | 167 | | | 34 | | | 1,480 | | | (1,404 | ) | | 360 | |
| |
| | |
| | |
| | |
| | |
| | |
| | |
| |
| Total operating income | 18,198 | | | 1,982 | | | 645 | | | 599 | | | 3,004 | | | (1,404 | ) | | 23,024 | |
| Net insurance claims17 | (241 | ) | | – | | | – | | | – | | | – | | | – | | | (241 | ) |
| |
| | |
| | |
| | |
| | |
| | |
| | |
| |
| Net operating income5 | 17,957 | | | 1,982 | | | 645 | | | 599 | | | 3,004 | | | (1,404 | ) | | 22,783 | |
Loan impairment charges and other credit risk provisions | (11,909 | ) | | (191 | ) | | (46 | ) | | (10 | ) | | – | | | – | | | (12,156 | ) |
| |
| | |
| | |
| | |
| | |
| | |
| | |
| |
| Net operating income | 6,048 | | | 1,791 | | | 599 | | | 589 | | | 3,004 | | | (1,404 | ) | | 10,627 | |
| Total operating expenses | (7,594 | ) | | (893 | ) | | (1,562 | ) | | (415 | ) | | (1,496 | ) | | 1,404 | | | (10,556 | ) |
| |
| | |
| | |
| | |
| | |
| | |
| | |
| |
| Operating profit/(loss) | (1,546 | ) | | 898 | | | (963 | ) | | 174 | | | 1,508 | | | – | | | 71 | |
Share of profit/(loss) in associates and joint ventures | – | | | 22 | | | (2 | ) | | – | | | – | | | – | | | 20 | |
| |
| | |
| | |
| | |
| | |
| | |
| | |
| |
| Profit/(loss) before tax | (1,546 | ) | | 920 | | | (965 | ) | | 174 | | | 1,508 | | | – | | | 91 | |
| |
| | |
| | |
| | |
| | |
| | |
| | |
| |
| | | | | | | | | | | | | | | | | | | | | |
| | % | | | % | | | % | | | % | | | % | | | | | | % | |
| | | | | | | | | | | | | | | | | | | | | |
| Share of HSBC’s profitbefore tax | (6.4 | ) | | 3.8 | | | (4.0 | ) | | 0.7 | | | 6.3 | | | | | | 0.4 | |
| Cost efficiency ratio | 42.3 | | | 45.1 | | | 242.2 | | | 69.3 | | | 49.8 | | | | | | 46.3 | |
| | | | | | | | | | | | | | | | | | | | | |
| Balance sheet data15 | | | | | | | | | | | | | | | | | | | | |
| | US$m | | | US$m | | | US$m | | | US$m | | | US$m | | | | | | US$m | |
| | | | | | | | | | | | | | | | | | | | | |
| Loans and advances tocustomers (net) | 218,676 | | | 38,930 | | | 26,186 | | | 6,068 | | | – | | | | | | 289,860 | |
| Total assets | 237,475 | | | 46,247 | | | 252,804 | | | 20,073 | | | 1,095 | | | (8,409 | ) | | 549,285 | |
| Customer accounts | 61,824 | | | 36,306 | | | 30,732 | | | 16,187 | | | 124 | | | | | | 145,173 | |
For footnotes, see page 143.
127
Back to Contents
| H S B C H O L D I N G S P L C |
| |
| Report of the Directors: Operating and Financial Review(continued) |
| | |
| | |
| Geographical regions > North America > Profit/loss before tax by customer group // Latin America |
Analysis by customer group and global business (continued)
Profit/(loss) before tax
| | 2006 | |
| |
|
|
|
|
|
|
|
|
|
|
|
|
|
|
|
|
|
|
| |
| | Personal | | | | | | Global | | | | | | | | | Inter- | | | | |
| | Financial | | | Commercial | | | Banking & | | | Private | | | | | | segment | | | | |
| | Services | | | Banking | | | Markets | | | Banking | | | Other | | | elimination | 21 | | Total | |
| North America | US$m | | | US$m | | | US$m | | | US$m | | | US$m | | | US$m | | | US$m | |
| | | | | | | | | | | | | | | | | | | | | |
| Net interest income/(expense) | 12,964 | | | 1,362 | | | 266 | | | 212 | | | (52 | ) | | (484 | ) | | 14,268 | |
| Net fee income/(expense) | 3,675 | | | 329 | | | 656 | | | 240 | | | (134 | ) | | – | | | 4,766 | |
Trading income/(expense) excluding net interest income | 66 | | | 13 | | | 746 | | | 12 | | | (220 | ) | | – | | | 617 | |
Net interest income/(expense) on trading activities | 208 | | | – | | | 72 | | | – | | | (23 | ) | | 484 | | | 741 | |
| Net trading income/(expense)16 | 274 | | | 13 | | | 818 | | | 12 | | | (243 | ) | | 484 | | | 1,358 | |
Changes in fair value of long-term debt issued and related derivatives | – | | | – | | | – | | | – | | | (63 | ) | | – | | | (63 | ) |
Net income/(expense) from other financial instruments designated at fair value | – | | | – | | | (11 | ) | | – | | | 11 | | | – | | | – | |
Net expense from financial instruments designated at fair value | – | | | – | | | (11 | ) | | – | | | (52 | ) | | – | | | (63 | ) |
| Gains less losses from financialinvestments | 14 | | | 19 | | | 12 | | | 9 | | | 4 | | | – | | | 58 | |
| Dividend income | 23 | | | 1 | | | 61 | | | – | | | – | | | – | | | 85 | |
| Net earned insurance premiums | 492 | | | – | | | – | | | – | | | – | | | – | | | 492 | |
| Other operating income | 270 | | | 87 | | | 269 | | | 31 | | | 1,536 | | | (1,271 | ) | | 922 | |
| |
| | |
| | |
| | |
| | |
| | |
| | |
| |
| Total operating income | 17,712 | | | 1,811 | | | 2,071 | | | 504 | | | 1,059 | | | (1,271 | ) | | 21,886 | |
| Net insurance claims17 | (259 | ) | | – | | | – | | | – | | | – | | | – | | | (259 | ) |
| |
| | |
| | |
| | |
| | |
| | |
| | |
| |
| Net operating income5 | 17,453 | | | 1,811 | | | 2,071 | | | 504 | | | 1,059 | | | (1,271 | ) | | 21,627 | |
Loan impairment charges and other credit risk provisions | (6,683 | ) | | (74 | ) | | (3 | ) | | (35 | ) | | (1 | ) | | – | | | (6,796 | ) |
| |
| | |
| | |
| | |
| | |
| | |
| | |
| |
| Net operating income | 10,770 | | | 1,737 | | | 2,068 | | | 469 | | | 1,058 | | | (1,271 | ) | | 14,831 | |
| Total operating expenses | (7,379 | ) | | (814 | ) | | (1,641 | ) | | (355 | ) | | (1,275 | ) | | 1,271 | | | (10,193 | ) |
| |
| | |
| | |
| | |
| | |
| | |
| | |
| |
| Operating profit/(loss) | 3,391 | | | 923 | | | 427 | | | 114 | | | (217 | ) | | – | | | 4,638 | |
Share of profit/(loss) in associates and joint ventures | – | | | 34 | | | (4 | ) | | – | | | – | | | – | | | 30 | |
| |
| | |
| | |
| | |
| | |
| | |
| | |
| |
| Profit/(loss) before tax | 3,391 | | | 957 | | | 423 | | | 114 | | | (217 | ) | | – | | | 4,668 | |
| |
| | |
| | |
| | |
| | |
| | |
| | |
| |
| | | | | | | | | | | | | | | | | | | | | |
| | % | | | % | | | % | | | % | | | % | | | | | | % | |
| | | | | | | | | | | | | | | | | | | | | |
| Share of HSBC’s profitbefore tax | 15.4 | | | 4.3 | | | 1.9 | | | 0.5 | | | (1.0 | ) | | | | | 21.1 | |
| Cost efficiency ratio | 42.3 | | | 44.9 | | | 79.2 | | | 70.4 | | | 120.4 | | | | | | 47.1 | |
| | | | | | | | | | | | | | | | | | | | | |
| Balance sheet data15 | | | | | | | | | | | | | | | | | | | | |
| | US$m | | | US$m | | | US$m | | | US$m | | | US$m | | | | | | US$m | |
| | | | | | | | | | | | | | | | | | | | | |
| Loans and advances tocustomers (net) | 220,517 | | | 34,651 | | | 17,215 | | | 5,604 | | | – | | | | | | 277,987 | |
| Total assets | 252,725 | | | 43,665 | | | 203,639 | | | 7,334 | | | 1,898 | | | (3,623 | ) | | 505,638 | |
| Customer accounts | 54,099 | | | 31,066 | | | 23,711 | | | 11,938 | | | 108 | | | | | | 120,922 | |
For footnotes, see page 143.
128
Back to Contents
Latin America
Profit/(loss) before tax by country within customer groups and global businesses
| Personal | | | | Global | | | | | | | |
| Financial | | Commercial | | Banking & | | Private | | | | | |
| Services | | Banking | | Markets | | Banking | | Other | | Total | |
| US$m | | US$m | | US$m | | US$m | | US$m | | US$m | |
| 2008 | | | | | | | | | | | | |
| Argentina | – | | 111 | | 113 | | – | | – | | 224 | |
| Brazil | 250 | | 348 | | 298 | | 8 | | 6 | | 910 | |
| Mexico | 360 | | 157 | | 190 | | 7 | | – | | 714 | |
| Panama | 51 | | 37 | | 33 | | – | | – | | 121 | |
| Other | 7 | | 53 | | 7 | | 1 | | – | | 68 | |
| |
| |
| |
| |
| |
| |
| |
| 668 | | 706 | | 641 | | 16 | | 6 | | 2,037 | |
| |
| |
| |
| |
| |
| |
| |
| 2007 | | | | | | | | | | | | |
| Argentina | 36 | | 75 | | 90 | | – | | – | | 201 | |
| Brazil | 293 | | 286 | | 297 | | 9 | | (6 | ) | 879 | |
| Mexico | 514 | | 333 | | 113 | | 11 | | 9 | | 980 | |
| Panama | 45 | | 18 | | 16 | | 7 | | – | | 86 | |
| Other | 5 | | 28 | | 1 | | (2 | ) | – | | 32 | |
| |
| |
| |
| |
| |
| |
| |
| 893 | | 740 | | 517 | | 25 | | 3 | | 2,178 | |
| |
| |
| |
| |
| |
| |
| |
| 2006 | | | | | | | | | | | | |
| Argentina | 35 | | 51 | | 68 | | – | | 3 | | 157 | |
| Brazil | 121 | | 185 | | 218 | | 6 | | (4 | ) | 526 | |
| Mexico | 628 | | 197 | | 177 | | 7 | | – | | 1,009 | |
| Panama | 16 | | 13 | | 10 | | – | | – | | 39 | |
| Other | – | | 5 | | 2 | | 1 | | (4 | ) | 4 | |
| |
| |
| |
| |
| |
| |
| |
| 800 | | 451 | | 475 | | 14 | | (5 | ) | 1,735 | |
| |
| |
| |
| |
| |
| |
| |
Loans and advances to customers (net) by country
| At 31 December | |
| |
| |
| 2008 | | 2007 | | 2006 | |
| US$m | | US$m | | US$m | |
| | | | | | | |
| Argentina | 2,356 | | 2,485 | | 1,912 | |
| Brazil | 18,255 | | 18,491 | | 11,469 | |
| Mexico | 12,211 | | 18,059 | | 14,294 | |
| Panama | 4,538 | | 4,158 | | 4,178 | |
| Other | 4,927 | | 4,730 | | 3,938 | |
| |
| |
| |
| |
| 42,287 | | 47,923 | | 35,791 | |
| |
| |
| |
| |
| |
| Customer accounts by country | | | | | | |
| At 31 December | |
| |
| |
| 2008 | | 2007 | | 2006 | |
| US$m | | US$m | | US$m | |
| | | | | | | |
| Argentina | 2,988 | | 2,779 | | 2,470 | |
| Brazil | 27,857 | | 26,231 | | 19,946 | |
| Mexico | 17,652 | | 22,307 | | 19,775 | |
| Panama | 5,185 | | 5,062 | | 5,031 | |
| Other | 5,761 | | 4,913 | | 3,639 | |
| |
| |
| |
| |
| 59,443 | | 61,292 | | 50,861 | |
| |
| |
| |
| |
129
Back to Contents
| H S B C H O L D I N G S P L C |
| |
| Report of the Directors: Operating and Financial Review(continued) |
| | |
| | |
| Geographical regions > Latin America > 2008 |
Profit before tax
| 2008 | | | 2007 | | | 2006 | | |
| Latin America | US$m | | | US$m | | | US$m | | |
| | | | | | | | | | |
| Net interest income | 6,458 | | | 5,576 | | | 4,197 | | |
| Net fee income | 2,167 | | | 2,153 | | | 1,630 | | |
| Net trading income | 701 | | | 548 | | | 537 | | |
| Changes in fair value of long-term debt issued and related derivatives | – | | | – | | | – | | |
| Net income from other financial instruments designated at fair value | 364 | | | 320 | | | 237 | | |
| Net income from financial instruments designated at fair value | 364 | | | 320 | | | 237 | | |
| Gains less losses from financial investments | 176 | | | 253 | | | 84 | | |
| Gains arising from dilution of interests in associates | – | | | 11 | | | – | | |
| Dividend income | 20 | | | 9 | | | 6 | | |
| Net earned insurance premiums | 1,717 | | | 1,594 | | | 1,076 | | |
| Other operating income | 300 | | | 228 | | | 91 | | |
| |
| | |
| | |
| | |
| Total operating income | 11,903 | | | 10,692 | | | 7,858 | | |
| Net insurance claims incurred and movement in liabilities to policyholders | (1,390 | ) | | (1,427 | ) | | (1,023 | ) | |
| |
| | |
| | |
| | |
| Net operating income before loan impairment charges and other credit risk provisions | 10,513 | | | 9,265 | | | 6,835 | | |
| Loan impairment charges and other credit risk provisions | (2,492 | ) | | (1,697 | ) | | (938 | ) | |
| |
| | |
| | |
| | |
| Net operating income | 8,021 | | | 7,568 | | | 5,897 | | |
| Total operating expenses | (5,990 | ) | | (5,402 | ) | | (4,166 | ) | |
| |
| | |
| | |
| | |
| Operating profit | 2,031 | | | 2,166 | | | 1,731 | | |
| Share of profit in associates and joint ventures | 6 | | | 12 | | | 4 | | |
| |
| | |
| | |
| | |
| Profit before tax | 2,037 | | | 2,178 | | | 1,735 | | |
| |
| | |
| | |
| | |
| | | | | | | | | | |
| % | | | % | | | % | | |
| | | | | | | | | | |
| Share of HSBC’s profit before tax | 21.9 | | | 9.0 | | | 7.9 | | |
| Cost efficiency ratio | 57.0 | | | 58.3 | | | 61.0 | | |
| Year-end staff numbers (full-time equivalent) | 58,559 | | | 64,404 | | | 64,900 | | |
Balance sheet data15
| At 31 December | |
| |
| |
| 2008 | | 2007 | | 2006 | |
| US$m | | US$m | | US$m | |
| | | | | | | |
| Loans and advances to customers (net) | 42,287 | | 47,923 | | 35,791 | |
| Loans and advances to banks (net) | 14,572 | | 12,675 | | 12,634 | |
| Trading assets, financial assets designated at fair value, and financial investments | 18,753 | | 24,715 | | 20,497 | |
| Total assets | 97,944 | | 101,088 | | 82,169 | |
| Deposits by banks | 5,598 | | 4,092 | | 5,267 | |
| Customer accounts | 59,443 | | 61,292 | | 50,861 | |
For footnote, see page 143.
All commentaries on Latin America are on an underlying basis unless stated otherwise.
2008 compared with 2007
Economic briefing
Inflationary pressures developed inMexico during the course of 2008, mostly due to rising commodity prices, as consumer price inflation accelerated from 3.7 per cent in January to 6.5 per cent by the year-end. In response, the Bank of Mexico raised its overnight interest rate by 75 basis points to 8.25 per cent by the end of the year, although a variety of
economic indicators pointed to a sharp loss of momentum during the final quarter as global growth slowed.
TheBrazilian economy performed strongly during the first half of 2008, driven by domestic demand, with the annual rate of consumer price inflation rising from 4.6 per cent in January to 6.4 per cent in July, towards the upper limit of the central banks’ tolerance range. Conditions within the labour market improved, with the rate of
130
Back to Contents
unemployment well below levels observed a year earlier. In line with many other economies within the region, however, conditions weakened markedly towards the end of 2008, with industrial production falling by close to 20 per cent during the fourth quarter.
InArgentina, economic activity held at a reasonably robust level for much of the year, although measures of industrial production growth slowed noticeably during the final months of 2008.
Declines in commodity prices during the second half of 2008 and the reduced value of exports raised concerns over the level of capital outflow from the country, while domestic currency interest rates increased sharply. The official headline rate of consumer price inflation rose during the first half of 2008, reaching 9.3 per cent in June 2008 before slowing to 7.2 per cent in December, although methodological changes make comparisons over year difficult.
Reconciliation of reported and underlying profit before tax
| 2008 compared with 2007 | |
| |
| |
| | | 2007 | | | | | | | | | | | | | | | |
| | | acquisitions, | | | | 2007 | | 2008 | | | | | | | | | |
| 2007 | | disposals | | | | at 2008 | | acquisitions | | Under- | | 2008 | | | | Under- | |
| as | | & dilution | | Currency | | exchange | | and | | lying | | as | | Reported | | lying | |
| reported | | gains | 1 | translation | 2 | rates | 3 | disposals | 1 | change | | reported | | change | | change | |
| Latin America | US$m | | US$m | | US$m | | US$m | | US$m | | US$m | | US$m | | % | | % | |
| | | | | | | | | | | | | | | | | | | |
| Net interest income | 5,576 | | – | | 155 | | 5,731 | | – | | 727 | | 6,458 | | 16 | | 13 | |
| Net fee income | 2,153 | | – | | 58 | | 2,211 | | – | | (44 | ) | 2,167 | | 1 | | (2 | ) |
| Other income4 | 1,536 | | (11 | ) | 23 | | 1,548 | | 71 | | 269 | | 1,888 | | 23 | | 17 | |
| |
| |
| |
| |
| |
| |
| |
| | | | | |
| Net operating income5 | 9,265 | | (11 | ) | 236 | | 9,490 | | 71 | | 952 | | 10,513 | | 13 | | 10 | |
| Loan impairment charges and other credit risk provisions | (1,697 | ) | – | | (64 | ) | (1,761 | ) | – | | (731 | ) | (2,492 | ) | (47 | ) | (42 | ) |
| |
| |
| |
| |
| |
| |
| |
| | | | | |
| Net operating income | 7,568 | | (11 | ) | 172 | | 7,729 | | 71 | | 221 | | 8,021 | | 6 | | 3 | |
| Operating expenses | (5,402 | ) | – | | (190 | ) | (5,592 | ) | – | | (398 | ) | (5,990 | ) | (11 | ) | (7 | ) |
| |
| |
| |
| |
| |
| |
| |
| | | | | |
| Operating profit | 2,166 | | (11 | ) | (18 | ) | 2,137 | | 71 | | (177 | ) | 2,031 | | (6 | ) | (8 | ) |
| Income from associates | 12 | | – | | – | | 12 | | – | | (6 | ) | 6 | | (50 | ) | (50 | ) |
| |
| |
| |
| |
| |
| |
| |
| | | | | |
| Profit before tax | 2,178 | | (11 | ) | (18 | ) | 2,149 | | 71 | | (183 | ) | 2,037 | | (6 | ) | (9 | ) |
| |
| |
| |
| |
| |
| |
| |
| | | | | |
For footnotes, see page 143.
Review of business performance
In Latin America, HSBC reported a pre-tax profit of US$2.0 billion compared with US$2.2 billion in 2007, a decrease of 6 per cent. On an underlying basis, pre-tax profits decreased by 9 per cent as increased revenues were offset by higher loan impairment charges, largely in Mexico and Brazil, and increased operating costs across the region.
Net interest income increased by 13 per cent. Growth in average personal lending volumes was mainly driven by vehicle finance and payroll loans in Brazil, and credit cards and personal loans in Mexico. Average credit card balances increased as a result of significant organic growth in 2007 which was not repeated in 2008. Commercial loan volume growth was driven by increased lending for working capital and trade finance loans in Brazil, and medium-sized businesses and the real estate sector in Mexico. Increased income on customer liabilities, which was driven by volume growth, particularly in
time deposits, was largely offset by a contraction in deposit spreads, primarily on US dollar denominated accounts. Active repricing strategies were deployed to mitigate spread compression in the region and to better reflect the credit risk on the loan portfolio. Lower overall spreads on lending products were partly offset by increases in cards in the region, small business loans in Mexico and overdrafts in Brazil. In Argentina, spreads on most products widened.
Net fee income decreased by 2 per cent following a ruling by the Brazilian Central Bank reducing or eliminating certain fees such as charges on early loan repayments and returned cheques. Lower transaction volumes in Personal Financial Services in Brazil also reduced fee income. These were partly offset by product repricing, the introduction of new fees and volume growth, particularly in cards, personal loans, packageddeposit products and payments and cash management.
131
Back to Contents
| H S B C H O L D I N G S P L C |
| |
| Report of the Directors: Operating and Financial Review(continued) |
| | |
| | |
| Geographical regions > Latin America > 2008 / 2007 |
Trading income rose by 22 per cent largely reflecting favourable positioning against foreign exchange movements and increased foreign exchange sales volumes. Trading losses were registered on certain transactions where an offsetting benefit is reported innet income from financial instruments designated at fair value. Losses from defaults on derivative contracts were registered, primarily in Mexico.
Gains less losses from financial investments declined by 24 per cent as gains on the redemption of VISA shares, following its global IPO, and the sale of shares in both Brazil and Mexico were lower than the gains achieved on the sale of shares in a number of companies in Brazil in 2007.
Net earned insurance premiums rose, driven by higher prices and increased sales in the general insurance business, primarily in Argentina. Sales of life assurance products remained strong.
Increasednet insurance claims incurred and movements in liabilities to policyholders in Argentina were more than offset by a decrease in liabilities to policyholders in Brazil following a decline in the equity market where the investment losses were passed on to unit-linked policyholders. This was compensated for by a similar decrease innet income from financial instruments designated at fair value.
Other operating income was broadly in line with 2007. A refinement of the income recognition methodology used in respect of long-term insurance contracts in Brazil in 2008 was offset by a similar adjustment in Mexico in 2007.
Loan impairment chargesand other credit risk provisions rose by 42 per cent, mainly relating to credit cards, as organically grown portfolios in Mexico seasoned following market share growth and credit quality deteriorated in Mexico and Brazil. The personal unsecured, vehicle finance and small and medium-sized commercial loan portfolios in Brazil also experienced increased levels of loan impairment. Specific focus was placed on improving the quality of new business, based on underwriting experience and relationship management, and steps were taken to improve collection strategies.
Operating expenses increased by 7 per cent. An increase in staff costs was primarily driven by higher salaries following union-agreed pay rises and redundancy payments following reductions in staff numbers, partly offset by cost savings from the reduced headcount. Administrative expenses rose
following an increase in the use of a credit card cashback promotional facility in Mexico which was terminated at the end of 2008. Costs also grew in support of improved operational processes in the region. HSBC benefited in 2008 from the recognition of a tax credit following a court ruling in Brazil granting the right to recover excess taxes paid on insurance transactions and changes in transactional tax legislation. As economic conditions weakened towards the second half of 2008, strategic cost saving measures were implemented throughout the region.
2007 compared with 2006
Economic briefingIn response to fluctuations in export demand from the US, economic growth inMexico moderated during the course of 2007, with GDP rising an estimated 3.1 per cent during the year, compared with 4.8 per cent in 2006. Inflationary pressures remained significant throughout 2007, with consumer price inflation averaging 4 per cent, driven by increases in international prices of commodities, which affected domestic food prices in the core index. As a result, the Bank of Mexico raised its overnight interest rate by a total of 50 basis points, and has maintained its restrictive monetary policy despite reductions in interest rates by the US Federal Reserve.
TheBrazilianeconomy expanded strongly in 2007, with GDP expected to have grown by 5.4 per cent compared with 3.7 per cent in 2006. As in 2006, growth was driven by domestic demand, with private consumption rising considerably. As a consequence, the average unemployment rate fell to 9.3 per cent in 2007 from 10 per cent in 2006. After declining to 3.1 per cent at the end of 2006, the annual rate of consumer price inflation climbed to 4.5 per cent by December 2007, mainly from higher food prices. The cycle of monetary easing which began in the third quarter of 2005 paused in October 2007 with the overnight rate at 11.25 per cent, the lowest level in several decades. After nine years of steady expansion, the trade balance surplus fell slightly in 2007, and is expected to decrease further in 2008. Balance of payments fundamentals, however, remained robust and, as a result, the Brazilian economy seemed less vulnerable to external shocks than in previous years.
TheArgentineeconomy also performed strongly in 2007, with GDP expected to have risen by 8.7 per cent. This strength was a consequence of several factors such as a competitive exchange rate, spare capacity in the economy and a generally
132
Back to Contents
favourable external environment, which helped Argentina extend its fiscal and external surpluses into a fourth successive year. Less encouraging was the fact that inflation accelerated to about 13 per cent, up from 10 per cent in 2006. Although food inflation was part of the explanation, rapid demand growth was also a factor. 2007 was an election year, and as a result the rate of growth of fiscal spending doubled to 45 per cent on an annual basis. As a consequence, the primary surplus fell by around 1.2 per cent of GDP.
Throughout the region as a whole, GDP growthroughly matched that of 2006. The slowdown in Mexico provided a contrast to better performances elsewhere in Central and Southern America. Central America grew by an estimated 6.3 per cent, up from5.9 per cent in 2006 while, in South America, growth was an estimated 5.8 per cent, up from 5.3 per cent in 2006. The most dynamic economies in Central America were Panama (10.0 per cent growth in GDP) and the Dominican Republic (8.0 per cent), followed by Costa Rica (6.2 per cent) and Honduras (6.2 per cent). In South America, the fastest growing countries after Argentina were Peru (7.2 per cent growth in GDP), Venezuela (7.0 per cent) and Colombia (6.5 per cent). In general, inflation appears to be under control in Latin America, averaging around 5 per cent over the past three years. Only Venezuela and Argentina have experienced double-digit inflation, while the US dollar-based economies of Panama, Ecuador and El Salvador have better inflationary records.
| Reconciliation of reported and underlying profit before tax |
| |
| | 2007 compared with 2006 | |
| |
|
|
|
|
|
|
|
|
|
|
|
|
|
|
| |
| | | | | | | | | | 2007 | | | | | | | | | |
| | | | 2006 | | | | 2006 | | acquisitions, | | | | | | | | | |
| | 2006 | | acquisitions | | | | at 2007 | | disposals | | Under- | | 2007 | | Re- | | Under- | |
| | as | | and | | Currency | | exchange | | & dilution | | lying | | as | | ported | | lying | |
| | reported | | disposals | 1 | translation | 2 | rates | 6 | gains | 1 | change | | reported | | change | | change | |
| Latin America | US$m | | US$m | | US$m | | US$m | | US$m | | US$m | | US$m | | % | | % | |
| | | | | | | | | | | | | | | | | | | |
| Net interest income | 4,197 | | – | | 261 | | 4,458 | | 375 | | 743 | | 5,576 | | 33 | | 17 | |
| Net fee income | 1,630 | | – | | 86 | | 1,716 | | 86 | | 351 | | 2,153 | | 32 | | 20 | |
| Other income4 | 1,008 | | – | | 60 | | 1,068 | | 102 | | 366 | | 1,536 | | 52 | | 34 | |
| |
| |
| |
| |
| |
| |
| |
| | | | | |
| Net operating income5 | 6,835 | | – | | 407 | | 7,242 | | 563 | | 1,460 | | 9,265 | | 36 | | 20 | |
Loan impairment charges and other credit risk provisions | (938 | ) | – | | (81 | ) | (1,019 | ) | (133 | ) | (545 | ) | (1,697 | ) | (81 | ) | (53 | ) |
| |
| |
| |
| |
| |
| |
| |
| | | | | |
| Net operating income | 5,897 | | – | | 326 | | 6,223 | | 430 | | 915 | | 7,568 | | 28 | | 15 | |
| Operating expenses | (4,166 | ) | – | | (258 | ) | (4,424 | ) | (320 | ) | (658 | ) | (5,402 | ) | (30 | ) | (15 | ) |
| |
| |
| |
| |
| |
| |
| |
| | | | | |
| Operating profit | 1,731 | | – | | 68 | | 1,799 | | 110 | | 257 | | 2,166 | | 25 | | 14 | |
| Income from associates | 4 | | – | | – | | 4 | | 9 | | (1 | ) | 12 | | 200 | | (25 | ) |
| |
| |
| |
| |
| |
| |
| |
| | | | | |
| Profit before tax | 1,735 | | – | | 68 | | 1,803 | | 119 | | 256 | | 2,178 | | 26 | | 14 | |
| |
| |
| |
| |
| |
| |
| |
| | | | | |
| For footnotes, see page 143. |
Review of business performance
HSBC’s operations in Latin America reported a pre-tax profit of US$2.2 billion compared with US$1.7 billion in 2006, representing an increase of 26 per cent. The Group’s acquisitions of HSBC Bank Panama and Banca Nazionale in 2006 strengthened the existing business platform and geographical representation. On an underlying basis, pre-tax profits rose by 14 per cent as increased revenues were partly offset by higher loan impairment charges, largely from Mexico, and a rise in operating costs.
Notable contributions to Commercial Banking’s pre-tax profits, which were 64 per cent higher than in 2006, arose in Brazil from small and mid-market
enterprises and in Mexico from larger corporates. In Personal Financial Services, profit before tax increased by 12 per cent as strong growth in revenues was partly offset by increased loan impairment charges in Mexico. Profit before tax in Global Banking and Markets increased as strong growth in net fee and net interest income was partly offset by a decrease in trading income and higher costs related to business expansion.
Notwithstanding continuing investment and integration costs throughout the region, the cost efficiency ratio improved by 2.7 percentage points to 58.3 per cent.
133
Back to Contents
| H S B C H O L D I N G S P L C |
| |
| Report of the Directors: Operating and Financial Review(continued) |
| | |
| | |
| Geographical regions > Latin America > 2007 / Profit/(loss) before tax by customer group |
Net interest income increased by 17 per cent. Growth was strong across the region, with net interest income rising by 22 per cent and 11 per cent in Mexico and Brazil, respectively.
In Mexico, net interest income rose despite a fall in balance sheet management revenues due to growth in both assets and liabilities. In particular, credit card balances increased, driven by marketing and portfolio management initiatives designed to improve customer retention and card usage. Volume growth was achieved in mortgages, commercial real estate lending, trade and factoring. Customer relationship management campaigns resulted in new customer acquisitions and increased cross-selling. Net interest income in Brazil increased as the sound economic outlook and falling interest rates resulted in strong demand for credit.
Fee income rose by 20 per cent, primarily driven by robust business growth across the region. In Mexico, the use of debit and credit cards grew, in part because of the growing ATM network and the number of cards in force, which drove commissions from ATM cash withdrawals and point of sale billing. Stricter guidelines on the imposition of late payment fees also led to higher income.
A strategy to migrate more transactions to internet-based services resulted in higher payment and cash management transactions as the number of active customers rose.
Current account income increased as a result of a re-pricing exercise and a rise in volumes. Fees from loans and funds under management also grew on higher volumes. Strong growth in customer accounts delivered higher transactional fees and the continuing success of the Tu Cuenta product in Mexico led to increased take-up with higher product fees charged to customers.
Net income from trading activities decreased by 4 per cent, mainly due to reduced trading opportunities in Credit and Rates. This was partly offset by income growth from foreign exchange trading, driven by continuing market volatility.
Net gains from financial investments rose significantly following a gain on sale of shares held
in a credit bureau, a stock exchange and a derivatives exchange in Brazil.
The continued growth of insurance operations in the region, achieved by increasing HSBC’s product offerings and expanding its distribution channels, along with targeted sales initiatives, led to highernetinsurance claims incurred and movements in liabilities to policyholders.
A 97 per cent increase inother operating income reflected the recognition of the embedded value calculation on the PVIF life assurance business in Mexico. The improvement on 2006 was also aided by the non-recurrence of a loss on sale of a portfolio of assets during that year and sundry gains on foreclosed assets in 2007.
Loan impairment charges rose sharply, by 53 per cent to US$1.7 billion, mainly driven by portfolio growth, normal seasoning and higher delinquency rates on credit cards in Mexico, following a targeted expansion in market share. Loan impairment charges for small and medium-sized businesses lending and delinquencies on loans to the self-employed also increased in Mexico. Partly offsetting these developments was an improvement in personal and commercial delinquency rates in Brazil.
Continuing investment and business expansion resulted in an increase inoperating expenses of 15 per cent. This compared favourably with growth in net operating income before loan impairment charges of 20 per cent. Staff costs rose, primarily on higher salaries and bonuses in the region, driven by the need to support business growth, union-agreed pay rises and one-off costs incurred in Brazil to improve operational efficiencies. These were partially offset by a curtailment and settlement gain in Mexico from staff transferring from the Group’s defined benefit healthcare scheme to a new defined contribution scheme.
Increases in non-staff costs included higher marketing expenditure in support of growth in credit card operations, continued investment in infrastructure to support business growth and a rise in telecommunication costs and transactional taxes. Four additional months of Banca Nazionale expenses also increased costs.
134
Back to Contents
| Analysis by customer group and global business | | | | | | | | |
| |
| Profit/(loss) before tax | | | | | | | | | | | | | | |
| |
| | 2008 |
| |
|
|
|
|
|
|
|
|
|
|
|
|
|
|
|
|
|
|
| | |
| | Personal | | | | | | Global | | | | | | | | | Inter- | | | | | |
| | Financial | | | Commercial | | | Banking & | | | Private | | | | | | segment | | | | | |
| | Services | | | Banking | | | Markets | | | Banking | | | Other | | | elimination | 21 | | Total | | |
| Latin America | US$m | | | US$m | | | US$m | | | US$m | | | US$m | | | US$m | | | US$m | | |
| | | | | | | | | | | | | | | | | | | | | | |
| Net interest income | 4,582 | | | 1,637 | | | 579 | | | 22 | | | (35 | ) | | (327 | ) | | 6,458 | | |
| Net fee income | 1,339 | | | 536 | | | 248 | | | 35 | | | 9 | | | – | | | 2,167 | | |
| |
| | |
| | |
| | |
| | |
| | |
| | |
| | |
| Trading income excluding net | | | | | | | | | | | | | | | | | | | | | |
| interest income | 123 | | | 27 | | | 200 | | | 3 | | | 4 | | | – | | | 356 | | |
Net interest income/(expense) on trading activities | 7 | | | 4 | | | 8 | | | – | | | (2 | ) | | 327 | | | 345 | | |
| |
| | |
| | |
| | |
| | |
| | |
| | |
| | |
| Net trading income16 | 130 | | | 31 | | | 208 | | | 3 | | | 2 | | | 327 | | | 701 | | |
| |
| | |
| | |
| | |
| | |
| | |
| | |
| | |
| Changes in fair value of long-term debt issued and related derivatives | – | | | – | | | – | | | – | | | – | | | – | | | – | | |
| Net income from other financial instruments designated at fair value | 187 | | | – | | | 139 | | | – | | | 38 | | | – | | | 364 | | |
| |
| | |
| | |
| | |
| | |
| | |
| | |
| | |
| Net income from financial | | | | | | | | | | | | | | | | | | | | | |
| instruments designated at | | | | | | | | | | | | | | | | | | | | | |
| fair value | 187 | | | – | | | 139 | | | – | | | 38 | | | – | | | 364 | | |
| Gains less losses from financial | | | | | | | | | | | | | | | | | | | | | |
| investments | 132 | | | 21 | | | 21 | | | 2 | | | – | | | – | | | 176 | | |
| Dividend income | 16 | | | 1 | | | 3 | | | – | | | – | | – | | | 20 | | | |
| Net earned insurance premiums | 1,547 | | | 82 | | | 88 | | | – | | | – | | | – | | | 1,717 | | |
| Other operating income | 244 | | | 57 | | | 39 | | | 3 | | | 8 | | | (51 | ) | | 300 | | |
| |
| | |
| | |
| | |
| | |
| | |
| | |
| | |
| Total operating income | 8,177 | | | 2,365 | | | 1,325 | | | 65 | | | 22 | | | (51 | ) | | 11,903 | | |
| Net insurance claims17 | (1,281 | ) | | (42 | ) | | (68 | ) | | – | | | 1 | | | – | | | (1,390 | ) | |
| |
| | |
| | |
| | |
| | |
| | |
| | |
| | |
| Net operating income5 | 6,896 | | | 2,323 | | | 1,257 | | | 65 | | | 23 | | | (51 | ) | | 10,513 | | |
| Loan impairment charges and | | | | | | | | | | | | | | | | | | | | | |
| other credit risk provisions | (2,120 | ) | | (340 | ) | | (29 | ) | | – | | | (3 | ) | | – | | | (2,492 | ) | |
| |
| | |
| | |
| | |
| | |
| | |
| | |
| | |
| Net operating income | 4,776 | | | 1,983 | | | 1,228 | | | 65 | | | 20 | | | (51 | ) | | 8,021 | | |
| |
| Total operating expenses | (4,114 | ) | | (1,277 | ) | | (587 | ) | | (49 | ) | | (14 | ) | | 51 | | | (5,990 | ) | |
| |
| | |
| | |
| | |
| | |
| | |
| | |
| | |
| Operating profit | 662 | | | 706 | | | 641 | | | 16 | | | 6 | | | – | | | 2,031 | | |
| Share of profit in associates | | | | | | | | | | | | | | | | | | | | | |
| and joint ventures | 6 | | | – | | | – | | | – | | | – | | | – | | | 6 | | |
| |
| | |
| | |
| | |
| | |
| | |
| | |
| | |
| Profit before tax | 668 | | | 706 | | | 641 | | | 16 | | | 6 | | | – | | | 2,037 | | |
| |
| | |
| | |
| | |
| | |
| | |
| | |
| | |
| |
| | % | | | % | | | % | | | % | | | % | | | | | | % | | |
| | | | | | | | | | | | | | | | | | | | | | |
| Share of HSBC’s profit | | | | | | | | | | | | | | | | | | | | | |
| before tax | 7.2 | | | 7.6 | | | 6.9 | | | 0.2 | | | – | | | | | | 21.9 | | |
| Cost efficiency ratio | 59.7 | | | 55.0 | | | 46.7 | | | 75.4 | | | 60.9 | | | | | | 57.0 | | |
| |
| Balance sheet data15 | | | | | | | | | | | | | | | | | | | | | |
| | US$m | | | US$m | | | US$m | | | US$m | | | US$m | | | | | | US$m | | |
| | | | | | | | | | | | | | | | | | | | | | |
| Loans and advances to | | | | | | | | | | | | | | | | | | | | | |
| customers (net) | 18,523 | | | 15,460 | | | 8,273 | | | 31 | | | – | | | | | | 42,287 | | |
| Total assets | 30,320 | | | 19,382 | | | 48,868 | | | 391 | | | 361 | | | (1,378 | ) | | 97,944 | | |
| Customer accounts | 27,564 | | | 14,367 | | | 15,384 | | | 2,128 | | | – | | | | | | 59,443 | | |
| |
| For footnotes, see page 143. | | | | | | | | | | | | | | | | | | | | | |
135
Back to Contents
| H S B C H O L D I N G S P L C |
| |
| Report of the Directors: Operating and Financial Review(continued) |
| | |
| | |
| Geographical regions > Latin America > Profit/(loss) before tax by customer group |
Analysis by customer group and global business(continued)
Profit/(loss) before tax
| | 2007 |
| |
|
|
|
|
|
|
|
|
|
|
|
|
|
|
|
|
|
|
|
| |
| | Personal | | | | | | Global | | | | | | | | | Inter- | | | | | |
| | Financial | | | Commercial | | | Banking & | | | Private | | | | | | segment | | | | | |
| | Services | | | Banking | | | Markets | | | Banking | | | Other | | | elimination | 21 | | Total | | |
| Latin America | US$m | | | US$m | | | US$m | | | US$m | | | US$m | | | US$m | | | US$m | | |
| |
| Net interest income | 3,983 | | | 1,407 | | | 410 | | | 20 | | | 3 | | | (247 | ) | | 5,576 | | |
| Net fee income | 1,372 | | | 485 | | | 250 | | | 40 | | | 6 | | | – | | | 2,153 | | |
| |
| | |
| | |
| | |
| | |
| | |
| | |
| | |
| Trading income excluding net | | | | | | | | | | | | | | | | | | | | | |
| interest income | 67 | | | 39 | | | 164 | | | 2 | | | – | | | – | | | 272 | | |
| Net interest income on | | | | | | | | | | | | | | | | | | | | | |
| trading activities | 10 | | | 1 | | | 18 | | | – | | | – | | | 247 | | | 276 | | |
| |
| | |
| | |
| | |
| | |
| | |
| | |
| | |
| Net trading income16 | 77 | | | 40 | | | 182 | | | 2 | | | – | | | 247 | | | 548 | | |
| |
| | |
| | |
| | |
| | |
| | |
| | |
| | |
| Changes in fair value of long- | | | | | | | | | | | | | | | | | | | | | |
| term debt issued and | | | | | | | | | | | | | | | | | | | | | |
| related derivatives | – | | | – | | | – | | | – | | | – | | | – | | | – | | |
| Net income from other financial | | | | | | | | | | | | | | | | | | | | | |
| instruments designated at fair | | | | | | | | | | | | | | | | | | | | | |
| value | 314 | | | – | | | 6 | | | – | | | – | | | – | | | 320 | | |
| |
| | |
| | |
| | |
|
| |
| | |
| | |
| | |
| Net income from financial | | | | | | | | | | | | | | | | | | | | | |
| instruments designated at | | | | | | | | | | | | | | | | | | | | | |
| fair value | 314 | | | – | | | 6 | | | – | | | – | | | – | | | 320 | | |
| Gains less losses from financial | | | | | | | | | | | | | | | | | | | | | |
| investments | 120 | | | 51 | | | 82 | | | 1 | | | (1 | ) | | – | | | 253 | | |
| Gains arising from dilution of | | | | | | | | | | | | | | | | | | | | | |
| interests in associates | – | | | – | | | – | | | – | | | 11 | | | – | | | 11 | | |
| Dividend income | 5 | | | 2 | | | 2 | | | – | | | – | | | – | | | 9 | | |
| Net earned insurance premiums | 1,448 | | | 66 | | | 80 | | | – | | | – | | | – | | | 1,594 | | |
| Other operating income | 145 | | | 69 | | | 31 | | | 8 | | | 12 | | | (37 | ) | | 228 | | |
| |
| | |
| | |
| | |
| | |
| | |
| | |
| | |
| Total operating income | 7,464 | | | 2,120 | | | 1,043 | | | 71 | | | 31 | | | (37 | ) | | 10,692 | | |
| Net insurance claims17 | (1,330 | ) | | (37 | ) | | (60 | ) | | – | | | – | | | – | | | (1,427 | ) | |
| |
| | |
| | |
| | |
| | |
| | |
| | |
| | |
| Net operating income5 | 6,134 | | | 2,083 | | | 983 | | | 71 | | | 31 | | | (37 | ) | | 9,265 | | |
| |
| Loan impairment (charges)/ | | | | | | | | | | | | | | | | | | | | | |
| recoveries and other credit | | | | | | | | | | | | | | | | | | | | | |
| risk provisions | (1,492 | ) | | (212 | ) | | 13 | | | – | | | (6 | ) | | – | | | (1,697 | ) | |
| |
| | |
| | |
| | |
| | |
| | |
| | |
| | |
| Net operating income | 4,642 | | | 1,871 | | | 996 | | | 71 | | | 25 | | | (37 | ) | | 7,568 | | |
| |
| Total operating expenses | (3,758 | ) | | (1,132 | ) | | (481 | ) | | (46 | ) | | (22 | ) | | 37 | | | (5,402 | ) | |
| |
| | |
| | |
| | |
| | |
| | |
| | |
| | |
| Operating profit | 884 | | | 739 | | | 515 | | | 25 | | | 3 | | | – | | | 2,166 | | |
| Share of profit in associates | | | | | | | | | | | | | | | | | | | | | |
| and joint ventures | 9 | | | 1 | | | 2 | | | – | | | – | | | – | | | 12 | | |
| |
| | |
| | |
| | |
| | |
| | |
| | |
| | |
| Profit before tax | 893 | | | 740 | | | 517 | | | 25 | | | 3 | | | – | | | 2,178 | | |
| |
| | |
| | |
| | |
| | |
| | |
| | |
| | |
| | | | | | | | | | | | | | | | | | | | | | |
| | % | | | % | | | % | | | % | | | % | | | | | | % | | |
| | | | | | | | | | | | | | | | | | | | | | |
| Share of HSBC’s profit | | | | | | | | | | | | | | | | | | | | | |
| before tax | 3.7 | | | 3.1 | | | 2.1 | | | 0.1 | | | – | | | | | | 9.0 | | |
| Cost efficiency ratio | 61.3 | | | 54.3 | | | 48.9 | | | 64.8 | | | 71.0 | | | | | | 58.3 | | |
| |
| Balance sheet data15 | | | | | | | | | | | | | | | | | | | | | |
| | US$m | | | US$m | | | US$m | | | US$m | | | US$m | | | | | | US$m | | |
| | | | | | | | | | | | | | | | | | | | | | |
| Loans and advances to | | | | | | | | | | | | | | | | | | | | | |
| customers (net) | 21,680 | | | 16,243 | | | 9,935 | | | 65 | | | – | | | | | | 47,923 | | |
| Total assets | 35,181 | | | 21,049 | | | 45,045 | | | 302 | | | 261 | | | (750 | ) | | 101,088 | | |
| Customer accounts | 30,628 | | | 15,524 | | | 13,950 | | | 1,190 | | | – | | | | | | 61,292 | | |
| |
| For footnotes, see page 143. | | | | | | | | | | | | | | | | | | | | | |
136
Back to Contents
| | 2006 |
| |
|
|
|
|
|
|
|
|
|
|
|
|
|
|
|
|
|
|
|
| |
| | Personal | | | | | | Global | | | | | | | | | Inter- | | | | | |
| | Financial | | | Commercial | | | Banking & | | | Private | | | | | | segment | | | | | |
| | Services | | | Banking | | | Markets | | | Banking | | | Other | | | elimination | 21 | | Total | | |
| Latin America | US$m | | | US$m | | | US$m | | | US$m | | | US$m | | | US$m | | | US$m | | |
| |
| Net interest income/(expense) | 3,057 | | | 1,037 | | | 325 | | | 13 | | | (2 | ) | | (233 | ) | | 4,197 | | |
| Net fee income | 1,053 | | | 387 | | | 167 | | | 23 | | | – | | | – | | | 1,630 | | |
| |
| | |
| | |
| | |
| | |
| | |
| | |
| | |
| Trading income excluding net | | | | | | | | | | | | | | | | | | | | | |
| interest income | 61 | | | 21 | | | 218 | | | 1 | | | – | | | – | | | 301 | | |
| Net interest income/(expense) | | | | | | | | | | | | | | | | | | | | | |
| on trading activities | 14 | | | 5 | | | (16 | ) | | – | | | – | | | 233 | | | 236 | | |
| |
| | |
| | |
| | |
| | |
| | |
| | |
| | |
| Net trading income16 | 75 | | | 26 | | | 202 | | | 1 | | | – | | | 233 | | | 537 | | |
| |
| | |
| | |
| | |
| | |
| | |
| | |
| | |
| Changes in fair value of long-term | | | | | | | | | | | | | | | | | | | | | |
| debt issued and related | | | | | | | | | | | | | | | | | | | | | |
| derivatives | – | | | – | | | – | | | – | | | – | | | – | | | – | | |
| Net income from other financial | | | | | | | | | | | | | | | | | | | | | |
| instruments designated at fair | | | | | | | | | | | | | | | | | | | | | |
| value | 227 | | | – | | | 11 | | | – | | | (1 | ) | | – | | | 237 | | |
| |
| | |
| | |
| | |
| | |
| | |
| | |
| | |
| Net income/(expense) from | | | | | | | | | | | | | | | | | | | | | |
| financial instruments | | | | | | | | | | | | | | | | | | | | | |
| designated at fair value | 227 | | | – | | | 11 | | | – | | | (1 | ) | | – | | | 237 | | |
| Gains less losses from financial | | | | | | | | | | | | | | | | | | | | | |
| investments | 11 | | | 1 | | | 72 | | | – | | | – | | | – | | | 84 | | |
| Dividend income | 5 | | | 1 | | | – | | | – | | | – | | | – | | | 6 | | |
| Net earned insurance premiums | 992 | | | 27 | | | 59 | | | – | | | (2 | ) | | – | | | 1,076 | | |
| Other operating income | 74 | | | 7 | | | 10 | | | 4 | | | 14 | | | (18 | ) | | 91 | | |
| |
| | |
| | |
| | |
| | |
| | |
| | |
| | |
| Total operating income | 5,494 | | | 1,486 | | | 846 | | | 41 | | | 9 | | | (18 | ) | | 7,858 | | |
| Net insurance claims17 | (957 | ) | | (16 | ) | | (51 | ) | | – | | | 1 | | | – | | | (1,023 | ) | |
| |
| | |
| | |
| | |
| | |
| | |
| | |
| | |
| Net operating income5 | 4,537 | | | 1,470 | | | 795 | | | 41 | | | 10 | | | (18 | ) | | 6,835 | | |
| Loan impairment (charges)/ | | | | | | | | | | | | | | | | | | | | | |
| recoveries and other credit | | | | | | | | | | | | | | | | | | | | | |
| risk provisions | (764 | ) | | (197 | ) | | 26 | | | – | | | (3 | ) | | – | | | (938 | ) | |
| |
| | |
| | |
| | |
| | |
| | |
| | |
| | |
| Net operating income | 3,773 | | | 1,273 | | | 821 | | | 41 | | | 7 | | | (18 | ) | | 5,897 | | |
| Total operating expenses | (2,977 | ) | | (822 | ) | | (346 | ) | | (27 | ) | | (12 | ) | | 18 | | | (4,166 | ) | |
| |
| | |
| | |
| | |
| | |
| | |
| | |
| | |
| Operating profit/(loss) | 796 | | | 451 | | | 475 | | | 14 | | | (5 | ) | | – | | | 1,731 | | |
| Share of profit in associates | | | | | | | | | | | | | | | | | | | | | |
| and joint ventures | 4 | | | – | | | – | | | – | | | – | | | – | | | 4 | | |
| |
| | |
| | |
| | |
| | |
| | |
| | |
| | |
| Profit/(loss) before tax | 800 | | | 451 | | | 475 | | | 14 | | | (5 | ) | | – | | | 1,735 | | |
| |
| | |
| | |
| | |
| | |
| | |
| | |
| | |
| | % | | | % | | | % | | | % | | | % | | | | | | % | | |
| | | | | | | | | | | | | | | | | | | | | | |
| Share of HSBC’s profit | | | | | | | | | | | | | | | | | | | | | |
| before tax | 3.6 | | | 2.0 | | | 2.2 | | | 0.1 | | | – | | | | | | 7.9 | | |
| Cost efficiency ratio | 65.6 | | | 55.9 | | | 43.5 | | | 65.9 | | | 120.0 | | | | | | 61.0 | | |
| |
| Balance sheet data15 | | | | | | | | | | | | | | | | | | | | | |
| | US$m | | | US$m | | | US$m | | | US$m | | | US$m | | | | | | US$m | | |
| | | | | | | | | | | | | | | | | | | | | | |
| Loans and advances to | | | | | | | | | | | | | | | | | | | | | |
| customers (net) | 16,165 | | | 11,463 | | | 8,147 | | | 16 | | | – | | | | | | 35,791 | | |
| Total assets | 28,237 | | | 16,599 | | | 37,564 | | | 90 | | | 344 | | | (665 | ) | | 82,169 | | |
| Customer accounts | 25,200 | | | 13,754 | | | 11,685 | | | 222 | | | – | | | | | | 50,861 | | |
| |
| For footnotes, see page 143. | | | | | | | | | | | | | | | | | | | | | |
137
Back to Contents
| H S B C H O L D I N G S P L C |
| |
| Report of the Directors: Operating and Financial Review(continued) |
| | |
| | |
| Products and services |
| Products and services |
|
| Personal Financial Services |
Personal Financial Services provides over105 million individual and self-employed customers with financial services in 62 countries. The selection of products and services offered in each case is determined by HSBC’s participation strategy in the respective markets.
In markets where HSBC already has scale or, in emerging markets where scale can be built over time, HSBC offers a full range of personal financial products and services. Typically, products provided include personal banking products (current and savings accounts, mortgages and personal loans, credit cards, and local and international payment services), together with consumer finance and wealth management services.
In other markets, HSBC participates more selectively, targeting only those customer segments which have strong international connectivity or where HSBC’s global scale is crucial.
HSBC Premier, the Group’s premium banking service, provides personalised relationship management, a single online view of all international accounts, free international funds transfer between HSBC accounts, 24-hour priority telephone access, global travel assistance and wealth management services. There are now over 2.6 million HSBC Premier customers, who can use more than 300 specially designated Premier branches and centres in 41 countries and territories.
Wealth management (insurance and investment products and financial planning services) plays an important part in meeting the needs of customers. Insurance products distributed by HSBC through its direct channels and branch networks include loan protection, life, property and health insurance and pensions. HSBC also makes available a wide range of investment products. A choice of third-party and proprietary funds provides customers with the ability to diversify their investments across a range of best-in-class fund managers chosen after a rigorous and objective selection process. Comprehensive financial planning services covering customers’ investment, retirement, personal and asset protection needs are offered through qualified financial planning managers.
Personal customers prefer to conduct their financial business at times convenient to them, using the sales and service channels of their choice. This demand for flexibility is met through the increased provision of direct channels such as the internet and self-service terminals, in addition to traditional and
automated branches and service centres accessed by telephone.
HSBC is a major global credit card issuer with over 100 million credit cards in force in 49 countries. In addition to HSBC branded cards, HSBC Finance in the US offers Household Bank and Orchard Bank branded cards and affiliation programmes such as the GM card and the AFL-CIO Union Plus card. HSBC is also a provider of third-party private label credit cards (or store cards) through merchant relationships.
HSBC Finance’s operations in the US, the UK and Canada also make credit available to customers not well catered for by traditional banking operations and facilitate point-of-sale credit in support of retail purchases. At the end of February 2009, HSBC authorised the discontinuation as soon as practicable of all new receivable originations of all products by the branch-based consumer lending business of HSBC Finance in North America (see page 70).
High net worth individuals and their families who choose the differentiated services offered within Private Banking are not included in this customer group.
Commercial BankingHSBC is one of the world’s leading and most international banks, with over 2.9 million Commercial Banking customers in 63 countries, including sole proprietors, partnerships, clubs and associations, incorporated businesses and publicly quoted companies. At 31 December 2008, HSBC had total commercial customer account balances of US$236 billion and total commercial customer loans and advances, net of loan impairment allowances, of US$204 billion.
HSBC segments its Commercial Banking business into corporate, mid-market, small and micro businesses, allowing the development of tailored customer propositions while adopting a broader view of the entire Commercial Banking sector, from sole traders to top-end mid-market corporations. This allows HSBC to provide continuous support to companies as they grow in size both domestically and internationally, and ensures a clear focus on the small and micro business sectors, which are typically the key to innovation and growth in market economies.
HSBC places particular emphasis on geographical collaboration to meet its business customers’ needs and aims to be recognised as the leading international business bank and the best bank
138
Back to Contents
for small business in target markets. The range of products and services includes:
Financing: HSBC provides a range of short and longer-term financing options for Commercial Banking customers, both domestically and cross-border, including overdrafts, receivables finance, term loans and property finance. The Group offers forms of asset finance in selected sites and has established specialised divisions providing leasing and instalment finance for vehicles, plant and equipment.
Payments and cash management: HSBC is a leading provider of domestic and cross-border payments, collections, liquidity management and account services worldwide. The Group’s extensive network of offices and direct access to numerous local clearing systems enhances its customers’ ability to manage their cash efficiently on a global basis. Deposits are attracted through both current accounts and savings products, in local and foreign currencies.
International trade: HSBC finances and facilitates significant volumes of international trade, under both open account terms and traditional trade finance instruments. HSBC also provides international factoring, commodity and insured export finance, and forfaiting services. The Group utilises its extensive international network to build customer relationships at both ends of trade flows, and maximises efficiency through expertise in documentary checking and processing, and highly automated systems.
Treasury and capital markets: Commercial Banking customers are volume users of the Group’s foreign exchange capabilities, including sophisticated currency and interest rate options.
Commercial cards: HSBC offers commercial card services covering both issuing and acquiring. Commercial card issuing provides its customers with services which enhance cash management, improve cost control and streamline purchasing processes. HSBC offers card acquiring services, either directly or as part of a joint venture, enabling merchants to accept credit and debit card payments either in person/on the premises or when the cardholder is not present (eg over the internet or on the telephone).
Insurance: HSBC offers insurance services covering a full range of commercial insurance products designed to meet the needs of businesses and their employees, including employee benefit, pension and healthcare programmes, and a variety of commercial risks such as buildings, marine, cargo, keyman and credit protection. These products are provided by HSBC either as an intermediary (broker,
agent or consultant) or as a supplier of in-house or third-party offerings. HSBC also provides insurance due diligence reviews, and actuarial and employee benefit consultancy services.
Wealth management services: These include advice and products related to savings and investments provided to Commercial Banking customers and their employees through HSBC’s worldwide network, with clients being referred to Private Banking where appropriate.
Investment banking: A small number of Commercial Banking customers need corporate finance and advisory support. These requirements are serviced by the Group on a client-specific basis.
Delivery channels: HSBC deploys a full range of delivery channels, including specific online and direct banking offerings such as HSBCnet and Business Internet Banking.
Global Banking and Markets
Global Banking and Markets provides tailored financial solutions to major government, corporate and institutional clients worldwide. Managed as a global business, Global Banking and Markets operates a long-term relationship management approach to build a full understanding of clients’ financial requirements. Sectoral client service teams comprising relationship managers and product specialists develop financial solutions to meet individual client needs. With dedicated offices in over 66 countries and access to HSBC’s worldwide presence and capabilities, this business serves subsidiaries and offices of its clients on a global basis.
Global Banking and Markets is managed as four principal business lines: Global Markets, Global Banking, Principal Investments and Global Asset Management. This structure allows HSBC to focus on relationships and sectors that best fit the Group’s footprint and facilitates seamless delivery of HSBC’s products and services to clients.
Global MarketsHSBC’s operations in Global Markets consist of treasury and capital markets services for supranationals, central banks, corporations, institutional and private investors, financial institutions and other market participants. Products include:
| • | foreign exchange; |
| | |
| • | currency, interest rate, bond, credit, equity andother derivatives; |
139
Back to Contents
| H S B C H O L D I N G S P L C |
| |
| Report of the Directors: Operating and Financial Review(continued) |
| | |
| | |
| Products and services / Other information > FUM / Assets in custody / Property |
| • | government and non-government fixed incomeand money market instruments; |
| | |
| • | precious metals and exchange traded futures; |
| | |
| • | equity services, including research, sales andtrading for institutional, corporate and privateclients and asset management services; |
| | |
| • | distribution of capital markets instruments,including debt, equity and structured products,utilising HSBC’s global network; and |
| | |
| • | securities services, where HSBC is one of theworld’s leading custodians providing custodyand clearing services and funds administrationto both domestic and cross-border investors. |
Global BankingHSBC’s operations in Global Banking consist of financing, advisory and transaction services for corporations, institutional and private investors, financial institutions, and governments and their agencies. Products include:
| • | financing and capital markets, which comprisescapital raising, including debt and equity capital,corporate finance and advisory services,bilateral and syndicated lending, leveraged andacquisition finance, structured and projectfinance, lease finance, and non-retail deposit-taking; |
| | |
| • | international, regional and domestic paymentsand cash management services; and |
| | |
| • | other transaction services, including tradeservices, factoring and banknotes. |
| | |
Global Asset ManagementHSBC’s operations in asset management consist of products and services for institutional investors, intermediaries and individual investors and their advisers.
Principal InvestmentsThis includes private equity, which comprises HSBC’s captive private equity funds, strategic relationships with third-party private equity managers and other investments.
Private BankingHSBC’s presence in all the major wealth-creating regions has enabled it to build one of the world’s leading private banking groups, providing private banking and trustee services to high net worth individuals and their families from over 90 locations
in 43 countries and territories, with client assets of US$352 billion at 31 December 2008.
HSBC Private Bank is the principal marketing name of the HSBC Group’s international private banking business and utilising the most suitable products from the marketplace, HSBC Private Bank works with its clients to offer both traditional and innovative ways to manage and preserve wealth while optimising returns. Products and services offered include:
Private Banking Services: These comprise multi-currency deposit accounts and fiduciary deposits, credit and specialist lending, treasury trading services, cash management, securities custody and clearing. In addition, HSBC Private Bank works to ensure its clients have full access to other products and services available throughout HSBC, such as credit cards, internet banking, corporate banking, and investment banking.
Private Wealth Management: These comprise both advisory and discretionary investment services. A wide range of investment vehicles is covered, including bonds, equities, derivatives, options, futures, structured products, mutual funds and alternatives (hedge funds, private equity and real estate). By accessing regional expertise located within six major advisory centres in Hong Kong, Singapore, Geneva, New York, Paris and London, Private Banking seeks to find the most suitable investments for clients’ needs and investment strategies. Corporate Finance Solutions helps provide clients with cross-border solutions for their companies working with Global Banking & Markets.
Private Wealth Solutions: These comprise inheritance planning, trustee and other fiduciary services designed to protect existing wealth and create tailored structures to preserve wealth for future generations. Areas of expertise include trusts, foundation and company administration, charitable trusts and foundations, insurance, family office advisory and philanthropy. These are tailored to meet the individual needs of each family.
| Other information |
|
| Funds under management |
| | 2008 | | 2007 | |
| | US$bn | | US$bn | |
| Funds under management | | | | |
| At 1 January | 844 | | 695 | |
| Net new money | (1 | ) | 36 | |
| Value change | (159 | ) | 53 | |
| Exchange and other | 51 | | 60 | |
| |
| |
| |
| At 31 December | 735 | | 844 | |
| |
| |
| |
140
Back to Contents
| | At 31 December | |
| |
|
|
| |
| | 2008 | | 2007 | |
| | US$bn | | US$bn | |
| Funds under management by business | | | | |
| Global Asset Management | 370 | | 380 | |
| Private Banking | 219 | | 275 | |
| Affiliates | 2 | | 3 | |
| Other | 144 | | 186 | |
| |
| |
| |
| | 735 | | 844 | |
| |
| |
| |
Funds under management at 31 December 2008 were US$735 billion, a decrease of 13 per cent compared with 31 December 2007. Both Global Asset Management and Private Banking funds decreased due to the fall in equity markets.
Global Asset Management funds under management amounted to US$370 billion, a decrease of 3 per cent compared with 31 December 2007. Excluding an internal transfer of US$67 billion, Global Asset Management funds decreased by 20 per cent to US$303 billion.
Net outflows were predominantly driven by clients redeeming long-term funds as a consequence of the downturn in the global economic environment, although this was reduced by net new money into money market funds as clients sought to reduce risk. Additionally, the total value of funds under management was affected by a weaker investment performance resulting from turbulent markets and by foreign exchange movements.
Notwithstanding a decrease in emerging markets funds during the year, Global Asset Management remained one of the world’s largest emerging market asset managers, with US$52 billion of funds under management.
Private Banking’s funds under management decreased by 20 per cent to US$219 billion, driven by equity market performance. Net new money, while positive, amounted to only US$2 billion as positive flows in Europe, were offset by outflows of funds in other regions as clients reduced risk by transferring funds to cash deposits, many with HSBC in response to its perceived strength.
Other funds under management, of which the main element is a corporate trust business in Asia, decreased to US$144 billion.
Assets held in custody and under administration
Custody is the safekeeping and servicing of securities and other financial assets on behalf of clients. At 31 December 2008, assets held by HSBC as custodian amounted to US$3.6 trillion, 33 per cent lower than the US$5.4 trillion held at 31 December 2007. This was mainly driven by
adverse market movements affecting the value of assets held.
HSBC’s assets under administration business, which includes the provision of various support function activities including the valuation of portfolios of securities and other financial assets on behalf of clients, complements the custody business. At 31 December 2008, the value of assets held under administration by the Group amounted to US$3.3 trillion, in line with 31 December 2007.
Property
During 2008, HSBC recognised a gain of US$416 million in other operating income in respect of the purchase of the subsidiary of Metrovacesa which owned the property and long leasehold land comprising 8 Canada Square, London. See Note 23 on the Financial Statements for further details.
At 31 December 2008, HSBC operated from some 9,870 operational properties worldwide, of which approximately 2,770 were located in Europe, 1,090 in Hong Kong and Rest of Asia-Pacific, 1,640 in North America, 4,200 in Latin America and 170 in the Middle East. These properties had an area of approximately 73.6 million square feet (2007: 69.8 million square feet).
Freehold, long leasehold and short leasehold land and buildings carried on the balance sheet represented 35 per cent of HSBC’s operational space. Of the total net book value of HSBC properties, more than 72 per cent was for owned properties or properties under long-term leases. In addition, properties with a net book value of US$971 million were held for investment purposes.
HSBC’s operational properties are stated at cost, being historical cost or fair value at the date of transition to IFRSs (their deemed cost) less any impairment losses, and are depreciated on a basis calculated to write off the assets over their estimated useful lives. Properties owned as a consequence of an acquisition are recognised initially at fair value.
Valuation of freehold and leasehold land and buildings
HSBC’s freehold and long leasehold properties, together with all leasehold properties in Hong Kong, were valued in 2008. The value of these properties was US$3.3 billion (2007: US$2.2 billion) in excess of their carrying amount in the consolidated balance sheet.
Further details are included in Note 23 on the Financial Statements.
141
Back to Contents
| H S B C H O L D I N G S P L C |
| |
| Report of the Directors: Operating and Financial Review(continued) |
| | |
| | |
| Other information / Legal proceedings / Footnotes |
Legal proceedings
On 27 July 2007, the UK Office of Fair Trading (‘OFT’) issued High Court legal proceedings against a number of UK financial institutions, including HSBC Bank, to determine the legal status and enforceability of certain of the charges applied to their personal customers in relation to unauthorised overdrafts (the ‘charges’). Pending the resolution of the proceedings, the Financial Services Authority (‘FSA’) has granted firms (including HSBC Bank) a waiver enabling them to place relevant complaints about the charges on hold and the County Courts have stayed all individual customer claims.
Certain preliminary issues in these proceedings have been heard in the Commercial Division of the High Court. This has confirmed that HSBC Bank’s current and historic charges are capable of being tested for fairness but are not capable of being penalties. HSBC Bank (and all the other financial institutions involved in the legal proceedings) appealed the finding that the current charges are capable of being tested for fairness. The Court of Appeal delivered its judgement on 26 February 2009, confirming the decision of the High Court that the charges of HSBC Bank (and all of the other financial institutions involved in the legal proceedings) are capable of being tested for fairness. HSBC Bank is considering applying for leave to appeal to the House of Lords.
The proceedings remain at an early stage and may, allowing for appeals on the issues, take some time to conclude. A wide range of outcomes is possible, depending upon the outcome of any appeal to the House of Lords and, to the extent applicable, upon the Court’s assessment of the fairness of each charge across the period under review. Since July 2001, there have been a variety of charges applied by HSBC Bank across different charging periods under the then existing contractual arrangements. HSBC Bank considers the charges to be and to have been valid and enforceable, and intends strongly to defend its position.
If, contrary to HSBC Bank’s current assessment, the Court should ultimately (after appeals) reach an adverse decision that results in a liability, a large number of different outcomes is possible, each of which would have a different financial impact. Given that there is limited authority on how an assessment of fairness should be conducted, HSBC Bank’s estimate of the potential financial impact is that it could be in the order of approximately £350 million (US$510 million), as published in theInterim Report 2008. To make an estimate of the potential financial impact at this stage with any
precision is extremely difficult, owing to (among other things) the complexity of the issues, the number of permutations of possible outcomes, and the early stage of the proceedings. In addition, the assumptions made by HSBC Bank may prove to be incorrect.
On 11 December 2008 Bernard L Madoff (‘Madoff’) was arrested and charged in the United States District Court for the Southern District of New York with one count of securities fraud. That same day, the US Securities and Exchange Commission (‘SEC’) filed securities fraud charges against Madoff and his firm Bernard L Madoff Investment Securities LLC (‘Madoff Securities’), a broker dealer and investment advisor registered with the SEC. The criminal complaint and SEC complaint each alleged that Madoff had informed senior Madoff Securities employees, in substance, that his investment advisory business was a fraud. On 15 December 2008, on the application of the Securities Investor Protection Corporation, the United States District Court for the Southern District of New York appointed a trustee for the liquidation of the business of Madoff Securities, and removed the liquidation proceeding to the United States Bankruptcy Court for the Southern District of New York. On 9 February 2009, on Madoff’s consent, the United States District Court for the Southern District of New York entered a partial judgement in the SEC action, permanently enjoining Madoff from violating certain antifraud provisions of the US securities laws, ordering Madoff to pay disgorgement, prejudgement interest and a civil penalty in amounts to be determined at a later time, and continuing certain other relief previously imposed, including a freeze on Madoff’s assets. The relevant US authorities are continuing their investigations into the alleged fraud. There remains significant uncertainty as to the facts of the alleged fraud and the extent of any assets of, and remaining within, Madoff Securities.
Various non-US HSBC group companies provide custodial, administration and similar services to a number of funds incorporated outside the United States of America whose assets were invested with Madoff Securities. Based on information provided by Madoff Securities, as at 30 November 2008, the aggregate net asset value of these funds (which would include principal amounts invested and unrealised gains) was US$8.4 billion.
Proceedings concerning Madoff and Madoff Securities have already been issued in various jurisdictions against numerous defendants and HSBC expects further proceedings to be brought, including by the Madoff Securities trustee. Various
142
Back to Contents
HSBC group companies have been named as defendants in suits in the United States anticipated to seek class action status and cases in the Commercial List of the Irish courts. All of the cases where HSBC group companies are named as a defendant are at a very early stage. HSBC considers that it has good defences to these claims and will continue to defend them vigorously. HSBC is unable reliably to estimate the liability, if any, that might arise as a result of such claims.
Various HSBC group companies have also received requests for information from various regulatory authorities in connection with the alleged fraud by Madoff. HSBC group companies are co-
operating with these requests for information.
These actions apart HSBC is party to legal actions in a number of jurisdictions including the UK, Hong Kong and the US arising out of its normal business operation. HSBC considers that none of the actions is material, and none is expected to result in a significant adverse effect on the financial position of HSBC, either individually or in the aggregate. Management believes that adequate provisions have been made in respect of the litigation arising out of its normal business operations. HSBC has not disclosed any contingent liability associated with these legal actions because it is not practical to do so.
Operating and Financial Review footnotes (see pages 12 to 143)
| 1 | Columns headed ‘Acquisitions, disposals and dilution gains’ and ‘Acquisitions and disposals’ comprise the net increments or decrements in profits in the current year (compared with the previous year) which are attributable to acquisitions or disposals of subsidiaries made, or dilution gains, in the relevant years. Acquisitions and disposals are determined on the basis of the review and analysis of events in each year. |
| 2 | Currency translation’ is the effect of translating the results of subsidiaries and associates for the previous year at the average rates of exchange applicable in the current year. |
| 3 | Excluding 2007 acquisitions, disposals and dilution gains. |
| 4 | ‘Other income’ in this context comprises net trading income (see 15 below), net income from financial instruments designated at fair value, gains less losses from financial investments, gains arising from dilution of interests in associates, dividend income, net earned insurance premiums and other operating income less net insurance claims incurred and movement in liabilities to policyholders. |
| 5 | Net operating income before loan impairment charges and other credit risk provisions. |
| 6 | Excluding 2006 acquisitions, disposals and dilution gains. |
| 7 | Interest income on trading assets is reported as ‘Net trading income’ in the consolidated income statement. |
| 8 | Interest income on financial assets designated at fair value is reported as ‘Net income from financial instruments designated at fair value’ in the consolidated income statement. |
| 9 | Brazilian operations comprise HSBC Bank Brasil S.A.-Banco Múltiplo and subsidiaries, plus HSBC Serviços e Participações Limitada. |
| 10 | This table analyses interest-bearing bank deposits only. See page 59 for an analysis of all bank deposits. |
| 11 | Interest expense on financial liabilities designated at fair value is reported as ‘Net income on financial instruments designated at fair value’ in the consolidated income statement other than interest on own debt. |
| 12 | This table analyses interest-bearing customer accounts only. See page 60 for an analysis of all customer accounts. |
| 13 | Net interest margin is calculated as net interest income divided by average interest earning assets. |
| 14 | The main items reported under ‘Other’ are certain property activities, unallocated investment activities, centrally held investment companies, gains arising from the dilution of interests in associates, movements in the fair value of own debt designated at fair value (the remainder of the Group’s gain on own debt is included in Global Banking and Markets), and HSBC’s holding company and financing operations. The results also include net interest earned on free capital held centrally, operating costs incurred by the head office operations in providing stewardship and central management services to HSBC, and costs incurred by the Group Service Centres and Shared Service Organisations and associated recoveries. At 31 December 2008, gains arising from the dilution of interests in associates were nil (2007: US$1.1 billion and 2006: nil) and fair value gains on HSBC’s own debt designated at fair value were US$6.7 billion (2007: US$2.8 billion income; 2006: US$35 million expense). |
| 15 | Assets by geographical region and customer group include intra-HSBC items. These items are eliminated, where appropriate, under the heading ‘Intra-HSBC items’. |
| 16 | In the analyses of customer groups and global businesses, net trading income comprises all gains and losses from changes in the fair value of financial assets and financial liabilities classified as held for trading, together with related external and internal interest income and interest expense, and dividends received; in the statutory presentation internal interest income and expense are eliminated. |
| 17 | Net insurance claims incurred and movement in liabilities to policyholders. |
| 18 | In 2008, Global Markets included a US$529 million gain on the widening of credit spreads on structured liabilities (2007: US$34 million; 2006: nil). |
| 19 | ‘Other’ in Global Banking and Markets includes net interest earned on free capital held in the global business not assigned to products. |
| 20 | Trading assets and financial investments held in Europe, and by Global Banking and Markets in North America, include financial assets which may be repledged or resold by counterparties. |
| 21 | Inter-segment elimination comprises (i) the costs of shared services and Group Service Centres included within ‘Other’ which are recovered from customer groups, and (ii) the intra-segment funding costs of trading activities undertaken within Global Banking and Markets. HSBC’s balance sheet management business, reported within Global Banking and Markets, provides funding to the trading businesses. To report Global Banking and Markets’ ‘Net trading income’ on a fully funded basis, ‘Net interest income’ and ‘Net interest income/(expense) on trading activities’ are grossed up to reflect internal funding transactions prior to their elimination in the inter- segment column. |
| 22 | France primarily comprises the domestic operations of HSBC France, HSBC Assurances and the Paris branch of HSBC Bank. |
| 23 | United States includes the impairment of goodwill in respect of Personal Financial Services - North America as described in Note 22 on the Financial Statements. |
143
Back to Contents
| H S B C H O L D I N G S P L C |
| |
| Report of the Directors: Impact of Market Turmoil |
| | |
| | |
| Background / Overview > Reclassification |
| Background and disclosure policy |
|
| (Audited) |
As a result of the widespread deterioration in the markets for securitised and structured financial assets, and consequent disruption to the global financial system since mid-2007, it has become increasingly difficult to observe prices for structured credit risk, including prime tranches of such risk as the markets for these assets became illiquid. The resulting constraint on the ability of financial institutions to access wholesale markets to fund such assets added additional downward pressure on all asset prices. As a consequence, many financial institutions have recorded considerable reductions in the fair values of their asset-backed securities (‘ABS’s) and leveraged structured transactions, most significantly in sub-prime mortgages but in other asset classes too.
In light of increasing illiquidity and the risk to capital from further write-downs, many financial institutions took steps during 2008 to reduce leveraged exposures, build liquidity and raise additional capital. However, credit conditions suffered additional deterioration in the second half of the year, as the economic outlook worsened and unemployment rose, intensifying the pressure on the global financial system. Volatility in money markets also increased during the second half of 2008, resulting in wider interest spreads, and markets for securitised and structured financial assets continued to be thoroughly constrained. This instability triggered a series of significant events including the default of a number of major financial institutions, and the taking into public ownership of banks in a number of countries.
Deterioration in the measured fair value of assets supported by sub-prime mortgages continued in 2008 with the primary market for all but US government-sponsored issues remaining weak. Spreads widened due to credit and liquidity concerns as delinquencies on the underlying mortgages continued to increase beyond the levels priced into securitisations issued in recent years. The impact widened beyond sub-prime related assets, with the measured fair value of securities backed by Alt-A collateral, in particular, suffering significant deterioration.
During 2008, governments and central banks worldwide took unprecedented measures designed to stabilise and increase confidence in financial markets. These measures included providing vast amounts of liquidity via emergency funding, extending guarantees of financial assets, and launching various forms of rescue plans.
This section contains disclosures about the effect of the recent market turmoil on HSBC’s securitisation activities and other structured products. HSBC’s principal exposures to the US and the UK mortgage markets primarily take the form of credit risk from direct loans and advances to customers which were originated to be held to maturity or refinancing, details of which are provided on page 208.
Financial instruments which were most affected by the market turmoil include exposures to direct lending held at fair value through profit or loss and ABSs, including mortgage-backed securities (‘MBS’s) and collateralised debt obligations (‘CDO’s), and exposures to and contingent claims on monoline insurers in respect of structured credit activities and leveraged finance transactions which were originated to be distributed.
In accordance with HSBC’s policy to provide meaningful disclosures that help investors and other stakeholders understand the financial position, performance and changes in the financial position of the Group, the information provided in this section goes beyond the minimum levels required by accounting standards, statutory and regulatory requirements and listing rules. In the specific context of facilitating an understanding of the recent market turmoil in markets for securitised and structured assets, HSBC has considered the recommendations relating to disclosure contained within the reports issued by the Financial Stability Forum on ‘Enhancing Market and Institutional Resilience’ (April and October 2008), the Committee of European Banking Supervisors on ‘Banks’ Transparency on Activities and Products Affected by the Recent Market Turmoil’ (June and October 2008) and the International Accounting Standards Board Expert Advisory Panel on ‘Measuring and disclosing the fair value of financial instruments in markets that are no longer active’ (October 2008). In addition, HSBC has considered feedback from investors, regulators and other stakeholders on the disclosures that investors would find most useful.
The specific topics covered in respect of HSBC’s securitisation activities and exposure to structured products are as follows:
| • | overview of exposure; |
| • | business model; |
| • | risk management; |
| • | accounting policies; |
| • | nature and extent of HSBC’s exposures; |
| • | fair values of financial instruments; and |
| • | special purpose entities. |
144
Back to Contents
| Overview of exposure |
|
| (Audited) |
At 31 December 2008, the aggregate carrying amount of HSBC’s exposure to ABSs, trading loans
held for securitisation and exposure to leveraged finance transactions was US$91 billion (2007:US$131 billion), summarised as follows:
| | At 31 December 2008 | | | At 31 December 2007 | |
| |
|
|
|
| | |
|
|
|
| |
| | | | | Including | | | | | | Including | |
| | Carrying | | | sub-prime | | | Carrying | | | sub-prime | |
| | amount | | | and Alt-A | | | amount | | | and Alt-A | |
| | US$bn | | | US$bn | | | US$bn | | | US$bn | |
| | | | | | | | | | | | |
| ABSs | 81 | | | 12 | | | 116 | | | 31 | |
| | | | | | | | | | | | |
| – fair value through profit or loss | 14 | | | 1 | | | 33 | | | 7 | |
| – available for sale1 | 56 | | | 9 | | | 80 | | | 24 | |
| – held to maturity1 | 3 | | | – | | | 3 | | | – | |
| – loans and receivables | 8 | | | 2 | | | – | | | – | |
| | | | | | | | | | | | |
| Loans at fair value through profit or loss | 4 | | | 3 | | | 6 | | | 6 | |
| |
| | |
| | |
| | |
| |
| Leveraged finance loans | 6 | | | – | | | 9 | | | – | |
| |
| | |
| | |
| | |
| |
| – fair value through profit or loss2 | – | | | – | | | 8 | | | – | |
| – loans and receivables | 6 | | | – | | | 1 | | | – | |
| |
| | |
| | |
| | |
| |
| | 91 | | | 15 | | | 131 | | | 37 | |
| |
| | |
| | |
| | |
| |
| | |
| 1 | Total includes holdings of ABSs issued by Freddie Mac and Fannie Mae. |
| 2 | Includes the carrying amount of funded loans plus the net exposure to unfunded leveraged finance commitments. |
| | |
The majority of these exposures arise in the Global Banking and Markets business segment.
Within the total carrying amount of ABSs on the balance sheet, ABS holdings of US$14.6 billion (2007: US$32.1 billion) are held through vehicles discussed on page 148, where significant first loss protection is provided by external investors on a fully collateralised basis.
A reconciliation of the movement in the carrying amount of ABSs on the balance sheet of US$34.5 billion is set out below:
| • | the write-downs of ABSs taken to the incomestatement – US$3.4 billion; |
| | |
| • | the movement in fair values on available-for-sale ABSs taken to equity – US$16.5 billion; |
| | |
| • | principal amortisation – US$11.4 billion; and, |
| | |
| • | exchange differences and other movements –US$3.2 billion. |
Due to the market dislocation in respect of these securities, the impact of purchases and sales on the total carrying amount of ABSs was not significant in 2008.
At 31 December 2008, of the total carrying amount of ABSs and trading loans held for securitisation in respect of sub-prime and Alt-A residential mortgage exposure, US$3.5 billion (2007: US$11.7 billion) was held through special purpose entities (‘SPE’s).
Reclassification of financial assets
In October 2008, the IASB issued amendments to IAS 39 ‘Financial Instruments: Recognition and Measurement’ and IFRS 7 ‘Financial Instruments: Disclosures’ which permitted an entity to reclassify non-derivative financial assets out of the held-for-trading category as described in the accounting policies on Note 2 (e) on the Financial Statements. This was done to better align IFRSs with US GAAP and was restricted to situations where the transferring entity had the intention and ability to hold the transferred position for the foreseeable future or until maturity.
During the second half of 2008, HSBC reclassified financial assets from the held-for-trading category as tabulated below. The amount reclassified was the fair value of the financial assets at the date of reclassification, subject to the transition rules noted below. In October 2008, HSBC reclassified US$12.5 billion and US$0.4 billion of held-for-trading financial assets as loans and receivables and available for sale, respectively. During November and December 2008, HSBC reclassified a further US$2.8 billion and US$2.2 billion of held-for-trading financial assets as loans and receivables and available for sale, respectively. The financial consequence of the reclassification is that the reclassified assets are no longer marked-to-market through the income statement. Amounts reclassified as loans and receivables are accounted as such from the date of reclassification and tested thereafter for
145
Back to Contents
| H S B C H O L D I N G S P L C |
| |
| Report of the Directors: Impact of Market Turmoil(continued) |
| | |
| | |
| Overview > Reclassification / Financial effect / Global Banking and Markets ABSs |
| | On reclassification | | At 31 December 2008 | |
| |
|
|
|
|
| |
|
|
| |
| | | | Estimate of | | | | | | | |
| | Amount | | future | | Effective | | Carrying | | | |
| | reclassified | 1 | cash flows | 2 | interest rate | | amount | | Fair value | |
| | US$m | | US$m | | % | | US$m | | US$m | |
| Reclassification to loans and receivables | | | | | | | | | | |
| ABSs | 8,194 | | 11,642 | | 8 | | 7,991 | | 6,139 | |
| Trading loans – commercial mortgage loans | 650 | | 741 | | 5 | | 587 | | 557 | |
| Leveraged finance loans | 6,458 | | 8,481 | | 7 | | 5,670 | | 4,239 | |
| |
| |
| | | |
| |
| |
| | 15,302 | | 20,864 | | | | 14,248 | | 10,935 | |
| Reclassification to available for sale | | | | | | | | | | |
| Corporate debt and other securities | 2,549 | | 3,626 | | 5 | | 2,401 | | 2,401 | |
| |
| |
| | | |
| |
| |
| | 17,851 | | 24,490 | | | | 16,649 | | 13,336 | |
| |
| |
| | | |
| |
| |
| | |
| 1 | Amounts reclassified that are denominated in foreign currencies have been translated using the rate of exchange at the date of reclassification; all other amounts denominated in foreign currencies have been translated into the functional currency at the rate of exchange ruling at the balance sheet date. |
| 2 | The estimate of future cash flows represents the cash flows expected to be recovered at the date of reclassification. |
| | |
impairment. Amounts reclassified as available for sale are held at fair value with changes in the fair value recognised in equity, and tested for impairment. In line with the transition rules, for reclassifications made during October 2008, the reclassified financial assets were treated as having been so reclassified as at 1 July 2008. The impact of back-dating these retrospective reclassifications was that fair value movements between 1 July 2008 and October 2008 of US$835 million were not recorded in the income statement.
The reclassifications resulted from significant reductions in market liquidity for these assets and a change in HSBC’s intention to hold them for the foreseeable future or to maturity. These circumstances arose in the wider context of market turmoil. As a result, the Group decided to reclassify financial assets that would have met the definition of loans and receivables at initial recognition, as permitted by the IAS 39 amendments. In addition, as permitted by the IAS 39 amendments in rare
circumstances, the Group reclassified securities, that did not meet the definition of loans and receivables on initial recognition, as the conditions of market turmoil prevailing in the second half of 2008 were considered rare.
If these reclassifications had not been made, the Group’s pre-tax profit would have been reduced by US$3.5 billion from US$9.3 billion to US$5.8 billion. The reduction would have been US$0.9 billion in the North America and US$2.6 billion in the Europe segments. There was no significant impairment identified on the loans transferred even though the fair value continued to fall as a consequence of illiquidity and market sentiment.
The following table shows the fair value gains and losses, income and expense recognised in the income statement both before and after the date of reclassification:
| | | | | | | |
| | Effect on income statement | |
| |
|
|
|
|
| |
| | Prior to reclassification | | After | | Assuming no | | Net effect of | |
| |
|
|
| | reclassification | 1 | reclassification | 2 | reclassification | |
| | 2008 | | 2007 | | 2008 | | 2008 | | 2008 | |
| | US$m | | US$m | | US$m | | US$m | | US$m | |
| Reclassifications to loans and receivables | | | | | | | | | | |
| ABSs | (1,020 | ) | (357 | ) | 303 | | (1,549 | ) | 1,852 | |
| Trading loans – commercial mortgage loans | (16 | ) | – | | 17 | | (13 | ) | 30 | |
| Leveraged finance loans | (253 | ) | (158 | ) | 192 | | (1,239 | ) | 1,431 | |
| |
|
|
|
|
| |
|
|
| |
| | (1,289 | ) | (515 | ) | 512 | | (2,801 | ) | 3,313 | |
| Reclassifications to available for sale | | | | | | | | | | |
| Corporate debt and other securities | (82 | ) | (2 | ) | 22 | | (202 | ) | 224 | |
| |
|
|
|
|
| |
|
|
| |
| | (1,371 | ) | (517 | ) | 534 | | (3,003 | ) | 3,537 | |
| |
|
|
|
|
| |
|
|
| |
| | |
| 1 | Income and expense recorded in the income statement after reclassification represents the accrual of the effective interest rate and also includes US$26 million in respect of impairment of leveraged finance loans. The group recorded no impairment charges on other financial assets reclassified during the second half of 2008. |
| 2 | Effect on the income statement which would have arisen from the date of reclassification, had the reclassification not occurred. |
146
Back to Contents
Financial effect of market turmoil
As described in the background to market turmoil on page 144, the dislocation of financial markets which developed in the second half of 2007 continued throughout 2008. For the three half-year periods
affected to date, the write-downs incurred by the Group on ABSs, trading loans held for securitisation, leveraged finance transactions and the movement in fair values on available-for-sale ABSs taken to equity, plus impairment losses on specific exposures to banks, are summarised in the following table:
| | | | |
| | | | |
| | | Half-year to | |
| | |
|
|
|
|
| |
| | | 31 December | | 30 June | | 31 December | |
| | | 2008 | | 2008 | | 2007 | |
| | | US$bn | | US$bn | | US$bn | |
| | | | | | | | |
| Write-downs taken to income statement | | (2.3 | ) | (4.0 | ) | (2.3 | ) |
| Fair value movement taken to available-for-sale reserve on ABSs in the period | | (10.4 | ) | (6.1 | ) | (2.2 | ) |
| Closing balance of available-for-sale reserve relating to ABSs | | (18.7 | ) | (8.3 | ) | (2.2 | ) |
| | | | | | | | |
| | | | | | | | |
Virtually all of these effects were recorded in Global Banking and Markets. Included in write-downs taken to the income statement is US$209 million in respect of impairment losses on the collapse of financial institutions, of which US$126 million was incurred on the collapse of Icelandic banks. The group took no material write-
downs to the income statement in respect of exposures to Lehman Brothers.
Further analysis of the write-downs taken to the income statement by Global Banking and Markets, and the net carrying amounts of the positions that have generated these write-downs, are shown in the following table:
Global Banking and Markets write-downs taken to the income statement and carrying amounts
| | | Write-downs during half-year to | | Carrying amount at | |
| | |
|
|
|
|
| |
|
|
|
|
| |
| | | 31 December | | 30 June | | 31 December | | 31 December | | 30 June | | 31 December | |
| | | 2008 | | 2008 | | 2007 | | 2008 | | 2008 | | 2007 | |
| | | US$m | | US$m | | US$m | | US$m | | US$m | | US$m | |
| Sub-prime mortgage-related assets | | | | | | | | | | | | | |
| – loan securitisation | | 292 | | 301 | | 529 | | 1,213 | | 1,565 | | 1,965 | |
| – credit trading | | 150 | | 665 | | 463 | | 428 | | 1,377 | | 1,700 | |
| Other ABSs | | 486 | | 1,327 | | 459 | | 2,201 | | 8,923 | | 9,830 | |
| Derivative transactions with monolines | | | | | | | | | | | | | |
| – investment grade counterparts | | 130 | | 598 | | 133 | | 2,089 | | 1,206 | | 1,209 | |
| – non-investment grade counterparts | | 370 | | 608 | | 214 | | 352 | | 78 | | – | |
| Leveraged finance loans1 | | 26 | | 278 | | 195 | | 271 | | 7,375 | | 7,772 | |
| Other credit related items | | 95 | | 99 | | 142 | | 186 | | 321 | | 446 | |
Available-for-sale impairments and other non-trading related items | | 655 | | 55 | | – | | | | | | | |
| | |
| |
| |
| | | | | | | |
| | | 2,204 | | 3,931 | | 2,135 | | | | | | | |
| | |
| |
| |
| | | | | | | |
| | | | | | | | | | | | | | |
| 1 | The carrying amount includes funded loans plus the net exposure to unfunded leveraged finance commitments, held within fair value through the profit or loss. |
| |
Global Banking and Markets asset-backed securities classified as available for sale
HSBC’s principal holdings of ABSs are in the Global Banking and Markets’ business through special purpose entities (‘SPE’s) which have the benefit of external investor first loss protection
support, positions held directly and by Solitaire Funding Limited (‘Solitaire’) where HSBC has first loss risk.
The table below summarises these Global Banking and Markets’ exposures to ABSs which are held on an available-for-sale basis.
147
Back to Contents
| H S B C H O L D I N G S P L C |
| |
| Report of the Directors: Impact of Market Turmoil(continued) |
| | |
| | |
| Overview > Global Banking and Markets ABSs / Stress analysis // Business model > SPEs |
| Global Banking and Markets available-for-sale ABSs exposure |
| | | | | | |
| | | At 31 December 2008 | | At 31 December 2007 | |
| | |
|
|
|
|
| |
|
|
|
|
| |
| | | Directly | | | | | | Directly | | | | | |
| | | held | 1 | SPEs | | Total | | held | 1 | SPEs | | Total | |
| | | US$m | | US$m | | US$m | | US$m | | US$m | | US$m | |
| | | | | | | | | | | | | | |
Total carrying amount of net principal exposure | | 35,736 | | 14,610 | | 50,346 | | 43,826 | | 32,105 | | 75,931 | |
| – which includes sub-prime/Alt-A exposure | | 5,155 | | 3,516 | | 8,671 | | 11,801 | | 11,664 | | 23,465 | |
Available-for-sale reserves relating to sub-prime/Alt-A exposure | | (5,920 | ) | (3,573 | ) | (9,493 | ) | (1,122 | ) | – | | (1,122 | ) |
| | | Half year to | | Half year to | | Half year to | |
| | | 31 December 2008 | | 30 June 2008 | | 31 December 2007 | |
| | |
|
|
|
|
| |
|
|
|
|
| |
|
|
|
|
| |
| | | Directly | | | | | | Directly | | | | | | Directly | | | | | |
| | | held | 1 | SPEs | | Total | | held | 1 | SPEs | | Total | | held | 1 | SPEs | | Total | |
| | | US$m | | US$m | | US$m | | US$m | | US$m | | US$m | | US$m | | US$m | | US$m | |
| Impairment charge: | | | | | | | | | | | | | | | | | | | |
| – borne by HSBC | | 224 | | – | | 224 | | 55 | | – | | 55 | | – | | – | | – | |
– allocated to capital note holders | | – | | 159 | | 159 | | – | | 134 | | 134 | | – | | – | | – | |
| | |
| |
| |
| |
| |
| |
| |
| |
| |
| |
| Total impairment charge | | 224 | | 159 | | 383 | | 55 | | 134 | | 189 | | – | | – | | – | |
| | |
| |
| |
| |
| |
| |
| |
| |
| |
| |
| | | | | | | | | | | | | | | | | | | | |
| 1 | Directly held’ includes both assets held by Solitaire where HSBC provides first loss protection and those assets held directly by the Group. |
| |
Structured investment vehicles and securities investment conduits (special purpose entities)
In the table above, the total carrying amount of ABSs on the balance sheet in respect of SPEs represent holdings in which significant first loss protection is provided through the capital notes issued by the structured investment conduits (‘SIC’s), excluding Solitaire. The economic first loss protection remaining at 31 December 2008 amounted to US$2.2 billion (2007: US$2.3 billion). As set out on page 174, on an IFRS accounting basis the impairment charge of US$293 million was allocated to the capital note holders at 31 December 2008 (2007: n/a).
At each balance sheet date, an assessment is made as to whether there is any objective evidence of impairment in the value of available-for-sale ABSs. Impairment charges incurred on assets held by these SPEs are offset by a credit to the impairment line for the amount of the loss allocated to capital note holders.
Impairments recognised at 31 December 2008 from assets held directly or within Solitaire in recognition of the first loss protection of US$1.2 billion provided by HSBC through credit enhancement were US$279 million (2007: nil), based on a notional principal value of securities which were impaired of US$570 million (2007: nil). The low level of impairment recognised in comparison with the deficit in the available-for-sale reserve is a reflection of the credit quality and seniority of the assets held.
Sub-prime and Alt-A residential mortgage-backed securities
Management’s current assessment of the holdings of available-for-sale ABSs with the most sensitivity to possible future impairment is focused on sub-prime and Alt-A residential mortgage-backed securities (‘MBS’s).
Excluding holdings in the SPEs discussed above, available-for-sale holdings in these categories within Global Banking and Markets amounted to US$5.2 billion at 31 December 2008 (2007: US$11.8 billion). During the year ended 31 December 2008, the movement in fair values of these securities taken to equity was a reduction of US$4.8 billion. The deficit in the available-for-sale fair value reserve as at 31 December 2008 in relation to these securities was US$5.9 billion (2007: US$1.1 billion). The main factors in the reduction in fair value of these securities over the period were the effects of reduced market liquidity and negative market sentiment. The level of actual credit losses experienced was low in 2008, notwithstanding the deterioration in the performance of the underlying mortgages in the period as US house prices fell and defaults increased. The absence of material credit losses is judged to be attributable to the seniority of the tranches held by HSBC as well as the priority for cash flow held by these tranches.
148
Back to Contents
During February 2009, the credit ratings on a proportion of ABSs held directly by HSBC, Solitaire and the SICs were downgraded. In particular, Moody’s Investor Services downgraded the ratings on substantially all the Group’s holdings of US Alt-A residential MBSs issued during 2006 and 2007.
As discussed on page 170, when assessing available-for-sale ABSs for objective evidence of impairment at the balance sheet date HSBC considers all available evidence including the performance of the underlying collateral. A downgrade of a security’s credit rating is not, of itself, evidence of impairment. Consequently, Moody’s action has no direct impact on the measurement of impairment losses. The impairment losses recognised on these securities at 31 December 2008 is set out on page 148.
Stress analysis
(Unaudited)
HSBC’s regular impairment assessment uses an industry standard model with inputs which are corroborated using observable market data where available. At 31 December 2008, management performed a stress test on the available-for-sale ABS positions, based on the fair value of the positions at that date. The outcome of the stress test was particularly sensitive to expected loss and prepayment rates for Alt-A securities and the loss of credit protection from certain monoline insurers on US Home Equity Lines of Credit (‘HELoC’s). The results of the stress test showed that, by applying different inputs to those currently observed, a further potential impairment charge to the income statement of some US$2 billion to US$2.5 billion could arise over the next three years. These different inputs were calculated by increasing the net impact of expected loss and prepayment rates for Alt-A securities by between a third and a half depending on loan vintage and by removing all credit protection from monoline insurers rated below AAA by S&P on the HELoC positions. However, management believes that the loss which would be realised in cash terms would be considerably lower than the impairment charge above and potentially cost some US$0.6 billion to US$0.8 billion over the next four years.
Asset-backed securities and leveraged finance
HSBC is or has been involved in the following activities in these areas:
| • | the purchase of US mortgage loans with theintention of structuring and placingsecuritisations into the market; |
| • | trading in ABSs, including MBSs, in secondarymarkets; |
| | |
| • | the holding of MBSs and other ABSs in balancesheet management activities, with the intentionof earning net interest income over the life ofthe securities; |
| | |
| • | the holding of MBSs and other ABSs as part ofinvestment portfolios, including the SIVs, SICsand money market funds described under‘Special purpose entities’ below, with theintention of earning net interest income andmanagement fees; |
| | |
| • | MBSs or other ABSs held in the tradingportfolio hedged through credit derivativeprotection, typically purchased from monolineinsurers, with the intention of earning the spreaddifferential over the life of the instruments; and |
| | |
| • | leveraged finance: originating loans for thepurposes of syndicating or selling them down inorder to generate a trading profit and holdingthem in order to earn interest margin over theirlives.
|
Historically, these activities have not been a significant part of Global Banking and Markets’ business, and Global Banking and Markets is not reliant on them for any material aspect of its business operations or profitability.
The purchase and securitisation of US mortgage loans and the secondary trading of US MBSs was conducted in HSBC’s US MBSs business. This business was discontinued in 2007.
Special purpose entities
HSBC enters into certain transactions with customers in the ordinary course of business which involve the establishment of SPEs to facilitate customer transactions. SPEs are used in HSBC’s business in order to provide structured investment opportunities for customers, facilitate the raising of funding for customers’ business activities, or diversify HSBC’s sources of funding and/or improve capital efficiency.
The use of SPEs is not a significant part of HSBC’s activities and HSBC is not reliant on the use of SPEs for any material part of its business operations or profitability. Detailed disclosures of HSBC’s sponsored SPEs are provided on page 173.
149
Back to Contents
| H S B C H O L D I N G S P L C |
| |
| Report of the Directors: Impact of Market Turmoil(continued) |
| |
| | |
| Risk management / Accounting policies / Nature and extent of exposures |
The effect of the recent market turmoil on HSBC’s risk exposures, the way in which HSBC has managed risk exposures in this context, and any changes made in HSBC’s risk management polices and procedures in response to the market conditions are set out in the following sections:
| • | Liquidity risk – ‘The impact of market turmoilon the Group’s liquidity risk position’ (seepage 239). |
| | |
| • | Market risk – ‘The impact of market turmoilon market risk’ (see page 242). |
| | |
| • | Credit Risk – ‘Credit exposure’ (see page 197). |
| | |
| Accounting policies |
|
| (Audited) |
HSBC’s accounting policies regarding the classification and valuation of financial instruments are in accordance with the requirements of IAS 32 ‘Financial Instruments: Presentation’ and IAS 39 ‘Financial Instruments: Recognition and Measurement’, as described in Note 2 on the Financial Statements, and the use of assumptions and estimation in respect of valuation of financial instruments as described on page 63.
| Nature and extent of HSBC’s exposures |
|
| (Audited) |
This section contains information on HSBC’s exposures to the following:
| • | direct lending held at fair value through profit orloss; |
| | |
| • | ABSs including MBSs and CDOs; |
| | |
| • | monoline insurers; |
| | |
| • | credit derivative product companies (‘CDPC’s);and |
| | |
| • | leveraged finance transactions. |
MBSs are securities that represent interests in a group of mortgages. Investors in these securities have the right to cash received from future mortgage payments (interest and/or principal). Where an MBS references mortgages with different risk profiles, the MBS is classified according to the highest risk class. Consequently, an MBS with both sub-prime and Alt-A exposures is classified as sub-prime.
CDOs are securities in which ABSs and/or certain other related assets have been purchased and securitised by a third-party, or securities which pay a
return which is referenced to those assets. CDOs may feature exposure to sub-prime mortgage assets through the underlying assets. As there is often uncertainty surrounding the nature of the underlying collateral supporting CDOs, all CDOs supported by residential mortgage-related assets, irrespective of the level of sub-prime assets, are classified as sub-prime.
HSBC’s holdings of ABSs and CDOs, and its direct lending positions, include the following categories of collateral and lending activity:
| • | sub-prime: loans to customers who havelimited credit histories, modest incomes, highdebt-to-income ratios or have experienced creditproblems caused by occasional delinquencies,prior charge-offs, bankruptcy or other credit-related actions. For US mortgages, US creditscores are primarily used to determine whether aloan is sub-prime. US home equity lines ofcredit are classified as sub-prime. For non-USmortgages, management judgement is used toidentify loans of similar risk characteristics tosub-prime, for example, UK non-conformingmortgages (see below); |
| | |
| • | US home equity lines of credit (‘HELoC’s): aform of revolving credit facility provided tocustomers, which is supported by a first orsecond lien charge over residential property.
Global Banking and Markets’ holdings ofHELoCs are classified as US sub-primeresidential mortgage assets; |
| | |
| • | US Alt-A: loans classified as Alt-A are regardedas lower risk than sub-prime, but they sharehigher risk characteristics than lending undernormal criteria. US credit scores, as well as thelevel of mortgage documentation held (such asproof of income), are considered whendetermining whether an Alt-A classification isappropriate. Non-agency mortgages in the USare classified as Alt-A if they do not meet thecriteria for classification as sub-prime. These aremortgages not eligible to be sold to the majorUS Government agency, Ginnie Mae(Government National Mortgage Association),and government sponsored enterprises in themortgage market, Fannie Mae (the FederalNational Mortgage Association) and FreddieMac (the Federal Home Loan MortgageCorporation); |
| | |
| • | US government agency mortgage-relatedassets: securities that are guaranteed by USGovernment agencies, such as Ginnie Mae; |
150
Back to Contents
| • | US Government sponsored enterprisesmortgage-related assets: securities that areguaranteed by US Government sponsoredentities, including Fannie Mae and Freddie Mac; |
| | |
| • | UK non-conforming mortgage-related assets:UK mortgages that do not meet normal lendingcriteria. This includes instances where thenormal level of documentation has not beenprovided (for example, in the case of self-certification of income), or where increased riskfactors, such as poor credit history, result inlending at a rate that is higher than the normallending rate. UK non-conforming mortgages aretreated as sub-prime exposures; and |
| | |
| • | other mortgage-related assets: residentialmortgage-related assets that do not meet any ofthe classifications described above. Prime |
residential mortgage-related assets are included in this category.
HSBC’s exposure to non-residential mortgage-related ABSs and direct lending includes:
| • | commercial property mortgage-relatedassets: MBSs with collateral other thanresidential mortgage-related assets; |
| | |
| • | leveraged finance-related assets: securitieswith collateral relating to leveraged financeloans; |
| | |
| • | student loan-related assets: securities withcollateral relating to student loans; and |
| | |
| • | other assets: securities with other receivable-related collateral. |
| Carrying amount of HSBC’s consolidated holdings of ABSs, and direct lending held at fair value through profit or loss | | |
| | | At 31 December 2008 | | |
| | |
| | |
| | | | | | | | | | | | Designated | | | | | | | | | Of which | | |
| | | | | | | | | | | | at fair value
| | | | | | | | | held through | | |
| | | Trading | | | Available
for sale | | | Held to
maturity | | | through
profit or loss | | | Loans and
receivables | | | Total | | | consolidated
SPEs | | |
| | | US$m | | | US$m | | | US$m | | | US$m | | | US$m | | | US$m | | | US$m | | |
| Sub-prime residential | | | | | | | | | | | | | | | | | | | | | | |
| mortgage-related assets | | 3,372 | | | 3,741 | | | – | | | 1 | | | 453 | | | 7,567 | | | 4,230 | | |
| Direct lending | | 2,789 | | | – | | | – | | | – | | | – | | | 2,789 | | | 1,300 | | |
| MBSs and MBS CDOs1 | | 583 | | | 3,741 | | | – | | | 1 | | | 453 | | | 4,778 | | | 2,930 | | |
| US Alt-A residential | | | | | | | | | | | | | | | | | | | | | | |
| mortgage-related assets | | 618 | | | 5,829 | | | 185 | | | – | | | 1,056 | | | 7,688 | | | 3,831 | | |
| Direct lending | | 246 | | | – | | | – | | | – | | | - | | | 246 | | | – | | |
| MBSs1 | | 372 | | | 5,829 | | | 185 | | | – | | | 1,056 | | | 7,442 | | | 3,831 | | |
| US government agency | | | | | | | | | | | | | | | | | | | | | | |
mortgage-related assets MBSs1 | | 640 | | | 7,418 | | | 494 | | | – | | | – | | | 8,552 | | | 441 | | |
| US government-sponsored | | | | | | | | | | | | | | | | | | | | | | |
enterprises mortgage-related assets MBSs1 | | 487 | | | 12,894 | | | 1,918 | | | 51 | | | – | | | 15,350 | | | – | | |
| Other residential mortgage- | | | | | | | | | | | | | | | | | | | | | | |
| related assets | | 1,633 | | | 4,272 | | | – | | | 31 | | | 2,135 | | | 8,071 | | | 2,822 | | |
| Direct lending | | 677 | | | – | | | – | | | – | | | – | | | 677 | | | – | | |
| MBSs1 | | 956 | | | 4,272 | | | – | | | 31 | | | 2,135 | | | 7,394 | | | 2,822 | | |
| Commercial property mortgage- | | | | | | | | | | | | | | | | | | | | | | |
related assets MBSs and MBS CDOs1 | | 589 | | | 6,802 | | | – | | | 86 | | | 1,402 | | | 8,879 | | | 4,985 | | |
| Leveraged finance-related assets | | | | | | | | | | | | | | | | | | | | | | |
| ABSs and ABS CDOs1 | | 784 | | | 4,489 | | | – | | | – | | | 204 | | | 5,477 | | | 3,667 | | |
| Student loan-related assets | | | | | | | | | | | | | | | | | | | | | | |
| ABSs and ABS CDOs1 | | 214 | | | 4,809 | | | – | | | 3 | | | 81 | | | 5,107 | | | 4,028 | | |
| Other assets | | | | | | | | | | | | | | | | | | | | | | |
| ABSs and ABS CDOs1 | | 3,068 | | | 5,957 | | | – | | | 6,371 | | | 2,660 | | | 18,056 | | | 3,941 | | |
| | |
| | |
| | |
| | |
| | |
| | |
| | |
| | |
| | | 11,405 | | | 56,211 | | | 2,597 | | | 6,543 | | | 7,991 | | | 84,747 | | | 27,945 | | |
| | |
| | |
| | |
| | |
| | |
| | |
| | |
| | |
| |
| For footnotes, see page 162. | | | | | | | | | | | | | | | | | | | | | | |
| The above table excludes leveraged finance transactions, which are shown separately on page 160. | | | | | | | | |
151
Back to Contents
| H S B C H O L D I N G S P L C |
| |
| Report of the Directors: Impact of Market Turmoil(continued) |
| |
| | |
| Nature and extent of exposures |
Carrying amount of HSBC’s consolidated holdings of ABSs, and direct lending held at fair value through profit or loss (continued)
| | | At 31 December 2007 | | |
| | |
| | |
| | | | | | | | | | | | Designated | | | | | | Of which | | |
| | | | | | | | | | | | at fair value | | | | | | held through | | |
| | | | | | Available | | | Held to | | | through | | | | | | consolidated | | |
| | | Trading | | | for sale | | | maturity | | | profit or loss | | | Total | | | SPEs | | |
| | | US$m | | | US$m | | | US$m | | | US$m | | | US$m | | | US$m | | |
| | | | | | | | | | | | | | | | | | | | |
| Sub-prime residential mortgage-related assets | | 9,431 | | | 9,311 | | | – | | | 2 | | | 18,744 | | | 11,504 | | |
| Direct lending | | 5,825 | | | – | | | – | | | – | | | 5,825 | | | 3,596 | | |
| MBSs and MBS CDOs1 | | 3,606 | | | 9,311 | | | – | | | 2 | | | 12,919 | | | 7,908 | | |
| US Alt-A residential mortgage-related assets | | 3,288 | | | 14,760 | | | 173 | | | – | | | 18,221 | | | 11,193 | | |
| Direct lending | | 342 | | | – | | | – | | | – | | | 342 | | | – | | |
| MBSs1 | | 2,946 | | | 14,760 | | | 173 | | | – | | | 17,879 | | | 11,193 | | |
| US government agency mortgage-related assets | | | | | | | | | | | | | | | | | | | |
| MBSs1 | | 204 | | | 5,239 | | | 552 | | | – | | | 5,995 | | | – | | |
| US government-sponsored enterprises | | | | | | | | | | | | | | | | | | | |
| mortgage-related assets | | | | | | | | | | | | | | | | | | | |
| MBSs1 | | 2,583 | | | 11,414 | | | 1,881 | | | 26 | | | 15,904 | | | – | | |
| Other residential mortgage-related assets | | 5,243 | | | 5,701 | | | – | | | 289 | | | 11,233 | | | 4,441 | | |
| Direct lending | | 416 | | | – | | | – | | | – | | | 416 | | | – | | |
| MBSs1 | | 4,827 | | | 5,701 | | | – | | | 289 | | | 10,817 | | | 4,441 | | |
| Commercial property mortgage-related assets | | | | | | | | | | | | | | | | | | | |
| MBSs and MBS CDO1 | | 3,467 | | | 10,505 | | | – | | | 105 | | | 14,077 | | | 8,600 | | |
| Leveraged finance-related assets | | | | | | | | | | | | | | | | | | | |
| ABSs and ABS CDOs1 | | 263 | | | 5,820 | | | – | | | – | | | 6,083 | | | 5,126 | | |
| Student loan-related assets | | | | | | | | | | | | | | | | | | | |
| ABSs and ABS CDOs1 | | 144 | | | 7,052 | | | – | | | – | | | 7,196 | | | 6,308 | | |
| Other assets | | 6,252 | | | 10,683 | | | – | | | 7,736 | | | 24,671 | | | 9,495 | | |
| Direct lending | | 3 | | | – | | | – | | | – | | | 3 | | | – | | |
| ABSs and ABS CDOs1 | | 6,249 | | | 10,683 | | | – | | | 7,736 | | | 24,668 | | | 9,495 | | |
| | |
| | |
| | |
| | |
| | |
| | |
| | |
| | | 30,875 | | | 80,485 | | | 2,606 | | | 8,158 | | | 122,124 | | | 56,667 | | |
| |
| | |
| | |
| | |
| | |
| | |
| | |
| |
| For footnotes, see page 162. | | | | | | | | | | | | | | | | | | | |
| The above table excludes leveraged finance transactions, which are shown separately on page 160. | | | | | | | | |
| | | | | | | | | |
Included in the above table are ABSs which are held through SPEs that are consolidated by HSBC. Although HSBC includes these assets in full on its balance sheet, the risks arising from the assets are mitigated to the extent of third-party investment in notes issued by those SPEs. For a description of HSBC’s holdings of and arrangements with SPEs, see page 173.
The exposure detailed above includes long positions where risk is mitigated by specific credit derivatives with monoline insurers (‘monolines’) and other financial institutions. These positions comprise:
| • | residential MBSs with a carrying amount ofUS$0.9 billion (2007: US$2.1 billion); |
| | |
| • | residential MBS CDOs with a carrying amountof US$39 million (2007: US$349 million); and |
| • | ABSs other than residential MBSs and MBS CDOs with a carrying amount of US$9.8 billion (2007: US$10.8 billion). |
| | |
| | In the tables which follow, carrying amounts and gains and losses are given for securities except those where risk is mitigated through specific credit derivatives with monolines. The counterparty credit risk arising from the derivative transactions undertaken with monolines is covered in the monoline exposure analysis on page 159. |
US government-sponsored enterprises mortgage-related assets shown in the table above include holdings of securities issued by Freddie Mac of US$8.0 billion (2007: US$6.8 billion) and by Fannie Mae of US$6.6 billion (2007: US$8.5 billion).
152
Back to Contents
HSBC’s consolidated holdings of US ABSs, and direct lending held at fair value through profit or loss
| | 2008 | | | At 31 December 2008 | |
| |
|
|
|
|
|
|
|
| |
|
|
|
|
|
|
| |
| | | | | | | | Fair value | | | | | | | | | | | | | | | | |
| | Unrealised | | | Realised | | | movements | | | | | | | | | CDS | | | Net | | | | |
| | gains and | | | gains and | | | through | | | Impair- | | | Gross | | | gross | | | principal | | | Carrying | |
| | (losses) | 3 | | (losses) | 4 | | equity | 5 | | ment | 6 | | principal | 7 | | protection | 8 | | exposure | 9 | | amount | 10 |
| | US$m | | | US$m | | | US$m | | | US$m | | | US$m | | | US$m | | | US$m | | | US$m | |
| US sub-prime residential | | | | | | | | | | | | | | | | | | | | | | | |
| mortgage-related assets | | | | | | | | | | | | | | | | | | | | | | | |
| Direct lending | (494 | ) | | 7 | | | – | | | – | | | 3,653 | | | – | | | 3,653 | | | 2,789 | |
| MBSs1 | (784 | ) | | 1 | | | (1,578 | ) | | – | | | 6,845 | | | 794 | | | 6,051 | | | 3,044 | |
| – high grade2 | (243 | ) | | 6 | | | (290 | ) | | – | | | 2,903 | | | 507 | | | 2,396 | | | 1,634 | |
| – rated C to A | (444 | ) | | (4 | ) | | (1,288 | ) | | – | | | 3,913 | | | 287 | | | 3,626 | | | 1,399 | |
| – not publicly rated | (97 | ) | | (1 | ) | | – | | | – | | | 29 | | | – | | | 29 | | | 11 | |
| MBS CDOs1 | (110 | ) | | – | | | (55 | ) | | (50 | ) | | 1,042 | | | 234 | | | 808 | | | 61 | |
| – high grade2 | – | | | – | | | (78 | ) | | – | | | 172 | | | 27 | | | 145 | | | 45 | |
| – rated C to A | (110 | ) | | – | | | 23 | | | (50 | ) | | 870 | | | 207 | | | 663 | | | 16 | |
| |
| | |
| | |
| | |
| | |
| | |
| | |
| | |
| |
| | (1,388 | ) | | 8 | | | (1,633 | ) | | (50 | ) | | 11,540 | | | 1,028 | | | 10,512 | | | 5,894 | |
| |
| | |
| | |
| | |
| | |
| | |
| | |
| | |
| |
| US Alt-A residential | | | | | | | | | | | | | | | | | | | | | | | |
| mortgage-related assets | | | | | | | | | | | | | | | | | | | | | | | |
| Direct lending | (11 | ) | | – | | | – | | | – | | | 264 | | | – | | | 264 | | | 246 | |
| MBSs1 | (737 | ) | | 9 | | | (6,416 | ) | | (510 | ) | | 16,860 | | | 436 | | | 16,424 | | | 7,174 | |
| – high grade2 | (446 | ) | | 17 | | | (3,012 | ) | | (82 | ) | | 9,804 | | | 317 | | | 9,487 | | | 4,869 | |
| – rated C to A | (292 | ) | | (7 | ) | | (3,404 | ) | | (428 | ) | | 7,041 | | | 119 | | | 6,922 | | | 2,293 | |
| – not publicly rated | 1 | | | (1 | ) | | – | | | – | | | 15 | | | – | | | 15 | | | 12 | |
| |
| | |
| | |
| | |
| | |
| | |
| | |
| | |
| |
| | (748 | ) | | 9 | | | (6,416 | ) | | (510 | ) | | 17,124 | | | 436 | | | 16,688 | | | 7,420 | |
| |
| | |
| | |
| | |
| | |
| | |
| | |
| | |
| |
| US government agency | | | | | | | | | | | | | | | | | | | | | | | |
| mortgage-related assets | | | | | | | | | | | | | | | | | | | | | | | |
| MBSs1 | | | | | | | | | | | | | | | | | | | | | | | |
| – high grade2 | 3 | | | 9 | | | 122 | | | – | | | 8,448 | | | – | | | 8,448 | | | 8,551 | |
| US government-sponsored | | | | | | | | | | | | | | | | | | | | | | | |
| enterprises mortgage-related assets | | | | | | | | | | | | | | | | | | | | | | | |
| MBSs1 | | | | | | | | | | | | | | | | | | | | | | | |
| – high grade2 | (54 | ) | | 31 | | | 270 | | | – | | | 15,022 | | | – | | | 15,022 | | | 15,349 | |
| Other US residential | | | | | | | | | | | | | | | | | | | | | | | |
| mortgage-related assets | | | | | | | | | | | | | | | | | | | | | | | |
| Direct lending | 23 | | | (9 | ) | | – | | | – | | | 691 | | | – | | | 691 | | | 677 | |
| MBSs1 | (65 | ) | | (37 | ) | | 33 | | | – | | | 1,039 | | | 284 | | | 755 | | | 614 | |
| – high grade2 | (63 | ) | | (37 | ) | | 33 | | | – | | | 959 | | | 262 | | | 697 | | | 574 | |
| – rated C to A | (2 | ) | | – | | | – | | | – | | | 80 | | | 22 | | | 58 | | | 40 | |
| |
| | |
| | |
| | |
| | |
| | |
| | |
| | |
| |
| | (42 | ) | | (46 | ) | | 33 | | | – | | | 1,730 | | | 284 | | | 1,446 | | | 1,291 | |
| |
| | |
| | |
| | |
| | |
| | |
| | |
| | |
| |
| Commercial property | | | | | | | | | | | | | | | | | | | | | | | |
| mortgage-related assets | | | | | | | | | | | | | | | | | | | | | | | |
| MBS and MBS CDOs1 | (57 | ) | | (19 | ) | | (1,709 | ) | | – | | | 5,797 | | | 553 | | | 5,244 | | | 3,182 | |
| – high grade2 | (57 | ) | | (18 | ) | | (1,696 | ) | | – | | | 5,658 | | | 553 | | | 5,105 | | | 3,059 | |
| – rated C to A | – | | | (1 | ) | | (13 | ) | | – | | | 108 | | | – | | | 108 | | | 94 | |
| – not publicly rated | – | | | – | | | – | | | – | | | 31 | | | – | | | 31 | | | 29 | |
| |
| | |
| | |
| | |
| | |
| | |
| | |
| | |
| |
| Balance carried forward | (2,286 | ) | | (8 | ) | | (9,333 | ) | | (560 | ) | | 59,661 | | | 2,301 | | | 57,360 | | | 41,687 | |
153
Back to Contents
| H S B C H O L D I N G S P L C |
| |
| Report of the Directors: Impact of Market Turmoil (continued) |
| | |
| | |
| Nature and extent of exposures |
HSBC’s consolidated holdings of US ABSs, and direct lending held at fair value through profit or loss(continued)
| | 2008 | | At 31 December 2008 | |
| |
|
|
|
|
|
|
|
|
|
|
| |
|
|
|
|
|
|
|
|
|
| |
| | | | | | | | Fair value | | | | | | | | | | | | | | | | |
| | Unrealised | | | Realised | | | movements | | | | | | | | | CDS | | | Net | | | | |
| | gains and | | | gains and | | | through | | | Impair- | | | Gross | | | gross | | | principal | | | Carrying | |
| | (losses) | 3 | | (losses) | 4 | | equity | 5 | | ment | 6 | | principal | 7 | | protection | 8 | | exposure | 9 | | amount | 10 |
| | US$m | | | US$m | | | US$m | | | US$m | | | US$m | | | US$m | | | US$m | | | US$m | |
| | | | | | | | | | | | | | | | | | | | | | | | |
| Balance brought forward | (2,286 | ) | | (8 | ) | | (9,333 | ) | | (560 | ) | | 59,661 | | | 2,301 | | | 57,360 | | | 41,687 | |
| Leveraged finance-related assets | | | | | | | | | | | | | | | | | | | | | | | |
| ABSs and ABS CDOs1 | (15 | ) | | – | | | (1,000 | ) | | – | | | 5,212 | | | 551 | | | 4,661 | | | 3,390 | |
| – high grade2 | (15 | ) | | – | | | (996 | ) | | – | | | 5,193 | | | 551 | | | 4,642 | | | 3,375 | |
| – rated C to A | – | | | – | | | (4 | ) | | – | | | 19 | | | – | | | 19 | | | 15 | |
| Student loan-related assets | | | | | | | | | | | | | | | | | | | | | | | |
| ABSs and ABS CDOs1 | (63 | ) | | (4 | ) | | (1,959 | ) | | – | | | 7,610 | | | 279 | | | 7,331 | | | 4,908 | |
| – high grade2 | (47 | ) | | (4 | ) | | (1,649 | ) | | – | | | 6,888 | | | 279 | | | 6,609 | | | 4,523 | |
| – rated C to A | (16 | ) | | – | | | (310 | ) | | – | | | 722 | | | – | | | 722 | | | 385 | |
| Other assets | | | | | | | | | | | | | | | | | | | | | | | |
| ABS and ABS CDOs1 | (247 | ) | | (90 | ) | | (807 | ) | | (33 | ) | | 7,885 | | | 1,539 | | | 6,346 | | | 4,277 | |
| – high grade2 | (153 | ) | | (71 | ) | | (589 | ) | | – | | | 5,216 | | | 1,370 | | | 3,846 | | | 2,725 | |
| – rated C to A | (94 | ) | | (19 | ) | | (218 | ) | | (13 | ) | | 1,916 | | | 169 | | | 1,747 | | | 805 | |
| – not publicly rated | – | | | – | | | – | | | (20 | ) | | 753 | | | – | | | 753 | | | 747 | |
| |
| | |
| | |
| | |
| | |
| | |
| | |
| | |
| |
| Total | (2,611 | ) | | (102 | ) | | (13,099 | ) | | (593 | ) | | 80,368 | | | 4,670 | | | 75,698 | | | 54,262 | |
| |
| | |
| | |
| | |
| | |
| | |
| | |
| | |
| |
| | 2007 | | At 31 December 2007 | |
| |
|
|
|
|
|
|
|
| |
|
|
|
|
|
|
| |
| | | | | | | | Fair value | | | | | | | | | | | | | | | | |
| | Unrealised | | | Realised | | | movements | | | | | | | | | CDS | | | Net | | | | |
| | gains and | | | gains and | | | through | | | Impair- | | | Gross | | | gross | | | principal | | | Carrying | |
| | (losses) | 3 | | (losses) | 4 | | equity | 5 | | ment | 6 | | principal | 7 | | protection | 8 | | exposure | 9 | | amount | 10 |
| | US$m | | | US$m | | | US$m | | | US$m | | | US$m | | | US$m | | | US$m | | | US$m | |
| | | | | | | | | | | | | | | | | | | | | | | | |
US sub-prime residential mortgage-related assets11 | | | | | | | | | | | | | | | | | | | | | | | |
| Direct lending | (385 | ) | | (251 | ) | | – | | | – | | | 6,288 | | | – | | | 6,288 | | | 5,825 | |
| MBSs1 | (564 | ) | | (69 | ) | | (290 | ) | | – | | | 9,576 | | | 657 | | | 8,919 | | | 7,981 | |
| – high grade2 | (121 | ) | | (10 | ) | | (289 | ) | | – | | | 9,079 | | | 647 | | | 8,432 | | | 7,807 | |
| – rated C to A | (275 | ) | | (36 | ) | | (1 | ) | | – | | | 462 | | | 10 | | | 452 | | | 153 | |
| – not publicly rated | (168 | ) | | (23 | ) | | – | | | – | | | 35 | | | – | | | 35 | | | 21 | |
| MBS CDOs1 | (21 | ) | | – | | | (45 | ) | | – | | | 1,157 | | | 652 | | | 505 | | | 440 | |
| – high grade2 | (19 | ) | | – | | | (40 | ) | | – | | | 923 | | | 454 | | | 469 | | | 411 | |
| – rated C to A | (2 | ) | | – | | | (5 | ) | | – | | | 234 | | | 198 | | | 36 | | | 29 | |
| |
| | |
| | |
| | |
| | |
| | |
| | |
| | |
| |
| | (970 | ) | | (320 | ) | | (335 | ) | | – | | | 17,021 | | | 1,309 | | | 15,712 | | | 14,246 | |
| |
| | |
| | |
| | |
| | |
| | |
| | |
| | |
| |
| US Alt-A residential mortgage-related assets | | | | | | | | | | | | | | | | | | | | | | | |
| Direct lending | – | | | – | | | – | | | – | | | 341 | | | – | | | 341 | | | 342 | |
| MBSs1 | (128 | ) | | (36 | ) | | (802 | ) | | – | | | 19,175 | | | 205 | | | 18,970 | | | 17,708 | |
| – high grade2 | (122 | ) | | (6 | ) | | (802 | ) | | – | | | 19,099 | | | 205 | | | 18,894 | | | 17,640 | |
| – rated C to A | (6 | ) | | (30 | ) | | – | | | – | | | 64 | | | – | | | 64 | | | 56 | |
| – not publicly rated | – | | | – | | | – | | | – | | | 12 | | | – | | | 12 | | | 12 | |
| |
| | |
| | |
| | |
| | |
| | |
| | |
| | |
| |
| | (128 | ) | | (36 | ) | | (802 | ) | | – | | | 19,516 | | | 205 | | | 19,311 | | | 18,050 | |
| |
| | |
| | |
| | |
| | |
| | |
| | |
| | |
| |
| US government agency mortgage-related assets | | | | | | | | | | | | | | | | | | | | | | | |
| MBSs1 | | | | | | | | | | | | | | | | | | | | | | | |
| – high grade2 | 2 | | | 3 | | | 49 | | | – | | | 5,996 | | | – | | | 5,996 | | | 5,995 | |
| |
| | |
| | |
| | |
| | |
| | |
| | |
| | |
| |
| Balance carried forward | (1,096 | ) | | (353 | ) | | (1,088 | ) | | – | | | 42,533 | | | 1,514 | | | 41,019 | | | 38,291 | |
154
Back to Contents
| | 2007 | | At 31 December 2007 | |
| |
|
|
|
|
|
|
|
| |
|
|
|
|
|
|
| |
| | | | | | | | Fair value | | | | | | | | | | | | | | | | |
| | Unrealised | | | Realised | | | movements | | | | | | | | | CDS | | | Net | | | | |
| | gains and | | | gains and | | | through | | | Impair- | | | Gross | | | gross | | | principal | | | Carrying | |
| | (losses) | 3 | | (losses) | 4 | | equity | 5 | | ment | 6 | | principal | 7 | | protection | 8 | | exposure | 9 | | amount | 10 |
| | US$m | | | US$m | | | US$m | | | US$m | | | US$m | | | US$m | | | US$m | | | US$m | |
| | | | | | | | | | | | | | | | | | | | | | | | |
| Balance brought forward | (1,096 | ) | | (353 | ) | | (1,088 | ) | | – | | | 42,533 | | | 1,514 | | | 41,019 | | | 38,291 | |
| US government-sponsoredenterprises mortgage-related assets | | | | | | | | | | | | | | | | | | | | | | | |
| MBSs1 | | | | | | | | | | | | | | | | | | | | | | | |
| – high grade2 | 12 | | | (39 | ) | | 3 | | | – | | | 16,125 | | | – | | | 16,125 | | | 15,904 | |
| Other US residentialmortgage-related assets | | | | | | | | | | | | | | | | | | | | | | | |
| Direct lending | (10 | ) | | (29 | ) | | – | | | – | | | 424 | | | – | | | 424 | | | 416 | |
| MBSs1 | (34 | ) | | – | | | (1 | ) | | – | | | 1,587 | | | 821 | | | 766 | | | 756 | |
| – high grade2 | (30 | ) | | – | | | (1 | ) | | – | | | 1,565 | | | 799 | | | 766 | | | 756 | |
| – rated C to A | (4 | ) | | – | | | – | | | – | | | 22 | | | 22 | | | – | | | – | |
| |
| | |
| | |
| | |
| | |
| | |
| | |
| | |
| |
| | (44 | ) | | (29 | ) | | (1 | ) | | – | | | 2,011 | | | 821 | | | 1,190 | | | 1,172 | |
| |
| | |
| | |
| | |
| | |
| | |
| | |
| | |
| |
| Commercial propertymortgage-related assets | | | | | | | | | | | | | | | | | | | | | | | |
| MBS and MBS CDOs1 | (30 | ) | | – | | | (141 | ) | | – | | | 5,981 | | | 685 | | | 5,296 | | | 5,196 | |
| – high grade2 | (30 | ) | | – | | | (141 | ) | | – | | | 5,760 | | | 685 | | | 5,075 | | | 4,983 | |
| – not publicly rated | – | | | – | | | – | | | – | | | 221 | | | – | | | 221 | | | 213 | |
Leveraged finance-related assets ABSs and ABS CDOs1 | | | | | | | | | | | | | | | | | | | | | | | |
| – high grade2 | (6 | ) | | – | | | (89 | ) | | – | | | 4,930 | | | 322 | | | 4,608 | | | 4,432 | |
| Student loan-related assets | | | | | | | | | | | | | | | | | | | | | | | |
| ABSs and ABS CDOs1 | 5 | | | – | | | (338 | ) | | – | | | 7,352 | | | – | | | 7,352 | | | 7,196 | |
| – high grade2 | 7 | | | – | | | (338 | ) | | – | | | 7,312 | | | – | | | 7,312 | | | 7,159 | |
| – rated C to A | (2 | ) | | – | | | – | | | – | | | 40 | | | – | | | 40 | | | 37 | |
| Other assets | | | | | | | | | | | | | | | | | | | | | | | |
| ABS and ABS CDOs1 | (100 | ) | | (3 | ) | | (134 | ) | | – | | | 8,943 | | | 2,735 | | | 6,208 | | | 6,204 | |
| – high grade2 | (99 | ) | | (3 | ) | | (134 | ) | | – | | | 8,233 | | | 2,707 | | | 5,526 | | | 5,557 | |
| – rated C to A | (1 | ) | | – | | | – | | | – | | | 595 | | | 28 | | | 567 | | | 550 | |
| – not publicly rated | – | | | – | | | – | | | – | | | 115 | | | – | | | 115 | | | 97 | |
| |
| | |
| | |
| | |
| | |
| | |
| | |
| | |
| |
| Total | (1,259 | ) | | (424 | ) | | (1,788 | ) | | – | | | 87,875 | | | 6,077 | | | 81,798 | | | 78,395 | |
| |
| | |
| | |
| | |
| | |
| | |
| | |
| | |
| |
| For footnotes, see page 162. |
HSBC’s consolidated holdings of UK ABSs, and direct lending held at fair value through profit or loss
| | 2008 | | | At 31 December 2008 | |
| |
|
|
|
|
|
|
| | |
|
|
|
|
|
|
| |
| | | | | | | | Fair value | | | | | | | | | | | | | | | | |
| | Unrealised | | | Realised | | | movements | | | | | | | | | CDS | | | Net | | | | |
| | gains and | | | gains and | | | through | | | Impair- | | | Gross | | | gross | | | principal | | | Carrying | |
| | (losses) | 3 | | (losses) | 4 | | equity | 5 | | ment | 6 | | principal | 7 | | protection | 8 | | exposure | 9 | | amount | 10 |
| | US$m | | | US$m | | | US$m | | | US$m | | | US$m | | | US$m | | | US$m | | | US$m | |
| UK non-conforming residentialmortgage-related assets | | | | | | | | | | | | | | | | | | | | | | | |
| MBSs1 | (3 | ) | | – | | | (294 | ) | | – | | | 1,425 | | | – | | | 1,425 | | | 1,100 | |
| – high grade2 | (1 | ) | | – | | | (268 | ) | | – | | | 1,349 | | | – | | | 1,349 | | | 1,051 | |
| – rated C to A | (2 | ) | | – | | | (26 | ) | | – | | | 76 | | | – | | | 76 | | | 49 | |
| Other UK residentialmortgage-related assets | | | | | | | | | | | | | | | | | | | | | | | |
| MBSs1 | (47 | ) | | (8 | ) | | (709 | ) | | – | | | 5,781 | | | – | | | 5,781 | | | 4,568 | |
| – high grade2 | (27 | ) | | (10 | ) | | (694 | ) | | – | | | 5,289 | | | – | | | 5,289 | | | 4,185 | |
| – rated C to A | (20 | ) | | 2 | | | (15 | ) | | – | | | 488 | | | – | | | 488 | | | 382 | |
| – not publicly rated | – | | | – | | | – | | | – | | | 4 | | | – | | | 4 | | | 1 | |
| |
| | |
| | |
| | |
| | |
| | |
| | |
| | |
| |
| Balance carried forward | (50 | ) | | (8 | ) | | (1,003 | ) | | – | | | 7,206 | | | – | | | 7,206 | | | 5,668 | |
155
Back to Contents
| H S B C H O L D I N G S P L C |
| |
| Report of the Directors: Impact of Market Turmoil(continued) |
| | |
| | |
| Nature and extent of exposures |
HSBC’s consolidated holdings of UK ABSs, and direct lending held at fair value through profit or loss(continued)
| | 2008 | | | At 31 December 2008 | |
| |
| | |
| |
| | | | | | | | Fair value | | | | | | | | | | | | | | | | |
| | Unrealised | | | Realised | | | movements | | | | | | | | | CDS | | | Net | | | | |
| | gains and | | | gains and | | | through | | | Impair- | | | Gross | | | gross | | | principal | | | Carrying | |
| | (losses) | 3 | | (losses) | 4 | | equity | 5 | | ment | 6 | | principal | 7 | | protection | 8 | | exposure | 9 | | amount | 10 |
| | US$m | | | US$m | | | US$m | | | US$m | | | US$m | | | US$m | | | US$m | | | US$m | |
| | | | | | | | | | | | | | | | | | | | | | | | |
| Balance brought forward | (50 | ) | | (8 | ) | | (1,003 | ) | | – | | | 7,206 | | | – | | | 7,206 | | | 5,668 | |
Commercial property mortgage-related assets
MBS and MBS CDOs1 | (112 | ) | | (6 | ) | | (571 | ) | | – | | | 3,836 | | | – | | | 3,836 | | | 3,017 | |
| – high grade2 | (83 | ) | | (6 | ) | | (560 | ) | | – | | | 3,665 | | | – | | | 3,665 | | | 2,910 | |
| – rated C to A | (29 | ) | | – | | | (11 | ) | | – | | | 156 | | | – | | | 156 | | | 101 | |
| – not publicly rated | – | | | – | | | – | | | – | | | 15 | | | – | | | 15 | | | 6 | |
Leveraged finance-related assets
ABSs and ABS CDOs1 | | | | | | | | | | | | | | | | | | | | | | | |
– high grade2 | – | | | – | | | (77 | ) | | – | | | 761 | | | 384 | | | 377 | | | 293 | |
| | | | | | | | | | | | | | | | | | | | | | | | |
Student loan-related assets
ABSs and ABS CDOs1 | | | | | | | | | | | | | | | | | | | | | | | |
| – high grade2 | – | | | – | | | – | | | – | | | 98 | | | – | | | 98 | | | 55 | |
| Other assets | | | | | | | | | | | | | | | | | | | | | | | |
| ABS and ABS CDOs1 | (10 | ) | | (4 | ) | | (413 | ) | | – | | | 7,623 | | | 5,102 | | | 2,521 | | | 1,997 | |
| – high grade2 | (8 | ) | | (4 | ) | | (52 | ) | | – | | | 1,751 | | | – | | | 1,751 | | | 1,607 | |
| – rated C to A | (2 | ) | | – | | | (361 | ) | | – | | | 770 | | | – | | | 770 | | | 390 | |
| – not publicly rated | – | | | – | | | – | | | – | | | 5,102 | | | 5,102 | | | – | | | – | |
| |
|
| |
|
| |
|
| |
|
| |
|
| |
|
| |
|
| |
|
|
| Total | (172 | ) | | (18 | ) | | (2,064 | ) | | – | | | 19,524 | | | 5,486 | | | 14,038 | | | 11,030 | |
| |
|
| |
|
| |
|
| |
| | |
| | |
| | |
| | |
| |
| | | | | | | | | | | | | | | | | | | | | | | | |
| | 2007 | | | At 31 December 2007 | |
| |
| | |
| |
| | | | | | | | Fair value | | | | | | | | | | | | | | | | |
| | Unrealised | | | Realised | | | movements | | | | | | | | | CDS | | | Net | | | | |
| | gains and | | | gains and | | | through | | | | | | Gross | | | gross | | | principal | | | Carrying | |
| | (losses) | 3 | | (losses) | 4 | | equity | 5 | | Impairment | 6 | | principal | 7 | | protection | 8 | | exposure | 9 | | amount | 10 |
| | US$m | | | US$m | | | US$m | | | US$m | | | US$m | | | US$m | | | US$m | | | US$m | |
| | | | | | | | | | | | | | | | | | | | | | | | |
UK non-conforming residential mortgage-related assets
MBSs1 | (5 | ) | | – | | | (15 | ) | | – | | | 3,355 | | | – | | | 3,355 | | | 3,211 | |
| – high grade2 | (3 | ) | | – | | | (15 | ) | | – | | | 3,321 | | | – | | | 3,321 | | | 3,183 | |
| – rated C to A | (2 | ) | | – | | | – | | | – | | | 28 | | | – | | | 28 | | | 24 | |
| – not publicly rated | – | | | – | | | – | | | – | | | 6 | | | – | | | 6 | | | 4 | |
Other UK residential mortgage-related assets
MBSs1 | (53 | ) | | (14 | ) | | (121 | ) | | – | | | 5,943 | | | – | | | 5,943 | | | 5,640 | |
| – high grade2 | (22 | ) | | (14 | ) | | (118 | ) | | – | | | 5,411 | | | – | | | 5,411 | | | 5,156 | |
| – rated C to A | (31 | ) | | – | | | (3 | ) | | – | | | 520 | | | – | | | 520 | | | 472 | |
| – not publicly rated | – | | | – | | | – | | | – | | | 12 | | | – | | | 12 | | | 12 | |
Commercial property mortgage-related assets
MBS and MBS CDOs1 | (64 | ) | | (2 | ) | | (40 | ) | | – | | | 5,330 | | | – | | | 5,330 | | | 4,902 | |
| – high grade2 | (54 | ) | | (2 | ) | | (39 | ) | | – | | | 4,437 | | | – | | | 4,437 | | | 4,095 | |
| – rated C to A | (10 | ) | | – | | | (1 | ) | | – | | | 173 | | | – | | | 173 | | | 113 | |
| – not publicly rated | – | | | – | | | – | | | – | | | 720 | | | – | | | 720 | | | 694 | |
Leveraged finance-related assets
ABSs and ABS CDOs1 | – | | | – | | | (8 | ) | | – | | | 675 | | | 330 | | | 345 | | | 336 | |
| – high grade2 | – | | | – | | | (8 | ) | | – | | | 366 | | | 21 | | | 345 | | | 336 | |
| – not publicly rated | – | | | – | | | – | | | – | | | 309 | | | 309 | | | – | | | – | |
| Other assets | | | | | | | | | | | | | | | | | | | | | | | |
| ABS and ABS CDOs1 | (13 | ) | | – | | | (38 | ) | | – | | | 9,385 | | | 6,802 | | | 2,583 | | | 2,511 | |
| – high grade2 | (8 | ) | | – | | | (38 | ) | | – | | | 2,225 | | | – | | | 2,225 | | | 2,170 | |
| – rated C to A | (5 | ) | | – | | | – | | | – | | | 26 | | | – | | | 26 | | | 29 | |
| – not publicly rated | – | | | – | | | – | | | – | | | 7,134 | | | 6,802 | | | 332 | | | 312 | |
| |
|
| |
|
| |
|
| |
| | |
| | |
| | |
| | |
| |
| Total | (135 | ) | | (16 | ) | | (222 | ) | | – | | | 24,688 | | | 7,132 | | | 17,556 | | | 16,600 | |
| |
|
| |
|
| |
|
| |
| | |
| | |
| | |
| | |
| |
For footnotes, see page 162.
156
Back to Contents
HSBC’s consolidated holdings of ABSs, and direct lending held at fair value through profit or loss, other than those supported by US and UK-originated assets
| | 2008 | | | At 31 December 2008 | |
| |
| | |
| |
| | | | | | | | Fair value | | | | | | | | | | | | | | | | |
| | Unrealised | | | Realised | | | movements | | | | | | | | | CDS | | | Net | | | | |
| | gains and | | | gains and | | | through | | | | | | Gross | | | gross | | | principal | | | Carrying | |
| | (losses) | 3 | | (losses) | 4 | | equity | 5 | | Impairment | 6 | | principal | 7 | | protection | 8 | | exposure | 9 | | amount | 10 |
| | US$m | | | US$m | | | US$m | | | US$m | | | US$m | | | US$m | | | US$m | | | US$m | |
| Non-US and non-UK non-sub-prime residential mortgage-related assets | | | | | | | | | | | | | | | | | | | | | | | |
| MBSs1 | – | | | – | | | – | | | (8 | ) | | 47 | | | – | | | 47 | | | 39 | |
| – high grade2 | – | | | – | | | – | | | (8 | ) | | 46 | | | – | | | 46 | | | 38 | |
| – rated C to A | – | | | – | | | – | | | – | | | 1 | | | – | | | 1 | | | 1 | |
| MBS CDOs1 | (15 | ) | | – | | | (3 | ) | | – | | | 53 | | | – | | | 53 | | | 26 | |
| – high grade2 | (14 | ) | | – | | | (3 | ) | | – | | | 40 | | | – | | | 40 | | | 23 | |
| – rated C to A | (1 | ) | | – | | | – | | | – | | | 11 | | | – | | | 11 | | | 1 | |
| – not publicly rated | – | | | – | | | – | | | – | | | 2 | | | – | | | 2 | | | 2 | |
Other non-US and non-UK residential mortgage-related assets | | | | | | | | | | | | | | | | | | | | | | | |
| MBSs1 | (66 | ) | | (27 | ) | | (62 | ) | | – | | | 2,411 | | | – | | | 2,411 | | | 2,051 | |
| – high grade2 | (59 | ) | | (28 | ) | | (62 | ) | | – | | | 2,184 | | | – | | | 2,184 | | | 1,878 | |
| – rated C to A | (6 | ) | | – | | | – | | | – | | | 149 | | | – | | | 149 | | | 127 | |
| – not publicly rated | (1 | ) | | 1 | | | – | | | – | | | 78 | | | – | | | 78 | | | 46 | |
Commercial property mortgage-related assets
MBS and MBS CDOs1 | (123 | ) | | (2 | ) | | (463 | ) | | – | | | 3,051 | | | – | | | 3,051 | | | 2,311 | |
| – high grade2 | (91 | ) | | (14 | ) | | (453 | ) | | – | | | 2,928 | | | – | | | 2,928 | | | 2,234 | |
| – rated C to A | (32 | ) | | 12 | | | (7 | ) | | – | | | 112 | | | – | | | 112 | | | 69 | |
| – not publicly rated | – | | | – | | | (3 | ) | | – | | | 11 | | | – | | | 11 | | | 8 | |
Leveraged finance-related assets
ABSs and ABS CDOs1 | | | | | | | | | | | | | | | | | | | | | | | |
| – high grade2 | (4 | ) | | 1 | | | (229 | ) | | – | | | 1,419 | | | 1 | | | 1,418 | | | 1,098 | |
Other assets
ABS and ABS CDOs1 | (209 | ) | | (13 | ) | | (241 | ) | | (51 | ) | | 5,604 | | | 1,853 | | | 3,751 | | | 3,188 | |
| – high grade2 | (168 | ) | | (6 | ) | | (92 | ) | | – | | | 4,379 | | | 1,679 | | | 2,700 | | | 2,199 | |
| – rated C to A | (41 | ) | | (7 | ) | | (149 | ) | | – | | | 906 | | | 174 | | | 732 | | | 707 | |
| – not publicly rated | – | | | – | | | – | | | (51 | ) | | 319 | | | – | | | 319 | | | 282 | |
| |
|
| |
|
| |
|
| |
|
| |
| | |
| | |
| | |
| |
| Total | (417 | ) | | (41 | ) | | (998 | ) | | (59 | ) | | 12,585 | | | 1,854 | | | 10,731 | | | 8,713 | |
| |
|
| |
|
| |
|
| |
|
| |
| | |
| | |
| | |
| |
| | | | | | | | | | | | | | | | | | | | | | | | |
| | 2007 | | | At 31 December 2007 | |
| |
| | |
| |
| | | | | | | | Fair value | | | | | | | | | | | | | | | | |
| | Unrealised | | | Realised | | | movements | | | | | | | | | CDS | | | Net | | | | |
| | gains and | | | gains and | | | through | | | | | | Gross | | | gross | | | principal | | | Carrying | |
| | (losses) | 3 | | (losses) | 4 | | equity | 5 | | Impairment | 6 | | principal | 7 | | protection | 8 | | exposure | 9 | | amount | 10 |
| | US$m | | | US$m | | | US$m | | | US$m | | | US$m | | | US$m | | | US$m | | | US$m | |
| Non-US and non-UK non- sub-prime residential mortgage-related assets | | | | | | | | | | | | | | | | | | | | | | | |
| MBSs1 | – | | | – | | | – | | | – | | | 624 | | | – | | | 624 | | | 385 | |
| – high grade2 | – | | | – | | | – | | | – | | | 447 | | | – | | | 447 | | | 279 | |
| – rated C to A | – | | | – | | | – | | | – | | | 104 | | | – | | | 104 | | | 38 | |
| – not publicly rated | – | | | – | | | – | | | – | | | 73 | | | – | | | 73 | | | 68 | |
Other non-US and non-UK residential mortgage-related assets | | | | | | | | | | | | | | | | | | | | | | | |
| MBSs1 | (20 | ) | | (10 | ) | | (6 | ) | | – | | | 4,001 | | | 814 | | | 3,187 | | | 3,055 | |
| – high grade2 | (16 | ) | | (8 | ) | | (6 | ) | | – | | | 3,703 | | | 710 | | | 2,993 | | | 2,869 | |
| – rated C to A | (6 | ) | | – | | | – | | | – | | | 130 | | | 90 | | | 40 | | | 36 | |
| – not publicly rated | 2 | | | (2 | ) | | – | | | – | | | 168 | | | 14 | | | 154 | | | 150 | |
| |
|
| |
|
| |
|
| |
| | |
| | |
| | |
| | |
| |
| Balance carried forward | (20 | ) | | (10 | ) | | (6 | ) | | – | | | 4,625 | | | 814 | | | 3,811 | | | 3,440 | |
157
Back to Contents
| H S B C H O L D I N G S P L C |
| |
| Report of the Directors: Impact of Market Turmoil(continued) |
| | |
| | |
| Nature and extent of exposures > Monolines |
HSBC’s consolidated holdings of ABSs, and direct lending held at fair value through profit or loss, other than those supported by US and UK-originated assets(continued)
| | 2007 | | | At 31 December 2007 | |
| |
| | |
| |
| | | | | | | | Fair value | | | | | | | | | | | | | | | | |
| | Unrealised | | | Realised | | | movements | | | | | | | | | CDS | | | Net | | | | |
| | gains and | | | gains and | | | through | | | Impair- | | | Gross | | | gross | | | principal | | | Carrying | |
| | (losses) | 3 | | (losses) | 4 | | equity | 5 | | ment | 6 | | principal | 7 | | protection | 8 | | exposure | 9 | | amount | 10 |
| | US$m | | | US$m | | | US$m | | | US$m | | | US$m | | | US$m | | | US$m | | | US$m | |
| | | | | | | | | | | | | | | | | | | | | | | | |
| Balance brought forward | (20 | ) | | (10 | ) | | (6 | ) | | – | | | 4,625 | | | 814 | | | 3,811 | | | 3,440 | |
| Commercial property mortgage-related assets | | | | | | | | | | | | | | | | | | | | | | | |
| MBS and MBS CDOs1 | (9 | ) | | – | | | (20 | ) | | – | | | 3,576 | | | 238 | | | 3,338 | | | 3,051 | |
| – high grade2 | (6 | ) | | – | | | (20 | ) | | – | | | 3,212 | | | 102 | | | 3,110 | | | 2,827 | |
| – rated C to A | (3 | ) | | – | | | – | | | – | | | 185 | | | 136 | | | 49 | | | 49 | |
| – not publicly rated | – | | | – | | | – | | | – | | | 179 | | | – | | | 179 | | | 175 | |
| Leveraged finance-related assets | | | | | | | | | | | | | | | | | | | | | | | |
| ABSs and ABS CDOs1 | (3 | ) | | – | | | (20 | ) | | – | | | 1,356 | | | 3 | | | 1,353 | | | 1,315 | |
| – high grade2 | (3 | ) | | – | | | (20 | ) | | – | | | 1,281 | | | 2 | | | 1,279 | | | 1,244 | |
| – not publicly rated | – | | | – | | | – | | | – | | | 75 | | | 1 | | | 74 | | | 71 | |
| Other assets | | | | | | | | | | | | | | | | | | | | | | | |
| Direct lending | – | | | – | | | – | | | – | | | 3 | | | – | | | 3 | | | 3 | |
| ABS and ABS CDOs1 | (2 | ) | | 6 | | | (18 | ) | | (36 | ) | | 7,929 | | | 1,702 | | | 6,227 | | | 6,113 | |
| – high grade2 | (5 | ) | | (2 | ) | | (18 | ) | | (36 | ) | | 7,310 | | | 1,443 | | | 5,867 | | | 5,550 | |
| – rated C to A | – | | | 5 | | | – | | | – | | | 547 | | | 259 | | | 288 | | | 522 | |
| – not publicly rated | 3 | | | 3 | | | – | | | – | | | 72 | | | – | | | 72 | | | 41 | |
| |
|
| |
|
| |
|
| |
|
| |
| | |
| | |
| | |
| |
| | (2 | ) | | 6 | | | (18 | ) | | (36 | ) | | 7,932 | | | 1,702 | | | 6,230 | | | 6,116 | |
| |
|
| |
|
| |
|
| |
|
| |
| | |
| | |
| | |
| |
| Total | (34 | ) | | (4 | ) | | (64 | ) | | (36 | ) | | 17,489 | | | 2,757 | | | 14,732 | | | 13,922 | |
| |
|
| |
|
| |
|
| |
|
| |
| | |
| | |
| | |
| |
For footnotes, see page 162.
| | | |
| The following table shows the vintages of the collateral assets supporting HSBC’s holdings of US sub-prime and Alt-A MBSs. Market prices for these instruments generally incorporate higher discounts | | for later vintages. The majority of HSBC’s holdings of US sub-prime MBSs are originated pre-2007; holdings of US Alt-A MBSs are more evenly distributed between pre- and post-2007 vintages. |
| | | |
Vintages of US sub-prime and Alt-A mortgage-backed securities
| | Gross principal7of US sub-prime | | Gross principal7of US Alt-A | |
| | mortgage-backed securities | | mortgage-backed securities | |
| | at 31 December | | at 31 December | |
| |
| |
| |
| | 2008 | | 2007 | | 2008 | | 2007 | |
| | US$m | | US$m | | US$m | | US$m | |
| Mortgage vintage | | | | | | | | |
| Pre-2006 | 2,012 | | 3,170 | | 2,695 | | 2,870 | |
| 2006 | 4,287 | | 5,186 | | 7,712 | | 7,777 | |
| 2007 | 1,588 | | 2,377 | | 6,453 | | 8,528 | |
| |
| |
| |
| |
| |
| | 7,887 | | 10,733 | | 16,860 | | 19,175 | |
| |
| |
| |
| |
| |
For footnotes, see page 162.
Transactions with monoline insurers
HSBC’s exposure to derivative transactions entered into directly with monoline insurers
HSBC’s principal exposure to monolines is through a number of over-the-counter (‘OTC’) derivative transactions, mainly credit default swaps (‘CDS’s). HSBC entered into these CDSs primarily to purchase credit protection against securities held within the trading portfolio.
During 2008, the notional value of contracts with monolines decreased as certain transactions were commuted and others matured. Nevertheless, HSBC’s overall credit exposure to monolines increased as the fair value of the underlying securities declined, causing the value of the CDS protection purchased to increase. The table below sets out the fair value, essentially the replacement cost, of the derivative transactions at 31 December 2008, and hence the amount at risk if the CDS
158
Back to Contents
protection purchased were to be wholly ineffective because, for example, the monoline insurer was subdivided between those monolines that were rated by S&P at ‘BBB or above’ at 31 December 2008, and those that were ‘below BBB’ (‘BBB’ is the S&P cut-off for an investment grade classification). As certain monolines were downgraded during 2008, exposure to monolines rated ‘below BBB’ at 31 December 2008 increased from the position as at 31 December 2007. The ‘Credit risk adjustment’
unable to meet its obligations. In order to illustrate that risk, the value of protection purchased is shown column indicates the valuation adjustment (the provision) taken against the net exposures, and reflects the assessed loss of value on purchased protection arising from the deterioration in creditworthiness of the monolines. These valuation adjustments, which reflect a measure of the irrecoverability of the protection purchased, have been charged to the income statement.
HSBC’s exposure to derivative transactions entered into directly with monoline insurers
| | | | Net exposure | | | | Net exposure | |
| | Notional | | before credit | | Credit risk | | after credit | |
| | amount | | risk adjustment | 12 | adjustment | 13 | risk adjustment | |
| | US$m | | US$m | | US$m | | US$m | |
| At 31 December 2008 | | | | | | | | |
| Derivative transactions with monoline counterparties | | | | | | | | |
| Monoline – BBB or above | 9,627 | | 2,829 | | (740 | ) | 2,089 | |
| Monoline – below BBB | 2,731 | | 1,104 | | (752 | ) | 352 | |
| |
| |
| |
| |
| |
| | 12,358 | | 3,933 | | (1,492 | ) | 2,441 | |
| |
| |
| |
| |
| |
| At 31 December 2007 | | | | | | | | |
| Derivative transactions with monoline counterparties | | | | | | | | |
| Monoline – BBB or above | 14,314 | | 1,342 | | (133 | ) | 1,209 | |
| Monoline – below BBB | 1,120 | | 214 | | (214 | ) | – | |
| |
| |
| |
| |
| |
| | 15,434 | | 1,556 | | (347 | ) | 1,209 | |
| |
| |
| |
| |
| |
| For footnotes, see page 162. | | | | | | | | |
The above table can be analysed as follows. HSBC has derivative transactions referenced to underlying securities with a nominal value of US$12.4 billion, whose value at 31 December 2008 indicated a potential claim against the protection purchased from the monolines of some US$3.9 billion. On the basis of a credit assessment of the standing of the monolines, a provision of US$1.5 billion has been taken, leaving US$2.4 billion exposed, of which US$2.1 billion is recoverable from monolines rated investment grade at 31 December 2008. The provisions taken imply in aggregate that 74 cents in the dollar will be recoverable from investment grade monolines and 32 cents in the dollar from non-investment grade monolines.
HSBC’s exposure to direct lending and irrevocable commitments to lend to monoline insurers
HSBC has outstanding liquidity facilities totalling US$47 million to monoline insurers, of which US$2 million was drawn at 31 December2008 (2007: US$158 million, none drawn).
HSBC’s exposure to debt securities which benefit from guarantees provided by monoline insurers
Within both the trading and available-for-sale portfolios, HSBC holds bonds that are ‘wrapped’ with a credit enhancement from a monoline insurer. As the bonds are traded explicitly with the benefit of this enhancement, any deterioration in the credit profile of the monoline insurer is reflected in market prices and, therefore, in the carrying amount of these securities on HSBC’s balance sheet at 31 December2008. For wrapped bonds held in the trading portfolio, the mark-to-market movement has been reflected through the income statement. For wrapped bonds held in the available-for-sale portfolio, the mark-to-market movement is reflected in equity unless there is objective evidence of impairment, in which case the impairment loss is reflected in the income statement. No wrapped bonds were included in the reclassification of financial assets described on page 145.
159
Back to Contents
| H S B C H O L D I N G S P L C |
| |
| Report of the Directors: Impact of Market Turmoil(continued) |
| | |
| | |
| Nature and extent of exposures > Monolines / Leveraged finance |
HSBC’s exposure to Credit Derivative Product Companies
CDPCs are independent companies that specialise in selling credit default protection on corporate exposures. As corporate credit spreads widened during the second half of 2008, increasing the potential value of claims against the CDPCs, the creditworthiness of CDPCs became a focus. At 31 December 2008, HSBC had purchased credit protection from CDPCs with a notional value of US$6.4 billion (2007: US$5.7 billion) which had a fair value (essentially, replacement cost) of US$1.2 billion (2007: US$218 million), against which a credit risk adjustment (a provision) of US$228 million (2007: nil) was held. All of the fair value exposures at 31 December 2008 and 2007 represented exposure to CDPCs with investment grade ratings.
Leveraged finance transactions
Leveraged finance transactions include sub-investment grade acquisition or event-driven financing. During the second half of 2008, HSBC reclassified US$6.5 billion of leveraged finance loans from the held-for-trading category to loans and receivables as detailed on page 146 as its intention now is to hold these assets for the foreseeable future or until maturity. Impairment on these reclassified assets is now recognised on an incurred loss basis. The following tables show HSBC’s gross commitments and exposure to leveraged finance transactions arising from primary transactions and the movement in that leveraged finance exposure in the year. HSBC’s additional exposure to leveraged finance loans through holdings of ABSs from its trading and investment activities is shown in the tables on pages 151 and 152.
HSBC’s gross commitments to leveraged finance transactions by geographical segment
| | Funded | | Unfunded | | Total | |
| | commitments | | commitments | | commitments | |
| | US$m | | US$m | | US$m | |
| At 31 December 2008 | | | | | | |
| Europe | 3,818 | | 543 | | 4,361 | |
| Rest of Asia-Pacific | 25 | | 12 | | 37 | |
| North America | 1,987 | | 268 | | 2,255 | |
| |
| |
| |
| |
| | 5,830 | | 823 | | 6,653 | |
| |
| |
| |
| |
| | Funded | | Unfunded | | Total | |
| | commitments | | commitments | | commitments | |
| | US$m | | US$m | | US$m | |
| At 31 December 2007 | | | | | | |
| Europe | 4,004 | | 1,822 | | 5,826 | |
| Hong Kong | – | | 160 | | 160 | |
| Rest of Asia-Pacific | 45 | | 182 | | 227 | |
| North America | 1,991 | | 733 | | 2,724 | |
| |
| |
| |
| |
| | 6,040 | | 2,897 | | 8,937 | |
| |
| |
| |
| |
HSBC’s exposure to leveraged finance transactions
| | At 31 December | |
|
|
|
|
|
| |
| | Funded | | Unfunded | | Total | |
| | exposures | 14 | exposures | 15 | exposures | |
| | US$m | | US$m | | US$m | |
| 2008 | | | | | | |
| Europe | 3,554 | | 480 | | 4,034 | |
| Rest of Asia-Pacific | 25 | | 12 | | 37 | |
| North America | 1,825 | | 258 | | 2,083 | |
|
| |
| |
| |
| | 5,404 | | 750 | | 6,154 | |
|
| |
| |
| |
| Held within: | | | | | | |
| – loans and receivables | 5,401 | | 482 | | 5,883 | |
| – fair value through the profit or loss | 3 | | 268 | | 271 | |
160
Back to Contents
| | At 31 December | |
| |
|
|
|
|
| |
| | Funded | | Unfunded | | Total | |
| | exposures | 14 | exposures | 15 | exposures | |
| | US$m | | US$m | | US$m | |
| 2007 | | | | | | |
| Europe | 3,903 | | 1,813 | | 5,716 | |
| Hong Kong | – | | 160 | | 160 | |
| Rest of Asia-Pacific | 45 | | 182 | | 227 | |
| North America | 1,917 | | 722 | | 2,639 | |
| |
| |
| |
| |
| | 5,865 | | 2,877 | | 8,742 | |
| |
| |
| |
| |
| Held within: | | | | | | |
| – loans and receivables | 424 | | 546 | | 970 | |
| – fair value through the profit or loss | 5,441 | | 2,331 | | 7,772 | |
| | | | | | | |
| For footnotes, see page 162. | | | | | | |
| Movement in leveraged finance exposures | | | | | | |
| | Funded | | Unfunded | | Total | |
| | exposures | 14 | exposures | 15 | exposures | |
| | US$m | | US$m | | US$m | |
| | | | | | | |
| At 31 December 2007 | 5,865 | | 2,877 | | 8,742 | |
| Additions | 128 | | 647 | | 775 | |
| Fundings | 834 | | (834 | ) | – | |
| Sales, repayments and other movements | (1,184 | ) | (1,875 | ) | (3,059 | ) |
| Write-downs | (239 | ) | (65 | ) | (304 | ) |
| |
| |
| |
| |
| At 31 December 2008 | 5,404 | | 750 | | 6,154 | |
|
| |
| |
| |
| For footnotes, see page 162. | | | | | | |
The fall in unfunded exposures during 2008 primarily relates to the depreciation in sterling against the US dollar.
As described in the background to market turmoil on page 144, the dislocation of financial
markets developed in the second half of 2007 and continued throughout 2008. Consequently, income statement write-downs on leveraged finance transactions are presented for the three half-year periods affected to date.
| | Half-year to | |
| |
|
|
|
|
| |
| | 31 December | | 30 June | | 31 December | |
| | 2008 | | 2008 | | 2007 | |
| | US$m | | US$m | | US$m | |
| | | | | | | |
| Write-downs taken to income statement | – | | 278 | | 195 | |
| Impairment of leveraged finance loans taken to the income statement | 26 | | – | | – | |
| For footnotes, see page 162. | | | | | | |
| | | | | | | |
As a result of the reclassification of certain leveraged finance loans from held-for-trading to loans and receivables, write-downs of US$1.2 billion were not taken to the income statement for the half year to 31 December 2008.
At 31 December 2008, HSBC’s principal exposures were to companies in two sectors:
US$3.6 billion to data processing (2007: US$3.8 billion) and US$1.7 billion to communications and infrastructure (2007: US$2.7 billion). During the year, 99 per cent of the total write-downs were against exposures in these two sectors.
161
Back to Contents
| H S B C H O L D I N G S P L C |
| |
| Report of the Directors: Impact of Market Turmoil(continued) |
| | |
| | |
| Footnotes / Fair values of financial instruments / Carried at fair value |
Footnotes to ‘Nature and extent of HSBC’s exposures’
| 1 | Mortgage-backed securities (‘MBSs’), asset-backed securities (‘ABSs’) and collateralised debt obligations (‘CDOs’). |
| 2 | High grade assets rated AA or AAA. |
| 3 | Unrealised gains and losses on the net principal exposure (see footnote 9) recognised in the income statement as a result of changes in the fair value of the asset, adjusted for the cumulative amount of transfers to realised gains and losses as a result of the disposal of assets. |
| 4 | Realised gains and losses on the net principal exposure (see footnote 9) recognised in the income statement as a result of the disposal of assets. |
| 5 | Fair value gains and losses on the net principal exposure (see footnote 9) recognised in equity as a result of the changes in the fair value of available-for-sale assets, adjusted for transfers from the available-for-sale reserve to the income statement as a result of impairment, and adjusted for transfers to realised gains and losses following the disposal of assets. |
| 6 | Impairment losses recognised in the income statement in respect of the net principal exposure (see footnote 9) of available-for-sale and held-to-maturity assets. |
| 7 | The gross principal is the redemption amount on maturity or, in the case of an amortising instrument, the sum of the future redemption amounts through the residual life of the security. |
| 8 | A CDS is a credit default swap. CDS gross protection is the gross principal of the underlying instrument that is protected by CDSs. |
| 9 | Net principal exposure is the gross principal amount of assets that are not protected by CDSs. It includes assets that benefit from monoline protection, except where this protection is purchased with a CDS. |
| 10 | Carrying amount of the net principal exposure. |
| 11 | During 2008, the Group reclassified holdings of HELoCs to US sub-prime residential mortgage-related assets from Other US residential mortgage-related assets, and restated the amounts of certain direct lending exposures presented in the ABS tables to show the gross carrying amount of assets on the consolidated balance sheet rather than the net exposure, consistent with other direct lending exposures. 2007 amounts have been restated accordingly, resulting in an increase of US$6.3 billion in the reported balance of US sub-prime mortgage-related assets as at 31 December 2007. |
| 12 | Net exposure after legal netting and any other relevant credit mitigation prior to deduction of the credit risk adjustment. |
| 13 | Cumulative fair value adjustment recorded against OTC derivative counterparty exposures to reflect the creditworthiness of the counterparty. |
| 14 | Funded exposure represents the loan amount advanced to the customer, less any fair value write-downs, net of fees held on deposit. |
| 15 | Unfunded exposures represent the contractually committed loan facility amount not yet drawn down by the customer, less any fair value write-downs, net of fees held on deposit. |
| Fair values of financial instruments |
|
| (Audited) |
The classification of financial instruments is determined in accordance with the accounting policies set out in Note 2 on the Financial Statements, and the use of assumptions and estimation in respect of valuation of financial instruments as described on page 63. The following is a description of HSBC’s methods of determining fair value and its related control framework, and a quantification of its exposure to financial instruments measured at fair value.
Fair value is the amount for which an asset could be exchanged, or a liability settled, between knowledgeable, willing parties in an arm’s length transaction.
Financial instruments measured at fair value on an ongoing basis include trading assets and liabilities, instruments designated at fair value, derivatives and financial investments classified as available for sale (including treasury and other eligible bills, debt securities, and equity securities).
Fair values of financial instruments carried at fair value
Control framework
Fair values are subject to a control framework designed to ensure that they are either determined or validated by a function independent of the risk-taker.
To this end, ultimate responsibility for the determination of fair values lies with Finance, which reports functionally to the Group Finance Director. Finance establishes the accounting policies and procedures governing valuation, and is responsible for ensuring that they comply with all relevant accounting standards.
For all financial instruments where fair values are determined by reference to externally quoted prices or observable pricing inputs to models, independent price determination or validation is utilised. In inactive markets, direct observation of a traded price may not be possible. In these circumstances, HSBC will source alternative market information to validate the financial instrument’s fair value, with greater weight given to information that is considered to be more relevant and reliable. The factors that are considered in this regard are,inter alia:
| • | the extent to which prices may be expected torepresent genuine traded or tradeable prices; |
| | |
| • | the degree of similarity between financialinstruments; |
| | |
| • | the degree of consistency between differentsources; |
| | |
| • | the process followed by the pricing provider toderive the data; |
162
Back to Contents
| • | the elapsed time between the date to which themarket data relates and the balance sheet date;and |
| | |
| • | the manner in which the data was sourced. |
Models provide a logical framework for the capture and processing of necessary valuation inputs. For fair values determined using a valuation model, the control framework may include, as applicable, independent development or validation of (i) the logic within valuation models; (ii) the inputs to those models; (iii) any adjustments required outside the valuation models; and, (iv) where possible, model outputs. Valuation models are subject to a process of due diligence and calibration before becoming operational and are calibrated against external market data on an ongoing basis.
The results of the independent validation process are reported to, and considered by, Valuation Committees. Valuation Committees are composed of valuation experts from several independent support functions (Product Control, Market Risk Management, Derivative Model Review Group and Finance) in addition to senior management. The members of each Valuation Committee consider the appropriateness and adequacy of the fair value adjustments and the effectiveness of valuation models. If necessary, they may require changes to model calibration or calibration procedures. The Valuation Committees are overseen by the Valuation Committee Review Group, which consists of Heads of Global Banking and Markets’ Finance and Risk Functions. All subjective valuation items with a potential impact in excess of US$5 million are reported to the Valuation Committee Review Group.
Determination of fair value
Fair values are determined according to the following hierarchy:
| • | Quoted market price:financial instruments withquoted prices for identical instruments in activemarkets. |
| | |
| • | Valuation technique using observable inputs:financial instruments with quoted prices forsimilar instruments in active markets or quotedprices for identical or similar instruments ininactive markets and financial instrumentsvalued using models where all significantinputs are observable. |
| | |
| • | Valuation technique with significantunobservable inputs:financial instrumentsvalued using valuation techniques where one ormore significant inputs are unobservable. |
The best evidence of fair value is a quoted price in an actively traded market. In the event that the market for a financial instrument is not active, a valuation technique is used.
The judgement as to whether a market is active may include, but is not restricted to, the consideration of factors such as the magnitude and frequency of trading activity, the availability of prices and the size of bid/offer spreads. In inactive markets, obtaining assurance that the transaction price provides evidence of fair value or determining the adjustments to transaction prices that are necessary to measure the fair value of the instrument requires additional work during the valuation process.
The majority of valuation techniques employ only observable market data, and so the reliability of the fair value measurement is high. However, certain financial instruments are valued on the basis of valuation techniques that feature one or more significant market inputs that are unobservable, and for them, the derivation of fair value is more judgemental. An instrument in its entirety is classified as valued using significant unobservable inputs if, in the opinion of management, a significant proportion of the instrument’s balance sheet value and/or inception profit (‘day 1 gain or loss’) is driven by unobservable inputs. ‘Unobservable’ in this context means that there is little or no current market data available from which to determine the price at which an arm’s length transaction would be likely to occur. It generally does not mean that there is no market data available at all upon which to base a determination of fair value (consensus pricing data may, for example, be used). Furthermore, in some cases the majority of the fair value derived from a valuation technique with significant unobservable inputs may be attributable to observable inputs. Consequently, the effect of uncertainty in determining unobservable inputs will generally be restricted to uncertainty about the overall fair value of the financial instrument being measured. To help in understanding the extent and the range of this uncertainty, additional information is provided in the section headed ‘Effect of changes in significant unobservable assumptions to reasonably possible alternatives’ below.
In certain circumstances, primarily where debt is hedged with interest rate derivatives or structured notes issued, HSBC records its own debt in issue at fair value, based on quoted prices in an active market for the specific instrument concerned, if available. When quoted market prices are unavailable, the own debt in issue is valued using valuation techniques, the inputs for which are either based upon quoted
163
Back to Contents
| H S B C H O L D I N G S P L C |
| |
| Report of the Directors: Impact of Market Turmoil(continued) |
| | |
| | |
| Fair values of financial instruments > Carried at fair value |
prices in an inactive market for the instrument, or are estimated by comparison with quoted prices in an active market for similar instruments. In both cases, the fair value includes the effect of applying the credit spread which is appropriate to HSBC’s liabilities. For all issued debt securities, discounted cash flow modelling is used to separate the change in fair value that may be attributed to HSBC’s credit spread movements from movements in other market factors such as benchmark interest rates or foreign exchange rates. Specifically, the change in fair value of issued debt securities attributable to the Group’s own credit spread is computed as follows: for each security at each reporting date, an externally verifiable price is obtained or a price is derived using credit spreads for similar securities for the same issuer. Then, using discounted cash flow, each security is valued using a risk-free discount curve. The difference in the valuations is attributable to the Group’s own credit spread. This methodology is applied consistently across all securities.
Structured notes issued and certain other hybrid instrument liabilities are included within trading liabilities and are measured at fair value. The credit spread applied to these instruments is derived from the spreads at which HSBC issues structured notes. These market spreads are significantly smaller than credit spreads observed for plain vanilla debt or in the credit default swap markets.
Gains and losses arising from changes in the credit spread of liabilities issued by HSBC reverse over the contractual life of the debt, provided that the debt is not repaid early.
All net positions in non-derivative financial instruments, and all derivative portfolios, are valued at bid or offer prices as appropriate. Long positions are marked at bid prices; short positions are marked at offer prices.
The fair value of a portfolio of financial instruments quoted in an active market is calculated as the product of the number of units and its quoted price and no block discounts are made.
The valuation techniques used when quoted market prices are not available incorporate certain assumptions that HSBC believes would be made by a market participant to establish fair value. When HSBC considers that there are additional considerations not included within the valuation model, appropriate adjustments may be made. Examples of such adjustments are:
| • | Credit risk adjustment:an adjustment to reflectthe creditworthiness of OTC derivativecounterparties. |
| • | Market data/model uncertainty:an adjustmentto reflect uncertainties in fair values based onunobservable market data inputs (for example,as a result of illiquidity), or in areas where thechoice of valuation model is particularlysubjective. |
| | |
| • | Inception profit (‘day 1 gain or loss’):forfinancial instruments valued at inception on thebasis of one or more significant unobservableinputs, the difference between transaction priceand model value, as adjusted, at inception (theday 1 gain or loss) is not recognised in theconsolidated income statement, but is deferred.An analysis of the movement in the deferredday 1 gain or loss is provided on page 400. |
Transaction costs are not included in the fair value calculation, nor are the future costs of administering the OTC derivative portfolio. These, along with trade origination costs such as brokerage fees and post-trade costs, are included either in fee expense or in operating expenses.
A detailed description of the valuation techniques applied to instruments of particular interest follows:
| • | Private equity |
| | |
| | HSBC’s private equity positions are generallyclassified as available for sale and are not tradedin active markets. In the absence of an activemarket, an investment’s fair value is estimatedon the basis of an analysis of the investee’sfinancial position and results, risk profile,prospects and other factors, as well as byreference to market valuations for similarentities quoted in an active market, or the priceat which similar companies have changedownership. The exercise of judgement isrequired because of uncertainties inherent inestimating fair value for private equityinvestments. |
| | |
| • | Debt securities, treasury and other eligible bills,and equities |
| | |
| | The fair value of these instruments is based onquoted market prices from an exchange, dealer,broker, industry group or pricing service, whenavailable. When they are unavailable, the fairvalue is determined by reference to quotedmarket prices for similar instruments, adjustedas appropriate for the specific circumstances ofthe instruments. |
| | |
| | Illiquidity and a lack of transparency in the market for debt securities backed by US sub-prime mortgages has resulted in less observable |
164
Back to Contents
| | data being available. While quoted market prices are generally used to determine the fair value of these securities, valuation models are used to substantiate the reliability of the limited market data available and to identify whether any adjustments to quoted market prices are required. |
| | |
| | In the absence of quoted market prices, fair value is determined using valuation techniques based on the calculation of the present value of expected future cash flows of the assets. The inputs to these valuation techniques are derived from observable market data and, where relevant, assumptions in respect of unobservable inputs. In respect of ABSs and mortgages, the assumptions may include prepayment speeds, default rates and loss severity based on collateral type, and performance as appropriate. The output from the valuation techniques is benchmarked for consistency against observable data. |
| | |
| • | Derivatives |
| | OTC (i.e. non-exchange traded) derivatives arevalued using valuation models. Valuationmodels calculate the present value of expectedfuture cash flows, based upon ‘no-arbitrage’principles. For many vanilla derivative products,such as interest rate swaps and Europeanoptions, the modelling approaches used arestandard across the industry. For more complexderivative products, there may be somedifferences in market practice. Inputs tovaluation models are determined fromobservable market data wherever possible,including prices available from exchanges,dealers, brokers or providers of consensuspricing. Certain inputs may not be observablein the market directly, but can be determinedfrom observable prices via model calibration |
| | procedures. Finally, some inputs are not observable, but can generally be estimated from historical data or other sources. Examples of inputs that are generally observable include foreign exchange spot and forward rates, benchmark interest rate curves and volatility surfaces for commonly traded option products. Examples of inputs that may be unobservableinclude volatility surfaces, in whole or in part,for less commonly traded option products, andcorrelations between market factors. |
| | |
| • | Loans including leveraged loans and loans heldfor securitisation |
| | Loans held at fair value are valued from brokerquotes and/or market data consensus providerswhen available. In the absence of an observablemarket, the fair value is determined usingvaluation techniques including discounted cashflow models, which incorporate assumptionsregarding an appropriate credit spread for theloan derived from other market instrumentsissued by the same or comparable entities. |
| | |
| • | Structured notes |
| | The fair value of structured notes valued usinga valuation technique is derived from the fairvalue of the underlying debt security asdescribed above, and the fair value of theembedded derivative is determined as describedin the paragraph above on derivatives. |
| | |
| Fair value valuation bases |
| | |
| The following table provides an analysis of the various bases described above which have been deployed for valuing financial assets and financial liabilities measured at fair value in the consolidated financial statements: |
Bases of valuing financial assets and liabilities measured at fair value
| | | | Valuation techniques | | | |
| | | |
|
|
| | | |
| | Quoted | | Using | | With significant | | | |
| | market | | observable | | unobservable | | | |
| | price | | inputs | | inputs | | Total | |
| | US$m | | US$m | | US$m | | US$m | |
| At 31 December 2008 | | | | | | | | |
| Assets | | | | | | | | |
| Trading assets | 234,399 | | 185,369 | | 7,561 | | 427,329 | |
| Financial assets designated at fair value | 14,590 | | 13,483 | | 460 | | 28,533 | |
| Derivatives | 8,495 | | 476,498 | | 9,883 | | 494,876 | |
| Financial investments: available for sale | 103,949 | | 173,157 | | 9,116 | | 286,222 | |
| | | | | | | | | |
| Liabilities | | | | | | | | |
| Trading liabilities | 105,584 | | 135,559 | | 6,509 | | 247,652 | |
| Financial liabilities designated at fair value | 23,311 | | 51,276 | | – | | 74,587 | |
| Derivatives | 9,896 | | 473,359 | | 3,805 | | 487,060 | |
165
Back to Contents
| H S B C H O L D I N G S P L C |
| |
| Report of the Directors: Impact of Market Turmoil(continued) |
| | |
| | |
| Fair values of financial instruments > Carried at fair value |
Bases of valuing financial assets and liabilities measured at fair value (continued)
| | | | Valuation techniques | | | |
| | | |
|
|
| | | |
| | Quoted | | Using | | With significant | | | |
| | market | | observable | | unobservable | | | |
| | price | | inputs | | inputs | | Total | |
| | US$m | | US$m | | US$m | | US$m | |
| At 31 December 2007 | | | | | | | | |
| Assets | | | | | | | | |
| Trading assets | 209,339 | | 222,678 | | 13,951 | | 445,968 | |
| Financial assets designated at fair value | 28,565 | | 12,694 | | 305 | | 41,564 | |
| Derivatives | 8,132 | | 175,493 | | 4,229 | | 187,854 | |
| Financial investments: available for sale | 77,045 | | 187,677 | | 8,510 | | 273,232 | |
| | | | | | | | | |
| Liabilities | | | | | | | | |
| Trading liabilities | 140,629 | | 167,967 | | 5,984 | | 314,580 | |
| Financial liabilities designated at fair value | 37,709 | | 52,230 | | – | | 89,939 | |
| Derivatives | 8,879 | | 171,444 | | 3,070 | | 183,393 | |
| | | | | | | | | |
The main drivers of the movement in the balances of assets and liabilities measured at fair value with significant unobservable inputs were an increase in the fair value of derivative assets and liabilities due to market conditions, and a reduction in the level of ABSs and loans held at fair value due
either to disposal, repayment or reclassification. At 31 December 2008, financial instruments measured at fair value using a valuation technique with significant unobservable inputs represented 2 per cent of total assets and liabilities measured at fair value (31 December 2007: 2 per cent).
Financial instruments measured at fair value using a valuation technique with significant unobservable inputs
| | Assets | | Liabilities | |
| |
|
|
|
|
|
|
| |
|
|
|
|
| |
| | | | | | Designated | | | | | | Designated | | | |
| | | | | | at fair value | | | | | | at fair value | | | |
| | Available | | Held for | | through | | | | Held for | | through | | | |
| | for sale | | trading | | profit or loss | | Derivatives | | trading | | profit or loss | | Derivatives | |
| | US$m | | US$m | | US$m | | US$m | | US$m | | US$m | | US$m | |
| At 31 December 2008 | | | | | | | | | | | | | | |
| Private equity investments | 2,689 | | 54 | | 225 | | – | | – | | – | | – | |
| Asset-backed securities | 4,264 | | 882 | | – | | 95 | | – | | – | | 565 | |
| Leveraged finance | – | | 266 | | – | | – | | – | | – | | 33 | |
| Loans held for securitisation | – | | 2,133 | | – | | – | | – | | – | | – | |
| Structured notes | – | | 87 | | – | | – | | 5,294 | | – | | – | |
| Derivatives with monolines | – | | – | | – | | 2,441 | | – | | – | | – | |
| Other derivatives | – | | – | | – | | 7,347 | | – | | – | | 3,207 | |
| Other portfolios | 2,163 | | 4,139 | | 235 | | – | | 1,215 | | – | | – | |
| |
| |
| |
| |
| |
| |
| |
| |
| | 9,116 | | 7,561 | | 460 | | 9,883 | | 6,509 | | – | | 3,805 | |
| |
| |
| |
| |
| |
| |
| |
| |
| At 31 December 2007 | | | | | | | | | | | | | | |
| Private equity investments | 3,037 | | – | | – | | – | | – | | – | | – | |
| Asset-backed securities | 4,223 | | 2,073 | | – | | – | | – | | – | | – | |
| Leveraged finance | – | | 3,349 | | – | | – | | – | | – | | – | |
| Loans held for securitisation | – | | 5,100 | | – | | – | | – | | – | | – | |
| Structured notes | – | | – | | – | | – | | 5,396 | | – | | – | |
| Derivatives with monolines | – | | – | | – | | 1,010 | | – | | – | | – | |
| Other derivatives | – | | – | | – | | 3,219 | | – | | – | | 3,070 | |
| Other portfolios | 1,250 | | 3,429 | | 305 | | – | | 588 | | – | | – | |
| |
| |
| |
| |
| |
| |
| |
| |
| | 8,510 | | 13,951 | | 305 | | 4,229 | | 5,984 | | – | | 3,070 | |
| |
| |
| |
| |
| |
| |
| |
| |
| | | | | | | | | | | | | | |
At 31 December 2008, available-for-sale assets valued using a valuation technique with significant unobservable inputs principally comprised various ABSs, private equity investments and other portfolios, similar to the position at 31 December 2007.
Trading assets valued using a valuation technique with significant unobservable inputs
principally comprised loans held for securitisation and other portfolios. Other portfolios included holdings in various bonds, preference shares and corporate and mortgage loans. The decrease during the year largely reflected leveraged finance and ABS positions no longer held on a fair value basis following their reclassification to loans and receivables as a result of the amendment to IAS 39
166
Back to Contents
and a reduction in the level of loans held for securitisation.
Derivative products valued using valuation techniques with significant unobservable inputs included certain types of correlation products, such as foreign exchange basket options, foreign exchange-interest rate hybrid transactions and long-dated option transactions. Examples of the latter are equity options, interest rate and foreign exchange options and certain credit derivatives. Credit derivatives included tranched CDS transactions. The increase in derivative assets during the year was mainly due to (i) the transfer of certain leveraged credit derivative transactions into this category because widening credit spreads increased the significance of unobservable credit spread volatilities, and (ii) a general increase in the fair value of derivative assets during 2008.
Trading liabilities valued using a valuation technique with significant unobservable inputs principally comprised equity-linked structured note
transactions. These notes, which HSBC issues to investors, provide the counterparty with a return that is linked to the performance of certain equity securities.
The increase in derivative liabilities valued using a valuation technique with significant unobservable inputs was due to the general increase in the fair value of derivative liabilities during 2008.
Effect of changes in significant unobservable assumptions to reasonably possible alternatives
As discussed above, the fair value of financial instruments are, in certain circumstances, measured using valuation techniques that incorporate assumptions that are not evidenced by prices from observable current market transactions in the same instrument and are not based on observable market data. The following table shows the sensitivity of these fair values to reasonably possible alternative assumptions:
| | | | | |
| | Reflected in profit or loss | | Reflected in equity | |
| |
|
|
| |
|
|
| |
| | Favourable | | Unfavourable | | Favourable | | Unfavourable | |
| | changes | | changes | | changes | | changes | |
| | US$m | | US$m | | US$m | | US$m | |
| At 31 December 2008 | | | | | | | | |
| Derivatives, trading assets and trading liabilities1 | 1,266 | | (703 | ) | – | | – | |
| Financial assets and liabilities designated at fair value | 30 | | (30 | ) | – | | – | |
| Financial investments: available for sale | – | | – | | 984 | | (1,005 | ) |
| | | | | | | | | |
| At 31 December 2007 | | | | | | | | |
| Derivatives, trading assets and trading liabilities1 | 602 | | (415 | ) | – | | – | |
| Financial assets and liabilities designated at fair value | 30 | | (30 | ) | – | | – | |
| Financial investments: available for sale | – | | – | | 529 | | (591 | ) |
| | |
| 1 | Derivatives, trading assets and trading liabilities are presented as one category to reflect the manner in which these financial instruments are risk-managed. |
| | |
The increase in the effect of changes in significant unobservable inputs in relation to derivatives, trading assets and trading liabilities
during the year primarily reflected increased sensitivity of instruments to unobservable parameters across asset and liability classes.
Principal assumptions used in the valuation of financial instruments with significant unobservable inputs
| | Reflected in profit or loss | | Reflected in equity | |
| |
|
|
| |
|
|
| |
| | Favourable | | Unfavourable | | Favourable | | Unfavourable | |
| | changes | | changes | | changes | | changes | |
| | US$m | | US$m | | US$m | | US$m | |
| At 31 December 2008 | | | | | | | | |
| Private equity investments | 28 | | (28 | ) | 234 | | (261 | ) |
| Asset-backed securities | 90 | | (91 | ) | 667 | | (660 | ) |
| Leveraged finance | 2 | | (2 | ) | – | | – | |
| Loans held for securitisation | 41 | | (41 | ) | – | | – | |
| Structured notes | 8 | | (8 | ) | – | | – | |
| Derivatives with monolines | 341 | | (250 | ) | – | | – | |
| Other derivatives | 652 | | (224 | ) | – | | – | |
| Other portfolios | 134 | | (89 | ) | 83 | | (84 | ) |
167
Back to Contents
| H S B C H O L D I N G S P L C |
| |
| Report of the Directors: Impact of Market Turmoil(continued) |
| |
| | |
| Fair values of financial instruments > Carried at fair value |
Principal assumptions used in the valuation of financial instruments with significant unobservable inputs(continued)
| | Reflected in profit or loss | | Reflected in equity | |
| |
| |
| |
| | Favourable | | Unfavourable | | Favourable | | Unfavourable | |
| | changes | | changes | | changes | | changes | |
| | US$m | | US$m | | US$m | | US$m | |
| At 31 December 2007 | | | | | | | | |
| Private equity investments | – | | – | | 228 | | (228 | ) |
| Asset-backed securities | 226 | | (178 | ) | 101 | | (163 | ) |
| Leveraged finance | 49 | | (49 | ) | – | | – | |
| Loans held for securitisation | 40 | | (40 | ) | – | | – | |
| Structured notes | 17 | | (17 | ) | – | | – | |
| Derivatives with monolines | 88 | | (109 | ) | – | | – | |
| Other derivatives | 132 | | (6 | ) | – | | – | |
| Other portfolios | 80 | | (46 | ) | 200 | | (200 | ) |
| | | | | | | | | |
Favourable and unfavourable changes are determined on the basis of changes in the value of the instrument as a result of varying the levels of the unobservable parameter using statistical techniques. When parameters are not amenable to statistical analysis, quantification of uncertainty is judgemental.
When the fair value of a financial instrument is affected by more than one unobservable assumption, the above table reflects the most favourable or most unfavourable change from varying the assumptions individually.
In respect of private equity investments, the valuations are assessed on an asset by asset basis using a valuation methodology appropriate to the specific investment, in line with industry guidelines. In many of the methodologies, the principal assumption is the valuation multiple to be applied to the main financial indicators including, for example, multiples for comparable listed companies and discounts for marketability.
For ABSs whose prices are unobservable, models are used to generate the expected value of the asset, incorporating benchmark information on factors such as prepayment speeds, default rates, loss severities and the historical performance of the underlying assets. The models used are calibrated by using securities for which external market information is available.
For leveraged finance, loans held for securitisation and derivatives with monolines the principal assumption concerns the appropriate value to be attributed to the counterparty credit risk. This requires exposure at default, probability of default and recovery in the event of default to be estimated. For loan transactions, assessment of exposure at default is straight-forward. For derivative transactions, a future exposure profile is generated based on current market data. Probabilities of default and recovery levels are estimated using market evidence, which may include financial information,
historical experience, CDS spreads and consensus recovery levels.
In the absence of such evidence, management’s best estimate is used.
For structured notes and other derivatives, principal assumptions concern the future volatility of asset values and the future correlation between asset values. For such unobservable assumptions, estimates are based on available market data, which may include the use of a proxy method to derive a volatility or a correlation from comparable assets for which market data is more readily available, and/or an examination of historical levels.
Changes in fair value recorded in the income statement
The following table quantifies the changes in fair values recognised in profit or loss during the year in respect of exposures whose fair values are estimated using valuation techniques that incorporate significant assumptions that are not evidenced by prices from observable current market transactions in the same instrument, and are not based on observable market data:
| • | the table details the total change in fair valueof these instruments; it does not isolate thecomponent of the change that is attributableto the unobservable component; |
| | |
| • | instruments valued with significantunobservable inputs are frequently dynamicallymanaged with instruments valued usingobservable inputs; the table does not include anychanges in fair value of these latter instruments;and |
| | |
| • | the table reflects the full change in fair valueduring 2008 of assets and liabilities valued usingsignificant unobservable inputs at 31 December2008 which were observable at 31 December2007. |
168
Back to Contents
| | 2008 | | 2007 | |
| | US$m | | US$m | |
Recorded profit/(loss) on: | | | | |
Derivatives, trading assets and trading liabilities | 779 | | 491 | |
Financial assets and liabilities designated at fair value | 109 | | 9 | |
The profit during the year primarily reflects changes in the fair value of credit derivatives which were transferred from using a valuation technique with significant observable inputs to a valuation technique with significant unobservable inputs. The change in valuation technique was due to widening
credit spreads which have increased the significance of unobservable credit spread volatilities. These movements are offset by reductions occurring due to write-downs of MBSs, mortgage loans acquired for the purpose of securitisation and credit derivative transactions executed against monoline insurers.
HSBC Holdings
The following table provides an analysis of the basis for valuing financial assets and financial liabilities measured at fair value in the financial statements:
Bases of valuing HSBC Holdings’ financial assets and liabilities measured at fair value| | Valuation techniques | |
| |
| |
| | Quoted | | Using | | With significant | | | |
| | market | | observable | | unobservable | | | |
| | price | | inputs | | inputs | | Total | |
| | US$m | | US$m | | US$m | | US$m | |
| At 31 December 2008 | | | | | | | | |
| Assets | | | | | | | | |
| Derivatives | – | | 3,682 | | – | | 3,682 | |
| Financial investments: available for sale | – | | – | | 2,629 | | 2,629 | |
| Liabilities | | | | | | | | |
| Financial liabilities designated at fair value | 16,389 | | – | | – | | 16,389 | |
| Derivatives | – | | 1,324 | | – | | 1,324 | |
| At 31 December 2007 | | | | | | | | |
| Assets | | | | | | | | |
| Derivatives | – | | 2,660 | | – | | 2,660 | |
| Financial investments: available for sale | 346 | | – | | 2,676 | | 3,022 | |
| Liabilities | | | | | | | | |
| Financial liabilities designated at fair value | 18,683 | | – | | – | | 18,683 | |
| Derivatives | – | | 44 | | – | | 44 | |
Financial investments measured using a valuation technique with significant unobservable inputs comprise fixed-rate trust-preferred securities and senior notes purchased from HSBC undertakings. The unobservable elements of the valuation technique include the use of implied credit spreads and simplified bond pricing assumptions.
Effect of changes in significant unobservable assumptions to reasonably possible alternatives
As discussed above, the fair value of financial instruments are in certain circumstances measured using valuation models that incorporate assumptions that are not supported by prices from observable current market transactions in the same instrument and are not based on observable market data. The following table shows the sensitivity of non-derivative financial instruments to reasonably possible alternative assumptions.
| | Reflected in equity | |
| |
| |
| | Favourable | | Unfavourable | |
| | changes | | changes | |
| | US$m | | US$m | |
| Financial investments | | | | |
| available for sale | | | | |
| At 31 December 2008 | 113 | | (97 | ) |
| At 31 December 2007 | 53 | | (52 | ) |
Assessing available-for-sale assets for impairment
HSBC’s policy on impairment of available-for-sale assets is described on page 350. The following is a description of HSBC’s application of that policy.
A systematic impairment review is carried out periodically of all available-for-sale assets, and all available indicators are considered to determine whether there is any objective evidence that an impairment may have occurred, whether as the result of a single loss event or as the combined effect of several events.
169
Back to Contents
| H S B C H O L D I N G S P L C |
| |
| Report of the Directors: Impact of Market Turmoil(continued) |
| |
| | |
| Fair values of financial instruments > Carried at fair value / Not carried at fair value |
Debt securities
When assessing available-for-sale debt securities for objective evidence of impairment at the balance sheet date, HSBC considers all available evidence, including observable data or information about events specifically relating to the securities which may result in a shortfall in recovery of future cash flows. These events may include a significant financial difficulty of the issuer, a breach of contract such as a default, bankruptcy or other financial reorganisation, or the disappearance of an active market for the debt security because of financial difficulties relating to the issuer.
These types of specific event and other factors such as information about the issuers’ liquidity, business and financial risk exposures, levels of and trends in default for similar financial assets, national and local economic trends and conditions, and the fair value of collateral and guarantees may be considered individually, or in combination, to determine if there is objective evidence of impairment of a debt security.
In addition, when assessing available-for-sale ABSs for objective evidence of impairment, HSBC considers the performance of underlying collateral, the extent and depth of market price declines and changes in credit ratings. The primary indicators of potential impairment are considered to be adverse fair value movements, and the disappearance of an active market for the securities.
At 31 December 2008, the population of available-for-sale ABSs identified as being most at risk of impairment included residential MBSs backed by sub-prime and Alt-A mortgages originated in the US, and CDOs with significant exposure to this sector. The estimated future cash flows of these securities are assessed to determine whether any of their cash flows are unlikely to be recovered as a result of events occurring on or before the balance sheet date.
In particular, for residential MBSs the estimated future cash flows are assessed by determining the future projected cash flows arising on the underlying collateral taking into consideration the delinquency status of underlying loans, the probability of delinquent loans progressing to default and the proportion of the advances subsequently recoverable. HSBC uses a modelling approach which incorporates historically observed progression rates to default, to determine if the decline in aggregate projected cash flows from the underlying collateral will lead to a shortfall in contractual cash flows. In such cases the security is considered to be impaired.
In respect of CDOs, in order to determine whether impairment has occurred, the expected future cash flows of the CDOs are compared with the total of the underlying collateral on the non-defaulted assets and the recovery value of the defaulted assets. In the event of a shortfall, the CDO is considered to be impaired.
When a security benefits from a contract provided by a monoline insurer that insures payments of principal and interest, the expected recovery on the contract is assessed in determining the total expected credit support available to the ABS.
Equity securitiesObjective evidence of impairment for available-for-sale equity securities may include specific information about the issuer as detailed above, but may also include information about significant changes in technology, markets, economics or the law that provides evidence that the cost of the equity securities may not be recovered.
A significant or prolonged decline in the fair value of the asset below its cost is also objective evidence of impairment. In assessing whether it is significant, the decline in fair value is evaluated against the original cost of the asset at initial recognition. In assessing whether it is prolonged, the decline is evaluated against the period in which the fair value of the asset has been below its original cost at initial recognition.
For impairment losses on available-for-sale debt and equity securities, see pages 34 and 30, respectively. Any impairment losses recognised in the income statement relating to ABSs are recorded in the ‘Loan impairment charges and other credit risk provisions’ line. Impairment losses incurred on assets held by consolidated securities investment conduits (excluding Solitaire) are offset by a credit to the impairment line for the amount of the loss borne by capital note holders.
Fair values of financial instruments not carried at fair value
Financial instruments that are not measured at fair value on the balance sheet include loans and advances to banks and customers, deposits by banks, customer accounts, debt securities in issue and subordinated liabilities. Their fair values are, however, provided for information by way of note disclosure and are calculated as described below.
The calculation of fair value incorporates HSBC’s estimate of the amount at which financial
170
Back to Contents
assets could be exchanged, or financial liabilities settled, between knowledgeable, willing parties in an arm’s length transaction. It does not reflect the economic benefits and costs that HSBC expects to flow from the instruments’ cash flows over their expected future lives. Other reporting entities may use different valuation methodologies and assumptions in determining fair values for which no observable market prices are available, so comparisons of fair values between entities may not be meaningful and users are advised to exercise caution when using this data.
Since August 2007, the unstable market conditions in the US mortgage lending industry have resulted in a significant reduction in the secondary market demand for US consumer lending assets. Uncertainty over the extent and timing of future credit losses, together with an absence of liquidity for non-prime ABSs, continued to be reflected in a lack of bid prices at 31 December 2008. It is not possible to distinguish from the indicative market prices that are available, between the relative discount to nominal value within the fair value measurement that reflects cash flow impairment due to expected losses to maturity, and the discount that the market is demanding for holding an illiquid and out of favour asset. Under impairment accounting for loans and advances, there is no need nor requirement to adjust carrying amounts to reflect illiquidity as HSBC’s intention is to fund assets until the earlier of prepayment, charge-off or repayment on maturity. Market fair values, on the other hand, reflect both incurred loss and loss expected through the life of the asset, a discount for illiquidity and a credit spread which reflects the market’s current risk preferences. This usually differs from the credit spread applicable in the market at the time the loan was underwritten and funded.
The estimated fair values at 31 December 2008 and 31 December 2007 of loans and advances to customers in North America reflect the combined effect of these conditions. As a result, the fair values are substantially lower than the carrying amount of customer loans held on-balance sheet and lower than would otherwise be reported under more normal market conditions. Accordingly, the fair values reported do not reflect HSBC’s estimate of the underlying long-term value of the assets.
Fair values at the balance sheet date of the assets and liabilities set out below are estimated for the purpose of disclosure as follows:
| • | Loans and advances to banks and customers |
| | |
| | The fair value of loans and advances is basedon observable market transactions, whereavailable. In the absence of observable markettransactions, fair value is estimated usingdiscounted cash flow models. Performingloans are grouped, as far as possible, intohomogeneous pools segregated by maturity andcoupon rates. In general, contractual cash flowsare discounted using HSBC’s estimate of thediscount rate that a market participant would usein valuing instruments with similar maturity,repricing and credit risk characteristics. |
| | |
| | The fair value of a loan portfolio reflects both loan impairments at the balance sheet date and estimates of market participants’ expectations of credit losses over the life of the loans. |
| | |
| | For impaired loans, fair value is estimated by discounting the future cash flows over the time period they are expected to be recovered. |
| | |
| • | Financial investments |
| | |
| | The fair values of listed financial investmentsare determined using bid market prices. The fairvalues of unlisted financial investments aredetermined using valuation techniques that takeinto consideration the prices and future earningsstreams of equivalent quoted securities. |
| | |
| • | Deposits by banks and customer accounts |
| | |
| | For the purposes of estimating fair value,deposits by banks and customer accounts aregrouped by residual maturity. Fair values areestimated using discounted cash flows, applyingcurrent rates offered for deposits of similarremaining maturities. The fair value of a depositrepayable on demand is assumed to be theamount payable on demand at the balance sheetdate. |
| | |
| • | Debt securities in issue and subordinatedliabilities |
| | |
| | Fair values are determined using quoted marketprices at the balance sheet date where available,or by reference to quoted market prices forsimilar instruments. |
The fair values in this note are stated at a specific date and may be significantly different from the amounts which will actually be paid on the maturity or settlement dates of the instruments. In many cases, it would not be possible to realise immediately the estimated fair values given the size
171
Back to Contents
| H S B C H O L D I N G S P L C |
| |
| Report of the Directors: Impact of Market Turmoil(continued) |
| | |
| | |
| Fair values of financial instruments > Not carried at fair value / HSBC Holdings // SPEs > HSBC-sponsored SPEs |
of the portfolios measured. Accordingly, these fair values do not represent the value of these financial instruments to HSBC as a going concern.
For all classes of financial instruments, fair value represents the product of the value of a single instrument, multiplied by the number of instruments held. No block discount or premium adjustments are made. The fair values of intangible assets related to the businesses which originate and hold the financial instruments subject to fair value measurement, such as values placed on portfolios of core deposits, credit card and customer relationships, are not included above because they are not classified as financial instruments. Accordingly, an aggregation of fair value measurements does not approximate to the value of the organisation as a going concern.
The following table lists financial instruments whose carrying amount is a reasonable approximation of fair value because, for example, they are short-term in nature or reprice to current market rates frequently:
Assets
Cash and balances at central banks
Items in the course of collection from other banks
Hong Kong Government certificates of indebtedness
Endorsements and acceptances
Short-term receivables within ‘Other assets’
Accrued income
Liabilities
Hong Kong currency notes in circulation
Items in the course of transmission to other banks
Investment contracts with discretionary participation features within ‘Liabilities under insurance contracts’
Endorsements and acceptances
Short-term payables within ‘Other liabilities’
Accruals
Fair values of financial instruments which are not carried at fair value on the balance sheet
| | | At 31 December 2008 | | At 31 December 2007 | |
| | |
|
|
| |
|
|
| |
| | | Carrying | | Fair | | Carrying | | Fair | |
| | | amount | | value | | amount | | value | |
| | | US$m | | US$m | | US$m | | US$m | |
| Assets | | | | | | | | | |
| Loans and advances to banks | | 153,766 | | 153,363 | | 237,366 | | 237,374 | |
| Loans and advances to customers | | 932,868 | | 876,239 | | 981,548 | | 951,850 | |
| Financial investments: debt securities | | 14,013 | | 15,057 | | 9,768 | | 10,154 | |
| Liabilities | | | | | | | | | |
| Deposits by banks | | 130,084 | | 130,129 | | 132,181 | | 132,165 | |
| Customer accounts | | 1,115,327 | | 1,115,291 | | 1,096,140 | | 1,095,727 | |
| Debt securities in issue | | 179,693 | | 170,599 | | 246,579 | | 243,802 | |
| Subordinated liabilities | | 29,433 | | 28,381 | | 24,819 | | 23,853 | |
Fair values of financial investments classified as held for sale which are not carried at fair value on the balance sheet
| | | At 31 December 2008 | | At 31 December 2007 | |
| | |
|
|
| |
|
|
| |
| | | Carrying | | Fair | | Carrying | | Fair | |
| | | amount | | value | | amount | | value | |
| | | US$m | | US$m | | US$m | | US$m | |
| Assets classified as held for sale | | | | | | | | | |
| Loans and advances to banks and customers | | 11 | | 11 | | 14 | | 14 | |
| Financial investments: debt securities | | 37 | | 37 | | 27 | | 27 | |
Analysis of loans and advances to customers by geographical segment
| | | At 31 December 2008 | | At 31 December 2007 | |
| | |
|
|
| |
|
|
| |
| | | Carrying | | Fair | | Carrying | | Fair | |
| | | amount | | Value | | amount | | value | |
| | | US$m | | US$m | | US$m | | US$m | |
| Loans and advances to customers | | | | | | | | | |
| Europe | | 426,191 | | 417,256 | | 452,275 | | 450,010 | |
| Hong Kong | | 100,220 | | 100,490 | | 89,638 | | 89,908 | |
| Rest of Asia-Pacific | | 107,956 | | 104,687 | | 101,852 | | 101,860 | |
| North America1 | | 256,214 | | 211,346 | | 289,860 | | 262,123 | |
| Latin America | | 42,287 | | 42,460 | | 47,923 | | 47,949 | |
| | |
| |
| |
| |
| |
| | | 932,868 | | 876,239 | | 981,548 | | 951,850 | |
| | |
| |
| |
| |
| |
| | | | | | | | | |
| 1 | The reasons for the significant difference between carrying amount and fair value of loans and advances to customers in North America are discussed on page 170. |
172
Back to Contents
HSBC Holdings
The methods used by HSBC Holdings to determine fair values of financial instruments for the purpose of measurement and disclosure are described above.
The following table provides an analysis of the fair value of financial instruments not carried at fair value on the balance sheet:
Fair values of HSBC Holdings’ financial instruments not carried at fair value on the balance sheet
| | | 2008 | | 2007 | |
| | |
|
|
| |
|
|
| |
| | | Carrying | | Fair | | Carrying | | Fair | |
| | | amount | | value | | amount | | value | |
| | | US$m | | US$m | | US$m | | US$m | |
| Assets | | | | | | | | | |
| Loans and advances to HSBC undertakings | | 11,804 | | 12,670 | | 17,242 | | 17,356 | |
| | | | | | | | | | |
| Liabilities | | | | | | | | | |
| Amounts owed to HSBC undertakings | | 4,042 | | 4,218 | | 2,969 | | 2,992 | |
| Subordinated liabilities | | 14,017 | | 13,940 | | 8,544 | | 8,609 | |
| | | | | | | | | | |
| | | | | | | | | | |
| | | | | | | | | | |
| Special purpose entities |
|
| (Audited) |
This section contains disclosures about HSBC-sponsored SPEs that are included in HSBC’s consolidated balance sheet, with a particular focus on SPEs containing exposures affected by recent turmoil in credit markets, and those that are not consolidated by HSBC under IFRSs. In addition to the disclosures about SPEs, information on other off-balance sheet arrangements has been included in this section.
HSBC enters into certain transactions with customers in the ordinary course of business which involve the establishment of SPEs to facilitate or secure customer transactions.
HSBC structures that utilise SPEs are authorised centrally when they are established to ensure appropriate purpose and governance. The activities of SPEs administered by HSBC are closely monitored by senior management. HSBC’s involvement with SPE transactions is described below.
HSBC-sponsored SPEs
HSBC sponsors the formation of entities which are designed to accomplish certain narrow and well-defined objectives, such as securitising financial assets or affecting a lease, and this requires a form of legal structure that restricts the assets and liabilities within the structure to the single purpose for which it was established. HSBC consolidates these SPEs when the substance of the relationship indicates that HSBC controls them. In assessing control, all relevant factors are considered, including qualitative and quantitative aspects. For example:
Qualitative factors – in substance:
| • | the activities of the SPE are being conducted on behalf of HSBC according to HSBC’s specific business needs so that it obtains benefit from the SPE’s operation. This might be evidenced, for example, by HSBC providing a significant level of support to the SPE; and |
| | |
| • | HSBC has the decision-making powers to obtainthe majority of the benefits of the activities ofthe SPE. |
Quantitative factors – hereinafter referred to as ‘the majority of risks and rewards of ownership’. In substance:
| • | HSBC has rights to obtain the majority of thebenefits of the SPE and therefore may beexposed to risks incidental to the activities ofthe SPE; and |
| | |
| • | HSBC retains the majority of the residual orownership risks related to the SPE or its assetsin order to obtain benefits from its activities. |
In a number of cases, these SPEs are accounted for off-balance sheet under IFRSs where HSBC does not have the majority of the risks and rewards of ownership of the SPE. However in certain circumstances, after careful consideration of the facts, HSBC consolidates an SPE when, although it does not obtain the majority of risks and rewards of ownership, the qualitative features of HSBC’s involvement indicate that, in substance, the activities of the SPE are being conducted on behalf of HSBC.
HSBC reassesses the required consolidation accounting tests whenever there is a change in the substance of the relationship between HSBC and an SPE, for example, when the nature of HSBC’s involvement or the governing rules, contractual
173
Back to Contents
| H S B C H O L D I N G S P L C |
| |
| Report of the Directors: Impact of Market Turmoil(continued) |
| |
| | |
| SPEs > SIVs and conduits |
arrangements or capital structure of the SPE change. The most significant categories of SPEs are discussed in more detail below.
Structured investment vehicles and conduits
Structured investment vehicles
Structured investment vehicles (‘SIV’s) are SPEs which invest in diversified portfolios of interest-earning assets, generally funded through issues of commercial paper (‘CP’), medium-term notes (‘MTN’s) and other senior debt to take advantage of the spread differentials between the assets in the SIV and the funding cost. Prior to the implementation of Basel II, it was capital efficient to many bank investors to invest in highly-rated investment securities in this way. HSBC sponsored the establishment of two SIVs, Cullinan Finance Limited (‘Cullinan’) and Asscher Finance Limited (‘Asscher’) in 2005 and 2007, respectively, and in November 2007 HSBC consolidated Cullinan and Asscher.
As market illiquidity intensified, there were two main challenges for the SIV sector which could force asset sales: an inability to fund in the CP markets and the sensitivity of the continuing operation of SIVs to changes in the market value of their underlying assets.
In order to remove the risk of having to make forced asset sales, HSBC established three new securities investment conduits (defined below) to take on the assets held in Cullinan and Asscher. Mazarin Funding Limited (‘Mazarin’), an asset backed CP conduit, and Barion Funding Limited (‘Barion’), a term-funding vehicle, were set up in respect of Cullinan; and Malachite Funding Limited (‘Malachite’), a term-funding vehicle, was set up in respect of Asscher. During 2008, the investors in the capital notes issued by Cullinan and Asscher had the option of exchanging their existing capital notes for the capital notes of the respective new conduits. In addition, the new conduits agreed to purchase the assets in Cullinan and Asscher. As a result of this agreement the legal title of all Cullinan and Asscher’s assets were transferred to the new conduits. By 31 December 2008, all the original assets in Cullinan and Asscher were transferred to the new conduits.
During 2008, 91.3 per cent of the remaining capital note holders in Asscher and all of the capital note holders in Cullinan elected to exchange their existing holdings for capital notes in the new conduits. In January 2009, the remaining 8.7 per cent of Asscher’s capital notes were redeemed. At
31December 2007, the holders of the capital notesbore the risk of any actual losses arising in the new conduits up to US$2.3 billion, being the par value of their respective holdings. Prior to the exchanges of assets against capital note extinguishments, the par value of the capital notes was US$2.6 billion. At 31 December 2008, the economic first loss protection from capital note holders amounted to US$2.2 billion (2007: US$2.3 billion). The reduction in economic first loss protection is attributable to the recognition of a US$92 million realised loss at 31 December 2008 (2007: n/a). On an IFRS accounting basis, the capital notes were initially recognised at fair value on consolidation, which amounted to US$1.3 billion at 31 December 2007. At 31 December 2008, on an IFRS accounting basis, an impairment charge of US$293 million (2007: n/a) was recognised in addition to the realised loss of US$92 million, therefore reducing the carrying amount of these capital notes to US$0.9 billion.
ConduitsHSBC sponsors and manages two types of conduits which issue CP; multi-seller securities and securities investment conduits (‘SIC’s). HSBC has consolidated these conduits from inception because it is exposed to the majority of risks and rewards of ownership.
Securities investment conduits
Solitaire, HSBC’s principal securities investment conduit, purchases highly rated ABSs to facilitate tailored investment opportunities. HSBC’s other SICs, Mazarin, Barion and Malachite, evolved from the restructuring of HSBC’s sponsored SIVs as discussed above.
Multi-seller conduitsThese vehicles were established for the purpose of providing access to flexible market-based sources of finance for HSBC’s clients, for example, to finance discrete pools of third-party originated trade and vehicle finance loan receivables. HSBC’s principal multi-seller conduits are Regency Assets Limited (‘Regency’), Bryant Park Funding Limited LLC (‘Bryant Park’), Abington Square Funding LLC (‘Abington Square’) and Performance Trust.
The multi-seller conduits purchase or fund interests in diversified pools of third-party assets financed by issuing CP or drawing advances from HSBC. The cash flows received by the conduits from the third-party assets are used to service the funding and provide a commercial rate of return for
174
Back to Contents
HSBC for structuring, for various other administrative services, and for the liquidity and credit support it gives to the conduits. The asset pools acquired by the conduits are structured so that the credit enhancement the conduits receive, which equates to senior investment grade ratings, and the benefit of liquidity facilities typically provided by HSBC mean that the CP issued by the multi-seller conduits is itself highly rated.
During 2008, the finance provided by HSBC to Abington Square Funding LLC at the end of 2007 was repaid using the proceeds received from refinancing the assets within the conduit. The conduit did not enter into any new securitisation transactions during the period.
An analysis of the assets held by HSBC’s SIVs and conduits is set out below:
Ratings analysis of assets
| | | | | | | | Total | | | |
| | | | Other | | Total | | multi-seller | | Total | |
| | Solitaire | | SICs | | SICs | | conduits | | SIVs | |
| | US$bn | | US$bn | | US$bn | | US$bn | | US$bn | |
| S&P ratings at 31 December 2008 | | | | | | | | | | |
| AAA | 8.1 | | 12.0 | | 20.1 | | 6.1 | | 0.3 | |
| AA | 0.7 | | 1.4 | | 2.1 | | 1.8 | | – | |
| A | 1.0 | | 4.7 | | 5.7 | | 1.6 | | – | |
| BBB | 0.8 | | 1.0 | | 1.8 | | 1.2 | | – | |
| BB | 0.3 | | 0.4 | | 0.7 | | 0.2 | | – | |
| B | 0.1 | | 0.2 | | 0.3 | | 0.5 | | – | |
| CCC | 0.2 | | 0.2 | | 0.4 | | 1.8 | | – | |
| D | – | | – | | – | | 0.3 | | – | |
| |
| |
| |
| |
| |
| |
| Total investments | 11.2 | | 19.9 | | 31.1 | | 13.5 | | 0.3 | |
| Cash and other investments | 0.9 | | 0.3 | | 1.2 | | 0.4 | | 0.1 | |
| |
| |
| |
| |
| |
| |
| | 12.1 | | 20.2 | | 32.3 | | 13.9 | | 0.4 | |
| |
| |
| |
| |
| |
| |
| S&P ratings at 31 December 2007 | | | | | | | | | | |
| AAA | 20.8 | | – | | 20.8 | | 9.7 | | 28.3 | |
| AA | – | | – | | – | | 1.6 | | 3.3 | |
| A | – | | – | | – | | 3.9 | | 3.4 | |
| BBB | – | | – | | – | | 0.1 | | 0.1 | |
| |
| |
| |
| |
| |
| |
| Total investments | 20.8 | | – | | 20.8 | | 15.3 | | 35.1 | |
| Cash and other investments | 0.8 | | – | | 0.8 | | 0.5 | | 5.6 | |
| |
| |
| |
| |
| |
| |
| | 21.6 | | – | | 21.6 | | 15.8 | | 40.7 | |
| |
| |
| |
| |
| |
| |
Composition of asset portfolio
| | | | | | | | Total | | | |
| | | | Other | | Total | | multi-seller | | Total | |
| | Solitaire | | SICs | | SICs | | conduits | 1 | SIVs | |
| | US$bn | | US$bn | | US$bn | | US$bn | | US$bn | |
| Asset class at 31 December 2008 | | | | | | | | | | |
| Structured finance | | | | | | | | | | |
| Vehicle loans and equipment leases | – | | – | | – | | 3.9 | | – | |
| Consumer receivables | – | | – | | – | | 0.7 | | – | |
| Credit card receivables | 0.2 | | – | | 0.2 | | 1.4 | | – | |
| Residential MBSs | 4.4 | | 5.7 | | 10.1 | | 0.6 | | – | |
| Commercial MBSs | 2.1 | | 3.1 | | 5.2 | | 0.2 | | – | |
| Auto floor plan | – | | – | | – | | 2.2 | | – | |
| Trade receivables | – | | – | | – | | 2.7 | | – | |
| Student loan securities | 2.2 | | 2.0 | | 4.2 | | – | | – | |
| Vehicle finance loan securities | – | | 0.3 | | 0.3 | | – | | – | |
| Leverage loan securities | 1.5 | | 2.2 | | 3.7 | | – | | – | |
| Other ABSs | 0.8 | | 1.3 | | 2.1 | | 1.7 | | – | |
| |
| |
| |
| |
| |
| |
| | 11.2 | | 14.6 | | 25.8 | | 13.4 | | – | |
| |
| |
| |
| |
| |
| |
175
Back to Contents
| H S B C H O L D I N G S P L C |
| |
| Report of the Directors: Impact of Market Turmoil(continued) |
| |
| | |
| SPEs > SIVs and conduits |
Composition of asset portfolio (continued)
| | | | | | | | | Total | | | |
| | | | | Other | | Total | | multi-seller | | Total | |
| | | Solitaire | | SICs | | SICs | | conduits | 1 | SIVs | |
| | | US$bn | | US$bn | | US$bn | | US$bn | | US$bn | |
| Finance | | | | | | | | | | | |
| Commercial bank securities and deposits | | – | | 4.4 | | 4.4 | | 0.4 | | – | |
| Investment bank debt securities | | – | | 0.5 | | 0.5 | | – | | – | |
| Investment bank securities | | – | | – | | – | | – | | – | |
| Finance company debt securities | | – | | 0.4 | | 0.4 | | – | | 0.3 | |
| Other assets | | 0.9 | | 0.3 | | 1.2 | | 0.1 | | 0.1 | |
| | |
| |
| |
| |
| |
| |
| | | 0.9 | | 5.6 | | 6.5 | | 0.5 | | 0.4 | |
| | |
| |
| |
| |
| |
| |
| | | 12.1 | | 20.2 | | 32.3 | | 13.9 | | 0.4 | |
| | |
| |
| |
| |
| |
| |
| US sub-prime mortgages | | 0.6 | | 0.7 | | 1.3 | | – | | – | |
| US Alt-A | | 2.3 | | 2.2 | | 4.5 | | – | | – | |
| | |
| |
| |
| |
| |
| |
| | | 2.9 | | 2.9 | | 5.8 | | – | | – | |
| | |
| |
| |
| |
| |
| |
| Asset class at 31 December 2007 | | | | | | | | | | | |
| Structured finance | | | | | | | | | | | |
| Vehicle loans and equipment leases | | – | | – | | – | | 3.6 | | – | |
| Consumer receivables | | – | | – | | – | | 0.8 | | – | |
| Credit card receivables | | – | | – | | – | | 1.5 | | – | |
| Residential MBSs | | 9.3 | | – | | 9.3 | | 2.0 | | 14.5 | |
| Commercial MBSs | | 3.7 | | – | | 3.7 | | 0.1 | | 5.0 | |
| Auto floor plan | | – | | – | | – | | 2.0 | | – | |
| Trade receivables | | – | | – | | – | | 3.1 | | – | |
| Student loan securities | | 3.5 | | – | | 3.5 | | – | | 2.6 | |
| Vehicle finance loan securities | | 0.1 | | – | | 0.1 | | – | | 0.3 | |
| Leverage loan securities | | 2.2 | | – | | 2.2 | | – | | 2.8 | |
| Other ABSs | | 2.2 | | – | | 2.2 | | 2.3 | | 6.9 | |
| | |
| |
| |
| |
| |
| |
| | | 21.0 | | – | | 21.0 | | 15.4 | | 32.1 | |
| | |
| |
| |
| |
| |
| |
| Finance | | | | | | | | | | | |
| Commercial bank securities and deposits | | 0.6 | | – | | 0.6 | | – | | 7.3 | |
| Investment bank debt securities | | – | | – | | – | | – | | 0.8 | |
| Investment bank securities | | – | | – | | – | | 0.4 | | – | |
| Finance company debt securities | | – | | – | | – | | – | | 0.5 | |
| | |
| |
| |
| |
| |
| |
| | | 0.6 | | – | | 0.6 | | 0.4 | | 8.6 | |
| | |
| |
| |
| |
| |
| |
| | | 21.6 | | – | | 21.6 | | 15.8 | | 40.7 | |
| | |
| |
| |
| |
| |
| |
| US sub-prime mortgages | | 1.9 | | – | | 1.9 | | 0.1 | | 3.5 | |
| US Alt-A | | 5.3 | | – | | 5.3 | | – | | 5.9 | |
| | |
| |
| |
| |
| |
| |
| | | 7.2 | | – | | 7.2 | | 0.1 | | 9.4 | |
| | |
| |
| |
| |
| |
| |
| | | | | | | | | | | | |
| 1 | Assets within multi-seller conduits are classified as collateralised loans. Under IFRSs, the conduits cannot recognise the underlying assets. |
During 2008, the credit ratings of various securities held by the SICs, many with exposures to US sub-prime and Alt-A mortgages, were downgraded by rating agencies. At 31 December
2008, 44.7 per cent of the SICs’ exposures to US sub-prime and Alt-A mortgages remained AAA rated (2007: 100 per cent), while 81.4 per cent remained investment grade.
It should be noted that securities purchased by SICs typically benefit from substantial transaction- specific credit enhancements such as subordinated tranches and/or excess spread, which absorb any
credit losses before they would fall on the tranche held by the SPE.
As noted above, by 31 December 2008, all the original assets held by the SIVs were transferred to the new SICs. However, during the second half of 2008, the SIVs purchased CP issued by certain SICs set up by HSBC and, at 31 December 2008, the SIVs’ holdings amounted to US$0.3 billion. The cash flows of the CP issued by the new SICs are referenced to bonds which include those backed by US sub-prime and US Alt-A MBSs. In early 2009, the CP matured, and the cash received by the SIVs has been transferred to the respective SICs.
176
Back to Contents
| Asset analysis by geographical origination for multi-seller conduits1 | | | | |
| |
| | At 31 December | |
| |
|
|
| |
| | 2008 | | 2007 | |
| | US$bn | | US$bn | |
| | | | | |
| Europe | 7.5 | | 7.4 | |
| Rest of Asia-Pacific | 0.9 | | 1.0 | |
| North America | 5.5 | | 6.3 | |
| Latin America | – | | 1.1 | |
| |
| |
| |
| | 13.9 | | 15.8 | |
| |
| |
| |
| 1 | For details on the geographical origin of the mortgage loans held at fair value and ABSs, including those represented by MBSs and CDOs held in consolidated SIVs and securities investment conduits, see ‘Nature and extent of HSBC’s exposures’ on page 150. |
| |
| Total assets by balance sheet classification | | | | | | | | | | |
| |
| | | | | | | | Total | | | |
| | | | Other | | Total | | multi-seller | | Total | |
| | Solitaire | | SICs | | SICs | | conduits | | SIVs | |
| | US$bn | | US$bn | | US$bn | | US$bn | | US$bn | |
| At 31 December 2008 | | | | | | | | | | |
| Financial instruments designated at fair value | 0.1 | | – | | 0.1 | | – | | – | |
| Derivative assets | – | | 0.2 | | 0.2 | | 0.1 | | – | |
| Loans and advances to banks | – | | 0.1 | | 0.1 | | – | | 0.1 | |
| Loans and advances to customers | – | | – | | – | | 13.4 | | – | |
| Financial investments | 11.1 | | 19.9 | | 31.0 | | – | | 0.3 | |
| Other assets | 0.9 | | – | | 0.9 | | 0.4 | | – | |
| |
| |
| |
| |
| |
| |
| | 12.1 | | 20.2 | | 32.3 | | 13.9 | | 0.4 | |
| |
| |
| |
| |
| |
| |
| |
| At 31 December 2007 | | | | | | | | | | |
| Financial instruments designated at fair value | 0.1 | | – | | 0.1 | | – | | – | |
| Derivative assets | 0.1 | | – | | 0.1 | | – | | 0.3 | |
| Loans and advances to banks | 0.2 | | – | | 0.2 | | – | | 3.1 | |
| Loans and advances to customers | – | | – | | – | | 14.9 | | – | |
| Financial investments | 20.6 | | – | | 20.6 | | 0.5 | | 37.1 | |
| Other assets | 0.6 | | – | | 0.6 | | 0.4 | | 0.2 | |
| |
| |
| |
| |
| |
| |
| | 21.6 | | – | | 21.6 | | 15.8 | | 40.7 | |
| |
| |
| |
| |
| |
| |
| | | | | | | | | | | | | | | |
| Weighted average maturity of assets and life of portfolios | | | | | | | | | | | | | | |
| |
| | | | | | | | | | | | Total | | | | | |
| | | | | | Other | | | Total | | | multi-seller | | | Total | | |
| | | Solitaire | | | SICs | | | SICs | | | conduits | | | SIVs | | |
| | | US$bn | | | US$bn | | | US$bn | | | US$bn | | | US$bn | | |
| At 31 December 2008 | | | | | | | | | | | | | | | |
| 0-6 months | 1.0 | | | 1.3 | | | 2.3 | | | 5.7 | | | 0.4 | | |
| 6-12 months | 0.2 | | | 1.4 | | | 1.6 | | | 0.5 | | | – | | |
| Over 12 months | 10.9 | | | 17.5 | | | 28.4 | | | 7.7 | | | – | | |
| | 1-3 years | 1.8 | | | 5.6 | | | 7.4 | | | 6.2 | | | – | | |
| | 3-5 years | 3.6 | | | 6.6 | | | 10.2 | | | 1.5 | | | – | | |
| | 5+ years | 5.5 | | | 5.3 | | | 10.8 | | | – | | | – | | |
| | |
| | |
| | |
| | |
| | |
| | |
| | | 12.1 | | | 20.2 | | | 32.3 | | | 13.9 | | | 0.4 | | |
| | |
| | |
| | |
| | |
| | |
| | |
| Weighted average life (years) | 5.8 | | | 3.9 | | | 4.6 | | | 1.6 | | | – | | |
| |
| At 31 December 2007 | | | | | | | | | | | | | | | |
| 0-6 months | 0.3 | | | – | | | 0.3 | | | 5.6 | | | 6.9 | | |
| 6-12 months | 0.3 | | | – | | | 0.3 | | | 2.5 | | | 2.2 | | |
| Over 12 months | 21.0 | | | – | | | 21.0 | | | 7.7 | | | 31.6 | | |
| | 1-3 years | 2.5 | | | – | | | 2.5 | | | 4.8 | | | 7.6 | | |
| | 3-5 years | 8.3 | | | – | | | 8.3 | | | 2.2 | | | 13.4 | | |
| | 5+ years | 10.2 | | | – | | | 10.2 | | | 0.7 | | | 10.6 | | |
| | |
| | |
| | |
| | |
| | |
| | |
| | | 21.6 | | | – | | | 21.6 | | | 15.8 | | | 40.7 | | |
| | |
| | |
| | |
| | |
| | |
| | |
| Weighted average life (years) | 5.3 | | | – | | | 5.3 | | | 1.6 | | | 4.0 | | |
177
Back to Contents
| H S B C H O L D I N G S P L C |
| |
| Report of the Directors: Impact of Market Turmoil (continued) |
| | |
| | |
| SPEs > SIVs and conduits |
The revolving credit facilities of multi-seller conduits will predominantly have expected average
lives with maturities of less than 12 months, but typically have a range of 1 to 60 months.
| | | | | | | | | | | | | | | | | | | | | |
| Funding structure | | | | | | | | | | | | | | | | | | | | |
| |
| | | | | | | | | | | | | | Total multi-seller | | | | | |
| | Solitaire | | Other SICs | | Total SICs | | conduits | | Total SIVs |
| |
|
|
| |
|
|
| |
|
|
| |
|
|
| |
|
|
| |
| | | | Provided | | | | Provided | | | | Provided | | | | Provided | | | | Provided | |
| | Total | | by HSBC | | Total | | by HSBC | | Total | | by HSBC | | Total | | by HSBC | | Total | | by HSBC | |
| | US$bn | | US$bn | | US$bn | | US$bn | | US$bn | | US$bn | | US$bn | | US$bn | | US$bn | | US$bn | |
| At 31 December 2008 | | | | | | | | | | | | | | | | | | | | |
| Capital notes | – | | – | | 0.9 | | – | | 0.9 | | – | | – | | – | | – | | – | |
| Drawn liquidityfacility | 2.4 | | 2.4 | | – | | – | | 2.4 | | 2.4 | | – | | – | | – | | – | |
| Commercial paper | 17.2 | | 8.3 | | 10.5 | | 10.4 | | 27.7 | | 18.7 | | 12.9 | | 2.1 | | – | | – | |
| Medium-term notes | – | | – | | 3.4 | | 3.4 | | 3.4 | | 3.4 | | – | | – | | 0.1 | | – | |
| Term repos executed | 0.8 | | 0.8 | | 13.3 | | 13.3 | | 14.1 | | 14.1 | | – | | – | | – | | – | |
| |
| |
| |
| |
| |
| |
| |
| |
| |
| |
| |
| | 20.4 | | 11.5 | | 28.1 | | 27.1 | | 48.5 | | 38.6 | | 12.9 | | 2.1 | | 0.1 | | – | |
| |
| |
| |
| |
| |
| |
| |
| |
| |
| |
| |
| At 31 December 2007 | | | | | | | | | | | | | | | | | | | | |
| Capital notes | – | | – | | – | | – | | – | | – | | – | | – | | 1.3 | | – | |
| Commercial paper | 23.0 | | 7.8 | | – | | – | | 23.0 | | 7.8 | | 14.8 | | 8.6 | | 7.3 | | 2.4 | |
| Medium-term notes | – | | – | | – | | – | | – | | – | | – | | – | | 23.2 | | 5.3 | |
| Term repos executed | – | | – | | – | | – | | – | | – | | – | | – | | 8.7 | | 8.2 | |
| |
| |
| |
| |
| |
| |
| |
| |
| |
| |
| |
| | 23.0 | | 7.8 | | – | | – | | 23.0 | | 7.8 | | 14.8 | | 8.6 | | 40.5 | | 15.9 | |
| |
| |
| |
| |
| |
| |
| |
| |
| |
| |
| |
| | | | | | | | | | |
| Weighted average life of the funding liabilities | | | | | | | | | |
| |
| | | | | | | | Total | | | |
| | | | Other | | Total | | multi-seller | | Total | |
| | Solitaire | | SICs | | SICs | | conduits | | SIVs | |
| | Years | | Years | | Years | | Years | | Years | |
| At 31 December 2008 | | | | | | | | | | |
| CP funding | 0.1 | | 0.2 | | 0.1 | | 0.1 | | n/a | |
| MTN funding | n/a | | 7.3 | | 7.3 | | n/a | | 0.1 | |
| |
| At 31 December 2007 | | | | | | | | | | |
| CP funding | 0.4 | | – | | – | | 0.1 | | 0.5 | |
| MTN funding | – | | – | | – | | – | | 1.1 | |
The majority CP and MTN funding issued by the SIVs was repaid in full during 2008 using the proceeds from the asset sales to the new SICs. The MTNs matured in early 2009.
HSBC’s maximum exposure
| Conduits |
| | |
| Mazarin |
| | |
| • | HSBC is exposed to the par value of Mazarin’sassets through the provision of a liquidityfacility equal to the lesser of the amortised costof issued senior debt and the amortised cost ofnon-defaulted assets. At 31 December 2008,HSBC's exposure amounted to US$15.5 billion(2007: n/a). First loss protection is providedthrough the capital notes issued by Mazarin,which are substantially all held by third parties. |
| | |
| • | In addition, at 31 December 2008, HSBC held1.3 per cent of Mazarin’s capital notes, which |
have a par value of US$17million (2007: n/a), and a carrying amount of US$0.6 million (2007: n/a).
| Barion and Malachite |
| | |
| • | These SICs are term funded by HSBC,consequently HSBC’s primary exposure to themis represented by the amortised cost of the debtrequired to support the non-cash assets of thevehicles. At 31 December 2008 this amountedto US$11.7 billion (2007: n/a). |
| | |
| • | First loss protection is provided through thecapital notes issued by these vehicles, which aresubstantially all held by third parties. |
| | |
| • | In addition, at 31 December 2008, HSBC held3.53 per cent (2007: n/a) of the capital notesissued by these vehicles which have a par valueof US$35 million (2007: n/a), and a carryingamount of US$1.3 million (2007: n/a). |
178
Back to Contents
| Solitaire |
| | |
| • | CP issued by Solitaire benefits from a 100 percent liquidity facility provided by HSBC. Firstloss credit protection, after any transaction-specific credit enhancement (as described onpage 148) and retained reserves, is provided byHSBC in the form of letters of credit with acombined notional value of US$1.2 billion at31 December 2008 (2007: US$1.2 billion). |
| | |
| • | HSBC’s maximum exposure to Solitaire islimited to the amortised cost of non-cashequivalent assets, which represents the risk thatHSBC may be required to fund the vehicle inthe event the debt is redeemed withoutreinvestment from third parties. |
| | |
| • | HSBC’s maximum exposure at 31 December2008 amounted to US$20.4 billion (2007:US$25.7 billion). |
| |
| Multi-seller conduits |
| | |
| • | HSBC provides transaction-specific liquidityfacilities to each of its multi-seller conduits,designed to be drawn in order to ensure therepayment of the CP issued. At 31 December2008, the committed liquidity facilitiesamounted to US$17.1 billion (2007:US$21.2 billion). |
| | |
| • | First loss protection is provided throughtransaction-specific credit enhancements, forexample, over-collateralisation and excessspread. These credit enhancements are providedby the originator of the assets and not by HSBC.In addition, a layer of secondary loss protectionis provided by HSBC in the form ofprogramme-wide enhancement facilities, and at31 December 2008 this amounted toUS$0.6 billion (2007: US$0.7 billion). HSBC’smaximum exposure is equal to the transaction-specific liquidity facilities offered to the multi-seller conduits, as described above. |
| | |
| • | The liquidity facilities are set to support totalcommitments and therefore exceed the fundedassets as at 31 December 2008. |
| | |
| • | In consideration of the significant first lossprotection afforded by the structure, the creditenhancements and a range of indemnitiesprovided by the various obligors, HSBC carriesonly a minimal risk of loss from the programme. |
| |
| Structured investment vehicles |
| | |
| • | At 31 December 2008, Cullinan held MazarinCP amounting to US$0.3 billion. HSBC retains |
| | no marginal exposure through Cullinan toMazarin’s activities over the maximumexposure value stated for Mazarin. |
| | |
| • | Asscher retains only cash and equivalent assetsheld within the HSBC Group. Consequently,HSBC retains no exposure to the vehicle. |
Money market funds
HSBC has established and manages a number of money market funds which provide customers with tailored investment opportunities with a set of narrow and well-defined objectives. In most cases, they are not consolidated in HSBC because the Group’s holdings in them are not of sufficient size to represent the majority of the risks and rewards of ownership.
Investors in money market funds generally have no recourse other than to the assets in the funds, so asset holdings are designed to meet expected fund liabilities. Usually, money market funds are constrained in their operations should the value of their assets and their ratings fall below predetermined thresholds. The risks to HSBC are, therefore, contingent, arising from the reputational damage which could occur if an HSBC-sponsored money market fund was thought to be unable to meet withdrawal requests on a timely basis or in full.
In aggregate, HSBC has established money market funds with total assets of US$102.7 billion at 31 December 2008 (2007: US$91.3 billion).
The main sub-categories of money market funds are:
| • | US$72.0 billion (2007: US$56.8 billion) inConstant Net Asset Value (‘CNAV’) funds,which invest in shorter-dated and highly-ratedmoney market securities with the objective ofproviding investors with a highly liquid andsecure investment; |
| | |
| • | US$2.7 billion (2007: US$11.9 billion) inFrench domicileddynamique(‘dynamic’) fundsand Irish ‘enhanced’ funds, together EnhancedVariable Net Asset Value (‘Enhanced VNAV’)funds, which invest in longer-dated moneymarket securities to provide investors with ahigher return than traditional money marketfunds; and |
| | |
| • | US$28.0 billion (2007: US$22.6 billion) invarious other money market Variable Net AssetValue (‘VNAV’) funds, including fundsdomiciled in Brazil, France, India, Mexico andother countries. |
179
Back to Contents
| H S B C H O L D I N G S P L C |
| |
| Report of the Directors: Impact of Market Turmoil (continued) |
| | |
| | |
| SPEs > SIVs and conduits |
These money market funds invest in diverse portfolios of highly-rated debt instruments, including limited holdings in instruments issued by SIVs. At 31 December 2008, the exposure of these funds to SIVs was US$0.5 billion (2007: US$3.9 billion).
Constant Net Asset Value funds
CNAV funds price their assets on an amortised cost basis, subject to the amortised book value of the portfolio remaining within 50 basis points of its market value. This feature enables CNAV funds to create and liquidate shares in the funds at a constant price. If the amortised value of an asset portfolio were to vary by more than 50 basis points from its market value, the CNAV fund would be required to price its assets at market value, and consequently would no longer be able to create or liquidate shares at a constant price. This is commonly known as ‘breaking the buck’.
Investments made by the CNAV funds in senior notes issued by SIVs continued to deteriorate in valuation terms during 2008. The market values of the underlying assets of those SIVs were affected by market nervousness over possible default levels, exacerbated by severe illiquidity. This reduced the ability of SIVs to sell assets in order to fund maturing liabilities, or issue new senior notes in order to raise cash. As a consequence, the CNAV funds recorded unrealised losses on their SIV holdings.
During 2008, the following actions were taken by HSBC in respect of the CNAV funds to maintain their AAA rating and mitigate any forced sale of liquid assets to meet potential redemptions:
| • | the provision of additional letters of limited indemnity (‘LOI’) to the directors of the CNAV funds that held investments in SIVs, as well as amendments to existing letters of limited indemnity. The total assets under management (‘AUM’) of the funds in respect of which indemnities were provided amounted to US$43.8 billion at 31 December 2008 (2007: US$27.1 billion); and |
| |
| • | in early October 2008, HSBC: |
| |
| | (i) | purchased all the SIV assets that were in enforcement from the CNAV funds, which amounted to US$687 million. Enforcement is the process by which winding down of independent SIVs and repaying secured |
| | | creditors begins. The purchased SIV assets are included within HSBC’s consolidated holdings of ABSs on page 151; |
| |
| | (ii) | made a payment of US$43 million under the letters of limited indemnity as a consequence of HSBC purchasing all the SIV assets that were in enforcement from the CNAV funds; and |
| |
| | (iii) | made capital contributions amounting to US$53 million. |
The following table provides a breakdown of the losses incurred and capital contributions made as a result of the actions taken by HSBC.
| | 2008 | |
| | US$m | |
| | | |
| Payment under LOI | 43 | |
| Capital contribution | 53 | |
| Fair value write down1 | 18 | |
| |
| |
| Total | 114 | |
| |
| |
| 1 | When HSBC purchased the enforced SIV assets from a fund at their amortised cost, an immediate loss was recognised by HSBC on initial recognition. |
As stated on page 173, a reassessment of the required consolidation accounting tests is performed whenever there is a change in the substance of the relationship between HSBC and an SPE. As a result of the events described above, a reassessment of the consolidation tests was, therefore, performed.
When considered together, the actions taken by HSBC demonstrated the Group’s support, within limited parameters, of the CNAV funds in the prevailing market conditions. This support was based on a commercial decision to support the funds at that time, but did not constitute any commitment to undertake further action and the future operations of the funds in question continue to be governed by their respective prospectuses. HSBC concluded that this substantively changed the relationship HSBC had with these CNAV funds, and therefore HSBC consolidated them from 30 September 2008. Although the actions taken by HSBC described above occurred in early October 2008, management’s intention had been agreed prior to this date.
The effect of consolidating the CNAV funds on HSBC’s balance sheet was to include US$43.8 billion of assets and US$43.1 billion of liabilities. HSBC’s exposure to the funds is described below.
180
Back to Contents
Composition of CNAV asset portfolio
| | 2008 | |
| | US$bn | |
| | | |
| ABSs | 0.8 | |
| Certificates of deposit | 13.0 | |
| CP | 18.1 | |
| Floating rate notes | 5.2 | |
| Government agency bonds | 1.9 | |
| Other assets | 4.8 | |
| |
| |
| Total | 43.8 | |
| |
| |
HSBC’s maximum exposure
HSBC’s maximum exposure to consolidated and unconsolidated CNAV funds is represented by HSBC’s investment in the units of each CNAV fund, and by the maximum limit of the letters of limited indemnity provided to the CNAV funds. HSBC’s exposure at 31 December 2008 amounted to US$0.7 billion (2007: US$1.3 billion) and US$58 million (2007: US$41 million) for investment in units within the CNAV funds and letters of limited indemnity, respectively.
Enhanced Variable Net Asset Value funds
Enhanced VNAV funds price their assets on a fair value basis and, consequently, prices may change from one day to the next. These funds pursue an ‘enhanced’ investment strategy, as part of which investors accept greater credit and duration risk in the expectation of higher returns.
As part of action taken in respect of these funds in the second half of 2007, HSBC acquired some of the underlying assets and shares in two of its French dynamic money market funds. HSBC’s aggregate holding in these funds at 31 December 2008 amounted to €0.5 billion (US$0.6 billion) (2007: €0.9 billion; US$1.4 billion). As a result of continued redemptions by unitholders during 2008, HSBC’s holding in the two funds increased to a level at which it obtained the majority of the risks and rewards of ownership, and it therefore consolidated these funds.
HSBC’s maximum exposure
HSBC’s maximum exposure to consolidated and unconsolidated Enhanced VNAV and consolidated and unconsolidated VNAV funds is represented by HSBC’s investment in the units of each fund. HSBC’s maximum exposure at 31 December 2008 amounted to US$0.6 billion (2007:
US$5.9 billion) and US$1.6 billion (2007: US$0.3 billion), for Enhanced VNAV and VNAV funds, respectively.
Total assets of HSBC’s money market funds which are on-balance sheet by balance sheet classification
| | At 31 December | |
| |
| |
| | 2008 | | 2007 | |
| | US$bn | | US$bn | |
| | | | | |
| Cash | 0.3 | | – | |
| Trading assets | 43.3 | | 0.7 | |
| Financial instruments designated at fair value | – | | 5.0 | |
| Other assets | 2.3 | | – | |
| |
| |
| |
| | 45.9 | | 5.7 | |
| |
| |
| |
Non-money market investment funds
HSBC, through its fund management business, has established a large number of non-money market funds to enable customers to invest in a range of assets, typically equities and debt securities. At the launch of a fund HSBC, as fund manager, usually provides a limited amount of initial capital known as ‘seed capital’ to enable the fund to start purchasing assets. These holdings are normally redeemed over time. The majority of these funds are off-balance sheet for HSBC because the Group’s limited economic interest means it does not have the majority of the risks and rewards of ownership. As the non-money market funds explicitly provide investors with tailored risk, the risk to HSBC is restricted to HSBC’s own investments in the funds.
In aggregate, HSBC has established non-money market funds with total assets of US$200.3 billion at 31 December 2008 (2007: US$288.8 billion).
The main sub-categories of non-money market funds are:
| • | US$83.1 billion (2007: US$132.0 billion) inspecialist funds, which comprise fundamentalactive specialists and active quantitativespecialists; |
| | |
| • | US$96.2 billion (2007: US$126.4 billion) inlocal investment management funds, whichinvest in domestic products, primarily for retailand private clients; and |
| | |
| • | US$21.0 billion (2007: US$30.4 billion) inmulti-manager funds, which offer fund of fundsand manager of manager products across adiversified portfolio of assets. |
181
Back to Contents
| H S B C H O L D I N G S P L C |
| |
| Report of the Directors: Impact of Market Turmoil (continued) |
| | |
| | |
| SPEs > SIVs and conduits > Maximum exposures |
Total assets of HSBC’s non-money market funds which are on-balance sheet by balance sheet classification
| | At 31 December | |
| |
| |
| | 2008 | | 2007 | |
| | US$bn | | US$bn | |
| | | | | |
| Cash | 0.4 | | 0.4 | |
| Trading assets | 0.2 | | 0.5 | |
| Financial instruments designated at fair value | 2.3 | | 3.0 | |
| Financial investments | 0.8 | | 0.2 | |
| |
| |
| |
| | 3.7 | | 4.1 | |
| |
| |
| |
HSBC’s maximum exposure
HSBC’s maximum exposure to consolidated and unconsolidated non-money market funds is represented by HSBC’s investment in the units of each respective fund. HSBC’s exposure at 31 December 2008 amounted to US$4.4 billion (2007: US$6.0 billion).
Securitisations
HSBC uses SPEs to securitise customer loans and advances that it has originated, mainly in order to diversify its sources of funding for asset origination and for capital efficiency purposes. In such cases, the loans and advances are transferred by HSBC to the SPEs for cash, and the SPEs issue debt securities to investors to fund the cash purchases. Credit enhancements to the underlying assets may be used to obtain investment grade ratings on the senior debt issued by the SPEs. Except in one instance, these securitisations are all consolidated by HSBC. HSBC has also established securitisation programmes in the US and Germany where loans originated by third parties are securitised. Most of these vehicles are not consolidated by HSBC as it is not exposed to the majority of risks and rewards of ownership in the SPEs. In 2008, demand for the securitised products remained low.
In addition, HSBC uses SPEs to mitigate the capital absorbed by some of the customer loans and advances it has originated. Credit derivatives are used to transfer the credit risk associated with such customer loans and advances to an SPE, using securitisations commonly known as synthetic securitisations. These SPEs are consolidated when HSBC is exposed to the majority of risks and rewards of ownership.
Total assets of HSBC’s securitisations which are on-balance sheet, by balance sheet classification
| | At 31 December | |
| |
| |
| | 2008 | | 2007 | |
| | US$bn | | US$bn | |
| | | | | |
| Trading assets | 1.3 | | 3.6 | |
| Loans and advances to customers | 50.8 | | 69.6 | |
| Financial investments | – | | 0.1 | |
| Other assets | 1.1 | | 1.3 | |
| Derivatives | 1.4 | | 0.1 | |
| |
| |
| |
| | 54.6 | | 74.7 | |
| |
| |
| |
These assets include US$1.3 billion (2007: US$3.6 billion) of exposure to US sub-prime mortgages.
Total assets of HSBC’s securitisations which are off-balance sheet
| | 2008 | | 2007 | |
| | US$bn | | US$bn | |
| | | | | |
| HSBC originated assets | 0.6 | | 0.9 | |
Non-HSBC originated assets –term securitisationprogrammes | 13.5 | | 16.0 | |
| |
| |
| |
| | 14.1 | | 16.9 | |
| |
| |
| |
HSBC’s financial investments in off-balance sheet securitisations at 31 December 2008 amounted to US$0.2 billion (2007: US$0.4 billion). These assets include assets which are classified as available-for-sale securities and measured at fair value, and have been securitised by HSBC under arrangements by which HSBC retains a continuing involvement in them. Further details are provided in Note 20 on the Financial Statements.
HSBC’s maximum exposure
The maximum exposure is the aggregate of any holdings of notes issued by these vehicles and the reserve account positions intended to provide credit support under certain pre-defined circumstances to senior note holders. HSBC is not obligated to provide further funding. At 31 December 2008, HSBC’s maximum exposure to consolidated and unconsolidated securitisations amounted to US$27.2 billion (2007: US$31 billion).
Other
HSBC also establishes SPEs in the normal course of business for a number of purposes, for example, structured credit transactions for customers to provide finance to public and private sector infrastructure projects, and for asset and structured finance (‘ASF’) transactions.
182
Back to Contents
Structured credit transactions
HSBC provides structured credit transactions to third-party professional and institutional investors who wish to obtain exposure, sometimes on a leveraged basis, to a reference portfolio of debt instruments. In such structures, the investor receives returns referenced to the underlying portfolio by purchasing notes issued by the SPEs. HSBC enters into contracts with the SPEs, generally in the form of derivatives, in order to pass the required risks and rewards of the reference portfolios to the SPEs. HSBC’s risk in relation to the derivative contracts with the SPEs is managed within HSBC’s trading market risk framework (see Market Risk on page 241). In certain transactions HSBC is exposed to risk often referred to as gap risk. Gap risk typically arises in transactions where the aggregate potential claims against the SPE by HSBC pursuant to one or more derivatives could be greater than the value of the collateral held by the SPE and securing such derivatives. HSBC often mitigates such gap risk by incorporating in the SPE transaction features which allow for deleveraging, a managed liquidation of the portfolio, or other mechanisms. Following the inclusion of such risk reduction mechanisms, HSBC has, in certain circumstances, retained all or a portion of the underlying exposure in the transaction. When this retained exposure represents ABSs, it has been included in ‘Nature and extent of HSBC’s exposures’ on page 150.
Often, transactions are facilitated through SPEs to enable the notes issued to the investors to be rated. The SPEs are not consolidated by HSBC because the investors bear substantially all the risks and rewards of ownership through the notes.
The total fair value of liabilities (notes issued and derivatives) in structured credit transaction SPEs was US$21.2 billion at 31 December 2008 (2007: US$23.6 billion). These amounts included US$0.3 billion (2007: US$0.1 billion) in SPEs that were consolidated by HSBC.
Other uses of SPEs
HSBC participates in Public-Private Partnerships to provide financial support for infrastructure projects initiated by government authorities. The funding structure is commonly achieved through the use of SPEs. HSBC consolidates these SPEs when it is exposed to the majority of risks and rewards of the vehicles.
HSBC’s ASF business specialises in leasing and arranging finance for aircraft and other physical assets, which it is customary to ring-fence through the use of SPEs, and in structured loans and deposits, where SPEs introduce cost efficiencies. HSBC consolidates these SPEs when the substance of the relationship indicates that HSBC controls the SPE.
HSBC’s risks and rewards of ownership in these SPEs are in respect of its on-balance sheet assets and liabilities.
HSBC’s maximum exposures to SPEs
The following tables show the total assets of the various types of SPEs, and the amount and types of funding provided by HSBC to these SPEs. The tables also show HSBC’s maximum exposure to the SPEs and, within that exposure, the types of liquidity and credit enhancements provided by HSBC. The maximum exposures to SPEs represent HSBC’s maximum possible risk exposure that could occur as a result of the Group’s arrangements and commitments to SPEs. The maximum amounts are contingent in nature, and may arise as a result of drawdowns under liquidity facilities, where these have been provided, and any other funding commitments, or as a result of any loss protection provided by HSBC to the SPEs. The conditions under which such exposure might arise differ depending on the nature of each SPE and HSBC’s involvement with it. The aggregation of such maximum exposures across the different forms of SPEs results in a theoretical total maximum exposure number. The elements of the maximum exposure to an SPE are not necessarily additive and a detailed explanation of how maximum exposures are determined is provided under each category of SPE.
183
Back to Contents
| H S B C H O L D I N G S P L C |
| |
| Report of the Directors: Impact of Market Turmoil(continued) |
| | |
| | |
| SPEs > SIVs and conduits > Maximum exposures |
HSBC’s maximum exposure to consolidated SPEs affected by the recent market turmoil
| | | | | | | | | | | | | | Non-money market funds | | | | | | | |
| | | | Securities | | | | | | Enhanced | | | |
|
|
| | | | | | | |
| | | | investment | | Multi-seller | | CNAV | | VNAV | | VNAV | | Specialist | | Local | | Securit- | | | | | |
| | SIVs | | conduits | 1 | conduits | | funds | | funds | | funds | | funds | | funds | 2 | isations | 3 | Other | | Total | |
| | US$bn | | US$bn | | US$bn | | US$bn | | US$bn | | US$bn | | US$bn | | US$bn | | US$bn | | US$bn | | US$bn | |
| At 31 December 2008 | | | | | | | | | | | | | | | | | | | | | | |
| Total assets | 0.4 | | 32.3 | | 13.9 | | 43.8 | | 0.7 | | 1.4 | | 0.6 | | 3.1 | | 54.6 | | 0.3 | | 151.1 | |
| Direct lending4 | – | | – | | – | | – | | – | | – | | – | | – | | 1.3 | | – | | 1.3 | |
| ABSs4 | – | | 25.8 | | – | | 0.8 | | – | | – | | – | | – | | – | | – | | 26.6 | |
| Other | 0.4 | | 6.5 | | 13.9 | | 43.0 | | 0.7 | | 1.4 | | 0.6 | | 3.1 | | 53.3 | | 0.3 | | 123.2 | |
| Funding provided by HSBC | – | | 38.6 | | 2.1 | | 0.7 | | 0.6 | | 1.3 | | 0.2 | | 3.2 | | 0.7 | | 0.2 | | 47.6 | |
| CP | – | | 18.7 | | 2.1 | | – | | – | | – | | – | | – | | – | | – | | 20.8 | |
| MTNs | – | | 3.4 | | – | | – | | – | | – | | – | | – | | 0.4 | | 0.2 | | 4.0 | |
| Junior notes | – | | – | | – | | – | | – | | – | | – | | – | | 0.3 | | – | | 0.3 | |
| Term repos executed | – | | 14.1 | | – | | – | | – | | – | | – | | – | | – | | – | | 14.1 | |
| Investments in funds | – | | – | | – | | 0.7 | | 0.6 | | 1.3 | | 0.2 | | 3.2 | | – | | – | | 6.0 | |
| Drawn liquidity facility | – | | 2.4 | | – | | – | | – | | – | | – | | – | | – | | – | | 2.4 | |
| Capital notes5 | – | | – | | – | | – | | – | | – | | – | | – | | – | | – | | – | |
| Total maximum exposure to consolidated SPEs | – | | 47.6 | | 17.1 | | 0.8 | | 0.6 | | 1.3 | | 0.2 | | 3.2 | | 27.0 | | 0.2 | | 98.0 | |
| Liquidity and credit enhancements | | | | | | | | | | | | | | | | | | | | | | |
| Deal-specific liquidity facilities | – | | – | | 17.1 | | – | | – | | – | | – | | – | | – | | – | | 17.1 | |
| Indemnities | – | | – | | – | | 0.1 | | – | | – | | – | | – | | – | | – | | 0.1 | |
| Programme-wide liquidity facilities | – | | 34.8 | | – | | – | | – | | – | | – | | – | | – | | – | | 34.8 | |
| Programme-wide limited credit enhancements | – | | 1.2 | | 0.6 | | – | | – | | – | | – | | – | | – | | – | | 1.8 | |
| Other liquidity and credit enhancements | – | | – | | – | | – | | – | | – | | – | | – | | 0.1 | | – | | 0.1 | |
184
Back to Contents
| | | | | | | | | | Non-money market funds | | | | | | | |
| | | | Securities | | | | | |
|
|
| | | | | | | |
| | | | investment | | Multi-seller | | Enhanced | | Specialist | | Local | | Securit- | | | | | |
| | SIVs | | conduits | 1 | conduits | | VNAV funds | | funds | | funds | 2,6 | isations | 3 | Other | | Total | |
| | US$bn | | US$bn | | US$bn | | US$bn | | US$bn | | US$bn | | US$bn | | US$bn | | US$bn | |
| At 31 December 2007 | | | | | | | | | | | | | | | | | | |
| Total assets | 40.7 | | 21.6 | | 15.8 | | 5.7 | | 1.0 | | 3.1 | | 74.7 | | 0.1 | | 162.7 | |
| Direct lending4 | – | | – | | – | | – | | – | | – | | 3.6 | | – | | 3.6 | |
| ABSs4 | 32.1 | | 21.0 | | – | | – | | – | | – | | – | | – | | 53.1 | |
| Other | 8.6 | | 0.6 | | 15.8 | | 5.7 | | 1.0 | | 3.1 | | 71.1 | | 0.1 | | 106.0 | |
| Funding provided by HSBC | 15.9 | | 7.8 | | 8.6 | | 4.6 | | 0.4 | | 2.8 | | 1.0 | | – | | 41.1 | |
| CP | 2.4 | | 7.8 | | 8.6 | | – | | – | | – | | – | | – | | 18.8 | |
| MTNs | 5.3 | | – | | – | | – | | – | | – | | 0.3 | | – | | 5.6 | |
| Junior notes | – | | – | | – | | – | | – | | – | | 0.7 | | – | | 0.7 | |
| Term repos executed | 8.2 | | – | | – | | – | | – | | – | | – | | – | | 8.2 | |
| Investments in funds | – | | – | | – | | 4.6 | | 0.4 | | 2.8 | | – | | – | | 7.8 | |
| Total maximum exposure to consolidated SPEs | 40.0 | | 25.7 | | 21.2 | | 4.6 | | 0.4 | | 2.8 | | 30.6 | | 0.1 | | 125.4 | |
| | | | | | | | | | | | | | | | | | | |
| Liquidity and credit enhancements | | | | | | | | | | | | | | | | | | |
| Deal-specific liquidity facilities | – | | – | | 21.2 | | – | | – | | – | | – | | – | | 21.2 | |
| Programme-wide liquidity facilities | 0.8 | | 25.7 | | – | | – | | – | | – | | – | | – | | 26.5 | |
| Programme-wide limited credit enhancements | – | | 0.2 | | 0.7 | | – | | – | | – | | – | | – | | 0.9 | |
| Other liquidity and credit enhancements | – | | – | | – | | – | | – | | – | | 0.2 | | – | | 0.2 | |
| | |
| 1 | The securities investment conduits include Mazarin, Barion, Malachite and Solitaire. |
| 2 | Local investment management funds. |
| 3 | Also includes consolidated SPEs that hold mortgage loans held at fair value. |
| 4 | These assets only include those measured at fair value. For details on the geographical origin of the mortgage loans held at fair value and ABSs, including those represented by MBSs and CDOs held in consolidated SIVs and securities investment conduits, see ‘Nature and extent of HSBC’s exposures’ on page 150. The geographical origin of the loans and receivables held by the multi-seller conduits is disclosed on page 177. |
| 5 | The carrying amount of HSBC’s holding of capital notes in the securities investment conduits amounted to US$1.9 million (2007: n/a) with a par value of US$52 million (2007: n/a). |
| 6 | Total assets for 2007 have been restated as a result of reclassifying assets amounting to US$17 billion from VNAV to local funds. |
185
Back to Contents
| H S B C H O L D I N G S P L C |
| |
| Report of the Directors: Impact of Market Turmoil(continued) |
| |
| | |
| SPEs > SIVs and conduits >Maximum exposures / 3rd party SPEs // Other off-balance sheet arrangements |
HSBC’s maximum exposure to unconsolidated SPEs
| | Securitisations1 | | | Money market funds1 | | | Non-money market funds1 | | | | | | | | |
| |
| | |
| | |
| | | | | | | | |
| | HSBC | | | Non-HSBC | | | | | | Enhanced | | | | | | | | | | | | Multi- | | | | | | | | |
| | originated | | | originated | | | CNAV | | | VNAV | | | VNAV | 4 | | Specialist | | | Local | | | manager | | | | | | | | |
| | assets | | | assets | 2 | | funds | | | funds | | | funds | | | funds | | | funds | 3,4 | | funds | | | Other | | | Total | | |
| | US$bn | | | US$bn | | | US$bn | | | US$bn | | | US$bn | | | US$bn | | | US$bn | | | US$bn | | | US$bn | | | US$bn | | |
| At 31 December 2008 | | | | | | | | | | | | | | | | | | | | | | | | | | | | | | |
| Total assets | 0.6 | | | 13.5 | | | 28.2 | | | 2.0 | | | 26.6 | | | 82.5 | | | 93.1 | | | 21.0 | | | 20.9 | | | 288.4 | | |
| Funding provided by HSBC | – | | | 0.2 | | | – | | | – | | | 0.3 | | | – | | | 1.0 | | | – | | | 8.3 | | | 9.8 | | |
| MTNs | – | | | 0.2 | | | – | | | – | | | – | | | – | | | – | | | – | | | 8.3 | | | 8.5 | | |
| Investments in funds | – | | | – | | | – | | | – | | | 0.3 | | | – | | | 1.0 | | | – | | | – | | | 1.3 | | |
| Total maximum exposure to unconsolidated SPEs | – | | | 0.2 | | | – | | | – | | | 0.3 | | | – | | | 1.0 | | | – | | | 4.1 | | | 5.6 | | |
| At 31 December 2007 | | | | | | | | | | | | | | | | | | | | | | | | | | | | | | |
| Total assets | 0.9 | | | 16.0 | | | 56.8 | | | 6.2 | | | 22.6 | | | 131.0 | | | 123.3 | | | 30.4 | | | 23.5 | | | 410.7 | | |
| Funding provided by HSBC | – | | | 0.4 | | | 1.3 | | | 1.3 | | | 0.3 | | | 0.1 | | | 2.6 | | | 0.1 | | | 7.2 | | | 13.3 | | |
| MTNs | – | | | 0.3 | | | – | | | – | | | – | | | – | | | – | | | – | | | 7.2 | | | 7.5 | | |
| Mezzanine notes | – | | | 0.1 | | | – | | | – | | | – | | | – | | | – | | | – | | | – | | | 0.1 | | |
| Investments in funds | – | | | – | | | 1.3 | | | 1.3 | | | 0.3 | | | 0.1 | | | 2.6 | | | 0.1 | | | – | | | 5.7 | | |
| Total maximum exposure to unconsolidated SPEs | – | | | 0.4 | | | 1.3 | | | 1.3 | | | 0.3 | | | 0.1 | | | 2.6 | | | 0.1 | | | 4.5 | | | 10.6 | | |
| 1 | HSBC’s financial investments in off-balance sheet money market funds and non-money market funds have been classified as available-for-sale securities, and measured at fair value. HSBC’s financial investments in off-balance sheet securitisations have been classified as trading assets and available-for-sale securities, and measured at fair value. |
| 2 | In the US, HSBC has established securitisation programmes where term-funded SPEs are used to securitise third-party originated mortgages, mainly sub-prime and Alt-A residential mortgages. The majority of these SPEs are not consolidated by HSBC as it is not exposed to the majority of the risk and rewards of ownership in the SPEs. No liquidity facility has been provided by HSBC. |
| 3 | Local investment management funds. |
| 4 | Total assets for 2007 have been restated as a result of reclassifying assets amounting to US$17 billion from VNAV funds to local funds. |
186
Back to Contents
Third-party sponsored SPEs
Through standby liquidity facility commitments, HSBC has exposure to third-party sponsored SIVs, conduits and securitisations under normal banking arrangements on standard market terms. These exposures are quantified below.
HSBC’s commitments under liquidity facilities to third-party SIVs, conduits and securitisations
| | Commit- | | | |
| | ments | | Drawn | |
| | US$bn | | US$bn | |
| At 31 December 2008 | | | | |
| Third-party SIVs | – | | – | |
| Third-party conduits | 1.1 | | 0.1 | |
| Third-party securitisations | 0.6 | | 0.1 | |
| |
| |
| |
| | 1.7 | | 0.2 | |
| |
| |
| |
| At 31 December 2007 | | | | |
| Third-party SIVs | 0.3 | | – | |
| Third-party conduits | 4.4 | | 0.4 | |
| Third-party securitisations | 0.5 | | – | |
| |
| |
| |
| | 5.2 | | 0.4 | |
| |
| |
| |
Other exposures to third-party SIVs, conduits and securitisations where a liquidity facility has been provided
| | At 31 December | |
| |
| |
| | 2008 | | 2007 | |
| | US$bn | | US$bn | |
| | | | | |
| Derivative assets | – | | 0.2 | |
| |
| |
| |
Other off-balance sheet arrangements and commitments |
|
Financial guarantees, letters of credit and similar undertakings
Note 40 on the Financial Statements describes various types of guarantees and discloses the maximum potential future payments under such arrangements. Credit risk associated with all forms of guarantees is assessed in the same manner as for on-balance sheet credit advances and, where necessary, provisions for assessed impairment are included in ‘Other provisions’.
Commitments to lend
Undrawn credit lines are disclosed in Note 40 on the Financial Statements. The majority by value of undrawn credit lines arise from ‘open to buy’ lines on personal credit cards, advised overdraft limits and other pre-approved loan products, and mortgage offers awaiting customer acceptance. HSBC generally has the right to change or terminate any conditions of a personal customer’s overdraft, credit card or other credit line upon notification to the customer. In respect of corporate commitments to lend, in most cases HSBC’s position will be protected through restrictions on access to funding in the event of material adverse change.
Leveraged finance transactions
Loan commitments in respect of leveraged finance transactions are accounted for as derivatives where it is HSBC’s intention to sell the loan after origination. Further information is provided on page 160.
187
Back to Contents
| H S B C H O L D I N G S P L C |
| |
| Report of the Directors: Risk |
| |
| | |
| Regulation and supervision |
| 1 | Unaudited. |
| 2 | Audited. |
| 3 | Audited where indicated. |
| Regulation and supervision |
|
| (Unaudited) |
With listings of its ordinary shares in London, Hong Kong, New York, Paris and Bermuda, HSBC Holdings complies with the relevant requirements for listing and trading on each of these exchanges. In the UK, these are the Listing Rules of the Financial Services Authority (‘FSA’); in Hong Kong, The Rules Governing the Listing of Securities on The Stock Exchange of Hong Kong Limited (‘HKSE’); in the US, where the shares are traded in the form of ADSs, HSBC Holdings’ shares are registered with the US Securities and Exchange Commission (‘SEC’). As a consequence of its US listing, HSBC Holdings is also subject to the reporting and other requirements of the US Securities Act of 1933, as amended, the Securities Exchange Act of 1934, as amended, and the New York Stock Exchange’s (‘NYSE’) Listed Company Manual, in each case as applied to foreign private issuers. In France and Bermuda, HSBC Holdings is subject to the listing rules of Euronext, Paris and the Bermuda Stock Exchange respectively, applicable to companies with secondary listings.
A statement of HSBC’s compliance with the code provisions of the Combined Code on Corporate Governance issued by the Financial Reporting Council and with the Code on Corporate Governance Practices in Appendix 14 to the Rules Governing the Listing of Securities on The Stock Exchange of Hong Kong Limited is set out in the ‘Report of the Directors: Governance’ on page 281.
HSBC’s operations throughout the world are regulated and supervised by approximately 540 different central banks and regulatory authorities in those jurisdictions in which HSBC has offices, branches or subsidiaries. These authorities impose a variety of requirements and controls designed to improve financial stability and the transparency of financial markets and their contribution to economic growth. These regulations and controls cover,inter alia, capital adequacy, depositor protection, market liquidity, governance standards, customer protection (for example, fair lending practices, product design, and marketing and documentation standards), and social responsibility obligations (for example, anti-money laundering and anti-terrorist financing measures). In addition, a number of countries in which HSBC operates impose rules that affect, or place limitations on, foreign or foreign-owned or controlled banks and financial institutions. The rules include restrictions on the opening of local offices, branches or subsidiaries and the types of banking and non-banking activities that may be conducted by those local offices, branches or subsidiaries;
188
Back to Contents
restrictions on the acquisition of local banks or regulations requiring a specified percentage of local ownership; and restrictions on investment and other financial flows entering or leaving the country. The supervisory and regulatory regimes of the countries where HSBC operates will determine to some degree HSBC’s ability to expand into new markets, the services and products that HSBC will be able to offer in those markets and how HSBC structures specific operations. As aresult of therecent government interventions in response to recent global economic conditions – it is widely anticipated that there will be a substantial increase in government regulation and supervision of the financial services industry, including the imposition of higher capital requirements, heightened disclosure standards and restrictions on certain types of transaction structures.
In June 2006, the Basel Committee on Banking Supervision introduced a new capital adequacy framework to replace the 1988 Basel Capital Accord in the form of a new Accord (commonly known as ‘Basel II’). Details of the way in which Basel II has been implemented by the FSA, the timing of the change and the impact on HSBC are set out on page 275.
The FSA supervises HSBC on a consolidated basis. In addition, each operating bank, finance company or insurance operation within HSBC is regulated by local supervisors. The primary regulatory authorities are those in the UK, Hong Kong and the US, the Group’s principal areas of operation.
UK regulation and supervision
UK banking and financial services institutions are subject to multiple regulations. The primary UK statute is the Financial Services and Markets Act 2000 (‘FSMA’). Additionally, data privacy is regulated by the Data Protection Act 1998. Other UK financial services legislation is derived from EU directives relating to banking, securities, insurance, investments and sales of personal financial services.
In addition to its role as HSBC’s lead regulator, the FSA is responsible for authorising and supervising all HSBC’s businesses in the UK which require authorisation under FSMA. These include deposit-taking, retail banking, life and general insurance, pensions, investments, mortgages, custody and share dealing businesses, and treasury and capital markets activity. HSBC Bank plc is HSBC’s principal authorised institution in the UK.
FSA rules establish the minimum criteria for authorisation for banks and financial services
businesses in the UK. They also set out reporting (and, as applicable, consent) requirements with regard to large individual exposures and large exposures to related borrowers. In its capacity as supervisor of HSBC on a consolidated basis, the FSA receives information on the capital adequacy of, and sets requirements for, HSBC as a whole. Further details on capital measurement are included in ‘Capital management and allocation’ on pages 274 to 280. The FSA’s approach to capital requirements for UK insurers is to require minimum capital to be calculated on two bases. First, firms must calculate their liabilities on a prudent basis and add a statutory solvency margin (‘pillar 1’). Secondly, firms must calculate their liabilities on a realistic basis then add to this their own calculation of risk-based capital. The sum of realistic reserves and risk-based capital (‘pillar 2’) is agreed with the FSA. Insurers are required to maintain capital equal to the higher of pillars 1 and 2. The FSA has the right to object, on prudential grounds, to persons who hold, or intend to hold, 10 per cent or more of the voting power of a financial institution.
The regulatory framework of the UK financial services system has traditionally been based on co-operation between the FSA and authorised institutions. The FSA monitors authorised institutions through ongoing supervision and the review of routine andad hoc reports relating to financial and prudential matters. The FSA may periodically obtain independent reports, usually from the auditors of the authorised institution, as to the adequacy of internal control procedures and systems as well as procedures and systems governing records and accounting. The FSA meets regularly with HSBC’s senior executives to discuss HSBC’s adherence to the FSA’s prudential guidelines. They also regularly discuss fundamental matters relating to HSBC’s business in the UK and internationally, including areas such as strategic and operating plans, risk control, loan portfolio composition and organisational changes, including succession planning. In light of current conditions, HSBC has experienced an increased level of ongoing interaction with the FSA.
Hong Kong regulation and supervision
Banking in Hong Kong is subject to the provisions of the Banking Ordinance and to the powers, functions and duties ascribed by the Banking Ordinance to the Hong Kong Monetary Authority (the ‘HKMA’). The principal function of the HKMA is to promote the general stability and effective working of the banking system in Hong Kong. The HKMA is responsible for supervising compliance
189
Back to Contents
| H S B C H O L D I N G S P L C |
| |
| Report of the Directors: Risk(continued) |
| | |
| | |
| Regulation and supervision / Risk management > Introduction / Governance and ownership |
with the provisions of the Banking Ordinance. The Banking Ordinance gives power to the Chief Executive of Hong Kong to give directions to the HKMA and the Financial Secretary with respect to the exercise of their respective functions under the Banking Ordinance.
The HKMA has responsibility for authorising banks, and has discretion to attach conditions to its authorisation. The HKMA requires that banks or their holding companies file regular prudential returns, and holds regular discussions with the management of the banks to review their operations. The HKMA may also conduct ‘on-site’ examinations of banks and, in the case of banks incorporated in Hong Kong, of any local and overseas branches and subsidiaries. The HKMA requires all authorised institutions to have adequate systems of internal control and requires the institutions’ external auditors, upon request, to report on those systems and other matters such as the accuracy of information provided to the HKMA. In addition, the HKMA may from time to time conduct tripartite discussions with banks and their external auditors.
The HKMA has the power to divest controlling interests in a bank from persons if they are no longer deemed to be fit and proper, if they may otherwise threaten the interests of depositors or potential depositors, or if they have contravened any conditions specified by the HKMA. The HKMA may revoke authorisation in the event of an institution’s non-compliance with the provisions of the Banking Ordinance. These provisions require, among other things, the furnishing of accurate reports.
The HKMA implemented Basel II with effect from 1 January 2007 for all Authorised Institutions incorporated in Hong Kong.
The marketing of, dealing in and provision of advice and asset management services in relation to securities in Hong Kong are subject to the provisions of the Securities and Futures Ordinance of Hong Kong (‘Securities and Futures Ordinance’). Entities engaging in activities regulated by the Securities and Futures Ordinance are required to be licensed. The HKMA is the primary regulator for banks involved in the securities business, while the Securities and Futures Commission is the regulator for non-banking entities.
US regulation and supervision
HSBC is subject to extensive federal and state supervision and regulation in the US. Banking laws and regulations of the Board of Governors of the Federal Reserve System (the ‘Federal Reserve Board’), the Office of the Comptroller of the
Currency (the ‘OCC’) and the Federal Deposit Insurance Corporation (the ‘FDIC’) govern many aspects of HSBC’s US business.
HSBC and its US operations are subject to supervision, regulation and examination by the Federal Reserve Board because HSBC is a ‘bank holding company’ under the US Bank Holding Company Act of 1956 (‘BHCA’), as a result of its control of HSBC Bank USA, N.A., Mclean, Virginia (‘HBUS’); HSBC Trust Company (Delaware), N.A., Wilmington, Delaware (‘HTCD’); and Wells Fargo Trade Bank, N.A., San Francisco, California (‘WFTB’). HSBC North America Holdings Inc. (‘HNAH’), formed to hold HSBC’s US and Canadian operations is also a ‘bank holding company’. Both HSBC and HNAH are registered as financial holding companies (‘FHC’s) under the BHCA, and, accordingly, may affiliate with securities firms and insurance companies and engage in other activities that are financial in nature or incidental or complementary to activities that are financial in nature. The ability of HSBC and HNAH to engage in expanded financial activities as FHCs depends upon HSBC and HNAH continuing to meet certain criteria set forth in the BHCA, including requirements that their US depository institution subsidiaries be ‘well capitalised’ and ‘well managed’, and that such institutions have achieved at least a satisfactory record in meeting community credit needs during their most recent examinations pursuant to the Community Reinvestment Act.
In general, under the BHCA, an FHC would be required, upon notice by the Federal Reserve Board, to enter into an agreement with the Federal Reserve Board to correct any failure to comply with the requirements to maintain FHC status. Until such deficiencies are corrected, the Federal Reserve Board may impose limitations on the US activities of an FHC and depository institutions under its control. If such deficiencies are not corrected, the Federal Reserve Board may require an FHC to divest its control of any subsidiary depository institution or to desist from certain financial activities in the US.
The three US banks, HBUS, HTCD, and WFTB are subject to regulation and examination primarily by the OCC, secondarily by the FDIC, and by the Federal Reserve Board. Banking laws and regulations restrict many aspects of their operations and administration, including the establishment and maintenance of branch offices, capital and reserve requirements, deposits and borrowings, investment and lending activities, payment of dividends and numerous other matters.
In December 2007, US regulators published a
190
Back to Contents
final rule regarding Risk-Based Capital Standards: Advanced Capital Adequacy Framework – Basel II. This final rule represents the US adoption of the Basel II International Capital Accord (‘Basel II’). The final rule became effective on 1 April 2008, and requires large bank holding companies, including HNAH, to adopt its provisions no later than 1 April 2011. HNAH has established comprehensive Basel II implementation project teams comprised of risk management specialists representing all risk disciplines. In addition, US banking authorities have adopted ‘leverage’ capital requirements that generally require US banks and bank holding companies to maintain a minimum amount of capital in relation to their balance sheet assets (measured on a non-risk-weighted basis).
HBUS and HTCD are subject to risk-based assessments from the FDIC, which insures deposits generally to a maximum of US$100,000 per domestic depositor. In October 2008, the FDIC raised the maximum amount of insured deposits to US$250,000 per domestic depositor until 31 December 2009, after which the limit will return to US$100,000. The FDIC bases assessments on supervisory ratings, financial ratios and long-term debt issuer ratings, with those banks in the highest rated categories paying lower assessments.
In October 2008, the FDIC announced its Temporary Liquidity Guarantee Programme (‘TLGP’), under which the FDIC will guarantee (i) newly-issued senior unsecured debt issued by eligible, participating institutions, and (ii) certain non-interest bearing transaction accounts. HNAH and its subsidiary banks and bank holding companies elected to participate in both components of the TLGP, as applicable.
HSBC’s US consumer finance operations are subject to extensive state-by-state regulation in the US, and to laws relating to consumer protection (both in general, and in respect of sub-prime lending operations, which have been subject to enhanced regulatory scrutiny); discrimination in extending credit; use of credit reports; privacy matters; disclosure of credit terms; and correction of billing errors. They also are subject to regulations and legislation that limit operations in certain jurisdictions.
| Risk management |
|
| (Unaudited) |
Introduction
All HSBC’s activities involve, to varying degrees, the analysis, evaluation, acceptance and management of risks or combinations of risks. The most important
categories of risk that the Group is exposed to are credit risk (including cross-border country risk), market risk, operational risks in various forms, liquidity risk, insurance risk, pension risk, residual value risk, reputational risk and sustainability (environmental and social) risks. Market risk includes foreign exchange, interest rate and equity price risks.
The management of these various risk categories is discussed below. Insurance risk is managed by the Group’s insurance businesses together with their own credit, liquidity and market risk functions, distinct from those covering the rest of HSBC due to the different nature of their activities. They remain under risk oversight at Group level.
The risk profiles of HSBC Group and of individual operating entities change constantly under the influence of a wide range of factors. The risk management framework established by the Group fosters the continuous monitoring of the risk environment and an integrated evaluation of risks and their interdependencies.
Risk governance and ownership
A well-established risk governance and ownership structure ensures oversight of, and accountability for, the effective management of risk at Group, regional, customer group and operating entity levels.
The Board approves the Group’s risk appetite framework, plans and performance targets for the Group and its principal operating subsidiaries, the appointment of senior officers, the delegation of authorities for credit and other risks and the establishment of effective control procedures. Under authority delegated by the Board, the Group Management Board (‘GMB’) through its separately convened Risk Management Meeting (‘RMM’) formulates high-level Group risk management policy, exercises delegated risk authorities and oversees the implementation of risk appetite and controls. It monitors all categories of risk, receives reports on actual performance and emerging issues, determines action to be taken and reviews the efficacy of HSBC’s risk management framework.
Primary responsibility for managing risk at operating entity level lies with the respective boards and Chief Executive Officers, as custodians of their balance sheets. In their oversight and stewardship of risk management at Group level, GMB and RMM are supported by a dedicated Global Risk function headed by the Group Chief Risk Officer (‘GCRO’), who is a member of both bodies and reports to the Group Finance Director within the integrated Finance and
191
Back to Contents
| H S B C H O L D I N G S P L C |
| |
| Report of the Directors: Risk(continued) |
| | |
| | |
| Regulation and supervision / Risk management > Introduction / Governance and ownership |
Risk function, which the Group Finance Director represents on the Board.
Global Risk has functional responsibility for the principal financial risk types, namely retail and wholesale credit, market, operational, security and fraud risks. For these it establishes Group policy, exercises Group-wide oversight and provides reporting and analysis of portfolio composition on a global and a regional basis to senior management. Accountability and consistent control across the Global Risk function is provided through the Global Risk Management Board, chaired by the GCRO, the membership of which includes the Chief Risk Officers of HSBC’s regions and the heads of risk disciplines within GMO. Global Risk also co-ordinates the continued development of the Group’s risk appetite, economic capital and stress testing frameworks. In addition, the GCRO is a member of the Group Portfolio Oversight Committee, chaired by the Group Treasurer, which governs the Group’s portfolio management activities for the wholesale business sector.
Risk appetite
HSBC’s risk appetite framework describes the quantum and types of risk that HSBC is prepared to take in executing its strategy. It is central to an integrated approach to risk, capital and business management and supports the Group in achieving its return on equity objectives, as well as being a key element in meeting the Group’s obligations under pillar 2 of Basel II.
The formulation of risk appetite considers HSBC’s risk capacity, its financial position, the strength of its core earnings and the resilience of its reputation and brand. It is expressed both qualitatively, describing which risks are taken and why, and quantitatively. HSBC senior management attaches quantitative metrics to individual risk types to ensure that:
| | • | underlying business activity may be guided andcontrolled, so that it continues to be aligned tothe risk appetite framework; |
| | | |
| | • | key assumptions underpinning risk appetite canbe monitored and, as necessary, adjustedthrough subsequent business planning cycles;and |
| | | |
| | • | business decisions anticipated to be necessary tomitigate risk are flagged and acted uponpromptly. |
The risk appetite framework, governed by the Board and overseen in its implementation on an ongoing basis by GMB and RMM, is also
maintained at regional and customer group levels. It operates through two key mechanisms:
| | • | the framework itself defines the governancebodies, processes, metrics and other features ofhow HSBC addresses risk appetite as part of itsongoing business; |
| | | |
| | • | periodic risk appetite statements define, atvarious levels in the business, the desired levelof risk commensurate with return and growthtargets and in line with the corporate strategyand stakeholder objectives. |
The risk appetite framework covers both the beneficial and adverse aspects of risk. Within it, economic capital is the common currency through which risk is measured and used as the basis for risk evaluation, capital allocation and performance measurement across regions and customer groups. Risk appetite is executed through the operational limits that control the levels of risk run by the Group, regions and customer groups and is measured using risk-adjusted performance metrics.
Risk control culture
HSBC’s risk management policies are encapsulated in the Group Standards Manual and cascaded in a hierarchy of policy manuals throughout the Group and communicate standards, instructions and guidance to employees. They support the formulation of risk appetite and establish procedures for monitoring and controlling risks, with timely and reliable reporting to management. HSBC regularly reviews and updates its risk management policies, systems and methodologies to reflect changes in law, regulation, markets, products and emerging best practice.
It is the responsibility of all Group officers to identify, assess and manage risk within the scope of their assigned responsibilities. Personal accountability, reinforced by the Group’s governance structure and instilled by training and experience, helps to foster throughout the Group a disciplined and constructive culture of risk management and control.
| Credit risk |
|
| Credit risk management |
| (Audited) |
Credit risk is the risk of financial loss if a customer or counterparty fails to meet an obligation under a contract. It arises principally from direct lending, trade finance and leasing business, but also from certain off-balance sheet products such as guarantees and credit derivatives, and from the Group’s holdings of assets in the form of debt securities. HSBC has standards, policies and procedures
192
Back to Contents
dedicated to monitoring and managing risk from such activities.
The credit risk governance structures and control frameworks implemented by the Group are designed for all stages of economic and financial cycles, including the current economic environment. No material changes were initiated to HSBC’s risk management objectives, policies or procedures as a direct result of market turmoil. Certain measures already undertaken, however, are helping the Group to manage the effects of that turmoil. Such measures, for example the reinforcement of central credit risk oversight and independent review activities, continue to be implemented within a common operating model for the responsibilities and interaction of GMO Risk, regionally integrated risk functions and country-based management. In addition, certain operational processes have been invoked and applied in order to manage risks more intensively.
Credit Risk is part of the Global Risk function, and the heads of its Retail and Wholesale risk disciplines within GMO, as well as regional Chief Risk Officers, certain country Chief Credit Officers and the Head of Risk Strategy, report to the GCRO. The regional governance bodies for key risk matters reflect those in place at the centre. Functional units at the entity and regional levels report to GMO Risk. GMO helps build the Group’s credit risk management capacity through staff selection, training, development, performance assessment and remuneration – the GCRO is jointly responsible with business heads for setting the performance goals of senior Global Risk officers.
Across the Group, Credit Risk fulfils the role of an independent credit control unit, while engaging in dialogue with business teams to set priorities, refine risk appetite, and monitor and report higher-risk exposures. Credit risk and risk capital management policies and methodologies, including analytical model development/review and management information, are enhanced in the light of experience gained, for instance through the roll-out of the Group’s advanced internal ratings-based (‘IRB’) approach to Basel II. See also ‘Capital Management’ on page 274.
The Credit Risk function within GMO provides high-level oversight and management of credit risk for HSBC worldwide. Its responsibilities include:
| | • | Formulating Group credit policy. Compliance,subject to approved dispensations, is mandatoryfor all HSBC’s operating companies, whichmust develop and record in local instructionmanuals their detailed credit policies and procedures, consistent with Group policy. |
| | ��� | Guiding HSBC’s operating companies on theGroup’s appetite for credit risk exposure tospecified market sectors, activities and bankingproducts. GMO Risk controls exposures tocertain higher-risk sectors and closely monitorsexposure to others, including real estate, theautomotive sector, certain non-bank financialinstitutions, structured products and leveragedfinance transactions. When necessary,restrictions are imposed on new business orexposures, which may be capped at Groupand/or entity level. |
| | | |
| | • | Undertaking independent review and objectiveassessment of risk. GMO Risk assesses allcommercial non-bank credit facilities andexposures – including those embedded inderivatives – that are originated or renewed byHSBC’s operating companies over designatedlimits, prior to the facilities being committed tocustomers or transactions being undertaken.Operating companies may not confirm creditapproval without this concurrence. |
| | | |
| | • | Monitoring the performance and management ofretail portfolios across the Group. GMO Risktracks emerging trends and conducts in-depthportfolio reviews, overseeing the effectivemanagement of any adverse characteristics. |
| | | |
| | • | Controlling centrally exposures to sovereignentities, banks and other financial institutions.HSBC’s credit and settlement risk limits tocounterparties in these sectors are approved andmanaged by GMO Risk to optimise the use ofcredit availability and avoid excessive riskconcentration. |
| | | |
| | • | Controlling exposure for all debt securities held;where a security is not held solely for thepurpose of trading, a formal issuer risk limit isestablished. |
| | | |
| | • | Establishing and maintaining HSBC’s policy onlarge credit exposures, ensuring thatconcentrations of exposure by counterparty,sector or geography do not become excessive inrelation to the Group’s capital base and remainwithin internal and regulatory limits. Theapproach is designed to be more conservativethan internationally accepted regulatorystandards. GMO Risk also monitors HSBC’sintra-Group exposures to ensure they aremaintained within regulatory limits. Plans arebeing developed to adopt the FSA’s new‘Integrated Groups’ regime in accordance withthe published transition timetable. |
193
Back to Contents
| H S B C H O L D I N G S P L C |
| |
| Report of the Directors: Risk(continued) |
| | |
| | |
| Credit risk > Management > Credit quality / Impairment assessment |
| • | Controlling cross-border exposures, through the imposition of country limits with sub-limits by maturity and type of business. Country limits are determined by taking into account economic and political factors, and applying local business knowledge. Transactions with countries deemed to be higher risk are considered on a case by case basis. |
| |
| • | Maintaining and developing HSBC’s risk rating framework and systems, to classify exposures meaningfully and enable focused management of the risks involved. The GCRO chairs the Credit Risk Analytics Oversight Committee, which reports to the RMM and oversees risk rating model governance for both wholesale and retail business. Rating methodologies, based upon a wide range of analytics and market data- based tools, are core inputs to the assessment of customer risk. For larger facilities, while full use is made of automated risk-rating processes, the ultimate responsibility for setting risk ratings rests with the final approving executive. |
| |
| • | Assisting the Risk Strategy unit in the development of stress-testing scenarios, economic capital measurement and the refinement of key risk indicators and their reporting, the tools for this being increasingly embedded within the Group’s business planning processes. |
| |
| • | Reporting on aspects of the HSBC credit risk portfolio to the RMM, the Group Audit Committee and the Board of Directors of HSBC Holdings by way of a variety of regular and ad hoc reports covering: |
| |
| | – | risk concentrations; |
| |
| | – | retail portfolio performance at Group entity, regional and overall Group levels; |
| |
| | – | specific higher-risk portfolio segments; |
| |
| | – | a Risk Map of the status of key risk topics, with associated preventive and mitigating actions; |
| |
| | – | individual large impaired accounts, and impairment allowances/charges for all customer segments; |
| |
| | – | country limits, cross-border exposures and related impairment allowances; |
| |
| | – | portfolio and analytical model performance data; and |
| |
| | – | stress-testing results and recommendations. |
| • | Managing and directing credit risk managementsystems initiatives. HSBC has constructed acentralised database covering substantially allthe Group’s direct lending exposures, to deliveran increasingly granular level of managementreporting. A uniform credit application processfor banks is operational throughout the Groupand a similar corporate credit application systemcovers almost all Group corporate business byvalue. |
| | |
| • | Providing advice and guidance to HSBC’soperating companies, to promote best practicethroughout the Group on credit-related matterssuch as sustainability risk, new products andtraining. |
| | |
| • | Acting on behalf of HSBC Holdings as theprimary interface, for credit-related issues, withexternal parties including the Bank of England,the FSA, rating agencies, corporate analysts,trade associations and counterparts in theworld’s major banks and non-bank financialinstitutions. |
Each HSBC operating company is required to implement credit policies, procedures and lending guidelines that meet local requirements while conforming to Group standards. Credit approval authorities are delegated by the Board of Directors of HSBC Holdings to the most senior Chief Executive Officers, who receive commensurate delegations from their own boards. In each major subsidiary, a Chief Risk Officer or Chief Credit Officer reports to the local Chief Executive Officer or Chief Operating Officer on credit-related issues, while maintaining a direct functional reporting line to the GCRO.
Each operating company is responsible for the quality and performance of its credit portfolios and for monitoring and controlling all credit risks in them, including those subject to central approval by Group Risk. This includes managing its own risk concentrations by market sector, geography and product. Local systems are in place throughout the Group to enable operating companies to control and monitor exposures by customer and retail product segments.
Special attention is paid to problem exposures, which are subject to more frequent and intensive review and reporting, in order to accelerate remedial action. Where appropriate, HSBC’s local operating companies maintain or establish specialist units to provide customers with support in order to help them avoid default wherever possible.
Periodic risk-based audits of operating companies’ credit processes and portfolios are
194
Back to Contents
undertaken by HSBC’s Internal Audit function. Audits include consideration of the adequacy and clarity of credit policy/procedure manuals; an in-depth analysis of a representative sample of accounts; an overview of homogeneous portfolios of similar assets to assess the quality of the loan book and other exposures; consideration of any oversight or review work performed by credit risk management functions and the adequacy of impairment calculations; a review of analytical model governance and implementation; a review of management objectives and a check that Group and local standards and policies are adhered to in the approval and management of credit facilities.
Individually significant accounts are reviewed on a sample basis to ensure that risk ratings are appropriate, that credit and collection procedures have been properly followed and that, when an account or portfolio evidences deterioration, impairment allowances are raised in accordance with the Group’s established procedures. Internal Audit discusses with management any risk ratings it considers to be inappropriate; after discussion, its final recommendations for revised ratings must then be adopted.
Credit quality
(Audited)
HSBC’s credit risk rating systems and processes differentiate exposures in order to highlight those with greater risk factors and higher potential severity of loss. In the case of individually significant accounts, risk ratings are reviewed regularly and any amendments are implemented promptly. Within the Group’s retail businesses, risk is assessed and managed using a wide range of risk and pricing models to generate portfolio data.
HSBC’s historical, seven-grade risk rating system based on a judgemental assessment of the likelihood and impact of delinquency was superseded in 2008 for financial reporting purposes, as for those of all significant risk management decisions employing credit risk ratings, by a more risk-sensitive and granular methodology. This facilitates the IRB approach under Basel II adopted by the Group to support calculation of its minimum credit regulatory capital requirement.
The integration of this methodology into HSBC’s risk processes and structures is well advanced and supports reporting on the new basis to senior management in line with the Group’s IRB obligations. For further details, please see ‘Credit quality of financial instruments’ on page 217.
Impairment assessment
(Audited)
When impairment losses occur, HSBC reduces the carrying amount of loans and advances through the use of an allowance account. When impairment of available-for-sale financial assets and held-to-maturity financial investments occurs, the carrying amount of the asset is reduced directly. For further details on the accounting policy for impairment of available-for-sale debt and equity securities, see ‘Accounting policies’ on page 350.
Impairment allowances may be assessed and created either for individually significant accounts or, on a collective basis, for groups of individually significant accounts for which no evidence of impairment has been individually identified or for high-volume groups of homogeneous loans that are not considered individually significant.
It is HSBC’s policy that each operating company creates allowances for impaired loans promptly and consistently.
Management regularly evaluates the adequacy of the established allowances for impaired loans by conducting a detailed review of the loan portfolio, comparing performance and delinquency statistics with historical trends and assessing the impact of current economic conditions.
Individually assessed impairment allowances
These are determined by evaluating exposure to loss, case by case, on all individually significant accounts and all other accounts that do not qualify for the collective assessment approach outlined below. Loans are treated as impaired as soon as there is objective evidence that an impairment loss has been incurred. The criteria used by HSBC to determine that there is such objective evidence include:
| • | known cash flow difficulties experienced by theborrower; |
| | |
| • | past due contractual payments of either principalor interest; |
| | |
| • | breach of loan covenants or conditions; |
| | |
| • | the probability that the borrower will enterbankruptcy or other financial realisation; and |
| | |
| • | a significant downgrading in credit rating by anexternal credit rating agency. |
In determining the level of allowances on such accounts, the following factors are typically considered:
| • | HSBC’s aggregate exposure to the customer; |
195
Back to Contents
| H S B C H O L D I N G S P L C |
| |
| Report of the Directors: Risk(continued) |
| | |
| | |
| Credit risk > Management > Impairment assessment // Credit exposure > Maximum exposure |
| • | the viability of the customer’s business modeland their capacity to trade successfully out offinancial difficulties, generating sufficient cashflow to service debt obligations; |
| | |
| • | the ability of the borrower to obtain, and makepayments in, the currency of the loan if notdenominated in local currency; |
| | |
| • | the amount and timing of expected receipts andrecoveries; |
| | |
| • | the extent of other creditors’ commitmentsranking ahead of, orpari passuwith, HSBC andthe likelihood of other creditors continuing tosupport the company; |
| | |
| • | the complexity of determining the aggregateamount and ranking of all creditor claims andthe extent to which legal and insuranceuncertainties are evident; |
| | |
| • | the value of security and likelihood ofsuccessfully realising it; |
| | |
| • | the existence of other credit mitigants and theability of the providers of such credit mitigantsto deliver as contractually committed; and |
| | |
| • | when available, the secondary market price ofthe debt. |
The level of impairment allowances on individually significant accounts that are above defined materiality thresholds is reviewed at least semi-annually, and more regularly when circumstances require. This normally encompasses re-assessment of the enforceability of any collateral held and of actual and anticipated receipts. For significant commercial and corporate debts, specialised loan ‘work-out’ teams with experience in insolvency and specific market sectors are used to manage the lending and assess likely losses.
Individually assessed impairment allowances are only released when there is reasonable and objective evidence of a reduction in the established loss estimate.
Collectively assessed impairment allowances
Impairment is assessed on a collective basis in two circumstances:
| • | to cover losses that have been incurred but havenot yet been identified on loans subject toindividual assessment; and |
| | |
| • | for homogeneous groups of loans that are notconsidered individually significant. |
Incurred but not yet identified impairment
Individually assessed loans for which no evidence of impairment has been specifically identified on an individual basis are grouped together according to their credit risk characteristics. A collective impairment allowance is calculated to reflect impairment losses incurred at the balance sheet date which will only be individually identified in the future.
The collective impairment allowance is determined having taken into account:
| • | historical loss experience in portfolios of similarcredit risk characteristics (for example, byindustry sector, risk rating or product segment); |
| | |
| • | the estimated period between impairmentoccurring and the loss being identified andevidenced by the establishment of anappropriate allowance against the individualloan; and |
| | |
| • | management’s experienced judgement as towhether current economic and credit conditionsare such that the actual level of inherent losses islikely to be greater or less than that suggested byhistorical experience. |
The period between a loss occurring and its identification is estimated by local management for each relevant portfolio. In general, the periods used vary between four and twelve months although, in exceptional cases, longer periods are warranted.
The basis on which impairment allowances for incurred but not yet identified losses is established in each reporting entity is documented and reviewed by senior Finance and Credit Risk management to ensure conformity with Group policy.
Homogeneous groups of loans
Two methodologies are used to calculate impairment allowances where large numbers of relatively low-value assets are managed using a portfolio approach, typically:
| • | low-value, homogeneous small businessaccounts in certain countries or territories; |
| | |
| • | residential mortgages that have not beenindividually assessed; |
| | |
| • | credit cards and other unsecured consumerlending products; and |
| | |
| • | motor vehicle financing. |
When appropriate empirical information is available, the Group uses roll rate methodology. This employs a statistical analysis of historical trends of
196
Back to Contents
default and the amount of consequential loss, based on the delinquency of accounts within a portfolio of homogeneous accounts. Other historical data and current economic conditions are also evaluated when calculating the appropriate level of impairment allowance required to cover inherent loss. In certain highly developed markets, models also take into account behavioural and account management trends revealed in, for example, bankruptcy and rescheduling statistics.
When the portfolio size is small, or when information is insufficient or not reliable enough to adopt a roll rate methodology, a formulaic approach is used that allocates progressively higher percentage loss rates the longer a customer’s loan is overdue. Loss rates reflect the discounted expected future cash flows for a portfolio.
Generally, historical experience is the most objective and relevant information from which to begin to assess inherent loss within each portfolio. In circumstances where historical loss experience provides less relevant information about the inherent loss in a given portfolio at the balance sheet date – for example, where there have been changes in economic conditions or regulations – management considers the more recent trends in the portfolio risk factors which may not be adequately reflected in its statistical models and, subject to guidance from Group Finance and GMO Risk, adjusts impairment allowances accordingly.
Roll rates, loss rates and the expected timing of future recoveries are regularly benchmarked against actual outcomes to ensure they remain appropriate.
Write-off of loans and advances
Loans are normally written off, either partially or in full, when there is no realistic prospect of further recovery. Where loans are secured, this is generally after receipt of any proceeds from the realisation of security. In the case of residential mortgages and second lien loans in HSBC Finance, loan carrying amounts in excess of net realisable value are written off at or before the time foreclosure is completed or when settlement is reached with the borrower. If there is no reasonable expectation of recovery, and foreclosure is pursued, unconstrained by delays required by law or regulation, the loan is normally written off no later than the end of the month in which the loan becomes 240 days contractually past due.
Unsecured personal facilities, including credit cards, are generally written off at between 150 and 210 days past due, the standard period being the end of the month in which the account becomes 180 days
contractually delinquent. This period may be extended, generally to 300 days past due but in no event exceeding 360 days past due, in the case of HSBC Finance’s unsecured personal facilities other than credit cards.
Cases of write-off periods exceeding 360 days past due are few but arise, for example, in a few countries where local regulation or legislation constrain earlier write-off, or where the realisation of collateral for secured real estate lending extends beyond this time.
In the event of bankruptcy or analogous proceedings, write-off may occur earlier than at the periods stated above. Collections procedures may continue after write-off.
Cross-border exposures
Management assesses the vulnerability of countries to foreign currency payment restrictions when considering impairment allowances on cross-border exposures. This assessment includes an analysis of the economic and political factors existing at the time. Economic factors include the level of external indebtedness, the debt service burden and access to external sources of funds to meet the debtor country’s financing requirements. Political factors taken into account include the stability of the country and its government, threats to security, and the quality and independence of the legal system.
Impairment allowances are assessed in respect of all qualifying exposures within these countries unless these exposures and the inherent risks are:
| • | performing, trade-related and of less than oneyear’s maturity; |
| | |
| • | mitigated by acceptable security cover which is,other than in exceptional cases, held outside thecountry concerned; |
| | |
| • | in the form of securities held for tradingpurposes for which a liquid and active marketexists, and which are measured at fair valuedaily; |
| | |
| • | performing facilities with a principal (excludingsecurity) of US$1 million or below; or |
| | |
| • | performing facilities with maturity dates shorterthan three months. |
Credit exposure
Maximum exposure to credit risk
(Audited)
HSBC’s exposure to credit risk is spread over several asset classes, including derivatives, trading
197
Back to Contents
| H S B C H O L D I N G S P L C |
| |
| Report of the Directors: Risk(continued) |
| | |
| | |
| Credit risk > Credit exposure > Maximum exposure / Collateral |
assets, loans and advances to customers, loans and advances to banks, and financial investments. The balance of exposure at 31 December 2008 represented a change in risk profile compared with a year ago as HSBC repositioned its balance sheet in the face of unprecedented turmoil in financial markets. The following commentary is on a constant currency basis.
Derivative asset balances rose significantly as the financial turmoil of 2008 led to heightened levels of volatility in the underlying markets to which the derivatives are referenced. The rise in asset balances was primarily driven by interest rate derivatives as the global fall in interest reference rates created significant gaps between the fixed and floating components of interest rate swaps, which in turn led to substantial mark-to-market increases in the value of interest rate swap positions. The widening credit spreads and significant volatility in credit and foreign exchange markets created the environment in which credit derivative positions and foreign exchange derivative assets increased.
HSBC reduced exposure to banks as it tightened lending limits in response to declining credit quality. Much of this lending was instead placed into government issued or guaranteed debt, which contributed to an increase in financial investments.
Loans and advances to customers in the commercial sector grew while personal lending declined, primarily due to the continued run-off of parts of the portfolio in North America. Amounts due from non-bank financial institutions increased due to the expansion of reverse repo lending with the London Clearing House in the UK and a reclassification of cash collateral in the US.
Within trading assets, debt securities and treasury and other bills increased, primarily due to the consolidation on 30 September 2008 of five Constant Net Asset Value funds containing assets upon consolidation of around US$40 billion held for trading. For further details see pages 180 to 181.
As a consequence of the significant increase in derivative balances, there was a decline in the proportion of total assets represented by most other asset classes. On a reported basis, the proportion of total assets represented by derivative assets increased by 12 percentage points while that deployed in loans and advances to customers declined by 5 percentage points and the proportion of trading assets declined by 2 percentage points. Loans and advances to banks as a proportion of total assets declined by 4 percentage points.
The most significant factor affecting HSBC’s exposure to credit risk during 2008 was the continuing deterioration in credit conditions in the US mortgage market. HSBC also experienced deterioration in credit quality in the commercial real estate sector. Loss experience remained concentrated in the personal lending portfolios, primarily in the US with 85 per cent of loan impairment charges and other credit risk provisions arising in Personal Financial Services in 2008 compared with 94 per cent in 2007. In 2008, 9 per cent of loan impairment charges and other credit risk provisions arose in Commercial Banking, compared with 6 per cent in 2007. In the UK, despite significant declines in house prices and activity in the housing market as a whole, the credit quality of HSBC’s mortgage business remained materially stable in 2008.
The following table presents the maximum exposure to credit risk from balance sheet and off-balance sheet financial instruments, before taking account of any collateral held or other credit enhancements (unless such credit enhancements meet offsetting requirements). For financial assets recognised on the balance sheet, the maximum exposure to credit risk equals their carrying amount; for financial guarantees granted, it is the maximum amount that HSBC would have to pay if the guarantees were called upon. For loan commitments and other credit-related commitments that are irrevocable over the life of the respective facilities, it is the full amount of the committed facilities.
198
Back to Contents
Maximum exposure to credit risk
(Audited)
| | | At 31 December 2008 | | | At 31 December 2007 | |
| | |
|
|
|
|
|
|
| | |
|
|
|
|
|
|
| |
| | | | | | | | | Net | | | | | | | | | Net | |
| | | Maximum | | | | | | exposure to | | | Maximum | | | | | | exposure to | |
| | | exposure | | | Offset | | | credit risk | | | exposure | | | Offset | | | credit risk | |
| | | US$m | | | US$m | | | US$m | | | US$m | | | US$m | | | US$m | |
| | | | | | | | | | | | | | | | | | | |
| Items in the course of collection from other banks | | 6,003 | | | – | | | 6,003 | | | 9,777 | | | – | | | 9,777 | |
| Trading assets | | 405,451 | | | (13,227 | ) | | 392,224 | | | 394,492 | | | (12,220 | ) | | 382,272 | |
| – treasury and other eligible bills | | 32,458 | | | – | | | 32,458 | | | 16,439 | | | – | | | 16,439 | |
| – debt securities | | 199,619 | | | – | | | 199,619 | | | 178,834 | | | (1,417 | ) | | 177,417 | |
| – loans and advances to banks | | 73,055 | | | – | | | 73,055 | | | 100,440 | | | (994 | ) | | 99,446 | |
| – loans and advances to customers | | 100,319 | | | (13,227 | ) | | 87,092 | | | 98,779 | | | (9,809 | ) | | 88,970 | |
| Financial assets designated at fair value | | 17,540 | | | – | | | 17,540 | | | 21,517 | | | – | | | 21,517 | |
| – treasury and other eligible bills | | 235 | | | – | | | 235 | | | 181 | | | – | | | 181 | |
| – debt securities | | 16,349 | | | – | | | 16,349 | | | 21,150 | | | – | | | 21,150 | |
| – loans and advances to banks | | 230 | | | – | | | 230 | | | 178 | | | – | | | 178 | |
| – loans and advances to customers | | 726 | | | – | | | 726 | | | 8 | | | – | | | 8 | |
| Derivatives | | 494,876 | | | (383,308 | ) | | 111,568 | | | 187,854 | | | (121,709 | ) | | 66,145 | |
| Loans and advances held at amortised cost | | 1,086,634 | | | (83,398 | ) | | 1,003,236 | | | 1,218,914 | | | (66,983 | ) | | 1,151,931 | |
| – loans and advances to banks | | 153,766 | | | (126 | ) | | 153,640 | | | 237,366 | | | (278 | ) | | 237,088 | |
| – loans and advances to customers | | 932,868 | | | (83,272 | ) | | 849,596 | | | 981,548 | | | (66,705 | ) | | 914,843 | |
| Financial investments | | 292,984 | | | – | | | 292,984 | | | 270,406 | | | – | | | 270,406 | |
| – treasury and other similar bills | | 41,027 | | | – | | | 41,027 | | | 30,104 | | | – | | | 30,104 | |
| – debt securities | | 251,957 | | | – | | | 251,957 | | | 240,302 | | | – | | | 240,302 | |
| Other assets | | 40,859 | | | (5 | ) | | 40,854 | | | 43,245 | | | (226 | ) | | 43,019 | |
| – endorsements and acceptances | | 10,482 | | | (5 | ) | | 10,477 | | | 12,248 | | | (226 | ) | | 12,022 | |
| – accrued income and other | | 30,377 | | | – | | | 30,377 | | | 30,997 | | | – | | | 30,997 | |
| Financial guarantees | | 52,318 | | | – | | | 52,318 | | | 56,440 | | | – | | | 56,440 | |
Loan commitments and other credit-related commitments1 | | 604,022 | | | – | | | 604,022 | | | 764,457 | | | – | | | 764,457 | |
| | |
| | |
| | |
| | |
| | |
| | |
| |
| | | 3,000,687 | | | (479,938 | ) | | 2,520,749 | | | 2,967,102 | | | (201,138 | ) | | 2,765,964 | |
| | |
| | |
| | |
| | |
| | |
| | |
| |
| | | | | | | | | | | | | | | | | | | |
| 1 | The amount of the loan commitments reflects, where relevant, the expected level of take-up of pre-approved loan offers made by mailshots to personal customers. In addition to those amounts, there is a further maximum possible exposure to credit risk of US$35,849 million (2007: US$317,834 million), reflecting the full take-up of such irrevocable loan commitments. |
| |
Collateral and other credit enhancements
(Audited)
Collateral held against financial instruments presented in the ‘Maximum exposure to credit risk’ table above is described in more detail below.
Items in the course of collection from other banks
Settlement risk arises in any situation where a payment in cash, securities or equities is made in the expectation of a corresponding receipt of cash, securities or equities. Daily settlement limits are established for counterparties to cover the aggregate of HSBC’s transactions with each one on any single day. Settlement risk on many transactions, particularly those involving securities and equities, is substantially mitigated by settling through assured
payment systems or on a delivery-versus-payment basis.
Treasury, other eligible bills and debt securities
Collateral held as security for financial assets other than loans and advances is determined by the nature of the instrument. Debt securities, treasury and other eligible bills are generally unsecured, except for ABSs and similar instruments, which are secured by pools of financial assets.
Derivatives
The ISDA Master Agreement is HSBC’s preferred agreement for documenting derivatives activity. It provides the contractual framework within which dealing activity across a full range of over-the-
199
Back to Contents
| H S B C H O L D I N G S P L C |
| |
| Report of the Directors: Risk(continued) |
| | |
| | |
| Credit risk > Credit exposure > Concentration > 2008 |
counter products is conducted, and contractually binds both parties to apply close-out netting across all outstanding transactions covered by an agreement if either party defaults or other pre-agreed termination events occur. It is common, and HSBC’s preferred practice, for the parties to execute a Credit Support Annex (‘CSA’) in conjunction with theISDA Master Agreement. Under a CSA, collateral is passed between the parties to mitigate the market-contingent counterparty risk inherent in the outstanding positions.
Loans and advances
It is HSBC’s policy, when lending, to do so on the basis of the customer’s capacity to repay, rather than rely primarily on the value of security offered. Depending on the customer’s standing and the type of product, facilities may be provided unsecured. Whenever available, collateral can be an important mitigant of credit risk.
The guidelines applied by operating companies in respect of the acceptability of specific classes of collateral or credit risk mitigation, and the determination of valuation parameters are subject to regular review to ensure that they are supported by empirical evidence and continue to fulfil their intended purpose. The principal collateral types employed by HSBC are as follows:
| • | in the personal sector, mortgages overresidential properties; |
| | |
| • | in the commercial and industrial sector, chargesover business assets such as premises, stock anddebtors; |
| | |
| • | in the commercial real estate sector, chargesover the properties being financed; and |
| | |
| • | in the financial sector, charges over financialinstruments such as cash, debt securities andequities in support of trading facilities. |
In addition, credit derivatives, including credit default swaps and structured credit notes, and securitisation structures are used to manage credit risk in the Group’s loan portfolio.
HSBC does not disclose the fair value of collateral held as security or other credit enhancements on loans and advances past due but not impaired, or on individually assessed impaired loans and advances, as it is not practicable to do so.
Concentration of exposure
(Audited)
Concentrations of credit risk arise when a number of counterparties or exposures have comparable
economic characteristics, or such counterparties are engaged in similar activities or operate in the same geographical areas or industry sectors, so that their collective ability to meet contractual obligations is uniformly affected by changes in economic, political or other conditions.
Securities held for trading
(Unaudited)
Total securities held for trading within trading assets were US$254 billion at 31 December 2008 (2007: US$247 billion). The largest concentration of these assets was government and government agency securities, which amounted to US$143 billion, or 56 per cent of overall trading securities (2007: US$115 billion, 46 per cent). This included US$32 billion (2007: US$16 billion) of treasury and other eligible bills. Corporate debt and other securities were US$82 billion or 32 per cent of overall trading securities, 8 percentage points higher than 2007’s level of 24 per cent at US$60 billion. Included within total securities held for trading were US$50 billion (2007: US$70 billion) of debt securities issued by banks and other financial institutions.
A more detailed analysis of securities held for trading is set out in Note 16 on the Financial Statements and an analysis of credit quality is provided on page 218.
Debt securities, treasury and other eligible bills
(Unaudited)
At US$293 billion, total financial investments excluding equity securities were 8 per cent higher at 31 December 2008 than at the end of 2007. Debt securities, at US$252 billion, represented the largest concentration of financial investments at 86 per cent of the total, compared with US$240 billion (89 per cent) at 31 December 2007. HSBC’s holdings of corporate debt, ABSs and other securities were spread across a wide range of issuers and geographical regions, with 48 per cent invested in securities issued by banks and other financial institutions. In total, holdings in ABSs decreased by US$24 billion due to a combination of movements in fair values, principal amortisations and write-downs.
Investments in securities of governments and government agencies of US$114 billion were 38 per cent of overall financial investments, 5 percentage points higher than in 2007. US$41 billion of these investments comprised treasury and other eligible bills.
A more detailed analysis of financial investments is set out in Note 19 on the Financial
200
Back to Contents
Statements and an analysis by credit quality is provided on page 218.
The insurance businesses held diversified portfolios of debt and equity securities designated at fair value (2008: US$20 billion; 2007: US$34 billion) and debt securities classified as financial investments (2008: US$28 billion; 2007:US$23 billion). A more detailed analysis of securities held by the insurance businesses is set out on page 262.
Derivatives
(Unaudited)
Derivative assets at 31 December 2008 were US$495 billion, a rise of 163 per cent from 31 December 2007, primarily foreign exchange, interest rate and credit derivatives. The main drivers of growth were mark-to-market movements across the entire portfolio arising from volatility and movements in interest rates and credit spreads.
Loans and advances
(Unaudited)
Loans and advances were well diversified across industry sectors and jurisdictions.
At constant exchange rates, gross loans and advances to customers (excluding the financial sector settlement accounts and reclassified ABSs) at 31 December 2008 rose by US$54 billion or 7 per cent from 31 December 2007.
Personal lending represented 46 per cent of total loans and advances to customers including the financial sector settlement accounts and reclassified ABSs. Residential mortgages of US$243 billion represented 25 per cent of total advances to customers, the Group’s largest concentration in a single exposure type.
Corporate, commercial and financial lending, including settlement accounts, amounted to 53 per cent of total loans and advances to customers at 31 December 2008. The largest industry concentrations were in non-bank financial institutions and commercial real estate lending at 10 per cent and 7 per cent, respectively, of total gross lending to customers.
Exposureto non-bank financial institutions principally comprised secured lending on trading accounts, primarily through repo facilities. During 2008, HSBC reduced unsecured exposure to hedge
fund trading accounts. HSBC had no material exposure to hedge funds affected by the administration of Lehman Brothers International (Europe).
HSBC managed its exposure to insurance institutions closely within existing limits and experienced no material loss during 2008.
Commercial, industrial and international trade lending rose strongly during 2008, increasing its proportion of total lending by 2 percentage points to 22 per cent of total gross loans and advances to customers on a reported basis. Within this category, the largest concentration of lending was to the service sector, which amounted to 6 per cent of total gross lending to customers.
Loans and advances to banks were widely distributed across major institutions.
Lending to banks was managed downwards through 2008. HSBC reduced limits to this sector in response to a deterioration in credit quality which was most visible in the collapse of a number of US and Icelandic banks to which the Group had advanced funds. The expansion of sovereign guarantees for some bank issuance increased appetite for these counterparties.
2008 compared with 2007
(Unaudited)
The commentary below analyses, on a constant currency basis, the changes in lending noted in the table below, compared with the position at 31 December 2007. On this basis, loans and advances to personal, corporate and commercial customers increased by 7 per cent, and total gross loans and advances rose by 1 per cent.
Total lending to personal customers was concentrated in North America (US$196 billion), the UK (US$108 billion) and Hong Kong (US$46 billion). Collectively, these regions accounted for 79 per cent of total personal lending, a decline of 1 percentage point from the level reported at 31 December 2007. Total lending to personal customers declined by 3 per cent to US$440 billion at 31 December 2008.
201
Back to Contents
| H S B C H O L D I N G S P L C |
| |
| Report of the Directors: Risk(continued) |
| | |
| | |
| Credit risk > Credit exposure > Concentration > 2008 |
Gross loans and advances by industry sector
(Unaudited)
| | At | | | Constant | | | Movement on a | | | At | |
| | 31 December | | | currency | | | constant | | | 31 December | |
| | 2007 | | | effect | | | currency basis | | | 2008 | |
| | US$m | | | US$m | | | US$m | | | US$m | |
| Gross loans and advances to customers | | | | | | | | | | | |
| Personal | 500,834 | | | (47,831 | ) | | (12,776 | ) | | 440,227 | |
| Residential mortgages1 | 269,068 | | | (30,164 | ) | | 4,433 | | | 243,337 | |
| Other personal2 | 231,766 | | | (17,667 | ) | | (17,209 | ) | | 196,890 | |
| | | | | | | | | | | | |
| Corporate and commercial | 400,771 | | | (59,671 | ) | | 66,374 | | | 407,474 | |
| Commercial, industrial and international trade | 202,038 | | | (31,953 | ) | | 39,755 | | | 209,840 | |
| Commercial real estate | 72,345 | | | (9,224 | ) | | 7,848 | | | 70,969 | |
| Other property-related | 33,907 | | | (4,188 | ) | | 1,020 | | | 30,739 | |
| Government | 5,708 | | | (650 | ) | | 1,486 | | | 6,544 | |
| Other commercial3 | 86,773 | | | (13,656 | ) | | 16,265 | | | 89,382 | |
| | | | | | | | | | | | |
| Financial | 99,148 | | | (11,391 | ) | | 13,328 | | | 101,085 | |
| Non-bank financial institutions | 96,781 | | | (11,146 | ) | | 13,901 | | | 99,536 | |
| Settlement accounts | 2,367 | | | (245 | ) | | (573 | ) | | 1,549 | |
| Asset-backed securities reclassified | – | | | – | | | 7,991 | | | 7,991 | |
| |
| | |
| | |
| | |
| |
| Gross loans and advances to customers | 1,000,753 | | | (118,893 | ) | | 74,917 | | | 956,777 | |
| Gross loans and advances to banks | 237,373 | | | (20,125 | ) | | (63,419 | ) | | 153,829 | |
| |
| | |
| | |
| | |
| |
| | 1,238,126 | | | (139,018 | ) | | 11,498 | | | 1,110,606 | |
| |
| | |
| | |
| | |
| |
| | |
| 1 | Including Hong Kong Government Home Ownership Scheme loans of US$3,882 million at 31 December 2008 (2007: US$3,942 million). |
| 2 | Other personal loans and advances include second lien mortgages and other property-related lending. |
| 3 | Other commercial loans and advances include advances in respect of agriculture, transport, energy and utilities. |
| | |
Residential mortgages rose slightly to US$243 billion at 31 December 2008, comprising 25 per cent of total loans and advances to customers (including the financial sector and settlement accounts). A significant increase in mortgage lending in the UK, combined with more modest increases in Hong Kong, Rest of Asia-Pacific and Latin America, more than offset a 15 per cent decrease in the value of mortgage lending in North America.
In Europe, residential mortgage lending rose by 22 per cent to US$87 billion. Mortgage lending rose by 26 per cent in the UK, driven by the successful launch of the RateMatcher campaign in April 2008, and a similarly successful campaign in First Direct. This was partly offset by a decline in France due to the sale of the regional banks in July 2008.
In Hong Kong, residential mortgage lending rose by 11 per cent due to successful repricing initiatives which allowed HSBC to become the market leader for new mortgage lending during the year. In response to the weakening local economy and declining house prices in the second half of 2008, HSBC tightened lending criteria and increased pricing on new loans.
In Rest of Asia-Pacific, mortgage lending rose by 11 per cent, driven by continued business
expansion in the Middle East. Balances in mainland China grew strongly as the branch network expanded.
In North America, mortgage lending declined by 15 per cent. In the US, total mortgage lending amounted to US$81 billion at 31 December 2008, a decline of 18 per cent since 31 December 2007. In the mortgage services business, balances declined by 21 per cent as there were no new originations and the portfolio continued to run-off. In consumer lending, balances declined by 7 per cent as a result of management actions taken to reduce risk in the portfolio, including further tightening underwriting criteria and increasing collateral requirements for new originations. In HSBC USA, balances declined by 32 per cent, primarily due to the sale of US$7.0 billion of mortgage portfolios during 2008 and the fact that the majority of loan originations continued to be sold in the secondary markets. In line with HSBC’s reduced risk appetite, the wholesale and third-party correspondent prime mortgage business of HSBC USA was closed in November 2008.
In Latin America, residential mortgage lending increased, driven by continued growth in fixed rate mortgage lending in Mexico.
Other personal lendingdeclined by 8 per cent to US$197 billion at 31 December 2008, representing
202
Back to Contents
21 per cent of total loans and advances to customers (including the financial sector and settlement accounts).
In Europe, other personal lending declined by 11 per cent from the end of 2007 to US$54 billion. The decrease was primarily attributable to the UK as a stronger focus on secured lending restricted originations in the unsecured portfolio. The sale of certain non-core credit card portfolios in the first half of 2008 also contributed to the decrease in the UK. In France, balances declined due to the sale of the regional banks in the second half of 2008. In Turkey, continued expansion of the branch network during 2008 resulted in higher balances, particularly in credit cards and overdrafts.
In Hong Kong, other personal lending declined by 2 per cent to US$13 billion. HSBC remained the market leader for credit cards in Hong Kong based on cards in circulation, cardholder spending and balances.
In Rest of Asia-Pacific, other personal lending rose by 12 per cent, primarily due to strong growth in the Middle East. Elsewhere in the region, balances rose in Malaysia and Indonesia.
In North America, other personal lending balances declined by 12 per cent to US$97 billion. In the US, consumer finance business and credit card lending fell due to the combined effect of tighter underwriting criteria and lower marketing expenditure. A reduction in non-credit card personal lending reflected the decision to cease new business in guaranteed direct mail loans and personal homeowner loans in the second half of 2007, and tighter underwriting criteria applied to originations in the remainder of the portfolio. In the mortgage services business, second lien balances declined due to the continued run-off of the portfolio following the cessation of originations in 2007. Lower vehicle finance lending at HSBC Finance reflected the discontinuation of certain product offerings and the cessation of new vehicle loan originations from the dealer and direct-to-consumer channels in July 2008. HSBC USA also discontinued originations of indirect vehicle finance loans, but second lien loans increased following a promotional campaign channelled through the branch network in the first half of 2008. In Canada, lower balances were attributable to the disposal of the vehicle finance businesses during the year.
In Latin America, other personal lending rose by 9 per cent to US$15 billion. Lending growth was primarily concentrated in Brazil and reflected strong demand for payroll loans and vehicle lending. In Mexico, balances were broadly in line with
31 December 2007 and the mix was adjusted towards customers of higher credit quality. Further growth was restricted as risk appetite was adjusted by closing certain products to new originations and tightening underwriting criteria on cards, leading to a sharp reduction in the number of cards issued in 2008.
Loans and advances to corporate and commercial customersrose by 19 per cent to US$407 billion, with strong growth across all regions. Lending was primarily concentrated in Europe, where it accounted for 54 per cent of advances to this sector, of which more than 40 per cent were in the UK.
In Europe, corporate and commercial advances rose by 24 per cent. In the UK, lending rose by 35 per cent, driven by growth in lending to large corporates. Balances declined in France due to the sale of the regional banks in July 2008.
In Hong Kong, corporate and commercial lending rose by 19 per cent, driven by higher lending in commercial, industrial and international trade, commercial real estate and other property-related sectors.
In Rest of Asia-Pacific, strong corporate and commercial lending growth was experienced in the Middle East and Singapore, which rose by 26 per cent and 50 per cent respectively and, to a lesser extent, in Malaysia, India and Taiwan, the latter due to the acquisition of the assets and liabilities of The Chinese Bank in March 2008. In the Middle East, the corporate and commercial loan book continued to grow, owing to an expansion of lending in UAE, particularly for trade and investment projects, in addition to general business growth. In Singapore, higher lending was driven by strong demand from the international trade sector. Lending in Japan declined due to the closure of inactive and unprofitable accounts, and lending in mainland China fell as a result of tightened government regulations and tighter lending criteria in response to the weakening local economy. This partly offset the strong growth elsewhere in the region.
In North America, corporate and commercial lending increased by 7 per cent, driven by growth in HSBC USA and, to a lesser extent, in Canada. In HSBC USA, higher lending to corporate and commercial clients reflected the targeted expansion of middle market activities and the drawdown of existing credit facilities, partly offset by a decline in commercial real estate activity as the bank managed down its lending exposures in light of lower risk appetite and a deterioration in market conditions. In Canada, corporate and commercial lending rose by
203
Back to Contents
| H S B C H O L D I N G S P L C |
| |
| Report of the Directors: Risk(continued) |
| | |
| | |
| Credit risk > Credit exposure > Concentration |
9 per cent, particularly in Western Canada, as demand remained strong for commercial loans.
In Latin America, corporate and commercial lending rose by 20 per cent, driven by higher lending in Brazil as a result of strong growth in the trade loans portfolio and working capital products.
Loans and advances to the financial sectorrose by 15 per cent with strong growth in the UK and North America, largely in collateralised lending. Lending balance were 46 per cent higher in the UK due to the increased use of secured funding facilities through the London Clearing House in the form of repos. In North America, higher lending was driven by HSBC USA due to the reclassification from ‘Other assets’ of cash collateral held with other institutions.
Loans and advances to banksfell by 29 per cent to US$154 billion due to a significant decline in placement activity in Hong Kong and Europe. This was driven by a reduction in money market and inter-bank placements in favour of treasury bills and bank securities. In the UK, a higher proportion of assets were invested in government and government-guaranteed debt. Elsewhere, growth in Latin America was primarily in Brazil, due to higher reverse repo balances.
The following tables analyse loans by industry sector and by the location of the principal operations of the lending subsidiary or, in the case of the operations of The Hongkong and Shanghai Banking Corporation Limited, HSBC Bank plc, HSBC Bank Middle East Limited and HSBC Bank USA N.A., by the location of the lending branch.
Gross loans and advances to customers by industry sector
(Audited: 2008 to 2005; Unaudited: 2004)
| | | | 2008 | | | 2007 | | | 2006 | | | 2005 | | | 2004 | |
| | | | US$m | | | US$m | | | US$m | | | US$m | | | US$m | |
| | | | | | | | | | | | | | | | | |
| Personal | 440,227 | | | 500,834 | | | 476,146 | | | 420,476 | | | 387,852 | |
| | Residential mortgages1 | 243,337 | | | 269,068 | | | 265,337 | | | 238,546 | | | 227,847 | |
| | Other personal | 196,890 | | | 231,766 | | | 210,809 | | | 181,930 | | | 160,005 | |
| Corporate and commercial | 407,474 | | | 400,771 | | | 343,107 | | | 278,709 | | | 231,772 | |
| | Commercial, industrial and international trade | 209,840 | | | 202,038 | | | 162,109 | | | 130,802 | | | 101,876 | |
| | Commercial real estate | 70,969 | | | 72,345 | | | 60,366 | | | 51,815 | | | 43,469 | |
| | Other property-related | 30,739 | | | 33,907 | | | 27,165 | | | 22,196 | | | 20,749 | |
| | Government | 6,544 | | | 5,708 | | | 8,990 | | | 8,218 | | | 10,527 | |
| | Other commercial2 | 89,382 | | | 86,773 | | | 84,477 | | | 65,678 | | | 55,151 | |
| Financial | 101,085 | | | 99,148 | | | 62,458 | | | 52,174 | | | 66,148 | |
| | Non-bank financial institutions | 99,536 | | | 96,781 | | | 59,204 | | | 50,032 | | | 52,329 | |
| | Settlement accounts | 1,549 | | | 2,367 | | | 3,254 | | | 2,142 | | | 13,819 | |
| Asset-backed securities reclassified | 7,991 | | | – | | | – | | | – | | | – | |
| | |
| | |
| | |
| | |
| | |
| |
| Total gross loans and advances to customers3 | 956,777 | | | 1,000,753 | | | 881,711 | | | 751,359 | | | 685,772 | |
| | |
| | |
| | |
| | |
| | |
| |
| Impaired loans4,6 | 25,352 | | | 19,582 | | | 15,071 | | | 12,338 | | | 13,031 | |
| | – | as a percentage of gross loans and advancesto customers4 | 2.6% | | | 2.0% | | | 1.7% | | | 1.6% | | | 1.9% | |
| Total impairment allowances5 | 23,909 | | | 19,205 | | | 13,578 | | | 11,357 | | | 12,542 | |
| | – | as a percentage of total gross loans and advances | 2.5% | | | 1.9% | | | 1.5% | | | 1.5% | | | 1.8% | |
| | | | | | | | | | | | | | | |
| 1 | Residential mortgages include Hong Kong Government Home Ownership Scheme loans of US$3,882 million (2007: US$3,942 million; 2006: US$4,078 million; 2005: US$4,680 million; 2004: US$5,383 million). |
| 2 | Other commercial loans and advances include advances in respect of agriculture, transport, energy and utilities. |
| 3 | Included within this total is credit card lending of US$75,266 million (2007: US$82,854 million; 2006: US$74,518 million; 2005: US$66,020 million; 2004: US$56,222 million). |
| 4 | The figures for 2004 are net of suspended interest. |
| 5 | 2004: Specific provisions on impaired loans. |
| 6 | Impaired loans for 2004-2007 have been restated as a result of the reclassification of an element of a credit card portfolio as impaired. There has been no effect on impairment allowances. |
204
Back to Contents
Loans and advances to customers by industry sector and by geographical region
(Audited)
| | | | | | | | | | | | | | | | | | | | | | Gross loans | |
| | | | | | | | | | | | | | | | | | | Gross | | | by industry | |
| | | | | | | | | | Rest of | | | | | | | | | loans and | | | sector as a | |
| | | | | | | Hong | | | Asia- | | | North | | | Latin | | | advances to | | | % of total | |
| | | | Europe | | | Kong | | | Pacific | | | America | | | America | | | customers | | | gross loans | |
| | | | US$m | | | US$m | | | US$m | | | US$m | | | US$m | | | US$m | | | % | |
| At 31 December 2008 | | | | | | | | | | | | | | | | | | | | |
| Personal | 141,532 | | | 46,087 | | | 37,411 | | | 195,534 | | | 19,663 | | | 440,227 | | | 46.0 | |
| | Residential mortgages1 | 87,267 | | | 33,014 | | | 20,185 | | | 98,383 | | | 4,488 | | | 243,337 | | | 25.4 | |
| | Other personal | 54,265 | | | 13,073 | | | 17,226 | | | 97,151 | | | 15,175 | | | 196,890 | | | 20.6 | |
| | | | | | | | | | | | | | | | | | | | | |
| Corporate and commercial | 219,640 | | | 52,186 | | | 66,126 | | | 47,291 | | | 22,231 | | | 407,474 | | | 42.5 | |
| | Commercial, industrial and international trade | 121,047 | | | 20,186 | | | 40,147 | | | 15,178 | | | 13,282 | | | 209,840 | | | 21.9 | |
| | Commercial real estate | 32,704 | | | 14,233 | | | 8,144 | | | 13,504 | | | 2,384 | | | 70,969 | | | 7.4 | |
| | Other property-related | 7,666 | | | 10,296 | | | 5,128 | | | 7,234 | | | 415 | | | 30,739 | | | 3.2 | |
| | Government | 1,864 | | | 951 | | | 1,760 | | | 352 | | | 1,617 | | | 6,544 | | | 0.7 | |
| | Other commercial2 | 56,359 | | | 6,520 | | | 10,947 | | | 11,023 | | | 4,533 | | | 89,382 | | | 9.3 | |
| | | | | | | | | | | | | | | | | | | | | |
| Financial | 62,620 | | | 2,680 | | | 5,646 | | | 27,746 | | | 2,393 | | | 101,085 | | | 10.6 | |
| | Non-bank financial institutions | 61,823 | | | 2,402 | | | 5,387 | | | 27,560 | | | 2,364 | | | 99,536 | | | 10.4 | |
| | Settlement accounts | 797 | | | 278 | | | 259 | | | 186 | | | 29 | | | 1,549 | | | 0.2 | |
| Asset-backed securities reclassified | 6,258 | | | – | | | – | | | 1,733 | | | – | | | 7,991 | | | 0.9 | |
| | |
|
| |
|
| |
|
| |
|
| |
|
| |
|
| |
| |
Total gross loans and advances to customers3 | 430,050 | | | 100,953 | | | 109,183 | | | 272,304 | | | 44,287 | | | 956,777 | | | 100.0 | |
| | |
|
| |
|
| |
|
| |
|
| |
|
| |
|
| |
| |
| Percentage of loans and advances by geographical region | 44.9 | % | | 10.6 | % | | 11.4 | % | | 28.5 | % | | 4.6 | % | | 100.0 | % | | | |
| | | | | | | | | | | | | | | | | | | | | |
| Impaired loans | 6,774 | | | 852 | | | 1,114 | | | 14,285 | | | 2,327 | | | 25,352 | | | | |
| | – | as a percentage of gross loansand advances to customers | 1.6 | % | | 0.8 | % | | 1.0 | % | | 5.2 | % | | 5.3 | % | | 2.6 | % | | | |
| | | | | | | | | | | | | | | | | | | | | | | |
| Total impairment allowances | 3,859 | | | 733 | | | 1,227 | | | 16,090 | | | 2,000 | | | 23,909 | | | | |
| | – | as a percentage of total grossloans and advances | 0.9 | % | | 0.7 | % | | 1.1 | % | | 5.9 | % | | 4.5 | % | | 2.5 | % | | | |
| | | | | | | | | | | | | | | | | | | | | | | |
| At 31 December 2007 | | | | | | | | | | | | | | | | | | | | |
| Personal | 168,549 | | | 43,033 | | | 36,910 | | | 230,562 | | | 21,780 | | | 500,834 | | | 50.1 | |
| | Residential mortgages1 | 95,665 | | | 29,689 | | | 20,397 | | | 118,993 | | | 4,324 | | | 269,068 | | | 26.9 | |
| | Other personal | 72,884 | | | 13,344 | | | 16,513 | | | 111,569 | | | 17,456 | | | 231,766 | | | 23.2 | |
| | | | | | | | | | | | | | | | | | | | | |
| Corporate and commercial | 225,282 | | | 43,716 | | | 60,442 | | | 48,898 | | | 22,433 | | | 400,771 | | | 40.0 | |
| | Commercial, industrial and international trade | 120,359 | | | 17,740 | | | 36,461 | | | 13,937 | | | 13,541 | | | 202,038 | | | 20.1 | |
| | Commercial real estate | 36,672 | | | 12,301 | | | 7,592 | | | 14,561 | | | 1,219 | | | 72,345 | | | 7.2 | |
| | Other property-related | 11,275 | | | 8,168 | | | 4,664 | | | 8,000 | | | 1,800 | | | 33,907 | | | 3.4 | |
| | Government | 2,299 | | | 332 | | | 1,667 | | | 248 | | | 1,162 | | | 5,708 | | | 0.6 | |
| | Other commercial2 | 54,677 | | | 5,175 | | | 10,058 | | | 12,152 | | | 4,711 | | | 86,773 | | | 8.7 | |
| | | | | | | | | | | | | | | | | | | | | | | |
| Financial | 62,375 | | | 3,265 | | | 5,426 | | | 22,380 | | | 5,702 | | | 99,148 | | | 9.9 | |
| | Non-bank financial institutions | 61,216 | | | 2,483 | | | 5,191 | | | 22,252 | | | 5,639 | | | 96,781 | | | 9.7 | |
| | Settlement accounts | 1,159 | | | 782 | | | 235 | | | 128 | | | 63 | | | 2,367 | | | 0.2 | |
| | |
| | |
| | |
| | |
| | |
| | |
| | |
| |
Total gross loans and advances to customers3 | 456,206 | | | 90,014 | | | 102,778 | | | 301,840 | | | 49,915 | | | 1,000,753 | | | 100 .0 | |
| | |
| | |
| | |
| | |
| | |
| | |
| | |
| |
| Percentage of loans and advances by geographical region | 45.6% | | | 9.0% | | | 10.2% | | | 30.2% | | | 5.0% | | | 100.0% | | | | |
| | | | | | | | | | | | | | | | | | | | | | | |
| Impaired loans4 | 6,254 | | | 433 | | | 1,088 | | | 9,662 | | | 2,145 | | | 19,582 | | | | |
| | – | as a percentage of gross loansand advances to customers | 1.4% | | | 0.5% | | | 1.1% | | | 3.2% | | | 4.3% | | | 2.0% | | | | |
| | | | | | | | | | | | | | | | | | | | | |
| Total impairment allowances | 3,931 | | | 376 | | | 926 | | | 11,980 | | | 1,992 | | | 19,205 | | | | |
| | – | as a percentage of total grossloans and advances | 0.9% | | | 0.4% | | | 0.9% | | | 4.0% | | | 4.0% | | | 1.9% | | | | |
| | |
| 1 | Residential mortgages in Hong Kong include Hong Kong Government Home Ownership Scheme loans of US$3,882 million (2007: US$3,942 million). |
205
Back to Contents
| H S B C H O L D I N G S P L C |
| |
| Report of the Directors: Risk (continued) |
| | |
| | |
| Credit risk > Credit exposure > Concentration / Cross-border |
| 2 | Other commercial loans and advances include advances in respect of agriculture, transport, energy and utilities. |
| 3 | Included within this total is credit card lending of US$75,266 million (2007: US$82,854 million). |
| 4 | The 2007 impaired loans for North America have been restated as a result of the reclassification of an element of a credit card portfolio as impaired. There has been no effect on impairment allowances. |
Additional disclosure on gross loans and advances to customers by principal country within Rest of Asia-Pacific and Latin America
(Audited)
| | | | | | | | | | | | Commercial, | | | | |
| | | | | | | | | | | | international | | | | |
| | | Residential | | | Other | | | Property- | | | trade and | | | | |
| | | mortgages | | | personal | | | related | | | other | | | Total | |
| | | US$m | | | US$m | | | US$m | | | US$m | | | US$m | |
| At 31 December 2008 | | | | | | | | | | | | | | | |
| Rest of Asia-Pacific | | | | | | | | | | | | | | | |
| Australia | | 3,598 | | | 783 | | | 1,621 | | | 3,350 | | | 9,352 | |
| India | | 1,112 | | | 1,482 | | | 493 | | | 3,332 | | | 6,419 | |
| Indonesia | | 27 | | | 527 | | | 26 | | | 1,410 | | | 1,990 | |
| Japan | | 57 | | | 160 | | | 808 | | | 4,818 | | | 5,843 | |
| Mainland China | | 1,303 | | | 12 | | | 2,784 | | | 7,423 | | | 11,522 | |
| Malaysia | | 2,699 | | | 1,624 | | | 941 | | | 4,263 | | | 9,527 | |
| Middle East (excluding Saudi Arabia) | | 1,941 | | | 5,583 | | | 3,018 | | | 17,167 | | | 27,709 | |
| Egypt | | – | | | 275 | | | 125 | | | 2,106 | | | 2,506 | |
| United Arab Emirates | | 1,693 | | | 3,748 | | | 2,118 | | | 10,214 | | | 17,773 | |
| Other Middle East | | 248 | | | 1,560 | | | 775 | | | 4,847 | | | 7,430 | |
| Singapore | | 4,209 | | | 3,301 | | | 2,448 | | | 3,521 | | | 13,479 | |
| South Korea | | 2,153 | | | 682 | | | 34 | | | 2,497 | | | 5,366 | |
| Taiwan | | 2,217 | | | 705 | | | 14 | | | 1,497 | | | 4,433 | |
| Other | | 869 | | | 2,367 | | | 1,085 | | | 9,222 | | | 13,543 | |
| | |
| | |
| | |
| | |
| | |
| |
| | | 20,185 | | | 17,226 | | | 13,272 | | | 58,500 | | | 109,183 | |
| | |
| | |
| | |
| | |
| | |
| |
| Latin America | | | | | | | | | | | | | | | |
| Argentina | | 41 | | | 707 | | | 60 | | | 1,648 | | | 2,456 | |
| Brazil | | 376 | | | 8,585 | | | 694 | | | 9,578 | | | 19,233 | |
| Mexico | | 2,150 | | | 3,665 | | | 1,024 | | | 6,094 | | | 12,933 | |
| Panama | | 1,105 | | | 1,076 | | | 569 | | | 1,877 | | | 4,627 | |
| Other | | 816 | | | 1,142 | | | 452 | | | 2,628 | | | 5,038 | |
| | |
| | |
| | |
| | |
| | |
| |
| | | 4,488 | | | 15,175 | | | 2,799 | | | 21,825 | | | 44,287 | |
| | |
| | |
| | |
| | |
| | |
| |
| At 31 December 2007 | | | | | | | | | | | | | | | |
| Rest of Asia-Pacific | | | | | | | | | | | | | | | |
| Australia | | 4,376 | | | 922 | | | 2,065 | | | 3,998 | | | 11,361 | |
| India | | 1,545 | | | 1,721 | | | 339 | | | 3,723 | | | 7,328 | |
| Indonesia | | 24 | | | 497 | | | 12 | | | 1,171 | | | 1,704 | |
| Japan | | 29 | | | 126 | | | 566 | | | 3,541 | | | 4,262 | |
| Mainland China | | 500 | | | 6 | | | 1,746 | | | 9,443 | | | 11,695 | |
| Malaysia | | 2,632 | | | 1,508 | | | 787 | | | 4,024 | | | 8,951 | |
| Middle East (excluding Saudi Arabia) | | 1,036 | | | 4,441 | | | 2,870 | | | 13,536 | | | 21,883 | |
| Egypt | | – | | | 196 | | | 126 | | | 1,575 | | | 1,897 | |
| United Arab Emirates | | 895 | | | 2,936 | | | 2,159 | | | 8,222 | | | 14,212 | |
| Other Middle East | | 141 | | | 1,309 | | | 585 | | | 3,739 | | | 5,774 | |
| Singapore | | 3,946 | | | 3,403 | | | 1,712 | | | 2,471 | | | 11,532 | |
| South Korea | | 2,596 | | | 880 | | | 61 | | | 3,608 | | | 7,145 | |
| Taiwan | | 2,061 | | | 648 | | | – | | | 1,072 | | | 3,781 | |
| Other | | 1,652 | | | 2,361 | | | 2,098 | | | 7,025 | | | 13,136 | |
| | |
| | |
| | |
| | |
| | |
| |
| | | 20,397 | | | 16,513 | | | 12,256 | | | 53,612 | | | 102,778 | |
| | |
| | |
| | |
| | |
| | |
| |
| Latin America | | | | | | | | | | | | | | | |
| Argentina | | 47 | | | 611 | | | 75 | | | 1,841 | | | 2,574 | |
| Brazil | | 329 | | | 10,110 | | | 426 | | | 8,601 | | | 19,466 | |
| Mexico | | 2,208 | | | 4,696 | | | 1,434 | | | 10,476 | | | 18,814 | |
| Panama | | 1,098 | | | 963 | | | 593 | | | 1,585 | | | 4,239 | |
| Other | | 642 | | | 1,076 | | | 491 | | | 2,613 | | | 4,822 | |
| | |
| | |
| | |
| | |
| | |
| |
| | | 4,324 | | | 17,456 | | | 3,019 | | | 25,116 | | | 49,915 | |
| | |
| | |
| | |
| | |
| | |
| |
206
Back to Contents
Loans and advances to banks by geographical region
(Audited: 2008 to 2005; Unaudited: 2004)
| | | | | | | | | | | | | Gross | | | |
| | | | | | | Rest of | | | | | | loans and | | | |
| | | | | Hong | | Asia- | | North | | Latin | | advances | | Impairment | |
| | | Europe | | Kong | | Pacific | | America | | America | | to banks | | allowances | 1 |
| | | US$m | | US$m | | US$m | | US$m | | US$m | | US$m | | US$m | |
| | | | | | | | | | | | | | | | |
| At 31 December 2008 | | 62,012 | | 29,646 | | 36,141 | | 11,458 | | 14,572 | | 153,829 | | (63 | ) |
| At 31 December 2007 | | 104,534 | | 63,737 | | 39,861 | | 16,566 | | 12,675 | | 237,373 | | (7 | ) |
| At 31 December 2006 | | 76,837 | | 50,359 | | 27,517 | | 17,865 | | 12,634 | | 185,212 | | (7 | ) |
| At 31 December 2005 | | 44,369 | | 42,751 | | 19,559 | | 10,331 | | 8,964 | | 125,974 | | (9 | ) |
| At 31 December 2004 | | 56,063 | | 45,710 | | 14,890 | | 20,911 | | 5,892 | | 143,466 | | (17 | ) |
| | | | | | | | | | | | | | | | |
| 1 | 2004: provisions for bad and doubtful debts. | |
| | | |
Country distribution of outstandings and cross-border exposures
(Unaudited)
HSBC controls the risk associated with cross-border lending, essentially that foreign currency will not be made available to local residents to make payments, through a centralised structure of internal country limits which are determined by taking into account relevant economic and political factors. Exposures to individual countries and cross-border exposure in aggregate are kept under continual review.
The following table summarises the aggregate of in-country foreign currency and cross-border outstandings by type of borrower to countries which
individually represent in excess of 1 per cent of HSBC’s total assets. The classification is based on the country of residence of the borrower but also recognises the transfer of country risk in respect of third-party guarantees, eligible collateral held and residence of the head office when the borrower is a branch. In accordance with the Bank of England Country Exposure Report (Form CE) guidelines, outstandings comprise loans and advances (excluding settlement accounts), amounts receivable under finance leases, acceptances, commercial bills, CDs and debt and equity securities (net of short positions), and exclude accrued interest and intra-HSBC exposures.
In-country foreign currency and cross-border amounts outstanding
(Unaudited) |
| | | | | | | | | | |
| | | | | Government | | | | | |
| | | | | and official | | | | | |
| | | Banks | | institutions | | Other | | Total | |
| | | US$bn | | US$bn | | US$bn | | US$bn | |
| At 31 December 2008 | | | | | | | | | |
| UK | | 38.4 | | 7.1 | | 33.8 | | 79.3 | |
| US | | 13.6 | | 26.4 | | 34.1 | | 74.1 | |
| Germany | | 19.9 | | 12.1 | | 7.9 | | 39.9 | |
| France | | 18.9 | | 8.0 | | 6.7 | | 33.6 | |
| The Netherlands | | 14.1 | | 1.9 | | 10.3 | | 26.3 | |
| | | | | | | | | | |
| At 31 December 2007 | | | | | | | | | |
| UK | | 32.3 | | 2.2 | | 47.5 | | 82.0 | |
| US | | 14.0 | | 11.4 | | 29.5 | | 54.9 | |
| France | | 38.8 | | 1.7 | | 1.9 | | 42.4 | |
| Germany | | 30.3 | | 5.9 | | 5.6 | | 41.8 | |
| The Netherlands | | 21.4 | | 0.2 | | 4.2 | | 25.8 | |
| | | | | | | | | | |
| At 31 December 2006 | | | | | | | | | |
| UK | | 24.8 | | – | | 33.5 | | 58.3 | |
| Germany | | 23.7 | | 18.9 | | 2.0 | | 44.6 | |
| US | | 9.5 | | 12.7 | | 16.2 | | 38.4 | |
| France | | 22.1 | | 2.4 | | 6.1 | | 30.6 | |
| The Netherlands | | 14.4 | | 2.1 | | 3.9 | | 20.4 | |
| Italy | | 4.7 | | 12.5 | | 1.4 | | 18.6 | |
207
Back to Contents
| H S B C H O L D I N G S P L C |
| |
| Report of the Directors: Risk(continued) |
| | |
| | |
| Credit risk > Exposure |
At 31 December 2008, HSBC had in-country foreign currency and cross-border amounts outstanding to counterparties in Japan of between 0.75 per cent and 1.0 per cent of total assets; in aggregate, US$24.4 billion.
At 31 December 2007, HSBC had in-country foreign currency and cross-border amounts outstanding to counterparties in Hong Kong, Belgium and Ireland of between 0.75 per cent and 1.0 per cent of total assets. The aggregate in-country foreign currency and cross-border amounts outstanding were Hong Kong, US$19.7 billion, Belgium, US$19.3 billion and Ireland, US$19.3 billion.
At 31 December 2006, HSBC had in-country foreign currency and cross-border amounts outstanding to counterparties in Australia and Hong Kong of between 0.75 per cent and 1 per cent of total assets. The aggregate in-country foreign currency and cross-border amounts outstanding were Australia, US$17.1 billion, Hong Kong, US$13.9 billion.
Areas of special interest
Personal lending
(Unaudited)
HSBC provides a broad range of secured and unsecured personal lending products to meet customer needs. Given the diverse nature of the markets in which HSBC operates, the range is not standardised across all countries but is tailored to meet the demands of individual markets while using appropriate distribution channels and, wherever possible, common global IT platforms.
Personal lending includes advances to customers for asset purchase, such as residential property and motor vehicles, where the loans are typically secured on the assets being acquired. HSBC also offers loans secured on existing assets, such as first and second liens on residential property; unsecured lending products such as overdrafts, credit cards and payroll loans; and debt consolidation loans which may be secured or unsecured. At the end of February 2009, HSBC authorised the discontinuation as soon as
practicable of all new receivable originations of all products by the branch-based consumer lending business of HSBC Finance in North America (see page 70).
Various underwriting controls are applied before a loan is issued, and delinquency is managed through collection and customer management procedures. The expected occurrence and degree of delinquency varies according to the type of loan and the customer segment. Delinquency levels tend to increase in the normal course of portfolio ageing. As a result, loan impairment charges usually relate to lending originated in earlier accounting periods.
As discussed in ‘Challenges and uncertainties’ on page 12, rising unemployment has been the major factor in the deterioration in credit quality of personal lending portfolios in 2008. Further weakening in consumers’ confidence and capacity to service financial commitments may result in deteriorating payment patterns and increased delinquencies and default rates and, as a consequence, higher loan impairment allowances and write-offs. HSBC monitors the effect of these factors on its personal lending portfolios and keeps under review a range of measures designed to limit the Group’s exposure and mitigate the effect on customers.
Loan impairment allowances are sensitive to changes in the level of unemployment, particularly at the current time in North America, which affects customers’ future ability to repay their loans. For example, had there been an additional 1 per cent increase in unemployment in North America, loan impairment allowances could have been higher by between US$0.7 billion and US$1.5 billion as at 31 December 2008. The relationship between changes in unemployment and loan impairment charges cannot be predicted with any degree of certainty. For example, sharp increases in unemployment may not have a linear impact on the level of increase in loan impairment charges.
Please refer to page 205 for further analysis of gross loans and advances by region and pages 34 and 229 for discussion of loan impairment charges and other credit risk provisions.
208
Back to Contents
Total personal lending
(Unaudited)
| | | | | | | | | | | | | | Hong Kong, | | | | |
| | | | | | | | | | | | | | Rest of | | | | |
| | | | | | | | | | | Rest of | | | Asia-Pacific | | | | |
| | | | | Rest of | | | | | | North | | | and Latin | | | | |
| | UK | | | Europe | | | US | 1 | | America | | | America | | | Total | |
| | US$m | | | US$m | | | US$m | | | US$m | | | US$m | | | US$m | |
| At 31 December 2008 | | | | | | | | | | | | | | | | | |
| Total personal lending | 107,620 | | | 33,912 | | | 170,508 | | | 25,026 | | | 103,161 | | | 440,227 | |
| Residential mortgages | 78,346 | | | 8,921 | | | 80,946 | | | 17,437 | | | 57,687 | | | 243,337 | |
| Other personal lending | 29,274 | | | 24,991 | | | 89,562 | | | 7,589 | | | 45,474 | | | 196,890 | |
| – motor vehicle finance | – | | | 99 | | | 10,864 | | | 137 | | | 6,201 | | | 17,301 | |
| – credit cards | 11,215 | | | 1,695 | | | 46,972 | | | 1,469 | | | 13,426 | | | 74,777 | |
| – second lien mortgages | 1,160 | | | 2 | | | 14,614 | | | 803 | | | 503 | | | 17,082 | |
| – other | 16,899 | | | 23,195 | | | 17,112 | | | 5,180 | | | 25,344 | | | 87,730 | |
| At 31 December 2007 | | | | | | | | | | | | | | | | | |
| Total personal lending | 128,400 | | | 40,149 | | | 199,336 | | | 31,226 | | | 101,723 | | | 500,834 | |
| Residential mortgages | 85,356 | | | 10,309 | | | 98,928 | | | 20,065 | | | 54,410 | | | 269,068 | |
| Other personal lending | 43,044 | | | 29,840 | | | 100,408 | | | 11,161 | | | 47,313 | | | 231,766 | |
| – motor vehicle finance | 71 | | | 156 | | | 13,266 | | | 1,865 | | | 7,563 | | | 22,921 | |
| – credit cards | 15,018 | | | 2,009 | | | 49,634 | | | 1,728 | | | 13,574 | | | 81,963 | |
| – second lien mortgages | 1,930 | | | – | | | 17,590 | | | 1,256 | | | 748 | | | 21,524 | |
| – other | 26,025 | | | 27,675 | | | 19,918 | | | 6,312 | | | 25,428 | | | 105,358 | |
| | |
| 1 | Includes residential mortgages of HSBC Bank USA and HSBC Finance. |
The commentary that follows is on a constant currency basis.
At 31 December 2008, total personal lending was US$440 billion, a decline of 3 per cent from the balance at 31 December 2007. In 2008, personal lending accounted for 85 per cent of the Group’s loan impairment charges and other credit risk provisions. Within personal lending, total loan impairment charges and other credit risk provisions of US$21.2 billion were concentrated in North America (US$16.1 billion) and, to a lesser extent, in Latin America (US$2.1 billion) and Europe (US$2.0 billion). These loan impairment charges represented, respectively, 39 per cent, 5 per cent and 5 per cent of each region’s total Personal Financial Services’ net operating income before loan impairment charges and other credit risk provisions.
Total US personal lending at 31 December 2008 was 15 per cent less than at the end of 2007, at US$171 billion, as HSBC’s strategy to run off its existing portfolio and improve credit quality on new originations took effect. Residential mortgage balances fell by 18 per cent to US$81 billion, driven by decisions taken in 2007 to end new correspondent channel originations in Mortgage Services and limit new originations in the consumer lending business through tighter underwriting standards. Portfolio run-off, charge-off of impaired loans and the sale of
US$8.2 billion of loans during 2008 from the US real estate secured portfolios contributed to these lower balances.
Other personal lending in the US fell by 11 per cent to US$90 billion as a result of actions taken by HSBC since 2007 to reduce risk in the portfolio, including the elimination of guaranteed direct mail loans to new customers, the discontinuance of personal homeowner loans and a general tightening of underwriting criteria. Card balances declined by 5 per cent to US$47 billion as HSBC reduced credit lines, closed dormant accounts and curtailed marketing expenditure, which together lowered originations in line with HSBC’s reduced appetite for risk in this segment at this time.
Motor vehicle finance loans in the US fell by 18 per cent to US$11 billion, again reflecting reduced risk appetite and lower origination. In July, the decision was taken to discontinue all new motor vehicle loan originations from the dealer and direct-to-consumer channels within the North America vehicle finance business of HSBC Finance as management determined that the business was sub-scale and did not have sufficient market strength to provide an acceptable level of risk-adjusted returns.
In the UK, gross loans and advances to personal customers rose by 14 per cent to US$108 billion, due to strong growth in residential mortgage lending following successful campaigns during 2008 at HSBC Bank and First Direct. Other personal lending
209
Back to Contents
| H S B C H O L D I N G S P L C |
| |
| Report of the Directors: Risk (continued) |
| | |
| | |
| Credit risk > Areas of special interest > Mortgage lending |
declined by 11 per cent to US$29 billion, driven by lower originations, reduced marketing activities and lower customer appetite for unsecured borrowing. Credit quality in the unsecured portfolios of M&S Money, HSBC Bank and Partnership Cards in the UK showed a slight deterioration in 2008, particularly in the second half of the year, due to the weakening UK economy.
In Latin America, in response to rising impairment charges and the weaker economic conditions, HSBC moderated loan growth from that achieved in the previous year, with gross loans and advances to personal customers rising by 11 per cent to US$20 billion compared with 31 per cent in 2007. Loan impairment charges were 20 per cent higher in Brazil but 57 per cent higher in Mexico following strong growth in recent years in lending portfolio seasoning and credit deterioration. As a consequence of this experience, in Mexico, HSBC’s other personal lending balances at 31 December 2008 were US$3.7 billion, 1 per cent lower than at 31 December 2007 as management realigned the business towards customers of higher credit quality.
Mortgage lending products
(Unaudited)
The Group offers a wide range of mortgage products designed to meet customer needs, including capital repayment mortgages subject to fixed or variable interest rates and products designed to meet demand for housing loans with more flexible payment structures. HSBC underwrites both first lien residential mortgages and loans secured by second lien mortgages.
Interest-only mortgages are those for which customers make regular payments of interest during the life of the loan and repay the principal from the sale of their home or alternative sources of funds. Introductory interest-only mortgages are typically where the interest-only element is for a fixed term at the start of the loan, after which principal repayments commence.
Affordability mortgages include all products where the customer’s monthly payments are set at a low initial rate, either variable or fixed, before resetting to a higher rate once the introductory period is over. These include adjustable-rate mortgages (‘ARM’s), loans on which the interest rate is periodically changed based on a reference price. HSBC Finance no longer originates or acquires interest-only loans or ARMs.
Affordability mortgages are primarily offered in the US and the UK. Under the HFC and Beneficial brands, HSBC Finance and HFC Bank Ltd (‘HFC UK’) offer a range of products predominantly designed for the needs of customers with nonstandard or less favourable credit profiles. Offset mortgages are products linked to a current or savings account, where the interest earned is used to repay mortgage debt.
US mortgage lending
US mortgage lending, comprising residential mortgage and second lien lending, made up 22 per cent of the Group’s gross loans and advances to personal customers at 31 December 2008.
Balances declined by 18 per cent from 31 December 2007, as the Mortgage Services portfolio continued to run-off and tighter underwriting standards were applied to originations for the consumer lending portfolio. As the bulk of the mortgage lending products sold in the US consumer lending branch network are for refinancing and debt consolidation, rather than for house purchase, the limited availability of home equity severely restricts the number of eligible customers. As a consequence, HSBC began the process of repositioning its consumer lending business in 2008, reducing exposure to lower tiers of sub-prime credit and expanding its range of lending for real estate loans to include both government-sponsored entity and conforming loan products. At the end of February 2009, HSBC authorised the discontinuation as soon as practicable of all new receivable originations of all products by the branch-based consumer lending business of HSBC Finance in North America (see page 70).
Mortgage lending in HSBC USA also declined, following a series of management actions to reduce risk in the portfolio. These included closing the prime wholesale and third-party correspondent mortgage business in November 2008, selling US$7.0 billion in loans during 2008, and continuing to sell newly originated residential mortgages to the US government-sponsored mortgage agencies.
Affordability mortgage balances in HSBC Finance declined from US$19 billion at 31 December 2007 to US$14 billion at 31 December 2008. These mortgages continued to experience the heightened levels of delinquency that began to emerge in late 2006. They are no longer originated through the consumer lending branch network. In aggregate, HSBC Finance’s mortgage balances declined to US$74 billion at 31 December 2008 (31 December 2007: US$87 billion) as set out inthe table on page 211. Within this, the portfolio of real estate secured business originated through the branch network was US$46 billion at 31 December
210
Back to Contents
2008, of which approximately 95 per cent were fixed rate loans and 87 per cent were first lien. At 31 December 2008, the mortgage services business had approximately 250,000 accounts and
US$28 billion in balances outstanding. Approximately 59 per cent were fixed rate loans and 84 per cent were first lien.
Further discussion of credit trends in the US mortgage lending portfolio and management actions taken to mitigate risk is provided in ‘US personal lending – credit quality’ on page 212.
HSBC Finance US mortgage lending1
(Unaudited)
| | At 31 December 2008 | | | At 31 December 2007 | |
| |
| | |
| |
| | | | | | | | Other | | | | | | | | | | | | Other | | | | |
| | Mortgage | | | Consumer | | | mortgage | | | | | | Mortgage | | | Consumer | | | mortgage | | | | |
| | services | | | lending | | | lending | | | Total | | | services | | | lending | | | lending | 2 | | Total | |
| | US$m | | | US$m | | | US$m | | | US$m | | | US$m | | | US$m | | | US$m | | | US$m | |
| | | | | | | | | | | | | | | | | | | | | | | | |
| Fixed-rate | 16,288 | | | 43,873 | | | 91 | | | 60,252 | | | 20,146 | | | 47,254 | | | 106 | | | 67,506 | |
| Other | 11,339 | | | 2,324 | | | 35 | | | 13,698 | | | 16,070 | | | 2,970 | | | 39 | | | 19,079 | |
| Adjustable-rate | 9,530 | | | 2,324 | | | 33 | | | 11,887 | | | 12,361 | | | 2,970 | | | 37 | | | 15,368 | |
| Interest-only | 1,809 | | | – | | | 2 | | | 1,811 | | | 3,709 | | | – | | | 2 | | | 3,711 | |
| | 27,627 | | | 46,197 | | | 126 | | | 73,950 | | | 36,216 | | | 50,224 | | | 145 | | | 86,585 | |
| |
| | |
| | |
| | |
| | |
| | |
| | |
| | |
| |
| First lien | 23,188 | | | 40,334 | | | 93 | | | 63,615 | | | 29,475 | | | 43,366 | | | 108 | | | 72,949 | |
| Second lien | 4,439 | | | 5,863 | | | 33 | | | 10,335 | | | 6,741 | | | 6,858 | | | 37 | | | 13,636 | |
| |
| | |
| | |
| | |
| | |
| | |
| | |
| | |
| |
| | 27,627 | | | 46,197 | | | 126 | | | 73,950 | | | 36,216 | | | 50,224 | | | 145 | | | 86,585 | |
| |
| | |
| | |
| | |
| | |
| | |
| | |
| | |
| |
| Stated income3 | 5,667 | | | – | | | – | | | 5,667 | | | 8,292 | | | – | | | – | | | 8,292 | |
| |
| | |
| | |
| | |
| | |
| | |
| | |
| | |
| |
| | | | | | | | | | | | | | | | | | | | | | | |
| 1 | HSBC Finance mortgage lending is shown on a management basis and includes loans transferred to HSBC USA Inc. which are managed by HSBC Finance. |
| 2 | Restated to show HSBC Finance management basis, consistent with the current year, and US balances only. |
| 3 | Stated income lending forms a subset of total mortgage services lending across all categories. |
UK mortgage lending
Mortgage lending in the UK rose significantly in 2008 and overall credit quality was maintained despite a significant deterioration in the housing market. The withdrawal of many competitors from the market and the consequent repricing of mortgage products allowed HSBC Bank to expand its share of the new lending market while staying within its targeted customer segments. In December 2008, HSBC announced that it will make available up to US$22 billion of new UK residential mortgages in 2009.
Total mortgage lending in the UK rose from US$64 billion at 31 December 2007 to US$80 billion at 31 December 2008. This was driven by the success of the RateMatcher mortgage campaign in the first half of 2008 in generating new business, and an increase at First Direct due to growth in offset mortgage lending following a similarly successful campaign.
The maintenance of good credit quality in difficult market conditions is attributable to the business model pursued by HSBC in the UK. HSBC Bank originates virtually all new business through its own salesforce and does not rely on business introduced through third parties. Also, HSBC does
not allow customer self-certification of income. The majority of lending is to existing customers holding a current or savings account relationship with the bank. At 31 December 2008, less than 2 per cent of the bank’s book consisted of lending to purchase property for rent to third parties, for which the bank applies higher collateral requirements.
In the UK, affordability mortgages have experienced relatively low levels of delinquency, reflecting the different credit profiles of the customers, compared with those in the US, and the tighter underwriting criteria.
Interest-only mortgage balances rose from US$22 billion at 31 December 2007 to US$32 billion at 31 December 2008, driven by an increase in balances at First Direct. The majority of these mortgages were offset mortgages linked to a current account and are classified as interest-only.
Second lien balances, which were all held by HFC UK, declined by US$770 million to US$1.2 billion at 31 December 2008 due to run-off and severely tighter underwriting criteria. In the first half of 2008, HFC UK ceased originating loans through brokers.
The credit quality of the UK mortgage portfolio remained broadly stable as a consequence of thebusiness model and underwriting criteria described
211
Back to Contents
| H S B C H O L D I N G S P L C |
| |
| Report of the Directors:Risk (continued) |
| | |
| | |
| Credit risk > Areas of special interest > Mortgage lending / US personal lending |
above. Additionally, HSBC Bank is now benefiting from having intentionally reduced its market share in 2006 and 2007 as property prices continued to rise. The portion of mortgages with a loan to value ratio greater than 90 per cent declined as virtually no new loans were originated at this level. The average loan to value ratio for new business in 2008 was 58.7 per cent, the lowest for 5 years.
At HSBC Bank, 30 days or more delinquency rates were unchanged from 31 December 2007 to 31 December 2008 at 1.8 per cent.
The following table shows the levels of mortgage lending products in the various portfolios in the US and the UK, together with the rest of the HSBC Group.
Mortgage lending products
(Unaudited)
| | | | | | | | | | Hong Kong, | | | |
| | | | | | | | | | Rest of | | | |
| | | | | | | | Rest of | | Asia-Pacific | | | |
| | | | Rest of | | | | North | | and Latin | | | |
| | UK | | Europe | | US | | America | | America | | Total | |
| | US$m | | US$m | | US$m | | US$m | | US$m | | US$m | |
| At 31 December 2008 | | | | | | | | | | | | |
| Residential mortgages | 78,346 | | 8,921 | | 80,946 | | 17,437 | | 57,687 | | 243,337 | |
| Second lien mortgages | 1,160 | | 2 | | 14,614 | | 803 | | 503 | | 17,082 | |
| |
| |
| |
| |
| |
| |
| |
| Total mortgage lending | 79,506 | | 8,923 | | 95,560 | | 18,240 | | 58,190 | | 260,419 | |
| |
| |
| |
| |
| |
| |
| |
| Second lien as a percentage of total mortgage lending | 1.5% | | 0.0% | | 15.3% | | 4.4% | | 0.9% | | 6.6% | |
| |
| |
| |
|
|
| |
| |
| |
| Interest-only (including endowment) mortgages | 33,782 | | 553 | | – | | 1,427 | | 993 | | 36,755 | |
| Affordability mortgages, including ARMs | 4,740 | | 824 | | 28,571 | | 311 | | 4,166 | | 38,612 | |
| Other | 153 | | – | | – | | – | | 82 | | 235 | |
| |
| |
| |
| |
| |
| |
| |
| Total interest-only and affordability mortgages | 38,675 | | 1,377 | | 28,571 | | 1,738 | | 5,241 | | 75,602 | |
| |
| |
| |
| |
| |
| |
| |
| – as a percentage of total mortgage lending | 48.6% | | 15.4% | | 29.9% | | 9.5% | | 9.0% | | 29.0% | |
| |
| |
| |
| |
| |
| |
| |
| Negative equity mortgages1 | 367 | | – | | 7,655 | | 86 | | 1,635 | | 9,743 | |
| Other loan to value ratios greater than 90 per cent2 | 6,178 | | 107 | | 35,296 | | 1,737 | | 2,122 | | 45,440 | |
| |
| |
| |
| |
| |
| |
| |
| | 6,545 | | 107 | | 42,951 | | 1,823 | | 3,757 | | 55,183 | |
| |
| |
| |
| |
| |
| |
| |
| – as a percentage of total mortgage lending | 8.2% | | 1.2% | | 44.9% | | 10.0% | | 6.5% | | 21.2% | |
| |
| |
| |
| |
| |
| |
| |
| At 31 December 2007 | | | | | | | | | | | | |
| Residential mortgages | 85,356 | | 10,309 | | 98,928 | | 20,065 | | 54,410 | | 269,068 | |
| Second lien mortgages | 1,930 | | – | | 17,590 | | 1,256 | | 748 | | 21,524 | |
| |
| |
| |
| |
| |
| |
| |
| Total mortgage lending | 87,286 | | 10,309 | | 116,518 | | 21,321 | | 55,158 | | 290,592 | |
| |
| |
| |
| |
| |
| |
| |
| Second lien as a percentage of total mortgage lending | 2.2% | | – | | 15.1% | | 5.9% | | 1.4 % | | 7.4% | |
| |
| |
| |
| |
| |
| |
| |
| Interest-only (including endowment) mortgages | 32,314 | | 602 | | – | | 174 | | 1,335 | | 34,425 | |
| Affordability mortgages, including ARMs | 8,695 | | 685 | | 40,201 | | 219 | | 4,993 | | 54,793 | |
| Other3 | 241 | | 27 | | – | | 274 | | 621 | | 1,163 | |
| |
| |
| |
| |
| |
| |
| |
| Total interest-only and affordability mortgages | 41,250 | | 1,314 | | 40,201 | | 667 | | 6,949 | | 90,381 | |
| |
| |
| |
| |
| |
| |
| |
| – as a percentage of total mortgage lending | 47.3% | | 12.7% | | 34.5 % | | 3.1% | | 12.6% | | 31.1% | |
| |
| |
| |
| |
| |
| |
| |
| Negative equity mortgages1 | 646 | | – | | 11,079 | | 107 | | 525 | | 12,357 | |
| Other loan to value ratios greater than 90 per cent2 | 10,969 | | 211 | | 42,246 | | 679 | | 1,333 | | 55,438 | |
| |
| |
| |
| |
| |
| |
| |
| | 11,615 | | 211 | | 53,325 | | 786 | | 1,858 | | 67,795 | |
| |
| |
| |
| |
| |
| |
| |
| – as a percentage of total mortgage lending | 13.3% | | 2.0 % | | 45.8% | | 3.7% | | 3.4% | | 23.3% | |
| |
| |
| |
| |
| |
| |
| |
| | | | | | | | | | | | | |
| 1 | Negative equity arises when the value of the loan exceeds the value of available equity, generally based on values at origination date. |
| 2 | Loan to value ratios are generally based on values at origination date. |
| 3 | Balances at 31 December 2007 have been restated to exclude mortgages in the UK that are fixed for a period of time before reverting to a standard variable rate. |
US personal lending – credit quality
(Unaudited)
The deterioration in credit quality which began in the sub-prime mortgage portfolio in 2006 accelerated in
2008 and spread across the remainder of the US personal lending portfolio as the economy weakened, levels of unemployment and personal bankruptcy filings rose, and house price depreciation became more pronounced (the S&P/Case-Shiller 10-City Composite Index of house prices showed a
212
Back to Contents
decline of 19 per cent in 2008). These factors restricted the ability of many customers to refinance and access equity retained in their homes.
Two months or more delinquencies in mortgages originated through the HSBC Finance
branch network rose most rapidly in those states most severely affected by continued house price depreciation and rising unemployment, particularly in California, Florida, New York, Virginia, Maryland, New Jersey, Illinois, Pennsylvania, Massachusetts and Ohio.
HSBC Finance: geographical concentration of US lending1, 2
(Unaudited)
| | Mortgage lending as a | | Other personal lending as a | | | |
| | percentage of: | | percentage of: | | | |
| |
| |
| | | |
| | | | total | | | | total other | | Percentage | |
| | total | | mortgage | | total | | personal | | of total | |
| | lending | | lending | | lending | | lending | | lending | |
| | % | | % | | % | | % | | % | |
| | | | | | | | | | | |
| California | 6 | | 11 | | 6 | | 12 | | 12 | |
| Florida | 4 | | 7 | | 3 | | 7 | | 7 | |
| New York | 3 | | 6 | | 3 | | 6 | | 6 | |
| Texas | 2 | | 3 | | 4 | | 8 | | 6 | |
| Ohio | 3 | | 5 | | 2 | | 5 | | 5 | |
| Pennsylvania | 3 | | 5 | | 2 | | 5 | | 5 | |
| | | | | | | | | | | |
| 1 | By states which individually account for 5 per cent or more of HSBC Finance’s US customer loan portfolio. |
| 2 | HSBC Finance lending is shown on a management basis and includes loans transferred to HSBC USA Inc, which are managed by HSBC Finance. |
| | |
In the US real estate secured portfolios, two months and over contractual delinquency ratios at the end of 2008 were higher across the portfolio than during 2007 and the first half of 2008, for the reasons described above. There was also a significant effect on delinquency ratios from declining balances. As the portfolios aged, outstanding balances fell as new lending in certain portfolios ceased, risk mitigation efforts and changes to product offerings which began in 2007 and continued in 2008 resulted in lower originations and US$8.2 billion in mortgage portfolios were sold during the year.
Both dollar and percentage two months and over contractual delinquency in the real estate secured portfolios of HSBC Finance and HSBC USA increased following a voluntary one month suspension of final court proceedings in foreclosure cases relating to owner-occupied properties, implemented in December 2008, which was in addition to actions taken by a number of states to slow foreclosure proceedings. Within these portfolios, dollar delinquencies rose sharply in 2008 as credit quality in the consumer lending portfolio, most notably for first lien products, and in mortgage services, continued to deteriorate, particularly in the second half of the year. In mortgage services, the rise in the fourth quarter of 2008 was despite lower balances following portfolio run-off and the sale of portfolios during the year, and was partly caused by the above-mentioned action on foreclosure.
Residential mortgages
The unprecedented turmoil in the mortgage lending market continued in 2008. Investors remained unwilling to purchase securitised credit, and this resulted in a sharp contraction in the supply of liquidity to the mortgage market. Progressively fewer refinancing options were available for customers as house prices fell and housing equity declined, a number of market participants exited the sub-prime mortgage industry, and the remaining providers tightened their underwriting criteria.
Equity withdrawal had been the principal source of credit available to sub-prime borrowers dealing with unforeseen financial needs. With this source of funds heavily restricted, consumers faced increasing difficulty in maintaining their contractual payment schedules as they confronted the challenges of rising unemployment and increases in the costs of living, particularly in the first half of the year. Compounding the situation, mortgage interest rates remained high for much of 2008 as credit spreads on interbank lending widened due to the turmoil in the global financial system.
The increase in delinquency rates was accompanied by a rise in loss severities as falling house prices led to a reduction in the amounts recoverable from foreclosure and repossession. These factors were partly offset by a decline in lending balances as HSBC continued to manage down exposure in the US.
213
Back to Contents
| H S B C H O L D I N G S P L C |
| |
| Report of the Directors:Risk (continued) |
| | |
| | |
| Credit risk > Areas of special interest > US personal lending / Loan delinquency in US |
Second lien loans have a risk profile characterised by higher loan-to-value ratios because, in many cases, the second lien loan was taken out to complete the refinancing or purchase of the property. For HSBC Finance second lien mortgages, the proportion of customers two months or more behind on contractual payments rose from 11.2 per cent at 31 December 2007 to 15.9 per cent at 31 December 2008. Loss on default of second lien loans typically approaches 100 per cent of the amount owed as any equity in the property is applied initially to the first lien loan, particularly during periods of house price depreciation when its value is eroded to the point where there is no surplus available to support the repayment of second liens.
Stated-income mortgages, which represented a small part of the HSBC Finance loan book, also continued to decline. These mortgages are of higher than average risk as they are underwritten on the basis of borrowers’ representations of annual income and are not verified by receipt of supporting documentation. These loan balances declined from US$8.3 billion at 31 December 2007 to US$5.7 billion at 31 December 2008. Two months or more delinquency rates on stated-income loans rose from 19.0 per cent at 31 December 2007 to 27.7 per cent at 31 December 2008. The percentage rise was primarily attributable to lower balances and portfolio ageing as the portfolio continued to run off.
In the mortgage services business, credit quality continued to deteriorate as 2005 and 2006 vintages continued to season and move into later stages of delinquency as economic conditions worsened. Amounts of two months or more delinquency in mortgage services rose by 9 per cent during the year to US$4.7 billion at 31 December 2008. These represented an increased proportion of a reducing portfolio, rising from 11.9 per cent to 17.0 per cent. An increase in foreclosures in process during the fourth quarter, arising from a voluntary one month suspension of final court proceedings in foreclosure cases relating to owner occupied properties, implemented in December 2008 and the actions taken by a number of states to slow foreclosure proceedings, affected total lending in mortgage services at 31 December 2008.
HSBC undertook several actions during 2008 to reposition HSBC Finance, including closure of more than 200 consumer lending branches, reducing the network to approximately 800 branches, and tightening credit criteria for originations. These actions followed the decisions taken in 2007 to cease purchasing mortgages from third-party correspondents and to close the wholesale business, Decision One, in September 2007, thereby ending new originations for the mortgage services business.
The branch-based consumer lending business continued to experience rising delinquency levels, particularly on first lien loans in the states most exposed to falling house prices and rising unemployment; 63 per cent of the increase in amounts of two months or more contractual delinquency was concentrated in the ten states noted above. Delinquencies rose across all vintages, with the most pronounced increase for first lien loans extended in 2006 and 2007. This trend was experienced across the rest of the industry in the US. Two months or more delinquencies rose from 4.2 per cent of loans and advances at 31 December 2007 to 12.1 per cent at 31 December 2008 and delinquent balances increased to US$5.6 billion. In this environment, HSBC took additional measures to tighten underwriting standards, including reducing the loan to value ratio for residential mortgages, ceasing to underwrite certain products and raising the credit requirements for certain risk factors. As a result, originations declined to 38 per cent of the levels recorded in 2007.
At HSBC USA, delinquencies rose as credit quality deterioration was experienced across the real estate secured portfolio, driven by house price depreciation and the US economic weakness. Delinquency rates of prime first lien mortgages were also affected by the sale of US$7.0 billion of mortgage portfolios during the year. Originations declined as HSBC’s risk appetite in the US reduced. Two months or more delinquencies in prime first lien mortgages rose from 1.1 per cent at 31 December 2007 to 3.4 per cent at 31 December 2008, and in second lien mortgages from 1.8 per cent to 3.5 per cent over the same period, on a management basis. The rise in delinquency was appreciably worse in third-party originations and, in response, HSBC USA closed its wholesale and third-party correspondent mortgage business in November 2008, curtailed certain stated-income mortgage products, tightened underwriting criteria and sold US$7.0 billion of mortgage portfolios during 2008. As a result, stated-income mortgage balances declined from US$2.4 billion at 31 December 2007 to US$2.2 billion at 31 December 2008.
HSBC has been proactive in approaching customers to provide financial assistance in restructuring their debts to avoid foreclosure and, as a result, HSBC has restructured and modified loans that it believes could be serviced on revised terms. For further details, see ‘US loan modifications’ on page 216.
The aggregate balances of loans which reached their first interest rate reset continued to decline in 2008. As interest rates fall, the effect of the reset on affordability becomes less pronounced.
214
Back to Contents
Credit cards
US credit card portfolio two or more months delinquencies rose from 5.7 per cent at 31 December 2007 to 6.6 per cent at 31 December 2008. In the private label cards portfolio, two or more months delinquencies rose from 3.4 per cent at 31 December 2007 to 4.3 per cent at 31 December 2008. Higher delinquency rates in both portfolios were driven by continued deterioration in the US economy, significantly higher unemployment rates, portfolio seasoning and higher levels of personal bankruptcy filings.
Motor vehicle finance
Two months or more delinquencies in vehicle finance rose from 3.7 per cent at 31 December 2007 to 5.0 per cent at 31 December 2008, in part due to portfolio ageing following the decision in July 2008 to cease new originations in HSBC Finance
from the dealer and direct-to-consumer channels, having earlier terminated a number of dealer relationships, particularly in the Northeast of the US.
Other personal lending
Higher delinquency rates were experienced in the HSBC Finance unsecured lending portfolio, excluding credit cards. The increase was driven by a deterioration in credit quality due to the weakness in the US economy, combined with portfolio seasoning as the lending book aged. Balances declined due to tightened credit criteria which resulted in lower originations. Management actions were taken in 2007 and continued in 2008 to reduce risk in the portfolio including the tightening of underwriting criteria.
The following tables provide a detailed analysis of loan delinquency in the US.
Two months and over contractual delinquency1
(Unaudited)
| | Quarter ended | |
| |
| |
| | 31 | | | 30 | | | 30 | | | 31 | | | 31 | | | 30 | | | 30 | | | 31 | |
| | December | | | September | | | June | | | March | | | December | | | September | | | June | | | March | |
| | 2008 | | | 2008 | | | 2008 | | | 2008 | | | 2007 | | | 2007 | | | 2007 | | | 2007 | |
| | US$m | | | US$m | | | US$m | | | US$m | | | US$m | | | US$m | | | US$m | | | US$m | |
| | | | | | | | | | | | | | | | | | | | | | | | |
| In Personal Financial Services in the US | | | | | | | | | | | | | | | | | | | | | | | |
| Residential mortgages | 9,236 | | | 7,061 | | | 5,984 | 2 | | 5,757 | 2 | | 5,167 | 2 | | 4,077 | | | 3,183 | | | 2,871 | |
| Second lien mortgage lending | 1,790 | | | 1,616 | | | 1,585 | | | 1,638 | | | 1,602 | | | 1,249 | | | 945 | | | 872 | |
| Vehicle finance | 541 | | | 512 | | | 445 | | | 370 | | | 488 | | | 451 | | | 384 | | | 302 | |
| Credit card | 2,029 | | | 1,871 | | | 1,700 | | | 1,782 | | | 1,830 | | | 1,581 | | | 1,314 | | | 1,274 | |
| Private label | 701 | | | 624 | | | 590 | | | 591 | | | 598 | | | 536 | | | 434 | | | 429 | |
| Personal non-credit card | 2,998 | | | 2,745 | | | 2,606 | | | 2,650 | | | 2,634 | | | 2,238 | | | 2,000 | | | 1,881 | |
| |
| | |
| | |
| | |
| | |
| | |
| | |
| | |
| |
| Total | 17,295 | | | 14,429 | | | 12,910 | | | 12,788 | | | 12,319 | | | 10,132 | | | 8,260 | | | 7,629 | |
| |
| | |
| | |
| | |
| | |
| | |
| | |
| | |
| |
| | % | 3 | | % | 3 | | % | 3 | | % | 3 | | % | 3 | | % | 3 | | % | 3 | | % | 3 |
| Residential mortgages | 11.42 | | | 8.23 | | | 6.65 | 2 | | 5.96 | 2 | | 5.23 | 2 | | 4.04 | | | 3.10 | | | 2.70 | |
| Second lien mortgage lending | 12.26 | | | 10.59 | | | 9.83 | | | 9.76 | | | 9.10 | | | 6.86 | | | 5.07 | | | 4.44 | |
| Vehicle finance | 4.98 | | | 4.27 | | | 3.48 | | | 2.83 | | | 3.68 | | | 3.40 | | | 2.91 | | | 2.30 | |
| Credit card | 6.64 | | | 6.07 | | | 5.57 | | | 5.81 | | | 5.68 | | | 5.09 | | | 4.32 | | | 4.43 | |
| Private label | 4.26 | | | 3.97 | | | 3.65 | | | 3.66 | | | 3.43 | | | 3.28 | | | 2.72 | | | 2.65 | |
| Personal non-credit card | 17.70 | | | 15.31 | | | 14.00 | | | 13.71 | | | 13.16 | | | 10.88 | | | 9.69 | | | 9.33 | |
| Total | 10.16 | | | 8.13 | | | 7.01 | | | 6.64 | | | 6.18 | | | 5.05 | | | 4.10 | | | 3.74 | |
215
Back to Contents
| H S B C H O L D I N G S P L C |
| |
| Report of the Directors: Risk(continued) |
| | |
| | |
| Credit risk > Areas of special interest > Renegotiated loans // Credit quality |
Two months and over contractual delinquency1(continued)
(Unaudited)
| | Quarter ended | |
| |
| |
| | 31 | | | 30 | | | 30 | | | 31 | | | 31 | | | 30 | | | 30 | | | 31 | |
| | December | | | September | | | June | | | March | | | December | | | September | | | June | | | March | |
| | 2008 | | | 2008 | | | 2008 | | | 2008 | | | 2007 | | | 2007 | | | 2007 | | | 2007 | |
| | US$m | | | US$m | | | US$m | | | US$m | | | US$m | | | US$m | | | US$m | | | US$m | |
| | | | | | | | | | | | | | | | | | | | | | | | |
In mortgage services and consumer lending | | | | | | | | | | | | | | | | | | | | | | | |
| Mortgage services: | | | | | | | | | | | | | | | | | | | | | | | |
| – first lien | 3,912 | | | 3,420 | | | 3,363 | | | 3,456 | | | 3,248 | | | 2,554 | | | 2,099 | | | 1,863 | |
| – second lien | 787 | | | 807 | | | 897 | | | 1,028 | | | 1,050 | | | 841 | | | 663 | | | 613 | |
| |
| | |
| | |
| | |
| | |
| | |
| | |
| | |
| |
| Total mortgage services | 4,699 | | | 4,227 | | | 4,260 | | | 4,484 | | | 4,298 | | | 3,395 | | | 2,762 | | | 2,476 | |
| |
| | |
| | |
| | |
| | |
| | |
| | |
| | |
| |
| Consumer lending: | | | | | | | | | | | | | | | | | | | | | | | |
| – first lien | 4,724 | | | 3,176 | | | 2,194 | | | 1,954 | | | 1,622 | | | 1,259 | | | 907 | | | 832 | |
| – second lien | 853 | | | 690 | | | 583 | | | 530 | | | 478 | | | 346 | | | 236 | | | 220 | |
| |
| | |
| | |
| | |
| | |
| | |
| | |
| | |
| |
| Total consumer lending | 5,577 | | | 3,866 | | | 2,777 | | | 2,484 | | | 2,100 | | | 1,605 | | | 1,143 | | | 1,052 | |
| |
| | |
| | |
| | |
| | |
| | |
| | |
| | |
| |
| | % | 3 | | % | 3 | | % | 3 | | % | 3 | | % | 3 | | % | 3 | | % | 3 | | % | 3 |
| Mortgage services: | | | | | | | | | | | | | | | | | | | | | | | |
| – first lien | 16.87 | | | 14.16 | | | 12.91 | | | 12.41 | | | 11.02 | | | 8.13 | | | 6.33 | | | 4.98 | |
| – second lien | 17.72 | | | 16.62 | | | 16.63 | | | 16.99 | | | 15.57 | | | 11.28 | | | 7.91 | | | 6.59 | |
| Total mortgage services | 17.01 | | | 14.57 | | | 13.55 | | | 13.22 | | | 11.87 | | | 8.73 | | | 6.65 | | | 5.30 | |
| Consumer lending: | | | | | | | | | | | | | | | | | | | | | | | |
| – first lien | 11.71 | | | 7.72 | | | 5.15 | | | 4.52 | | | 3.74 | | | 2.92 | | | 2.15 | | | 2.03 | |
| – second lien | 14.54 | | | 11.27 | | | 9.04 | | | 7.96 | | | 6.97 | | | 5.03 | | | 3.60 | | | 3.34 | |
| Total consumer lending | 12.07 | | | 8.18 | | | 5.66 | | | 4.98 | | | 4.18 | | | 3.21 | | | 2.34 | | | 2.21 | |
| | |
| 1 | Delinquency data for the period from 31 March 2007 to 30 June 2008 has been restated to include certain delinquent mortgage loans that were previously excluded due to system coding within the mortgage services loan servicing platform which had the effect of excluding certain delinquent mortgage loans from the calculation of delinquency ratios. This change affected mortgage services’ first and second lien delinquency percentages above. The effect on previously reported amounts was not material. |
| 2 | Delinquency data for the periods ending 31 December 2007 to 30 June 2008 has been restated to exclude certain delinquency balances of HSBC USA which related to residential mortgages classified as held for sale. |
| 3 | Expressed as a percentage of the relevant balance. |
| | |
Renegotiated loans
(Audited)
Restructuring activity is designed to manage customer relationships, maximise collection opportunities and, if possible, avoid foreclosure or repossession. Such activities include extended payment arrangements, approved external debt management plans, deferring foreclosure, modification, loan rewrites and/or deferral of payments pending a change in circumstances. Following restructuring, an overdue consumer account is normally reset from delinquent to current status. Restructuring policies and practices are based on indicators or criteria which, in the judgement of local management, indicate that repayment will probably continue. These policies are required to be kept under continual review and their application varies according to the nature of the market, the product, and the availability of empirical data. Criteria vary between products, but typically include receipt of one or more or, in the case of HSBC Finance, two or more, qualifying payments within a certain period, a minimum lapse of time from origination before restructuring may occur, and restrictions on the number and/or frequency of
successive restructurings. When empirical evidence indicates an increased propensity to default on restructured accounts, the use of roll rate methodology ensures this factor is taken into account when calculating impairment allowances.
Renegotiated loans that would otherwise be past due or impaired totalled US$35 billion at 31 December 2008 (2007: US$28 billion). Restructuring is most commonly applied to consumer finance portfolios. The largest concentration was in the US and amounted to US$31 billion (2007: US$24 billion) or 89 per cent (2007: 86 per cent) of the Group’s total renegotiated loans. The increase was due to a significant deterioration in credit quality in the US, where most restructurings related to loans secured on real estate.
US loan modifications
(Unaudited)
In 2008, HSBC Finance continued to refine and expand its customer account management policies and practices. Through its ARM Reset Modification Programme, established in October 2006, HSBC Finance proactively contacts customers who have
216
Back to Contents
ARM loans nearing their first reset that HSBC Finance expects will be the most affected by a rate adjustment. By a variety of means, HSBC Finance assesses the customer’s ability to make the adjusted payment and, as appropriate and in accordance with defined policies, HSBC Finance modifies the loans, allowing time for the customer to seek alternative financing or improve their individual situation. These loan modifications primarily provide for temporary interest rate relief for up to 12 months by either maintaining the current interest rate for that period or resetting the interest rate to one lower than that originally required at the reset date. At the end of the relief period, the interest rate on the loan will reset in accordance with the original loan terms, unless the borrower qualifies for, and is granted, a further modification. These loans are not included in the renegotiated loans figures quoted above, because they were not contractually delinquent at the time of the modification.
HSBC Finance also significantly expanded its Foreclosure Avoidance and Account Modification Programmes designed to provide relief to qualifying home owners by either loan restructuring or modification. Following a strategic review, in the first quarter of 2008 these programmes were expanded in the consumer lending business, to help those customers who did not qualify for assistance under previous programmes, and to help customers who required greater assistance than that available
under previous programmes. Innovations included lowering the interest rate for qualifying customers on fixed rate loans as well as ARMs, and implementing longer term modifications, providing assistance generally for two to five years. Under these expanded programmes, HSBC Finance modified over 92,000 loans in 2008 with an aggregate balance of US$13.5 billion. The ARM Reset Modification Programme covered some 13,000 loans, with an aggregate value of US$2.1 billion.
HSBC Finance also supports a variety of national and local efforts in home ownership preservation and foreclosure avoidance.
Credit quality of financial instruments
(Audited)
The four credit quality classifications set out and defined below describe the credit quality of HSBC’s lending, debt securities portfolios and derivatives. These classifications each encompass a range of more granular, internal credit rating grades assigned to wholesale and retail lending business, as well as the external ratings attributed by external agencies to debt securities.
There is no direct correlation between the internal and external ratings at granular level, except to the extent each falls within a single quality classification.
| Credit quality of HSBC’s lending, debt securities and other bills | | | | | |
| | Wholesale | | | | Debt |
| | lending and | | Retail | | securities |
| | derivatives | | lending | 1 | /other |
| Quality classification | | | | | |
| Strong | CRR1 to CRR2 | | EL1 to EL2 | | A- and above |
| Medium | CRR3 to CRR5 | | EL3 to EL5 | | B+ to BBB+, |
| | | | | | and unrated |
| Sub-standard | CRR6 to CRR8 | | EL6 to EL8 | | B and below |
| Impaired | CRR9 to CRR10 | | EL9 to EL10 | | Impaired |
| 1 | HSBC observes the disclosure convention that, in addition to those classified as EL9 to EL10, retail accounts classified EL1 to EL8 that are delinquent by 90 days or more are considered impaired, unless individually they have been assessed as not impaired (see page 219, ‘Past due but not impaired financial instruments’. |
| |
Quality classification definitions
| • | ‘Strong’:exposures demonstrate a strong capacity to meet financial commitments, with negligible or low probability of default and/or low levels of expected loss. Retail accounts operate within product parameters and only exceptionally show any period of delinquency. |
| | |
| • | ‘Medium’: exposures require closer monitoring, with low to moderate default risk. Retail accounts typically show only short periods of delinquency, with any losses expected to be |
| | minimal following the adoption of recovery processes. |
| | |
| • | ‘Sub-standard’: exposures require varying degrees of special attention and default risk is of greater concern. Retail portfolio segments show longer delinquency periods of generally up to 90 days past due and/or expected losses are higher due to a reduced ability to mitigate these through security realisation or other recovery processes. |
217
Back to Contents
| H S B C H O L D I N G S P L C |
| |
| Report of the Directors: Risk(continued) |
| | |
| | |
| Credit risk > Credit quality > Risk ratings / Past due but not impaired |
| • | ‘Impaired’:exposures have been assessed,individually or collectively, as impaired. |
Risk rating scales
Compared with previous years, the basis of reporting has been changed to replace the former uniform seven-grade portfolio quality scale, in order both to extend the range of financial instruments covered in the presentation of portfolio quality and to reflect the more risk-sensitive rating systems introduced under the Group’s Basel II programme.
The Customer Risk Rating (‘CRR’) 10-grade scale above summarises a more granular underlying 22-grade scale of obligor probability of default (‘PD’). All distinct customers Group-wide are rated using one of these two PD scales, depending on the degree of sophistication of the Basel II approach adopted for the exposure.
The Expected Loss (‘EL’) 10-grade scale for retail business summarises a more granular underlying EL scale for these customer segments; this combines obligor and facility/product risk factors in a composite measure.
For debt securities and certain other financial instruments, external ratings have been aligned to the four quality classifications. The ratings of Standard and Poor’s are cited, with those of other agencies being treated equivalently. Debt securities with short-term issue ratings are reported against the long-term rating of the issuer of those securities. If major rating agencies have different ratings for the same debt securities, a prudent rating selection is made in line with regulatory requirements.
Additional credit quality information in respect of HSBC’s consolidated holdings of ABSs and assets held in consolidated SIVs and conduits is provided on pages 153 to 158 and 175 to 176, respectively.
For the purpose of the following disclosure, retail loans which are past due up to 89 days and are not otherwise classified as EL9 or EL10, are separately classified as past due but not impaired.
The following tables set out the Group’s distribution of financial instruments by measures of credit quality:
| | | | | | | | | | | | | | | | | | |
| Distribution of financial instruments by credit quality | | | | | | | | | | | | | | | | | |
| (Audited) | | | | | | | | | | | | | | | | | | | | | |
| | Neither past due nor impaired | | | | | | | | | | | | | | |
| |
| | | Past due | | | | | | Impair- | | | | | |
| | | | | | | | Sub- | | | but not | | | | | | ment | | | | | |
| | Strong | | | Medium | | | standard | | | impaired | 4 | | Impaired | 4 | | allowances | 3 | | Total | | |
| | US$m | | | US$m | | | US$m | | | US$m | | | US$m | | | US$m | | | US$m | | |
| At 31 December 2008 | | | | | | | | | | | | | | | | | | | | | |
| Items in the course of collection from other banks | 4,541 | | | 1,396 | | | – | | | 66 | | | – | | | | | | 6,003 | | |
| Trading assets | 303,307 | | | 98,977 | | | 3,167 | | | | | | | | | | | | 405,451 | | |
| – treasury and other eligible bills1 | 32,314 | | | 92 | | | 52 | | | | | | | | | | | | 32,458 | | |
| – debt securities1 | 175,681 | | | 22,841 | | | 1,097 | | | | | | | | | | | | 199,619 | | |
| – loans and advances to banks | 60,400 | | | 12,514 | | | 141 | | | | | | | | | | | | 73,055 | | |
| – loans and advances to customers | 34,912 | | | 63,530 | | | 1,877 | | | | | | | | | | | | 100,319 | | |
| Financial assets designated at fair value | 5,288 | | | 11,434 | | | 818 | | | | | | | | | | | | 17,540 | | |
| – treasury and other eligible bills1 | 204 | | | 31 | | | – | | | | | | | | | | | | 235 | | |
| – debt securities1 | 4,129 | | | 11,402 | | | 818 | | | | | | | | | | | | 16,349 | | |
| – loans and advances to banks | 230 | | | – | | | – | | | | | | | | | | | | 230 | | |
| – loans and advances to customers | 725 | | | 1 | | | – | | | | | | | | | | | | 726 | | |
| Derivatives | 383,393 | | | 106,348 | | | 5,135 | | | | | | | | | | | | 494,876 | | |
| Loans and advances held at amortised cost | 565,542 | | | 427,788 | | | 43,432 | | | 48,422 | | | 25,422 | | | (23,972 | ) | | 1,086,634 | | |
| – loans and advances to banks | 118,684 | | | 33,766 | | | 1,268 | | | 41 | | | 70 | | | (63 | ) | | 153,766 | | |
| – loans and advances to customers2 | 446,858 | | | 394,022 | | | 42,164 | | | 48,381 | | | 25,352 | | | (23,909 | ) | | 932,868 | | |
| Financial investments | 257,435 | | | 32,889 | | | 1,382 | | | 32 | | | 1,246 | | | | | | 292,984 | | |
| – treasury and other similar bills | 37,932 | | | 2,927 | | | 168 | | | – | | | – | | | | | | 41,027 | | |
| – debt securities | 219,503 | | | 29,962 | | | 1,214 | | | 32 | | | 1,246 | | | | | | 251,957 | | |
| Other assets | 11,959 | | | 26,517 | | | 1,747 | | | 219 | | | 417 | | | | | | 40,859 | | |
| – endorsements and acceptances | 1,851 | | | 7,793 | | | 805 | | | 30 | | | 3 | | | | | | 10,482 | | |
| – accrued income and other | 10,108 | | | 18,724 | | | 942 | | | 189 | | | 414 | | | | | | 30,377 | | |
218
Back to Contents
| | Neither past due nor impaired | | | | | | | | | | | | | | |
| |
| | | Past due | | | | | | Impair- | | | | | |
| | | | | | | | Sub- | | | but not | | | | | | ment | | | | | |
| | Strong | | | Medium | | | standard | | | impaired | 4 | | Impaired | 4 | | allowances | 3 | | Total | | |
| | US$m | | | US$m | | | US$m | | | US$m | | | US$m | | | US$m | | | US$m | | |
| At 31 December 2007 | | | | | | | | | | | | | | | | | | | | | |
| Items in the course of collection from other banks | 7,599 | | | 2,178 | | | – | | | – | | | – | | | | | | 9,777 | | |
| Trading assets | 277,437 | | | 115,091 | | | 1,964 | | | | | | | | | | | | 394,492 | | |
– treasury and other eligible bills1 | 15,766 | | | 670 | | | 3 | | | | | | | | | | | | 16,439 | | |
| – debt securities1 | 150,893 | | | 27,636 | | | 305 | | | | | | | | | | | | 178,834 | | |
| – loans and advances to banks | 82,678 | | | 17,757 | | | 5 | | | | | | | | | | | | 100,440 | | |
| – loans and advances to customers | 28,100 | | | 69,028 | | | 1,651 | | | | | | | | | | | | 98,779 | | |
| Financial assets designated at fair value | 5,266 | | | 16,126 | | | 125 | | | | | | | | | | | | 21,517 | | |
| – treasury and other eligible bills1 | 36 | | | 145 | | | – | | | | | | | | | | | | 181 | | |
| – debt securities1 | 5,052 | | | 15,973 | | | 125 | | | | | | | | | | | | 21,150 | | |
| – loans and advances to banks | 178 | | | – | | | – | | | | | | | | | | | | 178 | | |
| – loans and advances to customers | – | | | 8 | | | – | | | | | | | | | | | | 8 | | |
| Derivatives | 150,141 | | | 36,745 | | | 968 | | | | | | | | | | | | 187,854 | | |
| Loans and advances held at amortised cost | 662,415 | | | 476,554 | | | 30,242 | | | 49,321 | | | 19,594 | | | (19,212 | ) | | 1,218,914 | | |
| – loans and advances to banks | 189,446 | | | 45,358 | | | 2,535 | | | 22 | | | 12 | | | (7 | ) | | 237,366 | | |
| – loans and advances to customers | 472,969 | | | 431,196 | | | 27,707 | | | 49,299 | | | 19,582 | | | (19,205 | ) | | 981,548 | | |
| Financial investments | 236,901 | | | 33,117 | | | 388 | | | – | | | – | | | | | | 270,406 | | |
| – treasury and other similar bills | 26,776 | | | 3,188 | | | 140 | | | – | | | – | | | | | | 30,104 | | |
| – debt securities | 210,125 | | | 29,929 | | | 248 | | | – | | | – | | | | | | 240,302 | | |
| Other assets | 10,775 | | | 31,097 | | | 1,144 | | | 92 | | | 137 | | | | | | 43,245 | | |
| – endorsements and acceptances | 2,612 | | | 9,122 | | | 477 | | | 27 | | | 10 | | | | | | 12,248 | | |
| – accrued income and other | 8,163 | | | 21,975 | | | 667 | | | 65 | | | 127 | | | | | | 30,997 | | |
| | | | | | | | | | | | | | | | | | | | | | |
| 1 | Impairment is not measured for assets held in trading portfolios or designated at fair value as assets in such portfolios are managed according to movements in fair value, and the fair value movement is taken directly to the income statement. Consequently, all such balances are reported under ‘neither past due nor impaired’. |
| 2 | Includes asset-backed securities that have been externally rated as strong (US$7,991 million), medium (nil) and sub-standard (nil). |
| 3 | Impairment allowances are not reported for financial instruments whereby the carrying amount is reduced directly for impairment and not through the use of an allowance account. |
| 4 | The amounts for loans and advances for 2007 have been restated, as a result of a reclassification from ’Past due but not impaired’ to ‘Impaired’ of an element of a credit card portfolio. There has been no effect on impairment allowances. |
| | |
Past due but not impaired gross financial instruments
(Audited)
Examples of exposures past due but not impaired include overdue loans fully secured by cash collateral; mortgages that are individually assessed for impairment, and that are in arrears more than 90
days, but where the value of collateral is sufficient to repay both the principal debt and all potential interest for at least one year; and short-term trade facilities past due more than 90 days for technical reasons such as delays in documentation, but where there is no concern over the creditworthiness of the counterparty.
Past due but not impaired loans and advances to customers and banks by geographical region
| | | | | | | | | | | | Gross | |
| | | | | | | | | | | | loans and | |
| | | | | | Rest of | | | | | | advances | |
| | | | Hong | | Asia- | | North | | Latin | | past due not | |
| | Europe | | Kong | | Pacific | | America | | America | | impaired | 1 |
| | US$m | | US$m | | US$m | | US$m | | US$m | | US$m | |
| | | | | | | | | | | | | |
| At 31 December 2008 | 3,800 | | 1,805 | | 4,320 | | 35,247 | | 3,250 | | 48,422 | |
| At 31 December 2007 | 3,143 | | 2,031 | | 4,951 | | 36,604 | | 2,592 | | 49,321 | |
| | |
| 1 | Restated for 2007 as a result of a reclassification of an element of a credit card portfolio as impaired. There has been no effect on impairment allowances. |
219
Back to Contents
| H S B C H O L D I N G S P L C |
| |
| Report of the Directors: Risk(continued) |
| | |
| | |
| Credit risk > Credit quality > Past due but not impaired // Impaired loans and advances > 2008 |
Past due but not impaired loans and advances to customers and banks by industry sector
| | At 31 December | | |
| |
|
|
|
| | |
| | 2008 | | | 2007 | | |
| | US$m | | | US$m | | |
| | | | | | | |
| Banks | 41 | | | 22 | | |
| Customers | 48,381 | | | 49,299 | | |
| Personal1 | 39,592 | | | 42,091 | | |
| Corporate and commercial | 8,603 | | | 6,938 | | |
| Financial | 186 | | | 270 | | |
| |
| | |
| | |
| | 48,422 | | | 49,321 | | |
| |
| | |
| | |
| | |
| 1 | Restated for 2007 as a result of a reclassification of an element of a credit card portfolio as impaired. There has been no effect on impairment allowances. |
| | | | | | | | | | | | |
| Ageing analysis of days past due but not impaired gross financial instruments |
| (Audited) |
| | Up to 29 | | | 30-59 | | | 60-89 | | | 90-180 | | | Over 180 | | | | | |
| | days | | | days | | | days | | | days | | | days | | | Total | | |
| | US$m | | | US$m | | | US$m | | | US$m | | | US$m | | | US$m | | |
| At 31 December 2008 | | | | | | | | | | | | | | | | | | |
| Items in the course of collection from other banks | 66 | | | – | | | – | | | – | | | – | | | 66 | | |
| Loans and advances held at amortised cost | 31,034 | | | 10,814 | | | 5,493 | | | 621 | | | 460 | | | 48,422 | | |
| – loans and advances to banks | 41 | | | – | | | – | | | – | | | – | | | 41 | | |
| – loans and advances to customers | 30,993 | | | 10,814 | | | 5,493 | | | 621 | | | 460 | | | 48,381 | | |
| Financial investments | | | | | | | | | | | | | | | | | | |
| – debt securities | 32 | | | – | | | – | | | – | | | – | | | 32 | | |
| Other assets | 45 | | | 22 | | | 118 | | | 7 | | | 27 | | | 219 | | |
| – endorsements and acceptances | 21 | | | 6 | | | 1 | | | 2 | | | – | | | 30 | | |
| – other | 24 | | | 16 | | | 117 | | | 5 | | | 27 | | | 189 | | |
| |
| | |
| | |
| | |
| | |
| | |
| | |
| | 31,177 | | | 10,836 | | | 5,611 | | | 628 | | | 487 | | | 48,739 | | |
| |
| | |
| | |
| | |
| | |
| | |
| | |
| At 31 December 2007 | | | | | | | | | | | | | | | | | | |
| Loans and advances held at amortised cost | 33,931 | | | 10,546 | | | 3,992 | | | 489 | | | 363 | | | 49,321 | | |
| – loans and advances to banks | 22 | | | – | | | – | | | – | | | – | | | 22 | | |
– loans and advances to customers1 | 33,909 | | | 10,546 | | | 3,992 | | | 489 | | | 363 | | | 49,299 | | |
| Other assets | 57 | | | 16 | | | 8 | | | 6 | | | 5 | | | 92 | | |
| – endorsements and acceptances | 21 | | | 3 | | | – | | | 2 | | | 1 | | | 27 | | |
| – other | 36 | | | 13 | | | 8 | | | 4 | | | 4 | | | 65 | | |
| |
| | |
| | |
| | |
| | |
| | |
| | |
| | 33,988 | | | 10,562 | | | 4,000 | | | 495 | | | 368 | | | 49,413 | | |
| |
| | |
| | |
| | |
| | |
| | |
| | |
| | |
| 1 | Restated for 2007 as a result of a reclassification of an element of a credit card portfolio as impaired. There has been no effect on impairment allowances. |
| | | | | | | | | | | | |
| Impaired loans and advances |
| | | | | | | | | | | | |
| Impaired loans and advances to customers and banks by industry sector |
| (Audited) |
| | Impaired loans and advances at | | | Impaired loans and advances at | | |
| | 31 December 2008 | | | 31 December 20071 | | |
| |
|
|
|
| | |
|
|
|
| | |
| | Individually | | | Collectively | | | | | | Individually | | | Collectively | | | | | |
| | assessed | | | assessed | | | Total | | | assessed | | | assessed | | | Total | | |
| | US$m | | | US$m | | | US$m | | | US$m | | | US$m | | | US$m | | |
| | | | | | | | | | | | | | | | | | | |
| Banks | 70 | | | – | | | 70 | | | 12 | | | – | | | 12 | | |
| Customers | 6,922 | | | 18,430 | | | 25,352 | | | 6,477 | | | 13,105 | | | 19,582 | | |
| Personal | 538 | | | 18,071 | | | 18,609 | | | 1,548 | | | 12,850 | | | 14,398 | | |
| Corporate and commercial | 6,086 | | | 357 | | | 6,443 | | | 4,799 | | | 254 | | | 5,053 | | |
| Financial | 298 | | | 2 | | | 300 | | | 130 | | | 1 | | | 131 | | |
| |
| | |
| | |
| | |
| | |
| | |
| | |
| | 6,992 | | | 18,430 | | | 25,422 | | | 6,489 | | | 13,105 | | | 19,594 | | |
| |
| | |
| | |
| | |
| | |
| | |
| | |
| | |
| 1 | Impaired loans for 2007 have been restated as a result of the reclassification of an element of a credit card portfolio as impaired. There has been no effect on impairment allowances. |
220
Back to Contents
2008 compared with 2007
(Unaudited)
Total impaired loans to customers were US$25.4 billion at 31 December 2008, an increase of 29 per cent since the end of 2007 (42 per cent at constant currency). Impaired loans were 3 per cent of gross customer loans and advances, a rise from 2 per cent at 31 December 2007.
The commentary that follows compares balances at 31 December 2008 with those at 31 December 2007, at constant exchange rates.
InEurope, impaired loans at US$6.8 billion were 32 per cent higher than at the end of 2007. The increase was driven by the UK where credit quality in the UK commercial portfolio deteriorated sharply in the final quarter of the year. A small number of exposures in the commercial real estate sector were particularly affected by a sharp deterioration in market conditions in the fourth quarter. UK mortgage impairments remained broadly stable despite the substantial increase in balances in the second half of the year and delinquency levels increased modestly from a low base. Unsecured personal lending in the UK also saw a slight increase in the levels of impaired loans, particularly in the second half of the year, as the economy weakened. A single financial sector loan in Europe also affected results. Impairment levels in France remained low in the personal sector. However, Commercial Banking experienced a rising number of small impairments during the second half of the year and a small number of larger impairments in the last quarter. In Turkey, impaired loans rose by 81 per cent due to increased delinquency in the personal lending portfolio and, particularly, in credit cards.
InHong Kong, impaired loans increased from a previously low level to US$852 million. The deterioration was concentrated in the commercial lending portfolio and was attributable to a number of factors including exporters in Hong Kong being affected by reduced demand from the US and other developed countries. The sharp fall in the value of currencies and commodities left some customers’ balance sheets weakened, coupled with rising fraud encountered with certain counterparties.
In theRest of Asia-Pacific impaired loans increased by 8 per cent to US$1.1 billion, primarily due to the deterioration in the commercial lending portfolio. In the last quarter of 2008 the number of export orders suffered a sharp fall and, together with a deterioration in credit quality around the region, caused a rise in impaired loans. Noticeable increases were recognised in Taiwan, Indonesia and India. In Taiwan the commercial loan portfolio started to deteriorate in the second half of the year as the fall in exports started to affect local businesses. In Indonesia and India, the increase in impaired loans was a result of the downgrade of a few individual customers as economic conditions worsened. Impaired personal loans rose as increased unemployment and bankruptcy rates affected the ability of customers to repay. India continued to show significant impaired loans as the economic conditions deteriorated and credit quality weakened. Active measures are being taken to reduce exposure in India and manage the personal lending portfolio.
InNorth America,impaired loans rose significantly, increasing by 49 per cent to US$14.3 billion at 31 December 2008. The US consumer finance business experienced a broad based deterioration in credit quality due to higher unemployment as the economy slowed. A full discussion of these developments and their effect on credit quality is provided in the ‘Areas of special interest’ commentary on page 208. In Canada, impaired loans rose from a low base as credit conditions weakened, with the loss concentrated in a single exposure in the commercial real estate portfolio. In the US, commercial and corporate credit quality declined due to downgrades as the economic environment deteriorated.
InLatin America, impaired loans increased by 37 per cent to US$2.3 billion. Impaired loans in Mexico rose by 32 per cent, largely in credit cards driven by portfolio growth in personal lending, seasoning and higher delinquency rates. In Brazil, impaired loans rose by 34 per cent due to growth in personal lending due to deterioration in payroll and vehicle finance loan portfolios, and weakness in a number of real estate portfolios and corporates exposed to the sharp rise in the value of the US dollar in the second half of the year.
221
Back to Contents
| H S B C H O L D I N G S P L C |
| |
| Report of the Directors: Risk(continued) |
| |
| | |
| Credit risk > Impaired loans and advances > Collateral // Impairment allowances |
Collateral and other credit enhancements obtained
(Audited)
HSBC obtained assets by taking possession of collateral held as security, or calling upon other credit enhancements, as follows:
| (Audited) |
| | Carrying amount obtained in: | |
| |
| |
| | 2008 | | 2007 | |
| | US$m | | US$m | |
| Nature of assets | | | | |
| Residential property | 2,562 | | 2,509 | |
| Commercial and industrial property | 21 | | 18 | |
| Other | 382 | | 373 | |
| |
| |
| |
| | 2,965 | | 2,900 | |
| |
| |
| |
Repossessed properties are made available for sale in an orderly fashion, with the proceeds used to reduce or repay the outstanding indebtedness. If excess funds arise after the debt has been repaid, they are made available either to repay other secured lenders with lower priority or are returned to the customer. HSBC does not generally occupy
repossessed properties for its business use. The majority of repossessed properties arose in HSBC Finance in the US, which, compared with 2007 experienced higher levels of foreclosure and higher losses on sale due to declining house prices. The average time taken to sell a repossessed property during 2008 was 177 days and the average loss upon sale of foreclosed properties was 13 per cent. The December 2008 balance of repossessed property was lower than otherwise would have been the case due to several factors that occurred during the month: HSBC Finance implemented a voluntary one month suspension of final court proceedings in foreclosure cases relating to owner occupied properties in December 2008, some states suspended foreclosure activity, and there was a backlog in moving foreclosure proceedings through the courts. HSBC expects, subject to further state actions, that repossessed property levels will increase in the first quarter of 2009 as foreclosure proceedings normalise. A quarterly breakdown of foreclosure data is provided below:
HSBC Finance foreclosed properties in the US
(Unaudited)
| | | | Quarter ended | |
| | | |
| |
| | | | 31 December | | 30 September | | 30 June | | 31 March | |
| | 2008 | | 2008 | | 2008 | | 2008 | | 2008 | |
| | | | | | | | | | | |
| Number of foreclosed properties at end of period | 9,589 | | 9,589 | | 11,182 | | 10,870 | | 10,203 | |
| Number of properties added to foreclosed inventory in the year/quarter | 20,051 | | 3,398 | | 5,562 | | 5,773 | | 5,318 | |
Average loss on sale of foreclosed properties1 | 13% | | 13% | | 10% | | 11% | | 16% | |
Average total loss on foreclosed properties2 | 42% | | 47% | | 42% | | 40% | | 39% | |
| Average time to sell foreclosed properties (days) | 177 | | 180 | | 174 | | 171 | | 181 | |
| 1 | The average loss on sale of foreclosed properties is calculated as cash proceeds after deducting selling costs and commissions, minus the book value of the property when it was moved to ‘Real estate owned’, divided by the book value of the property when it was moved to ‘Real estate owned’. |
| 2 | The average total loss on foreclosed properties sold during each quarter includes both the loss on sale and the cumulative write-downs recognised on the loans up to and upon classification as ‘Real estate owned’. This average total loss on foreclosed properties is expressed as a percentage of the book value of the property prior to its transfer to ‘Real estate owners’. |
222
Back to Contents
Impairment allowances and charges on loans and advances to customers and banks
(Audited)
The tables below analyse by geographical region the impairment allowances recognised for impaired
loans and advances that are either individually assessed or collectively assessed, and collective impairment allowances on loans and advances classified as not impaired.
Impairment allowances on loans and advances to customers by geographical region
(Audited)
| | | | | Hong | | | Rest of | | | North | | | Latin | | | | | |
| | Europe | | | Kong | | | Asia-Pacific | | | America | | | America | | | Total | | |
| | US$m | | | US$m | | | US$m | | | US$m | | | US$m | | | US$m | | |
| At 31 December 2008 | | | | | | | | | | | | | | | | | | |
| Gross loans and advances | | | | | | | | | | | | | | | | | | |
| Individually assessed impaired loans1 | 3,817 | | | 813 | | | 865 | | | 832 | | | 595 | | | 6,922 | | |
| Collectively assessed2 | 426,233 | | | 100,140 | | | 108,318 | | | 271,472 | | | 43,692 | | | 949,855 | | |
| Impaired loans1 | 2,957 | | | 39 | | | 249 | | | 13,453 | | | 1,732 | | | 18,430 | | |
| Non-impaired loans3 | 423,276 | | | 100,101 | | | 108,069 | | | 258,019 | | | 41,960 | | | 931,425 | | |
| |
| | |
| | |
| | |
| | |
| | |
| | |
| Gross loans and advances | 430,050 | | | 100,953 | | | 109,183 | | | 272,304 | | | 44,287 | | | 956,777 | | |
| |
| | |
| | |
| | |
| | |
| | |
| | |
| Impairment allowances | | | | | | | | | | | | | | | | | | |
| Individually assessed | 2,005 | | | 411 | | | 448 | | | 192 | | | 228 | | | 3,284 | | |
| Collectively assessed | 1,854 | | | 322 | | | 779 | | | 15,898 | | | 1,772 | | | 20,625 | | |
| |
| | |
| | |
| | |
| | |
| | |
| | |
| Total impairment allowances | 3,859 | | | 733 | | | 1,227 | | | 16,090 | | | 2,000 | | | 23,909 | | |
| |
| | |
| | |
| | |
| | |
| | |
| | |
| | % | | | % | | | % | | | % | | | % | | | % | | |
| Individually assessed allowances as a percentage | | | | | | | | | | | | | | | | | | |
| of individually assessed loans and advances | 52.5 | | | 50.6 | | | 51.8 | | | 23.1 | | | 38.3 | | | 47.4 | | |
| Collectively assessed allowances as a percentage | | | | | | | | | | | | | | | | | | |
| of collectively assessed loans and advances | 0.4 | | | 0.3 | | | 0.7 | | | 5.9 | | | 4.1 | | | 2.2 | | |
| Total allowances as a percentage of total loans | | | | | | | | | | | | | | | | | | |
| and advances | 0.9 | | | 0.7 | | | 1.1 | | | 5.9 | | | 4.5 | | | 2.5 | | |
| | | | | | | | | | | | | | | | | | | |
| | US$m | | | US$m | | | US$m | | | US$m | | | US$m | | | US$m | | |
| At 31 December 2007 | | | | | | | | | | | | | | | | | | |
| Gross loans and advances | | | | | | | | | | | | | | | | | | |
| Individually assessed impaired loans1 | 4,558 | | | 378 | | | 678 | | | 421 | | | 442 | | | 6,477 | | |
| Collectively assessed2 | 451,648 | | | 89,636 | | | 102,100 | | | 301,419 | | | 49,473 | | | 994,276 | | |
| Impaired loans1,4 | 1,696 | | | 55 | | | 410 | | | 9,241 | | | 1,703 | | | 13,105 | | |
| Non-impaired loans3,4 | 449,952 | | | 89,581 | | | 101,690 | | | 292,178 | | | 47,770 | | | 981,171 | | |
| |
| | |
| | |
| | |
| | |
| | |
| | |
| Gross loans and advances | 456,206 | | | 90,014 | | | 102,778 | | | 301,840 | | | 49,915 | | | 1,000,753 | | |
| |
| | |
| | |
| | |
| | |
| | |
| | |
| Impairment allowances | | | | | | | | | | | | | | | | | | |
| Individually assessed | 1,846 | | | 132 | | | 349 | | | 119 | | | 253 | | | 2,699 | | |
| Collectively assessed | 2,085 | | | 244 | | | 577 | | | 11,861 | | | 1,739 | | | 16,506 | | |
| |
| | |
| | |
| | |
| | |
| | |
| | |
| Total impairment allowances | 3,931 | | | 376 | | | 926 | | | 11,980 | | | 1,992 | | | 19,205 | | |
| |
| | |
| | |
| | |
| | |
| | |
| | |
| | % | | | % | | | % | | | % | | | % | | | % | | |
| Individually assessed allowances as a percentage | | | | | | | | | | | | | | | | | | |
| of individually assessed loans and advances | 40.5 | | | 34.9 | | | 51.5 | | | 28.3 | | | 57.2 | | | 41.7 | | |
| Collectively assessed allowances as a percentage | | | | | | | | | | | | | | | | | | |
| of collectively assessed loans and advances | 0.5 | | | 0.3 | | | 0.6 | | | 3.9 | | | 3.5 | | | 1.7 | | |
| Total allowances as a percentage of total loans | | | | | | | | | | | | | | | | | | |
| and advances | 0.9 | | | 0.4 | | | 0.9 | | | 4.0 | | | 4.0 | | | 1.9 | | |
| 1 | Impaired loans and advances are those classified as CRR 9, CRR 10, EL 9 or EL 10 and all retail loans 90 days or more past due. |
| 2 | Collectively assessed loans and advances comprise homogeneous groups of loans that are not considered individually significant, and loans subject to individual assessment where no impairment has been identified on an individual basis, but on which a collective impairment allowance has been calculated to reflect losses which have been incurred but not yet identified. |
| 3 | Collectively assessed loans and advances not impaired are those classified as CRR1 to CRR8 and EL1 to EL8 but excluding retail loans 90 days past due. |
| 4 | The 2007 collectively assessed impaired loans and advances for North America have been increased from US$7,963 million to US$9,241 million as a result of the reclassification of an element of a credit card portfolio as impaired. There has been no effect on impairment allowances. |
223
Back to Contents
| H S B C H O L D I N G S P L C |
| |
| Report of the Directors: Risk(continued) |
| | |
| | |
| Credit risk > Impairment allowances > Movements |
Impairment allowances on loans and advances to customers and banks by industry sector
(Audited)
| | At 31 December 2008 | | | At 31 December 2007 | |
| |
|
|
|
|
|
|
| | |
|
|
|
|
|
|
| |
| | Individually | | | Collectively | | | | | | Individually | | | Collectively | | | | |
| | assessed | | | assessed | | | Total | | | assessed | | | assessed | | | Total | |
| | allowances | | | allowances | | | allowances | | | allowances | | | allowances | | | allowances | |
| | US$m | | | US$m | | | US$m | | | US$m | | | US$m | | | US$m | |
| | | | | | | | | | | | | | | | | | |
| Banks1 | 63 | | | – | | | 63 | | | 7 | | | – | | | 7 | |
| Customers | 3,284 | | | 20,625 | | | 23,909 | | | 2,699 | | | 16,506 | | | 19,205 | |
| Personal | 312 | | | 18,657 | | | 18,969 | | | 379 | | | 14,983 | | | 15,362 | |
| Corporate and commercial | 2,845 | | | 1,795 | | | 4,640 | | | 2,275 | | | 1,472 | | | 3,747 | |
| Financial | 127 | | | 173 | | | 300 | | | 45 | | | 51 | | | 96 | |
| |
| | |
| | |
| | |
| | |
| | |
| |
| | 3,347 | | | 20,625 | | | 23,972 | | | 2,706 | | | 16,506 | | | 19,212 | |
| |
| | |
| | |
| | |
| | |
| | |
| |
| | |
| 1 | The impairment allowances on loans and advances to banks relates to the geographical region, Europe. |
Impairment allowances as a percentage of loans and advances1
(Unaudited)
| | At 31 December | |
| |
|
|
|
| |
| | 2008 | | | 2007 | |
| | % | | | % | |
| Banks | | | | | |
| Individually assessed impairment allowances2 | 0.06 | | | 0.0 | |
| | | | | | |
| Customers3 | 2.63 | | | 2.01 | |
| Individually assessed impairment allowances3 | 0.36 | | | 0.28 | |
| Collectively assessed impairment allowances3 | 2.27 | | | 1.73 | |
| | |
| 1 | Net of reverse repo transactions, settlement accounts and stock borrowings. |
| 2 | As a percentage of loans and advances to banks. |
| 3 | As a percentage of loans and advances to customers. |
| |
Movement in impairment allowances
The tables below describe details of the movements in HSBC’s loan impairment allowances (i) for loans
and advances, (ii) by industry segment for each of the past 5 years and (iii) by industry segment and geographical region for 2008 and 2007.
Movement in impairment allowances on loans and advances
(Audited)
| | | | Customers | | | |
| | Banks | |
|
|
| | | |
| | individually | | Individually | | Collectively | | | |
| | assessed | | assessed | | assessed | | Total | |
| | US$m | | US$m | | US$m | | US$m | |
| | | | | | | | | |
| At 1 January 2008 | 7 | | 2,699 | | 16,506 | | 19,212 | |
| Amounts written off | – | | (824 | ) | (17,131 | ) | (17,955 | ) |
| Recoveries of loans and advances written off in previous years | – | | 113 | | 721 | | 834 | |
| Charge to income statement | 54 | | 2,010 | | 22,067 | | 24,131 | |
| Exchange and other movements | 2 | | (714 | ) | (1,538 | ) | (2,250 | ) |
| |
| |
| |
| |
| |
| At 31 December 2008 | 63 | | 3,284 | | 20,625 | | 23,972 | |
| |
| |
| |
| |
| |
| At 1 January 2007 | 7 | | 2,565 | | 11,013 | | 13,585 | |
| Amounts written off | – | | (897 | ) | (11,947 | ) | (12,844 | ) |
| Recoveries of loans and advances written off in previous years | – | | 129 | | 876 | | 1,005 | |
| Charge to income statement | – | | 796 | | 16,381 | | 17,177 | |
| Exchange and other movements | – | | 106 | | 183 | | 289 | |
| |
| |
| |
| |
| |
| At 31 December 2007 | 7 | | 2,699 | | 16,506 | | 19,212 | |
| |
| |
| |
| |
| |
224
Back to Contents
| Movement in impairment allowances by industry sector | | | | | | | | | | | | | | |
| (Audited: 2008 to 2005; Unaudited: 2004) | | | | | | | | | | | | | | |
| | | | | | | | | | | | | | | |
| | 2008 | | | 2007 | | | 2006 | | | 2005 | | | 2004 | |
| | US$m | | | US$m | | | US$m | | | US$m | | | US$m | |
| | | | | | | | | | | | | | | |
| Impairment allowances at 1 January | 19,212 | | | 13,585 | | | 11,366 | | | 12,559 | | | 13,715 | |
| | | | | | | | | | | | | | | |
| IFRS transition adjustment at 1 January 2004 | – | | | – | | | – | | | – | | | (58 | ) |
| Amounts written off | (17,955 | ) | | (12,844 | ) | | (9,473 | ) | | (9,043 | ) | | (8,844 | ) |
| Personal | (16,625 | ) | | (11,670 | ) | | (8,281 | ) | | (8,046 | ) | | (7,597 | ) |
| – residential mortgages | (2,110 | ) | | (930 | ) | | (628 | ) | | (508 | ) | | (561 | ) |
| – other personal | (14,515 | ) | | (10,740 | ) | | (7,653 | ) | | (7,538 | ) | | (7,036 | ) |
| Corporate and commercial | (1,294 | ) | | (1,163 | ) | | (1,153 | ) | | (984 | ) | | (1,227 | ) |
| – commercial, industrial and international trade | (789 | ) | | (897 | ) | | (782 | ) | | (673 | ) | | (623 | ) |
| – commercial real estate and other property-related | (115 | ) | | (98 | ) | | (111 | ) | | (117 | ) | | (106 | ) |
| – other commercial | (390 | ) | | (168 | ) | | (260 | ) | | (194 | ) | | (498 | ) |
| Financial4 | (36 | ) | | (11 | ) | | (39 | ) | | (13 | ) | | (20 | ) |
| | | | | | | | | | | | | | | |
| Recoveries of amounts written off in previous years | 834 | | | 1,005 | | | 779 | | | 494 | | | 913 | |
| Personal | 686 | | | 837 | | | 605 | | | 320 | | | 690 | |
| – residential mortgages | 19 | | | 19 | | | 19 | | | 18 | | | 31 | |
| – other personal | 667 | | | 818 | | | 586 | | | 302 | | | 659 | |
| Corporate and commercial | 142 | | | 157 | | | 163 | | | 174 | | | 220 | |
| – commercial, industrial and international trade | 76 | | | 74 | | | 88 | | | 76 | | | 118 | |
| – commercial real estate and other property-related | 6 | | | 29 | | | 21 | | | 9 | | | 17 | |
| – other commercial | 60 | | | 54 | | | 54 | | | 89 | | | 85 | |
| Financial4 | 6 | | | 11 | | | 11 | | | – | | | 3 | |
| | | | | | | | | | | | | | | |
| Charge to income statement1,2 | 24,131 | | | 17,177 | | | 10,547 | | | 7,860 | | | 6,195 | |
| Personal | 20,950 | | | 15,968 | | | 9,929 | | | 7,249 | | | 6,698 | |
| – residential mortgages | 5,000 | | | 1,840 | | | 1,096 | | | 605 | | | 482 | |
| – other personal | 15,950 | | | 14,128 | | | 8,833 | | | 6,644 | | | 6,216 | |
| Corporate and commercial | 2,879 | | | 1,176 | | | 664 | | | 618 | | | (11 | ) |
| – commercial, industrial and international trade | 1,573 | | | 897 | | | 503 | | | 588 | | | 179 | |
| – commercial real estate and other property-related | 755 | | | 152 | | | 75 | | | 56 | | | (22 | ) |
| – other commercial | 551 | | | 127 | | | 86 | | | (26 | ) | | (168 | ) |
| Financial4 | 302 | | | 36 | | | (9 | ) | | (13 | ) | | 5 | |
| Governments | – | | | (3 | ) | | (37 | ) | | 6 | | | 1 | |
| General provisions | – | | | – | | | – | | | – | | | (498 | ) |
| | | | | | | | | | | | | | | |
| Exchange and other movements | (2,250 | ) | | 289 | | | 366 | | | (504 | ) | | 638 | |
| |
| | |
| | |
| | |
| | |
| |
| Impairment allowances at 31 December2 | 23,972 | | | 19,212 | | | 13,585 | | | 11,366 | | | 12,559 | |
| |
| | |
| | |
| | |
| | |
| |
| Impairment allowances against banks2: | | | | | | | | | | | | | | |
| – individually assessed2 | 63 | | | 7 | | | 7 | | | 9 | | | 17 | |
| Impairment allowances against customers2: | | | | | | | | | | | | | | |
| – individually assessed2 | 3,284 | | | 2,699 | | | 2,565 | | | 2,683 | | | 10,017 | |
| – collectively assessed2,3 | 20,625 | | | 16,506 | | | 11,013 | | | 8,674 | | | 2,525 | |
| |
| | |
| | |
| | |
| | |
| |
| Impairment allowances at 31 December2 | 23,972 | | | 19,212 | | | 13,585 | | | 11,366 | | | 12,559 | |
| |
| | |
| | |
| | |
| | |
| |
| | % | | | % | | | % | | | % | | | % | |
| | | | | | | | | | | | | | | |
| | | | | | | | | | | | | | | |
Impairment allowances against customers as a percentage of loans and advances to customers2: | | | | | | | | | | | | | | |
| – individually assessed2 | 0.34 | | | 0.27 | | | 0.29 | | | 0.36 | | | 1.46 | |
| – collectively assessed2 | 2.16 | | | 1.65 | | | 1.25 | | | 1.16 | | | 0.37 | |
| |
| | |
| | |
| | |
| | |
| |
| At 31 December | 2.50 | | | 1.92 | | | 1.54 | | | 1.52 | | | 1.83 | |
| |
| | |
| | |
| | |
| | |
| |
| | | | | | | | | | | | | | | |
| For footnotes, see page 227. | | | | | | | | | | | | | | |
225
Back to Contents
| H S B C H O L D I N G S P L C |
| |
| Report of the Directors: Risk(continued) |
| | |
| | |
| Credit risk > Impairment allowances > Movements |
Movement in impairment allowances by industry sector and by geographical region
(Audited)
| | 2008 | |
| |
|
|
|
|
|
|
|
|
|
|
|
|
|
|
|
| |
| | | | | | | | Rest of | | | | | | | | | | |
| | | | | Hong | | | Asia- | | | North | | | Latin | | | | |
| | Europe | | | Kong | | | Pacific | | | America | | | America | | | Total | |
| | US$m | | | US$m | | | US$m | | | US$m | | | US$m | | | US$m | |
| | | | | | | | | | | | | | | | | | |
| Impairment allowances at 1 January | 3,938 | | | 376 | | | 926 | | | 11,980 | | | 1,992 | | | 19,212 | |
| | | | | | | | | | | | | | | | | | |
| Amounts written off | (2,483 | ) | | (219 | ) | | (838 | ) | | (12,215 | ) | | (2,200 | ) | | (17,955 | ) |
| Personal | (1,947 | ) | | (179 | ) | | (799 | ) | | (11,989 | ) | | (1,711 | ) | | (16,625 | ) |
| – residential mortgages | (3 | ) | | (1 | ) | | (6 | ) | | (2,030 | ) | | (70 | ) | | (2,110 | ) |
| – other personal | (1,944 | ) | | (178 | ) | | (793 | ) | | (9,959 | ) | | (1,641 | ) | | (14,515 | ) |
| Corporate and commercial | (515 | ) | | (38 | ) | | (39 | ) | | (214 | ) | | (488 | ) | | (1,294 | ) |
| – commercial, industrial and international trade | (367 | ) | | (33 | ) | | (22 | ) | | (153 | ) | | (214 | ) | | (789 | ) |
| – commercial real estate and other property-related | (77 | ) | | (2 | ) | | (4 | ) | | (12 | ) | | (20 | ) | | (115 | ) |
| – other commercial | (71 | ) | | (3 | ) | | (13 | ) | | (49 | ) | | (254 | ) | | (390 | ) |
| Financial4 | (21 | ) | | (2 | ) | | – | | | (12 | ) | | (1 | ) | | (36 | ) |
| | | | | | | | | | | | | | | | | | |
| Recoveries of amounts written off in previous years | 294 | | | 39 | | | 137 | | | 100 | | | 264 | | | 834 | |
| Personal | 275 | | | 36 | | | 124 | | | 54 | | | 197 | | | 686 | |
| – residential mortgages | – | | | 7 | | | 1 | | | – | | | 11 | | | 19 | |
| – other personal | 275 | | | 29 | | | 123 | | | 54 | | | 186 | | | 667 | |
| Corporate and commercial | 19 | | | 3 | | | 8 | | | 45 | | | 67 | | | 142 | |
| – commercial, industrial and international trade | 19 | | | 1 | | | 6 | | | 27 | | | 23 | | | 76 | |
| – commercial real estate and other property-related | – | | | – | | | 1 | | | 5 | | | – | | | 6 | |
| – other commercial | – | | | 2 | | | 1 | | | 13 | | | 44 | | | 60 | |
| Financial4 | – | | | – | | | 5 | | | 1 | | | – | | | 6 | |
| | | | | | | | | | | | | | | | | | |
| Charge to income statement1 | 3,411 | | | 556 | | | 1,089 | | | 16,589 | | | 2,486 | | | 24,131 | |
| Personal | 1,961 | | | 160 | | | 860 | | | 16,006 | | | 1,963 | | | 20,950 | |
| – residential mortgages | 18 | | | – | | | 29 | | | 4,943 | | | 10 | | | 5,000 | |
| – other personal | 1,943 | | | 160 | | | 831 | | | 11,063 | | | 1,953 | | | 15,950 | |
| Corporate and commercial | 1,304 | | | 363 | | | 220 | | | 472 | | | 520 | | | 2,879 | |
| – commercial, industrial and international trade | 537 | | | 316 | | | 171 | | | 213 | | | 336 | | | 1,573 | |
| – commercial real estate and other property-related | 540 | | | 28 | | | 21 | | | 132 | | | 34 | | | 755 | |
| – other commercial | 227 | | | 19 | | | 28 | | | 127 | | | 150 | | | 551 | |
| Financial4 | 146 | | | 33 | | | 9 | | | 111 | | | 3 | | | 302 | |
| | | | | | | | | | | | | | | | | | |
| Exchange and other movements | (1,238 | ) | | (19 | ) | | (87 | ) | | (364 | ) | | (542 | ) | | (2,250 | ) |
| |
| | |
| | |
| | |
| | |
| | |
| |
| Impairment allowances at 31 December | 3,922 | | | 733 | | | 1,227 | | | 16,090 | | | 2,000 | | | 23,972 | |
| |
| | |
| | |
| | |
| | |
| | |
| |
| Impairment allowances against banks: | | | | | | | | | | | | | | | | | |
| – individually assessed | 63 | | | – | | | – | | | – | | | – | | | 63 | |
| Impairment allowances against customers: | | | | | | | | | | | | | | | | | |
| – individually assessed | 2,005 | | | 411 | | | 448 | | | 192 | | | 228 | | | 3,284 | |
| – collectively assessed3 | 1,854 | | | 322 | | | 779 | | | 15,898 | | | 1,772 | | | 20,625 | |
| |
| | |
| | |
| | |
| | |
| | |
| |
| Impairment allowances at 31 December | 3,922 | | | 733 | | | 1,227 | | | 16,090 | | | 2,000 | | | 23,972 | |
| |
| | |
| | |
| | |
| | |
| | |
| |
| | % | | | % | | | % | | | % | | | % | | | % | |
| | | | | | | | | | | | | | | | | | |
| Impairment allowances against customers as a percentage of loans and advances to customers: | | | | | | | | | | | | | | | | | |
| – individually assessed | 0.47 | | | 0.41 | | | 0.41 | | | 0.07 | | | 0.51 | | | 0.34 | |
| – collectively assessed | 0.43 | | | 0.32 | | | 0.71 | | | 5.84 | | | 4.00 | | | 2.16 | |
| |
| | |
| | |
| | |
| | |
| | |
| |
| At 31 December | 0.90 | | | 0.73 | | | 1.12 | | | 5.91 | | | 4.51 | | | 2.50 | |
| |
| | |
| | |
| | |
| | |
| | |
| |
226
Back to Contents
| | | 2007 | |
| | |
|
|
|
|
|
|
|
|
|
|
|
|
|
|
|
| |
| | | | | | | | | Rest of | | | | | | | | | | |
| | | | | | Hong | | | Asia- | | | North | | | Latin | | | | |
| | | Europe | | | Kong | | | Pacific | | | America | | | America | | | Total | |
| | | US$m | | | US$m | | | US$m | | | US$m | | | US$m | | | US$m | |
| | | | | | | | | | | | | | | | | | | |
| Impairment allowances at 1 January | | 3,683 | | | 365 | | | 901 | | | 7,247 | | | 1,389 | | | 13,585 | |
| Amounts written off | | (2,940 | ) | | (251 | ) | | (724 | ) | | (7,444 | ) | | (1,485 | ) | | (12,844 | ) |
| Personal | | (2,402 | ) | | (180 | ) | | (615 | ) | | (7,273 | ) | | (1,200 | ) | | (11,670 | ) |
| – residential mortgages | | (7 | ) | | (8 | ) | | (16 | ) | | (878 | ) | | (21 | ) | | (930 | ) |
| – other personal | | (2,395 | ) | | (172 | ) | | (599 | ) | | (6,395 | ) | | (1,179 | ) | | (10,740 | ) |
| Corporate and commercial | | (533 | ) | | (71 | ) | | (109 | ) | | (166 | ) | | (284 | ) | | (1,163 | ) |
| – commercial, industrial and international trade | | (371 | ) | | (57 | ) | | (94 | ) | | (122 | ) | | (253 | ) | | (897 | ) |
| – commercial real estate and other property-related | | (72 | ) | | (4 | ) | | (5 | ) | | (14 | ) | | (3 | ) | | (98 | ) |
| – other commercial | | (90 | ) | | (10 | ) | | (10 | ) | | (30 | ) | | (28 | ) | | (168 | ) |
| Financial4 | | (5 | ) | | – | | | – | | | (5 | ) | | (1 | ) | | (11 | ) |
| Recoveries of amounts written off in previous years | | 542 | | | 43 | | | 124 | | | 62 | | | 234 | | | 1,005 | |
| Personal | | 468 | | | 36 | | | 100 | | | 29 | | | 204 | | | 837 | |
| – residential mortgages | | – | | | 6 | | | 3 | | | 1 | | | 9 | | | 19 | |
| – other personal | | 468 | | | 30 | | | 97 | | | 28 | | | 195 | | | 818 | |
| Corporate and commercial | | 66 | | | 7 | | | 23 | | | 31 | | | 30 | | | 157 | |
| – commercial, industrial and international trade | | 14 | | | 5 | | | 10 | | | 21 | | | 24 | | | 74 | |
| – commercial real estate and other property-related | | 19 | | | 1 | | | 7 | | | 1 | | | 1 | | | 29 | |
| – other commercial | | 33 | | | 1 | | | 6 | | | 9 | | | 5 | | | 54 | |
| Financial4 | | 8 | | | – | | | 1 | | | 2 | | | – | | | 11 | |
| Charge to income statement1 | | 2,543 | | | 212 | | | 614 | | | 12,111 | | | 1,697 | | | 17,177 | |
| Personal | | 2,035 | | | 157 | | | 550 | | | 11,854 | | | 1,372 | | | 15,968 | |
| – residential mortgages | | 7 | | | (14 | ) | | 16 | | | 1,784 | | | 47 | | | 1,840 | |
| – other personal | | 2,028 | | | 171 | | | 534 | | | 10,070 | | | 1,325 | | | 14,128 | |
| Corporate and commercial | | 499 | | | 53 | | | 63 | | | 236 | | | 325 | | | 1,176 | |
| – commercial, industrial and international trade | | 353 | | | 57 | | | 82 | | | 125 | | | 280 | | | 897 | |
| – commercial real estate and other property-related | | 119 | | | (4 | ) | | (21 | ) | | 52 | | | 6 | | | 152 | |
| – other commercial | | 27 | | | – | | | 2 | | | 59 | | | 39 | | | 127 | |
| Financial4 | | 12 | | | 2 | | | 1 | | | 21 | | | – | | | 36 | |
| Governments | | (3 | ) | | – | | | – | | | – | | | – | | | (3 | ) |
| Exchange and other movements | | 110 | | | 7 | | | 11 | | | 4 | | | 157 | | | 289 | |
| | |
| | |
| | |
| | |
| | |
| | |
| |
Impairment allowances at 31 December | | 3,938 | | | 376 | | | 926 | | | 11,980 | | | 1,992 | | | 19,212 | |
| | |
| | |
| | |
| | |
| | |
| | |
| |
| Impairment allowances against banks: | | | | | | | | | | | | | | | | | | |
| – individually assessed | | 7 | | | – | | | – | | | – | | | – | | | 7 | |
| Impairment allowances against customers: | | | | | | | | | | | | | | | | | | |
| – individually assessed | | 1,846 | | | 132 | | | 349 | | | 119 | | | 253 | | | 2,699 | |
| – collectively assessed3 | | 2,085 | | | 244 | | | 577 | | | 11,861 | | | 1,739 | | | 16,506 | |
| | |
| | |
| | |
| | |
| | |
| | |
| |
| Impairment allowances at 31 December | | 3,938 | | | 376 | | | 926 | | | 11,980 | | | 1,992 | | | 19,212 | |
| | |
| | |
| | |
| | |
| | |
| | |
| |
| | | % | | | % | | | % | | | % | | | % | | | % | |
| Impairment allowances against customers as a percentage of loans and advances to customers: | | | | | | | | | | | | | | | | | | |
| – individually assessed | | 0.40 | | | 0.15 | | | 0.34 | | | 0.04 | | | 0.51 | | | 0.27 | |
| – collectively assessed | | 0.46 | | | 0.27 | | | 0.56 | | | 3.93 | | | 3.48 | | | 1.65 | |
| | |
| | |
| | |
| | |
| | |
| | |
| |
| At 31 December | | 0.86 | | | 0.42 | | | 0.90 | | | 3.97 | | | 3.99 | | | 1.92 | |
| | |
| | |
| | |
| | |
| | |
| | |
| |
| | | | | | | | | | | | | | | | | | | |
| 1 | See table below ‘Net loan impairment charge to the income statement by geographical region’. |
| 2 | In 2004, ‘Charge to income statement’ was ‘Net charge to profit and loss account’; ‘Impairment allowances’ were ‘Provisions’; ‘Individually assessed impairment allowances’ were ‘Specific provisions’; and ‘Collectively assessed impairment allowances’ were ‘General provisions’. |
| 3 | Collectively assessed impairment allowances (2004: ‘General provisions’) are allocated to geographical segments based on the location of the office booking the allowances or provisions. Consequently, the collectively assessed impairment allowances booked in Hong Kong may cover assets booked in branches located outside Hong Kong, principally in Rest of Asia-Pacific, as well as those booked in Hong Kong. |
| 4 | Includes movement in impairment allowances against banks. |
227
Back to Contents
| H S B C H O L D I N G S P L C |
| |
| Report of the Directors: Risk(continued) |
| | |
| | |
| Credit risk > Impairment allowances > Charge / 2008 |
Individually and collectively assessed charge to impairment allowances by industry segment
(Unaudited)
| | | 2008 | | | 2007 | |
| | |
|
|
|
|
|
|
| | |
|
|
|
|
|
|
| |
| | | Individually | | | Collectively | | | | | | Individually | | | Collectively | | | | |
| | | assessed | | | assessed | | | Total | | | assessed | | | assessed | | | Total | |
| | | US$m | | | US$m | | | US$m | | | US$m | | | US$m | | | US$m | |
| | | | | | | | | | | | | | | | | | | |
| Banks | | 54 | | | – | | | 54 | | | – | | | – | | | – | |
| Personal | | 110 | | | 20,840 | | | 20,950 | | | 54 | | | 15,914 | | | 15,968 | |
| Residential mortgages | | 26 | | | 4,974 | | | 5,000 | | | 13 | | | 1,827 | | | 1,840 | |
| Other personal | | 84 | | | 15,866 | | | 15,950 | | | 41 | | | 14,087 | | | 14,128 | |
| Corporate and commercial | | 1,782 | | | 1,097 | | | 2,879 | | | 722 | | | 451 | | | 1,173 | |
| Commercial, industrial and international trade | | 912 | | | 661 | | | 1,573 | | | 584 | | | 313 | | | 897 | |
| Commercial real estate and other property-related | | 613 | | | 142 | | | 755 | | | 84 | | | 67 | | | 151 | |
| Other commercial | | 257 | | | 294 | | | 551 | | | 54 | | | 71 | | | 125 | |
| Financial | | 118 | | | 130 | | | 248 | | | 20 | | | 16 | | | 36 | |
| | |
| | |
| | |
| | |
| | |
| | |
| |
| Total charge to income statement | | 2,064 | | | 22,067 | | | 24,131 | | | 796 | | | 16,381 | | | 17,177 | |
| | |
| | |
| | |
| | |
| | |
| | |
| |
| | | | | | | | | | | | | | | | | | | |
| | | | | | | | | | | | | | | | | | | |
Charge for impairment losses
The following tables analysing the net loan impairment charge to the income statement are
followed by a discussion of the material movements in loan impairment charges by region.
| |
| |
Net loan impairment charge to the income statement
(Unaudited) |
| | | 2008 | | | 2007 | | | 2006 | | | 2005 | | | 2004 | |
| | | US$m | | | US$m | | | US$m | | | US$m | | | US$m | |
| Individually assessed impairment allowances1 | | | | | | | | | | | | | | | |
| New allowances | | 2,742 | | | 1,533 | | | 1,297 | | | 1,715 | | | 8,872 | |
| Release of allowances no longer required | | (565 | ) | | (608 | ) | | (711 | ) | | (998 | ) | | (1,266 | ) |
| Recoveries of amounts previously written off | | (113 | ) | | (129 | ) | | (128 | ) | | (199 | ) | | (913 | ) |
| | |
| | |
| | |
| | |
| | |
| |
| | | 2,064 | | | 796 | | | 458 | | | 518 | | | 6,693 | |
| | |
| | |
| | |
| | |
| | |
| |
| Collectively assessed impairment allowances1 | | | | | | | | | | | | | | | |
| New allowances net of allowance releases | | 22,788 | | | 17,257 | | | 10,740 | | | 8,425 | | | – | |
| Release of allowances no longer required | | – | | | – | | | – | | | (788 | ) | | – | |
| Recoveries of amounts previously written off | | (721 | ) | | (876 | ) | | (651 | ) | | (295 | ) | | – | |
| General provisions | | – | | | – | | | – | | | – | | | (498 | ) |
| | |
| | |
| | |
| | |
| | |
| |
| | | 22,067 | | | 16,381 | | | 10,089 | | | 7,342 | | | (498 | ) |
| | |
| | |
| | |
| | |
| | |
| |
| Total charge for impairment losses1 | | 24,131 | | | 17,177 | | | 10,547 | | | 7,860 | | | 6,195 | |
| | |
| | |
| | |
| | |
| | |
| |
| Banks | | 54 | | | – | | | (3 | ) | | (7 | ) | | (10 | ) |
| Customers | | 24,077 | | | 17,177 | | | 10,550 | | | 7,867 | | | 6,205 | |
| | |
| | |
| | |
| | |
| | |
| |
| | | | | | | | | | | | | | | | |
| | | % | | | % | | | % | | | % | | | % | |
Charge for impairment losses as a percentage of closing gross loans and advances1 | | 2.17 | | | 1.39 | | | 0.99 | | | 0.90 | | | 0.91 | |
| | | | | | | | | | | | | | | | |
| | | US$m | | | US$m | | | US$m | | | US$m | | | US$m | |
| At 31 December | | | | | | | | | | | | | | | |
| Impaired loans1,2 | | 25,422 | | | 19,594 | | | 15,086 | | | 12,360 | | | 13,057 | |
| Impairment allowances1 | | 23,972 | | | 19,212 | | | 13,585 | | | 11,366 | | | 12,542 | |
| | | | | | | | | | | | | | | | |
| | | | | | | | | | | | | | | | |
| 1 | In 2004, ‘Individually assessed impairment allowances’ were ‘Specific provisions’; ‘Collectively assessed impairment allowances’ were ‘General provisions’; ‘Total charge for impairment losses’ was ‘Bad and doubtful debt charge’; ‘Impaired loans’ were ‘Non- performing loans’ and ‘Impairment allowances’ were ‘Provisions’. |
| 2 | Impaired loans for 2007 have been restated as a result of the reclassification of an element of a credit card portfolio as impaired. There has been no effect on impairment allowances. |
228
Back to Contents
Net loan impairment charge to the income statement by geographical region
(Unaudited) |
| | | | | | | | Rest of | | | | | | | | | | |
| | | | | Hong | | | Asia- | | | North | | | Latin | | | | |
| | Europe | | | Kong | | | Pacific | | | America | | | America | | | Total | |
| | US$m | | | US$m | | | US$m | | | US$m | | | US$m | | | US$m | |
| 2008 | | | | | | | | | | | | | | | | | |
| Individually assessed impairment allowances | | | | | | | | | | | | | | | | | |
| New allowances | 1,567 | | | 365 | | | 253 | | | 397 | | | 160 | | | 2,742 | |
| Release of allowances no longer required | (340 | ) | | (25 | ) | | (89 | ) | | (80 | ) | | (31 | ) | | (565 | ) |
| Recoveries of amounts previously written off | (38 | ) | | (10 | ) | | (20 | ) | | (40 | ) | | (5 | ) | | (113 | ) |
| |
| | |
| | |
| | |
| | |
| | |
| |
| | 1,189 | | | 330 | | | 144 | | | 277 | | | 124 | | | 2,064 | |
| |
| | |
| | |
| | |
| | |
| | |
| |
| Collectively assessed impairment allowances | | | | | | | | | | | | | | | | | |
| New allowances net of allowance releases | 2,478 | | | 255 | | | 1,062 | | | 16,372 | | | 2,621 | | | 22,788 | |
| Recoveries of amounts previously written off | (256 | ) | | (29 | ) | | (117 | ) | | (60 | ) | | (259 | ) | | (721 | ) |
| |
| | |
| | |
| | |
| | |
| | |
| |
| | 2,222 | | | 226 | | | 945 | | | 16,312 | | | 2,362 | | | 22,067 | |
| |
| | |
| | |
| | |
| | |
| | |
| |
| Total charge for impairment losses | 3,411 | | | 556 | | | 1,089 | | | 16,589 | | | 2,486 | | | 24,131 | |
| Banks | 54 | | | – | | | – | | | – | | | – | | | 54 | |
| Customers | 3,357 | | | 556 | | | 1,089 | | | 16,589 | | | 2,486 | | | 24,077 | |
| |
| | |
| | |
| | |
| | |
| | |
| |
| | | | | | | | | | | | | | | | | | |
| | % | | | % | | | % | | | % | | | % | | | % | |
| Charge for impairment losses as a percentage of closing gross loans and advances | 0.68 | | | 0.43 | | | 0.75 | | | 5.85 | | | 4.22 | | | 2.17 | |
| | | | | | | | | | | | | | | | | | |
| | US$m | | | US$m | | | US$m | | | US$m | | | US$m | | | US$m | |
| At 31 December 2008 | | | | | | | | | | | | | | | | | |
| Impaired loans | 6,844 | | | 852 | | | 1,114 | | | 14,285 | | | 2,327 | | | 25,422 | |
| Impairment allowances | 3,922 | | | 733 | | | 1,227 | | | 16,090 | | | 2,000 | | | 23,972 | |
| | | | | | | | | | | | | | | | | | |
| 2007 | | | | | | | | | | | | | | | | | |
| Individually assessed impairment allowances | | | | | | | | | | | | | | | | | |
| New allowances | 781 | | | 103 | | | 211 | | | 228 | | | 210 | | | 1,533 | |
| Release of allowances no longer required | (388 | ) | | (32 | ) | | (96 | ) | | (54 | ) | | (38 | ) | | (608 | ) |
| Recoveries of amounts previously written off | (38 | ) | | (14 | ) | | (32 | ) | | (26 | ) | | (19 | ) | | (129 | ) |
| |
| | |
| | |
| | |
| | |
| | |
| |
| | 355 | | | 57 | | | 83 | | | 148 | | | 153 | | | 796 | |
| |
| | |
| | |
| | |
| | |
| | |
| |
| Collectively assessed impairment allowances | | | | | | | | | | | | | | | | | |
| New allowances net of allowance releases | 2,692 | | | 184 | | | 623 | | | 11,999 | | | 1,759 | | | 17,257 | |
| Recoveries of amounts previously written off | (504 | ) | | (29 | ) | | (92 | ) | | (36 | ) | | (215 | ) | | (876 | ) |
| |
| | |
| | |
| | |
| | |
| | |
| |
| | 2,188 | | | 155 | | | 531 | | | 11,963 | | | 1,544 | | | 16,381 | |
| |
| | |
| | |
| | |
| | |
| | |
| |
| Total charge for impairment losses | 2,543 | | | 212 | | | 614 | | | 12,111 | | | 1,697 | | | 17,177 | |
| Customers | 2,543 | | | 212 | | | 614 | | | 12,111 | | | 1,697 | | | 17,177 | |
| |
| | |
| | |
| | |
| | |
| | |
| |
| | | | | | | | | | | | | | | | | | |
| | % | | | % | | | % | | | % | | | % | | | % | |
| Charge for impairment losses as a percentage of closing gross loans and advances | 0.45 | | | 0.14 | | | 0.43 | | | 3.80 | | | 2.71 | | | 1.39 | |
| | | | | | | | | | | | | | | | | | |
| | US$m | | | US$m | | | US$m | | | US$m | | | US$m | | | US$m | |
| At 31 December 2007 | | | | | | | | | | | | | | | | | |
| Impaired loans1 | 6,266 | | | 433 | | | 1,088 | | | 9,662 | | | 2,145 | | | 19,594 | |
| Impairment allowances | 3,938 | | | 376 | | | 926 | | | 11,980 | | | 1,992 | | | 19,212 | |
| | | | | | | | | | | | | | | | | | |
| 1 | The 2007 impaired loans for North America have been restated as a result of the reclassification of an element of a credit card portfolio as impaired. There has been no effect on impairment allowances. |
| |
2008 compared with 2007
(Unaudited)
Loan impairment charges increased by 40 per cent to US$24.1 billion from US$17.2 billion in 2007. The commentary that follows is on a constant currency basis.
New allowances for loan impairment charges rose by 37 per cent compared with 2007. Releases
and recoveries of allowances declined by 10 per cent to US$1.4 billion.
InEurope, new loan impairment charges were US$4.0 billion, a rise of 24 per cent compared with 2007. This primarily reflected higher impairment charges in Global Banking and Markets following a significant charge against a single European commercial real estate corporate customer.
229
Back to Contents
| H S B C H O L D I N G S P L C |
| |
| Report of the Directors: Risk (continued) |
| | |
| | |
| Credit risk > Impairment allowances > Charge > 2008 / 2007 |
Impairment charges against banks rose in the UK due to exposures to the Icelandic banks in 2008. New loan impairment charges rose in Turkey as delinquency rates rose across credit cards, personal loans and corporate lending in light of the deteriorating economic environment. Elsewhere, impairment charges on the commercial portfolio rose in the UK, particularly in the final quarter of 2008 as the weakening property market led to higher impairment charges against construction companies and businesses dependent upon the real estate sector. In France, the impact of declining commercial credit quality more than offset lower balances. Impairment allowances against firms in the financial sector rose due to exposure to a single asset management firm in the UK. Credit quality in the UK personal lending portfolio remained broadly stable, reflecting the strength of HSBC’s loan book in a period of significant economic uncertainty. Mortgage lending in the UK remained well secured as risk mitigation actions taken since 2006 reduced risk exposure to some of the problems now being uncovered in the UK residential property market. Credit quality in the unsecured portfolios of M&S Money, HSBC Bank and Partnership Cards deteriorated slightly in 2008, particularly in the second half of the year, due to the weakening UK economy.
Releases and recoveries in Europe declined by 27 per cent, driven by the deterioration in economic conditions.
InHong Kong, new loan impairment charges more than doubled from a low base, driven by deterioration in credit quality in the commercial portfolio in the second half of the year as the economy and trade flows weakened. Residential mortgage lending continued to be well-secured, as regulatory restrictions constrained origination loan-to-value ratios to below 70 per cent.
InRest of Asia-Pacific, new loan impairment charges rose by 59 per cent to US$1.3 billion, primarily in India and the Middle East. Higher impairment charges in India were driven by a combination of rising delinquency rates in consumer lending, as credit conditions deteriorated, and increased lending. Increased charges in the Middle East were due to rising delinquencies as growth rates declined and the property market retreated as economic conditions deteriorated on the back of lower oil and gas prices.
New loan impairment charges inNorth America rose by 37 per cent to US$16.8 billion, driven by the continued deterioration in credit quality in the HSBC Finance loan portfolio and, to a lesser extent, in HSBC USA.
US credit quality showed significant deterioration across the portfolio, driven by the continued weakness of the US economy. The reasons behind the deterioration in US credit quality, the effects on the US personal lending portfolio and actions taken as a result are discussed in more detail on page 210. Partly offsetting the effect of the deterioration was a reduction in overall lending as HSBC continued to reduce its exposure in the US.
In US card and retail services, impairment charges rose, driven by portfolio seasoning, higher levels of personal bankruptcy filings and continued weakness in the US economy. Delinquency increased in the geographical regions most affected by house price falls and rising unemployment.
In Commercial Banking, impairment charges rose from a low base driven by deterioration in the commercial real estate loan book in the US, and higher impairment charges against firms in the manufacturing, export and commercial real estate sectors in Canada. Higher impairment charges in Global Banking and Markets reflected weaker credit fundamentals in the US in 2008. Impairment allowances against firms in the financial sector rose due to rising delinquencies, despite government intervention.
Releases and recoveries in North America rose by 55 per cent to US$180 million.
InLatin America, new loan impairment charges rose by 37 per cent to US$2.8 billion. The most significant increase was in Mexico, reflecting higher impairment charges in the credit card portfolio due to a combination of higher average balances from organic expansion and growing delinquency rates driven by a deterioration in credit quality as the 2006 and 2007 vintages continued to season and move into later stages of delinquency. Management action to improve the quality of new business included tightened underwriting, enhanced collection strategies and better managed customer acquisition channels. The commercial portfolio in Mexico also experienced higher impairment charges due to credit quality deterioration among small and medium sized enterprises as the economy weakened. In Brazil, higher impairment charges were driven by a combination of balance growth and credit quality deterioration in the vehicle finance and payroll loan portfolios.
2007 compared with 2006
(Unaudited)
Loan impairment charges rose by 63 per cent to US$17.2 billion from US$10.5 billion in 2006. The
230
Back to Contents
commentary that follows is on a constant currency basis:
New allowances for loan impairment charges rose by 52 per cent, compared with 2006. Releases and recoveries of allowances increased by 1 per cent to US$1.6 billion.
InEurope, new loan impairment charges were US$3.5 billion, a rise of 8 per cent compared with 2006. This partly reflected growth in commercial lending, where charges remained low compared with historical amounts but rose from the exceptionally low levels experienced in 2005 and 2006. Increased charges also reflected growth in credit card lending in Turkey. In the UK, refinements to the methodology used to calculate roll rate percentages resulted in a higher charge in the consumer finance operations in the first half of the year. Excluding this, loan impairment charges were marginally lower than in 2006.
Releases and recoveries in Europe were broadly in line with 2006.
InHong Kong, new loan impairment charges of US$287 million were recorded, an increase of 19 per cent, due to the growth in credit card balances and new corporate loan charges.
Releases and recoveries in Hong Kong decreased to US$75 million, primarily in the corporate sector. This reflected the low level of allowances added in recent years.
InRest of Asia-Pacific, new loan impairment charges rose by 10 per cent to US$834 million, with higher loan impairment charges arising in the commercial loan books in Thailand and Malaysia. This was offset by a decline in loan impairment charges for personal lending, particularly in Taiwan and Indonesia, where charges returned to more regular levels after an upsurge in 2006 due to regulatory changes which affected collection activity and minimum payments.
With corporate and commercial loan impairment charges low in recent years, releases and recoveries decreased by 6 per cent to US$220 million.
New loan impairment charges inNorth America rose by 76 per cent to US$12.2 billion, driven by the continued deterioration in credit quality in the US consumer finance loan portfolio.
US credit quality deteriorated as mortgage delinquencies rose, house prices declined, refinancing credit became less available in the market and the macroeconomic outlook worsened.
Other factors affecting the rise in US loan impairment charges included normal seasoning of the portfolio, a higher proportion of unsecured personal lending and a return to historical norms from the unusually low levels of bankruptcy filings experienced in 2006, following changes enacted to US bankruptcy law in 2005.
Delinquency rates rose across all parts of the HSBC Finance personal lending portfolio, with mortgage services and consumer lending experiencing significant rises in delinquency which flowed through subsequent stages through to foreclosure. As the housing downturn began to have more effect on the broader economy, delinquency rates in credit cards and vehicle finance rose in the final quarter of 2007. A change in product mix in the cards portfolio towards higher yielding products also contributed to higher impairment charges as this segment of the portfolio seasoned.
Releases and recoveries in North America decreased to US$116 million. In the US consumer finance business, collection staff increased in all lending portfolios as part of the response to the deteriorating credit environment.
InLatin America, new loan impairment charges rose by 63 per cent to US$2.0 billion. The most significant increase was registered in Mexico, reflecting strong growth in balances, normal portfolio seasoning and a rise in delinquency rates in credit cards. Charges for commercial lending in Mexico fell as increased delinquency rates in the small and medium-sized business portfolios were offset by impairment allowance releases. Products with high credit losses were discontinued or restructured. Loan impairment charges in Brazil rose marginally, due to growth in store loans and credit cards.
Releases and recoveries in Latin America increased to US$272 million. In Brazil, credit models were changed during 2007 to align with credit behaviour in underlying portfolios.
231
Back to Contents
| H S B C H O L D I N G S P L C |
| |
| Report of the Directors: Risk (continued) |
| | |
| | |
| Credit risk > Impairment allowances > Charge // HSBC Holdings / Risk element |
Charge for impairment losses as a percentage of average gross loans and advances to customers
(Unaudited)
| | 2008 | | 2007 | | 2006 | | 2005 | | 2004 | |
| | % | | % | | % | | % | | % | |
| | | | | | | | | | | |
| New allowances net of allowance releases1 | 2.54 | | 2.09 | | 1.49 | | 1.25 | | 1.41 | |
| Recoveries1 | (0.09 | ) | (0.12 | ) | (0.10 | ) | (0.09 | ) | (0.35 | ) |
| |
| |
| |
| |
| |
| |
| Total charge for impairment losses1 | 2.45 | | 1.97 | | 1.39 | | 1.16 | | 1.06 | |
| |
| |
| |
| |
| |
| |
| Amount written off net of recoveries | 1.75 | | 1.36 | | 1.15 | | 1.26 | | 1.26 | |
| | |
| 1 | In 2004, ‘New allowances’ were ‘New provisions’; ‘Recoveries’ were ‘Releases and recoveries’; and ‘Total charge for impairment losses’ was ‘Total provisions charged’. |
Charge for impairment losses as a percentage of average gross loans and advances to customers by geographical region
(Unaudited)
| | | | | | Rest of | | | | | | | |
| | | | Hong | | Asia- | | North | | Latin | | | |
| | Europe | | Kong | | Pacific | | America | | America | | Total | |
| | % | | % | | % | | % | | % | | % | |
| 2008 | | | | | | | | | | | | |
| New allowances net of allowance releases | 0.86 | | 0.63 | | 1.06 | | 5.73 | | 5.32 | | 2.54 | |
| Recoveries | (0.07 | ) | (0.04 | ) | (0.12 | ) | (0.03 | ) | (0.51 | ) | (0.09 | ) |
| |
| |
| |
| |
| |
| |
| |
| Total charge for impairment losses | 0.79 | | 0.59 | | 0.94 | | 5.70 | | 4.81 | | 2.45 | |
| |
| |
| |
| |
| |
| |
| |
| Amount written off net of recoveries | 0.52 | | 0.19 | | 0.61 | | 4.16 | | 3.73 | | 1.75 | |
| | | | | | | | | | | | | |
| 2007 | | | | | | | | | | | | |
| New allowances net of allowance releases | 0.86 | | 0.29 | | 0.83 | | 4.20 | | 4.55 | | 2.09 | |
| Recoveries | (0.15 | ) | (0.05 | ) | (0.14 | ) | (0.02 | ) | (0.55 | ) | (0.12 | ) |
| |
| |
| |
| |
| |
| |
| |
| Total charge for impairment losses | 0.71 | | 0.24 | | 0.69 | | 4.18 | | 4.00 | | 1.97 | |
| |
| |
| |
| |
| |
| |
| |
| Amount written off net of recoveries | 0.67 | | 0.23 | | 0.67 | | 2.55 | | 2.95 | | 1.36 | |
HSBC Holdings
(Audited)
Credit risk arises in HSBC Holdings primarily from transactions with Group subsidiaries and from guarantees issued in support of obligations assumed by certain Group operations in the normal conduct of their business.
These risks are reviewed and managed within regulatory and internal limits for exposures by the HSBC Global Risk function, which provides high-
level, centralised oversight and management of HSBC’s credit risks world-wide.
No collateral or other credit enhancements were held by HSBC Holdings in respect of its transactions with subsidiary undertakings.
HSBC Holdings’ maximum exposure to credit risk at 31 December 2008 is shown below. HSBC Holdings’ financial assets principally represent claims on Group subsidiaries in Europe and North America.
| HSBC Holdings – maximum exposure to credit risk | | | | |
| | Maximum exposure | |
| |
|
|
| |
| | 2008 | | 2007 | |
| | US$m | | US$m | |
| | | | | |
| Derivatives | 3,682 | | 2,660 | |
| Loans and advances to HSBC undertakings | 11,804 | | 17,242 | |
| Financial investments | 2,629 | | 3,022 | |
| Financial guarantees | 47,341 | | 38,457 | |
| Loan commitments and other credit-related commitments | 3,241 | | 3,638 | |
| |
| |
| |
| | 68,697 | | 65,019 | |
| |
| |
| |
232
Back to Contents
All of the derivative transactions are with HSBC undertakings which are banking counterparties (2007: 100 per cent).
The credit quality of loans and advances to HSBC undertakings is assessed as satisfactory risk, with 100 per cent of the exposure being neither past due nor impaired (2007: 100 per cent).
The long-term debt ratings of HSBC Group issuers of financial investments are within the Standard & Poor’s ratings range of AA– to AA+ (2007: AA– to AA+).
Risk elements in the loan portfolio
(Unaudited)
The disclosure of credit risk elements under the following headings reflects US accounting practice and classifications for publicly traded bank holding companies:
| • | loans accounted for on a non-accrual basis; |
| | |
| • | accruing loans contractually past due 90 days or more as to interest or principal; and |
| | |
| • | troubled debt restructurings not included in the above. |
Interest forgone on impaired loans
(Audited)
Interest income that would have been recognised under the original terms of impaired and restructured loans amounted to approximately US$1.9 billion in 2008 (2007: US$1.1 billion). Interest income from such loans of approximately US$702 million (2007: US$374 million) was recorded in 2008.
Troubled debt restructurings
The SEC requires separate disclosure of any loans whose terms have been modified because of problems with the borrower to grant concessions other than are warranted by market conditions. These are classified as ‘troubled debt restructurings’ (TDRs). The definition of TDRs differs from the ‘Renegotiated loans that would otherwise be past due or impaired’ quantified on page 216 insofar as for TDRs the delinquency status of the loan following restructuring may continue to be past due not impaired or, where appropriate, impaired. In addition, the classification of a loan as a TDR may be discontinued after the first year if the debt performs in accordance with the new terms.
Troubled debt restructurings increased by 47 per cent in 2008, reflecting measures taken to mitigate risk in the US consumer finance business in response to the deterioration in mortgage loans.
Unimpaired loans past due 90 days or more
Unimpaired loans contractually past due 90 days or more increased. Figures for 2004 to 2007 have been restated due to the reclassification of an element of the North America credit card portfolio as impaired. There has been no effect on impairment allowances.
Impaired loans
In accordance with IFRSs, HSBC recognises interest income on assets after they have been written down as a result of an impairment loss. In the following tables, HSBC represents information on its impaired loans and advances in accordance with the disclosure convention described on page 217.
Potential problem loans
Credit risk elements also cover potential problem loans. These are loans where information on possible credit problems among borrowers causes management to seriously doubt their ability to comply with the loan repayment terms. There are no potential problem loans other than those identified in the table of risk elements set out below, and as discussed in ‘Areas of special interest’ on page 210. ‘Areas of special interest’ includes further disclosure about certain homogeneous groups of loans which are collectively assessed for impairment, and represent the Group’s most significant exposures to potential problem loans, including ARMs and stated-income products. Collectively assessed loans and advances, as set out on page 223, although not classified as impaired until more than 90 days, are assessed collectively for losses that have been incurred but have not yet been individually identified. This policy is further described on page 196.
Risk elements
The following table provides an analysis of risk elements in the loan portfolios at 31 December for the past five years.
233
Back to Contents
| H S B C H O L D I N G S P L C |
| |
| Report of the Directors: Risk (continued) |
| |
| | |
| Credit risk > Risk elements / Liquidity and funding > Policies / Primary sources of funding |
Analysis of risk elements
(Unaudited)
| | At 31 December | |
|
| |
| | 2008 | | 2007 | | 2006 | | 2005 | | 2004 | |
| | US$m | | US$m | | US$m | | US$m | | US$m | |
| Impaired loans | | | | | | | | | | |
| Europe | 6,844 | | 6,266 | | 5,858 | | 5,081 | | 6,053 | |
| Hong Kong | 852 | | 433 | | 454 | | 506 | | 696 | |
| Rest of Asia-Pacific | 1,114 | | 1,088 | | 1,188 | | 945 | | 1,172 | |
| North America1 | 14,285 | | 9,662 | | 6,108 | | 4,602 | | 4,204 | |
| Latin America | 2,327 | | 2,145 | | 1,478 | | 1,226 | | 932 | |
| |
| |
| |
| |
| |
| |
| | 25,422 | | 19,594 | | 15,086 | | 12,360 | | 13,057 | |
| |
| |
| |
| |
| |
| |
| Troubled debt restructurings | | | | | | | | | | |
| Europe | 366 | | 648 | | 360 | | 239 | | 213 | |
| Hong Kong | 165 | | 146 | | 189 | | 198 | | 436 | |
| Rest of Asia-Pacific | 119 | | 34 | | 73 | | 121 | | 56 | |
| North America | 5,618 | | 3,322 | | 1,712 | | 1,417 | | 1,600 | |
| Latin America | 1,067 | | 848 | | 915 | | 878 | | 830 | |
| |
| |
| |
| |
| |
| |
| | 7,335 | | 4,998 | | 3,249 | | 2,853 | | 3,135 | |
| |
| |
| |
| |
| |
| |
Unimpaired loans contractually past due 90 days or more as to principal or interest | | | | | | | | | | |
| Europe | 635 | | 202 | | 237 | | 592 | | 68 | |
| Hong Kong | 43 | | 49 | | 79 | | 74 | | 67 | |
| Rest of Asia-Pacific | 274 | | 156 | | 78 | | 40 | | 56 | |
| North America1 | 108 | | 24 | | 78 | | 32 | | 567 | |
| Latin America | 21 | | 421 | | 165 | | 4 | | – | |
| |
| |
| |
| |
| |
| |
| | 1,081 | | 852 | | 637 | | 742 | | 758 | |
| |
| |
| |
| |
| |
| |
| Trading loans classified as in default2 | | | | | | | | | | |
| North America | 561 | | 675 | | 127 | | 11 | | – | |
| |
| |
| |
| |
| |
| |
| Risk elements on loans | | | | | | | | | | |
| Europe | 7,845 | | 7,116 | | 6,455 | | 5,912 | | 6,334 | |
| Hong Kong | 1,060 | | 628 | | 722 | | 778 | | 1,199 | |
| Rest of Asia-Pacific | 1,507 | | 1,278 | | 1,339 | | 1,106 | | 1,284 | |
| North America | 20,572 | | 13,683 | | 8,025 | | 6,062 | | 6,371 | |
| Latin America | 3,415 | | 3,414 | | 2,558 | | 2,108 | | 1,762 | |
| |
| |
| |
| |
| |
| |
| | 34,399 | | 26,119 | | 19,099 | | 15,966 | | 16,950 | |
| |
| |
| |
| |
| |
| |
| Assets held for resale | | | | | | | | | | |
| Europe | 81 | | 59 | | 30 | | 205 | | 27 | |
| Hong Kong | 26 | | 29 | | 42 | | 49 | | 75 | |
| Rest of Asia-Pacific | 13 | | 7 | | 17 | | 31 | | 21 | |
| North America | 1,758 | | 1,172 | | 999 | | 582 | | 664 | |
| Latin America | 113 | | 101 | | 91 | | 103 | | 44 | |
| |
| |
| |
| |
| |
| |
| | 1,991 | | 1,368 | | 1,179 | | 970 | | 831 | |
| |
| |
| |
| |
| |
| |
| Total risk elements | | | | | | | | | | |
| Europe | 7,926 | | 7,175 | | 6,485 | | 6,117 | | 6,361 | |
| Hong Kong | 1,086 | | 657 | | 764 | | 827 | | 1,274 | |
| Rest of Asia-Pacific | 1,520 | | 1,285 | | 1,356 | | 1,137 | | 1,305 | |
| North America | 22,330 | | 14,855 | | 9,024 | | 6,644 | | 7,035 | |
| Latin America | 3,528 | | 3,515 | | 2,649 | | 2,211 | | 1,806 | |
| |
| |
| |
| |
| |
| |
| | 36,390 | | 27,487 | | 20,278 | | 16,936 | | 17,781 | |
| |
| |
| |
| |
| |
| |
| | % | | % | | % | | % | | % | |
| | | | | | | | | | | |
| Loan impairment allowances as a percentage of risk elements on loans3 | 70.8 | | 75.5 | | 71.6 | | 71.2 | | 74.1 | |
| |
| |
| |
| |
| |
| |
| | |
| 1 | Restated for 2004 to 2007 as a result of a reclassification from ‘Unimpaired loans contractually past due 90 days or more as to principal or interest’ to ‘Impaired’, in respect of an element of a credit card portfolio. |
| 2 | Classified as grades 6 and 7 in 2004 to 2007. |
| 3 | Ratio excludes trading loans classified as in default. |
234
Back to Contents
| Liquidity and funding |
|
| (Audited) |
Liquidity risk is the risk that HSBC does not have sufficient financial resources to meet its obligations as they fall due, or will have to do so at an excessive cost. This risk arises from mismatches in the timing of cash flows. Funding risk (a form of liquidity risk) arises when the liquidity needed to fund illiquid asset positions cannot be obtained at the expected terms and when required.
The objective of HSBC’s liquidity and funding management framework is to ensure that all foreseeable funding commitments can be met when due, and that access to the wholesale markets is co-ordinated and cost-effective. To this end, HSBC maintains a diversified funding base comprising core retail and corporate customer deposits and institutional balances. This is augmented with wholesale funding and portfolios of highly liquid assets diversified by currency and maturity which are held to enable HSBC to respond quickly and smoothly to unforeseen liquidity requirements.
HSBC requires its operating entities to maintain strong liquidity positions and to manage the liquidity profiles of their assets, liabilities and commitments with the objective of ensuring that their cash flows are balanced appropriately and that all their anticipated obligations can be met when due.
HSBC adapts its liquidity and funding risk management framework in response to changes in the mix of business that it undertakes, and to changes in the nature of the markets in which it operates. HSBC has continuously monitored the impact of recent market events on the Group’s liquidity positions and has changed behavioural assumptions where justified. The impact of these recent market events is discussed more fully below. The liquidity and funding risk management framework will continue to evolve as the Group assimilates knowledge from the recent market events.
Policies and procedures
(Audited)
The management of liquidity and funding is primarily undertaken locally in HSBC’s operating entities in compliance with practices and limits set by the Risk Management Meeting (‘RMM’). These limits vary according to the depth and liquidity of the market in which the entities operate. It is HSBC’s general policy that each banking entity should be self-sufficient when funding its own operations. Exceptions are permitted for certain short-term treasury requirements and start-up operations or branches which do not have access to local deposit
markets. These entities are funded from HSBC’s largest banking operations and within clearly defined internal and regulatory guidelines and limits. These limits place formal restrictions on the transfer of resources between HSBC entities and reflect the broad range of currencies, markets and time zones within which HSBC operates.
HSBC’s liquidity and funding management process includes:
| • | projecting cash flows by major currency under various stress scenarios and considering the level of liquid assets necessary in relation thereto; |
| | |
| • | monitoring balance sheet liquidity and advances to deposits ratios against internal and regulatory requirements; |
| | |
| • | maintaining a diverse range of funding sources with back-up facilities; |
| | |
| • | managing the concentration and profile of debt maturities; |
| | |
| • | managing contingent liquidity commitment exposures within pre-determined caps; |
| | |
| • | maintaining debt financing plans; |
| | |
| • | monitoring depositor concentration in order to avoid undue reliance on large individual depositors and ensure a satisfactory overall funding mix; and |
| | |
| • | maintaining liquidity and funding contingency plans. These plans identify early indicators of stress conditions and describe actions to be taken in the event of difficulties arising from systemic or other crises, while minimising adverse long-term implications for the business. |
Primary sources of funding
(Audited)
Current accounts and savings deposits payable on demand or at short notice form a significant part of HSBC’s funding, and the Group places considerable importance on maintaining their stability. For deposits, stability depends upon preserving depositor confidence in HSBC’s capital strength and liquidity, and on competitive and transparent pricing.
HSBC also accesses professional markets in order to provide funding for non-banking subsidiaries that do not accept deposits, to maintain a presence in local money markets and to optimise the funding of asset maturities not naturally matched by core deposit funding. In aggregate, HSBC’s banking entities are liquidity providers to the interbank market, placing significantly more funds with other banks than they themselves borrow.
235
Back to Contents
| H S B C H O L D I N G S P L C |
| |
| Report of the Directors: Risk(continued) |
| | |
| | |
| Liquidity and funding > Primary sources of funding |
The main operating subsidiary that does not accept deposits is HSBC Finance, which has historically funded itself principally by taking term funding in the professional markets and by securitising assets. At 31 December 2008,
US$111 billion (2007: US$142 billion) of HSBC Finance’s liabilities were drawn from professional markets, utilising a range of products, maturities and currencies.
Cash flows payable by HSBC under financial liabilities by remaining contractual maturities
(Audited)
| | | | | | Due | | Due | | | |
| | | | Due | | between | | between | | Due | |
| | On | | within 3 | | 3 and 12 | | 1 and 5 | | after 5 | |
| | demand | | months | | months | | years | | years | |
| | US$m | | US$m | | US$m | | US$m | | US$m | |
| At 31 December 2008 | | | | | | | | | | |
| Deposits by banks | 45,884 | | 82,514 | | 8,734 | | 4,875 | | 2,356 | |
| Customer accounts | 698,187 | | 332,207 | | 69,721 | | 34,537 | | 5,798 | |
| Trading liabilities | 247,652 | | – | | – | | – | | – | |
| Financial liabilities designated at fair value | 5,365 | | 2,713 | | 6,969 | | 34,855 | | 64,853 | |
| Derivatives | 482,039 | | 373 | | 1,479 | | 2,634 | | 1,003 | |
| Debt securities in issue | 481 | | 56,590 | | 53,174 | | 68,169 | | 22,920 | |
| Subordinated liabilities | 92 | | 686 | | 1,646 | | 9,718 | | 41,701 | |
| Other financial liabilities | 19,474 | | 26,180 | | 5,473 | | 1,472 | | 1,022 | |
| |
| |
| |
| |
| |
| |
| | 1,499,174 | | 501,263 | | 147,196 | | 156,260 | | 139,653 | |
| Loan commitments | 239,753 | | 105,952 | | 153,774 | | 72,111 | | 32,432 | |
| |
| |
| |
| |
| |
| |
| | 1,738,927 | | 607,215 | | 300,970 | | 228,371 | | 172,085 | |
| |
| |
| |
| |
| |
| |
| At 31 December 2007 | | | | | | | | | | |
| Deposits by banks | 42,793 | | 78,429 | | 11,445 | | 4,208 | | 5,199 | |
| Customer accounts | 629,227 | | 391,659 | | 56,294 | | 29,445 | | 6,614 | |
| Trading liabilities | 314,580 | | – | | – | | – | | – | |
| Financial liabilities designated at fair value | 11,730 | | 2,083 | | 8,286 | | 43,147 | | 68,726 | |
| Derivatives | 181,009 | | 113 | | 873 | | 1,663 | | 613 | |
| Debt securities in issue | 635 | | 90,718 | | 59,626 | | 109,054 | | 38,782 | |
| Subordinated liabilities | 3 | | 277 | | 1,951 | | 10,181 | | 34,841 | |
| Other financial liabilities | 20,516 | | 29,812 | | 5,177 | | 977 | | 1,273 | |
| |
| |
| |
| |
| |
| |
| | 1,200,493 | | 593,091 | | 143,652 | | 198,675 | | 156,048 | |
| Loan commitments | 312,146 | | 155,142 | | 155,565 | | 113,072 | | 28,532 | |
| |
| |
| |
| |
| |
| |
| | 1,512,639 | | 748,233 | | 299,217 | | 311,747 | | 184,580 | |
| |
| |
| |
| |
| |
| |
| | | | | | | | | | | |
The balances in the above table will not agree directly with the balances in the consolidated balance sheet as the table incorporates, on an undiscounted basis, all cash flows relating to principal and all future coupon payments (except for trading liabilities and trading derivatives). Also, loan commitments are generally not recognised on the balance sheet. Trading liabilities and trading derivatives have been included in the ‘On demand’ time bucket, and not by contractual maturity, because trading liabilities are typically held for short periods of time. The undiscounted cash flows payable under hedging derivative liabilities are classified according to their contractual maturity.
Cash flows payable in respect of customer accounts are primarily contractually repayable on demand or at short notice. However, in practice, short-term deposit balances remain stable as inflows and outflows broadly match and a significant portion of loan commitments expire without being drawn upon.
Advances to deposits ratio
(Audited)
HSBC emphasises the importance of core current accounts and savings accounts as a source of funds to finance lending to customers, and discourages reliance on short-term professional funding. This is achieved by placing limits on Group banking entities which restrict their ability to increase loans and advances to customers without corresponding growth in current accounts and savings accounts. This measure is referred to as the ‘advances to deposits’ ratio.
Advances to deposits ratio limits are set by the RMM and monitored by Group Finance. The ratio describes loans and advances to customers as a percentage of the total of core customer current and savings accounts and term funding with a remaining term to maturity in excess of one year. Loans and advances to customers which are part of reverse repurchase arrangements, and where HSBC receives
236
Back to Contents
securities which are deemed to be liquid, are excluded from the advances to deposits ratio, as are current accounts and savings accounts from customers deemed to be ‘non-core’. The definition of a non-core deposit includes a consideration of the size of the customer’s total deposit balances. Due to the distinction between core and non-core depositors, the Group’s measure of advances to deposits will be more restrictive than that which could be inferred from the published financial statements.
The three banking entities listed in the table below represented 70 per cent of HSBC’s total core deposits at 31 December 2008 (2007: 71 per cent). The table demonstrates that loans and advances to customers in HSBC’s principal banking entities are broadly financed by reliable and stable sources of funding. HSBC would meet any unexpected net cash outflows by selling securities and accessing additional funding sources such as interbank or collateralised lending markets. The Group also uses measures other than the advances to deposits ratio to manage liquidity risk, including the ratio of net liquid assets to customer liabilities and projected cash flow scenario analyses.
Ratio of net liquid assets to customer liabilities
(Audited)
Net liquid assets are liquid assets less all funds maturing in the next 30 days from wholesale market sources and from customers who are deemed to be professional. For this purpose, HSBC defines liquid assets as cash balances, short-term interbank deposits and highly-rated debt securities available for immediate sale and for which a deep and liquid market exists. Contingent liquidity risk associated with committed loan facilities is not reflected in the ratios. The Group’s framework for monitoring this risk is outlined under ‘Contingent liquidity risk’ below.
Limits for the ratio of net liquid assets to customer liabilities are set for each bank operating entity, except for HSBC Finance. As HSBC Finance does not accept customer deposits, it is not appropriate to manage its liquidity using standard liquidity ratios. The liquidity and funding risk management framework of HSBC Finance is discussed below.
Ratios of net liquid assets to customer liabilities are provided in the following table, along with the US dollar equivalents of net liquid assets.
HSBC’s principal banking entities – the management of liquidity risk
(Audited)
| | | | | | | | | Ratio of net liquid assets | | | | | | | |
| | | Advances to deposits ratios | | | to customer liabilities | | | Net liquid assets | |
| |
| | |
| | |
|
|
|
| |
| | | 2008 | | | 2007 | | | 2008 | | | 2007 | | | 2008 | | | 2007 | |
| | | % | | | % | | | % | | | % | | | US$bn | | | US$bn | |
| HSBC Bank (UK operations) | | | | | | | | | | | | | | | | | |
| | Year-end | 106.0 | | | 97.5 | | | 7.1 | | | 12.1 | | | 21.3 | | | 44.2 | |
| | Maximum | 106.7 | | | 101.7 | | | 14.1 | | | 21.5 | | | 52.5 | | | 80.6 | |
| | Minimum | 97.5 | | | 92.6 | | | 6.9 | | | 12.1 | | | 21.3 | | | 39.9 | |
| | Average | 101.5 | | | 97.1 | | | 10.0 | | | 15.6 | | | 35.8 | | | 52.4 | |
| | | | | | | | | | | | | | | | | | | |
| The Hongkong and Shanghai Banking Corporation | | | | | | | | | | | | | | | | | |
| | Year-end | 77.4 | | | 76.7 | | | 25.0 | | | 21.8 | | | 64.6 | | | 53.9 | |
| | Maximum | 82.9 | | | 82.2 | | | 25.0 | | | 24.1 | | | 64.6 | | | 56.9 | |
| | Minimum | 76.7 | | | 72.4 | | | 19.9 | | | 16.1 | | | 51.1 | | | 35.3 | |
| | Average | 80.6 | | | 76.4 | | | 21.9 | | | 20.8 | | | 56.5 | | | 48.2 | |
| | | | | | | | | | | | | | | | | | | |
| HSBC Bank USA | | | | | | | | | | | | | | | | | |
| | Year-end | 103.7 | | | 114.9 | | | 31.5 | | | 15.8 | | | 27.4 | | | 17.1 | |
| | Maximum | 117.3 | | | 116.8 | | | 31.5 | | | 25.7 | | | 27.4 | | | 26.1 | |
| | Minimum | 103.7 | | | 107.0 | | | 15.8 | | | 15.8 | | | 17.1 | | | 17.1 | |
| | Average | 111.8 | | | 112.7 | | | 22.6 | | | 21.3 | | | 21.5 | | | 22.0 | |
| | | | | | | | | | | | | | | | | | | |
Total of HSBC’s other principal banking entities1 | | | | | | | | | | | | | | | | | |
| | Year-end | 85.2 | | | 88.4 | | | 26.5 | | | 21.0 | | | 83.5 | | | 66.1 | |
| | Maximum | 92.3 | | | 89.3 | | | 26.5 | | | 26.1 | | | 83.5 | | | 72.7 | |
| | Minimum | 82.7 | | | 86.2 | | | 19.4 | | | 21.0 | | | 66.1 | | | 58.8 | |
| | Average | 88.1 | | | 87.7 | | | 22.5 | | | 24.0 | | | 73.9 | | | 65.3 | |
| | |
| 1 | This comprises the Group’s other main banking subsidiaries and, as such, includes businesses spread across a range of locations, in many of which HSBC may require a higher ratio of net liquid assets to customer liabilities to reflect local market conditions. |
237
Back to Contents
| H S B C H O L D I N G S P L C |
| |
| Report of the Directors: Risk(continued) |
| | |
| | |
| Liquidity and funding > Primary sources of funding / Contingent liquidity risk / Impact of market turmoil |
Projected cash flow scenario analysis
(Audited)
The Group uses a number of standard projected cash flow scenarios designed to model both Group-specific and market-wide liquidity crises, in which the rate and timing of deposit withdrawals and drawdowns on committed lending facilities are varied, and the ability to access interbank funding and term debt markets and to generate funds from asset portfolios is restricted. The scenarios are modelled by all Group banking entities and by HSBC Finance. The appropriateness of the assumptions under each scenario is regularly reviewed. In addition to the Group’s standard projected cash flow scenarios, individual entities are required to design their own scenarios tailored to reflect specific local market conditions, products and funding bases.
Limits for cumulative net cash flows under stress scenarios are set for each banking entity and for HSBC Finance. Both ratio and cash flow limits reflect the local market place, the diversity of funding sources available and the concentration risk from large depositors. Compliance with entity level limits is monitored centrally by Group Finance and reported regularly to the RMM.
HSBC Finance
As HSBC Finance does not accept customer deposits, it takes funding from the professional markets. HSBC Finance uses a range of measures to monitor funding risk, including projected cash flow scenario analysis and caps placed on the amount of unsecured term funding that can mature in any rolling three-month and rolling 12-month periods.
HSBC Finance also maintains access to committed sources of secured funding and has in place committed backstop lines for short-term refinancing CP programmes. At 31 December 2008, the maximum amounts of unsecured term funding maturing in any rolling three-month and rolling 12-month periods were US$6.0 billion and US$17.4 billion, respectively (2007: US$6.2 billion and US$17.7 billion). At 31 December 2008, HSBC Finance also had in place unused committed sources of secured funding for which eligible assets were held, of US$2.4 billion (2007: US$6.2 billion) and committed backstop lines from non-Group entities in support of CP programmes totalling US$7.3 billion (2007: US$9.3 billion).
Contingent liquidity risk
(Audited)
In the normal course of business, Group entities provide customers with committed facilities, including committed backstop lines to conduit vehicles sponsored by the Group and standby facilities to corporate customers. These facilities increase the funding requirements of the Group when customers choose to raise drawdown levels over and above their normal utilisation rates. The liquidity risk consequences of increased levels of drawdown are analysed in the form of projected cash flows under different stress scenarios. The RMM also sets limits for non-cancellable contingent funding commitments by Group entity after due consideration of each entity’s ability to fund them. The limits are split according to the borrower, the liquidity of the underlying assets and the size of the committed line.
The Group’s contractual exposures at 31 December monitored under the contingent liquidity risk limit structure
(Audited)
| | | | | | | | | | | | | | | | The Hongkong and | |
| | | | | | | | | | | | | | | | Shanghai Banking | |
| | | | HSBC Bank | | HSBC Bank USA | | HSBC Bank Canada | | Corporation | |
| | |
| |
| |
| |
| |
| | | | 2008 | | 2007 | | 2008 | | 2007 | | 2008 | | 2007 | | 2008 | | 2007 | |
| | | | US$bn | | US$bn | | US$bn | | US$bn | | US$bn | | US$bn | | US$bn | | US$bn | |
| Conduits | | | | | | | | | | | | | | | | |
| Client-originated assets1 | | | | | | | | | | | | | | | | |
| | – | total lines | 5.6 | | 11.0 | | 11.2 | | 9.5 | | 0.3 | | 0.7 | | – | | – | |
| | – | largest individual lines | 1.0 | | 1.6 | | 0.4 | | 0.9 | | 0.2 | | 0.4 | | – | | – | |
| HSBC-managed assets2 | 34.8 | | 25.7 | | – | | – | | – | | – | | – | | – | |
| Other conduits3 | – | | – | | 1.1 | | 2.6 | | – | | 1.8 | | – | | – | |
| Single-issuer liquidity facilities | | | | | | | | | | | | | | | | |
| | – | five largest4 | 6.0 | | 10.0 | | 5.0 | | 5.9 | | 1.5 | | 1.1 | | 1.0 | | 1.3 | |
| | – | largest market sector5 | 7.3 | | 11.7 | | 3.5 | | 4.2 | | 2.4 | | 1.5 | | 1.7 | | 2.3 | |
| | |
| 1 | These exposures relate to consolidated multi-seller conduits (see page 184). These vehicles provide funding to Group customers by issuing debt secured by a diversified pool of customer-originated assets. |
| 2 | These exposures relate to consolidated securities investment conduits, primarily Solitaire and Mazarin (see page 184). These vehicles issue debt secured by ABSs which are managed by HSBC. Of the total contingent liquidity risk under this category, US$25.3 billion was already funded on-balance sheet at 31 December 2008 leaving a net contingent exposure of US$9.5 billion. |
| 3 | These exposures relate to third-party sponsored conduits (see page 187). |
| 4 | These figures represent the five largest committed liquidity facilities provided to customers other than those facilities to conduits. |
| 5 | These figures represent the total of all committed liquidity facilities provided to the largest market sector, other than those facilities to conduits. |
238
Back to Contents
In times of market stress, the Group may choose to provide non-contractual liquidity support to certain HSBC-sponsored vehicles or HSBC-promoted products. This support would only be provided after careful consideration of the potential funding requirement and the impact on the entity’s overall liquidity.
The impact of market turmoil on the Group’s liquidity risk position
(Audited)
A significant aspect of the market turmoil continues to be its adverse effects on the liquidity and funding risk profile of the banking system.
At a systemic level, these may be characterised as follows:
| • | interbank funding costs increased as banks became reluctant to lend to each other beyond the very short-term; |
| | |
| • | many asset classes previously considered to be liquid became illiquid; |
| | |
| • | the ability of many market participants to issue either unsecured or secured debt has been restricted, although this has been partly mitigated following the introduction by some governments and central banks of term debt guarantee schemes; and |
| | |
| • | special purpose entities with investments linked to US sub-prime mortgages, or to ABSs where the underlying credit exposures were not fully transparent, found it increasingly difficult to raise wholesale funding.
|
In general terms, the strains arising from the credit crisis were concentrated in the wholesale market. The retail market, the market from which HSBC derives its core current and savings accounts, (the importance of which as a source of funding for the Group is discussed under ‘Advances to deposits ratio’ above) was relatively unaffected. The Group’s limited dependence on wholesale markets for funding has been a significant competitive advantage to HSBC through the recent period of dislocation in the financial markets.
HSBC’s customer deposit base has grown between 30 June 2007, the reporting date closest to the onset of the market turmoil, and 31 December 2008 by US$134 billion. This growth in US dollar equivalent terms has been diluted by the significant strengthening of US dollar against other major currencies between these two reporting dates, and therefore under represents the growth in customer deposits on an underlying currency basis. As a net provider of funds to the interbank market, the Group
has not been significantly affected by the scarcity of interbank funding.
A number of central banks and governments have taken action to alleviate the effects of the market turmoil, these actions have included making available government guaranteed term funding facilities. In the US, bank issuance under such programmes became normal market practice during 2008. To date, only HSBC’s US based operations have participated in government guaranteed term debt issuance schemes. At 31 December 2008, US$2.65 billion had been issued by HSBC USA, Inc. under the Federal Deposit Insurance Corporation Temporary Liquidity Guarantee Programme.
The deterioration of the US sub-prime credit market has reduced the availability of term financing to entities with exposures to the US sub-prime market. However, HSBC Finance, by virtue of its position within the Group, continued to enjoy committed financing facilities, albeit at a lower level, and access to commercial paper markets at interest rates below interbank rates. Through planned balance sheet reductions, the issuance of cost effective retail debt, capital infusions from the HSBC Group, and the utilisation of alternative sources of funding, including funding from other members of the HSBC Group, HSBC Finance was able to eliminate the need to issue institutional term debt in 2008. Funding plans are in place to enable HSBC Finance to deal with continued stress in the credit markets. As part of these plans, asset portfolios totalling US$15.3 billion were transferred from HSBC Finance to HSBC Bank USA in January 2009, resulting in US$8.0 billion of net funding benefit to HSBC Finance.
HSBC Finance is eligible to participate in the US Federal Reserve’s Commercial Paper Funding Facility (CPFF), a new scheme aimed at providing support to US issuers in the commercial paper market. At 31 December 2008, HSBC Finance had issued US$520 million under the CPFF and is eligible to issue a maximum of US$12.0 billion prior to 30 October 2009, the current expiry date for the scheme.
The effect of the market turmoil on liquidity and funding elsewhere in HSBC was largely restricted to the Group’s activities that historically depended upon the asset-backed commercial paper markets for funding, specifically SIVs and conduits, and certain money market funds. This is discussed in detail on page 174.
239
Back to Contents
| H S B C H O L D I N G S P L C |
| |
| Report of the Directors: Risk(continued) |
| |
| | |
| Liquidity and funding > HSBC Holdings // Market risk > Sensitivity / VAR |
HSBC Holdings
(Audited)
HSBC Holdings’ primary sources of cash are interest and capital receipts from its subsidiaries, which it deploys in short-term bank deposits. HSBC Holdings’ primary uses of cash are investments in subsidiaries, interest payments to debt holders and dividend payments to shareholders. On an ongoing basis, HSBC Holdings replenishes its liquid resources through the receipt of interest on, and repayment of, intra-group loans, from dividends paid by subsidiaries and from interest earned on its own liquid funds.
HSBC Holdings is also subject to contingent liquidity risk by virtue of loan commitments and guarantees given. Such commitments are only provided after due consideration of HSBC Holdings’ ability to finance these commitments and the likelihood of the need arising.
HSBC Holdings actively manages the cash flows from its subsidiaries to optimise the amount of cash held at the holding company level, and expects to continue doing so in the future. The ability of its subsidiaries to pay dividends or advance monies to HSBC Holdings depends on, among other things, their respective regulatory capital requirements, statutory reserves, and financial and operating performance. The wide range of HSBC’s activities means that HSBC Holdings is not dependent on a single source of profits to fund its dividend payments to shareholders. HSBC Holdings believes that, with its accumulated liquid assets, planned dividends and interest from subsidiaries it will be able to meet anticipated cash obligations. Also, during 2008 HSBC Holdings continued to have full access to capital markets at market rates and issued US$8.8 billion of capital instruments (2007: US$4.4 billion).
Cash flows payable by HSBC Holdings under financial liabilities by remaining contractual maturities
(Audited)
| | | | | | Due | | Due | | | |
| | | | Due | | between | | between | | Due | |
| | On | | within 3 | | 3 and 12 | | 1 and 5 | | after 5 | |
| | demand | | months | | months | | years | | years | |
| | US$m | | US$m | | US$m | | US$m | | US$m | |
| At 31 December 2008 | | | | | | | | | | |
| Amounts owed to HSBC undertakings | – | | 133 | | 539 | | 3,590 | | – | |
| Financial liabilities designated at fair value | – | | 587 | | 1,762 | | 5,977 | | 25,571 | |
| Derivatives | 1,324 | | – | | – | | – | | – | |
| Subordinated liabilities | – | | 235 | | 706 | | 3,764 | | 32,214 | |
| Other financial liabilities | – | | 1,805 | | – | | – | | – | |
| |
| |
| |
| |
| |
| |
| | 1,324 | | 2,760 | | 3,007 | | 13,331 | | 57,785 | |
| Loan commitments | 3,241 | | – | | – | | – | | – | |
| |
| |
| |
| |
| |
| |
| | 4,565 | | 2,760 | | 3,007 | | 13,331 | | 57,785 | |
| |
| |
| |
| |
| |
| |
| At 31 December 2007 | | | | | | | | | | |
| Amounts owed to HSBC undertakings | – | | 109 | | 1,801 | | 1,192 | | – | |
| Financial liabilities designated at fair value | – | | 258 | | 776 | | 8,152 | | 28,639 | |
| Derivatives | 44 | | – | | – | | – | | – | |
| Subordinated liabilities | – | | 160 | | 482 | | 2,568 | | 23,069 | |
| Other financial liabilities | – | | 1,398 | | – | | – | | – | |
| |
| |
| |
| |
| |
| |
| | 44 | | 1,925 | | 3,059 | | 11,912 | | 51,708 | |
| Loan commitments | 3,638 | | – | | – | | – | | – | |
| |
| |
| |
| |
| |
| |
| | 3,682 | | 1,925 | | 3,059 | | 11,912 | | 51,708 | |
| |
| |
| |
| |
| |
| |
The balances in the above table will not agree directly with the balances in the balance sheet of HSBC Holdings as the table incorporates, on an undiscounted basis, all cash flows relating to principal and all future coupon payments (except for trading derivatives).
Also, loan commitments are generally not recognised on the balance sheet. Trading derivatives
are included in the ‘On demand’ time bucket, and not by contractual maturity, because trading derivatives are typically held for short periods of time. The undiscounted cash flows on hedging derivative liabilities are classified according to their contractual maturity.
240
Back to Contents
The objective of HSBC’s market risk management is to manage and control market risk exposures in order to optimise return on risk while maintaining a market profile consistent with the Group’s status as one of the world’s largest banking and financial services organisations.
Market risk is the risk that movements in market risk factors, including foreign exchange rates and commodity prices, interest rates, credit spreads and equity prices will reduce HSBC’s income or the value of its portfolios.
HSBC separates exposures to market risk into trading and non-trading portfolios. Trading portfolios include those positions arising from market-making, proprietary position-taking and other marked-to-market positions so designated.
Non-trading portfolios include positions that arise from the interest rate management of HSBC’s retail and commercial banking assets and liabilities, financial investments designated as available for sale and held to maturity, and exposures arising from HSBC’s insurance operations.
Market risk arising in HSBC’s insurance businesses is discussed in ‘Risk management of insurance operations’ on pages 255 to 274.
The management of market risk is principally undertaken in Global Markets using risk limits approved by the GMB. Limits are set for portfolios, products and risk types, with market liquidity being a principal factor in determining the level of limits set. Traded Credit and Market Risk, an independent unit within Group Management Office, develops the Group’s market risk management policies and measurement techniques. Each major operating entity has an independent market risk management and control function which is responsible for measuring market risk exposures in accordance with the policies defined by Traded Credit and Market Risk, and monitoring and reporting these exposures against the prescribed limits on a daily basis.
Each operating entity is required to assess the market risks which arise on each product in its business and to transfer these risks to either its local Global Markets unit for management, or to separate books managed under the supervision of the local Asset and Liability Management Committee (‘ALCO’). The aim is to ensure that all market risks are consolidated within operations which have the necessary skills, tools, management and governance to manage such risks professionally. In certain cases where the market risks cannot be adequately
captured by the transfer process, simulation modelling is used to identify the impact of varying scenarios on valuations and net interest income.
HSBC uses a range of tools to monitor and limit market risk exposures. These include sensitivity analysis, value at risk (‘VAR’) and stress testing.
Sensitivity analysis
Sensitivity measures are used to monitor the market risk positions within each risk type, for example, present value of a basis point movement in interest rates, for interest rate risk. Sensitivity limits are set for portfolios, products and risk types, with the depth of the market being one of the principal factors in determining the level of limits set.
Value at risk
(Audited)
VAR is a technique that estimates the potential losses that could occur on risk positions as a result of movements in market rates and prices over a specified time horizon and to a given level of confidence.
The VAR models used by HSBC are based predominantly on historical simulation. These models derive plausible future scenarios from past series of recorded market rates and prices, taking account of inter-relationships between different markets and rates such as interest rates and foreign exchange rates. The models also incorporate the effect of option features on the underlying exposures.
The historical simulation models used by HSBC incorporate the following features:
| • | potential market movements are calculated with reference to data from the past two years; |
| | |
| • | historical market rates and prices are calculated with reference to foreign exchange rates and commodity prices, interest rates, equity prices and the associated volatilities; and |
| | |
| • | VAR is calculated to a 99 per cent confidence level and for a one-day holding period.
|
HSBC routinely validates the accuracy of its VAR models by back-testing the actual daily profit and loss results, adjusted to remove non-modelled items such as fees and commissions, against the corresponding VAR numbers. Statistically, HSBC would expect to see losses in excess of VAR only 1 per cent of the time over a one-year period. The actual number of excesses over this period can therefore be used to gauge how well the models are performing.
241
Back to Contents
| H S B C H O L D I N G S P L C |
| |
| Report of the Directors: Risk(continued) |
| | |
| | |
| Market risk > Impact of market turmoil > VAR |
Although a valuable guide to risk, VAR should always be viewed in the context of its limitations. For example:
| • | the use of historical data as a proxy forestimating future events may not encompass allpotential events, particularly those which areextreme in nature; |
| | |
| • | the use of a one-day holding period assumes thatall positions can be liquidated or the risk offsetin one day. This may not fully reflect the marketrisk arising at times of severe illiquidity, when aone-day holding period may be insufficient toliquidate or hedge all positions fully; |
| | |
| • | the use of a 99 per cent confidence level, bydefinition, does not take into account losses thatmight occur beyond this level of confidence; |
| | |
| • | VAR is calculated on the basis of exposuresoutstanding at the close of business andtherefore does not necessarily reflect intra-dayexposures; and |
| | |
| • | VAR is unlikely to reflect loss potential onexposures that only arise under significantmarket moves. |
Stress testing
In recognition of the limitations of VAR, HSBC augments it with stress testing to evaluate the potential impact on portfolio values of more extreme, although plausible, events or movements in a set of financial variables.
Stress testing is performed at a portfolio level, as well as on the consolidated positions of the Group, and covers the following scenarios:
| • | sensitivity scenarios, which consider the impactof market moves to any single risk factor or aset of factors. For example the impact resultingfrom a break of a currency peg that is unlikelyto be captured within the VAR models; |
| | |
| • | technical scenarios, which consider the largestmove in each risk factor, without considerationof any underlying market correlation; |
| | |
| • | hypothetical scenarios, which consider potential macro economic events; and |
| | |
| • | historical scenarios, which incorporate historicalobservations of market moves during previousperiods of stress which would not be capturedwithin VAR. |
Stress testing is governed by the ‘Stress Testing Review Group’ forum that coordinates the Group stress testing scenarios in conjunction with the
regional risk managers. Consideration is given to the actual market risk exposures, along with market events in determining the stress scenarios.
Stress testing results are reported to senior management and provide them with an assessment of the financial impact such events would have on the profit of HSBC. The daily losses experienced during 2008 were within the stress loss scenarios reported to senior management.
The following table provides an overview of the reporting of risks within this section:
| | Portfolio | |
| |
| |
| | Trading | | Non-trading | |
| Risk type | | | | |
| Foreign exchange | VAR | | VAR | 1 |
| Interest rate | VAR | | VAR | 2 |
| Commodity | VAR | | N/A | |
| Equity | VAR | | Sensitivity | |
| Credit spread | Sensitivity | | Sensitivity | 3 |
| | |
| 1 | The structural foreign exchange risk is monitored using sensitivity analysis. See page 429. |
| 2 | The interest rate risk on the fixed-rate securities issued by HSBC Holdings is not included in the Group VAR. The management of this risk is described on page 249. |
| 3 | Credit spread VAR is reported for the credit derivatives transacted by Global Banking. See page 244. |
The impact of market turmoil on market risk
(Audited)
The years preceding the current market turmoil were characterised by historically low levels of volatility, with ample market liquidity. This period was associated with falling levels of VAR as the level of observed market volatility is a key determinant in the VAR calculation. As a consequence HSBC reduced the overall VAR limit to reflect the lower level of volatility, and associated VAR.
The tightening of both credit and liquidity within the wholesale markets observed during the latter half of 2007 led to an increase in market volatility, most noticeably in the credit spreads of financial institutions and ABSs/MBSs.
Credit spread volatility continued to increase during the first half of 2008, and as the effect of the market turmoil on the wider economy became more apparent, there was a larger increase in the volatility in other risk types, such as interest rates. Coupled with positions taken in anticipation of rate reductions, the increase in volatility led to an increase in the total VAR in early 2008.
Volatility across all asset classes continued to increase in the second half of 2008, as central banks coordinated a series of rate cuts, in an attempt to stimulate demand within the global economy. Although the increase in volatility led to a further
242
Back to Contents
increase in total VAR during the second half of 2008, the overall impact was limited as a result of managing down the market risk exposures during this period (see ‘Value at risk of the trading and non-trading portfolios’ below).
Although the overall VAR limit for the Group was increased towards the end of 2008, as a result of the increased market volatility, the limit remained within the level set in early 2007.
Value at risk of the trading and non-trading portfolios
The VAR, both trading and non-trading, for the Group was as follows:
Value at risk
(Audited) | | | | |
| | 2008 | | 2007 | |
| | US$m | | US$m | |
| | | | | |
| At 31 December | 191.2 | | 70.1 | |
| Average | 158.9 | | 65.3 | |
| Minimum | 59.8 | | 43.8 | |
| Maximum | 287.1 | | 98.1 | |
As a result of improvements in the Group VAR data collection process during 2008, all entities within the Group are now aggregated on a historical simulation basis, reflecting the full diversification effects across the Group’s VAR. The 2007 VAR has been adjusted, reducing the total VAR by US$25.2 million as at 31 December 2007. The maximum, minimum and average VARs have also been adjusted on a comparable basis in order to fairly present the trend.
The daily VAR, both trading and non-trading, for the Group was as follows:
Daily VAR (trading and non-trading) (US$m)
(Unaudited) |
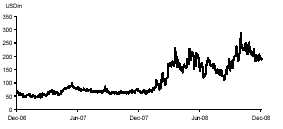 |
The major contributor to the trading and non-trading VAR for the Group was Global Markets.
The histogram to the right illustrates the frequency of daily revenue arising from Global Markets’ trading, balance sheet management and other trading activities.
The average daily revenue earned in 2008 was US$21.7 million, compared with US$18.7 million in 2007. The standard deviation of these daily revenues was US$53.4 million compared with US$25.3 million in 2007. The standard deviation measures the variation of daily revenues about the mean value of those revenues.
An analysis of the frequency distribution of daily revenue shows that there were 66 days with negative revenue during 2008 compared with 35 days in 2007. The most frequent result was a daily revenue of between US$40 million and US$50 million with 28 occurrences, compared with between US$20 million and US$30 million with 71 occurrences in 2007.
Daily distribution of Global Markets’ trading, balance sheet management and other trading revenues1
(Unaudited) |
| |
| 2008 |
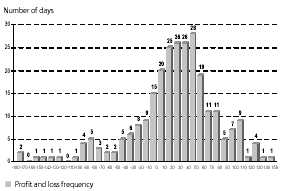 |
| |
| 2007 |
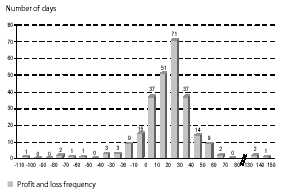 |
| | |
| 1 | The effect of any month-end adjustments, not attributable to a specific daily market move, is spread evenly over the days in the month in question. |
For a description of HSBC’s fair value and price verification controls, see page 163.
243
Back to Contents
| H S B C H O L D I N G S P L C |
| |
| Report of the Directors: Risk(continued) |
| | |
| | |
| Market risk > Trading portfolios / Non-trading portfolios |
Trading portfolios
(Audited)
HSBC’s control of market risk is based on a policy of restricting individual operations to trading within a list of permissible instruments authorised for each site by Traded Credit and Market Risk, of enforcing rigorous new product approval procedures, and of restricting trading in the more complex derivative
products only to offices with appropriate levels of product expertise and robust control systems.
Market making and proprietary position taking is undertaken within Global Markets. The VAR for such trading activity at 31 December 2008 was US$72.5 million (2007: US$30.2 million). This is analysed below by risk type:
| | | | | | | | | |
VAR by risk type for the trading activities (excluding Credit Spread VAR)
(Audited) | |
| | Foreign | | | | | | | |
| | exchange and | | Interest | | | | | |
| | commodity | | rate | | Equity | | Total | 1 |
| | US$m | | US$m | | US$m | | US$m | |
| | | | | | | | | |
| At 31 December 2008 | 29.8 | | 63.4 | | 13.9 | | 72.5 | |
| At 31 December 20072 | 10.7 | | 25.4 | | 10.2 | | 30.2 | |
| Average | | | | | | | | |
| 2008 | 19.0 | | 50.7 | | 15.2 | | 53.1 | |
| 20072 | 9.5 | | 22.9 | | 7.9 | | 23.7 | |
| Minimum | | | | | | | | |
| 2008 | 8.7 | | 21.4 | | 8.2 | | 22.6 | |
| 20072 | 4.0 | | 14.9 | | 3.4 | | 14.3 | |
| Maximum | | | | | | | | |
| 2008 | 54.9 | | 147.4 | | 39.0 | | 104.4 | |
| 20072 | 23.0 | | 36.1 | | 15.1 | | 38.8 | |
| | |
| 1 | The total VAR is non-additive across risk types due to diversification effects. |
| 2 | The VAR for 2007 has been adjusted on the same basis as Group VAR on page 243. |
| |
Credit spread risk
The risk associated with movements in credit spreads is primarily managed through sensitivity limits, stress testing, and VAR for those portfolios where VAR is calculated.
The Group is introducing credit spread as a separate risk type within the VAR models. At 31 December 2008, credit spread VAR was calculated for the London trading and New York credit derivatives portfolios. At that date, the total VAR for the trading activities, including credit spread VAR for the above portfolios, was US$106.4 million (2007: US$43.8 million) compared with a total VAR of US$72.5 million reported within the ‘VAR by risk type for the trading activities’ (see above), which excludes the credit spread VAR for these two portfolios.
The sensitivity of trading income to the effect of movements in credit spreads on the total trading activities of the Group was US$590.9 million at 31 December 2008 (2007: US$95.4 million). This sensitivity captures the credit spread exposure arising from positions taken throughout the Group, in addition to the London trading and New York credit derivative portfolios captured within credit spread VAR (see above). The sensitivity was calculated using simplified assumptions based on one-day movements in average market credit spreads
over a two-year period at a confidence level of 99 per cent, and assumes a simultaneous movement in credit spreads across issuers. It should be noted that diversification effects within the portfolio and with other risk types is likely to lead to a reduced impact on trading income.
The significant increase in the sensitivity at 31 December 2008, compared with 31 December 2007, was due to the effect of much higher volatility in credit spreads observed during 2008. The actual positions within the trading portfolios exposed to credit spread risk were lower on 31 December 2008 than on 31 December 2007.
In addition to the above measure certain portfolios are also managed using default risk measures where appropriate.
The measurement of the credit spread impact on trading income as at 31 December 2008 excludes those positions that were reclassified as non-trading during the second half of 2008 following the amendment to IFRS. These positions are included within the 31 December 2007 comparative, as the reclassification took effect from 1 July 2008.
Credit spread risk also arises on credit derivative transactions entered into by Global Banking in order to manage the risk concentrations within the corporate loan portfolio and so enhance capital
244
Back to Contents
efficiency. The mark-to-market of these transactions is taken through the income statement.
At 31 December 2008, the credit spread VAR on the credit derivatives transactions entered into by Global Banking was US$23.0 million (2007: US$19.7 million). The VAR shows the effect on trading income from a one-day movement in credit spreads over a two-year period, calculated to a 99 per cent confidence level.
Gap risk
Certain transactions are structured such that the risk to HSBC is negligible under a wide range of market conditions or events, but in which there exists a remote probability that a significant gap event could lead to loss. A gap event could be seen as a change in market price from one level to another with no trading opportunity in between, and where the price change breaches the threshold beyond which the risk profile changes from having no open risk to having full exposure to the underlying structure. Such movements may occur, for example, when there are adverse news announcements and the market for a specific investment becomes illiquid, making hedging impossible.
Given the characteristics of these transactions, they will make little or no contribution to VAR or to traditional market risk sensitivity measures. HSBC captures the risks for such transactions within its stress testing scenarios. Gap risk arising is monitored on an ongoing basis, and HSBC incurred no gap losses arising from movements in the underlying market price on such transactions in 2008.
ABSs/MBSs positions
The ABSs/MBSs exposures within the trading portfolios are managed within sensitivity and VAR limits, as described on page 241, and are included within the stress testing scenarios as described on page 242.
Non-tradingportfolios
(Audited)
The principal objective of market risk management of non-trading portfolios is to optimise net interest income.
Interest rate risk in non-trading portfolios arises principally from mismatches between the future yield on assets and their funding cost, as a result of interest rate changes. Analysis of this risk is complicated by having to make assumptions on embedded optionality within certain product areas such as the incidence of mortgage prepayments, and from behavioural assumptions regarding the
economic duration of liabilities which are contractually repayable on demand such as current accounts. The prospective change in future net interest income from non-trading portfolios will be reflected in the current realisable value of these positions, should they be sold or closed prior to maturity. In order to manage this risk optimally, market risk in non-trading portfolios is transferred to Global Markets or to separate books managed under the supervision of the local ALCO.
The transfer of market risk to books managed by Global Markets or supervised by ALCO is usually achieved by a series of internal deals between the business units and these books. When the behavioural characteristics of a product differ from its contractual characteristics, the behavioural characteristics are assessed to determine the true underlying interest rate risk. Local ALCOs are required to regularly monitor all such behavioural assumptions and interest rate risk positions to ensure they comply with interest rate risk limits established by GMB.
In certain cases, the non-linear characteristics of products cannot be adequately captured by the risk transfer process. For example, both the flow from customer deposit accounts to alternative investment products and the precise prepayment speeds of mortgages will vary at different interest rate levels, and where expectations about future moves in interest rates change. In such circumstances, simulation modelling is used to identify the impact of varying scenarios on valuations and net interest income.
Once market risk has been consolidated in Global Markets or ALCO-managed books, the net exposure is typically managed through the use of interest rate swaps within agreed limits. The VAR for these portfolios is included within the Group VAR (see ‘Value at risk of the trading and non-trading portfolios’ above).
Credit spread risk
At 31 December 2008, the sensitivity of equity to the effect of movements in credit spreads on the Group’s available-for-sale debt securities was US$1,092 million (2007: US$206 million). The sensitivity was calculated on the same basis as applied to the trading portfolio. Including the gross exposure for the SICs consolidated within HSBC’s balance sheet at 31 December 2008, the sensitivity increased to US$1,145 million. This sensitivity is struck, however, before taking account of any losses which would be absorbed by the capital note holders. At 31 December 2008, the capital note holders
245
Back to Contents
| H S B C H O L D I N G S P L C |
| |
| Report of the Directors: Risk (continued) |
| | |
| | |
| Market risk > Non-trading portfolios / DBS / Sensitivity of NII |
would have absorbed the first US$2.2 billion (2007: US$2.3 billion) of any losses incurred by the SICs prior to HSBC incurring any equity losses.
The notable increase in this sensitivity at 31 December 2008, compared with 31 December 2007, was again due to the effect of higher volatility in credit spreads observed during 2008. The overall credit spread positions within the available-for-sale portfolios were lower on 31 December 2008 compared with 31 December 2007.
Equity securities classified as available for sale
(Audited)
Market risk arises on equity securities held as available for sale. The fair value of these securities at 31 December 2008 was US$6.8 billion (2007: US$12.6 billion) and included private equity holdings of US$2.5 billion (2007: US$3.2 billion). Investments in private equity are primarily made through managed funds that are subject to limits on the amount of investment. Potential new commitments are subject to risk appraisal to ensure that industry and geographical concentrations remain within acceptable levels for the portfolio as a whole. Regular reviews are performed to substantiate the valuation of the investments within the portfolio. Funds typically invested for short-term cash management represented US$0.9 billion (2007: US$3.1 billion). Investments held to facilitate ongoing business, such as holdings in government-sponsored enterprises and local stock exchanges, represented US$1.0 billion (2007: US$1.7 billion). Other strategic investments represented US$2.4 billion (2007: US$4.6 billion). The fair value of the constituents of equity securities classified as available for sale can fluctuate considerably. A 10 per cent reduction in the value of the available-for-sale equities at 31 December 2008 would have reduced equity by US$0.7 billion (2007: US$1.3 billion). For details of the impairment incurred on available-for-sale equity securities see ‘Accounting policies’ on page 350.
US$1.0 billion of the reduction in the AFS Equities relates to funds that were consolidated within the Groups balance sheet as at 31 December 2008.
Defined benefit pension schemes
(Audited)
Market risk also arises within HSBC’s defined benefit pension schemes to the extent that the obligations of the schemes are not fully matched by assets with determinable cash flows. Pension scheme obligations fluctuate with changes in long-term interest rates, inflation, salary increases and the
longevity of scheme members. Pension scheme assets will include equities and debt securities, the cash flows of which change as equity prices and interest rates vary. There are risks that market movements in equity prices and interest rates could result in asset valuations which, taken together with regular ongoing contributions, are insufficient over time to cover the level of projected obligations and these, in turn, could increase with a rise in inflation and members living longer. Management, together with the trustees who act on behalf of the pension scheme beneficiaries, assess these risks using reports prepared by independent external actuaries and take action and, where appropriate, adjust investment strategies and contribution levels accordingly. For example, in order to mitigate the risk of adverse movements in investments, interest rates and inflation, the Trustee of the HSBC Bank (UK) Pension Scheme has continued to implement a programme of initiatives proposed by HSBC, including reducing the equity content of the investment strategy, increasing the diversification of the scheme’s assets, and entering into long-term interest rate and inflation swaps.
The present value of HSBC’s defined benefit pension plans’ obligations was US$24.0 billion at 31 December 2008, compared with US$32.4 billion at 31 December 2007. Assets of the defined benefit schemes at 31 December 2008 comprised equity investments, 20 per cent (2007: 26 per cent); debt securities, 68 per cent (2007: 62 per cent); and other (including property), 12 per cent (2007: 12 per cent) (see Note 8 on the Financial Statements).
Increased corporate bond yields in the UK in 2008 have resulted in an increase of 110 basis points in the real discount rate (net of the increase in expected inflation) used to value the accrued benefits payable under the HSBC Bank (UK) Pension Scheme, the Group’s largest plan. The resulting decrease in the liabilities of the scheme has been largely offset by a reduction in the fair values of the plan assets of the scheme. As a consequence, the deficit on the HSBC Bank (UK) Pension Scheme has decreased to US$392 million from US$808 million.
Sensitivity of net interest income
(Unaudited)
A principal part of HSBC’s management of market risk in non-trading portfolios is to monitor the sensitivity of projected net interest income under varying interest rate scenarios (simulation modelling). HSBC aims, through its management of market risk in non-trading portfolios, to mitigate the
246
Back to Contents
effect of prospective interest rate movements which could reduce future net interest income, while balancing the cost of such hedging activities on the current net revenue stream.
For simulation modelling, businesses use a combination of scenarios relevant to local businesses and local markets and standard scenarios which are required throughout HSBC. The standard scenarios are consolidated to illustrate the combined pro forma effect on HSBC’s consolidated portfolio valuations and net interest income.
The table below sets out the effect on future net interest income of an incremental 25 basis points parallel fall or rise in all yield curves worldwide at the beginning of each quarter during the 12 months
from 1 January 2009. Assuming no management actions, a series of such rises would decrease planned net interest income for 2009 by US$463 million (2008: US$503 million), while a series of such falls would decrease planned net interest income by US$284 million (2008: increase US$525 million). These figures incorporate the effect of any option features in the underlying exposures.
Instead of assuming that all interest rates move together, HSBC groups its interest rate exposures into currency blocs whose rates are considered likely to move together. The sensitivity of projected net interest income, on this basis, is as follows: