As filed with the Securities and Exchange Commission on March 20, 2006.
SECURITIES AND EXCHANGE COMMISSION
WASHINGTON, D.C. 20549
FORM 20-F
| |  | REGISTRATION STATEMENT PURSUANT TO SECTION 12(b) OR 12(g) OF THE | | | |
| | | SECURITIES EXCHANGE ACT OF 1934 | | | |
| | | | | | |
| | | or | | | |
| | | | | | |
| |  | ANNUAL REPORT PURSUANT TO SECTION 13 OR 15(d) OF THE | | | |
| | | SECURITIES EXCHANGE ACT OF 1934 for the fiscal year ended December 31, 2005 | | | |
| | | | | | |
| | | or | | | |
| | | | | | |
| | | TRANSITION REPORT PURSUANT TO SECTION 13 OR 15(d) OF THE | | | |
| | | SECURITIES EXCHANGE ACT OF 1934 | | | |
| | | | | | |
| | | or | | | |
| | | | | | |
| | | SHELL COMPANY REPORT PURSUANT TO SECTION 14 OR 15(d) OF THE | | | |
| | | SECURITIES EXCHANGE ACT OF 1934 | | | |
For the transition period from N/A to N/A
Commission file number: 1-14930
HSBC Holdings plc
(Exact name of Registrant as specified in its charter)
| N/A | United Kingdom |
| (Translation of Registrant’s name into English) | (Jurisdiction of incorporation or organization) |
8 Canada Square
London E14 5HQ
United Kingdom
(Address of principal executive offices)
Securities registered or to be registered pursuant to Section 12(b) of the Securities Exchange Act of 1934:
| Title of each class | Name of each exchange on which registered |
| |
| Ordinary Shares, nominal value US$0.50 each. | London Stock Exchange
Hong Kong Stock Exchange
Euronext Paris
Bermuda Stock Exchange
New York Stock Exchange* |
| | |
American Depository Shares, each representing 5 Ordinary
Shares of nominal value US$0.50 each. | New York Stock Exchange
|
| | |
| 6.20% Non-Cumulative Dollar Preference Shares, Series A | New York Stock Exchange* |
| | |
| American Depository Shares, each representing one-fortieth of a Share of 6.20% Non-Cumulative Dollar Preference Shares, Series A | New York Stock Exchange |
Securities registered or to be registered pursuant to Section 12(g) of the Securities Exchange Act of 1934: None
Securities for which there is a reporting obligation pursuant to Section 15(d) of the Securities Exchange Act of 1934: None
The number of outstanding shares of each of the issuer’s classes of capital or common stock as of December 31, 2005 was:
| Ordinary Shares, nominal value US$0.50 each | 11,172,075,550 |
Indicate by check mark if the registrant is a well-known seasoned issuer, as defined in Rule 405 of the Securities Act:
| Yes | No |
Indicate by check mark if the registrant is not required to file reports pursuant to Section 13 or 15(d) of the Securities Exchange Act of 1934:
| Yes | No |
Indicate by check mark whether the registrant (1) has filed all reports required to be filed by Section 13 or 15(d) of the Securities Exchange Act of 1934 during the preceding 12 months (or for such shorter period that the registrant was required to file such reports), and (2) has been subject to such filing requirements for the past 90 days.
Yes | No |
Indicate by check mark whether the registrant is a large accelerated filer, an accelerated filer, or a non-accelerated filer. See definition of accelerated filer and large accelerated filer” in Rule 12b-2 of the Exchange Act:
| Large accelerated filer | Accelerated filer | Non-accelerated filer |
Indicate by check mark which financial statements Item the registrant has elected to follow:
| Item 17 | Item 18 |
Indicate by check mark whether the registrant is a shell company (as defined in Rule 12b-2 of the Exchange Act):
| Yes | No |
* Not for trading, but only in connection with the registration of American Depositary Shares.
H S B C H O L D I N G S P L C
Table ofContents
Certain Defined Terms
| | | |
| | | |
| Unless the context requires otherwise, ‘HSBC Holdings’ means HSBC Holdings plc and ‘HSBC’ or the ‘Group’ means HSBC Holdings together with its subsidiaries and associates. Within this document the Hong Kong Special Administrative Region of the | | People’s Republic of China is referred to as ‘Hong Kong’. When used in the terms ‘shareholders’ equity’ and ‘total shareholders’ equity’, ‘shareholders’ means holders of HSBC Holdings ordinary and preference shares. |
Back to Contents
| H S B C H O L D I N G S P L C |
| |
| |
| Financial Highlights |
| | |
| | |
HSBC’s Financial Statements and Notes thereon, as set out on pages 236 to 402, are prepared in accordance with International Financial Reporting Standards (‘IFRSs’) as endorsed by the EU and effective for HSBC’s reporting for the year ended 31 December 2005. There is no difference between IFRSs currently in effect and EU-endorsed IFRSs as they apply to the Group. This is the first time HSBC’s annual financial statements have been prepared under IFRSs. Moving to IFRSs has necessarily involved the application of a number of available transition exemptions which means that prior year figures are not fully comparable with those presented in respect of 2005. Details of HSBC’s transition to IFRSs are set out on page 332. HSBC previously reported under United Kingdom Generally Accepted Accounting Principles (‘UK GAAP’).
In July 2005, HSBC published2004 IFRS Comparative Financial Information, summarising the principal effects of IFRSs on the financial information previously reported in respect of 2004 and including a reconciliation between data previously reported in respect of 2004 under UK GAAP and under IFRSs. HSBC’s opening balance sheet at 1 January 2005 differs from the closing balance sheet at 31 December 2004 as the former reflects first-time adoption of International Accounting Standard 32 ‘Financial Instruments: Presentation’ (‘IAS 32’), IAS 39 ‘Financial Instruments: Recognition and Measurement’ (‘IAS 39’) and IFRS 4 ‘Insurance Contracts’ (‘IFRS 4’).
Certain information for years prior to 2004 has been prepared under UK GAAP, which is not comparable with IFRSs.
HSBC uses the US dollar as its presentation currency because the US dollar and currencies linked to it form the major currency bloc in which HSBC transacts its business. Unless otherwise stated, the accounting information presented in this document has been prepared in accordance with IFRSs.
| | 2005 | | 2004 | |
| | US$m | | US$m | |
| For the year | | | | |
| Total operating income | 61,704 | | 55,988 | |
| Profit before tax | 20,966 | | 18,943 | |
| Profit attributable to shareholders of the parent company | 15,081 | | 12,918 | |
| Dividends | 7,750 | | 6,932 | |
| | | | | |
| At the year-end | | | | |
| Total equity | 98,226 | | 99,197 | |
| Total shareholders’ equity | 92,432 | | 85,522 | |
| Capital resources | 105,449 | | 90,780 | |
| Customer accounts and deposits by banks | 809,146 | | 777,127 | |
| Total assets | 1,501,970 | | 1,279,974 | |
| Risk-weighted assets | 827,164 | | 759,210 | |
| | | | | |
| | US$ | | US$ | |
| Per ordinary share | | | | |
| Basic earnings | 1.36 | | 1.18 | |
| Diluted earnings | 1.35 | | 1.17 | |
| Dividends | 0.69 | | 0.63 | |
| Net asset value at the year-end | 8.16 | | 7.66 | |
| | At | | At | |
| | 31 December | | 31 December | |
| | 2005 | | 2004 | |
| Share information | | | | |
| US$0.50 ordinary shares in issue (million) | 11,334 | | 11,172 | |
| Market capitalisation (billion) | US$182 | | US$190 | |
| Closing market price per ordinary share: | | | | |
| – London | £9.33 | | £8.79 | |
| – Hong Kong | HK$124.50 | | HK$133.00 | |
| Closing market price per American Depositary Share (‘ADS’)1 | US$80.47 | | US$85.14 | |
| | Over 1 year | | Over 3 years | | Over 5 years | |
| HSBC total shareholder return (‘TSR’) to 31 December 20052 | 111.3 | | 158.8 | | 121.2 | |
| Benchmarks: | | | | | | |
| – FTSE 1003 | 120.8 | | 158.4 | | 105.9 | |
| – MSCI World4 | 123.1 | | 159.1 | | 99.1 | |
For footnotes, see page 4.
1
Back to Contents
| H S B C H O L D I N G S P L C |
| |
| |
| Financial Highlights (continued) |
| | |
| | |
Capital and performance ratios
| | 2005 | | 2004 | |
| | % | | % | |
| Capital ratios | | | | |
| Tier 1 capital | 9.0 | | 8.9 | |
| Total capital | 12.8 | | 12.0 | |
| | | | | |
| Performance ratios | | | | |
| Return on average invested capital5 | 15.9 | | 15.0 | |
| Return on average total shareholders’ equity6 | 16.8 | | 16.3 | |
| Post-tax return on average total assets | 1.06 | | 1.14 | |
| Post-tax return on average risk-weighted assets | 2.01 | | 2.13 | |
| | | | | |
| Credit coverage ratios | | | | |
| Loan impairment charges as a percentage of total operating income | 12.74 | | 11.06 | |
| Loan impairment charges as a percentage of average gross customer advances | 1.16 | | 1.04 | |
| Total outstanding allowances against loan impairment as a percentage of non-performing loans at the year end | 99.1 | | 100.9 | |
| | | | | |
| Efficiency and revenue mix ratios | | | | |
| Cost efficiency ratio7 | 51.2 | | 51.6 | |
| – constant currency basis | 51.2 | | 52.4 | |
| As a percentage of total operating income: | | | | |
| – net interest income | 50.8 | | 55.5 | |
| – net fee income | 23.4 | | 23.1 | |
| – trading income | 9.5 | | 5.0 | |
Constant currency
Constant currency comparatives in respect of 2004 used in the 2005 commentaries are computed by retranslating into US dollars:
| • | the income statements for 2004 of non-US dollar branches, subsidiaries, joint ventures and associates at the average rates of exchange for 2005; and |
| | |
| • | the balance sheets at 31 December 2004 for non-US dollar branches, subsidiaries, joint ventures and associates at the prevailing rates of exchange on 31 December 2005. |
| | |
No adjustment is made to the exchange rates used to translate foreign currency denominated assets and liabilities into the functional currency of any HSBC branch, subsidiary, joint venture or associate.
| | 2005 compared with 2004 | |
| |
| |
| | As | | Constant | |
| reported | currency on |
| | an underlying |
| | basis |
| % | % |
| Operating income and cost growth | | | | |
| Total operating income | 10 | | 10 | |
| Net operating income before loan impairment charges and other credit risk provisions | 12 | | 12 | |
| Total operating expenses | 11 | | 9 | |
For details of the underlying constant currency basis, see ‘Comparison of financial information’ on page4.
For footnotes, see page 4.
2
Back to Contents
Five-year comparison
| 2005 | | 2004 | | | 2003 | | 2002 | | 2001 | |
| US$m | | US$m | | | US$m | | US$m | | US$m | |
| | | | | For the year | | | | | | |
| 31,334 | | 31,099 | | Net interest income | 25,598 | | 15,460 | | 14,725 | |
| 30,370 | | 24,889 | | Other operating income | 15,474 | | 11,135 | | 11,163 | |
| (7,801 | ) | (6,191 | ) | Loan impairment charges and other credit risk provisions | – | | – | | – | |
| – | | – | | Provisions for bad and doubtful debts | (6,093 | ) | (1,321 | ) | (2,037 | ) |
| (29,514 | ) | (26,487 | ) | Total operating expenses | (22,532 | ) | (15,808 | ) | (15,404 | ) |
| 20,966 | | 18,943 | | Profit before tax | 12,816 | | 9,650 | | 8,000 | |
| 15,081 | | 12,918 | | Profit attributable to shareholders of the parent company | 8,774 | | 6,239 | | 4,992 | |
| 7,750 | | 6,932 | | Dividends | 6,532 | | 5,001 | | 4,467 | |
| | | | | | | | | | | |
| | | | | At the year-end | | | | | | |
| 5,667 | | 5,587 | | Called up share capital | 5,481 | | 4,741 | | 4,678 | |
| 92,432 | | 85,522 | | Total shareholders’ equity | – | | – | | – | |
| – | | – | | Shareholders’ funds | 74,473 | | 51,765 | | 45,688 | |
| 105,449 | | 90,780 | | Capital resources10 | 74,042 | | 57,430 | | 50,854 | |
| 739,419 | | 693,072 | | Customer accounts | 573,130 | | 495,438 | | 449,991 | |
| 3,474 | | 3,686 | | Undated subordinated loan capital | 3,617 | | 3,540 | | 3,479 | |
| 35,856 | | 32,914 | | Dated subordinated loan capital | 17,580 | | 14,831 | | 12,001 | |
| 740,002 | | 672,891 | | Loans and advances to customers11,12 | 528,977 | | 352,344 | | 308,649 | |
| 1,501,970 | | 1,279,974 | | Total assets | 1,034,216 | | 758,605 | | 695,545 | |
| | | | | | | | | | | |
| US$ | | US$ | | | US$ | | US$ | | US$ | |
| | | | | Per ordinary share | | | | | | |
| 1.36 | | 1.18 | | Basic earnings | 0.84 | | 0.67 | | 0.54 | |
| 1.35 | | 1.17 | | Diluted earnings | 0.83 | | 0.66 | | 0.53 | |
| 0.69 | | 0.63 | | Dividends | 0.60 | | 0.53 | | 0.48 | |
| 8.16 | | 7.66 | | Net asset value at year-end | 6.79 | | 5.46 | | 4.88 | |
| | | | | | | | | | | |
| | | | | Share information | | | | | | |
| 11,334 | | 11,172 | | US$0.50 ordinary shares in issue (millions) | 10,960 | | 9,481 | | 9,355 | | |
| | | | | | | | | | | |
| % | | % | | | % | | % | | % | |
| | | | | Financial ratios | | | | | | |
| 50.7 | | 53.4 | | Dividend payout ratio13 | 60.6 | | 69.7 | | 76.2 | |
| 1.06 | | 1.14 | | Post-tax return on average total assets | 1.01 | | 0.97 | | 0.86 | |
| 16.8 | | 16.3 | | Return on average total shareholders’ equity | – | | – | | – | |
| – | | – | | Return on average shareholders’ funds | 13.0 | | 12.4 | | 10.6 | |
| 5.96 | | 6.35 | | Average total shareholders’ equity to average total assets | – | | – | | – | |
| – | | – | | Average shareholders’ funds to average total assets | 7.06 | | 6.91 | | 6.87 | |
| | | | | | | | | | | |
| | | | | Capital ratios | | | | | | |
| 9.0 | | 8.9 | | Tier 1 capital | 8.9 | | 9.0 | | 9.0 | |
| 12.8 | | 12.0 | | Total capital | 12.0 | | 13.3 | | 13.0 | |
| | | | | | | | | | | |
| | | | | Foreign exchange translation rates toUS$ | | | | | | |
| 0.581 | | 0.517 | | Closing – £:US$1 | 0.560 | | 0.620 | | 0.690 | |
| 0.847 | | 0.733 | | – €:US$1 | 0.793 | | 0.953 | | 1.130 | |
| 0.550 | | 0.546 | | Average – £:US$1 | 0.612 | | 0.666 | | 0.695 | |
| 0.805 | | 0.805 | | – €:US$1 | 0.885 | | 1.061 | | 1.117 | |
For footnotes, see page 4.
3
Back to Contents
| H S B C H O L D I N G S P L C |
| |
| |
| Financial Highlights (continued) |
| | |
| | |
Five-year comparison(continued)
Amounts in accordance with US GAAP
| | 2005 | | 2004 | | 2003 | | 2002 | | 2001 | |
| | US$m | | US$m | | US$m | | US$m | | US$m | |
| Income statement for the year | | | | | | | | | | |
| Net income available for ordinary shareholders | 14,703 | | 12,506 | | 7,231 | | 4,900 | | 4,911 | |
| Other comprehensive income | (7,271 | ) | 983 | | 7,401 | | 5,502 | | (1,439 | ) |
| Dividends | 7,750 | | 6,932 | | 6,974 | | 4,632 | | 4,394 | |
| | | | | | | | | | | |
| Balance sheet at 31 December | | | | | | | | | | |
| Total assets | 1,406,944 | | 1,266,365 | | 1,012,023 | | 763,565 | | 698,312 | |
| Shareholders’ funds | 93,524 | | 90,082 | | 80,251 | | 55,831 | | 48,444 | |
| | | | | | | | | | | |
| | US$ | | US$ | | US$ | | US$ | | US$ | |
| Per ordinary share | | | | | | | | | | |
| Basic earnings | 1.33 | | 1.15 | | 0.69 | | 0.52 | | 0.53 | |
| Diluted earnings | 1.32 | | 1.13 | | 0.69 | | 0.52 | | 0.53 | |
| Dividends | 0.69 | | 0.63 | | 0.685 | | 0.495 | | 0.48 | |
| Net asset value at year end | 8.25 | | 8.06 | | 7.32 | | 5.89 | | 5.18 | |
Comparison of financial information
When reference to ‘constant currency’ or ‘constant exchange rates’ is made, comparative data reported in the functional currencies of HSBC’s operations have been translated at the appropriate exchange rates applied in the current period in respect of the income statement or the balance sheet. When reference to ‘underlying basis’ is made, comparative information has been expressed at constant currency and adjusted for the effect of acquisitions and the change in presentation of non-equity minority issues.
As the transition to IFRSs affects the comparability of the financial information presented in this document (see Note 1 on the Financial Statements), the commentary that follows specifies the impact when this is material to a reader’s understanding of the underlying business trends.
Footnotes to ‘Financial Highlights’
| | |
| 1 | Each ADS represents five ordinary shares. |
| 2 | Total shareholder return (‘TSR’) is defined on page 220. |
| 3 | The Financial Times-Stock Exchange 100 Index. |
| 4 | The Morgan Stanley Capital International World Index. |
| 5 | The definition of return on average invested capital and a reconciliation to the equivalent GAAP measures are set out on page 43. |
| 6 | The return on average total shareholders’ equity is defined as profit attributable to shareholders of the parent company divided by average total shareholders’ equity. |
| 7 | The cost efficiency ratio is defined as total operating expenses divided by net operating income before loan impairment charges and other credit risk provisions. |
| 8 | Comparative data for 2004 excludes the provisions of IAS 32, IAS 39 and IFRS 4, which were adopted for the first time with effect from 1 January 2005. |
| 9 | The periods 2001-2003 were prepared in accordance with UK GAAP. The principal adjustments necessary to conform these periods with IFRSs are described in Note 46 on the Financial Statements on page 332. HSBC’s accounting policies under UK GAAP are stated in Note 2 on the Financial Statements in the2004 Annual Report and Accounts. |
| 10 | Capital resources are defined on page 173. A detailed computation for 2005 and 2004 is provided on page 176. |
| 11 | Net of suspended interest and provisions for bad and doubtful debts (UKGAAP). |
| 12 | Net of impairment allowances against customers (IFRSs). |
| 13 | Dividends per share expressed as a percentage of earnings per share (2001 to 2003: excluding goodwill amortisation). |
4
Back to Contents
| H S B C H O L D I N G S P L C |
| |
| |
| Cautionary Statement regarding Forward-Looking Statements |
| | |
| | |
ThisAnnual Report contains certain forward-looking statements with respect to the financial condition, results of operations and business of HSBC.
Statements that are not historical facts, including statements about HSBC’s beliefs and expectations, are forward-looking statements. Words such as ‘expects’, ‘anticipates’, ‘intends’, ‘plans’, ‘believes’, ‘seeks’, ‘estimates’, ‘potential’ and ‘reasonably possible’, variations of these words and similar expressions are intended to identify forward-looking statements. These statements are based on current plans, estimates and projections, and therefore undue reliance should not be placed on them. Forward-looking statements speak only as of the date they are made, and it should not be assumed that they have been revised or updated in the light of new information or future events.
Written and/or oral forward-looking statements may also be made in the periodic reports to the United States Securities and Exchange Commission, summary financial statements to shareholders, proxy statements, offering circulars and prospectuses, press releases and other written materials, and in oral statements made by HSBC’s Directors, officers or employees to third parties, including financial analysts.
Forward-looking statements involve inherent risks and uncertainties. Readers are cautioned that a number of factors could cause actual results to differ, in some instances materially, from those anticipated or implied in any forward-looking statement. These factors include, among others:
| • | changes in general economic conditions in the markets in which HSBC operates, such as: |
| | | |
| | – | changes in foreign exchange rates, in both market exchange rates (for example, between the US dollar and the pound sterling) and government-established exchange rates (for example, between the Hong Kong dollar and the US dollar); |
| | | |
| | – | volatility in interest rates; |
| | | |
| | – | volatility in equity markets, including in the smaller and less liquid trading markets in Asia and South America; |
| | | |
| | – | lack of liquidity in wholesale funding markets in periods of economic or political crisis; |
| | | |
| | – | illiquidity and downward price pressure in national real estate markets, particularly consumer-owned real estate markets; |
| | | – | the impact of lower than expected investment returns on the burden of funding private and public sector defined benefit pensions; |
| |
| | | – | the effect of unexpected changes in actuarial assumptions on longevity which would influence the funding of private and public sector defined benefit pensions; |
| |
| | | – | continuing or deepening recessions and employment fluctuations; and |
| |
| | | – | consumer perception as to the continuing availability of credit, and price competition in the market segments served by HSBC. |
| |
| | • | changes in governmental policy and regulation, including: |
| | | | |
| | | – | the monetary, interest rate and other policies of central banks and bank and other regulatory authorities, including the United Kingdom Financial Services Authority, the Bank of England, the Hong Kong Monetary Authority, the United States Federal Reserve, the US Office of the Comptroller of the Currency, the European Central Bank, the People’s Bank of China and the central banks of other leading economies and markets where HSBC operates; |
| |
| | | – | expropriation, nationalisation, confiscation of assets and changes in legislation relating to foreign ownership; |
| |
| | | – | initiatives by local, state and national regulatory agencies or legislative bodies to revise the practices, pricing or responsibilities of financial institutions serving their consumer markets; |
| |
| | | – | changes in bankruptcy legislation in the principal markets in which HSBC operates and the consequences thereof; |
| |
| | | – | general changes in governmental policy that may significantly influence investor decisions in particular markets in which HSBC operates; |
| |
| | | – | other unfavourable political or diplomatic developments producing social instability or legal uncertainty which in turn may affect demand for HSBC’s products and services; |
| |
| | | – | the costs, effects and outcomes of regulatory reviews, actions or litigation, including any additional compliance requirements; and |
5
Back to Contents
| H S B C H O L D I N G S P L C |
| |
| |
| Cautionary Statement regarding Forward-Looking Statements (continued) |
| | |
| | |
| | – | the effects of competition in the markets where HSBC operates including increased competition from non-bank financial services companies, including securities firms. |
| | | |
| • | factors specific to HSBC: |
| | | |
| | – | the success of HSBC in adequately identifying the risks it faces, such as the |
| | | incidence of loan losses or delinquency, and managing those risks (through account management, hedging and other techniques). Effective risk management depends on, among other things, HSBC’s ability through stress testing and other techniques to prepare for events that cannot be captured by the statistical models it uses. |
| | | |
| |
| Information about the Enforceability of Judgements made in the United States |
| | |
| | |
HSBC Holdings is a public limited company incorporated in England and Wales. Most of HSBC Holdings’ Directors and executive officers live outside the US. As a result, it may not be possible to serve process on such persons or HSBC Holdings in the US or to enforce judgements obtained in US courts against them or HSBC Holdings based on civil liability provisions of the securities laws of the US. There is doubt as to whether English courts would enforce:
| • | certain civil liabilities under US securities laws in original actions; or |
| | |
| • | judgements of US courts based upon these civil liability provisions. |
In addition, awards of punitive damages in actions brought in the US or elsewhere may be unenforceable in the UK. The enforceability of any judgement in the UK will depend on the particular facts of the case as well as the laws and treaties in effect at the time
| |
| Exchange Controls and Other Limitations affecting Equity Security Holders |
| | |
| | |
There are currently no UK laws, decrees or regulations which would prevent the import or export of capital or remittance of distributable profits by way of dividends and other payments to holders of HSBC Holdings’ equity securities who are not residents of the UK. There are also no
restrictions under the laws of the UK or the terms of the Memorandum and Articles of Association of HSBC Holdings concerning the right of non-resident or foreign owners to hold HSBC Holdings’ equity securities or, when entitled to vote, to do so.
6
Back to Contents
H S B C H O L D I N G S P L C
Description of Business
HSBC is one of the largest banking and financial services organisations in the world, with a market capitalisation of US$182 billion at 31 December 2005.
Headquartered in London, HSBC operates through long-established businesses and has an international network of over 9,800 properties in 76 countries and territories in five geographical regions: Europe; Hong Kong; Rest of Asia-Pacific, including the Middle East and Africa; North America and South America. Within these regions, a comprehensive range of financial services is offered to personal, commercial, corporate, institutional, investment and private banking clients. Services are delivered primarily by domestic banks, typically with large retail deposit bases, and consumer finance operations.
HSBC manages its business through four customer groups: Personal Financial Services; Commercial Banking; Corporate, Investment Banking and Markets; and Private Banking. Personal Financial Services incorporates the Group’s consumer finance businesses, reflecting their increasing integration within mainstream financial services around the world. The largest of these is HSBC Finance Corporation, one of the leading consumer finance companies in the US.
The establishment in 1999 of HSBC as a uniform, international brand name ensured that the Group’s hexagon corporate symbol has become an increasingly familiar sight across the world.
The founding member of HSBC, The Hongkong and Shanghai Banking Corporation Limited (‘The Hongkong and Shanghai Banking Corporation’), was established in both Hong Kong and Shanghai in 1865. The bank expanded rapidly, with an emphasis on building up representation in mainland China and throughout the rest of Asia, while also establishing a presence in the major financial and trading centres in Europe and America.
In the mid-1950s, The Hongkong and Shanghai Banking Corporation embarked on a strategy of pursuing profitable growth through acquisition as well as organic development – a combination that has remained a key feature of HSBC’s approach ever since.
With each acquisition, HSBC focused on integrating its newly acquired operations with its existing businesses with the aim of maximising the
synergy between the various components. Key to this integration process is the blending of local and international expertise.
The most significant developments are described below. Other acquisitions in 2005 are discussed in the ‘Financial Review’ on pages 26 to 177.
The Hongkong and Shanghai BankingCorporation purchased The Mercantile Bank of India Limited and The British Bank of the Middle East, now HSBC Bank Middle East Limited (‘HSBC Bank Middle East’) in 1959. In 1965, it acquired a 51 per cent interest (subsequently increased to 62.14 per cent) in Hang Seng Bank Limited (‘Hang Seng Bank’), consolidating its leadership position in Hong Kong. Hang Seng Bank is the third-largest listed bank in Hong Kong by market capitalisation.
The Hongkong and Shanghai Banking Corporation entered the US market in 1980 by acquiring a 51 per cent interest in Marine Midland Banks, Inc., now HSBC USA, Inc. The remaining interest was acquired in 1987.
In 1981, The Hongkong and Shanghai Banking Corporation incorporated its then existing Canadian operations. HSBC Bank Canada has since made numerous acquisitions, expanding rapidly to become the largest foreign-owned bank in Canada and the seventh-largest overall at 31 December 2005.
From the early 1980s, The Hongkong and Shanghai Banking Corporation began to focus its acquisition strategy on the UK. In 1987, it purchased a 14.9 per cent interest in Midland Bank plc, now HSBC Bank plc (‘HSBC Bank’), one of the UK’s principal clearing banks. In 1991, HSBC Holdings plc was established as the parent company of the HSBC Group and, in 1992, it purchased the remaining interest in HSBC Bank. As a consequence of this acquisition, HSBC’s head office was transferred from Hong Kong to London in January 1993.
In 1997, HSBC assumed selected assets, liabilities and subsidiaries of Banco Bamerindus do Brasil S.A., now HSBC Bank Brasil S.A.-Banco Múltiplo (‘HSBC Bank Brazil’), following the intervention of the Central Bank of Brazil, and in Argentina completed the acquisition of Grupo Roberts, now part of HSBC Bank Argentina S.A. (‘HSBC Bank Argentina’).
In December 1999, HSBC acquired Republic New York Corporation, subsequently merged with HSBC USA, Inc., and Safra Republic Holdings S.A. In July 2004, HSBC Bank USA, Inc. merged with
7
Back to Contents
H S B C H O L D I N G S P L C
Description of Business(continued)
HSBC Bank & Trust (Delaware) N.A. to form HSBC Bank USA, N.A. (‘HSBC Bank USA’).
To expand its base in the euro zone, in 2000 HSBC completed its acquisition of 99.99 per cent of the issued share capital of Crédit Commercial de France S.A., subsequently CCF S.A. (‘CCF’) and now HSBC France, a major French banking group.
In 2002, HSBC took further steps in expanding its presence in the Americas, completing the acquisition of 99.59 per cent of Grupo Financiero Bital, S.A. de C.V., the holding company of what is now HSBC México, S.A. (‘HSBC Mexico’), the fourth-largest banking group in Mexico measured by assets and the third by customer deposits.
Mainland China remains a key long-term growth area for the Group. In 2002, HSBC completed the acquisition of a 10 per cent equity stake in Ping An Insurance Company of China Limited (‘Ping An Insurance’), reducing its holding to 9.99 per cent following an initial public offering (‘IPO’) in 2004. In August 2005, HSBC acquired a further 9.91 per cent of Ping An Insurance at a cost of US$1,039 million, increasing its investment to 19.9 per cent. Ping An Insurance is the second-largest life insurer and the third-largest property and casualty insurer in mainland China.
In 2003, HSBC acquired HouseholdInternational, Inc., now HSBC Finance Corporation (‘HSBC Finance’). HSBC Finance brought to the Group national coverage in the US for consumer lending, credit cards and credit insurance through multiple distribution channels, as well as expertise in consumer finance for HSBC to roll out internationally.
Also in 2003, HSBC expanded in Brazil, acquiring Banco Lloyds TSB S.A.-Banco Múltiplo and the country’s leading consumer finance company, Losango Promotora de Vendas Limitada (‘Losango’).
In 2004, the acquisition of The Bank of Bermuda Limited (‘Bank of Bermuda’) was completed.
In the same year, HSBC acquired Marks and Spencer Retail Financial Services Holdings Limited, which trades as Marks and Spencer Money (‘M&S Money’) in the UK.
In mainland China in 2004, HSBC acquired 19.9 per cent of Bank of Communications Limited (‘Bank of Communications’), mainland China’s fifth largest bank by total assets. In the same year, Hang Seng Bank acquired 15.98 per cent of Industrial Bank Co.
Limited (‘Industrial Bank’), one of only 13 national joint-stock banks.
In December 2005, HSBC Finance completed the acquisition of Metris Companies Inc. (‘Metris’) for US$1.6 billion. HSBC is now the 5th largest issuer of MasterCard® and Visa® cards1 in the US.
In the near term, the outlook is encouraging. The world economy continues to grow steadily. The US economy is strong, the UK resilient, Japan and Germany are recovering and the emerging markets are buoyant.
Longer term prospects are more uncertain. Apart from the possibility, albeit remote, of a sudden shock to the world’s financial system, HSBC remains concerned about the unprecedented level of trade imbalances. Similarly, the implications of demographic change and of ageing populations for financial markets and businesses will be profound. It is inevitable that at some stage a process of adjustment will begin, but the timing is open to question. So far, the financial markets are taking a benign view of these potential sources of instability.
Progressively, globalisation is forcing countries and businesses operating within them to re-evaluate their comparative advantages and to adjust to a world in which emerging markets compete not only in terms of cost but also in skills and technology. The globalisation of the services industry, spurred on by new technologies and the rapid fall in communication costs, will afford huge opportunities but also pose significant challenges to many areas of economic activity, including financial services. Incipient protectionism, resulting from a reluctance to face up to the new competitive realities, remains a threat to the continuing growth of the world economy.
In certain mature markets, under-funded pension schemes threaten to become a drain on companies’ resources. Combined with the rising cost of long-term health care, they pose a considerable challenge to policy makers. Continuing productivity growth is, therefore, increasingly important. Only if it is achieved will financial markets be able to offer returns with a meaningful premium to the risk-free rate embodied in government debt. Without such productivity gains and associated financial returns, the affordability of pension and health care promises
| 1 | Visa is a registered trademark of VISA USA, Inc.and MasterCard is a registered trademark of MasterCard International, Incorporated. |
8
Back to Contents
will become increasingly burdensome. The challenge to society of managing the equitable distribution of wealth created between competing generations may well become one of the most pressing of the next decade.
In this environment HSBC, with its unique international footprint, is determined to continue to deliver profitable growth and value to its various constituencies. Success ensures that the Group can offer good employment prospects to an ever more diverse workforce. It means that HSBC can afford to continue to invest in expanding the platforms by which it delivers services to its customers. It enables the Group to contribute to the savings and retirement needs of those who invest in HSBC directly, or indirectly through pension plans and investment funds.
Building on its achievements, HSBC’s priority for the rest of 2006 is to continue to implement its Managing for Growth strategy. It will achieve this by being distinctive, reinforcing its brand values of trust and integrity in all its dealings with customers. The Group will make itself even more relevant by broadening the product, channel and geographical coverage it offers. Furthermore, HSBC will ensure that the scale and complexity needed to compete successfully will be seamless from the perspective of its customers and manageable from that of its employees.
HSBC’s businesses in Asia, Turkey, Mexico, Brazil and the Middle East see strong opportunities for growth on the back of investments already made. The Group also sees opportunities to strengthen its position in its franchises in the UK, Hong Kong, North America and France. HSBC believes there is growing momentum from the development of its new business streams within Corporate, Investment Banking and Markets businesses. Overall, HSBC is well positioned for further growth.
At the end of 2003, HSBC launched ‘Managing for Growth’, a strategic plan that provides HSBC with a blueprint for growth and development during the period to 2008. The strategy is evolutionary, not revolutionary. It builds on HSBC’s strengths and it addresses the areas where further improvement is considered both desirable and attainable.
Management’s vision for the Group remains consistent: HSBC aims to be the world’s leading financial services company. In this context, ‘leading’ means preferred, admired and dynamic, and being recognised for giving the customer a fair deal. HSBC
will strive to secure and maintain a leading position within each of its customer groups in selected markets.
HSBC will concentrate on growing earnings over the long term at a rate which will place it favourably when compared with its peer group. It will also focus on investing in its delivery platforms, its technology, its people and its brand to support the future value of HSBC as reflected in its comparative stock market rating and TSR. HSBC remains committed to benchmarking its performance both absolutely and by comparison with a peer group. For full details of the peer group benchmark, see page 220.
HSBC’s core values are integral to its strategy, and communicating them to customers, shareholders and employees is intrinsic to the plan. These values comprise an emphasis on long-term, ethical client relationships; high productivity through teamwork; a confident and ambitious sense of excellence; being international in outlook and character; prudence; creativity and customer-focused marketing.
The plan also reaffirms HSBC’s recognition of its corporate social responsibility (‘CSR’). HSBC has always aspired to the highest standards of conduct, recognises its wider obligations to society and believes there is a strong link between CSR, long-term success and value creation. Moreover, changing public expectations across a wide spectrum of social, ethical and environmental issues require continuing attention to this area. The strategy therefore calls for a renewed emphasis on CSR and for increased external communication of the Group’s CSR policies and performance, particularly on education and the environment, which will remain the principal beneficiaries of HSBC’s philanthropic activities.
HSBC’s growth ambitions centre on its four customer groups: Personal Financial Services; Commercial Banking; Corporate, Investment Banking and Markets; and Private Banking; and specific strategies are being implemented for each of them. HSBC believes that by organising its internal and external reporting around customer groups, it reinforces to all its employees the Group’s customer focus.
Within Personal Financial Services, the increasing integration, skills sharing and transfer of technology with the consumer finance business has augmented and enhanced existing activities. In addition, the introduction of skills and practices from the world’s leading retailing businesses is shaping HSBC’s competitive positioning.
9
Back to Contents
H S B C H O L D I N G S P L C
Description of Business(continued)
Key elements in achieving HSBC’s objectives for its customer groups will be accelerating the rate of growth of revenue; developing the brand strategy further; improving productivity; and maintaining the Group’s prudent risk management and strong financial position. Developing the skills of HSBC’s staff will also be critical and it will be necessary to ensure that all employees understand how they can contribute to the successful achievement of the Group’s objectives. Employees who do make such a contribution will be rewarded accordingly.
Operational management will continue to be organised geographically under four regional intermediate head offices, with business activities concentrated in locations where growth and critical mass are to be found.
| | The plan contains eight strategic imperatives: |
| | |
| • | Brand: make HSBC and its hexagon symbol one of the world’s leading brands for customer experience and corporate social responsibility; |
| | |
| • | Personal Financial Services: drive growth in key markets and through appropriate channels to make HSBC the strongest global player in personal financial services; |
| | |
| • | Consumer Finance: extend the reach of this business to existing customers through a wider product range and penetrate new markets; |
| | |
| • | Commercial Banking: make the most of HSBC’s international customer base through effective relationship management and improved product offerings in all the Group’s markets; |
| | |
| • | Corporate, Investment Banking and Markets: accelerate growth by enhancing capital markets and advisory capabilities focused on client service in defined sectors where HSBC has critical relevance and strength; |
| | |
| • | Private Banking: serve the Group’s highest value personal clients around the world; |
| | |
| • | People: attract, develop and motivate HSBC’s people, rewarding success and rejecting mediocrity; and |
| | |
| • | TSR: fulfil HSBC’s TSR target by achieving strong competitive performances in earnings per share growth and efficiency. |
At 31 December 2005, HSBC’s customers were served by 284,000 employees (including part-time employees) worldwide, compared with 253,000 at 31 December 2004 and 232,000 at 31 December 2003. The main centres of employment are the UK
with 55,000 employees, the US 49,000, Brazil 28,000, Hong Kong 26,000, Mexico 22,000, India 20,000 and France 14,000. HSBC negotiates with recognised unions, and estimates that approximately 40 per cent of its employees are unionised. The highest concentrations of union membership are in Brazil, France, India, Malaysia, Malta, Mexico, the Philippines, Singapore and the UK. As a result of well-developed communications and consultation programmes, HSBC has not experienced any material disruptions to its operations from labour disputes during the past five years.
In support of its strategy, HSBC focuses on attracting, developing and motivating the very best individuals and on encouraging talent internally. Emphasis is placed on performance management; differentiated rewards; succession planning; diversity; and learning and development, with priority accorded to enhancing sales and relationship management skills. HSBC continues to endeavour to ensure that employees’ engagement with the business is maximised as this is beneficial to shareholders, colleagues and customers alike.
HSBC recruits from a broad cross-section of society and encourages the sharing of individual perspectives and ideas through collective training and global secondments. HSBC’s diverse workforce represents a significant competitive advantage. The broad cultural mix and increasing cross-border mobility of its employees enables HSBC to resource operations with individuals who have detailed knowledge of local markets and of HSBC globally. This strengthens international networks and facilitates the sharing of best practices. In addition, a continuing focus on policies that encourage an inclusive working environment and the availability of career opportunities for all is critical to HSBC being an employer of choice. HSBC seeks to maintain an employee profile that reflects its customer base.
HSBC operates in a highly competitive and international business environment. Through its network of international operations, it has the advantage of being able to respond to the availability of talented employees wherever they are, in order to enhance customer service and improve productivity. As education levels improve globally and as investments in technology and telecommunications facilitate access at competitive cost to hitherto untapped resources, the balance of employment continues to change, resulting in global resource centres of excellence. Job losses may arise in some countries, but HSBC has a good record of communicating openly and sensitively in these circumstances, and of reassigning employees and
10
Back to Contents
minimising compulsory redundancies wherever possible.
HSBC seeks to promote and recruit the most able people and attaches great importance to cultivating its own talent. Resources have been set aside to ensure a supply of talented individuals to meet business succession needs, with support provided for these employees in the form of career enhancement and personal development programmes. In addition, HSBC recognises that there are lessons to be learned from other successful businesses, and will recruit from non-banking industries where appropriate.
| Customer groups |
|
| Profit before tax by customer group |
| |
| Year ended 31 December 2005 |

Total assets1 by customer group
As at 31 December 2005

| 1 | Excluding Hong Kong Government certificates of indebtedness. |
Personal Financial Services
Personal Financial Services provides some 120 million individual and self-employed customers with a wide range of banking and related financial services. The precise nature of the products and services provided is, to some extent, driven by local regulations, market practices and the market positioning of HSBC’s local businesses. Typically, products provided include
current and savings accounts, mortgages and personal loans, credit cards, and local and international payments services.
Personal customers prefer to conduct their financial business at times convenient to them, using a range of delivery channels. This demand for flexibility is met through the increased provision of direct channels such as the internet and self-service terminals, in addition to traditional and automated branches and service centres accessed by telephone.
Delivering the right products and services for particular target markets is a fundamental requirement in any retail service business, and market research and customer analysis is key to developing an in-depth understanding of significant customer segments and their needs. This understanding of the customer ensures that Customer Relationship Management (‘CRM’) systems are effectively used to identify and fulfil sales opportunities, and to manage the sales process.
HSBCPremieris a premium banking service providing personalised relationship management, 24-hour priority telephone access, global travel assistance and cheque encashment facilities. There are now over 1.3 million HSBCPremier customers, who can use more than 250 specially designatedPremierbranches and centres in 35 countries and territories, either when visiting, or on a more permanent basis if they require a banking relationship in more than one country.
Insurance and investment products play an important part in meeting the needs of customers. Insurance products sold and distributed by HSBC through its direct channels and branch networks include loan protection, life, property and health insurance, and pensions. Acting as both broker and underwriter, HSBC sees continuing opportunities to deliver insurance products to its personal customer base.
HSBC also makes available a wide range of investment products. A choice of third party and proprietary funds is offered, including traditional ‘long only’ equity and bond funds; structured funds that provide capital security and opportunities for an enhanced return; and ‘fund of funds’ products which offer customers the ability to diversify their investments across a range of best-in-class fund managers chosen after a rigorous and objective selection process. Comprehensive financial planning services covering customers’ investment, retirement, personal and asset protection needs are offered through specialist financial planning managers.
11
Back to Contents
H S B C H O L D I N G S P L CDescription of Business(continued)
High net worth individuals and their families who choose the differentiated services offered within Private Banking are not included in this customer group.
Consumer FinanceWithin Personal Financial Services, HSBC Finance’s operations in the US, the UK and Canada make credit available to customer groups not well catered for by traditional banking operations, facilitate point-of-sale credit in support of retail purchases and support major affiliate credit card programmes. At 31 December 2005 HSBC Finance had over 60 million customers with total gross advances of US$142.1 billion. Consumer Finance products are offered through the following businesses of HSBC Finance:
Theconsumer lendingbusiness is one of the largest sub-prime home equity originators in the US, marketed under the HFC and Beneficial brand names through a network of nearly 1,400 branches in 45 states, direct mail, telemarketing, strategic alliances and the internet. Consumer lending also acquires sub-prime loans on the secondary market. ‘Sub-prime’ is a category used in the US which describes customers who have limited credit histories, modest incomes, high debt-to-income ratios, high loan-to-value ratios (for real estate secured products) or have experienced credit problems caused by occasional delinquencies, prior charge-offs, bankruptcy or other credit-related actions. Consumer lending products include secured and unsecured loans such as first and second lien closed-end mortgages, open-ended home equity loans, personal loans, loans secured on motor vehicles and retail finance contracts. Consumer lending also offers a near-prime mortgage product which was first introduced in 2003 to broaden the range of customers to which its products are relevant.
The mortgage servicesbusiness purchases first and second lien residential mortgage loans, including open-end home equity loans, from a network of over 280 unaffiliated third-party lenders in the US. Purchases are primarily of pools of loans (‘bulk acquisitions’), but also include individual loan portfolios (‘flow acquisitions’), made under predetermined underwriting guidelines. Forward commitments are offered to selected correspondents to strengthen relationships and create a sustainable growth channel for this business. HSBC Finance, through its subsidiary, Decision One Mortgage Company (‘Decision One’), also originates mortgage loans referred by mortgage brokers.
Theretail servicesbusiness is one of the
largest providers of third party private label credit cards (or store cards) in the US based on receivables outstanding, with over 70 merchant relationships and 15.8 million active customer accounts.
In addition to originating and refinancing motor vehicle loans, HSBC Finance’smotor vehicle financebusiness purchases retail instalment contracts of US customers who do not have access to traditional prime-based lending sources. The loans are largely sourced from a network of approximately 10,000 motor dealers.
Thecredit card services business is the fifth largest issuer of MasterCard® and Visa®credit cards in the US, and also includes affiliation programmes such as the GM Card® and the AFL-CIO Union Plus® credit card. Also, credit cards issued in the name of Household Bank, Orchard Bank and Direct Merchants Bank brands are offered to customers under-served by traditional providers, or are marketed primarily through merchant relationships established by the retail services business.
A wide range ofinsurance services is offered by HSBC Finance to customers in the US, the UK and Canada who are typically not well-served by traditional sources.
Thetaxpayer financial services business accelerates access to funds for US taxpayers who are entitled to tax refunds and offers financial services through more than 25,000 tax return preparers in the US. The business is seasonal with most revenues generated in the first three months of the year.
HSBC Finance’s business in the UK (‘HFC Bank’) provides mid-market consumers with mortgages, secured and unsecured loans, insurance products, credit cards and retail finance products. It concentrates on customer service through its 187 HFC Bank and Beneficial branches, and finances consumer electronic goods through its retail finance operations. Its credit card business was sold to HSBC Bank in December 2005. In Canada, similar products are offered through trust operations of HSBC Finance’s subsidiary there.
Commercial BankingHSBC is one of the world’s leading, and most international, banks in the provision of financial services and products to small, medium-sized and middle market businesses, with over 2.5 million customers including sole proprietors, partnerships, clubs and associations, incorporated businesses and publicly quoted companies.
12
Back to Contents
At 31 December 2005, HSBC had total commercial customer account balances of US$148.1 billion and total commercial customer loans and advances, net of loan impairment allowances, of US$142.0 billion.
Commercial Banking places particular emphasis on multi-disciplinary and geographical collaboration in meeting its commercial customers’ needs, thereby differentiating, broadening and enhancing its offering. The range of products includes:
Payments and cash management: HSBC is a leading provider of payments, collections, liquidity management and account services worldwide, enabling commercial customers to manage their cash efficiently on a global basis. HSBC’s extensive network of offices and strong domestic capabilities in many countries, including direct access to local clearing systems, enhances its ability to provide high-quality competitive cash management services.
Treasury and capital markets: Commercial Banking customers have long been volume users of the Group’s foreign exchange capabilities. These are now being supplemented with more sophisticated currency and interest rate options.
Investment banking: A small number of Commercial Banking customers need occasional investment banking advisory support. Co-operation with Corporate, Investment Banking and Markets ensures that in most key markets such requirements are serviced internally.
Wealth management services: These include advice and products related to savings and investments. They are provided to Commercial Banking customers and their employees through HSBC’s worldwide network of branches and business banking centres.
Insurance: HSBC offers insurance protection, employee benefits programmes and pension schemes designed to meet the needs of businesses and their employees, and to help fulfil the applicable statutory obligations of client companies. These products are provided by HSBC either as an intermediary (broker, agent or consultant) or as a supplier of in-house or third party offerings. Products and services include a full range of commercial insurance, including pension schemes; healthcare schemes; ‘key man’ life insurance; car fleet; goods in transit; trade credit protection; risk management and insurance due diligence reviews; and actuarial/employee benefit consultancy.
Trade services: HSBC has more than 140 years of experience in trade services. A complete range of traditional documentary credit, collections and
financing products is offered, as well as specialised services such as insured export finance, international factoring and forfaiting. HSBC’s expertise is supported by highly automated systems.
Leasing, finance and factoring: HSBC has established specialised divisions to provide leasing and instalment finance for vehicles, plant and equipment, machinery and materials handling, and large complex leases. HSBC also provides domestic and international factoring and receivables finance services through a network of 11 businesses worldwide.
Credit cards: HSBC offers commercial credit card services in 18 countries. Commercial card issuing provides small to middle market businesses with services, including corporate and purchasing cards, which variously enhance cash management, improve cost control and streamline purchasing processes. Commercial card acquiring enables merchants to accept credit card payments either in-store or on the internet.
Corporate, Investment Banking and Markets
HSBC’s Corporate, Investment Banking and Markets business provides tailored financial solutions to major government, corporate and institutional clients worldwide. Managed as a global business, this customer group operates a long-term relationship management approach to build a full understanding of clients’ financial requirements. Sectoral client service teams comprising relationship managers and product specialists develop financial solutions to meet individual client needs. With dedicated offices in over 60 countries and with access to HSBC’s worldwide presence and capabilities, this business serves subsidiaries and offices of its clients on a global basis.
Products and services offered include:
Global MarketsHSBC’s operations in Global Markets consist of treasury and capital markets services for supranationals, central banks, corporations, institutional and private investors, financial institutions and other market participants. Products include:
| • | foreign exchange; |
| | |
| • | currency, interest rate, bond, credit, equity and other specialised derivatives; |
| | |
| • | government and non-government fixed income and money market instruments; |
| | |
| • | precious metals and exchange traded futures; |
13
Back to Contents
H S B C H O L D I N G S P L CDescription of Business(continued)
| • | equity services, including research, sales and trading for institutional, corporate and private clients and asset management services, including global investment advisory and fund management services; and |
| | |
| • | distribution of capital markets instruments, including debt, equity and structured products, utilising links with HSBC’s global networks. |
Corporate and Investment Banking
Global Investment Banking comprises:
| • | capital raising, both publicly and privately, including debt and equity capital, structured finance and syndicated finance; |
| | |
| • | corporate finance and advisory services for mergers and acquisitions, asset disposals, stock exchange listings, privatisations and capital restructurings; and |
| | |
| • | project and export finance services providing non-recourse finance to exporters, importers and financial institutions, and working closely with all major export credit agencies. |
Corporate and Institutional Banking includes:
| • | direct lending, including structured finance for complex investment facilities; |
| | |
| • | leasing finance with an emphasis on ‘large ticket’ transactions; and |
| | |
| • | deposit-taking. |
Global Transaction Banking includes international, regional and ‘in-country’ payments and cash management services; trade services, particularly the specialised ‘supply chain’ product; and securities services, where HSBC is one of the world’s leading custodians providing custody and clearing services and funds administration to both domestic and cross-border investors. Factoring and banknotes services are also provided by specialist units.
Private Equitycomprises HSBC’s captive private equity fund management activities, strategic relationships with certain third party private equity managers together with direct listed and unlisted equity investments and fund commitments.
Group Investment Businesses
These comprise asset management products and services for institutional investors, intermediaries and individual investors and their advisers.
Management structure
During February 2006, the management structure of Global Markets and Corporate and Investment Banking was restructured. Under the new structure, there are three principal business lines: Global Banking, Global Markets and Global Transaction Banking. This new structure will allow Corporate, Investment Banking and Markets to focus on the relationships and sectors that best fit the Group’s footprint and ensure seamless delivery of HSBC’s enhanced product capabilities to clients.
Private BankingHSBC’s presence in all the major wealth-creating regions has enabled it to build one of the world’s leading private banking groups, providing financial services to high net worth individuals and their families in 74 locations in 35 countries, with total assets under management of US$282 billion at 31 December 2005. HSBC Private Bank is the principal marketing name of the HSBC Group’s international private banking business which, together with HSBC Guyerzeller and HSBC Trinkaus & Burkhardt, provides private banking services.
Utilising the most suitable products from the marketplace, Private Banking works with its clients to offer both traditional and innovative ways to manage and preserve wealth whilst optimising returns. Products and services offered include:
Investment services: These comprise both advisory and discretionary investment services. A wide range of investment vehicles is covered, including bonds, equities, derivatives, options, futures, structured products and alternative products, mutual funds, hedge funds and fund of funds. Supported by six major advisory centres in Hong Kong, Singapore, Geneva, New York, Paris and London, Private Banking seeks to select the most suitable investments for clients’ needs and investment strategies.
Global wealth solutions: These comprise inheritance planning, trustee and other fiduciary services designed to protect existing wealth and create tailored structures to preserve wealth for future generations. Areas of expertise include trusts, foundation and company administration, charitable trusts and foundations, insurance and offshore structures.
Specialist advisory services: Private Banking offers expertise in several specialist areas of wealth management including tax advisory and financial planning, family office advisory, corporate finance,
14
Back to Contents
consolidated reporting, industry services such as charities and foundations, media, shipping, diamond and jewellery, and real estate planning. Specialist advisers are available to deliver products and services that are tailored to meet the full range of high net worth clients’ individual financial needs.
General banking services: These comprise treasury and foreign exchange, offshore and onshore deposits, credit and specialised lending, tailor-made loans and internet banking. Private Banking works to ensure its clients have full access to relevant skills and products available throughout HSBC, such as corporate banking, investment banking and insurance.
Profit before tax split by geographical region
Year ended 31 December 2005
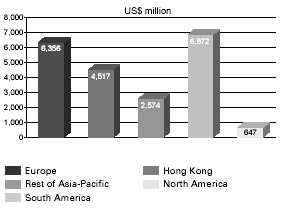
Total assets1 split by geographical region
As at 31 December 2005

| 1 | Excluding Hong Kong Government certificates of indebtedness. |
Additional information regarding business developments in 2005 may be found in the ‘Financial Review’ on pages 26 to 177.
Europe
HSBC’s principal banking operations in Europe are HSBC Bank in the UK, HSBC France, HSBC Bank
A.S. in Turkey, HSBC Bank Malta, HSBC Private Bank (Suisse), HSBC Trinkaus & Burkhardt KGaA and HSBC Guyerzeller Bank AG. Through these operations HSBC provides a wide range of banking, treasury and financial services to personal, commercial and corporate customers across Europe.
Hong Kong
HSBC’s principal banking subsidiaries in Hong Kong are The Hongkong and Shanghai Banking Corporation and Hang Seng Bank. The former is the largest bank incorporated in Hong Kong and is HSBC’s flagship bank in the Asia-Pacific region. It is one of Hong Kong’s three note-issuing banks, accounting for more than 65 per cent by value of banknotes in circulation in 2005.
Rest of Asia-Pacific (including the Middle East)
The Hongkong and Shanghai Banking Corporation offers personal, commercial, corporate and investment banking and markets services in mainland China. The bank’s network spans 12 major cities, comprising 12 branches and eight sub-branches. Hang Seng Bank offers personal and commercial banking services and operates six branches, four sub-branches, and two representative offices in eight cities in mainland China. HSBC also participates indirectly in mainland China through its three associates, Bank of Communications (19.9 per cent owned), Ping An Insurance (19.9 per cent) and Industrial Bank (15.98 per cent).
Outside Hong Kong and mainland China, the HSBC Group conducts business in the Asia-Pacific region primarily through branches and subsidiaries of The Hongkong and Shanghai Banking Corporation in 22 countries, with particularly strong coverage in India, Indonesia, South Korea, Singapore and Taiwan. HSBC’s presence in the Middle East is led by HSBC Bank Middle East in a network of branches and subsidiaries with the widest coverage in the region; in Australia by HSBC Bank Australia Limited; and in Malaysia by HSBC Bank Malaysia Berhad, which has the second largest presence of any foreign-owned bank in the country. HSBC’s associate in Saudi Arabia, The Saudi British Bank (40 per cent owned), is the Kingdom’s sixth largest bank.
North America
HSBC’s North American businesses cover the US, Canada, Mexico, Bermuda and Panama. Operations in the US are primarily conducted through HSBC Bank USA, N.A. which is concentrated in New York State, and HSBC Finance, a national consumer
15
Back to Contents
H S B C H O L D I N G S P L CDescription of Business(continued)
finance company based in Chicago. HSBC’s businesses in Mexico and Panama are run through HSBC Mexico, with HSBC Bank Canada and Bank of Bermuda responsible for operations in their respective countries.
South AmericaHSBC’s operations in South America principally comprise HSBC Bank Brazil and HSBC Bank Argentina, although HSBC is also represented in Venezuela, Chile and Uruguay. In addition to banking services, HSBC operates large insurance businesses in Argentina and Brazil. In Argentina, HSBC’s main insurance business is HSBC La Buenos Aires and, through Máxima and HSBC New York Life, HSBC offers pensions and life assurance products. In Brazil, HSBC also offers consumer finance products through its subsidiary, Losango.
HSBC believes that open and competitive markets are good for both local economies and their participants, and the Group faces very strong competition in the markets it serves. In personal and commercial banking, it competes with a wide range of institutions including commercial banks, consumer finance companies, retail financial service companies, savings and loan associations, credit unions, general retailers, brokerage firms and investment companies. In investment banking, HSBC faces competition from specialist providers and the investment banking operations of other commercial banks.
Regulators routinely monitor and investigate the competitiveness of the financial services industry (of which HSBC is a part) in a number of areas, particularly in the UK and Europe.
Global factorsConsolidation in the banking industry
Over the past few decades there has been a trend towards consolidation in banking and financial services, both nationally and internationally. This development has created a large and growing number of institutions which are capable of competing with HSBC across a wide range of services.
Limited market growth
The majority of HSBC’s business is conducted in the US, the UK and Hong Kong. Penetration of standard banking services in these markets is nearing saturation, with little scope for further market
growth. Greater potential for expansion lies in the provision of a wider range of financial services, including consumer finance, to new and existing customers. HSBC has also identified emerging economies in Asia-Pacific, Mexico, the Middle East, Turkey and Latin America as a source of current and future growth.
Advances in technology
Over the last decade, new technologies such as the internet and related innovations have matured, and financial institutions have not been alone in recognising the potential of these developments. Financial services and other market participants can now deliver a large and expanding range of products and services through these channels and competition is, as a result, fierce. However, with competition come opportunities. HSBC will continue to offer a full range of services via the channels preferred by its customers. These currently include the internet, interactive TV, mobile phone, WAP and telephone banking as well as the traditional branch network.
Regional factors
Europe
The European Commission has commenced inquiries into retail banking and business insurance across all member states. All HSBC entities affected have responded to the initial questionnaires.
The 65 member banks of the European Payments Council have signed an agreement to create a Single European Payments Area by 2008 which aims to harmonise transfers, banker’s orders and cards transactions. This should offer strong growth opportunities for some banks but will also lead to more competition.
UKAfter several very positive years, UK growth slowed in 2005. Although corporate earnings rose and the UK stock market was healthy, strong commodity and oil prices adversely affected several sectors.Retailers are suffering from declining levels of consumer confidence and disposable income, mainly caused by high levels of indebtedness and rising tax and utility burdens.
A stable interest rate environment, strong employment levels and a solid housing market helped to keep demand for consumer finance strong but could not prevent a rise in default and arrears rates in all forms of unsecured personal lending.
16
Back to Contents
Despite these developments, competition in the retail banking sector for the best customers remained intense, with pressure on credit products, interest margins and, in particular, deposit rates.
The high level of personal indebtedness and strong competition within the retail banking and consumer finance sectors led regulatory authorities to continue to monitor closely the financial services sector.
In December, the UK Competition Commission released its provisional remedies to improve competition following its investigation into the US$8.3 billion store card industry. HSBC continues to co-operate with the Commission as the inquiry draws to a conclusion.
Also in 2005, the Office of Fair Trading (‘OFT’) continued with its inquiry into credit card terms under the Unfair Terms in Consumer Contracts regulations. HSBC has made various submissions to the OFT and discussions continue.
The OFT also published its decision on the multilateral interchange agreement between MasterCard members in October. MasterCard has appealed against the decision to the Competition Appeals Tribunal. Visa is also subject to investigation but the case is suspended pending resolution of the MasterCard case.
In November, the Financial Services Authority published the results of its themed review of the sale of Payment Protection Insurance. It has expressed concerns regarding some practices which were common within the industry. HSBC has not received a negative response in respect of its own procedures, but will be considering its products and sales practices in the light of the findings. The OFT will be undertaking a market investigation into Payment Protection Insurance following a super-complaint from the Citizens’ Advice Bureau.
Throughout 2005, a Payments Task Force chaired by the OFT has brought together representatives of the banking industry, consumer bodies and business with the Bank of England and HM Treasury to look at various aspects of the payments system. Its first report recommended that the payment industry implement a faster means of making low cost electronic payments. HSBC agrees that this is in the consumer’s interest and favours its early implementation.
The Consumer Credit Bill, currently in its second reading in Parliament, updates existing consumer legislation in order to provide better consumer protection, and is likely to come into force during 2006.
HSBC’s policy is to co-operate and work positively with all its regulators, inputting data and perspective on those issues which affect all financial service providers via industry bodies.
FranceStable interest rates in the euro zone contributed to a strong growth in real estate investment in France. Competition between French banks was concentrated on the promotion of real estate mortgage loans, which are the principal means by which new customers in France are acquired. Market activity increased and consumers enjoyed improved pricing to the detriment of bank margins throughout 2005.
The payment of interest on sight deposits, which has only been permitted since the beginning of 2005, was introduced by one major mutual French bank. This move did not provoke a widespread reaction in the domestic market and, to date, no other leading French bank has followed suit.
In December 2005, Banque Postale (a subsidiary of the French Postal service) received the necessary regulatory approvals and with effect from January 2006 will be able to offer real estate mortgages and financial services, including the sale of investment products manufactured by third party providers. Given the scale of Banque Postale’s geographical coverage, this will increase competition in an already competitive market.
The French government has reformed tax law for 2006/2007 with two measures which will increase disposable income for high income individuals: a tax exemption on capital gains on equities held for more than eight years, which brings the French taxation regime into line with practices in many other European countries, and a cap on total household taxes at 60 per cent of income. This will boost one of the market segments on which HSBC France focuses.
At the end of December, French banks were granted approval, as in the UK, to provide equity release mortgages. This will assist customers to invest in real estate and finance consumption.
Hong KongWhile fierce competition in traditional core banking products remained evident in Hong Kong, the rising cost of funds in the second half of 2005 from increasing interbank rates made banks with smaller deposit bases more cautious in price competition. A decline in property loan demand also added pressure on banks to look for new outlets for lending. Personal loans, including credit card advances, attracted
17
Back to Contents
H S B C H O L D I N G S P L C
Description of Business(continued)
banks’ attention as consumer spending revived strongly.
The Chinese currency regime was reformed in July 2005 and the second phase of Hong Kong’s renminbi business introduced late in the year. While developments in these areas remain at an early stage, they are expected, along with the benefits flowing from the liberalisation of China’s financial sector under the World Trade Organisation agreement, to be a continued source of growth in the future.
Rest of Asia-Pacific
(including the Middle East)
The competitive environment in the Rest of Asia-Pacific continues to intensify as international banks focus on targeted sectors in emerging markets in pursuit of higher returns. Local banks are also actively expanding their reach and business, both within countries and across borders. Competition remains intense throughout the region in all the customer groups served by HSBC. However, in many countries the growing sophistication of the relatively young population and increasing affluence of the middle class continue to provide HSBC with further opportunities for growth.
Banks and non-banks, both local and international, are rapidly building consumer finance and direct banking businesses in a number of countries in the region.
North AmericaIn an already highly competitive US financial services industry, institutions involved in a broad range of financial products and services continued to consolidate. Within the banking sector, consolidation continued into 2006, with a greater focus on national networks and retail branch banking.
The Group’s principal US subsidiaries, HSBC Bank USA and HSBC Finance, face vigorous competition from a wide array of financial institutions. These include banks, thrifts, insurance companies, credit unions, mortgage lenders and brokers, and non-bank suppliers of consumer credit and other financial services. Many of these institutions are not subject to US banking industry regulation, unlike HSBC. This gives some of them cost and product advantages and will further increase competitive pressures. HSBC competes by expanding its customer base through portfolio acquisitions or alliances, co-branding opportunities and direct sales channels, by offering a very wide variety of consumer loan products and by maintaining a strong service orientation.
The five largest banks in Canada dominate the country’s financial services industry. Despite this, the market remains very competitive with comparable financial products and services offered by other banks, insurance companies and other institutions. Merger activity among the largest banks in Canada remains possible, but without such consolidation major financial institutions will continue to look elsewhere for growth.
Mexico’s banking industry is highly concentrated. Five large foreign-owned banks, including HSBC, control 75 per cent of banking assets and 78 per cent of deposits through their local subsidiaries. The majority of Mexico’s 105 million people neither have access to nor use the banking system. Thus there are favourable growth opportunities for retail banking over the medium to long term. HSBC is well placed in this environment, with an extensive branch network and an expanding base of young customers from which to develop growth opportunities. Currently, there is strong regulatory and consumer pressure to reduce banking and pension management fees and commissions as volumes increase, constraining growth in non-funds income. Mexico’s economy is very closely linked to the US and 88 per cent of its exports are sent there.
South AmericaThe composition of the Brazilian financial system saw relatively little change in 2005. The top ten banking groups, which account for 68 per cent of assets and 86 per cent of branches, remained dominated by a combination of large state-owned banks, privately-owned local banks and subsidiaries of foreign banks such as HSBC. In 2005, HSBC was the sixth largest non-state owned bank in the country, ranked by assets.
Notwithstanding the persistence of high interest rates in Brazil and an uncertain outlook for the economy, 2005 saw strong growth in lending to individuals. Central Bank statistics indicate that personal lending increased by an estimated 37 per cent during the year, following growth of 28.6 per cent in 2004. However, total lending as a percentage of GDP remained low in international terms at 31.3 per cent. This, together with the fact that within the economically active population an estimated 40 million people have limited access to financial services, indicates that the outlook for further growth is positive.
Against this background, banks continued to develop their consumer finance businesses, with particular emphasis on partnerships with large retailers and ‘green field’ ventures. In the retail
18
Back to Contents
segment, payroll and pension-linked advances emerged in 2005 as a significant source of lending. Banks also developed ‘virtual’ banking networks known ascorrespondentes bancários.Theseare typically small retail establishments offering basic payment and banking services on behalf of established banks on a commission basis. By the end of 2005, HSBC had developed a network of 1,824correspondentes generating close to one million monthly transactions.
In Argentina, HSBC’s competition comes from international financial groups which, in most cases, provide an equivalent range of banking, insurance, pension and annuity products and services.
The completion of Argentina’s international debt swap negotiation eliminated a major concern that had overshadowed the country and the financial system. This had a significantly favourable impact
upon the pensions and life insurance business, which also benefited from increasing contributions as more people returned to employment in the formal economy.
Consequently, the banking industry showed improved profitability with many of the larger foreign-owned banks re-capitalising their domestic operations. Continued growth and increased confidence in the economy were reflected in increased deposit levels and a 38 per cent growth in demand for loan products compared with 2004.
HSBC sees the return to a more normal business environment continuing and intends to monitor opportunities within the financial services industry in Argentina with a view to growing core retail and commercial banking franchises.
19
Back to Contents
H S B C H O L D I N G S P L C
Governance, Regulation and Supervision
| | Governance |
| |
|
| | With listings of its ordinary shares in London, Hong Kong, New York, Paris and Bermuda, HSBC Holdings complies with the relevant requirements for listing and trading on each of these exchanges. In the UK, these are the Listing Rules of the Financial Services Authority; in Hong Kong, The Rules Governing the Listing of Securities on The Stock Exchange of Hong Kong Limited; in the US, where the shares are traded in the form of ADSs, HSBC Holdings’ shares are registered with the US Securities and Exchange Commission. As a consequence of its US listing, HSBC Holdings is also subject to the reporting and other requirements of the US Securities Act of 1933, as amended, the Securities Exchange Act of 1934, as amended, and the New York Stock Exchange’s Listed Company Manual, in each case as applied to foreign private issuers. In France and Bermuda, HSBC Holdings is subject to the listing rules of Euronext, Paris and the Bermuda Stock Exchange applicable to companies with secondary listings. |
| | |
| | A statement of HSBC’s compliance with the code provisions of the Combined Code on Corporate Governance issued by the Financial Reporting Council and with the Code on Corporate Governance Practices in Appendix 14 to the Rules Governing the Listing of Securities on The Stock Exchange of Hong Kong Limited is set out in the ‘Report of the Directors’. |
| | |
| | Regulation and supervision |
| |
|
| | HSBC’s operations throughout the world are regulated and supervised by approximately 490 different central banks and regulatory authorities in those jurisdictions in which HSBC has offices, branches or subsidiaries. HSBC estimates the cost of this regulation and supervision to be approximately US$635 million in 2005. These authorities impose a variety of requirements and controls covering,inter alia, capital adequacy, depositor protection, market liquidity, governance standards, customer protection (for example, fair lending practices, product design, and marketing and documentation standards), and social responsibility obligations (for example, anti-money laundering and anti-terrorist financing measures). In addition, a number of countries in which HSBC operates impose rules that affect, or place limitations on, foreign or foreign-owned or controlled banks and financial institutions. The rules include restrictions on the opening of local offices, branches or subsidiaries and the types of banking and non-banking activities that may be conducted by those local offices, branches or subsidiaries; restrictions on the acquisition of local banks or |
regulations requiring a specified percentage of local ownership; and restrictions on investment and other financial flows entering or leaving the country. The supervisory and regulatory regimes of the countries where HSBC operates will determine to some degree HSBC’s ability to expand into new markets, the services and products that HSBC will be able to offer in those markets and how HSBC structures specific operations.
The Financial Services Authority (‘FSA’) supervises HSBC on a consolidated basis. In addition, each operating bank, finance company or insurance operation within HSBC is regulated by local supervisors. The primary regulatory authorities are those in the UK, Hong Kong and the US, the Group’s principal areas of operation.
In June 2004, the Basel Committee on Banking Supervision introduced a new capital adequacy framework to replace the 1988 Basel Capital Accord in the form of a final Accord (commonly known as ‘Basel II’). Details of the European Union’s implementation of Basel II and how this will affect HSBC are set out on page 174.
United Kingdom regulation and supervision
UK banking and financial services institutions are subject to multiple regulations. The primary UK statute is the Financial Services and Markets Act 2000 (‘FSMA’). Other UK primary and secondary banking legislation is derived from European Union (‘EU’) directives relating to banking, securities, investment and sales of personal financial services.
The FSA is responsible for authorising and supervising UK financial services institutions and regulates all HSBC’s businesses in the UK which require authorisation under the FSMA. These include retail banking, life and general insurance, pensions, mortgages, custody and branch share-dealing businesses, and treasury and capital markets activity. HSBC Bank is HSBC’s principal authorised institution in the UK.
FSA rules establish the minimum criteria for authorisation for banks and financial services businesses in the UK. They also set out reporting (and, as applicable, consent) requirements with regard to large individual exposures and large exposures to related borrowers. In its capacity as supervisor of HSBC on a consolidated basis, the FSA receives information on the capital adequacy of, and sets requirements for, HSBC as a whole. Further details on capital measurement are included in ‘Capital Management’ on pages 176 to 177. The FSA has the right to object, on prudential grounds, to
20
Back to Contents
persons who hold, or intend to hold, 10 per cent or more of the voting power of a financial institution.
The regulatory framework of the UK financial services system has traditionally been based on co-operation between the FSA and authorised institutions. The FSA monitors authorised institutions through ongoing supervision and the review of routine andad hoc reports relating to financial and prudential matters. The FSA may periodically obtain independent reports, usually from the auditors of the authorised institution, as to the adequacy of internal control procedures and systems as well as procedures and systems governing records and accounting. The FSA meets regularly with HSBC’s senior executives to discuss HSBC’s adherence to the FSA’s prudential guidelines. They also regularly discuss fundamental matters relating to HSBC’s business in the UK and internationally, including areas such as strategic and operating plans, risk control, loan portfolio composition and organisational changes, including succession planning.
UK depositors and investors are covered by the Financial Services Compensation Scheme which deals with deposits with authorised institutions in the UK, investment business and contracts of insurance. Institutions authorised to accept deposits and conduct investment business are required to contribute to the funding of the scheme. In the event of the insolvency of an authorised institution, depositors are entitled to receive 100 per cent of the first £2,000 (US$3,442) of a claim plus 90 per cent of any further amount up to £33,000 (US$56,798) (the maximum amount payable being £31,700 (US$54,560)). Payments under the scheme in respect of investment business compensation are limited to 100 per cent of the first £30,000 (US$51,634) of a claim plus 90 per cent of any further amount up to £20,000 (US$34,423) (the maximum amount payable being £48,000 (US$82,615)). In addition, the Financial Services Compensation Scheme has been extended to cover mortgage advice and arranging, certain long term and general insurance products, and the provision of general advice and arranging services. Differing levels of compensation limits apply to each of these additional areas.
The EU Savings Directive took effect on 1 July 2005. Under the directive, each member state other than Austria, Belgium, and Luxembourg is required to provide the tax authorities of each other member state with details of payments of interest or other similar income paid by a person within its jurisdiction to individuals resident in such other member state. For a transitional period beginning on the same date, Austria, Belgium, and Luxembourg
have imposed a withholding tax on such income. The withholding tax rate is 15 per cent, increasing to 20 per cent from 2008 and 35 per cent from 2011. Subject to future conditions being met, Austria, Belgium, and Luxembourg may cease to apply the withholding tax and instead comply with the automatic exchange of information rules applicable to the other member states. These future conditions will depend on other key financial centres – Switzerland, Liechtenstein, San Marino, Andorra and the US – not exchanging information. These financial centres and several other European countries and related offshore territories have also entered into similar agreements to the Savings Directive with the EU states.
Hong Kong regulation and supervision
Banking in Hong Kong is subject to the provisions of the Banking Ordinance of Hong Kong (Chapter 155) (the ‘Banking Ordinance’), and to the powers, functions and duties ascribed by the Banking Ordinance to the Hong Kong Monetary Authority (the ‘HKMA’). The principal function of the HKMA is to promote the general stability and effective working of the banking system in Hong Kong. The HKMA is responsible for supervising compliance with the provisions of the Banking Ordinance. The Banking Ordinance gives power to the Chief Executive of Hong Kong to give directions to the HKMA and the Financial Secretary with respect to the exercise of their respective functions under the Banking Ordinance.
The HKMA has responsibility for authorising banks, and has discretion to attach conditions to its authorisation. The HKMA requires that banks or their holding companies file regular prudential returns, and holds regular discussions with the management of the banks to review their operations. The HKMA may also conduct ‘on site’ examinations of banks, and in the case of banks incorporated in Hong Kong, of any local and overseas branches and subsidiaries. The HKMA requires all authorised institutions to have adequate systems of internal control and requires the institutions’ external auditors, upon request, to report on those systems and other matters such as the accuracy of information provided to the HKMA. In addition, the HKMA may from time to time conduct tripartite discussions with banks and their external auditors.
The HKMA, which may deny the acquisition of voting power of over 10 per cent in a bank, and may attach conditions to its approval thereof, can effectively control changes in the ownership and control of Hong Kong-incorporated financial institutions. In addition, the HKMA has the power to
21
Back to Contents
H S B C H O L D I N G S P L C
Governance, Regulation and Supervision (continued)
| | divest controlling interests in a bank from persons if they are no longer deemed to be fit and proper, if they may otherwise threaten the interests of depositors or potential depositors, or if they have contravened any conditions specified by the HKMA. |
| | |
| | The HKMA may revoke authorisation in the event of an institution’s non-compliance with the provisions of the Banking Ordinance. These provisions require, among other things, the furnishing of accurate reports. |
| | |
| | The Banking Ordinance requires that banks submit to the HKMA certain returns and other information and establishes certain minimum standards and ratios relating to capital adequacy (see below), liquidity, capitalisation, limitations on shareholdings, exposure to any one customer, unsecured advances to persons affiliated with the bank and holdings of interests in land, with which banks must comply. |
| | |
| | Hong Kong fully implemented the capital adequacy standards established by the 1988 Basel Capital Accord. The Banking Ordinance currently provides that banks incorporated in Hong Kong maintain a capital adequacy ratio (calculated as the ratio, expressed as a percentage, of the bank's capital base to its risk-weighted exposure) of at least 8 per cent. For banks with subsidiaries, the HKMA is empowered to require that the ratio be calculated on a consolidated basis, or on both consolidated and unconsolidated bases. If circumstances require, the HKMA is empowered to increase the minimum capital adequacy ratio (to up to 16 per cent), after consultation with the bank. |
| | |
| | The HKMA is in the process of establishing a Deposit Protection Scheme for banks in Hong Kong. It is expected that this will be launched in 2006. |
| | |
| | The marketing of, dealing in and provision of advice and asset management services in relation to securities in Hong Kong are subject to the provisions of the Securities and Futures Ordinance of Hong Kong (Chapter 571) (the ‘Securities and Futures Ordinance’). Entities engaging in activities regulated by the Securities and Futures Ordinance are required to be licensed. The HKMA is the primary regulator for banks involved in the securities business, while the Securities and Futures Commission is the regulator for non-banking entities. |
| | |
| | US regulation and supervision |
| | |
| | HSBC is subject to extensive federal and state supervision and regulation in the US. Banking laws and regulations of the Federal Reserve Board, the Federal Deposit Insurance Corporation (‘FDIC’) and |
the Office of the Comptroller of the Currency (‘OCC’) govern many aspects of HSBC’s US business.
HSBC and its US operations are subject to supervision, regulation and examination by the Federal Reserve Board because HSBC is a ‘bank holding company’ under the US Bank Holding Company Act of 1956 (the ‘BHCA’) as a result of its ownership of HSBC Bank USA. HSBC Bank USA is a nationally chartered commercial bank and a member of the Federal Reserve System. HSBC Bank USA is the surviving institution of the 1 July 2004 merger of HSBC Bank USA and HSBC Bank & Trust (Delaware) N.A. HSBC also owns HSBC Bank Nevada, N.A. (‘HSBC Bank Nevada’), a nationally chartered ‘credit card bank’ and HSBC Trust Company (Delaware) NA (‘HSBC Bank Delaware’), a nationally chartered bank limited to trust activities, each of which is also a member of the Federal Reserve System. Each of HSBC Bank USA, HSBC Bank Nevada and HSBC Bank Delaware is subject to regulation, supervision and examination by the OCC. The deposits of HSBC Bank USA and HSBC Bank Nevada are insured by the FDIC and both banks are subject to relevant FDIC regulation. On 1 January 2004, HSBC formed a new company to hold all of its North American operations, including these two banks. This company, called HSBC North America Holdings Inc. (‘HNAH’) is also a ‘bank holding company’ under the BHCA, by virtue of its ownership and control of HSBC Bank USA.
The BHCA and the International Banking Act of 1978 impose certain limits and requirements on the US activities and investments of HSBC, HNAH, and certain companies in which they hold direct or indirect investments. HSBC is also a ‘qualifying foreign banking organisation’ under Federal Reserve Board regulations and, as such, may engage within the United States in certain limited non-banking activities and hold certain investments that would otherwise not be permissible under US law. Prior to 13 March 2000, the BHCA generally prohibited HSBC from acquiring, directly or indirectly, ownership or control of more than 5 per cent of the voting shares of any company engaged in the US in activities other than banking and certain activities closely related to banking. On that date HSBC became a financial holding company (‘FHC’) under the Gramm-Leach-Bliley Act amendments to the BHCA, enabling it to offer a more complete line of financial products and services. Upon its formation, HNAH also registered as an FHC. HSBC and HNAH’s ability to engage in expanded financial activities as FHCs depend upon HSBC and HNAH continuing to meet certain criteria set forth in the
22
Back to Contents
BHCA, including requirements that its US depository institution subsidiaries, HSBC Bank USA, HSBC Bank Nevada and HSBC Bank Delaware, be ‘well-capitalised’ and ‘well-managed’, and that such institutions have achieved at least a satisfactory record in meeting community credit needs during their most recent examinations pursuant to the Community Reinvestment Act. These requirements also apply to Wells Fargo HSBC Trade Bank, N.A., in which HSBC and HNAH have a 20 per cent voting interest in equity capital and a 40 per cent economic interest. Each of these depository institutions achieved at least the required rating during their most recent examinations. At 31 December 2005, HSBC Bank USA, HSBC Bank Nevada, HSBC Bank Delaware and Wells Fargo HSBC Trade Bank, N.A. were each well capitalised and well managed under Federal Reserve Board regulations.
In general under the BHCA, an FHC would be required, upon notice by the Federal Reserve Board, to enter into an agreement with the Federal Reserve Board to correct any failure to comply with the requirements to maintain FHC status. Until such deficiencies are corrected, the Federal Reserve Board may impose limitations on the US activities of an FHC and depository institutions under its control. If such deficiencies are not corrected, the Federal Reserve Board may require an FHC to divest its control of any subsidiary depository institution or to desist from certain financial activities in the US.
HSBC and HNAH are generally prohibited under the BHCA from acquiring, directly or indirectly, ownership or control of more than 5 per cent of any class of voting shares of, or substantially all the assets of, or exercising control over, any US bank or bank holding company without the prior approval of the Federal Reserve Board.
The US is party to the 1988 Basel Capital Accord and US banking regulatory authorities have adopted risk-based capital requirements for US banks and bank holding companies that are generally consistent with the Accord. In addition, US regulatory authorities have adopted ‘leverage’ capital requirements that generally require US banks and bank holding companies to maintain a minimum amount of capital in relation to their balance sheet assets (measured on a non-risk-weighted basis).
The Federal Deposit Insurance Corporation Improvement Act of 1991 provides for extensive regulation of insured depository institutions (such as HSBC Bank USA, HSBC Bank Nevada and Wells Fargo HSBC Trade Bank, N.A.), including requiring federal banking regulators to take ‘prompt corrective
action’ with respect to FDIC-insured banks that do not meet minimum capital requirements.
HSBC Bank USA, HSBC Bank Nevada and Wells Fargo HSBC Trade Bank, N.A., like other FDIC-insured banks, may be required to pay assessments to the FDIC for deposit insurance under the FDIC’s Bank Insurance Fund. Under the FDIC’s risk-based system for setting deposit insurance assessments, an institution’s assessments vary according to the level of capital an institution holds, its deposit levels and other factors.
The USA Patriot Act (‘Patriot Act’) imposes significant record keeping and customer identity requirements, expands the US federal government’s powers to freeze or confiscate assets and increases the available penalties that may be assessed against financial institutions for failure to comply with obligations imposed on such institutions to detect, prevent and report money laundering and terrorist financing. Among other things, the Patriot Act requires the US Treasury Secretary to develop and adopt final regulations with regard to the anti-money laundering compliance obligations of financial institutions (a term which, for this purpose, includes insured US depository institutions, US branches and agencies of foreign banks, US broker-dealers and numerous other entities). The US Treasury Secretary delegated certain authority to a bureau of the US Treasury Department known as the Financial Crimes Enforcement Network (‘FinCEN’).
Many of the anti-money laundering compliance requirements of the Patriot Act, as implemented by FinCEN, are generally consistent with the anti-money laundering compliance obligations previously imposed on the then HSBC Bank USA and Household Bank (now HSBC Bank Nevada) under the Bank Secrecy Act (which was amended in certain respects by the Patriot Act) and applicable regulations. These include requirements to adopt and implement an anti-money laundering programme, report suspicious transactions and implement due diligence procedures for certain correspondent and private banking accounts. Certain other specific requirements under the Patriot Act involve new compliance obligations. The passage of the Patriot Act and other recent events have resulted in heightened scrutiny of the Bank Secrecy Act and anti-money laundering compliance by federal and state bank examiners. On 30 April 2003 the then HSBC Bank USA entered into a written agreement with the Federal Reserve Bank of New York and the New York State Banking Department to enhance its compliance with anti-money laundering requirements. HSBC Bank USA implemented certain improvements in its compliance, reporting, and review systems and procedures to
23
Back to Contents
H S B C H O L D I N G S P L C
Governance, Regulation and Supervision (continued)
| | comply with this agreement. When HSBC Bank USA merged with HSBC Bank & Trust (Delaware) N.A. on 1 July 2004, the OCC made the merger conditional on HSBC Bank USA’s continuing compliance with the requirements of the written agreement. On 6 February 2006, the OCC determined that HSBC Bank USA had satisfied the requirements of the written agreement, and it terminated the agreement. |
| | |
| | HSBC’s US consumer finance operations are subject to extensive state-by-state regulation in the US, and to laws relating to consumer protection; (both in general, and in respect of ‘sub-prime’ lending operations, which have been subject to enhanced regulatory scrutiny); discrimination in extending credit; use of credit reports; privacy matters; disclosure of credit terms; and correction of billing errors. They also are subject to regulations and legislation that limit operations in certain jurisdictions. For example, limitations may be placed on the amount of interest or fees that a loan may bear, the amount that may be borrowed, the types of actions that may be taken to collect or foreclose upon delinquent loans or the information about a customer that may be shared. HSBC’s US consumer finance branch lending offices are generally licensed |
in those jurisdictions in which they operate. Such licences have limited terms but are renewable, and are revocable for cause. Failure to comply with applicable laws and regulations may limit the ability of these licensed lenders to collect or enforce loan agreements made with consumers and may cause the consumer finance lending subsidiary to be liable for damages and penalties.
HSBC’s US credit insurance operations are subject to regulatory supervision under the laws of the states in which they operate. Regulations vary from state to state but generally cover licensing of insurance companies; premiums and loss rates; dividend restrictions; types of insurance that may be sold; permissible investments; policy reserve requirements; and insurance marketing practices.
Certain US source payments to foreign persons may be subject to US withholding tax unless the foreign person is a qualified intermediary. A qualified intermediary is a financial intermediary which is qualified under the Internal Revenue Code and has completed the Qualified Intermediary Withholding Agreement with the Internal Revenue Service. Various HSBC operations outside the US are qualified intermediaries.
24
Back to Contents
| H S B C H O L D I N G S P L C |
| |
| |
| Description of Property |
| | |
| | |
At 31 December 2005, HSBC operated from some 9,800 operational properties worldwide, of which approximately 3,300 were located in Europe, 600 in Hong Kong and the Rest of Asia-Pacific, 4,000 in North America (including 1,600 in Mexico) and 1,900 in South America. These properties had an area of approximately 63.8 million square feet (2004: 62.2 million square feet).
In addition, properties with a net book value of US$2,170 million were held for investment purposes. Of the total net book value of HSBC properties, more than 80 per cent were owned or held under long-term leases. Further details are included in Note 23 on the Financial Statements.
HSBC’s properties are stated at cost, being historical cost or fair value at the date of transition to IFRSs (their deemed cost) less any impairment losses, and are depreciated on a basis calculated to write off the assets over their estimated useful lives.
HSBC is named in and is defending legal actions in various jurisdictions arising out of its normal business operations. None of the above proceedings is regarded as material litigation.
25
Back to Contents
H S B C H O L D I N G S P L C
Financial Review
Summary
| | Year ended 31 December | |
| |
| |
| | 2005 | | | 2004 | |
| | US$m | | | US$m | |
| Interest income | 60,094 | | | 50,471 | |
| Interest expense | (28,760 | ) | | (19,372 | ) |
| Net interest income | 31,334 | | | 31,099 | |
| Fee income | 17,486 | | | 15,902 | |
| Fee expense | (3,030 | ) | | (2,954 | ) |
| Net fee income | 14,456 | | | 12,948 | |
| Trading income excluding net interest income | 3,656 | | | 2,786 | |
| Net interest income on trading activities | 2,208 | | | – | |
| Net trading income1 | 5,864 | | | 2,786 | |
| Net income from financial instruments designated at fair value | 1,034 | | | – | |
| Net investment income on assets backing policyholders’ liabilities | – | | | 1,012 | |
| Gains less losses from financial investments | 692 | | | 540 | |
| Dividend income | 155 | | | 622 | |
| Net earned insurance premiums | 5,436 | | | 5,368 | |
| Other operating income | 2,733 | | | 1,613 | |
| |
| | |
| |
| Total operating income | 61,704 | | | 55,988 | |
| Net insurance claims incurred and movement in policyholders’ liabilities | (4,067 | ) | | (4,635 | ) |
| |
| | |
| |
| Net operating income before loan impairment charges and other credit risk provisions | 57,637 | | | 51,353 | |
| Loan impairment charges and other credit risk provisions | (7,801 | ) | | (6,191 | ) |
| |
| | |
| |
| Net operating income | 49,836 | | | 45,162 | |
| |
| | |
| |
| Employee compensation and benefits | (16,145 | ) | | (14,523 | ) |
| General and administrative expenses | (11,183 | ) | | (9,739 | ) |
| Depreciation of property, plant and equipment | (1,632 | ) | | (1,731 | ) |
| Amortisation of intangible assets | (554 | ) | | (494 | ) |
| |
| | |
| |
| Total operating expenses | (29,514 | ) | | (26,487 | ) |
| |
| | |
| |
| Operating profit | 20,322 | | | 18,675 | |
| Share of profit in associates and joint ventures | 644 | | | 268 | |
| |
| | |
| |
| Profit before tax | 20,966 | | | 18,943 | |
| Tax expense | (5,093 | ) | | (4,685 | ) |
| |
| | |
| |
| Profit for the year | 15,873 | | | 14,258 | |
| |
| | |
| |
| Profit attributable to shareholders of the parent company | 15,081 | | | 12,918 | |
| Profit attributable to minority interests | 792 | | | 1,340 | |
| 1 | ‘Net trading income’ comprises all gains and losses from changes in the fair value of financial assets and financial liabilities held for trading, together with related external interest income, interest expense and dividend income. The 2004 comparative figure does not include interest income and interest expense on trading assets and liabilities except for trading derivatives, nor does it include dividend income on trading assets. |
| |
HSBC made a profit before tax of US$20,966 million, a rise of US$2,023 million or 11 per cent compared with 2004. Of this increase, US$267 million was attributable to additional contributions of ten and two months from M&S Money and Bank of Bermuda respectively, one month’s contribution from Metris, and the first full year effect of HSBC’s investments in Bank of Communications and Industrial Bank.
As a result of the transition to full IFRSs, the format of the income statement has changed. In
particular, US$685 million of what would, in the past, have been included in non-equity minority interest, has moved within the income statement and is classified as ‘Interest expense’ in 2005, rather than ‘Profit attributable to minority interests’. As the applicable IFRSs requiring these changes only came into effect from 1 January 2005, the comparative 2004 figures are presented on the previous basis.
On an underlying basis, which is described on page 4, profit before tax increased by 13 per cent.
26
Back to Contents
Total operating income of US$61,704 million was US$5,716 million or 10 per cent higher than in 2004. On an underlying basis, total operating income also rose by 10 per cent. This reflected organic lending growth in all regions and expansion in transactional banking revenues from increased trade, funds under management, administration and custody activities. Strong growth was also seen in fixed income and credit trading. Operating income performance was well spread geographically with particularly strong growth in HSBC’s operations in South America, the Middle East and the Rest of Asia-Pacific.
Loan impairment and other credit risk provisions as a percentage of gross average advances to customers was moderately higher in 2005 at 1.16 per cent than in 2004, 0.99 per cent. There was also a small rise in the percentage ratio of new loan impairment charges to gross average advances to customers from 1.41 in 2004 to 1.50 in 2005. The charge of US$7,801 million was US$1,610 million or 26 per cent higher than in 2004 and on an underlying basis 23 per cent higher. Of this increase, approximately half was driven by growth in lending, with the remainder attributable to the higher rate of new provisions and the non-recurrence of general provision releases benefiting 2004. Underlying credit conditions in the UK were adversely affected by slower economic growth and changes in bankruptcy legislation. This was offset by improved credit experience in the US, notwithstanding the impact of Hurricane Katrina and an acceleration of bankruptcy filings ahead of legislative changes in the fourth quarter of 2005. In Brazil, HSBC also experienced higher charges as increased credit availability, particularly in the consumer segment, led to over-indebtedness.
Total operating expenses of US$29,514 million were US$3,027 million or 11 per centhigher than in 2004, 9 per cent higher on an underlying basis. Much of the growth reflected investment to expand the Group’s geographic presence and adding product expertise and sales support. This expansion was most marked in Personal Financial Services in the Rest of Asia-Pacific and in Corporate, Investment Banking and Markets, where investment spend peaked during 2005. In addition, business expansion in Mexico, the Middle East and South America contributed to cost growth.
Productivity improvements achieved in the UK and Hong Kong allowed the Group to continue building its Personal Financial Services and Commercial Banking businesses in the Rest of Asia-Pacific, and expanding its capabilities in Corporate, Investment Banking and Markets, without deterioration in the Group’s cost efficiency ratio. In the UK, the focus on improving utilisation of the existing infrastructure led to broadly flat costs in Personal Financial Services and Commercial Banking compared with underlying combined revenue growth of 10 per cent.
HSBC’s cost efficiency ratio, which is calculated as total operating expenses divided by net operating income before loan impairment charges and other credit risk provisions, improved slightly to 51.2 per cent in 2005 from 51.6 per cent in 2004.
HSBC’s share of profit in associates and joint ventures increased by US$376 million, boosted by full year contributions from Bank of Communications and Industrial Bank in mainland China, and increased income from The Saudi British Bank, which reported a record performance on the back of a vibrant economy and a strong oil price.
27
Back to Contents
H S B C H O L D I N G S P L C
Financial Review(continued)
Net interest income
| | Year ended 31 December | |
| |
| |
| | 2005 | | | | 2004 | | | |
| | US$m | | % | | US$m | | % | |
| By geographical region | | | | | | | | |
| Europe | 8,221 | | 26.2 | | 9,098 | | 29.3 | |
| Hong Kong | 4,064 | | 13.0 | | 3,638 | | 11.7 | |
| Rest of Asia-Pacific | 2,412 | | 7.7 | | 2,060 | | 6.6 | |
| North America | 14,887 | | 47.5 | | 14,993 | | 48.2 | |
| South America | 1,750 | | 5.6 | | 1,310 | | 4.2 | |
| |
| |
| |
| |
| |
| Net interest income1 | 31,334 | | 100.0 | | 31,099 | | 100.0 | |
| |
| |
| |
| |
| |
| | Year ended 31 December | |
| |
| |
| | 2005 | | 2004 | |
| | US$m | | US$m | |
| Net interest income1 | 31,334 | | 31,099 | |
| Average interest-earning assets | 999,421 | | 976,387 | |
| Gross interest yield (per cent)2 | 6.01 | | 5.17 | |
| Net interest spread (per cent)3 | 2.84 | | 2.97 | |
| Net interest margin (per cent)4 | 3.14 | | 3.19 | |
| 1 | ‘Net interest income’ in 2005 comprises interest income less interest expense on financial assets and liabilities which is not recognised as part of ‘Net trading income’ or ‘Net income earned from financial instruments designated at fair value’. In 2004, all interest income and expense was included within ‘Net interest income’ so these figures are not strictly comparable. |
| 2 | Gross interest yield is the average annualised interest rate earned on average interest-earning assets (‘AIEA’). |
| 3 | Net interest spread is the difference between the average annualised interest rate earned on AIEA, net of amortised premiums and loan fees, and the average annualised interest rate paid on average interest-bearing funds. |
| 4 | Net interest margin is net interest income expressed as an annualised percentage of AIEA. |
| | |
Net interest income of US$31,334 million was US$235 million, or 1 per cent, higher than in 2004.
Under IFRSs, HSBC’s presentation of net interest income in 2005 was particularly affected by:
| • | the reclassification of certain preference dividends within non-equity minority interests as interest expense; |
| | |
| • | the inclusion of certain loan origination fees and expenses as part of an effective interest rate calculation instead of being recognised in full on inception of the loan; and |
| | |
| • | external interest income and expense on trading assets and liabilities now included within ‘Net trading income’. |
| | |
Adjusting for these changes and on an underlying basis, net interest income increased by 12 per cent. The commentary that follows is on this basis.
The benefit of strong growth in interest-earning assets globally more than offset the effect of spread compression from flattening yield curves in the major currencies. This latter phenomenon reduced opportunities for HSBC’s treasury operations to enhance margin by placing the Group’s surplus liquidity longer term than the behaviouralised deposit funding base. In addition, short-term interest rate rises in the US reduced spreads on consumer finance loans.
In Europe, higher personal and commercial lending and increased deposit balances led to a 12 per cent increase in net interest income. UKPersonal Financial Services balances grew strongly in mortgages, unsecured lending and cards, mainly funded by a 12 per cent increase in deposit and savings balances. In Turkey, card balances grew from increased marketing and working with HSBC’s retail partners. Spreads tightened on UK personal lending, reflecting the introduction of preferential pricing for lower-risk and higher-value customers, and on savings, due to better pricing for customers. In Commercial Banking in the UK, lending and overdraft balances increased by 23 per cent, with growth particularly strong in the property, distribution and services sectors. Deposit balances grew by 11 per cent, partly from keen pricing, though this reduced deposit spreads. Yields on UK corporate lending, which were lower largely as a result of competitive pressure, were only partly offset by higher loan balances, while lower treasury income reflected the effect of rising short-term rates and flattening yield curves on balance sheet management revenues.
In North America, net interest income increased by 6 per cent. Growth in mortgage, card and unsecured personal lending balances was strong, offsetting spread contraction as the cost of funds rose with progressive interest rate rises. Core deposit growth benefited from expansion of the branch
28
Back to Contents
network and the launch of new savings products, including an online savings product which attracted a significant number of new customers. Treasury income from balance sheet management within Corporate, Investment Banking and Markets diminished as the rise in short-term interest rates limited opportunities to profit from placing the liquidity generated from core banking operations over extended periods.
In Hong Kong, net interest income rose by 17 per cent. Rising interest rates reinvigorated demand for traditional savings products, driving increases in personal and commercial savings balances. Coupled with the rise in deposit spreads, which increased in line with interest rates, this led to a sharp rise in net interest income. Mortgage spreads, however, contracted, as the gradual increase in yields during the year, in line with higher rates, was more than offset by rising funding costs. There was little net new lending for residential mortgages as interest rate rises cooled the residential property market in the second half of 2005. Economic growth in mainland China boosted commercial lending to the trade and manufacturing sectors, and property lending also increased. Treasury income remained under pressure, with rising short-term interest rates and a flat yield curve providing limited opportunities to profitably deploy surplus liquidity and increasing funding costs.
In the Rest of Asia-Pacific, net interest income increased by 24 per cent, reflecting business expansion and favourable economic conditions
throughout the region. In the Middle East, buoyant oil-based economies stimulated demand for credit for property and infrastructure projects. Increasing personal and corporate wealth contributed to growth in deposit balances, while interest rate rises led to higher deposit spreads. General economic expansion created demand for consumption credit which boosted credit card lending. For the reasons noted above, treasury income from balance sheet management was weaker.
In South America, the positive economic environment encouraged growth in personal and commercial lending, particularly in credit cards and vehicle finance, which led to a 35 per cent increase in net interest income. A significant rise in customer acquisition and the development of the Losango customer base in Brazil also contributed.
Average interest-earning assets increased by US$23 billion, or 2 per cent, compared with 2004. At constant exchange rates, and excluding the US$84.7 billion of trading assets in 2004, average interest-earning assets increased by 11 per cent, reflecting strong growth in mortgages, personal lending and cards globally, and increased lending in Commercial Banking.
HSBC’s net interest margin was 3.14 per cent in 2005 compared with 3.19 in 2004. For the reasons set out in the opening paragraphs, these figures are not strictly comparable as a result of presentation changes under IFRSs from 1 January 2005.
29
Back to Contents
H S B C H O L D I N G S P L C
Financial Review(continued)
Net fee income
| | Year ended 31 December | |
| |
| |
| | 2005 | | | | 2004 | | | |
| | US$m | | % | | US$m | | % | |
| By geographical region | | | | | | | | |
| Europe | 6,299 | | 43.6 | | 5,980 | | 46.2 | |
| Hong Kong | 1,674 | | 11.6 | | 1,703 | | 13.2 | |
| Rest of Asia-Pacific | 1,340 | | 9.2 | | 1,041 | | 8.0 | |
| North America | 4,606 | | 31.9 | | 3,765 | | 29.1 | |
| South America | 537 | | 3.7 | | 459 | | 3.5 | |
| |
| |
| |
| |
| |
| Net fee income | 14,456 | | 100.0 | | 12,948 | | 100.0 | |
| |
| |
| |
| |
| |
| | Year ended 31 December | |
| |
| |
| | 2005 | | 2004 | |
| | US$m | | US$m | |
| Account services | 3,132 | | 2,779 | |
| Credit facilities1 | 880 | | 1,179 | |
| Remittances | 396 | | 353 | |
| Cards | 4,699 | | 3,987 | |
| Imports/exports | 722 | | 692 | |
| Underwriting | 274 | | 234 | |
| Insurance | 1,082 | | 1,001 | |
| Mortgage servicing | 76 | | 80 | |
| Trust income | 199 | | 203 | |
| Broking income | 1,104 | | 943 | |
| Global custody | 656 | | 564 | |
| Maintenance income on operating leases | 180 | | 190 | |
| Funds under management | 1,831 | | 1,479 | |
| Unit trusts | 388 | | 498 | |
| Corporate finance | 211 | | 193 | |
| Other | 1,656 | | 1,527 | |
| |
| |
| |
| Total fee income | 17,486 | | 15,902 | |
| Less: fee expense | (3,030 | ) | (2,954 | ) |
| |
| |
| |
| Net fee income | 14,456 | | 12,948 | |
| |
| |
| |
| 1 | Under IFRSs from 2005, a higher proportion of fees on credit facilities is dealt with as part of an effective interest rate calculation than previously. This change in accounting affects both the timing of fee income recognition and its presentation in the accounts. In accordance with the transition arrangements to IFRSs, the 2004 comparative figure is presented on the old accounting basis. |
| |
Net fee income of US$14,456 million wasUS$1,508 million or 12 per cent higher than in 2004. Under IFRSs, a greater proportion of fees related to the provision of credit facilities is now amortised and accounted for in net interest income as part of an effective interest rate calculation than was the case before 1 January 2005. This resulted in a reduction in reported net fee income of approximately 4 per cent. Excluding this effect and on an underlying basis, growth in net fee income was 14 per cent and the comments that follow are presented on this basis. The principal drivers of this growth were:
| • | the increase in card fee income, reflecting strong growth in personal credit card sales across the Group and increased transaction volumes; |
| | |
| • | increased customer numbers, higher transactionvolumes, an increase in packaged accounts and |
| | the selective management of tariffs led to an 11 per cent increase in account services fees; |
| | |
| • | in Private Banking, the introduction of a wider range of alternative investment products and services generated higher fee income; |
| | |
| • | increased demand for credit among personal and commercial customers drove mortgage and lending fees up by 11 per cent; and |
| | |
| • | rising equity markets and renewed interest in emerging markets led to higher global custody, broking and asset management fees. |
Offsetting these positive trends, after a strong run of growth, fee income from unit trust sales in Hong Kong fell as rising interest rates made traditional deposit products more attractive.
In Europe, fee income increased by 9 per cent. Higher personal and commercial lending volumes led to a 19 per cent increase in credit fees. Card fee
30
Back to Contents
income rose by 22 per cent, principally in the UK which benefited from higher customer numbers and greater card utilisation. Account service fees increased by 9 per cent, reflecting increased customer numbers, the launch of a new packaged product in the UK and the introduction of a Small Business Tariff in Commercial Banking. Buoyant equity markets benefited custody fees, which grew as a result of both increased asset values and strong new business volumes. Private Banking fee income was 12 per cent higher than in 2004 following increases in client assets under management and transaction volumes.
In Hong Kong, net fee income was in line with 2004. Unit trust fees decreased by 42 per cent as Personal Financial Services customers switched to traditional deposit savings and shorter-term investment products. The launch of 173 new open-ended funds established HSBC as the leading investment service provider in Hong Kong. This, together with the successful attraction of client assets in Private Banking, contributed to a rise in income from funds under management. Credit card fee income increased by 18 per cent, reflecting growth in cardholder spending as HSBC strengthened its position as the largest credit card issuer in Hong Kong. In Commercial Banking, net fees increased as trade services, insurance and lending income rose. However, lower Structured Finance revenues led to reduced Corporate, Investment Banking and Markets fees.
Net fee income in the Rest of Asia-Pacific rose by 28 per cent from higher card transaction volumes and increased account service fees in response to the expansion of the Personal Financial Services
business in the region. Rising equity markets, buoyant regional economies and an increase in personal wealth combined with the launch of new products to increase sales of investment products to personal customers. Client assets in Private Banking also grew. Global Transaction Banking revenues increased in line with transaction volumes following investment in 2004 to expand capabilities. Custody fees grew by 29 per cent as a result of improved investor sentiment and rising local equity markets. Trade services income rose by 13 per cent, reflecting strong trade flows.
In North America, net fee income grew by 21 per cent. Card fee income grew as a result of higher transactions, increased receivables and improvements in the interchange rate, while US mortgage lending fees benefited from lower refinancing prepayments and the consequent release of impairment provisions on mortgage servicing rights. In Mexico, strong growth in the cards base drove higher net fee income and increased transaction volumes delivered higher ATM fees and increased remittance income. Investment banking fees increased in response to HSBC’s success in attracting customers with an expanded range of products.
Net fee income in South America increased by 23 per cent, principally due to higher card, lending and current account servicing fees. Current account fees benefited from increased customer numbers and tariff increases, while lending fee growth was principally related to higher lending volumes. Card fees increased as a result of higher spending in both Brazil and Argentina.
31
Back to Contents
H S B C H O L D I N G S P L C
Financial Review(continued)
Net trading income
| | Year ended 31 December | |
| |
| |
| | 2005 | | | | 2004 | | | |
| | US$m | | % | | US$m | | % | |
| By geographical region | | | | | | | | |
| Europe | 3,036 | | 51.7 | | 997 | | 35.8 | |
| Hong Kong | 546 | | 9.3 | | 659 | | 23.7 | |
| Rest of Asia-Pacific | 860 | | 14.7 | | 494 | | 17.7 | |
| North America | 1,013 | | 17.3 | | 582 | | 20.9 | |
| South America | 409 | | 7.0 | | 54 | | 1.9 | |
| |
| |
| |
| |
| |
| Net trading income | 5,864 | | 100.0 | | 2,786 | | 100.0 | |
| |
| |
| |
| |
| |
| | Year ended 31 December | |
| |
| |
| | 2005 | | 2004 | |
| | US$m | | US$m | |
| Trading activities | 3,884 | | 2,786 | |
| Net interest income on trading activities | 2,208 | | – | |
| Other trading income | | | | |
| Hedge ineffectiveness: | | | | |
| – on cash flow hedges | (96 | ) | – | |
| – on fair value hedges | 14 | | – | |
| Non-qualifying hedges | (146 | ) | – | |
| |
| |
| |
| Net trading income | 5,864 | | 2,786 | |
| |
| |
| |
| | | | | |
Net trading income of US$5,864 million rose by 110 per cent against 2004. Under IFRSs, HSBC’s presentation of trading income for 2005 reclassified into trading income external interest income and dividend income on trading assets and interest expense on trading liabilities.
The external funding of long trading positions is reported separately within ‘Net interest income on trading activities’; in the 2004 comparatives this was included within ‘Interest expense’. The net effect of these adjustments added approximately US$2.9 billion to net trading income.
In the segmental analysis, both net internal funding and net external interest income on trading activities are reported as ‘Net interest income on trading activities’. The offset on the net internal funding is reported as ‘Net interest income’ within the lending customer group. The resulting ‘Net trading income’ line comprises all gains and losses from changes in the fair value of financial assets and financial liabilities classified as held for trading, together with related external interest income and interest expense and dividends received.
Income from trading activities rose, reflecting positive revenue trends on core products within Global Markets following the investment made in client-facing trading capabilities. In Europe, revenues were boosted from higher volumes through electronic trading platforms and from the expansion of primary dealing activity in European government bond markets. In the US, the benefit of favourable movements on credit spreads was compounded by
the non-recurrence of losses experienced in the industrial sector in 2004.
In Asia, volatility in the value of the Korean won against the US dollar, the introduction of a managed float for Malaysian ringgit and the enhancement of capabilities coupled with greater focus on trading regional currencies in the Middle East all contributed to higher foreign exchange revenues. In Europe, the weakening euro and market volatility following the general election in the UK and the French referendum on the EU constitutional treaty afforded opportunities to increase foreign exchange revenues.
Derivatives activity grew strongly as structured product capabilities were added in the credit, equity, and interest rate and foreign exchange areas. Further benefit was derived from the greater focus put on client-driven risk management and the investment made in sales and execution expertise in previous years. In accordance with IFRSs, the inception profits on certain derivative transactions are deferred as described in Note 17 on the Financial Statements.
Further analysis on the trading performance of the Global Markets business is provided in the regional business commentaries on Corporate, Investment Banking and Markets.
32
Back to Contents
Net income from financial instruments designated at fair value
| | Year ended 31 December 2005 | | At 31 December 2005 | |
| |
| |
| |
| | Net income | | Assets | | Liabilities | |
| | US$m | | % | | US$m | | US$m | |
| By geographical region | | | | | | | | |
| Europe | 362 | | 35.0 | | 9,077 | | 27,442 | |
| Hong Kong | (6 | ) | (0.6 | ) | 3,909 | | 3,999 | |
| Rest of Asia-Pacific | 58 | | 5.6 | | 872 | | 300 | |
| North America | 434 | | 42.0 | | – | | 29,934 | |
| South America | 186 | | 18.0 | | 1,188 | | 154 | |
| |
| |
| |
| |
| |
| Net income from financial instrumentsdesignated at fair value | 1,034 | | 100.0 | | 15,046 | | 61,829 | |
| |
| |
| |
| |
| |
| | 2005 | |
| | US$m | |
| Income from assets held to meet liabilities under insurance and investment contracts | 1,760 | |
| Change in fair value of liabilities to customers under investment contracts | (1,126 | ) |
| Movement in fair value of HSBC’s long-term debt issued and related derivatives | 403 | |
| – change in own credit spread on long-term debt | (70 | ) |
| – other changes in fair value | 473 | |
| Income from other instruments designated at fair value | (3 | ) |
| |
| |
| Net income from financial instruments designated at fair value | 1,034 | |
| |
| |
| | | |
HSBC has utilised the ‘Amendment to IAS 39 Financial Instruments: Recognition and Measurement: the Fair Value Option’ with effect from 1 January 2005. HSBC may designate financial instruments at fair value under the option in order to remove or reduce accounting mismatches in measurement or presentation, or where financial instruments are managed and their performance is evaluated on a fair value basis. All income and expense on financial instruments for which the fair value option has been taken is included in this line except for debt securities in issue and related derivatives, where the interest components are shown in interest income.
HSBC has principally used the fair value designation in the following cases:
| • | for certain fixed rate long-term debt issues whose interest rate characteristic has been changed to floating through interest rate swaps as part of a documented interest rate management strategy. Approximately US$51 billion of the Group’s debt issues have been accounted for using the option. The movement in fair value of these debt issues includes the effect of changes in own credit spread and any ineffectiveness in the economic relationship between the related swaps and own debt. Such ineffectiveness arises from the different credit characteristics of the swap and own debt coupled with the sensitivity of the floating leg of the swap to changes in short-term interest rates. In addition, the economic relationship between the swap and own debt can |
| | be affected by relative movements in market factors, such as bond and swap rates, and the relative bond and swap rates at inception. The size and direction of the accounting consequences of changes in own credit spread and ineffectiveness can be volatile from period to period, but do not alter the cash flows envisaged as part of the documented interest rate management strategy; |
| | |
| • | certain financial assets held by insurance operations and managed at fair value to meet liabilities under insurance contracts (approximately US$4 billion of assets); and |
| | |
| • | financial liabilities under investment contracts and the related financial assets, when the change in value of the assets is correlated with the change in value of the liabilities to policyholders (approximately US$8 billion of liabilities and related assets). |
The introduction of the new categories of financial instruments under IAS 39 on 1 January 2005 has led to a change in income statement presentation for the results of HSBC’s life insurance business. In 2005, income from assets designated at fair value and held to meet liabilities under insurance and investment contracts of US$1,760 million is reported under ‘Net income from financial instruments designated at fair value’. In 2004, the corresponding amounts were reported within ‘Net investment income on assets backing policyholders’ liabilities’.
33
Back to Contents
H S B C H O L D I N G S P L C
Financial Review(continued)
Income from assets designated at fair value and held to meet liabilities under insurance and investment contracts during 2005 is correlated with increases in liabilities under the related investment and insurance contracts. Under IFRSs, only investment contracts can be designated as financial instruments. Changes in the liability under these contracts, therefore, like the related assets, are included within the heading ‘Net income from financial instruments designated at fair value’. The
element of the increase in liabilities under insurance contracts that reflects investment performance is reported separately within ‘Net insurance claims incurred and movements in policyholders’ liabilities’. In 2004, investment income on assets backing policyholder liabilities was offset against the movement in policyholders’ liabilities without distinction between insurance and investment contracts.
Gains less losses from financial investments
| | Year ended 31 December | |
| |
| |
| | 2005 | | | | 2004 | | | |
| | US$m | | % | | US$m | | % | |
| By geographical region | | | | | | | | |
| Europe | 439 | | 63.4 | | 154 | | 28.5 | |
| Hong Kong | 108 | | 15.6 | | 175 | | 32.4 | |
| Rest of Asia-Pacific | 18 | | 2.6 | | 17 | | 3.1 | |
| North America | 88 | | 12.8 | | 160 | | 29.7 | |
| South America | 39 | | 5.6 | | 34 | | 6.3 | |
| |
| |
| |
| |
| |
| Gains less losses from financial investments | 692 | | 100.0 | | 540 | | 100.0 | |
| |
| |
| |
| |
| |
| | 2005 | | 2004 | |
| | US$m | | US$m | |
| Net gain from disposal of: | | | | |
| – debt securities | 138 | | 202 | |
| – equity securities | 505 | | 296 | |
| – other financial investments | 7 | | 42 | |
| |
| |
| |
| | 650 | | 540 | |
| Recovery of impairment losses | 42 | | – | |
| |
| |
| |
| Total gains from financial investments | 692 | | 540 | |
| |
| |
| |
The net gain of US$692 million from the disposal of available-for-sale financial investments was 28 per cent higher than in 2004. Lower income from the disposal of debt securities was more than
compensated for by an increase in gains from the disposal of private equity investments, particularly in HSBC’s European operations.
34
Back to Contents
Net earned insurance premiums
| | Year ended 31 December | |
| |
| |
| | 2005 | | | | 2004 | | | |
| | US$m | | % | | US$m | | % | |
| By geographical region | | | | | | | | |
| Europe | 1,599 | | 29.4 | | 1,875 | | 34.9 | |
| Hong Kong | 2,334 | | 42.9 | | 2,247 | | 41.9 | |
| Rest of Asia-Pacific | 155 | | 2.9 | | 97 | | 1.8 | |
| North America | 602 | | 11.1 | | 553 | | 10.3 | |
| South America | 746 | | 13.7 | | 596 | | 11.1 | |
| |
| |
| |
| |
| |
| Net earned insurance premiums | 5,436 | | 100.0 | | 5,368 | | 100.0 | |
| |
| |
| |
| |
| |
| | Year ended 31 December | |
| |
| |
| | 2005 | | 2004 | |
| | US$m | | US$m | |
| Gross insurance premium income | 6,152 | | 6,022 | |
| Reinsurance premiums | (716 | ) | (654 | ) |
| |
| |
| |
| Net earned insurance premiums | 5,436 | | 5,368 | |
| |
| |
| |
| | | | | |
Net earned insurance premiums of US$5,436 million increased by US$68 million compared with 2004. On an underlying basis, net earned insurance premiums were in line with 2004.
Under IFRSs, in 2005 there were changes in the presentation of certain aspects of HSBC’s insurance business, which are now treated as liabilities under investment contracts. Investment income from these products is now reported as ‘Net income from financial investments designated at fair value’. Income that was previously reported as ‘Net earned insurance premiums’ is now taken directly to the balance sheet as customer liabilities, with a corresponding movement in net insurance claims. Net insurance claims have fallen to a greater extent than premium income, due to the additional impact of the reclassification of the fair value movement in respect of liabilities under investment contracts.
The commentary that follows excludes the presentational changes discussed above, and is on an underlying basis.
Higher premium income in Europe was due to an increased uptake of creditor protection products in the UK.
The increase in premiums in Hong Kong reflected HSBC’s continued emphasis on the growth and development
of its insurance proposition. Higher volumes of life assurance new business were directly driven by the launch of new endowment products, augmented by HSBC’s leading position in online personal insurance provision. In addition, greater demand for private medical insurance products was driven by the public response to government deliberation over reforms to healthcare financing. Investment in HSBC’s insurance business included the establishment of a new Commercial Banking insurance division in October, which positively contributed to higher volumes of new business.
In the Rest of Asia-Pacific, the increase in premiums was mainly attributable to growth in the number of personal insurance policies, resulting from an expansion of HSBC’s insurance operations in the region.
In North America, increased cross-sales of insurance products through the branch network, combined with strong sales of other personal insurance-related products, resulted in an increase in net earned insurance premiums.
On an underlying basis, net earned insurance premiums in South America were broadly in line with 2004.
35
Back to Contents
H S B C H O L D I N G S P L C
Financial Review(continued)
Other operating income
| | Year ended 31 December | |
| |
| |
| | 2005 | | | | 2004 | | | |
| | US$m | | % | | US$m | | % | |
| By geographical region | | | | | | | | |
| Europe | 1,603 | | 43.7 | | 1,175 | | 52.4 | |
| Hong Kong | 805 | | 21.9 | | 536 | | 23.9 | |
| Rest of Asia-Pacific | 335 | | 9.1 | | 146 | | 6.5 | |
| North America | 740 | | 20.2 | | 359 | | 16.0 | |
| South America | 188 | | 5.1 | | 28 | | 1.2 | |
| |
| |
| |
| |
| |
| | 3,671 | | 100.0 | | 2,244 | | 100.0 | |
| | | |
| | | |
| |
| Intra-HSBC elimination | (938 | ) | | | (631 | ) | | |
| |
| | | |
| | | |
| Other operating income | 2,733 | | | | 1,613 | | | |
| |
| | | |
| | | |
| | Year ended 31 December | |
| |
| |
| | 2005 | | 2004 | |
| | US$m | | US$m | |
| Rent received | 859 | | 793 | |
| Gain/(loss) on disposal of assets held for resale | 11 | | (93 | ) |
| Valuation gains on investment properties | 201 | | 99 | |
| Gain on disposal of property, plant and equipment, and non-financial investments | 703 | | 267 | |
| Gain on disposal of operating leases | 26 | | – | |
| Change in present value of in-force long-term insurance business | 40 | | 71 | |
| Other | 893 | | 476 | |
| |
| |
| |
| Other operating income | 2,733 | | 1,613 | |
| |
| |
| |
| | | | | |
Other operating income of US$2,733 million was US$1,120 million higher than in 2004. On an underlying basis, other operating income grew by 69 per cent.
The commentary that follows is on an underlying basis.
In Europe, the increase in other operating income was largely driven by increased rental income on the leasing of train rolling stock, higher disposals of assets and a number of private equity realisations.
In Hong Kong, higher other operating income was driven mainly by an increase in market value of the investment property portfolio and the disposal of a leasehold residential property. HSBC’s investment properties are located principally in Hong Kong. Under IFRSs, valuation movements on investment properties are reflected in the income statement rather than through revaluation reserves. Within Hong Kong, the commercial property sector enjoyed good growth as the economy grew and vacant space fell markedly with a corresponding rise in rents.
The increase in other operating income in the Rest of Asia-Pacific was, in part, due to gains
realised on the sale of the Group’s asset management operations in Australia.
Other operating income in North America doubled, in part due to improved revenues from the sale of consumer real estate owned assets, higher rental income and disposals of property, plant and equipment.
In South America, other operating income increased by US$160 million, primarily as a result of the sale of the insurance underwriter HSBC Seguros de Automoveis e Bens Limitada in Brazil, and the receipt of compensation and coverage bonds in Argentina.
HSBC’s rental income mainly arose from leasing in the UK. Europe accounted for 80 per cent of total rental income; the remainder was attributable to North America and Hong Kong.
The increase in the ‘Other’ caption was partly due to the receipt of non-core income in Mexico from the distribution of third-party products through the HSBC network. Higher ‘Other’ income in South America reflected the receipt of compensation and coverage bonds in Argentina and increased revenues from ‘capitalisation’ products in Brazil.
36
Back to Contents
Net insurance claims incurred and movement in policyholders’ liabilities
| | Year ended 31 December | |
| |
| |
| | 2005 | | | | 2004 | | | |
| | US$m | | % | | US$m | | % | |
| By geographical region | | | | | | | | |
| Europe | 818 | | 20.1 | | 1,628 | | 35.1 | |
| Hong Kong | 2,059 | | 50.6 | | 2,154 | | 46.5 | |
| Rest of Asia-Pacific | 166 | | 4.1 | | 82 | | 1.8 | |
| North America | 333 | | 8.2 | | 312 | | 6.7 | |
| South America | 691 | | 17.0 | | 459 | | 9.9 | |
| |
| |
| |
| |
| |
| Net insurance claims incurred and movement in policyholders’ liabilities | 4,067 | | 100.0 | | 4,635 | | 100.0 | |
| |
| |
| |
| |
| |
| | Year ended 31 December | |
| |
| |
| | 2005 | | 2004 | |
| | US$m | | US$m | |
| Gross insurance claims and movement in policyholders’ liabilities | 4,153 | | 5,220 | |
| Reinsurers’ share of claims incurred and movement in policyholders’ liabilities | (86 | ) | (585 | ) |
| |
| |
| |
| Net insurance claims incurred and movement in policyholders’ liabilities | 4,067 | | 4,635 | |
| |
| |
| |
| | | | | |
Net insurance claims incurred and movement in policyholders’ liabilities of US$4,067 million decreased by 12 per cent compared with 2004. On an underlying basis, net insurance claims incurred decreased by 13 per cent.
As with net earned insurance premiums, the primary reason for the reduction was the required reclassification under IFRSs in 2005 of policyholders’ liabilities in respect of long term insurance contracts which were reclassified as ‘Liabilities to customers under investment contracts’. As a consequence, reported net insurance claims incurred and movement in policyholders’ liabilities have reduced.
The majority of HSBC’s non-life insurance business largely relates to the provision of personal insurance products. Minimal impact from hurricane damage in the US and a lack of significant claims events during 2005 resulted in a relatively stable
claims experience, augmented by negligible prior-year reserve development in respect of 2004.
Excluding the effect of the above reclassification, the most significant reduction in net claims occurred in Europe, due to the effect of revised actuarial valuations of existing life insurance policies in the UK life operation.
The reinsurers’ share of claims incurred and movement in policyholder liabilities in 2004 included the renegotiation of a reinsurance treaty in the UK life operation, in which a greater proportion of risk was transferred to the reinsurer. The subsequent implementation of a revised liability valuation system in 2005 reduced the amount of reserves held for liabilities in respect of income protection products, bringing additional benefits in terms of capital efficiency of the UK life operation.
37
Back to Contents
H S B C H O L D I N G S P L C
Financial Review(continued)
Loan impairment charges and other credit risk provisions
| | Year ended 31 December | |
| |
| |
| | 2005 | | | | 2004 | | | |
| | US$m | | % | | US$m | | % | |
| By geographical region | | | | | | | | |
| Europe | 1,929 | | 24.7 | | 1,033 | | 16.8 | |
| Hong Kong | 146 | | 1.9 | | (220 | ) | (3.6 | ) |
| Rest of Asia-Pacific | 134 | | 1.7 | | 89 | | 1.4 | |
| North America | 5,038 | | 64.6 | | 5,022 | | 81.1 | |
| South America | 554 | | 7.1 | | 267 | | 4.3 | |
| |
| |
| |
| |
| |
| Total loan impairment charges and other credit risk provisions | 7,801 | | 100.0 | | 6,191 | | 100.0 | |
| |
| |
| |
| |
| |
| | Year ended 31 December | |
| |
| |
| | 2005 | | | 2004 | |
| | US$m | | | US$m | |
| Loan impairment charges1 | | | | | |
| New allowances | 10,140 | | | 8,873 | |
| Reversal of allowances no longer required | (1,786 | ) | | (1,267 | ) |
| Recoveries of amounts previously written off | (494 | ) | | (913 | ) |
| |
| | |
| |
| | 7,860 | | | 6,693 | |
| Individually assessed allowances | 518 | | | – | |
| Collectively assessed allowances | 7,342 | | | – | |
| General provisions | – | | | (498 | ) |
| Other credit risk provisions | (59 | ) | | (4 | ) |
| |
| | |
| |
| Total loan impairment charges and other credit risk provisions | 7,801 | | | 6,191 | |
| |
| | |
| |
| Customer impaired loans | 11,446 | | | 12,427 | |
| Customer loan impairment allowances | 11,357 | | | 12,542 | |
| | | | | | |
| 1 | Loan impairment charges in 2004 refer to specific provisions. |
| | |
During 2005, the underlying growth in customer lending excluding loans to the financial sector and the impact of grossing adjustments required from 1 January 2005 under IFRSs, was 12 per cent. Personal lending accounted for 63 per cent of this increase, principally in mortgages, credit cards and other personal lending products. At 31 December 2005, personal lending accounted for 56 per cent of the customer loan portfolio, in line with 2004. The proportion of the portfolio attributable to corporate and commercial lending was augmented by the IFRSs adjustment noted above. Residential mortgages comprised 56 per cent of the personal lending portfolio.
The charge for loan impairment adjusts the balance sheet allowance for loan impairment to the level that management deems adequate to absorb actual and inherent losses in the Group’s loan portfolios. The majority of the Group’s loan impairment charges are determined on a portfolio basis, employing statistical calculations using roll rate methodologies. The total charge for loan impairment and other credit risk provisions in 2005 was US$7,801 million compared with a total charge of US$6,191 million in 2004, a rise of 26 per cent. This reflected:
| • | underlying growth in lending of 12 per cent; |
| • | a weakening credit environment in the UK and Brazil but an improved credit experience in the US; and |
| | |
| • | the non-recurrence of the 2004 net release of general provision of US$498 million. |
In the US, the underlying trend in loan impairment charges was favourable compared with 2004, notwithstanding the negative effect on loan impairment charges of Hurricane Katrina and a surge in personal bankruptcies in October ahead of new legislation making such declarations more onerous. This was due to a change in portfolio mix towards higher quality lending and a positive economic environment.
In the UK, credit costs rose following an expansion in personal lending, which was accompanied by an increase in delinquencies as the economy slowed during 2005. This was evidenced by rising personal bankruptcy, caused in part by legislative changes which facilitated debt reconstruction procedures, an increase in unemployment and higher levels of personal debt. In Hong Kong, the credit environment remained benign, with falling bankruptcies contributing to a modest reduction in loan impairment allowances in the personal sector. A fall in releases in the corporate
38
Back to Contents
sector, however, contributed to a modest charge for loan impairment as compared with a net release in 2004. In the Rest of Asia-Pacific, continuing releases and recoveries partly offset the impact of lending growth in the region. Higher charges in the personal sector in Brazil followed intense competitive pressure in the consumer segment, where significant increases in the availability of credit led to customers becoming over-indebted.
The aggregate customer loan impairment allowances at 31 December 2005 of US$11,357 million represented 1.5 per cent of gross customer advances (net of reverse repos, settlement accounts and netting) compared with 2.0 per cent at
31 December 2004. As in 2004, HSBC’s cross-border exposures did not necessitate significant allowances.
Impaired loans to customers were US$11,446 million at 31 December 2005 compared with US$12,427 million at 31 December 2004, largely reflecting the write-off of impaired loans against the provisions held in respect of these loans. At constant exchange rates, impaired loans were 3 per cent lower than 2004 compared with underlying lending growth (excluding lending to the financial sector and settlement accounts) of 12 per cent.
Operating expenses
| | Year ended 31 December | |
| |
| |
| | 2005 | | | | 2004 | | | |
| | US$m | | % | | US$m | | % | |
| By geographical region | | | | | | | | |
| Europe | 12,639 | | 41.4 | | 12,028 | | 44.4 | |
| Hong Kong | 2,867 | | 9.4 | | 2,558 | | 9.4 | |
| Rest of Asia-Pacific | 2,762 | | 9.1 | | 2,087 | | 7.7 | |
| North America | 10,217 | | 33.6 | | 9,032 | | 33.3 | |
| South America | 1,967 | | 6.5 | | 1,413 | | 5.2 | |
| |
| |
| |
| |
| |
| | 30,452 | | 100.0 | | 27,118 | | 100.0 | |
| | | |
| | | |
| |
| Intra-HSBC elimination | (938 | ) | | | (631 | ) | | |
| |
| | | |
| | | |
| Total operating expenses | 29,514 | | | | 26,487 | | | |
| |
| | | |
| | | |
| | Year ended 31 December | |
| |
| |
| | 2005 | | 2004 | |
| | US$m | | US$m | |
| By expense category | | | | |
| Employee compensation and benefits | 16,145 | | 14,523 | |
| Premises and equipment (excluding depreciation) | 2,977 | | 2,615 | |
| General and administrative expenses | 8,206 | | 7,124 | |
| |
| |
| |
| Administrative expenses | 27,328 | | 24,262 | |
| Depreciation of property, plant and equipment | 1,632 | | 1,731 | |
| Amortisation of intangible assets1 | 554 | | 494 | |
| |
| |
| |
| Total operating expenses | 29,514 | | 26,487 | |
| |
| |
| |
| | At 31 December | |
| |
| |
| | 2005 | | 2004 | |
| Staff numbers (full-time equivalent) | | | | |
| Europe | 77,755 | | 74,861 | |
| Hong Kong | 25,931 | | 25,552 | |
| Rest of Asia-Pacific | 55,577 | | 41,031 | |
| North America | 75,926 | | 69,781 | |
| South America | 33,282 | | 32,108 | |
| |
| |
| |
| Total staff numbers | 268,471 | | 243,333 | |
| |
| |
| |
| 1 | Intangible asset amortisation comprises the expensing through the income statement of purchased intangibles such as mortgage servicing rights and customer/merchant relationships and amounts allocated to intangible assets on the fair valuation of assets within acquired business combinations. This latter category principally includes customer relationships. |
| |
Operating expenses of US$29,514 million were US$3,027 million, or 11 per cent, higher than in 2004. On an underlying basis, cost growth was 9 per cent, trailing net operating income growth before
39
Back to Contents
H S B C H O L D I N G S P L C
Financial Review(continued)
impairment charges by 3 percentage points. This resulted in a slight improvement in the cost efficiency ratio to 51 per cent. The three main drivers of cost growth were as follows:
| • | volume expansion in many markets drove both revenue and costs. In Personal Financial Services and Commercial Banking, business expansion drove cost growth of 6 per cent and 4 per cent respectively, though this was exceeded by growth in net operating income before loan impairment charges of 11 per cent and 15 per cent respectively. In Mexico, Turkey and Brazil, cost increases contributed over half of the overall increase, but were significantly exceeded by income growth; |
| | |
| • | HSBC continued to improve productivity in mature markets. In the UK, reorganisations in Personal Financial Services and Commercial Banking in 2004 resulted, in aggregate, in broadly flat costs compared with growth of 10 per cent in net operating income before loan impairment charges. This was delivered through greater utilisation of direct channels, improved training and increased incentives. In Hong Kong, the promotion of cost-efficient delivery channels and greater utilisation of the Group Service Centres contributed to a 6 percentage point improvement in the cost efficiency ratios in Personal Financial Services and Commercial Banking; and |
| | |
| • | following a number of senior hires in 2004 in Corporate, Investment Banking and Markets, subsequent investment was focused on operations and technology, to support revenue growth. Non-staff costs increased by 23 per cent in 2005, with staff costs growing by 14 per cent.The rate of cost growth peaked during the year and the cost efficiency ratio was 2 percentage points better in the second half of the year than the first half, as net operating income before loan impairment charges grew faster than costs. |
The following points are also of note. In Europe, costs included the rebranding of the Group’s operations in France, the refurbishment of 60 UK branches and increased marketing costs. These increases were offset by lower costs in Commercial Banking in the UK following restructuring activity
in 2004. Costs in Corporate, Investment Banking and Markets increased by 9 per cent, reflecting increased staff numbers and investments in technology and infrastructure.
In Hong Kong, higher operating expenses reflected business expansion in Corporate, Investment Banking and Markets, supported by increased staff in the investment banking division and the recruitment of senior relationship managers. This was partly offset by the effect of branch restructuring and increased utilisation of the Group Service Centres in Personal Financial Services, which led to a 4 per cent fall in branch headcount.
Underlying operating expenses in the Rest of Asia-Pacific increased by 31 per cent, reflecting investment in broadening the customer base and the distribution platform. HSBC’s branch network was extended in mainland China, South Korea, and India and additional sales and support staff were recruited in Personal Financial Services and Commercial Banking. Staff numbers also increased in response to the migration of call centre activities to the Group Service Centres in the region. Growth initiatives required investment in infrastructure and technology, and accordingly non-staff costs increased by 39 per cent.
In North America, costs bore a particularly large share of the investment in Corporate, Investment Banking and Markets, reflecting HSBC’s commitment to growing its presence in the region. Costs also reflected the expansion of the network, with the opening of 27 new branches in 2005 and the launch of HSBC’s on-line savings account in the US.
HSBC’s South American operations reported a 17 per cent increase in operating expenses on an underlying basis, partly as a result of higher average staff numbers following the acquisition of consumer finance businesses in 2004. Marketing costs rose following a number of high profile campaigns in 2005, while transactional taxes and incentive payments grew as a direct consequence of higher income.
Productivity improvements and strong disposal gains allowed HSBC to substantially complete its investment in Corporate, Investment Banking and Markets without any deterioration in the Group’s cost efficiency ratio.
40
Back to Contents
Cost efficiency ratios
| | Year ended 31 December | |
| |
| |
| | 2005 | | | 2004 | |
| | % | | | % | |
| HSBC | 51.2 | | | 51.6 | |
| Personal Financial Services | 48.7 | | | 50.1 | |
| Europe | 58.2 | | | 65.7 | |
| Hong Kong | 33.3 | | | 39.2 | |
| Rest of Asia-Pacific | 72.3 | | | 70.8 | |
| North America | 42.8 | | | 41.9 | |
| South America | 66.6 | | | 72.5 | |
| Commercial Banking | 45.5 | | | 50.0 | |
| Europe | 49.9 | | | 55.2 | |
| Hong Kong | 27.2 | | | 33.7 | |
| Rest of Asia-Pacific | 43.8 | | | 42.7 | |
| North America | 45.9 | | | 48.3 | |
| South America | 60.5 | | | 62.9 | |
| | | | | | |
HSBC’s cost efficiency ratio on an underlying basis improved from 52.4 per cent to 51.2 per cent. This was mainly attributable to improvements in productivity in Personal Financial Services and Commercial Banking, as illustrated in the
tables set out above. The deterioration in cost efficiency ratios in the Rest of Asia-Pacific reflected continuing investment to expand HSBC’s presence within the region.
Asset deployment
| | At 31 December | |
| |
| |
| | 2005 | | | | 2004 | | | |
| | US$m | | % | | US$m | | % | |
| Loans and advances to customers | 740,002 | | 49.7 | | 672,891 | | 53.2 | |
| Loans and advances to banks | 125,965 | | 8.5 | | 143,449 | | 11.3 | |
| Trading assets | 232,909 | | 15.6 | | 122,160 | | 9.6 | |
| Financial investments | 182,342 | | 12.2 | | 185,332 | | 14.6 | |
| Derivatives | 73,928 | | 5.0 | | 32,190 | | 2.5 | |
| Goodwill and intangible assets | 33,200 | | 2.2 | | 34,495 | | 2.7 | |
| Other | 101,070 | | 6.8 | | 77,579 | | 6.1 | |
| |
| |
| |
| |
| |
| | 1,489,416 | | 100.0 | | 1,268,096 | | 100.0 | |
| | | |
| | | |
| |
| Hong Kong Government certificates of indebtedness | 12,554 | | | | 11,878 | | | |
| |
| | | |
| | | |
| | 1,501,970 | | | | 1,279,974 | | | |
| |
| | | |
| | | |
| Loans and advances to customers include: | | | | | | | | |
| –reverse repos | 14,610 | | | | 29,346 | | | |
| –settlement accounts | 2,142 | | | | 13,819 | | | |
| Loans and advances to banks include: | | | | | | | | |
| –reverse repos | 24,754 | | | | 36,543 | | | |
| –settlement accounts | 2,669 | | | | 6,086 | | | |
| | | | | | | | | |
HSBC’s total assets (excluding Hong Kong Government certificates of indebtedness) at 31 December 2005 were US$1,489.4 billion, an increase of US$221.3 billion or 17 per cent since 31 December 2004. Acquisitions, including Metris in the US, added just over US$6 billion to total assets. The accounting effect of the adjustments required under IFRSs from 1 January 2005 added a further US$89.8 billion, to which the largest single contributor was the grossing up of certain customer
lending and current account relationships in the UK, mainly in Corporate, Investment Banking and Markets, which would previously have been offset in reported loans and advances and customer accounts. At 31 December 2005, this grossing change resulted in a US$44.2 billion increase in customer loans and advances. At constant exchange rates and excluding these changes, total assets grew by 17 per cent.
At 31 December 2005, HSBC’s balance sheet remained highly liquid. The proportion of assets
41
Back to Contents
H S B C H O L D I N G S P L C
Financial Review(continued)
deployed in customer advances fell to 50 per cent, largely due to expansion of the fixed income business and the reclassification of certain financial instruments to ‘Trading assets’. Customer advances increased by 10 per cent, driven by lending to finance consumer spending, mortgage financing and cards. These were areas in which HSBC grew market share, particularly through competitive pricing and marketing initiatives in parts of Asia-Pacific, the UK and the US. Growth in corporate lending was concentrated in Commercial Banking, and largely reflected trade financing, project finance in the Middle East and expansion of the customer base in the UK, particularly in the property, distribution and services sectors. At constant exchange rates and excluding the grossing change mentioned above, net loans and advances to customers grew by 10 per cent in 2005, of which acquisitions represented 1 per cent, or US$5.3 billion.
At 31 December 2005, assets held by HSBC as custodian amounted to US$3,242 billion, 15 per cent higher than the US$2,819 billion held at 31 December 2004. At constant exchange rates, growth was 22 per cent. Custody is the safekeeping and administration of securities and financial instruments on behalf of others.
Complementing this is HSBC’s funds under administration business. At 31 December 2005, the value of funds held under administration by the Group amounted to US$779 billion, 28 per cent higher than the US$610 billion held at 31 December 2004. At constant exchange rates, growth was 37 per cent.
Trading assets and financial investments
Trading assets principally consist of debt and equity instruments acquired for the purpose of benefiting from short-term price movements. Securities classified as held-for-trading are carried in the balance sheet at fair value with movements in fair value reflected within the income statement.
Trading assets of US$232.9 billion were 91 per cent higher than at 31 December 2004. This increase was primarily driven by the reclassification of certain financial instruments from loans and advances to ‘Trading assets’, coupled with the expansion of the fixed income platform in Global Markets.
Financial investments include debt and equity instruments that are classified as available-for-sale or, to a very small extent, held to maturity. The available-for-sale investments essentially represent the deployment of the Group’s surplus deposits and
may be disposed of either to manage liquidity or in response to reinvestment opportunities arising from favourable movements in economic indicators, such as interest rates, foreign exchange rates and equity prices. They are carried at fair value with unrealised gains and losses from movements thereon reported in equity until disposal. On disposal, the accumulated unrealised gain or loss is recognised through the income statement and reported as ‘Gains less losses from financial investments’.
Financial investments of US$182.3 billion were broadly in line with the balance at 31 December 2004. Unrealised gains included in the valuation of equities amounted to US$1.1 billion.
Funds under management
Funds under management of US$561 billion were US$85 billion, or 18 per cent, higher than at 31 December 2004. Growth reflected strong inflows of net new money and good investment performances in both Group Investment Businesses and Private Banking, partly offset by the translation effect of the strengthening US dollar on sterling and euro-denominated funds.
In Group Investment Businesses, net new money trebled to US$33 billion compared with the previous year. Included in this, HSBC’s Sinopia subsidiary in France grew funds under management by 35 per cent, particularly in alternative funds. HSBC continues to manage some of the world’s largest active equity funds investing in India and China with US$4.7 billion and US$1.9 billion of assets, respectively, at the end of 2005. In Private Banking, increased recognition of HSBC in the private banking sector and an expanded product range contributed to strong funds inflows.
At 31 December 2005, HSBC’s GroupInvestment Businesses, including affiliates, reported funds under management of US$272 billion, and Private Banking reported funds under management of US$202 billion. Other funds under management, of which the main constituent was a corporate trust business in Asia, comprised US$87 billion.
Client assets, which are a measure of overall Private Banking volumes and include funds under management, cash deposits and fiduciary deposits, rose by 13 per cent to US$282 billion.
42
Back to Contents
| | 2005 | | | 2004 | |
| | US$bn | | | US$bn | |
| Funds under management | | | | | |
| At 1 January | 476 | | | 386 | |
| Net new money | 63 | | | 64 | |
| – Bank of Bermuda | – | | | 22 | |
| – Other | 63 | | | 42 | |
| Value change | 45 | | | 19 | |
| Exchange and other | (23 | ) | | 7 | |
| |
| | |
| |
| At 31 December | 561 | | | 476 | |
| |
| | |
| |
Economic profit
HSBC’s internal performance measures include economic profit, a calculation which compares the return on financial capital invested in HSBC by its shareholders with the cost of that capital. HSBC prices its cost of capital internally and the difference between that cost and post-tax profit attributable to ordinary shareholders represents the amount of economic profit generated. Economic profit is used by management as a means to decide where to allocate resources so that they will be most productive. In order to concentrate on external factors rather than measurement bases, HSBC emphasises the trend in economic profit within business units rather than absolute amounts. In light of the current levels of world interest rates, and taking into account its geographical and customer group diversification, HSBC believes that its true cost of capital on a consolidated basis is 10 per cent. HSBC plans to continue using this rate until the end of the current five-year strategic plan in 2008 in order to ensure consistency and comparability.
The effect of adopting IFRSs on the Group’s financial results has been reflected in the derivation of economic profit shown below. Under IFRSs, there is no periodic amortisation charge for goodwill arising on acquisitions. This removes the need for adjustments to post-tax profit for economic profit purposes. In addition, the Group has modified its calculation of economic profit for the following:
| • | Unrealised gains and losses on effective cash flow hedges. Gains and losses on the effective hedging of future cash flows essentially reflect the opportunity profit or loss on decisions taken to fix in monetary terms the yield on assets or the cost of liabilities when measured against current market rates. Given that these amounts are ultimately reflected in profit for the period, they are excluded from average invested capital upon which the capital charge is based. |
| | |
| • | Unrealised gains and losses on available-for-sale securities. These are excluded from the measure of average invested capital for the purpose of computing economic profit because (i) the gains or losses represent unrealised profit which may be offset or reversed in the future, and (ii) there is accounting asymmetry in that the offsetting profit or loss on the liabilities taken out to fund these assets is not reflected. |
On this basis, economic profit increased by US$1,318 million or 31 per cent compared with 2004, reflecting improved underlying profitability.
Economic profit
| | Year ended 31 December | |
| |
| |
| | 2005 | | | | 2004 | | | |
| | US$m | | % | 1 | US$m | | % | 1 |
| Average total shareholders’ equity | 89,589 | | | | 79,391 | | | |
| Add: Goodwill previously amortised or written off | 8,172 | | | | 8,172 | | | |
| Less: Property revaluation reserves | (1,092 | ) | | | (1,092 | ) | | |
| Reserves for unrealised gains on effective hedges | (315 | ) | | | – | | | |
| Reserves for unrealised gains on available-for-sale securities | (1,294 | ) | | | – | | | |
| Preference shares | (351 | ) | | | – | | | |
| |
| | | |
| | | |
| Average invested capital2 | 94,709 | | | | 86,471 | | | |
| |
| | | |
| | | |
| Return on invested capital3 | 15,060 | | 15.9 | | 12,918 | | 15.0 | |
| Benchmark cost of capital | (9,471 | ) | (10.0 | ) | (8,647 | ) | (10.0 | ) |
| |
| |
| |
| |
| |
| Economic profit/spread | 5,589 | | 5.9 | | 4,271 | | 5.0 | |
| |
| |
| |
| |
| |
| 1 | Expressed as a percentage of average invested capital. |
| 2 | Average invested capital is measured as average total shareholders’ equity after adding back goodwill previously written-off directly to reserves, deducting preference shares issued by HSBC Holdings and deducting average reserves for unrealised gains/(losses) on effective hedges and available-for-sale securities. This measure reflects capital initially invested and subsequent profit. |
| 3 | Return on invested capital is based on the profit attributable to ordinary shareholders of the parent company. |
43
Back to Contents
| H S B C H O L D I N G S P L C |
| |
| |
| Financial Review (continued) |
| | |
| | |
| Analysis by customer group and by geographical region |
|
By customer group
Profit before tax
| | Year ended 31 December 2005 | | |
| |
| | |
| | | | | | | | Corporate, | | | | | |
| | | | | |
| | |
| | Personal | | | | | | Investment | | | | | | | | | Inter- | | | | | |
| | Financial | | | Commercial | | | Banking & | | | Private | | | | | | segment | | | | | |
| | Services | | | Banking | | | Markets | | | Banking | | | Other | 6 | | elimination | | | Total | | |
| Total | US$m | | | US$m | | | US$m | | | US$m | | | US$m | | | US$m | | | US$m | | |
| | | | | | | | | | | | | | | | | | | | | | |
| Net interest income/(expense) | 23,351 | | | 6,310 | | | 3,001 | | | 848 | | | (472 | ) | | (1,704 | ) | | 31,334 | | |
| Net fee income | 7,313 | | | 2,876 | | | 2,967 | | | 1,080 | | | 220 | | | – | | | 14,456 | | |
| Trading income/(expense) excluding net interest | | | | | | | | | | | | | | | | | | | | | |
| income | 360 | | | 150 | | | 2,919 | | | 317 | | | (90 | ) | | – | | | 3,656 | | |
| Net interest income/ (expense) on trading activities | 214 | | | (3 | ) | | 306 | | | – | | | (13 | ) | | 1,704 | | | 2,208 | | |
| | | | | | | | | | | | | | | | | | | | | | |
| Net trading income/(expense)1 | 574 | | | 147 | | | 3,225 | | | 317 | | | (103 | ) | | 1,704 | | | 5,864 | | |
| Net income/(expense) from financial instruments | | | | | | | | | | | | | | | | | | | | | |
| designated at fair value . | 574 | | | (12 | ) | | 67 | | | (1 | ) | | 406 | | | – | | | 1,034 | | |
| Gains less losses from financial investments | 19 | | | 9 | | | 475 | | | 45 | | | 144 | | | – | | | 692 | | |
| Dividend income | 16 | | | 9 | | | 79 | | | 9 | | | 42 | | | – | | | 155 | | |
| | | | | | | | | | | | | | | | | | | | | | |
| Net earned insurance premiums | 4,864 | | | 236 | | | 76 | | | – | | | 260 | | | – | | | 5,436 | | |
| Other operating income | 729 | | | 327 | | | 1,621 | | | 68 | | | 2,634 | | | (2,646 | ) | | 2,733 | | |
| |
| | |
| | |
| | |
| | |
| | |
| | |
| | |
| Total operating income | 37,440 | | | 9,902 | | | 11,511 | | | 2,366 | | | 3,131 | | | (2,646 | ) | | 61,704 | | |
| Net insurance claims2 | (3,716 | ) | | (118 | ) | | (54 | ) | | – | | | (179 | ) | | – | | | (4,067 | ) | |
| |
| | |
| | |
| | |
| | |
| | |
| | |
| | |
| Net operating income before loan impairment | | | | | | | | | | | | | | | | | | | | | |
| charges and other credit risk provisions | 33,724 | | | 9,784 | | | 11,457 | | | 2,366 | | | 2,952 | | | (2,646 | ) | | 57,637 | | |
| Loan impairment charges and other credit risk | | | | | | | | | | | | | | | | | | | | | |
| provisions | (7,537 | ) | | (547 | ) | | 272 | | | 12 | | | (1 | ) | | – | | | (7,801 | ) | |
| |
| | |
| | |
| | |
| | |
| | |
| | |
| | |
| Net operating income | 26,187 | | | 9,237 | | | 11,729 | | | 2,378 | | | 2,951 | | | (2,646 | ) | | 49,836 | | |
| Total operating expenses | (16,427 | ) | | (4,453 | ) | | (6,838 | ) | | (1,466 | ) | | (2,976 | ) | | 2,646 | | | (29,514 | ) | |
| |
| | |
| | |
| | |
| | |
| | |
| | |
| | |
| Operating profit | 9,760 | | | 4,784 | | | 4,891 | | | 912 | | | (25 | ) | | – | | | 20,322 | | |
| Share of profit in associates and joint ventures | 144 | | | 177 | | | 272 | | | – | | | 51 | | | – | | | 644 | | |
| |
| | |
| | |
| | |
| | |
| | |
| | |
| | |
| Profit before tax | 9,904 | | | 4,961 | | | 5,163 | | | 912 | | | 26 | | | – | | | 20,966 | | |
| |
| | |
| | |
| | |
| | |
| | |
| | |
| | |
| | % | | | % | | | % | | | % | | | % | | | | | | % | | |
| Share of HSBC’s profit before tax | 47.2 | | | 23.7 | | | 24.6 | | | 4.4 | | | 0.1 | | | | | | 100.0 | | |
| Cost efficiency ratio | 48.7 | | | 45.5 | | | 59.7 | | | 62.0 | | | 100.8 | | | | | | 51.2 | | |
| | US$m | | | US$m | | | US$m | | | US$m | | | US$m | | | | | | US$m | | |
| Selected balance sheet data3 | | | | | | | | | | | | | | | | | | | | | |
| Loans and advances to customers (net) | 398,884 | | | 142,041 | | | 169,435 | | | 27,749 | | | 1,893 | | | | | | 740,002 | | |
| Total assets4 | 471,760 | | | 175,120 | | | 755,056 | | | 59,827 | | | 27,653 | | | | | | 1,489,416 | | |
| Customer accounts | 321,240 | | | 148,106 | | | 202,361 | | | 67,205 | | | 507 | | | | | | 739,419 | | |
| Loans and advances to banks (net)5 | | | | | | | 106,123 | | | | | | | | | | | | | | |
| Trading assets, financial assets designated at fair | | | | | | | | | | | | | | | | | | | | | |
| value, and financial investments5 | | | | | | | 373,787 | | | | | | | | | | | | | | |
| Deposits by banks5 | | | | | | | 65,853 | | | | | | | | | | | | | | |
| For footnotes, see page 55. | | | | | | | | | | | | | | | | | | | | | |
44
Back to Contents
| | Year ended 31 December 2004 | |
| |
| |
| | | | | | Corporate, | | | | | | | | | |
| | Personal | | | | Investment | | | | | | Inter- | | | |
| | Financial | | Commercial | | Banking & | | Private | | | | segment | | | |
| | Services | | Banking | | Markets | | Banking | | Other | 6 | elimination | | Total | |
| Total | US$m | | US$m | | US$m | | US$m | | US$m | | US$m | | US$m | |
| | | | | | | | | | | | | | | |
| Net interest income | 21,422 | | 4,875 | | 3,994 | | 718 | | 90 | | – | | 31,099 | |
| Net fee income | 6,406 | | 2,645 | | 2,764 | | 962 | | 171 | | – | | 12,948 | |
| Trading income | 320 | | 234 | | 1,935 | | 257 | | 40 | | – | | 2,786 | |
| Net investment income on assets backing policy- | | | | | | | | | | | | | | |
| holders’ liabilities | 635 | | 324 | | 9 | | – | | 44 | | – | | 1,012 | |
| Gains less losses from financial investments | 79 | | 6 | | 197 | | 39 | | 219 | | – | | 540 | |
| Dividend income | 16 | | 37 | | 548 | | 5 | | 16 | | – | | 622 | |
| Net earned insurance premiums | 3,652 | | 1,072 | | 86 | | – | | 558 | | – | | 5,368 | |
| Other operating income | 360 | | 513 | | 1,029 | | 24 | | 2,050 | | (2,363 | ) | 1,613 | |
| |
| |
| |
| |
| |
| |
| |
| |
| Total operating income | 32,890 | | 9,706 | | 10,562 | | 2,005 | | 3,188 | | (2,363 | ) | 55,988 | |
| Net insurance claims2 | (2,953 | ) | (1,264 | ) | (59 | ) | – | | (359 | ) | – | | (4,635 | ) |
| |
| |
| |
| |
| |
| |
| |
| |
| Net operating income before loan impairment | | | | | | | | | | | | | | |
| charges and other credit risk provisions | 29,937 | | 8,442 | | 10,503 | | 2,005 | | 2,829 | | (2,363 | ) | 51,353 | |
| Loan impairment charges and other credit risk | | | | | | | | | | | | | | |
| provisions | (6,500 | ) | (200 | ) | 499 | | 11 | | (1 | ) | – | | (6,191 | ) |
| |
| |
| |
| |
| |
| |
| |
| |
| Net operating income | 23,437 | | 8,242 | | 11,002 | | 2,016 | | 2,828 | | (2,363 | ) | 45,162 | |
| Total operating expenses | (15,009 | ) | (4,220 | ) | (5,809 | ) | (1,319 | ) | (2,493 | ) | 2,363 | | (26,487 | ) |
| |
| |
| |
| |
| |
| |
| |
| |
| Operating profit | 8,428 | | 4,022 | | 5,193 | | 697 | | 335 | | – | | 18,675 | |
| Share of profit in associates and joint ventures | 69 | | 35 | | 95 | | – | | 69 | | – | | 268 | |
| |
| |
| |
| |
| |
| |
| |
| |
| Profit before tax | 8,497 | | 4,057 | | 5,288 | | 697 | | 404 | | – | | 18,943 | |
| |
| |
| |
| |
| |
| |
| |
| |
| | | | | | | | | | | | | | | |
| | % | | % | | % | | % | | % | | | | % | |
| Share of HSBC’s profit before tax | 44.9 | | 21.4 | | 27.9 | | 3.7 | | 2.1 | | | | 100.0 | |
| Cost efficiency ratio | 50.1 | | 50.0 | | 55.3 | | 65.8 | | 88.1 | | | | 51.6 | |
| | | | | | | | | | | | | | | |
| | US$m | | US$m | | US$m | | US$m | | US$m | | | | US$m | |
| Selected balance sheet data3 | | | | | | | | | | | | | | |
| Loans and advances to customers (net) | 370,576 | | 130,160 | | 145,353 | | 24,463 | | 2,339 | | | | 672,891 | |
| Total assets4 | 441,114 | | 159,251 | | 584,779 | | 56,751 | | 26,201 | | | | 1,268,096 | |
| Customer accounts | 319,485 | | 137,801 | | 177,449 | | 57,780 | | 557 | | | | 693,072 | |
| The following assets and liabilities were significant | | | | | | | | | | | | | | |
| to Corporate, Investment Banking and Markets: | | | | | | | | | | | | | | |
| Loans and advances to banks (net) | | | | | 128,032 | | | | | | | | | |
| Trading assets, financial assets designated at fair | | | | | | | | | | | | | | |
| value, and financial investments | | | | | 252,459 | | | | | | | | | |
| Deposits by banks | | | | | 80,443 | | | | | | | | | |
| For footnotes, see page 55. | | | | | | | | | | | | | | |
45
Back to Contents
| H S B C H O L D I N G S P L C |
| |
| |
| Financial Review (continued) |
| | |
| | |
Personal Financial Services
Profit before tax
| | Year ended
31 December | | |
| |
| | |
| | 2005 | | | 2004 | | |
| | US$m | | | US$m | | |
| | | | | | | |
| Net interest income | 23,351 | | | 21,422 | | |
| Net fee income | 7,313 | | | 6,406 | | |
| Trading income excluding net interest income | 360 | | | 320 | | |
| Net interest income on trading activities | 214 | | | – | | |
| Net trading income1 | 574 | | | 320 | | |
Net income from financial instruments designated at fair value | 574 | | | – | | |
Net investment income on assets backing policyholders’ liabilities | – | | | 635 | | |
Gains less losses from financial investments | 19 | | | 79 | | |
| Dividend income | 16 | | | 16 | | |
| Net earned insurance premiums | 4,864 | | | 3,652 | | |
| Other operating income | 729 | | | 360 | | |
| |
| | |
| | |
| Total operating income | 37,440 | | | 32,890 | | |
| Net insurance claims2 | (3,716 | ) | | (2,953 | ) | |
| |
| | |
| | |
Net operating income before loan impairment charges and other credit risk provisions | 33,724 | | | 29,937 | | |
Loan impairment charges and other credit risk provisions | (7,537 | ) | | (6,500 | ) | |
| |
| | |
| | |
| Net operating income | 26,187 | | | 23,437 | | |
| Total operating expenses | (16,427 | ) | | (15,009 | ) | |
| |
| | |
| | |
| Operating profit | 9,760 | | | 8,428 | | |
Share of profit in associates and joint ventures | 144 | | | 69 | | |
| |
| | |
| | |
| Profit before tax | 9,904 | | | 8,497 | | |
| |
| | |
| | |
| By geographical region | | | | | | |
| Europe | 1,932 | | | 1,621 | | |
| Hong Kong | 2,628 | | | 2,063 | | |
| Rest of Asia-Pacific | 377 | | | 336 | | |
| North America | 4,761 | | | 4,384 | | |
| South America | 206 | | | 93 | | |
| |
| | |
| | |
| Profit before tax | 9,904 | | | 8,497 | | |
| |
| | |
| | |
| | | | | | | |
| | % | | | % | | |
| Share of HSBC’s profit before tax | 47.2 | | | 44.9 | | |
| Cost efficiency ratio | 48.7 | | | 50.1 | | |
| | | | | | | |
| | US$m | | | US$m | | |
| Selected balance sheet data3 | | | | | | |
Loans and advances to customers (net) | 398,884 | | | 370,576 | | |
| Total assets4 | 471,760 | | | 441,114 | | |
| Customer accounts | 321,240 | | | 319,485 | | |
| For footnotes, see page 55. | | | | | | |
Business highlights
| • | Pre-tax profits from Personal Financial Services grew by 17 per cent to US$9,904 million, driven by improved performances in the core operations in the UK, North America and Hong Kong. On an underlying basis, growth in profit before tax was 15 per cent, and markedly strong rates of growth were achieved in Turkey, Canada, the Middle East and Brazil. |
| | |
| • | The importance of direct sales channels continued to increase globally. HSBC conducted 183 million transactions online in 2005, an increase of 17 per cent on 2004. Online sales to personal customers rose by 65 per cent and online revenues by 71 per cent. |
| | |
| • | The number of customers using HSBC Premier grew for the sixth consecutive year, to 1.3 million, an increase of 17 per cent compared with 2004. HSBC Premier was launched in Bangladesh and South Korea during the year, and is now available in 35 countries. |
| | |
| Europe |
| | |
| • | In the UK, investment in marketing and a range of campaigns, including the first ever January sale for a UK bank, heightened brand awareness and increased market share in most product lines. In France, marketing campaigns accompanying the rebranding to ‘HSBC’ by CCF and four subsidiary banks generated sales growth in mortgages, current accounts and savings products. In Turkey, marketing helped increase customer numbers by 7 per cent to 2.2 million. |
| | |
| • | HSBC’s mortgage products in the UK were highly rated: HSBC was named ‘Best Value National Bank’ for mortgage borrowing over two, five and ten years by What Mortgage magazine for the fourth year running, and ‘Best Bank’ for mortgages by Mortgage magazine. First Direct was also named ‘Best Direct Lender’ over two and ten years by What Mortgage magazine, and ‘Best Offset Mortgage’ by Mortgage magazine. |
| | |
| • | The UK business was further streamlined, with the product range simplified and strengthened and the rollout of a branch refurbishment programme initially covering 60 major branches. In the UK, the credit card operations of HFC Bank and HSBC Bank were merged. Good progress was made with the integration and expansion of M&S Money. |
46
Back to Contents
| • | HSBC’s UK current account offering was relaunched in 2005, providing a range of simplified propositions tailored to customer segments, including HSBC’s first packaged bank account in the UK market. Personal Finance Magazine awarded HSBC ‘Best Current Account’ provider during the year. |
| | |
| Hong Kong |
| | |
| • | HSBC built on its leading position with the rollout of 25 new Financial Management Centres, providing investment planning services to non-Premier customers. |
| | |
| • | HSBC was named by the Asian Banker as the ‘Best Retail Bank’ in Hong Kong and Asia in 2004, and its web site was rated by Global Finance as the ‘Best Consumer Internet Bank’ in Hong Kong in 2005. |
| | |
| • | HSBC maintained its position as the largest credit card issuer in Hong Kong, increasing the number of cards in circulation by 15 per cent and its market share of spending from 50.5 per cent to 52.1 per cent. |
| | |
| • | A new innovative retirement planning solution was launched to meet the retirement planning needs of customers of all ages. HSBC was one of the first banks in Hong Kong to offer such a comprehensive service. |
| | |
| Rest of Asia-Pacific |
| | |
| • | Customer acquisition was a core focus again in 2005, with customer numbers growing by 22 per cent to 7.0 million. HSBC continued to enhance distribution channels with a 43 per cent increase in the sales force. Seven new branches were opened in South Korea, Vietnam and India. |
| | |
| • | Customer loans grew by 20 per cent, driven by the new customer acquisition programmes. In particular, the number of credit cards in circulation grew by 34 per cent, or 1.6 million cards, to 6.3 million. |
| | |
| • | In mainland China, HSBC maintains the largest branch network amongst foreign banks, and opened ten new branches and sub-branches in 2005. Average deposit balances grew by 80 per cent and income by 61 per cent. |
| | |
| North America |
| | |
| • | HSBC continued to expand its banking presence in the US by opening 27 new branches. The introduction of the HSBC Premier Savings account and the Online Savings Account, |
| | HSBC’s first nationwide savings product, generated total new deposit balances of US$2.5 billion and added over 30,000 new customers to HSBC. |
| | |
| • | Other niche marketing initiatives introduced by HSBC in the US included the launch of deposit generation programmes focused on the Chinese and Hispanic communities. Together these garnered US$589 million of new deposits. |
| | |
| • | An agreement was reached for HSBC to offer American Express branded credit cards in the US. This will allow HSBC to expand its product range and offer broader choice, value and convenience to customers. |
| | |
| • | HSBC completed its acquisition of Metris on 1 December 2005, and is now the 5th largest issuer of MasterCard and Visa cards in the US. This will strengthen HSBC’s capabilities to serve the full spectrum of credit card customers. |
| | |
| • | HSBC acquired Invis Inc, the largest independent mortgage broker in Canada. |
| | |
| • | In Mexico, strong asset and liability growth continued. Average deposit balances grew by 15 per cent, due in part to the success of the 'Tu Cuenta' product, the only integrated financial services product of its kind in the country. Since its launch in February, over 600,000 new accounts have been opened. Product innovation, improved customer service and competitive pricing led to strong growth in mortgages, vehicle financing and payroll loans. |
| | |
| • | HSBC Mexico’s cards in circulation grew by 80 per cent to over one million, following an active marketing campaign, and strong sales to the existing customer base. |
| | |
| South America |
| | |
| • | In Brazil, the integration of two consumer finance businesses purchased in 2004 into the Losango operating model was completed during 2005. |
| | |
| • | A number of new products were introduced in 2005. In Brazil, HSBC launched Consórcio de Imóveis, a lending product aimed at funding property purchases, and a new credit card, Cartão Solidariedade, which enables donations to be made to a children’s charity in lieu of an annual fee. In Argentina, a co-branded C&A credit card was launched in November, with over 25,000 cards issued in the following month. |
47
Back to Contents
| H S B C H O L D I N G S P L C |
| |
| |
| Financial Review (continued) |
| | |
| | |
Commercial Banking
Profit before tax
| | Year ended
31 December | | |
| |
| | |
| | 2005 | | | 2004 | | |
| | US$m | | | US$m | | |
| | | | | | | |
| Net interest income | 6,310 | | | 4,875 | | |
| Net fee income | 2,876 | | | 2,645 | | |
| Trading income excluding net interest income | 150 | | | 234 | | |
| Net interest expense on trading activities | (3 | ) | | – | | |
| Net trading income1 | 147 | | | 234 | | |
| Net expense from financial instruments designated at fair | | | | | | |
| value | (12 | ) | | – | | |
| Net investment income on assets backing policyholders’ | | | | | | |
| liabilities | – | | | 324 | | |
| Gains less losses from financial investments | 9 | | | 6 | | |
| Dividend income | 9 | | | 37 | | |
| Net earned insurance premiums | 236 | | | 1,072 | | |
| Other operating income | 327 | | | 513 | | |
| |
| | |
| | |
| Total operating income | 9,902 | | | 9,706 | | |
| Net insurance claims2 | (118 | ) | | (1,264 | ) | |
| |
| | |
| | |
| Net operating income before loan impairment charges and | | | | | | |
| other credit risk provisions | 9,784 | | | 8,442 | | |
| Loan impairment charges and other credit risk provisions | (547 | ) | | (200 | ) | |
| |
| | |
| | |
| Net operating income | 9,237 | | | 8,242 | | |
| Total operating expenses | (4,453 | ) | | (4,220 | ) | |
| |
| | |
| | |
| Operating profit | 4,784 | | | 4,022 | | |
| Share of profit in associates and joint ventures | 177 | | | 35 | | |
| |
| | |
| | |
| Profit before tax | 4,961 | | | 4,057 | | |
| |
| | |
| | |
| By geographical region | | | | | | |
| Europe | 1,939 | | | 1,663 | | |
| Hong Kong | 955 | | | 904 | | |
| Rest of Asia-Pacific | 818 | | | 483 | | |
| North America | 1,064 | | | 848 | | |
| South America | 185 | | | 159 | | |
| |
| | |
| | |
| Profit before tax | 4,961 | | | 4,057 | | |
| |
| | |
| | |
| | | | | | | |
| | % | | | % | | |
| Share of HSBC’s profit before tax | 23.7 | | | 21.4 | | |
| Cost efficiency ratio | 45.5 | | | 50.0 | | |
| | | | | | | |
| | US$m | | | US$m | | |
| Selected balance sheet data3 | | | | | | |
| Loans and advances to customers (net) | 142,041 | | | 130,160 | | |
| Total assets4 | 175,120 | | | 159,251 | | |
| Customer accounts | 148,106 | | | 137,801 | | |
| For footnotes, see page 55. | | | | | | |
Business highlights
| • | Pre-tax profit was 22 per cent higher than last year, driven by strong growth in net operating income before loan impairment, which more than compensated for the non-recurrence of the loan provision releases that benefited results in 2004. On an underlying basis, profits increased by 19 per cent. |
| | |
| • | Customer numbers rose by 10 per cent to 2.5 million as customers were attracted by HSBC’s competitive positioning. Loans and advances to customers and customer account balances increased by 9 per cent and 7 per cent respectively, with significant expansion in the UK and Hong Kong. Interest spreads increased in Hong Kong, North America and the Rest of Asia-Pacific following interest rate rises. |
| | |
| • | The commercial customer base was refined and now comprises four categories: Corporate, Mid-Market (together, ‘MME’), Small and Micro businesses (collectively, ‘SME’), building upon the successful business segmentation model in existence in Hong Kong and the UK. |
| | |
| • | Cross-border sales were strengthened by the launch of new cross-border referral programmes and the global implementation of online cross-border account opening and referral tools. |
| | |
| • | HSBC’s competitiveness in meeting the needs of SMEs was enhanced through the introduction of pre- approved loans and lines of credit in Hong Kong, the launch of scored lending in India, the introduction of small business accounts in Singapore and the expansion of business banking centres in Malaysia. |
| | |
| • | Customers responded favourably to enhanced online banking services, with numbers registered for internet banking increasing by 24 per cent and online transaction volumes during the year up by 116 per cent. |
| | |
| • | Business insurance and wealth management sales continued to advance, supported by two new dedicated insurance sales teams in Hong Kong. A worksite marketing programme launched in Mexico, and a programme across the Rest of Asia-Pacific to increase the sale of structured investment products, were also notable successes. |
| | |
| • | Having enhanced its systems, HSBC retained its position as ‘Best in Cash Management in Asia and the Middle East’, its number two ranking in the world and its top five ranking for Europe, North America, Latin America and Africa in Euromoney’s 2005 Cash Management Survey. |
48
Back to Contents
| • | Finance Asia named HSBC ‘Best Trade Bank in Asia’ for the ninth successive year, reflecting HSBC’s continuing development of new products and services. |
| | |
| Europe |
| | |
| • | In the UK, HSBC continued to focus on business start-ups and customers switching from other banks to grow its customer base. As a result, more customers moved their banking relationships from other financial institutions to HSBC than to any other established high street bank. |
| | |
| • | Investment in customer service as a differentiating factor continued, with the recruitment of further relationship managers, the improved deployment and training of over 600 dedicated small business specialists and a substantial investment in mobile working technology. |
| | |
| • | Recognising lack of scale, HSBC outsourced the processing of its UK vehicle finance contract hire product to a third party provider, Lex Vehicle Leasing. As well as releasing capital, this provided HSBC with access to Lex’s IT systems and expertise to enable a greater range of services to be offered to customers. |
| | |
| • | In France, the most experienced relationship managers focused on the largest 350 MME customers in 2004, resulting in income growth from this segment of 17 per cent in 2005. In addition, a centralised and specialised franchising team was established to increase penetration of this significant and expanding market. |
| | |
| • | A substantial investment was made to grow the Commercial Banking franchise in Turkey with the launch of SME banking, invoice discounting and commercial cards. |
| | |
| Hong Kong |
| | |
| • | Loan balances increased as HSBC added relationship managers and launched two new pre-approved lending products, the ‘Pre-approved Small Business Loan’ and the ‘Pre-approved Business Revolving Credit’ account. |
| | |
| • | The first ever Commercial Banking brand awareness campaign was launched in 2005. SME sales outlets were also rebranded as ‘SME Centres’ to strengthen the brand identity and more closely align HSBC with this market segment. |
| • | Supporting customer service, a new SME call centre, employing 100 staff and incorporating a dedicated sales hotline, took over four million calls in 2005. |
| | |
| Rest of Asia-Pacific |
| | |
| • | Regional relationship management offering a single point of contact across several countries was implemented in the Middle East. A similar approach was adopted in Hong Kong, mainland China and Taiwan. |
| | |
| • | The sales distribution network was expanded in key growth markets. In mainland China, three new branches and an additional sub-branch, with commercial banking presence, were opened. In South Korea, four commercial banking centres were established to extend HSBC’s presence in the MME market. |
| | |
| • | Across the region, several liability products were tailored for individual markets. HSBC in Bangladesh designed an innovative deposit scheme, ‘Double Your Money’, and in Taiwan HSBC launched a ‘Cash Marketing Campaign’. |
| | |
| North America |
| | |
| • | HSBC’s market share of small business customers in New York City increased, supported by the success of the BusinessSmart Value package which added 41,000 new accounts in 2005. HSBC Bank USA was voted the No. 1 Small Business Administration lender in New York State. |
| | |
| • | The MME and commercial real estate businesses continued to expand in Boston, Miami, Los Angeles, San Francisco and Seattle, with new offices established in Washington DC, Philadelphia and New Jersey. |
| | |
| • | HSBC Mexico was awarded ‘The best initiative in support of small and medium business owners in Mexico’ by the Mexican Minister of Economy for ‘Estimulo’, a tailor-made financial services package. |
| | |
| South America |
| | |
| • | 40 commercial centres with 100 specialised staff were established to expand sales activity and address the banking needs of over 12,500 larger SMEs in Brazil. |
| | |
| • | In Argentina, customer service was improved through the launch of an in-house internet banking solution, PC Banking Empresas, and a dedicated inbound call centre. |
| | |
| | |
49
Back to Contents
| H S B C H O L D I N G S P L C |
| |
| |
| Financial Review (continued) |
| | |
| | |
Corporate, Investment Banking and Markets
Profit before tax
| | Year ended 31 December | | |
| |
| | |
| | 2005 | | | 2004 | | |
| | US$m | | | US$m | | |
| | | | | | | |
| Net interest income | 3,001 | | | 3,994 | | |
| Net fee income | 2,967 | | | 2,764 | | |
| Trading income excluding net interest income | 2,919 | | | 1,935 | | |
| Net interest income on trading activities | 306 | | | – | | |
| Net trading income1 | 3,225 | | | 1,935 | | |
| Net income from financial instruments designated at fair | | | | | | |
| value | 67 | | | – | | |
| Net investment income on assets backing policyholders’ | | | | | | |
| liabilities | – | | | 9 | | |
| Gains less losses from financial investments | 475 | | | 197 | | |
| Dividend income | 79 | | | 548 | | |
| Net earned insurance premiums | 76 | | | 86 | | |
| Other operating income | 1,621 | | | 1,029 | | |
| |
| | |
| | |
| Total operating income | 11,511 | | | 10,562 | | |
| Net insurance claims2 | (54 | ) | | (59 | ) | |
| |
| | |
| | |
| Net operating income before loan impairment charges | | | | | | |
| and othercredit risk provisions | 11,457 | | | 10,503 | | |
| | | | | | | |
| Net recovery of loan impairment charges and other | | | | | | |
| credit risk provisions | 272 | | | 499 | | |
| |
| | |
| | |
| Net operating income | 11,729 | | | 11,002 | | |
| Total operating expenses | (6,838 | ) | | (5,809 | ) | |
| |
| | |
| | |
| Operating profit | 4,891 | | | 5,193 | | |
| Share of profit in associates and joint ventures | 272 | | | 95 | | |
| |
| | |
| | |
| Profit before tax | 5,163 | | | 5,288 | | |
| |
| | |
| | |
| By geographical region | | | | | | |
| Europe | 2,114 | | | 1,668 | | |
| Hong Kong | 922 | | | 1,603 | | |
| Rest of Asia-Pacific | 1,207 | | | 942 | | |
| North America | 774 | | | 966 | | |
| South America | 146 | | | 109 | | |
| |
| | |
| | |
| Profit before tax | 5,163 | | | 5,288 | | |
| |
| | |
| | |
| | % | | | % | | |
| Share of HSBC’s profit before tax | 24.6 | | | 27.9 | | |
| Cost efficiency ratio | 59.7 | | | 55.3 | | |
| For footnotes, see page 55. | | | | | | |
| | | | | | | |
| | | | | | | |
Business highlights
| • | Increased revenues marginally failed to cover increased costs arising from continuing investment to expand product capabilities and customer penetration. Notwithstanding a decline in balance sheet management revenues of US$1 billion and a US$1 billion increase in costs, pre-tax profit only fell by 2 per cent to US$5,163 million. On an underlying basis, pre-tax profits fell by 4 per cent. Earnings grew in key product areas and client sectors where HSBC has invested, particularly in foreign-exchange options, project and export finance, and securities services, demonstrating the success of the strategy to diversify revenue streams. Operating expenses increased by 18 per cent. The rate of cost growth peaked during the year as the investment phase of the Corporate, Investment Banking and Markets development plan neared completion. Some 3,600 additional people were recruited during 2005 and 2,220 people departed. The cost efficiency ratio was 2 percentage points better in the second half of the year than in the first half as net operating income before loan impairment charges grew faster than costs. |
| | |
| • | As the investment-led phase of the development strategy moved to implementation, the competitive advantage of HSBC’s geographic network and emerging market capabilities was underscored by client demand for cross-border services. HSBC advised on several cross-border acquisitions, notably outward investment by clients in the Middle East and inward investment into mainland China. The parallel development of primary debt finance and secondary debt trading capabilities allowed HSBC, acting as bookrunner, to help 792 clients in 65 countries to raise US$867.8 billion in bond and loan financing in the public markets. In Global Transaction Banking, HSBC won several new multi-country mandates. Foreign exchange trading benefited from strong income streams from emerging markets. |
| | |
| • | In Global Markets, client revenues and market share rose in response to new investment. Money market and balance sheet management income fell due to rising short-term US dollar and Hong Kong dollar interest rates, together with the flattening and in some cases inversion of yield curves in the US, Hong Kong, the UK, eurozone, Mexico and Brazil. |
| | |
| | Credit and rates revenue rose. HSBC is now a primary dealer in 10 European government bond markets compared with eight at the end of 2004. Cash equities commission revenue rose, reversing a four- year declining trend. |
50
Back to Contents
Management view of total operating income
| | Year ended 31 December | |
| |
| |
| | 2005 | | 2004 | |
| | US$m | | US$m | |
| | | | | |
| Global Markets | | | | |
| Money market and balance sheet | 1,238 | | 2,376 | |
| Foreign exchange | 1,200 | | 1,125 | |
| Credit and rates | 931 | | 655 | |
| Structured derivatives | 387 | | 386 | |
| Equities | 324 | | 256 | |
| |
| |
| |
| | 4,080 | | 4,798 | |
| |
| |
| |
| Corporate and Investment Banking | | | | |
| Global Investment Banking | 1,022 | | 877 | |
| Corporate and Institutional Banking and Global | | | | |
| Transaction Banking | 3,433 | | 2,937 | |
| Private Equity | 648 | | 207 | |
| |
| |
| |
| | 5,103 | | 4,021 | |
| Other1 | 2,328 | | 1,743 | |
| |
| |
| |
| Total operating income | 11,511 | | 10,562 | |
| |
| |
| |
| | | | | |
| Selected balance sheet data3 | | | | |
| Loans and advances to: | | | | |
| – customers (net) | 169,435 | | 145,353 | |
| – banks (net) | 106,123 | | 128,032 | |
| Total assets4 | 755,056 | | 584,779 | |
| Customer accounts | 202,361 | | 177,449 | |
| Trading assets, financial instruments designated | | | | |
| at fair value, and financial investments | 373,787 | | 252,459 | |
| Deposits by banks | 65,853 | | 80,443 | |
| | | | | |
| 1 | ‘Other’ includes the Corporate, Investment Banking and Markets business of HSBC Trinkaus & Burkhardt, Group Investment Businesses, and net interest earned on free capital held in Corporate, Investment Banking and Markets not assigned to products. |
| For other footnotes, see page 55. |
| |
| | Structured derivatives activity rose strongly as a significant upgrade and expansion of the quantitative skill base and investment in systems allowed HSBC to complete higher volumes of derivatives transactions in 2005. In accordance with IFRSs, the inception profits on certain types of these transactions are deferred as described in Note 17 on the Financial Statements. |
| | |
| | The strong momentum in client revenue was confirmed by industry surveys. In the Euromoney foreign exchange survey, HSBC ranked second in FX options in 2005, up from fourth in 2004 and eighth in 2003. In addition, HSBC was ranked fourth in foreign exchange trading market share, retained the premier ranking in Hong Kong and was voted, for the first time, the best foreign exchange bank in London. |
| • | In Corporate and Institutional Banking, which includes relationship management and lending activities, market conditions and competitive pressures resulted in spread contraction in all regions. This was mitigated by a continued focus on fee-generating business, cost management and a favourable credit environment. HSBC introduced a number of balance sheet management initiatives including the implementation of a detailed review of HSBC’s portfolio and a balance sheet securitisation programme to enhance return on capital employed. |
| | |
| • | In Global Investment Banking, an increase in market share reflected HSBC’s success in developing customer relationships. In debt capital markets, HSBC was ranked fifth in the international bond league table, up from seventh in 2004. In project and export finance, Dealogic ranked HSBC first in the Global Financial Adviser, Project Finance category. |
| | |
| | In the advisory business, there was continued momentum in both developed and emerging markets. Notable transactions included advising Dubai International Capital on its US$1.5 billion acquisition of Tussauds Group and acting as adviser to Autoroutes Paris-Rhin-Rhone on its privatisation. |
| | |
| | Significant equity-related transactions, in which HSBC acted as joint global coordinator, were the US$2.8 billion Link Real Estate Investment Trust (‘REIT’) IPO, the largest ever real estate offering and REIT IPO in the world, and the US$2.2 billion IPO by the Bank of Communications. |
| | |
| • | In Global Transaction Banking, a move to offering a wider range of integrated solutions to clients played a large part in winning Unilever’s first Asian pan- regional cash management mandate, covering 17 countries and territories. |
| | |
| • | At the end of December 2005, Group Investment Businesses managed US$272 billion of assets, a 33 per cent increase on 2004, driven mainly by US$33 billion of net flows from clients. Assets in money market products exceeded US$60 billion. HSBC manages two of the world's largest active equity funds investing in India and China with US$4.7 billion and US$1.9 billion assets, respectively. HSBC’s presence in mainland China was strengthened with an asset management joint venture with Shanxi Trust and Investment Corporation Limited. |
51
Back to Contents
| H S B C H O L D I N G S P L C |
| |
| |
| Financial Review (continued) |
| | |
| | |
Private Banking
Profit before tax
| | Year ended 31 December | |
| |
| |
| | 2005 | | 2004 | |
| | US$m | | US$m | |
| | | | | |
| Net interest income | 848 | | 718 | |
| Net fee income | 1,080 | | 962 | |
| Net trading income1 | 317 | | 257 | |
| Net expenses from financial instruments designated | | | | |
| at fair value | (1 | ) | – | |
| Gains less losses from financial investments | 45 | | 39 | |
| Dividend income | 9 | | 5 | |
| Other operating income | 68 | | 24 | |
| |
| |
| |
| Total operating income | 2,366 | | 2,005 | |
| Net insurance claims2 | – | | – | |
| |
| |
| |
| Net operating income before loan impairment charges | | | | |
| and othercredit risk provisions | 2,366 | | 2,005 | |
| Net recovery of loan impairment charges and other | | | | |
| credit risk provisions | 12 | | 11 | |
| |
| |
| |
| Net operating income | 2,378 | | 2,016 | |
| Total operating expenses | (1,466 | ) | (1,319 | ) |
| |
| |
| |
| Operating profit | 912 | | 697 | |
| Share of profit in associates and joint ventures | – | | – | |
| |
| |
| |
| Profit before tax | 912 | | 697 | |
| |
| |
| |
| By geographical region | | | | |
| Europe | 539 | | 438 | |
| Hong Kong | 190 | | 131 | |
| Rest of Asia-Pacific | 78 | | 60 | |
| North America | 104 | | 68 | |
| South America | 1 | | – | |
| |
| |
| |
| Profit before tax | 912 | | 697 | |
| |
| |
| |
| | | | | |
| | % | | % | |
| Share of HSBC’s profit before tax | 4.4 | | 3.7 | |
| Cost efficiency ratio | 62.0 | | 65.8 | |
| | | | | |
| | US$m | | US$m | |
| Selected balance sheet data3 | | | | |
| Loans and advances to customers (net) | 27,749 | | 24,463 | |
| Total assets4 | 59,827 | | 56,751 | |
| Customer accounts | 67,205 | | 57,780 | |
| For footnotes, see page 55. | | | | |
| | | | | |
| | | | | |
Business highlights
| • | Pre-tax profit grew by 31 per cent compared with 2004, supported by strong growth in client assets and lending. On an underlying basis, growth was also 31 per cent. Operational efficiency was increased by greater utilisation of Group Service Centres and the cost efficiency ratio was reduced by 4 percentage points to 62 per cent. |
| | |
| • | HSBC won a number of awards in the Euromoney third annual private banking survey. In the global private banking awards, notable wins included ‘1st Private Bank for Trust Services’ for the second year running, ‘1st Private Bank for Islamic Services’ and ‘1st Private Bank for Inheritance and Succession Planning’. Overall, HSBC improved one place to ‘3rd best Private Bank’. |
| | |
| • | Client assets increased by 13 per cent to US$282 billion, benefiting from net new money of US$35.7 billion in 2005. On an underlying basis, growth was 20 per cent. Discretionary and advisory asset growth benefited from the establishment of dedicated investment advisory resources in all major regions, and also from growth in the Strategic Investment Solutions product, in which invested assets increased by US$1.9 billion to US$2.9 billion during the year. |
| | |
| • | HSBC also continued to develop alternative investment products. Total client investment in hedge funds reached US$29.5 billion, and HSBC Private Bank was named the third largest global provider of hedge funds by capital invested by Institutional Investor magazine. |
| | |
| • | Dedicated teams working with Commercial Banking, Personal Financial Services and Corporate, Investment Banking and Markets produced a significant increase in intra-Group referrals in 2005. A closer alignment with the latter was also reflected in the manufacture of tailored structured products for private banking clients. Bank of Bermuda’s private banking operations were fully integrated during the year. |
| | |
| • | The lending book grew strongly, as clients sought to leverage their investments in the low interest rate environments in North America, Europe and Asia. In the UK and US, lending book growth was also buoyed by strong growth in higher value mortgages. |
52
Back to Contents
| Europe |
| | |
| • | In France, HSBC Private Bank’s subsidiary, Louvre Gestion, was awarded second and fourth places for overall performance over five and three years respectively by La Tribune – Standard & Poor’s. A number of HSBC’s individual funds also won awards in the Lipper Fund Awards – France. |
| | |
| • | Private Banking expanded its onshore business through the launch of regional offices in the UK and France, bringing HSBC closer to customers and strengthening referrals with the retail bank. Regional offices were also launched in Russia, and preparations were made for further expansion in 2006. |
| | |
| • | Client assets increased by 12 per cent, or 22 per cent on an underlying basis, with net new money reaching US$23.4 billion. |
| | |
| • | Euromoney awarded HSBC ‘Best Private Bank … in Monaco … for Ultra High Net Worth Clients’. |
| Asia |
| | |
| • | Client assets increased by 17 per cent, or 19 per cent on an underlying basis. Investment in Taiwan and Japan continued and HSBC expanded its support of clients from mainland China. Onshore operations were launched in Dubai and India during the year, and the expansion of the discretionary managed team aided growth of 47 per cent in this asset class. |
| | |
| • | HSBC won awards from Euromoney as ‘1st for Inheritance and Succession Planning’, ‘1st for Tax Guidance and Services’ and ‘1st for Trust Services’ in Asia. |
| | |
| North America |
| | |
| • | HSBC extended its Private Banking capabilities through front office recruitment in New York, California and Florida, and expanded its Wealth and Tax advisory business in Philadelphia through recruitment and a small acquisition. |
| | |
| • | The business was streamlined through restructuring, delivering front office synergies with Corporate, Investment Banking and Markets, cross-selling with Commercial Banking was enhanced, and a single management structure was put in place to cover the Hispanic customer base. |
| | |
| | |
53
Back to Contents
| H S B C H O L D I N G S P L C |
| |
| |
| Financial Review (continued) |
| | |
| | |
Other6
Profit before tax
| | Year ended 31 December | |
| |
| |
| | 2005 | | 2004 | |
| | US$m | | US$m | |
| | | | | |
| Net interest (expense)/income | (472 | ) | 90 | |
| Net fee income | 220 | | 171 | |
| Trading (expense)/income excluding net interest income | (90 | ) | 40 | |
| Net interest expense on trading activities | (13 | ) | – | |
| Net trading income1 | (103 | ) | 40 | |
| Net income from financial instruments designated at fair | | | | |
| value | 406 | | – | |
| Net investment income on assets backing policyholders’ | | | | |
| liabilities | – | | 44 | |
| Gains less losses from financial investments | 144 | | 219 | |
| Dividend income | 42 | | 16 | |
| Net earned insurance premiums | 260 | | 558 | |
| Other operating income | 2,634 | | 2,050 | |
| |
| |
| |
| Total operating income | 3,131 | | 3,188 | |
| Net insurance claims2 | (179 | ) | (359 | ) |
| |
| |
| |
| Net operating income before loan impairment charges | | | | |
| and othercredit risk provisions | 2,952 | | 2,829 | |
| Loan impairment charges and other credit risk | | | | |
| provisions | (1 | ) | (1 | ) |
| |
| |
| |
| Net operating income | 2,951 | | 2,828 | |
| Total operating expenses | (2,976 | ) | (2,493 | ) |
| |
| |
| |
| Operating profit/(loss) | (25 | ) | 335 | |
| Share of profit in associates and joint ventures | 51 | | 69 | |
| |
| |
| |
| Profit before tax | 26 | | 404 | |
| |
| |
| |
| By geographical region | | | | |
| Europe | (168 | ) | 366 | |
| Hong Kong | (178 | ) | 129 | |
| Rest of Asia-Pacific | 94 | | 26 | |
| North America | 169 | | (196 | ) |
| South America | 109 | | 79 | |
| |
| |
| |
| Profit before tax | 26 | | 404 | |
| |
| |
| |
| | % | | % | |
| Share of HSBC’s profit before tax | 0.1 | | 2.1 | |
| Cost efficiency ratio | 100.8 | | 88.1 | |
| | US$m | | US$m | |
| Selected balance sheet data3 | | | | |
| Loans and advances to customers (net) | 1,893 | | 2,339 | |
| Total assets4 | 27,653 | | 26,201 | |
| Customer accounts | 507 | | 557 | |
| For footnotes, see page 55. | | | | |
| | | | | |
| | | | | |
Notes
| • | For a description of the main items reported under ‘Other’, see footnote 6 on page 55. |
| | |
| • | Under IFRSs, from 1 January 2005 dividends payable on preference securities classified as liabilities have been recognised as an interest expense within ‘Other’ in 2005. In 2004, these dividends were shown as non- equity minority interests. This change decreased net interest income by US$653 million compared with 2004. It also affected inter-regional dividends and this increased net interest income in Europe by US$387 million, which was offset at a Group level by an equivalent reduction in net interest income in Hong Kong. |
| | |
| • | The US Technology Centre incurred and recharged US$1,100 million of expense, 18 per cent higher than 2004 as a result of increased activity in support of both increased global IT requirements and the development of new capabilities in Corporate, Investment Banking and Markets. |
| | |
| • | Costs incurred in the Group Service Centres outside the US increased by 75 per cent to US$302 million, reflecting the ongoing migration of processing and call centre activities. |
| | |
| • | Gains on the sale and revaluation of property and investments in Hong Kong were US$65 million lower than in 2004, at US$263 million. |
| | |
| • | Increases in US interest rates led to higher net interest income earnings on centrally held US dollar denominated investments in Hong Kong and the Rest of Asia-Pacific. |
| | |
| • | The reclassification of the Brazilian insurance business from Other to Personal Financial Services led to a US$16 million reduction in profit before tax, though significant variances were observed on operating income and operating expenses lines. |
| | |
| • | In Argentina, HSBC received compensation bonds in 2005 related to the pesification in 2002. This, together with reduced Amparos provisions and other items related to the sovereign debt default, led to a US$17 million increase in profit before tax. |
| | |
| • | Movement in the fair value of own debt designated at fair value was US$386 million, arising in North America and Europe. No movement was reported in 2004. |
54
Back to Contents
By geographical region
In the analysis of profit by geographical region that follows, operating income and operating expenses include intra-HSBC items of US$938 million (2004: US$631 million).
Profit before tax
| | Year ended 31 December | |
| |
| |
| | 2005 | | | | 2004 | | | |
| | US$m | | % | | US$m | | % | |
| | | | | | | | | |
| Europe | 6,356 | | 30.3 | | 5,756 | | 30.4 | |
| Hong Kong | 4,517 | | 21.5 | | 4,830 | | 25.5 | |
| Rest of Asia-Pacific | 2,574 | | 12.3 | | 1,847 | | 9.8 | |
| North America | 6,872 | | 32.8 | | 6,070 | | 32.0 | |
| South America | 647 | | 3.1 | | 440 | | 2.3 | |
| |
| |
| |
| |
| |
| | 20,966 | | 100.0 | | 18,943 | | 100.0 | |
| |
| |
| |
| |
| |
Total assets3,4
| | At 31 December | |
| |
| |
| | 2005 | | | | 2004 | | | |
| | US$m | | % | | US$m | | % | |
| | | | | | | | | |
| Europe | 636,703 | | 42.7 | | 545,557 | | 43.0 | |
| Hong Kong4 | 222,822 | | 15.0 | | 213,458 | | 16.8 | |
| Rest of Asia-Pacific | 142,014 | | 9.5 | | 120,530 | | 9.5 | |
| North America | 463,143 | | 31.1 | | 371,183 | | 29.3 | |
| South America | 24,734 | | 1.7 | | 17,368 | | 1.4 | |
| |
| |
| |
| |
| |
| | 1,489,416 | | 100.0 | | 1,268,096 | | 100.0 | |
| |
| |
| |
| |
| |
Basis of preparationThe results are presented in accordance with the accounting policies used in the preparation of HSBC’s consolidated financial statements. HSBC’s operations are closely integrated and, accordingly, the presentation of customer group data includes internal allocations of certain items of income and expense. These allocations include the costs of certain support services and head office functions, to
the extent that these can be meaningfully attributed to operational business lines. While such allocations have been made on a systematic and consistent basis, they necessarily involve a degree of subjectivity.
Where relevant, income and expense amounts presented include the results of inter-segment funding as well as inter-company and inter-business line transactions. All such transactions are undertaken on arm’s length terms.
| Footnotes to ‘Analysis by customer group and by geographical region’ |
| |
| 1 | Net trading income comprises all gains and losses from changes in the fair value of financial assets and financial liabilities classified as held for trading, together with related external and internal interest income and interest expense, and dividends received. |
| 2 | Net insurance claims incurred and movement in policyholders’ liabilities. |
| 3 | Third party only. |
| 4 | Excluding Hong Kong Government certificates of indebtedness. |
| 5 | Assets and liabilities recorded here were significant to Corporate, Investment Banking and Markets. |
| 6 | The main items reported under ‘Other’ are the income and expenses of wholesale insurance operations, certain property activities, unallocated investment activities including hsbc.com, centrally held investment companies, movements in the fair value of own debt designated at fair value, and HSBC’s holding company and financing operations. The results include net interest earned on free capital held centrally and operating costs incurred by the head office operations in providing stewardship and central management services to HSBC. Net operating income of the Group’s wholesale insurance operations amounted to US$460 million in 2005 (2004: US$511 million). ‘Other’ also includes the costs incurred by the Group Service Centres and Shared Service Organisations and associated recoveries. |
55
Back to Contents
H S B C H O L D I N G S P L C
Financial Review (continued)
Europe
Profit/(loss) before tax by country within customer group
| | Year ended 31 December | |
| |
| 2005 | | | 2004 | |
| US$m | | | US$m | |
| | | | | |
| Personal Financial Services | 1,932 | | | 1,621 | |
| United Kingdom1 | 1,475 | | | 1,340 | |
| France2 | 223 | | | 205 | |
| Turkey | 134 | | | 29 | |
| Other | 100 | | | 47 | |
| | | | | | |
| Commercial Banking | 1,939 | | | 1,663 | |
| United Kingdom | 1,495 | | | 1,258 | |
| France2 | 278 | | | 272 | |
| Turkey | 39 | | | 25 | |
| Other | 127 | | | 108 | |
| | | | | | |
| Corporate, Investment Banking and Markets | 2,114 | | | 1,668 | |
| United Kingdom | 1,186 | | | 1,021 | |
| France2 | 472 | | | 337 | |
| Turkey | 92 | | | 88 | |
| Other | 364 | | | 222 | |
| | | | | | |
| Private Banking | 539 | | | 438 | |
| United Kingdom | 171 | | | 135 | |
| France2 | 7 | | | (22 | ) |
| Switzerland | 254 | | | 203 | |
| Other | 107 | | | 122 | |
| | | | | | |
| Other | (168 | ) | | 366 | |
| United Kingdom | (47 | ) | | 477 | |
| France2 | (147 | ) | | (123 | ) |
| Other | 26 | | | 12 | |
| | | | | | |
| Total | 6,356 | | | 5,756 | |
| United Kingdom | 4,280 | | | 4,231 | |
| France2 | 833 | | | 669 | |
| Turkey | 265 | | | 142 | |
| Switzerland | 254 | | | 203 | |
| Other | 724 | | | 511 | |
| | |
| 1 | In the UK, the Personal Financial Services business primarily comprises HSBC Bank and the UK subsidiary of HSBC Finance. The latter’s results included within UK Personal Financial Services in 2005 were a loss of US$76 million (2004: profit US$97 million). |
| 2 | France primarily comprises the domestic operations of HSBC France and the Paris branch of HSBC Bank. |
56
Back to Contents
Profit before tax
| | Year ended 31 December | |
| |
| 2005 | | | 2004 | |
| Europe | US$m | | | US$m | |
| | | | | | |
| Net interest income | 8,221 | | | 9,098 | |
| Net fee income | 6,299 | | | 5,980 | |
| Net trading income | 3,036 | | | 997 | |
| Net income from financial instruments designated at fair value | 362 | | | – | |
| Net investment income on assets backing policyholders’ liabilities | – | | | 571 | |
| Gains less losses from financial investments | 439 | | | 154 | |
| Dividend income | 63 | | | 558 | |
| Net earned insurance premiums | 1,599 | | | 1,875 | |
| Other operating income | 1,603 | | | 1,175 | |
| |
| | |
| |
| Total operating income | 21,622 | | | 20,408 | |
| Net insurance claims incurred and movement in policyholders’ liabilities | (818 | ) | | (1,628 | ) |
| |
| | |
| |
| Net operating income before loan impairment charges and other credit risk provisions | 20,804 | | | 18,780 | |
| Loan impairment charges and other credit risk provisions | (1,929 | ) | | (1,033 | ) |
| |
| | |
| |
| Net operating income | 18,875 | | | 17,747 | |
| Total operating expenses | (12,639 | ) | | (12,028 | ) |
| |
| | |
| |
| Operating profit | 6,236 | | | 5,719 | |
| Share of profit in associates and joint ventures | 120 | | | 37 | |
| |
| | |
| |
| Profit before tax | 6,356 | | | 5,756 | |
| |
| | |
| |
| | % | | | % | |
| Share of HSBC’s profit before tax | 30.3 | | | 30.4 | |
| Cost efficiency ratio | 60.8 | | | 64.0 | |
| Year-end staff numbers (full-time equivalent) | 77,755 | | | 74,861 | |
| | | | | | |
| | US$m | | | US$m | |
| Selected balance sheet data1 | | | | | |
| Loans and advances to customers (net) | 312,537 | | | 277,560 | |
| Loans and advances to banks (net) | 44,360 | | | 56,049 | |
| Financial investments, trading assets, and financial instruments designated at fair value | 146,777 | | | 139,183 | |
| Total assets | 636,703 | | | 545,557 | |
| Deposits by banks | 47,202 | | | 55,720 | |
| Customer accounts | 334,200 | | | 292,568 | |
| | | | | | |
Growth in theUK economy remained subdued during 2005 at 1.8 per cent, the lowest rate since 1992. Consumer spending and housing activity slowed sharply during the first nine months of the year, staging a minor recovery in the final quarter. Doubts remained over the strength of consumer spending, given the rise in unemployment in ten consecutive months and reduced confidence in the housing market. The boost to the economy from government spending in recent years was also not expected to be as significant. The recovery in exports was maintained, helped in large part by the strength of the global economy, though the industrial sector continued to struggle. Industrial output contracted in 2005 for the fourth time in the past five years. Companies remained reluctant to invest despite a general profit recovery, stronger balance
sheets and an impressive equity market performance. Although commodity prices rose sharply, inflation remained well contained at around 2 per cent and wage growth eased. In response to weaker economic activity, the Bank of England cut interest rates in August to 4.5 per cent.
Theeurozone experienced lacklustre economic growth in 2005 of 1.4 per cent, although momentum accelerated during the course of the year. With consumer spending growth remaining subdued, the strongest areas were exports and fixed investment. There was, as usual, considerable divergence between countries: Italy and Portugal saw hardly any economic growth while Spain, Greece and Ireland grew by over 3 per cent. Growth in France slowed from 2.1 per cent in 2004 to 1.4 per cent in 2005 but both investment and consumer spending revived a
57
Back to Contents
H S B C H O L D I N G S P L C
Financial Review (continued)
little in the second half of the year. Weak domestic demand continued to constrain German gross domestic product (‘GDP’) growth, which slowed from 1.1 per cent in 2004 to 0.9 per cent in 2005, despite a strong increase in exports, particularly capital goods. Eurozone inflation averaged a little over 2 per cent in 2005, with higher energy prices boosting inflation by around 0.5 per cent. The European Central Bank raised interest rates from 2.0 per cent to 2.25 per cent in early December, the first increase for almost five years.
The performance of the Turkish economy in 2005 remained very positive. GDP grew by approximately 5.5 per cent, while inflation continued to fall, to 7.7 per cent in December from 9.7 per cent a year earlier. Economic policy remained anchored by the government’s agreement with the IMF. Turkey’s current account deficit, which reached US$23.1 billion, or approximately 6.3 per cent of GDP in 2005, is increasingly being financed by longer-term foreign direct investment into the country, which should help reduce Turkey’s vulnerability to a sudden reversal in short-term capital flows.
European operations reported a pre-tax profit of US$6,356 million compared with US$5,756 million in 2004, an increase of 10 per cent. IFRSs changes to the treatment of preference share dividends led to a US$275 million reduction in pre-tax profits. On an underlying basis, pre-tax profits grew by 25 per cent and represented around 30 per cent of HSBC’s equivalent total profits. In the UK, strong revenue growth in Personal Financial Services and good cost discipline were partially tempered by a weaker credit experience. A quadrupling of pre-tax profits in Turkey reflected the strong growth in customer acquisition and retention achieved in the country. In Commercial Banking, HSBC’s strong service proposition attracted a 5 per cent growth in customers with consequent growth in deposits, receivables and service revenues. Corporate, Investment Banking and Markets delivered strong revenue growth in Europe, notably in client related trading activities, Global Transaction Banking and securities services. In aggregate, European Corporate, Investment Banking and Markets’ revenues grew by 15 per cent against a 9 per cent increase in operating expenses.
The commentary that follows is on an underlying basis.
Personal Financial Servicesreported a pre-tax profit of US$1,932 million, an increase of 16 per cent compared with 2004, driven by revenue growth and productivity improvements in the UK and
expansion in Turkey, where pre-tax profit more than quadrupled to US$134 million. In France, revenue growth benefited from the rebranding of CCF and four subsidiary banks to ‘HSBC France’, with a notable increase in international products, particularly mortgage lending to overseas customers.
Continued emphasis was placed on streamlining the business to improve productivity, and on sales and channel management, particularly in the UK, where one third of sales were made through direct channels in 2005. Attention was also paid to further simplifying HSBC’s product range in the UK, and on integrating the M&S Money business in its first full year since acquisition. A number of innovative marketing campaigns and promotions during 2005 heightened brand awareness, leading to greater customer consideration of HSBC products. This was evidenced in strong balance growth and market share gains across most major product lines. In Turkey, an emphasis on business expansion and customer acquisition delivered increased card sales and utilisation combined with higher mortgage sales. In France, marketing campaigns in conjunction with the rebranding exercise boosted mortgage lending and sales of insurance and investment products.
Net interest income increased by 10 per cent to US$5,309 million. This arose substantially in the UK through increases in mortgage and credit card lending, and in Turkey, mainly in credit cards. Increased net interest income from balance sheet growth in France was offset by spread compression.
Despite a more subdued housing market, net interest income from UK mortgages increased by 37 per cent, driven by balance growth of 22 per cent and improvements in customer retention. Spreads also increased, reflecting the inclusion from 1 January 2005 of fee income within the effective interest rate calculation under IFRSs. New lending was strongest in the first time buyer market, where successful pricing and marketing strategies helped gain market share of new sales in a market which contracted overall.
Net interest income from UK credit cards increased by 24 per cent, driven by balance growth and the IFRSs impact noted above. Increased card utilisation by existing customers, as well as new customers attracted by competitive pricing, marketing and cross-sales, contributed to an increase of 16 per cent in average balances. HSBC-branded cards increased market share of new cards issued; sales of the John Lewis branded credit card also increased. Income benefited from the roll-off of balance transfers introduced in the ‘0 per cent’ campaign at the end of 2004, while more
58
Back to Contents
sophisticated risk-based pricing enabled customer rates to be differentiated more acutely.
Net interest income from other unsecured lending in the UK increased by 4 per cent. The launch of differentiated pricing initiatives in April, notably through preferential personal lending rate offers to lower-risk customers, helped boost average loan balances by 9 per cent, and increase HSBC’s market share of gross advances from 10.7 to 11.7 per cent. Focused sales and marketing, notably the ‘January sale’, also contributed to higher balances. As indebtedness levels grew, growth was curtailed through a tightening of underwriting criteria in the more difficult credit environment. The introduction of preferential pricing, and a mix change towards higher value but lower-yielding loans, led to a 48 basis point narrowing of spreads.
Recruitment of new current account customers was strong, and HSBC’s market share of new current accounts increased to 14.7 per cent, largely through brand-led awareness and marketing. The launch of two new current account propositions, including HSBC’s first value-driven packaged account in the UK market, and improved cross-sales aided growth of 6 per cent in overall customer accounts. This led to an increase in net interest income from UK current accounts of 5 per cent to US$1.0 billion, broadly in line with the 6 per cent increase in average balances.
Sales of new UK savings accounts increased markedly, and average balances rose by 15 per cent, driven by a greater front-line focus, competitive pricing and the launch of new products, including ‘Regular Saver’ and ‘Online Saver’. Included in this was growth of over US$1.2 billion in First Direct’s ‘e-savings’ product, launched in September 2004. Net interest income, however, fell by 5 per cent, largely due to the non-recurrence of the benefit to spreads from base rate rises in 2004, and a slight reduction in margin. The latter arose from competitive pricing initiatives partly designed to improve brand awareness and widen product consideration.
In Turkey, innovative marketing initiatives and advertising campaigns, with an emphasis on attracting new customers, contributed to strong growth in net interest income, which more than doubled compared with 2004. Average card balances increased by 66 per cent to US$0.9 billion, and average mortgage balances more than doubled to US$0.6 billion. Higher card usage by existing customers, higher average mortgage advances and a 7 per cent increase in overall customer numbers contributed to the growth.
In France, net interest income was broadly in line with 2004. Marketing campaigns in the run-up to the rebranding exercise contributed to a 54 per cent increase in mortgage sales in a buoyant market, and a resulting 18 per cent increase in average balances. Cross-sales of current and special regulated savings accounts were strong, and average deposit balances grew by 4 per cent to US$14.9 billion. The benefit of this balance sheet expansion was largely offset by lower spreads, as competitive pricing reduced yields on lending products, and the maturing of older, higher-yielding investments reduced the funding benefit from deposits.
Excluding net interest income, net operating income before loan impairment charges grew by 16 per cent to US$3,386 million, of which 12 percentage points was in the UK and largely attributable to increased fees associated with the increase in personal lending, mortgage and credit card volumes described above. Increased card utilisation also led to higher cash advance fees and currency conversion income. An improved investment fund offering, following the depolarisation of the previously tied sales force, was reflected in a 5 per cent increase in related commissions. In Turkey, fee income benefited from increased lending activity. In France, privatisations boosted brokerage income, and new product launches and marketing aided growth in insurance and investment sales.
Under IFRSs, changes in presentation from 1 January 2005, notably for certain contracts previously accounted for as insurance, and with the designation of insurance-related assets at fair value, caused large movements within certain individual income lines. These had negligible impact on income overall. There was also a US$32 million gain from the fair value measurement of options linked to French home-savings products.
Loan impairment charges of US$1,711 million were 73 per cent higher than 2004, the majority of which occurred in the UK. In large part, this reflected the strong growth in higher margin credit card and other unsecured lending in recent years. Weakening economic conditions and sharply rising personal bankruptcies, following the change in legislation in 2004, were also significant contributors.
Loan impairment charges as a percentage of period end net customer advances rose from 0.8 to 1.4 per cent.
HSBC responded to the weaker UK credit environment by further refining its credit eligibility criteria, and by enhancing its credit scorecards with
59
Back to Contents
H S B C H O L D I N G S P L C
Financial Review (continued)
full positive credit reference data. HSBC became the first UK high street clearing bank to share full customer credit performance data in 2005.Underwriting activity was also further centralised. Collections capabilities were enhanced, resulting in an increase in amounts collected, and resources were added to the Retail Credit Risk Management function. As a result, lending activity in the second half of the year indicated that the credit quality of more recent unsecured lending had improved.
Higher charges in Turkey were broadly in line with balance sheet growth, while credit quality in France remained sound.
Operating expenses were broadly in line with 2004. The 7.5 percentage point fall in the cost efficiency ratio, to 58 per cent, was largely driven by productivity improvements in the UK. This reflected the benefits of the cost reduction strategy introduced in 2004. Increased focus on direct channels, and the greater centralisation of support functions enabled by this, reduced the UK cost base in 2005, which also benefited from the non-recurrence of the restructuring costs incurred in implementing this strategy. Costs in 2004 also included amounts for compensation expected to be payable to UK customers for shortfalls on certain mortgage endowment policies and investment products. Operating expenses in 2005 included the initial phase of a UK branch refurbishment programme designed to improve customer experience, which added US$73 million to costs.
In France, a 2 per cent increase in operating expenses was driven by the recruitment of additional sales staff, as well as the rebranding exercise and associated marketing expenditure. In Turkey, marketing costs increased by 30 per cent and staff costs by 33 per cent, largely in support of the growing credit card business.
Commercial Banking reported pre-tax profits of US$1,939 million, an increase of 18 per cent. In highly competitive markets, revenues grew by 6 per cent and profit improvement largely reflected reduced costs, more than offsetting higher loan impairment charges.
In the UK, improved market segmentation led to a more acute focus on the needs of individual customers and underpinned a 20 per cent increase in pre-tax profits. The establishment in 2004 of Corporate Banking Centres to improve the service offered to MMEs, and Commercial Centres focusing on larger SMEs, together with the recruitment of additional sales staff, contributed to a 6 per cent increase in customers and strong growth in lending. Revenues responded strongly, and costs were lower
following a reorganisation in the UK in 2004 to improve efficiency. UK credit quality experienced some weakening in the fourth quarter of 2005, reflecting higher interest rates and the resulting slowdown in consumer spending. However, the quality of HSBC’s commercial lending book remained strong overall with impairment charges continuing to run below historic levels: as in prior periods, loan impairment charges principally reflected allowances against a small number of accounts.
Net interest income increased by 16 per cent. In the UK, lending and overdraft balances increased by 23 per cent, or US$6.6 billion, as a result of strong customer demand. HSBC increased its lending market share, with particularly strong growth in the property, distribution and services sectors. In invoice financing, a 12 per cent increase in customer numbers supported by a sales force realignment led to higher balances and a 10 per cent increase in net interest income. Risk-based pricing improved overdraft spreads by 15 basis points, while term lending margins were in line with 2004.
A campaign designed to secure a greater share of the commercial savings market, in part through more competitive pricing, contributed to an 11 per cent increase in UK deposit balances, with spreads falling by 16 basis points. Overall, UK commercial customer liability balances benefited from both deposit growth and a 12 per cent increase in current account balances. Current account customer numbers rose to over 700,000 with over 20,000 customers switching their business to HSBC following marketing and advertising campaigns in 2005. In the UK, HSBC attracted over 90,000 start-up accounts, representing a 20 per cent market share. Spreads on sterling current accounts fell as customers continued to migrate to interest-paying current accounts. Increases in US interest rates led to a widening of spreads on international and foreign currency current accounts.
Net interest income in Turkey increased by 29 per cent, principally as a result of higher lending and deposit balances, which increased by 25 per cent and 19 per cent respectively. HSBC deepened its relationships with its larger commercial banking customers and recruited additional sales staff to support the launch of SME banking in the second half of 2005.
In France, increased marketing activity highlighting HSBC’s international capabilities as CCF rebranded to HSBC France, together with a programme to align the bank’s 350 largest Commercial Banking customers with the most
60
Back to Contents
experienced relationship managers, led to a 10 per cent increase in medium term loan balances. Sight deposit balances grew by 7 per cent, though deposit spreads decreased as maturing funds were placed at lower prevailing interest rates.
Net fee income increased by 2 per cent to US$1,621 million, net of IFRSs changes to switch some fees into the effective interest rate calculation, which led to a 15 per cent reduction in fee income. In the UK, higher new business volumes and lending activity contributed to a US$77 million, or 27 per cent, increase in loan and overdraft fee income. Increased customer numbers, coupled with the introduction of a new small business tariff in January 2005, led to a 13 per cent increase in current account fee income. Card acquiring income increased by 8 per cent, despite a slowdown in consumer spending driven by a 6 per cent increase in transaction volumes, reflecting merchant acquisition. A 21 per cent increase in card customer numbers contributed to higher card issuing income.
HSBC benefited from the recruitment of additional sales staff, development of profitable relationships with brokers and the success of dedicated corporate and commercial centres. Invoice financing fee income increased by 9 per cent, benefiting from an expanded client base, while a tariff review contributed to a 16 per cent increase in treasury income. The recruitment, in both 2004 and 2005, of commercial independent financial advisors, together with the development of existing sales staff, led to a 13 per cent increase in insurance and investment income, with fee income from savings and investment products increasing by a third. Income in the vehicle and equipment leasing businesses decreased by 13 per cent, following an agreement to outsource the operational functions of the UK vehicle finance contract hire business to Lex Vehicle Leasing, which took effect from November 2005. Excluding the transfer, net fee income from leasing increased by 5 per cent.
Loan impairment charges and other credit risk provisions increased by 26 per cent to US$378 million. In the UK, lending growth and sizeable allowances against a small number of accounts led to a US$162 million increase in charges. Overall credit quality remained relatively strong, although some deterioration was evident in the market in the last three months of 2005 as consumer spending declined. In France, new individually assessed allowances were largely offset by higher recoveries, while in Malta net releases decreased as a large release against a single customer in 2004 was not repeated.
Operating expenses decreased by 5 per cent and, together with increased income, resulted in a 6 percentage point improvement in the cost efficiency ratio. In the UK, the non-recurrence of cost reduction expenditure in 2004, together with the resulting fall in staff numbers and strong cost control, contributed to a 10 per cent decrease in operating expenses. Although overall staff numbers declined, additional sales staff were hired to take advantage of business opportunities in support of revenue growth. These sales staff were supported by press and other advertising campaigns aimed at attracting customers switching banks and start-up businesses to HSBC, together with a campaign targeting SMEs which contributed to an increase in marketing costs.
In France, staff recruitment, increased marketing activity and re-branding led to an 8 per cent increase in costs. Staff costs rose as HSBC France recruited additional sales staff to support business expansion, and success led to higher performance-related remuneration. Campaigns targeting top tier commercial customers and supporting product launches led to an increase in marketing expenditure, while rebranding and supporting activity to emphasise the ‘HSBC’ name change also contributed.
In an economy which grew by 5.5 per cent in 2005, increased business activity, the launch of SME banking and the recruitment of additional sales and support staff in Turkey contributed to a rise in income and a 17 per cent increase in operating expenses.
Corporate, Investment Banking and Marketsreported a pre-tax profit of US$2,114 million, an increase of 27 per cent, compared with 2004. Revenues from all major client-related trading activities increased, particularly from the credit and rates, equities and structured derivatives businesses where HSBC has invested in upgrading its capabilities. Operating expenses rose, reflecting the first full-year cost of the expanded sales and execution capabilities. However, cost growth slowed in the second half of 2005 and in aggregate in Europe, revenue growth comfortably surpassed growth in costs. In Europe, 2005 marked the transition from the investment phase of Corporate, Investment Banking and Markets’ development strategy to a focus on implementation.
Total operating income increased by 15 per cent to US$5,510 million. Balance sheet management and money market revenues declined by approximately 46 per cent reflecting a challenging interest rate
61
Back to Contents
H S B C H O L D I N G S P L C
Financial Review (continued)
environment of higher short-term rates and a flattening yield curve.
Corporate lending spreads remained under pressure as customers refinanced and negotiated better terms in response to falling credit spreads on virtually all publicly traded debt instruments and strong liquidity in the banking system. In the UK, the adverse impact of a 23 basis point decrease in spreads on customer lending was partly mitigated by a 7 per cent increase in lending balances. Corporate and Institutional Banking also implemented a balance sheet securitisation programme to enhance returns. In Global Transaction Banking, net interest income increased, primarily due to an increase in balances held on behalf of customers, coupled with the favourable impact of rising short-term rates. Customer deposit balances increased by 23 per cent and spreads improved by 9 basis points.
Net fees rose by 7 per cent, partly due to an increase in earnings from the equity capital markets business. Additionally, as equity markets became more buoyant, HSBC Securities Services fees increased and assets under custody grew by 15 per cent to US$3,242 billion, primarily due to new business and market value appreciation. The asset-backed securities product also generated higher fees with several notable transactions closing in 2005. In Germany, a 31 per cent rise in net fees was driven by origination activity and higher sales of structured solutions.
The increase in income from trading activities arose from positive revenue trends on core products within Global Markets in response to the investment made in client-facing trading capabilities. Fixed income revenues were boosted by higher volumes processed through electronic trading platforms and by the expansion of primary dealing activity in European government bond markets. In the UK, a strong performance in structured derivatives reflected investment in new hybrid derivatives and structured fund derivatives businesses, while income in the credit and rates business rose by 25 per cent as a result of higher revenues from securities trading, asset-backed securities and credit default swaps. There was growth in income from currency derivatives on the back of increasing client business.
Other income was boosted by gains from the restructuring and syndication of existing assets in Global Investment Banking.
Gains from sales of financial investments increased significantly to US$396 million, due to higher realisations from Private Equity.
The overall credit environment remained favourable, with a net recovery in 2005 as in 2004. There were, however, lower recoveries of loan impairment charges in the UK and France, as HSBC had benefited from a number of successful refinancings in 2004. In Italy, a net recovery reflected relatively lower allowances against loan impairment, coupled with releases of provisions made in 2004.
Operating expenses increased by 9 per cent to US$3,647 million, partly from the first full year effect of recruitment in 2004 and partly from a further 980 people recruited in 2005 to deliver the expanded capabilities reflected in the revenue gains described above. Extensive investment was also made to develop the infrastructure and technology platform required to integrate and support the business expansion. In Global Markets, costs rose as new capabilities were added to the cash equities platform, the structured derivatives business in the UK and the credit and rates business. An increase in operational costs, particularly in Global Transaction Banking, was due to higher transaction volumes.
Private Banking reported a pre-tax profit of US$539 million, an increase of 23 per cent compared with 2004, driven by strong growth in client assets, transaction volumes and the lending book. Operating expenses rose with a recruitment-driven increase in staff costs partly offset by efficiency savings and the non-recurrence of restructuring costs in France in 2004.
Net interest income increased by 31 per cent, driven by strong balance sheet growth in the UK, Switzerland and, to a lesser extent, Germany. Overall, lending balances increased by 21 per cent to US$16.7 billion, as clients borrowed in the low interest rate environment to make alternative investments. This included strong growth in UK mortgage balances, which increased by 39 per cent, in part reflecting synergies with HSBC’s residential property advisory business. Deposits increased by 20 per cent to US$38.6 billion, as new clients placed cash prior to investment.
Client assets, including deposits, increased by 22 per cent to US$174.7 billion. Net new money of US$23.4 billion reflected notably strong inflows in Switzerland, Germany, Monaco and the UK. In Switzerland, an increased marketing effort and successful product placement aided net new money of US$9.6 billion. In Germany, US$7.6 billion of new money was predominantly due to the success of a new wealth management team. In Monaco, a focus on building the onshore business generated inflows of US$4.1 billion, while in the UK, cross-referrals
62
Back to Contents
H S B C H O L D I N G S P L C
Financial Review (continued)
with the wider Group contributed to nearly one quarter of the US$1.6 billion of new money.
A US$20 million lower performance fee from a public equity fund dedicated to Russia was more than offset by increased core fees and commissions in line with growth in client assets, and transactional income as new clients invested. Higher fee income also reflected growth in discretionary and advisory managed assets, and volume growth, which was boosted by the success of new products launched in 2005, notably in alternative investments. Gains from financial investments in both 2004 and 2005 were mainly on the sale of debt instruments. The overall gain in 2005 of US$27 million was 17 per cent lower than in the previous year.
The net release of loan impairment charges in 2005 related largely to specific clients; improved credit quality overall also led to a release of collective impairment provisions.
Operating expenses rose by 11 per cent, of which front office recruitment and increased performance-related remuneration comprised 4 and 5 percentage points respectively. Investment costs, largely in IT and marketing, and supporting business growth contributed further to the increase. These were in part offset by back office efficiency savings and lower restructuring costs following 2004’s merger of HSBC’s four French private banks.
WithinOther, net operating income benefited from the change to the presentation of inter-company preference share dividends received from Hong Kong under IFRSs from 1 January 2005. Head office operating expenses increased, reflecting higher brand advertising and marketing costs, increased professional fees incurred to comply with additional regulatory requirements including Sarbanes-Oxley and Basel II, and restructuring costs. In 2004, operating expenses benefited from the release of litigation provisions.
63
Back to Contents
H S B C H O L D I N G S P L C
Financial Review (continued)
Profit/(loss) before tax by customer group
| | Year ended 31 December 2005 | |
| |
| | | | | Corporate, | | | | | | | | | | |
| Personal | | | | Investment | | | | | | | Inter- | | | |
| Financial | | Commercial | | Banking & | | Private | | | | | segment | | | |
| Services | | Banking | | Markets | | Banking | | Other | | | elimination | | Total | |
| Europe | US$m | | US$m | | US$m | | US$m | | US$m | | | US$m | | US$m | |
| | | | | | | | | | | | | | | | |
| Net interest income | 5,309 | | 2,659 | | 827 | | 548 | | 95 | | | (1,217 | ) | 8,221 | |
| Net fee income | 2,314 | | 1,621 | | 1,339 | | 730 | | 295 | | | – | | 6,299 | |
| Trading income/(expense) excluding net interestincome | 81 | | 16 | | 1,493 | | 93 | | (23 | ) | | – | | 1,660 | |
| Net interest income/(expense) on trading activities | 3 | | 2 | | 159 | | – | | (5 | ) | | 1,217 | | 1,376 | |
| | | | | | | | | | | | | | | | |
| Net trading income/(expense) | 84 | | 18 | | 1,652 | | 93 | | (28 | ) | | 1,217 | | 3,036 | |
| Net income/(expense) from financial instruments designated at fair value . | 305 | | 71 | | 17 | | – | | (31 | ) | | – | | 362 | |
| Gains less losses from | | | | | | | | | | | | | | | |
| financial investments | (4 | ) | 4 | | 396 | | 27 | | 16 | | | – | | 439 | |
| Dividend income | 2 | | 7 | | 27 | | 9 | | 18 | | | – | | 63 | |
| Net earned insurance | | | | | | | | | | | | | | | |
| premiums | 1,220 | | 115 | | – | | – | | 264 | | | – | | 1,599 | |
| Other operating income | 42 | | 178 | | 1,252 | | 18 | | 329 | | | (216 | ) | 1,603 | |
| |
| |
| |
| |
| |
| | |
| |
| |
| Total operating income | 9,272 | | 4,673 | | 5,510 | | 1,425 | | 958 | | | (216 | ) | 21,622 | |
| Net insurance claims1 | (577 | ) | (62 | ) | – | | – | | (179 | ) | | – | | (818 | ) |
| |
| |
| |
| |
| |
| | |
| |
| |
| Net operating income | | | | | | | | | | | | | | | |
| before loan | | | | | | | | | | | | | | | |
| impairment charges and | | | | | | | | | | | | | | | |
| other credit risk | | | | | | | | | | | | | | | |
| provisions | 8,695 | | 4,611 | | 5,510 | | 1,425 | | 779 | | | (216 | ) | 20,804 | |
| Loan impairment charges | | | | | | | | | | | | | | | |
| and other credit risk | | | | | | | | | | | | | | | |
| provisions | (1,711 | ) | (378 | ) | 155 | | 5 | | – | | | – | | (1,929 | ) |
| |
| |
| |
| |
| |
| | |
| |
| |
| Net operating income | 6,984 | | 4,233 | | 5,665 | | 1,430 | | 779 | | | (216 | ) | 18,875 | |
| Total operating expenses | (5,058 | ) | (2,301 | ) | (3,647 | ) | (891 | ) | (958 | ) | | 216 | | (12,639 | ) |
| |
| |
| |
| |
| |
| | |
| |
| |
| Operating profit/(loss) | 1,926 | | 1,932 | | 2,018 | | 539 | | (179 | ) | | – | | 6,236 | |
| Share of profit/(loss) in | | | | | | | | | | | | | | | |
| associates and joint | | | | | | | | | | | | | | | |
| ventures | 6 | | 7 | | 96 | | – | | 11 | | | – | | 120 | |
| |
| |
| |
| |
| |
| | |
| |
| |
| Profit/(loss) before tax | 1,932 | | 1,939 | | 2,114 | | 539 | | (168 | ) | | – | | 6,356 | |
| |
| |
| |
| |
| |
| | |
| |
| |
| | % | | % | | % | | % | | % | | | | | % | |
| Share of HSBC’s profit | | | | | | | | | | | | | | | |
| before tax | 9.2 | | 9.2 | | 10.1 | | 2.6 | | (0.8 | ) | | | | 30.3 | |
| Cost efficiency ratio | 58.2 | | 49.9 | | 66.2 | | 62.5 | | 122.9 | | | | | 60.8 | |
| | | | | | | | | | | | | | | | |
| | US$m | | US$m | | US$m | | US$m | | US$m | | | | | US$m | |
| Selected balance sheet data2 | | | | | | | | | | | | | | | |
| Loans and advances to | | | | | | | | | | | | | | | |
| customers (net) | 120,302 | | 66,965 | | 107,899 | | 17,368 | | 3 | | | | | 312,537 | |
| Total assets | 143,095 | | 80,864 | | 367,893 | | 40,971 | | 3,880 | | | | | 636,703 | |
| Customer accounts | 122,118 | | 61,789 | | 109,086 | | 41,206 | | 1 | | | | | 334,200 | |
| Loans and advances to | | | | | | | | | | | | | | | |
| banks (net)3 | | | | | 34,218 | | | | | | | | | | |
| Trading assets, financial | | | | | | | | | | | | | | | |
| instruments designated at | | | | | | | | | | | | | | | |
| fair value, and financial | | | | | | | | | | | | | | | |
| investments3 | | | | | 168,062 | | | | | | | | | | |
| Deposits by banks3 | | | | | 45,075 | | | | | | | | | | |
| | | | | | | | | | | | | | | | |
| 1 | Net insurance claims incurred and movement in policyholders’ liabilities. |
| 2 | Third party only. |
| 3 | These assets and liabilities were significant to Corporate, Investment Banking and Markets. |
64
Back to Contents
| | Year ended 31 December 2004 | |
| |
| | | | | Corporate, | | | | | | | | | |
| Personal | | | | Investment | | | | | | Inter- | | | |
| Financial | | Commercial | | Banking & | | Private | | | | segment | | | |
| Services | | Banking | | Markets | | Banking | | Other | | elimination | | Total | |
| Europe | US$m | | US$m | | US$m | | US$m | | US$m | | US$m | | US$m | |
| | | | | | | | | | | | | | | | |
| Net interest income | 4,644 | | 2,305 | | 1,403 | | 421 | | 325 | | – | | 9,098 | |
| Net fee income | 2,110 | | 1,593 | | 1,261 | | 658 | | 358 | | – | | 5,980 | |
| Trading income | – | | 116 | | 735 | | 104 | | 42 | | – | | 997 | |
| Net investment income/ | | | | | | | | | | | | | | |
| | (expense) on assets | | | | | | | | | | | | | | |
| | backing policyholders’ | | | | | | | | | | | | | | |
| | liabilities | 445 | | 127 | | – | | – | | (1 | ) | – | | 571 | |
| Gains less losses from | | | | | | | | | | | | | | |
| | financial investments | – | | 1 | | 122 | | 33 | | (2 | ) | – | | 154 | |
| Dividend income/(expense) | – | | 36 | | 526 | | 5 | | (9 | ) | – | | 558 | |
| | | | | | | | | | | | | | | | |
| Net earned insurancepremiums | 1,254 | | 409 | | 12 | | – | | 200 | | – | | 1,875 | |
| Other operating income | 26 | | 285 | | 770 | | 19 | | 255 | | (180 | ) | 1,175 | |
| |
| |
| |
| |
| |
| |
| |
| |
| Total operating income | 8,479 | | 4,872 | | 4,829 | | 1,240 | | 1,168 | | (180 | ) | 20,408 | |
| Net insurance claims1 | (1,026 | ) | (487 | ) | – | | – | | (115 | ) | – | | (1,628 | ) |
| |
| |
| |
| |
| |
| |
| |
| |
| Net operating income | | | | | | | | | | | | | | |
| | before loan impairment | | | | | | | | | | | | | | |
| | charges and other credit | | | | | | | | | | | | | | |
| | risk provisions | 7,453 | | 4,385 | | 4,829 | | 1,240 | | 1,053 | | (180 | ) | 18,780 | |
| Loan impairment charges | | | | | | | | | | | | | | |
| | and other credit risk | | | | | | | | | | | | | | |
| | provisions | (939 | ) | (306 | ) | 207 | | 4 | | 1 | | – | | (1,033 | ) |
| |
| |
| |
| |
| |
| |
| |
| |
| Net operating income | 6,514 | | 4,079 | | 5,036 | | 1,244 | | 1,054 | | (180 | ) | 17,747 | |
| Total operating expenses | (4,898 | ) | (2,422 | ) | (3,380 | ) | (806 | ) | (702 | ) | 180 | | (12,028 | ) |
| |
| |
| |
| |
| |
| |
| |
| |
| Operating profit | 1,616 | | 1,657 | | 1,656 | | 438 | | 352 | | – | | 5,719 | |
| Share of profit in associates | | | | | | | | | | | | | | |
| | and joint ventures | 5 | | 6 | | 12 | | – | | 14 | | – | | 37 | |
| |
| |
| |
| |
| |
| |
| |
| |
| Profit before tax | 1,621 | | 1,663 | | 1,668 | | 438 | | 366 | | – | | 5,756 | |
| | |
| |
| |
| |
| |
| |
| |
| |
| | | | | | | | | | | | | | | | |
| | | % | | % | | % | | % | | % | | | | % | |
| Share of HSBC’s profit | | | | | | | | | | | | | | |
| | before tax | 8.6 | | 8.8 | | 8.8 | | 2.3 | | 1.9 | | | | 30.4 | |
| Cost efficiency ratio | 65.7 | | 55.2 | | 70.0 | | 65.0 | | 66.7 | | | | 64.0 | |
| | | | | | | | | | | | | | | | |
| | | US$m | | US$m | | US$m | | US$m | | US$m | | | | US$m | |
| Selected balance sheet data2 | | | | | | | | | | | | | | |
| Loans and advances to | | | | | | | | | | | | | | |
| | customers (net) | 118,796 | | 67,458 | | 75,628 | | 15,676 | | 2 | | | | 277,560 | |
| Total assets | 143,515 | | 83,289 | | 273,906 | | 40,140 | | 4,707 | | | | 545,557 | |
| Customer accounts | 121,599 | | 57,798 | | 78,031 | | 35,140 | | – | | | | 292,568 | |
| The following assets and | | | | | | | | | | | | | | |
| | liabilities were significant | | | | | | | | | | | | | | |
| | to Corporate, Investment | | | | | | | | | | | | | | |
| | Banking and Markets: | | | | | | | | | | | | | | |
| | Loans and advances to | | | | | | | | | | | | | | |
| | banks (net) | | | | | 47,802 | | | | | | | | | |
| Trading assets, financial | | | | | | | | | | | | | | |
| | instruments designated at | | | | | | | | | | | | | | |
| | fair value, and financial | | | | | | | | | | | | | | |
| | investments | | | | | 116,492 | | | | | | | | | |
| Deposits by banks | | | | | 53,646 | | | | | | | | | |
| | | | | | | | | | | | | | | |
| 1 | Net insurance claims incurred and movement in policyholders’ liabilities. |
| 2 | Third party only. |
| |
65
Back to Contents
H S B C H O L D I N G S P L C
Financial Review (continued)
| Hong Kong | | | | |
| Profit before tax by customer group | | | | |
| | Year ended 31 December | |
| |
|
|
| |
| | 2005 | | 2004 | |
| | US$m | | US$m | |
| | | | | |
| Personal Financial Services | 2,628 | | 2,063 | |
| Commercial Banking | 955 | | 904 | |
| Corporate, Investment Banking and Markets | 922 | | 1,603 | |
| Private Banking | 190 | | 131 | |
| Other | (178 | ) | 129 | |
| |
| |
| |
| | 4,517 | | 4,830 | |
| |
| |
| |
Profit before tax
| | Year ended 31 December | |
| |
|
|
| |
| | 2005 | | 2004 | |
| | US$m | | US$m | |
| | | | | |
| Net interest income | 4,064 | | 3,638 | |
| Net fee income | 1,674 | | 1,703 | |
| Trading income | 546 | | 659 | |
| Net expense from financial instruments designated at fair value | (6 | ) | – | |
| Net investment income on assets backing policyholders’ liabilities | – | | 314 | |
| Gains less losses from financial investments | 108 | | 175 | |
| Dividend income | 41 | | 27 | |
| Net earned insurance premiums | 2,334 | | 2,247 | |
| Other operating income | 805 | | 536 | |
| |
| |
| |
| Total operating income | 9,566 | | 9,299 | |
| Net insurance claims incurred and movement in policyholders’ liabilities | (2,059 | ) | (2,154 | ) |
| |
| |
| |
| Net operating income before loan impairment charges and other credit risk provisions | 7,507 | | 7,145 | |
| Loan impairment charges and other credit risk provisions | (146 | ) | 220 | |
| |
| |
| |
| Net operating income | 7,361 | | 7,365 | |
| Total operating expenses | (2,867 | ) | (2,558 | ) |
| |
| |
| |
| Operating profit | 4,494 | | 4,807 | |
| Share of profit in associates and joint ventures | 23 | | 23 | |
| |
| |
| |
| Profit before tax | 4,517 | | 4,830 | |
| |
| |
| |
| | | | | |
| | % | | % | |
| Share of HSBC’s profit before tax | 21.5 | | 25.5 | |
| Cost efficiency ratio | 38.2 | | 35.8 | |
| | | | | |
| Year-end staff numbers (full-time equivalent) | 25,931 | | 25,552 | |
| | | | | |
| | US$m | | US$m | |
| Selected balance sheet data1 | | | | |
| Loans and advances to customers (net) | 83,208 | | 78,824 | |
| Loans and advances to banks (net) | 42,751 | | 45,710 | |
| Trading assets, financial instruments designated at fair value, and financial investments | 81,631 | | 75,721 | |
| Total assets2 | 222,822 | | 213,458 | |
| Deposits by banks | 4,708 | | 4,325 | |
| Customer accounts | 173,726 | | 178,033 | |
| | |
| 1 | Third party only. |
| 2 | Excluding Hong Kong Government certificates of indebtedness. |
66
Back to Contents
Hong Kong’s economy grew by 7.3 per cent in 2005, down from the growth of 8.6 per cent achieved in 2004. Robust domestic demand provided strong support, particularly in the second half of the year, and external trade maintained its rapid rate of growth. Despite a substantial rise of more than 3 per cent in local interest rates in 2005, domestic demand continued to expand, reflecting a sustained improvement in business and consumer confidence. Increased consumer spending, spurred by greater job security as unemployment fell, and improving household incomes, became a key driver of growth in the latter part of the year. The rise in domestic spending more than offset the slower growth in tourists’ spending which occurred in 2005, particularly among mainland visitors, and consumer optimism remained unaffected by a cooling in the property market induced by the higher interest rate environment. Hong Kong’s strong export performance also propelled growth, benefiting from sustained external demand and foreign importers building up inventories as trade talks continued on textile quotas between mainland China and its major trading partners. Domestic exports also picked up, reflecting increased local production. In 2005, inflation rose to 1.1 per cent, mainly driven by increased demand for property rentals.
HSBC’s operations in Hong Kong reported a pre-tax profit of US$4,517 million, compared with US$4,830 million in 2004. IFRSs changes to the treatment of preference share dividends led to a US$387 million decrease in pre-tax profits. Excluding this, profits increased by 2 per cent. Subdued profit growth was largely attributable to a turnaround in loan impairment charges, as 2004 benefited from non-recurring releases from general provisions, and a fall in balance sheet management revenues. Pre-tax profits in Hong Kong represented around 22 per cent of HSBC’s total profit at this level. In Corporate, Investment Banking and Markets, balance sheet management revenues were negatively affected by the influence of short-term interest rate rises and a flattening yield curve. Expense growth in Corporate, Investment Banking and Markets reflected the first full-year effect of the investment made to support business expansion. Pre-tax profits of Personal Financial Services and Commercial Banking grew by 27 per cent and 6 per cent respectively, benefiting from a sharp rise in deposit spreads as short-term interest rates increased in a benign credit environment.
The commentary that follows is on an underlying basis.
Personal Financial Servicesreported a pre-tax profit of US$2,628 million, 27 per cent higher than
in 2004. This was largely due to widening deposit spreads, deposit growth and improved credit quality. During the year, HSBC placed considerable emphasis on maintaining its leadership position and meeting customer needs in both the credit cards and insurance businesses. Market share of both spend and balances grew in respect of credit cards along with strong insurance revenue growth.
Net interest income grew by 30 per cent to US$2,618 million. During 2005, interest rates in Hong Kong rose significantly, reflecting rising US dollar interest rates. In addition, adjustments to the Hong Kong: US dollar linked exchange rate system reduced the likelihood of an upward realignment of the Hong Kong dollar, prompting a reversal of much of the inward flows from investors that had depressed local market rates in 2004. Consequently, deposit spreads widened to more normal levels after the exceptionally low spreads experienced in 2004. Interest rate rises also helped stimulate growth in average deposit balances as investor sentiment moved away from long-term equity-related investments into shorter-term liquid deposits. Despite the competitive deposit market, average balances grew by US$2.9 billion, or 3 per cent.
The mortgage market remained highly competitive during 2005. During the first half of the year, HSBC did not aggressively compete on price but maintained a selective approach to mortgage approvals, mainly by offering competitive rates to the existing customer base. Yields gradually improved during the year, as HSBC repriced upwards following a series of interest rates increases. Spreads declined compared with 2004, as improvements in yields were more than offset by higher funding costs following rising interest rates. Average mortgage balances, excluding the reduction in balances under the suspended Hong Kong Government Home Ownership Scheme (‘GHOS’) grew by 1 per cent, despite the highly competitive environment.
Average credit card balances grew by 10 per cent, and HSBC’s market share of card balances also increased by 550 basis points led by targeted promotional campaigns and rewards programmes. These volume benefits were more than offset by lower spreads, mainly due to higher funding costs as interest rates rose.
Net fees fell by 6 per cent to US$740 million, driven mainly by lower sales of unit trusts and capital guaranteed funds, partly offset by higher sales of structured deposit products and open-ended funds. A 34 per cent fall in unit trust fee income was driven by a change in market sentiment during 2005.
67
Back to Contents
H S B C H O L D I N G S P L C
Financial Review (continued)
The combined effect of higher interest rates and a flattening yield curve reduced customer demand for capital guaranteed funds and longer-term equity related investment products. Investors preferred shorter-term investment products which in turn generated lower fees. Revenues from open-ended fund sales reflected this, increasing by 32 per cent to US$95 million with the introduction of 173 new funds increasing the choice of funds available to investors. This was an important strategic initiative to position HSBC as the leading investment service provider in Hong Kong, where customers can now choose from over 300 funds.
Revenues from structured deposit products grew, with strong sales volumes aided by new products launched. The success of the Exclusive Placement Service, launched in 2004 for HSBCPremiercustomers, continued with year-on-year revenue growth of 178 per cent. The service offers an extensive product range of yield enhancement options, re-priced daily and linked to foreign exchange or interest rates. IPO certificate of deposit offerings doubled. These were partly offset by lower revenues from ‘Deposit plus’ and ‘Equity linked note’ products.
Fee income from credit cards grew by 9 per cent, reflecting a 21 per cent increase in spending along with a 15 per cent rise in the number of cards in circulation to four million. In stockbroking and custody services, new services were launched aimed at facilitating securities management by customers. Competitive pricing and a high quality of service on the internet led to a 15 per cent growth in customers holding securities with HSBC.
HSBC continued to place significant emphasis on the growth and development of its insurance business, and increased the range of products offered. Insurance revenues grew by 20 per cent, aided by new products launched which included the ‘Five year excel’ and the ‘Three year express wealth’ joint life insurance and wealth products. HSBC was Hong Kong’s leading online insurance provider, offering 12 insurance products. This, coupled with competitive pricing, led to a 91 per cent growth in online insurance revenues. Medical insurance products were enhanced and heavily marketed in response to the growing public demand for private medical protection to complement new medical reforms being introduced.
Improvements in credit conditions, which benefited from economic growth, higher property prices and lower bankruptices, underpinned a net release of loan impairment charges and other credit risk provisions of US$11 million in 2005, compared
with a net charge of US$56 million in 2004. This was mainly driven by continued improvement in credit quality within the credit card portfolio, and a collective provision release of US$23 million in respect of prior year impairment allowances on the restructured lending portfolio. The strong housing market also enabled individually assessed allowance releases of US$24 million in the mortgage portfolio. There was also a release of US$11 million in respect of collective loan impairment allowances, benefiting from the improved economic conditions highlighted above.
Operating expenses fell by 4 per cent to US$1,305 million. This was largely due to a change in the method by which centrally incurred costs are allocated to the customer groups. IT development costs rose in support of future growth initiatives, and higher marketing and advertising expenditures were incurred on behalf of organic growth. Staff costs were marginally lower this year. Branch teams were restructured to dedicate more staff to sales and customer service, and significant improvements were made to the reward structure to ensure retention of high calibre individuals. Overall, headcount in the branch network fell by 4 per cent, reflecting operating efficiency improvements and higher utilisation of the Group Service Centres.
Pre-tax profits inCommercial Bankingincreased by 6 per cent to US$955 million. Increased deposit spreads and a rise in lending and deposit balances led to higher net interest income, though this was partly offset by larger loan impairment charges and the non-recurrence of loan allowance releases.
Net interest income increased by 60 per cent as a result of increased deposit spreads and growth in both assets and liabilities. The appointment of a number of experienced relationship managers to service key accounts, together with the establishment of core business banking centres, contributed to growth in both deposits and lending. Interest rate rises led to a 67 basis point increase in deposit spreads and, together with active management of the deposit base, contributed to increased customer demand for savings products which resulted in a 6 per cent increase in deposit balances to US$28.7 billion. The introduction of a pre-approved lending programme for SMEs, together with strong demand for credit in the property, manufacturing, trading and retail sectors, contributed to a 29 per cent increase in lending balances. However, increased competition reduced lending spreads by 43 basis points. Current account customers rose by 2 per cent to 329,000 and, together with higher spreads, contributed to an 81 per cent increase in current account net interest income.
68
Back to Contents
The ‘BusinessVantage’ all-in-one account continued to perform strongly, with customers increasing by 23 per cent, which led to income more than doubling in 2005.
Net fee income increased by 10 per cent to US$402 million as a result of efforts to encourage cross-sales, which led to an increase in average products per customer. Investment in HSBC’s insurance business, including the establishment of a new Commercial Banking insurance division in October 2005, delivered a 10 per cent increase in insurance income. Enhanced product offerings and focused sales efforts in the areas of currency and interest rate management products more than doubled income. Growth in the number of merchant customers following targeted marketing campaigns, together with higher consumer spending, led to a 22 per cent increase in card income. However, these increases were partly offset by a reduced contribution from investment products, even though sales increased by 20 per cent, reflecting changes in the product mix, as demand for capital protected funds decreased in the rising interest rate environment.
Loan impairment charges and other credit risk provisions of US$168 million contrasted with net recoveries in 2004, and included a significant charge against a client in the manufacturing sector. Releases and recoveries in 2005 were lower, although impaired loans as a proportion of lending balances decreased.
Operating expenses were 3 per cent higher, principally as a result of staff recruitment to support business development and expansion. This was particularly true with respect to business with mainland China, where additional resources were focused on increasing cross-sales and insurance income. Expenditure on new marketing campaigns promoted HSBC’s lower-cost delivery channels. These campaigns, together with additional investment to increase customer access to ATMs and cheque deposit machines, grew the proportion of transactions using low cost channels to 35 per cent from 25 per cent in 2004. This released staff to concentrate on increasing sales and offering enhanced customer service.
Corporate, Investment Banking and Marketsreported a pre-tax profit of US$922 million, 43 per cent lower than in 2004, primarily driven by a decline in net interest income in Global Markets and lower recoveries and releases of loan impairment allowances. In addition, operating expenses increased in line with initiatives taken to extend the product range in Global Markets and to strengthen
the Global Investment Banking advisory platform for Asia in Hong Kong.
A 19 per cent decline in total operating income was driven by a 74 per cent fall in balance sheet management and money market revenues due to rising short-term US and Hong Kong interest rates and flattening yield curves.
In Corporate and Institutional Banking, deposit spreads increased in line with higher local interest rates, although this was offset by lending spreads which fell amidst fierce local competition. In Global Transaction Banking revenues increased, benefiting from the improvement in deposit spreads, together with higher deposit balances as business volumes grew from the upgraded cash management service delivered through HSBCnet.
Net fees fell by 19 per cent, driven primarily by a reduction in structured finance revenues. However, a number of significant equity related transactions were concluded. Fee income from Group Investment Businesses was boosted by sales of investment products and a US$3.7 billion growth in funds under management.
Income from trading activities rose as new structured product capabilities were added in respect of credit, equities, interest rate and foreign exchange trading. Higher foreign exchange derivatives revenues reflected an increased focus on sales and execution. These gains were partly offset by a decline in sales of structured product solutions to the personal and commercial businesses, as retail investors switched to shorter deposit products in the higher interest rate environment. Losses were also incurred on the trading of Asian high-yield bonds, where revenues fell following the downgrading of the automobile sector in the first half of 2005.
The overall credit environment remained favourable and there was a small net release of loan impairment charges, although this was below levels seen in 2004 when HSBC benefited from corporate restructuring and refinancing in the property, industrial and telecommunications sectors.
A 20 per cent rise in operating expenses was due to the first full-year impact of the investment made in Hong Kong’s Corporate, Investment Banking and Markets businesses. Employee compensation and benefits rose by 24 per cent, in part driven by an increase in senior relationship managers recruited to extend coverage along industry sector lines. In total, over 90 people were recruited to support the expansion. Technology and infrastructure costs rose as support and control functions added new
69
Back to Contents
H S B C H O L D I N G S P L C
Financial Review (continued)
resources and improved services to facilitate business expansion.
Private Bankingcontributed a pre-tax profit of US$190 million, an increase of 45 per cent compared with 2004. The benefits of strong growth in client assets, and consequently higher brokerage and trading income, were partly offset by the adverse effect of a flattening yield curve on income from the investment of surplus liquidity.
Net operating income was 29 per cent higher than in 2004. A 25 per cent increase in fee income reflected higher client assets, as well as the benefits of a strategy to increase the level of higher fee generating discretionary managed assets, which increased by 50 per cent during the year. Trading income increased by 39 per cent, boosted by higher volumes which reflected growth in the customer base, and a generally buoyant market. Revenue from bond trading increased by 13 per cent, and from foreign exchange and sales of structured products by 6 and 21 per cent respectively. Gains from financial investments of US$16 million were mainly from the sale of debt instruments.
Overall, client assets increased by 17 per cent to US$47.3 billion. Net new money inflows of US$5.8 billion were notably strong, with recruitment of front office staff, the success of last year’s launch of the ‘HSBC Private Bank’ brand, and cross-referrals with the wider Group all contributing to the growth. Marketing, successful product placement and the enhancement of the related front office teams also aided in the increase of discretionary managed assets, with a near doubling of assets invested in the Strategic Investment Solutions product.
Operating expenses increased by 14 per cent. Costs from front office recruitment, and higher expenditure on marketing in support of the growing customer base, were partly offset by the non-recurrence of rebranding costs in 2004.
InOther, gains on the sale of investments and properties decreased by US$136 million in 2005, following significant sales in 2004. These were partly offset by increased gains on the revaluation of properties of US$70 million. Net interest income decreased as, from 1 January 2005 under IFRSs, dividends paid on certain intra-group preference shares were reclassified from non-equity minority interests to net interest income; this was partly offset by higher earnings on US dollar denominated assets following interest rate rises in the US.
70
Back to Contents
Profit/(loss) before tax by customer group
| | | Year ended 31 December 2005 | | |
| | |
| | |
| | | | | | | | | Corporate, | | | | | | | | | | | | | | |
| | | Personal | | | | | | Investment | | | | | | | | | Inter- | | | | | |
| | | Financial | | | Commercial | | | Banking & | | | Private | | | | | | segment | | | | | |
| | | Services | | | Banking | | | Markets | | | Banking | | | Other | | | elimination | | | Total | | |
| Hong Kong | US$m | | | US$m | | | US$m | | | US$m | | | US$m | | | US$m | | | US$m | | |
| | | | | | | | | | | | | | | | | | | | | | | |
| Net interest income/(expense) | 2,618 | | | 1,096 | | | 607 | | | 75 | | | (529 | ) | | 197 | | | 4,064 | | |
| Net fee income | 740 | | | 402 | | | 431 | | | 93 | | | 8 | | | – | | | 1,674 | | |
| Trading income/(expense) | | | | | | | | | | | | | | | | | | | | | |
| | excluding net interest | | | | | | | | | | | | | | | | | | | | | |
| | income | 67 | | | 48 | | | 601 | | | 140 | | | (83 | ) | | – | | | 773 | | |
| Net interest income/(expense) | | | | | | | | | | | | | | | | | | | | | |
| | on trading activities | – | | | – | | | (40 | ) | | – | | | 10 | | | (197 | ) | | (227 | ) | |
| Net trading income/(expense) | 67 | | | 48 | | | 561 | | | 140 | | | (73 | ) | | (197 | ) | | 546 | | |
| Net income/(expense) from | | | | | | | | | | | | | | | | | | | | | |
| | financial instruments | | | | | | | | | | | | | | | | | | | | | |
| | designated at fair value | 41 | | | (84 | ) | | 14 | | | – | | | 23 | | | – | | | (6 | ) | |
| Gains less losses from | | | | | | | | | | | | | | | | | | | | | |
| | financial investments | – | | | – | | | – | | | 16 | | | 92 | | | – | | | 108 | | |
| Dividend income | 1 | | | 2 | | | 18 | | | – | | | 20 | | | – | | | 41 | | |
| Net earned insurance | | | | | | | | | | | | | | | | | | | | | |
| | premiums | 2,238 | | | 77 | | | 19 | | | – | | | – | | | – | | | 2,334 | | |
| Other operating income | 230 | | | 35 | | | 83 | | | 13 | | | 682 | | | (238 | ) | | 805 | | |
| |
| | |
| | |
| | |
| | |
| | |
| | |
| | |
| Total operating income | 5,935 | | | 1,576 | | | 1,733 | | | 337 | | | 223 | | | (238 | ) | | 9,566 | | |
| | | | | | | | | | | | | | | | | | | | | | |
| Net insurance claims1 | (2,016 | ) | | (34 | ) | | (9 | ) | | – | | | – | | | – | | | (2,059 | ) | |
| |
| | |
| | |
| | |
| | |
| | |
| | |
| | |
| Net operating income before | | | | | | | | | | | | | | | | | | | | | |
| | loan impairment charges | | | | | | | | | | | | | | | | | | | | | |
| | and other credit risk | | | | | | | | | | | | | | | | | | | | | |
| | provisions | 3,919 | | | 1,542 | | | 1,724 | | | 337 | | | 223 | | | (238 | ) | | 7,507 | | |
| Loan impairment | | | | | | | | | | | | | | | | | | | | | |
| | charges/(recoveries) and other | | | | | | | | | | | | | | | | | | | | | |
| | credit risk provisions | 11 | | | (168 | ) | | 7 | | | 3 | | | 1 | | | – | | | (146 | ) | |
| |
| | |
| | |
| | |
| | |
| | |
| | |
| | |
| Net operating income | 3,930 | | | 1,374 | | | 1,731 | | | 340 | | | 224 | | | (238 | ) | | 7,361 | | |
| | | | | | | | | | | | | | | | | | | | | | |
| Total operating expenses | (1,305 | ) | | (419 | ) | | (809 | ) | | (150 | ) | | (422 | ) | | 238 | | | (2,867 | ) | |
| |
| | |
| | |
| | |
| | |
| | |
| | |
| | |
| Operating profit/(loss) | 2,625 | | | 955 | | | 922 | | | 190 | | | (198 | ) | | – | | | 4,494 | | |
| Share of profit in associates | | | | | | | | | | | | | | | | | | | | | |
| | and joint ventures | 3 | | | – | | | – | | | – | | | 20 | | | – | | | 23 | | |
| |
| | |
| | |
| | |
| | |
| | |
| | |
| | |
| Profit/(loss) before tax | 2,628 | | | 955 | | | 922 | | | 190 | | | (178 | ) | | – | | | 4,517 | | |
| |
| | |
| | |
| | |
| | |
| | |
| | |
| | |
| | | | | | | | | | | | | | | | | | | | | | | |
| | | % | | | % | | | % | | | % | | | % | | | | | | % | | |
| Share of HSBC’s profit | | | | | | | | | | | | | | | | | | | | | |
| | before tax | 12.5 | | | 4.6 | | | 4.4 | | | 0.9 | | | (0.9 | ) | | | | | 21.5 | | |
| Cost efficiency ratio | 33.3 | | | 27.2 | | | 46.9 | | | 44.5 | | | 189.0 | | | | | | 38.2 | | |
| | | | | | | | | | | | | | | | | | | | | | | |
| | | US$m | | | US$m | | | US$m | | | US$m | | | US$m | | | | | | US$m | | |
| Selected balance sheet data2 | | | | | | | | | | | | | | | | | | | | | |
| Loans and advances to | | | | | | | | | | | | | | | | | | | | | |
| | customers (net) | 34,318 | | | 20,292 | | | 23,712 | | | 3,107 | | | 1,779 | | | | | | 83,208 | | |
| Total assets3 | 40,244 | | | 25,625 | | | 133,005 | | | 7,621 | | | 16,327 | | | | | | 222,822 | | |
| Customer accounts | 105,801 | | | 37,417 | | | 21,070 | | | 9,216 | | | 222 | | | | | | 173,726 | | |
| Loans and advances to | | | | | | | | | | | | | | | | | | | | | |
| | banks (net)4 | | | | | | | 39,164 | | | | | | | | | | | | | | |
Trading assets, financial instruments designated at fair value, and financial investments4 | | | | | | | 63,813 | | | | | | | | | | | | | | |
| Deposits by banks4 | | | | | | | 4,373 | | | | | | | | | | | | | | |
| | |
| 1 | Net insurance claims incurred and movement in policyholders’ liabilities. |
| 2 | Third party only. |
| 3 | Excluding Hong Kong Government certificates of indebtedness. |
| 4 | These assets and liabilities were significant to Corporate, Investment Banking and Markets. |
71
Back to Contents
H S B C H O L D I N G S P L C
Financial Review (continued)
Profit/(loss) before tax by customer group (continued)
| | | Year ended 31 December 2004 | |
| | |
| |
| | | | | | | Corporate, | | | | | | | | | |
| | | Personal | | | | Investment | | | | | | Inter- | | | |
| | | Financial | | Commercial | | Banking & | | Private | | | | segment | | | |
| | | Services | | Banking | | Markets | | Banking | | Other | | elimination | | Total | |
| Hong Kong | US$m | | US$m | | US$m | | US$m | | US$m | | US$m | | US$m | |
| | | | | | | | | | | | | | | | |
| Net interest income/(expense) | 2,015 | | 684 | | 998 | | 85 | | (144 | ) | – | | 3,638 | |
| Net fee income/(expense) | 786 | | 365 | | 529 | | 75 | | (52 | ) | – | | 1,703 | |
| Trading income/(expense) | 47 | | 39 | | 476 | | 101 | | (4 | ) | – | | 659 | |
| Net investment income on | | | | | | | | | | | | | | |
| | assets backing policy- | | | | | | | | | | | | | | |
| | holders’ liabilities | 118 | | 196 | | – | | – | | – | | – | | 314 | |
| Gains less losses from | | | | | | | | | | | | | | |
| | financial investments | (2 | ) | – | | 2 | | – | | 175 | | – | | 175 | |
| Dividend income | 2 | | 1 | | 2 | | – | | 22 | | – | | 27 | |
| Net earned insurance | | | | | | | | | | | | | | |
| | premiums | 1,620 | | 609 | | 19 | | – | | (1 | ) | – | | 2,247 | |
| Other operating income | 294 | | 52 | | 101 | | (2 | ) | 561 | | (470 | ) | 536 | |
| |
| |
| |
| |
| |
| |
| |
| |
| Total operating income | 4,880 | | 1,946 | | 2,127 | | 259 | | 557 | | (470 | ) | 9,299 | |
| | | | | | | | | | | | | | | |
| Net insurance claims1 | (1,400 | ) | (742 | ) | (12 | ) | – | | – | | – | | (2,154 | ) |
| |
| |
| |
| |
| |
| |
| |
| |
| Net operating income before | | | | | | | | | | | | | | |
| | loan impairment charges and | | | | | | | | | | | | | | |
| | other credit risk provisions | 3,480 | | 1,204 | | 2,115 | | 259 | | 557 | | (470 | ) | 7,145 | |
| Loan impairment charges and | | | | | | | | | | | | | | |
| | other credit risk provisions | (56 | ) | 110 | | 164 | | 4 | | (2 | ) | – | | 220 | |
| |
| |
| |
| |
| |
| |
| |
| |
| Net operating income | 3,424 | | 1,314 | | 2,279 | | 263 | | 555 | | (470 | ) | 7,365 | |
| | | | | | | | | | | | | | | |
| Total operating expenses | (1,364 | ) | (406 | ) | (674 | ) | (132 | ) | (452 | ) | 470 | | (2,558 | ) |
| |
| |
| |
| |
| |
| |
| |
| |
| Operating profit | 2,060 | | 908 | | 1,605 | | 131 | | 103 | | – | | 4,807 | |
| Share of profit/(loss) in | | | | | | | | | | | | | | |
| | associates and joint ventures | 3 | | (4 | ) | (2 | ) | – | | 26 | | – | | 23 | |
| |
| |
| |
| |
| |
| |
| |
| |
| Profit before tax | 2,063 | | 904 | | 1,603 | | 131 | | 129 | | – | | 4,830 | |
| |
| |
| |
| |
| |
| |
| |
| |
| | | | | | | | | | | | | | | | |
| | | % | | % | | % | | % | | % | | | | % | |
| Share of HSBC’s profit | | | | | | | | | | | | | | |
| | before tax | 10.9 | | 4.7 | | 8.5 | | 0.7 | | 0.7 | | | | 25.5 | |
| Cost efficiency ratio | 39.2 | | 33.7 | | 31.9 | | 51.0 | | 81.1 | | | | 35.8 | |
| | | | | | | | | | | | | | | | |
| | | US$m | | US$m | | US$m | | US$m | | US$m | | | | US$m | |
| Selected balance sheet data2 | | | | | | | | | | | | | | |
| | Loans and advances to | | | | | | | | | | | | | | |
| | customers (net) | 33,646 | | 17,883 | | 22,440 | | 2,954 | | 1,901 | | | | 78,824 | |
| Total assets3 | 37,742 | | 23,272 | | 129,986 | | 7,490 | | 14,968 | | | | 213,458 | |
| Customer accounts | 114,302 | | 35,226 | | 18,903 | | 9,264 | | 338 | | | | 178,033 | |
The following assets and liabilities were significant to Corporate, Investment Banking and Markets: | | | | | | | | | | | | | | |
| Loans and advances to | | | | | | | | | | | | | | |
| | banks (net) | | | | | 42,515 | | | | | | | | | |
| Trading assets, financial instruments designated at fair value, and financial investments | | | | | 59,703 | | | | | | | | | |
| Deposits by banks | | | | | 4,205 | | | | | | | | | |
| | |
| 1 | Net insurance claims incurred and movement in policyholders’ liabilities. |
| 2 | Third party only. |
| 3 | Excluding Hong Kong Government certificates of indebtedness. |
72
Back to Contents
Rest of Asia-Pacific (including the Middle East)
Profit/(loss) before tax by customer group and by country
| | Year ended 31 December | |
| |
|
|
| |
| | 2005 | | 2004 | |
| | US$m | | US$m | |
| | | | | |
| Personal Financial Services | 377 | | 336 | |
| Commercial Banking | 818 | | 483 | |
| Corporate, Investment Banking and Markets | 1,207 | | 942 | |
| Private Banking | 78 | | 60 | |
| Other | 94 | | 26 | |
| |
| |
| |
| | 2,574 | | 1,847 | |
| |
| |
| |
| | Year ended 31 December | |
| |
|
|
| |
| | 2005 | | 2004 | |
| | US$m | | US$m | |
| | | | | |
| Australia and New Zealand | 111 | | 84 | |
| Brunei | 35 | | 33 | |
| India | 212 | | 178 | |
| Indonesia | 113 | | 76 | |
| Japan | (1 | ) | 50 | |
| Mainland China | 334 | | 32 | |
| Malaysia | 236 | | 214 | |
| Middle East (excluding Saudi Arabia) | 481 | | 298 | |
| Philippines | 41 | | 38 | |
| Saudi Arabia | 236 | | 122 | |
| Singapore | 289 | | 272 | |
| South Korea | 94 | | 89 | |
| Taiwan | 68 | | 107 | |
| Thailand | 61 | | 60 | |
| Other | 264 | | 194 | |
| |
| |
| |
| | 2,574 | | 1,847 | |
| |
| |
| |
73
Back to Contents
H S B C H O L D I N G S P L C
Financial Review (continued)
Profit before tax
| | Year ended 31 December | |
| |
|
|
| |
| | 2005 | | 2004 | |
| Rest of Asia-Pacific (including the Middle East) | US$m | | US$m | |
| | | | | |
| Net interest income | 2,412 | | 2,060 | |
| Net fee income | 1,340 | | 1,041 | |
| Trading income | 860 | | 494 | |
| Net income from financial instruments designated at fair value | 58 | | – | |
| Net investment income on assets backing policyholders’ liabilities | – | | 32 | |
| Gains less losses from financial investments | 18 | | 17 | |
| Dividend income | 5 | | 3 | |
| Net earned insurance premiums | 155 | | 97 | |
| Other operating income | 335 | | 146 | |
| |
| |
| |
| Total operating income | 5,183 | | 3,890 | |
| Net insurance claims incurred and movement in policyholders’ liabilities | (166 | ) | (82 | ) |
| |
| |
| |
| Net operating income before loan impairment charges and other credit risk provisions | 5,017 | | 3,808 | |
| Loan impairment charges and other credit risk provisions | (134 | ) | (89 | ) |
| |
| |
| |
| Net operating income | 4,883 | | 3,719 | |
| Total operating expenses | (2,762 | ) | (2,087 | ) |
| |
| |
| |
| Operating profit | 2,121 | | 1,632 | |
| Share of profit in associates and joint ventures | 453 | | 215 | |
| |
| |
| |
| Profit before tax | 2,574 | | 1,847 | |
| |
| |
| |
| | | | | |
| | % | | % | |
| | | | | |
| Share of HSBC’s profit before tax | 12.3 | | 9.8 | |
| Cost efficiency ratio | 55.1 | | 54.8 | |
| Year-end staff numbers (full-time equivalent) | 55,577 | | 41,031 | |
| | | | | |
| | US$m | | US$m | |
| Selected balance sheet data1 | | | | |
| Loans and advances to customers (net) | 70,016 | | 60,663 | |
| Loans and advances to banks (net) | 19,559 | | 14,887 | |
| Trading assets, financial instruments designated at fair value, and financial investments | 30,348 | | 31,065 | |
| Total assets | 142,014 | | 120,530 | |
| Deposits by banks | 7,439 | | 8,046 | |
| Customer accounts | 89,118 | | 78,613 | |
Mainland China’s economy grew by 9.9 per cent in 2005. Despite ongoing monetary tightening, total urban fixed asset investment growth showed no sign of slowing, though investment in steel and real estate sectors moderated. Consumer spending also remained strong, with retail sales growing by 13 per cent in 2005. Producer price inflation slowed, but still remained above 3 per cent thanks to strong investment demand. In July 2005, the People’s Bank of China announced that, with immediate effect, the arrangement by which the renminbi (‘RMB’) was pegged to the US dollar would be replaced with a managed float. Initially, the exchange rate was set at US$1 to RMB8.11, equivalent to an appreciation of approximately 2 per cent. This had little impact on export growth, which remained very strong, boosting China’s annual trade surplus from US$32 billion in
2004 to US$102 billion in 2005. Growth in food prices slowed as China's grain production increased 3 per cent in 2005. This lowered consumer price inflation to 1.8 per cent from 3.9 per cent at the end of 2004.
Japan’s economy in 2005 achieved its strongest growth in five years, and the long process of structural readjustment following the collapse in asset prices was largely completed. In particular, the excess corporate capacity, employment and debt of the past decade was eliminated, and bank impaired loans returned to historically normal levels. After a downturn which began in mid-2004, exports began to recover vigorously in March 2005, led by strong demand from mainland China. The decline in corporate borrowing ceased, and the end of net corporate debt reduction freed up cash which drove
74
Back to Contents
stronger growth in private capital investment. The tightening of the labour market boosted employment and led to a sustained rise in real wages for the first time in five years, providing strong support for consumer spending. The rise in the core consumer price index in November 2005 set the stage for the end of the Bank of Japan’s quantitative easing policy.
Elsewhere in the region, most economies performed impressively in 2005, in particular India’s. The main drivers of growth were exports, demand for technology, and domestic consumption. Investment demand, by contrast, remained weak. Strong domestic growth and continued firmness in energy prices resulted in an increase in inflationary pressures, especially in Indonesia and Thailand, where fuel subsidies were lowered or removed. Central banks in both these countries increased rates substantially. Elsewhere, particularly in South Korea and Taiwan, energy prices did not significantly affect headline inflation, and the benign inflationary environment was maintained with less need for monetary tightening. Most Asian currencies ended the year strongly against the US dollar.
2005 was a good year economically for theMiddle East, where growth was boosted by high oil prices and additional capacity in downstream oil and gas, real estate, transportation and tourism. Long-term growth was reinforced through economic liberalisation. The result was to encourage private sector investment in both established and new sectors of the region’s economy. Regional interest rates mirrored US dollar rate increases during the year without any noticeable effect on credit growth, though inflationary pressures arose from the US dollar’s weakness and general economic expansion. GDP growth is estimated by the International Monetary Fund to have been over 6 per cent in Saudi Arabia in 2005. Economies in the region which are not as dependent on oil also performed well, with the United Arab Emirates, for example, registering strong growth in non-oil sectors such as financial services and tourism.
HSBC’s operations in the Rest of Asia-Pacific reported a pre-tax profit of US$2,574 million, compared with US$1,847 million in 2004, representing an increase of 39 per cent. On an underlying basis, pre-tax profits grew by 29 per cent and represented around 12 per cent of HSBC’s equivalent total profit. Strong growth across the majority of countries in the region resulted in higher revenues across all customer groups.
The commentary that follows is on an underlying basis.
Personal Financial Services reported a pre-tax profit of US$377 million, an increase of 6 per cent compared with 2004, reflecting higher net interest income led by strong asset and deposit growth, increased fee income and higher income from investments in the Middle East and mainland China. Costs in support of business expansion rose and were broadly in line with revenue growth. Higher loan impairment charges reflected growth in credit card lending and the non-recurrence in 2005 of loan impairment provision releases in 2004.
Net interest income grew by 25 per cent to US$1,208 million, reflecting strong growth across the majority of countries in the region.Deposit balances generally grew strongly during 2005. This was due in part to the range of new products launched during the year, including dual currency, floating rate and higher-yielding time deposits. The number ofPremier account holders rose significantly, with a 40 per cent growth across the region generating US$3.5 billion of additional balances. In mainland China, organic expansion continued, with the opening of ten new branches and sub-branches. The deposit base grew by 80 per cent, as considerable emphasis was placed on the provision of wealth management services through the HSBCPremier account service. Deposit spreads also widened as interest rates rose, contributing to higher net interest income in mainland China, Singapore and India.
In the Middle East, a rise of 37 per cent in net interest income was driven by a combination of widening deposit spreads and strong loan growth, partly offset by lower asset spreads as funding costs increased following interest rate rises.
Average mortgage balances increased by 27 per cent to US$16.7 billion. This growth reflected marketing campaigns in India, Malaysia and Singapore alongside new products introduced in Australia and Korea. Higher sales volumes were also generated by direct sales forces across the region, notably in India, where mortgage balances grew by 43 per cent. The benefits of higher mortgage balances were partly offset by lower spreads as pricing stayed highly competitive.
The credit card business continued to expand in a number of countries. Credit card spending increased by 33 per cent, contributing to a 42 per cent growth in average card balances. Other notable developments included promotional campaigns, new product launches and a series of customer acquisition strategies including the exclusive rewards programme, ‘Home and Away’. At the end of the year, the number of cards in circulation stood at
75
Back to Contents
H S B C H O L D I N G S P L C
Financial Review (continued)
6.3 million, representing an increase of 34 per cent over 2004. In India, the number of cards in circulation exceeded one million for the first time. Higher card balances led to higher net interest income in Indonesia, India, Taiwan, Malaysia and the Philippines.
Net fee income grew by 46 per cent to US$419 million, largely attributable to strong sales of investment and insurance products, and increased account service fees. Credit card fee incomes rose, driven by the strong growth in cardholder spending. Commissions from sales of unit trusts and funds under management were particularly strong in Singapore, India and Taiwan. Sales of investment products, comprising unit trusts, bonds and structured notes, grew by 43 per cent to US$6.5 billion, generating a 56 per cent increase in fee income. The launch of over 217 tranches of structured notes and deposit products in 11 countries across the region achieved total sales of US$952 million. Total funds under management rose by 33 per cent or US$7.2 billion, led by increased marketing activity and the considerable focus placed on wealth management services during the year. HSBC Bank Malaysia maintained its position as the leading international institutional unit trust agent in the country. Brokerage and custody fees grew, particularly in Australia, where a 13 per cent rise reflected increased stock market activity.
HSBC continued to emphasise the expansion of its insurance business across the region. The number of policies in force increased by 27 per cent and revenues grew by 16 per cent.
Loan impairment charges and other credit risk provisions doubled compared with 2004. This was due to the non-recurrence of a release of a general provision in Malaysia in 2004, and a sharp rise in credit card provisions in Taiwan, reflecting deteriorating credit conditions. Growth in personal unsecured lending and credit cards across the region contributed further to the increased charge.
Operating expenses increased by 29 per cent to US$1,245 million in support of business growth. HSBC spent considerable amounts in the region enhancing its existing infrastructure in order to benefit fully from the opportunities presented by the Asian growth economies. Staff costs of US$469 million rose by 23 per cent, as employee numbers increased to support business growth and to increase sales and wealth management activities. Performance-related remuneration costs were also higher as a result of the strong growth in profitability.
Marketing costs rose as major campaigns were run to support product promotions in mortgages,
credit cards, insurance and investment products. Continued emphasis was placed on brand awareness in order to generate additional business and reinforce HSBC’s position as the world’s local bank across the region, and this further increased costs. Various growth initiatives required investment in technology, and the development of new distribution channels resulted in higher IT costs. Other expenses, including professional fees and communications costs, rose in support of business expansion.
Increased contributions from HSBC’s investments in Bank of Communications and Industrial Bank in mainland China, together with record earnings from The Saudi British Bank, contributed to strong growth in profit from associates.
Commercial Banking reported a pre-tax profit of US$818 million, 45 per cent higher than that delivered in 2004. The increase was mainly due to higher net interest income as growth in customer numbers and strong credit demand to fund infrastructure investment drove balance sheet growth. Higher contributions from Bank of Communications and Industrial Bank in China, as well as a strong performance in The Saudi British Bank, produced higher income from associates. Lending balances increased by 16 per cent, exceeded by a 24 per cent rise in deposits.
Net interest income increased by 33 per cent to US$631 million, reflecting growth in the Middle East, Singapore, mainland China, Indonesia and Taiwan. In the Middle East, strong regional economies and significant government backed infrastructure and property projects, principally in the United Arab Emirates, contributed to a 37 per cent growth in lending balances and a 42 per cent increase in customer account balances. Higher trade flows generated a 25 per cent increase in net interest income from trade services, while higher interest rates raised liability spreads by 118 basis points. A new Amanah term investment product was launched in May 2005, attracting US$120 million of deposits, principally from new customers seeking Shariah-compliant investment opportunities.
In mainland China, strong economic growth, expansion of the branch network and the recruitment of additional sales staff resulted in a 39 per cent increase in lending balances. Deposit balances also benefited from economic growth, increasing by 38 per cent, while deposit spreads widened by 76 basis points following increases in US interest rates.
In Singapore, interest rate rises prompted increased demand for savings products and
76
Back to Contents
consequently deposit balances grew by 13 per cent, while deposit spreads increased by 13 basis points. Lending balances rose by 27 per cent, following the selective recruitment of more experienced relationship managers and a reorganisation of customers into key industrial sectors to provide greater focus on identifying service opportunities. Asset spreads decreased by 42 basis points as a result of competitive pressures and market liquidity.
In Taiwan, a loyalty campaign designed to increase deposits, together with higher current account income and an increase in deposit spreads, contributed to an 80 per cent increase in net interest income. In Mauritius, net interest income doubled as a result of liability balance growth. In India, increased trade contributed to higher trade services net interest income and strong economic growth led to higher demand for credit. This resulted in lending balances increasing by 72 per cent, while customer acquisition increased average current account balances by 37 per cent. Liability spreads widened by 73 basis points following interest rate rises. In Indonesia, increased sales efforts and a more focused approach to customer relationship management contributed to an 84 per cent growth in asset balances and a 66 per cent increase in net interest income.
Net fee income of US$307 million was 15 per cent higher than in 2004. In the Middle East, increased trade flows led to a 17 per cent increase in trade services income, while current account income increased by 80 per cent, benefiting from the introduction of new cash management capabilities. Short-term IPO loan funding reflecting, in part, robust regional capital market, also contributed to a 40 per cent increase in net fee income. In mainland China, a 31 per cent increase in trade customers and a significant rise in imports led to higher trade services income, while a 49 per cent increase in current account customers and higher lending fees also contributed to an 8 per cent increase in fee income. Increased lending, current account and trade activities raised net fee income by 30 per cent in Indonesia. A number of sites, including Vietnam and Thailand, also reported strong growth, driven by the success of HSBC’s strategy of focusing on business opportunities involving international trade.
There was a net release of loan impairment charges of US$67 million, following net charges in 2004. Credit quality in the Middle East improved. In mainland China there was a significant reduction in loan impairment charges as higher collective impairment charges were more than offset by the release of allowances against a small number of accounts and the non-recurrence of a significant charge against a single customer in 2004. In India,
strong economic growth led to improved credit quality, while in Malaysia, Singapore and Indonesia, credit quality improved significantly although releases of impairment charges were lower than in 2004.
Operating expenses were 27 per cent higher than last year, broadly in line with revenue growth. In the Middle East, the recruitment of sales and support staff substantially increased income, leading to higher incentive payments. In mainland China, revenue growth was driven by branch expansion, increased sales and support staff and higher marketing expenditure. In Malaysia, the direct sales teams were expanded and business banking units were extended to all branches in support of the bank’s growth strategy, resulting in a 16 per cent increase in costs.
In India, the recruitment of additional sales staff boosted customer facing staff by 85 per cent in 2005. In South Korea, staff recruitment and heightened marketing activity supported HSBC’s four recently established commercial banking centres, contributing to an increase in costs. Higher costs throughout the rest of the region largely reflected increases in sales and support staff and initiatives to support business expansion.
Increased income from associates reflected strong performance in The Saudi British Bank and gains on the sale of HSBC’s stake in MISR International, an Egyptian Bank. Income from the bank’s strategic investments in China, Bank of Communications and Industrial Bank, which were acquired in 2004, also increased.
Corporate, Investment Banking and Marketsreported a pre-tax profit of US$1,207 million, an increase of 22 per cent compared with 2004. HSBC’s progress in this region was marked by positive revenue trends across most countries, with strong growth being reported in the Middle East, Malaysia, South Korea, India and mainland China.
Operating income rose by 25 per cent to US$1,769 million. Higher Corporate and Institutional Banking revenues reflected a 53 per cent increase in lending balances in mainland China, a result of strong demand for corporate credit, primarily from the industrial and technology sector. Deposit balances increased by 36 per cent and, together with a 40 basis point rise in deposit spreads, this also contributed to the growth in revenues.
HSBC’s operations in the Middle East reported a 63 per cent rise in customer advances, primarily due to strong demand for corporate credit, driven by government spending on regional infrastructure
77
Back to Contents
H S B C H O L D I N G S P L C
Financial Review (continued)
projects.
Global Transaction Banking revenues increased, as payments and cash management benefited from an increase in regional mandates which added to average balances, together with a widening of deposit spreads, notably in Singapore, India and Thailand.
In Global Markets, balance sheet management and money market revenues fell, particularly in Singapore and Japan, due to the effect of rising short-term interest rates and a flattening of the yield curves.
Net fees increased by 17 per cent. In Global Transaction Banking, the expansion in business capabilities which took place in the latter part of 2004 drove an increase in volumes, with marked improvements in Singapore, South Korea and India. Revenues from the custody business increased against the backdrop of rising local stock market indices as investment sentiment in the region improved. Additionally, securities services in India generated higher business volumes, with assets under custody growing by US$9 billion to US$34 billion. In Singapore, fee income increased by 55 per cent, reflecting an increase in revenues from securities services activities as HSBC leveraged its relationship strength and product capabilities to attract new business.
In the Middle East, corporate lending and trade finance activity generated higher customer volumes as regional economies strengthened from an increase in foreign investment, tourism and higher real estate and oil prices. Global Investment Banking benefited from the resulting demand for cross-border business, with an increase in fees from advisory and project and export finance services.
Income from trading activities increased, in part due to higher revenues from foreign exchange and structured derivatives driven by enhanced distribution and expanded product capabilities. In South Korea, volatility in the Korean won against the US dollar encouraged strong customer flows in foreign exchange. In Malaysia, a rise in customer demand, following the move to a managed float for the Malaysian ringgit, improved trading volumes in foreign exchange. Global Markets in Taiwan generated higher revenues, due to improved sales of structured derivative products. Falling interest rates in the Philippines resulted in favourable price movements on government bond portfolios. In the Middle East, HSBC’s enhanced capability in structured transactions and greater focus on trading in the regional currencies drove volumes higher in a volatile market.
Gains from the disposal of the Group’s asset management business in Australia added US$8 million to other operating income.
Net recoveries on loan impairment charges were marginally lower than in 2004.
Operating expenses increased by 21 per cent to US$733 million, broadly in line with the growth in operating income and reflecting higher performance-related incentives. 2005 bore the first full-year effect of the recruitment in 2004 of over 600 additional staff, of which more than half were in Global Transaction Banking. The upgrade of corporate and support teams across the region within Corporate and Institutional Banking resulted in some 280 additional people. The cost base was further affected by investment in HSBCnet and other technology costs incurred to support business expansion.
Income from associates included increased contribution from HSBC’s investments in Bank of Communications and Industrial Bank, which were acquired in 2004.
Private Banking reported a pre-tax profit of US$78 million, an increase of 32 per cent compared with 2004. Investment in the business over the past two years was reflected in strong growth in client assets and net new money inflows of US$2.3 billion, against a backdrop of intense competition in the region. Net operating income increased by 17 per cent, predominantly due to higher trading income.
Net interest income fell by 29 per cent to US$30 million compared with 2004. Balance sheet growth was mainly in Singapore and Japan, where client deposits increased by 44 and 64 per cent respectively. Lending to customers also grew strongly, with the loan book increasing by some 26 per cent. The net interest income benefits of these were more than offset by lower treasury margins earned in the rising interest rate environment, and the reclassification under IFRSs from 1 January 2005 of net interest income on certain derivatives to ‘net trading income’.
Trading income increased by 62 per cent. Strong growth in bond trading and sales of structured products, which increased by 28 and 20 per cent respectively, was compounded by the reclassification from net interest income mentioned above. Fee income was broadly in line with 2004, with the benefit of growth in client assets largely offset by the non-recurrence of exceptionally high brokerage volumes driven by the market recovery last year.
Client assets increased by 23 per cent to US$13.7 billion. Front office recruitment and marketing campaigns, and inflows from the
78
Back to Contents
operations launched in Dubai in 2005 and Malaysia in 2004, boosted asset growth in the region. Net new money of US$2.3 billion was 22 per cent higher than last year, with inflows strongest in Singapore and Japan.
Operating expenses increased by only 6 per cent, leading to a 5 percentage point improvement in the cost efficiency ratio. Front office recruitment in most countries contributed to a small increase in staff costs, and expenditure on marketing and administrative expenses rose to support business growth.
InOther, the Group’s Service Centres continued to expand to support HSBC’s productivity improvements, incurring US$129 million of incremental costs, offset by higher recharges to other customer groups. Higher interest rates led to increased earnings on centrally held investments. In Thailand, the sale of a residential property led to a gain of US$11 million and in India, litigation provisions raised in 2004 were not repeated.
79
Back to Contents
H S B C H O L D I N G S P L C
Financial Review (continued)
Profit/(loss) before tax by customer group
| | | Year ended 31 December 2005 | | |
| | |
|
|
|
|
|
|
|
|
|
|
|
|
|
|
|
|
|
|
| | |
| | | | | | | | | Corporate, | | | | | | | | | | | | | | |
| | | Personal | | | | | | Investment | | | | | | | | | Inter- | | | | | |
| | | Financial | | | Commercial | | | Banking & | | | Private | | | | | | segment | | | | | |
| | | Services | | | Banking | | | Markets | | | Banking | | | Other | | | elimination | | | Total | | |
| Rest of Asia-Pacific (including the Middle East) | US$m | | | US$m | | | US$m | | | US$m | | | US$m | | | US$m | | | US$m | | |
| | | | | | | | | | | | | | | | | | | | | | | |
| Net interest income | 1,208 | | | 631 | | | 614 | | | 30 | | | 54 | | | (125 | ) | | 2,412 | | |
| Net fee income | 419 | | | 307 | | | 498 | | | 43 | | | 73 | | | – | | | 1,340 | | |
| | | | | | | | | | | | | | | | | | | | | | |
| Trading income/(expense) | | | | | | | | | | | | | | | | | | | | | |
| | excluding net interest | | | | | | | | | | | | | | | | | | | | | |
| | income | 37 | | | 70 | | | 579 | | | 74 | | | (7 | ) | | – | | | 753 | | |
| Net interest income/(expense) | | | | | | | | | | | | | | | | | | | | | |
| | on trading activities | 1 | | | (1 | ) | | (21 | ) | | – | | | 3 | | | 125 | | | 107 | | |
| | | | | | | | | | | | | | | | | | | | | | |
| Net trading income | 38 | | | 69 | | | 558 | | | 74 | | | (4 | ) | | 125 | | | 860 | | |
| Net income from financial | | | | | | | | | | | | | | | | | | | | | |
| | instruments designated at | | | | | | | | | | | | | | | | | | | | | |
| | fair value | 44 | | | 1 | | | 4 | | | – | | | 9 | | | – | | | 58 | | |
| Gains less losses from | | | | | | | | | | | | | | | | | | | | | |
| | financial investments | – | | | 4 | | | 12 | | | 2 | | | | | | – | | | 18 | | |
| Dividend income | – | | | – | | | 1 | | | – | | | 4 | | | – | | | 5 | | |
| Net earned insurance | | | | | | | | | | | | | | | | | | | | | |
| | premiums | 134 | | | 21 | | | – | | | – | | | – | | | – | | | 155 | | |
| Other operating income | 37 | | | 9 | | | 82 | | | 4 | | | 287 | | | (84 | ) | | 335 | | |
| |
| | |
| | |
| | |
| | |
| | |
| | |
| | |
| Total operating income | 1,880 | | | 1,042 | | | 1,769 | | | 153 | | | 423 | | | (84 | ) | | 5,183 | | |
| Net insurance claims1 | (157 | ) | | (9 | ) | | – | | | – | | | – | | | – | | | (166 | ) | |
| |
| | |
| | |
| | |
| | |
| | |
| | |
| | |
| Net operating income before | | | | | | | | | | | | | | | | | | | | | |
| | loan impairment charges | | | | | | | | | | | | | | | | | | | | | |
| | and other credit risk | | | | | | | | | | | | | | | | | | | | | |
| | provisions | 1,723 | | | 1,033 | | | 1,769 | | | 153 | | | 423 | | | (84 | ) | | 5,017 | | |
| Loan impairment charges and | | | | | | | | | | | | | | | | | | | | | |
| | other credit risk provisions | (236 | ) | | 67 | | | 35 | | | 2 | | | (2 | ) | | – | | | (134 | ) | |
| |
| | |
| | |
| | |
| | |
| | |
| | |
| | |
| Net operating income | 1,487 | | | 1,100 | | | 1,804 | | | 155 | | | 421 | | | (84 | ) | | 4,883 | | |
| Total operating expenses | (1,245 | ) | | (452 | ) | | (733 | ) | | (77 | ) | | (339 | ) | | 84 | | | (2,762 | ) | |
| |
| | |
| | |
| | |
| | |
| | |
| | |
| | |
| Operating profit | 242 | | | 648 | | | 1,071 | | | 78 | | | 82 | | | – | | | 2,121 | | |
| Share of profit in associates | | | | | | | | | | | | | | | | | | | | | |
| | and joint ventures | 135 | | | 170 | | | 136 | | | – | | | 12 | | | – | | | 453 | | |
| |
| | |
| | |
| | |
| | |
| | |
| | |
| | |
| Profit before tax | 377 | | | 818 | | | 1,207 | | | 78 | | | 94 | | | – | | | 2,574 | | |
| |
| | |
| | |
| | |
| | |
| | |
| | |
| | |
| | | % | | | % | | | % | | | % | | | % | | | | | | % | | |
| Share of HSBC’s profit | | | | | | | | | | | | | | | | | | | | | |
| | before tax | 1.8 | | | 3.9 | | | 5.8 | | | 0.4 | | | 0.4 | | | | | | 12.3 | | |
| Cost efficiency ratio | 72.3 | | | 43.8 | | | 41.4 | | | 50.3 | | | 80.1 | | | | | | 55.1 | | |
| | | | | | | | | | | | | | | | | | | | | | | |
| | | US$m | | | US$m | | | US$m | | | US$m | | | US$m | | | | | | US$m | | |
| Selected balance sheet data2 | | | | | | | | | | | | | | | | | | | | | |
| Loans and advances to | | | | | | | | | | | | | | | | | | | | | |
| | customers (net) | 27,433 | | | 18,694 | | | 21,431 | | | 2,347 | | | 111 | | | | | | 70,016 | | |
| Total assets | 32,224 | | | 22,570 | | | 76,026 | | | 5,359 | | | 5,835 | | | | | | 142,014 | | |
| Customer accounts | 31,250 | | | 18,612 | | | 32,102 | | | 7,092 | | | 62 | | | | | | 89,118 | | |
The following assets and liabilities were significant to Corporate, Investment Banking and Markets: | | | | | | | | | | | | | | | | | | | | | |
| Loans and advances to | | | | | | | | | | | | | | | | | | | | | |
| | banks (net) | | | | | | | 15,352 | | | | | | | | | | | | | | |
| Trading assets, financial instruments designated at fair value, and financial investments | | | | | | | 26,113 | | | | | | | | | | | | | | |
| Deposits by banks | | | | | | | 7,041 | | | | | | | | | | | | | | |
| | |
| 1 | Net insurance claims incurred and movement in policyholders’ liabilities. |
| 2 | Third party only. |
80
Back to Contents
| | | Year ended 31 December 2004 | |
| | |
|
|
|
|
|
|
|
|
|
|
|
|
| |
| | | | | | | Corporate, | | | | | | | | | |
| | | Personal | | | | Investment | | | | | | Inter- | | | |
| | | Financial | | Commercial | | Banking & | | Private | | | | segment | | | |
| | | Services | | Banking | | Markets | | Banking | | Other | | elimination | | Total | |
| Rest of Asia-Pacific (including the Middle East) | US$m | | US$m | | US$m | | US$m | | US$m | | US$m | | US$m | |
| | | | | | | | | | | | | | | | |
| Net interest income | 948 | | 472 | | 596 | | 42 | | 2 | | – | | 2,060 | |
| Net fee income | 284 | | 266 | | 421 | | 41 | | 29 | | – | | 1,041 | |
| Trading income | 43 | | 59 | | 344 | | 46 | | 2 | | – | | 494 | |
| Net investment income on | | | | | | | | | | | | | | |
| | assets backing policyholders’ | | | | | | | | | | | | | | |
| | liabilities | 32 | | – | | – | | – | | – | | – | | 32 | |
| Gains less losses from | | | | | | | | | | | | | | |
| | financial investments | 1 | | – | | 6 | | – | | 10 | | – | | 17 | |
| Dividend income | – | | – | | – | | – | | 3 | | – | | 3 | |
| Net earned insurance | | | | | | | | | | | | | | |
| | premiums | 77 | | 20 | | – | | – | | – | | – | | 97 | |
| Other operating income | 28 | | 13 | | 26 | | 2 | | 157 | | (80 | ) | 146 | |
| |
| |
| |
| |
| |
| |
| |
| |
| Total operating income | 1,413 | | 830 | | 1,393 | | 131 | | 203 | | (80 | ) | 3,890 | |
| Net insurance claims1 | (72 | ) | (10 | ) | – | | – | | – | | – | | (82 | ) |
| |
| |
| |
| |
| |
| |
| |
| |
| Net operating income before | | | | | | | | | | | | | | |
| | loan impairment charges and | | | | | | | | | | | | | | |
| | other credit risk provisions | 1,341 | | 820 | | 1,393 | | 131 | | 203 | | (80 | ) | 3,808 | |
| Loan impairment charges and | | | | | | | | | | | | | | |
| | other credit risk provisions | (117 | ) | (20 | ) | 47 | | 1 | | – | | – | | (89 | ) |
| |
| |
| |
| |
| |
| |
| |
| |
| Net operating income | 1,224 | | 800 | | 1,440 | | 132 | | 203 | | (80 | ) | 3,719 | |
| Total operating expenses | (949 | ) | (350 | ) | (598 | ) | (72 | ) | (198 | ) | 80 | | (2,087 | ) |
| |
| |
| |
| |
| |
| |
| |
| |
| Operating profit | 275 | | 450 | | 842 | | 60 | | 5 | | – | | 1,632 | |
| Share of profit in associates | | | | | | | | | | | | | | |
| | and joint ventures | 61 | | 33 | | 100 | | – | | 21 | | – | | 215 | |
| |
| |
| |
| |
| |
| |
| |
| |
| Profit before tax | 336 | | 483 | | 942 | | 60 | | 26 | | – | | 1,847 | |
| |
| |
| |
| |
| |
| |
| |
| |
| | | % | | % | | % | | % | | % | | | | % | |
| Share of HSBC’s profit | | | | | | | | | | | | | | |
| | before tax | 1.8 | | 2.6 | | 5.0 | | 0.3 | | 0.1 | | | | 9.8 | |
| Cost efficiency ratio | 70.8 | | 42.7 | | 43.0 | | 55.0 | | 97.5 | | | | 54.8 | |
| | | US$m | | US$m | | US$m | | US$m | | US$m | | | | US$m | |
| Selected balance sheet data2 | | | | | | | | | | | | | | |
| Loans and advances to | | | | | | | | | | | | | | |
| | customers (net) | 22,886 | | 16,444 | | 19,276 | | 1,960 | | 97 | | | | 60,663 | |
| Total assets | 25,577 | | 18,845 | | 66,438 | | 4,549 | | 5,121 | | | | 120,530 | |
| Customer accounts | 28,961 | | 15,381 | | 28,620 | | 5,543 | | 108 | | | | 78,613 | |
The following assets and liabilities were significant to Corporate, Investment Banking and Markets: | | | | | | | | | | | | | | |
| | Loans and advances to | | | | | | | | | | | | | | |
| | banks (net) | | | | | 12,119 | | | | | | | | | |
Trading assets, financial instruments designated at fair value, and financial investments | | | | | 26,555 | | | | | | | | | |
| Deposits by banks | | | | | 7,156 | | | | | | | | | |
| | |
| 1 | Net insurance claims incurred and movement in policyholders’ liabilities. |
| 2 | Third party only. |
81
Back to Contents
H S B C H O L D I N G S P L C
Financial Review(continued)
North America
Profit/(loss) before tax by country within customer group
| | Year ended 31 December | |
| |
|
| |
| |
| | 2005 | | | 2004 | |
| | US$m | | | US$m | |
| | | | | | |
| Personal Financial Services | 4,761 | | | 4,384 | |
| United States | 3,853 | | | 3,642 | |
| Canada | 310 | | | 157 | |
| Mexico | 570 | | | 549 | |
| Other | 28 | | | 36 | |
| Commercial Banking | 1,064 | | | 848 | |
| United States | 447 | | | 417 | |
| Canada | 403 | | | 239 | |
| Mexico | 161 | | | 140 | |
| Other | 53 | | | 52 | |
| Corporate, Investment Banking and Markets | 774 | | | 966 | |
| United States | 373 | | | 741 | |
| Canada | 154 | | | 134 | |
| Mexico | 192 | | | 85 | |
| Other | 55 | | | 6 | |
| Private Banking | 104 | | | 68 | |
| United States | 104 | | | 65 | |
| Other | – | | | 3 | |
| Other | 169 | | | (196 | ) |
| United States | 158 | | | (201 | ) |
| Canada | (12) | | | – | |
| Other | 23 | | | 5 | |
| |
| | |
| |
| Total | 6,872 | | | 6,070 | |
| United States | 4,935 | | | 4,664 | |
| Canada | 855 | | | 530 | |
| Mexico | 923 | | | 774 | |
| Other | 159 | | | 102 | |
82
Back to Contents
Profit before tax
| | Year ended 31 December | |
| |
|
|
| |
| | 2005 | | 2004 | |
| North America | US$m | | US$m | |
| | | | | |
| Net interest income | 14,887 | | 14,993 | |
| Net fee income | 4,606 | | 3,765 | |
| Trading income | 1,013 | | 582 | |
| Net expense from financial instruments designated at fair value | 434 | | – | |
| Net investment income from assets backing policyholders’ liabilities | – | | – | |
| Gains less losses from financial investments | 88 | | 160 | |
| Dividend income | 42 | | 32 | |
| Net earned insurance premiums | 602 | | 553 | |
| Other operating income | 740 | | 359 | |
| |
| |
| |
| Total operating income | 22,412 | | 20,444 | |
| Net insurance claims incurred and movement in policyholders’ liabilities | (333 | ) | (312 | ) |
| |
| |
| |
| Net operating income before loan impairment charges and other credit risk provisions | 22,079 | | 20,132 | |
| Loan impairment charges and other credit risk provisions | (5,038 | ) | (5,022 | ) |
| |
| |
| |
| Net operating income | 17,041 | | 15,110 | |
| Total operating expenses | (10,217 | ) | (9,032 | ) |
| |
| |
| |
| Operating profit | 6,824 | | 6,078 | |
| Share of profit/(loss) in associates and joint ventures | 48 | | (8 | ) |
| |
| |
| |
| Profit before tax | 6,872 | | 6,070 | |
| |
| |
| |
| | % | | % | |
| Share of HSBC’s profit before tax | 32.8 | | 32.0 | |
| Cost efficiency ratio | 46.3 | | 44.9 | |
| Year-end staff numbers (full-time equivalent) | 75,926 | | 69,781 | |
| | | | | |
| | US$m | | US$m | |
| Selected balance sheet data1 | | | | |
| Loans and advances to customers (net) | 264,934 | | 248,616 | |
| Loans and advances to banks (net) | 14,013 | | 24,179 | |
| Trading assets, financial instruments designated at fair value, and financial investments | 116,269 | | 57,666 | |
| Total assets | 463,143 | | 371,183 | |
| Deposits by banks | 9,126 | | 15,284 | |
| Customer accounts | 125,830 | | 132,900 | |
| | | | | |
Despite cooling in the fourth quarter, GDP growth in the US was 3.5 per cent in 2005. Consumer spending grew by a healthy 3.6 per cent in 2005 despite slowing in the fourth quarter because of the hurricanes, higher energy costs and lower auto sales. Growth in equipment and software investment was robust, rising 11 per cent. Unemployment fell by 0.5 per cent to 4.9 per cent in 2005, with 2 million new jobs created. The Federal Reserve’s favoured inflation measure, the core personal consumption expenditure deflator, was contained, rising 2.0 per cent in 2005. Headline inflation in 2005 was higher due to increased energy prices, as the full year consumer price index rose 3.4 per cent. The Federal Reserve raised interest rates eight times during the year, from 2.25 per cent to 4.25 per cent. 10-year bond yields and equity markets rose moderately during 2005 as the US dollar strengthened, ending
the year at US$1.18 to the euro compared with US$1.35 at the end of 2004.
Canada’s growth was 2.9 per cent in 2005, as strong employment growth and, late in the year, rising earnings, boosted consumer spending. The unemployment rate fell to 6.4 per cent, the lowest level since 1976. In the second half of the year, exports rose, boosted by strong global demand. In the energy sector, investment and profits rose strongly as oil prices soared, with the positive economic impact being most pronounced in Western Canada. Gasoline prices lifted headline inflation to a peak of 3.4 per cent in September, but it fell back sharply and core inflation was 1.6 per cent by the year-end. Having been kept on hold for much of the year, interest rates were raised by 75 basis points between September and December. The Bank of
83
Back to Contents
H S B C H O L D I N G S P L C
Financial Review(continued)
Canada has indicated that further increases may be required.
Mexico’s GDP growth was 3.0 per cent compared with 4.2 per cent in 2004, in line with lower external demand from the US. The fiscal accounts for the year showed a reduced deficit of 0.9 per cent, mostly from windfall earnings from high oil prices. As in 2004, high oil receipts and increasing levels of workers’ remittances helped minimise the current account deficit at an estimated less than 1 per cent of GDP. The biggest achievement was the reduction in headline inflation from 5.2 per cent at the end of 2004 to 3.3 per cent in December 2005, with core inflation finishing the year at 3.1 per cent. HSBC views macroeconomic stability as encouragingly robust ahead of what looks likely to be a keenly contested presidential election in mid-2006.
HSBC’s operations in North America reported a pre-tax profit of US$6,872 million, compared with US$6,070 million in 2004, representing an increase of 13 per cent. On an underlying basis, pre-tax profits grew by 12 per cent and represented around 33 per cent of HSBC’s equivalent total profit. In the US, the benefits from strong deposit growth in Personal Financial Services were partly negated by narrowing spreads on lending in a rising interest rate environment. In Commercial Banking, growth in pre-tax profits was largely driven by lending and deposit balance growth and improved liability interest margins. In Corporate, Investment Banking and Markets, growth in revenues was offset by investment expenditure to build the required platform and infrastructure for future growth.
The commentary that follows is on an underlying basis.
Personal Financial Services, including the consumer finance business, generated a pre-tax profit of US$4,761 million, 8 per cent higher than in 2004. Under IFRSs, from 1 January 2005, HSBC changed the accounting treatment for certain debt issued and related interest rate swaps. This did not change the underlying economics of the transactions. The resulting revenues of US$618 million in 2004 are excluded from the following commentary. In addition, interest income earned on mortgage balances held on HSBC’s balance sheet pending sale into the US secondary mortgage market has been reported under trading income. In 2004 this was reported in net interest income. This difference in treatment has also been excluded from the following commentary.
In the US, profit before tax rose 28 per cent to US$3,853 million. The rise in profit was largely
driven by widening deposit spreads, strong deposit and customer loan growth and higher fee income, partly offset by lower asset spreads due to higher funding costs. Loan impairment charges fell, notwithstanding the higher charges due to the combined impacts of Hurricane Katrina and changes in bankruptcy legislation. In Mexico, excluding the transfer of some customers to the Commercial Banking segment due to alignment with Group standards, pre-tax profits rose. This was driven by strong revenue growth from higher deposit balances and widening spreads, strong loan growth and higher fee income, partly offset by the non-recurrence in 2005 of loan impairment provision releases in 2004.
Net interest income grew by 5 per cent to US$12,753 million, largely from increases in the US and Mexico. In the US, net interest income rose by 3 per cent largely driven by higher deposit balances and widening deposit spreads. Average loan balances grew strongly, in particular from prime and non-prime residential mortgages. With ongoing strong demand for unsecured lending, the credit card, private label card and personal non-credit card, portfolios continued to grow. The benefits of strong asset growth were largely offset by lower spreads as interest rates rose.
Additional resources were focused on the core retail banking business in the US as high priority was given to growing the deposit base. Investment in the retail branch network continued, to ensure a presence in locations with high growth potential. During the year, 27 new branches were opened, each tailored to meet the needs of the local market. The launch of two new deposit products, HSBC’s first national savings product, ‘Online Savings’, and ‘HSBCPremier Savings’, augmented by a 45 per cent rise in new personal account openings, led to a 4 per cent growth in average deposit balances to US$26.7 billion.
Overall, average mortgage balances including US$3.3 billion held for resale were US$112.1 billion, representing a 27 per cent increase. This was due to the significant expansion of adjustable rate mortgages (‘ARMs’) originated during 2004 in the US bank and strong growth within the mortgage services and branch-based consumer lending businesses. These volume benefits were largely offset by narrowing spreads as yields fell due to changes in product mix and higher funding costs.
Prime mortgages originated in 2005 were largely sold into the large government sponsored mortgage associations, reflecting a strategic decision to focus on loans originated through the retail
84
Back to Contents
channel, and reduce HSBC’s reliance on lower spread business generated by the network of mortgage correspondents. The improvements in retail channel sales were achieved by capitalising on the HSBC brand, and the newly expanded branch network and customer base. As interest rates rose, demand for ARM products in 2005 declined as customers migrated towards longer-term fixed rate mortgages. ARM-originated loans fell from 67 per cent of all loans originated in 2004 to 30 per cent this year. Spreads narrowed on prime mortgages, largely because of higher funding costs, together with marginally lower yields due to the full year effect of the strong growth of lower-yielding ARMs originated in 2004.
HSBC continued to grow its sub-prime and near-prime mortgage portfolios, primarily within the mortgage services and branch-based consumer lending businesses. The mortgage services business, which purchases mortgage loans from a network of correspondents, recorded strong average loan growth of 42 per cent to US$39.1 billion, of which US$1.7 billion related to mortgages held for resale. Continued focus on growing the second lien portfolio, widening the first lien product offering and expanding sources for the purchase of loans from ‘flow’ correspondents contributed further to the increase. Within the branch-based consumer lending business, average mortgage balances grew by 19 per cent to US$35.7 billion, reflecting a combination of increased marketing activity and higher sales volume of near-prime and ARMs, first introduced in the second half of 2004. In addition, the consumer lending business purchased US$1.7 billion of largely sub-prime mortgage loans through a portfolio acquisition programme. The benefits of higher sub-prime and near-prime balances were largely offset by lower spreads. Yields fell, due to the combined effects of strong refinancing activity, significant amounts of older higher-yielding loans maturing, continued product expansion into the near-prime customer segments and competitive pricing pressures. The higher cost of funds due to rising interest rates also contributed to the decline in spreads.
Average loan balances within the consumer finance credit cards business rose by 7 per cent to US$19.8 billion, despite the highly competitive environment, where overall market growth remained weak. By increasing the level of marketing promotions, HSBC was able to grow organically the HSBC branded prime, Union Privilege and non-prime portfolios. The benefit of higher balances was more than offset by higher funding costs. Yields, however, improved due to a combination of higher-
yielding sub-prime receivable balances, increased pricing on variable rate products and other re-pricing initiatives.
In the retail services cards business, average loan balances grew by 7 per cent to US$15.9 billion. This growth was driven by new loan originations and the agreement of new merchant relationships with The Neiman Marcus Group Inc, Bon Ton Stores Inc and OfficeMax, which contributed US$506 million of the overall increase. The benefit of higher loan balances was more than offset by lower spreads. Spreads declined as a large proportion of the loan book, priced at fixed rates, was affected by higher funding costs as interest rates rose. Spreads also narrowed as changes in the product mix reflected strong growth of lower-yielding recreational vehicle balances and external pricing pressures. Changes in contractual obligations associated with a merchant also had an adverse effect, but this resulted in lower merchant fees payable.
The vehicle finance business reported strong organic growth, with a 14 per cent increase in average loan balances, largely due to increases in the near-prime portfolio. This growth in balances was mainly driven by a combination of higher new loan originations acquired from the dealer network, in part due to the success of the ‘employee pricing’ incentive programmes introduced by a number of the large car manufacturers, and strong growth in the consumer direct loan programme. A new strategic alliance helped grow loans further, generating US$234 million of new balances. These volume benefits were largely offset by lower spreads, due to higher funding costs and lower yields. Yields fell due to product expansion into the near-prime portfolio, coupled with competitive pricing pressures due to excess market capacity.
Personal non-credit card average loan balances in the consumer finance business grew by 8 per cent to US$16.0 billion, reflecting the success of several large direct mail campaigns and increased availability of this product in the US market. Improvements in underwriting processes, aided by continued improvements in the US economy, also contributed to the increase. These benefits were partly offset by lower spreads, due to higher funding costs.
In Mexico, net interest income rose, primarily due to strong deposit and loan growth, coupled with the widening of deposit spreads. In 2005, HSBC in Mexico widened its competitive funding advantage, maintaining the lowest funding cost in the market. There was strong growth in consumer lending, although asset spreads declined, reflecting a
85
Back to Contents
H S B C H O L D I N G S P L C
Financial Review(continued)
reduction in yields in an increasingly competitive market. Funding costs rose, due to higher average interest rates.
HSBC in Mexico continued to lead the market in customer deposit growth, with a 1.5 per cent increase in market share to 15.9 per cent, despite a highly competitive market place. This was largely due to the success of the ‘Tu Cuenta’ product, the only integrated financial services product of its kind offered locally. Since its launch in February 2005, over 600,000 accounts have been opened, averaging some 2,300 new customers per day.
The continued success of HSBC’s competitive fixed rate mortgage product in Mexico, helped by strong demand from first time buyers, led to average mortgage balances increasing by 93 per cent to US$522 million, and market share reached 10.7 per cent. In Mexico, HSBC continued to be the leader in vehicle finance with a market share of 26.5 per cent. A unique new internet based product ‘Venta Directa’ was launched during the year, enabling the direct sales of used cars between customers using HSBC’s financing and website as the intermediary. The targeting of new customer segments and more competitive pricing drove average vehicle finance loans higher by US$228 million to US$796 million, a 40 per cent increase over 2004. Average payroll loan balances more than doubled to US$253 million, reflecting HSBC’s unique position in the market granting pre-approved personal loans through its ATM network. Average credit card balances were 55 per cent higher, with cards in circulation increasing by 80 per cent to over 1.1 million cards. This was largely driven by cross-selling to the existing customer base using CRM and the successful launch of the ‘Tarjeta inmediata’ or Instant credit card, which generated 109,000 new cards.
In Canada, net interest income grew by 21 per cent, due to growth in average loan and deposit balances, augmented by widening deposit spreads. Branch expansion in the consumer finance business generated higher average loan balances in real estate secured and unsecured lending. Credit card balances also grew, following the successful launch of a MasterCard programme.
Net fee income grew by 20 per cent to US$3,511 million, driven by strong performances in the US and Mexico. In the US, the 23 per cent increase was mainly from retail and credit card services, the mortgage banking business and the taxpayer financial services business. Fee income within the consumer finance credit cards business increased by 19 per cent, or US$300 million, largely
because of increased transaction volumes, loan balance growth and improved interchange rates. Greater use of the ‘intellicheck’ product, which enables customers to pay their credit card balances over the telephone, contributed an additional US$33m of revenues. Revenues from ancillary services rose US$77 million, reflecting higher sales volumes, new product launches and expansion into new customer segments.
Within the US retail services business, fee income rose, mainly from lower merchant partnership payments due to changes in contractual obligations with certain clients. In part, this reflected lower loan spreads associated with lower merchant payments.
Fee income from the US mortgage-banking business increased. As interest rates gradually rose, refinancing prepayments of mortgages declined, with levels of loan refinancing activity falling from 50 per cent of total loans originated in 2004 to 44 per cent in 2005. This led to lower amortisation charges and the subsequent release of temporary impairment provisions on mortgage servicing rights. Furthermore, the value of servicing rights was better protected by an improved economic hedging programme using a combination of derivative financial instruments and investment securities. A revised fee structure, introduced in the second half of 2004, produced a 6 per cent increase in fee income from deposit-related services in the US Bank.
Within the US taxpayer financial services business, fee income grew by 12 per cent, driven by higher average loan balances and the sale of previously written-off loan balances. HSBC is the sole provider of bank products to H&R Block, the largest retail tax preparation firm in the US, and in September 2005 extended this arrangement by signing a new five-year contract. Since June 2004, HSBC has retained in-house the clearing business for refund anticipation payments, previously carried out by a third party. This generated additional revenues of US$19 million for HSBC in the US.
HSBC in Mexico reported strong growth in fee income, driven by higher revenues from credit cards, remittances, mortgages and ATM transactions. The increase in the number of credit cards in circulation contributed to the 85 per cent increase in credit card fee income. Fees from the ‘Afore’ pension funds business continued to perform strongly, with 50 per cent growth and 394,000 new customers. Fee income from international remittances rose by 55 per cent, partly led by the continued success of ‘La Efectiva’, HSBC’s electronic remittance card. Monthly transactions exceeded one million, representing a
86
Back to Contents
20 per cent market share and a near seven-fold increase since December 2002. Strong sales of insurance products resulted from increased cross-selling through the branch network and combining sales with other Personal Financial Services products containing insurance components. Mutual fund balances grew by 58 per cent, partly attributable to the successful launch of new funds targeting different market segments, along with strong cross-sales among HSBC’s extensive customer base.
Trading income in 2005 was in line with 2004. In the US mortgage banking business revenues increased, largely as a result of more originations and sales related income, which reflected improved gains on each individual sale and a 41 per cent increase in the volume of originated loans sold. In addition, a higher percentage of ARM loans that previously would have been held on balance sheet were sold in 2005. This was partly offset by lower gains on Decision One sales in the mortgage services business.
The increase in other income was largely due to the US. Losses from sales of properties repossessed after customers default on their mortgage payments, which are recorded as a reduction in other income, were US$96 million lower than in 2004. This was attributable to improvements in the process by which fair market value is determined at the time of repossession, and to a reduction in the number of properties falling into repossession as credit quality improved.
Loan impairment charges and other credit risk provisions of US$5,086 million were marginally lower than in 2004. In the US, charges were lower notwithstanding the adverse effect of Hurricane Katrina and higher bankruptcy filings following changes in bankruptcy legislation. Partly offsetting these impacts was the non-recurrence of US$47 million charges from adopting Federal Financial Institutions Examination Council charge-off policies relating to retail and credit card balances in 2004. Excluding these factors, the lower charge reflected favourable credit conditions in the US. Higher levels of secured lending, continued targeting of higher credit quality customers and improvements in underwriting contributed to the reduction. In Mexico loan impairment charges rose in line with higher lending volumes and the non-recurrence in 2005 of loan impairment provision releases in 2004, while underlying credit quality remained stable. In Canada, charges were in line with prior year, as higher charges in the consumer lending business due to loan growth were offset by provision releases in the core bank business.
Operating expenses grew by 6 per cent to US$7,382 million, largely in the US and Mexico. In the US, costs increased by 3 per cent, as staff and marketing costs rose in the consumer finance business to support revenue growth. Acquisition costs were incurred following the Metris purchase. In the credit cards business, higher marketing spend was incurred on the non-prime portfolios and investment in new initiatives. Higher marketing expenses were also incurred following changes in contractual obligations associated with the General Motors’ co-branded credit card portfolio in July 2004, but these were partly offset by improved income through lower account origination fees.
In the US Bank, costs grew to support business expansion and new branch openings. Brand awareness programmes in the second and fourth quarters increased marketing costs, and expenditure was incurred on promoting the online savings product. The benefit of these initiatives was reflected in a significant increase in customer awareness of the HSBC brand. Within the retail brokerage business, cost increases reflected more stringent regulatory requirements.
In Mexico, operating expenses grew by 21 per cent, driven by a combination of higher staff, marketing and IT costs. Staff costs grew by 12 per cent, reflecting increases incurred to improve customer service levels within the branch network and bonus costs in line with increased sales. Marketing costs grew to support the credit cards business, evidenced by the 80 per cent increase in the number of cards in circulation. IT costs rose as new systems to meet Group standards, such as the WHIRL credit card platform, were rolled out. In Canada, operating expenses grew due to the opening of new branches within the consumer finance business, and expansion of the mortgage and credit cards businesses.
Commercial Banking’s pre-tax profits increased by 23 per cent to US$1,064 million, primarily due to lending growth and improved liability interest spreads.
Net interest income increased by 23 per cent to US$1,449 million. In the US, deposit growth, particularly among small businesses, contributed to a 20 per cent increase in net interest income. The recruitment of additional sales and support staff and expansion on both the East and West coasts led to a 15 per cent increase in deposits and a 16 per cent increase in lending balances, with income from commercial real estate lending increasing by 27 per cent. HSBC achieved particularly strong growth in the SME market and maintained its market leading
87
Back to Contents
H S B C H O L D I N G S P L C
Financial Review(continued)
position in small business administration lending in New York state. Following its launch in the first half of 2005, the ‘Select Investor’ product, which offers competitive tiered interest rates, attracted US$420 million of deposits. ‘Business Smart’, a product offering free checking and other value offerings to commercial customers, performed strongly following its launch at the end of 2004, attracting 41,000 new customers and balances of over US$1.0 billion.
In Canada, net interest income increased by 16 per cent, as higher oil and other natural resource prices led to strong economic growth and low interest rates increased demand for lending products. Average lending balances increased by 20 per cent, as leasing balances grew by 33 per cent and commercial real estate lending rose by 19 per cent. Average deposit and current account balances increased by 21 per cent and 24 per cent respectively, reflecting the buoyant economy, the launch of HSBCnet in Canada and more brand advertising. Both asset and liability spreads were broadly in line with 2004.
In Mexico, the transfer of a number of customers from Personal Financial Services increased both revenues and costs. Net interest income increased by 42 per cent, due in part to a 22 per cent increase in Commercial Banking customers. Deposit balances grew by 38 per cent as a result of expansion into the SME market, while deposit spreads increased by 76 basis points following interest rate rises. Loan balances rose by 21 per cent, principally in the services and commerce sectors, though competitive pricing led to a tightening of lending spreads. The ‘Estimulo’ combined loan and overdraft product, which was launched at the end of 2004, performed strongly, attracting balances of US$155 million.
Other income lines, including net fee income, increased by 11 per cent to US$541 million. In Mexico, marketing campaigns, tariff reductions and the promotion of business internet banking, together with increased customer numbers, contributed to a 31 per cent increase in payment and cash management fees, while card fees increased following the launch of a credit card as part of the ‘Estimulo’ suite of products. Trade services fee income increased by 63 per cent as a result of customer acquisition and increased cross-sales to existing customers, nearly doubling the bank’s market share in a growing market. In the US, higher gains on the sale of properties and investments contributed to a 4 per cent increase in other income.
Loan impairment charges were US$13 million, following net releases in 2004. Significant releases in Canada were more than offset by higher charges, driven by lending growth, in the US and Mexico. In Canada, improved credit quality led to a US$34 million net release of loan impairment provisions. In the US, credit quality remained high in the favourable economic conditions, with impaired loans as a proportion of assets decreasing by 49 basis points. In Mexico, growth in the lending portfolio led to a US$49 million increase in loan impairment charges, although underlying credit quality improved.
Operating expenses increased by 13 per cent to US$913 million, driven by increases in the US and Mexico. In the US, expansion in the SME and MME markets and in the commercial mortgage sector led to a 17 per cent increase in staff numbers. New MME offices were opened in Philadelphia and New Jersey, following the establishment of offices in Los Angeles and San Francisco in 2004. The launch of ‘Select Investor’ and promotion of ‘Business Smart’ led to higher marketing costs. In Mexico, operating expenses increased by 29 per cent, due to an 11 per cent increase in staff numbers to support business growth, higher incentive payments reflecting strong income growth, and increased ‘Estimulo’ marketing expenditure.
Corporate, Investment Banking and Marketsreported a pre-tax profit of US$774 million, 22 per cent lower than in 2004. The overall increase in revenue was exceeded by higher expenses, which reflected the full year cost of the expanded operations in the US and the continuing investment in a number of specific initiatives designed to build stronger execution and delivery capabilities.
Total operating income rose by 12 per cent. In Mexico, net income more than doubled, due to the strong performance in balance sheet management, which benefited from higher volumes and successful strategic positioning against a rising short-term interest rate environment, with an overall flattening of the yield curve in the first part of 2005. In the latter half of the year, positions were effectively managed to take advantage of the decline in local rates. In the US and Canada, balance sheet management and money market revenues declined by US$353 million, as rising US dollar short-term interest rates led to further flattening of the yield curve.
Net interest income from the payments and cash management business in the US grew by 65 per cent, principally due to an 82 per cent growth in balances.
Net fees increased by 25 per cent, primarily due
88
Back to Contents
to higher volumes in Global Investment Banking, reflecting positive momentum from an extension of the product range, particularly in debt capital markets, where earnings grew by 67 per cent. Equity capital markets revenue improved from a low base and higher income streams were generated from a regular flow of new deals from asset-backed securities. Global Transaction Banking fees rose, reflecting higher customer volumes in payments and cash management, particularly in Mexico.
Income from trading activities increased, due in part to higher revenues in the US from credit trading, following losses in 2004, and a tightening of credit spreads. Business lines in which HSBC has invested, such as equities and structured derivatives, also showed strong year-on-year gains. In addition, foreign exchange and derivatives trading was facilitated by the introduction of the Group’s standard derivatives system in Mexico.
There was a reduction of US$28 million in the net release of loan impairment allowances, primarily due to the non-recurrence of a number of large releases. New impairment allowances against corporate clients remained broadly in line with last year.
Operating expenses increased by 45 per cent to US$1,511 million. In 2005, the proportionately greater investment in North America compared with other regions reflected HSBC’s commitment to strengthen global reach by developing its presence in this region. HSBC continued to invest throughout the year in expanding product capabilities, particularly in structured derivatives, equities, research, mortgage-backed securities and advisory, and the build out of specialist sector teams in the US and Mexico. Nearly half of the incremental cost was attributable to this investment.
Staff costs rose by 43 per cent, reflecting the full year of recruitment in the latter part of 2004 and selective hiring in 2005, which resulted in an increase of 870 staff in Corporate, Investment Banking and Markets in North America.
Non-staff costs grew correspondingly and included the expense incurred in building critical infrastructure and investment in new technology.
Private Banking contributed a pre-tax profit of US$104 million, an increase of 55 per cent on 2004, driven by growth in client assets and the balance
sheet, and the expansion of Wealth and Tax Advisory Services (‘WTAS’).
Net interest income increased by 13 per cent. Lending balances rose by over 30 per cent as clients borrowed on a secured basis to make alternative investments. Mortgage lending also grew, supported by the launch of a ‘Tailored Mortgage’ product during the year. Spreads on current accounts increased by 40 basis points, reflecting the benefit of interest rate increases during the year.
A number of smaller trust accounts were sold in 2005, generating one-off income of US$9 million. This was partly offset by the non-recurrence of gains from financial investments arising from the sale of seed capital investments in 2004. WTAS expanded its presence in New York, Philadelphia, Los Angeles, San Francisco and Virginia through the recruitment of fee-generating staff, and grew organically through referrals, contributing to an increase of 15 per cent in fee income.
Client assets grew by 12 per cent to US$46.2 billion, contributing to the rise in fee and other operating income. US$4.2 billion of net new money reflected client acquisition in the US and in Mexico, following the launch of Private Banking there in 2004. This was partly offset by the divestment of trust accounts referred to above. The ‘Strategic Investment Solutions’ product, launched in March 2004, was markedly successful in attracting new funds. Discretionary managed assets invested in this product reached US$0.9 billion.
Operating expenses of US$334 million were 13 per cent higher than last year. The recruitment of front office staff in Private Banking, and new fee-generating staff in WTAS, added to the cost base. This was partly offset by headcount savings through restructuring and the sale of the trust account business referred to above.
Increased activity at HSBC’s North American technology centre led to an increase in both costs and net operating income inOther, as higher network and systems maintenance costs and development expenditure to meet increased technological requirements were recharged to other customer groups. Movements in the fair value of own debt and the associated swaps designated at fair value led to a US$401 million increase in total operating income.
89
Back to Contents
H S B C H O L D I N G S P L C
Financial Review(continued)
Profit/(loss) before tax by customer group
| | | | | | | | Year ended 31 December 2005 | | | | | | | | |
| |
| | |
| | | | | | | | Corporate, | | | | | | | | | | | | | | |
| | Personal | | | | | | Investment | | | | | | | | | Inter- | | | | | |
| | Financial | | | Commercial | | | Banking & | | | Private | | | | | | segment | | | | | |
| | Services | | | Banking | | | Markets | | | Banking | | | Other | | | elimination | | | Total | | |
| North America | US$m | | | US$m | | | US$m | | | US$m | | | US$m | | | US$m | | | US$m | | |
| | | | | | | | | | | | | | | | | | | | | | |
| Net interest income/(expense) | 12,753 | | | 1,449 | | | 842 | | | 190 | | | (115 | ) | | (232 | ) | | 14,887 | | |
| Net fee income/ (expense) . | 3,511 | | | 425 | | | 626 | | | 203 | | | (159 | ) | | – | | | 4,606 | | |
| Trading income excludingnet interest income | 160 | | | 12 | | | 168 | | | 10 | | | 21 | | | – | | | 371 | | |
| Net interest income/ (expense) on trading activities | 210 | | | (4 | ) | | 225 | | | – | | | (21 | ) | | 232 | | | 642 | | |
| Net trading income/ (expense) | 370 | | | 8 | | | 393 | | | 10 | | | – | | | 232 | | | 1,013 | | |
| Net income from financial instruments designated at fair value | 10 | | | – | | | 23 | | | (1 | ) | | 402 | | | – | | | 434 | | |
| Gains less losses from financial investments | 22 | | | 1 | | | 64 | | | – | | | 1 | | | – | | | 88 | | |
| Dividend income | 9 | | | – | | | 33 | | | – | | | – | | | – | | | 42 | | |
| Net earned insurance premiums | 603 | | | – | | | – | | | – | | | (1 | ) | | – | | | 602 | | |
| Other operating income | 285 | | | 107 | | | 205 | | | 34 | | | 1,279 | | | (1,170 | ) | | 740 | | |
| |
| | |
| | |
| | |
| | |
| | |
| | |
| | |
| Total operating income | 17,563 | | | 1,990 | | | 2,186 | | | 436 | | | 1,407 | | | (1,170 | ) | | 22,412 | | |
| Net insurance claims1 | (334 | ) | | – | | | – | | | – | | | 1 | | | – | | | (333 | ) | |
| |
| | |
| | |
| | |
| | |
| | |
| | |
| | |
| Net operating income before loan impairment | | | | | | | | | | | | | | | | | | | | | |
| charges and other credit risk provisions | 17,229 | | | 1,990 | | | 2,186 | | | 436 | | | 1,408 | | | (1,170 | ) | | 22,079 | | |
| | | | | | | | | | | | | | | | | | | | | | |
| Loan impairment chargesand other credit risk provisions | (5,086 | ) | | (13 | ) | | 60 | | | 2 | | | (1 | ) | | – | | | (5,038 | ) | |
| |
| | |
| | |
| | |
| | |
| | |
| | |
| | |
| Net operating income | 12,143 | | | 1,977 | | | 2,246 | | | 438 | | | 1,407 | | | (1,170 | ) | | 17,041 | | |
| Total operating expenses | (7,382 | ) | | (913 | ) | | (1,511 | ) | | (334 | ) | | (1,247 | ) | | 1,170 | | | (10,217 | ) | |
| |
| | |
| | |
| | |
| | |
| | |
| | |
| | |
| Operating profit/(loss) | 4,761 | | | 1,064 | | | 735 | | | 104 | | | 160 | | | – | | | 6,824 | | |
| | | | | | | | | | | | | | | | | | | | | | |
| Share of profit in associates and joint ventures | – | | | – | | | 39 | | | – | | | 9 | | | – | | | 48 | | |
| |
| | |
| | |
| | |
| | |
| | |
| | |
| | |
| Profit/(loss) before tax | 4,761 | | | 1,064 | | | 774 | | | 104 | | | 169 | | | – | | | 6,872 | | |
| |
| | |
| | |
| | |
| | |
| | |
| | |
| | |
| | % | | | % | | | % | | | % | | | % | | | | | | % | | |
| | | | | | | | | | | | | | | | | | | | | | |
| Share of HSBC’s profitbefore tax | 22.7 | | | 5.1 | | | 3.7 | | | 0.5 | | | 0.8 | | | | | | 32.8 | | |
| Cost efficiency ratio | 42.8 | | | 45.9 | | | 69.1 | | | 76.6 | | | 88.6 | | | | | | 46.3 | | |
| | | | | | | | | | | | | | | | | | | | | | |
| | US$m | | | US$m | | | US$m | | | US$m | | | US$m | | | | | | US$m | | |
| Selected balance sheetdata2 | | | | | | | | | | | | | | | | | | | | | |
| Loans and advances tocustomers (net) | 212,058 | | | 32,700 | | | 15,250 | | | 4,926 | | | – | | | | | | 264,934 | | |
| Total assets | 247,928 | | | 40,821 | | | 168,524 | | | 5,870 | | | – | | | | | | 463,143 | | |
| Customer accounts | 57,401 | | | 26,324 | | | 32,514 | | | 9,590 | | | 1 | | | | | | 125,830 | | |
| | | | | | | | | | | | | | | | | | | | | | |
| Loans and advances tobanks (net)3 | | | | | | | 13,658 | | | | | | | | | | | | | | |
| | | | | | | | | | | | | | | | | | | | | | |
| Trading assets, financial instruments designated at | | | | | | | | | | | | | | | | | | | | | |
| fair value, and financial investments3 | | | | | | | 112,000 | | | | | | | | | | | | | | |
| Deposits by banks3 | | | | | | | 8,561 | | | | | | | | | | | | | | |
| | | | | | | | | | | | | | | | | | | | | | |
| 1 | Net insurance claims incurred and movement in policyholders’ liabilities. |
| 2 | Third party only. |
| 3 | These assets and liabilities were significant to Corporate, Investment Banking and Markets. |
90
Back to Contents
| | Year ended 31 December 2004 | |
| |
| |
| | | | | | Corporate, | | | | | | | | | |
| | Personal | | | | Investment | | | | | | Inter- | | | |
| | Financial | | Commercial | | Banking & | | Private | | | | segment | | | |
| | Services | | Banking | | Markets | | Banking | | Other | | elimination | | Total | |
| North America | US$m | | US$m | | US$m | | US$m | | US$m | | US$m | | US$m | |
| | | | | | | | | | | | | | | |
| Net interest income/(expense) | 12,915 | | 1,147 | | 870 | | 166 | | (105 | ) | – | | 14,993 | |
| Net fee income/(expense). | 2,885 | | 302 | | 491 | | 176 | | (89 | ) | – | | 3,765 | |
| Trading income | 221 | | 15 | | 339 | | 6 | | 1 | | – | | 582 | |
| Gains less losses from financial investments | 80 | | 5 | | 68 | | 6 | | 1 | | – | | 160 | |
| Dividend income | 14 | | – | | 20 | | – | | (2 | ) | – | | 32 | |
| Net earned insurancepremiums | 553 | | – | | – | | – | | – | | – | | 553 | |
| Other operating income | (7 | ) | 154 | | 129 | | 4 | | 1,065 | | (986 | ) | 359 | |
| |
| |
| |
| |
| |
| |
| |
| |
| Total operating income | 16,661 | | 1,623 | | 1,917 | | 358 | | 871 | | (986 | ) | 20,444 | |
| Net insurance claims1 | (312 | ) | – | | – | | – | | – | | – | | (312 | ) |
| |
| |
| |
| |
| |
| |
| |
| |
| Net operating income before loan impairment | | | | | | | | | | | | | | |
| charges and other credit risk provisions | 16,349 | | 1,623 | | 1,917 | | 358 | | 871 | | (986 | ) | 20,132 | |
| Loan impairment charges and other credit riskprovisions | (5,120 | ) | 9 | | 88 | | 2 | | (1 | ) | – | | (5,022 | ) |
| |
| |
| |
| |
| |
| |
| |
| |
| Net operating income | 11,229 | | 1,632 | | 2,005 | | 360 | | 870 | | (986 | ) | 15,110 | |
| Total operating expenses | (6,845 | ) | (784 | ) | (1,024 | ) | (292 | ) | (1,073 | ) | 986 | | (9,032 | ) |
| |
| |
| |
| |
| |
| |
| |
| |
| Operating profit/(loss) | 4,384 | | 848 | | 981 | | 68 | | (203 | ) | – | | 6,078 | |
| Share of profit/(loss) in associates and joint ventures | – | | – | | (15 | ) | – | | 7 | | – | | (8 | ) |
| |
| |
| |
| |
| |
| |
| |
| |
| Profit/(loss) before tax | 4,384 | | 848 | | 966 | | 68 | | (196 | ) | – | | 6,070 | |
| |
| |
| |
| |
| |
| |
| |
| |
| | % | | % | | % | | % | | % | | | | % | |
| | | | | | | | | | | | | | | |
| Share of HSBC’s profitbefore tax | 23.1 | | 4.5 | | 5.1 | | 0.3 | | (1.0 | ) | | | 32.0 | |
| Cost efficiency ratio | 41.9 | | 48.3 | | 53.4 | | 81.6 | | 123.2 | | | | 44.9 | |
| | | | | | | | | | | | | | | |
| | US$m | | US$m | | US$m | | US$m | | US$m | | | | US$m | |
| Selected balance sheet data2 | | | | | | | | | | | | | | |
| Loans and advances to customers (net) | 191,727 | | 26,850 | | 26,166 | | 3,871 | | 2 | | | | 248,616 | |
| Total assets | 228,451 | | 31,407 | | 106,713 | | 4,538 | | 74 | | | | 371,183 | |
| Customer accounts | 51,165 | | 27,167 | | 46,745 | | 7,822 | | 1 | | | | 132,900 | |
| The following assets and liabilities were significant | | | | | | | | | | | | | | |
| to Corporate, Investment Banking and Markets: | | | | | | | | | | | | | | |
| Loans and advances tobanks (net) | | | | | 23,817 | | | | | | | | | |
| Trading assets, financial instruments designated at | | | | | | | | | | | | | | |
| fair value, and financial investments | | | | | 46,700 | | | | | | | | | |
| Deposits by banks | | | | | 14,887 | | | | | | | | | |
| | |
| 1 | Net insurance claims incurred and movement in policyholders’ liabilities. |
| 2 | Third party only. |
91
Back to Contents
H S B C H O L D I N G S P L C
Financial Review(continued)
South America
Profit/(loss) before tax by country within customer group
| | Year ended 31 December | | |
| |
| | |
| | 2005 | | | 2004 | | |
| | US$m | | | US$m | | |
| | | | | | | |
| Personal Financial Services | 206 | | | 93 | | |
| Brazil | 167 | | | 98 | | |
| Argentina | 37 | | | (5 | ) | |
| Other | 2 | | | – | | |
| Commercial Banking | 185 | | | 159 | | |
| Brazil | 147 | | | 108 | | |
| Argentina | 35 | | | 50 | | |
| Other | 3 | | | 1 | | |
| Corporate, Investment Banking and Markets | 146 | | | 109 | | |
| Brazil | 95 | | | 92 | | |
| Argentina | 56 | | | 8 | | |
| Other | (5 | ) | | 9 | | |
| Private Banking | 1 | | | – | | |
| Brazil | 1 | | | 1 | | |
| Other | – | | | (1 | ) | |
| Other | 109 | | | 79 | | |
| Brazil | (4) | | | (18 | ) | |
| Argentina | 116 | | | 101 | | |
| Other | (3 | ) | | (4 | ) | |
| |
| | |
| | |
| Total | 647 | | | 440 | | |
| Brazil | 406 | | | 281 | | |
| Argentina | 244 | | | 154 | | |
| Other | (3 | ) | | 5 | | |
92
Back to Contents
Profit before tax
| | Year ended 31 December | |
| |
| |
| | 2005 | | 2004 | |
| South America | US$m | | US$m | |
| | | | | |
| Net interest income | 1,750 | | 1,310 | |
| Net fee income | 537 | | 459 | |
| Trading income | 409 | | 54 | |
| Net income from financial instruments designated at fair value | 186 | | – | |
| Net investment income on assets backing policyholders’ liabilities | – | | 95 | |
| Gains less losses from financial investments | 39 | | 34 | |
| Dividend income | 4 | | 2 | |
| Net earned insurance premiums | 746 | | 596 | |
| Other operating income | 188 | | 28 | |
| |
| |
| |
| Total operating income | 3,859 | | 2,578 | |
| Net insurance claims incurred and movement in policyholders’ liabilities | (691 | ) | (459 | ) |
| |
| |
| |
| Net operating income before loan impairment charges and other credit risk provisions | 3,168 | | 2,119 | |
| Loan impairment charges and other credit risk provisions | (554 | ) | (267 | ) |
| |
| |
| |
| Net operating income | 2,614 | | 1,852 | |
| Total operating expenses | (1,967 | ) | (1,413 | ) |
| |
| |
| |
| Operating profit | 647 | | 439 | |
| Share of profit in associates and joint ventures | – | | 1 | |
| |
| |
| |
| Profit before tax | 647 | | 440 | |
| |
| |
| |
| | | | | |
| | % | | % | |
| | | | | |
| Share of HSBC’s profit before tax | 3.1 | | 2.3 | |
| Cost efficiency ratio | 62.1 | | 66.7 | |
| Year-end staff numbers (full-time equivalent) | 33,282 | | 32,108 | |
| | | | | |
| | US$m | | US$m | |
| | | | | |
| Selected balance sheet data1 | | | | |
| Loans and advances to customers (net) | 9,307 | | 7,228 | |
| Loans and advances to banks (net) | 5,282 | | 2,624 | |
| Trading assets, financial instruments designated at fair value, and financial investments | 6,579 | | 3,857 | |
| Total assets | 24,734 | | 17,368 | |
| Deposits by banks | 1,252 | | 680 | |
| Customer accounts | 16,545 | | 10,958 | |
| | | | | |
InBrazil, the cyclical slowdown which began in late 2004 continued throughout 2005, with full-year GDP growth of 2.3 per cent compared with 4.9 per cent in 2004. This modest performance was the result of tight monetary policy, political uncertainty and the appreciation of the Brazilian real. External demand provided support, with exports growing by 23 per cent in 2005 to record levels, helping to create trade and current account surpluses of US$45 billion and US$14 billion respectively, and increasing net international reserves by 96 per cent to US$54 billion. The tight monetary policy, with real interest rates among the highest in the world at 10.5 per cent, slowed inflation from 7.6 per cent in 2004 to 5.7 per cent in 2005, in line to achieve the Central Bank’s 4.5 per cent inflation target for 2006. Having established its anti-inflationary credentials, the Central Bank cut interest rates by 175 basis points
between September and the end of 2005 in order to stimulate growth and ease the pressure on the real.
InArgentina, the recovery from the crisis of 2001 continued in 2005, helped by a favourable external environment and the success of the offer to exchange replacement discount bonds issued in June for defaulted debt. Average GDP growth was 9.1 per cent in 2005. Fiscal performance remained strong, with the public sector posting an overall surplus of approximately 3.3 per cent of GDP. This surplus helped to offset the expansionary effect on money supply growth of the large foreign exchange interventions of the Central Bank, which continued to pursue a nominal rate policy of near stability against the US dollar despite strong upward pressure on the Argentine peso. This policy was supported by newly introduced controls on capital inflows. Inflation remained a concern, however, having accelerated to
93
Back to Contents
H S B C H O L D I N G S P L C
Financial Review (continued)
12.3 per cent in December 2005. Following the example of Brazil, at the end of the year the authorities decided to make an early repayment of Argentina’s US$9.8 billion debt owed to the International Monetary Fund.
HSBC’s operations in South America reported a pre-tax profit of US$647 million, compared with US$440 million in 2004, representing an increase of 47 per cent. On an underlying basis, pre-tax profits grew by 28 per cent and represented around 3 per cent of HSBC’s equivalent total profit. Growth was achieved, in part, as a result of a US$89 million gain on the sale of Brazil’s property and casualty insurance business. HSBC in Argentina benefited from a strong economic recovery and certain one-off items including the receipt of compensation bonds.
The commentary that follows is on an underlying basis.
Personal Financial Services reported a pre-tax profit of US$206 million, an increase of 76 per cent, partly as a result of gains on the sale of the Brazilian property and casualty insurance business. The remaining increase was driven by strong loan growth in vehicle finance and personal lending, together with record credit card sales. The cost efficiency ratio improved by 5 percentage points, even though higher income was partly offset by increased costs to support business expansion and develop alternative sales channels. The investment in alternative channels led to a 15 per cent increase in direct sales volumes to over 3.2 million, with particularly strong growth in personal lending, cards and insurance. Loan impairment charges increased, reflecting lending growth in Brazil and an increase in delinquency rates in the consumer finance business. In 2005, the reporting of the Brazilian insurance business transferred from ‘Other’ to Personal Financial Services. Profit before tax increased by US$16 million as a result, though individual account lines showed much larger variances: where appropriate, these are noted below.
Net interest income rose by 35 per cent compared with 2004. Consumer demand for credit remained strong, fuelled by lower unemployment across the region and declining inflation in Brazil. This contributed to significant growth in personal lending, vehicle finance loans and credit cards.
In Brazil, HSBC continued to position itself for future growth, investing in infrastructure to ensure the delivery of integrated solutions to customers. Enhancements to distribution, together with marketing campaigns and promotions, including partnerships with motor finance dealers, drove a 49 per cent rise in vehicle finance loans.
A combination of increased customers and targeted marketing initiatives contributed to 40 per cent growth in personal lending. Personal lending balances also benefited from the successful launch in the first half of 2005 of pension-linked loans offering attractive rates of interest, with repayments drawn directly from the borrower’s pension income. Balances of pension-linked loans increased to US$110 million, partly as a result of an agreement to acquire the pension-linked loan production of Banco Schahin, a small local bank.
The cards business continued to expand, due to both the continued strength of consumer expenditure and the development of a private label card with Petrobras gas stations, launched in 2004. During 2005, HSBC improved its competitive position, issuing over a million credit cards and having over two million in circulation, an increase of 21 per cent. Card utilisation grew and cardholder spending increased, while average card balances rose by 30 per cent to US$373 million. Credit card spreads increased as HSBC repositioned its card proposition by increasing interest rates to fall broadly in line with the bank’s major competitors.
In Argentina, considerable focus was placed on pre-approved sales mailings and developing direct sales channels. Net interest income more than doubled, driven by a 59 per cent increase in asset balances. The strong demand for credit resulted in personal unsecured lending more than doubling. Credit cards in circulation increased by 25 per cent, following a discount campaign launched in June 2005 and the launch of a private label card with C&A which contributed to a 53 per cent increase in card balances. Savings and deposit balances increased by 34 per cent, reflecting the improved economic environment.
Net fee income decreased by 21 per cent, driven by both the inclusion of HSBC’s Brazilian insurance business, previously reported in the ‘Other’ business segment, and IFRSs related changes to the reporting of effective interest rates, which together led to a 52 per cent fall in fees. These decreases were mitigated by higher current account, credit card and lending fees. Recruitment of new customers, particularly through the payroll portfolio, led to a 21 per cent rise in HSBC’s current account base which, together with revised tariffs, increased account service fees by 21 per cent. Growth in lending volumes and the introduction of a new pricing structure contributed to a 36 per cent increase in credit-related fee income. Higher credit card spending and additional performance-driven fees from credit card companies generated a 72 per cent increase in credit card fee income. In Argentina, net
94
Back to Contents
fee income increased by US$27 million, reflecting a 29 per cent increase in credit card fees and a 29 per cent increase in current account fee income, driven by increased transaction volumes in a recovering economy.
The sale of HSBC’s Brazilian property and casualty insurance business, HSBC Seguros de Automoveis e Bens Limitada, to HDI Seguros S.A., led to the recognition of an US$89 million gain, reported in other operating income.
Loan impairment charges and other credit risk provisions increased to US$515 million, reflecting strong growth in unsecured lending. Credit quality in Brazil remained stable in the majority of product lines, but there was a 5 per cent increase in impaired loans as a proportion of assets in the consumer finance business. The consumer finance sector experienced increased credit availability, which led to indebtedness exceeding customers’ repayment capacity, increasing delinquencies. However, tightening of credit approval policies and improvements in the credit scoring model led to an improvement in the charge as a proportion of assets in the fourth quarter. Credit quality in Argentina improved, reflecting generally better economic conditions.
Operating expenses increased by 27 per cent. In Brazil, the acquisition of Valeu Promotora de Vendas and CrediMatone S.A. led to a significant increase in average staff numbers, though by the end of 2005 staff numbers were 2 per cent lower than at December 2004, following a restructuring of the consumer finance business. The increased average number of full-time employees, the impact of a mandatory national salary increase and the transfer of the Brazilian insurance business from the ‘Other’ business segment contributed to a 25 per cent increase in Brazilian staff costs. Other expenses grew to support business expansion and the development of direct sales channels, while transactional taxes increased by 21 per cent, driven by higher operating income. In Argentina, costs were 3 per cent up on 2004 as increased performance-related remuneration and union agreed salary increases led to higher staff costs.
Commercial Banking reported pre-tax profits of US$185 million, 2 per cent higher than 2004. In Brazil, pre-tax profits increased by 12 per cent as asset growth drove higher revenues, which were mitigated by increased loan impairment charges and higher costs. In Argentina, pre-tax profits declined by 31 per cent, as significant loan recoveries were not repeated.
Net interest income increased by 49 per cent, driven by asset growth. In Brazil, a growing economy and a 30 per cent rise in customer numbers led to increases in both assets and liabilities. Overdraft balances grew by 41 per cent as both the number and the average size of facilities grew, contributing US$40 million of additional income. Overdraft spreads increased by 3 percentage points as a result of increases in the rate charged to new borrowers. The continuing success ofGiro fácil, a revolving loan and overdraft facility, resulted in a 13 per cent increase in customer numbers which, together with an increase in facility utilisation, resulted in a 77 per cent increase in balances. Invoice financing balances rose by 30 per cent, benefiting from both increased marketing and higher sales to Losango clients, approximately a third of whom now have a commercial banking relationship with HSBC.
Deposit balances in Brazil increased by 21 per cent, reflecting initiatives to incentivise staff to prioritise sales of liability products. However, competitive pressures contributed to a 5 percentage points decrease in spreads on loans and advances to customers, while deposit spreads were 13 basis points lower. In Argentina, deposits from commercial customers increased by 42 per cent, reflecting the continuing economic recovery, while loans and overdrafts more than doubled and current account balances increased by 38 per cent. HSBC increased its market share in both loans and deposits.
Net fee income was 14 per cent lower than 2004, driven by IFRSs changes to accounting for effective interest rates, which reduced fee income by 40 per cent. Excluding this effect, net fee income increased, due to higher fees from payments and cash management, current accounts, and lending in Brazil. Current account fees increased by 26 per cent, reflecting tariff increases, improved collection procedures and higher transaction volumes, while lending fees benefited from higher business volumes. In Argentina, the launch of a commercial banking call centre in the first half of 2005 enhanced the customer service proposition. This, together with the recruitment of additional relationship managers, supported a 14 per cent increase in customer numbers and, as a result, current account fee income increased by 21 per cent. Improvements in the Argentinian economic climate contributed to increased trade flows which, together with the establishment of a dedicated trade service sales team, led to a 22 per cent increase in trade services income.
Loan impairment charges and other credit risk provisions were US$55 million, following a small net release in 2004. In Brazil, asset growth contributed to a US$47 million increase in charges. Impaired loans
95
Back to Contents
H S B C H O L D I N G S P L C
Financial Review (continued)
as a proportion of assets increased by 3 percentage points in the SME portfolio, in line with overall market performance, and MME credit quality also declined slightly. In Argentina, net recoveries decreased as significant releases from amounts recognised at the time of the sovereign debt default and pesification were not repeated. However, underlying credit quality improved substantially and impaired loans as a percentage of assets more than halved.
Operating expenses of US$368 million were 19 per cent higher than in 2004, though the cost efficiency ratio improved by 3 percentage points as income grew faster than costs. Staff numbers in Brazil increased by 34 per cent following a recruitment drive initiated in the second half of 2004 to support expansion of the SME business. Higher incentive payments, reflecting increased income, and union agreed pay increases also contributed to an increase in staff costs. New marketing campaigns, including the award winning ‘30, 60, 90 Dias de Apuros’ campaign focusing on invoice financing, increased advertising and marketing costs. Expenses in Argentina increased by 24 per cent, driven by higher staff costs, reflecting pay rises agreed with local unions, together with a 9 per cent increase in headcount in support of business expansion.
Corporate, Investment Banking and Marketsreported a pre-tax profit of US$146 million, an increase of 12 per cent, driven by higher net interest income in Argentina and a decline in loan impairment charges in Brazil.
Total operating income at US$313 million decreased by 7 per cent compared with 2004. In Argentina, a reduction in funding costs in Global Markets was augmented by the positive impact of an appreciating CER (an inflation-linked index) on holdings of government bonds. Continuing economic growth and improved market confidence stimulated demand for credit, resulting in a 67 per cent growth in balances. Brazil reported a decrease in balance
sheet management and money market revenues as a result of high short-term interest rates and an inverted yield curve.
Trading activities generated higher income as Global Markets in Brazil benefited from a wider product range and the addition of new delivery capabilities. This investment and the relatively buoyant local market resulted in higher business volumes, particularly in foreign exchange. In Argentina, Global Markets income rose in line with increased trading activity in response to the sovereign debt swap.
In Brazil, a US$15 million net release of loan impairment charges compared favourably with a net charge in 2004. A recovery in the energy sector was accompanied by the non-recurrence of allowances raised against two specific corporate accounts in 2004.
Operating expenses of US$138 million were 8 per cent lower than in 2004, primarily due to a reduction in profit share and bonus payments in Brazil. This was partly offset by higher centralised support function staff costs, driven by pay rises agreed with local unions. In Argentina, operating expenses were broadly in line with 2004.
Private Banking reported a pre-tax profit of US$1 million, a modest increase on 2004. The business was reorganised in 2005, with the transfer of smaller accounts to Personal Financial Services in Brazil, following a resegmentation of the customer base.
In Brazil, HSBC’s insurance business was reclassified fromOther to Personal Financial Services. As a result, operating income decreased by US$106 million and operating expenses were US$90 million lower. In Argentina, the receipt of compensation bonds and other items related to the pesification in 2002 led to a US$17 million increase in profit before tax.
96
Back to Contents
Profit before tax by customer group
| | Year ended 31 December 2005 | | |
| |
| | |
| | | | | | | | Corporate, | | | | | | | | | | | | | | |
| | Personal | | | | | | Investment | | | | | | | | | Inter- | | | | | |
| | Financial | | | Commercial | | | Banking & | | | Private | | | | | | segment | | | | | |
| | Services | | | Banking | | | Markets | | | Banking | | | Other | | | elimination | | | Total | | |
| South America | US$m | | | US$m | | | US$m | | | US$m | | | US$m | | | US$m | | | US$m | | |
| | | | | | | | | | | | | | | | | | | | | | |
| Net interest income | 1,463 | | | 475 | | | 111 | | | 5 | | | 23 | | | (327 | ) | | 1,750 | | |
| Net fee income | 329 | | | 121 | | | 73 | | | 11 | | | 3 | | | – | | | 537 | | |
| Trading income excluding net interest income | 15 | | | 4 | | | 78 | | | – | | | 2 | | | – | | | 99 | | |
| Net interest expense on trading activities | – | | | – | | | (17 | ) | | – | | | – | | | 327 | | | 310 | | |
| Net trading income | 15 | | | 4 | | | 61 | | | – | | | 2 | | | 327 | | | 409 | | |
| Net income from financial instruments designated at fair value | 174 | | | – | | | 9 | | | – | | | 3 | | | – | | | 186 | | |
| Gains less losses fromfinancial investments | 1 | | | – | | | 3 | | | – | | | 35 | | | – | | | 39 | | |
| Dividend income | 4 | | | – | | | – | | | – | | | – | | | – | | | 4 | | |
| Net earned insurancepremiums | 669 | | | 23 | | | 57 | | | – | | | (3 | ) | | – | | | 746 | | |
| Other operating income | 135 | | | (2 | ) | | (1 | ) | | (1 | ) | | 57 | | | – | | | 188 | | |
| |
| | |
| | |
| | |
| | |
| | |
| | |
| | |
| Total operating income | 2,790 | | | 621 | | | 313 | | | 15 | | | 120 | | | – | | | 3,859 | | |
| Net insurance claims1 | (632 | ) | | (13 | ) | | (45 | ) | | – | | | (1 | ) | | – | | | (691 | ) | |
| |
| | |
| | |
| | |
| | |
| | |
| | |
| | |
| Net operating income before loan impairmentcharges and other | | | | | | | | | | | | | | | | | | | | | |
| credit risk provisions | 2,158 | | | 608 | | | 268 | | | 15 | | | 119 | | | – | | | 3,168 | | |
| Loan impairment charges and other credit risk provisions | (515 | ) | | (55 | ) | | 15 | | | – | | | 1 | | | – | | | (554 | ) | |
| |
| | |
| | |
| | |
| | |
| | |
| | |
| | |
| Net operating income | 1,643 | | | 553 | | | 283 | | | 15 | | | 120 | | | – | | | 2,614 | | |
| Total operating expenses | (1,437 | ) | | (368 | ) | | (138 | ) | | (14 | ) | | (10 | ) | | – | | | (1,967 | ) | |
| |
| | |
| | |
| | |
| | |
| | |
| | |
| | |
| Operating profit | 206 | | | 185 | | | 145 | | | 1 | | | 110 | | | – | | | 647 | | |
| Share of profit in associatesand joint ventures | – | | | – | | | 1 | | | – | | | (1 | ) | | – | | | – | | |
| |
| | |
| | |
| | |
| | |
| | |
| | |
| | |
| Profit before tax | 206 | | | 185 | | | 146 | | | 1 | | | 109 | | | – | | | 647 | | |
| |
| | |
| | |
| | |
| | |
| | |
| | |
| | |
| | | | | | | | | | | | | | | | | | | | | | |
| | % | | | % | | | % | | | % | | | % | | | | | | % | | |
| | | | | | | | | | | | | | | | | | | | | | |
| Share of HSBC’s profit before tax | 1.0 | | | 0.9 | | | 0.7 | | | – | | | 0.5 | | | | | | 3.1 | | |
| Cost efficiency ratio | 66.6 | | | 60.5 | | | 51.5 | | | 93.3 | | | 8.4 | | | | | | 62.1 | | |
| | | | | | | | | | | | | | | | | | | | | | |
| | US$m | | | US$m | | | US$m | | | US$m | | | US$m | | | | | | US$m | | |
| Selected balance sheetdata2 | | | | | | | | | | | | | | | | | | | | | |
| Loans and advances tocustomers (net) | 4,773 | | | 3,390 | | | 1,143 | | | 1 | | | – | | | | | | 9,307 | | |
| Total assets | 8,270 | | | 5,240 | | | 9,608 | | | 6 | | | 1,610 | | | | | | 24,734 | | |
| Customer accounts | 4,670 | | | 3,964 | | | 7,589 | | | 101 | | | 221 | | | | | | 16,545 | | |
| Loans and advances tobanks (net)3 | | | | | | | 3,731 | | | | | | | | | | | | | | |
| Trading assets, financial instruments designated at | | | | | | | | | | | | | | | | | | | | | |
| fair value, and financial investments3 | | | | | | | 3,799 | | | | | | | | | | | | | | |
| Deposits by banks3 | | | | | | | 803 | | | | | | | | | | | | | | |
| | | | | | | | | | | | | | | | | | | | | | |
| 1 | Net insurance claims incurred and movement in policyholders’ liabilities. |
| 2 | Third party only. |
| 3 | These assets and liabilities were significant to Corporate, Investment Banking and Markets. |
97
Back to Contents
H S B C H O L D I N G S P L C
Financial Review(continued)
Profit before tax by customer group (continued)
| | Year ended 31 December 2004 | |
| |
| |
| | | | | | Corporate, | | | | | | | | | |
| | Personal | | | | Investment | | | | | | Inter- | | | |
| | Financial | | Commercial | | Banking & | | Private | | | | segment | | | |
| | Services | | Banking | | Markets | | Banking | | Other | | elimination | | Total | |
| South America | US$m | | US$m | | US$m | | US$m | | US$m | | US$m | | US$m | |
| | | | | | | | | | | | | �� | | |
| Net interest income | 900 | | 267 | | 127 | | 4 | | 12 | | – | | 1,310 | |
| Net fee income/(expense) | 341 | | 119 | | 62 | | 12 | | (75 | ) | – | | 459 | |
| Trading income/(expense) | 9 | | 5 | | 41 | | – | | (1 | ) | – | | 54 | |
| Net investment income on assets backing policyholders’ liabilities | 40 | | 1 | | 9 | | – | | 45 | | – | | 95 | |
| Gains less losses from financial investments | – | | – | | (1 | ) | – | | 35 | | – | | 34 | |
| Dividend income | – | | – | | – | | – | | 2 | | – | | 2 | |
| Net earned insurancepremiums | 148 | | 34 | | 55 | | – | | 359 | | – | | 596 | |
| Other operating income | 19 | | 9 | | 3 | | 1 | | 12 | | (16 | ) | 28 | |
| |
| |
| |
| |
| |
| |
| |
| |
| Total operating income | 1,457 | | 435 | | 296 | | 17 | | 389 | | (16 | ) | 2,578 | |
| Net insurance claims1 | (143 | ) | (25 | ) | (47 | ) | – | | (244 | ) | – | | (459 | ) |
| |
| |
| |
| |
| |
| |
| |
| |
| Net operating income before loan impairmentcharges and other | | | | | | | | | | | | | | |
| credit risk provisions | 1,314 | | 410 | | 249 | | 17 | | 145 | | (16 | ) | 2,119 | |
| Loan impairment charges and other credit risk provisions | (268 | ) | 7 | | (7 | ) | – | | 1 | | – | | (267 | ) |
| |
| |
| |
| |
| |
| |
| |
| |
| Net operating income | 1,046 | | 417 | | 242 | | 17 | | 146 | | (16 | ) | 1,852 | |
| Total operating expenses | (953 | ) | (258 | ) | (133 | ) | (17 | ) | (68 | ) | 16 | | (1,413 | ) |
| |
| |
| |
| |
| |
| |
| |
| |
| Operating profit | 93 | | 159 | | 109 | | – | | 78 | | – | | 439 | |
| Share of profit in associates and joint ventures | – | | – | | – | | – | | 1 | | – | | 1 | |
| |
| |
| |
| |
| |
| |
| |
| |
| Profit before tax | 93 | | 159 | | 109 | | – | | 79 | | – | | 440 | |
| |
| |
| |
| |
| |
| |
| |
| |
| | | | | | | | | | | | | | | |
| | % | | % | | % | | % | | % | | | | % | |
| | | | | | | | | | | | | | | |
| Share of HSBC’s profitbefore tax | 0.5 | | 0.8 | | 0.6 | | – | | 0.4 | | | | 2.3 | |
| Cost efficiency ratio | 72.5 | | 62.9 | | 53.4 | | 100.0 | | 46.9 | | | | 66.7 | |
| | | | | | | | | | | | | | | |
| | US$m | | US$m | | US$m | | US$m | | US$m | | | | US$m | |
| Selected balance sheet data2 | | | | | | | | | | | | | | |
| Loans and advances to customers (net) | 3,521 | | 1,525 | | 1,843 | | 2 | | 337 | | | | 7,228 | |
| Total assets | 5,829 | | 2,438 | | 7,736 | | 34 | | 1,331 | | | | 17,368 | |
| Customer accounts | 3,458 | | 2,229 | | 5,150 | | 11 | | 110 | | | | 10,958 | |
| The following assets and liabilities were significantto Corporate, | | | | | | | | | | | | | | |
| Investment Banking and Markets: | | | | | | | | | | | | | | |
| Loans and advances to banks (net) | | | | | 1,779 | | | | | | | | | |
| | | | | | | | | | | | | | | |
| Trading assets, financial instruments designated at | | | | | | | | | | | | | | |
| fair value, and financial investments | | | | | 3,009 | | | | | | | | | |
| Deposits by banks | | | | | 549 | | | | | | | | | |
| | | | | | | | | | | | | | | |
| 1 | Net insurance claim incurred and movement in policyholders’ liabilities. |
| 2 | Third party only. |
98
Back to Contents
Critical accounting policies
(audited information) |
|
Introduction
The results of HSBC are sensitive to the accounting policies, assumptions and estimates that underlie the preparation of its consolidated financial statements. The accounting policies used in the preparation of the consolidated financial statements are described in detail in Note 2 on the Financial Statements.
When preparing the financial statements, it is the directors’ responsibility under UK company law to select suitable accounting policies and to make judgements and estimates that are reasonable and prudent.
The accounting policies that are deemed critical to HSBC’s IFRSs results and financial position, in terms of the materiality of the items to which the policy is applied, or which involve a high degree of judgement and estimation, are discussed below.
Impairment of loans
HSBC’s accounting policy for losses in relation to the impairment of customer loans and advances is described in Note 2(f) on the Financial Statements.
Losses in respect of impaired loans are reported in HSBC’s income statement under the caption ‘Loan impairment charges and other credit risk provisions’. Any increase in these losses has the effect of reducing HSBC’s profit for the period by a corresponding amount (while any decrease in impairment charges or reversal of impairment charges would have the opposite effect).
Losses for impaired loans are recognised promptly when there is objective evidence that impairment of a loan or portfolio of loans has occurred. Impairment losses are calculated on individual loans and on loans assessed collectively. Losses expected from future events, no matter how likely, are not recognised.
Individually assessed loans
At each balance sheet date, HSBC assesses on a case-by-case basis whether there is any objective evidence that a loan is impaired. This procedure is applied to all accounts that are considered individually significant. In determining impairment losses on these loans, the following factors are considered:
| • | HSBC’s aggregate exposure to the customer; |
| | |
| • | the viability of the customer’s business model and the capacity to trade successfully out of |
| | financial difficulties and generate sufficient cash flow to service debt obligations; |
| | |
| • | the amount and timing of expected receipts and recoveries; |
| | |
| • | the likely dividend available on liquidation or bankruptcy; |
| | |
| • | the extent of other creditors’ commitments ranking ahead of, or pari passu with, HSBC and the likelihood of other creditors continuing to support the company; |
| | |
| • | the complexity of determining the aggregate amount and ranking of all creditor claims and the extent to which legal and insurance uncertainties are evident; |
| | |
| • | the realisable value of security (or other credit mitigants) and likelihood of successful repossession; |
| | |
| • | the likely deduction of any costs involved in recovery of amounts outstanding; |
| | |
| • | the ability of the borrower to obtain, and make payments in, the currency of the loan if not local currency; and |
| | |
| • | when available, the secondary market price of the debt. |
Impairment losses are calculated by discounting the expected future cash flows of a loan at its original effective interest rate, and comparing the resultant present value with the loan’s current carrying amount. The carrying amount of impaired loans on the balance sheet is reduced through the use of an allowance account.
HSBC’s policy requires a review of the level of impairment allowances on individual facilities above materiality thresholds at least half-yearly, or more regularly when individual circumstances require. This will normally include a review of collateral held (including re-confirmation of its enforceability) and an assessment of actual and anticipated receipts.
Collectively assessed loans
Impairment is assessed on a collective basis in two different scenarios:
| • | for loans subject to individual assessment, to cover losses which have been incurred but have not yet been identified; and |
| | |
| • | for homogeneous groups of loans that are not considered individually significant. |
99
Back to Contents
| H S B C H O L D I N G S P L C |
Financial Review (continued)
Incurred but not yet identified impairment
Individually assessed loans for which no evidence of loss has been identified are grouped together according to their credit risk characteristics for the purpose of calculating an estimated collective loss. This arises from impairment at the balance sheet date which will only be individually identified in the future.
The collective impairment allowance is determined after taking into account:
| • | historical loss experience in portfolios of similar credit risk characteristics (for example, by industry sector, loan grade or product); |
| | |
| • | the estimated period between impairment occurring and the loss being identified and evidenced by the establishment of an appropriate allowance against the individual loan; and |
| | |
| • | management’s experienced judgement as to whether current economic and credit conditions are such that the actual level of inherent losses is likely to be greater or less than that suggested by historical experience. |
The period between a loss occurring and its identification is estimated by local management for each identified portfolio.
Homogeneous groups of loans
For homogeneous groups of loans that are not considered individually significant, two alternative methods are used to calculate allowances on a portfolio basis:
| • | When appropriate empirical information is available, HSBC utilises roll-rate methodology. This methodology employs a statistical analysis of historical trends of the probability of default and the amount of consequential loss, assessed at each time period for which the customer’s contractual payments are overdue. The estimated loss is the difference between the present value of expected future cash flows, discounted at the original effective interest rate of the portfolio, and the carrying amount of the portfolio. Other historical data and current economic conditions are also evaluated when calculating the appropriate level of allowance required to cover inherent loss. In certain highly developed markets, sophisticated models also take into account behavioural and account management trends as revealed in, for example, bankruptcy and rescheduling statistics. |
| | |
| • | In other cases, when the portfolio size is small |
| | or when information is insufficient or not reliable enough to adopt a roll-rate methodology, HSBC adopts a formulaic approach which allocates progressively higher percentage loss rates in line with the period of time for which a customer’s loan is overdue. Loss rates are calculated from the discounted expected future cash flows from a portfolio. |
Roll rates, loss rates and the expected timing of future recoveries are regularly benchmarked against actual outcomes to ensure they remain appropriate.
The portfolio approach is applied to accounts in the following portfolios:
| • | low value, homogeneous small business accounts in certain jurisdictions; |
| | |
| • | residential mortgages less than 90 days overdue; |
| | |
| • | credit cards and other unsecured consumer lending products; and |
| | |
| • | motor vehicle financing. |
These portfolio allowances are generally reassessed monthly and charges for new allowances, or reversals of existing allowances, are calculated for each separately identified portfolio.
Loan write-offs
Loans (and the related impairment allowance accounts) are normally written off, either partially or in full, when there is no realistic prospect of recovery of these amounts and, for collateralised loans, when the proceeds from realising the security have been received.
Reversals of impairment
If the amount of an impairment loss decreases in a subsequent period, and the decrease can be related objectively to an event occurring after the impairment was recognised, the excess is written back by reducing the loan impairment allowance account accordingly. The reversal is recognised in the income statement.
Assets acquired in exchange for loans
Non-financial assets acquired in exchange for loans in order to achieve an orderly realisation are recorded as assets held for sale and reported in ‘Other assets’. The asset acquired is recorded at the lower of its fair value (less costs to sell) and the carrying amount of the loan (net of impairment allowance) at the date of exchange. No depreciation is provided in respect of assets held for sale. Any subsequent write-down of the acquired asset to fair
100
Back to Contents
value less costs to sell is recorded as an impairment loss and included in the income statement. Any subsequent increase in the fair value less costs to sell, to the extent this does not exceed the cumulative impairment loss, is recognised in the income statement.
Renegotiated loans
Retail loans, which are generally subject to collective impairment assessment, whose terms have been renegotiated, are no longer considered to be past due but are treated as new loans only after the minimum required number of payments under the new arrangements have been received.
Loans subject to individual impairment assessment, whose terms have been renegotiated, are subject to ongoing review to determine whether they remain impaired or are considered to be past due.
Goodwill impairment
HSBC’s accounting policy for goodwill is described in Note 2(o) on the Financial Statements.
Goodwill arises on business combinations, including the acquisition of subsidiaries, joint ventures or associates, when the cost of acquisition exceeds the fair value of HSBC’s share of the identifiable assets, liabilities and contingent liabilities acquired. By contrast, if HSBC’s interest in the fair value of the identifiable assets, liabilities and contingent liabilities of an acquired business is greater than the cost to acquire, the excess is recognised immediately in the income statement.
Goodwill is allocated to cash-generating units for the purpose of impairment testing, which is undertaken at the lowest level at which goodwill is monitored for internal management purposes. Impairment testing is performed annually by comparing the present value of the expected future cash flows from a business with the carrying amount of its net assets, including attributable goodwill.
Significant management judgement is involved in two aspects of the process of identifying and evaluating goodwill impairment.
First, the cost of capital assigned to an individual cash-generating unit and used to discount its future cash flows can have a significant effect on its valuation. The cost of capital percentage is generally derived from an appropriate Capital Asset Pricing Model, which itself depends on inputs reflecting a number of financial and economic variables including the risk-free rate in the country concerned and a premium to reflect the inherent risk
of the business being evaluated. These variables are established on the basis of management judgement.
Second, management judgement is required in estimating the future cash flows of the cash-generating units. These values are sensitive to the cash flows projected for the periods for which detailed forecasts are available, and to assumptions regarding the long-term sustainable pattern of cash flows thereafter. While the acceptable range within which underlying assumptions can be applied is governed by the requirement for resulting forecasts to be compared with actual performance and verifiable economic data in future years, the cash flow forecasts necessarily and appropriately reflect management’s view of future business prospects.
When the analysis demonstrates that the expected cash flows of a cash-generating unit have declined and/or that its cost of capital has increased, the effect will be to reduce the estimated fair value of the cash-generating unit. If this results in an estimated recoverable amount that is lower than the carrying value of the cash-generating unit, a charge for impairment of goodwill will be recorded, thereby reducing by a corresponding amount HSBC’s profit for the year. Goodwill is stated at cost less accumulated impairment losses.
Goodwill on acquisitions of joint ventures or associates is included in ‘Interests in associates and joint ventures’.
At the date of disposal of a business, attributable goodwill is included in HSBC’s share of net assets in the calculation of the gain or loss on disposal.
Valuation of financial instruments
HSBC’s accounting policy for valuation of financial instruments is described in Note 2(d) on the Financial Statements.
All financial instruments are recognised initially at fair value. The fair value of a financial instrument on initial recognition is normally the transaction price, i.e. the fair value of the consideration given or received. In certain circumstances, however, the initial fair value may be based on other observable current market transactions in the same instrument, without modification or repackaging, or on a valuation technique whose variables include only data from observable markets.
Subsequent to initial recognition, the fair values of financial instruments measured at fair value that are quoted in active markets are based on bid prices for assets held and offer prices liabilities. When independent prices are not available, fair values are determined by using valuation techniques which
101
Back to Contents
| H S B C H O L D I N G S P L C |
Financial Review (continued)
refer to observable market data. These include comparison with similar instruments where market observable prices exist, discounted cash flow analysis, option pricing models and other valuation techniques commonly used by market participants.
The main factors which management considers when applying a model are:
| • | the likelihood and expected timing of future cash flows on the instrument. These cash flows are usually governed by the terms of the instrument, although management judgement may be required in situations where the ability of the counterparty to service the instrument in accordance with the contractual terms is in doubt; and |
| | |
| • | an appropriate discount rate for the instrument. Management determines this rate, based on its assessment of the appropriate spread of the rate for the instrument over the risk-free rate. |
When valuing instruments by reference to comparable instruments, management takes into account the maturity, structure and rating of the instrument with which the position held is being compared.
When valuing instruments on a model basis using the fair value of underlying components, management considers, in addition, the need for adjustments to take account of a number of factors such as bid-offer spread, credit profile, servicing costs of portfolios and model uncertainty. These adjustments are based on defined policies which are applied consistently across HSBC.
When unobservable market data have a significant impact on the valuation of derivatives, the entire initial change in fair value indicated by the valuation model is not recognised immediately in the income statement but is recognised over the life of the transaction on an appropriate basis or is recognised in the income statement when the inputs become observable, or when the transaction matures or is closed out.
| • | Financial instruments measured at fair value through profit or loss comprise financial instruments held for trading and financial instruments designated at fair value. Changes in their fair value directly impact HSBC’s income statement in the period in which they occur. |
| | |
| • | A change in the fair value of a financial instrument which is classified as ‘available-for-sale’ is recorded directly in equity until the financial instrument is sold, at which point the cumulative change in fair value is charged or credited to the income statement. For those debt and equity securities classified as available-for-sale, consideration as to whether any such assets should be written down to reflect an impairment is taken into account in the fair value of the relevant security. Any impairment in the value of debt and equity securities held as available-for-sale is reported in the income statement and hence reduces HSBC’s operating profit for the period. |
The table below summarises HSBC’s trading portfolios by valuation methodology at 31 December 2005:
| | Assets | | Liabilities | |
| |
|
|
| |
|
|
| |
| | Trading | | | | Trading | | | |
| | securities | | | | securities | | | |
| | purchased | | Derivatives | | sold | | Derivatives | |
| | % | | % | | % | | % | |
| Fair value based on: | | | | | | | | |
| Quoted market prices | 87.6 | | 6.0 | | 96.0 | | 5.7 | |
| Internal models with significant observable market parameters1 | 12.4 | | 91.5 | | 4.0 | | 92.4 | |
| Internal models with significant unobservable market parameters | – | | 2.5 | | – | | 1.9 | |
| |
| |
| |
| |
| |
| | 100.0 | | 100.0 | | 100.0 | | 100.0 | |
| |
| |
| |
| |
| |
| | |
| 1 | Including instruments valued on the basis of comparable instruments. |
102
Back to Contents
| IFRSs compared with US GAAP |
|
| | 2005 | | 2004 | |
| | US$m | | US$m | |
| Net income | | | | |
| US GAAP | 14,703 | | 12,506 | |
| IFRSs | 15,081 | | 12,918 | |
| | | | | |
| Shareholders’ equity | | | | |
| US GAAP | 93,524 | | 90,082 | |
| IFRSs | 92,432 | | 85,522 | |
HSBC provides details of its net income and shareholders’ equity calculated in accordance with US GAAP, which differs in certain respects from IFRSs. Differences in net income and shareholders’ equity are explained in Note 47 on the Financial Statements on pages 375 to 402.
| Future accounting developments |
|
At 31 December 2005, HSBC adopted all IFRSs or interpretations that had been issued by the International Accounting Standards Board and endorsed by the EU with the exception of the ‘Amendments to IAS 39 and IFRS 4 – Financial Guarantee Contracts’.
Financial guarantee contracts are currently accounted for under IAS 37 ‘Provisions, Contingent Liabilities and Contingent Assets’ as contingent liabilities and are disclosed as off-balance sheet items. Under the amendment, the issuer of a financial guarantee contract should classify such a contract as a financial instrument liability in accordance with IAS 39. An exception is made for issuers of guarantees deemed to be insurance contracts, who, subject to certain conditions, may irrevocably elect to account for such contracts as financial liabilities under IAS 39 or as insurance contract liabilities under IFRS 4.
HSBC is required to adopt this amendment for the year ending 31 December 2006 and is currently assessing the impact this will have both in the Group and the parent company.
The Financial Accounting Standards Board (‘FASB’) has issued the following accounting standards, which will become fully effective in future financial statements.
In May 2005 the FASB issued Statement of Financial Accounting Standards (‘SFAS’) No. 154 ‘Accounting Changes and Error Corrections’. In many, but not all aspects, SFAS 154 converges with IAS 8 ‘Accounting Policies, Changes in Accounting Estimates and Errors’ in the accounting and reporting of accounting changes and corrections of errors. SFAS 154 is effective for fiscal years beginning after 15 December 2005. Adoption is not expected to have
a material impact on the US GAAP information in HSBC’s financial statements.
In June 2005, the FASB Emerging Issues Task Force (‘EITF’) issued EITF 04-5 ‘Determining whether a General Partner, or General Partners as a Group, Controls a Limited Partnership or Similar Entity When the Limited Partners Have Certain Rights’. EITF 04-5 has a presumption that the general partner in a limited partnership or similar entity, such as a limited liability company, has control unless the limited partners have substantive kick-out rights or participating rights. The guidance contained in the EITF is effective after 29 June 2005 for all new partnerships formed and for existing partnerships that are modified after that date, and for all other existing partnerships it is effective no later than the beginning of the first reporting period beginning after 15 December 2005. The impact of EITF 04-5 on the US GAAP information in HSBC’s financial statements is not expected to be material.
In November 2005 the FASB released FASB Staff Position FSP FAS 115-1 ‘The Meaning of Other-Than-Temporary Impairment and Its Application to Certain Investments’ which supersedes the guidance provided by EITF 03-1 ‘The Meaning of Other-Than-Temporary Impairment and Its Application to Certain Investments’. FSP FAS 115-1 clarifies when an investment is considered impaired, whether that impairment is other than temporary, and the measurement of an impairment loss. FSP FAS 115-1 is effective for fiscal years beginning after 15 December 2005. Adoption is not expected to have a material impact on the US GAAP information in HSBC’s financial statements.
SFAS 155 ‘Accounting for Certain Hybrid Financial Instruments’ was issued by the FASB in February 2006. SFAS 155 permits fair value measurement for any hybrid financial instrument that contains an embedded derivative that would otherwise require bifurcation. An irrevocable election may be made to initially and subsequently measure such a hybrid financial instrument at fair value, with changes in fair value recognised through income. Such election needs to be supported by concurrent documentation. SFAS 155 is effective for financial years beginning after 15 September 2006, with early adoption permitted. HSBC is currently considering the impact that adoption of SFAS 155 will have on its US GAAP financial statements.
103
Back to Contents
| H S B C H O L D I N G S P L C |
| |
| |
| FinancialReview (continued) |
| | |
| | |
| Average balance sheet and netinterest income |
|
| Average balances and the related interest are shown for the domestic operations of HSBC’s principal commercial banks by geographic region with all other commercial banking and investment banking balances and transactions included in ‘Other operations’. |
| |
Net interest margin numbers are calculated by dividing net interest income as reported in the income statement by the average interest earning assets from which interest income is reported within the ‘Net interest income’ line of the income statement. Interest income and interest expense arising from trading assets and liabilities and the funding thereof is included within ‘Net trading income’ in the income statement.
Assets
| | | Year ended 31 December | |
| | |
| |
| | | 2005 | | 2004 | |
| | |
| |
| |
| | | Average | | Interest | | | | Average | | Interest | | | |
| | | balance | | income | | Yield | | balance | | income | | Yield | |
| | | US$m | | US$m | | % | | US$m | | US$m | | % | |
| Short-term funds and loans and advances to banks | | | | | | | | | | | | |
| Europe | HSBC Bank | 21,875 | | 774 | | 3.54 | | 24,173 | | 669 | | 2.77 | |
| | HSBC Private Banking Holdings (Suisse) | 3,606 | | 156 | | 4.33 | | 2,644 | | 89 | | 3.37 | |
| | HSBC France | 16,829 | | 387 | | 2.30 | | 26,007 | | 960 | | 3.69 | |
| Hong Kong | Hang Seng Bank | 8,061 | | 288 | | 3.57 | | 8,328 | | 221 | | 2.65 | |
| | The Hongkong and Shanghai Banking Corporation | 36,904 | | 1,058 | | 2.87 | | 28,172 | | 538 | | 1.91 | |
| Rest of Asia-Pacific | The Hongkong and Shanghai Banking Corporation | 11,667 | | 351 | | 3.01 | | 9,180 | | 198 | | 2.16 | |
| | HSBC Bank Malaysia | 1,767 | | 49 | | 2.77 | | 1,348 | | 36 | | 2.67 | |
| | HSBC Bank Middle East | 3,262 | | 111 | | 3.40 | | 1,619 | | 29 | | 1.79 | |
| North America | HSBC Bank USA | 3,579 | | 151 | | 4.22 | | 2,323 | | 56 | | 2.41 | |
| | HSBC Bank Canada | 2,115 | | 62 | | 2.93 | | 2,163 | | 45 | | 2.08 | |
| | HSBC Mexico | 2,994 | | 228 | | 7.62 | | 3,771 | | 227 | | 6.02 | |
| South America | Brazilian operations1 | 3,305 | | 565 | | 17.10 | | 1,954 | | 237 | | 12.13 | |
| | HSBC Bank Argentina | 264 | | 7 | | 2.65 | | 250 | | 3 | | 1.20 | |
| Other operations | | 15,023 | | 456 | | 3.04 | | 19,515 | | 329 | | 1.69 | |
| | |
| |
| | | |
| |
| | | |
| | | 131,251 | | 4,643 | | 3.54 | | 131,447 | | 3,637 | | 2.77 | |
| | |
| |
| | | |
| |
| | | |
| Trading assets2 | | | | | | | | | | | | | |
| Europe | HSBC Bank | | | | | | | 29,183 | | 1,147 | | 3.93 | |
| | HSBC France | | | | | | | 13,663 | | 365 | | 2.67 | |
| Hong Kong | Hang Seng Bank | | | | | | | 369 | | 13 | | 3.52 | |
| | The Hongkong and Shanghai Banking Corporation | | | | | | | 11,209 | | 298 | | 2.66 | |
| Rest of Asia-Pacific | The Hongkong and Shanghai Banking Corporation | | | | | | | 2,487 | | 101 | | 4.06 | |
| | HSBC Bank Malaysia | | | | | | | 145 | | 4 | | 2.76 | |
| North America | HSBC Bank USA | | | | | | | 5,447 | | 115 | | 2.11 | |
| | HSBC Bank Canada | | | | | | | 1,177 | | 25 | | 2.12 | |
| | HSBC Markets Inc | | | | | | | 11,543 | | 421 | | 3.65 | |
| | HSBC Mexico | | | | | | | 2,957 | | 173 | | 5.86 | |
| South America | Brazilian operations1 | | | | | | | 843 | | 128 | | 15.18 | |
| | HSBC Bank Argentina | | | | | | | 19 | | 1 | | 5.26 | |
| Other operations | | | | | | | | 5,661 | | 232 | | 4.10 | |
| | | | | | | | |
| |
| | | |
| | | | | | | | | 84,703 | | 3,023 | | 3.57 | |
| For footnotes, see page 113. | | | | | | |
| |
| | | |
104
Back to Contents
Assets(continued)
| | | Year ended 31 December | |
| | |
| |
| | | 2005 | | 2004 | |
| | |
| |
| |
| | | Average | | Interest | | | | Average | | Interest | | | |
| | | Balance | | income | | Yield | | balance | | income | | Yield | |
| | | US$m | | US$m | | % | | US$m | | US$m | | % | |
| Loans and advances to customers | | | | | | | | | | | | |
| Europe | HSBC Bank | 203,568 | | 12,223 | | 6.00 | | 170,939 | | 9,521 | | 5.57 | |
| | HSBC Private Banking Holdings (Suisse) | 5,795 | | 211 | | 3.64 | | 4,700 | | 115 | | 2.45 | |
| | HSBC France | 41,977 | | 1,710 | | 4.07 | | 42,149 | | 1,892 | | 4.49 | |
| | HSBC Finance | 9,951 | | 1,086 | | 10.91 | | 9,276 | | 1,055 | | 11.37 | |
| Hong Kong | Hang Seng Bank | 32,893 | | 1,323 | | 4.02 | | 31,234 | | 882 | | 2.82 | |
| | The Hongkong and Shanghai Banking Corporation | 43,971 | | 2,061 | | 4.69 | | 41,901 | | 1,406 | | 3.36 | |
| Rest of Asia-Pacific | The Hongkong and Shanghai Banking Corporation | 46,652 | | 2,659 | | 5.70 | | 36,775 | | 1,781 | | 4.84 | |
| | HSBC Bank Malaysia | 5,380 | | 325 | | 6.04 | | 4,937 | | 278 | | 5.63 | |
| | HSBC Bank Middle East | 10,038 | | 635 | | 6.33 | | 7,425 | | 418 | | 5.63 | |
| North America | HSBC Bank USA | 86,800 | | 5,594 | | 6.44 | | 61,659 | | 2,936 | | 4.76 | |
| | HSBC Finance | 118,215 | | 13,307 | | 11.26 | | 114,393 | | 13,146 | | 11.49 | |
| | HSBC Bank Canada | 28,491 | | 1,439 | | 5.05 | | 22,603 | | 1,099 | | 4.86 | |
| | HSBC Mexico | 9,983 | | 1,210 | | 12.12 | | 8,095 | | 878 | | 10.85 | |
| South America | Brazilian operations1 | 7,447 | | 2,647 | | 35.54 | | 4,726 | | 1,527 | | 32.31 | |
| | HSBC Bank Argentina | 914 | | 122 | | 13.35 | | 903 | | 101 | | 11.18 | |
| Other operations | | 27,203 | | 1,352 | | 4.97 | | 35,713 | | 1,113 | | 3.12 | |
| | |
| |
| | | |
| |
| | | |
| | | 679,278 | | 47,904 | | 7.05 | | 597,428 | | 38,148 | | 6.39 | |
| | |
| |
| | | |
| |
| | | |
| Financial investments | | | | | | | | | | | | |
| Europe | HSBC Bank | 35,787 | | 1,297 | | 3.62 | | 22,488 | | 824 | | 3.66 | |
| | HSBC Private Banking Holdings (Suisse) | 8,725 | | 299 | | 3.43 | | 10,828 | | 303 | | 2.80 | |
| | HSBC France | 4,482 | | 143 | | 3.19 | | 6,957 | | 240 | | 3.45 | |
| Hong Kong | Hang Seng Bank | 23,445 | | 815 | | 3.48 | | 20,924 | | 507 | | 2.42 | |
| | The Hongkong and Shanghai Banking Corporation | 29,508 | | 924 | | 3.13 | | 33,798 | | 779 | | 2.30 | |
| Rest of Asia-Pacific | The Hongkong and Shanghai Banking Corporation | 15,100 | | 592 | | 3.92 | | 15,902 | | 537 | | 3.38 | |
| | HSBC Bank Malaysia | 1,182 | | 41 | | 3.47 | | 1,156 | | 40 | | 3.46 | |
| | HSBC Bank Middle East | 1,311 | | 44 | | 3.36 | | 1,104 | | 27 | | 2.45 | |
| North America | HSBC Bank USA | 19,262 | | 864 | | 4.49 | | 18,213 | | 884 | | 4.85 | |
| | HSBC Finance | 3,945 | | 221 | | 5.60 | | 4,153 | | 166 | | 4.00 | |
| | HSBC Bank Canada | 3,951 | | 116 | | 2.94 | | 2,814 | | 65 | | 2.31 | |
| | HSBC Mexico | 4,995 | | 583 | | 11.67 | | 3,822 | | 395 | | 10.33 | |
| South America | Brazilian operations1 | 2,328 | | 324 | | 13.92 | | 843 | | 128 | | 15.18 | |
| | HSBC Bank Argentina | 218 | | 23 | | 10.55 | | 169 | | 12 | | 7.10 | |
| Other operations | | 17,769 | | 881 | | 4.96 | | 17,485 | | 564 | | 3.23 | |
| | |
| |
| | | |
| |
| | | |
| | | 172,008 | | 7,167 | | 4.17 | | 160,656 | | 5,471 | | 3.41 | |
| | |
| |
| | | |
| |
| | | |
| For footnotes, see page 113. | | | | | | | | | | | | |
105
Back to Contents
| H S B C H O L D I N G S P L C |
| |
| |
| FinancialReview (continued) |
| | |
| | |
| | |
Assets(continued)
| | | Year ended 31 December | |
| | |
| |
| | | 2005 | | 2004 | |
| | |
| |
| |
| | | Average | | Interest | | | | Average | | Interest | | | |
| | | Balance | | income | | Yield | | balance | | income | | Yield | |
| | | US$m | | US$m | | % | | US$m | | US$m | | % | |
| Other interest-earning assets | | | | | | | | | | | | |
| Europe | HSBC Bank | 14,748 | | 543 | | 3.68 | | 8,629 | | 361 | | 4.18 | |
| | HSBC Private Banking Holdings (Suisse) | 11,831 | | 416 | | 3.52 | | 7,611 | | 146 | | 1.92 | |
| | HSBC France | 9,811 | | 442 | | 4.51 | | 7,533 | | 62 | | 0.82 | |
| Hong Kong | Hang Seng Bank | 81 | | 3 | | 3.70 | | 813 | | 17 | | 2.09 | |
| | The Hongkong and Shanghai Banking Corporation | 18,310 | | 443 | | 2.42 | | 16,926 | | 316 | | 1.87 | |
| Rest of Asia-Pacific | The Hongkong and Shanghai Banking Corporation | 4,836 | | 200 | | 4.14 | | 4,757 | | 179 | | 3.76 | |
| | HSBC Bank Malaysia | 283 | | 8 | | 2.83 | | 153 | | 3 | | 1.96 | |
| | HSBC Bank Middle East | 371 | | 18 | | 4.85 | | 164 | | 10 | | 6.10 | |
| North America | HSBC Bank USA | 1,444 | | 43 | | 2.98 | | 784 | | 26 | | 3.32 | |
| | HSBC Finance | 2,063 | | 67 | | 3.25 | | 651 | | 64 | | 9.83 | |
| | HSBC Bank Canada | 641 | | 18 | | 2.81 | | 233 | | 8 | | 3.43 | |
| | HSBC Mexico | 1,186 | | 16 | | 1.35 | | 336 | | 5 | | 1.49 | |
| South America | Brazilian operations1 | 558 | | 162 | | 29.03 | | 284 | | 36 | | 12.68 | |
| | HSBC Bank Argentina | 43 | | 2 | | 4.65 | | 30 | | – | | – | |
| Other operations | | (49,322 | ) | (2,001 | ) | | | (46,751 | ) | (1,040 | ) | | |
| | |
| |
| | | |
| |
| | | |
| | | 16,884 | | 380 | | 2.25 | | 2,153 | | 193 | | 8.96 | |
| | |
| |
| | | |
| |
| | | |
| Total interest-earning assets | | | | | | | | | | | | |
| Europe | HSBC Bank | 275,977 | | 14,837 | | 5.38 | | 255,412 | | 12,522 | | 4.90 | |
| | HSBC Private Banking Holdings (Suisse) | 29,957 | | 1,082 | | 3.61 | | 25,783 | | 653 | | 2.53 | |
| | HSBC France | 73,099 | | 2,682 | | 3.67 | | 96,310 | | 3,520 | | 3.65 | |
| | HSBC Finance | 10,553 | | 1,081 | | 10.24 | | 9,342 | | 1,074 | | 11.50 | |
| Hong Kong | Hang Seng Bank | 64,958 | | 2,447 | | 3.77 | | 61,669 | | 1,614 | | 2.62 | |
| | The Hongkong and Shanghai Banking Corporation | 128,693 | | 4,485 | | 3.49 | | 132,007 | | 3,337 | | 2.53 | |
| Rest of Asia-Pacific | The Hongkong and Shanghai Banking Corporation | 78,255 | | 3,802 | | 4.86 | | 69,102 | | 2,796 | | 4.05 | |
| | HSBC Bank Malaysia | 8,612 | | 423 | | 4.91 | | 7,739 | | 361 | | 4.66 | |
| | HSBC Bank Middle East | 14,982 | | 808 | | 5.39 | | 10,348 | | 485 | | 4.69 | |
| North America | HSBC Bank USA | 111,085 | | 6,652 | | 5.99 | | 88,426 | | 4,017 | | 4.54 | |
| | HSBC Finance | 124,223 | | 13,595 | | 10.94 | | 119,197 | | 13,376 | | 11.22 | |
| | HSBC Bank Canada | 35,198 | | 1,635 | | 4.65 | | 28,990 | | 1,242 | | 4.28 | |
| | HSBC Mexico | 19,159 | | 2,038 | | 10.64 | | 18,982 | | 1,678 | | 8.84 | |
| South America | Brazilian operations1 | 13,637 | | 3,697 | | 27.11 | | 9,186 | | 2,231 | | 24.29 | |
| | HSBC Bank Argentina | 1,440 | | 154 | | 10.69 | | 1,371 | | 117 | | 8.53 | |
| Other operations | | 9,593 | | 676 | | 7.05 | | 42,523 | | 1,449 | | 3.41 | |
| | |
| |
| | | |
| |
| | | |
| | | 999,421 | | 60,094 | | 6.01 | | 976,387 | | 50,472 | | 5.17 | |
| | |
| |
| | | |
| |
| | | |
| Summary | | | | | | | | | | | | | |
| Total interest-margin assets | 999,421 | | 60,094 | | 6.01 | | 976,387 | | 50,472 | | 5.17 | |
| Trading assets2 | | 292,404 | | 7,232 | | 2.47 | | | | | | | |
| Financial assets designated at fair value3 | 15,247 | | 405 | | 2.66 | | | | | | | |
| Impairment provisions | | (12,469 | ) | | | | | (12,958 | ) | | | | |
| Non-interest-earning assets | 207,337 | | | | | | 285,912 | | | | | |
| | |
| |
| | | |
| |
| | | |
| Total assets and interest income | 1,501,940 | | 67,731 | | 4.51 | | 1,249,341 | | 50,472 | | 4.04 | |
| | |
| |
| | | |
| |
| | | |
106
Back to Contents
Assets(continued)
| | | Year ended 31 December | |
| | |
| |
| | | 2005 | | 2004 | |
| | | % | | % | |
| Distribution of average total assets | | | | |
| Europe | HSBC Bank | 30.1 | | 28.3 | |
| | HSBC Private Banking Holdings (Suisse) | 2.2 | | 2.2 | |
| | HSBC France | 9.9 | | 9.8 | |
| | HSBC Finance | 0.7 | | 0.9 | |
| Hong Kong | Hang Seng Bank | 4.8 | | 5.2 | |
| | The Hongkong and Shanghai Banking Corporation | 12.7 | | 14.2 | |
| Rest of Asia-Pacific | The Hongkong and Shanghai Banking Corporation | 6.5 | | 6.6 | |
| | HSBC Bank Malaysia | 0.6 | | 0.7 | |
| | HSBC Bank Middle East | 1.1 | | 0.9 | |
| North America | HSBC Bank USA | 10.7 | | 8.8 | |
| | HSBC Finance | 9.3 | | 10.8 | |
| | HSBC Bank Canada | 2.6 | | 2.4 | |
| | HSBC Mexico | 1.6 | | 1.8 | |
| South America | Brazilian operations1 | 1.4 | | 0.9 | |
| | HSBC Bank Argentina | 0.1 | | 0.1 | |
| Other operations (including consolidation adjustments) | 5.7 | | 6.4 | |
| | |
| |
| |
| | | 100.0 | | 100.0 | |
| |
| |
| |
| For footnotes, see page 113. | | | | |
107
Back to Contents
| H S B C H O L D I N G S P L C |
| |
| |
| FinancialReview (continued) |
| | |
| | |
| | |
Total equity and liabilities
| | | Year ended 31 December | |
| | |
| |
| | | 2005 | | 2004 | |
| | |
| |
| |
| | | Average | | Interest | | | | Average | | Interest | | | |
| | | balance | | expense | | Cost | | balance | | expense | | Cost | |
| | | US$m | | US$m | | % | | US$m | | US$m | | % | |
| Deposits by banks4 | | | | | | | | | | | | | |
| Europe | HSBC Bank | 32,673 | | 1,037 | | 3.17 | | 26,950 | | 412 | | 1.53 | |
| | HSBC Private Banking Holdings (Suisse) | 886 | | 20 | | 2.26 | | 1,446 | | 27 | | 1.87 | |
| | HSBC France | 17,935 | | 582 | | 3.25 | | 22,162 | | 526 | | 2.37 | |
| Hong Kong | Hang Seng Bank | 1,876 | | 61 | | 3.25 | | 685 | | 14 | | 2.04 | |
| | The Hongkong and Shanghai Banking Corporation | 3,430 | | 116 | | 3.38 | | 3,139 | | 39 | | 1.24 | |
| Rest of Asia-Pacific | The Hongkong and Shanghai Banking Corporation | 4,973 | | 168 | | 3.38 | | 3,505 | | 95 | | 2.71 | |
| | HSBC Bank Malaysia | 238 | | 5 | | 2.10 | | 98 | | 2 | | 2.04 | |
| | HSBC Bank Middle East | 888 | | 27 | | 3.04 | | 1,104 | | 23 | | 2.08 | |
| North America | HSBC Bank USA | 4,251 | | 202 | | 4.75 | | 3,833 | | 74 | | 1.93 | |
| | HSBC Bank Canada | 926 | | 34 | | 3.67 | | 392 | | 8 | | 2.04 | |
| | HSBC Mexico | 1,051 | | 70 | | 6.66 | | 914 | | 48 | | 5.25 | |
| South America | Brazilian operations1 | 1,355 | | 125 | | 9.23 | | 914 | | 57 | | 6.24 | |
| | HSBC Bank Argentina | 111 | | 8 | | 7.21 | | 140 | | 8 | | 5.71 | |
| Other operations | | 3,962 | | 211 | | 5.33 | | 11,182 | | 206 | | 1.84 | |
| | |
| |
| | | |
| |
| | | |
| | | 74,555 | | 2,666 | | 3.58 | | 76,464 | | 1,539 | | 2.01 | |
| | |
| |
| | | |
| |
| | | |
| Customer accounts5 | | | | | | | | | | | | | |
| Europe | HSBC Bank | 186,996 | | 5,359 | | 2.87 | | 169,501 | | 3,986 | | 2.35 | |
| | HSBC Private Banking Holdings (Suisse) | 19,908 | | 622 | | 3.12 | | 17,339 | | 377 | | 2.17 | |
| | HSBC France | 24,538 | | 611 | | 2.49 | | 22,072 | | 575 | | 2.61 | |
| Hong Kong | Hang Seng Bank | 51,460 | | 874 | | 1.70 | | 50,944 | | 290 | | 0.57 | |
| | The Hongkong and Shanghai Banking Corporation | 95,496 | | 1,322 | | 1.38 | | 92,579 | | 392 | | 0.42 | |
| Rest of Asia-Pacific | The Hongkong and Shanghai Banking Corporation | 48,997 | | 1,293 | | 2.64 | | 42,625 | | 891 | | 2.09 | |
| | HSBC Bank Malaysia | 6,123 | | 157 | | 2.56 | | 5,744 | | 151 | | 2.63 | |
| | HSBC Bank Middle East | 8,696 | | 207 | | 2.38 | | 5,978 | | 60 | | 1.00 | |
| North America | HSBC Bank USA | 60,795 | | 1,385 | | 2.28 | | 52,813 | | 680 | | 1.29 | |
| | HSBC Bank Canada | 21,635 | | 475 | | 2.20 | | 18,191 | | 351 | | 1.93 | |
| | HSBC Mexico | 8,272 | | 188 | | 2.27 | | 11,157 | | 377 | | 3.38 | |
| South America | Brazilian operations1 | 10,790 | | 1,859 | | 17.23 | | 5,787 | | 842 | | 14.55 | |
| | HSBC Bank Argentina | 903 | | 28 | | 3.10 | | 898 | | 27 | | 3.01 | |
| Other operations | | 44,816 | | 1,273 | | 2.84 | | 56,494 | | 918 | | 1.62 | |
| | |
| |
| | | |
| |
| | | |
| | | 589,425 | | 15,653 | | 2.66 | | 552,122 | | 9,917 | | 1.80 | |
| | |
| |
| | | |
| |
| | | |
| For footnotes, see page 113. | | | | | | | | | | | | |
108
Back to Contents
Total equity and liabilities(continued)
| | | Year ended 31 December | |
| | |
| |
| | | 2005 | | 2004 | |
| | |
| |
| |
| | | Average | | Interest | | | | Average | | Interest | | | |
| | | balance | | expense | | Cost | | balance | | expense | | Cost | |
| | | US$m | | US$m | | % | | US$m | | US$m | | % | |
| Financial liabilities designated at fair value – | | | | | | | | | | | | |
| own debt issued6 | | | | | | | | | | | | | |
| Europe | HSBC Holdings | 13,928 | | 496 | | 3.56 | | | | | | | |
| | HSBC Bank | 5,919 | | 327 | | 5.52 | | | | | | | |
| North America | HSBC Bank USA | 1,469 | | 96 | | 6.54 | | | | | | | |
| | HSBC Finance | 28,146 | | 1,098 | | 3.90 | | | | | | | |
| Other operations | | 288 | | 20 | | 6.94 | | | | | | | |
| | |
| |
| | | | | | | | | |
| | | 49,750 | | 2,037 | | 4.09 | | | | | | | |
| | |
| |
| | | | | | | | | |
| Debt securities in issue | | | | | | | | | | | | |
| Europe | HSBC Bank | 28,620 | | 1,817 | | 6.35 | | 26,320 | | 1,103 | | 4.19 | |
| | HSBC France | 14,271 | | 314 | | 2.20 | | 16,250 | | 434 | | 2.67 | |
| | HSBC Finance | 3,330 | | 77 | | 2.31 | | 3,524 | | 163 | | 4.63 | |
| Hong Kong | Hang Seng Bank | 1,523 | | 53 | | 3.48 | | 1,266 | | 30 | | 2.37 | |
| | The Hongkong and Shanghai Banking Corporation | – | | – | | – | | 11,192 | | 437 | | 3.90 | |
| Rest of Asia-Pacific | The Hongkong and Shanghai Banking Corporation | 6,523 | | 315 | | 4.83 | | 5,313 | | 229 | | 4.31 | |
| | HSBC Bank Malaysia | 572 | | 16 | | 2.80 | | 261 | | 8 | | 3.07 | |
| North America | HSBC Bank USA | 25,537 | | 1,073 | | 4.20 | | 11,125 | | 376 | | 3.38 | |
| | HSBC Finance | 75,913 | | 3,399 | | 4.48 | | 101,269 | | 2,751 | | 2.72 | |
| | HSBC Bank Canada | 7,963 | | 268 | | 3.37 | | 5,994 | | 165 | | 2.75 | |
| | HSBC Mexico | 4,585 | | 285 | | 6.22 | | 3,566 | | 134 | | 3.76 | |
| South America | Brazilian operations1 | 401 | | 67 | | 16.71 | | 360 | | 65 | | 18.06 | |
| | HSBC Bank Argentina | 7 | | 1 | | 14.29 | | 95 | | 7 | | 7.37 | |
| Other operations | | 6,834 | | 90 | | 1.32 | | 18,136 | | 234 | | 1.29 | |
| | |
| |
| | | |
| |
| | | |
| | | 176,079 | | 7,775 | | 4.42 | | 204,671 | | 6,136 | | 3.00 | |
| | |
| |
| | | |
| |
| | | |
| Other interest-bearing liabilities | | | | | | | | | | | | |
| Europe | HSBC Bank | 23,924 | | 547 | | 2.29 | | 30,504 | | 870 | | 2.85 | |
| | HSBC Private Banking Holdings (Suisse) | 4,247 | | 130 | | 3.06 | | 2,505 | | 38 | | 1.52 | |
| | HSBC France | 14,154 | | 220 | | 1.55 | | 20,117 | | 601 | | 2.99 | |
| | HSBC Finance | 5,299 | | 361 | | 6.81 | | 4,298 | | 258 | | 6.00 | |
| Hong Kong | Hang Seng Bank | 1,228 | | 36 | | 2.93 | | 1,161 | | 22 | | 1.89 | |
| | The Hongkong and Shanghai Banking Corporation | 6,981 | | 221 | | 3.17 | | 10,495 | | 171 | | 1.63 | |
| Rest of Asia-Pacific | The Hongkong and Shanghai Banking Corporation | 13,725 | | 460 | | 3.35 | | 12,972 | | 228 | | 1.76 | |
| | HSBC Bank Malaysia | 137 | | 4 | | 2.92 | | 195 | | 3 | | 1.54 | |
| | HSBC Bank Middle East | 767 | | 23 | | 3.00 | | 407 | | 20 | | 4.91 | |
| North America | HSBC Bank USA | 13,287 | | 1,332 | | 10.02 | | 12,618 | | 324 | | 2.57 | |
| | HSBC Bank Canada | 856 | | 12 | | 1.40 | | 938 | | 20 | | 2.13 | |
| | HSBC Markets Inc | 4,718 | | 121 | | 2.56 | | 12,652 | | 460 | | 3.64 | |
| | HSBC Mexico | 1,258 | | 30 | | 2.38 | | 195 | | 15 | | 7.69 | |
| South America | Brazilian operations1 | 2,264 | | 86 | | 3.80 | | 565 | | 47 | | 8.32 | |
| | HSBC Bank Argentina | 35 | | 4 | | 11.43 | | 319 | | 3 | | 0.94 | |
| Other operations | | (62,593 | ) | (2,958 | ) | | | (64,040 | ) | (1,301 | ) | | |
| | |
| |
| | | |
| |
| | | |
| | | 30,287 | | 629 | | 2.08 | | 45,901 | | 1,779 | | 3.88 | |
| | |
| |
| | | |
| |
| | | |
| For footnotes, see on page 113. | | | | | | | | | | | | |
109
Back to Contents
| H S B C H O L D I N G S P L C |
| |
| |
| FinancialReview (continued) |
| | |
| | |
| | |
Total equity and liabilities(continued)
| | | Year ended 31 December | |
| | |
| |
| | | 2005 | | 2004 | |
| | |
| |
| |
| | | Average | | Interest | | | | Average | | Interest | | | |
| | | balance | | expense | | Cost | | balance | | expense | | Cost | |
| | | US$m | | US$m | | % | | US$m | | US$m | | % | |
| Total interest-bearing liabilities | | | | | | | | | | | | |
| Europe | HSBC Bank | 278,131 | | 9,087 | | 3.27 | | 253,275 | | 6,371 | | 2.52 | |
| | HSBC Private Banking Holdings (Suisse) | 25,041 | | 772 | | 3.08 | | 21,290 | | 442 | | 2.08 | |
| | HSBC France | 71,115 | | 1,732 | | 2.44 | | 80,601 | | 2,136 | | 2.65 | |
| | HSBC Finance | 8,667 | | 470 | | 5.42 | | 8,152 | | 421 | | 5.16 | |
| Hong Kong | Hang Seng Bank | 56,087 | | 1,024 | | 1.83 | | 54,056 | | 357 | | 0.66 | |
| | The Hongkong and Shanghai Banking Corporation | 105,907 | | 1,659 | | 1.57 | | 117,404 | | 1,038 | | 0.88 | |
| Rest of Asia-Pacific | The Hongkong and Shanghai Banking Corporation | 74,218 | | 2,236 | | 3.01 | | 64,415 | | 1,443 | | 2.24 | |
| | HSBC Bank Malaysia | 7,070 | | 182 | | 2.57 | | 6,298 | | 163 | | 2.59 | |
| | HSBC Bank Middle East | 10,351 | | 289 | | 2.79 | | 7,489 | | 103 | | 1.38 | |
| North America | HSBC Bank USA | 105,339 | | 4,088 | | 3.88 | | 80,389 | | 1,454 | | 1.81 | |
| | HSBC Finance | 116,164 | | 4,933 | | 4.25 | | 112,973 | | 2,964 | | 2.62 | |
| | HSBC Bank Canada | 31,380 | | 789 | | 2.51 | | 25,516 | | 544 | | 2.13 | |
| | HSBC Markets Inc | 4,718 | | 121 | | 2.56 | | 28,563 | | 701 | | 2.45 | |
| | HSBC Mexico | 15,165 | | 573 | | 3.78 | | 15,832 | | 574 | | 3.63 | |
| South America | Brazilian operations1 | 14,810 | | 2,137 | | 14.43 | | 7,626 | | 1,010 | | 13.24 | |
| | HSBC Bank Argentina | 1,056 | | 41 | | 3.88 | | 1,453 | | 46 | | 3.17 | |
| Other operations | | (17,224 | ) | (1,373 | ) | | | (6,174 | ) | (396 | ) | | |
| | |
| |
| | | |
| |
| | | |
| | | 907,995 | | 28,760 | | 3.17 | | 879,158 | | 19,371 | | 2.20 | |
| | |
| |
| | | |
| |
| | | |
| Summary | | | | | | | | | | | | | |
| Total interest-margin liabilities | 907,995 | | 28,760 | | 3.17 | | 879,158 | | 19,371 | | 2.20 | |
| Trading liabilities | | 211,059 | | 5,024 | | 2.38 | | | | | | | |
| Financial liabilities designated at fair value (excluding own debt issued) | 9,787 | | | | | | | | | | | |
| Non-interest-bearing current accounts | 65,509 | | | | | | 56,043 | | | | | |
| Total equity and other non-interest-bearing liabilities | 307,590 | | | | | | 314,140 | | | | | |
| | |
| |
| | | |
| |
| | | |
| Total equity and liabilities | 1,501,940 | | 33,784 | | 2.25 | | 1,249,341 | | 19,371 | | 1.55 | |
| | |
| |
| | | |
| |
| | | |
Net interest margin
| | | Year ended 31 December | |
| | |
| |
| | | 2005 | | 2004 | |
| | | % | | % | |
| Europe | HSBC Bank | 2.08 | | 2.41 | |
| | HSBC Private Banking Holdings (Suisse) | 1.03 | | 0.82 | |
| | HSBC France | 1.30 | | 1.44 | |
| | HSBC Finance | 5.79 | | 6.99 | |
| Hong Kong | Hang Seng Bank | 2.19 | | 2.08 | |
| | The Hongkong and Shanghai Banking Corporation | 2.20 | | 1.74 | |
| Rest of Asia-Pacific | The Hongkong and Shanghai Banking Corporation | 2.00 | | 1.96 | |
| | HSBC Bank Malaysia | 2.80 | | 2.56 | |
| | HSBC Bank Middle East | 3.46 | | 3.69 | |
| North America | HSBC Bank USA | 2.31 | | 2.90 | |
| | HSBC Finance | 6.97 | | 8.74 | |
| | HSBC Bank Canada | 2.40 | | 2.41 | |
| | HSBC Mexico | 7.65 | | 5.82 | |
| South America | Brazilian operations1 | 11.44 | | 13.29 | |
| | HSBC Bank Argentina | 7.87 | | 5.18 | |
| Other operations7 | | 0.20 | | 0.03 | |
| | |
| |
| |
| | | 3.14 | | 3.19 | |
| For footnotes, see page 113. |
| |
| |
110
Back to Contents
| Analysis of changes in net interest income |
|
The following table allocates changes in net interest income between volume and rate for 2005 compared with 2004. Changes due to a combination of volume
and rate, and the effect of reclassifying items on the adoption of IAS 32 and IAS 39 at 1 January 2005, are allocated to rate.
| | | | | | |
| Interest income | | | | | |
| | | 2005 compared with 2004 | | | |
| | | Increase/(decrease) | | | |
| | |
| | | |
| | | 2005 | | Volume | | Rate | | 2004 | |
| | | US$m | | US$m | | US$m | | US$m | |
| Short-term funds and loans and advances to banks | | | | | | | | |
| | | | | | | | | | |
| Europe | HSBC Bank | 774 | | (64 | ) | 169 | | 669 | |
| | HSBC Private Banking Holdings (Suisse) | 156 | | 32 | | 35 | | 89 | |
| | HSBC France | 387 | | (339 | ) | (234 | ) | 960 | |
| | | | | | | | | | |
| Hong Kong | Hang Seng Bank | 288 | | (7 | ) | 74 | | 221 | |
| | The Hongkong and Shanghai Banking Corporation | 1,058 | | 167 | | 353 | | 538 | |
| | | | | | | | | | |
| Rest of Asia-Pacific | The Hongkong and Shanghai Banking Corporation | 351 | | 54 | | 99 | | 198 | |
| | HSBC Bank Malaysia | 49 | | 11 | | 2 | | 36 | |
| | HSBC Bank Middle East | 111 | | 29 | | 53 | | 29 | |
| | | | | | | | | | |
| North America | HSBC Bank USA | 151 | | 30 | | 65 | | 56 | |
| | HSBC Bank Canada | 62 | | (1 | ) | 18 | | 45 | |
| | HSBC Mexico | 228 | | (47 | ) | 48 | | 227 | |
| | | | | | | | | | |
| South America | Brazilian operations1 | 565 | | 164 | | 164 | | 237 | |
| | HSBC Bank Argentina | 7 | | – | | 4 | | 3 | |
| | | | | | | | | | |
| Other operations | | 456 | | (76 | ) | 203 | | 329 | |
| | |
| | | | | |
| |
| | | 4,643 | | (5 | ) | 1,011 | | 3,637 | |
| | |
| | | | | |
| |
| Trading assets | | | | | | | 3,023 | |
| | | | | | | |
| |
| Loans and advances to customers | | | | | | | | |
| | | | | | | | | | |
| Europe | HSBC Bank | 12,223 | | 1,817 | | 885 | | 9,521 | |
| | HSBC Private Banking Holdings (Suisse) | 211 | | 27 | | 69 | | 115 | |
| | HSBC France | 1,710 | | (8 | ) | (174 | ) | 1,892 | |
| | HSBC Finance | 1,086 | | 77 | | (46 | ) | 1,055 | |
| | | | | | | | | | |
| Hong Kong | Hang Seng Bank | 1,323 | | 47 | | 394 | | 882 | |
| | The Hongkong and Shanghai Banking Corporation | 2,061 | | 70 | | 585 | | 1,406 | |
| | | | | | | | | | |
| Rest of Asia-Pacific | The Hongkong and Shanghai Banking Corporation | 2,659 | | 478 | | 400 | | 1,781 | |
| | HSBC Bank Malaysia | 325 | | 25 | | 22 | | 278 | |
| | HSBC Bank Middle East | 635 | | 147 | | 70 | | 418 | |
| | | | | | | | | | |
| North America | HSBC Bank USA | 5,594 | | 1,197 | | 1,461 | | 2,936 | |
| | HSBC Finance | 13,307 | | 439 | | (278 | ) | 13,146 | |
| | HSBC Bank Canada | 1,439 | | 286 | | 54 | | 1,099 | |
| | HSBC Mexico | 1,210 | | 205 | | 127 | | 878 | |
| | | | | | | | | | |
| South America | Brazilian operations1 | 2,647 | | 879 | | 241 | | 1,527 | |
| | HSBC Bank Argentina | 122 | | 1 | | 20 | | 101 | |
| | | | | | | | | | |
| Other operations | | 1,352 | | (266 | ) | 505 | | 1,113 | |
| | |
| | | | | |
| |
| | | 47,904 | | 5,230 | | 4,526 | | 38,148 | |
| |
| | | | | |
| |
| For footnotes, see page 113. | | | | | | | | |
111
Back to Contents
H S B C H O L D I N G S P L C
Financial Review(continued)
| Interest income(continued) | | | | | | | | |
| | | 2005 compared with 2004 | | | |
| | | Increase/(decrease) | | | |
| | |
| | | |
| | | 2005 | | Volume | | Rate | | 2004 | |
| | | US$m | | US$m | | US$m | | US$m | |
| Financial investments | | | | | | | | |
| | | | | | | | | | |
| Europe | HSBC Bank | 1,297 | | 487 | | (14 | ) | 824 | |
| | HSBC Private Banking Holdings (Suisse) | 299 | | (59 | ) | 55 | | 303 | |
| | HSBC France | 143 | | (85 | ) | (12 | ) | 240 | |
| | | | | | | | | | |
| Hong Kong | Hang Seng Bank | 815 | | 61 | | 247 | | 507 | |
| | The Hongkong and Shanghai Banking Corporation | 924 | | (99 | ) | 244 | | 779 | |
| | | | | | | | | | |
| Rest of Asia-Pacific | The Hongkong and Shanghai Banking Corporation | 592 | | (27 | ) | 82 | | 537 | |
| | HSBC Bank Malaysia | 41 | | 1 | | – | | 40 | |
| | HSBC Bank Middle East | 44 | | 5 | | 12 | | 27 | |
| | | | | | | | | | |
| North America | HSBC Bank USA | 864 | | 51 | | (71 | ) | 884 | |
| | HSBC Finance | 221 | | (8 | ) | 63 | | 166 | |
| | HSBC Bank Canada | 116 | | 26 | | 25 | | 65 | |
| | HSBC Mexico | 583 | | 121 | | 67 | | 395 | |
| | | | | | | | | | |
| South America | Brazilian operations1 | 324 | | 225 | | (29 | ) | 128 | |
| | HSBC Bank Argentina | 23 | | 3 | | 8 | | 12 | |
| | | | | | | | | | |
| Other operations | | 881 | | 9 | | 308 | | 564 | |
| | |
| | | | | |
| |
| | | 7,167 | | 387 | | 1,309 | | 5,471 | |
| | |
| | | | | |
| |
| Deposits by banks | | | | | | | | | |
| | | | | | | | | | |
| Europe | HSBC Bank | 1,037 | | 87 | | 538 | | 412 | |
| | HSBC Private Banking Holdings (Suisse) | 20 | | (10 | ) | 3 | | 27 | |
| | HSBC France | 582 | | (100 | ) | 156 | | 526 | |
| | | | | | | | | | |
| Hong Kong | Hang Seng Bank | 61 | | 24 | | 23 | | 14 | |
| | The Hongkong and Shanghai Banking Corporation | 116 | | 4 | | 73 | | 39 | |
| | | | | | | | | | |
| Rest of Asia-Pacific | The Hongkong and Shanghai Banking Corporation | 168 | | 40 | | 33 | | 95 | |
| | HSBC Bank Malaysia | 5 | | 3 | | – | | 2 | |
| | HSBC Bank Middle East | 27 | | (5 | ) | 9 | | 23 | |
| | | | | | | | | | |
| North America | HSBC Bank USA | 202 | | 8 | | 120 | | 74 | |
| | HSBC Bank Canada | 34 | | 11 | | 15 | | 8 | |
| | HSBC Mexico | 70 | | 7 | | 15 | | 48 | |
| | | | | | | | | | |
| South America | Brazilian operations1 | 125 | | 28 | | 40 | | 57 | |
| | HSBC Bank Argentina | 8 | | (2 | ) | 2 | | 8 | |
| | | | | | | | | | |
| Other operations | | 211 | | (133 | ) | 138 | | 206 | |
| | |
| | | | | |
| |
| | | 2,666 | | (38 | ) | 1,165 | | 1,539 | |
| |
| | | | | |
| |
| For footnotes, see page 113. | | | | | | | | |
112
Back to Contents
| Interest expense | | | | | | | | |
| | | 2005 compared with 2004 | | | |
| | | Increase/(decrease) | | | |
| | |
| | | |
| | | 2005 | | Volume | | Rate | | 2004 | |
| | | US$m | | US$m | | US$m | | US$m | |
| Customer accounts | | | | | | | | | |
| | | | | | | | | | |
| Europe | HSBC Bank | 5,359 | | 411 | | 962 | | 3,986 | |
| | HSBC Private Banking Holdings (Suisse) | 622 | | 56 | | 189 | | 377 | |
| | HSBC France | 611 | | 64 | | (28 | ) | 575 | |
| | | | | | | | | | |
| Hong Kong | Hang Seng Bank | 874 | | 3 | | 581 | | 290 | |
| | The Hongkong and Shanghai Banking Corporation | 1,322 | | 12 | | 918 | | 392 | |
| | | | | | | | | | |
| Rest of Asia-Pacific | The Hongkong and Shanghai Banking Corporation | 1,293 | | 133 | | 269 | | 891 | |
| | HSBC Bank Malaysia | 157 | | 10 | | (4 | ) | 151 | |
| | HSBC Bank Middle East | 207 | | 27 | | 120 | | 60 | |
| | | | | | | | | | |
| North America | HSBC Bank USA | 1,385 | | 103 | | 602 | | 680 | |
| | HSBC Bank Canada | 475 | | 66 | | 58 | | 351 | |
| | HSBC Mexico | 188 | | (97 | ) | (92 | ) | 377 | |
| | | | | | | | | | |
| South America | Brazilian operations1 | 1,859 | | 728 | | 289 | | 842 | |
| | HSBC Bank Argentina | 28 | | – | | 1 | | 27 | |
| | | | | | | | | | |
| Other operations | | 1,273 | | (190 | ) | 545 | | 918 | |
| | |
| | | | | |
| |
| | | 15,653 | | 670 | | 5,066 | | 9,917 | |
| |
| | | | | |
| |
| Financial liabilities designated at fair value – own debt issued | 2,037 | | | | | | | |
| |
| | | | | | | |
| Debt securities in issue | | | | | | | | |
| | | | | | | | | | |
| Europe | HSBC Bank | 1,817 | | 96 | | 618 | | 1,103 | |
| | HSBC France | 314 | | (53 | ) | (67 | ) | 434 | |
| | HSBC Finance | 77 | | (9 | ) | (77 | ) | 163 | |
| | | | | | | | | | |
| Hong Kong | Hang Seng Bank | 53 | | 6 | | 17 | | 30 | |
| | The Hongkong and Shanghai Banking Corporation | – | | (437 | ) | – | | 437 | |
| |
| | | | | | | | | | |
| Rest of Asia-Pacific | The Hongkong and Shanghai Banking Corporation | 315 | | 52 | | 34 | | 229 | |
| | HSBC Bank Malaysia | 16 | | 10 | | (2 | ) | 8 | |
| | | | | | | | | | |
| North America | HSBC Bank USA | 1,073 | | 487 | | 210 | | 376 | |
| | HSBC Finance | 3,399 | | (689 | ) | 1,337 | | 2,751 | |
| | HSBC Bank Canada | 268 | | 54 | | 49 | | 165 | |
| | HSBC Mexico | 285 | | 38 | | 113 | | 134 | |
| | | | | | | | | | |
| South America | Brazilian operations1 | 67 | | 7 | | (5 | ) | 65 | |
| | HSBC Bank Argentina | 1 | | (6 | ) | – | | 7 | |
| | | | | | | | | | |
| Other operations | | 90 | | (146 | ) | 2 | | 234 | |
| | |
| | | | | |
| |
| | | 7,775 | | (857 | ) | 2,496 | | 6,136 | |
| | |
| | | | | |
| |
Footnotes to ‘Average balance sheet and net interest income’
| 1 | Brazilian operations comprise HSBC Bank Brasil S.A.-Banco Múltiplo and subsidiaries, plus Banco Lloyds TSB S.A. and Losango Promotora de Vendas Limitada. |
| 2 | Interest income on trading assets is reported as ‘Net trading income’ in the consolidated income statement in 2005. |
| 3 | Interest income on financial assets designated at fair value is reported as ‘Net income from financial instruments designated at fair value’ in the consolidated income statement. |
| 4 | Further analysis is given on page 179. |
| 5 | Further analysis is given on page 180. |
| 6 | Interest expense on financial liabilities designated at fair value is reported as ‘Net income on financial liabilities designated at fair value’ in the consolidated income statement other than interest on own debt. |
| 7 | Excludes eliminations (see note (iii)). |
113
Back to Contents
H S B C H O L D I N G S P L C
Financial Review(continued)
Notes
| (i) | Average balances are based on daily averages for the principal areas of HSBC’s banking activities with monthly or less frequent averages used elsewhere. |
| (ii) | In 2004 ‘Loans accounted for on a non-accrual basis’ and ‘Loans on which interest has been accrued but suspended’ were included in ‘Loans and advances to banks’ and ‘Loans and advances to customers’. Interest income on such loans was included in the consolidated income statement to the extent to which it had been received. |
| (iii) | Balances and transactions with fellow subsidiaries are reported gross in the principal commercial banking and consumer finance entities within ‘Other interest-earning assets’ and ‘Other interest-bearing liabilities’ as appropriate and the elimination entries are included within ‘Other operations’ in those two categories. |
| (iv) | Other than as noted in (iii) above, ‘Other operations’ comprise the operations of the principal commercial banking and consumer finance entities outside their domestic markets and all other banking operations. |
| (v) | In 2004 non-equity minority interests were included within shareholders’ equity and other non interest-bearing liabilities and the related coupon payments were included within ‘Profit attributable to minority interests’. |
114
Back to Contents
| Risk management |
|
| (Audited IFRS 7 information) |
All HSBC’s activities involve analysis, evaluation, acceptance and management of some degree of risk or combination of risks. The most important types of risk are credit risk (which includes country and cross-border risk), liquidity risk, market risk, residual value risk, reputational risk, operational risk and insurance risk. Market risk includes foreign exchange, interest rate and equity price risk.
HSBC’s risk management policies are designed to identify and analyse these risks, to set appropriate risk limits and controls, and to monitor the risks and adherence to limits by means of reliable and up-to-date administrative and information systems. HSBC regularly reviews its risk management policies and emerging best practice. Individual responsibility and accountability, instilled through training, are designed to deliver a disciplined, conservative and constructive culture of risk management and control.
The Group Management Board, under authority delegated by the Board of Directors, formulates high level Group risk management policy. A separately constituted Risk Management Meeting monitors risk and receives reports which allow it to review the effectiveness of HSBC’s risk management policies.
The management of all risks that are significant to HSBC is discussed below. The insurance businesses manage their own credit, liquidity and market risk along with insurance risk, so these risks are discussed separately from those relating to the operations’ section.
| Credit risk management |
|
| (Audited IFRS 7 information) |
Credit risk is the risk of financial loss if a customer or counterparty fails to meet an obligation under a contract. It arises principally from lending, trade finance, treasury and leasing business. HSBC hasfinance, treasury and leasing business. HSBC has standards, policies and procedures dedicated to controlling and monitoring risk from all such activities.
Within Group Head Office, a separate function, Group Credit and Risk, is mandated to provide high-level centralised management of credit risk for HSBC worldwide. Group Credit and Risk is headed by a Group General Manager who reports to the Group Chief Executive. Its responsibilities include the following:
| • | Formulating credit policies. These are embodied in the HSBC standards with which all HSBC’s |
| | operating companies are required to comply in formulating and recording in dedicated manuals their own more detailed credit policies and procedures. All such credit policies and procedures are monitored by Group Credit and Risk. |
| | |
| • | Establishing and maintaining HSBC’s largecredit exposure policy. This policy delineatesHSBC’s maximum exposures to individualcustomers, customer groups and other riskconcentrations in an approach which is designedto be more conservative than internationallyaccepted regulatory standards. All HSBC’soperating companies are required to complywith the policy. |
| | |
| • | Issuing lending guidelines to HSBC’s operating companies on the Group’s attitude towards, and appetite for, lending to, inter alia, specified market sectors and industries. Each HSBC operating company and major business unit is required to base its own lending guidelines on HSBC’s standards, regularly update them and disseminate them to all credit and lending executives. |
| | |
| • | Undertaking an independent review and objective assessment of risk. Group Credit and Risk assesses all commercial non-bank credit facilities originated by HSBC’s operating companies in excess of designated limits, prior to the facilities being committed to customers. Operating companies may not confirm credit approval without this concurrence. Renewals and reviews of commercial non-bank facilities over designated levels are subject to the same process. |
| | |
| • | Controlling exposures to banks and other financial institutions. HSBC’s credit and settlement risk limits to counterparties in the finance and government sectors are approved centrally to optimise the use of credit availability and avoid excessive risk concentration. A dedicated unit within Group Credit and Risk controls and manages these exposures globally using centralised systems and automated processes. |
| | |
| • | Managing exposures to debt securities by establishing controls in respect of the liquidity of securities held for trading and setting issuer limits for securities held-to-maturity. Separate portfolio limits are established for asset-backed securities and similar instruments. |
| | |
| • | Controlling cross-border exposures. A dedicated unit within Group Credit and Risk uses |
115
Back to Contents
H S B C H O L D I N G S P L C
Financial Review (continued)
| | centralised systems to manage country and cross-border risk through the imposition of country limits with sub-limits by maturity and type of business. Country limits are determined by taking into account economic and political factors, and applying local business knowledge. Transactions with countries deemed to be high risk are considered on a case-by-case basis. |
| | |
| • | Controlling exposures to selected industries. Group Credit and Risk controls HSBC’s exposures to the shipping, aviation and automobile sectors, and closely monitors exposures to other industries such as insurance and real estate. When necessary, restrictions are imposed on new business, or exposures in HSBC’s operating companies are capped. |
| | |
| • | Maintaining and developing HSBC’s riskratings in order to categorise exposuresmeaningfully and facilitate focused managementof the attendant risks. Historically, HSBC’s riskrating framework has consisted of a minimum ofseven grades, taking into account the risk ofdefault and the availability of security or othercredit risk mitigation. A more sophisticated risk-rating framework for banks and other customers,based on default probability and loss estimatesand comprising up to 22 categories, is beingprogressively implemented across the HSBC Group and is already operative in most major business units. This new approach will increasingly allow a more granular analysis of risk and trends. Rating methodology is based upon a wide range of financial analytics together with market data-based tools which are core inputs to the assessment of counterparty risk. Although automated risk-rating processes are increasingly in use, for the larger facilities ultimate responsibility for setting risk grades rests in each case with the final approving executive. Risk grades are reviewed frequently and amendments, where necessary, are implemented promptly. |
| | |
| • | Reviewing the performance and effectiveness of operating companies’ credit approval processes. Regular reports are provided to Group Credit and Risk on the credit quality of local portfolios and corrective action is taken where necessary. |
| | |
| • | Reporting to certain senior executives on aspects of the HSBC loan portfolio. These executives, as well as the Group Management Board, the Risk Management Meeting, the Group Audit Committee and the Board of Directors of HSBC Holdings, receive a variety of regular reports covering: |
| | – | risk concentrations and exposure to industry sectors; |
| | | |
| | – | large customer group exposures; |
| | | |
| | – | emerging market debt and impairment allowances; |
| | | |
| | – | large impaired accounts and impairment allowances; |
| | | |
| | – | specific segments of the portfolio: real estate, automobiles, insurance, aviation and shipping, as well as ad hoc reviews; |
| | | |
| | – | country limits, cross-border exposures and impairment allowances; and |
| | | |
| | – | causes of unexpected loss and lessons learned. |
| | | |
| • | Managing and directing credit-related systems initiatives. HSBC has a centralised database of large corporate, sovereign and bank facilities and is constructing a database comprising all Group credit assets. A systems-based credit application process for bank lending is operational in all jurisdictions and an electronic corporate credit application system is deployed in all of the Group’s major businesses. |
| | | |
| • | Providing advice and guidance to HSBC’s operating companies in order to promote best practice throughout the Group on credit-related matters such as: |
| | | |
| | – | regulatory developments; |
| | | |
| | – | implementing environmental and social responsibility policies; |
| | | |
| | – | risk modelling and portfolio collective impairment allowances; |
| | | |
| | – | new products; |
| | | |
| | – | training courses; and |
| | | |
| | – | credit-related reporting. |
| | | |
| • | Acting on behalf of HSBC Holdings as the primary interface for credit-related issues with external parties including the Bank of England, the FSA, rating agencies, corporate analysts, trade associations and counterparts in the world’s major banks and non-bank financial institutions. |
| | | |
| Each operating company is required to implement credit policies, procedures and lending guidelines which conform to HSBC Group standards, with credit approval authorities delegated from the Board of Directors of HSBC Holdings to the relevant Chief Executive Officer. In each major |
116
Back to Contents
subsidiary, management includes a Chief Credit and Risk Officer who reports to the local Chief Executive Officer on credit-related issues. All Chief Credit and Risk Officers have a functional reporting line to the Group General Manager, Group Credit and Risk. Each operating company is responsible for the quality and performance of its credit portfolios and for monitoring and controlling all credit risks in its portfolios, including those subject to central approval by Group Credit and Risk. This includes managing its own risk concentrations by market sector, geography and product. Local systems are in place throughout the Group to enable operating companies to control and monitor exposures by customer and counterparty.
Special attention is paid to problem loans. When appropriate, specialist units are established by HSBC’s operating companies to provide customers with support in order to help them avoid default wherever possible, thereby maximising recoveries for HSBC.
Regular audits of operating companies’ credit processes are undertaken by HSBC’s Internal Audit function. Audits include a consideration of the completeness and adequacy of credit manuals and lending guidelines; an in-depth analysis of a representative sample of accounts; an overview of homogeneous portfolios of similar assets to assess the quality of the loan book and other exposures; and a check that Group standards and policies are adhered to in the extension and management of credit facilities. Individual accounts are reviewed to ensure that risk grades are appropriate, that credit and collection procedures have been properly followed and that, when an account or portfolio evidences deterioration, impairment allowances are raised in accordance with the Group’s established processes. Internal Audit discuss with management risk ratings they consider to be inappropriate, and their subsequent recommendations for revised grades must then be assigned to the facilities concerned.
Collateral and other credit enhancements
Loans and advances (Audited IFRS 7 information)
When appropriate, operating companies are required to implement guidelines on the acceptability of specific classes of collateral or credit risk mitigation, and determine valuation parameters. Such parameters are expected to be conservative, reviewed regularly and supported by empirical evidence. Security structures and legal covenants are subject to regular review to ensure that they continue to fulfil their intended purpose and remain in line with local market practice. While collateral is an
important mitigant to credit risk, it is HSBC’s policy to establish that loans are within the customer’s capacity to repay rather than to rely excessively on security. In certain cases, depending on the customer’s standing and the type of product, facilities may be unsecured. The principal collateral types are as follows:
| • | in the personal sector, mortgages over residential properties; |
| | |
| • | in the commercial and industrial sector, charges over business assets such as premises, stock and debtors; |
| | |
| • | in the commercial real estate sector, charges over the properties being financed; and |
| | |
| • | in the financial sector, charges over financial instruments such as debt securities and equities in support of trading facilities. |
Other securities(Audited IFRS 7 information)
Collateral held as security for financial assets other than loans and advances is determined by the nature of the instrument. Debt securities, treasury and other eligible bills are generally unsecured with the exception of asset backed securities and similar instruments, which are secured by pools of financial assets.
The ISDA Master Agreement is HSBC’s preferred agreement for documenting derivatives activity. It provides the contractual framework within which dealing activity across a full range of over-the-counter (‘OTC’), products is conducted and contractually binds both parties to apply close-out netting across all outstanding transactions covered by an agreement, if either party defaults or following other pre-agreed termination events. It is common for the parties to execute a Credit Support Annex (‘CSA’) in conjunction with the ISDA Master Agreement, a practice HSBC encourages. Under a CSA, collateral is passed between the parties to mitigate the market contingent counterparty risk inherent in the outstanding positions.
Settlement risk arises in any situation where a payment in cash, securities or equities is made in the expectation of a corresponding receipt in cash, securities or equities. Daily Settlement Limits are established for each counterparty, to cover the aggregate of all settlement risk arising from HSBC’s investment banking and markets transactions on any single day. Settlement risk on many transactions, particularly those involving securities and equities, is substantially mitigated when effected via Assured Payment Systems, or on a delivery versus payment basis.
117
Back to Contents
H S B C H O L D I N G S P L C
Financial Review (continued)
| |
| Maximum exposure to credit risk |
| |
| Maximum exposure to credit risk before collateral held or other credit enhancements |
| Maximum exposure |
| (Audited IFRS 7 information) |
| US$m |
| Items in course of collection from other banks | 11,300 |
| Trading assets | 212,705 |
| Treasury and other eligible bills | 12,746 |
| Debt securities | 117,659 |
| Loans and advances | 82,300 |
| | |
| Financial assets designated at fair value | 6,513 |
| Treasury and other eligible bills | 53 |
| Debt securities | 5,705 |
| Loans and advances | 755 |
| | |
| Derivatives | 73,928 |
| Loans and advances to banks | 125,965 |
| Loans and advances to customers | 740,002 |
| Financial investments | 174,822 |
| Treasury and other eligible bills | 25,041 |
| Debt securities | 149,781 |
| | |
| Other assets | |
| Endorsements and acceptances | 7,973 |
| Other | 10,981 |
| Financial guarantees and other credit related contingent liabilities | 66,805 |
| Loan commitments and other credit related commitments | 12,216 |
| |
|
| At 31 December 2005 | 1,443,210 |
| |
|
| | |
Concentration of exposure
Loans and advances
Loans and advances are well spread across both industry sectors and jurisdictions.
At constant exchange rates, and excluding the US$44 billion grossing adjustment to meet IFRSs requirements, gross loans and advances to customers (excluding the finance sector and settlement accounts) grew by US$71 billion, or 12 per cent, during 2005. On the same basis, personal lending comprised 63 per cent of HSBC’s loan portfolio and 63 per cent of the growth in loans in 2005.
Including the financial sector and settlement accounts, personal lending represented US$420 billion, or 56 per cent, of total loans and advances to customers at 31 December 2005. Within this total, secured residential mortgages were US$234 billion and, at 31 per cent, of total advances to customers, the Group’s largest single concentration.
Commercial and financial lending, including settlement accounts, comprised 44 per cent of gross lending to customers at 31 December 2005. The largest single industry concentrations were in non-bank financial institutions and commercial real estate lending, each of which amounted to 7 per cent of total gross lending to customers, broadly in line with 2004.
Commercial, industrial and international trade lending grew strongly in 2005, particularly in the retail and services industries. This, together with the IFRS grossing change mentioned above, increased commercial and financial lending by just over 2 percentage points to 17 per cent of total gross loans and advances. Within this category of lending, no individual industry exceeded 4 per cent of total gross lending.
Advances to banks are widely distributed, principally to major institutions, and with no single exposure more than 5 per cent of total advances to banks.
Financial investmentsTotal financial investments were broadly in line with 2004. Investments of US$96 billion in corporate debt and other securities were the largest single concentration of these, rising to 53 per cent of overall investments from 45 per cent at 31 December 2004. Nearly three quarters of these holdings, which were spread across a wide range of issuers, as well as geographically, were in debt securities issued by banks and other financial institutions.
Investments in governments and government agencies of US$76 billion were 42 per cent of overall financial investments, broadly in line with 2004. One third of these investments were held in treasury and other eligible bills.
118
Back to Contents
The insurance businesses have a diversified portfolio of debt securities designated at fair value (US$5 billion) and debt securities classified as financial investments (US$9 billion).
Securities held for trading
Total securities within trading assets were US$150 billion. The largest single class of these assets is governments and government agency assets,
which amounted to US$72 billion, or 48 per cent of overall trading securities. This included US$13 billion of treasury and other eligible bills.
Corporate debt and other securities were US$55 billion or 37 per cent of overall trading securities. In percentage terms this was broadly in line with 2004. Included within this were US$17 billion of debts securities issued by banks and other financial institutions.
Gross loans and advances by industry sector
| At | | Constant | | | | | | At | |
| 31 December | | currency | | Grossing/ | | Underlying | | 31 December | |
| 2004 | | effect | | offsetting2 | | change | | 2005 | |
| US$m | | US$m | | US$m | | US$m | | US$m | |
| Loans and advances to customers | | | | | | | | | | |
| Personal: | | | | | | | | | | |
| Residential mortgages | 222,464 | | (7,701 | ) | – | | 19,103 | | 233,866 | |
| Hong Kong Government Home | | | | | | | | | | |
| Ownership Scheme | 5,383 | | 14 | | – | | (717 | ) | 4,680 | |
| Other personal | 160,005 | | (4,267 | ) | – | | 26,192 | | 181,930 | |
| |
| |
| |
| |
| |
| |
| Total personal | 387,852 | | (11,954 | ) | – | | 44,578 | | 420,476 | |
| |
| |
| |
| |
| |
| |
| Corporate and commercial: | | | | | | | | | | |
| Commercial, industrial andinternational trade | 101,876 | | (6,171 | ) | 21,626 | | 13,471 | | 130,802 | |
| Commercial real estate | 43,469 | | (2,222 | ) | 199 | | 10,369 | | 51,815 | |
| Other property-related | 20,749 | | (761 | ) | 1,353 | | 855 | | 22,196 | |
| Government | 10,527 | | (388 | ) | 622 | | (2,543 | ) | 8,218 | |
| Other commercial1 | 55,151 | | (3,993 | ) | 10,606 | | 3,914 | | 65,678 | |
| |
| |
| |
| |
| |
| |
| Total corporate and commercial | 231,772 | | (13,535 | ) | 34,406 | | 26,066 | | 278,709 | |
| |
| |
| |
| |
| |
| |
| Financial: | | | | | | | | | | |
| Non-bank financial institutions | 52,329 | | (3,679 | ) | 9,840 | | (8,458 | ) | 50,032 | |
| Settlement accounts | 13,819 | | (497 | ) | – | | (11,180 | ) | 2,142 | |
| |
| |
| |
| |
| |
| |
| Total financial | 66,148 | | (4,176 | ) | 9,840 | | (19,638 | ) | 52,174 | |
| |
| |
| |
| |
| |
| |
| Total loans and advances to customers | 685,772 | | (29,665 | ) | 44,246 | | 51,006 | | 751,359 | |
| Loans and advances to banks | 143,466 | | (5,694 | ) | – | | (11,798 | ) | 125,974 | |
| |
| |
| |
| |
| |
| |
| Total gross loans and advances | 829,238 | | (35,359 | ) | 44,246 | | 39,208 | | 877,333 | |
| |
| |
| |
| |
| |
| |
| 1 | Other commercial loans and advances include advances in respect of agriculture, transport, energy and utilities. |
| 2 | Under IAS32 there are restrictions on the ability to offset, for presentational purposes, loans and advances in respect of customers who maintain both deposit and borrowing relationships with HSBC. This represents the amounts ‘grossed up’ at 31 December 2005 to isolate underlying charges on the net basis on which HSBC continues to treat such loans and advances for the purpose of credit risk management. |
| | |
The commentary below analyses the underlying changes in lending noted in the table above, measured against the position at 31 December 2004. On this basis, total loans and advances to customers grew by 8 per cent, and total gross loans and advances increased by 5 per cent.
Residential mortgages increased by 9 per cent to US$234 billion and comprised 31 per cent of total gross loans to customers (including the finance sector and settlement accounts) at 31 December 2005. Growth was particularly strong in the UK, where residential mortgages increased by 17 per cent to US$68 billion, and in North America, where
mortgages increased by US$5 billion to US$118 billion.
In North America, mortgage growth was concentrated in HSBC Finance in the US, where a continued focus on expanding the secured lending portfolio through the correspondent and branch based businesses generated an 18 per cent increase in mortgage lending. There was also a continued focus on junior lien loans through portfolio acquisitions and purchasing newly originated loans through flow correspondents. This was partly offset by a reduction in the US bank, as newly originated prime mortgages were sold into the secondary market. In Canada,
119
Back to Contents
H S B C H O L D I N G S P L C
Financial Review (continued)
branch expansions in the consumer finance business delivered a 17 per cent increase in mortgage lending.
Residential mortgage balances in Hong Kong were broadly flat, in what remained a highly competitive market. There was a net repayment in mortgages under the Hong Kong GHOS, under which new advances remained suspended. In the rest of Asia-Pacific, an increase of 22 per cent in mortgage lending was driven by operations in the Middle East, India, Taiwan, South Korea, mainland China and Singapore, in each of which growth was over 30 per cent.
Other personal lending increased by 17 per cent to US$182 billion, and represented 24 per cent of total gross loans to customers at 31 December 2005. The acquisition of Metris in December 2005 increased personal loans by US$5 billion, or 3 percentage points of the growth in 2005. Including and in part due to this, some 75 per cent of growth was in North America. Organic growth within the US in HSBC branded prime, Union Privilege and non-prime portfolios, partly offset by the continued decline in certain older acquired portfolios, also contributed to the increase. The US vehicle finance business reported strong organic growth, principally in the near-prime portfolios. This came from newly originated loans acquired through the dealer network, growth in the consumer direct loan programme and expanded distribution through alliance channels. Growth in personal non-credit card lending reflected HSBC’s increasing the availability of this product in the second half of 2004, as a result of an improving US economy, as well as the success of several large direct mail campaigns launched in 2005.
In Europe, the charge-off of substantially provided personal loans against provisions masked the underlying growth in lending: Other personal lending net of impairment reserves grew by 13 per cent. In the UK, growth in credit card and other unsecured lending was driven by pricing and marketing initiatives, against the backdrop of subdued consumer spending. In Turkey, credit card lending rose markedly, also helped by marketing campaigns.
In the Rest of Asia-Pacific, continuing expansion of the credit card base and higher utilisation of cards by existing customers, together with successful marketing, contributed to a 25 per cent increase in lending. In South America, marketing and new product launches, combined with improved consumer sentiment, contributed to underlying growth of 26 per cent in Brazil.
Loans and advances to the corporate and commercial sectors grew by 12 per cent during 2005, predominantly in the Commercial Banking customer group.
In Europe, corporate and commercial advances increased by 10 per cent, reflecting customer demand for credit, as well as new customer acquisition, particularly in the property, distribution and services sectors. In Hong Kong, an 11 per cent increase was mainly in the property and manufacturing sectors, in part reflecting the benefit of economic expansion in mainland China. This was also reflected in the Rest of Asia-Pacific, where strong regional economies, and significant government-backed infrastructure and property projects, also contributed to the 16 per cent increase overall. In North America, a 15 per cent increase was driven by lending to finance real estate projects and construction, as well as increases in most other sectors and industries.
The following tables analyse loans by industry sector and by the location of the principal operations of the lending subsidiary or, in the case of the operations of The Hongkong and Shanghai Banking Corporation, HSBC Bank, HSBC Bank Middle East and HSBC Bank USA, by the location of the lending branch.
120
Back to Contents
Loans and advances to customers by industry sector and by geographical region
| | | | | | |
| At 31 December 2005(Audited IFRS 7 information) | |
| |
| |
| | | | | | | | | | | | | Gross loans | |
| | | | | | | | | | | Gross | | by industry | |
| | | | | Rest of | | | | | | loans and | | sector as a | |
| | | Hong | | Asia- | | North | | South | | advances to | | % of total | |
| Europe | | Kong | | Pacific | | America | | America | | customers | | gross loans | |
| US$m | | US$m | | US$m | | US$m | | US$m | | US$m | | % | |
| Personal | | | | | | | | | | | | | | |
| Residential mortgages | 73,923 | | 23,812 | | 17,641 | | 118,298 | | 192 | | 233,866 | | 31.1 | |
| Hong Kong Government | | | | | | | | | | | | | | |
| Home Ownership Scheme | – | | 4,680 | | – | | – | | – | | 4,680 | | 0.6 | |
| Other personal | 55,672 | | 9,978 | | 11,178 | | 100,116 | | 4,986 | | 181,930 | | 24.2 | |
| |
| |
| |
| |
| |
| |
| |
| |
| | 129,595 | | 38,470 | | 28,819 | | 218,414 | | 5,178 | | 420,476 | | 55.9 | |
| |
| |
| |
| |
| |
| |
| |
| |
| Corporate and commercial | | | | | | | | | | | | | | |
| Commercial, industrial and | | | | | | | | | | | | | | |
| international trade | 76,687 | | 16,736 | | 21,286 | | 13,199 | | 2,894 | | 130,802 | | 17.4 | |
| Commercial real estate | 22,071 | | 12,557 | | 5,081 | | 11,911 | | 195 | | 51,815 | | 6.9 | |
| Other property-related | 7,603 | | 6,147 | | 3,426 | | 4,937 | | 83 | | 22,196 | | 3.0 | |
| Government | 1,821 | | 303 | | 2,147 | | 3,502 | | 445 | | 8,218 | | 1.1 | |
| Other commercial1 | 41,944 | | 6,922 | | 7,716 | | 7,960 | | 1,136 | | 65,678 | | 8.7 | |
| |
| |
| |
| |
| |
| |
| |
| |
| | 150,126 | | 42,665 | | 39,656 | | 41,509 | | 4,753 | | 278,709 | | 37.1 | |
| |
| |
| |
| |
| |
| |
| |
| |
| Financial | | | | | | | | | | | | | | |
| Non-bank financial | | | | | | | | | | | | | | |
| institutions | 35,305 | | 1,966 | | 2,202 | | 10,431 | | 128 | | 50,032 | | 6.7 | |
| Settlement accounts | 1,002 | | 505 | | 175 | | 416 | | 44 | | 2,142 | | 0.3 | |
| |
| |
| |
| |
| |
| |
| |
| |
| | 36,307 | | 2,471 | | 2,377 | | 10,847 | | 172 | | 52,174 | | 7.0 | |
| |
| |
| |
| |
| |
| |
| |
| |
| Total gross loans and advances | | | | | | | | | | | | | | |
| to customers2 | 316,028 | | 83,606 | | 70,852 | | 270,770 | | 10,103 | | 751,359 | | 100.0 | |
| |
| |
| |
| |
| |
| |
| |
| |
| Percentage of Group loans and | | | | | | | | | | | | | | |
| advances by geographical | | | | | | | | | | | | | | |
| region | 42.2% | | 11.1% | | 9.4% | | 36.0% | | 1.3% | | 100.0% | | | |
| Impaired loans | 5,068 | | 506 | | 936 | | 4,045 | | 891 | | 11,446 | | | |
| Impaired loans as a percentage of | | | | | | | | | | | | | | |
| gross loans and advances to | | | | | | | | | | | | | | |
| customers | 1.6% | | 0.6% | | 1.3% | | 1.5% | | 8.8% | | 1.5% | | | |
| Impairment allowances | | | | | | | | | | | | | | |
| outstanding against loans | | | | | | | | | | | | | | |
| and advances | 3,491 | | 398 | | 836 | | 5,836 | | 796 | | 11,357 | | | |
| Impairment allowances | | | | | | | | | | | | | | |
| outstanding as a percentage | | | | | | | | | | | | | | |
| of impaired loans | 68.9% | | 78.9% | | 89.3% | | 144.3% | | 89.2% | | 99.2% | | | |
| | |
| 1 | Other commercial loans and advances include advances in respect of agriculture, transport, energy and utilities. |
| 2 | Included within this total is credit card lending of US$66,020 million. |
| |
| Included in personal lending in North America are the following balances relating to the US: | | | | |
| 2005 | | 2004 | |
| US$m | | US$m | |
| Residential mortgages – HSBC Bank USA | 36,170 | | 43,683 | |
| Residential mortgages – HSBC Finance | 67,359 | | 55,612 | |
| Motor vehicle finance | 12,792 | | 11,284 | |
| MasterCard/Visa credit cards | 26,795 | | 20,300 | |
| Private label cards | 15,488 | | 13,684 | |
| Other unsecured personal lending | 35,545 | | 28,448 | |
| |
| |
| |
| 194,149 | | 173,011 | |
| |
| |
| |
121
Back to Contents
H S B C H O L D I N G S P L C
Financial Review(continued)
| Loans and advances to customers by industry sector and by geographical region(continued) | | | |
| At 31 December 2004 | |
| |
| |
| | | | | | | | | | | | | Gross loans | |
| | | | | | | | | | | Gross | | by industry | |
| | | | | Rest of | | | | | | loans and | | sector as a | |
| | | Hong | | Asia- | | North | | South | | advances to | | % of total | |
| Europe | | Kong | | Pacific | | America | | America | | customers | | gross loans | |
| US$m | | US$m | | US$m | | US$m | | US$m | | US$m | | % | |
| Personal | | | | | | | | | | | | | | |
| Residential mortgages | 70,546 | | 23,990 | | 14,860 | | 112,861 | | 207 | | 222,464 | | 32.5 | |
| Hong Kong GovernmentHome | | | | | | | | | | | | | | |
| Ownership Scheme. | – | | 5,383 | | – | | – | | – | | 5,383 | | 0.8 | |
| Other personal | 57,920 | | 9,105 | | 9,079 | | 80,463 | | 3,438 | | 160,005 | | 23.3 | |
| |
| |
| |
| |
| |
| |
| |
| |
| 128,466 | | 38,478 | | 23,939 | | 193,324 | | 3,645 | | 387,852 | | 56.6 | |
| |
| |
| |
| |
| |
| |
| |
| |
| Corporate and commercial | | | | | | | | | | | | | | |
| Commercial, industrial and | | | | | | | | | | | | | | |
| international trade | 55,018 | | 14,132 | | 19,177 | | 11,599 | | 1,950 | | 101,876 | | 14.9 | |
| Commercial real estate | 18,917 | | 10,388 | | 4,232 | | 9,798 | | 134 | | 43,469 | | 6.3 | |
| Other property-related | 6,850 | | 5,959 | | 3,350 | | 4,518 | | 72 | | 20,749 | | 3.0 | |
| Government | 3,663 | | 615 | | 1,432 | | 3,868 | | 949 | | 10,527 | | 1.5 | |
| Other commercial1 | 34,185 | | 7,294 | | 7,015 | | 5,718 | | 939 | | 55,151 | | 8.1 | |
| |
| |
| |
| |
| |
| |
| |
| |
| 118,633 | | 38,388 | | 35,206 | | 35,501 | | 4,044 | | 231,772 | | 33.8 | |
| |
| |
| |
| |
| |
| |
| |
| |
| Financial | | | | | | | | | | | | | | |
| Non-bank financial | | | | | | | | | | | | | | |
| institutions | 30,901 | | 1,932 | | 2,297 | | 17,090 | | 109 | | 52,329 | | 7.6 | |
| Settlement accounts | 4,476 | | 596 | | 305 | | 8,431 | | 11 | | 13,819 | | 2.0 | |
| |
| |
| |
| |
| |
| |
| |
| |
| 35,377 | | 2,528 | | 2,602 | | 25,521 | | 120 | | 66,148 | | 9.6 | |
| |
| |
| |
| |
| |
| |
| |
| |
| Total gross loans and | | | | | | | | | | | | | | |
| advances to customers2 | 282,476 | | 79,394 | | 61,747 | | 254,346 | | 7,809 | | 685,772 | | 100.0 | |
| |
| |
| |
| |
| |
| |
| |
| |
| Percentage of Group loans and | | | | | | | | | | | | | | |
| advances by geographical | | | | | | | | | | | | | | |
| region | 41.2% | | 11.6% | | 9.0% | | 37.1% | | 1.1% | | 100.0% | | | |
| Impaired loans3,4 | 6,039 | | 696 | | 1,160 | | 3,875 | | 657 | | 12,427 | | | |
| Impaired loans as a percentage of | | | | | | | | | | | | | | |
| gross loans and advances3 | 2.1% | | 0.9% | | 1.9% | | 1.5% | | 8.4% | | 1.8% | | | |
| Specific provisions outstanding | | | | | | | | | | | | | | |
| against loans and advances4 | 4,036 | | 320 | | 785 | | 4,364 | | 512 | | 10,017 | | | |
| Specific provisions outstanding | | | | | | | | | | | | | | |
| as a percentage of impaired | | | | | | | | | | | | | | |
| loans3,4 | 66.8% | | 46.0% | | 67.7% | | 112.6% | | 77.9% | | 80.6% | | | |
| | |
| 1 | Other commercial loans and advances include advances in respect of agriculture, transport, energy and utilities. |
| 2 | Included within this total is credit card lending of US$56,222 million. |
| 3 | Net of suspended interest. |
| 4 | Included in North America are impaired loans of US$3,782 million and specific provisions of US$3,443 million in HSBC Finance; excluding HSBC Finance, specific provisions outstanding as a percentage of impaired loans was 54.6 per cent. |
122
Back to Contents
| At 31 December 20031 | |
| |
| |
| | | | | | | | | | | | | Gross loans | |
| | | | | | | | | | | Gross | | by industry | |
| | | | | Rest of | | | | | | loans and | | sector as a | |
| | | Hong | | Asia- | | North | | South | | advances to | | % of total | |
| Europe | | Kong | | Pacific | | America | | America | | customers | | gross loans | |
| US$m | | US$m | | US$m | | US$m | | US$m | | US$m | | % | |
| Personal | | | | | | | | | | | | | | |
| Residential mortgages | 51,721 | | 23,664 | | 12,101 | | 77,754 | | 224 | | 165,464 | | 30.4 | |
| Hong Kong Government Home | | | | | | | | | | | | | | |
| Ownership Scheme | – | | 6,290 | | – | | – | | – | | 6,290 | | 1.2 | |
| Other personal | 42,041 | | 7,420 | | 7,135 | | 75,173 | | 2,376 | | 134,145 | | 24.7 | |
| |
| |
| |
| |
| |
| |
| |
| |
| 93,762 | | 37,374 | | 19,236 | | 152,927 | | 2,600 | | 305,899 | | 56.3 | |
| |
| |
| |
| |
| |
| |
| |
| |
| Corporate and commercial | | | | | | | | | | | | | | |
| Commercial, industrial and | | | | | | | | | | | | | | |
| international trade | 49,468 | | 10,966 | | 14,892 | | 8,907 | | 1,435 | | 85,668 | | 15.7 | |
| Commercial real estate | 15,517 | | 8,548 | | 3,149 | | 7,785 | | 89 | | 35,088 | | 6.5 | |
| Other property-related | 5,416 | | 5,075 | | 2,597 | | 3,994 | | 58 | | 17,140 | | 3.2 | |
| Government | 2,462 | | 927 | | 1,450 | | 4,104 | | 647 | | 9,590 | | 1.8 | |
| Other commercial1 | 24,239 | | 6,754 | | 5,735 | | 6,619 | | 683 | | 44,030 | | 8.1 | |
| |
| |
| |
| |
| |
| |
| |
| |
| 97,102 | | 32,270 | | 27,823 | | 31,409 | | 2,912 | | 191,516 | | 35.3 | |
| |
| |
| |
| |
| |
| |
| |
| |
| Financial | | | | | | | | | | | | | | |
| Non-bank financial | | | | | | | | | | | | | | |
| institutions | 21,226 | | 4,921 | | 2,027 | | 8,839 | | 78 | | 37,091 | | 6.8 | |
| Settlement accounts | 3,068 | | 556 | | 188 | | 4,767 | | 15 | | 8,594 | | 1.6 | |
|
| |
| |
| |
| |
| |
| |
| |
| 24,294 | | 5,477 | | 2,215 | | 13,606 | | 93 | | 45,685 | | 8.4 | |
| |
| |
| |
| |
| |
| |
| |
| |
| Total gross loans and advances | | | | | | | | | | | | | | |
| to customers3 | 215,158 | | 75,121 | | 49,274 | | 197,942 | | 5,605 | | 543,100 | | 100.0 | |
| |
| |
| |
| |
| |
| |
| |
| |
| Percentage of Group loans and | | | | | | | | | | | | | | |
| advances by geographical | | | | | | | | | | | | | | |
| region | 39.7% | | 13.8% | | 9.1% | | 36.4% | | 1.0% | | 100.0% | | | |
| Non-performing loans5 | 5,701 | | 1,671 | | 1,538 | | 5,444 | | 696 | | 15,050 | | | |
| Non-performing loans as a | | | | | | | | | | | | | | |
| percentage of gross loans and | | | | | | | | | | | | | | |
| advances to customers4 | 2.6% | | 2.2% | | 3.1% | | 2.8% | | 12.4% | | 2.8% | | | |
| Specific provisions outstanding | | | | | | | | | | | | | | |
| against loans and advances5 | 3,554 | | 629 | | 981 | | 5,184 | | 530 | | 10,878 | | | |
| Specific provisions outstanding | | | | | | | | | | | | | | |
| as a percentage of non- | | | | | | | | | | | | | | |
| performing loans5 | 62.3% | | 37.6% | | 63.8% | | 95.2% | | 76.1% | % | 72.3% | | | |
| | |
| 1 | Figures presented in this table were prepared in accordance with UK GAAP. |
| 2 | Other commercial loans and advances include advances in respect of agriculture, transport, energy and utilities. |
| 3 | Included within this total is credit card lending of US$48,634 million. |
| 4 | Net of suspended interest. |
| 5 | Included in North America are non-performing loans of US$4,380 million and specific provisions of US$4,448 million in HSBC Finance; excluding HSBC Finance, specific provisions outstanding as a percentage of non-performing loans was 69.2 per cent. |
123
Back to Contents
H S B C H O L D I N G S P L C
Financial Review(continued)
| Loans and advances to customers by industry sector and by geographical region(continued) | | | |
| | At 31 December 20021 | |
| |
| |
| | | | | | | | | | | | | | Gross loans | |
| | | | | | | | | | | | Gross | | by industry | |
| | | | | | Rest of | | | | | | loans and | | sector as a | |
| | | | Hong | | Asia- | | North | | South | | advances to | | % of total | |
| | Europe | | Kong | | Pacific | | America | | America | | customers | | gross loans | |
| | US$m | | US$m | | US$m | | US$m | | US$m | | US$m | | % | |
| Personal | | | | | | | | | | | | | | |
| Residential mortgages | 38,719 | | 23,839 | | 7,507 | | 26,666 | | 253 | | 96,984 | | 26.9 | |
| Hong Kong Government Home | | | | | | | | | | | | | | |
| Ownership Scheme | – | | 7,255 | | – | | – | | – | | 7,255 | | 2.0 | |
| Other personal | 26,748 | | 7,066 | | 5,900 | | 7,836 | | 1,012 | | 48,562 | | 13.4 | |
| |
| |
| |
| |
| |
| |
| |
| |
| | 65,467 | | 38,160 | | 13,407 | | 34,502 | | 1,265 | | 152,801 | | 42.3 | |
| |
| |
| |
| |
| |
| |
| |
| |
| Corporate and commercial | | | | | | | | | | | | | | |
| Commercial, industrial and | | | | | | | | | | | | | | |
| international trade | 44,424 | | 10,173 | | 12,582 | | 10,773 | | 1,063 | | 79,015 | | 21.8 | |
| Commercial real estate | 11,887 | | 8,336 | | 2,701 | | 6,297 | | 46 | | 29,267 | | 8.1 | |
| Other property-related | 3,970 | | 4,805 | | 2,031 | | 4,515 | | 26 | | 15,347 | | 4.2 | |
| Government | 2,164 | | 719 | | 933 | | 4,575 | | 562 | | 8,953 | | 2.5 | |
| Other commercial2 | 22,712 | | 6,612 | | 5,950 | | 4,835 | | 565 | | 40,674 | | 11.2 | |
| |
| |
| |
| |
| |
| |
| |
| |
| | 85,157 | | 30,645 | | 24,197 | | 30,995 | | 2,262 | | 173,256 | | 47.8 | |
| |
| |
| |
| |
| |
| |
| |
| |
| Financial | | | | | | | | | | | | | | |
| Non-bank financial institutions | 15,221 | | 2,055 | | 931 | | 9,231 | | 49 | | 27,487 | | 7.6 | |
| Settlement accounts | 2,622 | | 347 | | 192 | | 5,224 | | – | | 8,385 | | 2.3 | |
| |
| |
| |
| |
| |
| |
| |
| |
| | 17,843 | | 2,402 | | 1,123 | | 14,455 | | 49 | | 35,872 | | 9.9 | |
| |
| |
| |
| |
| |
| |
| |
| |
| Total gross loans and advances | | | | | | | | | | | | | | |
| to customers3 | 168,467 | | 71,207 | | 38,727 | | 79,952 | | 3,576 | | 361,929 | | 100.0 | |
| |
| |
| |
| |
| |
| |
| |
| |
| Percentage of Group loans and | | | | | | | | | | | | | | |
| advances by geographical | | | | | | | | | | | | | | |
| region | 46.5% | | 19.7% | | 10.7% | | 22.1% | | 1.0% | | 100.0% | | | |
| Non-performing loans4 | 4,495 | | 1,724 | | 2,055 | | 1,773 | | 476 | | 10,523 | | | |
| Non-performing loans as a | | | | | | | | | | | | | | |
| percentage of gross loans and | | | | | | | | | | | | | | |
| advances to customers4 | 2.7% | | 2.4% | | 5.3% | | 2.2% | | 13.3% | | 2.9% | | | |
| Specific provisions outstanding | | | | | | | | | | | | | | |
| against loans and advances | 2,774 | | 688 | | 1,321 | | 1,482 | | 341 | | 6,606 | | | |
| Specific provisions outstanding | | | | | | | | | | | | | | |
| as a percentage of non- | | | | | | | | | | | | | | |
| performing loans4 | 61.7% | | 39.9% | | 64.3% | | 83.6% | | 71.6% | | 62.8% | | | |
| | | | | | | | | | | | | | | |
| 1 | Figures presented in this table were prepared in accordance with UK GAAP. |
| 2 | Other commercial loans include advances in respect of agriculture, transport, energy and utilities. |
| 3 | Included within this total is credit card lending of US$9,950 million. |
| 4 | Net of suspended interest. |
124
Back to Contents
| | | | | | At 31 December 20011 | | | | | | | |
| |
|
|
|
|
|
|
|
|
|
|
|
|
| |
| | | | | | | | | | | | | | Gross loans | |
| | | | | | | | | | | | Gross | | by industry | |
| | | | | | Rest of | | | | | | loans and | | sector as a | |
| | | | Hong | | Asia- | | North | | South | | advances to | | % of total | |
| | Europe | | Kong | | Pacific | | America | | America | | customers | | gross loans | |
| | US$m | | US$m | | US$m | | US$m | | US$m | | US$m | | % | |
| Personal | | | | | | | | | | | | | | |
| Residential mortgages | 27,282 | | 23,125 | | 5,134 | | 22,126 | | 548 | | 78,215 | | 24.6 | |
| Hong Kong Government Home | | | | | | | | | | | | | | |
| Ownership Scheme | – | | 8,123 | | – | | – | | – | | 8,123 | | 2.6 | |
| Other personal | 21,065 | | 6,227 | | 4,616 | | 6,273 | | 1,280 | | 39,461 | | 12.4 | |
| |
| |
| |
| |
| |
| |
| |
| |
| | 48,347 | | 37,475 | | 9,750 | | 28,399 | | 1,828 | | 125,799 | | 39.6 | |
| |
| |
| |
| |
| |
| |
| |
| |
| Corporate and commercial | | | | | | | | | | | | | | |
| Commercial, industrial and | | | | | | | | | | | | | | |
| international trade | 38,476 | | 9,662 | | 11,226 | | 9,018 | | 1,720 | | 70,102 | | 22.1 | |
| Commercial real estate | 9,475 | | 8,474 | | 2,395 | | 5,877 | | 77 | | 26,298 | | 8.3 | |
| Other property-related | 3,630 | | 4,710 | | 2,169 | | 4,011 | | 69 | | 14,589 | | 4.6 | |
| Government | 2,393 | | 543 | | 900 | | 728 | | 775 | | 5,339 | | 1.7 | |
| Other commercial1 | 20,510 | | 6,349 | | 5,457 | | 4,230 | | 617 | | 37,163 | | 11.7 | |
| |
| |
| |
| |
| |
| |
| |
| |
| | 74,484 | | 29,738 | | 22,147 | | 23,864 | | 3,258 | | 153,491 | | 48.4 | |
| |
| |
| |
| |
| |
| |
| |
| |
| Financial | | | | | | | | | | | | | | |
| Non-bank financial | | | | | | | | | | | | | | |
| institutions | 11,329 | | 1,546 | | 752 | | 12,572 | | 118 | | 26,317 | | 8.3 | |
| Settlement accounts | 2,361 | | 223 | | 189 | | 8,984 | | 4 | | 11,761 | | 3.7 | |
| |
| |
| |
| |
| |
| |
| |
| |
| | 13,690 | | 1,769 | | 941 | | 21,556 | | 122 | | 38,078 | | 12.0 | |
| |
| |
| |
| |
| |
| |
| |
| |
| Total gross loans and advances | | | | | | | | | | | | | | |
| to customers3 | 136,521 | | 68,982 | | 32,838 | | 73,819 | | 5,208 | | 317,368 | | 100.0 | |
| |
| |
| |
| |
| |
| |
| |
| |
| Percentage of Group loans and | | | | | | | | | | | | | | |
| advances by geographical | | | | | | | | | | | | | | |
| region | 43.0% | | 21.7 | % | 10.3 | % | 23.3 | % | 1.7 | % | 100.0 | % | | |
| |
| |
| |
| |
| |
| |
| | | |
| Non-performing loans4 | 3,682 | | 2,028 | | 2,723 | | 672 | | 544 | | 9,649 | | | |
| Non-performing loans as a | | | | | | | | | | | | | | |
| percentage of gross loans and | | | | | | | | | | | | | | |
| advances to customers4 | 2.7 | % | 2.9 | % | 8.3 | % | 0.9 | % | 10.4 | % | 3.0 | % | | |
| Specific provisions outstanding | | | | | | | | | | | | | | |
| against loans and advances | 2,204 | | 856 | | 1,786 | | 289 | | 365 | | 5,500 | | | |
| Specific provisions outstanding | | | | | | | | | | | | | | |
| as a percentage of non- | | | | | | | | | | | | | | |
| performing loans4 | 59.8 | % | 42.2 | % | 65.6 | % | 43.0 | % | 67.1 | % | 57.0 | % | | |
| | | | | | | | | | | | | | | |
| 1 | Figures presented in this table were prepared in accordance with UK GAAP. |
| 2 | Other commercial loans include advances in respect of agriculture, transport, energy and utilities. |
| 3 | Included within this total is credit card lending of US$8,289 million. |
| 4 | Net of suspended interest. |
125
H S B C H O L D I N G S P L C
Financial Review(continued)
Loans and advances to customers by principal area within Rest of Asia-Pacific and South America
| | | Loans and advances (gross) | | | |
| |
|
|
|
|
|
|
|
|
| |
| | | | | | | | Commercial, | | | |
| | | | | | | | international | | | |
| | Residential | | Other | | Property- | | trade and | | | |
| | mortgages | | personal | | related | | other | | Total | |
| | US$m | | US$m | | US$m | | US$m | | US$m | |
| At 31 December 2005 (audited) | | | | | | | | | | |
| Australia and New Zealand | 5,912 | | 694 | | 2,588 | | 3,698 | | 12,892 | |
| India | 1,139 | | 545 | | 104 | | 1,819 | | 3,607 | |
| Indonesia | 13 | | 338 | | 8 | | 921 | | 1,280 | |
| Japan | 14 | | 139 | | 696 | | 2,352 | | 3,201 | |
| Mainland China | 358 | | 11 | | 1,210 | | 3,426 | | 5,005 | |
| Malaysia | 2,223 | | 871 | | 496 | | 2,925 | | 6,515 | |
| Middle East | 258 | | 2,320 | | 1,448 | | 9,403 | | 13,429 | |
| Singapore | 2,811 | | 3,395 | | 1,441 | | 2,249 | | 9,896 | |
| South Korea | 2,585 | | 460 | | 31 | | 2,219 | | 5,295 | |
| Taiwan | 2,094 | | 1,057 | | 14 | | 727 | | 3,892 | |
| Thailand | 23 | | 220 | | 75 | | 958 | | 1,276 | |
| Other | 211 | | 1,128 | | 396 | | 2,829 | | 4,564 | |
| |
| |
| |
| |
| |
| |
| Total of Rest of Asia-Pacific | 17,641 | | 11,178 | | 8,507 | | 33,526 | | 70,852 | |
| |
| |
| |
| |
| |
| |
| Argentina | 4 | | 147 | | 31 | | 1,000 | | 1,182 | |
| Brazil | 187 | | 4,838 | | 206 | | 3,432 | | 8,663 | |
| Other | 1 | | 1 | | 41 | | 215 | | 258 | |
| |
| |
| |
| |
| |
| |
| Total of South America | 192 | | 4,986 | | 278 | | 4,647 | | 10,103 | |
| |
| |
| |
| |
| |
| |
| At 31 December 2004 | | | | | | | | | | |
| Australia and New Zealand | 5,935 | | 635 | | 2,580 | | 3,761 | | 12,911 | |
| India | 778 | | 371 | | 56 | | 1,440 | | 2,645 | |
| Indonesia | 12 | | 166 | | 9 | | 769 | | 956 | |
| Japan | 12 | | 106 | | 689 | | 3,532 | | 4,339 | |
| Mainland China | 256 | | 10 | | 794 | | 3,329 | | 4,389 | |
| Malaysia | 2,029 | | 670 | | 407 | | 2,611 | | 5,717 | |
| Middle East | 129 | | 1,982 | | 1,414 | | 6,327 | | 9,852 | |
| Singapore | 2,137 | | 3,027 | | 1,262 | | 2,258 | | 8,684 | |
| South Korea | 1,834 | | 189 | | 6 | | 1,559 | | 3,588 | |
| Taiwan | 1,509 | | 762 | | – | | 805 | | 3,076 | |
| Thailand | 28 | | 178 | | 75 | | 1,134 | | 1,415 | |
| Other | 201 | | 983 | | 290 | | 2,701 | | 4,175 | |
| |
| |
| |
| |
| |
| |
| Total of Rest of Asia-Pacific | 14,860 | | 9,079 | | 7,582 | | 30,226 | | 61,747 | |
| |
| |
| |
| |
| |
| |
| Argentina | 37 | | 69 | | 21 | | 1,372 | | 1,499 | |
| Brazil | 170 | | 3,369 | | 158 | | 2,411 | | 6,108 | |
| Other | – | | – | | 27 | | 175 | | 202 | |
| |
| |
| |
| |
| |
| |
| Total of South America | 207 | | 3,438 | | 206 | | 3,958 | | 7,809 | |
| |
| |
| |
| |
| |
| |
| | | | | | | | | | | | |
| Loans and advances to banks by geographical region | | | | | | | | | | | |
| | | | | | | | | | | | | | Impairment | |
| | | | | | | | | | | | | | allowances | |
| | | | | | | | | | | | | | (2001-2004: | |
| | | | | | | | | | | | Gross | | provisions | |
| | | | | | Rest of | | | | | | loans and | | for bad and | |
| | | | Hong | | Asia- | | North | | South | | advances | | doubtful | |
| | Europe | | Kong | | Pacific | | America | | America | | to banks | | debts) | |
| | US$m | | US$m | | US$m | | US$m | | US$m | | US$m | | US$m | |
| | | | | | | | | | | | | | | |
| At 31 December 2005 (audited) | 44,369 | | 42,751 | | 19,559 | | 14,013 | | 5,282 | | 125,974 | | (9 | ) |
| At 31 December 2004 | 56,063 | | 45,710 | | 14,890 | | 24,179 | | 2,624 | | 143,466 | | (17 | ) |
| At 31 December 2003 | 51,806 | | 38,639 | | 12,948 | | 11,885 | | 1,922 | | 117,200 | | (24 | ) |
| At 31 December 2002 | 39,398 | | 33,359 | | 10,708 | | 10,391 | | 1,665 | | 95,521 | | (23 | ) |
| At 31 December 2001 | 40,665 | | 42,516 | | 11,253 | | 7,979 | | 2,252 | | 104,665 | | (22 | ) |
126
Back to Contents
Credit quality
Loans and advances
Distribution of loans and advances by credit quality(Audited IFRS 7 information)
| | At 31 December 2005 | |
| |
|
|
| |
| | Loans and | | Loans and | |
| | advances to | | advances to | |
| | customers | | banks | |
| | US$m | | US$m | |
| Loans and advances: | | | | |
| – neither past due nor impaired | 731,116 | | 125,930 | |
| – past due but not impaired | 8,797 | | 22 | |
| – impaired | 11,446 | | 22 | |
| |
| |
| |
| | 751,359 | | 125,974 | |
| |
| |
| |
Distribution of loans and advances neither past due nor impaired(Audited IFRS 7 information)
The credit quality of the portfolio of loans and advances that were neither past due nor impaired at 31 December 2005 can be assessed by reference to the Group’s standard credit grading system. The following information is based on that system:
| | Loans and | | Loans and | |
| | advances to | | advances to | |
| | customers | | banks | |
| | US$m | | US$m | |
| Grades: | | | | |
| 1 – 3: satisfactory risk | 705,036 | | 125,324 | |
| 4 – watch list and special mention | 19,950 | | 555 | |
| 5 – sub-standard but not impaired | 6,130 | | 51 | |
| |
| |
| |
| | 731,116 | | 125,930 | |
| |
| |
| |
Grades 1 and 2 include corporate facilities demonstrating financial condition, risk factors and capacity to repay that are good to excellent, residential mortgages with low to moderate loan to values ratios, and other retail accounts which are not impaired and are maintained within product guidelines.
Grade 3 represents satisfactory risk and includes corporate facilities that require closer monitoring, mortgages with higher loan to value ratios than grades 1 and 2, all non-impaired credit card exposures, and other retail exposures which operate outside product guidelines without being impaired.
Grades 4 and 5 include corporate facilities that require various degrees of special attention and all retail exposures that are progressively between 30 and 90 days past due.
Loans and advances which were past due but not impaired(Audited IFRS 7 information)
Loans and advances which were past due at 31 December 2005 but not impaired were as follows:
| | Loans and | | Loans and | |
| | advances to | | advances to | |
| | customers | | banks | |
| | US$m | | US$m | |
| | | | | |
| Past due up to 29 days | 4,837 | | 22 | |
| Past due 30 – 59 days | 1,743 | | – | |
| Past due 60 – 89 days | 583 | | – | |
| |
| |
| |
| | 7,163 | | 22 | |
| Past due 90 – 179 days | 1,368 | | – | |
| Past due over 180 days but less than 1 year | 266 | | – | |
| |
| |
| |
| | 8,797 | | 22 | |
| |
| |
| |
This ageing analysis includes loans and advances less than 90 days past due that have collective impairment allowances set aside to cover credit losses on loans which are in the early stages of arrears.
127
Back to Contents
H S B C H O L D I N G S P L C
Financial Review(continued)
There are a variety of reasons why certain loans designated as ‘past due’ are not regarded as impaired. Unless other information is available to indicate to the contrary, all loans less than 90 days past due are not considered impaired. It is also not unusual for short-term trade finance facilities to extend beyond 90 days past due for reasons that do not reflect any concern on the creditworthiness of the counterparty, such as delays in documentation. In addition, past due loans secured in full by cash collateral are not considered impaired and, where appropriate, neither are residential mortgages in arrears by more than 90 days where the value of collateral is sufficient to repay both the debt and all potential interest for at least one year.
Impaired loans and advances(Audited IFRS 7 information)
For individually assessed accounts, loans are treated as impaired as soon as there is objective evidence that an impairment loss has been incurred. The criteria used by HSBC to determine that there is objective evidence of an impairment loss include,inter alia:
| – | known cash flow difficulties experienced by the borrower; |
| | |
| – | overdue contractual payments of either principal or interest; |
| | |
| – | breach of loan covenants or conditions; |
| | |
| – | the probability that the borrower will enter bankruptcy or other financial reorganisation; and |
| | |
| – | a downgrading in credit rating by an external credit rating agency. |
Accounts in portfolios of homogeneous loans are treated as impaired once facilities are 90 days or more overdue. Further information on impaired loans is provided below in ‘Impairment assessment’.
The total gross amount of impaired loans and advances to customers as at 31 December 2005 was US$11,446 million, of which US$4,960 million related to individually impaired loans and advances andUS$6,486 million related to portfolios of homogeneous loans and advances. The following table presents an analysis of individually impaired loans by industry sector and by geographical region:
| | At 31 December 2005 | |
| |
|
|
|
|
|
|
|
|
|
|
|
|
| |
| | | | | | | | | | | | | | Gross | |
| | | | | | | | | | | | | | impaired | |
| | | | | | | | | | | | Gross | | loans by | |
| | | | | | | | | | | | impaired | | industry | |
| | | | | | Rest of | | | | | | loans and | | sector as a | |
| | | | Hong | | Asia- | | North | | South | | advances to | | % of total | |
| | Europe | | Kong | | Pacific | | America | | America | | customers | | gross loan | |
| | US$m | | US$m | | US$m | | US$m | | US$m | | US$m | | % | |
| | | | | | | | | | | | | | | |
| Personal | 655 | | 256 | | 119 | | 5 | | – | | 1,035 | | 20.9 | |
| Commercial and corporate | 2,562 | | 198 | | 629 | | 338 | | 198 | | 3,925 | | 79.1 | |
| |
| |
| |
| |
| |
| |
| |
| |
| Total impaired loans and | | | | | | | | | | | | | | |
| advances to customers | 3,217 | | 454 | | 748 | | 343 | | 198 | | 4,960 | | 100.0 | |
| |
| |
| |
| |
| |
| |
| |
| |
The types of collateral or other security held are described above in ‘Collateral and other credit enhancements’.
128
Back to Contents
Loans and advances measured at amortised cost – net total credit risk
(Audited IFRS 7 information)
Loans and advances against which HSBC had legally enforceable rights to offset with financial liabilities at 31 December 2005 were as follows:
| | | | Amount for | | | |
| | | | which HSBC | | | |
| | | | had a legally | | | |
| | Carrying | | enforceable | | Net total | |
| | amount | | right to offset1 | | credit risk2 | |
| | US$m | | US$m | | US$m | |
| | | | | | | |
| Loans and advances to customers | 751,359 | | (48,495 | ) | 702,864 | |
| Loans and advances to banks | 125,974 | | (51 | ) | 125,923 | |
| |
| |
| |
| |
| | 877,333 | | (48,546 | ) | 828,787 | |
| |
| |
| |
| |
| 1 | Against financial liabilities with the same counterparty. |
| 2 | Excluding the value of any collateral or security held. |
| | |
Debt securitiesDebt securities and other bills by rating agency designation
(Audited IFRS 7 information)
The following table presents an analysis of debt and similar securities, other than loans, by rating agency designation at 31 December 2005, based on Standard and Poor’s ratings or their equivalent:
| | | Treasury | | Other | | Debt | | | |
| | | bills | | eligible bills | | securities | | Total | |
| | | US$m | | US$m | | US$m | | US$m | |
| | | | | | | | | |
| AAA | 16,798 | | 381 | | 113,429 | | 130,608 | |
| AA – to AA + | 3,089 | | 264 | | 62,684 | | 66,037 | |
| A – to A + | 11,147 | | 110 | | 46,538 | | 57,795 | |
| Lower than A – | 3,287 | | 202 | | 23,359 | | 26,848 | |
| Unrated | 2,563 | | – | | 27,135 | | 29,698 | |
| | |
| |
| |
| |
| |
| | | 36,884 | | 957 | | 273,145 | | 310,986 | |
| |
| |
| |
| |
| |
| Of which issued by: | | | | | | | | |
| – | governments | 19,634 | | – | | 91,279 | | 110,913 | |
| – | local authorities | 16,646 | | – | | 10,516 | | 27,162 | |
| – | corporates | 7 | | 84 | | 63,384 | | 63,475 | |
| – | other | 597 | | 873 | | 107,966 | | 109,436 | |
| Of which classified as: | | | | | | | | |
| – | trading assets | 12,649 | | 97 | | 117,659 | | 130,405 | |
| – | financial instruments designated at fair value | 53 | | – | | 5,705 | | 5,758 | |
| – | available-for-sale securities | 23,974 | | 860 | | 141,699 | | 166,533 | |
| – | held-to-maturity investments | 208 | | – | | 8,082 | | 8,290 | |
Debt securities with short-term ratings are reported against the long-term rating of the issuer of the short-term debt securities. If major rating agencies have different ratings for the same debt securities, the securities are reported against the lower rating.
129
Back to Contents
H S B C H O L D I N G S P L C
Financial Review(continued)
Financial assets other than loans and advances measured at amortised cost – net total credit risk
(Audited IFRS 7 information)
Financial assets against which HSBC had legally enforceable rights to offset with financial liabilities at 31 December 2005 were as follows:
| | | | Amount for | | | |
| | | | which HSBC | | | |
| | | | had a legally | | | |
| | Carrying | | enforceable | | Net total | |
| | amount | | right to offset1 | | credit risk2 | |
| | US$m | | US$m | | US$m | |
| Trading assets | | | | | | |
| Treasury and other eligible bills | 12,746 | | – | | 12,746 | |
| Debt securities | 117,659 | | – | | 117,659 | |
| Loans and advances to banks | 29,806 | | (19 | ) | 29,787 | |
| Loans and advances to customers | 52,495 | | (7,411 | ) | 45,084 | |
| |
| |
| |
| |
| | 212,706 | | (7,430 | ) | 205,276 | |
| |
| |
| |
| |
| Financial assets designated at fair value | | | | | | |
| Treasury and other eligible bills | 53 | | – | | 53 | |
| Debt securities | 5,705 | | (464 | ) | 5,241 | |
| Loans and advances to banks | 124 | | – | | 124 | |
| Loans and advances to customers | 631 | | – | | 631 | |
| |
| |
| |
| |
| | 6,513 | | (464 | ) | 6,049 | |
| |
| |
| |
| |
| Derivatives | 73,928 | | (46,060 | ) | 27,868 | |
| Financial investments | | | | | | |
| Treasury and other similar bills | 25,042 | | – | | 25,042 | |
| Debt securities | 149,781 | | – | | 149,781 | |
| |
| |
| |
| |
| | 174,823 | | – | | 174,823 | |
| Other assets |
| |
| |
| |
| Endorsements and acceptances | 7,973 | | (9 | ) | 7,964 | |
| |
| |
| |
| |
| | 475,943 | | (53,963 | ) | 421,980 | |
| |
| |
| |
| |
| 1 | Against financial liabilities with the same counterparty. |
| 2 | Excluding the value of any collateral or security held. |
Impairment assessment
Loans and advances(Audited IFRS 7 information)
It is HSBC’s policy that each operating company makes allowance for impaired loans promptly when required and on a consistent basis in accordance with Group guidelines.
HSBC’s rating process for credit facilities extended by its operating entities is designed to highlight exposures which require closer management attention because of their greater probability of default and potential loss. Amendments to risk grades, when necessary, are implemented promptly, with management particularly focusing on facilities to borrowers and portfolio segments classified below satisfactory grades. Management also regularly evaluates the adequacy of the established allowances for impaired loans by conducting a detailed review of the loan portfolio, comparing performance and delinquency statistics with historical trends and assessing the impact of current economic conditions. The criteria that HSBC uses to determine that there is objective
evidence that an impairment loss has occurred include:
| • | contractual payments of principal or interest which become 90 days overdue; |
| | |
| • | breach of loan covenants, conditions or other terms; |
| | |
| • | known cash flow difficulties experienced by the borrower; and |
| | |
| • | a significant downgrading in credit rating set by an external credit rating agency. |
Two types of impairment allowance are in place: individually assessed and collectively assessed. These are discussed below.
Individually assessed allowances
(Audited IFRS 7 information)
Impairment allowances on individually assessed accounts are determined by an evaluation of the exposure to loss on a case-by-case basis. This procedure is applied to all individually significant accounts and all other accounts that do not qualify for, or are not subject to, the portfolio-based
130
Back to Contents
approach outlined below. In determining allowances on individually assessed accounts, the following factors are considered:
| • | HSBC’s aggregate exposure to the customer; |
| | |
| • | the viability of the customer’s business modeland the capacity to trade successfully out offinancial difficulties and generate sufficient cashflow to service debt obligations; |
| | |
| • | the amount and timing of expected receipts and recoveries; |
| | |
| • | the likely dividend available on liquidation or bankruptcy; |
| | |
| • | the extent of other creditors’ commitmentsranking ahead of, or pari passu with, HSBC andthe likelihood of other creditors continuing tosupport the company; |
| | |
| • | the complexity of determining the aggregateamount and ranking of all creditor claims andthe extent to which legal and insuranceuncertainties are evident; |
| | |
| • | the realisable value of security (or other creditmitigants) and likelihood of successfulrepossession; |
| | |
| • | the likely deduction of any costs involved in recovering amounts outstanding; |
| | |
| • | the ability of the borrower to obtain and makepayments in the relevant foreign currency ifloans are not in local currency; and |
| | |
| • | when available, the secondary market price for the debt. |
Group policy requires the level of impairment allowances on individual facilities that are above materiality thresholds to be reviewed at least half-yearly, and more regularly when individual circumstances require. The review normally encompasses collateral held (including re-confirmation of its enforceability) and an assessment of actual and anticipated receipts. For significant commercial and corporate debts, specialised loan ‘work-out’ teams with experience in insolvency and specific market sectors are used to assess likely losses on significant individual exposures.
Individually calculated impairment allowances are only reversed when the Group has reasonable and objective evidence of a reduction in the established loss estimate.
Collectively assessed allowances
(Audited IFRS 7 information)
Collectively assessed allowances are made in respect of (i) losses incurred in portfolios of homogeneous
assets and (ii) losses which have been incurred but have not yet been identified on loans subject to individual assessment for impairment.
Homogeneous groups of loans
(Audited IFRS 7 information)
Two approaches are available to calculating impairment allowances when homogeneous groups of assets such as credit card loans, other unsecured consumer lending, motor vehicle financing and residential mortgage loans are reviewed collectively on a portfolio basis:
| • | When appropriate empirical information isavailable, the Group uses roll rate methodology(a statistical analysis of historical trends of theprobability of default and amount ofconsequential loss, assessed at each time periodfor which payments are overdue), otherhistorical data and an evaluation of currenteconomic conditions to calculate an appropriatelevel of impairment allowance based oninherent loss. In certain highly developedmarkets, sophisticated models also take intoaccount behavioural and account managementtrends such as those indicated by bankruptcyand restructuring statistics. Roll rates areregularly benchmarked to ensure they remainappropriate. |
| | |
| • | When portfolios are less than US$20 million insize, or when information is insufficient or notsufficiently reliable for roll rate methodology tobe adopted, the Group uses a simpler methodbased on similar principles which assessesimpairment based on historical experience andcurrent economic conditions. |
| | |
| The portfolio approach is applied to accounts in the following portfolios: |
| | |
| • | low value, homogeneous small business accounts in certain jurisdictions; |
| | |
| • | residential mortgages that have not beenindividually assessed or are less than 90 daysoverdue (except in HSBC Finance); |
| | |
| • | credit cards and other unsecured consumer lending products; and |
| | |
| • | motor vehicle financing. |
These portfolio allowances are generally assessed monthly and charges for new allowances, or releases of existing allowances, are calculated for each separately identified portfolio.
131
Back to Contents
H S B C H O L D I N G S P L C
Financial Review(continued)
Incurred but not yet identified impairment
(Audited IFRS 7 information)
Impairment allowances for incurred but not yet identified losses relate to loans that are impaired at the balance sheet date but which will not be individually identified as such until some time in the future. HSBC requires each operating company to estimate such impairment losses by taking into account:
| • | historical loss experience in portfolios of similarrisk characteristics, for example, by industrysector, loan grade or product; |
| | |
| • | the estimated period between a loss beingincurred and that loss being evidenced by theestablishment of an individually assessedimpairment allowance against that loss; and |
| | |
| • | management’s experienced judgement as towhether the current economic and creditconditions are such that the actual level ofinherent losses is likely to be greater or less thanthat suggested by historical experience. |
The estimated period between a loss occurring and its identification (as evidenced by the establishment of an individual impairment allowance for that loss) is determined by local management for each identified portfolio. In general, the periods used vary between four and twelve months although, in exceptional cases, longer periods are warranted.
In normal circumstances, historical experience is the most objective and accurate framework used to assess inherent loss within each portfolio. Historical loss experience is generally benchmarked against the average annual rate of losses over at least five years. In certain circumstances, economic conditions are such that historical loss experience provides little or no guide to the inherent loss in a given portfolio. In such circumstances, management uses its experienced judgement to determine an appropriate impairment allowance.
The basis on which impairment allowances for incurred but not yet identified losses is established in each reporting entity is documented and reviewed by senior Group credit management to ensure conformity with Group policy.
Cross-border exposures(Audited IFRS 7 information)
Management assesses the vulnerability of countries to foreign currency payment restrictions when considering impairment allowances on cross-border exposures. This assessment includes an analysis of the economic and political factors existing at the time. Economic factors include the level of external indebtedness, the debt service burden and access to
external sources of funds to meet the debtor country’s financing requirements. Political factors taken into account include the stability of the country and its government, threats to security, and the quality and independence of the legal system.
Impairment allowances are applied to all qualifying exposures within these countries unless these exposures are:
| • | performing, trade-related and of less than one year’s maturity; |
| | |
| • | mitigated by acceptable security cover which is,other than in exceptional cases, held outside thecountry concerned; |
| | |
| • | represented by securities held for tradingpurposes for which a liquid and active marketexists, and which are measured at fair valuedaily; |
| | |
| • | performing facilities with principal (excluding security) of US$1 million or below; or |
| | |
| • | performing facilities with maturity dates shorterthan 3 months. |
Loan write-offs(Audited IFRS 7 information)
Loans (and the related impairment allowances) are normally written off, either partially or in full, when there is no realistic prospect of recovering these amounts and when the proceeds from realising security have been received. Unsecured consumer facilities are normally written off between 150 and 210 days overdue. In HSBC Finance, this period is generally extended to 300 days overdue (270 days for real estate secured products).
In almost no cases does the write-off period exceed 360 days overdue. The only exception arises when certain consumer finance accounts are deemed collectible beyond this point. In the event of bankruptcy, write-off can occur earlier.
US banks typically write off problem lending more quickly than is the practice in the UK. This means that HSBC’s reported levels of credit risk elements and associated allowances are likely to be higher than those of comparable US banks.
Impairment allowances(Audited IFRS 7information)
When impairment losses occur, HSBC reduces the carrying amount of loans and advances and held-to-maturity financial investments through the use of an allowance account. When impairment of available-for-sale financial assets occurs, the carrying amount of the asset is reduced directly.
132
Back to Contents
| Movement in allowance accounts for total loans and advances | | | | | |
| (Audited IFRS 7 information) | | | | | | |
| | | | 2005 | | | |
| |
|
|
|
|
| |
| | Individually | | Collectively | | | |
| | assessed | | assessed | | Total | |
| | US$m | | US$m | | US$m | |
| At 1 January | | | | | 12,881 | |
| IFRSs transition at 1 January | | | | | (247 | ) |
| | | | | |
| |
| At 1 January | 3,728 | | 8,906 | | 12,634 | |
| Amounts written off | (1,102 | ) | (7,941 | ) | (9,043 | ) |
| Recoveries of loans and advances written off in previous years | 199 | | 295 | | 494 | |
| Charge to income statement | 518 | | 7,342 | | 7,860 | |
| Exchange and other movements | (664 | ) | 85 | | (579 | ) |
| |
| |
| |
| |
| At 31 December | 2,679 | | 8,687 | | 11,366 | |
| |
| |
| |
| |
| | | | | | | |
| Impairment allowances against loans and advances to customers | | | | | | |
| | | | | |
| | 2005 | | 2004 | |
| | % | | % | |
| Total impairment allowances to gross lending1 | | | | |
| Individually assessed impairment allowances | 0.36 | | – | |
| Collectively assessed impairment allowances | 1.18 | | – | |
| Total provisions to gross lending1 | | | | |
| Specific provisions | – | | 1.56 | |
| General provisions | – | | 0.39 | |
| |
| |
| |
| | 1.54 | | 1.95 | |
| |
| |
| |
| 1 | Net of reverse repo transactions and settlement accounts. |
133
Back to Contents
H S B C H O L D I N G S P L C
Financial Review(continued)
Movement in impairment allowances by industry segment and by geographical region
The following tables show details of the movements in HSBC’s impairment allowances by location of lending office for each of the past five years.
A discussion of the material movements in the loan impairment charges by region follows these tables.
| | 2005(Audited IFRS 7 information) | |
| |
|
|
|
|
|
|
|
|
|
|
| |
| | | | | | Rest of | | | | | | | |
| | | | Hong | | Asia- | | North | | South | | | |
| | Europe | | Kong | | Pacific | | America | | America | | Total | |
| | US$m | | US$m | | US$m | | US$m | | US$m | | US$m | |
| | | | | | | | | | | | | |
| Impairment allowances at 1 January | 4,851 | | 504 | | 960 | | 5,733 | | 586 | | 12,634 | |
| Amounts written off | | | | | | | | | | | | |
| Commercial, industrial and international trade | (345 | ) | (157 | ) | (79 | ) | (83 | ) | (9 | ) | (673 | ) |
| Real estate | (67 | ) | (23 | ) | (11 | ) | (15 | ) | (1 | ) | (117 | ) |
| Non-bank financial institutions | (3 | ) | – | | – | | (10 | ) | – | | (13 | ) |
| Other commercial | (108 | ) | – | | (6 | ) | (62 | ) | (18 | ) | (194 | ) |
| Residential mortgages | (14 | ) | (2 | ) | (6 | ) | (486 | ) | – | | (508 | ) |
| Other personal | (2,267 | ) | (112 | ) | (227 | ) | (4,447 | ) | (485 | ) | (7,538 | ) |
| |
| |
| |
| |
| |
| |
| |
| | (2,804 | ) | (294 | ) | (329 | ) | (5,103 | ) | (513 | ) | (9,043 | ) |
| |
| |
| |
| |
| |
| |
| |
| Recoveries of amounts written off in previousyears | | | | | | | | | | | | |
| Commercial, industrial and international trade | 10 | | 4 | | 17 | | 37 | | 8 | | 76 | |
| Real estate | 5 | | – | | 1 | | 2 | | 1 | | 9 | |
| Other commercial | 6 | | 1 | | 2 | | 47 | | 33 | | 89 | |
| Residential mortgages | 1 | | 9 | | 1 | | 7 | | – | | 18 | |
| Other personal | 62 | | 31 | | 61 | | 99 | | 49 | | 302 | |
| |
| |
| |
| |
| |
| |
| |
| | 84 | | 45 | | 82 | | 192 | | 91 | | 494 | |
| |
| |
| |
| |
| |
| |
| |
| Net charge/(release) to income statement1 | | | | | | | | | | | | |
| Banks | (5 | ) | – | | (2 | ) | – | | – | | (7 | ) |
| Commercial, industrial and international trade | 354 | | 199 | | (72 | ) | 31 | | 76 | | 588 | |
| Real estate | 59 | | – | | 1 | | (6 | ) | 2 | | 56 | |
| Non-bank financial institutions | (14 | ) | (1 | ) | – | | 9 | | – | | (6 | ) |
| Governments | 4 | | – | | – | | 2 | | – | | 6 | |
| Other commercial | (21 | ) | (32 | ) | (1 | ) | 27 | | 1 | | (26 | ) |
| Residential mortgages | 5 | | (25 | ) | 7 | | 614 | | 4 | | 605 | |
| Other personal | 1,602 | | 5 | | 203 | | 4,363 | | 471 | | 6,644 | |
| |
| |
| |
| |
| |
| |
| |
| | 1,984 | | 146 | | 136 | | 5,040 | | 554 | | 7,860 | |
| |
| |
| |
| |
| |
| |
| |
| Foreign exchange and other movements | (616 | ) | (3 | ) | (12 | ) | (26 | ) | 78 | | (579 | ) |
| |
| |
| |
| |
| |
| |
| |
| Impairment allowances at 31 December | 3,499 | | 398 | | 837 | | 5,836 | | 796 | | 11,366 | |
| |
| |
| |
| |
| |
| |
| |
| Impairment allowances against banks: | | | | | | | | | | | | |
| – individually assessed | 8 | | – | | 1 | | – | | – | | 9 | |
| Impairment allowances against customers: | | | | | | | | | | | | |
| – individually assessed | 1,575 | | 173 | | 500 | | 309 | | 126 | | 2,683 | |
| – collectively assessed2 | 1,916 | | 225 | | 336 | | 5,527 | | 670 | | 8,674 | |
| |
| |
| |
| |
| |
| |
| |
| Impairment allowances at 31 December | 3,499 | | 398 | | 837 | | 5,836 | | 796 | | 11,366 | |
| |
| |
| |
| |
| |
| |
| |
| | % | | % | | % | | % | | % | | % | |
| Impairment allowances against customers | | | | | | | | | | | | |
| as a percentage of loans and advances to | | | | | | | | | | | | |
| customers: | | | | | | | | | | | | |
| – individually assessed | 0.50 | | 0.21 | | 0.71 | | 0.11 | | 1.25 | | 0.36 | |
| – collectively assessed | 0.61 | | 0.27 | | 0.47 | | 2.04 | | 6.63 | | 1.16 | |
| |
| |
| |
| |
| |
| |
| |
| At 31 December | 1.11 | | 0.48 | | 1.18 | | 2.15 | | 7.88 | | 1.52 | |
| |
| |
| |
| |
| |
| |
| |
| 1 | See table below ‘Net impairment charge to income statement by geographical region’. |
| 2 | Collectively assessed impairment allowances are allocated to geographical segments based on the location of the office booking the allowance. Consequently, the collectively assessed impairment allowances booked in Hong Kong may cover assets booked in branches located outside Hong Kong, principally in the Rest of Asia-Pacific, as well as those booked in Hong Kong. |
134
Back to Contents
Movement in provisions by industry segment and by geographical region
| | 2004 | |
| |
| |
| | | | | | Rest of | | | | | | | |
| | | | Hong | | Asia- | | North | | South | | | |
| | Europe | | Kong | | Pacific | | America | | America | | Total | |
| | US$m | | US$m | | US$m | | US$m | | US$m | | US$m | |
| | | | | | | | | | | | | |
| Provisions at 1 January | 4,435 | | 1,055 | | 1,181 | | 6,461 | | 583 | | 13,715 | |
| IFRSs transition adjustment at 1 January | (2 | ) | (34 | ) | (21 | ) | – | | (1 | ) | (58 | ) |
| | | | | | | | | | | | | |
| Amounts written off | | | | | | | | | | | | |
| Commercial, industrial and international trade | (298 | ) | (35 | ) | (164 | ) | (73 | ) | (53 | ) | (623 | ) |
| Real estate | (30 | ) | (55 | ) | (17 | ) | (3 | ) | (1 | ) | (106 | ) |
| Non-bank financial institutions | (14 | ) | (2 | ) | (1 | ) | (3 | ) | – | | (20 | ) |
| Other commercial | (209 | ) | (33 | ) | (42 | ) | (204 | ) | (10 | ) | (498 | ) |
| Residential mortgages | (10 | ) | (52 | ) | (8 | ) | (488 | ) | (3 | ) | (561 | ) |
| Other personal | (770 | ) | (125 | ) | (171 | ) | (5,639 | ) | (331 | ) | (7,036 | ) |
| |
| |
| |
| |
| |
| |
| |
| | (1,331 | ) | (302 | ) | (403 | ) | (6,410 | ) | (398 | ) | (8,844 | ) |
| |
| |
| |
| |
| |
| |
| |
| Recoveries of amounts written off in previous years | | | | | | | | | | | | |
| Commercial, industrial and international trade | 27 | | 10 | | 4 | | 73 | | 4 | | 118 | |
| Real estate | 3 | | – | | 10 | | 4 | | – | | 17 | |
| Non-bank financial institutions | 3 | | – | | – | | – | | – | | 3 | |
| Other commercial | 5 | | 3 | | 14 | | 34 | | 29 | | 85 | |
| Residential mortgages | 1 | | 12 | | 1 | | 17 | | – | | 31 | |
| Other personal | 97 | | 22 | | 41 | | 453 | | 46 | | 659 | |
| |
| |
| |
| |
| |
| |
| |
| | 136 | | 47 | | 70 | | 581 | | 79 | | 913 | |
| |
| |
| |
| |
| |
| |
| |
| Net charge to profit and loss account1 | | | | | | | | | | | | |
| Banks | (7 | ) | – | | (1 | ) | – | | (2 | ) | (10 | ) |
| Commercial, industrial and international trade | 180 | | (56 | ) | 52 | | (44 | ) | 47 | | 179 | |
| Real estate | 21 | | (15 | ) | (28 | ) | (1 | ) | 1 | | (22 | ) |
| Non-bank financial institutions | 18 | | (3 | ) | (1 | ) | 1 | | – | | 15 | |
| Governments | – | | – | | – | | 1 | | – | | 1 | |
| Other commercial | (65 | ) | (29 | ) | (18 | ) | (37 | ) | (19 | ) | (168 | ) |
| Residential mortgages | 3 | | (14 | ) | 4 | | 485 | | 4 | | 482 | |
| Other personal | 1,035 | | 120 | | 142 | | 4,680 | | 239 | | 6,216 | |
| General provisions | (162 | ) | (223 | ) | (48 | ) | (63 | ) | (2 | ) | (498 | ) |
| |
| |
| |
| |
| |
| |
| |
| | 1,023 | | (220 | ) | 102 | | 5,022 | | 268 | | 6,195 | |
| |
| |
| |
| |
| |
| |
| |
| Foreign exchange and other movements | 551 | | (24 | ) | 14 | | 60 | | 37 | | 638 | |
| |
| |
| |
| |
| |
| |
| |
| Provisions at 31 December | 4,812 | | 522 | | 943 | | 5,714 | | 568 | | 12,559 | |
| |
| |
| |
| |
| |
| |
| |
| Provisions against banks: | | | | | | | | | | | | |
| – specific provisions | 14 | | – | | 3 | | – | | – | | 17 | |
| Provisions against customers | | | | | | | | | | | | |
| – specific provisions | 4,036 | | 320 | | 785 | | 4,364 | | 512 | | 10,017 | |
| – general provisions2 | 762 | | 202 | | 155 | | 1,350 | | 56 | | 2,525 | |
| |
| |
| |
| |
| |
| |
| |
| Provisions at 31 December | 4,812 | | 522 | | 943 | | 5,714 | | 568 | | 12,559 | |
| |
| |
| |
| |
| |
| |
| |
| Provisions against customers as a percentage of loans and advances to customers | % | | % | | % | | % | | % | | % | |
| – specific provisions | 1.43 | | 0.40 | | 1.27 | | 1.72 | | 6.56 | | 1.46 | |
| – general provisions | 0.27 | | 0.25 | | 0.25 | | 0.53 | | 0.72 | | 0.37 | |
| |
| |
| |
| |
| |
| |
| |
| At 31 December | 1.70 | | 0.65 | | 1.52 | | 2.25 | | 7.28 | | 1.83 | |
| |
| |
| |
| |
| |
| |
| |
| | | | | | | | | | | | | |
| 1 | See table below ‘Net charge to the profit and loss account for bad and doubtful debts by geographical region’. |
| 2 | General provisions are allocated to geographical segments based on the location of the office booking the provision. Consequently, the general provision booked in Hong Kong may cover assets booked in branches located outside Hong Kong, principally in the Rest of Asia-Pacific, as well as those booked in Hong Kong. |
135
Back to Contents
H S B C H O L D I N G S P L C
Financial Review(continued)
Movement in provisions by industry segment and by geographical region(continued)
| | 2003 | |
| |
| |
| | | | | | Rest of | | | | | | | |
| | | | Hong | | Asia- | | North | | South | | | |
| | Europe | | Kong | | Pacific | | America | | America | | Total | |
| | US$m | | US$m | | US$m | | US$m | | US$m | | US$m | |
| | | | | | | | | | | | | |
| Provisions at 1 January | 3,668 | | 1,143 | | 1,496 | | 2,356 | | 477 | | 9,140 | |
| Amounts written off | | | | | | | | | | | | |
| Commercial, industrial and international trade | (338 | ) | (71 | ) | (201 | ) | (337 | ) | (69 | ) | (1,016 | ) |
| Real estate | (31 | ) | (12 | ) | (18 | ) | (113 | ) | (5 | ) | (179 | ) |
| Non-bank financial institutions | (3 | ) | (13 | ) | (21 | ) | (30 | ) | – | | (67 | ) |
| Other commercial | (54 | ) | (65 | ) | (42 | ) | (104 | ) | (30 | ) | (295 | ) |
| Residential mortgages | (4 | ) | (121 | ) | (16 | ) | (529 | ) | (5 | ) | (675 | ) |
| Other personal | (472 | ) | (302 | ) | (147 | ) | (4,225 | ) | (78 | ) | (5,224 | ) |
| |
| |
| |
| |
| |
| |
| |
| | (902 | ) | (584 | ) | (445 | ) | (5,338 | ) | (187 | ) | (7,456 | ) |
| |
| |
| |
| |
| |
| |
| |
| Recoveries of amounts written off in previous years | | | | | | | | | | | | |
| Commercial, industrial and international trade | 25 | | 16 | | 18 | | 20 | | 3 | | 82 | |
| Real estate | 3 | | – | | 4 | | 2 | | – | | 9 | |
| Non-bank financial institutions | 2 | | – | | 5 | | 4 | | – | | 11 | |
| Other commercial | 49 | | 4 | | 11 | | 10 | | 7 | | 81 | |
| Residential mortgages | 1 | | 6 | | 1 | | 4 | | 1 | | 13 | |
| Other personal | 62 | | 16 | | 35 | | 295 | | 6 | | 414 | |
| |
| |
| |
| |
| |
| |
| |
| | 142 | | 42 | | 74 | | 335 | | 17 | | 610 | |
| |
| |
| |
| |
| |
| |
| |
| Net charge to profit and loss account1 | | | | | | | | | | | | |
| Banks | (6 | ) | – | | 3 | | – | | – | | (3 | ) |
| Commercial, industrial and international trade | 286 | | (3 | ) | (45 | ) | 78 | | 60 | | 376 | |
| Real estate | 15 | | (18 | ) | (8 | ) | (1 | ) | 1 | | (11 | ) |
| Non-bank financial institutions | (1 | ) | 1 | | (17 | ) | (5 | ) | (1 | ) | (23 | ) |
| Governments | – | | – | | 1 | | – | | – | | 1 | |
| Other commercial | 216 | | 78 | | (4 | ) | 55 | | (6 | ) | 339 | |
| Residential mortgages | – | | 102 | | 23 | | 421 | | 6 | | 552 | |
| Other personal | 482 | | 271 | | 116 | | 3,992 | | 122 | | 4,983 | |
| General Provisions | (118 | ) | (31 | ) | 16 | | 136 | | (124 | ) | (121 | ) |
| |
| |
| |
| |
| |
| |
| |
| | 874 | | 400 | | 85 | | 4,676 | | 58 | | 6,093 | |
| |
| |
| |
| |
| |
| |
| |
| Foreign exchange and other movements2 | 653 | | 54 | | (29 | ) | 4,432 | | 218 | | 5,328 | |
| |
| |
| |
| |
| |
| |
| |
| Provisions at 31 December | 4,435 | | 1,055 | | 1,181 | | 6,461 | | 583 | | 13,715 | |
| |
| |
| |
| |
| |
| |
| |
| Provisions against banks: | | | | | | | | | | | | |
| – specific provisions | 20 | | – | | 4 | | – | | – | | 24 | |
| Provisions against customers | | | | | | | | | | | | |
| – specific provisions | 3,554 | | 629 | | 981 | | 5,184 | | 530 | | 10,878 | |
| – general provisions3 | 861 | | 426 | | 196 | | 1,277 | | 53 | | 2,813 | |
| |
| |
| |
| |
| |
| |
| |
| Provisions at 31 December | 4,435 | | 1,055 | | 1,181 | | 6,461 | | 583 | | 13,715 | |
| |
| |
| |
| |
| |
| |
| |
| Provisions against customers as a percentage of loans and advances to customers | % | | % | | % | | % | | % | | % | |
| – specific provisions | 1.65 | | 0.84 | | 1.99 | | 2.62 | | 9.46 | | 2.00 | |
| – general provisions | 0.40 | | 0.57 | | 0.40 | | 0.65 | | 0.95 | | 0.52 | |
| |
| |
| |
| |
| |
| |
| |
| At 31 December | 2.05 | | 1.41 | | 2.39 | | 3.27 | | 10.41 | | 2.52 | |
| |
| |
| |
| |
| |
| |
| |
| | |
| 1 | See table below ‘Net charge to the profit and loss account for bad and doubtful debts by geographical region’. |
| 2 | Other movements include amounts of US$129 million in Europe and US$4,524 million in North America transferred in on the acquisition of HSBC Finance Corporation, and of US$116 million in South America transferred in on the acquisition of Lloyds TSB Group’s Brazilian businesses and assets. |
| 3 | General provisions are allocated to geographical segments based on the location of the office booking the provision. Consequently, the general provision booked in Hong Kong may cover assets booked in branches located outside Hong Kong, principally in the Rest of Asia-Pacific, as well as those booked in Hong Kong. |
136
Back to Contents
| | 2002 | |
| |
| |
| | | | | | Rest of | | | | | | | |
| | | | Hong | | Asia- | | North | | South | | | |
| | Europe | | Kong | | Pacific | | America | | America | | Total | |
| | US$m | | US$m | | US$m | | US$m | | US$m | | US$m | |
| | | | | | | | | | | | | |
| Provisions at 1 January | 3,067 | | 1,408 | | 1,952 | | 723 | | 1,033 | | 8,183 | |
| | | | | | | | | | | | | |
| Amounts written off | | | | | | | | | | | | |
| Banks | – | | – | | – | | – | | (1 | ) | (1 | ) |
| Commercial, industrial and international trade | (161 | ) | (59 | ) | (255 | ) | (92 | ) | (28 | ) | (595 | ) |
| Real estate | (31 | ) | (18 | ) | (88 | ) | (9 | ) | (4 | ) | (150 | ) |
| Non-bank financial institutions | (4 | ) | (11 | ) | (2 | ) | (12 | ) | (2 | ) | (31 | ) |
| Governments | (1 | ) | – | | – | | – | | – | | (1 | ) |
| Other commercial | (54 | ) | (11 | ) | (116 | ) | (149 | ) | (22 | ) | (352 | ) |
| Residential mortgages | (2 | ) | (109 | ) | (7 | ) | (2 | ) | (10 | ) | (130 | ) |
| Other personal | (199 | ) | (328 | ) | (132 | ) | (96 | ) | (96 | ) | (851 | ) |
| |
| |
| |
| |
| |
| |
| |
| | (452 | ) | (536 | ) | (600 | ) | (360 | ) | (163 | ) | (2,111 | ) |
| |
| |
| |
| |
| |
| |
| |
| Recoveries of amounts written off in previousyears | | | | | | | | | | | | |
| Commercial, industrial and international trade | 15 | | 1 | | 4 | | 6 | | 2 | | 28 | |
| Real estate | 6 | | – | | 2 | | 6 | | – | | 14 | |
| Non-bank financial institutions | – | | – | | 1 | | – | | – | | 1 | |
| Other commercial | 7 | | 3 | | 14 | | 9 | | – | | 33 | |
| Residential mortgages | 1 | | 7 | | – | | – | | – | | 8 | |
| Other personal | 29 | | 14 | | 31 | | 14 | | 8 | | 96 | |
| |
| |
| |
| |
| |
| |
| |
| | 58 | | 25 | | 52 | | 35 | | 10 | | 180 | |
| |
| |
| |
| |
| |
| |
| |
| Net charge to profit and loss account1 | | | | | | | | | | | | |
| Banks | (2 | ) | – | | – | | – | | – | | (2 | ) |
| Commercial, industrial and international trade | 345 | | (22 | ) | 38 | | 89 | | 30 | | 480 | |
| Real estate | (4 | ) | 9 | | (11 | ) | 5 | | 2 | | 1 | |
| Non-bank financial institutions | 3 | | (14 | ) | (29 | ) | 18 | | 11 | | (11 | ) |
| Governments | (1 | ) | – | | – | | (5 | ) | 4 | | (2 | ) |
| Other commercial | 50 | | (22 | ) | (22 | ) | 116 | | 177 | | 299 | |
| Residential mortgages | – | | 70 | | 11 | | (4 | ) | 10 | | 87 | |
| Other personal | 243 | | 322 | | 93 | | 66 | | 96 | | 820 | |
| General Provisions | (65 | ) | (97 | ) | 9 | | 15 | | (213 | ) | (351 | ) |
| |
| |
| |
| |
| |
| |
| |
| | 569 | | 246 | | 89 | | 300 | | 117 | | 1,321 | |
| |
| |
| |
| |
| |
| |
| |
| Foreign exchange and other movements2 | 426 | | – | | 3 | | 1,658 | | (520 | ) | 1,567 | |
| |
| |
| |
| |
| |
| |
| |
| Provisions at 31 December | 3,668 | | 1,143 | | 1,496 | | 2,356 | | 477 | | 9,140 | |
| |
| |
| |
| |
| |
| |
| |
| Provisions against banks: | | | | | | | | | | | | |
| – specific provisions | 23 | | – | | – | | – | | – | | 23 | |
| Provisions against customers | | | | | | | | | | | | |
| – specific provisions | 2,774 | | 688 | | 1,321 | | 1,482 | | 341 | | 6,606 | |
| – general provisions3 | 871 | | 455 | | 175 | | 874 | | 136 | | 2,511 | |
| |
| |
| |
| |
| |
| |
| |
| Provisions at 31 December | 3,668 | | 1,143 | | 1,496 | | 2,356 | | 477 | | 9,140 | |
| |
| |
| |
| |
| |
| |
| |
| Provisions against customers as a percentage of loans and advances to customers | % | | % | | % | | % | | % | | % | |
| – specific provisions | 1.65 | | 0.97 | | 3.42 | | 1.85 | | 9.73 | | 1.83 | |
| – general provisions | 0.52 | | 0.64 | | 0.45 | | 1.09 | | 3.88 | | 0.69 | |
| |
| |
| |
| |
| |
| |
| |
| At 31 December | 2.17 | | 1.61 | | 3.87 | | 2.94 | | 13.61 | | 2.52 | |
| |
| |
| |
| |
| |
| |
| |
| 1 | See table below ‘Net charge to the profit and loss account for bad and doubtful debts by geographical region’. |
| 2 | Other movements include amounts transferred in on the acquisition of HSBC Mexico of US$1,704 million. |
| 3 | General provisions are allocated to geographical segments based on the location of the office booking the provision. Consequently, the general provision booked in Hong Kong may cover assets booked in branches located outside Hong Kong, principally in the Rest of Asia-Pacific, as well as those booked in Hong Kong. |
137
Back to Contents
H S B C H O L D I N G S P L C
Financial Review(continued)
Movement in provisions by industry segment and by geographical region(continued)
| | 2001 | |
| |
| |
| | | | | | Rest of | | | | | | | |
| | | | Hong | | Asia- | | North | | South | | | |
| | Europe | | Kong | | Pacific | | America | | America | | Total | |
| | US$m | | US$m | | US$m | | US$m | | US$m | | US$m | |
| | | | | | | | | | | | | |
| Provisions at 1 January | 3,025 | | 1,802 | | 2,091 | | 739 | | 540 | | 8,197 | |
| | | | | | | | | | | | | |
| Amounts written off | | | | | | | | | | | | |
| Banks | (5 | ) | – | | – | | – | | – | | (5 | ) |
| Commercial, industrial and international trade | (123 | ) | (238 | ) | (256 | ) | (107 | ) | (29 | ) | (753 | ) |
| Real estate | (27 | ) | (29 | ) | (18 | ) | (10 | ) | (4 | ) | (88 | ) |
| Non-bank financial institutions | (5 | ) | (53 | ) | (5 | ) | (3 | ) | (1 | ) | (67 | ) |
| Other commercial | (54 | ) | (34 | ) | (48 | ) | (107 | ) | (215 | ) | (458 | ) |
| Residential mortgages | (4 | ) | (121 | ) | (7 | ) | (2 | ) | (13 | ) | (147 | ) |
| Other personal | (224 | ) | (155 | ) | (93 | ) | (93 | ) | (95 | ) | (660 | ) |
| |
| |
| |
| |
| |
| |
| |
| | (442 | ) | (630 | ) | (427 | ) | (322 | ) | (357 | ) | (2,178 | ) |
| |
| |
| |
| |
| |
| |
| |
| Recoveries of amounts written off in previous years | | | | | | | | | | | | |
| Commercial, industrial and international trade | 12 | | 1 | | 11 | | 18 | | 3 | | 45 | |
| Real estate | 1 | | 2 | | 1 | | – | | – | | 4 | |
| Non-bank financial institutions | – | | 3 | | 1 | | – | | – | | 4 | |
| Other commercial | 17 | | 12 | | 99 | | 11 | | 1 | | 140 | |
| Residential mortgages | 1 | | 5 | | – | | – | | – | | 6 | |
| Other personal | 34 | | 8 | | 26 | | 14 | | 4 | | 86 | |
| |
| |
| |
| |
| |
| |
| |
| | 65 | | 31 | | 138 | | 43 | | 8 | | 285 | |
| |
| |
| |
| |
| |
| |
| |
| Net charge to profit and loss account1 | | | | | | | | | | | | |
| Banks | (1 | ) | – | | – | | – | | – | | (1 | ) |
| Commercial, industrial and international trade | 164 | | 15 | | 157 | | 93 | | 55 | | 484 | |
| Real estate | (35 | ) | 16 | | (6 | ) | 2 | | 7 | | (16 | ) |
| Non-bank financial institutions | (2 | ) | (20 | ) | (14 | ) | 2 | | – | | (34 | ) |
| Government | (2 | ) | – | | – | | (3 | ) | – | | (5 | ) |
| Other commercial | 143 | | (84 | ) | (58 | ) | 151 | | 90 | | 242 | |
| Residential mortgages | (47 | ) | 111 | | 10 | | 1 | | 17 | | 92 | |
| Other personal | 257 | | 168 | | 82 | | 70 | | 125 | | 702 | |
| General provisions | (36 | ) | (9 | ) | 1 | | (16 | ) | 633 | | 573 | |
| |
| |
| |
| |
| |
| |
| |
| | 441 | | 197 | | 172 | | 300 | | 927 | | 2,037 | |
| |
| |
| |
| |
| |
| |
| |
| Foreign exchange and other movements | (22 | ) | 8 | | (22 | ) | (37 | ) | (85 | ) | (158 | ) |
| |
| |
| |
| |
| |
| |
| |
| Provisions at 31 December | 3,067 | | 1,408 | | 1,952 | | 723 | | 1,033 | | 8,183 | |
| |
| |
| |
| |
| |
| |
| |
| Provisions against banks: | | | | | | | | | | | | |
| – specific provisions | 22 | | – | | – | | – | | – | | 22 | |
| Provisions against customers | | | | | | | | | | | | |
| – specific provisions | 2,204 | | 856 | | 1,786 | | 289 | | 365 | | 5,500 | |
| – general provisions2 | 841 | | 552 | | 166 | | 434 | | 668 | | 2,661 | |
| |
| |
| |
| |
| |
| |
| |
| Provisions at 31 December | 3,067 | | 1,408 | | 1,952 | | 723 | | 1,033 | | 8,183 | |
| |
| |
| |
| |
| |
| |
| |
| Provisions against customers as a percentage of loans and advances to customers | % | | % | | % | | % | | % | | % | |
| – specific provisions | 1.61 | | 1.24 | | 5.44 | | 0.39 | | 7.03 | | 1.73 | |
| – general provisions | 0.62 | | 0.80 | | 0.51 | | 0.59 | | 12.873 | | 0.84 | |
| |
| |
| |
| |
| |
| |
| |
| At 31 December | 2.23 | | 2.04 | | 5.95 | | 0.98 | | 19.90 | | 2.57 | |
| |
| |
| |
| |
| |
| |
| |
| 1 | See table below ‘Net charge to the profit and loss account for bad and doubtful debts by geographical region’. |
| 2 | General provisions are allocated to geographical segments based on the location of the office booking the provision. Consequently, the general provision booked in Hong Kong may cover assets booked in branches located outside Hong Kong, principally in the Rest of Asia-Pacific, as well as those booked in Hong Kong. |
| 3 | Includes US$600 million of additional provisions held against Argentine loans. |
138
Back to Contents
Net impairment charge to income statement by geographical region
| | Year ended 31 December 2005 | |
| |
| |
| | | | | | | | Rest of | | | | | | | | | | |
| | | | | Hong | | | Asia- | | | North | | | South | | | | |
| | Europe | | | Kong | | | Pacific | | | America | | | America | | | Total | |
| | US$m | | | US$m | | | US$m | | | US$m | | | US$m | | | US$m | |
| | | | | | | | | | | | | | | | | | |
| Individually assessed impairment allowances | | | | | | | | | | | | | | | | | |
| New allowances | 1,029 | | | 200 | | | 131 | | | 348 | | | 7 | | | 1,715 | |
| Release of allowances no longer required | (648 | ) | | (123 | ) | | (166 | ) | | (43 | ) | | (18 | ) | | (998 | ) |
| Recoveries of amounts previously written off | (21 | ) | | (18 | ) | | (34 | ) | | (110 | ) | | (16 | ) | | (199 | ) |
| |
| | |
| | |
| | |
| | |
| | |
| |
| | 360 | | | 59 | | | (69 | ) | | 195 | | | (27 | ) | | 518 | |
| |
| | |
| | |
| | |
| | |
| | |
| |
| Collectively assessed impairment allowances | | | | | | | | | | | | | | | | | |
| New allowances | 2,013 | | | 159 | | | 339 | | | 5,198 | | | 716 | | | 8,425 | |
| Release of allowances no longer required | (326 | ) | | (45 | ) | | (86 | ) | | (271 | ) | | (60 | ) | | (788 | ) |
| Recoveries of amounts previously written off | (63 | ) | | (27 | ) | | (48 | ) | | (82 | ) | | (75 | ) | | (295 | ) |
| |
| | |
| | |
| | |
| | |
| | |
| |
| | 1,624 | | | 87 | | | 205 | | | 4,845 | | | 581 | | | 7,342 | |
| |
| | |
| | |
| | |
| | |
| | |
| |
| Total charge for impairment losses | 1,984 | | | 146 | | | 136 | | | 5,040 | | | 554 | | | 7,860 | |
| Bank | (5 | ) | | – | | | (2 | ) | | – | | | – | | | (7 | ) |
| Customer | 1,989 | | | 146 | | | 138 | | | 5,040 | | | 554 | | | 7,867 | |
| |
| | |
| | |
| | |
| | |
| | |
| |
| | % | | | % | | | % | | | % | | | % | | | % | |
| Customer charge for impairment losses | | | | | | | | | | | | | | | | | |
| as a percentage of closing gross loans | | | | | | | | | | | | | | | | | |
| and advances | 0.55 | | | 0.12 | | | 0.15 | | | 1.77 | | | 3.60 | | | 0.90 | |
| | | | | | | | | | | | | | | | | | |
| | US$m | | | US$m | | | US$m | | | US$m | | | US$m | | | US$m | |
| 31 December 2005 | | | | | | | | | | | | | | | | | |
| Impaired loans | 5,068 | | | 506 | | | 936 | | | 4,045 | | | 891 | | | 11,446 | |
| Impairment allowances | 3,491 | | | 398 | | | 836 | | | 5,836 | | | 796 | | | 11,357 | |
Net charge to the income statement for bad and doubtful debts by geographical region
| | Year ended 31 December 2004 | |
| |
| |
| | | | | | | | Rest of | | | | | | | | | | |
| | | | | Hong | | | Asia- | | | North | | | South | | | | |
| | Europe | | | Kong | | | Pacific | | | America | | | America | | | Total | |
| | US$m | | | US$m | | | US$m | | | US$m | | | US$m | | | US$m | |
| | | | | | | | | | | | | | | | | | |
| Specific provisions | | | | | | | | | | | | | | | | | |
| New provisions | 2,047 | | | 237 | | | 419 | | | 5,771 | | | 398 | | | 8,872 | |
| Release of provisions no longer required | (726 | ) | | (187 | ) | | (199 | ) | | (105 | ) | | (49 | ) | | (1,266 | ) |
| Recoveries of amounts previously written off | (136 | ) | | (47 | ) | | (70 | ) | | (581 | ) | | (79 | ) | | (913 | ) |
| |
| | |
| | |
| | |
| | |
| | |
| |
| | 1,185 | | | 3 | | | 150 | | | 5,085 | | | 270 | | | 6,693 | |
| General provisions | (162 | ) | | (223 | ) | | (48 | ) | | (63 | ) | | (2 | ) | | (498 | ) |
| |
| | |
| | |
| | |
| | |
| | |
| |
| Total bad and doubtful debt charge | 1,023 | | | (220 | ) | | 102 | | | 5,022 | | | 268 | | | 6,195 | |
| Bank | (7 | ) | | – | | | (1 | ) | | – | | | (2 | ) | | (10 | ) |
| Customer | 1,031 | | | (220 | ) | | 103 | | | 5,022 | | | 270 | | | 6,205 | |
| |
| | |
| | |
| | |
| | |
| | |
| |
| | % | | | % | | | % | | | % | | | % | | | % | |
| Customer bad and doubtful debt charge | | | | | | | | | | | | | | | | | |
| as a percentage of closing gross loans | | | | | | | | | | | | | | | | | |
| and advances | 0.36 | | | (0.28 | ) | | 0.17 | | | 1.97 | | | 3.44 | | | 0.91 | |
| | | | | | | | | | | | | | | | | | |
| | US$m | | | US$m | | | US$m | | | US$m | | | US$m | | | US$m | |
| | | | | | | | | | | | | | | | | | |
| 31 December 2004 | | | | | | | | | | | | | | | | | |
| Non-performing loans | 6,039 | | | 696 | | | 1,160 | | | 3,875 | | | 657 | | | 12,427 | |
| Provisions | 4,798 | | | 522 | | | 940 | | | 5,714 | | | 568 | | | 12,542 | |
139
Back to Contents
H S B C H O L D I N G S P L C
Financial Review(continued)
Net charge to the income statement for bad and doubtful debts by geographical region(continued)
| | Year ended 31 December 2003 | |
| |
|
|
|
|
|
|
|
|
|
|
|
|
|
|
|
| |
| | | | | | | Rest of | | North | | South | | | | |
| | Europe | | Hong Kong | | Asia-Pacific | | America | | America | | | Total | |
| | US$m | | US$m | | US$m | | US$m | | US$m | | | US$m | |
| Specific provisions | | | | | | | | | | | | | | | | | |
| New provisions | 1,485 | | | 655 | | | 412 | | | 4,962 | | | 263 | | | 7,777 | |
| Release of provisions no longer required | (351 | ) | | (182 | ) | | (269 | ) | | (87 | ) | | (64 | ) | | (953 | ) |
| Recoveries of amounts previously written off | (142 | ) | | (42 | ) | | (74 | ) | | (335 | ) | | (17 | ) | | (610 | ) |
| |
| | |
| | |
| | |
| | |
| | |
| |
| | 992 | | | 431 | | | 69 | | | 4,540 | | | 182 | | | 6,214 | |
| General provisions | (118 | ) | | (31 | ) | | 16 | | | 136 | | | (124 | ) | | (121 | ) |
| |
| | |
| | |
| | |
| | |
| | |
| |
| Total bad and doubtful debt charge | 874 | | | 400 | | | 85 | | | 4,676 | | | 58 | | | 6,093 | |
| Bank | (6 | ) | | – | | | 3 | | | – | | | – | | | (3 | ) |
| Customer | 880 | | | 400 | | | 82 | | | 4,676 | | | 58 | | | 6,096 | |
| |
| | |
| | |
| | |
| | |
| | |
| |
| | % | | | % | | | % | | | % | | | % | | | % | |
| Customer bad and doubtful debt charge | | | | | | | | | | | | | | | | | |
| as a percentage of closing gross loans | | | | | | | | | | | | | | | | | |
| and advances | 0.41 | | | 0.53 | | | 0.17 | | | 2.36 | | | 1.03 | | | 1.12 | |
| | | | | | | | | | | | | | | | | | |
| | US$m | | | US$m | | | US$m | | | US$m | | | US$m | | | US$m | |
| | | | | | | | | | | | | | | | | | |
| 31 December 2003 | | | | | | | | | | | | | | | | | |
| Non-performing loans | 5,701 | | | 1,671 | | | 1,538 | | | 5,444 | | | 696 | | | 15,050 | |
| Provisions | 4,415 | | | 1,055 | | | 1,177 | | | 6,461 | | | 583 | | | 13,691 | |
| | Year ended 31 December 2002 | |
| |
|
|
|
|
|
|
|
|
|
|
|
|
|
|
|
| |
| | | | | | | | Rest of | | | North | | | South | | | | |
| | Europe | | | Hong Kong | | | Asia-Pacific | | | America | | | America | | | Total | |
| | US$m | | | US$m | | | US$m | | | US$m | | | US$m | | | US$m | |
| Specific provisions | | | | | | | | | | | | | | | | | |
| New provisions | 963 | | | 528 | | | 400 | | | 399 | | | 388 | | | 2,678 | |
| Release of provisions no longer required | (271 | ) | | (160 | ) | | (268 | ) | | (79 | ) | | (48 | ) | | (826 | ) |
| Recoveries of amounts previously written off | (58 | ) | | (25 | ) | | (52 | ) | | (35 | ) | | (10 | ) | | (180 | ) |
| |
| | |
| | |
| | |
| | |
| | |
| |
| | 634 | | | 343 | | | 80 | | | 285 | | | 330 | | | 1,672 | |
| |
| | |
| | |
| | |
| | |
| | |
| |
| General provisions | | | | | | | | | | | | | | | | | |
| Argentine additional provision | – | | | – | | | – | | | – | | | (196 | ) | | (196 | ) |
| Other | (65 | ) | | (97 | ) | | 9 | | | 15 | | | (17 | ) | | (155 | ) |
| |
| | |
| | |
| | |
| | |
| | |
| |
| | (65 | ) | | (97 | ) | | 9 | | | 15 | | | (213 | ) | | (351 | ) |
| |
| | |
| | |
| | |
| | |
| | |
| |
| Total bad and doubtful debt charge | 569 | | | 246 | | | 89 | | | 300 | | | 117 | | | 1,321 | |
| |
| | |
| | |
| | |
| | |
| | |
| |
| Customer | 569 | | | 246 | | | 89 | | | 300 | | | 117 | | | 1,321 | |
| |
| | |
| | |
| | |
| | |
| | |
| |
| | % | | | % | | | % | | | % | | | % | | | % | |
| Customer bad and doubtful debt charge | | | | | | | | | | | | | | | | | |
| as a percentage of closing gross loans | | | | | | | | | | | | | | | | | |
| and advances | 0.34 | | | 0.35 | | | 0.23 | | | 0.38 | | | 3.27 | | | 0.36 | |
| | | | | | | | | | | | | | | | | | |
| | US$m | | | US$m | | | US$m | | | US$m | | | US$m | | | US$m | |
| | | | | | | | | | | | | | | | | | |
| 31 December 2002 | | | | | | | | | | | | | | | | | |
| Non-performing loans | 4,495 | | | 1,724 | | | 2,055 | | | 1,773 | | | 476 | | | 10,523 | |
| Provisions | 3,645 | | | 1,143 | | | 1,496 | | | 2,356 | | | 477 | | | 9,117 | |
140
Back to Contents
| | Year ended 31 December 2001 | |
| |
| |
| | | | | | | | Rest of | | | North | | | South | | | | |
| | Europe | | | Hong Kong | | | Asia-Pacific | | | America | | | America | | | Total | |
| | US$m | | | US$m | | | US$m | | | US$m | | | US$m | | | US$m | |
| Specific provisions | | | | | | | | | | | | | | | | | |
| New provisions | 802 | | | 449 | | | 577 | | | 392 | | | 346 | | | 2,566 | |
| Release of provisions no longer required | (260 | ) | | (212 | ) | | (268 | ) | | (42 | ) | | (35 | ) | | (817 | ) |
| Recoveries of amounts previously written off | (65 | ) | | (31 | ) | | (138 | ) | | (43 | ) | | (8 | ) | | (285 | ) |
| |
| | |
| | |
| | |
| | |
| | |
| |
| | 477 | | | 206 | | | 171 | | | 307 | | | 303 | | | 1,464 | |
| |
| | |
| | |
| | |
| | |
| | |
| |
| General provisions | | | | | | | | | | | | | | | | | |
| Argentine additional provision | – | | | – | | | – | | | – | | | 600 | | | 600 | |
| Other | (36 | ) | | (9 | ) | | 1 | | | (7 | ) | | 24 | | | (27 | ) |
| |
| | |
| | |
| | |
| | |
| | |
| |
| | (36 | ) | | (9 | ) | | 1 | | | (7 | ) | | 624 | | | 573 | |
| |
| | |
| | |
| | |
| | |
| | |
| |
| Total bad and doubtful debt charge | 441 | | | 197 | | | 172 | | | 300 | | | 927 | | | 2,037 | |
| Customer | 441 | | | 197 | | | 172 | | | 300 | | | 927 | | | 2,037 | |
| |
| | |
| | |
| | |
| | |
| | |
| |
| | % | | | % | | | % | | | % | | | % | | | % | |
Customer bad and doubtful debt charge as a percentage of closing gross loans and advances | 0.32 | | | 0.29 | | | 0.52 | | | 0.41 | | | 17.80 | | | 0.64 | |
| | | | | | | | | | | | | | | | | | |
| | US$m | | | US$m | | | US$m | | | US$m | | | US$m | | | US$m | |
| 31 December 2001 | | | | | | | | | | | | | | | | | |
| Non-performing loans | 3,682 | | | 2,028 | | | 2,723 | | | 672 | | | 544 | | | 9,649 | |
| Provisions | 3,045 | | | 1,408 | | | 1,952 | | | 723 | | | 1,033 | | | 8,161 | |
| | | | | | | | | | | | | | | | | | |
Year ended 31 December 2005 compared with year ended 31 December 2004
Loan impairment charges were US$7,860 million, an increase of 27 per cent compared with 2004. Acquisitions accounted for US$107 million of the rise and US$498 million reflected the non-recurrence of the general provision release in 2004. The total charge remained dominated by the personal sector, with losses in these portfolios representing 92 per cent of the Group’s net loan impairment charge. On a constant currency basis, the trends were as follows:
New allowances for loan impairment charges were US$10,140 million, an increase of 13 per cent compared with 2004. Releases and recoveries of allowances increased by 4 per cent to US$2,280 million. Including a general provision release of US$498 million in 2004, releases and recoveries decreased by 15 per cent.
InEurope, growth in UK personal lending and a weakening in credit quality were the principal causes of a 50 per cent increase in new loan impairment charges to US$3,042 million in 2005. Slower economic growth and weaker employment conditions were compounded by a change in legislation in 2004 that relaxed conditions for personal bankruptcies, which rose to record highs by the final quarter of 2005. In response to these trends in the personal portfolio, HSBC tightened underwriting controls, focusing more on existing relationships and changing the product mix towards lower risk customers. These actions, together with further centralisation of underwriting approvals and
revised reward programmes, assisted in mitigating the rate of growth in new impairment charges towards the end of 2005. In the commercial sector, there were a number of individually significant new charges raised in the fourth quarter, as well as a higher rate of new allowances. Although credit charges remained low by historic standards, the trend is progressively moving back to more normal levels. Elsewhere in Europe, France and Italy saw declines in new allowances, due to the sale of a consumer finance subsidiary during the year and the non-recurrence of corporate charges, respectively. In Turkey, new allowances have increased in line with the growth in the personal loan portfolio.
Releases and recoveries in Europe were US$1,058 million, an increase of 23 per cent. Including a general provision release of US$162 million in 2004, releases and recoveries were broadly in line. Increased releases in Turkey, largely reflecting higher volumes offset the non-recurrence of the general provision release in Switzerland.
New impairment allowances inHong Kongwere US$359 million, a rise of 51 per cent. This was partially attributable to a small number of individual allowances for corporate and commercial customers. However, overall credit quality improved, evidenced by a decline in non-performing loans as a proportion of gross advances, reflecting a strong economy with low unemployment.
Releases and recoveries in Hong Kong declined 53 per cent, including the non-recurrence of a
141
Back to Contents
| H S B C H O L D I N G S P L C |
| |
| |
| Financial Review(continued) |
| | |
| | |
general provision release of US$223 million in 2004. Excluding this, releases and recoveries fell by 9 per cent to US$213 million, as the significant number of large corporate releases in 2004 was not repeated. The general provision release last year reflected a review of historical loss experience and the improved market environment.
The effect of strong growth in advances in theRest of Asia-Pacific, produced an 11 per cent rise in new impairment allowances to US$470 million. In particular, increased allowances in Taiwan were driven by a combination of loan growth and an increase in credit card delinquency. There were further increases in Indonesia and the Philippines due to growth in advances, with credit quality stable in both countries. These were partially offset by declines in mainland China and Singapore. In general, across the region, advances to customers rose and credit quality improved. Non-performing assets, as a percentage of advances, fell across most major countries.
In the Rest of Asia-Pacific, releases and recoveries rose by 6 per cent to US$334 million, including the US$48 million general provision release in 2004. Excluding this, releases and recoveries were 24 per cent higher than 2004. There were higher releases and recoveries across most countries in the region reflecting the strong economic environment, although in Malaysia and Singapore there were declines, due to the non-recurrence of the general provision releases in 2004.
New loan impairment allowances inNorth America declined 4 per cent. This was despite loan growth, and the additional credit allowances raised in relation to Hurricane Katrina, and accelerated bankruptcy filings in the second half of the year ahead of new legislation in the US. A portion of the increase in bankruptcies was an acceleration of write-offs that would have otherwise been experienced in future periods. In an effort to assist customers affected by Hurricane Katrina, HSBC initiated various programmes, including extended payment arrangements. The reduction in the charge also reflected the non-recurrence of a US$47 million charge in 2004, following the adoption of FFIEC write-off policies relating to retail and credit card balances. Excluding these factors, credit quality improved year on year, reflecting an improving economic environment. This contributed to the fall in new impairment allowances, which was only partially offset by increased requirements due to loan growth. HSBC has benefited from the shift in the balance of the consumer lending business towards higher credit quality customers. HSBC Finance monitors the two-month-and-over contractual
delinquency ratio closely, as management views it as an important indicator of future write-offs. The ratio declined from 4.0 per cent at 31 December 2004 to 3.6 per cent at 30 June 2005, rising to 3.7 per cent at 31 December 2005. Lending in the US is primarilyin the personal sector. Credit quality in the commercial portfolio was stable in 2005. The favourable trends in the US were partially offset by rises in new allowances in Mexico and Canada. In both cases, this was largely driven by personal balance growth in the loan portfolio in recent years. Underlying credit quality was stable in Mexico and improved in Canada.
Releases and recoveries in North America were US$506 million, a decrease of 27 per cent. Including the 2004 general provision release of US$63 million, releases and recoveries declined by 33 per cent. In the US, a rise in releases reflected an improved credit environment and a strong economy. Under IFRSs, from 1 January 2005 certain recoverable amounts were incorporated into the loan impairment charge directly resulting in lower reported recoveries. There were further decreases in Mexico, due to a particularly large number of recoveries last year, and in Bank of Bermuda, following the non-recurrence of the general provision release in 2004. These declines were offset by a more than five-fold increase in releases in Canada, where better credit quality was driven by improved economic conditions, particularly in the resource driven economy of western Canada.
InSouth America, new impairment allowances in Brazil were the principal cause of a 51 per cent rise in new charges to US$723 million in 2005. Significant growth of 24 per cent in gross advances, coupled with deteriorating credit quality in the consumer finance business, were the main contributing factors to this increase. Lending growth combined with a move into the low-income segment, where finances have been stretched by higher interest rates, drove higher delinquency. Changes were made to underwriting procedures during the year, to improve the credit quality of new business. This resulted in a falling impairment charge to asset ratio towards the end of the year. New allowances in Argentina were in line with 2004.
Releases and recoveries in South America increased by 16 per cent to US$169 million. Recoveries in Brazil rose as a result of improved collections, compounded by higher releases as a result of greater volumes of advances. Argentine releases fell as impaired loans reduced, partially offsetting the rise in Brazil.
142
Back to Contents
Charge for impairment losses as a percentage of average gross loans and advances to customers
| | | | | | Rest of | | North | | South | | | |
| | Europe | | Hong Kong | | Asia-Pacific | | America | | America | | Total | |
| | % | | % | | % | | % | | % | | % | |
| Year ended 31 December 2005 | | | | | | | | | | | | |
| New allowances | 1.12 | | 0.44 | | 0.70 | | 2.25 | | 7.68 | | 1.50 | |
| Releases and recoveries | (0.39 | ) | (0.26 | ) | (0.50 | ) | (0.21 | ) | (1.80 | ) | (0.34 | ) |
| |
| |
| |
| |
| |
| |
| |
| Impairment allowances | 0.73 | | 0.18 | | 0.20 | | 2.04 | | 5.88 | | 1.16 | |
| |
| |
| |
| |
| |
| |
| |
| Total charge for impairment losses | 0.73 | | 0.18 | | 0.20 | | 2.04 | | 5.89 | | 1.16 | |
| Amount written off net of recoveries | 1.00 | | 0.31 | | 0.37 | | 1.99 | | 4.49 | | 1.26 | |
| Year ended 31 December 2004 | | | | | | | | | | | | |
| New provisions | 0.78 | | 0.31 | | 0.77 | | 2.54 | | 6.58 | | 1.41 | |
| Releases and recoveries | (0.33 | ) | (0.30 | ) | (0.49 | ) | (0.30 | ) | (2.13 | ) | (0.35 | ) |
| |
| |
| |
| |
| |
| |
| |
| Net charge for specific provisions | 0.45 | | 0.01 | | 0.28 | | 2.24 | | 4.45 | | 1.06 | |
| |
| |
| |
| |
| |
| |
| |
| Total provisions charged | 0.39 | | (0.29 | ) | 0.19 | | 2.21 | | 4.45 | | 0.99 | |
| Amount written off net of recoveries | 0.46 | | 0.33 | | 0.61 | | 2.56 | | 5.27 | | 1.26 | |
| Year ended 31 December 2003 | | | | | | | | | | | | |
| New provisions | 0.76 | | 0.89 | | 0.96 | | 2.91 | | 6.09 | | 1.60 | |
| Releases and recoveries | (0.25 | ) | (0.30 | ) | (0.80 | ) | (0.25 | ) | (1.88 | ) | (0.32 | ) |
| |
| |
| |
| |
| |
| |
| |
| Net charge for specific provisions | 0.51 | | 0.59 | | 0.16 | | 2.66 | | 4.21 | | 1.28 | |
| |
| |
| |
| |
| |
| |
| |
| Total provisions charged | 0.45 | | 0.54 | | 0.20 | | 2.74 | | 1.34 | | 1.25 | |
| Amount written off net of recoveries | 0.39 | | 0.73 | | 0.86 | | 2.93 | | 3.94 | | 1.40 | |
| | | | | | | | | | | | | |
Collateral and other credit enhancements obtained
During 2005, HSBC obtained assets by taking possession of collateral held as security, or calling other credit enhancements, as follows:
| | Carrying |
| | amount |
| | obtainable |
| | in 20051 |
| | US$m |
| Nature of assets | |
| Residential property | 1,171 |
| Commercial and industrial property | 26 |
| |
|
| | 1,197 |
| |
|
| 1 | Audited IFRS 7 information. |
Repossessed properties are made available for sale in an orderly fashion, with the proceeds used to reduce or repay the outstanding indebtedness. Where excess funds are available after the debt has been repaid, they are available either for other secured lenders with lower priority or are returned to the customer. HSBC does not generally occupy repossessed properties for its business use. The majority of repossessed properties in 2005 arose in HSBC Finance Corporation in the US.
Renegotiated loans (Audited IFRS 7 information)
Restructuring activity is designed to manage customer relationships, maximise collection opportunities and, if possible, avoid foreclosure or repossession. These include extended payment arrangements, approved external debt managementplans, deferring foreclosure, modification, loan
rewrites and/or deferral of payments pending a change in circumstances. Following restructuring, an overdue consumer account is normally reset from delinquent to current status. Restructuring policies and practices are based on indicators or criteria which, in the judgement of local management, indicate that repayment will probably continue. These policies are kept under continuous review and their application varies according to the nature of the market, the product, and the availability of empirically based data. When empirical evidence indicates an increased propensity to default on restructured accounts, the use of roll-rate methodology ensures this factor is taken into account when calculating impairment allowances.
Renegotiated loans that would otherwise be past due or impaired totalled US$18.1 billion at 31 December 2005. Restructuring is most commonly applied to consumer finance portfolios. The largest concentration is in HSBC Finance, and amounts to US$14.8 billion or 82 per cent of the total renegotiated loans. The majority of restructured amounts arise from secured lending.
HSBC Holdings (Audited IFRS 7 information)
HSBC Holdings manages its credit risk by limiting its exposure to transactions with its subsidiary undertakings. No outstanding balances were considered past due or impaired as at 31 December 2005.
HSBC Holdings’ maximum exposure to credit risk at 31 December 2005, excluding collateral orother credit enhancements, was as follows:
143
Back to Contents
| H S B C H O L D I N G S P L C |
| |
| |
| Financial Review(continued) |
| | |
| | |
| | | | 2005 | | | |
| |
| |
| | Carrying | | Off-balance | | Maximum | |
| | value | | sheet exposure | | exposure | |
| | US$m | | US$m | | US$m | |
| Derivatives | 968 | | – | | 968 | |
| Loans and advances to HSBC undertakings | 14,092 | | 3,663 | | 17,755 | |
| Financial investments – debt securities of HSBC undertakings | 3,256 | | – | | 3,256 | |
| Guarantees | – | | 36,877 | | 36,877 | |
| |
| |
| |
| |
| | 18,316 | | 40,540 | | 58,856 | |
| |
| |
| |
| |
| | | | | | | |
No collateral or other credit enhancements were held by HSBC Holdings in respect of its transactions with subsidiary undertakings, other than cash deposited in respect of interest rate contract margins.
HSBC Holdings’ financial assets are held with subsidiaries of HSBC, primarily those domiciled in Europe and North America.
Areas of special interest
Group advances to personal customers
The loan impairment charge in 2005 remained dominated by the charge relating to the personal sector, which represented 92 per cent of the Group total after taking account of losses from HSBC’s other credit related activities. Within this total, losses on residential mortgages remained modest.
At 31 December 2005, HSBC’s lending to the personal sector amounted to US$420 billion, or 56 per cent of total gross loans and advances, compared with US$388 billion (57 per cent) at 31 December 2004. Acquisitions in 2005 accounted for 1 per cent of the overall increase on the previous year. The main characteristics of this portfolio and the economic influences affecting it are outlined below.
Secured residential mortgages, including the Hong Kong GHOS, accounted for US$239 billion, or 57 per cent of total lending to the personal sector, compared with US$228 billion, or 59 per cent, at 31 December 2004. The US and the UK were the main areas of growth in 2005, though increased lending to European customers was masked by the effect of the strengthening US dollar on currency translation. In percentage terms, growth in the Rest of Asia-Pacific was also strong, and mortgage lending increased by over 30 per cent in each of the Middle East, India, Taiwan, South Korea, mainland China and Singapore.
Growth in the unsecured element of the portfolio, consisting of credit and charge card advances, personal loans, vehicle finance facilitiesand other varieties of instalment finance, was more subdued than in the prior year. Following a review of
the UK personal unsecured lending book, US$1 billion of gross lending to personal customers was written off, and related collectively assessed loss allowances extinguished. This reflected those amounts for which it was deemed there was no realistic possibility of recovery, and was the main cause of more subdued growth. At 31 December 2005, the combined portfolios totalled US$182 billion, or 43 per cent, of total lending to the personal sector, compared with US$160 billion, or 41 per cent, at 31 December 2004. The acquisition of the credit card portfolios of Metris added US$5 billion to unsecured lending in 2005.
Growth in these portfolios reflected resilient consumer spending in most of the main economies in which HSBC operates. In the UK, demand for additional consumer credit moderated, and marketing and competitive pricing initiatives were the main drivers of growth. Again, growth in Europe was masked by the strengthening US dollar.
Geographically, total lending to personal customers was dominated by the diverse and mature portfolios in North America (US$218 billion), the UK (US$107 billion) and Hong Kong (US$38 billion). Collectively, these books accounted for 87 per cent of total lending to the personal sector (31 December 2004: 87 per cent).
Account management within HSBC’s personal lending portfolios is generally supported by sophisticated statistical techniques, which are enhanced by the availability of credit reference data in key local markets. The utilisation of an increasingly analytical approach to the management of these portfolios remains an ongoing objective of the Group.
In the US, excluding the acquisition of Metris, growth was largely in the mortgage services and branch-based consumer lending businesses. Promotions in the dealer network, and strong growth in the consumer direct loan programme, also contributed to increased vehicle finance lending. With the exception of the areas immediately affected by Hurricane Katrina, the US housing market remained strong, supported by low interest rates and
144
Back to Contents
transaction costs, and increased availability of credit. Within the US, HSBC’s portfolios remained geographically diverse, and were largely secured by first lien positions.
Although increased mortgage borrowing has contributed to the record level of consumer debt burden in the US, levels have largely stabilised and are expected to decline gradually, as incomes rise sufficiently to repay debt, notwithstanding higher interest rates. Bankruptcy filings increased sharply in the second half of 2005 as a result of a change in legislation, but receded to more modest levels by the end of the year. This has continued into 2006. Notwithstanding the effect of additional impairment allowances required for the Hurricane Katrina and increased bankruptcy filings, delinquency rates continued to fall across the majority of portfolios during 2005, and trends in lending quality improved.
In Mexico, HSBC utilised well-developed distribution capabilities and enhanced marketing initiatives to grow consumer lending, card and mortgages. Net interest margin was partially offset by a lower interest rate environment during the year.
In the UK, growth in personal lending was mainly in the mortgage market, where HSBC focused on retaining existing customers, and increasing market share through competitive pricing and marketing strategies. Fixed rate mortgages were the main driver of growth, against the background of a more subdued market. Overall, the secured mortgage portfolio represented 64 per cent of total lending to personal customers in the UK, and although delinquency increased modestly during 2005, losses remained negligible.
The unsecured portfolio in the UK also continued to expand, driven by credit and charge cards, and to a lesser extent unsecured personal lending, though growth in gross lending was largely offset by the US$1 billion write-off mentioned above. In response to prevailing market conditions, which saw a progressive rise in personal indebtedness, bankruptcies and delinquencies over the course of 2005, HSBC revised credit scorecards, adopted positive credit reference data, further centralised underwriting, and expanded its origination and collection analytics and efforts. As a result, there were indicators in the second half of the year that the credit quality of more recent unsecured lending vintages had improved.
Personal lending in Hong Kong remained subdued in 2005. The mortgage market remained intensely competitive, with competitors offering very low rates, along with up-front cash incentives to attract new mortgage business. Overall mortgage
balances, excluding the reduction in balances under the GHOS, which remained suspended, were broadly flat compared with December 2004. Credit quality continued to improve, with consumers benefiting from employment levels and rising property prices, with a notable reduction in the level of negative equity on mortgage balances.
In contrast with Hong Kong, personal lending in the Rest of Asia-Pacific grew strongly in most countries in 2005, boosted by a series of mortgage and credit card campaigns during the year and growth in the card base, which added 1.6 million cards, to reach 6.3 million cards in issue at the end of 2005.
Growth was also notable in Brazil, where marketing and new product launches contributed to growth of 44 per cent in personal unsecured lending, as consumer sentiment improved with economic growth. Credit quality deteriorated, notably in the consumer finance business, however, actions taken to mitigate this, notably through tightening underwriting, delivered an improvement in the fourth quarter.
Elsewhere, credit quality remained relatively stable, although HSBC continued to monitor carefully those portfolios that possess the greatest potential for future economic stress. Delinquency and loss trends differed across jurisdictions, reflecting these varied conditions.
Non-traditional lending
In response to customer demand, HSBC offers interest only residential mortgage loans in more developed markets. These loans allow customers to pay only accruing interest for a period of time, and provide customers with the repayment flexibility inherent in the structures of such products. An increasing number of customers prefer to make one-off, or irregular capital reduction payments through the lifetime of such loans, reflecting their individual income patterns.
HSBC underwrites and prices these loans in a manner appropriate to compensate for their risk by ensuring, for example, that loan-to-value ratios are more conservative than for traditional mortgage lending. HSBC does not offer loans which are designed to expose customers to the risk of negative amortisation.
145
Back to Contents
H S B C H O L D I N G S P L C
Financial Review(continued)
Risk elements in the loan portfolio
The disclosure of credit risk elements under the following headings reflects US accounting practice and classifications:
| • | loans accounted for on a non-accrual basis; |
| | |
| • | accruing loans contractually past due 90 days or more as to interest or principal; and |
| | |
| • | troubled debt restructurings not included in the above. |
In accordance with IFRSs, interest income continues to be recognised on assets that have been written down as a result of an impairment loss. In the following tables, HSBC presents information on its impaired loans and advances which are designated in accordance with the policy described above.
Impaired loans are consistent with the ‘non-accrual basis’ classification used in US GAAP and in prior years.
Impaired loans and advances
| | At 31 December | |
| |
| |
| | 2005 | | 2004 | |
| | US$m | | US$m | |
| Banks | 22 | | 26 | |
| Customers | 11,446 | | 12,427 | |
| |
| |
| |
| Total impaired loans and advances | 11,468 | | 12,453 | |
| |
| |
| |
| Total allowances cover as a percentage of impaired loans and advances | 99.1% | | 100.9% | |
Impaired customer loans and impairment allowances by geographical region
| | 2005 | | 2004 | |
| |
| |
| |
| | Impaired | | Impairment | | Impaired | | Impairment | |
| | loans | | allowances | | loans | | allowances | |
| | US$m | | US$m | | US$m | | US$m | |
| Europe | 5,068 | | 3,491 | | 6,039 | | 4,799 | |
| Hong Kong | 506 | | 398 | | 696 | | 522 | |
| Rest of Asia-Pacific | 936 | | 836 | | 1,160 | | 940 | |
| North America | 4,045 | | 5,836 | | 3,875 | | 5,714 | |
| South America | 891 | | 796 | | 657 | | 567 | |
| |
| |
| |
| |
| |
| | 11,446 | | 11,357 | | 12,427 | | 12,542 | |
| |
| |
| |
| |
| |
| | | | | | | | | |
Total impaired loans to customers declined by US$981 million to US$11,446 million at the end of 2005. At 31 December 2005, impaired loans represented 1.5 per cent of gross customer loans and advances after grossing, compared with 1.8 per cent at 31 December 2004. Following a review of the personal unsecured lending portfolio in the UK, US$1 billion of impaired loans, for which there was no realistic possibility of recovery, were written-off.
The commentary that follows is based on constant exchange rates.
Impaired loans in Europe fell by 5 per cent to US$5,068 million in 2005. In the UK, impaired loans decreased by 4 per cent. This was primarily due to the write-offs mentioned above. Excluding this, impaired loans rose, in part due to the strong growth in unsecured personal lending and credit cards. The UK has experienced weakening personal credit quality in recent years, driven by record levels of consumer debt, slower economic growth and higher unemployment. These factors, coupled with a change in legislation, have resulted in a significant
increase in personal bankruptcies. There were further declines in France, due to corporate restructuring and acquisition activity, and a 21 per cent decline in Malta. This reflected the write-off of fully provided loans that were no longer deemed to have a realistic prospect of recovery.
In Hong Kong, impaired loans declined by 28 per cent to US$506 million in 2005. Improvement was seen in both the personal and corporate portfolios, driven by the strong economy, lower unemployment and stable property prices following a recovery in 2004. Some weakness in the real estate market was evident in the fourth quarter, following successive interest rate rises, but loan quality remains strong.
Impaired loans, both in absolute terms and as a proportion of gross advances, declined across most major countries in the Rest of Asia-Pacific. In total, impaired balances declined by 19 per cent to US$936 million. In particular, there were significant falls in Malaysia, due to a significant number of restructurings and to strong economic growth. There
146
Back to Contents
were also improvements in mainland China and Singapore, due to strong economic growth.
In North America, impaired loans increased by 4 per cent to US$4,045 million. This rise reflected portfolio growth and accelerated bankruptcies ahead of new US legislation, particularly in secured and personal unsecured lending. The trend in US impaired loans as a percentage of gross receivables was stable year-on-year. In Mexico, impaired loans increased in line with portfolio growth. Improving credit conditions in Canada, on the back of a strong economy, drove a decrease in impaired loans, offsetting the rises in the US and Mexico.
A rise of 26 per cent to US$891 million in South America’s impaired loans was mainly due to the 34 per cent increase in Brazil. This was partly driven by strong balance sheet growth, but there was also some weakening in credit quality in the consumer finance business, particularly in the low income segment. Action taken during the year to amend lending parameters has assisted in stabilising delinquency. Argentina’s economy continued its steady recovery and as a result impaired loans declined by 9 per cent, partly offsetting the rise in Brazil.
Troubled debt restructurings
US GAAP requires separate disclosure of any loans whose terms have been modified because of problems with the borrower to grant concessions other than are warranted by market conditions. These are classified as ‘troubled debt restructurings’ and are distinct from the normal restructuring activities described above. Disclosure of troubled debt restructurings may be discontinued after the first year if the debt performs in accordance with the new terms.
The fall in troubled debt restructurings was driven by the decline in Hong Kong, a product of the continuing improvement in the quality of the loan book.
Unimpaired loans past due 90 days or more
The rise in Europe was due to the UK, where improved processes led to better credit data collection. In North America, HSBC Finance’s business benefited from improvement in delinquency and default trends year on year. In common with other card issuers, including other parts of HSBC, HSBC Finance continues to accrue interest on credit cards past 90 days until charged off. Appropriate provisions are raised against the proportion judged to be irrecoverable.
Potential problem loans
Credit risk elements also cover potential problem loans. These are loans where information about borrowers’ possible credit problems causes management serious doubts about the borrowers’ ability to comply with the loan repayment terms. There are no potential problem loans other than those identified in the table of risk elements set out below.
147
Back to Contents
H S B C H O L D I N G S P L C
Financial Review(continued)
Risk elements
The following table provides an analysis of risk elements in the loan portfolios at 31 December for the past five years:
At 31 December | | | | At 31 December | |
| | | |
| |
| 2005 | | 2004 | | | | 2003 | | 2002 | | 2001 | |
| US$m | | US$m | | | | US$m | | US$m | | US$m | |
| | | | | Impaired loans | | | | | | | |
| 5,081 | | 6,053 | | Europe | | 5,680 | | 4,479 | | 3,605 | |
| 506 | | 696 | | Hong Kong | | 1,670 | | 1,707 | | 2,008 | |
| 945 | | 1,172 | | Rest of Asia-Pacific | | 1,519 | | 2,008 | | 2,692 | |
| 4,045 | | 3,875 | | North America | | 4,651 | | 1,672 | | 660 | |
| 891 | | 657 | | South America | | 696 | | 476 | | 544 | |
| |
| | | |
| |
| |
| |
| 11,468 | | 12,453 | | | | 14,216 | | 10,342 | | 9,509 | |
| |
| | | |
| |
| |
| |
| | | | | Troubled debt restructurings | | | | | | | |
| 35 | | 34 | | Europe | | 159 | | 41 | | – | |
| 198 | | 436 | | Hong Kong | | 571 | | 396 | | 381 | |
| 121 | | 56 | | Rest of Asia-Pacific | | 68 | | 89 | | 131 | |
| 160 | | 144 | | North America | | 210 | | 4 | | 3 | |
| 732 | | 693 | | South America | | 837 | | 669 | | 144 | |
| |
| | | |
| |
| |
| |
| 1,246 | | 1,363 | | | | 1,845 | | 1,199 | | 659 | |
| |
| | | |
| |
| |
| |
| | | | | Unimpaired loans contractually past due | | | | | | | |
| | | | | 90 days or more as to principal or | | | | | | | |
| | | | | interest | | | | | | | |
| 592 | | 68 | | Europe | | 34 | | 16 | | 15 | |
| 74 | | 67 | | Hong Kong | | 205 | | 193 | | 98 | |
| 40 | | 56 | | Rest of Asia-Pacific | | 45 | | 33 | | 38 | |
| 928 | | 1,171 | | North America | | 1,252 | | 42 | | 52 | |
| – | | – | | South America | | 2 | | 7 | | 47 | |
| |
| | | |
| |
| |
| |
| 1,634 | | 1,362 | | | | 1,538 | | 291 | | 250 | |
| |
| | | |
| |
| |
| |
| | | | | Risk elements on loans | | | | | | | |
| 5,708 | | 6,155 | | Europe | | 5,873 | | 4,536 | | 3,620 | |
| 778 | | 1,199 | | Hong Kong | | 2,446 | | 2,296 | | 2,487 | |
| 1,106 | | 1,284 | | Rest of Asia-Pacific | | 1,632 | | 2,130 | | 2,861 | |
| 5,133 | | 5,190 | | North America | | 6,113 | | 1,718 | | 715 | |
| 1,623 | | 1,350 | | South America | | 1,535 | | 1,152 | | 735 | |
| |
| | | |
| |
| |
| |
| 14,348 | | 15,178 | | | | 17,599 | | 11,832 | | 10,418 | |
| |
| | | |
| |
| |
| |
| | | | | Assets held for resale | | | | | | | |
| 205 | | 27 | | Europe | | 32 | | 26 | | 84 | |
| 49 | | 75 | | Hong Kong | | 2 | | 17 | | 19 | |
| 31 | | 21 | | Rest of Asia-Pacific | | 30 | | 54 | | 32 | |
| 634 | | 708 | | North America | | 794 | | 101 | | 14 | |
| 40 | | – | | South America | | – | | – | | – | |
| |
| | | |
| |
| |
| |
| 959 | | 831 | | | | 858 | | 198 | | 149 | |
| |
| | | |
| |
| |
| |
| | | | | Total risk elements | | | | | | | |
| 5,913 | | 6,182 | | Europe | | 5,905 | | 4,562 | | 3,704 | |
| 827 | | 1,274 | | Hong Kong | | 2,448 | | 2,313 | | 2,506 | |
| 1,137 | | 1,305 | | Rest of Asia-Pacific | | 1,662 | | 2,184 | | 2,893 | |
| 5,767 | | 5,898 | | North America | | 6,907 | | 1,819 | | 729 | |
| 1,663 | | 1,350 | | South America | | 1,535 | | 1,152 | | 735 | |
| |
| | | |
| |
| |
| |
| 15,307 | | 16,009 | | | | 18,457 | | 12,030 | | 10,567 | |
| |
| | | |
| |
| |
| |
| % | | % | | | | % | | % | | % | |
| | | | | Loan impairment allowances as a | | | | | | | |
| 79.2 | | 82.7 | | percentage of risk elements on loans | | 77.9 | | 77.2 | | 78.5 | |
| |
| | | |
| |
| |
| |
Interest foregone on impaired loans
Interest income that would have been recognised under the original terms of the impaired interest and restructured loans amounted to approximately
US$275 million in 2005, compared with US$280 million in 2004. Interest income of approximately US$120 million from such loans was recorded in 2005, compared with US$182 million in 2004.
148
Back to Contents
Country distribution of outstandings and cross-border exposures
HSBC controls the risk associated with cross-border lending, essentially that foreign currency will not be made available to local residents to make payments, through a centralised structure of internal country limits which are determined by taking into account relevant economic and political factors. Exposures to individual countries and cross-border exposure in aggregate are kept under continuous review.
The following table summarises the aggregate of in-country foreign currency and cross-border outstandings by type of borrower to countries which individually represent in excess of 1 per cent of HSBC’s total assets. The classification is based on
the country of residence of the borrower but also recognises the transfer of country risk in respect of third party guarantees, eligible collateral held and residence of the head office when the borrower is a branch. In accordance with the Bank of England Country Exposure Report (Form CE) guidelines, outstandings comprise loans and advances (excluding settlement accounts), amounts receivable under finance leases, acceptances, commercial bills, certificates of deposit, and debt and equity securities (net of short positions), and exclude accrued interest and intra-HSBC exposures. Comparative figures for 2003 were calculated in accordance with the requirements of the Bank of England’s Form C1, which was replaced by Form CE with effect from 31 December 2004 reporting.
| | | | Government | | | | | |
| | | | and official | | | | | |
| | Banks | | institutions | | Other | | Total | |
| | US$bn | | US$bn | | US$bn | | US$bn | |
| At 31 December 2005 | | | | | | | | |
| United Kingdom | 19.6 | | 3.7 | | 16.2 | | 39.5 | |
| United States | 10.2 | | 11.1 | | 17.1 | | 38.4 | |
| Germany | 21.6 | | 12.7 | | 3.3 | | 37.6 | |
| France | 11.5 | | 4.7 | | 5.4 | | 21.6 | |
| The Netherlands | 11.9 | | 2.6 | | 4.4 | | 18.9 | |
| Italy | 4.4 | | 10.6 | | 3.5 | | 18.5 | |
| | | | | | | | | |
| At 31 December 2004 | | | | | | | | |
| United Kingdom | 19.7 | | 3.8 | | 24.5 | | 48.0 | |
| United States | 9.2 | | 13.3 | | 14.0 | | 36.5 | |
| Germany | 17.8 | | 10.4 | | 4.0 | | 32.2 | |
| France | 11.1 | | 3.7 | | 4.6 | | 19.4 | |
| Italy | 5.7 | | 9.7 | | 2.1 | | 17.5 | |
| The Netherlands | 9.1 | | 2.2 | | 4.2 | | 15.5 | |
| Hong Kong | 1.6 | | 1.1 | | 10.3 | | 13.0 | |
| | | | | | | | | |
| At 31 December 2003 | | | | | | | | |
| United Kingdom | 14.2 | | 3.1 | | 20.4 | | 37.7 | |
| Germany | 16.0 | | 8.0 | | 3.7 | | 27.7 | |
| United States | 5.5 | | 8.4 | | 12.3 | | 26.2 | |
| France | 9.5 | | 2.3 | | 5.5 | | 17.3 | |
| The Netherlands | 9.0 | | 0.6 | | 4.6 | | 14.2 | |
| Hong Kong | 1.1 | | 0.7 | | 10.0 | | 11.8 | |
| Canada | 6.0 | | 3.2 | | 1.8 | | 11.0 | |
| Italy | 4.4 | | 5.2 | | 0.8 | | 10.4 | |
| | | | | | | | | |
At 31 December 2005, HSBC had in-country foreign currency and cross-border outstandings to counterparties in Hong Kong, Australia and Canada of between 0.75 per cent and 1 per cent of total assets. The aggregate in-country foreign currency and cross-border outstandings were: Hong Kong: US$14.6 billion; Australia: US$12.5 billion; Canada: US$11.7 billion.
At 31 December 2004, HSBC had in-country foreign currency and cross-border outstandings to counterparties in Australia and Canada of between 0.75 per cent and 1 per cent of total assets. The aggregate in-country foreign currency and cross-
border outstandings were: Australia: US$12.7 billion; Canada: US$11.8 billion.
At 31 December 2003, HSBC had in-country foreign currency and cross-border outstandings to counterparties in Australia and Japan of between 0.75 per cent and 1 per cent of total assets. The aggregate in-country foreign currency and cross-border outstandings were: Australia: US$9.1 billion; Canada: US$7.9 billion.
149
Back to Contents
H S B C H O L D I N G S P L C
FinancialReview(continued)
| |
| Liquidity and funding management |
|
| (Audited IFRS 7 information) |
The objective of HSBC’s liquidity and funding management is to ensure that all foreseeable funding commitments and deposit withdrawals can be met when due, and that wholesale market access is co-ordinated and disciplined. To this end, HSBC maintains a diversified and stable funding base comprising core retail and corporate customer deposits and institutional balances. This is augmented by wholesale funding and portfolios of highly liquid assets which are diversified by currency and maturity, in order to enable HSBC to respond quickly and smoothly to unforeseen liquidity requirements.
The management of liquidity and funding is primarily carried out locally in the operating companies of HSBC in accordance with practice and limits set by the Group Management Board. These limits vary by local financial unit to take account of the depth and liquidity of the market in which the entity operates. It is HSBC’s general policy that each banking entity should be self-sufficient with regard to funding its own operations. Exceptions are permitted to facilitate the efficient funding of certain short-term treasury requirements and start-up operations or branches which do not have access to local deposit markets, all of which are funded under strict internal and regulatory guidelines and limits from HSBC’s largest banking operations. These internal and regulatory limits and guidelines serve to place formal limitations on the transfer of resources between HSBC entities and are necessary to reflect the broad range of currencies, markets and time zones within which HSBC operates.
HSBC requires operating entities to maintain a strong liquidity position and to manage the liquidity profile of their assets, liabilities and commitments so that cash flows are appropriately balanced and all funding obligations are met when due.
The Group’s liquidity and funding management process includes:
| • | projecting cash flows by major currency and considering the level of liquid assets necessary in relation thereto; |
| | |
| • | monitoring balance sheet liquidity ratios against internal and regulatory requirements; |
| | |
| • | maintaining a diverse range of funding sources with adequate back-up facilities; |
| | |
| • | managing the concentration and profile of debt maturities; |
| | |
| • | maintaining debt financing plans; |
| | |
| • | monitoring depositor concentration in order to avoid undue reliance on large individual depositors and ensure a satisfactory overall funding mix; and |
| | |
| • | maintaining liquidity and funding contingency plans. These plans identify early indicators of stress conditions and describe actions to be taken in the event of difficulties arising from systemic or other crises, while minimising adverse long-term implications for the business. |
| | |
Primary sources of funding(Audited IFRS 7 information)
Current accounts and savings deposits payable on demand or at short notice form a significant part of HSBC’s funding. HSBC places considerable importance on the stability of these deposits. Stability depends upon maintaining depositor confidence in HSBC’s capital strength and liquidity, and on competitive and transparent deposit-pricing strategies. HSBC seeks to support this confidence by consistently reinforcing HSBC’s brand values of trust and solidity across the Group’s geographically diverse retail banking network.
HSBC accesses professional markets in order to provide funding for non-banking subsidiaries that do not accept deposits, to maintain a presence in local money markets and to optimise the funding of asset maturities not naturally matched by core deposit funding. In aggregate, HSBC’s banking entities are liquidity providers to the inter-bank market, placing significantly more funds with other banks than they borrow.
The main operating subsidiary that does not accept deposits is HSBC Finance Corporation, which funds itself principally through taking term funding in the professional markets and through the securitisation of assets. At 31 December 2005, US$132 billion of HSBC Finance Corporation’s liabilities were drawn from professional markets, utilising a range of products, maturities and currencies to avoid undue reliance on any particular funding source.
Of total liabilities of US$1,502 billion at 31 December 2005, funding from customers amounted to US$810 billion, of which US$773 billion was contractually repayable within one year. However, although the contractual repayments of many customer accounts are on demand or at short notice, in practice short-term deposit balances remain stable as inflows and outflows broadly match.
150
Back to Contents
The following is an analysis of cash flows payable by HSBC under financial liabilities by remaining contractual maturities at the balance sheet date:
| | | | | | Due | | Due | | | |
| | | | Due | | between | | between | | Due | |
| | On | | within 3 | | 3 and 12 | | 1 and 5 | | after 5 | |
| | demand | | months | | months | | years | | years | |
| | US$m | | US$m | | US$m | | US$m | | US$m | |
| | | | | | | | | | | |
| Deposits by banks | 21,672 | | 29,937 | | 11,026 | | 7,619 | | 4,259 | |
| Customer accounts | 424,880 | | 254,354 | | 40,813 | | 29,619 | | 6,531 | |
| Financial liabilities designated at fair value | 6,258 | | 1,365 | | 4,603 | | 34,244 | | 73,534 | |
| Debt securities in issue | 1,487 | | 64,824 | | 51,538 | | 118,109 | | 24,823 | |
| Subordinated liabilities | – | | 714 | | 2,453 | | 14,583 | | 30,555 | |
| Other financial liabilities | 12,922 | | 14,871 | | 971 | | 109 | | 689 | |
| |
| |
| |
| |
| |
| |
| Total at 31 December 2005 | 467,219 | | 366,065 | | 111,404 | | 204,283 | | 140,391 | |
| |
| |
| |
| |
| |
| |
For information on the contractual maturity of gross loan commitments, see Note 40 on the Financial Statements.
Liabilities in trading portfolios have not been analysed by contractual maturity because trading assets and liabilities are typically held for short periods of time.
Assets available to meet these liabilities, and to cover outstanding commitments to lend (US$642 billion), included cash, central bank balances, items in the course of collection and treasury and other bills (US$75 billion); loans to banks (US$156 billion, including US$121 billion repayable within one year); and loans to customers (US$793 billion, including US$313 billion repayable within one year). In the normal course of business, a proportion of customer loans contractually repayable within one year will be extended. In addition, HSBC held debt securities marketable at a value of US$273 billion. Of these assets, some US$98 billion of debt securities and treasury and other bills have been pledged to secure liabilities.
HSBC would meet unexpected net cash outflows by selling securities and accessing additional funding sources such as interbank or asset-backed markets.
A key measure used by the Group for managing liquidity risk is the ratio of net liquid assets to customer liabilities. Generally, liquid assets comprise cash balances, short-term interbank deposits and highly-rated debt securities available for immediate sale and for which a deep and liquid market exists. Net liquid assets are liquid assets less all wholesale market funds, and all funds provided by customers deemed to be professional, maturing in the next 30 days. The definition of a professional customer takes account of the size of the customer’s total deposits.
Minimum liquidity ratio limits are set for each bank operating entity. Limits reflect the local market place, the diversity of funding sources available, and the concentration risk from large depositors. Compliance with entity level limits is monitored within the Group Finance Function and reported regularly to the Risk Management Meeting.
Although consolidated data is not utilised in the management of HSBC’s liquidity, the consolidated liquidity ratio figures of net liquid assets to customer liabilities shown in the following table provide a useful insight into the overall liquidity position of the Group’s banking entities. The Group’s liquidity risk has not changed materially during the year.
Ratio of net liquid assets to customer liabilities
| |
At 31 December | | Average | | | | | |
| | during | | Maximum | | Minimum | |
| 2005 | | 2004 | | 2005 | | in 2005 | | in 2005 | |
| 17.1% | | 15.9% | | 16.3% | | 17.5% | | 14.4% | |
HSBC Holdings (Audited IFRS 7 information)
HSBC Holdings’ primary sources of cash are interest and capital receipts from its subsidiaries, which it deploys in short-term bank deposits or liquidity funds. HSBC Holdings’ primary uses of cash are investments in subsidiaries, interest payments to debt holders and dividend payments to shareholders. On an ongoing basis, HSBC Holdings replenishes its liquid resources through the receipt of interest on, and repayment of, intra-group loans, from dividends paid by subsidiaries, and from interest earned on its own liquid funds. The ability of its subsidiaries to pay dividends or advance monies to HSBC Holdings depends, among other things, on their respective regulatory capital requirements, statutory reserves, and financial and operating performance.
151
Back to Contents
H S B C H O L D I N G S P L C
FinancialReview(continued)
HSBC actively manages the cash flows from its subsidiaries to optimise the amount of cash held at the holding company level, and expects to continue doing so in the future. The wide range of HSBC’s activities means that HSBC Holdings is not dependent on a single source of profits to fund its dividends. Together with its accumulated liquid assets, HSBC Holdings believes that planned dividends and interest from subsidiaries will enable
it to meet anticipated cash obligations. Also, in normal circumstances, HSBC Holdings has full access to capital markets on normal terms.
The following is an analysis of cash flows payable by HSBC Holdings under financial liabilities by remaining contractual maturities at the balance sheet date:
| | | | | | Due | | Due | | | |
| | | | Due | | between | | between | | Due | |
| | On | | within 3 | | 3 and 12 | | 1 and 5 | | after 5 | |
| | demand | | months | | months | | years | | years | |
| | US$m | | US$m | | US$m | | US$m | | US$m | |
| | | | | | | | | | | |
| Amounts owed to HSBC undertakings | 664 | | 176 | | 1,060 | | 1,654 | | 521 | |
| Financial liabilities designated at fair value | – | | 140 | | 420 | | 3,442 | | 20,382 | |
| Other liabilities | – | | 1,196 | | – | | – | | 7 | |
| Accruals and deferred income | 13 | | 82 | | – | | – | | – | |
| Subordinated liabilities | – | | 107 | | 321 | | 2,771 | | 15,638 | |
| |
| |
| |
| |
| |
| |
| Total at 31 December 2005 | 677 | | 1,701 | | 1,801 | | 7,867 | | 36,548 | |
| |
| |
| |
| |
| |
| |
At 31 December 2005, the short-term liabilities of HSBC Holdings totalled US$3,191 million including US$1,193 million in respect of the proposed third interim dividend for 2005. Short-term assets of US$5,599 million consisted mainly of cash at bank of US$756 million and loans and advances to HSBC undertakings of US$4,661 million.
| |
| Market risk management |
|
| (Audited IFRS 7 information) |
The objective of HSBC’s market risk management is to manage and control market risk exposures in order to optimise return on risk while maintaining a market profile consistent with the Group’s status as a premier provider of financial products and services.
Market risk is the risk that movements in market risk factors, including foreign exchange rates and commodity prices, interest rates, credit spreads and equity prices will reduce HSBC’s income or the value of its portfolios. Credit risk is discussed separately in the Credit risk management section.
HSBC separates exposures to market risk into either trading or non-trading portfolios. Trading portfolios include those positions arising from market-making, proprietary position-taking and other marked-to-market positions so designated. The marked-to-market positions so designated but not held with trading intent have historically not been material to the Trading Value at Risk figure. However, this is no longer the case following the transition to accounting under IFRSs, which has increased the proportion of financial instruments measured at fair value. The contribution of these positions to the Trading Value at Risk is disclosed separately.
Non-trading portfolios primarily arise from the effective interest rate management of HSBC’s retail and commercial banking assets and liabilities.
The management of market risk is principally undertaken in Global Markets using risk limits approved by the Group Management Board. Limits are set for each portfolio, product and risk type, with market liquidity being a principal factor in determining the level of limits set. Traded Markets Development and Risk, an independent unit within Corporate, Investment Banking and Markets, develops the Group’s market risk management policies and measurement techniques. Each major operating entity has an independent market risk control function which is responsible for measuring market risk exposures in accordance with the policies defined by Traded Markets Development and Risk, and monitoring and reporting these exposures against the prescribed limits on a daily basis.
Each operating entity is required to assess the market risks which arise on each product in its business and to transfer these risks to either its local Global Markets unit for management, or to separate books managed under the supervision of the local Asset and Liability Management Committee (‘ALCO’). The aim is to ensure that all market risks are consolidated within operations which have the necessary skills, tools, management and governance to manage such risks professionally.
Value at risk (‘VAR’)(Audited IFRS 7 information)
One of the principal tools used by HSBC to monitor and limit market risk exposure is VAR. VAR is a technique that estimates the potential losses that
152
Back to Contents
could occur on risk positions as a result of movements in market rates and prices over a specified time horizon and to a given level of confidence (for HSBC, 99 per cent). HSBC calculates VAR daily. The VAR model used by HSBC is predominantly based on historical simulation. The historical simulation model derives plausible future scenarios from historical market rate time series, taking account of inter-relationships between different markets and rates, for example, between interest rates and foreign exchange rates. Potential movements in market prices are calculated with reference to market data from the last two years. The model incorporates the impact of option features in the underlying exposures. HSBC has changed the assumed holding period from a 10-day period to a 1-day period as this reflects the way the risk positions are managed. Comparative VAR numbers have been restated to reflect this change.
Although a valuable guide to risk, VAR should always be viewed in the context of its limitations. For example:
| • | the use of historical data as a proxy for estimating future events may not encompass all potential events, particularly those which are extreme in nature; |
| • | the use of a 1-day holding period assumes that all positions can be liquidated or hedged in one day. This may not fully reflect the market risk arising at times of severe illiquidity, when a 1-day holding period may be insufficient to liquidate or hedge all positions fully; |
| | |
| • | the use of a 99 per cent confidence level, by definition, does not take into account losses that might occur beyond this level of confidence; and |
| | |
| • | VAR is calculated on the basis of exposures outstanding at the close of business and therefore does not necessarily reflect intra-day exposures. |
| | |
HSBC recognises these limitations by augmenting its VAR limits with other position and sensitivity limit structures. Additionally, HSBC applies a wide range of stress testing, both on individual portfolios and on the Group’s consolidated positions. HSBC’s stress-testing regime provides senior management with an assessment of the financial impact of identified extreme events on the market risk exposures of HSBC.
The VAR, both trading and non-trading, for Global Markets was as follows:
| Value at risk | | | |
| | | US$m | |
| Total | | | |
| At 31 December 2005 | | 128.5 | |
| At 31 December 2004 | | 254.7 | |
| | Average | | Minimum | | Maximum | |
| | US$m | | US$m | | US$m | |
| | | | | | | |
| 2005 | 174.1 | | 108.2 | | 248.8 | |
| 2004 | 172.5 | | 101.2 | | 304.2 | |
Total VAR at 31 December 2005 reduced compared with 31 December 2004. As interest rates rose during 2005 in the major markets, the risk arising in Global Markets’ positions was managed down to limit exposure to further interest rate rises.
(Unaudited information)
The histogram below illustrates the frequency of daily revenue arising from all Global Markets’ business and other trading activities. In 2005, HSBC implemented a change in the transfer pricing of funds between the Personal Financial Services and the Corporate, Investment Banking and Markets segments in North America, following a transfer of the management of all of the interest rate risk of the held prime residential mortgage portfolio. The numbers for 2004 have been restated
to reflect the impact of transfer pricing had it been in place on a similar basis and to include the Futures and Equities revenues which comprise part of the Global Markets’ business. As a result of these restatements, the average daily revenue in 2004 increased from US$18.3 million to US$20.5 million.
The average daily revenue earned from Global Markets’ business and other trading activities in 2005 was US$18.7 million, compared with US$20.5 million in 2004. The standard deviation of these daily revenues was US$10.4 million compared with US$8.1 million for 2004. The standard deviation measures the variation of daily revenues about the mean value of those revenues.
153
Back to Contents
H S B C H O L D I N G S P L C
FinancialReview(continued)
An analysis of the frequency distribution of daily revenue shows that there were three days with negative revenue during 2005 compared with two days in 2004. The most frequent result was a daily revenue of between US$20 million and US$24 million, with 43 occurrences.
Daily distribution of Global Markets’ and other trading revenues in 2005
Number of days
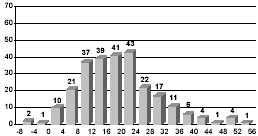
Revenues (US $m)
 Profit and loss frequency
Daily distribution of Global Markets’ and other trading revenues in 2004
Number of days

Revenues (US $m)
Profit and loss frequency
Fair value and price verification control(Audited IFRS 7 information)
Where certain financial instruments are carried on the Group’s balance sheet at fair values, the valuation and the related price verification processes are subject to independent validation across the Group. Financial instruments which are accounted for on a fair value basis include assets held in the trading portfolio, financial instruments designated at fair value, obligations related to securities sold short all derivative financial instruments and available-for-sale securities.
The determination of fair values is therefore a significant element in the reporting of the Group’s Global Markets activities.
Responsibility for determining accounting policies and procedures governing valuation and validation ultimately rests with independent finance
functions which report functionally to the Group Finance Director. All significant valuation policies, and any changes thereto, must be approved by senior finance management. HSBC’s governance of financial reporting requires that Financial Control departments across the Group are independent of the risk-taking businesses, with the Finance functions having ultimate responsibility for the determination of fair values included in the financial statements, and for ensuring that the Group’s policies comply with all relevant accounting standards. Both senior executive management and the Group Audit Committee assess the resourcing and expertise of Finance functions within the Group on a regular basis to ensure that the Group’s financial control and price verification processes are properly staffed to support the required control infrastructure.
Trading(Audited IFRS 7 information)
HSBC’s control of market risk is based on restricting individual operations to trading within a list of permissible instruments authorised for each site by Traded Markets Development and Risk, and enforcing rigorous new product approval procedures. In particular, trading in the more complex derivative products is concentrated in offices with appropriate levels of product expertise and robust control systems.
In addition, at both portfolio and position levels, market risk in trading portfolios is monitored and controlled using a complementary set of techniques such as VAR and present value of a basis point, together with stress and sensitivity testing and concentration limits. These techniques quantify the impact on capital of defined market movements.
Total trading VAR for Global Markets at 31 December 2005 was US$32.7 million. The contribution from positions taken without trading intent was US$6.9 million, the principal components of which are hedges that fail to meet the strict documentation and testing requirements of IAS 39 and are designated as ‘non-qualifying’ hedges, and other positions transacted as economic hedges but which again do not qualify for hedge accounting. HSBC’s policy on hedging is to manage economic risk in the most appropriate way without regard as to whether hedge accounting is available, within limits regarding the potential volatility of reported earnings. Trading VAR is further analysed below by risk type, by positions taken with trading intent and by positions taken without trading intent:
154
Back to Contents
Total trading VAR by risk type(Audited IFRS 7 information)
| | | Foreign | | | | | | | |
| | | exchange and | | | | | | | |
| | | commodity | | Interest | | | | | |
| | | prices | | rate trading | | Equity | | Total | |
| | | US$m | | US$m | | US$m | | US$m | |
| | | | | | | | | | |
| At 31 December 2005 | | 4.6 | | 33.8 | | 4.7 | | 32.7 | |
| At 31 December 2004 | | 12.4 | | 30.9 | | 4.8 | | 37.7 | |
| | | | | | | | | | |
| Average | | | | | | | | | |
| 2005 | | 6.9 | | 37.3 | | 5.5 | | 37.3 | |
| 2004 | | 16.1 | | 29.6 | | 5.2 | | 39.2 | |
| | | | | | | | | | |
| Minimum | | | | | | | | | |
| 2005 | | 2.9 | | 24.3 | | 2.3 | | 23.5 | |
| 2004 | | 7.4 | | 19.1 | | 3.5 | | 30.1 | |
| | | | | | | | | | |
| Maximum | | | | | | | | | |
| 2005 | | 12.4 | | 76.9 | | 10.9 | | 73.2 | |
| 2004 | | 21.4 | | 42.9 | | 8.9 | | 53.1 | |
| | | | | | | | | | |
Positions taken with trading intent – VAR by risk type(Audited IFRS 7 information)
| | | Foreign | | | | | | | |
| | | exchange and | | | | | | | |
| | | commodity | | Interest | | | | | |
| | | prices | | rate trading | | Equity | | Total | |
| | | US$m | | US$m | | US$m | | US$m | |
| | | | | | | | | | |
| At 31 December 2005 | | 4.6 | | 28.4 | | 4.7 | | 30.1 | |
| At 31 December 2004 | | 12.4 | | 30.9 | | 4.8 | | 37.7 | |
| | | | | | | | | | |
| Average | | | | | | | | | |
| 2005 | | 6.9 | | 33.3 | | 5.5 | | 33.5 | |
| 2004 | | 16.1 | | 29.6 | | 5.2 | | 39.2 | |
| | | | | | | | | | |
| Minimum | | | | | | | | | |
| 2005 | | 2.9 | | 25.5 | | 2.3 | | 25.7 | |
| 2004 | | 7.4 | | 19.1 | | 3.5 | | 30.1 | |
| | | | | | | | | | |
| Maximum | | | | | | | | | |
| 2005 | | 12.4 | | 49.0 | | 10.9 | | 46.7 | |
| 2004 | | 21.4 | | 42.9 | | 8.9 | | 53.1 | |
| | | | | | | | | | |
Positions taken without trading intent – VAR by risk type(Audited IFRS 7 information)
| | | Foreign | | | | | | | |
| | | exchange and | | | | | | | |
| | | commodity | | Interest | | | | | |
| | | prices | | rate trading | | Equity | | Total | |
| | | US$m | | US$m | | US$m | | US$m | |
| | | | | | | | | | |
| At 31 December 2005 | | – | | 6.9 | | – | | 6.9 | |
| At 31 December 2004 | | – | | – | | – | | – | |
| | | | | | | | | | |
| Average | | | | | | | | | |
| 2005 | | – | | 8.6 | | – | | 8.6 | |
| 2004 | | – | | – | | – | | – | |
| | | | | | | | | | |
| Minimum | | | | | | | | | |
| 2005 | | – | | 1.4 | | – | | 1.4 | |
| 2004 | | – | | – | | – | | – | |
| | | | | | | | | | |
| Maximum | | | | | | | | | |
| 2005 | | – | | 24.5 | | – | | 24.5 | |
| 2004 | | – | | – | | – | | – | |
| | | | | | | | | | |
155
Back to Contents
H S B C H O L D I N G S P L C
FinancialReview(continued)
Non-trading(Audited IFRS 7 information)
The principal objective of market risk management of non-trading portfolios is to optimise net interest income.
Market risk in non-trading portfolios arises principally from mismatches between the future yield on assets and their funding cost, as a result of interest rate changes. Analysis of this risk is complicated by having to make assumptions on optionality in certain product areas, for example, mortgage prepayments, and from behavioural assumptions regarding the economic duration of liabilities which are contractually repayable on demand, for example, current accounts. The prospective change in future net interest income from non-trading portfolios will be reflected in the current realisable value of these positions, should they be sold or closed prior to maturity. In order to manage this risk optimally, market risk in non-trading portfolios is transferred to Global Markets or to separate books managed under the supervision of the local ALCO.
The transfer of market risk to books managed byGlobal Markets or supervised by ALCO is usually achieved by a series of internal deals between the business units and these books. When the behavioural characteristics of a product differ from its contractual characteristics, the behavioural characteristics are assessed to determine the true underlying interest rate risk. Local ALCOs regularly monitor all such behavioural assumptions and interest rate risk positions, to ensure they comply with interest rate risk limits established by the GroupManagement Board.
As noted above, in certain cases, the non-linear characteristics of products cannot be adequately captured by the risk transfer process. For example, both the flow from customer deposit accounts to alternative investment products and the precise prepayment speeds of mortgages will vary at different interest rate levels. In such circumstances, simulation modelling is used to identify the impact of varying scenarios on valuations and net interest income.
Once market risk has been consolidated in Global Markets or ALCO-managed books, the net exposure is typically managed through the use of interest rate swaps within agreed limits.
The principal non-trading risks which are not included in VAR for Global Markets (see ‘Value at risk’ above) are detailed below.
Market risk within HSBC Finance primarily arises from mismatches between future behaviouralised asset yields and their funding costs. This mismatch mainly comes from the fact that asset yields are predominantly fixed and relatively insensitive to market movements in interest rates, whereas the related wholesale funding and its associated derivatives are more sensitive to such movements. This non-trading risk is principally managed by controlling the sensitivity of projected net interest income under varying interest rate scenarios: see ‘Net interest income’ below.
VAR limits are set to control the total market risk exposure of HSBC Finance. The VAR as at 31 December 2005 was US$13.5 million (2005 average: US$13.4 million; 2005 minimum: US$6.2 million; 2005 maximum: US$41.6 million), compared with US$9.1 million at 31 December 2004(2004 average: US$16.1 million; 2004 minimum: US$4.1 million; 2004 maximum: US$31.9 million).
Market risk arising in the prime residential mortgage business of HSBC Bank USA is primarily managed by a specialist function within the business,under guidelines established by HSBC Bank USA’s ALCO. A range of risk management tools is applied to hedge the sensitivity arising from movements in interest rates. The key element of market risk within the US prime mortgage business relates to the prepayment options embedded in US mortgages, which affect the sensitivity of the value of mortgage servicing rights (‘MSRs’) to interest rate movements and the net interest margin on mortgage assets. MSRs represent the economic value of the right to receive fees for performing specified residential mortgage servicing activities. They are sensitive to interest rate movements because lower rates accelerate the prepayment speed of the underlying mortgages and therefore reduce the value of the MSRs. The reverse is true for rising rates. HSBC uses a combination of interest rate-sensitive derivatives and debt securities to help protect the economic value of MSRs. An accounting asymmetry can arise in this area because the derivatives used to hedge the economic exposure arising from MSRs arealways measured at fair value, but the MSRs themselves are measured for accounting purposes at the lower of amortised cost and valuation. It is, therefore, possible for an economically hedged position not to be shown as such in the accounts, when the hedge shows a loss but the MSR cannot be revalued above cost to reflect the related profit. HSBC’s policy again is to hedge the economic risk.
156
Back to Contents
VAR limits are set to control the exposure to MSRs and MSR hedges. The VAR on MSRs and MSR hedges at 31 December 2005 was US$3.9 million (2005 average: US$3.2 million; 2005 minimum: US$2.4 million; 2005 maximum: US$4.0 million), compared with US$3.7 million at 31 December 2004 (2004 average: US$3.9 million; 2004 minimum: US$2.8 million; 2004 maximum: US$4.6 million).
Non-trading exposure also arises on non-cumulative perpetual preferred securities issued. These fixed-rate securities are eligible as tier 1 capital and are managed as capital instruments. Prior to the adoption of IFRSs these securities were classified as a non-equity element of minority interests but they are now classified as debt securities issued and therefore included in non-trading market risk analysis. The combination of a fixed interest rate and perpetual term generated a VAR of US$65.0 million at 31 December 2005 (2005 average: US$70.3 million; 2005 minimum: US$62.3 million; 2005 maximum: US$78.2 million), compared with US$72.5 million at 31 December 2004 (2004 average: US$75.6 million; 2004 minimum: US$66.6 million; 2004 maximum: US$86.3 million).
Market risk arises in HSBC’s insurance businesses within their portfolios of investments and policyholders’ liabilities. The principal market risks are interest-rate risk and equity risk, which primarily arise when guaranteed investment return policies have been issued. The insurance businesses have a dedicated head office market risk function which oversees management of this risk.
A similar market risk also arises within HSBC’s defined benefit pension schemes to the extent that the obligations of the schemes are not fully matched by assets with determinable cash flows. This risk principally derives from the pension schemes holding equities against their future pension obligations. The risk is that market movements in equity prices could result in assets which are insufficient over time to cover the level of projected liabilities. Management, together with the trustees who act on behalf of the pension scheme beneficiaries, assess the level of this risk using reports prepared by independent external actuaries.
The present value of HSBC’s defined benefit pension plans’ liabilities was US$27.7 billion at 31 December 2005, compared with US$26.5 billion at 31 December 2004. Assets of the defined benefit
schemes at 31 December 2005 comprised: equity investments 46 per cent (54 per cent at 31 December 2004); debt securities 33 per cent (29 per cent at 31 December 2004) and other (including property) 21 per cent (17 per cent at 31 December 2004). (See Note 7 on the Financial Statements).
Net interest income
A principal part of HSBC’s management of market risk in non-trading portfolios is to monitor the sensitivity of projected net interest income under varying interest rate scenarios (simulation modelling). HSBC aims, through its management of market risk in non-trading portfolios, to mitigate the impact of prospective interest rate movements which could reduce future net interest income, whilst balancing the cost of such hedging activities on the current net revenue stream.
For simulation modelling, businesses use a combination of scenarios relevant to local businesses and local markets as well as standard scenarios required to be used across HSBC. The standard scenarios are consolidated to illustrate the combined pro forma impact on HSBC consolidated portfolio valuations and net interest income.
The table below sets out the impact on future net interest income of a 25 basis points parallel fall or rise in all yield curves worldwide at the beginning of each quarter during the 12 month period from 1 January 2006. These scenarios differ from those disclosed in theAnnual Report and Accounts 2004 which assumed an immediate 100 basis points parallel rise or fall in all yield curves on the first day of the 12 month period. The revised scenarios, although still simplified, are considered more relevant.
Assuming no management actions, such a series of incremental parallel rises in all yield curves would decrease planned net interest income for the year to 31 December 2006 by US$525 million, while such a series of incremental parallel falls in all yield curves would increase planned net interest income by US$474 million. These figures incorporate the impact of any option features in the underlying exposures.
Instead of assuming that all interest rates move together, HSBC groups its interest rate exposures into currency blocs whose interest rates are considered likely to move together. The sensitivity of projected net interest income, on this basis, is described as follows:
157
Back to Contents
H S B C H O L D I N G S P L C
FinancialReview(continued)
| | | | Rest of | | Hong Kong | | Rest of | | | | | | | |
| | US dollar | | Americas | | dollar | | Asia | | Sterling | | Euro | | | |
| | bloc | | bloc | | bloc | | bloc | | bloc | | bloc | | Total | |
| | US$m | | US$m | | US$m | | US$m | | US$m | | US$m | | US$m | |
| Change in 2006 projected net | | | | | | | | | | | | | | |
| interest income | | | | | | | | | | | | | | |
| +25 basis points shift in yield curves | | | | | | | | | | | | | | |
| at the beginning of each quarter . | (448 | ) | 74 | | (18 | ) | 28 | | (47 | ) | (114 | ) | (525 | ) |
| -25 basis points shift in yield curves | | | | | | | | | | | | | | |
| at the beginning of each quarter . | 402 | | (72 | ) | 20 | | (39 | ) | 51 | | 112 | | 474 | |
| Change in 2005 projected net | | | | | | | | | | | | | | |
| interest income | | | | | | | | | | | | | | |
| +25 basis points shift in yield curves | | | | | | | | | | | | | | |
| at the beginning of each quarter . | (500 | ) | 81 | | 2 | | 18 | | 62 | | (160 | ) | (497 | ) |
| -25 basis points shift in yield curves | | | | | | | | | | | | | | |
| at the beginning of each quarter . | 637 | | (83 | ) | (104 | ) | (13 | ) | (70 | ) | 157 | | 524 | |
| | | | | | | | | | | | | | | |
The interest rate sensitivities set out in the table above are illustrative only and are based on simplified scenarios. The figures represent the effect of the pro forma movements in net interest income based on the projected yield curve scenarios and the Group’s current interest rate risk profile. This effect, however, does not incorporate actions that would be taken by Global Markets or in the business units to mitigate the impact of this interest rate risk. In reality, Global Markets seeks proactively to change the interest rate risk profile to minimise losses and optimise net revenues. The projections above also assume that interest rates of all maturities move by the same amount and, therefore, do not reflect the potential impact on net interest income of some rates changing while others remain unchanged. The projections also make other simplifying assumptions, including that all positions run to maturity.
The Group’s core exposure to changes in its net interest income arising from movements in interest rates falls into three areas: core deposit franchises, HSBC Finance and Global Markets.
| • | Core deposit franchises: these are exposed to changes in the value of the deposits raised and spreads against wholesale funds; in a low interest rate environment, the value of core deposits increases as interest rates rise and decreases as interest rates fall. This risk is, however, asymmetrical in a very low interest rate environment as there is limited room to lower deposit pricing in the event of interest rate reductions. |
| | |
| • | HSBC Finance provides an offset to the sensitivity effect of interest rate reductions on the core deposit franchises. This arises from having a substantially fixed rate, real estate secured, lending portfolio funded to an extent with interest rate sensitive short-term liabilities. |
| • | Global Markets: the residual interest rate risk is managed within Global Markets. This reflects the Group’s policy of transferring all interest rate risk, other than structural risk, to Global Markets to be managed within defined limits and with flexibility as to the instruments used. |
| | |
| The major drivers of the changes shown in the projected effect of interest rate moves in the above table are set out below. |
| | |
| • | In the US dollar bloc, the rise in interest rates in 2005, coupled with an overall flattening of the yield curve, led the Group to reduce its sensitivity to falling rates, particularly with respect to some retail products with embedded optionality. |
| | |
| • | In Hong Kong, the rise in interest rates during the year improved the sensitivity to falling interest rates as there was more room to lower deposit pricing in the event of falling interest rates. |
| | |
| • | Global Markets decreased its exposure to US dollar, Hong Kong dollar, and euro assets, contributing to the decreased sensitivity in these currencies to both rising and falling rates. |
It can be seen from the above that projecting the movement in net interest income from prospective changes in interest rates is a complex interaction of structural and managed exposures. In a rising rate environment, the most critical exposures are those managed within Global Markets.
Additionally, the Group considers a principal risk to future net interest income to be a general flattening of yield curves at a low level of interest rates, as this reduces the value of the deposit franchise and limits the opportunities within Global Markets.
158
Back to Contents
Following the adoption of IFRSs, HSBC monitors the sensitivity of reported reserves to interest rate movements on a monthly basis by assessing the expected reduction in valuation of available-for-sale portfolios and cash flow hedges
due to parallel movements of plus or minus 100 basis points in all yield curves. The table below describes the sensitivity to these movements at 31 December 2005 and the maximum and minimum month figures during the year then ended:
| | At | | | | | |
| 31 December | Maximum | Minimum |
| 2005 | impact | impact |
| US$m | US$m | US$m |
| | | | | | | |
| + 100 basis point parallel move all in yield curves | (1,918 | ) | (2,655 | ) | (1,918 | ) |
| As a percentage of shareholders’ funds at 31 December 2005 | (2.0% | ) | (2.8% | ) | (2.0% | ) |
| | | | | | | |
| - 100 basis point parallel move all in yield curves | 1,877 | | 2,543 | | 1,877 | |
| As a percentage of shareholders’ funds at 31 December 2005 | 2.0% | | 2.7% | | 2.0% | |
The sensitivities included in the table are illustrative only and are based on simplified scenarios. Moreover, the table shows only those interest rate risk exposures arising in available-for-sale portfolios and from cash flow hedges. These particular exposures form only a part of the Group’s overall interest rate exposures. The accounting treatment under IFRSs of the Group’s remaining interest rate exposures, while economically largely offsetting the exposures shown in the above table, does not require revaluation movements to go to reserves.
Structural foreign exchange exposures
Structural foreign exchange exposures represent net investments in subsidiaries, branches or associated undertakings, the functional currencies of which are currencies other than the US dollar.
Exchange differences on structural exposures are recorded in the consolidated statement of recognised income and expense. The main operating (or functional) currencies in which HSBC’s business is transacted are the US dollar, the Hong Kong dollar, sterling, the euro, the Mexican peso, the Brazilian real and the Chinese renminbi. As the US dollar and currencies linked to it form the dominant currency bloc in which HSBC’s operations transact business, HSBC Holdings prepares its consolidated financial statements in US dollars. HSBC’s consolidated balance sheet is, therefore, affected by exchange differences between the US dollar and all the non-US dollar functional currencies of underlying subsidiaries.
HSBC hedges structural foreign exchange exposures only in limited circumstances. HSBC’s
structural foreign exchange exposures are managed with the primary objective of ensuring, where practical, that HSBC’s consolidated capital ratios, and the capital ratios of individual banking subsidiaries, are protected from the effect of changes in exchange rates. This is usually achieved by ensuring that, for each subsidiary bank, the ratio of structural exposures in a given currency to risk-weighted assets denominated in that currency is broadly equal to the capital ratio of the subsidiary in question.
Selective hedges were in place during 2005. Hedging is undertaken using forward foreign exchange contracts which are accounted for under IFRSs as hedges of a net investment in a foreign operation, or by financing with borrowings in the same currencies as the functional currencies involved. There was no ineffectiveness arising from these hedges in the year ended 31 December 2005.
There was no material effect from exchange differences on HSBC’s capital ratios during the period.
HSBC Holdings(Audited IFRS 7 information)
As a financial services holding company, HSBC Holdings has limited market risk activity. Its activities predominantly involve maintaining sufficient capital resources to support the Group’s diverse activities; allocating these capital resources across the Group’s businesses; earning dividend and interest income on its investments in the Group’s businesses; providing dividend payments to HSBC Holdings’ equity shareholders and interest payments to providers of debt capital; and maintaining a supply of short-term cash resources. It does not take proprietary trading positions.
159
Back to Contents
H S B C H O L D I N G S P L C
FinancialReview(continued)
The objectives of HSBC Holdings’ market risk management are to minimise income statement volatility arising from short-term cash balances and funding positions; to minimise the market risk arising from long-term investments and long-term liabilities; and to protect distributable reserves from the adverse impact of market risk variables.
Market risk for HSBC Holdings is monitored by its ALCO.
The main market risks to which HSBC Holdings is exposed are interest rate risk and foreign currency risk.
HSBC Holdings is exposed to interest rate risk on debt capital investments in, and loans to, subsidiary undertakings; on debt capital issues; and on short-term cash resources.
Following the adoption of IFRSs, certain loans to subsidiary undertakings of a capital nature that are not denominated in the functional currency of either the provider or the recipient are accounted for as financial assets. Changes in the carrying amount of these assets due to exchange differences are taken directly to the income statement. Prior to the adoption of IFRSs, such exchange differences were taken directly to reserves. These loans, and the associated foreign exchange exposures, are eliminated on a Group consolidated basis.
Revaluations due to foreign exchange rate movements of loans to subsidiary undertakings of a capital nature, and which are denominated in the functional currency of either the borrower or the recipient, are taken directly to reserves. Equity investments in subsidiary undertakings are accounted for on a cost basis and are not revalued following movements in exchange rates.
Total VAR arising within HSBC Holdings at 31 December 2005 was as follows:
| | | Foreign | | Interest | | | |
| exchange | rates | Total |
| US$m | US$m | US$m |
| | | | | | | | |
| At 31 December | | | | | | |
| | 2005 | 26.1 | | 36.1 | | 51.4 | |
| | | | | | | |
| At 31 December | | | | | | |
| | 2004 | 24.1 | | 29.4 | | 45.9 | |
| | | | | | | |
| Average | | | | | | |
| | 2005 | 24.0 | | 33.7 | | 48.9 | |
| | 2004 | 21.8 | | 34.2 | | 52.4 | |
| | | | | | | |
| Minimum | | | | | | |
| | 2005 | 22.0 | | 29.6 | | 42.6 | |
| | 2004 | 20.6 | | 22.6 | | 40.3 | |
| | | | | | | |
| Maximum | | | | | | |
| | 2005 | 26.1 | | 45.9 | | 56.6 | |
| | 2004 | 24.1 | | 47.2 | | 68.4 | |
A principal tool in the management of market risk is the projected sensitivity of HSBC Holdings’ net interest income to future changes in yield curves.
(Unaudited information)
The table below sets out the effect on HSBC Holdings’ future net interest income of an incremental 25 basis point parallel fall or rise in all yield curves worldwide at the beginning of each quarter during the 12 month period from 1 January 2006.
Assuming no management action, a series of such rises would decrease HSBC Holdings’ planned net interest income for 2006 by US$7 million while a series of such falls would increase planned net interest income by US$7 million. These figures incorporate the impact of any option features in the underlying exposures.
Unaudited information
| | US dollar | | Sterling | | Euro | | | |
| | bloc | | bloc | | bloc | | Total | |
| | US$m | | US$m | | US$m | | US$m | |
| Change in 2006 projected net interest income | | | | | | | | |
| | | | | | | | | |
| +25 basis points shift in yield curves at the beginning of each quarter | (18 | ) | 5 | | 6 | | (7 | ) |
| –25 basis points shift in yield curves at the beginning of each quarter | 18 | | (5 | ) | (6 | ) | 7 | |
| | | | | | | | | |
| Change in 2005 projected net interest income | | | | | | | | |
| | | | | | | | | |
| +25 basis points shift in yield curves at the beginning of each quarter | (5 | ) | 6 | | 4 | | 5 | |
| –25 basis points shift in yield curves at the beginning of each quarter | 5 | | (6 | ) | (4 | ) | (5 | ) |
HSBC Holdings’ principal exposure to changes in its net interest income from movements in interest rates arises on short-term cash balances, floating rate loans advanced to subsidiary undertakings and fixed rate debt capital securities in issue which have been swapped to floating rate.
The interest rate sensitivities set out in the table above are illustrative only and are based on simplified scenarios. The figures represent the effect of pro forma movements in net interest income based on the projected yield curve scenarios and HSBC Holdings’ current interest rate risk profile. This
160
Back to Contents
effect, however, does not incorporate actions that could be taken to mitigate the effect of this interest rate risk.
HSBC Holdings’ interest rate risk has not changed materially in the year.
| Residual value risk management |
|
| (Audited information) |
A significant part of a lessor’s leasing activities is its management of residual value risk. This arises from operating lease transactions to the extent that the values recovered from disposing of leased assets or re-letting them at the end of the lease terms (the ‘residual values’) differ from those projected at the inception of the leases. The business regularly monitors residual value exposure by reviewing the recoverability of the residual value projected at lease inception. This entails considering the re-lettability and projected disposal proceeds of operating lease assets at the end of their lease terms. Provision is made to the extent that the carrying values of leased assets are impaired through residual values not being fully recoverable.
The net book value of equipment on operating leases includes projected residual values at the end of current lease terms, to be recovered through re-letting or disposal in the following periods:
| | 2005 | | 2004 | |
| | US$m | | US$m | |
| | | | | |
| Within 1 year | 355 | | 172 | |
| Between 1-2 years | – | | 484 | |
| Between 2-5 years | 465 | | 1,042 | |
| More than 5 years | 1,684 | | 2,073 | |
| |
| |
| |
| Total exposure | 2,504 | | 3,771 | |
| |
| |
| |
| |
| Operational risk management |
|
| (Unaudited information) |
Operational risk is the risk of loss arising from fraud, unauthorised activities, error, omission, inefficiency, systems failure or external events. It is inherent in every business organisation and covers a wide spectrum of issues.
HSBC manages this risk through a controls-based environment in which processes are documented, authorisation is independent and transactions are reconciled and monitored. This is supported by an independent programme of periodic reviews undertaken by Internal Audit, and by monitoring external operational risk events, which ensure that HSBC stays in line with best practice and takes account of lessons learned from publicised operational failures within the financial services industry.
HSBC has codified its operational risk management process by issuing a high level standard, supplemented by more detailed formal guidance issued in January 2005. This explains how HSBC manages operational risk by identifying, assessing, monitoring, controlling and mitigating the risk, rectifying operational risk events, and implementing any additional procedures required for compliance with local regulatory requirements. The processes undertaken to manage operational risk are determined by reference to the scale and nature of each HSBC operation. The HSBC standard covers the following:
| • | operational risk management responsibility is assigned to senior management within each business operation; |
| | |
| • | information systems are used to record the identification and assessment of operational risks and to generate appropriate, regular management reporting; |
| | |
| • | assessments are undertaken of the operational risks facing each business and the risks inherent in its processes, activities and products. Risk assessment incorporates a regular review of identified risks to monitor significant changes; |
| | |
| • | operational risk loss data is collected and reported to senior management at the business unit level. Aggregate operational risk losses are recorded and details of incidents above a materiality threshold are reported to Group Head Office. A regular report on operational losses is made to Group Audit Committee and the Risk Management Meeting; and |
| | |
| • | risk mitigation, including insurance, is considered where this is cost-effective. |
In each of HSBC’s subsidiaries, local management is responsible for implementing HSBC standards on operational risk throughout their operations and, where deficiencies are evident, rectifying them within a reasonable timeframe. Subsidiaries acquired by HSBC are required to assess, plan and implement the standard’s requirements within an agreed timescale.
HSBC maintains and tests contingency facilities to support operations in the event of disasters. Additional reviews and tests are conducted in the event that any HSBC office is affected by a business disruption event, to incorporate lessons learned in the operational recovery from those circumstances. HSBC has requested all country managers to prepare plans for the operation of their businesses, with reduced staffing levels, should a flu pandemic occur.
161
Back to Contents
H S B C H O L D I N G S P L C
FinancialReview(continued)
| Reputational risk management |
|
| (Unaudited information) |
The safeguarding of HSBC’s reputation is of paramount importance to its continued prosperity and is the responsibility of every member of staff. Reputational risks can arise from social, ethical or environmental issues, or as a consequence of operational risk events. As a banking group, HSBC’s good reputation depends upon the way in which it conducts its business, but it can also be affected by the way in which clients, to whom it provides financial services, conduct themselves.
Reputational risks are considered and assessed by the Board, the Group Management Board, the Risk Management Meeting, subsidiary company boards, board committees and/or senior management during the formulation of policy and the establishment of HSBC standards. Standards on all major aspects of business are set for HSBC and for individual subsidiaries, businesses and functions. These policies, which are an integral part of the internal control systems, are communicated through manuals and statements of policy and are promulgated through internal communications and training. The policies set out operational procedures in all areas of reputational risk, including money laundering deterrence, environmental impact, anti-corruption measures and employee relations.
Management in all operating entities is required to establish a strong internal control structure to minimise the risk of operational and financial failure, and to ensure that a full appraisal of reputational implications is made before strategic decisions are taken. The Group Internal Audit function monitors compliance with policies and standards.
| Risk management of insurance operations |
|
| (Forms part of the audited financial statements) |
Insurance risk
Within its service proposition, HSBC offers its personal and commercial customers a wide range of insurance products, many of which complement other bank and consumer finance products.
Both life and non-life insurance is underwritten. Underwriting occurs in nine countries through 27 licensed insurers, principally in the UK, Hong Kong, Mexico, Brazil, the US and Argentina.
Life insurance contracts include participating business (with discretionary participation features) such as endowments and pensions, credit life business in respect of income and payment
protection, annuities, term assurance and critical illness covers.
Non-life insurance contracts include motor, fire and other damage, accident, repayment protection and a limited amount of commercial and liability business.
The principal insurance risk faced by HSBC is that the costs of claims combined with acquisition and administration costs may exceed the aggregate amount of premiums received and investment income. HSBC manages its insurance risks through the application of formal underwriting, reinsurance and claims procedures. These procedures are designed also to ensure compliance with regulations.
The Group’s overall approach to insurance risk is to maintain a good diversification of insurance business by type and geography, and to focus on risks that are straightforward to manage and frequently are directly related to the underlying banking activity (for example, with credit life products). The following tables provide an analysis of the insurance risk exposures by geography and by type of business. These tables demonstrate the Group’s diversification of risk and the strong emphasis on personal lines. Personal lines tend to be higher volume and with lower individual value than commercial lines, which further diversifies the risk. Separate tables are provided for life and non-life business, reflecting their very distinct risk characteristics. Life business tends to be longer term than non-life and also frequently involves an element of savings and investment in the premium. For this reason, the life insurance risk table provides an analysis of the insurance liabilities as the best available overall measure of the insurance exposure. By contrast for non-life business, the table uses written premium as representing the best available measure of risk exposure.
Both life and non-life business insurance risks are controlled through a combination of local and central procedures and policies. These include a centralised approach to the authorisation to write certain classes of business, with restrictions applying particularly to commercial and liability non-life business. For life business in particular, use is also made of ALCOs in order to monitor the risk exposures. Market risk limits are also applied centrally as an additional control over the extent of insurance risk that is retained.
As indicated in the specific comments relating to particular classes, use is also made of reinsurance as a means of further mitigating exposure, in particular to aggregations as a result of catastrophe risk.
162
Back to Contents
Analysis of insurance risk
The insurance risk is illustrated by an analysis of business by type of contract and geographic location.
Analysis of life insurance risk – policyholder liabilities
| | | | | | Rest of | | | | | | | |
| Hong | Asia- | North | South |
| Europe | Kong | Pacific | America | America | Total |
| US$m | US$m | US$m | US$m | US$m | US$m |
| | | | | | | | | | | | | |
| Life (non-linked) | | | | | | | | | | | | |
| | Insurance contracts with DPF1 | 155 | | 3,886 | | 152 | | – | | – | | 4,193 | |
| | Credit life | 156 | | – | | – | | 196 | | – | | 352 | |
| | Annuities | 202 | | – | | 22 | | 1,651 | | 515 | | 2,390 | |
| | Term assurance and other long-term contracts | 1,063 | | 68 | | 82 | | 51 | | 170 | | 1,434 | |
| |
| |
| |
| |
| |
| |
| |
| Total life (non-linked) | 1,576 | | 3,954 | | 256 | | 1,898 | | 685 | | 8,369 | |
| Life (linked) | 1,201 | | 536 | | 332 | | – | | 826 | | 2,895 | |
Investment contracts with DPF1 | – | | – | | 9 | | – | | – | | 9 | |
| |
| |
| |
| |
| |
| |
| |
| Life insurance policyholders’ liabilities | 2,777 | | 4,490 | | 597 | | 1,898 | | 1,511 | | 11,273 | |
| |
| |
| |
| |
| |
| |
| |
| | |
| 1 | Insurance contracts and investment contracts with discretionary participation features (‘DPF’) give policyholders a contractual right to receive, as a supplement to their guaranteed benefits, additional benefits that are likely to be a significant portion of the total contractual benefits and whose amount or timing is contractually at the discretion of HSBC. The additional benefits are contractually based on the performance of a specified pool of contracts or assets, or the profit of the company issuing the contracts. |
The above table of life insurance policyholder liabilities provides an overall summary of the life insurance activity across the Group. For life insurance business, the insurance risk will vary considerably depending on the type of business. The principal risks are in relation to mortality, morbidity, lapse and surrender, investment (market) and expense levels. As indicated above, the geographic and product diversity of HSBC’s life insurance business provides an effective mitigation of exposure to insurance risk. This is in addition to the local underwriting, claims handling and expense control management functions.
In general terms, mortality and morbidity risks are mitigated through medical underwriting and the ability in a number of cases to amend the premium in the light of changes in experience. Lapse and surrender risks are mitigated by the setting of appropriate surrender values. Market risk is usually mitigated through a combination of investment policy to match liabilities and the risk being shared with policyholders. In the case of unit-linked business, market risk is generally borne by policyholders. In the case of life business with a discretionary participation feature, the risk is shared with policyholders through the management of bonuses.
The principal division of life business is between unit linked and non-linked. There are a number of major sub-categories of non-linked life assurance.
Insurance contracts with discretionary participation features include with-profits business. The largest portfolio is in Hong Kong. This is a book of endowment life policies, with annual bonuses awarded to policyholders. Althoughprima facie this business entails significant market risk, this is managed in conjunction with other risks through the investment policy and adjustment to bonus rates. In practice this means that the majority of the market risk is borne by policyholders. The main risk associated with this product is the value of assigned assets falling below that required to support benefit payments. HSBC manages this risk by conducting regular actuarial investigations on the supportability of the bonus rates.
Credit life insurance business is written in relation to the banking and finance products. The insurance risk relates to mortality and morbidity risk for the duration of the loans advanced. Claims experience is continuously monitored and premium rates adjusted accordingly. For much of this business, the average term of the credit risk exposure is for two to three years, which limits the insurance risk exposure.
163
Back to Contents
H S B C H O L D I N G S P L C
FinancialReview(continued)
Annuities are contracts providing income from capital investment paid in a stream of regular payments for either a fixed period or during the annuitant’s lifetime. Deferred annuities are those whose payments to the annuitant begin at a designated future date as opposed to immediate annuities where payments begin at once. The principal risks in respect of annuity business relate to mortality and market risk in relation to the need to match investments against the anticipated cash flow profile of the policies. HSBC has a number of annuity books, some of which have been in run-off for several years. The majority of the annuity book is composed of contracts with a duration of no longer than five years. Investments are managed to match the anticipated cash flow profile, and the mortality risk is regularly monitored. HSBC has annuity business in the US, Mexico, Cayman Islands and Argentina.
The major component of the ‘Term assurance and other long-term contracts’ category is term assurance and critical illness policies written in the UK. The principal risks are in respect of mortality and morbidity, and are mitigated through a combination of underwriting practices, premium adjustment in light of changes in experience and reinsurance.
For linked insurance business, market risk is usually borne by policyholders. The principal risk retained by HSBC relates to expenses, although mortality, disability and morbidity risks are also associated with this product and are managed through the application of the techniques set out above for non-linked lines of business.
| Analysis of non-life insurance risk – net written insurance premiums1 | | | | | | | |
| | | | | | Rest of | | | | | | | |
| | | | Hong- | | Asia- | | North | | South | | | |
| | Europe | | Kong | | Pacific | | America | | America | | Total | |
| | US$m | | US$m | | US$m | | US$m | | US$m | | US$m | |
| | | | | | | | | | | | | |
| Accident and health | 33 | | 67 | | 3 | | 8 | | 1 | | 112 | |
| Motor | 192 | | 20 | | 11 | | 47 | | 259 | | 529 | |
| Fire and other damage | 251 | | 34 | | 3 | | 8 | | 58 | | 354 | |
| Liability | 229 | | 17 | | 2 | | 90 | | 15 | | 353 | |
| Credit (non-life) | 225 | | – | | – | | 202 | | – | | 427 | |
Marine, aviation
and transport | – | | 16 | | 4 | | – | | 22 | | 42 | |
Other non-life insurance
contracts | 10 | | 29 | | – | | 17 | | 12 | | 68 | |
| |
| |
| |
| |
| |
| |
| |
Total net written insurance
premiums | 940 | | 183 | | 23 | | 372 | | 367 | | 1,885 | |
| |
| |
| |
| |
| |
| |
| |
| | |
| 1 | Net written insurance premiums represent gross written premiums less gross written premiums ceded to reinsurers. |
Non-life insurance contracts include liability and property insurance. However, only a small proportion of HSBC’s non-life insurance portfolio is liability insurance which is in general underwritten as part of a product business proposal. The key risks associated with non-life business are underwriting risk and claims experience risk. Underwriting risk is the risk that HSBC does not charge premiums appropriate for the cover provided and claims experience risk is the risk that portfolio experience is worse than expected. HSBC manages these risks through prudent pricing (for example, imposing restrictions and deductibles in the policy terms and conditions), product design, risk selection, claims handling, investment strategy and reinsurance policy. All non-life insurance contracts are annually renewable and the underwriters have the right to
refuse renewal or to change the terms and conditions of the contract at renewal.
HSBC underwrites non-life insurance business in Ireland, the UK, Hong Kong, Argentina, the US, Mexico and Singapore.
Accident and health insurance business is underwritten in all major markets with the largest portfolio being Hong Kong. Potential accumulations of personal accident risks are mitigated by the purchase of catastrophe reinsurance.
Motor insurance business covers vehicle damage and liability for personal injury. It includes a large portfolio underwritten in Brazil for US$105 million, which was disposed of during 2005. Other significant portfolios are written in the
164
Back to Contents
UK, Mexico and Argentina. Reinsurance protection has been arranged where necessary to avoid excessive exposure to larger losses, particularly those relating to personal injury claims.
Fire and other damage business is written in all major markets, most significantly in Europe. The predominant focus in most markets is insurance for homes and contents while covers for selected commercial customers are largely written in Asian and South American markets. All portfolios at risk from catastrophic losses are protected by reinsurance in accordance with information obtained from professional risk-modelling organisations.
A very limited portfolio of liability business is written in major markets.
Following the disposal of the non-life insurance portfolio in Brazil, credit non-life business now represents the largest single class and is concentrated in the US and the UK. This business is written in relation to the banking and finance products.
Present value of in-force long-term insurance business (‘PVIF’)
The HSBC life insurance business is accounted for using the embedded value approach, which,inter alia, provides a comprehensive framework for the evaluation of insurance and related risks. The present value of the shareholders’ interest in the profits expected to emerge from the book of in-force policies at 31 December 2005 can be stress-tested to assess the ability of the book of life business to withstand adverse developments. A key feature of life insurance business is the importance of managing the assets, liabilities and risks in a coordinated fashion rather than individually. This reflects the greater interdependence of these three elements for life insurance than is generally the case for non-life insurance.
The following table shows the effect on the PVIF as at 31 December 2005 of reasonably possible changes in the main economic assumptions across all insurance underwriting subsidiaries:
| | PVIF | |
| | US$m | |
| | | |
| + 100 basis points shift in risk-free rate | 90 | |
| – 100 basis points shift in risk-free rate | (100 | ) |
| + 100 basis points shift in risk discount rate | (54 | ) |
| – 100 basis points shift in risk discount rate | 57 | |
| + 100 basis points shift in expenses inflation | (8 | ) |
| – 100 basis points shift in expenses inflation | 7 | |
| + 100 basis points shift in lapse rate | 47 | |
| – 100 basis points shift in lapse rate | (49 | ) |
The effects on PVIF shown above are illustrative only and employ simplified scenarios. They do not incorporate actions that could be taken by management to mitigate effects nor do they take account of consequential changes in policyholder behaviour.
General economic and business assumptions
The sensitivity of profit for the year to, and net assets at, 31 December 2005 to reasonably possible changes in conditions at 31 December 2005 across all insurance underwriting subsidiaries is as follows:
| | Impact on: | |
| |
| |
| | Profit for | | Net | |
| | the year | | assets | |
| | US$m | | US$m | |
| Economic assumptions | | | | |
| 20 per cent increase in claims costs | (82 | ) | (78 | ) |
| 20 per cent decrease in claims costs | 81 | | 78 | |
| | | | | |
| Non-economic assumptions | | | | |
| 10 per cent increase in mortality and/or morbidity rates | (8 | ) | (9 | ) |
| 10 per cent decrease in mortality and/or morbidity rates | 18 | | 18 | |
| 50 per cent increase in lapse rates | (17 | ) | (14 | ) |
| 50 per cent decrease in lapse rates | 56 | | 51 | |
| 10 per cent increase in expense rates | (20 | ) | (20 | ) |
| 10 per cent decrease in expense rates | 19 | | 19 | |
165
Back to Contents
H S B C H O L D I N G S P L C
FinancialReview(continued)
A key aspect of the risk management for insurance business, and life insurance in particular, is the need actively to manage the assets in relation to the liabilities. Of particular importance for a number of lines of business is the need to match the expected pattern of cash flow, which in some cases (such as annuities) can run for many years. The following table shows the overall disposition of assets and liabilities and demonstrates that there is an
appropriate level of matching. It is generally not possible to achieve a complete matching of asset and liability duration. This is partly because with annual premium contracts there are uncertain future cash flows yet to be received from policyholders and partly because the duration of some liability cash flows exceeds the duration of the longest available dated fixed interest investments.
| | | | | | | | | | | | Investment | | | | | |
| | | Insurance contracts | contracts | | | | | |
| | |
| |
| | | | | |
| | | | | | | | | Term | | | | | | | | | | | |
| | | | | | | | | assurance | | | | | | | | | | | |
| | | Contracts | | | | | | and other | | | | | | | | | | | |
| | | with | | Unit- | | | | long-term | | | | Unit- | | | | Other | | | |
| | | DPF1 | | linked | | Annuities | | contracts2 | | Non-life | | linked | | Other | | Assets3 | | Total | |
| | | US$m | | US$m | | US$m | | US$m | | US$m | | US$m | | US$m | | US$m | | US$m | |
| Financial assets: | | | | | | | | | | | | | | | | | | |
| – | trading assets | – | | – | | – | | 49 | | 58 | | – | | – | | 170 | | 277 | |
| – | financial assets | | | | | | | | | | | | | | | | | | |
| | designated at fair | | | | | | | | | | | | | | | | | | |
| | value | 1,005 | | 2,132 | | 52 | | 947 | | 14 | | 6,995 | | 1,415 | | 1,488 | | 14,048 | |
| – | derivatives | 57 | | 426 | | – | | – | | – | | 1 | | 4 | | – | | 488 | |
| – | financial investments | 2,581 | | – | | 1,272 | | 339 | | 1,230 | | – | | 1,527 | | 1,896 | | 8,845 | |
| – | other assets | 635 | | 268 | | 828 | | 182 | | 619 | | 174 | | 376 | | 1,098 | | 4,180 | |
| |
| |
| |
| |
| |
| |
| |
| |
| |
| |
| Total financial assets | 4,278 | | 2,826 | | 2,152 | | 1,517 | | 1,921 | | 7,170 | | 3,322 | | 4,652 | | 27,838 | |
| Reinsurance assets | 2 | | 69 | | 193 | | 612 | | 669 | | – | | – | | 40 | | 1,585 | |
| PVIF | – | | – | | – | | – | | – | | – | | – | | 1,400 | | 1,400 | |
| Other assets | 18 | | 9 | | 45 | | 33 | | 329 | | 1 | | – | | 760 | | 1,195 | |
| |
| |
| |
| |
| |
| |
| |
| |
| |
| |
| Total assets | 4,298 | | 2,904 | | 2,390 | | 2,162 | | 2,919 | | 7,171 | | 3,322 | | 6,852 | | 32,018 | |
| |
| |
| |
| |
| |
| |
| |
| |
| |
| |
| Financial liabilities | | | | | | | | | | | | | | | | | | |
| designated at fair value . | – | | – | | – | | – | | – | | 7,156 | | 3,289 | | – | | 10,445 | |
| Liabilities under insurance | | | | | | | | | | | | | | | | | | |
| contracts issued | 4,193 | | 2,895 | | 2,390 | | 1,786 | | 2,871 | | – | | 9 | | – | | 14,144 | |
| Deferred tax | – | | – | | – | | – | | – | | – | | – | | 322 | | 322 | |
| Other liabilities | – | | – | | – | | – | | – | | – | | – | | 2,125 | | 2,125 | |
| |
| |
| |
| |
| |
| |
| |
| |
| |
| |
| Total liabilities | 4,193 | | 2,895 | | 2,390 | | 1,786 | | 2,871 | | 7,156 | | 3,298 | | 2,447 | | 27,036 | |
| Shareholders’ equity | – | | – | | – | | – | | – | | – | | – | | 4,982 | | 4,982 | |
| |
| |
| |
| |
| |
| |
| |
| |
| |
| |
| Total liabilities and | | | | | | | | | | | | | | | | | | |
| shareholders’ equity4 | 4,193 | | 2,895 | | 2,390 | | 1,786 | | 2,871 | | 7,156 | | 3,298 | | 7,429 | | 32,018 | |
| |
| |
| |
| |
| |
| |
| |
| |
| |
| |
| | |
| 1 | Discretionary participation features. |
| 2 | Includes credit life insurance. |
| 3 | Other assets comprise solvency and unencumbered assets. |
| 4 | Excludes assets, liabilities and shareholders’ funds of associate insurance companies Erisa S.A. and Ping An Insurance. |
166
Back to Contents
The balance sheet of insurance underwriting operations by geographical region at 31 December 2005 was as follows:
| | | | | | Rest of Asia- | | North | | South | | | |
| | Europe | | Hong Kong | | Pacific | | America | | America | | Total | |
| | US$m | | US$m | | US$m | | US$m | | US$m | | US$m | |
| Financial assets: | | | | | | | | | | | | |
| – | trading assets | – | | – | | – | | 277 | | – | | 277 | |
| – | financial assets designated at fair | | | | | | | | | | | | |
| | value | 9,276 | | 3,164 | | 545 | | – | | 1,063 | | 14,048 | |
| – | derivatives | 386 | | 102 | | – | | – | | – | | 488 | |
| – | financial investments | 1,053 | | 4,429 | | 60 | | 2,962 | | 341 | | 8,845 | |
| – | other assets | 886 | | 1,512 | | 157 | | 1,142 | | 483 | | 4,180 | |
| |
| |
| |
| |
| |
| |
| |
| Total financial assets | 11,601 | | 9,207 | | 762 | | 4,381 | | 1,887 | | 27,838 | |
| |
| |
| |
| |
| |
| |
| |
| Reinsurance assets | 1,293 | | 48 | | 24 | | 153 | | 67 | | 1,585 | |
| PVIF | 796 | | 557 | | 47 | | – | | – | | 1,400 | |
| Other assets | 307 | | 64 | | 19 | | 306 | | 499 | | 1,195 | |
| |
| |
| |
| |
| |
| |
| |
| Total assets | 13,997 | | 9,876 | | 852 | | 4,840 | | 2,453 | | 32,018 | |
| |
| |
| |
| |
| |
| |
| |
| Financial liabilities designated at fair | | | | | | | | | | | | |
| value | 6,375 | | 3,874 | | 42 | | – | | 154 | | 10,445 | |
| Liabilities under insurance contracts | | | | | | | | | | | | |
| issued | 4,284 | | 4,724 | | 655 | | 2,787 | | 1,694 | | 14,144 | |
| Deferred tax | 237 | | 83 | | 9 | | (17 | ) | 10 | | 322 | |
| Other liabilities | 1,374 | | 123 | | 21 | | 395 | | 212 | | 2,125 | |
| |
| |
| |
| |
| |
| |
| |
| Total liabilities | 12,270 | | 8,804 | | 727 | | 3,165 | | 2,070 | | 27,036 | |
| Shareholders’ equity | 1,727 | | 1,072 | | 125 | | 1,675 | | 383 | | 4,982 | |
| |
| |
| |
| |
| |
| |
| |
| Total liabilities and shareholders’ | | | | | | | | | | | | |
| equity1 | 13,997 | | 9,876 | | 852 | | 4,840 | | 2,453 | | 32,018 | |
| | |
| |
| |
| |
| |
| |
| |
| |
| 1 | Excludes assets, liabilities and shareholders’ funds of associate insurance companies Erisa S.A. and Ping An Insurance. |
Financial risks
HSBC’s insurance businesses are exposed to a range of financial risks, including market risk, credit risk and liquidity risk. The nature and management of these risks is described below.
Underwriting subsidiaries incur financial risk, for example, when the proceeds from financial assets are not sufficient to fund the obligations arising from insurance and investment contracts. Other non-underwriting insurance-related activities undertaken by HSBC subsidiaries such as insurance broking; insurance management (including captive management); and insurance, pensions and annuities administration and intermediation are exposed to financial risk but not to a significant extent.
The insurance underwriting subsidiaries have developed their own risk management policies appropriate for the business. Where applicable they also comply with HSBC’s banking risk management procedures. However, in some cases, such as the use of one day VAR measures, these are not appropriate for insurance and, therefore, not applied.
The majority of HSBC’s insurance underwriting subsidiaries are owned and primarily managed by local banking subsidiaries. Their activities are subject to a variety of locally applied controls and to external regulatory monitoring. Centralised insurance management, including risk and capital management, is relatively limited in scope, acting primarily as an additional level of control. In many jurisdictions, local regulatory requirements prescribe the type, quality and concentration of assets that HSBC’s insurance underwriting subsidiaries must maintain in local currency to meet local insurance liabilities. Within each subsidiary, ALCOs are responsible for the management of financial risks within local requirements and ensure compliance with the control framework and risk appetite established centrally.
The following table analyses the assets held in HSBC’s insurance underwriting subsidiaries at 31 December 2005 by type of liability against which the assets are held, and provides an overall framework for considering exposure to financial risk:
167
Back to Contents
H S B C H O L D I N G S P L C
FinancialReview(continued)
| | Life linked | | Life non-linked | | Non-life | | | | | |
| | insurance1 | | insurance2 | | insurance3 | | Other assets4 | | Total5 | |
| | US$m | | US$m | | US$m | | US$m | | US$m | |
| Trading assets | | | | | | | | | | |
| Treasury bills | – | | – | | 21 | | 103 | | 124 | |
| Debt securities | – | | 49 | | 37 | | 67 | | 153 | |
| |
| |
| |
| |
| |
| |
| | – | | 49 | | 58 | | 170 | | 277 | |
| |
| |
| |
| |
| |
| |
| Financial assets designated | | | | | | | | | | |
| at fair value | | | | | | | | | | |
| Treasury bills | 9 | | 26 | | – | | 17 | | 52 | |
| Debt securities | 2,374 | | 2,118 | | 4 | | 745 | | 5,241 | |
| Equity securities | 6,744 | | 1,275 | | 10 | | 726 | | 8,755 | |
| |
| |
| |
| |
| |
| |
| | 9,127 | | 3,419 | | 14 | | 1,488 | | 14,048 | |
| |
| |
| |
| |
| |
| |
| Financial investments | | | | | | | | | | |
| Held-to-maturity: | | | | | | | | | | |
| Debt securities | – | | 4,603 | | 157 | | 226 | | 4,986 | |
| |
| |
| |
| |
| |
| |
| | – | | 4,603 | | 157 | | 226 | | 4,986 | |
| |
| |
| |
| |
| |
| |
| Available-for-sale: | | | | | | | | | | |
| Treasury bills | – | | – | | 70 | | 101 | | 171 | |
| Other eligible bills | – | | – | | 447 | | 116 | | 563 | |
| Debt securities | – | | 1,116 | | 556 | | 1,437 | | 3,109 | |
| Equity securities | – | | – | | – | | 16 | | 16 | |
| |
| |
| |
| |
| |
| |
| | – | | 1,116 | | 1,073 | | 1,670 | | 3,859 | |
| |
| |
| |
| |
| |
| |
| | 9,127 | | 9,187 | | 1,302 | | 3,554 | | 23,170 | |
| |
| |
| |
| |
| |
| |
| | |
| 1 | Comprises life linked insurance contracts, linked long-term investment contracts and investment contracts with discretionary participation features. |
| 2 | Comprises life non-linked insurance contracts and non-linked long-term investment contracts. |
| 3 | Comprises non-life insurance contracts. |
| 4 | Comprises solvency and unencumbered assets. |
| 5 | Excludes financial assets of insurance underwriting associates, Erisa, S.A. and Ping An Insurance. |
Under linked insurance and investment contracts, premium income less charges levied is invested in unit-linked funds. HSBC manages the financial risk of this product by holding appropriate assets in funds or portfolios to which the liabilities are linked. This generally transfers the financial risk to the policyholder. The assets held to support unit-linked liabilities represent 35.9 per cent of the total financial assets of HSBC’s insurance underwriting subsidiaries at the reporting date.
Market risk
Interest rate risk
HSBC’s insurance underwriting subsidiaries are exposed to interest rate risk when there is a mismatch in terms of duration or yields between the assets and liabilities. Examples of interest rate risk exposure are as follows:
| • | lower market interest rates result in lower yieldson the assets supporting guaranteed investmentreturns payable to policyholders; and |
| | |
| • | higher market interest rates result in a reductionof the value of the fixed income securitiesportfolio which may result in losses if, as aresult of an increase of the level of surrenders, |
| | the corresponding fixed income securities have to be sold. |
HSBC manages the interest rate risk arising from its insurance underwriting subsidiaries by establishing limits centrally. These govern the sensitivity of the net present values of expected cash flows from subsidiaries’ assets and liabilities to a one basis point parallel upward shift in the discount curve used to calculate values. Adherence to these limits is monitored by local ALCOs.
Interest rate risk is also assessed by measuring the impact of defined movements in interest yield curves on the profits after tax and net assets of the insurance underwriting subsidiaries. An immediate and permanent movement in interest yield curves as at 31 December 2005 in all territories in which HSBC’s insurance subsidiaries operate would have the following impact on the profit for the year and net assets at that date:
| | Profit for | | | |
| | the year | | Net assets | |
| | US$m | | US$m | |
| | | | | |
| + 100 basis points shift in | | | | |
| yield curves | (46 | ) | (122 | ) |
| – 100 basis points shift in | | | | |
| yield curves | 63 | | 181 | |
168
Back to Contents
The interest rate sensitivities set out above are illustrative only and employ simplified scenarios. They are based on US$8,068 million of interest-bearing securities held by insurance underwriting subsidiaries at 31 December 2005 and US$3,350 million of insurance liabilities under insurance contracts and long-term investment contracts issued. The sensitivities do not incorporate actions that could be taken by management to mitigate the effect of the interest rate movements, nor do they take account of consequential changes in policyholder behaviour.
The majority of interest rate exposure arises within insurance underwriting subsidiaries in the UK, the US and Hong Kong.
HSBC’s insurance underwriting subsidiaries are also exposed to the risk that the yield on assets held may fall short of the return guaranteed on certain contracts issued to policyholders. This investment return guarantee risk is managed by matching assets held to liability requirements. In addition, a provision is established when analysis indicates that, over the life of the contracts, the returns from the designated assets may not be adequate to cover the related liabilities.
The guarantees offered to policyholders in respect of certain insurance products are divided into broad categories as follows:
| • | annuities in payment; |
| | |
| • | deferred annuities: these consist of two phases –the savings and investing phase, and theretirement income phase; |
| | |
| • | annual return: the investment return credited tothe policyholder every year (referred to as a‘hard’ guarantee), or the average annualinvestment return credited to the policyholderover the life of the policy to its maturity orsurrender (referred to as a ‘soft’ guarantee) isguaranteed to be no lower than a specified rate; |
| | |
| • | capital: policyholders are guaranteed to receiveback no less than the premiums paid lessexpenses, or a cash payment or series of cashpayments whose amounts are at least equal tothose defined within the policy; and |
| | |
| • | market performance: policyholders receive aninvestment return which is guaranteed to bewithin a prescribed range of average investmentreturns earned by predetermined marketparticipants on the specified product. |
The table below shows, in respect of each category of guarantee, the total reserves established for guaranteed products, the range of investment returns implied by the guarantees, and the range of current yields of the investment portfolios supporting the guarantees.
| | | Investment | |
| | | returns implied | |
| | Reserve | by guarantee1 | Current yields |
| | US$m | % | % |
| | | | |
| Annuities in payment | 1,063 | 0.0 – 4.2% | 4.0 – 13.0% |
| Deferred annuities | 408 | 0.0 – 6.0% | 6.1 – 8.6% |
| Deferred annuities | 674 | 6.0 – 9.0% | 5.7% |
| Annual return | 4,362 | 0.0 – 3.0% | 3.5 – 5.6% |
| Annual return | 581 | 3.0 – 6.0% | 3.5 – 11.5 % |
| Capital | 1,168 | 0.0% | 2.9 – 5.6 % |
| Market performance2 | 2,938 | n/a | n/a |
| | |
| 1 | The above table excludes guarantees from associate insurance companies Erisa, S.A. and Ping An Insurance. |
| 2 | There is no specific investment return implied by market performance guarantees because the guarantees are expressed as lying within prescribed ranges of average market returns. |
The Group manages the annuities, annual return and capital guarantees by seeking to match the exposure predominantly with bonds which are producing a return at least equal to the investment return implied by the guarantee. Provision is made for any anticipated shortfall, generally calculated by recourse to stress testing of the likely outcomes.
The main risk arising from these guarantees is reinvestment risk, which arises primarily when the duration of the policy extends beyond the maturity
dates of the bonds. Future reinvestment yields may be less than the investment rates implied by the guarantee.
A certain number of these products have been discontinued to new business; this includes the deferred annuity portfolio in HSBC Finance, where the current portfolio yield is less than the guarantee and highlighted in the above table. For this block of business, a purchase accounting reserve was made at the time of the acquisition of HSBC Finance to mitigate the impact of the disparity in yields. In
169
Back to Contents
H S B C H O L D I N G S P L C
FinancialReview(continued)
addition, in the UK there is an annuity portfolio where the risk is fully reinsured.
For market performance guarantee business in the table above, the Group seeks to match the composition of the investment portfolio with the composition of the average investment portfolio of the other market participants. These are published by the regulator monthly. Reserves have also been established to cover any potential shortfall although, since inception, they have never been called upon.
Equity riskHSBC manages the equity risk arising from its holdings of equity securities centrally by setting limits on the maximum market value of equities that each insurance underwriting subsidiary may hold. Equity risk is also monitored by estimating the effect of predetermined movements in equity prices on the profit and total net assets of the insurance underwriting subsidiaries.
The following table illustrates the impact on the aggregated profit for the year and net assets of a reasonably possible 10 per cent variance in equity prices:
| | Profit for | | | |
| | the year | | Net assets | |
| | US$m | | US$m | |
| | | | | |
| 10 per cent increase in | | | | |
| equity prices | 61 | | 62 | |
| 10 per cent decrease in | | | | |
| equity prices | (45 | ) | (46 | ) |
These equity sensitivities are illustrative only and employ simplified scenarios. They are based on US$6,753 million of marketable equity securities held by insurance underwriting subsidiaries at 31 December 2005, and US$6,137 million of liabilities under insurance contracts and long-term investment contracts issued. They do not allow for any management actions to mitigate the effects of the equity price decline, nor for any consequential changes, such as in policyholder behaviour, that could accompany such a fall.
Foreign exchange riskHSBC’s insurance underwriting subsidiaries are exposed to this risk when the assets supporting insurance liabilities are denominated in currencies other than the currencies of the liabilities.
HSBC manages the foreign exchange risk arising from its insurance underwriting subsidiaries centrally, by establishing limits on the net positions
by currency and the total net short position that each insurance subsidiary may hold. The risk is also monitored by tracking the effect of predetermined exchange differences on the total profit and net assets of the insurance underwriting subsidiaries.
The following table illustrates the impact on the aggregated profit for the year and net assets of a reasonably possible 10 per cent variance in the US dollar exchange rate:
| | Profit | | | |
| | for the | | Net | |
| | year | | assets | |
| | US$m | | US$m | |
| | | | | |
| 10 per cent increase in | | | | |
| US dollar exchange rate | 5 | | 5 | |
| 10 per cent decrease in | | | | |
| US dollar exchange rate | (5 | ) | (5 | ) |
These sensitivities to movements in the US dollar are for illustrative purposes only and employ simplified scenarios applied to local US dollar positions only. They are based on US$1,444 million of liabilitiesunder insurance contracts and long-term investment contracts andUS$1,505 million of assets denominated in US dollars. They do not allow for actions that could be taken by management to mitigate the effect of exchange differences, nor for any consequential changes in policyholder behaviour.
Credit riskHSBC’s insurance underwriting subsidiaries are exposed to credit risk in respect of their investment portfolios and their reinsurance transactions.
Local management of HSBC’s underwriting insurance subsidiaries is responsible for the quality and performance of the investment portfolios. Investment guidelines are set at Group level. Local ALCOs set investment parameters appropriate to the local environment within the framework of the Group guidelines and review investment performance and compliance with the guidelines. Assessment of the creditworthiness of issuers and counterparties is based primarily upon internationally recognised credit ratings and other publicly available information. In addition, to reduce the impact of individual entity or industry sector failures, centrally determined issuer and industry sector concentration limits are complied with.
Investment credit exposures are aggregated and reported to HSBC’s Group Credit and Risk function on a quarterly basis.
170
Back to Contents
Rating agency designation
The following table presents the analysis of treasury bills, other eligible bills and debt securities within HSBC’s insurance business by rating agency designation at 31 December 2005 based on Standard and Poor’s ratings or equivalent:
| | Treasury | | Other eligible | | Debt | | | |
| | bills | | bills | | securities | | Total | |
| | US$m | | US$m | | US$m | | US$m | |
| | | | | | | | | |
| Supporting liabilities under non-linked insurance | | | | | | | | |
| contracts | | | | | | | | |
| AAA | 117 | | 224 | | 3,367 | | 3,708 | |
| AA– to AA+ | – | | 223 | | 3,372 | | 3,595 | |
| A– to A+ | – | | – | | 1,459 | | 1,459 | |
| Lower than A– | – | | – | | 382 | | 382 | |
| Unrated | – | | – | | 60 | | 60 | |
| |
| |
| |
| |
| |
| | 117 | | 447 | | 8,640 | | 9,204 | |
| |
| |
| |
| |
| |
| Supporting shareholder’s funds | | | | | | | | |
| AAA | 221 | | 109 | | 892 | | 1,222 | |
| AA– to AA+ | – | | 7 | | 606 | | 613 | |
| A– to A+ | – | | – | | 787 | | 787 | |
| Lower than A– | – | | – | | 183 | | 183 | |
| Unrated | – | | – | | 7 | | 7 | |
| |
| |
| |
| |
| |
| | 221 | | 116 | | 2,475 | | 2,812 | |
| |
| |
| |
| |
| |
| Total1 | | | | | | | | |
| AAA | 338 | | 333 | | 4,259 | | 4,930 | |
| AA– to AA+ | – | | 230 | | 3,978 | | 4,208 | |
| A– to A+ | – | | – | | 2,246 | | 2,246 | |
| Lower than A– | – | | – | | 565 | | 565 | |
| Unrated | – | | – | | 67 | | 67 | |
| |
| |
| |
| |
| |
| | 338 | | 563 | | 11,115 | | 12,016 | |
| |
| |
| |
| |
| |
| | | | | | | | | |
| Of which issued by: | | | | | | | | |
| – government | 338 | | – | | 2,224 | | 2,562 | |
| – local authorities | – | | – | | 76 | | 76 | |
| – corporates | – | | – | | 8,424 | | 8,424 | |
| – other | – | | 563 | | 391 | | 954 | |
| | | | | | | | | |
| Of which classified as: | | | | | | | | |
| – trading assets | 124 | | – | | 153 | | 277 | |
| – financial instruments designated at fair value | 43 | | – | | 2,867 | | 2,910 | |
| – available-for-sale securities | 171 | | 563 | | 3,109 | | 3,843 | |
| – held-to-maturity investments | – | | – | | 4,986 | | 4,986 | |
| | |
| 1 | Excludes treasury bills, other eligible bills and debt securities held by insurance underwriting associates Erisa, S.A. and Ping An Insurance. |
171
Back to Contents
H S B C H O L D I N G S P L C
FinancialReview(continued)
Credit risk also arises when part of the insurancerisk incurred by HSBC is assumed by reinsurers. HSBC’s Reinsurance Security Committeeestablishes the minimum security criteria for acceptable reinsurance and monitors the purchase ofreinsurance against these criteria.
At 31 December 2005, the split of liabilities ceded toreinsurers and outstanding reinsurance recoveries,analysed by Standard and Poor’s reinsurance credit ratingdata or their equivalent, was as follows:
| | Reinsurers’ share of liabilities under | | | |
| | insurance contracts | | | |
| |
| | | |
| | Linked | | Non-linked | | | | | |
| | insurance | | insurance | | | | Reinsurance | |
| | contracts | | contracts | | Total | | debtors | |
| | US$m | | US$m | | US$m | | US$m | |
| | | | | | | | | |
| AAA | 7 | | 61 | | 68 | | – | |
| AA– to AA | 29 | | 735 | | 764 | | 5 | |
| A– to A+ | 8 | | 536 | | 544 | | 27 | |
| Lower than A– | 25 | | 68 | | 93 | | 2 | |
| Unrated | – | | 76 | | 76 | | 6 | |
| |
| |
| |
| |
| |
| Total1 | 69 | | 1,476 | | 1,545 | | 40 | |
| |
| |
| |
| |
| |
| | |
| 1 | Excludes reinsurers’ share of liabilities under insurance contracts and reinsurance debtors of insurance underwriting associates Erisa, S.A. and Ping An Insurance. |
Liquidity risk
It is an inherent characteristic of almost all insurance contracts that there is uncertainty over the amount and the timing of settlement of claims liabilities that may arise, and this leads to liquidity risk. As part of the management of this exposure, estimates are prepared for most lines of insurance business of cash flows expected to arise from insurance funds at the balance sheet date. The estimates frequently include future renewal premiums and new business cash flows. As indicated by the asset and liability table for insurance business, and the analysis of insurance risk of the Group, a significant proportion of the Group’s non-life insurance business is viewed as very short
term, with the settlement of claims expected to occur within one year of the period of risk. There is a greater spread of anticipated duration for the life business where, in a large proportion of cases, the liquidity risk is borne in conjunction with policyholders (wholly in the case of unit-linked business). To ensure adequate cash resources are available to meet short-term requirements that can arise as a consequence of large claims events, the local insurance operations may obtain intra-group borrowing facilities at short notice.
The following table presents an analysis of the remaining contractual maturity of the long-term investment contract liabilities at 31 December 2005:
| | Liabilities under investment contracts issued by | |
| | insurance underwriting subsidiaries1 | |
| |
| |
| | Linked | | Non-linked | | | |
| | investment | | investment | | | |
| | contracts | | contracts | | | |
| | designated | | designated | | | |
| | at fair value | | at fair value | | Total | |
| | US$m | | US$m | | US$m | |
| | | | | | | |
| Remaining contractual maturity: | | | | | | |
| – due within 1 year | 118 | | 11 | | 129 | |
| – due between 1 and 5 years | 1,043 | | 185 | | 1,228 | |
| – due between 5 and 10 years | 683 | | – | | 683 | |
| – due after 10 years | 2,431 | | – | | 2,431 | |
| – undated2 | 2,881 | | 3,093 | | 5,974 | |
| |
| |
| |
| |
| | 7,156 | | 3,289 | | 10,445 | |
| |
| |
| |
| |
| | |
| 1 | Excludes investment contracts issued by insurance underwriting associates Erisa, S.A. and Ping An Insurance. |
| 2 | In most cases, policyholders have the option to terminate their contracts at any time and receive the surrender values of their policies. These may be significantly lower than the amounts shown above. |
172
Back to Contents
| Capital management and allocation |
|
| (Forms part of the audited financial statements except where stated) |
Capital measurement and allocation
The Financial Services Authority (‘FSA’) supervises HSBC on a consolidated basis and, as such, receives information on the capital adequacy of, and sets capital requirements for, HSBC as a whole.Individual banking subsidiaries are directly regulated by their local banking supervisors, who set and monitor their capital adequacy requirements. In most jurisdictions, non-banking financial subsidiaries are also subject to the supervision and capital requirements of local regulatory authorities. Since 1988, when the governors of the Group of Ten central banks agreed to guidelines for the international convergence of capital measurement and standards, the banking supervisors of HSBC’s major banking subsidiaries have exercised capital adequacy supervision within a broadly similar framework.
In implementing the EU’s BankingConsolidation Directive, the FSA requires each bank and banking group to maintain an individually prescribed ratio of total capital to risk-weighted assets taking into account both balance sheet assets and off-balance sheet transactions. Under the EU’s Amending Directive to the Capital Adequacy Directive, the FSA allows banks to calculate capital requirements for market risk in the trading book using VAR techniques.
HSBC’s capital is divided into two tiers:
| • | Tier 1 capital comprises shareholders’ funds,innovative tier 1 securities and minorityinterests in tier 1 capital, after adjusting foritems reflected in shareholders’ funds which aretreated differently for the purposes of capitaladequacy. The book values of goodwill andintangible assets are deducted in arriving attier 1 capital. |
| | |
| • | Tier 2 capital comprises qualifying subordinatedloan capital, collective impairment allowances(previously, general provisions), minority andother interests in tier 2 capital and unrealisedgains arising on the fair valuation of equityinstruments held as available-for-sale. Tier 2capital also includes reserves arising from therevaluation of properties. |
Various limits are applied to elements of the capital base. The amount of innovative tier 1 securities cannot exceed 15 per cent of overall tier 1 capital, qualifying tier 2 capital cannot exceed tier 1 capital, and qualifying term subordinated loan
capital may not exceed 50 per cent of tier 1 capital. There are also limitations on the amount of collective impairment allowances which may be included as part of tier 2 capital. From the total of tier 1 and tier 2 capital are deducted the carrying amounts of unconsolidated investments, investments in the capital of banks, and certain regulatory items.
Banking operations are categorised as either trading book or banking book and risk-weighted assets are determined accordingly. Banking book risk-weighted assets are measured by means of a hierarchy of risk weightings classified according to the nature of each asset and counterparty, taking into account any eligible collateral or guarantees. Banking book off-balance sheet items giving rise to credit, foreign exchange or interest rate risk are assigned weights appropriate to the category of the counterparty, taking into account any eligible collateral or guarantees. Trading book risk-weighted assets are determined by taking into account market-related risks such as foreign exchange, interest rate and equity position risks, and counterparty risk.
Effect of IFRSs
In October 2004, the FSA published a consultation paper CP04/17 ‘Implications of a changing accounting framework’. This was followed in April 2005 with a policy statement with the same title, PS05/5. These papers set out the FSA’s approach to assessing banks’ capital adequacy after implementation of IFRSs. PS05/5 took effect on publication.
Under the new policy, there have been changes to the measurement of banks’ capital adequacy, the most significant of which for HSBC are set out below.
| • | The capital treatment for collective impairmentallowances is the same as previously applied togeneral provisions, that is they are included intier 2 capital. This had a positive impact onHSBC’s total capital ratio as the amount ofcollective impairment allowances exceeds theamount of the previous general provisions. |
| | |
| • | The effect of recognising defined benefitpension plan deficits on the balance sheet willbe reversed for regulatory reporting. However,whereas previously banks deducted from capitalprepayments to pension plans, they must nowdeduct from capital their best estimate of theadditional funding that they expect to pay intothe plans over the following five years to reducethe defined benefit liability. This estimate isarrived at in conjunction with the plans’actuaries and/or trustees. |
173
Back to Contents
H S B C H O L D I N G S P L C
FinancialReview(continued)
| • | Under IFRSs, dividends are not recognised as aliability on the balance sheet until they aredeclared. This gives rise to an increase inshareholders’ funds at the balance sheet datecompared with the previous accounting, whichis reversed when the relevant dividend issubsequently declared. Banks reflect the benefitof this increase in their regulatory capital untilthe dividend declaration, in line with theaccounting treatment. |
| | |
| • | Unrealised gains on available-for-sale equitiesheld are included as part of tier 2 capital;previously these were not recognised. |
The FSA plan to review certain elements of this policy in mid-2007. In addition, in January 2006, the FSA published a consultation paper, CP06/1, which set out proposed amendments to the handbook, on which comments are due in March 2006. These proposals are not expected to have a significant impact for HSBC.
Future developmentsThe Basel Committee on Banking Supervision (‘the Basel Committee’) has published a new framework for calculating minimum capital requirements. Known as ‘Basel II’, it will replace the 1988 Basel Capital Accord. Basel II is structured around three ‘pillars’: minimum capital requirements, supervisory review process and market discipline. The supervisory objectives for Basel II are to promote safety and soundness in the financial system and maintain at least the current overall level of capital in the system; enhance competitive equality; constitute a more comprehensive approach to addressing risks; and focus on internationally active banks.
With respect to pillar one minimum capital requirements, Basel II provides three approaches, of increasing sophistication, to the calculation of credit risk regulatory capital. The most basic one, the standardised approach, requires banks to use external credit ratings to determine the risk weightings applied to rated counterparties, and group other counterparties into broad categories and apply standardised risk weightings to these categories. In the next level, the internal ratings-based foundation approach allows banks to calculate their credit risk regulatory capital requirement on the basis of their internal assessment of the probability that a counterparty will default, but with quantification of exposure and loss estimates being subject to standard supervisory formulae. Finally, the internal ratings-based advanced approach will allow banks to use their own internal assessment of not only the
probability of default but also the quantification of exposure at default and loss given default.
Basel II also introduces capital requirements for operational risk and, again, three levels of sophistication are proposed. The capital required under the basic indicator approach will be a simple percentage of gross revenues: under the standardised approach it will be one of three different percentages of gross revenues applicable to each of eight business lines, and under advanced measurement approaches it will be an amount determined using banks’ own statistical analysis of operational risk data.
The EU Capital Requirements Directive (‘CRD’) recast the Banking Consolidation Directive and the Capital Adequacy Directive and will be the means by which Basel II will be implemented in the EU. The CRD was approved by the European Parliament in September 2005 and the European Parliament’s amendments were subsequently endorsed by EU Finance Ministers on 12 October 2005. The CRD is expected to be published in its final form in the spring of 2006. It requires EU Member States to bring implementing provisions into force on 1 January 2007, although in the case of the provisions relating to the implementation of the internal ratings-based advanced approach to credit risk and the advanced measurement approach to operational risk, implementation may be delayed until 1 January 2008.
In January 2005, the FSA published a consultation paper, CP05/3 ‘Strengthening capital standards’, setting out proposals for implementing the recast EU Directives. The FSA proposed that the new requirements should take effect from 1 January 2007, except that firms may elect to continue applying the existing capital adequacy framework until 1 January 2008. A further FSA consultation paper, CP06/3 ‘Strengthening Capital Standards 2’, was published in February 2006 setting out the FSA’s latest proposals for implementing the CRD in the UK, together with the draft FSA Handbook text.
HSBC continues to participate actively in industry consultations surrounding the development and implementation of Basel II and the recast EU Directives, and fully supports the more risk-sensitive regulatory capital framework proposed to replace the original 1988 Basel Capital Accord. The application of Basel II across HSBC’s geographically diverse businesses, which operate in a large number of different regulatory environments, represents a significant logistical and technological challenge, and an extensive programme of implementation projects is currently in progress. Basel II permits
174
Back to Contents
local discretion in a number of areas for determination by local regulators. The extent to which requirements will diverge, coupled with how the FSA, HSBC’s home regulator, and the local host regulators in the other countries in which HSBC operates interact will be key factors in completing implementation of Basel II. In view of this ongoing uncertainty, it remains premature to establish with precision the effect of Basel II on HSBC’s capital ratios or how the competitive landscape will change. One example of regulatory uncertainty relates to the US, where banking supervisory authorities have yet to produce draft rules (termed Notice of Proposed Rulemaking). They are now expected to be published in the first half of 2006. The US authorities have decided to apply the advanced credit and operational risk methodologies of Basel II only to the largest US banks and holding companies, although other banks may decide to opt in. HSBC North America Holdings Inc. (HSBC’s highest level US bank holding company in the US, which holds all HSBC’s major US operating subsidiaries and HSBC Canada) has been mandated to comply with these rules. For smaller US banks, the US banking authorities are considering applying an updated version of the existing Basel I rules (dubbed Basel Ia). The Basel Ia rules may also be used in the determination of Basel II capital floors during the transition period (2009-11).
Capital managementIt is HSBC’s policy to maintain a strong capital base to support the development of its business. HSBC seeks to maintain a prudent balance between the
different components of its capital and, in HSBC Holdings, between the composition of its capital and that of its investment in subsidiaries. This is achieved by each subsidiary managing its own capital within the context of an approved annual plan which determines the optimal amount and mix of capital required to support planned business growth and meet Group and local regulatory capital requirements and, in the case of HSBC Finance, its ratings targets. Capital generated in excess of planned requirements is returned to HSBC Holdings, normally by way of dividends, and represents a source of strength for HSBC.
HSBC Holdings is primarily a provider of equity capital to its subsidiaries. These investments are substantially funded by HSBC Holdings’ own equity issuance and profit retentions. Major subsidiaries usually raise their own non-equity tier 1 capital and subordinated debt in accordance with HSBC guidelines regarding market and investor concentration, cost, market conditions, timing and the effect on the composition and maturity profile of HSBC’s capital. The subordinated debt requirements of other HSBC companies are met internally.
HSBC recognises the impact on shareholder returns of the level of equity capital employed within HSBC and seeks to maintain a prudent balance between the advantages and flexibility afforded by a strong capital position and the higher returns on equity possible with greater leverage. In the current environment, HSBC uses a benchmark tier 1 capital ratio of 8.25 per cent in considering its long-term capital planning.
Source and application of tier 1 capital(Unaudited information)
| | 2005 | | 2004 | |
| | US$m | | US$m | |
| | | | | |
| Movement in tier 1 capital | | | | |
| At 1 January | 67,259 | | 54,863 | |
| Consolidated profits attributable to shareholders of the parent company | 15,081 | | 11,840 | |
| Add back: goodwill amortisation | – | | 1,818 | |
| Dividends | (7,750 | ) | (7,301 | ) |
| Add back: shares issued in lieu of dividends | 1,811 | | 2,607 | |
| Increase in goodwill and intangible assets deducted | (1,631 | ) | (3,088 | ) |
| Preference shares issued | 1,405 | | – | |
| Ordinary shares issued | 690 | | 581 | |
| Innovative tier 1 capital issued | – | | 1,983 | |
| Other (including exchange differences) | (2,462 | ) | 3,956 | |
| |
| |
| |
| At 31 December | 74,403 | | 67,259 | |
| |
| |
| |
| Movement in risk-weighted assets | | | | |
| At 1 January | 759,210 | | 618,662 | |
| Movements | 67,954 | | 140,548 | |
| |
| |
| |
| At 31 December | 827,164 | | 759,210 | |
| |
| |
| |
175
Back to Contents
H S B C H O L D I N G S P L C
FinancialReview(continued)
Capital structure(Unaudited information)
| | 2005 | | 2004 | |
| | US$m | | US$m | |
| Composition of regulatory capital | | | | |
| Tier 1 capital | | | | |
| Shareholders’ funds | 92,432 | | 86,623 | |
| Minority interests and preference shares | 6,741 | | 4,253 | |
| Innovative tier 1 securities | 9,383 | | 10,077 | |
| Less : | | | | |
| Goodwill capitalised and intangible assets | (32,821 | ) | (31,190 | ) |
| Other regulatory adjustments1 | (1,332 | ) | (2,504 | ) |
| |
| |
| |
| Total qualifying tier 1 capital | 74,403 | | 67,259 | |
| |
| |
| |
| Tier 2 capital | | | | |
| Reserves arising from revaluation of property and unrealised gains on | | | | |
| available-for-sale equities | 1,593 | | 2,660 | |
| Collective impairment allowances | 8,749 | | – | |
| General provisions | – | | 2,624 | |
| Perpetual subordinated debt | 3,640 | | 3,670 | |
| Term subordinated debt | 24,519 | | 21,373 | |
| Minority and other interests in tier 2 capital | 425 | | 519 | |
| |
| |
| |
| Total qualifying tier 2 capital | 38,926 | | 30,846 | |
| |
| |
| |
| Unconsolidated investments | (6,437 | ) | (6,361 | ) |
| Investments in other banks | (1,147 | ) | (799 | ) |
| Other deductions | (296 | ) | (165 | ) |
| |
| |
| |
| Total regulatory capital | 105,449 | | 90,780 | |
| |
| |
| |
| Risk-weighted assets | | | | |
| Banking book | 762,037 | | 705,302 | |
| Trading book | 65,127 | | 53,908 | |
| |
| |
| |
| Total | 827,164 | | 759,210 | |
| |
| |
| |
| Risk-weighted assets were included in the totals above in respect of: | | | | |
| – contingent liabilities | 43,333 | | 41,264 | |
| – commitments | 51,288 | | 47,541 | |
| | | | | |
| Capital ratios | % | | % | |
| Total capital | 12.8 | | 12.0 | |
| Tier 1 capital | 9.0 | | 8.9 | |
| | |
| 1 | Other regulatory adjustments mainly arise from the implementation of IFRSs in conjunction with the FSA’s policy statement PS05/5. |
The above figures were computed in accordance with the EU Banking Consolidation Directive and the FSA policy statement PS05/5. The comparative figures at 31 December 2004 have not been restated to reflect the implementation of IFRSs and PS05/5. HSBC complied with the FSA’s capital adequacy requirements throughout 2005 and 2004.
Tier 1 capital increased by US$7.1 billion. Retained profits contributed US$7.3 billion, shares issued in lieu of dividends, together with preference shares issued, contributed US$3.2 billion and other movements, including net other IFRS transitional adjustments, added US$0.8 billion. These increases
were partly offset by reductions due to exchange differences of US$4.2 billion.
The increase of US$8 billion in tier 2 capital mainly reflects collective impairment allowances becoming eligible for inclusion in capital in place of general provisions.
Total risk-weighted assets increased by US$68 billion, or 9 per cent. The increase mainly reflects growth in the loan book and trading positions. At constant currency, risk-weighted asset growth was 13 per cent.
176
Back to Content
Risk-weighted assets by principal subsidiary
(Unaudited information)
In order to give an indication of how HSBC’s capital is deployed, the table below analyses the disposition
of risk-weighted assets by principal subsidiary. The risk-weighted assets are calculated using FSA rules and exclude intra-HSBC items.
| | 2005 | | | 2004 | |
| | US$m | | | US$m | |
| Risk-weighted assets | | | | | |
| Hang Seng Bank | 45,525 | | | 37,918 | |
| The Hongkong and Shanghai Banking Corporation and other subsidiaries | 123,906 | | | 119,595 | |
| The Hongkong and Shanghai Banking Corporation | 169,431 | | | 157,513 | |
| HSBC Private Banking Holdings (Suisse) | 21,224 | | | 19,815 | |
| HSBC France | 54,684 | | | 54,569 | |
| HSBC Bank and other subsidiaries | 221,355 | | | 220,824 | |
| HSBC Bank | 297,263 | | | 295,208 | |
| HSBC Finance | 129,282 | | | 110,744 | |
| HSBC Bank Canada | 30,275 | | | 26,127 | |
| HSBC Bank USA and other subsidiaries | 123,829 | | | 108,577 | |
| HSBC North America | 283,386 | | | 245,448 | |
| HSBC Mexico | 13,166 | | | 8,750 | |
| HSBC Bank Middle East | 14,682 | | | 10,088 | |
| HSBC Bank Malaysia | 5,991 | | | 5,472 | |
| HSBC South American operations | 15,736 | | | 9,743 | |
| Bank of Bermuda | 4,195 | | | 4,107 | |
| HSBC Holdings sub-group | 780 | | | 1,380 | |
| Other | 22,534 | | | 21,501 | |
| |
| | |
| |
| | 827,164 | | | 759,210 | |
| |
| | |
| |
177
Back to Contents
H S B C H O L D I N G S P L C
Other Information
| | Loan maturity and interest sensitivity analysis |
| |
|
| | At 31 December 2005, the geographical analysis of loan maturity and interest sensitivity by loan type on a contractual repayment basis was as follows: |
| | |
| | | | | | | Rest | | | | | | | |
| Hong | of Asia- | North | South |
| Europe | Kong | Pacific | America | America | Total |
| US$m | US$m | US$m | US$m | US$m | US$m |
| | Maturity of 1 year or less | | | | | | | | | | | | |
| | | | | | | | | | | | | | |
| | Loans and advances to banks | 43,254 | | 42,684 | | 18,898 | | 11,293 | | 5,265 | | 121,394 | |
| | |
| |
| |
| |
| |
| |
| |
| | Commercial loans to customers Commercial, industrial and international trade | 54,243 | | 11,155 | | 17,478 | | 6,759 | | 2,229 | | 91,864 | |
| | Real estate and other property related | 12,884 | | 6,189 | | 3,814 | | 5,472 | | 218 | | 28,577 | |
| | Non-bank financial institutions | 32,287 | | 1,588 | | 1,606 | | 8,655 | | 109 | | 44,245 | |
| | Governments | 782 | | 116 | | 1,439 | | 253 | | 55 | | 2,645 | |
| | Other commercial | 27,223 | | 1,942 | | 4,700 | | 6,240 | | 855 | | 40,960 | |
| | |
| |
| |
| |
| |
| |
| |
| | | 127,419 | | 20,990 | | 29,037 | | 27,379 | | 3,466 | | 208,291 | |
| | Hong Kong Government Home Ownership Scheme | – | | 489 | | – | | – | | – | | 489 | |
| | Residential mortgages and other personal loans | 30,066 | | 10,685 | | 9,538 | | 49,629 | | 3,827 | | 103,745 | |
| | |
| |
| |
| |
| |
| |
| |
| | Loans and advances to customers | 157,485 | | 32,164 | | 38,575 | | 77,008 | | 7,293 | | 312,525 | |
| | |
| |
| |
| |
| |
| |
| |
| | | 200,739 | | 74,848 | | 57,472 | | 88,301 | | 12,558 | | 433,918 | |
| | |
| |
| |
| |
| |
| |
| |
| | Maturity after 1 year but within 5 years | | | | | | | | | | | | |
| | Loans and advances to banks | 750 | | 67 | | 266 | | 124 | | 17 | | 1,224 | |
| | |
| |
| |
| |
| |
| |
| |
| | Commercial loans to customers Commercial, industrial and international trade | 13,558 | | 5,192 | | 3,335 | | 5,128 | | 655 | | 27,868 | |
| | Real estate and other property related | 9,180 | | 9,036 | | 3,734 | | 7,651 | | 57 | | 29,658 | |
| | Non-bank financial institutions | 1,726 | | 348 | | 558 | | 1,480 | | 18 | | 4,130 | |
| | Governments | 363 | | 186 | | 472 | | 2,647 | | 163 | | 3,831 | |
| | Other commercial | 6,984 | | 3,532 | | 2,253 | | 1,536 | | 317 | | 14,622 | |
| | |
| |
| |
| |
| |
| |
| |
| | | 31,811 | | 18,294 | | 10,352 | | 18,442 | | 1,210 | | 80,109 | |
| | | | | | | | | | | | | | |
| | Hong Kong Government Home Ownership Scheme | – | | 1,564 | | – | | – | | – | | 1,564 | |
| | Residential mortgages and other personal loans . | 34,043 | | 6,836 | | 7,535 | | 50,515 | | 1,268 | | 100,197 | |
| | |
| |
| |
| |
| |
| |
| |
| | Loans and advances to customers | 65,854 | | 26,694 | | 17,887 | | 68,957 | | 2,478 | | 181,870 | |
| | |
| |
| |
| |
| |
| |
| |
| | | 66,604 | | 26,761 | | 18,153 | | 69,081 | | 2,495 | | 183,094 | |
| | |
| |
| |
| |
| |
| |
| |
| | Interest rate sensitivity of loans and advances to banks and commercial loans to customers: | | | | | | | | | | | | |
| | Fixed interest rate | 6,991 | | 69 | | 3,070 | | 3,791 | | 430 | | 14,351 | |
| | Variable interest rate | 25,570 | | 18,292 | | 7,548 | | 14,775 | | 797 | | 66,982 | |
| | |
| |
| |
| |
| |
| |
| |
| | | 32,561 | | 18,361 | | 10,618 | | 18,566 | | 1,227 | | 81,333 | |
| | |
| |
| |
| |
| |
| |
| |
| | Maturity after 5 years | | | | | | | | | | | | |
| | Loans and advances to banks | 364 | | – | | 396 | | 2,596 | | – | | 3,356 | |
| | |
| |
| |
| |
| |
| |
| |
| | Commercial loans to customers | | | | | | | | | | | | |
| | Commercial, industrial and international trade | 8,886 | | 389 | | 473 | | 1,312 | | 10 | | 11,070 | |
| | Real estate and other property related | 7,610 | | 3,479 | | 959 | | 3,725 | | 3 | | 15,776 | |
| | Non-bank financial institutions | 1,292 | | 30 | | 38 | | 296 | | 1 | | 1,657 | |
| | Governments | 676 | | 1 | | 236 | | 602 | | 227 | | 1,742 | |
| | Other commercial | 8,739 | | 1,953 | | 938 | | 600 | | 8 | | 12,238 | |
| | |
| |
| |
| |
| |
| |
| |
| | | 27,203 | | 5,852 | | 2,644 | | 6,535 | | 249 | | 42,483 | |
| | | | | | | | | | | | | | |
| | Hong Kong Government Home Ownership Scheme | – | | 2,627 | | – | | – | | – | | 2,627 | |
| | Residential mortgages and other personal loans | 65,486 | | 16,269 | | 11,746 | | 118,270 | | 83 | | 211,854 | |
| | |
| |
| |
| |
| |
| |
| |
| | Loans and advances to customers | 92,689 | | 24,748 | | 14,390 | | 124,805 | | 332 | | 256,964 | |
| | |
| |
| |
| |
| |
| |
| |
| | | 93,053 | | 24,748 | | 14,786 | | 127,401 | | 332 | | 260,320 | |
| | |
| |
| |
| |
| |
| |
| |
| | Interest rate sensitivity of loans and advances to banks and commercial loans to customers | | | | | | | | | | | | |
| | Fixed interest rate | 6,633 | | 30 | | 927 | | 1,673 | | 11 | | 9,274 | |
| | Variable interest rate | 20,934 | | 5,822 | | 2,113 | | 7,458 | | 238 | | 36,565 | |
| | |
| |
| |
| |
| |
| |
| |
| | | 27,567 | | 5,852 | | 3,040 | | 9,131 | | 249 | | 45,839 | |
| | |
| |
| |
| |
| |
| |
| |
178
Back to Contents
H S B C H O L D I N G S P L C
Other information(continued)
| | Deposits |
| |
|
| | The following table analyses the average amount of bank and customer deposits and certificates of deposit (‘CDs’) and other money market instruments (which are included within ‘debt securities in issue’ in the balance sheet), together with the average interest rates paid thereon for each of the past three years. The geographical analysis of average deposits is based on the location of the office in which the deposits are recorded and excludes balances with HSBC companies. The ‘Other’ category includes securities sold under agreements to repurchase. |
| | |
| | Year ended 31 December | |
|
|
|
|
|
|
|
|
|
|
|
|
|
| 2005 | | 2004 | | | | 2003 |
|
| | | |
|
| Average | | Average | Average | | Average | | | | Average | | Average |
| balance | rate | balance | rate | | | | balance | rate |
| US$m | % | US$m | % | | | | US$m | % |
| | | | | | | | | | Deposits by banks | | | | | |
| | | | | | | | | | | | | | | |
| | | | | | | | | | Europe | | | | | |
| | 14,252 | | – | | 14,746 | | – | | Demand and other – non-interest bearing | | 9,895 | | – | |
| | 9,418 | | 4.5 | | 9,237 | | 1.5 | | Demand – interest bearing | | 6,418 | | 3.3 | |
| | 28,021 | | 3.9 | | 22,029 | | 2.8 | | Time | | 17,877 | | 1.9 | |
| | 16,111 | | 4.9 | | 22,870 | | 2.5 | | Other | | 13,828 | | 2.5 | |
| |
| | | |
| | | | | |
| | | |
| | 67,802 | | | | 68,882 | | | | | | 48,018 | | | |
| |
| | | |
| | | | | |
| | | |
| | | | | | | | | | Hong Kong | | | | | |
| | 2,054 | | – | | 1,752 | | – | | Demand and other – non-interest bearing | | 1,253 | | – | |
| | 3,104 | | 3.5 | | 2,484 | | 1.2 | | Demand – interest bearing | | 2,059 | | 1.0 | |
| | 2,012 | | 3.2 | | 1,016 | | 1.6 | | Time | | 450 | | 1.1 | |
| | 218 | | 2.3 | | 416 | | 1.7 | | Other | | 110 | | 5.5 | |
| |
| | | |
| | | | | |
| | | |
| | 7,388 | | | | 5,668 | | | | | | 3,872 | | | |
| |
| | | |
| | | | | |
| | | |
| | | | | | | | | | Rest of Asia-Pacific | | | | | |
| | 2,164 | | – | | 1,641 | | – | | Demand and other – non-interest bearing | | 1,438 | | – | |
| | 1,442 | | 1.9 | | 1,013 | | 2.3 | | Demand – interest bearing | | 737 | | 1.8 | |
| | 4,375 | | 4.3 | | 4,410 | | 3.1 | | Time | | 3,055 | | 3.6 | |
| | 761 | | 5.4 | | 1,146 | | 2.7 | | Other | | 664 | | 1.7 | |
| |
| | | |
| | | | | |
| | | |
| | 8,742 | | | | 8,210 | | | | | | 5,894 | | | |
| |
| | | |
| | | | | |
| | | |
| | | | | | | | | | North America | | | | | |
| | 1,344 | | – | | 1,948 | | – | | Demand and other – non-interest bearing | | 1,442 | | – | |
| | 3,647 | | 3.6 | | 3,098 | | 1.4 | | Demand – interest bearing | | 3,161 | | 0.7 | |
| | 3,886 | | 6.3 | | 3,176 | | 3.3 | | Time | | 3,151 | | 2.9 | |
| | 40 | | 47.5 | | 4,480 | | 1.8 | | Other | | 2,526 | | 1.2 | |
| |
| | | |
| | | | | |
| | | |
| | 8,917 | | | | 12,702 | | | | | | 10,280 | | | |
| |
| | | |
| | | | | |
| | | |
| | | | | | | | | | South America | | | | | |
| | 39 | | – | | 13 | | – | | Demand and other – non-interest bearing | | 17 | | – | |
| | 117 | | 7.7 | | 148 | | 6.8 | | Demand – interest bearing | | 181 | | 8.3 | |
| | 330 | | 5.5 | | 238 | | 6.3 | | Time | | 273 | | 12.8 | |
| | 1,073 | | 10.2 | | 703 | | 5.7 | | Other | | 299 | | 19.1 | |
| |
| | | |
| | | | | |
| | | |
| | 1,559 | | | | 1,102 | | | | Total | | 770 | | | |
| |
| | | |
| | | | | |
| | | |
| | 19,853 | | – | | 20,100 | | – | | Demand and other – non-interest bearing | | 14,045 | | – | |
| | 17,728 | | 4.0 | | 15,980 | | 1.5 | | Demand – interest bearing | | 12,556 | | 2.2 | |
| | 38,624 | | 4.1 | | 30,869 | | 2.9 | | Time | | 24,806 | | 2.3 | |
| | 18,203 | | 5.3 | | 29,615 | | 2.4 | | Other | | 17,427 | | 2.6 | |
| |
| | | |
| | | | | |
| | | |
| | 94,408 | | | | 96,564 | | | | | | 68,834 | | | |
| |
| | | |
| | | | | |
| | | |
179
Back to Contents
H S B C H O L D I N G S P L C
Other Information(continued)
| Year ended 31 December | | | | Year ended | |
|
|
|
|
|
|
| | | |
|
|
| |
| 2005 | | 2004 | | | | 31 December 2003 | |
| |
| | | |
| |
| Average | | Average | | Average | | Average | | | | Average | | Average | |
| balance | | rate | | balance | | rate | | | | balance | | rate | |
| US$m | | % | | US$m | | % | | | | US$m | | % | |
| | | | | | | | | Customer accounts | | | | | |
| | | | | | | | | Europe | | | | | |
| 28,501 | | – | | 37,184 | | – | | Demand and other – non-interest bearing | | 30,667 | | – | |
| 146,484 | | 2.4 | | 128,249 | | 2.0 | | Demand – interest bearing | | 101,189 | | 1.8 | |
| 46,248 | | 3.3 | | 37,846 | | 2.5 | | Savings | | 33,876 | | 2.3 | |
| 48,201 | | 3.9 | | 47,941 | | 3.1 | | Time | | 41,010 | | 2.8 | |
| 10,967 | | 4.2 | | 15,167 | | 2.2 | | Other | | 9,696 | | 3.6 | |
| | | |
| | | | | |
| | | |
| 280,401 | | | | 266,387 | | | | | | 216,438 | | | |
| | | |
| | | | | |
| | | |
| | | | | | | | | Hong Kong | | | | | |
| 13,365 | | – | | 13,508 | | – | | Demand and other – non-interest bearing | | 8,829 | | – | |
| 91,723 | | 0.9 | | 94,629 | | 0.1 | | Demand – interest bearing | | 74,818 | | 0.1 | |
| 50,281 | | 2.4 | | 46,817 | | 1.0 | | Savings | | 58,646 | | 0.9 | |
| 14,054 | | 2.7 | | 12,015 | | 1.6 | | Time | | 10,101 | | 1.4 | |
| 15 | | (26.7 | ) | 106 | | 4.7 | | Other | | 379 | | 1.3 | |
| | | |
| | | | | |
| | | |
| 169,438 | | | | 167,075 | | | | | | 152,773 | | | |
| | | |
| | | | | |
| | | |
| | | | | | | | | Rest of Asia-Pacific | | | | | |
| 11,825 | | – | | 8,592 | | – | | Demand and other – non-interest bearing | | 6,467 | | – | |
| 27,721 | | 1.7 | | 24,480 | | 1.2 | | Demand – interest bearing | | 18,483 | | 1.1 | |
| 31,584 | | 3.3 | | 27,171 | | 2.9 | | Savings | | 25,685 | | 2.7 | |
| 10,484 | | 3.5 | | 7,597 | | 2.1 | | Time | | 6,105 | | 1.6 | |
| 1,895 | | 3.9 | | 2,866 | | 1.2 | | Other | | 2,304 | | 1.2 | |
| | | |
| | | | | |
| | | |
| 83,509 | | | | 70,706 | | | | | | 59,044 | | | |
| | | |
| | | | | |
| | | |
| | | | | | | | | North America | | | | | |
| 17,084 | | – | | 21,508 | | – | | Demand and other – non-interest bearing | | 21,364 | | – | |
| 17,788 | | 1.6 | | 16,395 | | 1.0 | | Demand – interest bearing | | 11,648 | | 1.3 | |
| 53,328 | | 1.7 | | 52,919 | | 1.3 | | Savings | | 48,295 | | 1.2 | |
| 23,945 | | 3.8 | | 13,971 | | 2.3 | | Time | | 6,652 | | 3.3 | |
| 2,534 | | 4.5 | | 16,989 | | 2.7 | | Other | | 11,672 | | 3.3 | |
| | | |
| | | | | |
| | | |
| 114,679 | | | | 121,782 | | | | | | 99,631 | | | |
| | | |
| | | | | |
| | | |
| | | | | | | | | South America | | | | | |
| 2,126 | | – | | 1,428 | | – | | Demand and other – non-interest bearing | | 1,192 | | – | |
| 276 | | 2.5 | | 308 | | 1.6 | | Demand – interest bearing | | 207 | | 1.9 | |
| 10,110 | | 16.3 | | 5,976 | | 13.5 | | Savings | | 4,271 | | 18.1 | |
| 343 | | 5.2 | | 269 | | 0.4 | | Time | | 157 | | – | |
| 1,444 | | 17.3 | | 411 | | 16.3 | | Other | | 246 | | 18.3 | |
| | | |
| | | | | |
| | | |
| 14,299 | | | | 8,392 | | | | | | 6,073 | | | |
| | | |
| | | | | |
| | | |
| | | | | | | | | Total | | | | | |
| 72,901 | | – | | 82,220 | | – | | Demand and other – non-interest bearing | | 68,519 | | – | |
| 283,992 | | 1.8 | | 264,061 | | 1.2 | | Demand – interest bearing | | 206,345 | | 1.1 | |
| 191,551 | | 3.3 | | 170,729 | | 2.2 | | Savings | | 170,773 | | 2.0 | |
| 97,027 | | 3.7 | | 81,793 | | 2.6 | | Time | | 64,025 | | 2.5 | |
| 16,855 | | 5.3 | | 35,539 | | 2.5 | | Other | | 24,297 | | 3.3 | |
| | | |
| | | | | |
| | | |
| 662,326 | | | | 634,342 | | | | | | 533,959 | | | |
| | | |
| | | | | |
| | | |
| | | | | | | | | CDs and other money market instruments | | | | | |
| 27,778 | | 5.8 | | 24,684 | | 2.6 | | Europe | | 11,156 | | 2.8 | |
| 1,599 | | 3.1 | | 10,031 | | 3.3 | | Hong Kong | | 9,656 | | 3.6 | |
| 7,467 | | 6.2 | | 6,804 | | 4.4 | | Rest of Asia-Pacific | | 4,906 | | 4.1 | |
| 24,150 | | 3.7 | | 20,790 | | 2.1 | | North America | | 14,309 | | 2.4 | |
| 73 | | 17.8 | | 102 | | 14.7 | | South America | | 63 | | 19.0 | |
| | | |
| | | | | |
| | | |
| 61,067 | | 5.0 | | 62,411 | | 2.9 | | | | 40,090 | | 3.0 | |
| | | |
| | | | | |
| | | |
180
Back to Contents
| | Certificates of deposit and other time deposits |
| |
|
| | At 31 December 2005, the maturity analysis of certificates of deposit and other wholesale time deposits, by remaining maturity, was as follows: |
| | |
| | | | | After 3 months | | After 6 months | | | | | |
| | | 3 months | | but within | | but within | | After | | | |
| | | or less | | 6 months | | 12 months | | 12 months | | Total | |
| | | US$m | | US$m | | US$m | | US$m | | US$m | |
| | Europe | | | | | | | | | | |
| | Certificates of deposit | 12,713 | | 1,581 | | 325 | | 3 | | 14,622 | |
| | Time deposits: | | | | | | | | | | |
| | – banks | 12,192 | | 5,012 | | 1,497 | | 1,630 | | 20,331 | |
| | – customers | 39,800 | | 3,652 | | 1,495 | | 4,496 | | 49,443 | |
| | |
| |
| |
| |
| |
| |
| | | 64,705 | | 10,245 | | 3,317 | | 6,129 | | 84,396 | |
| | |
| |
| |
| |
| |
| |
| | Hong Kong | | | | | | | | | | |
| | Certificates of deposit | 340 | | 988 | | 1,178 | | 9,598 | | 12,104 | |
| | Time deposits: | | | | | | | | | | |
| | – banks | 889 | | 5 | | 7 | | 37 | | 938 | |
| | – customers | 13,438 | | 330 | | 353 | | 1,335 | | 15,456 | |
| | |
| |
| |
| |
| |
| |
| | | 14,667 | | 1,323 | | 1,538 | | 10,970 | | 28,498 | |
| | |
| |
| |
| |
| |
| |
| | Rest of Asia-Pacific | | | | | | | | | | |
| | Certificates of deposit | 4,251 | | 894 | | 1,031 | | 498 | | 6,674 | |
| | Time deposits: | | | | | | | | | | |
| | – banks | 2,923 | | 299 | | 397 | | 284 | | 3,903 | |
| | – customers | 9,408 | | 1,321 | | 79 | | 1,426 | | 12,234 | |
| | |
| |
| |
| |
| |
| |
| | | 16,582 | | 2,514 | | 1,507 | | 2,208 | | 22,811 | |
| | |
| |
| |
| |
| |
| |
| | North America | | | | | | | | | | |
| | Certificates of deposit | 5,114 | | 49 | | 15 | | – | | 5,178 | |
| | Time deposits: | | | | | | | | | | |
| | – banks | 2,490 | | 611 | | 552 | | 212 | | 3,865 | |
| | – customers | 15,713 | | 3,797 | | 1,803 | | 4,537 | | 25,850 | |
| | |
| |
| |
| |
| |
| |
| | | 23,317 | | 4,457 | | 2,370 | | 4,749 | | 34,893 | |
| | |
| |
| |
| |
| |
| |
| | South America | | | | | | | | | | |
| | Certificates of deposit | – | | – | | – | | 56 | | 56 | |
| | Time deposits: | | | | | | | | | | |
| | – banks | 160 | | 83 | | 71 | | 1 | | 315 | |
| | – customers | 312 | | 10 | | 37 | | 21 | | 380 | |
| | |
| |
| |
| |
| |
| |
| | Total | 472 | | 93 | | 108 | | 78 | | 751 | |
| | |
| |
| |
| |
| |
| |
| | Certificates of deposit | 22,418 | | 3,512 | | 2,549 | | 10,155 | | 38,634 | |
| | Time deposits: | | | | | | | | | | |
| | – banks | 18,654 | | 6,010 | | 2,524 | | 2,164 | | 29,352 | |
| | – customers | 78,671 | | 9,110 | | 3,767 | | 11,815 | | 103,363 | |
| | |
| |
| |
| |
| |
| |
| | | 119,743 | | 18,632 | | 8,840 | | 24,134 | | 171,349 | |
| | |
| |
| |
| |
| |
| |
| | | | | | | | | | | | |
| | The geographical analysis of deposits is based on the location of the office in which the deposits are recorded and excludes balances with HSBC companies. The majority of certificates of deposit and time deposits are in amounts of US$100,000 and over or the equivalent in other currencies. |
181
Back to Contents
H S B C H O L D I N G S P L C
Other information(continued)
| | Short-term borrowings |
| |
|
| | HSBC includes short-term borrowings within customer accounts, deposits by banks and debt securities in issue and does not show short-term borrowings separately on the balance sheet. Short-term borrowings are defined by the US Securities and Exchange Commission (‘SEC’) as Federal funds purchased and securities sold under agreements to repurchase, commercial paper and other short-term borrowings. HSBC’s only significant short-term borrowings are securities sold under agreements to repurchase and certain debt securities in issue. Additional information on these is provided in the tables below. |
| | |
| Year ended 31 December | |
| |
| 2005 | | 2004 | | | | 2003 | |
| US$m | US$m | | | US$m | |
| | | | | Securities sold under agreements to repurchase | | | |
| 75,745 | | 43,726 | | Outstanding at 31 December | | 27,427 | |
| 74,143 | | 46,229 | | Average amount outstanding during the year | | 25,883 | |
| 78,590 | | 53,188 | | Maximum quarter-end balance outstanding during the year | | 30,938 | |
| 3.6% | | 2.7% | | Weighted average interest rate during the year | | 2.0% | |
| 4.0% | | 2.9% | | Weighted average interest rate at the year-end | | 1.9% | |
| | | | | | | | |
| | | | | Short term bonds | | | |
| 40,642 | | 36,085 | | Outstanding at 31 December | | 29,979 | |
| 31,908 | | 29,238 | | Average amount outstanding during the year | | 17,445 | |
| 40,642 | | 36,085 | | Maximum quarter-end balance outstanding during the year | | 29,979 | |
| 4.6% | | 2.8% | | Weighted average interest rate during the year | | 2.5% | |
| 3.7% | | 2.5% | | Weighted average interest rate at the year-end | | 2.5% | |
| | Off-balance sheet arrangements |
| |
|
| | HSBC enters into certain off-balance sheet arrangements with customers in the ordinary course of business, as described below. |
| | |
| | (i) | Financial guarantees, letters of credit and similar undertakings |
| |
| | | Note 40 on the Financial Statements on page 327 describes various types of guarantees and discloses the maximum potential future payments under such arrangements. Credit risk associated with all forms of guarantees is assessed in the same manner as for on-balance sheet credit advances and, where necessary, provisions for assessed impairment are included in ‘Other provisions’. |
| |
| | (ii) | Commitments to lend |
| |
| | | Undrawn credit lines are disclosed in Note 40 on the Financial Statements on page 327. The majority by value of undrawn credit lines arise from ‘open to buy’ lines on personal credit cards, cheques issued to potential customers offering them a pre-approved loan, advised overdraft limits, and mortgage offers awaiting customer acceptance. HSBC generally has the right to change or terminate any conditions of a personal customer’s overdraft, credit card or other credit line upon notification to the customer. In respect of corporate commitments to lend, in most contracts HSBC’s position will be protected through restrictions on access to funding in the event of material adverse change. |
| |
| | (iii) | Credit derivatives |
| |
| | | HSBC uses credit derivatives through its principal dealing operations, acting as a principal counterparty to a broad range of users, structuring deals to produce risk management products for its customers, or making markets in certain products. Risk is typically controlled through entering into offsetting credit derivative contracts with other counterparties. |
| |
| | | HSBC manages the credit risk arising on buying and selling credit derivative protection by including the exposure to any credit risk that arises from such transactions within its overall credit limits structure to the relevant counterparty. The trading of credit derivatives is restricted to a small number of offices within the major centres which in management’s view have the control infrastructure and market skills to manage effectively the credit risk inherent in the products. |
| |
| | | Credit derivatives are also used for the management of credit risk in the Group’s loan portfolio. HSBC’s use of credit derivatives in this manner is not significant, however. |
| | | |
182
Back to Contents
| | | The following table presents the notional amounts of credit derivatives protection bought and sold by HSBC: |
| | | |
| | | | Notional amount of protection | |
|
| Bought | | Sold |
| US$m | US$m |
| | | | | | | |
| | | At 31 December 2005 | 249,347 | | 262,393 | |
| | | At 31 December 2004 | 93,750 | | 102,321 | |
| | | The mismatch between these notional amounts is attributable to HSBC selling protection on large, diversified, predominantly investment grade portfolios (including the most senior tranches) and then hedging these positions by buying protection on the more subordinated tranches of the same portfolios. In addition, HSBC uses securities to hedge certain derivative positions. Consequently, while there is a mismatch in notional amounts of credit derivatives, the risk positions are largely matched. |
| |
| | (iv) | Special purpose and variable interest entities |
| |
| | | HSBC predominantly uses special purpose entities ('SPE'), or variable interest entities ('VIE'), to securitise loans and advances it has originated where this source of funding is cost effective. Such loans and advances generally remain on the balance sheet under IFRSs. |
| |
| | | HSBC also administers SPEs that have been established for the purpose of providing alternative sources of financing to HSBC’s customers. Such arrangements also enable HSBC to provide tailored investment opportunities for investors. These SPEs, commonly referred to as asset-backed or multi-seller conduits, purchase interests in a diversified pool of receivables from customers or in the market using finance provided by a third party. The cash flows received by SPEs on pools of receivables are used to service the finance provided by investors. HSBC administers this arrangement, which facilitates diversification of funding sources and the tranching of credit risk. HSBC also typically provides part of the liquidity facilities to the entities, together with secondary credit enhancement. |
| |
| | | HSBC also has relationships with SPEs which offer management of investment funds, provide finance to public and private sector infrastructure projects, and facilitate capital funding through the issue of preference shares via partnerships. |
| |
| | | All SPEs used by HSBC are authorised centrally upon initial establishment to ensure appropriate purpose and governance. The activities of SPEs administered by HSBC are closely monitored by senior management. The use of SPEs is not a significant part of HSBC’s activities and HSBC is not reliant on the use of SPEs for any material part of its business operations or profitability. For a further discussion of HSBC’s involvement with SPEs and the accounting treatments under IFRSs and US GAAP, see Note 47(j) on the Financial Statements on page 398. |
| |
| |
| | Contractual obligations |
| |
|
| | The table below provides details of HSBC’s material contractual obligations as at 31 December 2005. |
| | |
| | | Payments due by period | |
|
| | | Less than | | | | More than |
| Total | 1 year | 1–5 years | 5 years |
| US$m | US$m | US$m | US$m |
| | | | | | | | | | |
| | Long-term debt obligations | 252,008 | | 107,741 | | 104,285 | | 39,982 | |
| | Term deposits and certificates of deposit | 171,349 | | 147,215 | | 24,134 | | – | |
| | Capital (finance) lease obligations | 639 | | 25 | | 54 | | 560 | |
| | Operating lease obligations | 3,950 | | 744 | | 1,754 | | 1,452 | |
| | Purchase obligations | 1,218 | | 922 | | 296 | | – | |
| | Short positions in debt securities and equity shares | 66,696 | | 55,491 | | 3,687 | | 7,518 | |
| | Pension obligations | 4,050 | | 390 | | 1,440 | | 2,220 | |
| | |
| |
| |
| |
| |
| | | 499,910 | | 312,528 | | 135,650 | | 51,732 | |
| | |
| |
| |
| |
| |
183
Back to Contents
| H S B C H O L D I N G S P L C |
| |
| |
| Other information (continued) |
| | |
| | |
The Group Chairman and Group Finance Director, with the assistance of other members of management, carried out an evaluation of the effectiveness of the design and operation of HSBC Holdings’ disclosure controls and procedures as of 31 December 2005. Based upon that evaluation, the Group Chairman and Group Finance Director concluded that HSBC’s disclosure controls and procedures as of 31 December 2005 were effective to provide reasonable assurance that information required to be disclosed in the reports which the company files and submits under the US Securities Exchange Act of 1934, as amended, is recorded, processed, summarised and reported as and when required. There are inherent limitations to the effectiveness of any system of disclosure controls and procedures, including the possibility of human error and the circumvention or overriding of the controls and procedures. Accordingly, even effective disclosure controls and procedures can only provide reasonable assurance of achieving their control objectives.
There has been no change in HSBC Holdings’ internal control over financial reporting during the year ended 31 December 2005 that has materially affected, or is reasonably likely to materially affect, HSBC Holdings’ internal control over financial reporting.
| |
| |
| Board of Directors and Senior Management |
| | |
| | |
| | Directors |
| |
|
| | Sir John Bond,Group Chairman |
| | (retiring on 26 May 2006) |
| |
| | Age 64. An executive Director since 1990; Group Chief Executive from 1993 to 1998. Joined HSBC in 1961; a non-executive Director of The Hongkong and Shanghai Banking Corporation Limited, having been an executive Director from 1988 to 1992. A Director of HSBC North America Holdings Inc. A Director of HSBC Bank plc from 1993 to 1997 and Chairman from 1998 to 2004. A non-executive Director of Ford Motor Company and of Vodafone Group Plc. Chairman of the Mayor of Shanghai’s International Business Leaders’ Advisory Council. |
| |
| * | The Baroness Dunn,DBE, Deputy Chairman and senior non-executive Director |
| |
| | Age 66. An executive Director of John Swire & Sons Limited and a Director of Swire Pacific Limited. A non-executive Director since 1990 and a non-executive Deputy Chairman since 1992. A member of the Nomination Committee. A non-executive Director of The Hongkong and Shanghai Banking Corporation |
| |
| | Limited from 1981 to 1996. A member of the Asia Task Force. A former Senior Member of the Hong Kong Executive Council and Legislative Council. |
| |
| † | Sir Brian Moffat,OBE, Deputy Chairman and senior independent non-executive Director |
| |
| | Age 67. Former Chairman of Corus Group plc. A non- executive Director since 1998 and a non-executive Deputy Chairman since 2001. Chairman of the Group Audit Committee and of the Nomination Committee. A member of the Court of the Bank of England. A non- executive Director of Macsteel Global BV. |
| |
| | S K Green,Group Chief Executive, |
| | (Group Chairman designate) |
| |
| | Age 57. An executive Director since 1998. Executive Director, Corporate, Investment Banking and Markets from 1998 to 2003. Joined HSBC in 1982. Group Treasurer from 1992 to 1998. Chairman of HSBC Bank plc, HSBC Bank Middle East Limited, HSBC Bank USA, N.A., HSBC Group Investment Businesses Limited, HSBC Private Banking Holdings (Suisse) A., and HSBC USA Inc. A Director of The Bank of Bermuda Limited, HSBC France, The Hongkong and Shanghai Banking Corporation Limited, Grupo |
| | |
| | |
184
Back to Contents
| | Financiero HSBC, S.A. de C.V., HSBC North America Holdings Inc. and HSBC Trinkaus & Burkhardt KGaA. |
| | |
| | A W Jebson, Group Chief Operating Officer |
| | (retiring on 26 May 2006) |
| | |
| | Age 56. An executive Director since 2000. Group IT Director from 2000 to 2003. Group General Manager, Information Technology from 1996 to 2000. Joined HSBC in 1978. A Director of HSBC Finance Corporation. |
| | |
| † | The Rt Hon the Lord Butler of Brockwell, KG, GCB, CVO |
| | |
| | Age 68. Master, University College, Oxford. A non- executive Director since 1998. Chairman of the Corporate Social Responsibility Committee, a member of the Nomination Committee and Chairman of the HSBC Education Trust. A non-executive Director of Imperial Chemical Industries plc. A member of the International Advisory Board of Marsh McLennan Inc. Chaired the UK Government Review of Intelligence on Weapons of Mass Destruction. Secretary of the Cabinet and Head of the Home Civil Service in the United Kingdom from 1988 to 1998. |
| | |
| † | R K F Ch’ien, CBE |
| | |
| | Age 54. Chairman of CDC Corporation and of its subsidiary, China.com Inc. A non-executive Director since 1998. A member of the Group Audit Committee. Non-executive Chairman of HSBC Private Equity (Asia) Limited and a non-executive Director of The Hongkong and Shanghai Banking Corporation Limited since 1997. Non-executive Chairman of MTR Corporation Limited and a non-executive Director of Convenience Retail Asia Limited, Inchcape plc, VTech Holdings Limited and The Wharf (Holdings) Limited. |
| | |
| † | J D Coombe |
| | |
| | Age 60. Former executive Director and Chief Financial Officer of GlaxoSmithKline plc. A non-executive Director since 1 March 2005. A member of the Group Audit Committee since 1 July 2005. Appointed a member of the Remuneration Committee with effect from 1 June 2006. A non-executive Director of the Supervisory Board of Siemens AG and a non- executive Director of GUS plc. A member of The Code Committee of the Panel on Takeovers and Mergers. A trustee of the Royal Academy Trust. A former Chairman of The Hundred Group of Finance Directors and a former member of the Accounting Standards Board. |
| | |
| † | R A Fairhead |
| | |
| | Age 44. Finance Director of Pearson plc. A non- |
| | executive Director since March 2004. A member of the Group Audit Committee. A non-executive Director of The Economist Newspaper Limited. Former Executive Vice President, Strategy and Group Control of Imperial Chemical Industries plc. |
| |
| | DJ Flint,Group Finance Director |
| |
| | Age 50. Joined HSBC as an executive Director in 1995. A Director of HSBC Bank Malaysia Berhad. Chaired the Financial Reporting Council’s review of the Turnbull Guidance on Internal Control. Served on the Accounting Standards Board and the Standards Advisory Council of the International Accounting Standards Board from 2001 to 2004. A non-executive Director of BP p.l.c. since 1 January 2005. A former partner in KPMG. |
| |
| † | W K L Fung,OBE |
| |
| | Age 57. Group Managing Director of Li & Fung Limited. A non-executive Director since 1998. A member of the Corporate Social Responsibility Committee and of the Remuneration Committee. Deputy Chairman and non-executive Director of The Hongkong and Shanghai Banking Corporation Limited. A non-executive Director of Bank of Communications Limited. Former Chairman of the Hong Kong General Chamber of Commerce, the Hong Kong Exporters’ Association and the Hong Kong Committee for the Pacific Economic Co-operation Council. |
| |
| | F Geoghegan,CBE, Deputy Chairman, HSBC Bank plc. (Group Chief Executive designate) |
| |
| | Age 52. An executive Director since March 2004. Joined HSBC in 1973. A Director and, since 6 March 2006, Deputy Chairman of HSBC Bank plc. A Director of HSBC France and HSBC Private Banking Holdings (Suisse) S.A. President of HSBC Bank Brasil S.A.- Banco Múltiplo from 1997 to 2003 and responsible for all of HSBC’s business throughout South America from 2000 to 2003. Chief Executive of HSBC Bank plc from January 2004 to 6 March 2006. A non-executive Director and Chairman of Young Enterprise. |
| |
| † | S Hintze |
| |
| | Age 61. Former Chief Operating Officer of Barilla P.A. A non-executive Director since 2001. Amember of the Corporate Social Responsibility Committee and of the Remuneration Committee. A non-executive Director of Premier Foods plc and the Society of Genealogists, a registered charity. A former Senior Vice President of Nestlé S.A. With Mars Incorporated from 1972 to 1993, latterly as Executive Vice President of M&M/Mars in New Jersey. A former non-executive Director of Safeway plc. |
| |
| |
| |
| |
185
Back to Contents
| H S B C H O L D I N G S P L C |
| |
| |
| Board of Directors and Senior Management (continued) |
| | |
| | |
| † | J W J Hughes-Hallett |
| | |
| | Age 56. Chairman of John Swire & Sons Limited. A non-executive Director since 1 March 2005. Appointed a member of the Group Audit Committee with effect from 1 June 2006. A non-executive Director of The Hongkong and Shanghai Banking Corporation Limited from 1999 to 2004. A non-executive Director and formerly Chairman of Cathay Pacific Airways Limited and Swire Pacific Limited. A trustee of the Dulwich Picture Gallery, the Hong Kong Maritime Museum and the Esmée Fairbairn Foundation. |
| | |
| † | Sir John Kemp-Welch (retiring on 26 May 2006) |
| | |
| | Age 69. Former Joint Senior Partner of Cazenove & Co and former Chairman of the London Stock Exchange. A non-executive Director since 2000. A member of the Group Audit Committee and of the Remuneration Committee. A Deputy Chairman of the Financial Reporting Council and a member of the Panel on Takeovers and Mergers from 1994 to 2000. |
| | |
| † | Sir Mark Moody-Stuart, KCMG |
| | |
| | Age 65. Chairman of Anglo American plc. A non- executive Director since 2001. Chairman of the Remuneration Committee and a member of the Corporate Social Responsibility Committee. A non- executive Director of Accenture Limited, a Governor of Nuffield Hospitals, President of the Liverpool School of Tropical Medicine and Chairman of the Global Business Coalition on HIV/AIDS. A former Director and Chairman of The ‘Shell’ Transport and Trading Company, plc and former Chairman of the Committee of Managing Directors of the Royal Dutch/Shell Group of Companies. |
| | |
| † | S W Newton |
| | |
| | Age 64. Chairman of The Real Return Holdings Company Limited. A non-executive Director since 2002. A Member of the Advisory Board of the East Asia Institute and of the Investment Board at Cambridge University. A Member of The Wellcome Trust Investment Committee. Founder of Newton Investment Management, from which he retired in 2002. |
| | |
| † | S M Robertson |
| | |
| | Age 65. Non-executive Chairman of Rolls-Royce Group plc and the founder member of Simon Robertson Associates LLP. A non-executive Director since 3 January 2006. A Director of The Economist Newspaper Limited, The Royal Opera House Covent Garden Limited and a non-executive Director of Berry Bros. & Rudd Limited. Chairman of Trustees of the Royal Academy Trust and the Ernest Kleinwort |
| | |
| | |
| | Charitable Trust. A trustee of the Eden Project and the Royal Opera House Endowment Fund. A former Managing Director of Goldman Sachs International. Former Chairman of Dresdner Kleinwort Benson and a former non-executive Director of Inchcape plc, Invensys plc and the London Stock Exchange. |
| |
| * | H Sohmen,OBE |
| |
| | Age 66. Chairman of Bergesen Worldwide Limited and Bergesen Worldwide Gas ASA. Chairman and President of BW Corporation Limited (formerly World-Wide Shipping Group Limited) and Chairman of The International Tanker Owners Pollution Federation Limited. A non-executive Director since 1990. A non-executive Director of The Hongkong and Shanghai Banking Corporation Limited from 1984 to May 2005 and Deputy Chairman from 1996 to May 2005. |
| | |
| † | Sir Brian Williamson, CBE |
| | |
| | Age 61. Chairman of Electra Private Equity plc. A non-executive Director since 2002. A member of the Nomination Committee. A non-executive Director of Resolution plc. A member of the Supervisory Board of Euronext NV. A senior adviser to Fleming Family and Partners. Former Chairman of London International Financial Futures and Options Exchange, Gerrard Group plc and Resolution Life Group Limited. A former non-executive Director of the Financial Services Authority and of the Court of The Bank of Ireland. |
| | |
| | * Non-executive Director |
| | † Independent non-executive Director |
| | |
| | Adviser to the Board |
| |
|
| | D J Shaw |
| | |
| | Age 59. An Adviser to the Board since 1998. Solicitor. A partner in Norton Rose from 1973 to 1998. A Director of The Bank of Bermuda Limited and HSBC Private Banking Holdings (Suisse) S.A. |
| | |
| | Secretary |
| |
|
| | R G Barber |
| | |
| | Age 55. Group Company Secretary since 1990. Joined HSBC in 1980; Corporation Secretary of The Hongkong and Shanghai Banking Corporation Limited from 1986 to 1992. Company Secretary of HSBC Bank plc from 1994 to 1996. |
| | |
| | |
| | |
186
Back to Contents
| | Group Managing Directors |
| |
|
| | |
| | V H C Cheng, OBE |
| | |
| | Age 57. Chairman of The Hongkong and Shanghai Banking Corporation Limited. A Group Managing Director since 25 May 2005. Joined HSBC in 1978. Appointed a Group General Manager in 1995. Deputy Chairman and Chief Executive Officer of Hang Seng Bank Limited from 1998 to 25 May 2005. |
| | |
| | C-H Filippi |
| | |
| | Age 53. Chairman and Chief Executive Officer of HSBC France. A Group Managing Director since 2004. A Director of HSBC Bank plc. Joined HSBC France in 1987 having previously held senior appointments in the French civil service. Appointed a Group General Manager in 2001. Global Head of Corporate and Institutional Banking from 2001 to 2004. |
| | |
| | ST Gulliver |
| | |
| | Age 46. Co-Head Corporate, Investment Banking and Markets. A Group Managing Director since 2004. Joined HSBC in 1980. Appointed a Group General Manager in 2000. Head of Treasury and Capital Markets in Asia-Pacific from 1996 to 2002 and Head of Global Markets from 2002 to 2003. |
| | |
| | D D J John |
| | |
| | Age 55. Chief Executive, HSBC Bank plc and a Group Managing Director since 6 March 2006. Joined HSBC Bank plc in 1971. Appointed a Group General Manager in 2000. Deputy Chairman and Chief Executive Officer, HSBC Bank Malaysia Berhad from 1999 to 2002. Chief Operating Officer of HSBC Bank plc from 2003 to May 2005 and Deputy Chief Executive from May 2005 to 6 March 2006. |
| | |
| | S N Mehta |
| | |
| | Age 47. Chief Executive of HSBC North America Holdings Inc, and Chairman and Chief Executive Officer of HSBC Finance Corporation since March 2005. A Group Managing Director since 30 April 2005. Joined HSBC Finance Corporation in 1998 and was appointed Vice Chairman in April 2004. |
| | |
| | Y A Nasr |
| | Age 51. President, HSBC Bank Brasil S.A.-Banco Múltiplo. A Group Managing Director since 2004. Joined HSBC in 1976. Appointed a Group General Manager in 1998. President and Chief Executive Officer of HSBC Bank Canada from 1997 to 1999. President and Chief Executive Officer of HSBC USA Inc. and HSBC Bank USA from 1999 to 2003. |
| | J J Studzinski |
| | |
| | Age 49. Co-Head Corporate, Investment Banking and Markets. A Group Managing Director since 2004. Joined HSBC in 2003 as a Group General Manager, having previously been with Morgan Stanley from 1980 to 2003, latterly as Deputy Chairman of Morgan Stanley International. |
| | |
| | Group General Managers |
| |
|
| | |
| | PY Antika |
| | |
| | Age 45. Chief Executive Officer, HSBC Turkey. Joined HSBC in 1990. Appointed a Group General Manager 1 August 2005. |
| | |
| | R J Arena |
| | |
| | Age 57. Group General Manager, Global e-business. Joined HSBC in 1999. Appointed a Group General Manager in 2000. |
| | |
| | C C R Bannister |
| | Age 47. Chief Executive Officer, Group Private Banking. Joined HSBC in 1994. Appointed a Group General Manager in 2001. |
| | |
| | R E T Bennett |
| | |
| | Age 54. Group General Manager, Legal and Compliance. Joined HSBC in 1979. Appointed a Group General Manager in 1998. |
| | |
| | N S K Booker |
| | |
| | Age 47. Chief Executive Officer, India. Joined HSBC in 1981. Appointed a Group General Manager in January 2004. |
| | |
| | P W Boyles |
| | |
| | Age 50. Group General Manager, Human Resources. Joined HSBC in 1975. Appointed a Group General Manager on 1 January 2006. |
| | |
| | D C Budd |
| | |
| | Age 52. Chief Operating Officer and Executive Director, HSBC Bank plc. Joined HSBC in 1972. Appointed a Group General Manager on 5 May 2005. |
| | |
| | G P S Calvert, OBE |
| | |
| | Age 53. Group General Manager Special Duties. Joined HSBC in 1974. Appointed a Group General Manager in June 2004. |
| | |
| | Z J Cama |
| | |
| | Age 58. Deputy Chairman and Chief Executive Officer, HSBC Bank Malaysia Berhad. Joined HSBC in 1968. Appointed a Group General Manager in 2001. |
| | |
187
Back to Contents
| H S B C H O L D I N G S P L C |
| |
| |
| Board of Directors and Senior Management (continued) |
| | |
| | |
S L Derickson
Age 52. Vice Chairman of HSBC Finance Corporation. Joined HSBC Finance Corporation in 2000. Appointed a Group General Manager on 30 April 2005.
A A Flockhart
Age 54. Chief Executive Officer and Chairman, Grupo Financiero HSBC, S.A. de C.V. and HSBC México, S.A. Joined HSBC in 1974. Appointed a Group General Manager in 2002.
M J G Glynn
Age 54. President and Chief Executive Officer, HSBC Bank USA, N.A. Joined HSBC in 1982. Appointed a Group General Manager in 2001.
L Gordon
Age 53. President and Chief Executive Officer, HSBC Bank Canada. Joined HSBC in 1987. Appointed a Group General Manager on 1 August 2005.
K M Harvey
Age 45. Group General Manager and Group Chief Information Officer. Joined HSBC Finance Corporation in 1989. Appointed a Group General Manager in August 2004.
D H Hodgkinson
Age 55. Chief Executive Officer and Deputy Chairman, HSBC Bank Middle East Limited. Joined HSBC in 1969. Appointed a Group General Manager in 2003.
A P Hope
Age 59. Group General Manager, Insurance. Joined HSBC in 1971. Appointed a Group General Manager in 1996.
M J W King
Age 49. Group General Manager, Internal Audit. Joined HSBC in 1986. Appointed a Group General Manager in 2002.
P J Lawrence
Age 44. Chief Executive Officer, HSBC Singapore. Joined HSBC in 1982. Appointed a Group General Manager on 1 August 2005.
M Leung
Age 53. Global Co-Head Commercial Banking. Joined HSBC in 1978. Appointed a Group General Manager on 1 August 2005.
B McDonagh
Age 47. Chief Operating Officer, HSBC Bank USA, N.A. Joined HSBC in 1979. Appointed a Group General Manager on 1 August 2005.
R C F Or
Age 56. Vice-Chairman and Chief Executive, Hang Seng Bank Limited and Executive Director, The Hongkong and Shanghai Banking Corporation Limited. Joined HSBC in 1972. Appointed a Group General Manager in 2000.
K Patel
Age 57. Chief Executive Officer, South Africa branch of HSBC Bank plc and Head of Africa. Joined HSBC in 1984. Appointed a Group General Manager in 2000.
R C Picot
Age 48. Group Chief Accounting Officer. Joined HSBC in 1993. Appointed a Group General Manager in 2003.
B Robertson
Age 51. Group General Manager, Credit and Risk. Joined HSBC in 1975. Appointed a Group General Manager in 2003.
M R P Smith, OBE
Age 49. President and Chief Executive Officer, The Hongkong and Shanghai Banking Corporation Limited. Chairman, Hang Seng Bank Limited. Joined HSBC in 1978. Appointed a Group General Manager in 2000.
I A Stewart
Age 47. Head of Transaction Banking, Corporate, Investment Banking and Markets. Joined HSBC in 1980. Appointed a Group General Manager in 2000.
P E Stringham
Age 56. Group General Manager, Marketing. Joined HSBC in 2001. Appointed a Group General Manager in 2001.
P A Thurston
Age 52. Group General Manager, Personal Financial Services, Asia-Pacific. Joined HSBC in 1975. Appointed a Group General Manager in 2003.
PT S Wong
Age 54. Executive Director, Hong Kong and Mainland China of The Hongkong and Shanghai Banking Corporation Limited. Joined HSBC 28 February 2005. Appointed a Group General Manager on 1 April 2005.
188
Back to Contents
H S B C H O L D I N G S P L C
Report ofthe Directors
| Results and dividends for 2005 |
|
HSBC reported profit before tax of US$20,966 million. Profit attributable to shareholders of HSBC Holdings, transferred to retained earnings, was US$15,081 million, a 16.8 per cent return on average total shareholders’ equity.
First, second and third interim dividends for 2005, each of US$0.14 per ordinary share, were paid on 6 July 2005, 5 October 2005 and 19 January 2006 respectively. Note 11 on the Financial Statements gives more information on the dividends declared in 2005. On 6 March 2006, the Directors declared a fourth interim dividend for 2005 of US$0.31 per ordinary share in lieu of a final dividend, which will be payable to ordinary shareholders on 11 May 2006 in cash in US dollars, or in sterling or Hong Kong dollars at exchange rates to be determined on 2 May 2006, with a scrip dividend alternative. As the fourth interim dividend for 2005 was declared after the balance sheet date it has not been included as a creditor at 31 December 2005. The reserves available for distribution at 31 December 2005 are US$10,643 million.
A first dividend of US$14.294444 per 6.20 per cent non-cumulative US dollar preference share, Series A (‘Series A dollar preference share’), equivalent to a dividend of US$0.357361 per Series A American Depositary Shares (‘Series A ADS’), each of which represents one-fortieth of a Series A dollar preference share, was paid on 15 December 2005.
Further information about the results is given in the consolidated income statement on page 236.
| Principal activities and business review |
|
Through its subsidiaries and associates, HSBC provides a comprehensive range of banking and related financial services. HSBC operates through long-established businesses and has an international network in 76 countries and territories in Europe, the Asia-Pacific region, the Americas, the Middle East and Africa. Taken together, the five largest customers of HSBC do not account for more than one per cent of HSBC’s income.
The principal acquisitions and disposals made during the year were:
In June 2005, US$430 million was invested in the initial public offering of Bank of Communications Co. Limited, maintaining the Group’s investment at 19.9 per cent.
In August 2005, a further 9.91 per cent of Ping An Insurance (Group) Company of China Ltd. was
acquired for US$1,039 million, bringing the Group's aggregate holding to 19.9 per cent.
In December 2005, Metris Companies Inc. was acquired for US$1,595 million.
In October 2005, the Group’s interest in Framlington Group Limited was sold for US$156 million.
A review of the development of the business of HSBC undertakings during the year and an indication of likely future developments are given in the ‘Description of Business’ on pages 7 to 19.
| Share capital and reserves |
|
The following events in relation to the share capital of HSBC Holdings occurred during the year:
Ordinary shares of US$0.50 each
Scrip dividends
| 1. | 14,944,042 ordinary shares were issued at par on 20 January 2005 to shareholders who elected to receive new shares in lieu of the 2004 third interim dividend. The market value per share used to calculate shareholders’ entitlements to new shares was US$16.9969, being the US dollar equivalent of £8.934. |
| | |
| 2. | 27,142,444 ordinary shares were issued at par on 4 May 2005 to shareholders who elected to receive new shares in lieu of the 2004 fourth interim dividend. The market value per share used to calculate shareholders’ entitlements to new shares was US$15.8923, being the US dollar equivalent of £8.371. |
| | |
| 3. | 42,694,641 ordinary shares were issued at par on 6 July 2005 to shareholders who elected to receive new shares in lieu of the 2005 first interim dividend. The market value per share used to calculate shareholders’ entitlements to new shares was US$15.8448, being the US dollar equivalent of £8.656. |
| | |
| 4. | 19,180,779 ordinary shares were issued at par on 5 October 2005 to shareholders who elected to receive new shares in lieu of the 2005 second interim dividend. The market value per share used to calculate shareholders’ entitlements to new shares was US$16.2305, being the US dollar equivalent of £9.032. |
All-Employee share plans
| 5. | 29,692,885 ordinary shares were issued at prices ranging from £5.3496 to £8.442 per share in connection with the exercise of options under |
189
Back to Contents
H S B C H O L D I N G S P L C
Report of the Directors(continued)
| | the HSBC Holdings savings-related share option plans. Options over 8,607,677 ordinary shares lapsed. |
| | |
| 6. | 3,705,594 ordinary shares were issued at €10.525 per share in connection with a Plan d’Epargne Entreprise for the benefit of non-UK resident employees of HSBC France and its subsidiaries. |
| | |
| 7. | Options over 26,994,655 ordinary shares were awarded at nil consideration on 24 May 2005 to over 48,700 HSBC employees resident in nearly 60 countries and territories under the HSBC Holdings savings-related share option plans. The options are exercisable within six months following the third or fifth anniversary of the commencement of the relevant savings contracts on 1 August 2005 at a price of £6.6792 per share, a 20 per cent discount to the average market value over the five business days immediately preceding the date of the invitation. |
Discretionary share incentive plans
| 8. | 11,205,883 ordinary shares were issued at prices ranging from £2.1727 to £7.46 per share in connection with the exercise of options under the HSBC Holdings Executive Share Option Scheme. Options over 530,920 ordinary shares lapsed. |
| | |
| 9. | 11,764,081 ordinary shares were issued at prices ranging from £6.91 to £8.712 per share in connection with the exercise of options under the HSBC Holdings Group Share Option Plan. Options over 6,393,502 ordinary shares lapsed. |
| | |
| 10. | Options over 552,526 ordinary shares were awarded at nil consideration on 21 June 2005 under The HSBC Share Plan. The options are normally exercisable between the third and fourth anniversaries of the award at a price of £8.794 per share, the market value of the ordinary shares on the date of award. |
| | |
| 11. | Options over 74,985 ordinary shares were awarded at nil consideration on 30 September 2005 under The HSBC Share Plan. The options are normally exercisable between the third and tenth anniversaries of the award at a price of £9.17 per share, the market value of the ordinary shares on the date of award. |
HSBC Finance
| 12. | 324,726 ordinary shares were issued at US$9.60 in connection with the early settlement of HSBC Finance 8.875 per cent Adjustable Conversion- |
| | Rate Equity Security Units. |
| | |
| 13. | 878,224 ordinary shares were issued at prices ranging from US$15.51 to US$16.86 in connection with the vesting of Restricted Stock Rights under HSBC Finance share plans that have been converted into rights over HSBC Holdings ordinary shares. |
Authority to repurchase ordinary shares
| 14. | At the Annual General Meeting in 2005, shareholders renewed the authority for the Company to make market repurchases of up to 1,119,000,000 ordinary shares. The Directors have not exercised this authority. In accordance with the terms of a waiver granted by the Hong Kong Stock Exchange on 19 December 2005, HSBC Holdings will comply with the applicable law and regulation in the UK in relation to the holding of any shares in treasury and with the conditions of the waiver, in connection with any shares it may hold in treasury. |
Non-cumulative US dollar preference shares of US$0.01 each
| 15. | On 22 September and 6 October 2005, a total of US$1,450 million was raised by the issue of a total of 1,450,000 non-cumulative US dollar preference shares of US$0.01 each (the ‘Series A dollar preference shares’) which trade in the form of Series A ADS. The Series A dollar preference shares were issued to bearer for a consideration of US$1,000 each and qualify as core Tier 1 capital in HSBC’s regulatory capital base. The aggregate nominal value of the Series A dollar preference shares which have been issued is US$14,500. The net proceeds after expenses were approximately US$1,405 million, which was used to support the development of HSBC Holdings and further strengthen HSBC’s capital base. |
| | |
| | A non-cumulative fixed-rate dividend of 6.20 per cent per annum is payable quarterly on the Series A dollar preference shares. Dividends will be payable at the sole and absolute discretion of the Board of HSBC Holdings and will not be payable if the payment of the dividend would cause HSBC Holdings not to meet the applicable capital adequacy requirements of the UK Financial Services Authority, or the profits of HSBC Holdings available for distribution as dividends are not sufficient to enable HSBC Holdings to pay in full both dividends on the Series A dollar preference shares and dividends on any other of |
190
Back to Contents
| | its shares that are scheduled to be paid on the same date and that have an equal right to dividends. HSBC Holdings may not declare or pay dividends or distributions on any class of its shares ranking lower in the right to dividends than the Series A dollar preference shares nor redeem nor purchase in any manner any of its other shares ranking equal to or lower than the Series A dollar preference shares, unless it has paid in full, or set aside an amount to provide for payment in full, the dividends on the Series A dollar preference shares for the then-current dividend period. |
| | |
| | Holders of the Series A dollar preference shares will only be entitled to attend and vote at general meetings of shareholders of HSBC Holdings if the dividend payable on the Series A dollar preference shares has not been paid in full for four consecutive dividend payment dates. In such circumstances, holders of the Series A dollar preference shares will be entitled to vote on all matters put to general meetings until such time as HSBC Holdings shall have paid in full a dividend on the Series A dollar preference shares. The Series A dollar preference shares carry no rights of conversion into ordinary shares of HSBC Holdings. |
| | |
| | Subject to the prior consent of the UK Financial Services Authority, HSBC Holdings may redeem the Series A dollar preference shares in whole (but not in part only) at any time on or after 16 December 2010, at a redemption price equal to US$1,000 per Series A dollar preference share (which is equal to US$25 per Series A ADS) together with any accrued and unpaid dividends for the then-current dividend period up to the date fixed for redemption. |
Authority to allot shares
| 16. | At the Annual General Meeting in 2005 shareholders renewed the authority for the Directors to allot new shares. The authority was to allot up to 2,238,000,000 ordinary shares, 10,000,000 non-cumulative preference shares of £0.01 each, 10,000,000 non-cumulative preference shares of US$0.01 each and 10,000,000 non-cumulative preference shares of €0.01 each. |
| | |
| | Other than as described in paragraphs 1 to 13 and 15 above, the Directors did not allot any shares during 2005. |
| |
| Employee share option plans |
|
To help align the interests of employees with those
of shareholders, share options are granted under all-employee share plans. Since 2005, discretionary options have not been granted on a widespread basis. The following are particulars of outstanding employee share options, including those held by employees working under employment contracts that are regarded as ‘continuous contracts’ for the purposes of the Hong Kong Employment Ordinance. The options were granted at nil consideration. No options have been granted to substantial shareholders, suppliers of goods or services, or in excess of the individual limit for each share plan. No options were cancelled during the year. Employee share plans are subject to the following limits on the number of HSBC Holdings ordinary shares that may be subscribed for. In any 10-year period not more than 10 per cent of the HSBC Holdings ordinary shares in issue from time to time (approximately 1,137 million HSBC Holdings ordinary shares at 6 March 2006) may in aggregate become issuable pursuant to the grant of options or be issued other than pursuant to options under all-employee share plans. In any 10-year period not more than 5 per cent of the HSBC Holdings ordinary shares in issue from time to time (approximately 568 million HSBC Holdings ordinary shares on 6 March 2006) may in aggregate be put under option under The HSBC Share Plan or be issuable pursuant to the HSBC Holdings Group Share Option Plan, the HSBC Executive Share Option Scheme, the HSBC Holdings Restricted Share Plan 2000 or The HSBC Share Plan. The number of HSBC Holdings ordinary shares that may be issued on exercise of all options granted on or after 27 May 2005 under The HSBC Share Plan and any other plans must not exceed 1,119,000,000 HSBC Holdings ordinary shares. Under the HSBC Holdings savings-related share option plans, The HSBC Share Plan, HSBC Holdings Group Share Option Plan and the HSBC Holdings Executive Share Option Scheme there were options outstanding over 341,281,540 HSBC Holdings ordinary shares at 31 December 2005. Particulars of options over HSBC Holdings shares held by Directors of HSBC Holdings are set out on pages 215 to 232 of the Directors’ Remuneration Report.
All-employee share plans
The HSBC Holdings Savings-Related Share Option Plan and the HSBC Holdings Savings-Related Share Option Plan: International are all-employee share plans under which eligible HSBC employees (those employed within the Group on the first working day of the year of grant) are granted options to acquire HSBC Holdings ordinary shares. Employees may make contributions of up to £250 (or equivalent)
191
Back to Contents
H S B C H O L D I N G S P L C
Report of the Directors(continued)
overall each month over a period of three or five years which may be used on the third or fifth anniversary of the commencement of the relevant savings contract, at their election, to exercise the options; alternatively the employee may elect to have the savings (plus interest) repaid in cash. The options are exercisable within six months following the third or fifth anniversary of the commencement of the relevant savings contract. In the case of redundancy, retirement on grounds of injury or ill health, retirement at or after normal retirement age, the transfer of the employing business to another party, or a change of control of the employing company, options may be exercised before completion of the relevant savings contract. Following approval at the 2005 Annual General Meeting, the HSBC Holdings Savings-Related ShareOption Plan: International will offer the choice of options over one year in addition to the existing
three and five year terms. Employees will also be able to save and have option prices expressed in US dollars, Hong Kong dollars or euros. Options granted over a one-year period will be exercisable within three months following the first anniversary of the commencement of the savings contract. Under the HSBC Holdings Savings-Related Share Option Plan and the HSBC Holdings Savings-Related Share Option Plan: International the option exercise price is determined by reference to the average market value of the ordinary shares on the five business days immediately preceding the invitation date, then applying a discount of 20 per cent (except for the one-year options granted under the US sub-plan where a 15 per cent discount will be applied). The all-employee share plans will terminate on 27 May 2015 unless the Directors resolve to terminate the plans at an earlier date.
HSBC Holdings Savings-Related Share Option Plan
HSBC Holdings ordinary shares of US$0.50
| | | | | | | | Options at | | Options | | Options | | Options | | Options at | |
| Date of | Exercise | | Exercisable | | Exercisable | | 1 January | | awarded | | exercised | | lapsed | | 31 December | |
| award | price (£) | | from | 1 | until | 2 | 2005 | | during year | 3 | during year | 4 | during year | | 2005 | |
| | | | | | | | | | | | | | | | | |
| 1 Apr 1999 | 5.3980 | | 1 Aug 2004 | | 31 Jan 2005 | | 199,542 | | – | | 166,335 | | 33,207 | | – | |
| 10 Apr 2000 | 6.0299 | | 1 Aug 2005 | | 31 Jan 2006 | | 10,085,436 | | – | | 9,722,684 | | 204,222 | | 158,530 | |
| 11 Apr 2001 | 6.7536 | | 1 Aug 2004 | | 31 Jan 2005 | | 68,525 | | – | | 42,156 | | 26,369 | | – | |
| 11 Apr 2001 | 6.7536 | | 1 Aug 2006 | | 31 Jan 2007 | | 3,728,076 | | – | | 186,369 | | 213,351 | | 3,328,356 | |
| 2 May 2002 | 6.3224 | | 1 Aug 2005 | | 31 Jan 2006 | | 1,474,971 | | – | | 1,393,516 | | 49,678 | | 31,777 | |
| 2 May 2002 | 6.3224 | | 1 Aug 2007 | | 31 Jan 2008 | | 4,212,972 | | – | | 125,068 | | 281,882 | | 3,806,022 | |
| 23 Apr 2003 | 5.3496 | | 1 Aug 2006 | | 31 Jan 2007 | | 7,878,002 | | – | | 303,561 | | 693,981 | | 6,880,460 | |
| 23 Apr 2003 | 5.3496 | | 1 Aug 2008 | | 31 Jan 2009 | | 13,049,424 | | – | | 236,973 | | 1,021,175 | | 11,791,276 | |
| 21 Apr 2004 | 6.4720 | | 1 Aug 2007 | | 31 Jan 2008 | | 4,255,200 | | – | | 70,818 | | 634,349 | | 3,550,033 | |
| 21 Apr 2004 | 6.4720 | | 1 Aug 2009 | | 31 Jan 2010 | | 6,327,198 | | – | | 43,850 | | 554,868 | | 5,728,480 | |
| 24 May 2005 | 6.6792 | | 1 Aug 2008 | | 31 Jan 2009 | | – | | 4,779,913 | | 1,631 | | 195,390 | | 4,582,892 | |
| 24 May 2005 | 6.6792 | | 1 Aug 2010 | | 31 Jan 2011 | | – | | 5,890,418 | | 568 | | 136,735 | | 5,753,115 | |
| | |
| 1 | May be advanced to an earlier date in certain circumstances, e.g. retirement. |
| 2 | May be extended to a later date in certain circumstances, e.g. on the death of a participant the executors may exercise the option up to six months beyond the normal exercise period. |
| 3 | The closing price per share on 23 May 2005, the day before the options were awarded, was £8.68. |
| 4 | The weighted average closing price of the shares immediately before the dates on which options were exercised was £9.15. |
192
Back to Contents
HSBC Holdings Savings-Related Share Option Plan: International
HSBC Holdings ordinary shares of US$0.50
| | | | | | | | Options at | | Options | | Options | | Options | | Options at | |
| Date of | Exercise | | Exercisable | | Exercisable | | 1 January | | awarded | | exercised | | lapsed | | 31 December | |
| award | price (£) | | from | 1 | until | 2 | 2005 | | during year | 3 | during year | 4 | during year | | 2005 | |
| | | | | | | | | | | | | | | | | |
| 1 Apr 1999 | 5.3980 | | 1 Aug 2004 | | 31 Jan 2005 | | 170,388 | | – | | 103,666 | | 66,722 | | – | |
| 10 Apr 2000 | 6.0299 | | 1 Aug 2005 | | 31 Jan 2006 | | 15,687,141 | | – | | 14,377,189 | | 849,721 | | 460,231 | |
| 11 Apr 2001 | 6.7536 | | 1 Aug 2004 | | 31 Jan 2005 | | 374,043 | | – | | 85,864 | | 288,179 | | – | |
| 11 Apr 2001 | 6.7536 | | 1 Aug 2006 | | 31 Jan 2007 | | 1,341,245 | | – | | 12,748 | | 53,127 | | 1,275,370 | |
| 2 May 2002 | 6.3224 | | 1 Aug 2005 | | 31 Jan 2006 | | 3,063,749 | | – | | 2,691,243 | | 250,711 | | 121,795 | |
| 2 May 2002 | 6.3224 | | 1 Aug 2007 | | 31 Jan 2008 | | 1,151,329 | | – | | 4,457 | | 47,291 | | 1,099,581 | |
| 23 Apr 2003 | 5.3496 | | 1 Aug 2006 | | 31 Jan 2007 | | 10,459 | | – | | – | | – | | 10,459 | |
| 23 Apr 2003 | 5.3496 | | 1 Aug 2008 | | 31 Jan 2009 | | 10,488 | | – | | – | | – | | 10,488 | |
| 8 May 2003 | 5.3496 | | 1 Aug 2006 | | 31 Jan 2007 | | 16,384,589 | | – | | 76,043 | | 820,236 | | 15,488,310 | |
| 8 May 2003 | 5.3496 | | 1 Aug 2008 | | 31 Jan 2009 | | 6,265,693 | | – | | 15,748 | | 240,748 | | 6,009,197 | |
| 21 Apr 2004 | 6.4720 | | 1 Aug 2007 | | 31 Jan 2008 | | 49,524 | | – | | – | | – | | 49,524 | |
| 21 Apr 2004 | 6.4720 | | 1 Aug 2009 | | 31 Jan 2010 | | 14,488 | | – | | 357 | | 1,766 | | 12,365 | |
| 10 May 2004 | 6.4720 | | 1 Aug 2007 | | 31 Jan 2008 | | 10,118,832 | | – | | 23,169 | | 860,067 | | 9,235,596 | |
| 10 May 2004 | 6.4720 | | 1 Aug 2009 | | 31 Jan 2010 | | 3,272,604 | | – | | 6,479 | | 169,196 | | 3,096,929 | |
| 24 May 2005 | 6.6792 | | 1 Aug 2008 | | 31 Jan 2009 | | – | | 12,304,413 | | 2,202 | | 316,101 | | 11,986,110 | |
| 24 May 2005 | 6.6792 | | 1 Aug 2010 | | 31 Jan 2011 | | – | | 4,019,911 | | 191 | | 70,113 | | 3,949,607 | |
| | |
| 1 | May be advanced to an earlier date in certain circumstances, e.g. retirement. |
| 2 | May be extended to a later date in certain circumstances, e.g. on the death of a participant the executors may exercise the option up to six months beyond the normal exercise period. |
| 3 | The closing price per share on 23 May 2005, the day before the options were awarded, was £8.68. |
| 4 | The weighted average closing price of the shares immediately before the dates on which options were exercised was £9.22. |
Discretionary share option plans
The HSBC Share Plan and previously the HSBC Holdings Group Share Option Plan and the HSBC Holdings Executive Share Option Scheme, are discretionary share option plans under which HSBC employees, based on performance criteria and potential, have been granted options to acquire HSBC Holdings ordinary shares. Since 1996 the vesting of these options has been subject to the attainment of pre-determined performance criteria, except within HSBC France (which was acquired in 2000) where performance criteria are being phased in. The maximum value of options which may be granted to an employee in any one year under The HSBC Share Plan (when taken together with any Performance Share awards made under The HSBC Share Plan) is 700 per cent of the employee’s annual salary at the date of grant. Whilst having flexibility to make total awards of options and Performance Shares at this level in certain exceptional circumstances, the Remuneration Committee does not intend seven times salary to be the normal level of award. Under the HSBC Holdings Group Share Option Plan the maximum value of options which could have been granted to an employee in any one year (together with any Performance Share awards under the HSBC Holdings Restricted Share Plan 2000) was 150 per cent of the employee’s annual salary at the date of grant plus any bonus paid for the previous year (or in exceptional circumstances 225
per cent). Subject to achievement of the performance condition where applicable, options are generally exercisable between the third and tenth anniversary of the date of grant. Employees of a subsidiary that is sold or transferred out of HSBC may exercise options awarded under the HSBC Holdings Group Share Option Plan within six months of the sale or transfer regardless of whether the performance condition is met.
The Remuneration Committee favours the use of Performance Shares and Restricted Shares and, following the introduction of The HSBC Share Plan in 2005, does not intend to continue granting discretionary options on any widespread basis. There are locations, and there may be particular circumstances in the future, however, where option grants may be appropriate.
The exercise price of options granted under The HSBC Share Plan, and previously under the HSBC Holdings Group Share Option Plan, is the higher of the average market value of the ordinary shares on the five business days prior to the grant of the option or the market value of the ordinary shares on the date of grant of the option. The exercise price of options granted under the HSBC Holdings Executive Share Option Scheme was the market value of the ordinary shares on the business day prior to the grant of the option. The HSBC Share Plan will terminate on 27 May 2015 unless the Directors resolve to terminate the Plan at an earlier date.
193
Back to Contents
H S B C H O L D I N G S P L C
Report of the Directors(continued)
HSBC Holdings Executive Share Option Scheme
HSBC Holdings ordinary shares of US$0.50
| | | | | | | | Options at | | Options | | Options | | Options at | |
| Date of | Exercise | | Exercisable | | Exercisable | | 1 January | | exercised | | lapsed | | 31 December | |
| award | price (£) | | from | 1 | until | 2 | 2005 | | during year | 3 | during year | | 2005 | |
| | | | | | | | | | | | | | | |
| 7 Mar 1995 | 2.1727 | | 7 Mar 1998 | | 7 Mar 2005 | | 100,500 | | 100,500 | | – | | – | |
| 1 Apr 1996 | 3.3334 | | 1 Apr 1999 | | 1 Apr 2006 | | 350,670 | | 142,401 | | – | | 208,269 | |
| 24 Mar 1997 | 5.0160 | | 24 Mar 2000 | | 24 Mar 2007 | | 781,911 | | 209,092 | | – | | 572,819 | |
| 12 Aug 1997 | 7.7984 | | 12 Aug 2000 | | 12 Aug 2007 | | 14,625 | | – | | – | | 14,625 | |
| 16 Mar 1998 | 6.2767 | | 16 Mar 2001 | | 16 Mar 2008 | | 1,433,143 | | 369,532 | | – | | 1,063,611 | |
| 29 Mar 1999 | 6.3754 | | 3 Apr 2002 | | 29 Mar 2009 | | 23,318,365 | | 6,223,911 | | 89,668 | | 17,004,786 | |
| 10 Aug 1999 | 7.4210 | | 10 Aug 2002 | | 10 Aug 2009 | | 142,658 | | 24,750 | | – | | 117,908 | |
| 31 Aug 1999 | 7.8710 | | 31 Aug 2002 | | 31 Aug 2009 | | 4,000 | | – | | – | | 4,000 | |
| 3 Apr 2000 | 7.4600 | | 3 Apr 2003 | | 3 Apr 2010 | | 17,845,939 | | 4,135,697 | | 441,252 | | 13,268,990 | |
| | |
| 1 | May be advanced to an earlier date in certain circumstances, e.g. retirement. |
| 2 | May be extended to a later date in certain circumstances, e.g. on the death of a participant the executors may exercise the option up to twelve months beyond the normal exercise period. |
| 3 | The weighted average closing price of the shares immediately before the dates on which options were exercised was £9.03. |
The HSBC Holdings Executive Share Option Scheme expired on 26 May 2000. No options have been granted under the Scheme since that date.
HSBC Holdings Group Share Option Plan
HSBC Holdings ordinary shares of US$0.50
| | | | | | | | | | Options | | Options | | Options | | | |
| | | | | | | | Options at | | awarded | | exercised | | lapsed | | Options at | |
| Date of | Exercise | | Exercisable | | Exercisable | | 1 January | | during | | during | | during | | 31 December | |
| award | price (£) | | from | 1 | until | 2 | 2005 | | year | 3 | year | 4 | year | | 2005 | |
| | | | | | | | | | | | | | | | | |
| 4 Oct 2000 | 9.6420 | | 4 Oct 2003 | | 4 Oct 2010 | | 389,352 | | – | | – | | 17,467 | | 371,885 | |
| 23 Apr 2001 | 8.7120 | | 23 Apr 2004 | | 23 Apr 2011 | | 44,805,457 | | – | | 4,274,514 | | 1,289,115 | | 39,241,828 | |
| 30 Aug 2001 | 8.2280 | | 30 Aug 2004 | | 30 Aug 2011 | | 317,230 | | – | | 46,200 | | 8,075 | | 262,955 | |
| 7 May 2002 | 8.4050 | | 7 May 2005 | | 7 May 2012 | | 52,613,475 | | – | | 7,128,292 | | 1,217,131 | | 44,268,052 | |
| 30 Aug 2002 | 7.4550 | | 30 Aug 2005 | | 30 Aug 2012 | | 444,625 | | – | | 28,000 | | 6,000 | | 410,625 | |
| 2 May 2003 | 6.9100 | | 2 May 2006 | | 2 May 2013 | | 54,801,850 | | – | | 138,475 | | 1,832,345 | | 52,831,030 | |
| 29 Aug 2003 | 8.1300 | | 29 Aug 2006 | | 29 Aug 2013 | | 569,070 | | – | | – | | 13,990 | | 555,080 | |
| 3 Nov 2003 | 9.1350 | | 3 Nov 2006 | | 3 Nov 2013 | | 4,069,800 | | – | | – | | – | | 4,069,800 | |
| 30 Apr 2004 | 8.2830 | | 30 Apr 2007 | | 30 Apr 2014 | | 62,319,187 | | – | | 148,600 | | 1,953,979 | | 60,216,608 | |
| 27 Aug 2004 | 8.6500 | | 27 Aug 2007 | | 27 Aug 2014 | | 339,860 | | – | | – | | 2,100 | | 337,760 | |
| 20 Apr 2005 | 8.3620 | | 30 Apr 2008 | | 20 Apr 2015 | | – | | 7,470,195 | | – | | 53,300 | | 7,416,895 | |
| | |
| 1 | May be advanced to an earlier date in certain circumstances, e.g. retirement. |
| 2 | May be extended to a later date in certain circumstances, e.g. on the death of a participant the executors may exercise the option up to twelve months beyond the normal exercise period. |
| 3 | The closing price per share on 19 April 2005, the day before the options were awarded, was £8.29. |
| 4 | The weighted average closing price of the shares immediately before the dates on which options were exercised was £9.19. |
The HSBC Holdings Group Share Option Scheme expired on 26 May 2005. No options have been granted under the Scheme since that date.
The HSBC Share Plan
HSBC Holdings ordinary shares of US$0.50
| | | | | | | | | | Options | | Options | | Options | | | |
| | | | | | | | Options at | | awarded | | exercised | | lapsed | | Options at | |
| Date of | Exercise | | Exercisable | | Exercisable | | 1 January | | during | | during | | during | | 31 December | |
| award | price (£) | | from | 1 | until | 2 | 2005 | | period | | period | | period | | 2005 | |
| 21 Jun 2005 | 8.794 | | 21 Jun 2008 | | 21 Jun 2009 | | – | | 552,526 | 3 | – | | – | | 552,526 | |
| 30 Sep 2005 | 9.170 | | 30 Sep 2008 | | 30 Sep 2015 | | – | | 74,985 | 4 | – | | – | | 74,985 | |
| | |
| 1 | May be advanced to an earlier date in certain circumstances, e.g. on the death of a participant. |
| 2 | Exercise date may be extended to a later date in certain circumstances, e.g. on the death of a participant the executors may exercise the option up to 12 months beyond the normal exercise period. |
| 3 | The closing price per share on 20 June 2005, the day before the options were awarded, was £8.78. |
| 4 | The closing price per share on 29 September 2005, the day before the options were awarded, was £9.21. |
194
Back to Contents
HSBC France and subsidiary company plans
When it was acquired in 2000, HSBC France and certain of its subsidiary companies operated employee share option plans under which options could be granted over their respective shares. No further options will be granted under any of these subsidiary company plans. The following are details of options to acquire shares in HSBC France and its subsidiaries.
HSBC France
shares of €5
| | | | | | | | Options at | | Options | | Options | | Options at | |
| Date of | Exercise | | Exercisable | | Exercisable | | 1 January | | exercised | | lapsed | | 31 December | |
| award | price (€) | | from | | until | | 2005 | | during year | 1 | during year | | 2005 | 1 |
| | | | | | | | | | | | | | | |
| 22 Jun 1995 | 34.00 | | 22 Jun 1997 | | 22 Jun 2005 | | 52,000 | | 52,000 | | – | | – | |
| 9 May 1996 | 35.52 | | 9 May 1998 | | 9 May 2006 | | 64,500 | | 20,000 | | – | | 44,500 | |
| 7 May 1997 | 37.05 | | 7 Jun 2000 | | 7 May 2007 | | 215,560 | | 53,560 | | – | | 162,000 | |
| 29 Apr 1998 | 73.50 | | 7 Jun 2000 | | 29 Apr 2008 | | 388,298 | | 103,054 | | – | | 285,244 | |
| 7 Apr 1999 | 81.71 | | 7 Jun 2000 | | 7 Apr 2009 | | 588,422 | | 112,920 | | – | | 475,502 | |
| 12 Apr 2000 | 142.50 | | 1 Jan 2002 | | 12 Apr 2010 | | 860,000 | | 94,250 | | – | | 765,750 | |
| | |
| 1 | Following exercise of the options, the HSBC France shares will be exchanged for HSBC Holdings ordinary shares in the same ratio as for the acquisition of HSBC France (13 HSBC Holdings ordinary shares for each HSBC France share). At 31 December 2005, The HSBC Holdings Employee Benefit Trust 2001 (No. 1) held 21,102,823 HSBC Holdings ordinary shares which may be exchanged for HSBC France shares arising from the exercise of these options. |
Banque Chaix
shares of €16
| | | | | | | | Options at | | Options | | Options | | Options at | |
| Date of | Exercise | | Exercisable | | Exercisable | | 1 January | | exercised | | lapsed | | 31 December | |
| award | price (€) | | from | | until | | 2005 | | during year | | during year | | 2005 | |
| | | | | | | | | | | | | | | |
| 7 Jun 2000 | 105.94 | | 7 Jun 2005 | | 7 Dec 2005 | | 10,000 | | 10,000 | | – | | – | |
| | | | | | | | | | | | | | | |
HSBC de Baecque Beau
shares of no par value
| | | | | | | | Options at | | Options | | Options | | Options at | |
| Date of | Exercise | | Exercisable | | Exercisable | | 1 January | | exercised | | lapsed | | 31 December | |
| award | price (€) | | from | | until | | 2005 | | during year | | during year | | 2005 | |
| | | | | | | | | | | | | | | |
| 22 Dec 2000 | 61.66 | | 22 Dec 2003 | | 22 Dec 2005 | | 11,500 | | 11,500 | | – | | – | |
| | | | | | | | | | | | | | | |
Banque de Savoie
shares of €16
| | | | | | | | Options at | | Options | | Options | | Options at | |
| Date of | Exercise | | Exercisable | | Exercisable | | 1 January | | exercised | | lapsed | | 31 December | |
| award | price (€) | | from | | until | | 2005 | | during year | | during year | | 2005 | |
| | | | | | | | | | | | | | | |
| 9 Sep 1999 | 64.79 | | 9 Sep 2004 | | 9 Mar 2005 | | 5,000 | | 5,000 | | – | | – | |
| 14 Jun 2000 | 69.52 | | 14 Jun 2005 | | 14 Dec 2005 | | 5,100 | | 5,100 | | – | | – | |
| | | | | | | | | | | | | | | |
Banque Dupuy de Parseval
shares of €20
| | | | | | | | Options at | | Options | | Options | | Options at | |
| Date of | Exercise | | Exercisable | | Exercisable | | 1 January | | exercised | | lapsed | | 31 December | |
| award | price (€) | | from | | until | | 2005 | | during year | | during year | | 2005 | |
| | | | | | | | | | | | | | | |
| 3 Apr 2000 | 36.36 | | 3 Apr 2005 | | 3 Jul 2005 | | 5,000 | | 5,000 | | – | | – | |
| 8 Jun 2000 | 39.48 | | 8 Jun 2005 | | 8 Sep 2005 | | 5,000 | | 5,000 | | – | | – | |
| | | | | | | | | | | | | | | |
Crédit Commercial du Sud Ouest
shares of €15.25
| | | | | | | | Options at | | Options | | Options | | Options at | |
| Date of | Exercise | | Exercisable | | Exercisable | | 1 January | | exercised | | lapsed | | 31 December | |
| award | price (€) | | from | | until | | 2005 | | during year | | during year | | 2005 | |
| | | | | | | | | | | | | | | |
| 9 Sep 1999 | 95.89 | | 9 Sep 2004 | | 9 Mar 2005 | | 7,500 | | 7,500 | | – | | – | |
| 7 Jun 2000 | 102.29 | | 7 Jun 2005 | | 7 Dec 2005 | | 7,500 | | 7,500 | | – | | – | |
| | | | | | | | | | | | | | | |
195
Back to Contents
H S B C H O L D I N G S P L C
Report of the Directors(continued)
HSBC Private Bank France
shares of €2
| | | | | | | | Options at | | Options | | Options | | Options at | |
| Date of | Exercise | | Exercisable | | Exercisable | | 1 January | | exercised | | lapsed | | 31 December | |
| award | price (€) | | from | | until | | 2005 | | during year | 1 | during year | | 2005 | 1 |
| | | | | | | | | | | | | | | |
| 21 Dec 1999 | 10.84 | | 21 Dec 2000 | | 21 Dec 2009 | | 170,500 | | 79,350 | | – | | 91,150 | |
| 9 Mar 2000 | 12.44 | | 27 Jun 2004 | | 31 Dec 2010 | | 149,460 | | 67,300 | | – | | 82,160 | |
| 15 May 2001 | 20.80 | | 15 May 2002 | | 15 May 2011 | | 254,025 | | 24,750 | | – | | 229,275 | |
| 7 Sep 2001 | 15.475 | | 7 Sep 2005 | | 7 Oct 2007 | | 331,500 | | 302,000 | | 29,500 | | – | |
| 1 Oct 2002 | 22.22 | | 2 Oct 2005 | | 1 Oct 2012 | | 225,450 | | – | | 30,375 | | 195,075 | |
| | |
| 1 | Following exercise of the options, the HSBC Private Bank France shares will be exchanged for HSBC Holdings ordinary shares in the ratio of 1.83 HSBC Holdings ordinary shares for each HSBC Private Bank France share. At 31 December 2005, The CCF Employee Benefit Trust 2001 held 1,452,775 HSBC Holdings ordinary shares which may be exchanged for HSBC Private Bank France shares arising from the exercise of these options. |
Netvalor
shares of €415
| | | | | | | | Options at | | Options | | Options | | Options at | |
| Date of | Exercise | | Exercisable | | Exercisable | | 1 January | | exercised | | lapsed | | 31 December | |
| award | price (€) | | from | | until | | 2005 | | during year | | during year | 1 | 2005 | |
| 22 Dec 1999 | 415 | | 22 Dec 2004 | | 22 Dec 2006 | | 2,410 | | – | | 2,410 | | – | |
| 19 Dec 2000 | 415 | | 19 Dec 2005 | | 19 Dec 2007 | | 3,270 | | – | | 3,270 | | – | |
| | | | | | | | | | | | | | | |
| 1 | Netvalor was sold by HSBC France on 2 August 2005 and all outstanding options lapsed at that date. |
Sinopia Asset Management
shares of €0.50
| | | | | | | | Options at | | Options | | Options | | Options at | |
| Date of | Exercise | | Exercisable | | Exercisable | | 1 January | | exercised | | Lapsed | | 31 December | |
| award | price (€) | | from | | until | | 2005 | | during year | ¹ | during year | | 2005 | |
| 15 Oct 1999 | 18.80 | | 15 Oct 2004 | | 15 Apr 2005 | | 30,000 | | 30,000 | | – | | – | |
| 18 Feb 2000 | 18.66 | | 18 Feb 2005 | | 18 Aug 2005 | | 95,500 | | 95,500 | | – | | – | |
| | |
| 1 | Following exercise of the options, the Sinopia shares were exchanged for HSBC Holdings ordinary shares in the ratio of 2.143 HSBC Holdings ordinary shares for each Sinopia share, such shares being delivered from The CCF Employee Benefit Trust 2001. |
HSBC UBP
shares of €16
| | | | | | | | Options at | | Options | | Options | | Options at | |
| Date of | Exercise | | Exercisable | | Exercisable | | 1 January | | exercised | | lapsed | | 31 December | |
| award | price (€) | | from | | until | | 2005 | | during year | | during year | | 2005 | |
| 12 Jul 2000 | 47.81 | | 12 Jul 2005 | | 12 Jan 2006 | | 22,400 | | 22,400 | | – | | – | |
| | | | | | | | | | | | | | | |
HSBC Finance and subsidiary company plans
Following the acquisition of HSBC Finance in 2003, all outstanding options and equity-based awards over HSBC Finance common shares were converted into rights to receive HSBC Holdings ordinary shares in the same ratio as the share exchange offer for the acquisition of HSBC Finance (2.675 HSBC Holdings ordinary shares for each HSBC Finance common share) and the exercise prices per share were adjusted accordingly. No further options will be granted under any of these plans.
All outstanding options and other equity-based awards over HSBC Finance common shares granted before 14 November 2002, being the date the
transaction was announced, vested on completion of the acquisition. Options and equity-based awards granted on or after 14 November 2002 will be exercisable on their original terms, save that they have been adjusted to reflect the exchange ratio.
At 31 December 2005, the HSBC (Household) Employee Benefit Trust 2003 held 3,006,623 HSBC Holdings ordinary shares and 2,198,829 American Depositary Shares (‘ADSs’), each of which represents five HSBC Holdings ordinary shares, which may be used to satisfy the exercise of employee share options.
196
Back to Contents
HSBC Finance
1984 Long-Term Executive Incentive Compensation Plan
HSBC Holdings ordinary shares of US$0.50
| | | | | | | | Options at | | Options | | Options | | Options at | |
| Date of | Exercise | | Exercisable | | Exercisable | | 1 January | | exercised | | lapsed | | 31 December | |
| award | price (US$) | | from | | until | | 2005 | | during year | 1 | during year | | 2005 | |
| 7 Feb 1995 | 5.09 | | 7 Feb 1996 | | 7 Feb 2005 | | 148,142 | | 148,142 | | – | | – | |
| 13 Nov 1995 | 7.43 | | 13 Nov 1996 | | 13 Nov 2005 | | 283,131 | | 283,131 | | – | | – | |
| | | | | | | | | | | | | | | |
| 1 | The weighted average closing price of the shares immediately before the dates on which options were exercised was £8.91. |
HSBC Finance
1996 Long-Term Executive Incentive Compensation Plan
HSBC Holdings ordinary shares of US$0.50
| | | | | | | | Options at | | Options | | Options | | Options at | |
| Date of | Exercise | | Exercisable | | Exercisable | | 1 January | | exercised | | lapsed | | 31 December | |
| award | price (US$) | | from | | until | | 2005 | | during year1 | | during year | | 2005 | |
| 11 Nov 1996 | 11.43 | | 11 Nov 1997 | | 11 Nov 2006 | | 1,006,469 | | 399,244 | | – | | 607,225 | |
| 14 May 1997 | 11.29 | | 14 May 1998 | | 14 May 2007 | | 200,630 | | 20,063 | | – | | 180,567 | |
| 10 Nov 1997 | 14.60 | | 10 Nov 1998 | | 10 Nov 2007 | | 4,016,020 | | 627,350 | | – | | 3,388,670 | |
| 15 Jun 1998 | 17.08 | | 15 Jun 1999 | | 15 Jun 2008 | | 802,500 | | – | | – | | 802,500 | |
| 1 Jul 1998 | 19.21 | | 1 Jul 1999 | | 1 Jul 2008 | | 80,250 | | – | | – | | 80,250 | |
| 9 Nov 1998 | 13.71 | | 9 Nov 1999 | | 9 Nov 2008 | | 4,695,629 | | 152,475 | | – | | 4,543,154 | |
| 17 May 1999 | 16.99 | | 17 May 2000 | | 17 May 2009 | | 334,375 | | – | | – | | 334,375 | |
| 3 Jun 1999 | 16.32 | | 3 Jun 2000 | | 3 Jun 2009 | | 200,625 | | – | | – | | 200,625 | |
| 31 Aug 1999 | 13.96 | | 31 Aug 2000 | | 31 Aug 2009 | | 345,077 | | – | | – | | 345,077 | |
| 8 Nov 1999 | 16.96 | | 8 Nov 2000 | | 8 Nov 2009 | | 4,869,841 | | – | | – | | 4,869,841 | |
| 30 Jun 2000 | 15.70 | | 30 Jun 2001 | | 30 Jun 2010 | | 26,846 | | – | | – | | 26,846 | |
| 8 Feb 2000 | 13.26 | | 8 Feb 2001 | | 8 Feb 2010 | | 66,875 | | – | | – | | 66,875 | |
| 13 Nov 2000 | 18.40 | | 13 Nov 2001 | | 13 Nov 2010 | | 6,379,208 | | – | | – | | 6,379,208 | |
| 12 Nov 2001 | 21.37 | | 12 Nov 2002 | | 12 Nov 2011 | | 7,571,322 | | – | | – | | 7,571,322 | |
| 20 Nov 2002 | 10.66 | | 20 Nov 2003 | 2 | 20 Nov 2012 | | 7,111,494 | | 753,689 | | – | | 6,357,805 | |
| | |
| 1 | The weighted average closing price of the shares immediately before the dates on which options were exercised was £8.81. |
| 2 | 25 per cent of the original award is exercisable on each of the first, second, third and fourth anniversaries of the date of award. May be advanced to an earlier date in certain circumstances, e.g. retirement. |
HSBC Finance
1996 Long-Term Executive Incentive Compensation Plan1
HSBC Holdings ordinary shares of US$0.50
| | | | | | Rights at | | Rights | | Rights | | Rights at | |
| Date of | Vesting | | Vesting | | 1 January | | vested | | lapsed | | 31 December | |
| award | from | 2 | until | 2 | 2005 | | during year3 | | during year | | 2005 | |
| 15 Nov 2002 | 15 Nov 2005 | | 15 Nov 2007 | | 7,222 | | 2,405 | | – | | 4,817 | |
| 20 Nov 2002 | 20 Nov 2005 | | 20 Nov 2007 | | 1,789,084 | | 598,947 | | 57,531 | | 1,132,606 | |
| 2 Dec 2002 | 2 Dec 2005 | | 2 Dec 2007 | | 10,701 | | 3,564 | | – | | 7,137 | |
| 16 Dec 2002 | 16 Dec 2005 | | 16 Dec 2007 | | 35,846 | | 11,944 | | – | | 23,902 | |
| 20 Dec 2002 | 20 Dec 2005 | | 20 Dec 2007 | | 164,514 | | 59,286 | | 13,375 | | 91,853 | |
| 2 Jan 2003 | 2 Jan 2006 | | 2 Jan 2008 | | 1,338 | | – | | – | | 1,338 | |
| 15 Jan 2003 | 15 Jan 2006 | | 15 Jan 2008 | | 31,432 | | – | | – | | 31,432 | |
| 3 Feb 2003 | 3 Feb 2006 | | 3 Feb 2008 | | 9,635 | | 134 | | – | | 9,501 | |
| 14 Feb 2003 | 14 Feb 2006 | | 14 Feb 2008 | | 187,518 | | 40,125 | | – | | 147,393 | |
| 3 Mar 2003 | 3 Mar 2006 | | 3 Mar 2008 | | 1,338 | | – | | – | | 1,338 | |
| | |
| 1 | Awards of Restricted Stock Rights which represent a right to receive shares for nil consideration if the employee remains in the employment of HSBC Finance at the date of vesting. |
| 2 | Restricted Stock Rights vest one-third on each of the third, fourth and fifth anniversaries of the date of award. May be advanced to an earlier date in certain circumstances, e.g. retirement. |
| 3 | The weighted average closing price of the shares immediately before the dates on which rights vested was £9.41. |
197
Back to Contents
H S B C H O L D I N G S P L C
Report of the Directors(continued)
HSBC Finance
Non-Qualified Deferred Compensation Plan for Restricted Stock Rights
HSBC Holdings ordinary shares of US$0.50
| | | | | | Rights at | | Rights | | Rights | | Rights at | |
| Date of | Vesting | | Vesting | | 1 January | | vested | | lapsed | | 31 December | |
| award | from | | until | | 2005 | | during year | 1 | during year | | 2005 | |
| 10 May 2000 | 10 May 2002 | | 10 May 2005 | | 181,125 | | 181,125 | | – | | – | |
| | |
| 1 | The weighted average closing price of the shares immediately before the dates on which rights vested was £8.61. |
HSBC Finance
Non-Qualified Deferred Compensation Plan for Stock Option Exercises
HSBC Holdings ordinary shares of US$0.50
| | | | | | | | Options at | | Options | | Options | | Options at | |
| Date of | Exercise | | Exercisable | | Exercisable | | 1 January | | exercised | | lapsed | | 31 December | |
| award | price (US$) | | from | | until | | 2005 | | during year | 1 | during year | | 2005 | |
| 2 Feb 1991 | 2.48 | | 2 Feb 1992 | | 15 Jul 2005 | | 20,819 | | 20,819 | | – | | – | |
| | |
| 1 | The weighted average closing price of the shares immediately before the dates on which options were exercised was £9.00. |
Beneficial Corporation
1990 Non-Qualified Stock Option Plan
HSBC Holdings ordinary shares of US$0.50
| | | | | | | | Options at | | Options | | Options | | Options at | |
| Date of | Exercise | | Exercisable | | Exercisable | | 1 January | | exercised | | lapsed | | 31 December | |
| award | price (US$) | | from | | until | | 2005 | | during year | 1 | during year | | 2005 | |
| 15 Nov 1995 | 6.00 | | 15 Nov 1996 | | 15 Nov 2005 | | 177,600 | | 177,600 | | – | | – | |
| 20 Nov 1996 | 7.86 | | 20 Nov 1997 | | 20 Nov 2006 | | 289,704 | | 45,529 | | – | | 244,175 | |
| 13 Dec 1996 | 7.54 | | 13 Dec 1997 | | 13 Dec 2006 | | 65,624 | | – | | 65,624 | | – | |
| 14 Nov 1997 | 9.20 | | 14 Nov 1998 | | 14 Nov 2007 | | 131,248 | | – | | – | | 131,248 | |
| 19 Nov 1997 | 9.39 | | 19 Nov 1998 | | 19 Nov 2007 | | 405,274 | | 21,328 | | – | | 383,946 | |
| 1 Dec 1997 | 9.68 | | 1 Dec 1998 | | 1 Dec 2007 | | 65,624 | | – | | 16,406 | | 49,218 | |
| | |
| 1 | The weighted average closing price of the shares immediately before the dates on which options were exercised was £9.00. |
Beneficial Corporation
BenShares Equity Participation Plan
HSBC Holdings ordinary shares of US$0.50
| | | | | | | | Options at | | Options | | Options | | Options at | |
| Date of | Exercise | | Exercisable | | Exercisable | | 1 January | | exercised | | lapsed | | 31 December | |
| award | price (US$) | | from | | until | | 2005 | | during year | 1 | during year | | 2005 | |
| 31 Jan 1997 | 9.87 | | 31 Jan 1998 | | 31 Jan 2007 | | 41,317 | | 4,926 | | – | | 36,391 | |
| 15 Nov 1997 | 11.04 | | 15 Nov 1998 | | 15 Nov 2007 | | 55,696 | | 6,977 | | – | | 48,719 | |
| | |
| 1 | The weighted average closing price of the shares immediately before the dates on which options were exercised was £8.98. |
Renaissance Holdings, Inc.
Amended and Restated 1997 Incentive Plan
HSBC Holdings ordinary shares of US$0.50
| | | | | | | | Options at | | Options | | Options | | Options at | |
| Date of | Exercise | | Exercisable | | Exercisable | | 1 January | | exercised | | lapsed | | 31 December | |
| award | price (US$) | | from | | until | | 2005 | | during year | 1 | during year | | 2005 | |
| 31 Oct 1997 | 1.25 | | 31 Oct 1998 | | 31 Oct 2007 | | 4,739 | | 3,414 | | – | | 1,325 | |
| 1 Jan 1998 | 1.25 | | 1 Jan 1999 | | 1 Jan 2008 | | 1,424 | | – | | – | | 1,424 | |
| 1 Oct 1998 | 1.74 | | 1 Oct 1999 | | 1 Oct 2008 | | 1,606 | | 803 | | – | | 803 | |
| 1 Jan 1999 | 2.24 | | 1 Jan 2000 | | 1 Jan 2009 | | 5,024 | | – | | – | | 5,024 | |
| | |
| 1 | The weighted average closing price of the shares immediately before the dates on which options were exercised was £8.98. |
198
Back to Contents
Bank of Bermuda plans
Following the acquisition of Bank of Bermuda in February 2004, all outstanding options over Bank of Bermuda shares were converted into rights to receive HSBC Holdings ordinary shares based on the consideration of US$40 for each Bank of Bermuda share and the average closing price of HSBC Holdings ordinary shares, derived from the London Stock Exchange Daily Official List, for the five
business days preceding the closing date of the acquisition. No further options will be granted under any of these plans.
All outstanding options over Bank of Bermuda shares vested on completion of the acquisition. At 31 December 2005, the HSBC (Bank of Bermuda) Employee Benefit Trust 2004 held 2,796,182 HSBC Holdings ordinary shares which may be used to satisfy the exercise of these options.
Bank of Bermuda
Executive Share Option Plan 1997
HSBC Holdings ordinary shares of US$0.50
| | | | | | | | Options at | | Options | | Options | | Options at | |
| Date of | Exercise | | Exercisable | | Exercisable | | 1 January | | exercised | | lapsed | | 31 December | |
| award | price (US$) | | from | | until | | 2005 | | during period | 1 | during period | | 2005 | |
| 1 Jul 1998 | 9.61 | | 1 Jul 1999 | | 1 Jul 2008 | | 67,813 | | – | | – | | 67,813 | |
| 23 Feb 1999 | 7.40 | | 23 Feb 2000 | | 23 Feb 2009 | | 18,464 | | – | | 6,780 | | 11,684 | |
| 3 Aug 1999 | 7.10 | | 3 Aug 2000 | | 3 Aug 2009 | | 9,331 | | – | | – | | 9,331 | |
| 4 Feb 2000 | 7.21 | | 4 Feb 2001 | | 4 Feb 2010 | | 67,925 | | 1,540 | | 9,249 | | 57,136 | |
| 7 Apr 2000 | 7.37 | | 7 Apr 2001 | | 7 Apr 2010 | | 385 | | 385 | | – | | – | |
| 29 May 2000 | 7.21 | | 29 May 2001 | | 29 May 2010 | | 15,411 | | – | | 15,411 | | – | |
| 1 Jun 2000 | 7.04 | | 1 Jun 2001 | | 1 Jun 2010 | | 61,649 | | – | | – | | 61,649 | |
| 31 Jul 2000 | 10.11 | | 31 Jul 2001 | | 31 Jul 2010 | | 166,454 | | 120,215 | | – | | 46,239 | |
| 19 Sep 2000 | 11.31 | | 19 Sep 2001 | | 19 Sep 2010 | | 40,458 | | – | | 40,458 | | – | |
| 11 Jan 2001 | 14.27 | | 11 Jan 2002 | | 11 Jan 2011 | | 161,829 | | – | | – | | 161,829 | |
| | |
| 1 | The weighted average closing price of the shares immediately before the dates on which options were exercised was £9.14 |
Bank of Bermuda
Share Option Plan 2000
HSBC Holdings ordinary shares of US$0.50
| | | | | | | | Options at | | Options | | Options | | Options at | |
| Date of | Exercise | | Exercisable | | Exercisable | | 1 January | | exercised | | lapsed | | 31 December | |
| award | price (US$) | | from | | until | | 2005 | | during period | 1 | during period | | 2005 | |
| 11 Jan 2001 | 14.27 | | 11 Jan 2002 | | 11 Jan 2011 | | 161,829 | | 26,972 | | – | | 134,857 | |
| 6 Feb 2001 | 16.41 | | 6 Feb 2002 | | 6 Feb 2011 | | 1,067,606 | | 22,972 | | 245,300 | | 799,334 | |
| 29 Mar 2001 | 15.39 | | 29 Mar 2002 | | 29 Mar 2011 | | 540 | | – | | 270 | | 270 | |
| 16 Apr 2001 | 15.57 | | 16 Apr 2002 | | 16 Apr 2011 | | 539 | | – | | – | | 539 | |
| 6 Jun 2001 | 18.35 | | 6 Jun 2002 | | 6 Jun 2011 | | 8,091 | | – | | – | | 8,091 | |
| 16 Jul 2001 | 16.87 | | 16 Jul 2002 | | 16 Jul 2011 | | 224,631 | | – | | 66,146 | | 158,485 | |
| 28 Aug 2001 | 15.39 | | 28 Aug 2002 | | 28 Aug 2011 | | 13,486 | | – | | – | | 13,486 | |
| 26 Sep 2001 | 12.79 | | 26 Sep 2002 | | 26 Sep 2011 | | 459,651 | | 10,706 | | – | | 448,945 | |
| 16 Jan 2002 | 16.11 | | 16 Jan 2003 | | 16 Jan 2012 | | 3,678 | | – | | 3,678 | | – | |
| 30 Jan 2002 | 15.60 | | 30 Jan 2003 | | 30 Jan 2012 | | 1,226 | | – | | – | | 1,226 | |
| 5 Feb 2002 | 16.09 | | 5 Feb 2003 | | 5 Feb 2012 | | 1,421,151 | | 45,976 | | 323,361 | | 1,051,814 | |
| 5 Feb 2002 | 16.41 | | 5 Feb 2003 | | 5 Feb 2012 | | 1,383 | | – | | – | | 1,383 | |
| 10 Jul 2002 | 15.84 | | 10 Jul 2003 | | 10 Jul 2012 | | 12,260 | | – | | – | | 12,260 | |
| 9 Sep 2002 | 12.34 | | 9 Sep 2003 | | 9 Sep 2012 | | 61,299 | | 61,299 | | – | | – | |
| 16 Dec 2002 | 11.27 | | 16 Dec 2003 | | 16 Dec 2012 | | 6,130 | | 6,130 | | – | | – | |
| 4 Feb 2003 | 10.69 | | 4 Feb 2004 | | 4 Feb 2013 | | 359,867 | | 134,355 | | 26,167 | | 199,345 | |
| 1 Apr 2003 | 11.97 | | 1 Apr 2004 | | 1 Apr 2013 | | 28,541 | | 28,541 | | – | | – | |
| 21 Apr 2003 | 11.85 | | 21 Apr 2004 | | 21 Apr 2013 | | 48,853 | | – | | – | | 48,853 | |
| | |
| 1 | The weighted average closing price of the shares immediately before the dates on which options were exercised was £9.04. |
199
Back to Contents
H S B C H O L D I N G S P L C
Report of the Directors(continued)
Bank of Bermuda
Directors’ Share Option Plan
HSBC Holdings ordinary shares of US$0.50
| | | | | | | | Options at | | Options | | Options | | Options at | |
| Date of | Exercise | | Exercisable | | Exercisable | | 1 January | | exercised | | lapsed | | 31 December | |
| award | price (US$) | | from | | until | | 2005 | | during period | | during period | | 2005 | |
| 22 Sep 1999 | 8.02 | | 22 Sep 2000 | | 22 Sep 2009 | | 7,706 | | – | | – | | 7,706 | |
| 20 Sep 2000 | 11.31 | | 20 Sep 2001 | | 20 Sep 2010 | | 9,440 | | – | | – | | 9,440 | |
| 28 Mar 2001 | 15.76 | | 28 Mar 2002 | | 28 Mar 2011 | | 18,205 | | – | | 2,697 | | 15,508 | |
| 3 Apr 2002 | 16.01 | | 3 Apr 2003 | | 3 Apr 2012 | | 34,328 | | – | | 4,904 | | 29,424 | |
| 30 Apr 2003 | 12.23 | | 30 Apr 2004 | | 30 Apr 2013 | | 9,808 | | – | | – | | 9,808 | |
| Valuation of freehold and leasehold land and buildings |
|
HSBC’s freehold and long leasehold properties, together with all leasehold properties in Hong Kong, were valued in 2005. The value of these properties was US$1.1 billion in excess of their carrying amount in the consolidated balance sheet.
Further details are included in Note 23 on the Financial Statements on page 298.
| Corporate Governance Report |
|
The information set out on pages 184 to 233 and information incorporated by reference constitutes the Corporate Governance Report of HSBC Holdings.
The objective of the management structures within HSBC, headed by the Board of Directors of HSBC Holdings and led by the Group Chairman, is to deliver sustainable value to shareholders. Implementation of the strategy set by the Board is delegated to the Group Management Board under the leadership of the Group Chief Executive.
The Board sets the strategy for HSBC through the five-year strategic plan and approves the annual operating plans presented by management for the achievement of the strategic objectives. The annual operating plans ensure the efficient disposition of HSBC’s resources for the achievement of these objectives. The Board delegates the management and day to day running of HSBC to the Group Management Board but retains to itself approval of certain matters including annual plans and performance targets, procedures for monitoring and control of operations, specified senior appointments, acquisitions and disposals above predetermined thresholds and any substantial change in balance sheet management policy.
The Board of Directors meets regularly and Directors receive information between meetings
about the activities of committees and developments in HSBC’s business. All Directors have full and timely access to all relevant information and may take independent professional advice if necessary.
HSBC Holdings has a unitary Board ofDirectors. The authority of each Director is exercised in Board Meetings where the Board acts collectively as a unit. At 6 March 2006 the Board comprises five executive and 15 non-executive Directors. The roles of Group Chairman and Group Chief Executive are separated and held by experienced executive Directors. Before assuming the role of Group Chairman in 1998, Sir John Bond had been the Group Chief Executive for five years. The Group Chairman’s knowledge of HSBC’s complex and widespread geographical business from his previous service as Group Chief Executive has been a considerable benefit to HSBC.
On 28 November 2005, it was announced that S K Green, the Group Chief Executive since 2003, would succeed Sir John Bond as Group Chairman at the conclusion of the 2006 Annual General Meeting on 26 May 2006 and that M F Geoghegan would succeed S K Green as Group Chief Executive. Sir Brian Moffat, the senior independent non-executive Director and the Chairman of the Nomination Committee, wrote to shareholders regarding these appointments.
He explained that the decision by the Board to appoint S K Green as Group Chairman was made after a thorough selection process. This was conducted by the Nomination Committee, assisted by external advisers, and included extensive benchmarking against external candidates. The Committee considered carefully the requirements of the position in terms of HSBC’s size, geographical spread and complexity; the need for full time executive commitment and experience of international banking at the highest level; and took account of the need for the Group Chairman to have a wide range of skills, the capacity for strategic thinking and the ability to sustain and enhance the Group’s corporate character. The Committee also
200
Back to Contents
took into consideration the need for the Group Chairman to be able to work closely and effectively with the Group Chief Executive, to have the authority to run the Board and to have the personal standing to represent HSBC externally at the highest level. Job specifications for the Group Chairman and the Group Chief Executive, setting out their respective authorities and responsibilities, have been agreed by the Board. The Nomination Committee came to the unanimous conclusion that S K Green was the outstanding candidate.
S K Green joined HSBC in 1982. He was Group Treasurer from 1992 to 1998, and Executive Director, Corporate, Investment Banking and Markets from 1998 to 2003, when he was appointed to his current position. He has worked in Hong Kong, New York, the Middle East and London, and has immense international experience and knowledge of HSBC. The Committee concluded that S K Green is superbly well qualified to serve as Group Chairman.
S K Green’s successor as Group Chief Executive will be M F Geoghegan, who has led HSBC Bank, HSBC’s principal subsidiary in the United Kingdom, since 2004. He too is highly qualified for his new position and his appointment also has the unanimous support of the Board. Mr Geoghegan has 33 years’ experience with HSBC and has worked in 10 countries in North and South America, Asia, the Middle East and Europe.
Nowadays, success in financial services depends in a large measure on the relative strengths of competing management teams. Planning management succession is key to this, has long been established in the Group and the plan is regularly reviewed by the non-executive Directors. Furthermore, HSBC is a remarkable organisation with a distinctive character and culture. The business is managed through international teamwork and HSBC believes this is best achieved by management continuity and amongst colleagues who have similar values. By way of example, the top 50 executives have a combined service approaching 1,000 years with HSBC, although 20 per cent of these executives have joined the Group in the last six years, thus ensuring there is a balance of new talent to help run the business.
The Directors believe strongly that these appointments are in the best interests of the shareholders. The appointments have the unanimous support of the Directors and have been made after consulting with representatives of major institutional investors and explaining the succession planning and independent external search process.
Executive Directors are employees who carry out executive functions in HSBC in addition to their duties as Directors. Non-executive Directors are not HSBC employees and do not participate in the daily business management of HSBC. Non-executive Directors bring an external perspective, constructively challenge and help develop proposals on strategy, scrutinise the performance of management in meeting agreed goals and objectives and monitor the reporting of performance. The non-executive Directors have a wealth of experience across a number of industries and business sectors, including the leadership of large, complex multinational enterprises. The roles of non-executive Directors as members of Board committees are set out below. It is estimated that non-executive Directors spend 24 days per annum on HSBC business after an induction phase, with Committee members devoting significant additional time. The names and brief biographical particulars of the Directors are listed on pages 184 to 188.
The Board considers all of the non-executive Directors to be independent in character and judgement. Baroness Dunn and H Sohmen have served on the Board for more than nine years, however, and in that respect only, do not meet the usual criteria for independence set out in the UK Combined Code on corporate governance. The Board has therefore determined Lord Butler, R K F Ch’ien, J D Coombe, R A Fairhead, W K L Fung, S Hintze, J W J Hughes-Hallett, Sir John Kemp-Welch, Sir Brian Moffat, Sir Mark Moody-Stuart, S M Robertson, S W Newton and Sir Brian Williamson to be independent. In reaching its determination of each non-executive Director’s independence the Board has concluded that there are no relationships or circumstances which are likely to affect a Director’s judgement and any relationships or circumstances which could appear to do so were considered not to be material.
In accordance with the Rules Governing the Listing of Securities on The Stock Exchange of Hong Kong Limited, each non-executive Director determined by the Board to be independent has provided confirmation of his or her independence to HSBC Holdings.
The Directors who served during the year were W F Aldinger, Sir John Bond, Lord Butler, R K F Ch’ien, J D Coombe, Baroness Dunn, D G Eldon, R A Fairhead, D J Flint, W K L Fung, M F Geoghegan, S K Green, S Hintze, J W J Hughes-Hallett, A W Jebson, Sir John Kemp-Welch, Sir Brian Moffat, Sir Mark Moody-Stuart, S W Newton, H Sohmen, C S Taylor and Sir Brian Williamson.
201
Back to Contents
H S B C H O L D I N G S P L C
Report of the Directors(continued)
C S Taylor resigned as a Director on 14 March 2005, W F Aldinger resigned as a Director on 29 April 2005 and D G Eldon retired as a Director on 27 May 2005. J D Coombe and J W J Hughes-Hallett were appointed Directors with effect from 1 March 2005.
S M Robertson was appointed a Director with effect from 3 January 2006. Having been appointed since the Annual General Meeting in 2005, he will retire at the forthcoming Annual General Meeting and offer himself for re-election.
Sir John Bond, A W Jebson and Sir John Kemp-Welch will retire at the conclusion of the forthcoming Annual General Meeting and will not therefore seek re-election.
Baroness Dunn, M F Geoghegan, S K Green, Sir Mark Moody-Stuart, H Sohmen and Sir Brian Williamson will retire by rotation at the forthcoming Annual General Meeting and offer themselves for re-election.
The Board has undertaken an evaluation of its performance and that of its committees. This evaluation covered board composition and capabilities; dynamics; strategy; corporate governance; and the performance of individual Directors. In undertaking this review the Group Chairman held structured meetings with each Director using a framework adapted from that employed in the two previous reviews. The report on the evaluation of the Board and its committees has been reviewed by the Board and has been used by the non-executive Directors, led by Sir Brian Moffat, in their evaluation of the performance of the Group Chairman. The review concluded that the board and its committees were functioning effectively. The Group Audit Committee, the Remuneration Committee, the Nomination Committee and the Corporate Social Responsibility Committee have also each undertaken a review of their terms of reference and their own effectiveness in 2005.
Following the review of the Board, the Group Chairman has confirmed that the Directors standing for re-election at the Annual General Meeting continue to perform effectively and to demonstrate commitment to their roles. It is the intention of the Board of HSBC Holdings to continue to review its performance and that of its Directors annually.
Seven regular Board meetings were held during 2005. Sir John Bond, Lord Butler, R K F Ch’ien, Baroness Dunn, D J Flint, W K L Fung, M F Geoghegan, S K Green, S Hintze, A W Jebson, Sir John Kemp-Welch, Sir Brian Moffat, Sir Mark Moody-Stuart, S W Newton, H Sohmen and
Sir Brian Williamson attended all of the Board meetings. R A Fairhead attended five of the Board meetings. W F Aldinger and C S Taylor attended the two Board meetings held before they ceased to be Directors. D G Eldon attended all four Board meetings held before his retirement. J D Coombe and J W J Hughes-Hallett attended all five of the Board meetings held following their appointments.
During 2005, the non-executive Directors and the Group Chairman met three times to discuss Board performance and succession planning, and the non-executive Directors met once without the Group Chairman to discuss his performance.
In addition to the meetings of the principal Committees referred to below, ten other meetings of committees of the Board were held during the year to discharge business delegated by the Board.
All Directors attended the 2005 Annual General Meeting.
The Board regularly reviews reports on progress against financial objectives, on business developments and on investor issues and external relations and receives reports from the Chairmen of Board Committees, the Group Chief Executive and the Chief Operating Officer. The Board also receives regular reports and presentations on strategy and developments in the customer groups and principal geographical areas. Regular reports are also provided to the Board, the Group Audit Committee and the Group Management Board on credit exposures and the loan portfolio, asset and liability management, liquidity, litigation and compliance and reputational issues. The agenda and supporting papers are distributed in advance of all Board and Committee meetings to allow time for appropriate review and to facilitate full discussion at the meetings.
The Directors have free and open contact with management at all levels. Group Managing Directors and Group General Managers meet informally with Directors after Board meetings. Board offsite visits are made each year to enable Directors to see at first hand subsidiary company operations at their operating environments and to meet local management, employees and customers. In 2005 the Board visited Bermuda, India and the HSBC Management Training College in Hertfordshire, United Kingdom.
The Board ensures all Directors, including non-executive Directors, develop an understanding of the views of major shareholders through attendance at analyst meetings following results announcements and otherad hoc meetings with investors and their representative bodies. In April 2005, the Board held
202
Back to Contents
an informal meeting with representatives of institutional shareholders to discuss corporate governance matters. An Investor Day, attended by executive and non-executive Directors, was held in September 2005. During 2005, major shareholders were consulted on the employee share plan proposals considered at the 2005 Annual General Meeting and the succession plans for the Group Chairman and Group Chief Executive.
The Group Chairman, Group Chief Executive and the Group Finance Director hold regular meetings with institutional investors and report to the Board on those meetings.
Sir Brian Moffat, Deputy Chairman and senior independent non-executive Director, is available to shareholders should they have concerns which contact through the normal channels of Group Chairman, Group Chief Executive, Group Finance Director or other executives has failed to resolve or for which such contact would be inappropriate. Sir Brian Moffat may be contacted through the Group Company Secretary at 8 Canada Square, London E14 5HQ.
The Group Chairman’s principal commitments outside HSBC are as a non-executive Director of Ford Motor Company and of Vodafone Group plc.
Full, formal and tailored induction programmes with particular emphasis on internal controls, are arranged for newly appointed Directors to enable them to familiarise themselves with HSBC. Opportunities to update and develop skills and knowledge, through externally-run seminars and through briefings by senior executives, are provided to all Directors. The terms and conditions of appointments of non-executive Directors are available for inspection at 8 Canada Square, London E14 5HQ and will be made available for 15 minutes before the Annual General Meeting and during the Meeting itself.
The Articles of Association of HSBC Holdings provide that Directors are entitled to be indemnified out of the assets of the Company against claims from third parties in respect of certain liabilities arising in connection with the performance of their functions, in accordance with the provisions of the UK Companies Act 1985. Indemnity provisions of this nature have been in place during the financial year but have not been utilised by the Directors.
None of the Directors had, during the year or at the end of the year, a material interest, directly or indirectly, in any contract of significance with HSBC Holdings or any of its subsidiary undertakings.
The Board has appointed a number of committees consisting of certain Directors, Group Managing Directors and, in the case of the Corporate Social Responsibility Committee, certain co-opted non-director members. The following are the principal committees:
Group Management Board
The Group Management Board meets regularly and operates as a general management committee under the direct authority of the Board. The objective of the Group Management Board is to maintain a reporting and control structure whereby all of the line operations of HSBC are accountable to individual members of the Group Management Board, who in turn report to Group Chairman or Group Chief Executive. The members of the Group Management Board are S K Green (Chairman), Sir John Bond, D J Flint, M F Geoghegan and A W Jebson, all of whom are executive Directors, and V H C Cheng, C-H Filippi, S T Gulliver, D D J John, S N Mehta, Y A Nasr and J J Studzinski, all of whom are Group Managing Directors.
The Group Management Board exercises the powers, authorities and discretions of the Board in so far as they concern the management and day to day running of HSBC in accordance with such policies and directions as the Board may from time to time determine. Matters reserved for approval by the Board include annual plans and performance targets, procedures for monitoring and control of operations, specified senior appointments, acquisitions and disposals above predetermined thresholds and any substantial change in balance sheet management policy. The Group Management Board sub-delegates credit, investment and capital expenditure authorities to its members.
Group Audit Committee
The Group Audit Committee meets regularly with HSBC’s senior financial, internal audit, legal and compliance management and the external auditor to consider HSBC Holdings’ financial reporting, the nature and scope of audit reviews and the effectiveness of the systems of internal control and compliance. The members of the Group Audit Committee throughout 2005 were Sir Brian Moffat (Chairman), R K F Ch’ien, R A Fairhead and Sir John Kemp-Welch. J D Coombe was appointed a member of the Committee with effect from 1 July 2005. J W J Hughes-Hallett has been appointed a member of the Committee with effect from 1 June 2006. All members of the Committee are
203
Back to Contents
H S B C H O L D I N G S P L C
Report of the Directors(continued)
independent non-executive Directors.
The Board has determined that Sir Brian Moffat, R A Fairhead and J D Coombe are independent according to SEC criteria, may be regarded as audit committee independent financial experts for the purposes of section 407 of the Sarbanes-Oxley Act and as having recent and relevant financial experience.
Since 2004 appointments to the Committee have been made for periods of up to three years, extendable by no more than two additional three-year periods, so long as members continue to be independent.
Formal and tailored induction programmes are held for newly appointed Committee members and appropriate training is provided on an ongoing and timely basis.
There were seven meetings of the Group Audit Committee during 2005. Sir John Kemp-Welch and Sir Brian Moffat attended all of the meetings; R K F Ch’ien attended five meetings; R A Fairhead attended six meetings; and J D Coombe attended each of the five meetings held following his appointment.
At the beginning of each meeting, the Committee has the opportunity to meet with the external auditor, without management present, to facilitate the discussion of any matter relating to its remit and any issue arising from the audit. Similar arrangements have been adopted for the Committee to meet with the internal auditor.
The terms of reference of the Committee, which are reviewed annually, are available at www.hsbc.com/committeeg. To ensure consistency of scope and approach by subsidiary company audit committees, the Group Audit Committee has established minimum core terms of reference for those committees. These are in the course of being adopted.
The Group Audit Committee is accountable to the Board and assists the Board in meeting its responsibilities for maintaining an effective system of internal control and compliance and for meeting its external financial reporting obligations. The Committee is directly responsible on behalf of the Board for the selection, oversight and remuneration of the external auditor. The Committee receives frequent comprehensive reports from the Group General Manager Credit and Risk, the Head of Group Compliance, the Group General Manager, Legal and Compliance, the Group General Manager Internal Audit and the Head of Group Security and receives periodic presentations from other functional heads and line management.
Regular comprehensive reports on the work of the internal audit function are submitted to the Committee. These reports include reports on frauds and special investigations and summaries of internal audit findings, regulatory reports and external auditors’ reports. The Committee also receives summaries of periodic peer reviews of the internal audit functions around HSBC.
The Committee undertakes an annual review of the effectiveness of HSBC’s system of internal control. This is described on page 208. The Committee receives regular updates on changes in law, regulations and accounting standards and practices and the preparations being made to respond to those requirements, including the preparations for reporting on the review of internal financial reporting controls required by section 404 of the Sarbanes-Oxley Act.
The Committee reports on its activities at each Board meeting and, twice annually, produces a written summary of its activities.
The Committee has approved procedures for the receipt, retention and handling of complaints regarding accounting, internal accounting controls and auditing matters. The Committee receives regular reports regarding the nature, investigation and resolution of material complaints and concerns from the Head of Group Compliance.
The Committee reviews and monitors the external auditor's independence and objectivity and the effectiveness of the audit process, taking into consideration relevant professional and regulatory requirements. The Committee receives reports from the external auditor on its own policies and procedures regarding independence and quality control and oversees the appropriate rotation of audit partners within the external auditor.
The Group Audit Committee has adopted policies for the pre-approval of specific services that may be provided by the principal auditor, KPMG Audit Plc and its affiliates (‘KPMG’), since 2003. These policies are kept under review and amended as necessary to meet the dual objectives of ensuring that HSBC benefits in a cost effective manner from the cumulative knowledge and experience of its auditor, whilst also ensuring that the auditor maintains the necessary degree of independence and objectivity. These pre-approval policies apply to all services where HSBC Holdings or any of its subsidiaries pays for the service, or is a beneficiary or addressee of the service and has selected, or influenced the choice of, KPMG. All services entered into with KPMG during 2005 were pre-approved by the Group Audit Committee or were entered into
204
Back to Contents
under pre-approval policies established by the Group Audit Committee.
The pre-approved services relate to the provision of objective advice, attestation type services or opinions on areas such as controls and are used as an input into management decision-making. They fall into the following four categories:
Audit services
In addition to the statutory audit appointments, which are approved by the Group Audit Committee, this category includes services that are normally provided by the independent auditor in connection with statutory and regulatory filings or engagements, such as reviews of interim financial information, letters to securities underwriters in connection with debt or equity offerings, the inclusion of auditors’ reports in filings with the SEC and certain reports on internal control over financial reporting.
Audit-related services
These services are those provided by the principal auditor that are reasonably related to the performance of the audit or review of the Group’s financial statements. Examples of such services are due diligence services provided in connection with potential acquisitions, audits or reviews of employee benefit plans,ad hoc attestation or agreed-upon procedures reports (including reports requested by regulators), and accounting and regulatory advice on actual or contemplated transactions.
Tax services
This category includes both tax advice and compliance services. Examples of such services are advice on national and local income taxation matters, (including assistance in data gathering for preparation, review and submission as agent of tax filings), advice on tax consequences of management-proposed transactions and assistance in responding to tax examinations by governmental authorities. The pre-approved tax services explicitly exclude proposals for tax structures unconnected with a contemplated transaction and whose main motive is to reduce taxation.
Other services
This category includes various other assurance and advisory services, such as training, or advice or assurance provided on specific elements of financial data and models, IT security and advice, and providing due diligence on financial reviews of HSBC customers and private equity investments.
All services provided by KPMG relating to the implementation of section 404 of the Sarbanes-Oxley Act were specifically pre-approved by the Group Audit Committee.
An analysis of the remuneration paid in respect of audit and non-audit services provided by KPMG for each of the last two years is disclosed in Note 8 on the Financial Statements.
The Committee has recommended to the Board that KPMG Audit Plc be reappointed as Auditor at the forthcoming Annual General Meeting.
Remuneration Committee
The role of the Remuneration Committee and its membership are set out in the Directors’ Remuneration Report on page 215.
Nomination Committee
The Nomination Committee is responsible for leading the process for Board appointments and for identifying and nominating, for approval by the Board, candidates for appointment to the Board. Before recommending an appointment to the Board, the Committee evaluates the balance of skills, knowledge and experience on the Board and, in the light of this, identifies the role and capabilities required for a particular appointment. Candidates are considered on merit against these criteria. Care is taken to ensure that appointees have enough time to devote to HSBC. All Directors are subject to election by shareholders at the Annual General Meeting following their appointment and to re-election at least every three years. The members of the Nomination Committee throughout 2005 were Sir Brian Moffat (Chairman), Lord Butler, Baroness Dunn and Sir Brian Williamson.
There were three Nomination Committee meetings during 2005, each of which was attended by all members.
Following each meeting the Committee reports to the Board on its activities.
The terms of reference of the Committee are available at www.hsbc.com/committeen.
The appointments of J D Coombe, J W J Hughes-Hallett and S M Robertson as non-executive Directors were made on the advice and recommendation of the Nomination Committee. An external consultancy was used in connection with these appointments.
As set out on page 205, the Committee conducted the selection process which recommended to the Board that S K Green succeed Sir John Bond
205
Back to Contents
H S B C H O L D I N G S P L C
Report of the Directors(continued)
as Group Chairman at the conclusion of the 2006 Annual General Meeting and that M F Geoghegan succeed S K Green as Group Chief Executive.
The Committee makes recommendations to the Board concerning plans for succession for both executive and non-executive Directors; the appointment of any Director to executive or other office; suitable candidates for the role of senior independent Director; the re-election by shareholders of Directors retiring by rotation; the renewal of the terms of office of non-executive Directors; membership of Board Committees, in consultation with the Group Chairman and the chairman of such committee as appropriate; any matters relating to the continuation in office of any Director at any time; Directors’ fees and committee fees for the Company and any of its subsidiaries as appropriate; and appointments and re-appointments to the Boards of Directors of major subsidiary companies as appropriate.
The Committee regularly reviews the structure, size and composition (including the skills, knowledge and experience required) of the Board and makes recommendations to the Board as appropriate. It keeps under review the leadership needs of HSBC, with a view to ensuring the continued ability of HSBC to compete effectively in the marketplace. The Board has satisfied itself that the Nomination Committee has in place appropriate plans for orderly succession to the Board and Senior Management positions as well as procedures to ensure an appropriate balance of skills and experience within HSBC and on the Board.
Corporate Social Responsibility Committee
The Corporate Social Responsibility Committee is responsible for overseeing Corporate Social Responsibility and Sustainability policies, principally environmental, social and ethical matters and for advising the Board, committees of the Board and executive management on such matters. The terms of reference of the Committee are available at www.hsbc.com/committeec. The members of the Committee throughout 2005 were Lord Butler (Chairman), W K L Fung, S Hintze, each of whom is an independent non-executive Director, and G V I Davis, E M Diggory and Lord May, who are non-Director members of the Committee. C S Taylor, a former independent non-executive Director, was a member of the Committee until 14 March 2005. Sir Mark Moody-Stuart, an independent non-executive Director, was appointed a member of the Committee from 29 April 2005.
There were four meetings of the Corporate Social Responsibility Committee during 2005. Following each meeting the Committee reports to the Board on its activities.
Further information is available in HSBC’s Corporate Social Responsibility Report 2005, available in April 2006.
| Corporate Governance Codes |
|
HSBC is committed to high standards of corporate governance. HSBC Holdings complied throughout the year with the applicable code provisions of the Combined Code on Corporate Governance issued by the Financial Reporting Council. The terms of reference of the Group Audit Committee and the Remuneration Committee were modified in February 2005 to incorporate certain provisions set out in the Code on Corporate Governance Practice in Appendix 14 to the Rules Governing the Listing of Securities on The Stock Exchange of Hong Kong Limited which came into effect on 1 January 2005. HSBC Holdings has complied throughout the year with all other applicable code provisions of the Code on Corporate Governance Practices in Appendix 14 to the Rules Governing the Listing of Securities on The Stock Exchange of Hong Kong Limited.
The Board of HSBC Holdings has adopted a code of conduct for transactions in HSBC Group securities by Directors that complies with The Model Code in the Listing Rules of the Financial Services Authority and with The Model Code for Securities Transactions by Directors of Listed Issuers (‘Hong Kong Model Code’) set out in the Rules Governing the Listing of Securities on The Stock Exchange of Hong Kong Limited, save that The Stock Exchange of Hong Kong has granted certain waivers from strict compliance with the Hong Kong Model Code, primarily to take into account accepted practices in the UK, particularly in respect of employee share plans. Following a specific enquiry, each Director has confirmed he or she has complied with the code of conduct for transactions in HSBC Group securities throughout the year.
Differences in HSBC Holdings/New York Stock Exchange corporate governance practices
Under the New York Stock Exchange’s (‘NYSE’) corporate governance rules for listed companies, as a NYSE-listed foreign private issuer, HSBC Holdings must disclose any significant ways in which its corporate governance practices differ from those followed by US companies subject to NYSE listing standards. HSBC Holdings believes the following to be the significant differences between its corporate
206
Back to Contents
governance practices and NYSE corporate governance rules applicable to US companies.
US companies listed on the NYSE are required to adopt and disclose corporate governance guidelines. The Listing Rules of the UK Financial Services Authority require each listed company incorporated in the United Kingdom to include in its Annual Report and Accounts a narrative statement of how it has applied the principles of the Combined Code on Corporate Governance issued by the Financial Reporting Council (‘Combined Code’) and a statement as to whether or not it has complied with the code provisions of the Combined Code throughout the accounting period covered by the Annual Report and Accounts. A company that has not complied with the Code provisions, or complied with only some of the Code provisions or (in the case of provisions whose requirements are of a continuing nature) complied for only part of an accounting period covered by the report, must specify the Code provisions with which it has not complied, and (where relevant) for what part of the reporting period such non-compliance continued, and give reasons for any non-compliance. As stated above, HSBC Holdings complied throughout 2005 with the applicable code provisions of the Combined Code. The Combined Code does not require HSBC Holdings to disclose the full range of corporate governance guidelines with which it complies.
Under NYSE standards, companies are required to have a nominating/corporate governance committee, composed entirely of independent directors. In addition to identifying individuals qualified to become board members, this committee must develop and recommend to the board a set of corporate governance principles. HSBC’s Nomination Committee, which follows the requirements of the Combined Code, includes a majority of members who are independent. All members of the Committee are non-executive Directors and three of the four members, including the Committee chairman, are independent non-executive Directors. The Committee’s terms of reference do not require the Committee to develop and recommend corporate governance principles for HSBC Holdings. As stated above, HSBC Holdings is subject to the corporate governance principles of the Combined Code.
Pursuant to NYSE listing standards, non-management directors must meet on a regular basis without management present and independent directors must meet separately at least once per year. During 2005, HSBC Holdings’ non-executive Directors met three times as a group with the Group Chairman, but with no other executive Directors
present, and met once as a group without the Group Chairman or other executive Directors present. HSBC Holdings’ practice, in this regard, complies with the Combined Code.
In accordance with the requirements of the Combined Code, HSBC Holdings discloses in its annual report how the Board, its committees and the Directors are evaluated and the results of the evaluation (on pages 202 to 203) and it provides extensive information regarding Directors’ compensation in the Directors’ Remuneration Report (on pages 215 to 232). The terms of reference of HSBC Holdings’ Audit, Nomination and Remuneration Committees are available at www.hsbc.com/committeeb.
NYSE listing standards require US companies to adopt a code of business conduct and ethics for directors, officers and employees, and promptly disclose any waivers of the code for directors or executive officers. In addition to the Group Business Principles and Values, which apply to the employees of all HSBC companies, pursuant to the requirements of the Sarbanes-Oxley Act the Board of HSBC Holdings has adopted a Code of Ethics applicable to the Group Chairman, the Group Finance Director and Group Chief Accounting Officer. HSBC Holdings’ Code of Ethics is available on www.hsbc.com/codeofethics or from the Group Company Secretary at 8 Canada Square, London E14 5HQ. If the Board amends or waives the provisions of the Code of Ethics, details of the amendment or waiver will appear at the same website address. During 2005 HSBC Holdings made no amendments to its Code of Ethics and granted no waivers from its provisions. The Group Business Principles and Values is available on www.hsbc.com/businessprinciplesandvalues.
Under NYSE listing rules applicable to US companies, independent directors must comprise a majority of the board of directors. Currently, over half of HSBC Holdings’ Directors are independent.
Under the Combined Code the HSBC Holdings Board determines whether a director is independent in character and judgement and whether there are relationships or circumstances which are likely to affect, or could appear to affect, the director’s judgement. Under the NYSE rules a director cannot qualify as independent unless the board affirmatively determines that the director has no material relationship with the listed company; in addition the NYSE rules prescribe a list of circumstances in which a director cannot be independent. The Combined Code requires a company’s board to assess director independence by affirmatively
207
Back to Contents
H S B C H O L D I N G S P L C
Report of the Directors(continued)
concluding that the director is independent of management and free from any business or other relationship that could materially interfere with the exercise of independent judgement.
Lastly, a chief executive officer of a US company listed on the NYSE must annually certify that he or she is not aware of any violation by the company of NYSE corporate governance standards. In accordance with NYSE listing rules applicable to foreign private issuers, HSBC Holdings’ Group Chairman is not required to provide the NYSE with this annual compliance certification. However, in accordance with rules applicable to both US companies and foreign private issuers, the Group Chairman is required promptly to notify the NYSE in writing after any executive officer becomes aware of any material non-compliance with the NYSE corporate governance standards applicable to HSBC Holdings.
Since July 2005 HSBC Holdings has been required to submit annual and interim written affirmations of compliance with applicable NYSE corporate governance standards, similar to the affirmations required of NYSE listed US companies. The first annual affirmation was submitted to the NYSE in August 2005.
The Directors are responsible for internal control in HSBC and for reviewing its effectiveness. Procedures have been designed for safeguarding assets against unauthorised use or disposition; for maintaining proper accounting records; and for the reliability of financial information used within the business or for publication. Such procedures are designed to manage rather than eliminate the risk of failure to achieve business objectives and can only provide reasonable and not absolute assurance against material misstatement, errors, losses or fraud. The procedures also enable HSBC Holdings to discharge its obligations under the Handbook of Rules and Guidance issued by the Financial Services Authority, HSBC’s lead regulator.
The key procedures that the Directors have established are designed to provide effective internal control within HSBC and accord with the Internal Control: Revised Guidance for Directors on the Combined Code issued by the Financial Reporting Council. Such procedures for the ongoing identification, evaluation and management of the significant risks faced by HSBC have been in place throughout the year and up to 6 March 2006, the date of approval of theAnnual Report and Accounts 2005. In the case of companies acquired during the
year, including Metris Companies Inc., the internal controls in place are being reviewed against HSBC’s benchmarks and integrated into HSBC’s systems.
HSBC’s key internal control procedures include the following:
| • | Authority to operate the various subsidiaries is delegated to their respective chief executive officers within limits set by the Board of Directors of HSBC Holdings or by the Group Management Board under powers delegated by the Board. Sub-delegation of authority from the Group Management Board to individuals requires these individuals, within their respective delegation, to maintain a clear and appropriate apportionment of significant responsibilities and to oversee the establishment and maintenance of systems of controls appropriate to the business. The appointment of executives to the most senior positions within HSBC requires the approval of the Board of Directors of HSBC Holdings. |
| | |
| • | Functional, operating, financial reporting and certain management reporting standards are established by Group Head Office management for application across the whole of HSBC. These are supplemented by operating standards set by functional and local management as required for the type of business and geographical location of each subsidiary. |
| | |
| • | Systems and procedures are in place in HSBC to identify, control and report on the major risks including credit, changes in the market prices of financial instruments, liquidity, operational error, breaches of law or regulations, unauthorised activities and fraud. Exposure to these risks is monitored by asset and liability committees and executive committees in subsidiaries and by the Group Management Board for HSBC as a whole. A Risk Management meeting, chaired by the Group Finance Director, is held each month. The Risk Management meeting addresses asset and liability management issues. Minutes of the Risk Management meeting are submitted to the Group Management Board and the Group Audit Committee. |
| | |
| • | Processes are in place to identify new risks from changes in market practices or customer behaviours which could expose HSBC to heightened risk of loss or reputational damage. During 2005 additional attention was directed towards evolving best practice in the areas of internet fraud, counterparty risk management policy following the publication of the Corrigan |
208
Back to Contents
| | report in July 2005 and responding to new public policy initiatives governing sales practices. |
| | |
| • | Periodic strategic plans are prepared for customer groups, global product groups, key support functions and certain geographies within the framework of the Group Strategic Plan. Operating plans are prepared and adopted by all HSBC companies annually, setting out the key business initiatives and the likely financial effects of those initiatives. |
| | |
| • | Centralised functional control is exercised over all computer system developments and operations. Common systems are employed for similar business processes where practicable. Credit and market risks are measured and reported on in subsidiaries and aggregated for review of risk concentrations on a Group-wide basis. |
| | |
| • | Responsibilities for financial performance against plans and for capital expenditure, credit exposures and market risk exposures are delegated with limits to line management in the subsidiaries. In addition, functional management in Group Head Office is responsible for setting policies, procedures and standards in the following areas of risk: credit risk; market risk; liquidity risk; operational risk; IT risk; insurance risk; accounting risk; tax risk; legal and regulatory compliance risk; human resources risk; reputational risk and purchasing risk; and for certain global product lines. |
| | |
| • | Policies to guide subsidiary companies and management at all levels in the conduct of business to safeguard the Group’s reputation are established by the Board of HSBC Holdings and the Group Management Board, subsidiary company boards, board committees or senior management. Reputational risks can arise from social, ethical or environmental issues, or as a consequence of operational risk events. As a banking group, HSBC’s good reputation depends upon the way in which it conducts its business but it can also be affected by the way in which clients, to which it provides financial services, conduct their business. |
| | |
| • | The internal audit function, which is centrally controlled, monitors the effectiveness of internal control structures across the whole of HSBC. The work of the internal audit function is focused on areas of greatest risk to HSBC as determined by a risk-based approach. The head of this function reports to the Group Chairman and the Group Audit Committee. |
| • | Management is responsible for ensuring that recommendations made by the internal audit function are implemented within an appropriate and agreed timetable. Confirmation to this effect must be provided to internal audit. Management must also confirm annually to internal audit that offices under their control have taken or are in the process of taking the appropriate actions to deal with all significant recommendations made by external auditors in management letters or by regulators following regulatory inspections. |
The Group Audit Committee has kept under review the effectiveness of this system of internal control and has reported regularly to the Board of Directors. The key processes used by the Committee in carrying out its reviews include: regular reports from the heads of key risk functions; the production annually of reviews of the internal control framework applied at Group Head Office and major operating subsidiary level measured against HSBC benchmarks, which cover all internal controls, both financial and non-financial; semi-annual confirmations from chief executives of principal subsidiary companies that there have been no material losses, contingencies or uncertainties caused by weaknesses in internal controls; internal audit reports; external audit reports; prudential reviews; and regulatory reports.
The Directors, through the Group Audit Committee, have conducted an annual review of the effectiveness of HSBC’s system of internal control covering all material controls, including financial, operational and compliance controls and risk management systems. The Group Audit Committee has received confirmation that management has taken or is taking the necessary action to remedy any failings or weaknesses identified through the operation of HSBC’s framework of controls.
| Reputational and operational risks |
|
HSBC regularly updates its policies and procedures for safeguarding against reputational and operational risks. This is an evolutionary process which takes account of The Association of British Insurers’ guidance on best practice when responding to social, ethical and environmental (‘SEE’) risks.
The safeguarding of HSBC’s reputation is of paramount importance to its continued prosperity and is the responsibility of every member of staff. HSBC has always aspired to the highest standards of conduct and, as a matter of routine, takes account of reputational risks to its business. The training of Directors on appointment includes reputational matters.
209
Back to Contents
H S B C H O L D I N G S P L C
Report of the Directors(continued)
Reputational risks, including SEE matters, are considered and assessed by the Board, the Group Management Board, subsidiary company boards, board committees and/or senior management during the formulation of policy and the establishment of HSBC standards. Standards on all major aspects of business are set for HSBC and for individual subsidiary companies, businesses and functions. These policies, which form an integral part of the internal control systems, are communicated through manuals and statements of policy and are promulgated through internal communications and training. The policies cover SEE issues and set out operational procedures in all areas of reputational risk, including money laundering deterrence, environmental impact, anti-corruption measures and employee relations. The policy manuals address risk issues in detail and co-operation between head office departments and businesses is required to ensure a strong adherence to HSBC’s risk management system and its corporate social responsibility practices.
Internal controls are an integral part of how HSBC conducts its business. HSBC’s manuals and statements of policy are the foundation of these internal controls. There is a strong process in place to ensure controls operate effectively. Any significant failings are reported through the control mechanisms, internal audit and compliance functions to subsidiary company audit committees and to the Group Audit Committee, which keeps under review the effectiveness of the system of internal controls and reports regularly to HSBC Holdings’ Board. In addition, all HSBC businesses and major functions are required to review their control procedures and to make regular reports about any losses arising from operational risks.
HSBC provides information in its Corporate Social Responsibility Report and website (www.hsbc.com/csr) on the extent to which it has complied with its social, ethical and environmental risk management policies. Aspects covered include: how HSBC is implementing and applying the Equator Principles to manage the environmental and social risks in project finance; employee diversity; environmental management; and health and safety. HSBC is using the guidelines of the Global Reporting Initiative in producing its 2005 Corporate Social Responsibility Report. Third party scrutiny of the assertions made in the report is provided through an assurance process conducted by URS Verification Limited, including a commentary in the report and on the HSBC website. HSBC’s direct environmental performance data is verified by Den Norske Veritas. HSBC also participates in the Dow Jones
Sustainability Index, FTSE4Good and Business in the Community’s Environment Index. HSBC’s Corporate Social Responsibility Report 2005 will be available at www.hsbc.com/csrreport from late-April 2006.
| Financial risk management |
|
The financial risk management objectives and policies of HSBC Holdings and its subsidiary undertakings included in the consolidation, in relation to the use of financial instruments, together with an analysis of the exposure to price, credit, liquidity and cash flow risks, as required under the Companies Act and International Financial Reporting Standards are set out in the risk management section of the Financial Review on pages 115 to 172 and in Note 17 and part of Note 47 on the Financial Statements on pages 285 and 375 respectively.
The maintenance of appropriate health and safety standards throughout HSBC remains a key responsibility of all managers and HSBC is committed to actively managing all health and safety risks associated with its business. HSBC’s objectives are to identify, remove, reduce or control material risks of fires and of accidents or injuries to employees and visitors.
Health and Safety Policies, Group standards and procedures are set by Group Fire and Safety and are implemented by Health, Safety and Fire Coordinators based in each country in which HSBC operates.
HSBC faces a range of threats from terrorists and criminals across the world. In particular, over recent years the threat from international terrorism has become significant in a number of areas where HSBC operates. This threat has mainly manifested itself in bomb attacks such as the one in Istanbul in 2003 in which HSBC’s Turkish headquarters building was attacked. Despite suffering tragic loss of life and major damage, existing security measures and well-managed contingency procedures ensured the business was able to return to normal operations the following day.
Group Security provides regular risk assessments in areas of increased risk to assist management in judging the level of terrorist threat. In addition, Regional Security functions conduct regular security reviews to ensure measures to protect HSBC staff, buildings, assets and information are appropriate for the level of threat.
210
Back to Contents
| Communication with shareholders |
|
Communication with shareholders is given high priority. Extensive information about HSBC’s activities is provided in theAnnual Report and Accounts,Annual Reviewand theInterim Reportwhich are sent to shareholders and are available on www.hsbc.com. There is regular dialogue with institutional investors and enquiries from individuals on matters relating to their shareholdings and the business of HSBC are welcomed and are dealt with in an informative and timely manner. Allshareholders are encouraged to attend the Annual General Meeting or the informal meeting of
shareholders held in Hong Kong to discuss the progress of HSBC.
According to the registers of Directors’ interests maintained by HSBC Holdings pursuant to section 325 of the Companies Act 1985 and section 352 of the Securities and Futures Ordinance of Hong Kong, the Directors of HSBC Holdings at the year-end had the following interests, all beneficial unless otherwise stated, in the shares and loan capital of HSBC and its associated corporations:
HSBC Holdings ordinary shares of US$0.50
| | | | At 31 December 2005 | |
| | | |
| |
| | | | | | | | | | Jointly | | | | | | Percentage | |
| | At | | | | Child | | | | with | | | | | | of ordinary | |
| | 1 January | | Beneficial | | under 18 | | | | another | | | | Total | | shares | |
| | 2005 | | owner | | or spouse | | Trustee | | person | | Other | | Interests | 1 | in issue | |
| | | | | | | | | | | | | | | | | |
| Sir John Bond | 451,531 | | 389,897 | | 3,743 | | – | | 121,160 | | – | | 514,800 | | 0.00 | |
| R K F Ch’ien | 47,796 | | 49,835 | | – | | – | | – | | – | | 49,835 | | 0.00 | |
| J D Coombe | 40,659 | 2 | 6,000 | | – | | 36,195 | 3 | – | | – | | 42,195 | | 0.00 | |
| Baroness Dunn | 164,411 | | 141,560 | | – | | 28,650 | 3 | – | | – | | 170,210 | | 0.00 | |
| D J Flint | 81,271 | | 54,726 | | – | | 27,000 | | – | | – | | 81,726 | | 0.00 | |
| W K L Fung | 328,000 | | 328,000 | | – | | – | | – | | – | | 328,000 | | 0.00 | |
| M F Geoghegan | 37,795 | | 73,536 | | – | | – | | – | | – | | 73,536 | | 0.00 | |
| S K Green | 243,659 | | 233,434 | | 16,359 | | – | | 45,355 | | – | | 295,148 | | 0.00 | |
| S Hintze | 2,037 | | 2,037 | | – | | – | | – | | – | | 2,037 | | 0.00 | |
| J W J Hughes-Hallett | 3,053,983 | 2 | – | | – | | 2,119,229 | 3 | – | | – | | 2,119,229 | | 0.02 | |
| A W Jebson | 83,628 | | 108,099 | | – | | – | | – | | – | | 108,099 | | 0.00 | |
| Sir John Kemp-Welch | 96,800 | | 127,300 | | 7,000 | | 6,000 | 3 | – | | – | | 140,300 | | 0.00 | |
| Sir Brian Moffat | 11,157 | | – | | – | | – | | 11,632 | | – | | 11,632 | | 0.00 | |
| Sir Mark Moody-Stuart | 10,840 | | 5,000 | | 840 | | 5,000 | 3 | – | | – | | 10,840 | | 0.00 | |
| S W Newton | 5,170 | | 5,391 | | – | | – | | – | | – | | 5,391 | | 0.00 | |
| H Sohmen | 3,270,147 | | – | | 1,302,274 | | – | | – | | 2,067,873 | 4 | 3,370,147 | | 0.03 | |
| Sir Brian Williamson | 15,865 | | 16,543 | | – | | – | | – | | – | | 16,543 | | 0.00 | |
| | |
| 1 | Details of executive Directors’ other interests in HSBC Holdings ordinary shares of US$0.50 arising from share option plans, The HSBC Share Plan and the HSBC Holdings Restricted Share Plan 2000 are set out in the Directors’ Remuneration Report on pages 215 to 232. |
| 2 | Interests at 1 March 2005 – date of appointment. |
| 3 | Non-beneficial. |
| 4 | Interests held by private investment companies. |
Sir John Bond has an interest as beneficial owner in £290,000 of HSBC Capital Funding (Sterling 1) L.P. 8.208 per cent Non-cumulative Step-up Perpetual Preferred Securities, which he held throughout the year.
S K Green has an interest as beneficial owner in €75,000 of HSBC Holdings plc 5½ per cent Subordinated Notes 2009 which he held throughout the year. During the year he ceased to have an interest in £100,000 of HSBC Bank plc 9 per cent Subordinated Notes 2005.
J W J Hughes-Hallett has a non-beneficial interest as Trustee in £4,700,000 of HSBC Capital Funding (Sterling 1) L.P. 8.208 per cent Non-cumulative Step-up Perpetual Preferred Securities, which he acquired during the year.
During the year, H Sohmen ceased to have a corporate interest in £1,200,000 of HSBC Bank plc 9 per cent Subordinated Notes 2005.
As Directors of HSBC France, S K Green and M F Geoghegan each have an interest as beneficial
211
Back to Contents
H S B C H O L D I N G S P L C
Report of the Directors(continued)
owner in one share of €5 in that company, which they held throughout the year. The Directors have waived their rights to receive dividends on these shares and have undertaken to transfer these shares to HSBC on ceasing to be Directors of HSBC France.
As Directors of HSBC Private Banking Holdings (Suisse), S K Green and M F Geoghegan each have an interest as beneficial owner in one share of CHF1,000, which they held during the year. The Directors have waived their rights to receive dividends on these shares and have undertaken to transfer these shares to HSBC on ceasing to be Directors of HSBC Private Banking Holdings (Suisse).
At 31 December 2005, the aggregate interests under the Securities and Futures Ordinance of Hong Kong of the executive Directors in HSBC Holdings ordinary shares of US$0.50 (each of which represents less than 0.01 per cent of the shares in issue, unless otherwise stated), including interests
arising through share option plans, the Restricted Share Plan and The HSBC Share Plan are: Sir John Bond – 1,663,088 (0.01 per cent of shares in issue); D J Flint – 668,647; M F Geoghegan – 549,492; S K Green – 1,097,718 (0.01 per cent of shares in issue); and A W Jebson –709,751.
No directors held any short positions as defined in the Securities and Futures Ordinance of Hong Kong. Save as stated above and in the Directors’ Remuneration Report, none of the Directors had an interest in any shares or debentures of any HSBC or associated corporation at the beginning or at the end of the year, and none of the Directors or members of their immediate family was awarded or exercised any right to subscribe for any shares or debentures during the year.
Since the end of the year, the interests of each of the following Directors have increased by the number of HSBC Holdings ordinary shares shown against their name:
HSBC Holdings ordinary shares of US$0.50
| | | | Child | | | | | |
| | Beneficial | | under 18 | | Jointly with | | Beneficiary | |
| | owner | | or spouse | | another person | | of a trust | |
| | | | | | | | | |
| Sir John Bond | 67 | 1 | 28 | 2 | – | | 10,846 | 3 |
| R K F Ch’ien | 429 | 4 | – | | – | | – | |
| Baroness Dunn | 1,222 | 4 | – | | – | | – | |
| D J Flint | 492 | 5 | – | | – | | 5,045 | 6 |
| M F Geoghegan | 533 | 7 | – | | – | | 4,106 | 6 |
| S K Green | 2,040 | 8 | 141 | 4 | – | | 6,903 | 6 |
| A W Jebson | 933 | 4 | – | | – | | 5,192 | 6 |
| Sir Brian Moffat | – | | – | | 100 | 4 | – | |
| S W Newton | 46 | 4 | – | | – | | – | |
| Sir Brian Williamson | 143 | 4 | – | | – | | – | |
| | | | | | | | | |
| 1 | Comprises the automatic reinvestment of dividend income by an Individual Savings Account and Personal Equity Plan manager (35 shares), the acquisition of shares in the HSBC Holdings UK Share Ownership Plan through regular monthly contributions (25 shares) and the automatic reinvestment of dividend income on shares held in the plan (7 shares). |
| 2 | The automatic reinvestment of dividend income by an Individual Savings Account and Personal Equity Plan manager. |
| 3 | Comprises scrip dividend on awards held under The HSBC Share Plan and the HSBC Holdings Restricted Share Plan 2000 (9,915 shares) and on shares held in a Trust (931 shares). |
| 4 | Scrip dividend. |
| 5 | Comprises scrip dividend on shares held as beneficial owner (425 shares), the acquisition of shares in the HSBC Holdings UK Share Ownership Plan through regular monthly contributions (25 shares), the automatic reinvestment of dividend income on shares held in the plan (7 shares) and by the automatic reinvestment of dividend income by an Individual Savings Account and Personal Equity Plan manager (35 shares). |
| 6 | Scrip dividend on awards held under The HSBC Share Plan and the HSBC Holdings Restricted Share Plan 2000. |
| 7 | Exercise of an option awarded in 2000 under the HSBC Savings-Related Share Option Plan: International; options over 26 shares lapsed. |
| 8 | Comprises scrip dividend on shares held as beneficial owner (2,008 shares), the acquisition of shares in the HSBC Holdings UK Share Ownership Plan through normal monthly contributions (25 shares) and the automatic reinvestment of dividend income on shares held in the plan (7 shares). |
S M Robertson held, on his appointment as a Director on 3 January 2006, a non-beneficial interest as Trustee in 36,195 HSBC Holdings ordinary shares.
Since the end of the year, the non-beneficial interests of J W J Hughes-Hallett as Trustee of two
Trusts have decreased by a net 44,194 HSBC Holdings ordinary shares.
There have been no other changes in Directors’ interests from 31 December 2005 to the date of this Report. Any subsequent changes up to the last practicable date before the publication of the ‘Notice
212
Back to Contents
of Annual General Meeting’ will be set out in the notes to that Notice.
At 31 December 2005, Directors and Senior Management held, in aggregate, beneficial interests in 26,043,491 HSBC Holdings ordinary shares (0.2 per cent of the issued ordinary shares).
HSBC Holdings continues to regard communication with its employees as a key aspect of its policies. Information is given to employees about employment matters and about the financial and economic factors affecting HSBC’s performance through management channels, an intranet site accessible to all HSBC’s employees worldwide, in-house magazines and by way of attendance at internal seminars and training programmes. Employees are encouraged to discuss operational and strategic issues with their line management and to make suggestions aimed at improving performance. The involvement of employees in the performance of HSBC is further encouraged through participation in bonus and share plans as appropriate.
About half of all HSBC employees now participate in one or more of HSBC’s employee share plans.
| Employment of disabled persons |
|
HSBC Holdings continues to be committed to providing equal opportunities to employees. The employment of disabled persons is included in this commitment and the recruitment, training, career development and promotion of disabled persons is based on the aptitudes and abilities of the individual. Should employees become disabled during employment, every effort is made to continue their employment and, if necessary, appropriate training is provided.
HSBC Holdings subscribes to the Better Payment Practice Code for all suppliers, the four principles of which are: to agree payment terms at the outset and stick to them; to explain payment procedures to suppliers; to pay bills in accordance with any contract agreed with the supplier or as required by law; and to tell suppliers without delay when an invoice is contested and settle disputes quickly.
Copies of, and information about, the Code are available from: The Department of Trade and Industry, 1 Victoria Street, London SW1H 0ET; and the internet at www.dti.gov.uk/publications.
It is HSBC Holdings’ practice to organise payment to its suppliers through a central accounts function operated by its subsidiary, HSBC Bank. Included in the balance with HSBC Bank is the amount due to trade creditors which, at 31 December 2005, represented 22 days’ average daily purchases of goods and services received from such creditors, calculated in accordance with the Companies Act 1985, as amended by Statutory Instrument 1997/571.
| Notifiable interests in share capital |
|
According to the register maintained by HSBC Holdings under section 211 of the Companies Act 1985:
| • | Legal and General Investment Management Limited gave notice on 11 June 2002 that it had an interest in 284,604,788 HSBC Holdings ordinary shares, representing 3.01 per cent of the ordinary shares in issue at that date; |
| | |
| • | Barclays PLC gave notice on 2 June 2005 that it had an interest in 351,871,399 HSBC Holdings ordinary shares representing 3.14 per cent of the ordinary shares in issue on that date; and |
| | |
| • | Credit Suisse First Boston gave notice on 30 November 2005 that it had an interest in 553,491,660 HSBC Holdings ordinary shares, representing 4.89 per cent of the ordinary shares in issue at that date. |
There are no notifiable interests in the equity share capital recorded in the register maintained under section 336 of the Securities and Futures Ordinance of Hong Kong.
In compliance with the Rules Governing the Listing of Securities on The Stock Exchange of Hong Kong Limited at least 25 per cent of the total issued share capital of HSBC Holdings has been held by the public at all times during 2005 and up to the date of this Report.
| Dealings in HSBC Holdings shares |
|
Except for dealings as intermediaries by HSBC Bank, HSBC Financial Products (France) and The Hongkong and Shanghai Banking Corporation, which are members of a European Economic Area exchange, neither HSBC Holdings nor any subsidiary undertaking has bought, sold or redeemed any securities of HSBC Holdings during the year ended 31 December 2005.
During the year, HSBC made charitable donations totalling US$81.4 million. Of this amount,
213
Back to Contents
H S B C H O L D I N G S P L C
Report of the Directors(continued)
US$28.9 million was given for charitable purposes in the United Kingdom.
No political donations were made during the year.
At the Annual General Meeting in 2003 shareholders gave authority for HSBC Holdings and HSBC Bank to make EU political donations and incur EU political expenditure up to a maximum aggregate sum of £250,000 and £50,000 respectively over a four-year period as a precautionary measure in light of the wide definitions in The Political Parties, Elections and Referendums Act 2000. These authorities have not been used.
The Annual General Meeting of HSBC Holdings will be held at the Barbican Hall, Barbican Centre, London EC2 on Friday 26 May 2006 at 11.00am.
An informal meeting of shareholders will be held at Level 28, 1 Queen’s Road Central, Hong Kong on Tuesday 23 May 2006 at 4.30pm.
A live webcast of the Annual General Meeting will be available on www.hsbc.com. From shortly after the conclusion of the Meeting until 30 June 2006 a recording of the proceedings will be available on www.hsbc.com.
KPMG Audit Plc has expressed its willingness to continue in office. The Group Audit Committee and the Board recommend that it be reappointed. A resolution proposing the reappointment of KPMG Audit Plc as auditor of HSBC Holdings and giving authority to the Group Audit Committee to determine its remuneration will be submitted to the forthcoming Annual General Meeting.
| On behalf of the Board | |
| R G Barber, Secretary | 6 March 2006 |
214
Back to Contents
H S B C H O L D I N G S P L C
Directors’ Remuneration Report
The Remuneration Committee meets regularly to consider human resource issues, particularly terms and conditions of employment, remuneration, retirement benefits, development of high potential employees and key succession planning. The Remuneration Committee seeks to respond to the variety of environments and circumstances which are faced by different businesses in different markets at different times and has in place appropriate policies and procedures to monitor the size of the potential remuneration awards and resulting company liabilities. The Remuneration Committee reviews the incentive plans on an ongoing basis to ensure that they remain effective and appropriate to HSBC’s circumstances and prospects.
The members of the Remuneration Committee throughout 2005 were Sir Mark Moody-Stuart (Chairman), W K L Fung, S Hintze and Sir John Kemp-Welch. J D Coombe has been appointed a member of the Committee with effect from 1 June 2006.
There were seven meetings of the Remuneration Committee during 2005. S Hintze, Sir Mark Moody-Stuart and Sir John Kemp-Welch attended all of these meetings and W K L Fung attended six meetings. Following each meeting the Committee reports to the Board on its activities. The terms of reference of the Committee are available at www.hsbc.com/committeer.
Towers Perrin, a firm of specialist human resources consultants, has been appointed by the Committee to provide independent advice on executive remuneration issues. As a global firm, Towers Perrin also provides other remuneration, actuarial and retirement consulting services to various parts of HSBC. Other than the provision of expert advice in these areas to the Remuneration Committee and to HSBC, Towers Perrin have no connection with HSBC. Other consultants are used from time to time to validate their findings. The Remuneration Committee also receives advice from the Group General Manager, Human Resources, J C S Rankin until 31 December 2005 and P W Boyles since 1 January 2006, and the Senior Executive, Group Reward Management, P M Wood.
| General Policy on Employees |
|
As with most businesses, HSBC’s performance depends on the quality and commitment of its people. Accordingly, the Board’s stated strategy is to attract, retain and motivate the very best people.
In a business that is based on trust and relationships, HSBC’s broad policy is to look for people who want to make a long-term career with the organisation since trust and relationships are built over time.
Remuneration is an important component in people’s decisions on which company to join, but it is not the only one; it is HSBC’s experience that people are attracted to an organisation with good values, fairness, the potential for success and the scope to develop a broad, interesting career.
Within the authority delegated by the Board of Directors, the Remuneration Committee is responsible for determining the remuneration policy of HSBC including the terms of bonus plans, share plans and other long-term incentive plans, and for agreeing the individual remuneration packages of executive Directors and other senior Group employees. No Directors are involved in deciding their own remuneration.
The Remuneration Committee applies the following key principles:
| • | to ensure that the total remuneration package (salary, bonus, long-term incentive awards and other benefits) is competitive in relation to comparable organisations in each of the countries or regions in which HSBC operates; |
| | |
| • | to offer fair and realistic salaries with an important element of variable pay, differentiated by performance; |
| | |
| • | through awards of shares (and in limited circumstances, share options) to recognise high performance and retain key talent; and |
| | |
| • | since 1996, to follow a policy of moving progressively from defined benefit to defined contribution Group pension schemes for new employees only. |
| | |
| | In line with these principles: |
| | |
| • | employees’ salaries are reviewed annually in the context of individual and business performance, market practice, internal relativities and competitive market pressures. Allowances and benefits are largely determined by local market practice; |
| | |
| • | employees participate in various bonus arrangements. The level of performance-related variable pay depends upon the performance of constituent businesses and the individual concerned. Variable bonus plans emphasise revenue growth whilst retaining a strong link to expense control; other key measures taken into |
215
Back to Contents
H S B C H O L D I N G S P L C
Directors’ Remuneration Report(continued)
| | account in determining individual bonus levels include customer relationships; full utilisation of professional skills; and adherence to HSBC’s ethical standards, internal controls and procedures. Bonus ranges are reviewed in the context of prevailing market practice; and |
| | |
| • | HSBC has a long history of paying close attention to its customers in order to provide value for shareholders. This has been achieved by ensuring that the interests of HSBC and its employees are aligned with those of its shareholders and that HSBC’s approach to risk management serves the interests of all.
Accordingly, employees are encouraged to participate in the success they help to create, through participating in the HSBC Holdings savings-related share option plans and in local share ownership and profit sharing arrangements. |
Following a comprehensive review of share-based remuneration arrangements, The HSBC Share Plan was approved at the 2005 Annual General Meeting. The arrangements for the most senior executives of HSBC are described under ‘Long-term incentive plan’ on page 219.
Below the senior executive level and in the context of an employee’s total remuneration package, the practice of awarding share options at all levels within HSBC has been reviewed.Commencing with awards made in 2005, restricted shares will be granted to a substantially smaller number of executives than those who previously received share options, with awards focused on those individuals who bring key talents and high levels of performance to the Group. These awards will normally vest after three years, subject to the individual remaining in employment. Awards of share options will only be granted in limited circumstances. For those who will normally no longer be eligible to receive awards of shares or share options, variable bonus arrangements have been reviewed and enhanced, as appropriate, taking account of local markets. Such changes may include an element of deferral.
In 2003, under the HSBC Holdings Group Share Option Plan, share option awards were made to some 35,000 high performing employees (approximately the top 20 per cent of performers) below senior management who are still with HSBC. The awards included those at the most junior levels in the organisation. Of the awards of share options, over 95 per cent were granted subject to the achievement of the same performance conditions as apply to awards of shares under the HSBC Holdings
Restricted Share Plan 2000 (as described under ‘Arrangements from 2000-2004’ on pages 221 to 223, below). In addition, in some areas, performance was rewarded by bonuses rather than share options. Awards of share options with performance conditions were relatively modest, but form an important part of performance motivation of frontline staff. The range of awards was up to 10,000 shares under option with an average award of 1,100. With a recent share price of £9.50 and an option price of £6.91 this would translate to an average gain of £2,850. Some 60 per cent of those granted awards in 2003 received awards of 1,000 shares under option or fewer.
The Total Shareholder Return (TSR) comparison with the defined Benchmark is not due to be made until 31 March 2006. As at 28 February 2006 HSBC’s TSR, while showing growth of 67 per cent since the beginning of the measurement period in March 2003, is lower than the Benchmark TSR. A performance condition based on a single TSR test against a comparator group is very sensitive to the relative position at the start of the measurement period. HSBC’s share price at the start of the measurement period for the 2003 awards under the HSBC Holdings Group Share Option Plan was at an unusually high level compared to historical relationships within the comparator group. Several companies in the comparator group have subsequently recovered from the historically low ratings they experienced in 2003, thereby affecting HSBC’s relative TSR performance over the measurement period.
While not currently meeting the TSR performance condition for the 2003 awards under the HSBC Holdings Group Share Option Plan, HSBC Holdings has delivered impressive and sustained performance and shareholder returns over the same period. EPS for 2002 (which was calculated on a UK GAAP basis, excluding goodwill amortisation) was US$0.76 and for 2005 (now prepared under IFRSs) it was US$1.36, representing an increase of 79 per cent. Dividends per share have grown by 38 per cent over the same period. The cash return on cash invested has improved from 12.9 per cent in 2002 to 15.7 per cent in 2005.
In light of the above, the Committee has decided that if the performance condition is not satisfied at the end of March 2006, the Committee will exercise its discretion to waive the performance condition in respect of the 2003 awards under the HSBC Holdings Group Share Option Plan. This waiver will not apply to awards with performance conditions which were granted to senior executives under the
216
Back to Contents
French sub-plan of the HSBC Holdings Group Share Option Plan.
To encourage greater participation in the HSBC Holdings Savings-Related Share Option Plan: International, two amendments were approved at the 2005 Annual General Meeting. The first was the introduction of the facility to save and have option prices expressed in US dollars, Hong Kong dollars and euros as well as in pounds sterling. The maximum savings limit of £250 per month will continue to apply but be converted to the other currencies on a consistent and appropriate date. The second amendment gives individuals the choice of options over one year in addition to three and five year terms. This change carries tax advantages in certain jurisdictions.
The impact on earnings per share of granting share options which are to be satisfied by the issue of new shares is shown in diluted earnings per share on the face of the consolidated income statement, with further details disclosed in Note 12 on the Financial Statements on page 276. The effect on basic earnings per share of exercising all outstanding share options would be to dilute it by 0.42 per cent.
Employee share plans are subject to the following limits on the number of HSBC Holdings ordinary shares that may be subscribed for. In any 10-year period not more than 10 per cent of the HSBC Holdings ordinary shares in issue from time to time (approximately 1,137 million at 6 March 2006) may in aggregate become issuable pursuant to the grant of options or be issued other than pursuant to options under all-employee share plans. In any 10-year period not more than 5 per cent of the HSBC Holdings ordinary shares in issue from time to time (approximately 568 million ordinary shares at 6 March 2006) may in aggregate be put under option under The HSBC Share Plan or be issuable pursuant to the HSBC Holdings Group Share Option Plan, the HSBC Executive Share Option Scheme, The HSBC Holdings Restricted Share Plan 2000 or The HSBC Share Plan. The number of HSBC Holdings ordinary shares that may be issued on exercise of all options granted on or after 27 May 2005 under The HSBC Share Plan and any other plans must not exceed 1,119,000,000 HSBC Holdings ordinary shares. In the 10-year period to 31 December 2005, less than 600,000,000 HSBC Holdings ordinary shares had been issued or could become issuable under all-employee share plans and less than 350 million HSBC Holdings ordinary shares had been issued or could become issuable under discretionary employee share plans, including the HSBC Holdings Group Share Option Plan, the HSBC Holdings Restricted Share Plan 2000 and The HSBC Share Plan.
The new UK pensions tax regime introduced by the Finance Act 2004 means that the current pension arrangements may cease to be tax effective for some employees. The changes become effective from 6 April 2006. In anticipation of these changes, the Remuneration Committee established some principles when formulating its policy response:
| 1. | the cost of executive pension provision should not increase; |
| | |
| 2. | HSBC should not compensate individuals for changes in the tax regime; and |
| | |
| 3. | HSBC should make available an effective alternative form of reward where current pension provision is no longer tax effective for senior executives. |
After taking advice and considering market data, all UK employees whose pension arrangements may cease to be a tax effective reward mechanism with defined benefit pension provision will be offered the following choices:
| 1. | retain their current pension plan membership; or |
| | |
| 2. | opt-out of the current pension plan to receive either (i) a salary supplement, paid monthly, in lieu of pension provision; or (ii) a pension promise from HSBC that will pay the same benefit as if the executive had continued in the current plan (provided on an unfunded basis). |
UK employees whose pension arrangements may cease to be a tax effective reward mechanism with defined contribution pension provision will be offered the following choices:
| 1. | retain their current pension plan membership; or |
| | |
| 2. | a salary supplement, paid monthly, in lieu of pension provision of the same amount as the current employer pension contribution. |
| |
| Directors and Senior Management |
|
HSBC’s operations are substantial, diverse and international; for example, over 79 per cent of profit before tax is derived from outside the United Kingdom.
The HSBC Holdings’ Board comprises 15 non-executive Directors and five executive Directors. With businesses in 76 countries and territories, HSBC aims to attract Directors with a variety of experience, both in its key areas of activity and internationally. The Board currently includes nationals of four different countries. The five executive Directors, seven Group Managing Directors and 29 Group General Managers have in total more than 945 years of service with HSBC.
217
Back to Contents
H S B C H O L D I N G S P L C
Directors’ Remuneration Report(continued)
Directors’ fees
Directors’ fees are regularly reviewed and compared with other large international companies. The current fee, which was approved by shareholders in 2004, is £55,000 per annum. With effect from 1 January 2005, all executive Directors waived their rights to receive a Director’s fee from HSBC Holdings. Having considered comprehensive data it is clear that the current Director’s fee is below the level paid in other major UK companies. The approval of shareholders will therefore be sought at the 2006 Annual General Meeting for the fee for non-executive Directors to be increased to £65,000 per annum with effect from 1 January 2006.
In addition, non-executive Directors receive, from 1 January 2006, the following fees:
| Chairman, Audit Committee | £50,000 p.a. |
| Member, Audit Committee | £20,000 p.a. |
During 2005, seven Audit Committee meetings were held. A Director’s commitment to each meeting, including preparatory reading and review, can be 15 hours or more.
| Chairman, Remuneration Committee | £40,000 p.a. |
| Member, Remuneration Committee | £20,000 p.a. |
During 2005, seven meetings of the Remuneration Committee were held.
| Chairman, Nomination Committee | £30,000 p.a. |
| Member, Nomination Committee | £20,000 p.a. |
During 2005, three meetings of the Nomination Committee were held.
| Chairman, Corporate Social | |
| Responsibility Committee | £30,000 p.a. |
| Member, Corporate Social | |
| Responsibility Committee | £20,000 p.a. |
During 2005, four meetings of the Corporate Social Responsibility Committee were held.
Executive DirectorsThe executive Directors are experienced executives with detailed knowledge of the financial services business in various countries. In most cases there has been a need to attract them from abroad to work in the United Kingdom.
Consistent with the principles applied by the Committee to employees generally, there are four key components to the executive Directors’ remuneration:
| • | salary; |
| | |
| • | annual cash bonus; |
| | |
| • | long-term incentives; and |
| | |
| • | pension. |
| | |
| | To ensure that the executive Directors’ |
remuneration packages are competitive having regard to the broad international nature of the Group, each year the Remuneration Committee considers market data on senior executive remuneration arrangements within organisations that are considered key competitors.
In 2005, a review of the competitive peer groups was undertaken to ascertain their continued relevance to roles at HSBC Holdings. The review resulted in a slight change in the composition and emphasis of the peer groups so that for the 2006 review they consisted primarily of:
| • | FTSE30 companies with significant international operations in the US and/or in Asia-Pacific. This peer group comprised 22 companies and representative companies include: Anglo American plc, AstraZeneca plc, Barclays PLC, BP p.l.c., Diageo plc, GlaxoSmithKline plc, Prudential plc, Reckitt Benckiser plc, Rio Tinto plc, The Royal Bank of Scotland Group plc, Royal Dutch Shell plc, Standard Chartered PLC, Unilever PLC and Vodafone Group plc. |
| | |
| • | European banks with significant domestic and/or global operations/influences. These banks include ABN AMRO Holding N.V., Banco Bilbao Vizcaya Argentaria S.A., Banco Santander Central Hispano S.A., Credit Suisse Group and Deutsche Bank AG. |
Although not used for setting remuneration benchmarks, the Remuneration Committee also considers it important to be mindful of trends in the level and structure of executive reward in the United States banking sector. Market information is monitored for major US institutions of a comparable size and complexity to HSBC Holdings, including: Bank of America Corporation, Citigroup Inc. and JPMorgan Chase & Co.
The level of awards available to the executive Directors under the annual cash bonus scheme and as Performance Shares is entirely dependent on performance. Remuneration policy for executive Directors is intended to provide competitive rates of base salary but with the potential for the majority of the value of the remuneration package to be delivered in the form of both short and long-term incentives. This typically results in base salary comprising around 30 per cent of total direct pay and the remaining 70 per cent split between annual bonus and the expected value of Performance Share awards.
Each component of executive Directors’ remuneration is explained in detail below as it
218
Back to Contents
applies to 2006 and, as far as possible, for subsequent years. Any changes in policy for subsequent years will be described in future reports on Directors’ remuneration.
Salary
The Committee reviews salary levels for executive Directors each year in the same context as other employees. With reference to market practice and taking account of the international nature of the Group, the Committee benchmarks the salary of each Director and member of Senior Management against those of comparable executives in large, diverse companies.
Base salaries with effect from March 2006 will be:
| Sir John Bond | £ | 1,400,000 |
| D J Flint | £ | 575,000 |
| M F Geoghegan | £ | 1,000,000 |
| S K Green | £ | 1,250,000 |
| A W Jebson | £ | 550,000 |
To assist with a smooth transition to the revised organisation structure announced in November 2005 and with the aim of having only one salary adjustment per year, the salary increases for S K Green and M F Geoghegan incorporate adjustments for their new appointments as Group Chairman and Group Chief Executive respectively.
Annual cash bonus
Cash bonuses for executive Directors are based on two key factors: individual performance, taking into account, as appropriate, results against plan of the business unit or performance of the support function for which the individual is responsible; and Group performance, measured by comparing operating profit before tax with plan. The Remuneration Committee has discretion to eliminate extraordinary items when assessing bonuses, if the main cause did not arise during the current bonus year.
Measurement against these key performance factors may result in discretionary cash bonuses of up to 250 per cent of basic salary for executive Directors.
Long-term incentive plan
Long-term incentive plans are designed to reward the delivery of sustained financial growth of HSBC. So as to align the interests of the Directors and senior employees more closely with those of shareholders, the vesting of Performance Share awards is subject to the attainment of predetermined performance criteria.
As part of the comprehensive review of share-based remuneration in 2004-2005, the Remuneration Committee considered whether the continued use of Performance Shares was appropriate. The Committee considered several other types of arrangement but concluded that Performance Shares remain the most appropriate vehicle for HSBC’s executive Directors and Senior Management.
Following approval at the 2005 Annual General Meeting, The HSBC Share Plan has replaced the HSBC Holdings Restricted Share Plan 2000 and the HSBC Holdings Group Share Option Plan as the plan under which long-term incentive awards are made.
The vesting of Performance Share awards under The HSBC Share Plan is more challenging and highly geared to performance than under the previous arrangements. Vesting is now based on two independent measures, relative TSR and growth in earnings per share, both of which are considered by the Remuneration Committee to be key measures of the Group’s overall business success.
Awards under The HSBC Share Plan can be up to a maximum of seven times salary. Whilst having flexibility to make awards at this level in certain exceptional circumstances, the Remuneration Committee does not intend seven times salary to be the normal level of award. The average face value of the awards proposed for executive Directors is 2.3 times base salary; proposed individual awards are set out in the table below. The average face value of awards proposed for 2006 for Group Managing Directors and Group General Managers is 1.6 times salary; no award is higher than four times salary.
Further details of the performance conditions and vesting arrangements for The HSBC Share Plan are set out below. A summary of the arrangements relevant to previous awards of Performance Shares under The HSBC Holdings Restricted Share Plan 2000 is also given.
2006 awards
The Remuneration Committee is proposing that the conditional awards shown in the table below should be made to executive Directors in 2006. The table shows the face value of the full conditional awards and their approximate expected value.
219
Back to Contents
H S B C H O L D I N G S P L C
Directors’ Remuneration Report(continued)
| | | Face | | | Expected |
| | | value | | | value |
| | | £000 | | | £000 |
| D J Flint | | 1,600 | | | 704 |
| M F Geoghegan | | 2,000 | | | 880 |
| S K Green | | 2,500 | | | 1,100 |
| |
| |
|
| Total | | 6,100 | | | 2,684 |
| |
| |
|
The higher face value of these awards reflects the significantly more challenging vesting schedule of The HSBC Share Plan where maximum value will only be released to the individual if Group performance is at a very high level.
The Trustee to the Plan will be provided with funds to acquire HSBC Holdings ordinary shares at an appropriate time after the announcement of the annual results.
Sir John Bond and A W Jebson, who are to retire at the conclusion of the forthcoming Annual General Meeting, will not receive long-term incentive awards in 2006.
Performance conditionsAwards of Performance Shares under The HSBC Share Plan are divided into two equal parts subject to separate performance conditions measured over a three-year performance period (‘the performance period’):
| • | the Total Shareholder Return award (‘TSR award’): one half of the award of Performance Shares will be subject to a relative TSR measure. TSR is defined as the growth in share value and declared dividend income, measured in sterling, during the relevant period. In calculating TSR, dividend income is assumed to be reinvested in the underlying shares. As the comparator group includes companies listed on overseas markets, a common currency is used to ensure that TSR is measured on a consistent basis; and |
| | |
| • | the earnings per ordinary share award (‘EPS award’): the other half of the Performance Share award will be based upon the absolute growth in EPS achieved by HSBC Holdings. For this purpose, EPS means the profit attributable to the shareholders (expressed in US dollars), divided by the weighted average number of ordinary shares in issue and held outside the Group during the year in question. |
The TSR award is based on HSBC’s ranking against a comparator group of 28 major banks. The comparator group will generally comprise the largest banks in the world measured in terms of market capitalisation, having regard to the geographic
spread and the nature of the activities of each bank. The Remuneration Committee will use these criteria in selecting any replacements to the comparator group that may be necessary during the performance period, for example because a bank ceases to exist or to be quoted or if its relevance to HSBC as a comparator significantly diminishes.
The TSR comparator group at 6 March 2006 comprises ABN AMRO Holding N.V., Banco Bilbao Vizcaya Argentaria S.A, Banco Santander Central Hispano S.A., Bank of America Corporation, The Bank of New York Company, Inc., Barclays PLC, BNP PARIBAS S.A., Citigroup Inc., Crédit Agricole S.A., Credit Suisse Group, Deutsche Bank AG, HBOS plc, JPMorgan Chase & Co., Lloyds TSB Group plc, Mitsubishi Tokyo Financial Group, Inc., Mizuho Financial Group, Inc., Morgan Stanley, National Australia Bank Limited, Royal Bank of Canada, The Royal Bank of Scotland Group plc, Société Générale, Standard Chartered PLC, UBS AG, UniCredito Italiano S.p.A., US Bancorp, Wachovia Corporation, Wells Fargo & Company and Westpac Banking Corporation.
The extent to which the TSR award will vest will be determined on a sliding scale based on HSBC Holdings’ relative TSR ranking against the comparator group. The opening calculation of the share price component within HSBC Holdings’ TSR will be the average market price over the 20 trading days commencing on the day when the annual results are announced, which in 2006 is 6 March. The starting point will be, therefore, the average over the period 6 March to 31 March 2006 inclusive. The end point will be the average market price over the 20 trading days commencing on the day on which the annual results are announced three years later. TSR for comparator group constituents will be calculated over the same two periods.
For TSR performance in line with the bank ranked 14th, only 30 per cent of the conditional TSR award will vest; if HSBC’s performance is in line with or above the bank ranked 7th in the ranked list all of the TSR award shares will vest.
Vesting between the 14th and 7th ranked banks will be based on HSBC’s position against the ranked list. In simple terms, the percentage vesting will start at 30 per cent and will rise in 10 per cent increments for each position that HSBC achieves higher than the 14th bank in the ranked list until full vesting is achieved for TSR performance equal to or greater than the 7th bank in the ranked list. Where HSBC’s performance falls between these incremental steps, account will be taken of HSBC’s TSR performance
220
Back to Contents
relative to the banks immediately above and below it.
For example, if HSBC’s TSR falls half way between the bank ranked 12th (where, a release of 50 per cent of the TSR award would occur) and the bank ranked 13th (where a release of 40 per cent of the TSR award would occur), then the actual proportion of the TSR award released would be 45 per cent, i.e. half way between 40 per cent and 50 per cent.
For the EPS award, the base measure shall be EPS for the financial year preceding that in which the award is made (‘the base year’). EPS will then be compared with the base year over three consecutive financial years commencing with the year in which the award is made. Incremental EPS shall be calculated by expressing as a percentage of the EPS of the base year the difference each year of the three-year performance period between the EPS of that year and the EPS of the base year (with a negative percentage for any year in which the EPS is less than the EPS of the base year). These percentages will then be aggregated to arrive at the total incremental EPS for the performance period. In the event that the published EPS for the base year is restated during the performance period to adjust for changes in accounting standards, that restated EPS will be used for the purposes of the EPS performance condition.
The percentage of the conditional EPS award vesting will depend upon the absolute growth in EPS achieved over the three years. 30 per cent of the EPS award will vest if the incremental EPS over the performance period is 24 per cent or more.
The percentage of shares vesting will rise on a straight line proportionate basis to 100 per cent if HSBC’s incremental EPS over the performance period is 52 per cent or more.
No element of the TSR award will vest if over the three-year performance period HSBC’s TSR is below that of the bank ranked 14th in the comparator group list and no element of the EPS award will vest if HSBC’s incremental EPS over the performance period is less than 24 per cent.
To the extent that the performance conditions have not been met at the third anniversary, the shares awarded will be forfeited.
In addition, awards will not vest unless the Remuneration Committee is satisfied that HSBC Holdings’ financial performance has shown a sustained improvement in the period since the award date.
In determining whether HSBC has achieved a sustained improvement in performance the Remuneration Committee will take account of all relevant factors but in particular the historical comparison against the comparator group in the following areas:
| 1. | revenue growth; |
| | |
| 2. | revenue mix; |
| | |
| 3. | cost efficiency; |
| | |
| 4. | credit performance as measured by risk-adjusted revenues; and |
| | |
| 5. | cash return on cash invested, dividend performance and total shareholder return. |
Following the three-year performance period, the conditions applying to awards of Performance Shares under The HSBC Share Plan will be tested and vesting will take place shortly afterwards. Shares released will include additional shares equivalent to the value of the dividends payable on the vested shares over the performance period, where permitted by the laws of the relevant jurisdiction.
If events occur which cause the Remuneration Committee to consider that a performance condition has become unfair or impractical, the right is reserved to the Remuneration Committee, if it considers it appropriate to do so, to amend, relax or waive the condition.
Awards will vest in full immediately in cases of death. In the event of redundancy, retirement on grounds of injury or ill health, early retirement by agreement, normal retirement and where a participant ceases to be employed by HSBC, awards will normally vest at the end of the vesting period on a time-apportioned basis to the extent that the performance conditions have been satisfied. In the event of a change of control, awards will normally vest immediately and on a time-apportioned basis to the extent that the TSR performance condition has been satisfied. Awards will normally be forfeited if the participant is dismissed or resigns from HSBC. In all these circumstances the Committee retains discretion to ensure fair and reasonable treatment.
Arrangements from 2000-2004
For awards made from 2000 to 2004, vesting was linked to the attainment of predetermined TSR targets over a three-year period from date of award as set out below.
The TSR performance condition for awards of Performance Shares remained the same from 1999 to 2003. For awards made in 2004, changes were made
221
Back to Contents
H S B C H O L D I N G S P L C
Directors’ Remuneration Report(continued)
to the peer group and re-testing provisions were eliminated such that awards will lapse if the performance condition is not satisfied after the initial three-year performance period.
A benchmark for HSBC Holdings’ TSR, weighted by market capitalisation, was established which takes account of the TSR performance of:
1. | a peer group of nine banks weighted by market capitalisation which were considered most relevant to HSBC in terms of size and international scope. For performance periods up to and including the one beginning in 2003, this group comprised ABN AMRO Holding N.V., The Bank of East Asia, Limited, Citigroup Inc., Deutsche Bank AG, JPMorgan Chase & Co., Lloyds TSB Group plc, Mitsubishi Tokyo Financial Group Inc., Oversea-Chinese Banking Corporation Limited and Standard Chartered PLC. To be more relevant to HSBC in terms of size and international scope, this peer group was amended for conditional awards made in 2004 by the replacement of Lloyds TSB Group plc, Oversea-Chinese Banking Corporation Ltd., Mitsubishi Tokyo Financial Group Inc. and The Bank of East Asia, Limited with Bank of America Corporation, The Royal Bank of Scotland Group plc, Banco Santander Central Hispano S.A. and UBS AG; |
| |
2. | the five largest banks from each of the US, the UK, continental Europe and the Far East, other than any within paragraph 1 above, weighted by market capitalisation; and |
| |
3. | the banking sector of the Morgan Stanley Capital International World Index, excluding any within paragraph 1 or paragraph 2 above, weighted by market capitalisation. |
By combining the weighted average TSR for each of the above three groups and weighting that average so that 50 per cent is applied to paragraph 1, 25 per cent is applied to paragraph 2 and 25 per cent is applied to paragraph 3, a single TSR benchmark for market comparison was determined.
The extent to which each award will vest will be determined by reference to HSBC Holdings’ TSR measured against the TSR benchmark. For each award the opening calculation of the share price component within HSBC Holdings’ TSR was the average market price over the 20 trading days commencing on the day when the annual results were announced. TSR for the benchmark constituents was based on their published share prices on the 20th trading day after the annual results were announced. If HSBC Holdings’ TSR over the
performance period exceeds the benchmark TSR, awards with a value, at the date of grant, of up to 100 per cent of the individual’s earnings (base salary and bonus in respect of the previous performance year), will vest. For higher value awards, the greater of 50 per cent of the award or the number of shares equating at the date of grant to 100 per cent of the individual’s earnings, will vest at this level of performance. If HSBC Holdings’ TSR over the performance period places it within the upper quartile of the ranked list of the banks comprising the benchmark, these higher value awards will vest in full. For performance between the median and the upper quartile, vesting will be on a straight-line basis.
The Performance Shares awarded in 2000 passed their three-year TSR performance condition in March 2003 and vested on the fifth anniversary of the award, 10 March 2005. The Performance Shares awarded in 2001 and 2002 have passed their three-year TSR performance conditions and will vest on the fifth anniversaries of the awards, 13 March 2006 and 8 March 2007 respectively.
For awards made in 2003 the initial performance period is three years. If the upper quartile performance target is achieved at the third anniversary of the date of award then an additional award equal to 20 per cent of the initial Performance Share award will be made and will vest at the same time as the original award to which it relates. However, regardless of whether the upper quartile is achieved, full vesting and transfer of the shares will not generally occur until the fifth anniversary of the date of grant. For awards made in 2004 the conditions are the same but, if the performance test is not passed at the third anniversary, the shares will be forfeited.
In addition to these performance conditions, none of the outstanding awards will vest unless the Remuneration Committee is satisfied that, during the performance period, HSBC has achieved sustained growth. The Remuneration Committee retains discretion to recommend early release of shares awarded in certain circumstances, for example, retirement, redundancy or ill health.
Where events occur which cause the Remuneration Committee to consider that the performance conditions have become unfair or impractical the right is reserved for the Committee to amend or substitute the performance conditions. The Committee believes that the continued use of a single TSR measure in the awards made in 2003 and 2004 may give rise to unfairness given that EPS for 2002 (which was calculated on a UK GAAP basis,
222
Back to Contents
excluding goodwill amortisation) was US$0.76 and for 2005 (now prepared under IFRSs) it was US$1.36, representing an increase of 79 per cent. Dividends per share have grown by 38 per cent over the same period and the share price has risen by 51.3 per cent from 31 March 2003 to 28 February 2006. The cash return on cash invested has improved from 12.9 per cent in 2002 to 15.7 per cent in 2005. The Committee intends to undertake a review of the appropriateness of the single TSR performance measure for Performance Share awards made in 2003 and 2004. As part of this review the Committee will ensure appropriate consultation is undertaken with shareholders and their representatives.
Total Shareholder Return
The graphs below show HSBC Holdings’ TSR performance against the benchmark TSR for Performance Shares awarded in March 2002 (graph 1), the Financial Times-Stock Exchange (‘FTSE’) 100 Index (graph 2), the Morgan Stanley Capital International (‘MSCI’) World Index (graph 3) and MSCI Financials Index (graph 4) over the three-year period to March 2005. These measures have been chosen as they are the main published indices against which HSBC monitors its performance.
Graph 1: HSBC TSR and Benchmark TSR

Graph 2: HSBC TSR and FTSE 100 Index

Graph 3: HSBC TSR and MSCI World Index

Graph 4: HSBC TSR and MSCI Financials Index
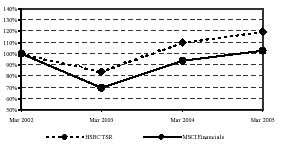
Pursuant to the Directors’ Remuneration Report Regulations 2002, graph 5 below shows HSBC Holdings’ TSR performance against the FTSE 100 Index, for the five-year period ended 31 December 2005. The FTSE 100 has been chosen as this is a recognised broad equity market index of which HSBC Holdings is a member.
Graph 5: HSBC TSR and FTSE 100 Index

Source: Datastream
Pensions
The pension entitlements earned by the executive Directors during the year are set out on pages 228 and 229.
Service contracts and terms of appointment
HSBC’s policy is to employ executive Directors on one-year rolling contracts although, on recruitment, longer initial terms may be approved by the Remuneration Committee. The Remuneration Committee will, consistent with the best interests of
223
Back to Contents
H S B C H O L D I N G S P L C
Directors’ Remuneration Report(continued)
the Group, seek to minimise termination payments.
No current executive Director has a service contract with HSBC Holdings or any of its subsidiaries with a notice period in excess of one year or with provisions for predetermined compensation on termination which exceeds one year’s salary and benefits in kind. There are no provisions for compensation upon early termination of any current executive Directors’ service contracts.
In the case of W F Aldinger, who retired as a Director on 29 April 2005, there was an exception to the general policy on Directors’ service contracts. Details of the arrangements relating to W F Aldinger, which were also set out in the 2004 Directors’ Remuneration Report, are set out below. W F Aldinger entered into a new employment agreement with HSBC Finance on 14 November 2002 (‘the 2002 employment agreement’) for a term of three years, such term to commence on the effective date of the acquisition of HSBC Finance by HSBC. The three-year term, and certain other terms, of the 2002 employment agreement represented an exception to HSBC’s normal policy for executive Directors’ service contracts, but the details of the terms, background and reasons for this were set out in the Discloseable Transaction Circular relating to the acquisition of HSBC Finance sent to shareholders on 26 February 2003 in advance of the Extraordinary General Meeting to approve the acquisition. The terms of the 2002 employment agreement were consistent with practice in the United States. The effective date of the acquisition, and commencement date of the 2002 employment agreement, was 28 March 2003. In connection with W F Aldinger’s retirement on 29 April 2005, the terms of the 2002 employment agreement, were amended by an agreement (‘amendment agreement’) entered into between HSBC Finance and Mr Aldinger, as referred to below. The Remuneration Committee reviewed the financial and other terms which were reflected in the amendment agreement. Having reviewed the relevant factors and circumstances, the Committee considered that these financial and other terms were appropriate and in order and in the best interests of the Group.
During the term of the 2002 employment agreement Mr Aldinger was entitled to be paid an annual base salary equal to his annual base salary as at the date of the merger agreement between HSBC Finance and HSBC (US$1 million) and an annual bonus in an amount at least equal to the annual average of Mr Aldinger’s bonuses earned with respect to the three-year period ended 2001, pro rated for any partial year (US$4 million). Within 30 days of the effective date of the acquisition,
Mr Aldinger received a one-time special retention grant of HSBC Holdings ordinary shares under the HSBC Holdings Restricted Share Plan 2000 with a value equal to US$10 million on terms that these Restricted Shares would vest in three equal instalments on each of the first three anniversaries of the effective date, as set out on page 231. After each of the first and second anniversaries of the effective date, subject to the approval of the Trustee of the HSBC Holdings Restricted Share Plan 2000, Mr Aldinger was entitled to receive an additional grant of HSBC Holdings ordinary shares with a value equal to at least US$5.5 million. The purpose of these arrangements was to retain the services of Mr Aldinger through the initial integration of HSBC Finance. HSBC considered it essential that the experience, knowledge and skills of Mr Aldinger be retained for the benefit of HSBC shareholders.
Under the 2002 employment agreement, if Mr Aldinger’s employment was terminated by him during its term for ‘good reason’, or by HSBC Finance for reasons other than ‘cause’ or disability, he was entitled to: apro ratatarget annual bonus for the financial year of the date of termination; a payment equal to his annual base salary, plus the average of his annual bonuses with respect to the three-year period ended 2001, times the number of full and partial months from the date of termination until the third anniversary of the effective date, divided by 12; the immediate vesting and exercisability of each stock option, restricted stock award and other equity-based award or performance award (or cash equivalent) that is outstanding as at the date of termination and treatment as retirement eligible for purposes of exercising any such award; for the remainder of his life and that of his current spouse, continued medical and dental benefits at HSBC Finance’s cost; and his retirement benefits (as set out on page 228) in a lump sum.
Following discussion with Mr Aldinger, it was agreed that Mr Aldinger would retire as Chairman and Chief Executive of HSBC Finance and HSBC North America Holdings Inc on 29 April 2005 and would retire as a director of HSBC Holdings on the same date and resign from his directorships and other appointments with Group companies. As indicated above, the original purpose of the 2002 employment agreement was to retain the services of Mr Aldinger through the initial integration of HSBC Finance with the Group’s other North American businesses. The discussions with Mr Aldinger about his retirement before the expiry of the three-year term took into account that the integration process had been completed successfully and faster than expected.
224
Back to Contents
Under the amendment agreement, Mr Aldinger was entitled to receive, on termination of the 2002 employment agreement on 29 April 2005, the same terms and benefits (summarised above) as if his employment had been terminated by him for ‘good reason’ or by HSBC Finance for reasons other than ‘cause’ or disability, except that he would not be entitled to receive the 2005 restricted share award (or cash equivalent) with a value to at least US$5.5 million that he would have been entitled to receive on or before 28 April 2005. Mr Aldinger did, however, receive a payment of US$4.6 million in lieu of salary and bonus in respect of the remainder of the three-year period. The amendment agreement also provided that the ‘non-competition’ provision in the 2002 employment agreement for a period of one year after termination of his employment, and certain other restrictions, will continue to apply. Under this provision he may not become associated with certain competitive entities that are actively engaged in the consumer lending business (including mortgage and credit card lending).
Sir John Bond is employed on a rolling contract dated 14 July 1994 which requires 12 months’ notice to be given by either party.
D G Eldon, who retired as a Director on 27 May 2005, was employed on a rolling contract dated 1 January 1968 which required three months’ notice to be given by either party.
D J Flint is employed on a rolling contract dated 29 September 1995 which requires 12 months’ notice to be given by the Company and nine months’ notice to be given by Mr Flint.
M F Geoghegan, who is to stand for re-election at the forthcoming Annual General Meeting, is employed on a rolling contract dated 25 May 2004 which requires 12 months’ notice to be given by either party.
S K Green, who is to stand for re-election at the forthcoming Annual General Meeting, is employed on a rolling contract dated 9 March 1998 which requires 12 months’ notice to be given by either party.
A W Jebson is employed on a rolling contract dated 14 January 2000 which requires 12 months’ notice to be given by either party.
Members of Senior Management are employed on service contracts which generally provide for a term of service expiring at the end of a period of up to two years, or the individual’s sixtieth birthday, whichever is earlier.
Non-executive Directors are appointed for fixed terms not exceeding three years, subject to their re-election by shareholders at subsequent Annual General Meetings. Non-executive Directors have no service contract and are not eligible to participate in HSBC’s share plans. Non-executive Directors’ terms of appointment will expire as follows: in 2006, Sir John Kemp-Welch; in 2007, Lord Butler, R K F Ch’ien, Baroness Dunn, R A Fairhead, W K L Fung, S Hintze, Sir Brian Moffat, Sir Mark Moody-Stuart and H Sohmen; in 2008, J D Coombe and J W J Hughes-Hallett; and in 2009, S W Newton, S M Robertson and Sir Brian Williamson.
Other directorships
Executive Directors, if so authorised by either the Nomination Committee or the Board, may accept appointments as non-executive Directors of suitable companies which are not part of HSBC. Approval will not be given for executive Directors to accept a non-executive directorship of more than one FTSE 100 company. When considering a non-executive appointment, the Nomination Committee or Board will take into account the expected time commitment of such appointment. The time commitment for executive Directors’ external appointments will be reviewed as part of the annual Board review. Any remuneration receivable in respect of an external appointment is normally paid to the HSBC company by which the executive Director is employed, unless otherwise approved by the Remuneration Committee.
Sir John Bond retains his fees as a non-executive Director of the Ford Motor Company, which are provided partly in the form of restricted shares, which become unrestricted over a period of five years. During 2005 the fees received were US$80,000 in cash and US$120,000 deferred into Ford common stock units. In addition, Ford provides US$200,000 of life assurance and US$500,000 of accidental death or dismemberment insurance. The life assurance can be continued after retirement from the Board or Sir John Bond could elect to have it reduced to US$100,000 and receive US$15,000 a year for life. The accidental death or dismemberment insurance ends upon retirement from the Board.
W F Aldinger retained his fees as a non-executive Director of Illinois Tool Works, Inc. and as a non-executive Director of AT&T Corp. During the period to his retirement as a Director of HSBC Holdings on 29 April 2005, the fee received from Illinois Tool Works, Inc. was US$53,000 in the form of deferred stock and the fee received from AT&T Corp. was US$52,803. In addition, AT&T Corp.
225
Back to Contents
H S B C H O L D I N G S P L C
Directors’ Remuneration Report(continued)
provide travel accident insurance when on AT&T Corp. company business and US$100,000 of life assurance.
Employees’ emoluments
Set out below is information in respect of the five individuals who are not Directors of HSBC Holdings whose emoluments (excluding commissions or bonuses related to the revenue or profits generated by employees individually or collectively with others engaged in similar activities) were the highest in HSBC for the year ended 31 December 2005.
| | £000 |
| | |
| Basic salaries, allowances and benefits in kind | 2,248 |
| Pension contributions | 698 |
| Bonuses paid or receivable | 32,272 |
| Inducements to join paid or receivable | – |
| Compensation for loss of office: | |
| – contractual | – |
| – other | – |
| |
|
| Total | 35,218 |
| |
|
| Total (US$000) | 63,980 |
| |
|
Their emoluments are within the following bands:
| | Number of |
| Employees |
| | |
| £4,900,001– £5,000,000 | 1 |
| £5,100,001– £5,200,000 | 1 |
| £6,800,001– £6,900,000 | 1 |
| £8,000,001– £8,100,000 | 1 |
| £10,200,001– £10,300,000 | 1 |
| |
| The basic salaries of Group Managing Directors and Group General Managers are within the following bands: |
| |
| Number of |
| | Group Managing |
| | Directors and Group |
| | General Managers |
| | |
| £150,001– £250,000 | 4 |
| £250,001– £350,000 | 20 |
| £350,001– £450,000 | 9 |
| £450,001– £550,000 | 3 |
The aggregate remuneration of Directors and Senior Management for the year ended 31 December 2005 was US$124,431,000.
The aggregate amount set aside or accrued to provide pension, retirement or similar benefits for Directors and Senior Management for the year ended 31 December 2005 was US$9,869,000.
At 31 December 2005, executive Directors and Senior Management held, in aggregate, options to subscribe for 6,169,982 HSBC Holdings ordinary shares under the HSBC Holdings Executive Share Option Scheme, HSBC Holdings Group Share Option Plan and HSBC Holdings savings-related share option plans. These options are exercisable between 2006 and 2014 at prices ranging from £3.3334 to £9.1350.
226
Back to Contents
Directors’ emoluments
The emoluments of the Directors of HSBC Holdings for 2005 were as follows:
| | | | Salary and | | | | | | | | | |
| | | | other | | Benefits | | | | Total | | Total | |
| | Fees | 1 | remuneration | | in kind | 2 | Bonuses | | 2005 | | 2004 | |
| | £000 | | £000 | | £000 | | £000 | | £000 | | £000 | |
| Executive Directors | | | | | | | | | | | | |
| W F Aldinger3 | – | | 2,609 | 4 | 34 | | 716 | 5 | 3,359 | | 2,822 | |
| Sir John Bond | – | | 1,286 | | 2 | | 3,191 | 6 | 4,479 | | 3,649 | |
| D G Eldon7 | – | | 286 | | 180 | | 144 | 6 | 610 | | 1,317 | |
| D J Flint | – | | 679 | 8 | 11 | | 500 | 6 | 1,190 | | 1,166 | |
| M F Geoghegan | – | | 658 | | 13 | | – | 9 | 671 | | 546 | |
| S K Green | – | | 778 | | 1 | | 1,750 | 6 | 2,529 | | 1,757 | |
| AW Jebson | – | | 545 | | 2 | | 1,000 | 6 | 1,547 | | 1,026 | |
| Non-executive Directors | | | | | | | | | | | | |
| Lord Butler | 90 | | – | | – | | – | | 90 | | 90 | |
| R K F Ch’ien | 187 | 10 | – | | – | | – | | 187 | | 186 | |
| J D Coombe11 | 53 | | – | | – | | – | | 53 | | – | |
| Baroness Dunn | 70 | | – | | – | | – | | 70 | | 70 | |
| R A Fairhead | 70 | | – | | – | | – | | 70 | | 58 | |
| W K L Fung | 117 | 12 | – | | – | | – | | 117 | | 117 | |
| S Hintze | 85 | | – | | – | | – | | 85 | | 85 | |
| J W J Hughes-Hallett11 | 46 | | – | | – | | – | | 46 | | – | |
| Sir John Kemp-Welch | 85 | | – | | – | | – | | 85 | | 85 | |
| Sir Brian Moffat | 115 | | – | | – | | – | | 115 | | 115 | |
| Sir Mark Moody-Stuart | 85 | | – | | – | | – | | 85 | | 75 | |
| S W Newton | 55 | | – | | – | | – | | 55 | | 55 | |
| H Sohmen | 16 | 13 | – | | – | | – | | 16 | | 39 | |
| C S Taylor14 | 12 | | – | | – | | – | | 12 | | 95 | |
| Sir Brian Williamson | 70 | | – | | – | | – | | 70 | | 59 | |
| |
| |
| |
| |
| |
| |
| |
| Total | 1,156 | | 6,841 | | 243 | | 7,301 | | 15,541 | | 16,226 | 15 |
| |
| |
| |
| |
| |
| |
| |
| Total (US$000) | 2,100 | | 12,428 | | 441 | | 13,264 | | 28,233 | | 29,722 | |
| |
| |
| |
| |
| |
| |
| |
| | | | | | | | | | | | | |
| 1 | With effect from 1 January 2005, Sir John Bond, D J Flint, M F Geoghegan, S K Green and A W Jebson waived their rights to receive a Director’s fee from HSBC Holdings (2005: £55,000, 2004: £55,000). W F Aldinger (2005: £18,333) and D G Eldon (2005: £22,917) had previously elected to waive any fees payable by HSBC Holdings (2004: £55,000). |
| 2 | Benefits in kind for executive Directors include provision of company car, medical insurance, other insurance cover and travel assistance. |
| 3 | Retired as a Director on 29 April 2005. |
| 4 | Includes a payment of US$4.6 million in lieu of salary and bonus under the terms of the amendment agreement. |
| 5 | Determined under the terms of the amendment agreement. |
| 6 | These discretionary bonuses are in respect of 2005 and were paid in 2006. |
| 7 | Retired as a Director on 27 May 2005. The emoluments of D G Eldon include a fee from The Hongkong and Shanghai Banking Corporation and housing and other expatriate benefits in kind that are normal within the location in which he is employed. |
| 8 | Includes an executive allowance of £154,269 (2004: £137,100) paid to fund personal pension arrangements. |
| 9 | In return for the prior waiver of bonus, an employer contribution has been made into a pension arrangement for M F Geoghegan equal to the amount of £1,818,750 which would otherwise have been paid. The bonus waived in respect of 2005 when added to the bonus waived in respect of 2004 (£1,200,000) equals 250 per cent of salary earned during 2004 and 2005. |
| 10 | Includes fees as non-executive Chairman of HSBC Private Equity (Asia) Limited and as a non-executive Director of The Hongkong and Shanghai Banking Corporation. |
| 11 | Appointed a Director on 1 March 2005 |
| 12 | Includes fee as a non-executive Director of The Hongkong and Shanghai Banking Corporation. |
| 13 | Fees as a non-executive Director and member of the Audit Committee of The Hongkong and Shanghai Banking Corporation. H Sohmen has elected to waive any fees payable to him by HSBC Holdings (2005: £55,000; 2004: £55,000). |
| 14 | Retired as a Director on 14 March 2005. |
| 15 | Includes the emoluments of Directors who retired in 2004. |
227
Back to Contents
H S B C H O L D I N G S P L C
Directors’ Remuneration Report(continued)
Pensions
There are separate schemes for UK-based and overseas-based employees: the UK scheme has a normal retirement age of 60; retirement ages for overseas schemes vary in accordance with local legislation and practice. Save as stated below no other Director participated in any HSBC pension schemes, none of the Directors participating in HSBC’s UK ‘approved’ pension schemes is subject to the earnings cap introduced by the 1989 Finance Act and only basic salary is pensionable. With one exception (see paragraphs below on D J Flint), the current executive Directors are members of defined benefit pension schemes, having joined HSBC at a time when these were the norm.
Before commencement of the 2002 employment agreement on 28 March 2003, W F Aldinger participated in HSBC Finance Corporation’s ‘qualified’ and ‘non-qualified’ defined benefit pension plans. The annual pension benefit under these arrangements was a function of service and a percentage of final average earnings (which included bonus). The ‘non-qualified plans’ were enhanced before commencement of the 2002 employment agreement. The benefits under the ‘qualified’ and ‘non-qualified’ defined benefit pension plans were then frozen and became payable in a lump sum on Mr Aldinger’s retirement on 29 April 2005. No further benefits accrued under these arrangements after 28 March 2003.
Up to his retirement on 29 April 2005, Mr Aldinger participated in the HSBC North America (U.S.) Tax Reduction Investment Plan (TRIP). Employer contributions of US$10,500 were made to this plan on behalf of Mr Aldinger in 2005 (2004: US$10,250).
Mr Aldinger also participated in the Supplemental TRIP (a ‘non-qualified’ plan), which is an unfunded arrangement under which additional employer provision of US$606,423 was made during 2005 (2004: US$289,749).
The pension arrangements for Sir John Bond, S K Green and A W Jebson to contractual retirement age of 60 are provided under the HSBC Bank (UK) Pension Scheme. The pensions accrue at a rate of one-thirtieth of pensionable salary for each year of pensionable service in the UK.
The existing pension arrangements for D J Flint to contractual retirement age of 60 are provided
through an executive allowance set at 30 per cent of basic salary which is paid to fund personal pension arrangements. In addition he participates in the HSBC Holdings plc Funded Unapproved Retirement Benefits Scheme on a defined contribution basis with an employer contribution during 2005 of £92,500 (2004: £86,013). The intention of these arrangements is to provide benefits broadly comparable to an accrual rate of one-thirtieth of pensionable salary for each year of pensionable service. From 5 April 2006, this Funded Unapproved Retirement Benefits Scheme will be closed. So as to ensure that pension arrangements for Mr Flint remain broadly comparable to the existing arrangements, the executive allowance will increase to 55 per cent of annual basic salary.
The pension arrangements for D G Eldon are provided under the HSBC International Staff Retirement Benefits Scheme with a normal accrual rate of one twenty-seventh of pensionable salary per year of pensionable service. These arrangements are part of a remuneration package which includes a number of expatriate benefits.
Since his appointment as an executive Director in 2004, M F Geoghegan has remained a member of the HSBC International Staff Retirement Benefits Scheme whilst no longer in receipt of expatriate benefits. A full review of Mr Geoghegan’s remuneration identified, in particular, that his pensionable pay of £252,000 was not aligned to his actual 2005 gross salary of £632,500. To bring his pension arrangements to a level more appropriate both to his actual gross salary and his more than 30 years of service, Mr Geoghegan’s pension provision will be adjusted to reflect his actual gross salary. The transfer value will be placed into a defined contribution arrangement in Mr Geoghegan’s name with no further funding from HSBC after 31 March 2006. Thereafter, he will receive an annual executive allowance of 50 per cent of annual salary to fund personal pension arrangements.
In addition, Mr Geoghegan participates in the HSBC Asia Holdings Pension Plan, on a defined contribution basis, with an employer contribution in respect of 2005 of £1,818,750 (2004: £1,200,000), arising entirely from a bonus sacrifice. There were no other employer contributions made to this plan.
228
Back to Contents
| | | | | | | | | | | | | | Transfer value | |
| | | | | | | | | | | | | | (less personal | |
| | | | | | | | | | | | | | contributions) | |
| | | | | | | | | | | | | | at | |
| | | | | | | | | | | | | | 31 December | |
| | | | | | | | | | | | | | 2005 relating | |
| | | | | | Increase in | | | | | | Increase of | | to increase | |
| | | | | | accrued | | Transfer | | Transfer | | transfer value | | in accrued | |
| | Accrued | | Increase in | | pension during | | value | | value | | of accrued | | pensions | |
| | annual | | accrued | | 2005, | | of accrued | | of accrued | | pension (less | | during 2005, | |
| | pension at | | pension | | excluding | | pension at | | pension at | | personal | | excluding any | |
| | 31 December | | during | | any increase | | 1 January | | 31 December | | contributions | ) | increase for | |
| | 2005 | | 2005 | | for inflation | | 2005 | | 2005 | | in 2005 | | inflation | |
| | £000 | | £000 | | £000 | | £000 | 1 | £000 | 1 | £000 | 1 | £000 | 1 |
| | | | | | | | | | | | | | | |
| Sir John Bond2 | 546 | | 34 | | 20 | | 9,230 | | 10,667 | | 1,438 | | 395 | |
| D G Eldon3,4 | 290 | | 12 | | 10 | | 5,275 | | 5,596 | | 313 | | 179 | |
| M F Geoghegan5,6. | 557 | | 372 | | 367 | | 4,042 | | 12,495 | | 8,436 | | 8,230 | |
| S K Green | 335 | | 47 | | 40 | | 4,401 | | 5,758 | | 1,357 | | 682 | |
| A W Jebson | 200 | | 19 | | 14 | | 2,612 | | 3,231 | | 619 | | 225 | |
| | |
| 1 | The transfer value represents a liability of HSBC’s pension funds and not a sum paid or due to the individual; it cannot therefore meaningfully be added to annual remuneration. |
| 2 | On attaining age 60, Sir John Bond has been able, under the terms of the scheme, to retire at any time with an immediate pension equal to his accrued pension which, at 31 December 2005, is shown above. |
| 3 | Retired as a Director on 27 May 2005. On attaining age 53, D G Eldon was able, under the terms of the scheme, to retire at any time with an immediate pension equal to his accrued pension which, at 31 December 2005, is shown above. |
| 4 | D G Eldon retired from the Group with effect from 30 May 2005. He elected to commute all of his pension entitlement of £290,000 per annum for a lump sum of £3,770,000. The HSBC International Staff Retirement Benefits Scheme retains a liability to pay a contingent spouse’s pension equal to 50 per cent of the commuted pension. The accrued pensions and transfer values stated in the above table do not reflect the commutation of the pension entitlement on retirement. As required by the rules of the HSBC International Staff Retirement Benefits Scheme, D G Eldon made personal contributions towards his pension of £8,119 in respect of 2005. |
| 5 | As required by the rules of the HSBC International Staff Retirement Benefits Scheme, M F Geoghegan made personal contributions towards his pension of £16,797 in respect of 2005. |
| 6 | As at 31 March 2006, under the revised pension arrangements described above, M F Geoghegan’s accrued pension will amount to £571,000 per annum and it is estimated that the transfer value of that accrued pension, at that date, will amount to £12,919,000. |
The following unfunded pension payments, in respect of which provision has been made, were made during 2005 to five former Directors of HSBC Holdings:
| | 2005 | | 2004 |
| | £ | | £ |
| | | | |
| B H Asher | 90,465 | | 85,443 |
| C F W de Croisset | 178,344 | | – |
| R Delbridge | 130,120 | | 122,891 |
| Sir Brian Pearse | 54,261 | | 51,246 |
| Sir William Purves | 95,767 | | 90,453 |
| |
| |
|
| | 548,957 | | 350,033 |
| |
| |
|
The payments in respect of R Delbridge and Sir Brian Pearse were made by HSBC Bank plc as former Directors of that bank. The payment in respect of C F W de Croisset was made by HSBC France as a former Director of that bank.
Share optionsAt 31 December 2005, the undernamed Directors held options to acquire the number of HSBC
Holdings ordinary shares set against their respective names. The options were awarded for nil consideration at exercise prices equivalent to the market value at the date of award, except that options awarded under the HSBC Holdings savings-related share option plans before 2001 are exercisable at a 15 per cent discount to the market value at the date of award and those awarded since 2001 at a 20 per cent discount. Under the Securities and Futures Ordinance of Hong Kong the options are categorised as unlisted physically settled equity derivatives.
Except as otherwise indicated, no options were exercised or lapsed during the year and there are no remaining performance criteria conditional upon which the outstanding options are exercisable. The market value of the ordinary shares at 31 December 2005 was £9.33. The highest and lowest market values during the year were £9.49 and £8.25. Market value is the mid-market price derived from the London Stock Exchange Daily Official List on the relevant date.
229
Back to Contents
H S B C H O L D I N G S P L C
Directors’ Remuneration Report(continued)
HSBC Holdings Savings-Related Share Option Plan
HSBC Holdings ordinary shares of US$0.50 |
| | | | | | | | | | | | | |
| | Options | | Options | | Options | | Options | | | | | | | | |
| | held at | | awarded | | exercised | | held at 31 | | | | | | | | |
| | 1 January | | during | | during | | December | | Exercise | | Date of | | Exercisable | | Exercisable |
| | 2005 | | year | | year | | 2005 | | price (£) | | award | | from | 1 | until |
| | | | | | | | | | | | | | | | |
| Sir John Bond | 2,798 | 4 | – | | 2,798 | 2 | – | | 6.0299 | | 10 Apr 2000 | | 1 Aug 2005 | | 31 Jan 2006 |
| D J Flint | 2,617 | 4 | – | | – | | 2,617 | | 6.3224 | | 2 May 2002 | | 1 Aug 2007 | | 31 Jan 2008 |
| M F Geoghegan | 559 | | – | | – | | 559 | 3 | 6.0299 | | 10 Apr 2000 | | 1 Aug 2005 | | 31 Jan 2006 |
| S K Green | 3,070 | 4 | – | | – | | 3,070 | | 5.3496 | | 23 Apr 2003 | | 1 Aug 2008 | | 31 Jan 2009 |
| | |
| 1 | May be advanced to an earlier date in certain circumstances, e.g. retirement. |
| 2 | At the date of exercise, 2 August 2005, the market value per share was £9.32. |
| 3 | Options over 533 shares were exercised on 31 January 2006 and options over 26 shares lapsed on that date. At the date of exercise, the market value per share was £9.34. |
| | |
| | |
|
At 29 April 2005, the date he retired as a Director, W F Aldinger held options to acquire HSBC Holdings ordinary shares as set out in the table below. These options arise from options he held over shares of Household International (now HSBC Finance Corporation) before its acquisition, which were converted into options over HSBC Holdings ordinary shares in the same ratio as the offer for HSBC Finance Corporation (2.675 HSBC
Holdings ordinary shares for each HSBC Finance Corporation common share) and the exercise prices per share adjusted accordingly. The HSBC Finance Corporation options were granted at nil consideration.
No options over HSBC Holdings ordinary shares were awarded to or exercised by Mr Aldinger during 2005.
| |
| HSBC Finance 1996 Long-Term Executive Incentive Compensation Plan |
| HSBC Holdings ordinary shares of US$0.50 |
| | | | | | | | | | | |
| Options held | Exercise price | | Options held | | Date of | | Exercisable | | Exercisable | |
| at 1 January 2005 | per share (US$) | | at 29 April 2005 | | award | | from | | until | |
| | | | | | | | | | | |
| 1,203,750 | 14.60 | | 1,203,750 | | 10 Nov 1997 | | 10 Nov 1998 | | 10 Nov 2007 | |
| 1,337,500 | 13.71 | | 1,337,500 | | 9 Nov 1998 | | 9 Nov 1999 | | 9 Nov 2008 | |
| 1,230,500 | 16.96 | | 1,230,500 | | 8 Nov 1999 | | 8 Nov 2000 | | 8 Nov 2009 | |
| 1,605,000 | 18.40 | | 1,605,000 | | 13 Nov 2000 | | 13 Nov 2001 | | 13 Nov 2010 | |
| 2,140,000 | 21.37 | | 2,140,000 | | 12 Nov 2001 | | 12 Nov 2002 | | 12 Nov 2011 | |
| 2,140,000 | 10.66 | | 2,140,000 | | 20 Nov 2002 | | 20 Nov 20031 | | 20 Nov 2012 | |
| | |
| 1 | 535,000 options were exercisable on each of the first, second, third and fourth anniversaries of the date of award. These options could be advanced, under the terms of the HSBC Finance Corporation stock option plan, to an earlier date in certain circumstances, for example retirement. 1,070,000 options remaining unvested therefore vested on Mr Aldinger’s retirement as a Director on 29 April 2005. Based on the market price of HSBC Holdings shares on 29 April 2005 and after deduction of the option subscription price these options had a value of approximately £2,973,000. |
230
Back to Contents
HSBC Holdings Restricted Share Plan 2000
HSBC Holdings ordinary shares of US$0.50
| | | | | | Monetary | | | | | | | |
| | | | | | value of | | | | | | | |
| | | | | | awards | | | | | | | |
| | Awards | | Awards | | vested | | Awards | | | | Year in | |
| | held at | | vested | | during | | held at | | | | which | |
| | 1 January | | during | | the year | | 31 December | | Date of | | awards | |
| | 2005 | | the year | 1 | £000 | | 2005 | 1 | award | | may vest | |
| | | | | | | | | | | | | |
| W F Aldinger | 670,821 | | 687,435 | 2 | 5,749 | | – | | 15 Apr 2003 | | 2005 to 2006 | 2 |
| | 379,232 | | 388,623 | 3 | 3,249 | | – | | 10 May 2004 | | 2005 to 2007 | 3 |
| Sir John Bond | 93,405 | | 94,119 | 4 | 798 | | – | | 10 Mar 2000 | | 2005 | |
| | 87,535 | | – | | – | | 91,276 | | 12 Mar 2001 | | 2006 | |
| | 131,077 | | – | | – | | 136,679 | | 8 Mar 2002 | | 2007 | |
| | 174,929 | | – | | – | | 182,406 | | 5 Mar 2003 | | 2008 | |
| | 252,771 | | – | | – | | 263,574 | | 4 Mar 2004 | | 2009 | |
| D G Eldon | 42,458 | | 42,781 | 4 | 363 | | – | | 10 Mar 2000 | | 2005 | |
| | 50,021 | | 51,712 | 5 | 449 | | – | | 12 Mar 2001 | | 2006 | |
| | 55,191 | | 57,056 | 5 | 495 | | – | | 8 Mar 2002 | | 2007 | |
| | 10,220 | | 10,472 | 6 | 87 | | – | | 15 May 2002 | | 2005 | |
| | 79,513 | | 61,651 | 5 | 535 | | 20,729 | 7 | 5 Mar 2003 | | 2008 | |
| | 13,892 | | – | | – | | 14,486 | 8 | 12 May 2003 | | 2006 | |
| | 90,276 | | 38,886 | 5 | 338 | | 54,913 | 7 | 4 Mar 2004 | | 2009 | |
| D J Flint | 38,211 | | 38,502 | 4 | 326 | | – | | 10 Mar 2000 | | 2005 | |
| | 62,525 | | – | | – | | 65,198 | | 12 Mar 2001 | | 2006 | |
| | 82,786 | | – | | – | | 86,324 | | 8 Mar 2002 | | 2007 | |
| | 119,270 | | – | | – | | 124,367 | | 5 Mar 2003 | | 2008 | |
| | 125,182 | | – | | – | | 130,532 | | 4 Mar 2004 | | 2009 | |
| M F Geoghegan | 33,965 | | 34,224 | 4 | 290 | | – | | 10 Mar 2000 | | 2005 | |
| | 37,515 | | – | | – | | 39,119 | | 12 Mar 2001 | | 2006 | |
| | 41,393 | | – | | – | | 43,162 | | 8 Mar 2002 | | 2007 | |
| | 55,661 | | – | | – | | 58,040 | | 5 Mar 2003 | | 2008 | |
| | 93,887 | | – | | – | | 97,899 | | 4 Mar 2004 | | 2009 | |
| S K Green | 42,458 | | 42,781 | 4 | 363 | | – | | 10 Mar 2000 | | 2005 | |
| | 87,535 | | – | | – | | 91,276 | | 12 Mar 2001 | | 2006 | |
| | 103,482 | | – | | – | | 107,905 | | 8 Mar 2002 | | 2007 | |
| | 119,270 | | – | | – | | 124,367 | | 5 Mar 2003 | | 2008 | |
| | 172,125 | | – | | – | | 179,481 | | 4 Mar 2004 | | 2009 | |
| A W Jebson | 33,965 | | 34,224 | 4 | 290 | | – | | 10 Mar 2000 | | 2005 | |
| | 75,030 | | – | | – | | 78,237 | | 12 Mar 2001 | | 2006 | |
| | 96,584 | | – | | – | | 100,712 | | 8 Mar 2002 | | 2007 | |
| | 119,270 | | – | | – | | 124,368 | | 5 Mar 2003 | | 2008 | |
| | 125,182 | | – | | – | | 130,532 | | 4 Mar 2004 | | 2009 | |
| | |
| Unless otherwise indicated, these awards are subject to the performance tests set out in the section headed ‘Arrangements from 2000-2004’ on pages 221 to 223. The awards made on 12 March 2001 and 8 March 2002 have passed their TSR performance conditions. Under the Securities and Futures Ordinance of Hong Kong, interests held through the HSBC Holdings Restricted Share Plan 2000 are categorised as the interests of a beneficiary of a Trust. |
| | |
| 1 | Includes additional shares arising from scrip dividends. |
| 2 | Under the terms of this award the shares vested in three instalments on each of the first three anniversaries of 31 March 2003 so long as Mr Aldinger remained employed on the relevant vesting date, subject to accelerated vesting upon a termination of cause, or by Mr Aldinger for good reason or due to his death or disability. 341,463 shares therefore vested on 31 March 2005 when the market price was £8.37. Pursuant to the amendment agreement referred to above, the remaining 345,972 shares vested on Mr Aldinger’s retirement as a Director on 29 April 2005 when the market price was £8.355. At the date of the award, 15 April 2003, the market value per share was £6.81. |
| 3 | Under the terms of this award the shares vested in three instalments on each of 31 March 2005, 2006 and 2007 so long as Mr Aldinger remained employed on the relevant vesting date, subject to accelerated vesting upon a termination of cause, or by Mr Aldinger for good reason or due to his death or disability. 128,245 shares therefore vested on 31 March 2005 when the market price was £8.37. Pursuant to the amendment agreement referred to above, the remaining 260,378 shares vested on Mr Aldinger’s retirement as a Director on29 April 2005 when the market price was £8.355. At the date of the award, 10 May 2004, the market value per share was £7.94. |
| 4 | The performance tests described in the ‘Report of the Directors’ in theAnnual Report and Accounts 2000and set out in the section headed ‘Arrangements from 2000-2004’ on pages 221 to 223 of theAnnual Report and Accounts 2005 have been met and the shares have vested. At the date of vesting,10March 2005, the market value per share was £8.48. The market value per share at the date of the award, 10 March 2000, was £7.09. |
231
Back to Contents
H S B C H O L D I N G S P L C
Directors’ Remuneration Report(continued)
| 5 | Retired as a Director on 27 May 2005. At the date of vesting, 31 May 2005 the market value per share was £8.68. The market values per share at the dates of the awards, 12 March 2001, 8 March 2002, 5 March 2003 and 4 March 2004 were £8.62, £8.34, £6.70 and £8.515 respectively. |
| 6 | 50 per cent of D G Eldon’s discretionary bonus in respect of 2001 was awarded in Restricted Shares with a three year restricted period. At the date of vesting, 29 April 2005, the market value per share was £8.355. The market value per share at the date of the award, 15 May 2002, was £8.635. |
| 7 | Interests at date of retirement as a Director (27 May 2005). |
| 8 | Interests at date of retirement as a Director (27 May 2005). 50 per cent of D G Eldon’s discretionary bonus in respect of 2002 was awarded in Restricted Shares with a three-year restricted period. |
The HSBC Share Plan
HSBC Holdings ordinary shares of US$0.50
| | | | | | Monetary | | | | | | | |
| | | | | | value of | | | | | | | |
| | Awards | | Awards | | awards | | Awards | | | | Year in | |
| | held at | | made | | made | | held at | | | | which | |
| | 1 January | | during | | during | | 31 December | | Date of | | awards | |
| | 2005 | | period | 1 | period | | 2005 | 2 | award | | may vest | |
| | | | | | £000 | | | | | | | |
| | | | | | | | | | | | | |
| Sir John Bond | – | | 458,389 | | 4,000 | | 474,353 | | 27 May 2005 | | 2008 | |
| D J Flint | – | | 171,896 | | 1,500 | | 177,883 | | 27 May 2005 | | 2008 | |
| M F Geoghegan | – | | 229,195 | | 2,000 | | 237,177 | | 27 May 2005 | | 2008 | |
| S K Green | – | | 286,493 | | 2,500 | | 296,471 | | 27 May 2005 | | 2008 | |
| A W Jebson | – | | 162,155 | | 1,415 | | 167,803 | | 27 May 2005 | | 2008 | |
| | |
| | Unless otherwise indicated, vesting of these shares is subject to the performance conditions described on page 220 being satisfied. Under the Securities and Futures Ordinance of Hong Kong, interests in The HSBC Share Plan are categorised as the interests of a beneficiary of a Trust. |
| 1 | At the date of the award, 27 May 2005, the market value per share was £8.68. The shares acquired by the Trustee of the Plan were purchased at an average price of £8.726. |
| 2 | Includes additional shares arising from scrip dividends. |
| | |
| On behalf of the Board | 6 March 2006 |
| | |
| Sir Mark Moody-Stuart,Chairman of Remuneration Committee | |
232
Back to Contents
H S B C H O L D I N G S P L C
Statement of Directors’ Responsibilities in Respect of theAnnual Report and Accounts 2005 and the Financial Statements
The following statement, which should be read in conjunction with the Auditor’s statement of their responsibilities set out in their report on pages 234 and 235, is made with a view to distinguishing for shareholders the respective responsibilities of the Directors and of the Auditor in relation to the financial statements.
The Directors are responsible for preparing the Annual Report and Accounts 2005, the consolidated financial statements of HSBC Holdings and its subsidiaries (the ‘Group’) and holding company financial statements for HSBC Holdings (the ‘parent company’) in accordance with applicable law and regulations.
Company law requires the Directors to prepare Group and parent company financial statements for each financial year. The Directors are required to prepare the Group financial statements in accordance with IFRSs as adopted by the EU and have elected to prepare the parent company financial statements on the same basis.
The Directors are also required to present additional information for US shareholders. Accordingly these financial statements are framed to meet both UK and US requirements to give a consistent view to all shareholders.
The Group and parent company financial statements are required by law and IFRSs as adopted by the EU to present fairly the financial position of the Group and the parent company and the performance of the Group for that period; the Companies Act 1985 provides in relation to such financial statements that references in the relevant part of that Act to financial statements giving a true and fair view are references to their achieving a fair presentation.
In preparing each of the Group and parent company financial statements, the Directors are required to:
| • | select suitable accounting policies and then apply them consistently; |
| | |
| • | make judgements and estimates that are reasonable and prudent; and |
| | |
| • | state whether they have been prepared in accordance with IFRSs as adopted by the EU. |
The Directors are required to prepare the financial statements on the going concern basis unless it is not appropriate. Since the Directors are satisfied that the Group has the resources to continue in business for the foreseeable future, the financial statements continue to be prepared on the going concern basis.
The Directors have responsibility for ensuring that sufficient accounting records are kept that disclose with reasonable accuracy at any time the financial position of the parent company and enable them to ensure that its financial statements comply with the Companies Act 1985.
The Directors have general responsibility for taking such steps as are reasonably open to them to safeguard the assets of the Group and to prevent and detect fraud and other irregularities.
Under applicable law and regulations, the Directors also have responsibility for preparing a Directors’ Report, Directors’ Remuneration Report and the Corporate Governance statement on page 206 that comply with that law and those regulations.
The Directors have responsibility for the maintenance and integrity of the Annual Report and Accounts 2005 as they appear on the company’s website. Legislation in the UK governing the preparation and dissemination of financial statements may differ from legislation in other jurisdictions.
| | |
| | |
| On behalf of the Board | 6 March 2006 |
| | |
| R G Barber, Secretary | |
233
Back to Contents
H S B C H O L D I N G S P L C
Report of Independent registered public accounting firm to the Board of Directors and
shareholders of HSBC Holdings plc
We have audited the accompanying consolidated financial statements of HSBC Holdings plc and its subsidiary undertakings (together ‘HSBC’) on pages 236 to 402 which comprise the consolidated balance sheets as at 31 December 2005 and 2004, the related consolidated income statements, consolidated cash flow statements and consolidated statements of recognised income and expense, for the years ended 31 December 2005 and 2004. These consolidated financial statements are the responsibility of management. Our responsibility is to express an opinion on these consolidated financial statements based on our audits.
We conducted our audits in accordance with the standards of the Public Company Accounting Oversight Board (United States). Those standards require that we plan and perform the audit to obtain reasonable assurance about whether the financial statements are free of material misstatement. An audit includes examining, on a test basis, evidence supporting the amounts and disclosures in the financial statements. An audit also includes assessing the accounting principles used and significant estimates made by management, as well as evaluating the overall financial statement presentation. We believe that our audits provide a reasonable basis for our opinion.
In our opinion, the consolidated financial statements referred to above present fairly, in all material respects, the financial position of HSBC as at 31 December 2005 and 2004, and the results of its operations and its cash flows for the years ended 31 December 2005 and 2004 in conformity with IFRSs as adopted by the EU.
IFRSs as adopted by the EU vary in certain significant respects from accounting principles generally accepted in the United States. Information relating to the nature and effect of such differences is presented in Note 47 to the consolidated financial statements. As permitted by IFRS 1 and disclosed in Note 1 to the financial statements, HSBC has applied certain IFRSs from 1 January 2005, in particular IAS 32, IAS 39 and IFRS 4.
KPMG Audit Plc
London, England
6 March 2006
234
Back to Contents
This page is intentionally left blank
235
Back to Contents
| H S B C H O L D I N G S P L C |
| |
| |
| Financial Statements |
| | |
| | |
Consolidated income statement for the year ended 31 December 2005
| | | 2005 | | | 2004 | |
| | Notes | US$m | | | US$m | |
| Interest income | | 60,094 | | | 50,471 | |
| Interest expense | | (28,760 | ) | | (19,372 | ) |
| Net interest income | | 31,334 | | | 31,099 | |
| Fee income | | 17,486 | | | 15,902 | |
| Fee expense | | (3,030 | ) | | (2,954 | ) |
| Net fee income | | 14,456 | | | 12,948 | |
| Trading income excluding net interest income | | 3,656 | | | 2,786 | |
| Net interest income on trading activities | | 2,208 | | | – | |
| Net trading income | | 5,864 | | | 2,786 | |
| Net income from financial instruments designated at fair value | 3 | 1,034 | | | – | |
| Net investment income on assets backing policyholders’ liabilities | | – | | | 1,012 | |
| Gains less losses from financial investments | | 692 | | | 540 | |
| Dividend income | | 155 | | | 622 | |
| Net earned insurance premiums | 4 | 5,436 | | | 5,368 | |
| Other operating income | | 2,733 | | | 1,613 | |
| | |
| | |
| |
| Total operating income | | 61,704 | | | 55,988 | |
| Net insurance claims incurred and movement in policyholders’ liabilities | 5 | (4,067 | ) | | (4,635 | ) |
| | |
| | |
| |
Net operating income before loan impairment charges and other credit risk provisions | | 57,637 | | | 51,353 | |
| Loan impairment charges and other credit risk provisions | | (7,801 | ) | | (6,191 | ) |
| | |
| | |
| |
| Net operating income | 6 | 49,836 | | | 45,162 | |
| | |
| | |
| |
| Employee compensation and benefits | 7 | (16,145 | ) | | (14,523 | ) |
| General and administrative expenses | 8 | (11,183 | ) | | (9,739 | ) |
| Depreciation of property, plant and equipment | 23 | (1,632 | ) | | (1,731 | ) |
| Amortisation of intangible assets | | (554 | ) | | (494 | ) |
| | |
| | |
| |
| Total operating expenses | | (29,514 | ) | | (26,487 | ) |
| | |
| | |
| |
| Operating profit | | 20,322 | | | 18,675 | |
| Share of profit in associates and joint ventures | 20 | 644 | | | 268 | |
| | |
| | |
| |
| Profit before tax | | 20,966 | | | 18,943 | |
| Tax expense | 10 | (5,093 | ) | | (4,685 | ) |
| | |
| | |
| |
| Profit for the year | | 15,873 | | | 14,258 | |
| | |
| | |
| |
| Profit attributable to shareholders of the parent company | | 15,081 | | | 12,918 | |
| Profit attributable to minority interests | | 792 | | | 1,340 | |
| | | | | | | |
| | | US$ | | | US$ | |
| Basic earnings per ordinary share | 12 | 1.36 | | | 1.18 | |
| Diluted earnings per ordinary share | 12 | 1.35 | | | 1.17 | |
| Dividends per ordinary share | 11 | 0.69 | | | 0.63 | |
236
Back to Contents
Consolidated balance sheet at 31 December 2005
| | | | 2005 | | 2004 | |
| | Notes | | US$m | | US$m | |
| ASSETS | | | | | | |
| | | | | | | |
| Cash and balances at central banks | | | 13,712 | | 9,944 | |
| Items in the course of collection from other banks | | | 11,300 | | 6,338 | |
| Hong Kong Government certificates of indebtedness | | | 12,554 | | 11,878 | |
| Trading assets | 15 | | 190,257 | | 122,160 | |
| Trading assets which may be repledged or resold by counterparties | 15 | | 42,652 | | – | |
| Financial assets designated at fair value | 16 | | 15,046 | | – | |
| Derivatives | 17 | | 73,928 | | 32,190 | |
| Loans and advances to banks | 32 | | 125,965 | | 143,449 | |
| Loans and advances to customers | 32 | | 740,002 | | 672,891 | |
| Financial investments | 18 | | 176,301 | | 185,332 | |
| Financial investments which may be repledged or resold by counterparties | 18 | | 6,041 | | – | |
| Interests in associates and joint ventures | 20 | | 7,249 | | 3,441 | |
| Goodwill and intangible assets | 21 | | 33,200 | | 34,495 | |
| Property, plant and equipment | 23 | | 15,206 | | 15,624 | |
| Other assets | 25 | | 26,596 | | 23,077 | |
| Prepayments and accrued income | | | 11,961 | | 19,155 | |
| | | |
| |
| |
| Total assets | | | 1,501,970 | | 1,279,974 | |
| | | |
| |
| |
| LIABILITIES AND EQUITY | | | | | | |
| | | | | | | |
| Liabilities | | | | | | |
| Hong Kong currency notes in circulation | | | 12,554 | | 11,878 | |
| Deposits by banks | 32 | | 69,727 | | 84,055 | |
| Customer accounts | 32 | | 739,419 | | 693,072 | |
| Items in the course of transmission to other banks | | | 7,022 | | 5,301 | |
| Trading liabilities | | | 174,365 | | 46,460 | |
| Financial liabilities designated at fair value | 26 | | 61,829 | | – | |
| Derivatives | 17 | | 74,036 | | 34,988 | |
| Debt securities in issue | 27 | | 188,072 | | 211,721 | |
| Retirement benefit liabilities | 7 | | 4,869 | | 6,475 | |
| Other liabilities | 28 | | 26,515 | | 20,581 | |
| Liabilities under insurance contracts issued | 29 | | 14,144 | | – | |
| Liabilities to policyholders under long-term assurance business | | | – | | 19,190 | |
| Accruals and deferred income | | | 12,689 | | 16,499 | |
| Provisions | 30 | | 1,966 | | 4,071 | |
| Subordinated liabilities | 31 | | 16,537 | | 26,486 | |
| | | |
| |
| |
| Total liabilities | | | 1,403,744 | | 1,180,777 | |
| | | |
| |
| |
| Equity | | | | | | |
| Called up share capital | 37 | | 5,667 | | 5,587 | |
| Share premium account | 38 | | 6,896 | | 4,881 | |
| Other reserves | 38 | | 23,646 | | 25,622 | |
| Retained earnings | 38 | | 56,223 | | 49,432 | |
| | | |
| |
| |
| Total shareholders’ equity | | | 92,432 | | 85,522 | |
| Minority interests | 36 | | 5,794 | | 13,675 | |
| | | |
| |
| |
| Total equity | | | 98,226 | | 99,197 | |
| | | |
| |
| |
| Total equity and liabilities | | | 1,501,970 | | 1,279,974 | |
| | | |
| |
| |
| | |
 | |
| |
| Sir John Bond, Group Chairman | |
237
Back to Contents
| H S B C H O L D I N G S P L C |
| |
| |
| Financial Statements(continued) |
| | |
| | |
Consolidated statement of recognised income and expense for the year ended 31 December 2005
| | 2005 | | 2004 | |
| | US$m | | US$m | |
| Available-for-sale investments: | | | | |
| – fair value changes taken to equity | (400 | ) | – | |
| – fair value changes transferred to income statement on disposal or impairment | (240 | ) | – | |
| Cash flow hedges: | | | | |
| – fair value changes taken to equity | (92 | ) | – | |
| – fair value changes transferred to income statement | (106 | ) | – | |
| Share of changes in equity of associates and joint ventures | 161 | | – | |
| Exchange differences | (4,257 | ) | 3,720 | |
| Actuarial losses on post-employment benefits | (812 | ) | (731 | ) |
| |
| |
| |
| | (5,746 | ) | 2,989 | |
| Net deferred tax on items taken directly to equity | 437 | | 319 | |
| |
| |
| |
| Total income and expense taken to equity during the year | (5,309 | ) | 3,308 | |
| Profit for the year | 15,873 | | 14,258 | |
| |
| |
| |
| Total recognised income and expense for the year | 10,564 | | 17,566 | |
| Effect of change in accounting policy | | | | |
| IFRSs transition adjustment at 1 January 2005 | | | | |
| – available-for-sale fair value reserve | 1,919 | | – | |
| – cash flow hedging reserve | 410 | | – | |
| – foreign exchange reserve | 686 | | – | |
| – retained earnings | (1,762 | ) | – | |
| – minority interests | (10,077 | ) | – | |
| |
| |
| |
| | 1,740 | | 17,566 | |
| |
| |
| |
| Total recognised income and expense for the year attributable to: | | | | |
| – shareholders of the parent company | 9,912 | | 15,743 | |
| – minority interests | 652 | | 1,823 | |
| |
| |
| |
| | 10,564 | | 17,566 | |
| |
| |
| |
238
Back to Contents
Consolidated cash flow statement for the year ended 31 December 2005
| | | | 2005 | | 2004 | |
| | Notes | | US$m | | US$m | |
| Cash flows from operating activities | | | | | | |
| Profit before tax | | | 20,966 | | 18,943 | |
| Adjustments for: | | | | | | |
| – non-cash items included in net profit | 39 | | 1,358 | | 719 | |
| – change in operating assets | 39 | | (82,710 | ) | (124,299 | ) |
| – change in operating liabilities | 39 | | 70,933 | | 178,014 | |
| – elimination of exchange differences1 | | | 2,315 | | (9,015 | ) |
| – net gain from investing activities | | | (692 | ) | (540 | ) |
| – share of profits in associates and joint ventures | | | (644 | ) | (268 | ) |
| – dividends received from associates | | | 114 | | 127 | |
| – tax paid | | | (4,619 | ) | (3,784 | ) |
| | | |
| |
| |
| Net cash from operating activities | | | 7,021 | | 59,897 | |
| | | |
| |
| |
| Cash flows from investing activities | | | | | | |
| Purchase of financial investments | | | (378,103 | ) | (330,917 | ) |
| Proceeds from the sale of financial investments | | | 368,696 | | 315,437 | |
| Purchase of property, plant and equipment | | | (2,887 | ) | (2,830 | ) |
| Proceeds from the sale of property, plant and equipment | | | 620 | | 371 | |
| Purchase of intangible assets | | | (849 | ) | (108 | ) |
| Net cash outflow from acquisition of and increase in stake of subsidiaries | | | (1,662 | ) | (2,431 | ) |
| Net cash inflow from disposal of subsidiaries | | | 705 | | 27 | |
| Net cash outflow from acquisition of and increase in stake of associates | | | (2,569 | ) | (2,122 | ) |
| Proceeds from disposal of associates | | | 422 | | 212 | |
| | | |
| |
| |
| Net cash used in investing activities | | | (15,627 | ) | (22,361 | ) |
| | | |
| |
| |
| Cash flows from financing activities | | | | | | |
| Issue of ordinary share capital | | | 690 | | 581 | |
| Issue of preference shares | | | 1,298 | | – | |
| Net purchases and sales of own shares for market-making purposes | | | (55 | ) | 98 | |
| Purchases of own shares to meet share awards and share option awards | | | (766 | ) | (345 | ) |
| Own shares released on vesting of share awards and exercise of options | | | 277 | | 159 | |
| Increase in non-equity minority interests | | | – | | 1,480 | |
| Subordinated loan capital issued | | | 2,093 | | 6,021 | |
| Subordinated loan capital repaid | | | (1,121 | ) | (1,740 | ) |
| Dividends paid to shareholders of the parent company | | | (5,935 | ) | (4,425 | ) |
| Dividends paid to minority interests: | | | | | | |
| – equity | | | (508 | ) | (664 | ) |
| – non-equity | | | – | | (548 | ) |
| | | |
| |
| |
| Net cash used in financing activities | | | (4,027 | ) | 617 | |
| | | |
| |
| |
| Net (decrease)/increase in cash and cash equivalents | | | (12,633 | ) | 38,153 | |
| Cash and cash equivalents at 1 January | | | 160,956 | | 117,558 | |
| Exchange differences in respect of cash and cash equivalents | | | (7,016 | ) | 5,245 | |
| | | |
| |
| |
| Cash and cash equivalents at 31 December | 39 | | 141,307 | | 160,956 | |
| | | |
| |
| |
| 1 | Adjustment to bring changes between opening and closing balance sheet amounts to average rates. This is not done on a line-by-line basis, as details cannot be determined without unreasonable expense. |
239
Back to Contents
| H S B C H O L D I N G S P L C |
| |
| |
| Financial Statements(continued) |
| | |
| | |
HSBC Holdings balance sheet at 31 December 2005
| | | | 2005 | | 2004 | |
| | Notes | | US$m | | US$m | |
| ASSETS | | | | | | |
| | | | | | | |
| Cash at bank and in hand: | | | | | | |
| – balances with HSBC undertakings | | | 756 | | 246 | |
| Derivatives | 17 | | 968 | | 1,643 | |
| Loans and advances to HSBC undertakings | 32 | | 14,092 | | 16,636 | |
| Financial investments | 18 | | 3,517 | | 1,885 | |
| Investments in subsidiaries | 24 | | 58,038 | | 55,668 | |
| Property, plant and equipment | 23 | | 1 | | 2 | |
| Other assets | | | 171 | | 632 | |
| Prepayments and accrued income | | | 19 | | 5 | |
| | | |
| |
| |
| Total assets | | | 77,562 | | 76,717 | |
| | | |
| |
| |
| LIABILITIES AND EQUITY | | | | | | |
| | | | | | | |
| Liabilities | | | | | | |
| Amounts owed to HSBC undertakings | 32 | | 4,075 | | 7,352 | |
| Financial liabilities designated at fair value | 26 | | 13,370 | | – | |
| Derivatives | 17 | | 286 | | 10 | |
| Other liabilities | 28 | | 1,203 | | 1,198 | |
| Accruals and deferred income | | | 95 | | 172 | |
| Deferred tax | 30 | | 70 | | 64 | |
| Subordinated liabilities | 31 | | 5,236 | | 17,812 | |
| | | |
| |
| |
| Total liabilities | | | 24,335 | | 26,608 | |
| | | |
| |
| |
| Equity | | | | | | |
| Called up share capital | 37 | | 5,667 | | 5,587 | |
| Share premium account | | | 6,896 | | 4,881 | |
| Merger reserve and other reserves | | | 28,942 | | 28,942 | |
| Other reserves | | | 2,221 | | 1,740 | |
| Retained earnings | | | 9,501 | | 8,959 | |
| | | |
| |
| |
| Total equity | | | 53,227 | | 50,109 | |
| | | |
| |
| |
| Total equity and liabilities | | | 77,562 | | 76,717 | |
| | | |
| |
| |
| | |
| |
| |
| Sir John Bond, Group Chairman | |
240
Back to Contents
HSBC Holdings statement of changes in total equity for the year ended 31 December 2005
| | 2005 | | 2004 | |
| | US$m | | US$m | |
| Called up share capital | | | | |
| At 1 January | 5,587 | | 5,481 | |
| Shares issued in connection with the early conversion of HSBC Finance Corporation | | | | |
| 8.875 per cent Adjustable Conversion-Rate Equity Security Units | – | | 1 | |
| Shares issued under employee share plans | 28 | | 25 | |
| Shares issued in lieu of dividends | 52 | | 80 | |
| |
| |
| |
| At 31 December | 5,667 | | 5,587 | |
| |
| |
| |
| Share premium account | | | | |
| At 1 January | 4,881 | | 4,406 | |
| Shares issued under employee share plans | 662 | | 555 | |
| Shares issued in lieu of dividends and amounts thereon | (52 | ) | (80 | ) |
| New share capital subscribed, net of costs | 1,405 | | – | |
| |
| |
| |
| At 31 December | 6,896 | | 4,881 | |
| |
| |
| |
| Merger reserve and other reserves | | | | |
| At 1 January and 31 December | 28,942 | | 28,942 | |
| |
| |
| |
| Other reserves | | | | |
| Available-for-sale fair value reserve | | | | |
| At 1 January | – | | – | |
| IFRSs transition adjustments at 1 January 20051 | 464 | | – | |
| Fair value losses taken to equity2 | (184 | ) | – | |
| Net deferred tax on items taken directly to equity2 | 57 | | – | |
| |
| |
| |
| At 31 December | 337 | | – | |
| |
| |
| |
| Share-based payment reserve | | | | |
| At 1 January | 1,329 | | 1,395 | |
| Exercise of HSBC share options | (328 | ) | (227 | ) |
| Charge to the income statement in respect of equity settled share-based | | | | |
| payment transactions | 12 | | 11 | |
| Shares/options granted to employees of subsidiaries under employee share awards | 219 | | 150 | |
| Other movements | 2 | | – | |
| |
| |
| |
| At 31 December | 1,234 | | 1,329 | |
| |
| |
| |
| Other paid-in capital | | | | |
| At 1 January | 411 | | 270 | |
| Exercise of HSBC share options | 239 | | 141 | |
| |
| |
| |
| At 31 December | 650 | | 411 | |
| |
| |
| |
| Total other reserves at 31 December | 2,221 | | 1,740 | |
| |
| |
| |
| Retained earnings | | | | |
| At 1 January | 8,959 | | 8,970 | |
| IFRSs transition adjustments at 1 January 20051 | (317 | ) | – | |
| Profit for the year attributable to shareholders | 6,816 | | 4,612 | |
| Dividends to shareholders of the parent company | (7,750 | ) | (6,932 | ) |
| Amounts arising on shares in lieu of dividends | 1,811 | | 2,627 | |
| Own shares adjustments | 87 | | (110 | ) |
| Exchange differences and other movements2 | (105 | ) | (208 | ) |
| |
| |
| |
| At 31 December3 | 9,501 | | 8,959 | |
| |
| |
| |
| | |
| 1 | See Note 46 for an explanation of the IFRSs transition adjustment at 1 January 2005. |
| 2 | The total net expense taken directly to equity during the year was US$232 million (2004: US$208 million). |
| 3 | Retained earnings include 130,812,676 (US$701 million) of own shares, held to fund employee share plans (2004:123,108,967, US$749 million). |
241
Back to Contents
| H S B C H O L D I N G S P L C |
| |
| |
| Financial Statements(continued) |
| | |
| | |
HSBC Holdings cash flow statement for the year ended 31 December 2005
| | | | 2005 | | 2004 | |
| | Notes | | US$m | | US$m | |
| Cash flows from operating activities | | | | | | |
| Profit before tax | | | 6,541 | | 4,495 | |
| Adjustments for: | | | | | | |
| – non-cash items included in net profit | 39 | | – | | 167 | |
| – change in operating assets | 39 | | 2,511 | | (2,883 | ) |
| – change in operating liabilities | 39 | | (3,349 | ) | 1,156 | |
| – elimination of exchange differences1 | | | (109 | ) | (240 | ) |
| – tax received | | | 158 | | 125 | |
| | | |
| |
| |
| Net cash from operating activities | | | 5,752 | | 2,820 | |
| | | |
| |
| |
| Cash flows from investing activities | | | | | | |
| Purchase of financial investments | | | – | | (1,119 | ) |
| Proceeds from the sale of financial investments | | | 303 | | 365 | |
| Purchase of property, plant and equipment | | | – | | (1 | ) |
| Net cash outflow from acquisition of and increase in stake of subsidiaries | | | (4,093 | ) | (3,696 | ) |
| Net cash inflow from disposal of subsidiaries | | | 1,063 | | – | |
| | | |
| |
| |
| Net cash used in investing activities | | | (2,727 | ) | (4,451 | ) |
| | | |
| |
| |
| Cash flows from financing activities | | | | | | |
| Issue of ordinary share capital | | | 690 | | 581 | |
| Issue of preference shares | | | 1,405 | | – | |
| Purchases of own shares to meet share awards and share option awards | | | (39 | ) | (261 | ) |
| Own shares released on vesting of share awards and exercise of options | | | 67 | | 84 | |
| Subordinated loan capital issued | | | 1,647 | | 4,997 | |
| Subordinated loan capital repaid | | | (350 | ) | – | |
| Dividends paid | | | (5,935 | ) | (4,425 | ) |
| | | |
| |
| |
| Net cash (used in)/from financing activities | | | (2,515 | ) | 976 | |
| | | |
| |
| |
| Net increase/(decrease) in cash and cash equivalents | | | 510 | | (655 | ) |
| Cash and cash equivalents at 1 January | | | 246 | | 901 | |
| | | |
| |
| |
| Cash and cash equivalents at 31 December | 39 | | 756 | | 246 | |
| | | |
| |
| |
| | |
| 1 | Adjustment to bring changes between opening and closing balance sheet amounts to average rates. This is not done on a line-by-line basis, as details cannot be determined without unreasonable expense. |
242
Back to Contents
| H S B C H O L D I N G S P L C |
| |
| |
| Notes on the Financial Statements |
| | |
| | |
| | |
| 1 | Basis of preparation |
|
| | (a) | For all reporting periods up to and including the year ended 31 December 2004, HSBC prepared its consolidated financial statements in accordance with UK Generally Accepted Accounting Principles (‘UK GAAP’). From1 January 2005, HSBC has prepared its consolidated financial statements in accordance with International Financial Reporting Standards (‘IFRSs’) as endorsed by the EU and effective for HSBC’s reporting for the year ended 31 December 2005. IFRSs comprise accounting standards issued by the International Accounting Standards Board (‘IASB’) and its predecessor body as well as interpretations issued by the International Financial Reporting Interpretations Committee (‘IFRIC’) and its predecessor body. |
| | | |
| | | In preparing these consolidated financial statements, HSBC has elected to take advantage of certain transitional provisions within IFRS 1 ‘First-time Adoption of International Financial Reporting Standards’ (‘IFRS 1’) which offer exemption from presenting comparative information or applying IFRSs retrospectively. The most significant of these provisions is the exemption from presenting comparative information in accordance with IFRSs in the following areas: |
| |
| | | • | IAS 32 ‘Financial Instruments: Presentation’ (‘IAS 32’); |
| |
| | | • | IAS 39 ‘Financial Instruments: Recognition and Measurement’ (‘IAS 39’); and |
| |
| | | • | IFRS 4 ‘Insurance Contracts’ (‘IFRS 4’). |
| |
| | | In addition, HSBC has elected not to present comparative information for disclosures required under IFRS 7 ‘Financial Instruments: Disclosure’ (‘IFRS 7’) as permitted for entities applying the standard for annual periods beginning before 1 January 2006. |
| |
| | | The notes affected by the transition provisions within IFRS 1 that do not contain comparative information are: net income from financial instruments designated at fair value; net earned insurance premiums; net insurance claims incurred and movement in policyholders’ liabilities; net operating income; analysis of financial assets and liabilities by measurement basis; financial assets designated at fair value; hedging instruments within the derivatives note; securitisation and other structured transactions; financial liabilities designated at fair value and liabilities under insurance contracts issued. |
| |
| | | Where comparative information for financial instruments and insurance contracts has been prepared on the basis of HSBC’s previous accounting policies, the accounting policies applied to 2004 are disclosed separately in Note 46g. |
| |
| | | In addition to the Notes on the Financial Statements, disclosures under IFRS 7 relating to the nature and extent of risks may be found under ‘Risk Management’ in the audited information of the Financial Review on pages115 to 177 Unless stated otherwise, this information is unaudited. |
| | | |
| | | HSBC has adopted the ‘Amendment to IAS 39: The Fair Value Option’ (Note 2h), the ‘Amendment to IAS 19 Employee Benefits: Actuarial Gains and Losses, Group Plans and Disclosures’ (Note 2s), the ‘Amendment to IAS 1 Presentation of Financial Statements: Capital Disclosures’, IFRIC 4 ‘Determining whether an Arrangement contains a Lease’ (Note 2q) and IFRS 7 with effect from 1 January 2005, ahead of their effective dates. IFRSs as endorsed by the EU are identical in all respects to the current IFRSs except for the EU’s amendment to IAS 39, under which certain conditions required for the application of hedge accounting were deleted. HSBC has not taken advantage of the EU amendment to IAS 39, and applies the more restrictive requirements of IAS 39. |
| |
| | | The balance sheets and income statements in this document are presented in accordance with IAS 1 ‘Presentation of Financial Statements’. |
| |
| | | On publishing the parent company financial statements here together with Group financial statements HSBC Holdings is taking advantage of the exception in s230 of the Companies Act 1985 not to present its individual income statement and related notes that form a part of these financial statements. |
| |
| | | HSBC has taken advantage of the exemption under Regulation 7 of the Partnerships and Unlimited Companies (Accounts) Regulations 1993 from certain partnerships that are consolidated by HSBC presenting their own individual financial statements under IFRSs. |
| |
| | (b) | The consolidated financial statements of HSBC comprise the financial statements of HSBC Holdings and its subsidiaries made up to 31 December, with the exception of the banking and insurance subsidiaries of HSBC |
243
Back to Contents
| H S B C H O L D I N G S P L C |
| |
| |
| Notes on the Financial Statements(continued) |
| | |
| | |
| | | |
| | | Bank Argentina, whose financial statements are made up to 30 June annually to comply with local regulations. Accordingly, HSBC uses their audited interim financial statements, drawn up to 31 December annually. Entities that are controlled by HSBC are consolidated until the date that control ceases. Newly acquired subsidiaries are consolidated from the date that control is transferred to HSBC. |
| | | |
| | | The purchase method of accounting is used to account for the acquisition of subsidiaries by HSBC. The cost of an acquisition is measured at the fair value of the consideration given at the date of exchange, together with costs directly attributable to that acquisition. The acquired identifiable assets, liabilities and contingent liabilities are measured at their fair values at the date of acquisition. Any excess of the cost of acquisition over the fair value of HSBC’s share of the identifiable assets, liabilities and contingent liabilities acquired is recorded as goodwill. If the cost of acquisition is less than the fair value of HSBC’s share of the identifiable assets, liabilities and contingent liabilities of the business acquired, the difference is recognised immediately in the income statement. |
| | | |
| | | In accordance with IFRS 1, HSBC has chosen not to restate business combinations that took place prior to 1 January 2004, the date of transition to IFRSs. |
| | | |
| | | The premium recorded on shares issued in respect of acquisitions that qualified for merger relief under section 131 of the Companies Act 1985 prior to the transition to IFRS is included in the merger reserve. |
| | | |
| | | All intra-HSBC transactions are eliminated on consolidation. |
| | | |
| | | The consolidated financial statements of HSBC also include the attributable share of the results and reserves of joint ventures and associates. These are based on financial statements made up to 31 December, with the exception of the Bank of Communications Limited and Ping An Insurance Company of China Limited, which are included on the basis of financial statements made up to 30 September. Accordingly, HSBC has taken into account changes in the period from 1 October to 31 December that would have materially affected its results. These are equity accounted three months in arrears in order to meet the requirements of the Group’s reporting timetable. |
| | | |
| | (c) | The preparation of financial information requires the use of estimates and assumptions about future conditions. Use of available information and application of judgement are inherent in the formation of estimates. Actual results in the future may differ from those reported. In this regard, management believes that the critical accounting policies where judgement is necessarily applied are those which relate to loan impairment, goodwill impairment and the valuation of financial instruments (see Critical Accounting Policies on pages 99 to 102). |
| | | |
| | | Further information about key assumptions concerning the future, and other key sources of estimation uncertainty, are set out in the notes on these financial statements. |
| | | |
| | (d) | A discussion of the significant differences between IFRSs and US GAAP and a reconciliation to US GAAP of certain amounts is contained in Note 47. As stated in Note 45, there are no material differences between IFRSs and Hong Kong Generally Accepted Accounting Principles (‘Hong Kong GAAP’). The Notes on the Financial Statements, taken together with the Financial Review, include the aggregate of all disclosures necessary to satisfy IFRSs, Hong Kong and US reporting requirements. |
| | | |
| | | |
| 2 | Summary of significant accounting policies |
|
| | (a) | Interest income and expense |
| | | |
| | | Interest income and expense for all interest-bearing financial instruments except for those classified as held for trading or designated at fair value (other than debt issued by HSBC and related derivatives) are recognised in ‘Interest income’ and ‘Interest expense’ in the income statement using the effective interest rates of the financial assets or financial liabilities to which they relate. |
| | | |
| | | The effective interest rate is the rate that exactly discounts estimated future cash receipts or payments earned or paid on a financial asset or financial liability through its expected life or, where appropriate, a shorter period, to the net carrying amount of the financial asset or financial liability. When calculating the effective interest rate, HSBC estimates cash flows considering all contractual terms of the financial instrument but not future credit losses. The calculation includes all amounts paid or received by HSBC that are an integral part of the effective interest rate, including transaction costs and all other premiums or discounts. |
| | | |
| | | Interest on impaired financial assets is calculated by applying the original effective interest rate of the financial |
244
Back to Contents
| | | asset to the carrying amount as reduced by any allowance for impairment. |
| |
| | (b) | |