HSBC’s credit card business in the rest of Asia-Pacific recorded a 25 per cent increase in outstandings in 2002. Against a depressed economic climate, the focus was switched from acquisition to usage and retention of customers. Further expansion of the credit card business is expected in 2003, with significant investment in staff, training and systems to support this growth.
The focus on increasing the efficiency of the Group’s operations in the region and reducing costs has intensified during the year. Process reviews of several of HSBC’s larger operations in the region have been carried out with a particular emphasis on streamlining operational procedures, concentrating processing activities in single sites where economies of scale can be achieved, and, where financially appropriate, moving certain processing activities offshore to the major Group Service Centres in India and mainland China. Japan, Singapore and the Philippines have migrated operations offshore during the year, and further migrations are planned for 2003. In aggregate the Group Service Centres in India and mainland China now employ 4,720 people, an increase of over 2,700 since December 2001. To facilitate further growth and diversity in locations, a new processing site in Malaysia will be opened in the first half of the year.
In the Asia-Pacific region outside Hong Kong, HSBC’s Corporate Investment Banking and Markets business posted robust results.
As a result of investment in human resources, marketing and systems development in 2001, HSBC firmly established itself as a premier provider of higher margin derivative products in 2002. This was reflected in strong customer-franchise-related revenues, augmenting accrual income and dealing profits.
HSBC’s electronic dealing platform now allows its various branches in the region to access liquidity in its major global market-making centres, thus enhancing speed of delivery, breadth of product offering, and overall service quality. In addition, many regional centres now allow customers to deal directly via electronic media.
HSBC’s operations in the region are conducted primarily through HSBC Bank Middle East, HSBC Financial Services (Middle East) Limited, HSBC Bank Egypt S.A.E. (94.5 per cent owned), British Arab Commercial Bank Limited (46.5 per cent owned) and The Saudi British Bank (40 per cent owned). HSBC Middle East Finance Company Limited (80 per cent owned) and HSBC Insurance Brokers Limited also have operations in the region. HSBC’s network consists of 139 branches and offices, primarily in the United Arab Emirates and Saudi Arabia, and also in Algeria, Egypt, Bahrain, Jordan, Lebanon, Libya, Morocco, Oman, Qatar, Iran and the Palestinian Autonomous Area. In addition to their core commercial and corporate banking services, HSBC’s Middle East operations focus on personal banking, private banking for high net worth individuals and the rapidly developing field of Islamic finance. During 2002, data processing was integrated in the UK, and certain processing act ivities were streamlined by moving them to the Group Service Centre in Hyderabad. IT systems development for the Middle East is now also sourced from India.
North America contributed US$1,238 million, or 12.8 per cent, of HSBC’s profit on ordinary activities before tax in 2002 compared with US$503 million in 2001. HSBC’s principal banking subsidiaries in North America are HSBC Bank USA, HSBC Bank Canada and GFBital.
At 31 December 2002, HSBC Bank USA had assets of US$89 billion and deposits of US$59 billion and was the eleventh-largest US commercial bank, ranked by total assets, and the third-largest depositary institution in New York State, serving over two million customers.
HSBC Bank USA is engaged in general commercial banking business. Through HSBC Bank USA, HSBC has the largest branch network in New York State, where it has over 400 branches, as well as two branches in Pennsylvania, eight in Florida and three in California. Selected commercial and consumer banking products are offered on a national basis, including mortgage servicing to over 3,000 brokers and 48 states. At 31 December 2002, HSBC Bank USA’s customer base included more than 2.3 million personal and 190,000 commercial and institutional customers.
Back to Contents
HSBC HOLDINGS PLC
Description of Business (continued)
|
As a result of the acquisition of RNYC in December 1999, HSBC provides the fifth-largest factoring service in the US. The acquisition also helped to double assets under administration and greatly enhanced HSBC’s global treasury and foreign exchange businesses. HSBC is now also a world leader in banknotes and precious metals trading.
Through its participation in the joint venture Wells Fargo HSBC Trade Bank with Wells Fargo Bank, HSBC offers trade-related financing throughout the western US. Through HSBC’s international network, HSBC Bank USA offers its customers access to the global markets and services of HSBC.
HSBC Bank USA also has a considerable presence and is the largest lender to corporations in Panama with 15 branches.
As part of its strategy of providing customers with multiple choices for product and service delivery, HSBC Bank USA offers a comprehensive internet banking service. At 31 December 2002, more than 405,000 customers had registered for the service, up from approximately 275,000 at 31 December 2001. The HSBC Bank USA web site, us.hsbc.com, where customers can apply for accounts, conduct financial planning and link to online services, receives approximately 50,000 visits daily.
In 2002, hsbc.com, HSBC’s internet development facility based in New York, launched business applications in Asia, North America and Europe; implemented an improved internet service for Global Treasury and Capital Markets customers; launched new web sites for Group businesses in North America and Europe; and provided a global service for processing internet credit card transactions. hsbc.com made significant progress in fulfilling its mission of providing a common presentation layer / browser capability for all HSBC’s global products and services. This e-channel delivery program, when completed, will provide HSBC’s customers with access to all Group products in all the countries and territories in which HSBC has a presence, as well as reducing costs through the economies of a single technical platform. Considerable infrastructural work was also successfully completed in 2002, providing the foundation for migrating all existing systems and applications to this platform over the next 5 years.
HSBC Bank Canada had assets of US$22 billion as at 31 December 2002 and was the seventh-largest bank in Canada. With over 160 branches and subsidiary offices and a staff of over 4,900, HSBC Bank Canada’s operations are customer-driven and integrated both across service and product lines and through HSBC’s international network. HSBC Bank Canada offers a wide range of products and services to targeted customer segments. As at 31 December 2002, HSBC Bank Canada had approximately 890,000 customers across all business segments.
Through HSBC’s international network, HSBC Bank Canada has a strong market share of Asian banking. HSBC has the largest market share in Canada for Import Documentary Credits and ranks second based on industry statistics as compiled by the Canadian Bankers’ Association for the 12 months ended 31 October 2002 in terms of combined Import/Export Documentary Credits.
In 2002, HSBC Bank Canada was rated highest for overall quality of customer service among the banks included in the ‘2002 Customer Service Index’, an independent study conducted annually by Market Facts of Canada. HSBC Bank Canada introduced ‘clientConnect’, a sales and service initiative designed to improve client relationships. The bank also completed the rollout of a Call Management strategy, designed to remove routine tasks from branches, enabling staff to concentrate on deepening relationships with customers.
Electronic Documentary Credit Advising, an internet based trade services product, was launched in 2002. In addition, there was a major overhaul of the hsbc.ca website and Business Internet Banking was launched.
GFBital, which is headquartered in Mexico City, has nation-wide coverage from a network of 1,350 branches and nearly 4,000 automatic teller machines servicing the bank’s customers, which, numbering nearly five and a half million, represent the largest personal customer base of any banking institution in Mexico. HSBC plans to use this network and customer base to expand personal banking services and cross-sell other products and services, particularly leveraging the important position now held in all of the North American Free Trade Agreement countries (Canada, the US and Mexico).
24
Back to Contents
HSBC HOLDINGS PLC
Through its subsidiary Banco Internacional S.A., GFBital provides comprehensive retail and consumer banking products and services using its branches and state of the art internet and tele-banking facilities. In addition, Casa de Bolsa Bital, a brokerage house, offers investment banking and fund management products and services, through the branch network.
GFBital has a joint venture insurance and pension investment with ING, offering life, auto, property, health insurance and pension products through branches.
South America contributed a loss of US$58 million to HSBC’s profit on ordinary activities before tax in 2002 compared with a loss of US$1,016 million in 2001. HSBC’s operations in South America principally comprise HSBC Bank Brasil and HSBC Bank Argentina S.A., with small operations in Chile, Uruguay and Venezuela.
HSBC Bank Brasil, which is headquartered in Curitiba, has an extensive domestic network, with over 1,500 branches and offices, 3.5 million personal customers and over 250,000 business and institutional customers. HSBC’s goal is to use this network, the third-largest of the privately-owned banks in Brazil, as a platform to expand personal banking services and cross-sell other products and services, particularly insurance, funds management and leasing services.
HSBC operates the seventh-largest insurance business in Brazil, offering a broad range of insurance products. As part of HSBC’s overall cross-selling strategy, most of the staff of HSBC Bank Brasil’s insurance and banking offices are being located together in order to maximise cross-sale opportunities.
HSBC Bank Brasil also manages HSBC Investment Bank Brasil S.A.-Banco Múltiplo (formerly known as Banco CCF Brasil S.A), which is owned by CCF. The business complements HSBC’s capital markets and insurance operations and has brought significant additions to HSBC’s private banking and asset management operations in Brazil. Total assets under management were US$5.9 billion at 31 December 2002, making HSBC the fifth-largest fund manager in Brazil.
Argentina has undergone significant financial turmoil in 2002, with a consequent adverse impact on the economy. It remains unclear when this position will improve. HSBC in Argentina has a total staff of over 4,100 employees and a total of 115 sales points, of which 58 are bank branches and 57 are insurance, pension, annuities and health care outlets. HSBC Bank Argentina S.A. is the seventh-largest privately-owned bank in Argentina in terms of deposits and sixth-largest in terms of assets and loans. HSBC also has one of the largest insurance businesses in Argentina, HSBC La Buenos Aires, and through its subsidiaries HSBC Máxima and HSBC New York Life offers pensions and life assurance. HSBC’s Argentinian health care subsidiary, HSBC Salud, provides pre-paid medical services and is the fourth-largest pre-paid health care company in Argentina (in terms of membership) and the leading one in the corporate market.
HSBC Holdings and its subsidiaries face keen competition in all the markets they serve. HSBC competes with other major financial institutions, including commercial banks, savings and loan associations, credit unions, consumer finance companies, major retailers, brokerage firms and investment companies providing commercial banking products and services, and with investment banks and the investment banking operations of commercial banks providing investment banking products and services.
| Consolidation in the banking industry |
The trend towards bank consolidations, at both the national and international levels, is creating a broader range of banks capable of competing directly with HSBC in an increasing number of markets worldwide in which previously only HSBC and a few other global banks offered the full range of banking services.
In HSBC’s largest current markets, the UK, France, the US and Hong Kong, there is limited market growth in the provision of basic financial and banking services. There is, however, growth potential in the provision of a full range of financial services.
25
Back to Contents
HSBC HOLDINGS PLC
Description of Business (continued)
|
Technological innovations, including new and expanding information and communication technologies, are altering radically HSBC’s range of competitors, as specialist providers and non-financial organisations begin to offer financial services without the need of a traditional physical branch network. Such innovations increase the pressure on traditional banks to maintain and enhance service quality and also to make the investments required to offer similar services. HSBC is actively adapting its business to allow customers to access its full range of services in the manner they wish: through the internet, interactive TV, mobile phones, WAP, telephone banking as well as the branch system.
Although market growth in the UK has remained limited, competition continues to increase. The market has seen an array of new entrants, new channels and new products. Such new entrants have included insurance companies, supermarkets, clothing and grocery retailers, car manufacturers and utilities, each providing a variety of products and services to challenge traditional banks.
In March 2002, the Competition Commission Report on the supply of banking services to small and medium sized businesses was published. The Report prescribed several remedies including a ‘Transitional Remedy’ which allowed the banks the choice of paying interest on current accounts at a minimum of 2 1/2 per cent below base rate or providing free money transmission services to businesses with up to £25 million turnover. During the year, discussions took place with The Office of Fair Trading (OFT) following the completion of the Competition Commission’s report on the provision of banking services to small and medium-sized businesses. HSBC Bank plc has developed an enhanced package of initiatives for customers, estimated to be worth US$125 million per annum. Interest on current accounts has been paid automatically to all qualifying customers with effect from 1 January 2003. Further initiatives include the introducti on of a new instant access savings account and improved terms for start-up businesses.
In November 2002, OFT announced that in early 2003 it is to launch a new market investigation looking into payment systems developments. It has stated that this will pave the way for its prospective powers to promote effective competition in payment systems. On 11 February 2003, OFT announced its preliminary conclusion that an agreement between MasterCard’s UK members (which includes HSBC Bank plc) on a common interchange fee charged on transactions made in the UK by credit and charge cards infringes the Competition Act 1998. OFT has given MasterCard a further opportunity to justify the existing agreement or suggest changes to it so that it will meet the conditions for an exemption under the Competition Act. A final decision on this issue is expected in the spring of 2003.
Like the other western economies, the French banking sector was affected in 2002 by the poor economic environment and the equity market turmoil, but benefited from high volumes of sight deposits and slightly improved lending margins. A debate has been opened on the legal prohibition of remuneration for sight deposits. The trend towards consolidation in the sector is expected to continue.
Competition from locally incorporated and foreign banks remains strong, particularly for quality customers and quality assets. Competition for credit cards and consumer assets has remained intense, but banks in general have tightened their credit acceptance procedures and limits due to the growing numbers of bankruptcies. This trend is likely to continue through 2003. To generate income to cover credit loss and mitigate the reduction in mortgage revenue, banks have diversified into growing their insurance and investment businesses. HSBC has grown its securities trading market share by 40 per cent, although weak demand for individual equity products continues to put securities trading revenues under pressure. As market leaders, The Hongkong and Shanghai Banking Corporation and Hang Seng Bank are well placed to meet these competitive challenges.
| Rest of Asia-Pacific (including Middle East) |
Growth picked up in general across the rest of Asia-Pacific in 2002, spurred by a rebound in trade and economic activity. An improvement in consumer spending, supported by more flexible monetary policy and the willingness of banks to extend credit to the household sector, was also seen in certain economies, notably in Malaysia.
26
Back to Contents
HSBC HOLDINGS PLC
The competitive environment varies greatly across the region, depending on the level of regulation, number of entrants and the maturity of the markets. Following the economic slowdown in 2001, a greater accommodation towards foreign banks has emerged in some countries as local banks suffer from the burden of extensive non-performing loans. HSBC’s strong reputation for prudent risk management is invaluable as new opportunities arise. Additionally, in most countries in the region, the relatively young population and maturing sophistication in financial services are expected to provide further growth opportunities for HSBC.
In the Middle East, competition remains intense, with a large number of banks serving relatively small populations in each country.
In the US, mergers and acquisitions in the banking, insurance and securities industries have brought consolidation, conglomeration and a blending of services. HSBC Bank USA also faces vigorous competition from a large number of non-bank suppliers of financial services that have found new and effective ways to meet the financial demands of customers. Many of these institutions are not subject to the same laws and regulations imposed on HSBC Bank USA. The Gramm-Leach-Bliley Act (‘GLBA’) enables banks, securities firms and insurance companies to enter into combinations that permit a single financial services organisation to offer a more complete line of financial products and services.
In Canada, the financial services industry is more centrally regulated relative to the US and other parts of the world. The financial services industry continues to be dominated by the five largest banks in the country but the market remains highly competitive. In anticipation of potential de-regulation, there has been consolidation in the insurance and wealth management sectors over the past two years. The large banks, however, have been unsuccessful to date in gaining approval from the federal government to merge.
In Mexico, the banking environment has seen significant concentration in recent years with over 70% of banking assets and 75% of deposits owned by subsidiaries of four major foreign banks (HSBC, BBVA, Citibank and Santander). Given that Mexico has a population of 100 million of which an estimated 80% do not use the banking system, the growth opportunities in the retail sector are favourable in the medium to long term. GFBital, with its extensive branch network, solid technological infrastructure and growing young customer base is well positioned to take full advantage of the economic and competitive environment.
HSBC’s expertise and global customer base will help position GFBital to compete more effectively in trade finance, Corporate, Investment Banking and Markets and Personal Financial Services. Mexico’s economy is very closely linked to that of the US and Canada; over 90% of Mexico’s exports stay within the North American market. HSBC’s growing presence in the region provides a competitive advantage.
There are over 180 banks in Brazil operating through a network of over 24,000 branches and offices. Consolidation in the local banking industry is underway, increasingly involving foreign banks (at the end of 2002 there were 53 banks in Brazil with foreign ownership interests). With a population of 175 million and an estimated 63 per cent of the population ‘unbanked’, growth opportunities in the retail sector, in particular, appear favourable in the medium to long term. In comparison with more developed markets, insurance penetration in Brazil is fairly low, especially in the life business sector. HSBC’s ability to cross-sell both life assurance and general insurance products through its extensive branch network means that it is well placed to take advantage of this economic and competitive environment.
In Argentina, international financial groups are the main competitors as most major banking and insurance players in the market are foreign controlled.
The crisis in Argentina over the past year has had a profound impact on the financial services market and HSBC is now one of a few participants still able to provide the full range of financial services to its customers. The financial services industry however remains unprofitable pending the necessary economic, fiscal and political reforms required to recover confidence in the country’s prospects. HSBC will carefully monitor developments, particularly following the presidential election due in April 2003, to evaluate the opportunities and risks within the financial services industry in Argentina.
27
Back to Contents
HSBC HOLDINGS PLC
Description of Business (continued)
|
As at 31 December 2002, HSBC had approximately 192,000 employees (including part-time employees) worldwide (of whom approximately 54,000 work in the UK, 14,000 in France, 24,000 in Hong Kong, 14,000 in the US, 21,000 in Brazil and 15,000 in Mexico), compared with approximately 180,000 at 31 December 2001 and 172,000 at 31 December 2000. HSBC estimates that approximately half of its labour force worldwide is unionised. Most significant concentrations of union membership occur in Brazil, France, Indonesia, Malaysia, Malta, Mexico, Philippines, Spain, and the UK. Management believes that the current relationship between HSBC and its employees is harmonious, as it has been in the past. HSBC has not experienced any material strikes or work stoppages within the past five years.
HSBC is proud of its diverse workforce that is able to communicate with HSBC’s customers in the local languages and dialects across 80 countries and territories. A continued focus on policies that encourage an inclusive working environment and the development of career opportunities for all, regardless of ethnicity, gender or grade, is a key part of HSBC’s employer of choice philosophy. Emphasis is also placed on identifying, developing and retaining the very best talent that exists around the globe.
Regulation and supervision
|
HSBC’s operations throughout the world are regulated and supervised by the relevant central banks and regulatory authorities in each of the jurisdictions in which HSBC has offices, branches or subsidiaries. These authorities impose certain reserve and reporting requirements and controls (for example, capital adequacy, depositor protection, and prudential supervision) on banks. In addition, a number of countries in which HSBC operates impose rules that affect, or place limitations on, foreign or foreign-owned or controlled banks and financial institutions, including: restrictions on the opening of local offices, branches or subsidiaries and the types of banking and non-banking activities that may be conducted by those local offices, branches or subsidiaries; restrictions on the acquisition of local banks or requiring a specified percentage of local ownership; and restrictions on investment and other financial flows entering or leaving the country. Changes i n the supervisory and regulatory regimes of the countries where HSBC operates, particularly in Asia, will determine to some degree HSBC’s ability to expand into new markets, the services and products that HSBC will be able to offer in those markets and how HSBC structures specific operations.
The UK Financial Services Authority (‘FSA’) supervises HSBC on a consolidated basis. Additionally, each operating bank within HSBC is regulated by local supervisors. Thus, The Hongkong and Shanghai Banking Corporation Limited and Hang Seng Bank are supervised by the Hong Kong Monetary Authority (the ‘Monetary Authority’), HSBC Bank plc by the FSA, CCF by the French Banking Commission and HSBC Bank USA by the Board of Governors of the Federal Reserve Board (the ‘Federal Reserve Board’), the Federal Deposit Insurance Corporation (the ‘FDIC’) and the State of New York Banking Department.
United Kingdom regulation and supervision |
UK banking and financial institutions are subject to multiple regulations. The primary UK statute is the Financial Services and Markets Act 2000 (‘FSMA’). In addition, other UK primary and secondary banking legislation is derived from European Union (‘EU’) directives relating to banking, securities, investment and sales of personal financial services.
The FSA has been responsible for authorising and supervising UK banking institutions since 1 June 1998, when the Bank of England Act 1998 transferred to it responsibility for, among other things, banking supervision from the Bank of England. The FSA regulates all investment business in the UK from retail life and pensions business to custody, branch share dealing and treasury and capital markets activity.
FSA rules establish the minimum criteria for authorisation for banks and investment businesses in the UK. They also set out reporting (and, as applicable, consent) requirements with regard to large individual exposures and large exposures to related borrowers. The FSA may obtain independent reports, usually from the auditors of the authorised institution, as to the adequacy of systems governing internal control as well as systems governing records and accounting. The FSA may also object, on prudential grounds, to persons who hold, or intend to hold, 10 per cent or more of the voting power of a financial institution.
28
Back to Contents
HSBC HOLDINGS PLC
The regulatory framework of the UK banking system has traditionally been based on co-operation between the FSA and authorised institutions. The FSA monitors authorised institutions through interviews and the review of periodically required reports relating to financial and prudential matters. The FSA meets regularly with HSBC’s senior executives to confirm that HSBC adheres to the FSA’s prudential guidelines. The FSA and senior executives in the UK regularly discuss fundamental matters relating to HSBC’s business in the UK and internationally, such as strategic and operating plans, risk control, loan portfolio composition and organisational changes.
In its capacity as supervisor of HSBC on a consolidated basis, the FSA receives information on the capital adequacy of, and sets requirements for, HSBC as a whole. Further details on capital measurement are included in ‘Capital Management’ on pages 140 to 142.
HSBC Bank plc is HSBC’s principal authorised institution in the UK. HSBC Investment Bank plc’s business was subsumed into HSBC Bank plc in November 2002 (see page 9).
Depositors and investors are covered by the Financial Services Compensation Scheme which deals with deposits with authorised institutions in the UK, investment business and contracts of insurance. Institutions authorised to accept deposits and conduct investment business are required to contribute to the funding of the scheme. In the event of the insolvency of an authorised institution, depositors are entitled to receive 100% of the first £2,000 (US$3,224) of a claim plus 90% of any further amount up to £33,000 (US$53,189) (the maximum amount payable being £31,700 (US$51,094)). Payments under the scheme in respect of investment business compensation are limited to 100% of the first £30,000 (US$48,354) of a claim plus 90% of any further amount up to £20,000 (US$32,236) (the maximum amount payable being £48,000 (US$77,366)).
The European Union is currently in the process of finalizing a new directive regarding the taxation of savings income. Under the current proposal, each Member State other than Austria, Belgium, and Luxembourg would be required, beginning in 2004, to provide the tax authorities of each other Member State with details of payments of interest or other similar income paid by a person within its jurisdiction to individuals resident in such other Member State. Beginning on the same date, Austria, Belgium, and Luxembourg would impose a withholding tax on such income. The withholding tax rate would initially be 15 per cent, increasing to 20 per cent after 2006 and 35 per cent after 2009. If and when (i) the European Union enters into exchange of information agreements with Switzerland, Liechtenstein, Monaco, Andorra, and San Marino and (ii) the Council of the European Union confirms that the United States is sufficiently committed to exchang e of information pursuant to bilateral agreements, Austria, Belgium, and Luxembourg would cease to apply the withholding tax and would instead comply with the automatic exchange of information rules applicable to the other Member States. Although some issues regarding the proposal remain to be resolved (notably, a precondition that Switzerland agree to a withholding tax regime similar to that applicable to Austria, Belgium, and Luxembourg), the Council of the European Union intends to finalize and approve the directive on March 21, 2003.
Hong Kong regulation and supervision |
Banking in Hong Kong is subject to the provisions of the Banking Ordinance of Hong Kong (Chapter 155) (the ‘Banking Ordinance’), and to the powers, functions and duties ascribed by the Banking Ordinance to the Monetary Authority. The principal function of the Monetary Authority is to promote the general stability and effective working of the banking system in Hong Kong. The Monetary Authority is responsible for supervising compliance with the provisions of the Banking Ordinance. The Chief Executive of Hong Kong (‘the Chief Executive’) has the power to give directions to the Monetary Authority, which the Banking Ordinance requires the Monetary Authority and the Financial Secretary to follow.
The Monetary Authority has responsibility for authorising banks, and has discretion to attach conditions to its authorisation. The Monetary Authority requires that banks or their holding companies file regular prudential returns, and holds regular discussions with the management of the banks to review their operations. The Monetary Authority may also conduct ‘on site’ examinations of banks, and in the case of banks incorporated in Hong Kong, of any local and overseas branches and subsidiaries. The Monetary Authority requires all authorised institutions to have adequate systems of internal control and requires the institutions’ external auditors, upon request, to report on those systems and other matters such as the accuracy of information provided to the Monetary Authority. In addition, the Monetary Authority may from time to time conduct tripartite discussions with banks and their external auditors.
29
Back to Contents
HSBC HOLDINGS PLC
Description of Business (continued)
|
The Monetary Authority, which may deny the acquisition of voting share capital of over 10 per cent in a bank, and may attach conditions to its approval thereof, can effectively control changes in the ownership and control of Hong Kong-incorporated financial institutions. In addition, the Monetary Authority has the power to divest controlling interests in a bank from a person if they are no longer deemed to be fit and proper, or if they may otherwise threaten the interests of depositors or potential depositors.
The Monetary Authority may revoke authorisation in the event of an institution’s non-compliance with the provisions of the Banking Ordinance. These provisions require, among other things, the furnishing of accurate reports.
The Banking Ordinance requires that banks submit to the Monetary Authority certain returns and other information and establishes certain minimum standards and ratios relating to capital adequacy (see below), liquidity, capitalisation, limitations on shareholdings, exposure to any one customer, unsecured advances to persons affiliated with the bank and holdings of interests in land, with which banks must comply.
Hong Kong fully implemented the capital adequacy standards established by the Basel Convergence Agreement in 1989. The Banking Ordinance currently provides that banks incorporated in Hong Kong maintain a capital adequacy ratio (calculated as the ratio (expressed as a percentage) of its capital base to its risk-weighted exposure) of at least 8 per cent. For banks with subsidiaries, the Monetary Authority is empowered to require that the ratio be calculated on a consolidated basis, or on both consolidated and unconsolidated bases. If circumstances require, the Monetary Authority is empowered to increase the minimum capital adequacy ratio (to up to 12 per cent for fully-licensed banks and 16 per cent for deposit-taking companies and restricted-licence banks), after consultation with the bank.
US regulation and supervision |
HSBC is subject to extensive federal and state supervision and regulation in the US. Banking laws and regulations of the Federal Reserve Board, the FDIC and the State of New York Banking Department govern many aspects of HSBC’s US business.
HSBC and its US operations are subject to supervision, regulation and examination by the Federal Reserve Board because HSBC is a bank holding company under the US Bank Holding Company Act of 1956 (the ‘BHCA’) as a result of its ownership of HSBC Bank USA. HSBC Bank USA, as a New York state-chartered bank, is a member of the Federal Reserve System and subject to regulation, supervision and examination by both the Federal Reserve Board and the State of New York Banking Department. The deposits of HSBC Bank USA are insured by the FDIC and are subject to relevant FDIC regulation.
The BHCA and the International Banking Act of 1978 (‘IBA’) impose certain limits and requirements on the US activities and investments of HSBC and certain companies in which it holds direct or indirect investments. HSBC is generally prohibited from acquiring, directly or indirectly, ownership or control of more than 5 per cent of the voting shares of any company engaged in the United States in activities other than banking and certain activities closely related to banking. HSBC has elected to be treated as a financial holding company under the GLBA, enabling it to offer a more complete line of financial products and services. HSBC’s ability to engage in expanded financial activities as an FHC depends upon HSBC meeting certain criteria set forth in the BHCA, including requirements that its principal US depository institution subsidiary, HSBC Bank USA, and its forty per cent owned subsidiary, Wells Fargo HSBC Trade Bank, N.A., be well capitalized and well managed, and that they have achieved at least a satisfactory record of meeting community credit needs during their most recent examination pursuant to the Community Reinvestment Act. In general under the BHCA, an FHC would be required, upon notice by the Federal Reserve Board, to enter into an agreement to correct any deficiency in the requirements necessary to maintain its FHC election. Until such deficiencies are corrected, the Federal Reserve Board may impose limitations on the conduct or activities of an FHC or any of its affiliates as it deems appropriate. If such deficiencies are not timely corrected, the Federal Reserve Board may require an FHC to divest its control of any subsidiary bank or to cease to engage in certain financial activities. HSBC is also generally prohibited from acquiring, directly or indirectly, ownership or control of more than 5 per cent of any class of voting shares of, or substantially all the assets of, or exercising control over, any US bank or bank holding company without the prior approval of the Federal Reserve Board. However, as a qualifying foreign banking organisation under Federal Reserve Board regulations, HSBC may engage in the United States in certain limited non-banking activities and hold certain investments that would otherwise not be permissible under US law.
30
Back to Contents
HSBC HOLDINGS PLC
The Riegle-Neal Interstate Banking and Branching Efficiency Act of 1994 (the ‘Riegle-Neal Act’) permits a bank holding company or foreign banking organisation, with Federal Reserve Board approval, to acquire a bank located in a state other than the organisation’s US ‘home’ state, subject to certain restrictions, and a national or state-chartered bank to merge across state lines or to establish or acquire branches in other states, subject to various state law requirements or restrictions. In general, the Riegle-Neal Act provides a non-US bank with interstate branching and expansion rights similar to those of a US national or state-chartered bank located in its ‘home’ state.
The US is a party to the Basel Convergence Agreement and US banking regulatory authorities have adopted risk-based capital requirements for US banks and bank holding companies that are generally consistent with the agreement. In addition, US bank regulatory authorities have adopted ‘leverage’ capital requirements that generally require US banks and bank holding companies to maintain a minimum amount of capital in relation to their balance sheet assets (measured on a non-risk-weighted basis).
The Federal Reserve Board has determined that, as a general matter, a US bank holding company that is owned and controlled by a foreign bank that is a financial holding company that the Federal Reserve Board has determined to be well capitalised and well managed, will not be required to comply with the Federal Reserve Board’s capital adequacy guidelines. HSBC may rely on the Federal Reserve Board’s flexibility with respect to the capital adequacy requirements applicable to such US bank holding companies.
HSBC Bank USA, like other FDIC-insured banks, is required to pay assessments to the FDIC for deposit insurance under the FDIC’s Bank Insurance Fund (calculated using a risk-based assessment system). These assessments are based on deposit levels and other factors.
The Federal Deposit Insurance Corporation Improvement Act of 1991 (‘FDICIA’) provides for extensive regulation of depository institutions (such as HSBC Bank USA), including requiring federal banking regulators to take ‘prompt corrective action’ in respect of FDIC-insured banks that do not meet minimum capital requirements. For this purpose, FDICIA establishes five tiers of institutions: well capitalised; adequately capitalised; undercapitalised; significantly undercapitalised; and critically undercapitalised. As an insured bank’s capital level declines and the bank falls into lower categories (or if it is placed in a lower category by the discretionary action of its supervisor), greater limits are placed on its activities and federal banking regulators are authorised (and, in many cases, required) to take increasingly more stringent supervisory actions, which could ultimately include the appointment of a conservator or receiver for the bank (even if it is solvent). In addition, FDICIA generally prohibits an FDIC-insured bank from making any capital distribution (including payment of a dividend) or paying any management fee to its holding company if the bank would thereafter be undercapitalised. If an insured bank becomes undercapitalised, it is required to submit to federal regulators a capital restoration plan guaranteed by the bank’s holding company. The guarantee is limited to 5 per cent of the bank’s assets at the time it becomes undercapitalised or, should the undercapitalised bank fail to comply with the plan, the amount of the capital deficiency at the time of failure, whichever is less. If an undercapitalised bank fails to submit an acceptable plan, it is treated as if it were significantly undercapitalised. Significantly undercapitalised banks may be subject to a number of requirements and restrictions, including requirements to sell sufficient voting stock to become adequately capitalised, requirements to reduce total assets and restrictions on accepting deposits from correspondent banks. Critically undercapitalised depository institutions are subject to appointment of a receiver or conservator.
As at 31 December 2002, HSBC Bank USA was well capitalised under Federal Reserve Board regulations.
31
Back to Contents
HSBC HOLDINGS PLC
Description of Business (continued)
|
On 26 October 2001 the USA Patriot Act (‘Patriot Act’) became effective. The Patriot Act imposed significant record keeping and customer identity requirements, expanded the government’s powers to freeze or confiscate assets and increased the available penalties that may be assessed against financial institutions for violation of the requirements of the Patriot Act intended to detect and deter money laundering. The Patriot Act required the U.S. Treasury Secretary to develop and adopt final regulations with regard to the anti-money laundering compliance obligations on financial institutions (a term which includes insured U.S. depository institutions, U.S. branches and agencies of foreign banks, U.S. broker-dealers and numerous other entities). The U.S. Treasury Secretary delegated this authority to a bureau of the U.S. Treasury Department known as the Financial Crimes Enforcement Network (‘FinCEN’).
Many of the new anti-money laundering compliance requirements of the Patriot Act, as implemented by FinCEN, are generally consistent with the anti-money laundering compliance obligations that already apply to HSBC Bank USA under the Bank Secrecy Act and applicable Federal Reserve Board regulations. These include requirements to adopt and implement an anti-money laundering program, report suspicious transactions and implement due diligence procedures for certain correspondent and private banking accounts. Certain other specific requirements under the Patriot Act involve new compliance obligations. The passage of the Patriot Act and other recent events have resulted in heightened scrutiny of the Bank Secrecy Act and anti-money laundering compliance by federal and state bank examiners. HSBC Bank USA is in the process of implementing a program to ensure that it is in full compliance with all such requirements.
Certain U.S. source payments to foreign persons may be subject to U.S. withholding tax unless the foreign person is a qualified intermediary. A qualified intermediary is a financial intermediary who is qualified under the Internal Revenue Code and has completed the Qualified Intermediary Withholding Agreement with the Internal Revenue Service. This regulatory regime requires us to incur additional compliance expenses and creates another risk of noncompliance which may have significant adverse consequences.
The U.S. Treasury has proposed amendments to the regulations under section 163(j) of the Internal Revenue Code that would limit deductions for interest expense paid to certain related parties. Treasury’s proposal is subject to the uncertainties inherent in the legislative process and it is impossible to predict whether and in what form the proposal will be enacted. If the amendment is enacted as proposed, it may reduce the amount of U.S. tax deductions we are able to take for interest paid in respect of certain related-party debt.
French regulation and supervision |
French banking law (the ‘Banking Law’) sets forth the conditions under which credit institutions, including banks, may operate in France and vests related supervisory and regulatory powers in certain administrative authorities: the National Credit and Securities Council, the Banking and Financial Regulatory Committee, the Credit Institutions and Investment Firms Committee and the Banking Commission.
The Banking Commission, which is chaired by the Governor of the Bank of France, is responsible for the supervision of credit institutions and certain investment firms and the enforcement of laws and regulations applicable to them. Banks are required to submit periodic (either monthly or quarterly) accounting reports to the Banking Commission concerning the principal areas of their activity. The Banking Commission may also request additional information which it deems necessary and may carry out on-site inspections. The reports permit close monitoring of the condition of each bank and also facilitate computation of the total deposits of all banks and their use. Where regulations have been violated, the Banking Commission may act as an administrative court and impose sanctions which may include deregistration of a bank, resulting in closure. The Banking Commission also has the power to appoint a temporary administrator to manage provisionally a bank which it deems to be mismanaged.
The principal regulations applicable to deposit banks such as CCF are minimum capital ratio requirements, equity and permanent resources (certain long-term assets denominated in euros) ratios, risk diversification and liquidity, as well as monetary policy, restrictions on equity investments and reporting requirements.
CCF’s commercial banking operations in France are also significantly affected by monetary policies established from time to time by the European Central Bank in coordination with the Bank of France. French credit institutions are required to maintain on deposit with the Bank of France a percentage, fixed by the European Central Bank and calculated monthly, of various categories of demand and short-term deposits and are prohibited from paying interest on certain demand deposits and on deposits with a maturity of less than one month.
32
Back to Contents
HSBC HOLDINGS PLC
Credit institutions must make periodic reports to the Banking Commission summarising their activities during the relevant period with detailed breakdowns by category, including an income statement, and certain additional data relating to operations such as the number of employees, client accounts and branches.
All credit institutions operating in France are required by law to operate a deposit guarantee mechanism for customers of commercial banks, except branches of European Economic Area banks which are covered by their home country’s guarantee system. The contribution of each credit institution is calculated on the basis of the aggregate deposits and one-third of the gross customer loans held by such credit institution. This contribution is weighted by solvency criteria. In the event of the insolvency of an authorised institution, the limit on compensation for each depositor is €70,000.
French credit institutions are required to establish appropriate internal control systems, including with respect to risk management and the creation of appropriate audit trails. The institution must prepare an annual report for review by the institution’s board of directors and the Banking Commission regarding the institution’s internal procedures and the measurement and monitoring of the institution’s exposure.
33
Back to Contents
HSBC HOLDINGS PLC
At 31 December 2002, HSBC had some 7,600 operational properties worldwide, of which approximately 3,100 were located in Europe, 600 in Hong Kong and the Asia Pacific region, 2,000 in North America (including 1,370 in Mexico) and 1,600 in Brazil. Additionally, properties with a net book value of US$525 million were held for investment purposes. Of the total net book value of HSBC properties, more than 70 per cent were owned or held under long-term leases. Further details are included in Note 25 of the ‘Notes on the Financial Statements’.
HSBC values its properties on an annual basis and updates their balance sheet values accordingly.
On 19 October 1998, HSBC Bank plc, a subsidiary of HSBC Holdings, entered into an agreement to acquire a long leasehold interest in a building at Canary Wharf, London, to be developed by Canary Wharf Limited. The building was substantially completed, and occupation commenced in the third quarter 2002. The final transfer of operations was completed in February 2003. The new building accommodates under one roof approximately 8,000 staff, who previously occupied various HSBC offices in the City of London. The disposal of surplus property interests released by this consolidation move has been managed in 2002, and will continue to be managed in 2003, through assignment, leasing or sale into the market, as appropriate.
34
Back to Contents
HSBC HOLDINGS PLC
HSBC, through a number of its subsidiary undertakings, is named in and is defending legal actions in various jurisdictions arising from its normal business. None of the above proceedings is regarded as material litigation.
35
Back to Contents
HSBC HOLDINGS PLC
The following discussion is based on, and should be read in conjunction with, the Financial Statements and the notes thereto included elsewhere in this Annual Report. The Financial Statements are prepared in accordance with UK GAAP, which varies in certain significant respects from US GAAP. For a discussion of the differences and a reconciliation of certain UK GAAP amounts to US GAAP, see Note 50 of the ‘Notes on the Financial Statements’.
HSBC operates through long-established businesses in five regions: Europe; Hong Kong; Rest of Asia-Pacific, including the Middle East and Africa; North America; and South America. Each of these businesses operates domestic banking operations in its region providing services to personal, commercial and corporate customers. In key locations including London, New York, Hong Kong and Paris, HSBC has treasury and capital markets operations to service its base of large commercial and institutional clients. In addition, HSBC has private banking operations in Hong Kong, London, New York, Miami, Düsseldorf, Monaco, Singapore, Luxembourg, and the Channel Islands as well as in Switzerland.
Against a background of difficult conditions in most of the world’s economies, HSBC achieved a solid set of results in 2002. Its performance reflected the resilience of its local businesses and their ability to generate a reasonable return.
HSBC’s attributable profit of US$6,239 million in 2002 was 25 per cent higher than 2001. The results in 2001 bore an exceptional charge of US$1,120 million relating to the situation in Argentina, and the provision for the Princeton Note settlement (US$323 million after tax). Operating profit before provisions and goodwill amortisation increased by 3 per cent year on year for the second year running, rising to US$11,641 billion in 2002. In constant currency, operating profit before provisions rose also by 3 per cent with a 43 per cent decline in South America being offset against an underlying growth of 6 per cent in Europe and 11 per cent in North America. In an environment of economic uncertainty, weak equity markets and reduced demand for capital investment, HSBC concentrated on controlling costs and extending the range of products offered to its core customer base. Organic growth, particularly in North America and Europe, tog ether with the benefit of acquisitions, more than offset the lower levels of operating profits earned in South America, which were heavily impacted by foreign exchange translation. Credit costs in 2002 at US$1,321 million absorbed 11 per cent of cash operating profit before provisions against 13 per cent in 2001, excluding the additional general provision for Argentina.
HSBC has grown its asset base and operating profits over the past several years, fuelled by an expansion of services and a strategy of value-added acquisitions. HSBC’s strong capital position and depth of management resources have enabled opportunistic acquisitions to be made in all market conditions.
The strategic acquisitions impacting the last three years are as follows:
In December 1999, HSBC acquired Republic New York Corporation, subsequently merged with HSBC USA Inc, and Safra Republic Holdings S.A. subsequently renamed HSBC Republic Holdings (Luxembourg) S.A.. The acquisition doubled HSBC’s private banking business and extended HSBC’s US domestic, personal and commercial banking business. Goodwill of US$6.3 billion arose on the acquisition and is being amortised over 20 years commencing January 2000.
In July 2000, HSBC acquired CCF, a major French banking group, with businesses in personal, corporate and investment banking, asset management and private banking. Goodwill of US$9 billion arose on the acquisition of CCF and is being amortised over 20 years commencing July 2000. At 31 December 2002 CCF’s total assets were US$73 billion, total customer deposits were US$26 billion and loans to customers (net) were US$31 billion.
On 25 November 2002, HSBC completed the acquisition of GFBital, a major retail banking group in Mexico. Goodwill of US$2 billion arose on the acquisition of GFBital and is being amortised over 20 years commencing November 2002. With this acquisition, HSBC has extended its presence in the North American Free Trade Agreement countries. At 31 December 2002, GFBital’s total assets were US$21 billion, total customer deposits were US$13 billion and loans to customers (net) were US$8 billion.
On 14 November 2002, HSBC announced that it had reached agreement to acquire the common stock of Household for a consideration of approximately US$14.2 billion. The agreement remains subject to a number of conditions including shareholders’ approval and regulatory approvals.
36
Back to Contents
HSBC HOLDINGS PLC
HSBC’s financial performance has also been and may continue to be affected by both actual changes in, and speculation about, market exchange rates, such as the US dollar-pound sterling exchange rate, and government-established exchange rates, such as the managed exchange rate between the Hong Kong dollar and the US dollar. In 2002, the decline in the value of the US dollar against sterling and the euro had a significant effect on the results reported in Europe, while the strengthening of the US dollar against the Argentine peso and Brazilian real significantly affected the results reported in South America.
HSBC has economic, financial market, credit, legal, political and other specialists who monitor economic and market conditions and government policies and actions. However, because of the difficulty involved in predicting with accuracy changes in economic or market conditions or in governmental policies and actions, HSBC cannot fully anticipate the effects that such changes might have on its financial performance and business operations. HSBC believes that the most important external factors affecting its business in 2003 will be the impact on the world economy of possible conflict in the Middle East, and low expected growth rates in the US and in European economies.
So far during the economic and stock market downturn consumers and small business customers have proved surprisingly resilient. Policy initiatives to maintain economic activity through low interest rates have been effective. Although equity markets have fallen, property markets have supported consumer confidence and have attracted savings and investment flows. However, this cannot be a long term solution for repairing world economic growth prospects. Overcapacity still burdens many of the world’s industries, leading to corporate activity focussed on rationalisation rather than expansion. It is a period of cost reduction rather than revenue growth. Demand for investment funding remains very modest. Pension provision and, in the US retirement health benefits obligations, entered into by companies during a more benign economic climate, are likely to place a severe strain on future corporate profits. Employment levels remain a key f actor in economic recovery. During the current uncertainties, HSBC believes completion of the Household acquisition announced last year will improve its geographical balance. This will also change the character of risks within HSBC’s financial framework by increasing the proportion of earnings from the personal sector which, long term, has more predictable revenue and cost characteristics.
| | | Year ended 31 December
| |
Figures in US$m | | | 2002 | | | 2001 | † | | 2000 | † |
| |
| Net interest income | | | 15,460 | | | 14,725 | | | 13,723 | |
| Other operating income | | | 11,135 | | | 11,163 | | | 10,850 | |
| |
Total operating income | | | 26,595 | | | 25,888 | | | 24,573 | |
| |
| Operating expenses excluding goodwill amortisation | | | (14,954 | ) | | (14,605 | ) | | (13,577 | ) |
| Goodwill amortisation | | | (854 | ) | | (799 | ) | | (510 | ) |
| |
Operating profit before provisions | | | 10,787 | | | 10,484 | | | 10,486 | |
| |
| Provisions for bad and doubtful debts | | | (1,321 | ) | | (2,037 | ) | | (932 | ) |
| Provisions for contingent liabilities and commitments | | | (39 | ) | | (649 | ) | | (71 | ) |
| Loss from foreign currency redenomination in Argentina | | | (68 | ) | | (520 | ) | | — | |
| Amounts written off fixed asset investments | | | (324 | ) | | (125 | ) | | (36 | ) |
| |
Operating profit | | | 9,035 | | | 7,153 | | | 9,447 | |
| |
| Share of operating loss in joint ventures | | | (28 | ) | | (91 | ) | | (51 | ) |
| Share of operating profit in associates | | | 135 | | | 164 | | | 75 | |
| Gains/(losses) on disposal of: | | | | | | | | | | |
| – investments | | | 532 | | | 754 | | | 302 | |
| – tangible fixed assets | | | (24 | ) | | 20 | | | 2 | |
| |
Profit on ordinary activities before tax | | | 9,650 | | | 8,000 | | | 9,775 | |
| |
| Tax on profit on ordinary activities | | | (2,534 | ) | | (1,988 | ) | | (2,409 | ) |
| |
Profit on ordinary activities after tax | | | 7,116 | | | 6,012 | | | 7,366 | |
| |
| Minority interests | | | (877 | ) | | (1,020 | ) | | (909 | ) |
| |
| Profit attributable to shareholders | | | 6,239 | | | 4,992 | | | 6,457 | |
| |
| Cash basis profit before tax* | | | 10,513 | | | 8,807 | | | 10,300 | |
| |
| Cash basis profit attributable to shareholders* | | | 7,102 | | | 5,799 | | | 6,982 | |
| | |
| * | Cash based measurements are after excluding the impact of goodwill amortisation. |
| † | The figures for 2001 and 2000 have been restated to reflect the adoption of UK Financial Reporting Standard 19 ‘Deferred Tax’, details of which are set out in Note 1 on pages 195 to 197. |
37
Back to Contents
HSBC HOLDINGS PLC
Financial Review (continued)
|
| |
| |
| |
| |
| Year ended 31 December 2002 compared with year ended 31 December 2001 |
In the sections which follow, analysis of these results highlights the impact of a weaker US dollar against other major currencies and significantly weaker South American currencies against all currencies, on translating revenues and costs arising in the year. Both are important to an understanding of HSBC’s performance in 2002.
HSBC made a profit on ordinary activities before tax of US$9,650 million in 2002, an increase of US$1,650 million, or 21 per cent, compared with 2001. On a cash basis, profit before tax increased by US$1,706 million, or 19 per cent.
Net interest income of US$15,460 million in 2002 was US$735 million, or 5 per cent, higher than 2001. Net interest income in Europe and North America was higher than in 2001 by US$1.1 billion, of which US$0.2 billion reflected the impact of foreign exchange translation and US$85 million reflected the first time contribution from GFBital. Underlying growth reflected higher levels of average interest-earning assets and the benefits from lower funding costs. Net interest income in South America was lower than in 2001 by US$0.4 billion, of which US$0.3 billion was due to foreign exchange translation. Excluding this, the underlying reduction reflected a lower level of local debt securities in Brazil. In Argentina narrower spreads and the costs associated with the funding of the non-performing loan portfolio resulted in net interest expense in 2002.
Other operating income of US$11,135 million, was in line with 2001 as growth in wealth management income was offset by falls in securities market related fee and commission income. Dealing profits was also lower against a backdrop of difficult trading conditions in the credit and equity markets.
Operating expenses, excluding goodwill amortisation, were US$349 million, or 2 per cent, higher than 2001 reflecting the cost structures of new acquisitions, investment in the expanding wealth management business, and costs associated with the enhancement of business processes. In constant currency, operating expenses were 4 per cent higher. HSBC’s cost: income ratio, excluding goodwill amortisation, decreased to 56.2 per cent compared with 56.4 per cent in 2001.
The charge for bad and doubtful debts was US$1,321 million in 2002, which was US$716 million lower than in 2001. The main component of the charge related to the personal sector which amounted to US$857 million, a rise of US$113 million, largely as a result of growth in lending and higher credit card provisioning in Hong Kong. New corporate provisions also increased in Europe but this was more than offset by the clients in Asia as the economic conditions in some Asian countries improved. The substantial decrease in the total charge from 2001 reflected the US$600 million general provision against Argentine exposure charged in 2001.
Other charges of US$107 million in 2002 were US$1,062 million, or 91 per cent, lower than in 2001. The 2001 charges included the loss of US$520 million arising from the foreign currency redenomination in Argentina and a charge of US$575 million in respect of the Princeton Note matter. The 2002 charge includes US$68 million in respect of losses in Argentina arising from judicial orders or ‘amparos’ (allowing certain depositors relief from the mandatory pesification rules and recovery of their historic US dollar deposits at current exchange rates), government decrees and renegotiation of banking contracts
Amounts written off fixed asset investments were dominated by a US$143 million charge writing down the carrying value of a major European life assurer in which CCF has for some time held a strategic minority stake.
The US$28 million share of operating losses in joint ventures principally reflected HSBC’s share of the ongoing costs of Merrill Lynch HSBC for the first half of 2002. Following the acquisition by HSBC of its joint venture partner’s share on 28 June 2002 these results are now consolidated fully on a line by line basis.
Gains on disposal of investments of US$532 million included profit on the sales of CCF’s stake in Lixxbail to its joint venture partner and HSBC’s 6.99 per cent stake in Banco Santiago S.A. In addition, disposal gains of US$170 million were realised from sales of investment debt securities to adjust to changes in interest rate conditions. In aggregate disposal gains on investments were US$222 million lower than in 2001.
| Year ended 31 December 2001 compared with year ended 31 December 2000 |
In the sections which follow, analysis of these results highlights the contribution from CCF, acquired on 28 July 2000, and the impact of a stronger US dollar on translating revenues and costs arising in other currencies, each of which is significant to an understanding of HSBC’s performance in 2001.
38
Back to Contents
HSBC HOLDINGS PLC
HSBC made a profit on ordinary activities before tax of US$8,000 million in 2001, a decrease of US$1,775 million, or 18 per cent, compared with 2000. On a cash basis, profit before tax decreased by US$1,493 million, or 14 per cent, compared with 2000. At constant exchange rates, cash basis profit before tax was 12 per cent lower than 2000.
Net interest income of US$14,725 million in 2001 was US$1,002 million, or 7 per cent, higher than 2000, with a large part of this increase due to the inclusion of CCF for a full year. Net interest income in North America was US$265 million, or 12 per cent, higher than 2000 mainly reflecting growth in average interest-earning assets and the benefit of lower funding costs.
Other operating income rose by US$313 million, or 3 per cent, to US$11,163 million compared with 2000. This increase was primarily driven by the acquisition of CCF and by growth in wealth management income which offset falls in securities-related fee and commission income.
Operating expenses, excluding goodwill amortisation, were US$1,028 million, or 8 per cent, higher than 2000. This increase principally reflected recent acquisitions.
HSBC’s cost: income ratio, excluding goodwill amortisation, increased to 56.4 per cent compared with 55.3 per cent in 2000, reflecting the cost structures of new acquisitions and investment in the expanding wealth management business and IT.
The charge for bad and doubtful debts was US$2,037 million in 2001, which was US$1,105 million higher than in 2000. This mainly reflected the US$600 million general provision against Argentine exposure and specific provisions made against a small number of corporate borrowers. Other provisions included a loss of US$520 million arising from the foreign currency redenomination in Argentina and a charge of US$575 million for the Princeton Note matter.
The US$91 million share of operating losses in joint ventures principally reflected continuing start-up costs of Merrill Lynch HSBC, now operational in the UK, Canada and Australia.
The charge for amounts written-off fixed asset investments arose mainly from venture capital investments and holdings of emerging technology stocks.
Gains on disposal of investments of US$754 million included profit on the sale of HSBC’s 20 per cent stake in British Interactive Broadcasting and the investment in Modern Terminals Limited. In addition, disposal gains of US$170 million were realised from sales of investment debt securities to adjust to changes in interest rate conditions.
| | | Year ended
31 December 2002
| | Year ended
31 December 2001
| | Year ended
31 December 2000
| |
| | | | US$m | | | % | | | US$m | | | % | | | US$m | | | % | |
| |
| Europe | | | 6,343 | | | 41.0 | | | 5,563 | | | 37.8 | | | 4,988 | | | 36.4 | |
| Hong Kong | | | 4,133 | | | 26.7 | | | 4,165 | | | 28.3 | | | 3,997 | | | 29.1 | |
| Rest of Asia-Pacific | | | 1,607 | | | 10.4 | | | 1,482 | | | 10.1 | | | 1,367 | | | 10.0 | |
| North America | | | 2,732 | | | 17.7 | | | 2,450 | | | 16.6 | | | 2,185 | | | 15.9 | |
| South America | | | 645 | | | 4.2 | | | 1,065 | | | 7.2 | | | 1,186 | | | 8.6 | |
| |
| Net interest income | | | 15,460 | | | 100.0 | | | 14,725 | | | 100.0 | | | 13,723 | | | 100.0 | |
| |
Net interest income (US$m) |

| | | Year ended 31 December | |
Figures in US$m | | | 2002 | | | 2001 | | | 2000 | |
| |
| Net interest income | | | 15,460 | | | 14,725 | | | 13,723 | |
| Average interest-earning assets | | | 608,749 | | | 579,665 | | | 516,185 | |
Gross interest yield (per cent)1 | | | 4.70 | | | 6.08 | | | 7.31 | |
Net interest spread (per cent)2 | | | 2.27 | | | 2.09 | | | 2.10 | |
Net interest margin (per cent)3 | | | 2.54 | | | 2.54 | | | 2.66 | |
| | |
| 1 | Gross interest yield is the average interest rate earned on average interest-earning assets (AIEA). |
| | |
| 2 | Net interest spread is the difference between the average interest rate earned on average interest-earning assets and the average interest rate paid on average interest-bearing funds. |
| | |
| 3 | Net interest margin is net interest income expressed as a percentage of average interest-earning assets. |
39
Back to Contents
HSBC HOLDINGS PLC
Financial Review (continued)
|
| Year ended 31 December 2002 compared with year ended 31 December 2001 |
Net interest income in 2002 was US$735 million, or 5 per cent, higher than 2001, at US$15,460 million. At constant exchange rates, net interest income was 6 per cent higher than 2001 reflecting growth in HSBC’s operations in Europe, North America and the rest of Asia Pacific regions, as well as the acquisition of GFBital at the end of November 2002.
In Europe, net interest income was US$780 million, or 14 per cent, higher than in 2001, mainly reflecting the growth in average interest-earning assets and the benefits of lower funding costs. In constant currency, growth was 10 per cent. In North America net interest income increased by US$282 million, or 12 per cent, due to a combination of the increased level of average interest-earning assets, primarily residential mortgages, and wider margins on treasury activities as a steeper yield curve led to reduced funding costs. In addition, GFBital contributed US$85 million of net interest income to the North American region. In Hong Kong, notwithstanding modest loan growth and a reduced contribution from net free funds, net interest income was largely maintained as a strong treasury performance, together with growth in credit card lending and in low cost deposits, offset continuing margin compression in the mortgage business.
In the rest of Asia-Pacific net interest income growth of 8 per cent was driven by higher credit card and personal lending together with the full year impact of the acquisition of NRMA Building Society in Australia in 2001.
In South America the impact of the unsettled economic environment caused net interest income to fall by US$420 million to US$645 million. In Brazil, underlying net interest income was in line with 2001 as the benefit from higher levels of customer lending was offset by the impact of HSBC’s decision to reduce the level of local debt securities and to move to a more conservative positioning of the balance sheet. In Argentina, the combination of narrower spreads and the high cost of local funding of the non-performing loan portfolio resulted in net interest expense in 2002.
Average interest-earning assets at US$609 billion increased by US$29 billion, or 5 per cent. Adjusting for the impact of foreign exchange translation and acquisitions, underlying growth was 3 per cent, driven principally by the placement of customer deposits in the United Kingdom, Taiwan, India, Korea, mainland China and the Middle East, together with personal lending growth in the United Kingdom, France, United States, Canada, Singapore, Malaysia, Korea, Taiwan and India. The increase in average interest-earning assets from acquisitions was US$4 billion.
HSBC was able to maintain its net interest margin at 2.54 per cent, unchanged from that for 2001, as an 18 basis point widening in interest spread was offset by a similar reduction in the contribution from net free funds. Interest spreads benefited from a change in asset mix with a higher proportion of personal lending and with surplus liquidity increasingly invested in higher yielding investment grade corporate debt securities as opposed to interbank placements. In addition, the fall in short-term interest rates benefited margins in our treasury activities as the historical deployment of liquidity into longer dated assets benefited from the effects of the steeper yield curve. A reduced benefit from a higher level of net free funds mitigated this impact on the net interest margin.
In the United Kingdom, net interest margin fell as a reduced benefit from net free funds more than offset an improved contribution from treasury activities and the benefit of a higher level of personal customer lending. In Hong Kong, the Hongkong and Shanghai Banking Corporation was able to maintain its margin through improved treasury performance, higher net recoveries of suspended interest and an increased proportion of higher yielding credit card advances. These factors offset the impact of reduced spreads on deposits, a lower contribution from net free funds and narrower spreads in the competitive mortgage market. Hang Seng Bank suffered a fall in net interest margin resulting primarily from a combination of a lower benefit from net free funds as interest rates fell and the narrower spreads on mortgages. For Hang Seng Bank these drivers are much more significant than for the Hongkong and Shanghai Banking Corporation. In the United States, a strong performance in treasury activities as a steeper yield curve reduced funding costs, and a growth in average mortgage balances, drove an improvement in net interest margin.
HSBC is moving increasingly to differentiated product pricing. This competitive approach reflects the value to HSBC of its most loyal customers and has resulted in narrower spreads on a number of products, particularly mortgages and savings products. The benefit of this strategy is being seen in the mix and volume of HSBC’s core current account and savings products, particularly in the United Kingdom, Hong Kong and the United States.
40
Back to Contents
HSBC HOLDINGS PLC
| Year ended 31 December 2001 compared with year ended 31 December 2000 |
Net interest income in 2001 was US$1,002 million, or 7 per cent, higher than 2000 at US$14,725 million with a large part of this increase due to the inclusion for a full year of CCF. At constant exchange rates and excluding CCF, net interest income was 7 per cent higher than 2000 reflecting growth across all geographical regions.
In Europe, net interest income at US$5,563 million was US$575 million higher than in 2000 primarily due to the inclusion for a full year of CCF and improved spreads on treasury investment opportunities. Net interest income in Hong Kong at US$4,165 million was US$168 million higher than in 2000 reflecting growth in average customer deposits. Widening interest spreads, particularly on residential mortgages and treasury investment opportunities resulted in net interest income in North America increasing by US$265 million to US$2,450 million.
Average interest-earning assets at US$579.7 billion (of which US$55.4 billion relates to CCF) increased by US$63.5 billion, or 12 per cent. Excluding the effect of acquisitions, there was organic growth in Hong Kong driven principally by the placement of customer deposits, together with personal lending growth in the United Kingdom, the United States, Canada, Singapore, Taiwan, India and the Philippines.
At 2.54 per cent, HSBC’s net interest margin was 12 basis points lower than for 2000 mainly reflecting the impact of CCF’s lower margin business. In addition, for HSBC as a whole an increasingly liquid balance sheet, and a reduced benefit from net free funds as interest rates fell, also impacted the net interest margin. The fall in interest rates, however, improved the net interest margin in two of HSBC’s largest domestic operations in the United Kingdom and the United States as margins in our treasury activities widened as funding costs reduced. In Hong Kong, net interest margin in The Hongkong and Shanghai Banking Corporation was largely unchanged as a reduction in suspended interest, net of releases and recoveries, and improved margins on treasury activities offset the effects of a more liquid balance sheet the reduced benefit of net free funds and reduced interest spreads on Hong Kong dollar deposits. In Hang Seng Bank, the fall in net interest margin resulted primarily from a lower benefit from net free funds as interest rates fell.
HSBC is moving increasingly to differentiated product pricing. This competitive approach reflects the value to HSBC of our most loyal customers and has resulted in narrower spreads on a numbers of products, particularly mortgages and savings products. The benefit of this strategy is seen in the mix and volume of HSBC’s core current account and savings products, particularly in the United Kingdom, Hong Kong and the United States.
| | | Year ended 31 December 2002 | | Year ended 31 December 2001 | | Year ended 31 December 2000 | |
| | |
| |
| |
| |
| | | | US$m | | | % | | | US$m | | | % | | | US$m | | | % | |
| |
By geographical segment | | | | | | | | | | | | | | | | | | | |
| Europe | | | 6,272 | | | 54.8 | | | 6,056 | | | 53.0 | | | 5,922 | | | 53.5 | |
| Hong Kong | | | 1,917 | | | 16.7 | | | 1,852 | | | 16.2 | | | 1,790 | | | 16.2 | |
| Rest of Asia-Pacific | | | 1,174 | | | 10.2 | | | 1,137 | | | 10.0 | | | 1,085 | | | 9.8 | |
| North America | | | 1,502 | | | 13.1 | | | 1,495 | | | 13.1 | | | 1,338 | | | 12.1 | |
| South America | | | 596 | | | 5.2 | | | 880 | | | 7.7 | | | 932 | | | 8.4 | |
| | |
|
| |
|
| |
|
| |
|
| |
|
| |
|
| |
| | | | 11,461 | | | 100.0 | | | 11,420 | | | 100.0 | | | 11,067 | | | 100.0 | |
| | | | | |
| | | | |
| | | | |
| |
| Intra-HSBC elimination | | | (326 | ) | | | | | (257 | ) | | | | | (217 | ) | | | |
| | |
| | | | |
| | | | |
| | | | |
| Other operating income | | | 11,135 | | | | | | 11,163 | | | | | | 10,850 | | | | |
| | |
| | | | |
| | | | |
| | | | |
| | | Year ended 31 December | |
| | |
| |
Figures in US$m | | | 2002 | | | 2001 | | | 2000 | |
| |
By income category: | | | | | | | | | | |
| Dividend income | | | 278 | | | 186 | | | 197 | |
| Fees and commissions (net) | | | 7,824 | | | 7,470 | | | 7,311 | |
| Dealing profits | | | | | | | | | | |
| – foreign exchange | | | 1,167 | | | 1,120 | | | 965 | |
| – interest rate derivatives | | | 47 | | | 159 | | | 57 | |
| – debt securities | | | 75 | | | 311 | | | 281 | |
| – equities and other trading | | | 24 | | | 95 | | | 323 | |
| | | | | | | | | | | |
| | | | 1,313 | | | 1,685 | | | 1,626 | |
| | | | | | | | | | | |
| – operating leased assets rental income | | | 490 | | | 465 | | | 481 | |
| – general insurance underwriting (net) | | | 313 | | | 373 | | | 360 | |
| – increase in value of long-term insurance business | | | 182 | | | 251 | | | 195 | |
| – other | | | 735 | | | 733 | | | 680 | |
| | | | | | | | | | | |
| | | | 1,720 | | | 1,822 | | | 1,716 | |
| |
Total other operating income | | | 11,135 | | | 11,163 | | | 10,850 | |
| |
| |
41
Back to Contents
HSBC HOLDINGS PLC
Financial Review (continued)
|
| Analysis of fees and commissions receivable and payable |
| | | Year ended 31 December | |
Figures in US$m | | | 2002 | | | 2001 | | | 2000 | |
| |
| Account services | | | 1,715 | | | 1,620 | | | 1,536 | |
| Credit facilities | | | 752 | | | 628 | | | 613 | |
| Remittances | | | 268 | | | 246 | | | 225 | |
| Cards | | | 1,242 | | | 1,116 | | | 1,070 | |
| Imports/exports | | | 556 | | | 524 | | | 540 | |
| Underwriting | | | 173 | | | 135 | | | 119 | |
| Insurance | | | 775 | | | 668 | | | 570 | |
| Mortgage servicing rights | | | 77 | | | 78 | | | 69 | |
| Trust income | | | 125 | | | 114 | | | 185 | |
| Broking income | | | 773 | | | 928 | | | 1,208 | |
| Global custody | | | 296 | | | 308 | | | 291 | |
| Maintenance income on operating leases | | | 160 | | | 165 | | | 176 | |
| Funds under management | | | 1,026 | | | 965 | | | 822 | |
| Corporate finance | | | 122 | | | 115 | | | 271 | |
| Other | | | 1,185 | | | 1,146 | | | 882 | |
| |
Total fees and commissions receivable | | | 9,245 | | | 8,756 | | | 8,577 | |
| Less: fees payable | | | (1,421 | ) | | (1,286 | ) | | (1,266 | ) |
| |
Net fees and commissions | | | 7,824 | | | 7,470 | | | 7,311 | |
| |
| |
Other operating income (US$m) |

| Year ended 31 December 2002 compared with year ended 31 December 2001 |
Other operating income of US$11,135 million, was in line with that for 2001 both in nominal terms and in constant currency. In both Europe and South America the nominal movements in other operating income were primarily due to currency translation effects. Virtually all lines of other operating income demonstrated growth with the exception of equity market-related activities, namely broking income and custody fees.
Net fees and commissions at US$7,824 million represented 29 per cent of total operating income against 29 per cent in 2001 and were US$354 million, or 5 per cent, higher than in 2001. At constant exchange rates, net fees and commissions were 4 per cent higher than in 2001.
In Europe, fee income increased by US$318 million, or 7.5 per cent (3.1 per cent in constant currency), as growth in wealth management income, particularly in general and life insurance, private client, pensions and investment advisory business more than offset the lower levels of equity market-related fees. Within UK Banking, growth was achieved of 17 per cent in HSBC branded life, pensions and investment products sold through the tied salesforce, of 4 per cent in sales of life protection products and of 29 per cent in creditor protection insurance.
In North America, excluding the US$47 million increase relating to the acquisition of GFBital in Mexico, fee income was US$24 million higher than in 2001. Growth in fee income from the sale of annuities, mutual funds and across a range of banking services more than offset a lower level of broking income.
In Hong Kong, given the muted demand for credit products, significant emphasis was given to generating fee income. A combination of initiatives drove fee income US$92 million higher than in 2001. This was primarily due to strong growth in fees from the sale of unit trusts, including the sale of US$2.8 billion of HSBCs capital guaranteed funds, fees from credit cards, insurance and underwriting business. In addition, higher levels of fee income were earned from structured finance transactions.
HSBC’s operations in the rest of Asia Pacific grew fee income by US$43 million with strong growth in fee income from credit cards in Taiwan, Malaysia, Indonesia, the Middle East, Thailand and India.
In South America, fee income fell nominally by US$170 million, but by only US$27 million at constant exchange rates. The weakening economic environment reduced activity levels in areas where fees are generated, and in addition, the Brazilian Government moved to prohibit the charging of fees against certain accounts.
Dealing profits at US$1,313 million were US$372 million, or 22 per cent, lower than in 2001. Within this category foreign exchange earnings grew 4 per cent to US$1,167 million and continued to demonstrate resilience across all market conditions. The deterioration was primarily in the area of interest rate trading, with debt securities earnings US$236 million less as credit spreads on corporate bonds widened sharply as market confidence was undermined by low earnings growth and news of corporate scandals in the United States. Dealing profits were also impacted by weaknesses in the equity markets.
42
Back to Contents
HSBC HOLDINGS PLC
Fees in debt capital markets grew strongly by 30 per cent, or US$40 million, as HSBC improved its position in European markets.
| Year ended 31 December 2001 compared with year ended 31 December 2000 |
Other operating income in 2001 was US$313 million, or 3 per cent, higher than in 2000 at US$11,163 million and included other operating income of US$1,822 million. At constant exchange rates and excluding CCF, other operating income was 2 per cent higher than 2000 reflecting good growth in wealth management income which offset the falls in broking and other securities-related fee and commission income arising from the less favourable conditions in the equity markets.
Net fees and commissions at US$7,470 million represented 29 per cent of total operating income against 30 per cent in 2000 and were US$159 million, or 2 per cent, higher than 2000. At constant exchange rates and excluding CCF, net fees and commissions were 1 per cent higher than in 2000.
As part of HSBC’s competitive positioning and consistent with the pricing changes on loan and deposit products referred to above, its customers also benefited from a number of fee reductions during 2001, particularly in HSBC Bank plc’s UK Banking business.
In the United Kingdom, eliminating mortgage loan to valuation fees reduced revenues by US$7 million, dispensing with ATM withdrawal fees benefited customers by US$49 million, and overdraft fees fell by US$41 million as unauthorised overdrafts fell, as we have made it easier for customers to obtain authorised borrowings. Offsetting these reductions, UK Banking achieved good growth in wealth management with income rising by 9 per cent, reflecting increased income from life, pension and investment business, general insurance income and private clients.
In Hong Kong and the rest of Asia-Pacific, there was encouraging growth in wealth management income, particularly in fee income from the sale of unit trusts, reflecting the successful sale of capital-guaranteed products. Credit card fees grew by US$39 million, or 11 per cent, following the growth in the number of credit cards issued.
In the United States, the harmonisation of product lines between HSBC and the former Republic Bank of New York and the increase in volume of annuities sold contributed to the 15 per cent increase in fee income. In addition insurance revenues also increased by 44 per cent compared to 2000.
In South America, fee income benefited from the initiatives taken to increase wealth management revenue. Fee income in Brazil, at constant exchange rates, was US$79 million, or 28 per cent, higher with good growth in revenue from asset management activities and success in cross-sales to existing customers through the retails branch.
Revenues from investment banking, broking income, corporate finance activities and other securities-related activities were substantially lower than those earned in the buoyant equity markets during the first half of 2000.
Dealing profits held up well, despite less favourable conditions in the equity markets, as performance in debt securities and interest rate trading improved. Foreign exchange trading was bolstered by CCF.
43
Back to Contents
HSBC HOLDINGS PLC
Financial Review (continued)
|
| | | Year ended 31
December 2002 | | Year ended 31
December 2001 | | Year ended 31
December 2000 | |
| | | | US$m | | | % | | | US$m | | | % | | | US$m | | | % | |
| |
By geographical segment | | | | | | | | | | | | | | | | | | | |
| | | | | | | | | | | | | | | | | | |
| Europe | | | 7,878 | | | 51.6 | | | 7,288 | | | 49.0 | | | 6,518 | | | 47.3 | |
| Hong Kong | | | 2,139 | | | 14.0 | | | 2,140 | | | 14.4 | | | 1,986 | | | 14.4 | |
| Rest of Asia-Pacific | | | 1,528 | | | 10.0 | | | 1,397 | | | 9.4 | | | 1,292 | | | 9.4 | |
| North America | | | 2,675 | | | 17.5 | | | 2,540 | | | 17.1 | | | 2,396 | | | 17.3 | |
| South America | | | 1,060 | | | 6.9 | | | 1,497 | | | 10.1 | | | 1,602 | | | 11.6 | |
| | |
|
| |
|
| |
|
| |
|
| |
|
| |
|
| |
| | | | 15,280 | | | 100.0 | | | 14,862 | | | 100.0 | | | 13,794 | | | 100.0 | |
| | |
| |
| |
| |
| |
| |
| |
Goodwill amortisation | | | | | | | | | | | | | | | | | | | |
| Europe | | | 651 | | | | | | 632 | | | | | | 348 | | | | |
| Hong Kong | | | – | | | | | | – | | | | | | 1 | | | | |
| Rest of Asia-Pacific | | | 33 | | | | | | 8 | | | | | | 5 | | | | |
| North America | | | 146 | | | | | | 145 | | | | | | 143 | | | | |
| South America | | | 24 | | | | | | 14 | | | | | | 13 | | | | |
| | |
| | | | |
| | | | |
| | | | |
| | | | 854 | | | | | | 799 | | | | | | 510 | | | | |
| | |
| | | | |
| | | | |
| | | | |
| Intra-HSBC elimination | | | (326 | ) | | | | | (257 | ) | | | | | (217 | ) | | | |
| | |
| | | | |
| | | | |
| | | | |
| Total operating expenses | | | 15,808 | | | | | | 15,404 | | | | | | 14,087 | | | | |
| | |
| | | | |
| | | | |
| | | | |
| | | Year ended 31 December
| |
Figures in US$m | | | 2002 | | | 2001 | | | 2000 | |
| |
By expense category: | | | | | | | | | | |
| Staff costs | | | 8,609 | | | 8,553 | | | 8,057 | |
| Premises and equipment (excluding depreciation) | | | 1,824 | | | 1,639 | | | 1,480 | |
| Other administrative expenses | | | 3,331 | | | 3,279 | | | 2,959 | |
| |
Administrative expenses | | | 13,764 | | | 13,471 | | | 12,496 | |
| Depreciation and amortisation | | | | | | | | | | |
| – tangible fixed assets | | | 1,190 | | | 1,134 | | | 1,081 | |
| – goodwill | | | 854 | | | 799 | | | 510 | |
| |
| |
Total operating expenses | | | 15,808 | | | 15,404 | | | 14,087 | |
| |
| Cost: income ratio (excluding goodwill amortisation) | | | 56.2 | | | 56.4 | | | 55.3 | |
| |
Operating expenses (US$m) |

| Staff numbers (full-time equivalent) |
| | | As at 31 December
| |
| | | | 2002 | | | 2001 | | | 2000 | |
| |
| Europe | | | 72,260 | | | 73,326 | | | 69,629 | |
| Hong Kong | | | 23,786 | | | 24,654 | | | 24,204 | |
| Rest of Asia-Pacific | | | 28,630 | | | 26,259 | | | 22,919 | |
| North America | | | 34,207 | | | 19,291 | | | 19,201 | |
| South America | | | 25,522 | | | 27,519 | | | 25,671 | |
| |
| Total staff numbers | | | 184,405 | | | 171,049 | | | 161,624 | |
| |
| Year ended 31 December 2002 compared with year ended 31 December 2001 |
Operating expenses in 2002 were US$404 million, or 3 per cent, higher than in 2001. In addition to organic growth, the increase reflected the impact of the acquisitions made during 2002 and the full year impact of acquisitions and expansion of business activities in 2001, particularly in Asia Pacific and North America. In constant currency, excluding acquisitions made in 2002 and goodwill amortisation, cost growth was 2 per cent. Goodwill amortisation increased by US$55 million of which US$10 million reflected the amortisation of goodwill arising on GFBital for the one month of its ownership, and US$20 million was a one time charge to write- off the balance of the purchased goodwill on the Group’s insurance activities in Argentina.
In Europe, costs in 2002, excluding goodwill amortisation, increased by US$590 million compared with 2001. At constant exchange rates, costs in 2002, excluding goodwill amortisation, were US$265 million, or 3 per cent higher than in 2001. Of this increase in costs, acquisitions and changes in group structure accounted for US$165 million of the movement following the full consolidation of the Merrill Lynch HSBC business from July 2002 (US$45 million), and the acquisition of Demirbank and the Benkar card business in Turkey (US$120 million) The move to the Group’s new headquarters in Canary Wharf together with increases in vacant space provisioning consequential to that move, added US$76 million. Costs in the UK based investment banking operations were lower as headcount was adjusted to reflect market conditions.
In Hong Kong, costs in 2002, excluding goodwill amortisation, were in line with 2001. A fall in staff costs, following the transfer of back office processing functions to Group Service Centres in India and mainland China, and the non-recurrence of a pension top-up in Hang Seng Bank offset increases in costs associated with business expansion.
44
Back to Contents
HSBC HOLDINGS PLC
In the rest of Asia-Pacific, costs in 2002, excluding goodwill amortisation, increased by US$131 million, or 9 per cent compared with 2001. This growth in costs primarily reflected a higher staff complement in Group Service Centres in India and mainland China and the expansion of business in several countries in the region, in particular mainland China, Taiwan, the Middle East and in Australia through the acquisition of NRMA. During the year The Hongkong and Shanghai Banking Corporation opened eight new branches in the Asia Pacific region.
Operating expenses in North America, excluding goodwill amortisation, increased by US$135 million, or 5 per cent, in 2002. This increase was largely driven by the impact of the acquisition of GFBital and the costs associated with the establishment of the WTAS business in the United States. A reduction in the costs associated with ongoing development of hsbc.com offset additional costs relating to the closure of the institutional equity business in Canada and the restructuring of the merchant banking business in the United States.
In South America, operating expenses, excluding goodwill amortisation, fell by US$437 million, or 29 per cent, during 2002. At constant exchange rates operating expenses, excluding goodwill amortisation, were 4 per cent higher than in 2001. The increase related to industry-wide union agreed salary adjustments in Brazil and costs of severance as headcount reductions were made in the recessionary environment.
Year ended 31 December 2001 compared with year ended 31 December 2000
Operating expenses were US$1,317 million higher than in 2000. This increase was mainly driven by the recent acquisitions together with a related US$289 million increase in goodwill amortisation.In Europe, costs, excluding goodwill amortisation, increased by US$770 million compared with 2000 and included US$128 million of restructuring costs. At constant exchange rates, costs in 2001, excluding goodwill amortisation, were US$1,023 million, or 16 per cent, higher than in 2000, of which the inclusion of CCF’s cost base accounted for US$769 million. Business expansion and increased information technology-related expenditure to support business development projects lay at the heart of the cost increase.
In Hong Kong, costs in 2001, excluding goodwill amortisation, increased by US$154 million, or 8 per cent, compared with 2000. Staff costs increased by 10 per cent mainly to support business expansion in personal financial services, particularly in credit card and Mandatory Provident Fund products. Operating expenses, other than staff costs, rose by 5 per cent to support wealth management expansion and the development of e-banking initiatives.
In the rest of Asia-Pacific, operating expenses, excluding goodwill amortisation, increased by US$105 million, or 8 per cent, compared to 2000. At constant exchange rates, the increase was 16 per cent. Recent acquisitions accounted for some US$31 million of the cost increase. The remaining growth in costs reflected higher staff numbers to support business expansion, particularly in personal financial services and wealth management initiatives together with a doubling of complement in our shared service centres in India and mainland China.
Operating costs, excluding goodwill amortisation, in North America were US$144 million, or 6 per cent, higher than in 2000. Of this increase, US$164 million related to development costs associated with hsbc.com. The underlying change in operating costs was a decrease of 1 per cent. This principally reflected a 2 per cent fall in the domestic cost base of HSBC Bank USA with a reduced level of restructuring charges offset by business expansion costs.
In South America, operating expenses at constant exchange rates were US$133 million, or 10 per cent, higher than in 2001. This mainly reflected the acquisition of CCF Brazil and restructuring costs. As economic conditions become less certain in the region, further cost controls were put in place to restrain cost growth.
The Group’s global processing initiatives continue to develop with some 2000 staff employed at HSBC’s global processing centres in mainland China and India at 31 December 2001.
HSBC’s cost: income ratio, excluding goodwill amortisation, was 56.4 per cent in 2001, reflecting the cost structure of new acquisitions and investment in the expanding wealth management businesses and IT.
45
Back to Contents
HSBC HOLDINGS PLC
Financial Review (continued)
|
Provisions for bad and doubtful debts |
| | | Year ended 31 December 2002 | | Year ended 31 December 2001 | | Year ended 31 December 2000 | |
| | | | US$m | | | % | | | US$m | | | % | | | US$m | | | % | |
| |
By geographical segment: | | | | | | | | | | | | | | | | | | | |
| Europe | | | 569 | | | 43.1 | | | 441 | | | 21.6 | | | 348 | | | 37.3 | |
| Hong Kong | | | 246 | | | 18.6 | | | 197 | | | 9.7 | | | 248 | | | 26.6 | |
| Rest of Asia-Pacific | | | | | | | | | | | | | | | | | | | |
| – normal | | | 89 | | | 6.7 | | | 172 | | | 8.4 | | | 159 | | | 17.1 | |
| – release of special general provision | | | – | | | – | | | – | | | – | | | (174 | ) | | (18.7 | ) |
| North America | | | 300 | | | 22.7 | | | 300 | | | 14.7 | | | 157 | | | 16.9 | |
| South America | | | | | | | | | | | | | | | | | | | |
| – normal | | | 313 | | | 23.7 | | | 327 | | | 16.1 | | | 194 | | | 20.8 | |
| – additional general provision against Argentine exposures | | | (196 | ) | | (14.8 | ) | | 600 | | | 29.5 | | | – | | | – | |
| |
| | | | 1,321 | | | 100.0 | | | 2,037 | | | 100.0 | | | 932 | | | 100.0 | |
| |
Of the charge for 2000, US$2 million related to bank advances. |
The charge for customer bad and doubtful debts and non-performing customer loans and related provisions can be analysed as follows:
2002 | | | Europe | | | Hong
Kong | | | Rest of
Asia-Pacific | | | North America | | | South America | | | Total | |
|
| | | | US$m | | | US$m | | | US$m | | | US$m | | | US$m | | | US$m | |
| New specific provisions | | | 963 | | | 528 | | | 400 | | | 399 | | | 388 | | | 2,678 | |
| Release of provisions no longer required | | | (271 | ) | | (160 | ) | | (268 | ) | | (79 | ) | | (48 | ) | | (826 | ) |
| Recoveries of amounts previously written-off | | | (58 | ) | | (25 | ) | | (52 | ) | | (35 | ) | | (10 | ) | | (180 | ) |
| |
| | | | 634 | | | 343 | | | 80 | | | 285 | | | 330 | | | 1,672 | |
| |
| General provisions | | | | | | | | | | | | | | | | | | | |
| – Argentine additional provision | | | – | | | – | | | – | | | – | | | (196 | ) | | (196 | ) |
| – other | | | (65 | ) | | (97 | ) | | 9 | | | 15 | | | (17 | ) | | (155 | ) |
| | | | (65 | ) | | (97 | ) | | 9 | | | 15 | | | (213 | ) | | (351 | ) |
| |
| Total for 2002 | | | 569 | | | 246 | | | 89 | | | 300 | | | 117 | | | 1,321 | |
| |
| 31 December 2002 | | | | | | | | | | | | | | | | | | | |
| Non-performing loans | | | 4,495 | | | 1,724 | | | 2,055 | | | 1,773 | | | 476 | | | 10,523 | |
| Provisions | | | 3,645 | | | 1,143 | | | 1,496 | | | 2,356 | | | 477 | | | 9,117 | |
| 2001 | | | Europe | | | Hong
Kong | | | Rest of
Asia-Pacific | | | North America | | | South America | | | Total | |
| |
| | | | US$m | | | US$m | | | US$m | | | US$m | | | US$m | | | US$m | |
| | | | | | | | | | | | | | | | | | | | |
| New specific provisions | | | 802 | | | 449 | | | 577 | | | 392 | | | 346 | | | 2,566 | |
| Release of provisions no longer required | | | (260 | ) | | (212 | ) | | (268 | ) | | (42 | ) | | (35 | ) | | (817 | ) |
| Recoveries of amounts previously written-off | | | (65 | ) | | (31 | ) | | (138 | ) | | (43 | ) | | (8 | ) | | (285 | ) |
| |
| | | | 477 | | | 206 | | | 171 | | | 307 | | | 303 | | | 1,464 | |
| |
| General provisions | | | | | | | | | | | | | | | | | | | |
| – Argentine additional provision | | | – | | | – | | | – | | | – | | | 600 | | | 600 | |
| – other | | | (36 | ) | | (9 | ) | | 1 | | | (7 | ) | | 24 | | | (27 | ) |
| |
| | | | (36 | ) | | (9 | ) | | 1 | | | (7 | ) | | 624 | | | 573 | |
| |
| Total for 2001 | | | 441 | | | 197 | | | 172 | | | 300 | | | 927 | | | 2,037 | |
| |
| 31 December 2001 | | | | | | | | | | | | | | | | | | | |
| Non-performing loans | | | 3,682 | | | 2,028 | | | 2,723 | | | 672 | | | 544 | | | 9,649 | |
| Provisions | | | 3,045 | | | 1,408 | | | 1,952 | | | 723 | | | 1,033 | | | 8,161 | |
| |
| 2000 | | | Europe | | | Hong
Kong | | | Rest of
Asia-Pacific | | | North America | | | South America | | | Total | |
| |
| | | | US$m | | | US$m | | | US$m | | | US$m | | | US$m | | | US$m | |
| New specific provisions | | | 607 | | | 454 | | | 543 | | | 395 | | | 232 | | | 2,231 | |
| Release of provisions no longer required | | | (248 | ) | | (192 | ) | | (321 | ) | | (72 | ) | | (28 | ) | | (861 | ) |
| Recoveries of amounts previously written-off | | | (56 | ) | | (15 | ) | | (49 | ) | | (31 | ) | | (9 | ) | | (160 | ) |
| |
| | | | 303 | | | 247 | | | 173 | | | 292 | | | 195 | | | 1,210 | |
| |
| General provisions | | | | | | | | | | | | | | | | | | | |
| – special provision reflecting Asian risk raised in 1997 | | | – | | | – | | | (174 | ) | | – | | | – | | | (174 | ) |
| – other | | | 43 | | | 1 | | | (14 | ) | | (135 | ) | | (1 | ) | | (106 | ) |
| |
| | | | 43 | | | 1 | | | (188 | ) | | (135 | ) | | (1 | ) | | (280 | ) |
| |
| Total for 2000 | | | 346 | | | 248 | | | (15 | ) | | 157 | | | 194 | | | 930 | |
| |
| 31 December 2000 | | | | | | | | | | | | | | | | | | | |
| Non-performing loans | | | 3,376 | | | 2,521 | | | 3,081 | | | 684 | | | 710 | | | 10,372 | |
| Provisions | | | 2,995 | | | 1,802 | | | 2,091 | | | 739 | | | 540 | | | 8,167 | |
| |
46
Back to Contents
HSBC HOLDINGS PLC
| Year ended 31 December 2002 compared with year ended 31 December 2001 |
HSBC’s customer loan portfolio continued to be well-spread both geographically and across personal and industrial sectors during 2002. The loan portfolio at constant exchange rates and excluding loans to the financial sector, grew by US$31.5 billion, or 11 per cent, during 2002 of which US$9.4 billion, or 3 per cent, arose from the acquisition of GFBital in Mexico. The personal loan sector of the Group’s loan portfolio increased to 42 per cent of the aggregate at the end of 2002 compared to 40 per cent at the end of 2001. At constant exchange rates, there was growth of US$19.5 billion mainly in Europe, North America and Asia. Of this increase, US$14.2 billion arose from residential mortgage lending.
The other main change in HSBC’s loan portfolio in terms of concentration risk and asset quality related to incorporating the domestic Mexican loan book of GFBital. 13 per cent of GFBital’s loan book of US$9.7 billion is non-performing including a significant proportion of residential mortgage loans and unsecured personal loans. These assets became impaired during the Mexican economic crisis in the late 1990s. In addition, approximately 40 per cent of GFBital’s loan exposures are peso-denominated Mexican Government risk. GFBital also has impaired assets in the agriculture and other government-supported sectors. As part of the fair value exercise carried out as at the date of acquisition of GFBital, these loan assets were critically reviewed and restated where necessary to conform with the requirements of both UK GAAP and US GAAP.
Excluding GFBital, there was a decrease in the level of non-performing loans during 2002 of US$350 million due to a combination of write-offs, recoveries and upgradings in Hong Kong and a number of other Asian countries. This was partly offset by a rise of US$813 million in non-performing loans in Europe. This related primarily to a small number of individual corporate loans in the telecommunications, private healthcare, leisure and manufacturing sectors and was not indicative of a general trend. Importantly, credit quality on consumer lending remained stable. In South America, in local currency terms there was a sharp increase in the level of non-performing loans in Argentina as individual accounts migrated to non-performing status as the economic crisis deepened. Almost three-quarters of the non-government loan book is now classified as non-performing. The impact of this migration was recognised in the general provision established at the end of 2001 within which the deterioration noted was covered.
Aggregate customer bad and doubtful debt provisions at 31 December 2002 of US$9.1 billion represented 2.52 per cent of gross customer advances compared with 2.57 per cent at 31 December 2001.
As in 2001, HSBC’s cross-border exposures did not necessitate significant provisions.
There were no significant changes to the Group’s procedures for determining the various components of the provision for bad and doubtful debts.
The main components of the decrease in the customer loans bad debt charge were:
| • | New specific provisions increased by US$112 million, or 4 per cent, principally driven by: |
| | |
| i. | new provisions in Europe which were US$161 million higher than in 2001, reflecting an increase in non-performing loans in the UK. In UK Banking, there was an increase in specific provisions relating to a small number of corporate exposures in the telecommunications, private healthcare, leisure and manufacturing sectors. These provisions are assessed on a case-by-case basis. By contrast, provisions for UK personal customers were lower than in 2001 as credit quality remained stable and increased debt counselling services proved effective. Provisioning against such unsecured loans is determined on a formula based, inter alia, on the number of days delinquent. There were no major changes made during the year to the assumptions used. The level of new specific provisions against residential mortgages in Europe remained very low. |
| | |
| ii. | new specific provisions in the rest of Asia-Pacific decreased by US$177 million compared with 2001 reflecting the fall in non-performing loans. In Indonesia and Malaysia, significantly lower new provisions were raised, particularly against commercial and corporate borrowers, as the economic conditions in these countries improved. In the Middle East, new provisions required on the corporate loan book were lower following economic growth in the UAE and strengthened credit control systems. These factors helped reduce delinquencies and as a result the level of new provisions on consumer lending. |
47
Back to Contents
HSBC HOLDINGS PLC
Financial Review (continued)
|
| | |
| iii. | new corporate provisions in Hong Kong declined by US$48 million reflecting a reduction in non-performing loans. As the economy remained in deflation, high levels of unemployment and the impact of new bankruptcy laws significantly increased the incidence of personal bankruptcy filings leading to an increase of US$127 million in new provisions against personal lending, principally on credit cards. |
| | |
| • | In aggregate, releases and recoveries decreased by US$96 million compared with 2001. 2001 benefited from exceptional recoveries against an historical Olympia and York exposure and from successful restructuring and recoveries achieved in Malaysia on corporate and commercial loans impaired during the Asian economic crisis in the late 1990s. |
| | |
| • | Excluding Argentina, there was a net release of general provisions of US$155 million compared with a release of US$27 million in 2001. There was a release of US$97 million in Hong Kong reflecting a reduction in estimated latent loan losses at 31 December 2002. The estimate of these latent losses reflects the group’s historical experience of the rate at which such losses occur and are identified, on the structure of the credit portfolio and the economic and credit conditions prevailing at the balance sheet date. In the UK there was a release of some US$50 million of general provisions as a number of corporate borrowers which had been causing concern at the 2001 year end were specifically provisioned against in 2002. In Argentina, an additional general provision of US$600 million (at constant exchange rates, US$292 million) was raised at the end of 2001. In 2002, US$196 million of specific impairments were raised and the general provision requirement w as reduced accordingly. As individual loans have become impaired, this has caused an underlying increase in the level of non-performing loans in South America. The loss experience on corporate credit in Argentina during 2002 has confirmed that the level of general provisions established in 2001 was appropriate. At the end of 2002, specific and general provisions together continued to cover about 60 per cent of non-government loans in Argentina. |
| | |
| Year ended 31 December 2001 compared with year ended 31 December 2000 |
HSBC’s loans and advances to customers were spread across the various industrial sectors, as well as geographically. At constant exchange rates, the loan portfolio (excluding the financial sector and settlement accounts) grew by US$16.4 billion, or 6 per cent, during 2001. Within this growth, personal lending grew by US$11.5 billion, or 10 per cent, and loans to the commercial and corporate customer base grew by US$4.9 billion, or 3 per cent. The personal loan sector of the Group’s loan portfolio increased to 40 per cent at the end of 2001 compared to 39 per cent at the end of 2001. Residential mortgage lending and other personal lending contributed US$6.5 billion and US$3.4 billion respectively to this growth.
The main change in HSBC’s loan portfolio in terms of concentration risk related to the expansion of the personal lending portfolio. In terms of asset quality, the main change was the substantially increased risk within the portfolio subsequent to the collapse in economic conditions in Argentina following its default on sovereign debt.
There was a decrease in non-performing loans of US$723 million during 2001 due to a combination of write-offs and recoveries in Hong Kong and in the rest of Asia-Pacific, including the recoveries against a historical Olympia and York exposure. In South America, there was an increase in the level of non-performing loans in local currency terms in Brazil reflecting both targeted growth in consumer lending and a weaker economy. In Argentina, there was an increase in non-performing loans during the year due to the economic deterioration although this was offset by all fully provided loans being written-off. As at 31 December 2001, the impact of the economic crisis had not yet caused individual accounts to become non-performing against contractual terms.
In terms of non-performing loans, overall credit quality in North America remained stable in 2001.
Aggregate customer bad and doubtful debt provisions at 31 December 2001 were in line with 31 December 2000 and at US$8.2 billion represented 2.57 per cent of gross customer advances compared with 2.73 per cent at 31 December 2000.
During 2001, HSBC’s cross-border exposures did not necessitate significant provisions.
48
Back to Contents
HSBC HOLDINGS PLC
There were no significant changes to HSBC’s procedures for determining the various components of the provision for bad and doubtful debts. |
| |
| The main components of the increase in the bad debt charge were: |
| | |
| • | New specific provisions increased by 15 per cent, or US$335 million, which was principally driven by: |
| | |
| i. | new provisions in Europe which were US$195 million higher than in 2000. This reflected a full year charge for bad and doubtful debts of US$178 million for CCF for the first time. This charge mainly arose on corporate borrowers in the airline and leisure industries. In UK Banking, lower levels of new specific provision were raised for consumer loans in First Direct and on credit card advances but new provisions for commercial loans were slightly higher and mainly reflected problems seen in the manufacturing sector. Although underlying credit quality remained stable both in the UK and in France, there was some weakening of business confidence and a rise in non-performing loans of US$290 million. |
| | |
| ii. | new specific provisions rose by US$114 million in South America. This reflected the growth in the consumer lending portfolio in Brazil, for which provisions are determined on a formula based on the number of days delinquency. New specific provisions rose by US$64 million in Argentina as the impact of the economic turmoil caused some increase in the level of non-performing loans. |
| | |
| • | The other major factor contributing to the rise in the bad debt charge was the US$600 million additional general provision raised for Argentina. This reflected the severe economic deterioration and unprecedented political and economic uncertainty, with government default on foreign currency debt and on a more generalised breakdown of the economic and political structures of the country, manifested most immediately in a sharp rise in unemployment. Management judged that the severity of losses incurred in Argentina was somewhat higher than had been experienced in the Asian crisis of 1998 and that, taking into account all these factors the probable inherent loss in its Argentine non-government loan portfolio approximated 60 per cent of outstanding customer loans and the additional general provision increased the provision coverage to this level. There was also a modest release of general provisions in the private bank in Switzerland in view of the improved l oss experience in the book. |
| | |
| | During 2000, there had been a release of US$174 million of the special general provision reflecting Asian risk raised in 1997. |
| | |
| • | In aggregate, releases and recoveries were US$81 million higher than in 2000. Both years benefited from the releases and recoveries on problem loans which had been impaired during the Asian economic crisis in 1998 and 1999 although there was also a significant recovery and release on Olympia and York in 2001. |
| |
| Provisions for bad and doubtful debts as a percentage of average gross loans and advances to customers |
| | | | Europe | | | Hong Kong | | | Rest of Asia Pacific | | | North America | | | South America | | | Total | |
| | | | % | | | % | | | % | | | % | | | % | | | % | |
Year ended 31 December 2002 | | | | | | | | | | | | | | | | | | | |
| New provisions | | | 0.62 | | | 0.75 | | | 1.13 | | | 0.51 | | | 9.97 | | | 0.78 | |
| Releases and recoveries | | | (0.21 | ) | | (0.26 | ) | | (0.90 | ) | | (0.15 | ) | | (1.48 | ) | | (0.29 | ) |
| |
| Net charge for specific provisions | | | 0.41 | | | 0.49 | | | 0.23 | | | 0.36 | | | 8.49 | | | 0.49 | |
| Total provisions charged | | | 0.37 | | | 0.35 | | | 0.25 | | | 0.38 | | | 3.01 | | | 0.38 | |
| Amounts written off net of recoveries | | | 0.25 | | | 0.72 | | | 1.55 | | | 0.41 | | | 3.91 | | | 0.56 | |
| |
| Year ended 31 December 2001 | | | | | | | | | | | | | | | | | | | |
| New provisions | | | 0.60 | | | 0.66 | | | 1.85 | | | 0.55 | | | 5.72 | | | 0.82 | |
| Releases and recoveries | | | (0.24 | ) | | (0.36 | ) | | (1.31 | ) | | (0.12 | ) | | (0.71 | ) | | (0.35 | ) |
| |
| Net charge for Specific provisions | | | 0.36 | | | 0.30 | | | 0.54 | | | 0.43 | | | 5.01 | | | 0.47 | |
| Total provisions charged | | | 0.33 | | | 0.29 | | | 0.55 | | | 0.42 | | | 15.36 | | | 0.65 | |
| Amounts written off net of Recoveries | | | 0.28 | | | 0.88 | | | 0.93 | | | 0.39 | | | 5.78 | | | 0.61 | |
| |
| Year ended 31 December 2000 | | | | | | | | | | | | | | | | | | | |
| New provisions | | | 0.53 | | | 0.68 | | | 1.70 | | | 0.66 | | | 4.07 | | | 0.81 | |
| Releases and recoveries | | | (0.28 | ) | | (0.31 | ) | | (1.16 | ) | | (0.17 | ) | | (0.65 | ) | | (0.39 | ) |
| Net charge for Specific provisions | | | 0.25 | | | 0.37 | | | 0.54 | | | 0.49 | | | 3.42 | | | 0.42 | |
| Total provisions charged | | | 0.28 | | | 0.37 | | | (0.05 | ) | | 0.26 | | | 3.39 | | | 0.32 | |
| Amounts written off net of Recoveries | | | 0.35 | | | 0.64 | | | 1.39 | | | 0.45 | | | 1.43 | | | 0.58 | |
49
Back to Contents
HSBC HOLDINGS PLC
Financial Review (continued)
|
| |
| |
| |
| |
| Gains on disposals of investments |
| | | Year ended 31 December
| |
Figures in US$m | | | 2002 | | | 2001 | | | 2000 | |
| |
| Gains/(losses) on disposal of: | | | | | | | | | | |
| – equity investments | | | 226 | | | 305 | | | 228 | |
| – debt securities | | | 170 | | | 170 | | | 66 | |
| – part of a business | | | – | | | – | | | (11 | ) |
| – other participating interests | | | 69 | | | 4 | | | (11 | ) |
| – associates | | | 47 | | | 257 | | | – | |
| – subsidiaries | | | 16 | | | 21 | | | – | |
| – other | | | 4 | | | (3 | ) | | 30 | |
| |
| | | | 532 | | | 754 | | | 302 | |
| |
| |
| |
| |
| Year ended 31 December 2002 compared with year ended 31 December 2001 |
During 2002, HSBC made 23 business acquisitions and completed 20 business disposals.
HSBC’s European results included US$213 million of profits on the sales of securities from investment portfolios, principally as HSBC adjusted its exposure to interest rates. CCF also disposed of its 50 per cent stake in Lixxbail to its joint venture partner generating a profit of US$39 million.
In the United States, gains were taken in the first half of the year, on the sales of a number of mortgage-backed and other debt securities as long-term portfolios were adjusted to respond to exposures to interest rates and sovereign credit.
HSBC’s South American results include a gain of US$38 million on the sale of HS BC’s 6.99 per cent stake in Banco Santiago S.A.
Year ended 31 December 2001 compared with year ended 31 December 2000
During 2001, HSBC made 15 business acquisitions and completed 10 business disposals.
Gains on disposals of investments of US$754 million included a profit of US$200 million on the sale of HSBC’s stake in British Interactive Broadcasting (‘BiB’) to BSkyB.
HSBC’s European results were bolstered by gains on the disposal of the stake in Quilter and by profits in Germany on the sale of the majority stake in our fledgling internet broker Pulsiv and ERGO.
In Hong Kong HSBC made gains on the sale of HSBC’s investment in Modern Terminals Limited and the disposal of our 50 per cent stake in Central Registration Hong Kong Limited to the other 50 per cent shareholder, Computershare.
In the United States, HSBC realised significant gains, substantially in the first half of the year, on the sale of a number of mortgage-backed and other debt securities as long-term portfolios were adjusted to respond to changed economic circumstances, particularly the potential loss of value from mortgage refinancing. Simi lar, but smaller gains were achieved in other locations.
| | | Year ended 31 December
| |
Figures in US$m | | | 2002 | | | 2001 | * | | 2000 | * |
| |
| UK corporation tax charge | | | 684 | | | 416 | | | 856 | |
| Overseas taxation | | | 1,217 | | | 1,570 | | | 1,468 | |
| Joint ventures | | | (6 | ) | | (13 | ) | | (7 | ) |
| Associates | | | 17 | | | 26 | | | (1 | ) |
| | |
|
| |
|
| |
|
| |
| Current taxation | | | 1,912 | | | 1,999 | | | 2,316 | |
| | | | | | | | | |
| Origination and reversal of timing differences | | | 615 | | | (176 | ) | | 89 | |
| Effect of decreased tax rate on opening asset | | | – | | | 3 | | | 4 | |
| Adjustment in respect of prior periods | | | 7 | | | 162 | | | – | |
| | |
|
| |
|
| |
|
| |
| Deferred taxation | | | 622 | | | (11 | ) | | 93 | |
| | | | | | | | | |
| Total charge for taxation | | | 2,534 | | | 1,988 | | | 2,409 | |
| |
| Effective taxation (per cent) | | | 26.3 | | | 24.9 | | | 24.6 | |
| Standard UK corporation tax rate (per cent) | | | 30.0 | | | 30.0 | | | 30.0 | |
| |
| |
Analysis of overall tax charge |
| | | Year ended 31 December
| |
Figures in US$m | | | 2002 | | | 2001 | * | | 2000 | * |
| |
| Taxation at UK corporate tax rate of 30.0% (2001:30.0% 2000: 30.0%) | | | 2,895 | | | 2,400 | | | 2,932 | |
| Impact of differently taxed overseas profits in principal locations | | | (472 | ) | | (616 | ) | | (498 | ) |
| Tax free gains | | | (19 | ) | | (102 | ) | | (15 | ) |
| Argentine losses | | | 87 | | | 336 | | | — | |
| Goodwill amortisation | | | 261 | | | 263 | | | 172 | |
| Prior period adjustments | | | (90 | ) | | (167 | ) | | (48 | ) |
| Other items | | | (128 | ) | | (126 | ) | | (134 | ) |
| | |
|
| |
|
| |
|
| |
| Overall tax charge | | | 2,534 | | | 1,988 | | | 2,409 | |
| |
| |
| | |
| * | The figures for 2001 and 2000 have been restated to reflect the adoption of UK Financial Reporting Standard 19 ‘Deferred Tax’, details of which are set out in Note 1 on pages 195 to 197. |
50
Back to Contents
HSBC HOLDINGS PLC
| Year ended 31 December 2002 compared with year ended 31 December 2001 |
HSBC Holdings and its subsidiary undertakings in the United Kingdom provided for UK corporation tax at 30 per cent, the rate for the calendar year 2002 (2001: 30 per cent).
Overseas tax included Hong Kong profits tax of US$408 million (2001: US$450 million) provided at a rate of 16 per cent (2001: 16 per cent) on the profits assessable in Hong Kong. Other overseas taxation was provided for in the countries of operation at the appropriate rates of taxation.
HSBC’s effective tax rate of 26.3 per cent in 2002 was higher than that for 2001 (24.9 per cent) mainly as a result of the geographic mix of profits and certain non-recurring items which occurred in 2001 and resulted in a reduction in the 2001 rate.
In particular, profits arising in North America represented a higher percentage of HSBC’s profits in 2002 compared to 2001 because profits in the US were abnormally suppressed in 2001 by the provision relating to the Princeton Note settlement. US profits are taxed at a higher rate than the average for the rest of the group and thus this change in mix raised the overall tax rate of the group.
One-off tax-free gains arising in 2002 were less than those arising in 2001.
Partly offsetting these factors, no tax relief was assumed in respect of the bad debt provision and other losses relating to Argentina. These losses and provisions were lower in 2002 than in 2001. This had the effect of increasing the aggregate tax rate in both 2002 and 2001 but by a lesser degree in 2002.
In 2002, prior year adjustments mainly relating to audit settlements, which resulted in a reduction in the tax rate, were less than similar adjustments in 2001.
At 31 December 2002 there were potential future tax benefits of US$885 million (2001: US$906 million) in respect of trading losses, allowable expenditure charged to the profit and loss account but not yet allowable for tax, and capital losses which had not yet been recognised because realisation of the benefits was not considered certain.
| Year ended 31 December 2001 compared to year ended 31 December 2000 |
HSBC Holdings and its subsidiary undertakings in the United Kingdom provided for UK corporation tax at 30 per cent, the rate for the calendar year 2001 (2000: 30 per cent).
Overseas tax included Hong Kong profits tax of US$450 million (2000: US$478 million) provided at a rate of 16 per cent (2000: 16 per cent) on the profits assessable in Hong Kong. Other overseas taxation was provided for in the countries of operation at the appropriate rates of taxation.
HSBC’s effective tax rate of 24.9 per cent in 2001 was in line with that for 2000 (24.6 per cent) although there were several factors either increasing or reducing the rate.
Profits arising in North America represented a lower percentage of HSBC ’s profits in 2001 compared to 2000 because the profits in the US were suppressed in 2001 by the provision relating to the Princeton Note settlement. Because these profits are taxed at a higher rate than the average for the rest of the group this reduces the overall group tax rate in 2001.
One-off tax-free gains arose in 2001 and these were greater than those arising in 2000.
No tax relief has been assumed for the 2001 bad debt provision relating to Argentina. This increases the 2001 tax rate.
In 2001 certain prior year adjustments mainly relating to audit settlements resulted in a reduction in the tax rate. There were similar adjustments in 2001 which resulted in a lower reduction in the tax rate.
At 31 December 2001 there were potential future tax benefits of US$906m (2000: US$350m) in respect of trading losses, allowable expenditure charged to the profit and loss account but not yet allowable for tax and capital losses which have not yet been recognised because realisation of the benefits is not considered certain.
51
Back to Contents
HSBC HOLDINGS PLC
Financial Review (continued)
|
| | | At 31 December 2002
| | At 31 December 2001
| |
| | | | US$m | | | % | | | US$m | | | % | |
| |
| Loans and advances to customers | | | 352,344 | | | 47.1 | | | 308,649 | | | 44.9 | |
| Loans and advances to banks | | | 95,496 | | | 12.7 | | | 104,641 | | | 15.2 | |
| Debt securities | | | 175,730 | | | 23.4 | | | 160,579 | | | 23.4 | |
| Treasury bills and other eligible bills | | | 18,141 | | | 2.4 | | | 17,971 | | | 2.6 | |
| Equity shares | | | 8,213 | | | 1.1 | | | 8,057 | | | 1.2 | |
Intangible fixed assets | | | 17,163 | | | 2.3 | | | 14,564 | | | 2.1 | |
| Other | | | 82,714 | | | 11.0 | | | 73,147 | | | 10.6 | |
| | |
|
| |
|
| |
|
| |
|
| |
| | | | 749,801 | | | 100.0 | | | 687,608 | | | 100.0 | |
| | | | | |
| | | | |
| |
| | | | | | | | | | | | |
| Hong Kong SAR Government certificates of indebtedness | | | 9,445 | | | | | | 8,637 | | | | |
| | |
| | | | |
| | | | |
| Total assets | | | 759,246 | | | | | | 696,245 | | | | |
| | |
| | | | |
| | | | |
| Loans and advances to customers include: | | | | | | | | | | | | | |
| – reverse repos | | | 12,545 | | | | | | 14,823 | | | | |
| – settlement accounts | | | 8,385 | | | | | | 11,761 | | | | |
| Loans and advances to banks include: | | | | | | | | | | | | | |
| – reverse repos | | | 18,736 | | | | | | 10,926 | | | | |
| – settlement accounts | | | 4,717 | | | | | | 4,433 | | | | |
| |
Asset 2002 (excluding Hong Kong Government certificates of indebtedness)
|

Assets 2001 (excluding Hong Kong Government certificates of indebtedness)*
|
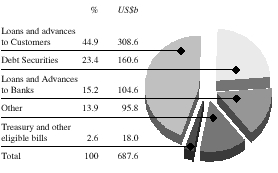
| * | The figures for 2001 have been restated to reflect the adoption of UK Financial Reporting Standard 19 ‘Deferred Tax’, details of which are set out in Note 1 on pages 195 to 197. |
| |
| |
| |
| 31 December 2002 compared with 31 December 2001 |
HSBC’s total assets at 31 December 2002 were US$759 billion, an increase of US$63 billion, or 9 per cent, since 31 December 2001; at constant exchange rates, the increase was US$29 billion, or 4 per cent. US$23 billion or 74 per cent of this growth was attributable to acquisitions, of which US$22 billion resulted from the acquisition of GFBital.
HSBC’s balance sheet remained highly liquid, reflecting further strong growth in customer deposits and limited credit demand in some countries. Approximately 47 per cent of the balance sheet was deployed in customer loans and advances which was 2 per cent higher than as at 31 December 2001.
At constant exchange rates, gross loans and advances to customers (excluding loans to the financial sector) at 31 December 2002 were US$32 billion, or 11 per cent, higher than at 31 December 2001. Of this growth US$9.7 billion reflected the acquisition of GFBital. Excluding the impact of GFBital, personal lending grew by 15 per cent and constituted 88 per cent of the organic growth in lending outside the financial sector, with strong organic growth in the UK, United States, Malaysia, Taiwan, Korea, Singapore and India. Personal lending now constitutes 42 per cent of gross customer lending at 31 December 2002, compared with 39 per cent at 31 December 2001. Loans and advances to the commercial and corporate customer base (excluding Governments) grew by 3 per cent and reflected muted loan demand from this sector.
At 31 December 2002, assets held by the Group as custodian amounted to US$1,350 billion. Custody is the safe-keeping and administration of securities and financial instruments on behalf of others. Funds under management amounted to US$306 billion at 31 Dece mber 2002.
Debt securities and equity shares |
Continuing reductions in interest rates, particularly in the United States have contributed to debt securities held in the accruals book at 31 December 2002 being recognised in the accounts at an amount net of off-balance- sheet hedges, of US$1,278 million less than market value, compared with an unrecognised gain of US$885 million at 31 December 2001. Equity shares included US$4,833 million held on investment account, compared with US$4,755 million at 31 December 2001, on which there was a further unrecognised gain of US$406 million compared with US$539 million at 31 December 2001.
52
Back to Contents
HSBC HOLDINGS PLC
Funds under management of US$306 billion were US$22 billion, or 8 per cent, higher than at 31 December 2001.
During the year, both HSBC’s asset management and private banking businesses attracted net funds inflows. The weakening of the US dollar on our sterling and Euro denominated funds also led to increases in the value of funds under management. Together these more than offset the impact of the fall in global equity markets.
Funds under management | | | US$bn | |
| |
| At 1 January 2002 | | | 284 | |
| Additions | | | 116 | |
| Withdrawals | | | (86 | ) |
| Value change | | | (26 | ) |
| Exchange and other | | | 18 | |
| |
| At 31 December 2002 | | | 306 | |
| |
HSBC’s internal performance measures include economic profit, a measure which compares the return on the amount of capital invested in HSBC by its shareholders with the cost of that capital. HSBC prices the cost of capital internally and the difference between that cost and post-tax profit attributable to ordinary shareholders is the amount of economic profit generated. Economic profit is used by management as one of the measures to decide where to allocate resources so that they will be most productive. As a result of this, HSBC has consistently used a benchmark cost of capital of 12.5 per cent on a consolidated basis. Given recent changes in interest rates and in the composition of HSBC, HSBC believes that its true cost of capital on a consolidated basis is now 10.0 per cent. HSBC plans to continue to use the figure of 12.5 per cent until at least the end of the current year which marks the conclusion of its current five year strategic plan period to ens ure consistency and to help comparability.
Economic profit improved by US$845 million, compared with 2001 which bore the cost of the settlement of the Princeton Note matter and the exceptional provisions in respect of Argentina. Measurement of economic profit involves a number of assumptions and, therefore, management believes that the trend over time is more relevant than the absolute economic profit reported for a single period and this approach concentrates focus on external factors rather than measurement bases.
| | | 2002 | | 2001 | |
| | | | US$m | | | % | | | US$m | | | % | |
| |
| Average shareholders funds | | | 50,937 | | | | | | 48,154 | | | | |
| Add: cumulative goodwill written off and amortised | | | 6,554 | | | | | | 6,111 | | | | |
| Dividends declared but not yet paid | | | 953 | | | | | | 893 | | | | |
| Less: property revaluation reserves | | | (2,180 | ) | | | | | (2,573 | ) | | | |
| |
| Average invested capital | | | 56,264 | | | | | | 52,585 | | | | |
| |
| Profit after tax | | | 7,116 | | | 12.7 | | | 6,012 | | | 11.4 | |
| Add: Goodwill amortisation | | | 863 | | | 1.5 | | | 807 | | | 1.5 | |
| Depreciation charged on property revaluations | | | 80 | | | 0.1 | | | 78 | | | 0.2 | |
| Less: equity minority interest | | | (505 | ) | | (0.9 | ) | | (579 | ) | | (1.1 | ) |
| Preference dividends | | | (372 | ) | | (0.6 | ) | | (441 | ) | | (0.8 | ) |
| |
| Return on invested capital* | | | 7,182 | | | 12.8 | | | 5,877 | | | 11.2 | |
| | | | | | | | | | | | | | |
After charging: | | | | | | | | | | | | | |
| Princeton settlement | | | – | | | – | | | (323 | ) | | (0.6 | ) |
| Additional Argentine general provisions and losses | | | – | | | – | | | (1,120 | ) | | (2.1 | ) |
| | | | | | | | | | | | | | |
| Benchmark cost of capital | | | (7,033 | ) | | (12.5 | ) | | (6,573 | ) | | (12.5 | ) |
| | |
|
| |
|
| |
|
| |
|
| |
| Economic profit | | | 149 | | | 0.3 | | | (696 | ) | | (1.3 | ) |
| | |
|
| |
|
| |
|
| |
|
| |
| * | Return on invested capital is based on cash-based attributable profit adjusted for depreciation attributable to revaluation surpluses. Average invested capital is measured as shareholders’ funds after adding back goodwill amortised and goodwill previously written-off directly to reserves and deducting property revaluation reserves. This measure broadly reflects cash invested capital. |
53
Back to Contents
HSBC HOLDINGS PLC
Financial Review (continued)
|
Analysis by geographical segment
|
| |
| |
| |
Profit on ordinary activities before tax by segment |
| | | Year ended 31 December
| |
| | | 2002
| | 2001
| | 2000
| |
| | | | US$m | | | % | | | US$m | | | % | | | US$m | | | % | |
| Europe | | | 3,500 | | | 36.3 | | | 3,542 | | | 44.3 | | | 3,658 | | | 37.4 | |
| Hong Kong | | | 3,710 | | | 38.4 | | | 3,883 | | | 48.5 | | | 3,691 | | | 37.8 | |
| Rest of Asia-Pacific | | | 1,260 | | | 13.1 | | | 1,088 | | | 13.6 | | | 1,265 | | | 12.9 | |
| North America | | | 1,238 | | | 12.8 | | | 503 | | | 6.3 | | | 860 | | | 8.8 | |
| | | | | | | | | | | | | | | | | | |
of which Princeton | | | – | | | – | | | (575 | ) | | (7.2 | ) | | – | | | – | |
| South America | | | (58 | ) | | (0.6 | ) | | (1,016 | ) | | (12.7 | ) | | 301 | | | 3.1 | |
of which Argentina provisions | | | – | | | – | | | (1,120 | ) | | (14.0 | ) | | – | | | – | |
| |
| Total | | | 9,650 | | | 100.0 | | | 8,000 | | | 100.0 | | | 9,775 | | | 100.0 | |
| |
| | | 31 December 2002 | | 31 December 2001† | |
| Total assets* | | | US$m | | | % | | | US$m | | | % | |
| |
| Europe | | | 342,118 | | | 45.7 | | | 297,674 | | | 43.2 | |
| Hong Kong | | | 180,525 | | | 24.1 | | | 175,744 | | | 25.6 | |
| Rest of Asia-Pacific | | | 76,635 | | | 10.2 | | | 62,355 | | | 9.1 | |
| North America | | | 142,032 | | | 18.9 | | | 138,738 | | | 20.2 | |
| South America | | | 8,491 | | | 1.1 | | | 13,097 | | | 1.9 | |
|
| Total | | | 749,801 | | | 100.0 | | | 687,608 | | | 100.0 | |
|
| * | Excluding Hong Kong SAR Government certificates of indebtedness. |
| | |
| † | The figures for 2001 have been restated to reflect the adoption of UK Financial Reporting Standard 19 ‘Deferred Tax’, details of which are set out in Note 1 on pages 195 to 197. |
The results of operations by lines of business are included in the following segmental disclosures in the appropriate geographical segment. A separate commentary is provided on the aggregate results of each line of business on pages 81 to 96. The cash basis measures set out in this section are derived by deducting goodwill amortisation from the equivalent reported measure.
In the analysis of profit by geographical segment which follows, the total of operating income and operating expenses includes intra-HSBC items of US$326 million in 2002, US$257 million in 2001 and US$217 million in 2000.
Following the acquisition of GFBital, HSBC is better able to facilitate business among member countries of the North American Free Trade Agreement (“NAFTA”) and internationally. Hence, the geograp hical analysis has been realigned to reflect this fact by reclassifying Mexico and Panama to North America, from South America (formerly described as Latin America).
| |
| |
| Cash basis profit before tax |
| | | Year ended 31 December
| |
Figures in US$m | | | 2002 | | | 2001 | | | 2000 | |
| |
| UK banking | | | 2,242 | | | 2,394 | | | 2,205 | |
| France | | | 548 | | | 587 | | | 176 | |
| International banking | | | 312 | | | 278 | | | 426 | |
| Treasury and capital markets | | | 701 | | | 487 | | | 305 | |
| HSBC Private Banking Holdings (Suisse) SA | | | 233 | | | 211 | | | 290 | |
| HSBC Trinkaus & Burkhardt | | | 57 | | | 133 | | | 133 | |
| Other* | | | 67 | | | 92 | | | 486 | |
| |
| | | | 4,160 | | | 4,182 | | | 4,021 | |
| |
| | |
| * | Other primarily relates to other operating subsidiaries and the holding company sub-group. |
| | | Year ended 31 December
| |
Figures in US$m | | | 2002 | | | 2001 | | | 2000 | |
| |
| Net interest income | | | 6,343 | | | 5,563 | | | 4,988 | |
| Dividend income | | | 211 | | | 116 | | | 84 | |
| Net fees and commissions | | | 4,528 | | | 4,210 | | | 4,100 | |
| Dealing profits | | | 508 | | | 708 | | | 787 | |
| Other income | | | 1,025 | | | 1,022 | | | 951 | |
| Other operating income | | | 6,272 | | | 6,056 | | | 5,922 | |
| |
Total operating income | | | 12,615 | | | 11,619 | | | 10,910 | |
| Staff costs | | | (4,425 | ) | | (4,227 | ) | | (3,862 | ) |
| Premises and equipment | | | (966 | ) | | (786 | ) | | (651 | ) |
| Other | | | (1,763 | ) | | (1,619 | ) | | (1,374 | ) |
| Depreciation | | | (724 | ) | | (656 | ) | | (631 | ) |
| | | | (7,878 | ) | | (7,288 | ) | | (6,518 | ) |
| Goodwill amortisation | | | (651 | ) | | (632 | ) | | (348 | ) |
| | |
|
| |
|
| |
|
| |
| Operating expenses | | | (8,529 | ) | | (7,920 | ) | | (6,866 | ) |
| |
Operating profit before provisions | | | 4,086 | | | 3,699 | | | 4,044 | |
| | | | | | | | | |
| Provisions for bad and doubtful debts | | | (569 | ) | | (441 | ) | | (348 | ) |
| Provisions for contingent liabilities and commitments | | | (15 | ) | | (30 | ) | | (67 | ) |
| Amounts written off fixed asset investments | | | (267 | ) | | (90 | ) | | (23 | ) |
| |
Operating profit | | | 3,235 | | | 3,138 | | | 3,606 | |
| | | | | | | | | |
| Share of operating (loss) in joint ventures | | | (26 | ) | | (79 | ) | | (51 | ) |
| Share of operating profits/(losses) in associated undertakings | | | 3 | | | 42 | | | (45 | ) |
| Gains on disposal of investments and tangible fixed assets | | | 288 | | | 441 | | | 148 | |
| |
Profit on ordinary activities before tax* | | | 3,500 | | | 3,542 | | | 3,658 | |
| |
* of which United Kingdom | | | 3,239 | | | 3,147 | | | 3,127 | |
54
Back to Contents
HSBC HOLDINGS PLC
| | | Year ended 31 December
| |
| | | | 2002 | | | 2001 | | | 2000 | |
| |
| Share of HSBC’s pre-tax profits (cash basis) (per cent) | | | 39.5 | | | 47.5 | | | 39.0 | |
| Share of HSBC’s pre-tax profits (per cent) | | | 36.3 | | | 44.3 | | | 37.4 | |
| Cost:income ratio (excluding goodwill amortisation) (per cent) | | | 62.4 | | | 62.7 | | | 59.7 | |
| Period-end staff numbers (full-time equivalent ) | | | 72,260 | | | 73,326 | | | 69,629 | |
| | | Year ended 31 December
| |
Figures in US$m | | | 2002 | | | 2001 | | | 2000 | |
| |
| Loans and advances to customers | | | | | | | | | | |
| – specific charge new provisions | | | 963 | | | 802 | | | 607 | |
| release of provisions no longer required | | | (271 | ) | | (260 | ) | | (248 | ) |
| recoveries of amounts previously written off | | | (58 | ) | | (65 | ) | | (56 | ) |
| | | | 634 | �� | | 477 | | | 303 | |
| – general (release)/charge | | | (65 | ) | | (36 | ) | | 43 | |
| |
| Customer bad and doubtful debt charge | | | 569 | | | 441 | | | 346 | |
| Loans and advances to banks – net specific (release)/charge | | | – | | | – | | | 2 | |
| |
| Total bad and doubtful debt charge | | | 569 | | | 441 | | | 348 | |
| |
| Customer bad debt charge as a percentage of closing gross loans and advances | | | 0.34% | | | 0.32% | | | 0.26% | |
| | | | At 31 December | | | At 31 December | |
Figures in US$m | | | 2002 | | | 2001 | |
| |
Assets | | | | | | | |
| Loans and advances to customers (net) | | | 164,701 | | | 133,380 | |
| Loans and advances to banks (net) | | | 39,373 | | | 40,641 | |
| Debt securities, treasury bills and other eligible bills | | | 71,446 | | | 66,255 | |
| Total assets | | | 342,118 | | | 297,674 | |
| | | | | | |
Liabilities | | | | | | | |
| Deposits by banks | | | 34,559 | | | 36,908 | |
| Customer accounts | | | 197,362 | | | 169,371 | |
| |
| Year ended 31 December 2002 compared with year ended 31 December 2001 |
Economic activity slowed further in 2002, as early indicators pointing to a standard cyclical recovery in economic activity diminished and the momentum from rate cuts in 2001 was lost. Industrial production and investment contracted in all major economies, although this was offset to varying degrees by consumer and government expenditure. Initial optimism that the fourth quarter of 2001 marked the low point in the Eurozone’s economic cycle was largely misplaced as constraints imposed by the EMU’s growth and stability pact limited the degree of fiscal loosening available to members.
The United Kingdom registered strong consumer led GDP growth, expected to be 1.6 per cent, in 2002. Structural disparities within the United Kingdom economy widened further as consumer and government spending masked an industrial recession. A combination of low interest rates and a rising incidence of equity withdrawal, as house prices rose, boosted consumer expenditure, particularly in the latter half of the year. Unemployment remained low as the jobs shake-out in manufacturing was absorbed by growth in the public sector. However, a slowing of house price rises since the start of 2003, combined with fiscal tightening and higher consumer indebtedness is likely to dampen consumer spending in the first half of 2003.
France is expected to register a fall in GDP growth from 1.8 per cent in 2001 to 1.0 per cent in 2002. Growth in consumer spending was stronger than in other parts of the Eurozone while fixed investment fell by less. However, there was a substantial fall in inventory which reduced GDP growth by 0.9%. French consumer spending remained buoyant in spite of a gradual increase in the unemployment rate and a high savings rate, reflecting household concerns about future pension provisions. Underlying fiscal policy is likely to be largely neutral with tax cuts balanced by public sector spending limits. The budget deficit is likely to hit a target of 2.8 per cent, double the 2001 level but within the stability pact limit of 3 per cent of GDP.
In Germany, GDP growth for 2002 is forecast to be 0.2 per cent, reflecting constraints within the EMU’s growth and stability pact and weakness in the banking system. Germany’s budget deficit, projected at 3.75 per cent of GDP, was well ahead of the pact’s upper limit of 3 per cent and limited the government’s ability to loosen fiscal policy to bolster the economy. Lending to small and medium sized businesses collapsed as weakness in the banking system reflected a combination of low banking profits and rising non-performing loans. The government has announced a significant tightening of fiscal policy in an attempt to bring the deficit back below 3 per cent in 2003. This is already hitting confidence and is likely to dampen growth further during the first half of 2003.
55
Back to Contents
HSBC HOLDINGS PLC
Financial Review (continued)
|
European operations contributed US$3,500 million to HSBC’s profits before tax in 2002 and represented 36.3 per cent of pre-tax profits. On a cash basis, Europe’s pre-tax profits were US$4,160 million, and represented 39.5 per cent of HSBC’s profits on this basis. Operating performance was strong with pre-provision profit rising 9 per cent to US$4,737 million on a cash basis. In constant currency terms, the growth was 6 per cent. This growth was driven essentially by the core personal and commercial banking businesses in the UK and France and by Treasury and Capital Markets performance. There was no material benefit in 2002 from disposal gains as after making provisions for amounts to be written off fixed asset investments the net gain was only US$21 million. The comparable figure in 2001 was US$351 million, a result dominated by the sale of the Group’s stake in British Interactive Broadcasting.
The impact of acquisitions on 2002 profit before tax was modest at US$51 million. The acquisitions of Demirbank in October 2001 and Benkar in September 2002, however, represented a major expansion of HSBC’s business in Turkey. These businesses have been successfully integrated during 2002, and now over 500,000 customers in Turkey are served through a combination of call centres, internet banking and a network of 163 branches.
A number of other internal restructurings took place to enhance operational efficiency. In June 2002, HSBC acquired Merrill Lynch’s 50 per cent share of the Merrill Lynch HSBC joint venture. The business was integrated into HSBC Bank in December.
HSBC continued to restructure and strengthen its private banking operations with the integration of HSBC Guyerzeller and CCF’s private banking operations outside France with HSBC Republic Holdings (Suisse). The comments below on HSBC Republic (Suisse) assume that this structure was in place during 2001.
The following commentary on the Europe results is based on constant exchange rates.
Net interest income at US$6,343 million was US$558 million, or 10 per cent, higher than in 2001, principally attributable to growth in mortgage lending in the UK and increased spreads as funding costs reflected the low interest rate environment across Europe.
In UK Banking, net interest income at US$3,469 million was US$312 million, or 10 per cent, higher than in 2001, driven by strong growth in mortgages and personal lending, and the benefits of lower cost of funds. Mortgage balances increased by US$5.4 billion, or 24 per cent, and gross new lending by 57 per cent as HSBC Bank increased its market share from 4 per cent to 6 per cent in a buoyant housing market. Personal current account balances were up 11 per cent on 2001 as customers preferred to hold cash in the uncertain investment climate. The launch of a new Bonus Savings Account and improved utilisation of customer relationship management systems contributed to growth of 19 per cent in personal savings balances and 16 per cent in personal lending balances in 2002. Business current account balances grew by 14 per cent, helped by HSBC Bank’s increased profile in the market place and its ‘Start up Stars’ advertising campaign. The bank increased its share of business start-ups and opened more than 87,000 new business accounts in 2002. Corporate current account balances improved by 9 per cent compared with 2001 although this was partly offset by a narrowing of spreads on deposit accounts.
In Treasury and Capital Markets net interest income increased by US$141 million, or 32 per cent, compared with 2001. The increase was primarily due to earnings on money market business, which benefited from reduced funding costs and the deployment of surplus liquidity in higher yielding investment grade corporate and institutional bonds.
In France, CCF’s net interest income of US$1,022 million was US$95 million, or 10 per cent, higher than for 2001. Net interest income in the branch network grew strongly, driven by growth both in personal lending and in sight deposits as customers preferred liquidity and security in the face of falling equity markets. CCF’s treasury operation benefited from a lower cost of funds and spreads widened offsetting a reduction in benefit from net free funds.
HSBC Republic (Suisse)’s net interest income fell by 7 per cent compared with 2001 as lower interest rates reduced the benefit from its investment portfolio and from free funds. Part of the portfolio was repositioned at the beginning of the year into lower yielding but higher grade securities in anticipation of difficult credit markets.
56
Back to Contents
HSBC HOLDINGS PLC
Other operating income at US$6,272 million in 2002 was US$25 million lower than in 2001, reflecting lower income from equity-market-related activity and sales of investment products largely offset by strong growth in credit facility, life and income protection fees. Lower dealing profits reflected difficult conditions in the equity markets, and costs associated with the hedging of the corporate bond portfolio.
In UK Banking, other operating income at US$3,040 million was 2 per cent lower than in 2001 but within this performance there was encouraging evidence of success in reaching customers with products to match their current preferences. The number of customers who benefited from HSBC Bank’s individual service reviews more than doubled to 485,000 and over 750,000 personal banking products were sold through call centres in 2002. HSBC’s Premier service for its higher value customers was further enhanced and the number of customers using this service increased by 44 per cent to 182,000. Overall sales of HSBC branded life, critical illness and income protection products through its tied sales-force were 7 per cent higher than in 2001. Life protection sales grew by 42 per cent on the back of strong mortgage growth and there was a 26 per cent increase in sales of creditor protection insurance, driven by the growth in personal lending . Fees and commissions in commercial banking increased on the back of a rise in current accounts and overdrafts. Cards income grew by 6 per cent and Invoice Finance saw a 13 per cent rise in the number of clients opting for credit protection. Corporate banking fees were 7 per cent lower than in 2001 reflecting the impact of subdued stock market activity on the custody services business and lower fee income from reduced corporate activity. In addition, sales of investment products fell by 14 per cent reflecting continued uncertainty in the investment markets and the impact of a sustained fall in equity markets reduced the value of long-term assurance business.
In CCF, a similar pattern was evidenced. Good growth was achieved in fee income on credit facilities, payments and cash management and cards. Stockbroking, market making and asset management fees were all lower in the face of subdued equity markets although sales of investment protection products in CCF’s regional banking subsidiaries rose. In the European bond markets, CCF benefited from synergies as a core member of HSBC Group, growing origination and distribution fees on euro-denominated products. Dealing profits, however, fell in difficult market conditions. Equity fees were boosted by CCF’s role as lead manager in the privatisation of Autoroutes du Sud de la France, the largest IPO in the European market in 2002. In aggregate other operating income was US$84 million, or 7 per cent, lower than 2001.
Treasury and Capital Markets’ other operating income at US$400 million was US$70 million, or 21 per cent, higher than in 2001. Although dealing profits were down in aggregate, foreign exchange revenues grew by 6 per cent following expansion in emerging markets business and currency options. Fee income from fixed income products also benefited strongly from the continued alignment with HSBC corporate clients and HSBC achieved number one ranking in bond issuance with UK and French corporates in all currencies.
This was offset by the costs of interest rate swaps used as part of the management of the corporate bond portfolio. In addition, equity swap activity generated dealing losses, although these were offset by a rise in dividend income.
In HSBC Republic (Suisse), transaction and safe custody fees increased in line with the growth in funds under management of US$4.1 billion to US$45.6 billion reflecting net inflows as world stock markets fell. US$2 billion of net new funds were attracted. Investment fees benefited strongly from the success of the Hermitage Fund, which offered clients access to Russian investment opportunities.
Operating expenses, excluding amortisation of goodwill, at US$7,878 million were US$265 million, or 3 per cent, higher than in 2001, reflecting acquisition related growth, one-off property related expenses and continued investment in customer contact and relationship management systems.
Staff costs at US$4,425 million were broadly in line with 2001. In UK Banking, staff costs reduced by US$24 million, or 1 per cent, compared with 2001. This was due in part to a switch into ‘other operating expenses’ of the cost of outsourcing HSBC Bank’s cash and cheque processing services and to the impact of offshore processing. Utilisation of HSBC’s service centres in China and India increased with some 700 staff positions and 20 new processes being transferred to India during the year. In Treasury and Capital Markets, staff costs were US$21 million or 12 per cent higher than in 2001, reflecting higher bonus accruals in line with increased profitability. CCF’s staff costs were unchanged on 2001, despite the full year impact of Banque Hervet, achieved in part through a small reduction in headcount.
57
Back to Contents
HSBC HOLDINGS PLC
Financial Review (continued)
|
Non-staff costs of US$3,452 million were US$256 million, or 8 per cent, higher than in 2001. In UK Banking, non-staff costs increased by US$140 million, or 4 per cent, due to the cost of the outsourced cash and cheque processing centres, the full consolidation of Merrill Lynch HSBC from July 2002 and one-off property and vacant space costs relating to the relocation of the bank’s headquarters to Canary Wharf. Provisions for vacant space and diminution in value of surplus properties given the fall in value of central London property cost US$76 million. The contribution of customer contact systems to delivering strong growth in both personal savings and lending balances and fee based products during the year justified further investment in these systems.
In CCF, the full year impact of Banque Hervet and the acquisition of 11 branches from Banque Worms added US$7 million to non-staff costs, while the integration of Demirbank and acquisition of Benkar in Turkey added a further US$76 million to the cost base.
The charge for bad and doubtful debts at US$569 million was US$81 million, or 17 per cent, higher than in 2001. In UK Banking, there was an increase in specific provisions of which the largest element related to a small number of corporate exposures in the telecommunications sector together with a number of individual provisions for commercial loans in the private healthcare, leisure and manufacturing sectors. In contrast, provisions in the branch network for personal customers were lower than in 2001 as credit quality remained stable and increased debt counselling services proved effective. The charge for bad debts in CCF was considerably lower than in 2001 as lower provisions combined with higher releases and recoveries.
Amounts written off fixed asset investments largely reflected a write-down of a strategic equity investment held by CCF in a European life company.
The share of operating losses in joint ventures fell by 37 per cent in 2002, largely reflecting the full consolidation of MLHSBC from July 2002 which offset lower profitability in CCF’s insurance and asset management joint ventures. On 28 June 2002, HSBC acquired Merrill Lynch’s 50 per cent share of the joint venture.
Gains on disposal of fixed assets and investments were US$266 million lower than in 2001. Higher venture capital gains were realised from the sale of private equity investments in CCF and a US$39 million profit was achieved on the disposal of its stake in Lixxbail to its joint venture partner. However, these could not compensate for non-recurrence of the gain on disposal of HSBC Bank plc’s 20 per cent shareholding in British Interactive Broadcasting in the first half of 2001.
In Turkey, operating profit of US$82 million was US$12 million lower than in 2001, mainly reflecting depreciation of the Turkish lira. At constant exchange rates, operating profit was US$17 million, or 27 per cent, higher. Net interest income increased by US$98 million, reflecting the full year contribution from Demirbank and acquisition of Benkar. Operating expenses increased by US$120 million as a result of the integration of the two companies.
In Germany, HSBC Trinkaus & Burkhardt reported pre-tax profits of US$57 million, US$85 million, or 61 per cent, lower than in 2001.
Fees and commissions benefited from strong corporate finance income, which offset a significant reduction in equity commissions as a result of lower transaction volumes. However, a significant inflow of new funds failed to compensate for reductions in advisory fees and securities transaction commissions, and uncertainty on amendments to German tax laws following the general elections in autumn 2002 also slowed the placement of closed end property funds.
Trading activities generally suffered from the weakness in equity markets and profits from equity derivatives fell sharply as volatilities increased.
Strict cost control led to a fall in operating expenses despite one-off costs relating to the successful implementation of a new securities system. Staff numbers fell slightly reflecting the reduction in market activity and lower transaction numbers.
58
Back to Contents
HSBC HOLDINGS PLC
| Year ended 31 December 2001 compared with year ended 31 December 2000 |
Economic activity in Europe slowed with industrial production contracting in all major economies and job cuts affected consumer spending to varying degrees in most countries in the Eurozone. There are increasing signs that the fourth quarter of 2001 marked the low point in the Eurozone’s economic cycle and there is expected to be a gradual recovery in 2002 as the cuts in interest rates, made during 2001, take effect and real incomes are boosted by further declines in inflation.
The United Kingdom continued to register strong GDP growth, expected to be 2.2 per cent, in 2001. Disparities within the United Kingdom economy widened as consumer spending boosted by very low interest rates, high employment levels and continued strong house price inflation masked an industrial recession given the global slowdown and continued high level of sterling.
France is expected to register strong GDP growth of 2.1 per cent in 2001. France saw considerable growth in consumer spending and in fixed investment. The growth in French consumer spending reflected lower unemployment, as a result of labour market reforms in the first part of 2001. Unemployment, after falling to a 17 year low in the first quarter of 2001 trended higher in the fourth quarter reflecting the effects of global slowdown on the French economy. Germany is the only major European economy to have registered an outright recession in 2001, albeit a very modest one. GDP growth for 2001, forecast to be 0.8 per cent, reflected the effects of over supply in the construction sector following the post-unification boom and the lagged impact of higher interest rates in 1999/2000. Despite the global downturn, German exports held up reasonably well. The main disappointment was the weakness in consumer spending, despite large income tax cuts, and a fall in capital spending, in both construction and plant and machinery.
European operations contributed US$3,542 million to HSBC’s profit before tax in 2001 and represented 44.3 per cent of pre-tax profits. On a cash basis, Europe’s pre-tax profits were US$4,182 million, US$161 million, or 4 per cent higher than in 2000 reflecting the first full year contribution from CCF. At constant exchange rates, cash earnings (excluding CCF) were slightly lower compared with 2000 as a result of significantly lower revenues from securities, related commissions and corporate finance.
The process of integration of CCF is now complete and has generated the additional revenues expected when the transaction was announced. This, together with a higher level of costs savings will result in our €150 million post-tax synergy target being exceeded. During 2001 management responsibility for HSBC’s businesses in France, Spain, Italy, Belgium and the Netherlands was transferred to CCF; whilst CCF’s Private Banking operations in Switzerland, Monaco and Luxembourg were merged within HSBC Republic Suisse. Within France, the HSBC hexagon symbol has now been put on all branches in the CCF network and most of the investment banking businesses have been rebranded.
Banque Hervet, which was acquired by CCF, has more than 100,000 customers and 87 branches mainly in the greater Paris area and the central region of France. This acquisition will strengthen CCF’s wealth management and commercial banking businesses. Banque Hervet contributed US$39 million to cash basis profit before tax.
In October 2001 HSBC, through HSBC Bank, acquired Demirbank TAS in Turkey at a cost of US$353 million. Following the acquisition of Demirbank, the fifth largest bank in Turkey, HSBC has a network of 168 branches and offices in 38 cities across Turkey and offers a full range of financial services. Demirbank made a positive contribution in the two months of ownership to HSBC European results.
The following commentary on the Europe results is based on constant exchange rates.
Net interest income was US$788 million, or 17 per cent, higher at US$5,563 million of which US$569 million was attributable to CCF. The underlying increase was principally attributable to significantly higher net interest income in Treasury and Capital Markets, growth in UK Banking and Turkey, the latter on short term money market business due to volatile local market conditions. These increases were partly offset by a fall in net interest income in HSBC Republic Suisse reflecting a reduction in the benefit of net free funds from falling interest rates.
CCF’s net interest income of US$889 million (2000: US$296 million for five months) reflected a full year trading period including the acquisition of Banque Hervet. Interest income was proportionally higher than the previous year due to growth in customer advances in both CCF’s retail branches and regional banking subsidiaries. Net interest income also benefited from a slight improvement in credit spreads.
59
Back to Contents
HSBC HOLDINGS PLC
Financial Review (continued)
|
In UK Banking, net interest income was 2 per cent higher than in 2000. Balance sheet growth of 29 per cent was achieved in personal savings products, 8 per cent in personal current accounts and 14 per cent in business current accounts. The benefit of these higher deposits was reduced by the impact of HSBC Bank plc’s product repricing which resulted in narrower spreads on a number of products, particularly savings accounts and residential mortgages. HSBC Bank plc’s mortgage advances were US$2.5 billion, or 13 per cent, higher than 2000 reflecting an increase in new lending and improved retention of existing customers.
Net interest income earned in treasury and capital markets increased strongly compared to 2000. This increase was primarily due to earnings on money market business which benefited from reduced funding costs as short-term lending rates declined. In addition, the deployment of surplus liquidity in increasing holdings of investment grade corporate bonds also benefited net interest income.
Other operating income at US$6,056 million was US$370 million, or 7 per cent, higher than in 2000. Excluding CCF, other operating income at US$4,982 million was US$168 million, or 3 per cent lower than in 2000 reflecting reduced dealing profits and lower broking and other securities-related fee income from investment banking activities. These were partly offset by increased wealth management and corporate banking fees particularly in UK Banking.
CCF’s other operating income was US$1,074 million in 2001 compared with US$536 million for the five months of 2000. Net fee income at US$781 million, US$415 million higher than the five month contribution in 2000 reflected a full year trading period including the acquisition of Banque Hervet. Net fee income was adversely affected by lower equity market related activities, and in spite of strong growth in Commercial and Corporate Banking and Capital Markets fees. That growth results both from good customer demand and the synergies allowed by the integration of CCF within HSBC. This integration also helped HSBC to strongly improve its positioning in the eurobond market. In addition, CCF’s dealing profits of US$190 million, US$105 million higher than the five month contribution in 2000 reflected a full year trading period, good results in Treasury and Capital Markets and a less favourable performance in securities trading.
In UK Banking, other operating income at US$2,976 million was 4 per cent higher than in 2000, notwithstanding the bank’s decision to remove charges for debit card withdrawals from ATM machines in the LINK network, on which US$49 million gross income was earned in 2000, and withdrawal of the loan to valuation fees on mortgages. The increase reflected growth in wealth management, higher fee income from cards and higher corporate banking fees.
Wealth management income increased by US$66 million, or 9 per cent, compared with 2000. Within this, notwithstanding the depressed market for investment products, income from life, pensions and investment products increased by US$45 million, or 16 per cent of which US$27 million related to non-recurring elements in the calculation of profits on long-term assurance business. General insurance income increased by 9 per cent primarily through the sale of income protection products.
Personal account overdraft fees and mortgage were reduced compared with 2000. Overdraft fees declined by US$41 million, reflecting a reduction in unauthorised overdrafts. Mortgage fees were US$7 million lower than 2000, mainly due to the removal of loan to valuation fees.
Corporate banking fees increased by 7 per cent benefiting from the bank’s strategy of aligning Corporate and Investment Banking services. In addition, increased transaction volumes resulted in a 14 per cent increase in fee income from cards.
In Treasury and Capital Markets, other operating income was US$52 million, or 14 per cent, lower than 2000. This was primarily due to lower income in gilts trading, which did not repeat the strong performance of the first half of 2000 and the costs associated with the interest rate hedge on the increased holdings of investment grade corporate bonds.
60
Back to Contents
HSBC HOLDINGS PLC
In Investment Banking, there were significantly lower levels of fee income from broking and other-securities related income as the high market volumes and favourable stock market movements in the first half of 2000 were followed by eighteen months of declining volumes in primary and secondary equity markets and declines in merger and acquisition activity. Dealing profits in equity trading business were also lower as volumes fell sharply, reflecting the adverse market conditions.
Operating expenses before goodwill amortisation at US$7,288 million were US$1,023 million, or 16 per cent, higher than in 2000. CCF’s operating expenses before goodwill amortisation were US$1,441 million (2000: US$674 million for five months) in 2001. Excluding CCF, operating expenses before goodwill amortisation at US$5,847 million were US$256 million higher than 2000. About a third of this related to increased information technology-related expenditure.
CCF operating costs of US$1,441 million (2000: US$674 million for five months) reflected a full year trading period and the acquisition of Banque Hervet, together with strict cost control. Excluding changes in corporate structure and on a full year basis, operating costs increased by only 1.7 per cent, mainly from non-recurring expenses.
Staff costs at US$4,227 million were US$521 million higher than 2000 (of which US$448 million related to CCF) . In UK Banking staff costs increased by 7 per cent to US$1,922 million as staff numbers were increased to support business development and higher business volumes, including wealth management activities and customer telephone services. Additional IT staff numbers have supported service improvement projects, particularly relating to expanding delivery channels including the internet. Profit-related remuneration reflected the higher revenues generated in treasury and capital markets, offset by lower payments as revenues declined in securities related and corporate finance activities.
Non-staff costs grew by US$502 million (of which US$302 million related to CCF) to US$3,061 million, including an increase in information technology-related expenditure and increase in the cost of services contracted out, primarily relating to the outsourcing of HSBC Bank plc’s cash and cheque processing services.
Higher costs in Greece reflected the acquisition of additional branches and in Turkey of Demirbank.
The charge for bad and doubtful debts was US$110 million, or 33 per cent, higher at US$441 million. Of this US$81 million was attributable to CCF. In UK Banking the charge for bad and doubtful debts was US$57 million, or 15 per cent, lower than in 2000. New specific provisions, recoveries and releases were in line with 2000 as underlying credit quality remained stable. Lower levels of new specific provisions were raised for First Direct and on credit card advances but new provisions for commercial loans were slightly higher and reflected problems seen in the manufacturing sector and weakening in business confidence.
In HSBC Republic Suisse, an increase in new provisions against a corporate exposure in the Channel Islands was offset by the release of general provisions. This release reflects the reassessment of the historical risk factors associated with higher quality private bank lending.
CCF’s charge for bad and doubtful debts of US$77 million (2000: US$4 million release for five months) remains at a moderate level illustrating the good quality of CCF loan book in spite of some deterioration in the airline industry.
Provisions for contingent liabilities were US$36 million lower at US$30 million. The 2000 comparative included a charge in UK Banking for the amount of redress potentially payable to customers who may have been disadvantaged when transferring from or opting out of occupational pension schemes.
Amounts written off fixed asset investments of US$90 million arose mainly from venture capital investments and holdings of emerging technology stocks.
The share of operating losses in joint ventures primarily reflected HSBC’s share of losses in Merill Lynch HSBC’s European operations. The 2000 comparatives for the share of operating losses in associated undertakings included losses of US$76 million in respect of HSBC Bank plc’s 20 per cent shareholding in British Interactive Broadcasting.
Gains on disposal of fixed assets of US$441 million included the US$200 million profit in the first half of 2001, on the sale of HSBC Bank plc’s 20 per cent shareholding in British Interactive Broadcasting. HSBC’s European results were also bolstered by gains on disposal of the stake in Quilter and by profits in Germany on the sale of our fledgling internet broker Pulsiv and ERGO.
61
Back to Contents
HSBC HOLDINGS PLC
Financial Review (continued)
|
| | | Year ended 31 December
| |
Figures in US$m | | | 2002 | | | 2001 | | | 2000 | |
| |
| Net interest income | | | 4,133 | | | 4,165 | | | 3,997 | |
| | | | | | | | | | | |
| Dividend income | | | 25 | | | 26 | | | 34 | |
| Net fees and commissions | | | 1,264 | | | 1,172 | | | 1,168 | |
| Dealing profits | | | 133 | | | 218 | | | 229 | |
| Other income | | | 495 | | | 436 | | | 359 | |
| Other operating income | | | 1,917 | | | 1,852 | | | 1,790 | |
| |
Total operating income | | | 6,050 | | | 6,017 | | | 5,787 | |
| | | | | | | | | | | |
| Staff costs | | | (1,249 | ) | | (1,279 | ) | | (1,166 | ) |
| Premises and equipment | | | (233 | ) | | (234 | ) | | (218 | ) |
| Other | | | (459 | ) | | (428 | ) | | (412 | ) |
| Depreciation | | | (198 | ) | | (199 | ) | | (190 | ) |
| | | | (2,139 | ) | | (2,140 | ) | | (1,986 | ) |
| Goodwill amortisation | | | – | | | – | | | (1 | ) |
| | |
|
| |
|
| |
|
| |
| Operating expenses | | | (2,139 | ) | | (2,140 | ) | | (1,987 | ) |
| |
Operating profit before provisions | | | 3,911 | | | 3,877 | | | 3,800 | |
| | | | | | | | | | | |
| Provisions for bad and doubtful debts | | | (246 | ) | | (197 | ) | | (248 | ) |
| Provisions for contingent liabilities and commitments | | | (14 | ) | | 6 | | | (10 | ) |
| Amounts written off fixed asset investments | | | (10 | ) | | (18 | ) | | (9 | ) |
| |
Operating profit | | | 3,641 | | | 3,668 | | | 3,533 | |
| | | | | | | | | | | |
| Share of operating profit in associated undertakings | | | 11 | | | 17 | | | 21 | |
| Gains on disposal of investments and tangible fixed assets | | | 58 | | | 198 | | | 137 | |
| |
Profit on ordinary activities before tax | | | 3,710 | | | 3,883 | | | 3,691 | |
| |
| Share of HSBC’s pre-tax profits (cash basis) (per cent) | | | 35.3 | | | 44.1 | | | 35.9 | |
| Share of HSBC’s pre-tax profits (per cent) | | | 38.4 | | | 48.5 | | | 37.8 | |
| Cost:income ratio (excluding goodwill amortisation) (per cent) | | | 35.4 | | | 35.6 | | | 34.3 | |
| Period-end staff numbers (full-time equivalent) | | | 23,786 | | | 24,654 | | | 24,204 | |
| | | Year ended 31 December
| |
Figures in US$m | | | 2002 | | | 2001 | | | 2000 | |
| |
| Loans and advances to customers | | | | | | | | | | |
| – specific charge | | | | | | | | | | |
| new provisions | | | 528 | | | 449 | | | 454 | |
| release of provisions no longer required | | | (160 | ) | | (212 | ) | | (192 | ) |
| recoveries of amounts previously written off | | | (25 | ) | | (31 | ) | | (15 | ) |
| | | | 343 | | | 206 | | | 247 | |
| – general (release)/charge | | | (97 | ) | | (9 | ) | | 1 | |
| |
| Customer bad and doubtful debt charge | | | 246 | | | 197 | | | 248 | |
| |
| Total bad and doubtful debt charge | | | 246 | | | 197 | | | 248 | |
| |
| Customer bad debt charge as a percentage of closing gross loans and advances | | | 0.35% | | | 0.29% | | | 0.37% | |
Figures in US$m | | | At 31 December
2002 | | | At 31 December
2001 | |
| |
Assets | | | | | | | |
| Loans and advances to customers (net) | | | 69,948 | | | 67,359 | |
| Loans and advances to banks (net) | | | 33,359 | | | 42,516 | |
| Debt securities, treasury bills and other eligible bills | | | 60,083 | | | 49,625 | |
| Total assets (excluding Hong Kong SAR Government certificates of indebtedness) | | | 180,525 | | | 175,744 | |
| | | | | | | | |
Liabilities | | | | | | | |
| Deposits by banks | | | 2,379 | | | 3,271 | |
| Customer accounts | | | 148,904 | | | 146,544 | |
| |
| Year ended 31 December 2002 compared with year ended 31 December 2001 |
Hong Kong continued to suffer from deflation in 2002 and domestic demand remains subdued. An improvement in trade failed to stimulate demand, as unemployment increased and salaries fell. Deflation is forecast to continue throughout 2003.
Against this backdrop HSBC’s operations in Hong Kong reported a cash basis operating profit before provisions of US$3,911 million, an increase of US$34 million, or 1 per cent, compared with 2001, as targeted income growth from wealth management products was achieved. Cash basis profit before tax of US$3,710 million was US$173 million, or 4 per cent, lower than in 2001 due to a higher bad debt charge and lower investment disposal gains.
Net interest income of US$4,133 million was US$32 million, or 1 per cent, lower than in 2001. Further growth in personal lending, particularly mortgages and credit cards, and an improved spread arising from lower funding deposit costs were offset by intense competition reducing spreads on mortgage and commercial lending. In addition net interest income benefitted from a strong treasury performance. The reduced spreads on mortgages reduced net interest income by US$142 million. There was also a considerable reduction in the benefit of net free funds as average interest rates remained low.
62
Back to Contents
HSBC HOLDINGS PLC
Average customer advances increased by US$2.0 billion compared with 2001, with growth in mortgages and credit cards. Average credit card advances increased by a further 15 per cent compared to 2001. Term lending to corporate and commercial customers also increased, despite subdued demand for lending.
For the Hongkong and Shanghai Banking Corporation in Hong Kong actions taken to improve lending mix and target lower cost deposits held net interest margin essentially flat, the actual margin falling by 1 basis point to 2.47 per cent. Spread widened by 13 basis points, driven by a strong treasury performance, suspended interest recoveries, increased levels of high-yielding credit card balances, and a greater level of low cost deposits. These factors more than offset lower spreads on mortgages and deposits. Continued price competition in the residential mortgage portfolio, excluding the Government Home Ownership Scheme loans, resulted in a further reduction in the average yield on the residential mortgage portfolio to 151 basis points below the bank’s best lending rate (‘BLR’) in 2002. The overall improvement in spread was offset by a reduction in 14 basis points from the benefit of net free funds, as average interest r ates remained low.
Hang Seng Bank’s net interest margin fell by 10 basis points to 2.46 per cent. Net interest spread improved, driven by improved spreads on debt securities and higher levels of low-cost deposits. These were offset by lower spreads on mortgages – Hang Seng Bank’s average yield on residential mortgages was 149 basis points below BLR in 2002 – and a lower benefit from net free funds as average interest rates remained low.
Other operating income increased by US$65 million, or 4 per cent, to US$1,917 million. Fee income grew by US$92 million, or 8 per cent, to US$1,264 million, driven by growth in revenues from wealth management initiatives. Sales of unit trusts were strong, including the sale of over US$4 billion of funds launched by HSBC in 2002, up 33 per cent compared with 2001. Revenues from insurance and underwriting also increased strongly. Revenue from cards also increased by US$9 million, or 4 per cent. There was also growth in the Hongkong and Shanghai Banking Corporation in Hong Kong in Corporate Banking revenues, due to higher income from structured and corporate finance transactions. Other income increased by US$59 million, driven by improved underwriting results. Dealing profits fell by US$85 million, or 39 per cent, due to lower profits on debt securities as credit spreads widened following the series of corporate scandals in the USA. Par t of the decline was also attributable to treasury positions which generated improved net interest income at the expense of lower dealing profits as hedge costs were reflected on that line. Foreign exchange trading remained strong with profits increasing 11 per cent over 2001.
Operating expenses were in line with 2001. Staff costs fell by US$30 million, driven by a reduction in full time equivalent headcount of 868 as back office processing functions transferred to HSBC’s Group Service Centres in India and mainland China, and the non-recurrence of a pension top-up in Hang Seng Bank in 2001. These reductions were partially offset by higher revenue-related remuneration. Other administrative expenses increased by US$31 million, or 7 per cent, due to continuing marketing initiatives, higher IT costs to support business growth, and higher professional fees in relation to higher levels of structured finance transactions.
The charge for bad and doubtful debts increased by US$49 million, or 25 per cent, to US$246 million. The increase was driven by new provisions against credit card lending, rising to US$250 million in 2002, compared with US$122 million in 2001; provisions against other retail lending also increased, as bankruptcy filings grew. Provisions against the mortgage portfolio fell as delinquency rates fell. Recoveries and releases against commercial and corporate customers were lower than in 2001, although economic conditions remained difficult. The above increases were partially offset by a release in general provisions reflecting a reduction in latent losses.
Gains on the disposal of fixed asset investments of US$58 million were US$140 million lower than in 2001, which included gains on the disposal of interests in Modern Terminals and Central Registration.
| Year ended 31 December 2001 compared with year ended 31 December 2000 |
Despite large interest rate cuts, the Hong Kong economy contracted through most of 2001 as consumer spending was hit by rising unemployment and a weak property market. The ongoing deflation kept demand for consumption and investment loans weak.
Hong Kong contributed US$3,883 million to HSBC’s cash basis profit before tax, an increase of US$191 million, or 5 per cent, compared with 2000, and represented 44.1 per cent of HSBC’s cash basis profit before tax.
63
Back to Contents
HSBC HOLDINGS PLC
Financial Review (continued)
|
Net interest income increased by US$168 million, or 4 per cent, to US$4,165 million in 2001, primarily reflecting a switch from interbank lending to corporate bonds, the placement of increased average customer deposits in debt securities and increased spreads on treasury activities. In addition, successful marketing campaigns to target growth in credit card loans and wider spreads on foreign currency customer deposits also contributed to the increase in net interest income. This was partly offset by reduced spreads on residential mortgages and Hong Kong dollar deposits and subdued corporate loan demand. The combination of increased market liquidity and shortage of quality lending opportunities reduced margins earned on corporate loans.
Driven by continued growth in average customer deposits, average interest-earning assets in Hong Kong increased by 6 per cent. However with little demand for new lending, these deposits together with the switch from interbank lending, funded a significant increase in debt securities. Despite intense mortgage price competition and subdued demand for corporate loans, there was a small increase in average customer loans principally credit card advances, term lending and residential mortgages. The success of focused marketing initiatives was reflected in an increase of over 23 per cent in average credit card advances, with the number of credit cards now in issue increasing from 2.5 million to some 2.7 million at 31 December 2001.
For The Hongkong and Shanghai Banking Corporation in Hong Kong the net interest margin at 2.48 per cent (one basis point higher) was largely unchanged from 2000. Spread improved by 18 basis points mainly due to a combination of reduced funding costs on treasury activities, increased higher-yielding credit card balances and widening of spreads on foreign currency deposits. In addition, a reduction in the level of suspended interest, net of releases and recoveries, accounted for six basis points of the improvement in spread. This was partly offset by reduced spreads on Hong Kong dollar savings and time deposits and residential mortgage loans. The contribution from net free funds fell by 17 basis points due to lower average interest rates during the year.
In Hang Seng Bank, the net interest margin decreased to 2.56 per cent, 12 basis points lower than 2000. Spread improved by nine basis points mainly due to the benefits of a higher spread on increased holdings of fixed rate investment securities, growth in lower-cost customer deposits and a wider gap between BLR and interbank rates. These positive effects were partly offset by a further decline in mortgage yields and reduced spreads on term deposits. The contribution from net free funds fell by 21 basis points due to lower average interest rates during the year.
Continued price competition in the residential loan market resulted in further reductions in the average yield on the residential mortgage portfolio. Excluding Government Home Ownership Scheme loans and staff loans, the average yield earned by The Hongkong and Shanghai Banking Corporation in Hong Kong on this portfolio fell to 86 basis points below BLR in 2001, before accounting for the effect of cash incentive payments, compared with 27 basis points below BLR in 2000. Hang Seng Bank saw its average yield on the residential mortgage portfolio fall to 84 basis points below BLR in 2001, compared with 26 basis points below BLR in 2000.
Other operating income was US$62 million, or 3 per cent, higher than 2000. Within other operating income, insurance income increased by US$48 million, or 28 per cent, reflecting significant growth in new life insurance business. HSBC’s operations in Hong Kong increased market share with growth of over 90 per cent in individual life insurance premiums. The Mandatory Provident Fund (‘MPF’) products launched in December 2000 now provide MPF services to over 738,000 individuals. Dealing profits were US$11 million lower than in 2000 as increased profits on interest rate derivatives trading were offset by losses on the mark-to-market of corporate debt securities as credit spreads widened in the latter part of 2001 on the back of reduced corporate earnings in the current economic environment.
Net fees and commissions at US$1,172 million were slightly higher when compared with US$1,168 million in 2000. Securities and stockbroking fee income fell sharply by US$59 million, or 28 per cent, due to lower stock market volumes reflecting the poor market sentiment. In addition, stock market-related revenues were also affected by an increase in the volume of customer trades being executed via the internet. Over 60 per cent of all trades are now transacted through this low cost channel. There was an encouraging increase in fee income from the sale of unit trust products, reflecting the successful sale of capital guaranteed funds during 2001. Fee income from sales of unit trusts in HSBC’s Hong Kong operations increased by US$71 million, or over 140 per cent, compared to 2000. In addition, fee income from cards increased by US$13 million, or 6 per cent following the increase in number of cards in issue in Hong Kong.
64
Back to Contents
HSBC HOLDINGS PLC
Operating expenses excluding goodwill increased by US$154 million, or 8 per cent, compared with 2000. Staff costs increased by US$113 million, or 10 per cent. The increase in staff numbers in Hong Kong of 450 to 24,654 at 31 December 2001, which supported business expansion in credit card advances and Mandatory Provident Fund products and salary increments were the main contributors to this increase. In addition, US$42 million of the increased staff costs related to higher retirement benefit costs mainly in Hang Seng Bank where additional payments were made to maintain the fully funded position of the staff retirement benefit scheme. Operating expenses, other than staff costs, increased by US$41 million, or 5 per cent, mainly in advertising and marketing expenses to support various initiatives, including the promotion of credit cards, launch of capital guaranteed funds and other personal banking products and development costs relating to e-banking initiatives.
The charge for provisions for bad and doubtful debts decreased by US$51 million compared with 2000. The charge for new specific provisions was largely unchanged. An increase in new provision levels for personal customers, to reflect the underlying risks within the consumer portfolio as targeted growth in personal lending led to an expected and corresponding increase in delinquencies, was offset by lower charges against corporate customers. Mortgage delinquency rates however remained low in absolute terms. Releases and recoveries of specific provisions were higher than 2000 mainly in The Hongkong and Shanghai Banking Corporation in Hong Kong.
Non-performing advances as a percentage of total advances improved to 2.9 per cent, compared with 3.8 per cent at the end of 2000.
Gains on disposal of investments and tangible fixed assets amounted to US$198 million, an increase of US$61 million compared with 2000. During the first half of 2001, HSBC’s operations in Hong Kong disposed of their interest in Modern Terminals and a 50 per cent shareholding in Central Registration. These were augmented by gains on disposals of other investment securities throughout 2001.
65
Back to Contents
HSBC HOLDINGS PLC
Financial Review (continued)
|
| |
Rest of Asia-Pacific (including the Middle East) |
| | | Year ended 31 December
| |
Figures in US$m | | | 2002 | | | 2001 | | | 2000 | |
| |
| Net interest income | | | 1,607 | | | 1,482 | | | 1,367 | |
| | | | | | | | | |
| Dividend income | | | 3 | | | 3 | | | 3 | |
| Net fees and commissions | | | 724 | | | 681 | | | 710 | |
| Dealing profits | | | 364 | | | 395 | | | 324 | |
| Other income | | | 83 | | | 58 | | | 48 | |
| Other operating income | | | 1,174 | | | 1,137 | | | 1,085 | |
| |
| | | | | | | | | |
Total operating income | | | 2,781 | | | 2,619 | | | 2,452 | |
| | | | | | | | | |
| Staff costs | | | (826 | ) | | (771 | ) | | (733 | ) |
| Premises and equipment | | | (156 | ) | | (143 | ) | | (137 | ) |
| Other | | | (454 | ) | | (401 | ) | | (343 | ) |
| Depreciation | | | (92 | ) | | (82 | ) | | (79 | ) |
| | | | (1,528 | ) | | (1,397 | ) | | (1,292 | ) |
| Goodwill amortisation | | | (33 | ) | | (8 | ) | | (5 | ) |
| | |
|
| |
|
| |
|
| |
| Operating expenses | | | (1,561 | ) | | (1,405 | ) | | (1,297 | ) |
| |
| | | | | | | | | |
Operating profit before provisions | | | 1,220 | | | 1,214 | | | 1,155 | |
| | | | | | | | | |
| Provisions for bad and doubtful debts | | | (89 | ) | | (172 | ) | | 15 | |
| Provisions for contingent liabilities and commitments | | | 18 | | | (43 | ) | | 5 | |
| Amounts written off fixed asset investments | | | (2 | ) | | (11 | ) | | (3 | ) |
| |
| | | | | | | | | |
Operating profit | | | 1,147 | | | 988 | | | 1,172 | |
| | | | | | | | | |
| Share of operating loss in joint venture | | | – | | | (5 | ) | | – | |
| Share of operating profit in associates | | | 113 | | | 99 | | | 100 | |
| Gains/(losses) on disposal of investments and tangible fixed assets | | | – | | | 6 | | | (7 | ) |
| |
| | | | | | | | | |
Profit on ordinary activities before tax | | | 1,260 | | | 1,088 | | | 1,265 | |
| |
| | | | | | | | | |
| Share of HSBC’s pre-tax profits (cash basis) (per cent) | | | 12.3 | | | 12.4 | | | 12.3 | |
| | | | | | | | | | |
| Share of HSBC’s pre-tax profits (per cent) | | | 13.1 | | | 13.6 | | | 12.9 | |
| | | | | | | | | | | |
| Cost:income ratio (excluding goodwill amortisation) (per cent) | | | 54.9 | | | 53.3 | | | 52.7 | |
| | | | | | | | | |
| Period-end staff numbers (full-time equivalent) | | | 28,630 | | | 26,259 | | | 22,919 | |
| | | Year ended 31 December
| |
Figures in US$m | | | 2002 | | | 2001 | | | 2000 | |
| |
| Loans and advances to customers | | | | | | | | | | |
| – specific charge | | | | | | | | | | |
| new provisions | | | 400 | | | 577 | | | 543 | |
| release of provisions no longer required | | | (268 | ) | | (268 | ) | | (321 | ) |
| recoveries of amounts previously written off | | | (52 | ) | | (138 | ) | | (49) | |
| | | | 80 | | | 171 | | | 173 | |
| – general charge/(release) | | | 9 | | | 1 | | | (188 | ) |
| |
| | | | | | | | | |
| Customer bad and doubtful debt charge/(release) | | | 89 | | | 172 | | | (15 | ) |
| | | | | | | | | |
| Loans and advances to banks – net specific (releases) | | | – | | | – | | | – | |
| |
| Total bad and doubtful debt charge/(release) | | | 89 | | | 172 | | | (15 | ) |
| |
| Customer bad debt charge as a percentage of closing gross loans and advances | | | 0.23% | | | 0.52% | | | – | |
| | | | | | | | | | | |
Figures in US$m | | | At 31
December
2002 | | | At 31
December
2001 | |
| |
Assets | | | | | | | |
| Loans and advances to customers (net) | | | 37,078 | | | 30,666 | |
| Loans and advances to banks (net) | | | 10,708 | | | 11,253 | |
| Debt securities, treasury bills and other eligible bills | | | 21,622 | | | 13,623 | |
| Total assets | | | 76,635 | | | 62,355 | |
| | | | | | |
Liabilities | | | | | | | |
| Deposits by banks | | | 5,362 | | | 4,010 | |
| Customer accounts | | | 54,172 | | | 45,498 | |
| |
| Year ended 31 December 2002 compared with year ended 31 December 2001 |
Following the slowdown across the region in 2001, the growth in mainland China, Malaysia and South Korea was export-led, whilst consumer spending has driven growth in Australia and New Zealand. Interest rates and inflationary pressures remained low across the region. Improving economic fundamentals in Thailand, Malaysia and Singapore are positioning these economies to benefit from future direct investment recovery. The Japanese economy has remained fragile, with consumer growth rates slowing during the year despite an improvement in GDP during the second half of 2002 driven by increased exports and domestic consumption.
66
Back to Contents
HSBC HOLDINGS PLC
HSBC’s operations in the rest of the Asia-Pacific region contributed US$1,253 million cash basis operating profit before provisions, an increase of 3 per cent compared with 2001. In constant currency terms the growth was 2 per cent. Cash basis profit before tax of US$1,293 million was 18 per cent higher than 2001. The increase in profit before tax resulted largely from lower bad debt charges, particularly in the Middle East and Indonesia.
Net interest income of US$1,607 million was US$125 million, or 8 per cent, higher than in 2001. The increase was driven by strong growth in credit card and personal lending across the region, particularly in Taiwan, Singapore, India, the Philippines and Australia, the latter supported by HSBC’s acquisition of NRMA Building Society in 2001. Overall, average loans and advances to customers in the rest of Asia-Pacific increased by 14 per cent compared with 2001.
Other operating income increased by US$37 million, or 3 per cent, compared with 2001. Net fee income increased by US$43 million, or 6 per cent, compared with 2001. There was a 30 per cent increase in credit card income, mainly focused in Taiwan, Malaysia, Indonesia and the Middle East. There was also good growth in account service and credit-related fee income. Dealing profits fell by US$31 million, or 8 per cent, to US$364 million. The reduction resulted principally from lower interest rate derivatives and debt securities trading income in Singapore and the Philippines.
Total operating expenses excluding goodwill increased by US$131 million, or 9 per cent, to US$1,528 million. This included an increase of US$26 million resulting from the further expansion of HSBC’s processing facilities in mainland China and India, along with significant business expansion, particularly in the Middle East and Taiwan. In addition, an increase in costs in Australia resulted from the acquisition of NRMA Building Society at the end of 2001. Staff costs increased by US$55 million, or 7 per cent, to US$826 million. Of the increase, US$13 million relates to the processing centres in India and mainland China. There was also a significant increase in staff costs in the Middle East as a result of increased headcount to support the expansion of personal and commercial banking. This was offset by savings in Singapore due to lower headcount and lower levels of voluntary severance costs. Other administrative expenses increas ed by US$76 million, particularly due to the expansion of personal financial services in Taiwan, Singapore and mainland China, one-off IT costs in the Middle East, and higher costs in Australia arising from the acquisition of NRMA Building Society in 2001.
The charge for bad and doubtful debts of US$89 million was US$83 million lower than in 2001. There was a significant reduction in the bad debt charges in Indonesia, the Middle East and mainland China. In Indonesia, there were significantly lower new provisions raised, particularly against commercial and corporate sectors, along with higher levels of releases against commercial and corporate customers. Strengthened credit control procedures in the Middle East led to lower requirements for new specific provisions against both personal and corporate customers, along with releases in the UAE and Lebanon. In mainland China, there were various recoveries of provisions against corporate customers.
HSBC’s operations in Singapore reported an increase in operating profit before provisions of US$22 million, or 12 per cent to US$213 million. Profit before tax fell by 17 per cent to US$223 million, as 2001 benefited from the release of provisions held against the historic Olympia and York exposure. Net interest income increased by US$20 million, or 8 per cent, to US$272 million driven mainly by increased volumes of car loans and a strong treasury performance, partly offset by narrower spreads and subdued demand in the commercial and corporate sector. Dealing profits fell by US$17 million, or 29 per cent, due to lower profits from interest rate derivatives and debt securities trading resulting from interest rate movements and wider credit spreads. Fee income remained flat with growth in income from the sale of HSBC’s capital guaranteed funds offset by reductions in broking income. Operating expenses fell by US$16 million, or 7 per cent to US$204 million. Staff costs fell by US$24 million, or 17 per cent as a result of lower headcount and lower voluntary separation costs. Other administrative expenses increased by US$8 million including higher marketing costs relating to personal financial services. There was a net release of US$6 million of bad debts, compared with a net release of US$94 million in 2001 which benefited from the recovery made against the historic Olympia and York exposure. New provisions were US$22 million lower than in 2001, particularly relating to exposures in the corporate sector, and there were further recoveries from commercial and corporate customers.
67
Back to Contents
HSBC HOLDINGS PLC
Financial Review (continued)
|
HSBC’s operations in India reported operating profit before provisions of US$111 million, an increase of US$7 million, or 7 per cent, compared with 2001. Profit before tax of US$85 million was broadly in line with 2001. Net interest income increased by US$3 million, or 3 per cent to US$100 million. Growth in personal lending was partly offset by lower treasury income as spreads narrowed. Fee income increased by 6 per cent to US$57 million, driven by higher credit card fees due to higher merchant acquiring volume. Dealing profits increased by 17 per cent to US$68 million, as profits on interest rate derivatives trading grew, reflecting increased business volumes as a result of the closer co-operation between investment banking and corporate banking to offer customised structured solutions to major corporate customers. Operating expenses increased by US$20 million, or 18 per cent, to US$132 million. Of this increase, US$12 million related to the further expansion of operations in HSBC’s Group Service Centres in Hyderabad, which now employs in excess of 2,300 employees. Staff costs increased by US$10 million, of which US$6 million related to the processing centre, and the remainder due to higher headcount due to business expansion. Other operating expenses increased by US$10 million, of which US$6 million related to the processing centre. The remaining increase resulted from an expansion in business, including investment in IT, new branches and marketing of credit cards and other personal financial products. The charge for bad and doubtful debts increased by US$6 million to US$27 million, reflecting increasing levels of provisions against personal and credit card lending.
HSBC’s operations in mainland China reported operating profit before provisions of US$17 million, a decrease of US$9 million compared with 2001, as operating expenses related to HSBC’s Group Service Centre in Guangzhou and Shanghai increased. Profit before tax increased by US$17 million to US$50 million due to increased bad debt recoveries. Net interest income increased by US$4 million, or 11 per cent to US$40 million, driven by increases in renminbi advances and an increase in customer deposits, resulting from a successful cash management marketing campaign. Fee income increased by 6 per cent to US$33 million, with increased levels of income from trade services and credit card merchant acquiring. Operating expenses increased by US$26 million to US$79 million. Of this increase, US$14 million relates to the further expansion of operations in HSBC’s Group Service Centres in Guangzhou and Shanghai, which now employ in exc ess of 2,300 employees. Staff costs increased by US$11 million, of which US$7 million related to the processing centres, and the remainder due to higher headcount due to an increased PFS sales-force and new staff in investment banking and card issuing. Other operating expenses increased by US$15 million, of which US$7 million related to the HSBC’s Group Service Centres. The remaining increase resulted from an expansion in business, including investment in IT to support the credit card business and in Customer Relationship Management systems, and increased marketing and advertising costs for PFS services. There was a net release of bad and doubtful debts of US$32 million, reflecting a number of recoveries of provisions held against various corporate customers.
In Malaysia, HSBC Bank Malaysia reported operating profit before provisions of US$131 million, an increase of US$3 million, or 3 per cent, compared with 2001 as fees from personal financial services increased. Profit before tax of US$119 million was US$12 million, or 9 per cent, lower than in 2001, which included significant levels of bad debt recoveries as a result of repayments and credit upgrades following a programme of loan restructurings. Net interest income of US$169 million was broadly in line with 2001. Residential mortgages grew by 63 per cent, including the acquisition of ABN Amro’s residential mortgage portfolio in the first half of 2002, and average credit card advances increased by 34 per cent. However, this growth was offset by a reduction in margin resulting from subdued corporate loan demand, price competition and lower recoveries of suspended interest. Fee income increased by 19 per cent, as the continuing focus on personal banking initiatives led to increased fees from credit cards and account services. Operating expenses were 1 per cent lower than in 2001, mainly as a result of a reduction in mortgage promotion expenditure. The bad and doubtful debt charge of US$18 million was US$11 million higher than in 2001, which benefited from significant bad debt recoveries following a series of loan restructurings. The credit environment remained favourable and non-performing loans were 26 per cent lower than at 31 December 2001.
68
Back to Contents
HSBC HOLDINGS PLC
HSBC Bank Middle East reported a decrease in operating profit before provisions of 9 per cent compared with 2001 due to higher costs to support growth in personal and commercial banking. Profit before tax on a cash basis was 12 per cent higher than in 2001, mainly as a result of a lower bad debt charge and releases of provisions. Net interest income increased by 3 per cent, with a 5 per cent increase in average interest- earning assets due to higher term lending to corporate customers in the UAE. However, the net interest margin fell by 6 basis points to 3.78 per cent due to a lower benefit of net free funds in a declining interest rate environment. Net fee income rose by 12 per cent, largely from personal banking products. The financial planning services team, which provides savings, retirement education and protection planning services throughout the region sold investments totalling US$304 million, 12 per cent higher than in 2001. There was further growth in the credit card business, where fee income rose by 14 per cent. As a result of the increased staffing to support the expansion of personal and commercial banking, staff costs increased by 26 per cent. Increased costs of US$2 million were incurred for the debt recovery teams whilst net charge for personal lending bad and doubtful debts declined by 51 per cent. Additional one-off costs were also incurred in transferring data processing work to other parts of HSBC. In total, operating expenses rose by 26 per cent. The charge for bad and doubtful debts fell by US$50 million to US$6 million. Strengthened credit risk management procedures and a new debt recovery unit resulted in lower new provisioning requirements in both the personal and corporate lending portfolio.
Elsewhere, HSBC’s operations in Taiwan, Indonesia and Korea each contributed in excess of US$50 million to pre-tax profits. Growth in Taiwan was driven by increased sales of personal financial services, particularly credit cards. HSBC’s operations in Japan, Thailand, the Philippines, Brunei and Australia each contributed in excess of US$25 million to pre-tax profits, the latter benefiting from HSBC’s acquisition of NRMA Building Society in 2001. HSBC Bank Egypt contributed a pre-tax profit of US$19 million, in line with 2001. HSBC’s associates The Saudi British Bank and British Arab Commercial Bank contributed US$113 million to cash basis pre-tax profits.
| Year ended 31 December 2001 compared with year ended 31 December 2000 |
Growth slowed sharply across most of the Asia-Pacific region in the first half of the year as exports and investment were hit by the global downturn, in electronics in particular. Inflationary pressures continued to ease and interest rates were generally declining. By the end of the year there were signs that the worst of the industrial downturn was over, particularly in the high-tech exposed countries such as Korea. While growth in mainland China has also slowed modestly, it continued to outperform the rest of the region by a large margin with GDP growth of 7.3 per cent. India was the next strongest economy in the region with growth of about 5 per cent.
HSBC’s operations in the rest of the Asia-Pacific region contributed US$1,096 million of HSBC’s cash basis profit before tax, a decrease of US$174 million, or 14 per cent, compared with 2000. At constant exchange rates, cash basis profit before tax was 10 per cent lower than 2000. The fall in profits mainly resulted from a net release of customer bad and doubtful debt provisions in 2000 which benefited from the release of US$174 million from the special general provision. At constant exchange rates, cash basis operating profits before provisions were 11 per cent higher than in 2000.
Net interest income was US$115 million, or 8 per cent (at constant exchange rates 13.7 per cent) higher than in 2000. The increase reflected growth in higher-yielding personal lending, increased spreads on treasury activities and recoveries of previously suspended interest. There was solid growth in personal lending, reflecting the successful development of wealth management businesses in several countries, with increases in Taiwan, Singapore, Korea, India, New Zealand, Brunei, Malaysia and Australia. Spreads widened in Singapore and Japan mainly due to strong treasury performance and in mainland China as a result of previously suspended interest. Subdued corporate loan demand and intense competition for the limited quality lending opportunities available in some countries in the region resulted in reduced net interest margins as excess deposit-driven growth in average interest-earning assets was placed in lower-yielding money market loans and debt securities.
69
Back to Contents
HSBC HOLDINGS PLC
Financial Review (continued)
|
Other operating income increased by US$52 million, or 5 per cent, (at constant exchange rates by 13 per cent) compared to 2000. Net fees and commissions were US$29 million lower than in 2000 (but 3 per cent higher at constant exchange rates). The focus on expanding HSBC’s personal banking operations, most notably in the Philippines, Taiwan, India, Indonesia and the Middle East, resulted in an increase of 23 per cent at constant exchange rates (or 16 per cent on a reported basis) in credit card fee income. Securities and stockbroking income fell by some 26 per cent (at constant exchange rates some 18 per cent) reflecting subdued stock market activity across the region. Dealing profits increased by US$71 million due to increased profits on interest rate derivatives (which benefited from increased volatility in interest rates), particularly in India, Indonesia, Singapore, the Philippines, Japan, and Thailand. There were also increased profits on debt securities trading in Singapore and India.
Operating expenses on a cash basis increased by US$105 million, or 8 per cent, (at constant exchange rates by 16 per cent) compared with 2000. The growth in staff costs (at constant exchange rates 12 per cent) reflected increased staff numbers to support business expansion and notably increased transfer of back office processing from overseas to premises in Hyderabad and Guangzhou. Over the past year, HSBC has expanded its operations in Australia, the Philippines, Egypt, Taiwan and Brunei through acquisitions and opened some 13 new branches in seven countries in the rest of the Asia-Pacific region. The growth in other expenses (20 per cent, at constant exchange rates) reflected acquisitions and increased marketing expenditure promoting personal banking products. In aggregate recent acquisitions accounted for some US$31 million of the increase in operating expenses.
The significant change in the net charge for customer bad and doubtful debt provisions is accounted for by the impact of the release of the Asian special general provision in 2000. New specific provisions reflected further provisioning on existing non-performing loans in Indonesia due to heightened current political and economic uncertainties, and on an energy sector related corporate exposure in India. Offsetting these items were falls in the level of new specific provisions required in Malaysia, mainland China and the Middle East. Releases and recoveries were US$36 million higher than in 2000, mainly as a result of the liquidation of security held against a loan to Olympia and York.
This recovery helped boost the pre-tax profit of HSBC’s operations in Singapore to US$270 million, US$51 million, or 23 per cent, higher than 2000. Net interest income was US$12 million higher than in 2000. This resulted from the combination of an improved net interest margin as spreads on deposits widened and surplus deposits were placed in higher-earning investment securities together with a good performance by treasury. Fee income was only slightly lower than 2000 as fees from advisory services and the sale of capital protected funds partially offset the fall in stockbroking and credit facilities income. Higher profits from bond trading resulted in a 23 per cent increase in dealing profits. Operating expenses reflecting higher performance related bonus provisions, salary increments, the costs of the voluntary severance scheme and increased contributions to the central provident fund were US$32 million higher.
In India, pre-tax profits were in line with those earned in 2000. Dealing profits increased by US$19 million, or 49 per cent, as anticipated movements in interest rates increased dealing profits from debt securities and interest rate derivatives. Fee income was 2 per cent higher as growth in credit card fees offset falls in securities and stockbroking income from subdued stock market activities. Operating expenses were US$23 million higher, reflecting the expansion of the development of the Group’s global processing operations in Hyderabad together with higher performance related staff costs. Costs in respect of the former were largely offset by other operating income received for these services. The opening of two new branches, together with the expansion of the processing centre in Hyderabad resulted in an increased headcount of some 1,000 during the year. Bad and doubtful debt provisions increased by US$12 million mainly due to exposure to an energy sector related company. Advances to customers grew by US$125 million, or 9 per cent, with strong growth in personal lending and to the commercial and industrial and public sectors.
70
Back to Contents
HSBC HOLDINGS PLC
In mainland China, HSBC’s operations returned to profitability reporting pre-tax profit of US$33 million for 2001 compared with a loss of US$26 million in 2000. The receipt of previously suspended interest resulted in a significant increase in net interest income. Increased operating expenses reflected increased headcount arising on business expansion in personal financial services preparing for opportunities which will arise as China’s banking markets open post its accession to the World Trade Organisation together with expansion of the global processing centre in Guangzhou. Costs in respect of the latter were largely offset by other operating income received for these services. Business expansion together with development of the processing centre at Guangzhou resulted in an increased headcount of some 500 during the year. Consistent with the recovery of suspended interest there was a net release in bad debt provisions for 2001 compared with a charge of US$24 million in 2000.
In Malaysia, HSBC Bank Malaysia reported profits before tax of US$131 million, an increase of US$15 million, 13 per cent higher than in 2000. This was largely attributable to a lower level of provisions for bad and doubtful debts.
Against a backdrop of subdued corporate loan demand, intense price competition and reduced lending margins net interest income of US$171 million was slightly lower than in 2000. However HSBC Bank Malaysia exceeded targeted growth in residential mortgages (up US$569 million, an increase of 91 per cent) and in credit card loans (up US$70 million and reflecting a 50 per cent increase in the number of credit cards in issue) following successful promotional campaigns. As a consequence the net interest margin improved by 5 basis points to 2.76 per cent. Spread widened by 17 basis points mainly due to the impact of higher yielding residential mortgage and credit card loans and lower cost of funds in a falling interest rate environment. The contribution from net free funds fell by 12 basis points reflecting lower interest rates and a reduced volume of interest free account balances as foreign investors repatriated surplus funds.
Other operating income of US$91 million was US$7 million higher than in 2000. The continuing focus on expanding HSBC’s personal banking operations generated a 15 per cent increase in credit card fee income to US$26 million. Higher profits from bond trading and higher volumes of foreign exchange transactions resulted in a 13 per cent increase in dealing profits to US$34 million. Operating expenses at US$134 million were US$15 million higher than 2000.
Operating expenses, other than staff costs increased by 31 per cent mainly due to an increase in marketing initiatives to support strategic repositioning to focus more on Personal Financial Services.
Provisions for bad and doubtful debts decreased by US$26 million to US$7 million. Non-performing customer loans have decreased by US$126 million or 18 per cent since 31 December 2000 as a result of a combination of credit upgrades following loan restructurings, recoveries and write-offs.
The Middle Eastern operations of HSBC Bank Middle East benefited from the expansion of fee income from personal banking business and a lower charge for bad and doubtful debt provisions. Cash basis pre-tax profits were US$40 million, 23 per cent higher than in 2000.
Net interest income was in line with 2000 as the benefit of increased levels of average interest-earning assets offset a fall in net interest margin. Intense competition for the limited quality lending opportunities resulted in a fall in average customer advances as scheduled repayments were received. As a result growth in average interest-earning assets of US$301 million or 4 per cent, was deposit-driven and was placed in lower-yielding money market loans. The 12 basis point fall in net interest margin to 3.84 per cent reflected the more liquid balance sheet and a lower contribution from net free funds in the falling interest rate environment.
Anticipating the pressure on lending income growth HSBC Bank Middle East focused marketing activity on fee based products generating net fee income US$15 million, or 19 per cent, higher than 2000 as a result of growth in personal banking products. This was the major contributor to growth in other operating income of US$20 million, or 17 per cent higher than in 2000. HSBC’s financial planning management service (which provides savings, retirement, education and protection planning services in six countries in the region) contributed US$10 million of net fees in its first full year of operations, an increase of US$7 million. Credit card fee income increased by US$3 million, or 15 per cent, following fresh promotion of credit card products, backed by the launch of a new loyalty programme and a virtual card which facilitates secure financial internet transactions. The number of credit cards in issue increased by 25 per cent and average outstanding credit card advances were 18 per cent higher. Funds sold to customers rose by 51 per cent to US$272 million compared with 2000. A wider range of trade, cash management and institutional products also contributed to the increase in other operating income.
71
Back to Contents
HSBC HOLDINGS PLC
Financial Review (continued)
|
The expansion of the personal banking sales teams and the related strengthening of the credit function across the region drove staff costs higher and was the principal contributor to operating expenses being US$19 million, or 11 per cent, higher than in 2000. Investment in new products (including the card loyalty programme), costs associated with centralisation of regional back office processes in Dubai and investment in internet service capabilities also contributed to increased operating expenses. The bank’s new internet service was soft launched in the United Arab Emirates in November 2001 and a full regional launch to customers is planned for the second half of 2002.
The individually significant bad debt provisions which burdened HSBC Bank Middle East in 2000 were not repeated and as a result the charge for bad and doubtful debt provisions was 30 per cent lower. This also reflected an increased level of recoveries following investment in strengthening the credit systems and collection processes.
Elsewhere, HSBC operations in Korea and Thailand each contributed in excess of US$50 million to pre-tax profits and HSBC’s operations in Taiwan, the Philippines and Mauritius each contributed in excess of US$25 million to pre-tax profits. Following investment to take HSBC’s stake in HSBC Bank Egypt from 40 per cent to 94.5 per cent HSBC’s return on a pre-tax basis grew to US$19 million. HSBC’s associates, The Saudi British Bank and British Arab Commercial Bank, contributed US$96 million to cash basis pre-tax profits.
In Lebanon, losses of US$31 million were suffered on an operation which has subsequently been closed. In addition, increased levels of credit provisions raised against a small number of customers reduced the contribution from operations in Australia and resulted in losses being reported in Indonesia.
| |
| Cash basis profit before tax |
| | | Year ended 31 December | |
| | |
| |
| Figures in US$m | | | 2002 | | | 2001 | | | 2000 | |
| |
| HSBC Bank USA (excl Princeton) | | | 1,406 | | | 1,273 | | | 871 | |
| HSBC Markets USA | | | (100 | ) | | (6 | ) | | 35 | |
| Other USA operations | | | 4 | | | 13 | | | 5 | |
| |
| USA operations | | | 1,310 | | | 1,280 | | | 911 | |
| Canadian operations | | | 267 | | | 230 | | | 236 | |
| Mexico | | | 35 | | | 14 | | | 9 | |
| Panama | | | (15 | ) | | 11 | | | 2 | |
| |
| | | | 1,597 | | | 1,535 | | | 1,158 | |
| Princeton Note settlement | | | – | | | (575 | ) | | – | |
| Group internet development – hsbc.com | | | (83 | ) | | (161 | ) | | – | |
| Intermediate holding companies | | | (130 | ) | | (151 | ) | | (154 | ) |
| |
| | | | 1,384 | | | 648 | | | 1,004 | |
| |
| | | Year ended 31 December | |
| | |
| |
| Figures in US$m | | | 2002 | | | 2001 | | | 2000 | |
| |
| Net interest income | | | 2,732 | | | 2,450 | | | 2,185 | |
| | | | | | | | | | | |
| Dividend income | | | 24 | | | 29 | | | 68 | |
| Net fees and commissions | | | 984 | | | 913 | | | 862 | |
| Dealing profits | | | 161 | | | 346 | | | 229 | |
| Other income | | | 333 | | | 207 | | | 179 | |
| Other operating income | | | 1,502 | | | 1,495 | | | 1,338 | |
| |
| Total operating income | | | 4,234 | | | 3,945 | | | 3,523 | |
| | |
| Staff costs | | | (1,537 | ) | | (1,440 | ) | | (1,406 | ) |
| Premises and equipment | | | (356 | ) | | (323 | ) | | (312 | ) |
| Other | | | (651 | ) | | (653 | ) | | (561 | ) |
| Depreciation | | | (131 | ) | | (124 | ) | | (117 | ) |
| | | | (2,675 | ) | | (2,540 | ) | | (2,396 | ) |
| Goodwill amortisation | | | (146 | ) | | (145 | ) | | (144 | ) |
| | |
|
| |
|
| |
|
| |
| Operating expenses | | | (2,821 | ) | | (2,685 | ) | | (2,540 | ) |
| |
| Operating profit before provisions | | | 1,413 | | | 1,260 | | | 983 | |
| | |
| Provisions for bad and doubtful debts | | | (300 | ) | | (300 | ) | | (157 | ) |
| Provisions for contingent liabilities and commitments | | | | | | | | | | |
| – other | | | 3 | | | (7 | ) | | 1 | |
| – Princeton Note settlement | | | – | | | (575 | ) | | – | |
| Amounts written off fixed asset investments | | | (9 | ) | | (5 | ) | | – | |
| |
| Operating profit | | | 1,107 | | | 373 | | | 827 | |
| |
| Share of operating losses in joint venture | | | (2 | ) | | (7 | ) | | – | |
| Share of operating profit/(losses) in associates | | | 8 | | | 5 | | | (2 | ) |
| Gains on disposal of investments and tangible fixed assets | | | 125 | | | 132 | | | 35 | |
| |
| Profit on ordinary activities before tax | | | 1,238 | | | 503 | | | 860 | |
| |
| Share of HSBC’s pre-tax profits (cash basis) (per cent) | | | 13.2 | | | 7.4 | | | 9.7 | |
| Share of HSBC’s pre-tax profits (cash basis excl. Princeton) (per cent) | | | 13.2 | | | 13.8 | | | 9.7 | |
| Share of HSBC’s pre-tax profits (per cent) | | | 12.8 | | | 6.3 | | | 8.8 | |
| Cost: income ratio (excluding goodwill amortisation) (per cent) | | | 63.2 | | | 64.4 | | | 68.0 | |
| Period-end staff numbers (full-time equivalent basis) | | | 34,207 | | | 19,291 | | | 19,201 | |
72
Back to Contents
HSBC HOLDINGS PLC
| Bad and doubtful debts | | | |
| | | Year ended 31 December
| |
| Figures in US$m | | | 2002 | | | 2001 | | | 2000 | |
| |
| Loans and advances to customers | | | | | | | | | | |
| – specific charge new provisions | | | 399 | | | 392 | | | 395 | |
| Release of provisons no longer required | | | (79 | ) | | (42 | ) | | (72 | ) |
| Recoveries of amounts prevously written off | | | (35 | ) | | (43 | ) | | (31 | ) |
| | | | 285 | | | 307 | | | 292 | |
| – general charge/(release) | | | 15 | | | (7 | ) | | (135 | ) |
| |
| Customer bad and doubtful debt charge | | | 300 | | | 300 | | | 157 | |
| |
| Total bad and doubtful debt charge | | | 300 | | | 300 | | | 157 | |
| |
| | | | | | | | | | | |
| Customer bad debt charge as a percentage of closing gross loans and advances | | | 0.38% | | | 0.41% | | | 0.25% | |
| Figures in US$m | | | At 31 December
2002 | | | At 31 December 2001 | |
| |
| Assets | | | | | | | |
| Loans and advances to customers (net) | | | 77,589 | | | 73,088 | |
| Loans and advances to banks (net) | | | 10,391 | | | 7,979 | |
| Debt securities, treasury bills and other eligible bills | | | 39,270 | | | 45,661 | |
| Total assets | | | 142,032 | | | 138,738 | |
| | | | | | |
| Liabilities | | | | | | | |
| Deposits by banks | | | 9,972 | | | 8,113 | |
| Customer accounts | | | 90,137 | | | 81,055 | |
| |
| Year ended 31 December 2002 compared with year ended 31 December 2001 |
The United States economy showed signs of improvement in 2002 following a deterioration in 2001, as low interest rates and low inflation helped to boost the housing, manufacturing and consumer sectors. GDP growth was 2.4 per cent compared with 1.1 per cent in 2001. However, growth prospects remained unclear, as equity markets remained subdued, and levels of corporate and consumer debt remained high. The dollar weakened throughout the year, reflecting investor concerns about investment returns from the US.
The Canadian economy continued to outperform its fellow G7 members, with GDP growth of 3.3 per cent in 2002. This has been driven by strong growth in employment, and increased levels of retail sales. However, in response to fears about strong consumer spending and increasing inflation, interest rates have shown upward pressure. It is expected that the Canadian economy will be slowed down by the performance of the US economy during 2003.
Economic growth in Mexico also remained subdued, relying as it does on the US economy for 25 per cent of its GDP. However, growth in industrial output is an encouraging sign for Mexico’s future prospects. Although the recent devaluation in the value of the peso has increased inflationary pressures, the present economic indicators do not appear to present cause for concern with regard to Mexico’s creditworthiness.
HSBC’s operations in North America which include Mexico and Panama, contributed US$1,559 million to cash operating profit before provisions, up US$154 million, or 11 per cent, compared with 2001. Cash basis profit before tax increased by US$736 million to US$1,384 million. Operating performance was driven by strong growth in net interest income in 2002 which benefited from low funding costs as interest rates remained at historically low levels. The 2001 results bore the exceptional costs of the Princeton Note Settlement.
HSBC Bank USA’s operations in the United States reported an increase in cash basis operating profit before provisions of US$58 million, or 4 per cent, to US$1,438 million, primarily driven by improved spreads in treasury in the low interest rate environment. At the pre-tax level profits on a cash basis of US$1,406 million were US$133 million, or 10 per cent, higher than in 2001, excluding the Princeton Note settlement. A number of successful restructurings and debt reduction programs allowed HSBC Bank USA to release provisions raised. HSBC’s Canadian operations reported an increase in cash operating profit before provisions of US$53 million, or 18 per cent. This performance was achieved through higher net interest income arising from lower funding costs and mortgage growth. Cash basis profit before tax increased by US$37 million, or 16 per cent to US$267 million. HSBC Markets USA reported a pre-tax loss of US$100 million largely as a result of losses on bond positions held when credit spreads widened significantly in the first half of the year. Following the acquisition of GFBital on 25 November 2002, HSBC’s operations in Mexico reported a cash basis pre-tax profit of US$35 million.
73
Back to Contents
HSBC HOLDINGS PLC
Financial Review (continued)
|
Net interest income increased by US$282 million, or 12 per cent, to US$2,732 million in 2002. In the United States, HSBC Bank USA’s domestic operations grew net interest income by US$176 million, or 9 per cent. The principal driver of growth was significantly reduced funding costs as the steeper yield curve led to spread increasing by 54 basis points. Treasury operations in particular benefited from the lower funding costs. There was also strong growth in residential mortgage lending. Average mortgage balances grew by US$1.8 billion, or 12 per cent, as consumers took advantage of the low interest rate environment to remortgage. These factors were partly offset by a lower benefit of net free funds, and a lower yield on investment securities as HSBC Bank USA sacrificed yield for security. In Canada, HSBC Bank Canada reported an increase in net interest income of US$58 million, or 12 per cent, to US$538 million. Lower cost funding increased spread by 25 basis points. Deposits grew by US$1.0 billion, or 10 per cent, as consumers sought to minimise risks whilst equity markets remained volatile, and the cost of funds fell by 170 basis points to 2.33 per cent. In addition, the bank achieved strong growth in mortgage lending, up US$1.0 billion as consumers took advantage of the introduction of a new variable interest rate mortgage, based on a similar product available through HSBC Bank plc in the United Kingdom, to remortgage.
Other operating income increased by US$7 million to US$1,502 million. Solid growth in fee income of 8 per cent was offset by lower dealing income. Fee income, excluding mortgage servicing rights, in HSBC Bank USA’s domestic operations, grew strongly by 18 per cent, driven by increases in wealth management fees, fees on deposit and cash management products and card fees. In addition, brokerage revenues increased, due in part to sales of annuity products and increased transaction volumes, and insurance revenues also grew strongly. Over 1,500 professionals are now licensed to sell insurance and certain annuity products through the retail network. Difficult conditions in the capital markets prevented a recurrence of 2001’s strong dealing profits, and profits on domestic US dollar trading fell. Income relating to mortgage servicing rights was in line with 2001. In Canada, HSBC’s Canadian operations reported an increase in other operating income of US$8 million, or 3 per cent, as growth in fees from account services and credit facilities was partially offset by the reduction in equity market-related fees. HSBC Canada withdrew from the institutional equity trading and research business in the first half of 2002. Other operating income in HSBC Markets USA fell by US$45 million, largely resulting from losses on corporate bond trading. HSBC’s operations in Mexico reported other operating income of US$75 million, up US$51 million compared with 2001 following the acquisition of GFBital.
Total operating expenses on a cash basis rose by US$135 million, or 5 per cent, to US$2,675 million in 2002. Of this increase, US$129 million arose as a result of the acquisition of GFBital, the launch of WTAS and increased revenue-related staff costs, offset by a reduction in development costs relating to HSBC’s world-wide internet development platform hsbc.com. HSBC Bank USA’s domestic operations reported an increase in costs of US$127 million, or 8 per cent. Staff costs increased by US$47 million, including US$22 million related to the establishment of WTAS, the remainder largely resulting from increased revenue-related compensation. Other administrative expenses increased by US$80 million, or 12 per cent, to US$764 million, resulting from higher IT costs, a number of one-off indirect taxation expenses, and costs arising from WTAS. HSBC Bank Canada reported an increase in costs of US$13 million, or 3 per cent. Staff costs remained flat, as costs incurred on restructuring the securities business were saved due to lower headcount and lower revenue-related remuneration. Other administrative costs increased by US$13 million, principally arising from the one-off expense relating to the consolidation of premises in Toronto and expenses relating to a brand marketing campaign. Operating expenses in HSBC Markets USA decreased by US$21 million, as revenue-related pay decreased.
74
Back to Contents
HSBC HOLDINGS PLC
The charge for bad and doubtful debts of US$300 million was the same as for 2001. HSBC Bank USA’s charge for bad and doubtful debts fell by US$68 million, or 30 per cent, to US$160 million. New specific provisions fell by US$38 million, as credit quality improved in 2002 and the non-recurrence of a specific provision against exposure to a corporate customer in the energy sector that arose in 2001. Releases and recoveries were US$26 million higher than in 2001, as restructuring and debt reduction programs enabled a number of provisions raised in previous years against corporate customers to be released or recovered. The charge for bad and doubtful debts in Canada of US$81 million was US$22 million, or 37 per cent, higher than in 2001, mainly reflecting a provision for an exposure in the telecommunications sector.
Provisions for contingent liabilities and commitments were US$585 million lower than in 2001, due to the non-recurrence of the Princeton Note settlement in 2001.
Gains on the disposal of fixed assets of US$125 million were in line with 2001, and reflected gains on the disposal of mortgage-backed and South American securities.
| Year ended 31 December 2001 compared with year ended 31 December 2000 |
The United States economy continued to deteriorate in 2001 with investment spending significantly down, particularly in the technology sectors. Despite rising unemployment, consumer spending remained resilient, boosted by lower interest rates as the Federal Reserve Bank cut short-term interest rates 11 times during the year. Although these sharply lower interest rates led to rising consumer debt, demand for corporate loans continued to weaken. For 2001 as a whole, GDP growth slowed to 1.1 per cent compared to growth of 4.1 per cent in 2000. Weaker growth and lower oil prices resulted in a sustained decline in inflation to just 1.5 per cent by the end of 2001. In New York State, unemployment has risen from a cyclical low of 4 per cent early in 2001 to 6 per cent by the end of 2001.
The year was marked by the tragic events on 11 September. In New York City, HSBC responded immediately to the tragedy with a number of donations and programs to assist with the rebuilding of the community. Although HSBC Bank USA’s branch at Five World Trade Center was destroyed we were fortunate that none of our employees was killed or injured. As contingency plans were activated, communications and business activities were resumed and the resilience of New York as a city and its inhabitants was awe inspiring to observe. Although the direct impact on HSBC’s profitability was small the effect of 11 September will remain with our staff and the Group owes a large debt of gratitude for the exemplary way they have continued to deal with our customers and the broader community in New York.
Unsurprisingly, given Canada’s extremely high dependence on the US economy for trade and investment flows, Canada also registered weaker activity in 2001. Aggressive interest rate cuts limited the extent of the downturn but rising unemployment fed through into weaker consumer spending and poor corporate profits which kept investment spending weak. The Canadian dollar was slightly weaker relative to the US dollar at the end 2001.
HSBC’s operations in North America contributed US$1,535 million to cash basis profit before tax; US$377 million, or 33 per cent, higher than in 2000. Non trading items most notably the cost of the Princeton Note settlement and development costs of US$164 million incurred on HSBC’s ‘e’ commerce platform hsbc.com in its development centre in New York caused reported profit before tax to fall by US$357 million, or 42 per cent, to US$503 million.
HSBC Bank USA’s operations in the United States reported an increase of US$402 million, or 46 per cent, in cash basis profit before tax (excluding the provision for Princeton Note settlement) in 2001, due largely to increased levels of net interest income and gains on disposal of securities, principally mortgage backed. HSBC’s Canadian operations cash basis pre-tax profit of US$230 million in 2001 was US$6 million lower compared with 2000. At constant exchange rates, HSBC’s Canadian operations cash basis pre-tax profits were US$3 million higher than in 2000 as increased levels of net interest income offset higher charges for bad and doubtful debts and the losses incurred by the Canadian operations of the Merrill Lynch HSBC joint venture.
75
Back to Contents
HSBC HOLDINGS PLC
Financial Review (continued)
|
Net interest income increased by US$265 million, or 12 per cent to US$2,450 million when compared to 2000. In the United States net interest income was US$222 million higher than in 2000. The increase in net interest income in HSBC Bank USA’s domestic operations’ of US$269 million, or 15 per cent, was partly offset by a decline in HSBC Markets USA. HSBC Bank USA’s domestic operations average interest-earning assets increased by US$4.4 billion, of which US$2.6 billion reflected strong growth in residential mortgages as home-owners took the opportunity, as interest rates fell, to re-mortgage at lower rates. Spreads on residential mortgages however widened as the steeper yield curve allowed the increase in average-interest earning assets to be funded with low costing customer deposits. In addition, spreads on treasury investment operations widened due to higher levels of available net free funds and the effects of the 11 interest rate cuts during the year. However, the net interest income decline in HSBC Markets USA reflected the impact of trading strategies during the year where funding costs were incurred as part of arbitrage operations. Net interest income was lower by US$50 million while dealing profits rose by US$86 million. Net interest income in Canada was US$28 million, or 6 per cent, higher than in 2000 (10.6 per cent at constant exchange rates) and reflected the effects of the combination of higher levels of average interest-earning assets, primarily residential mortgages, and a widening in interest spread. Net interest income in Panama was US$29 million higher in 2001, following the acquisition of Chase Manhattan’s branch network in Panama in the second half of 2000.
Other operating income was US$157 million higher than in 2000 with a solid increase in dealing profits. Dealing profits at US$346 million were US$117 million, or 51 per cent, higher than in 2000. As noted above HSBC Markets USA reported a US$86 million, or 92 per cent, increase in profits on debt securities and US treasury activities over 2000. In addition, HSBC Bank USA reported increased profits on foreign exchange trading. The dealing profits in HSBC’s Canadian operations were lower than in 2000 as operations were scaled back in the unsettled market conditions.
Fee income at US$913 million was US$51 million higher than in 2000. In the United States, the harmonisation of product lines between HSBC and the former Republic Bank of New York, the volume of annuities sold (a product which is especially attractive in a low rate environment) and other wealth management initiatives all contributed to a 15.2 per cent increase in fee income. There was also a 44 per cent increase in insurance revenue when compared to 2000. Fee income in Canada, excluding the contribution to 2000 of HSBC Invest Direct (Canada) Inc (which was transferred to the Merrill Lynch HSBC joint venture in the fourth quarter of 2000), was US$16 million lower than in 2000 as a 13 per cent increase in personal and commercial services revenues only partly offset lower levels of broking and capital market fees in weaker equity stock markets.
As part of its strategy of providing customers with multiple choices for product and service delivery, HSBC Bank USA offered a comprehensive Internet Banking service. At 31 December 2001, more than 275,000 customers had registered for the service, up from approximately 80,000 at year-end 2000. The HSBC Bank USA web site, us.hsbc.com, where customers can apply for accounts, conduct financial planning and link to online services, received over 37,000 visits daily.
During 2001, HSBC’s second generation strategic internet banking platform being developed in the United States hsbc.com launched its first business applications. The hsbc.com program has been designed to maximise the ability to offer any or all of our services to any or all of our customers. hsbc.com provides a common presentation and browser capability. By adopting this approach, we enhance the choices our customers have in selecting how they want to do business with us, while reducing our cost of providing the services. All the key systems, which provide our core services, are planning on integrating with hsbc.com over the next five years.
Operating expenses, excluding goodwill amortisation, of US$2,540 million in 2001 were US$144 million, or 6 per cent higher than for 2000. Of this increase, US$164 million related to development costs associated with hsbc.com. Excluding these costs and adjusting for the transfer of HSBC InvestDirect (Canada) Inc, underlying costs were US$29 million, or 1 per cent, lower than in 2000. HSBC Markets USA’s operating expenses increased by US$58 million all of which related to higher staff costs reflecting higher levels of performance-related bonuses on improved trading revenues together with additional headcount building on the successful trading platform in place. Operating expenses in the domestic operations of HSBC Bank USA were 2 per cent lower compared to 2000. A reduced level of acquisition related restructuring charges in 2001 was offset by business expansion in treasury, wealth management and e-commerce, and increased marketing expenses. Higher depreciation expense resulting from infrastructure improvements represents a delayed restructuring charge. In Canada, excluding HSBC Invest Direct Inc’s costs in 2000, operating expenses were US$29 million lower, or 6 per cent, of which US$24 million related to lower staff costs mainly lower performance related bonuses as a result of lower levels of trading revenues in the scaled back equity operations. Lower volumes of transaction-driven costs and continuing efforts to improve operational efficiencies reduced other operating expenses by US$5 million.
76
Back to Contents
HSBC HOLDINGS PLC
Credit quality deteriorated modestly during 2001. In the United States new specific provisions of US$313 million, were US$25 million lower than in 2001 and took into account requirements against an exposure to a corporate customer in the energy sector. An increase in new specific provisions in Canada of US$40 million related to the deterioration of a small number of commercial facilities, notably in the telecommunications sector. Releases and recoveries were consistent with 2000 and the net increase in the bad and doubtful debt charge of US$143 million reflects the release of general provision in the United States in 2000 not repeated in 2001.
In terms of non-performing loans overall credit quality remained stable in 2001 with non-performing loans at 31 December 2001 at US$671 million compared with US$684 million at 31 December 2000. It was early to determine the medium to longer-term effect that the events of 11 September, the impact on market liquidity of the Enron collapse and the general economic slowdown may have on the overall credit portfolio.
Gains on disposal of investments amounted to US$132 million, an increase of US$97 million compared with 2000. During the year, but substantially in the first half, HSBC’s operations in the United States sold mortgage-backed securities to reduce exposure to refinancing mortgages in a declining interest rate environment.
| |
| Cash basis profit before tax |
| | | Year ended 31 December
| |
Figures in US$m | | | 2002 | | | 2001 | | | 2000 | |
| |
| Brazil | | | 127 | | | 136 | | | 208 | |
| Argentina | | | (210 | ) | | (1,152 | ) | | 112 | |
| Chile | | | 72 | | | 17 | | | 8 | |
| Other | | | (23 | ) | | (3 | ) | | (15 | ) |
| |
| | | | (34 | ) | | (1,002 | ) | | 313 | |
| |
| | | Year ended 31 December
| |
Figures in US$m | | | 2002 | | | 2001 | | | 2000 | |
| |
| Net interest income | | | 645 | | | 1,065 | | | 1,186 | |
| Dividend income | | | 15 | | | 12 | | | 8 | |
| Net fees and commissions | | | 324 | | | 494 | | | 471 | |
| Dealing profits | | | 147 | | | 18 | | | 57 | |
| Other income | | | 110 | | | 356 | | | 396 | |
| Other operating income | | | 596 | | | 880 | | | 932 | |
| |
Total operating income | | | 1,241 | | | 1,945 | | | 2,118 | |
| Staff costs | | | (572 | ) | | (836 | ) | | (890 | ) |
| Premises and equipment | | | (113 | ) | | (153 | ) | | (162 | ) |
| Other | | | (330 | ) | | (435 | ) | | (486 | ) |
| Depreciation | | | (45 | ) | | (73 | ) | | (64 | ) |
| | | | (1,060 | ) | | (1,497 | ) | | (1,602 | ) |
| Goodwill amortisation | | | (24 | ) | | (14 | ) | | (12 | ) |
| | |
|
| |
|
| |
|
| |
| Operating expenses | | | (1,084 | ) | | (1,511 | ) | | (1,614 | ) |
| |
Operating profit before provisions | | | 157 | | | 434 | | | 504 | |
| Provisions for bad and doubtful debts | | | (117 | ) | | (927 | ) | | (194 | ) |
| Loss from foreign currency redenomination in Argentina | | | (68 | ) | | (520 | ) | | – | |
| Provisions for contingent liabilities and commitments | | | (31 | ) | | – | | | – | |
| Amounts written off fixed asset investments | | | (36 | ) | | (1 | ) | | (1 | ) |
| |
Operating (loss)/profit | | | (95 | ) | | (1,014 | ) | | 309 | |
| Share of operating profit in associated undertakings | | | – | | | 1 | | | 1 | |
| Gains/(losses) on disposal of investments and tangible fixed assets | | | 37 | | | (3 | ) | | (9 | ) |
| |
(Loss)/profit on ordinary activities before tax | | | (58 | ) | | (1,016 | ) | | 301 | |
| |
| Share of HSBC’s pre-tax profits (cash basis) (per cent) | | | (0.3 | ) | | (11.4 | ) | | 3.1 | |
| Share of HSBC’s pre-tax profits (per cent) | | | (0.6 | ) | | (12.7 | ) | | 3.1 | |
| Cost:income ratio (excluding goodwill amortisation) (per cent) | | | 85.4 | | | 77.0 | | | 75.6 | |
| Period-end staff numbers (full-time equivalent) | | | 25,522 | | | 27,519 | | | 25,671 | |
77
Back to Contents
HSBC HOLDINGS PLC
Financial Review (continued)
|
| | | Year ended 31 December
| |
Figures in US$m | | | 2002 | | | 2001 | | | 2000 | |
| |
| Loans and advances to customers | | | | | | | | | | |
| – specific charge | | | | | | | | | | |
| new provisions | | | 388 | | | 346 | | | 232 | |
| release of provisions no longer required | | | (48 | ) | | (35 | ) | | (28 | ) |
| recoveries of amounts previously written off | | | (10 | ) | | (8 | ) | | (9 | ) |
| | | | 330 | | | 303 | | | 195 | |
| – additional general charge against Argentine exposure | | | (196 | ) | | 600 | | | – | |
| – general charge/(release) | | | (17 | ) | | 24 | | | (1 | ) |
| |
| Customer bad and doubtful debt charge | | | 117 | | | 927 | | | 194 | |
| |
| | | | | | | | | |
| Total bad and doubtful debt charge | | | 117 | | | 927 | | | 194 | |
| |
| Customer bad debt charge as a percentage of closing gross loans and advances | | | 3.27% | | | 17.80% | | | 3.04% | |
| | | | | | | | | | | |
Figures in US$m | | | At 31
December
2002 | | | At 31
December
2001 | |
|
Assets | | | | | | | |
| Loans and advances to customers (net) | | | 3,028 | | | 4,156 | |
| Loans and advances to banks (net) | | | 1,665 | | | 2,252 | |
| Debt securities, treasury bills and other eligible bills | | | 1,450 | | | 3,386 | |
| Total assets | | | 8,491 | | | 13,097 | |
| | | | | | |
Liabilities | | | | | | | |
| Deposits by banks | | | 661 | | | 1,338 | |
| Customer accounts | | | 4,863 | | | 7,523 | |
| |
| Year ended 31 December 2002 compared with year ended 31 December 2001 |
2002 has been a year of uncertainty in both Brazil and Argentina. The Argentine government has been in talks with the International Monetary Fund and World Bank for over a year, however an agreement on the resumption of lending has yet to be reached. The Argentine economy has experienced its fourth successive year of recession with a large contraction in GDP, falling 12 per cent, and unemployment continuing to rise. However, some stability was introduced towards the end of 2002, as the peso began to appreciate from its lows as fears of hyperinflation began to recede and a significant trade surplus emerged. Elections are expected to take place in the second quarter of 2003.
Brazil skillfully avoided major fall-out from the collapse of the Argentine economy and steadily improved its current account position through growing its trade surplus with the rest of the world. Uncertainty over the outcome of presidential elections held in the second half of 2002 led to a sharp depreciation in the value of the real and upward pressure on interest rates in the first half of the year. The newly elected government quickly stated its commitment to fiscal discipline, leading to improved stability towards the end of 2002 reflected in lower interest rates and a stronger currency.
HSBC’s operations in South America reported a cash basis operating profit before provisions of US$181 million, compared with US$448 million in 2001. At constant exchange rates, cash basis operating profit before provisions was US$137 million, or 43 per cent, lower than in 2001. Cash basis losses before tax improved substantially to US$34 million, compared with a loss of US$1,002 million in 2001.
In Brazil, cash basis operating profit before provisions of US$268 million was US$51 million, or 16 per cent, lower than in 2001. At constant exchange rates, cash basis operating profit before provisions was broadly in line with 2001. A strong performance in dealing income was offset by a loss of revenue from account services, as new legislation prohibited the levying of fees on certain types of account. Higher contributions to employee pension schemes arising from higher levels of inflation also depressed results. In Argentina there was a cash basis operating loss before provisions of US$111 million, compared with a profit of US$117 million in 2001. These losses were driven primarily by the high cost of funding non performing assets. In addition, revenues from the insurance businesses were adversely affected by the prevailing market conditions. Cash basis losses before tax of US$210 million included further losses relating to the mandatory pesification of assets and liabilities of US$68 million. These arose mainly from court decisions (‘amparos’) relating to formerly frozen US dollar denominated customer deposits that were required to be settled at the prevailing market exchange rate.
The following commentary is based on constant exchange rates.
78
Back to Contents
HSBC HOLDINGS PLC
Net interest income of US$645 million was US$119 million, or 16 per cent lower than in 2001. In Brazil, net interest income was US$14 million, or 2 per cent, lower than in 2001. Customer lending, particularly overdrafts, term lending and credit cards grew strongly in 2002 in response to targeted marketing campaigns. Yield on customer lending was slightly higher than in 2001 as a result of higher pricing of term lending and instalment finance. The increases in customer lending were more than offset by a significant reduction in investment securities, as HSBC sought to minimise its exposure in the uncertain economic climate. In Argentina, net interest expense was US$16 million, compared with net interest income of US$85 million in 2001. HSBC Bank Argentina’s margin worsened from 5.65 per cent in 2001 to negative 2.71 per cent in 2002, mainly as a result of the high cost of funding the non-performing loan portfolio. In addition, th e reduction in net interest income reflected the fact that pesified mortgages and personal loans are specifically excluded from CER, an inflation adjustment applied to all pesified sovereign debt, deposit balances and certain (primarily commercial and corporate) customer loans.
Other operating income of US$596 million was US$24 million, or 4 per cent higher than in 2001. Fee income fell by US$27 million, or 8 per cent, but dealing profits increased by US$133 million to US$147 million as a result of the volatile economic conditions. In Brazil, other operating income increased by US$47 million, or 11 per cent, to US$489 million. Dealing profits increased by US$74 million on strong interest rate derivatives trading and foreign exchange trading. Fee income fell by US$22 million to US$281 million, reflecting a loss of revenue from account fees, as the Brazilian government outlawed the levying of fees on certain accounts. Fees were also lower from investment banking services. However, the above factors were partly offset by strong growth in credit-related fee income. Income from insurance business fell 4 per cent compared with 2001. In Argentina, other operating income of US$70 million was US$39 million, or 36 pe r cent lower, than in 2001. The reduction was principally as a result of considerably lower net revenues from the insurance businesses. HSBC was obliged to renegotiate a number of contracts as a result of the mismatch between premiums and claims arising from the pesification of assets and liabilities. In addition, HSBC’s pension fund administrator suffered reduced revenues due to increased levels of unemployment. Foreign exchange dealing profits improved as some resumption in activity was permitted.
Cash operating expenses rose by US$39 million, or 4 per cent, to US$1,060 million. In response to the difficult economic conditions in South America, the full time equivalent number of staff has been reduced by 2,000. However, staff costs in 2002 rose by US$16 million to US$572 million. In Brazil, operating expenses of US$873 million were US$32 million, or 4 per cent higher than in 2001. Staff costs increased by US$17 million driven mainly by higher pension contributions required as a result of higher levels of inflation, and an industry-wide union-agreed salary increase. Other administrative expenses increased by US$15 million as a result of an increase in the levels of transactional taxation imposed by the government. In Argentina, operating expenses on a cash basis rose by US$13 million to US$165 million. The reduction of 1,000 in headcount reduced costs by US$2 million, however this saving was offset by severance payments made. T here was further additional expense resulting from transactional taxation, including an additional tax imposed on foreign companies. HSBC wrote off during 2002 the remaining goodwill of US$20 million that arose on the purchase of its insurance subsidiaries.
The provision for bad and doubtful debts of US$117 million was US$361 million lower than in 2001. In 2001, a special general provision of US$292 million (at constant exchange rates) was raised to provide a coverage ratio of 63 per cent against Argentina’s non-government loan book. In 2002, US$196 million of bad debts arising have been specifically provided and the general provision requirement was reduced accordingly. The remaining US$96 million of general provisions has been critically reviewed and is believed to be sufficient to cover remaining credit risk in the loan portfolio. In Brazil, the bad debt charge of US$139 million was US$10 million, or 7 per cent lower than in 2001. New provisions against customers increased by US$29 million, as a result of a specific corporate exposure and as a result of the increasing level of personal lending, including credit cards, term lending and overdrafts. However, pro-active management o f the personal loan portfolio has enabled a number of provisions, particularly in the cards portfolio, to be released. In addition, further releases have been made of provisions raised against the commercial sector.
In the first half of 2002, HSBC realised a gain of US$38 million on the sale of its 6.99 per cent shareholding in Banco Santiago S.A.
79
Back to Contents
HSBC HOLDINGS PLC
Financial Review (continued)
|
| |
| Year ended 31 December 2001 compared with year ended 31 December 2000 |
The main focus in South America has been Argentina, where following the inability to secure a financing package from the International Monetary Fund (‘IMF’), the Argentine government introduced measures to restrict the withdrawal of US dollar denominated deposits and the transfer of monies abroad. Following the declaration of a state of siege by the Argentine government, in late December, the president and the three subsequent incumbents resigned within a space of two weeks. In January 2002 the new president, Eduardo Dulhalde, formally announced that Argentina would default on its sovereign debt and at the same time announced the “pesification” of certain in-country US dollar denominated assets and liabilities. In addition, after a brief period of dual exchange rates (with a floating rate for financial transactions and a fixed rate for trade), the fixed exchange rate policy of one-to-one parity with the US dollar was abandoned and the peso m oved to a freely floating basis. Against this background of uncertainty and turmoil the Argentine economy contracted by around 5 per cent in 2001, the third successive year of recession. This economic downturn is forecast to worsen during 2002.
Encouragingly, despite the Argentine crisis, the Brazilian economy remained relatively stable. Initially the Argentine crisis prompted a sharp devaluation of the real which prompted the Central bank to raise interest rates by 375 basis points, between January 2001 and July 2001, to control inflationary pressures and dampen domestic demand. In the fourth quarter, a combination of sharp cuts in US interest rates and an improved Brazilian current account balance resulted in the real recovering to be only 15.6 per cent lower against the US dollar over the course of 2001. It is anticipated that GDP growth in 2001 was around 2 per cent (compared to forecast growth of 4 per cent) with inflation slightly higher at 7.7 per cent compared with 5.97 per cent in 2000.
HSBC’s operations in South America reported a cash basis pre-tax loss of US$1,002 million in 2001 compared with a cash basis pre-tax profit of US$313 million in 2000. In view of the continuing unsettled and deteriorating economic environment in Argentina, the bad debt charge arising on HSBC’s Argentine exposure was US$723 million higher than that in 2000 and included a US$600 million additional general provision charge raised against this exposure. In addition, the 2001 pre-tax loss included a loss of US$520 million arising from the pesification of HSBC Argentina’s US dollar assets and liabilities at mandatory differing rates of exchange which destroyed capital in the Argentine banking system. In Brazil, cash basis profit before tax of US$136 million, US$72 million lower than in 2000, reflected curtailment in the rate of credit expansion during 2001 as a consequence of volatility in foreign exchange and interest rate m arkets reflecting concerns over the Argentine economy, energy shortages and political uncertainties. At constant exchange rates, cash basis pre-tax profits in Brazil were only US$28 million lower than in 2000.
The following commentary on South America’s results is based on constant exchange rates.
Net interest income in South America at US$1,065 million was US$71 million higher than in 2000. In Brazil net interest income was US$98 million, or 14 per cent, higher than in 2000 reflecting increased levels of corporate and retail lending (principally arising from the full years contribution from CCF’s Brazilian operations) and holdings of US dollar linked securities to take advantage of wider spreads from lower funding costs. This was partly offset by a decline in HSBC Bank Brasil’s net interest margin reflecting a change in asset mix to an increase in the proportion of less risky but lower-yielding assets. In Argentina, net interest income was US$17 million lower than in 2000 and reflected higher funding costs on rising interest rates.
Other operating income of US$880 million was US$71 million, or 9 per cent, higher than in 2000 with an increase of US$103 million in fee income. In Brazil, fee income increased by US$79 million, or 27.6 per cent, as the HSBC Brazilian operation continued to develop wealth management business, particularly asset management activities, and the successful cross-sales of products to existing customers through the retail branch network. Fees from asset management grew by 48 per cent compared to 2001 and at 31 December 2001 funds under management stood at US$9.0 billion (US$3.9 billion of which arose from the acquisition of CCF Brasil). In total, funds under management by our Brazilian operations now rank fifth largest in Brazil. Life insurance premia grew by 24 per cent and now represent 36 per cent (34 per cent in 2000) of total insurance premia. In Argentina, fee income was US$30 million, or 32.6 per cent, higher than in 2000. Initiativ es taken to improve revenue mix were reflected in higher levels of fees from credit cards and asset management. In addition, fee income reflected fees earned from being an arranger and market-maker for Argentine government bond auctions.
80
Back to Contents
HSBC HOLDINGS PLC
The increased contribution from fee income was partly offset by lower levels of dealing profits. Brazil’s dealing profits of US$20 million were US$7 million lower than in 2000 as losses were incurred on interest rate trading positions as interest rates rose. These losses were only partly offset by higher levels of dealing profits on foreign exchange and debt securities trading. Argentina reported dealing losses of US$6 million compared to dealing profits of US$16 million in 2000. This resulted from difficult trading conditions as a result of volatility in foreign exchange rates and losses on bond positions. HSBC’s Argentine pensions, healthcare and life insurance businesses also reported falls in income as rising unemployment and collapsing economic conditions led to a 6 per cent fall in healthcare membership, reduced contributions to pensions funds and a reduction in annuities business.
Operating expenses, excluding goodwill amortisation, of US$1,497 million were US$133 million, or 10 per cent, higher than 2000. In Brazil operating expenses of US$1,023 million, were higher by US$141 million reflecting the acquisition of CCF Brasil and restructuring provisions. As economic conditions became less certain cost controls were put in place to restrain operating expense growth with a number of contracts renegotiated. Investment in electronic distribution channels continued and HSBC Bank Brasil’s internet and wireless banking services expanded with a twofold increase in the number of registered Internet Bank users since December 2000, to 420,000 performing on average 1.9 million on-line transactions a month. The newer Wireless Services, which encompass e-mail, Cellular and Palm Banking, have 24,000 users, a 40 per cent increase since June 2001. In Argentina, cost controls were rigorously enforced and the increase in op erating expenses of US$11 million was due mainly to the write-down to market value of certain properties now considered to be permanently impaired.
Provisions for bad and doubtful debts of US$927 million increased by US$765 million compared to 2000. In Brazil, the significant increase in provisioning requirements of US$80 million reflected a change in the lending portfolio mix. Targeted growth in the high margin personal lending portfolio led to an expected and corresponding increase in delinquencies and provisioning levels rose to reflect the underlying risks within the consumer portfolio. In Argentina, provisions for bad and doubtful debts rose substantially to reflect the disastrous economic conditions and financial uncertainties. This is reflected in the US$681 million increase in the bad and doubtful debt provisions to US$737 million compared to US$56 million in 2000.
Analysis by line of business
|
Profit on ordinary activities before tax (cash basis) by line of business |
| | | Year ended
| |
| | | 31 December
2002
| | 31 December
2001*
| | 31 December
2000*
| |
| | | | US$m | | | % | | | US$m | | | % | | | US$m | | | % | |
| |
| Personal Financial Services | | | 3,543 | | | 33.7 | | | 3,457 | | | 39.3 | | | 3,010 | | | 29.2 | |
| Commercial Banking | | | 3,034 | | | 28.8 | | | 2,385 | | | 27.1 | | | 2,780 | | | 27.0 | |
| Corporate, Investment Banking and Markets | | | 3,717 | | | 35.4 | | | 4,033 | | | 45.8 | | | 3,559 | | | 34.6 | |
| Private Banking | | | 420 | | | 4.0 | | | 456 | | | 5.2 | | | 578 | | | 5.6 | |
| Other | | | (201 | ) | | (1.9 | ) | | (1,524 | ) | | (17.4 | ) | | 373 | | | 3.6 | |
| |
| | | | 10,513 | | | 100.0 | | | 8,807 | | | 100.0 | | | 10,300 | | | 100.0 | |
| |
| * | Restated for changes in management responsibility. The principal change relates to aligning domestic private banking with international private banking in the United States. |
The cash basis measures included in this section are derived by deducting goodwill amortisation from the equivalent reported measure.
Total assets by line of business |
| | | Year ended
| |
| | | 31 December
2002
| | 31 December
2001
| |
| Total assets# | | | US$m | | | % | | | US$m | | | % | |
| |
| Personal Financial Services | | | 171,496 | | | 22.9 | | | 138,908 | | | 20.2 | |
| Commercial Banking | | | 113,525 | | | 15.1 | | | 101,002 | | | 14.7 | |
| Corporate, Investment Banking and Markets | | | 394,542 | | | 52.6 | | | 374,282 | | | 54.4 | |
| Private Banking | | | 48,346 | | | 6.5 | | | 52,135 | | | 7.6 | |
| Other | | | 21,892 | | | 2.9 | | | 21,281 | | | 3.1 | |
|
| | | | 749,801 | | | 100.0 | | | 687,608 | | | 100.0 | |
|
| # | Excluding Hong Kong SAR Government certificates of indebtedness. |
81
Back to Contents
HSBC HOLDINGS PLC
Financial Review (continued)
|
| |
Net assets by line of business |
| | | Year ended
| |
| | | 31 December
2002
| | 31 December
2001
| |
| | | | US$m | | | % | | | US$m | | | % | |
| |
| Personal Financial Services | | | 12,101 | | | 23.0 | | | 9,309 | | | 20.1 | |
| Commercial Banking | | | 10,290 | | | 19.6 | | | 9,108 | | | 19.6 | |
| Corporate, Investment Banking and Markets | | | 16,852 | | | 32.2 | | | 15,046 | | | 32.4 | |
| Private Banking | | | 7,366 | | | 14.1 | | | 6,195 | | | 13.4 | |
| Other | | | 5,797 | | | 11.1 | | | 6,730 | | | 14.5 | |
| |
| | | | 52,406 | | | 100.0 | | | 46,388 | | | 100.0 | |
| |
The data presented on pages 83 to 96 reflects an analysis of HSBC’s results and of certain key balance sheet amounts, according to the lines of business described on pages 12 to 14. This provides additional and complementary analysis to HSBC’s segmental reporting by geographic region.
The figures for 2001 and 2000 have been restated where changes in management responsibility for the business this year impact on comparatives. The principal change relates to aligning domestic private banking with international private banking in the United States and therefore moving the results from Personal Financial Services into Private Banking. Total assets and net assets split by line of business are disclosed for the first time with 2001 comparatives. Year 2000 comparatives are not available.
The results are presented in accordance with the accounting policies used in the preparation of HSBC’s consolidated financial statements. HSBC’s operations are closely integrated and, accordingly, the presentation of line of business data includes internal allocations of certain items of income and expense. These allocations include the costs of certain support services and head office functions, to the extent that these can be meaningfully attributed to operational business lines. While such allocations have been made on a systematic and consistent basis they necessarily involve a degree of subjectivity.
Where relevant, income and expense amounts presented include the results of inter-company and inter-business line transactions. Such transactions are undertaken on arm’s-length terms. Intra-segment funding and placement of surplus funds is generally undertaken at market interest rates.
The reported results of each line of business include the funding benefit of shareholders’ funds allocated to that business. Shareholders’ funds are generally allocated to lines of business on the basis of economic capital measures including the relative risk-weighted assets of each operation.
In the analysis of profit by line of business, total operating income and operating expenses include intra-HSBC items of US$1,148 million, US$1,057 million in 2001 and US$931 million in 2000.
All commentary is made on a cash basis, that is excluding the impact of goodwill amortisation.
82
Back to Contents
HSBC HOLDINGS PLC
Personal Financial Services
|
| Cash basis profit before tax |
| | | Year ended
| |
| | | 31 December 2002 | | 31 December 2001* | | 31 December 2000* | |
| | |
| |
| |
| |
| | | | US$m | | | % | | | US$m | | | % | | | US$m | | | % | |
| |
| Europe | | | 987 | | | 27.8 | | | 1,091 | | | 31.6 | | | 624 | | | 20.7 | |
| Hong Kong | | | 1,705 | | | 48.1 | | | 1,631 | | | 47.2 | | | 1,680 | | | 55.8 | |
| Rest of Asia-Pacific | | | 127 | | | 3.6 | | | 80 | | | 2.3 | | | 189 | | | 6.3 | |
| North America | | | 757 | | | 21.4 | | | 593 | | | 17.1 | | | 482 | | | 16.0 | |
| South America | | | (33 | ) | | (0.9 | ) | | 62 | | | 1.8 | | | 35 | | | 1.2 | |
| |
| | | | 3,543 | | | 100.0 | | | 3,457 | | | 100.0 | | | 3,010 | | | 100.0 | |
| |
| | Year ended | |
| |
| |
| Figures in US$m | | | 31 December 2002 | | | 31 December 2001* | | | 31 December 2000* | |
| |
| Net interest income | | | 7,581 | | | 6,828 | | | 6,508 | |
| |
| Dividend income | | | 6 | | | 5 | | | 1 | |
| Net fees and commissions | | | 2,979 | | | 2,877 | | | 2,644 | |
| Dealing profits | | | 50 | | | 53 | | | 97 | |
| Other income | | | 788 | | | 806 | | | 711 | |
| Other operating income | | | 3,823 | | | 3,741 | | | 3,453 | |
| |
| Total operating income | | | 11,404 | | | 10,569 | | | 9,961 | |
| | | | | | | | | | | |
| Operating expenses (excluding goodwill amortisation) | | | (6,973 | ) | | (6,477 | ) | | (6,237 | ) |
| |
| Operating profit before provisions | | | 4,431 | | | 4,092 | | | 3,724 | |
| |
| Provisions for bad and doubtful debts | | | (857 | ) | | (767 | ) | | (602 | ) |
| Provisions for contingent liabilities and commitments | | | (42 | ) | | (17 | ) | | (31 | ) |
| Amounts written off fixed asset investments | | | (2 | ) | | (5 | ) | | – | |
| |
Operating profit | | | 3,530 | | | 3,303 | | | 3,091 | |
| |
| Share of operating (losses) in joint ventures | | | (23 | ) | | (99 | ) | | (52 | ) |
| Share of operating profit/(losses) in associates | | | 17 | | | 43 | | | (44 | ) |
| Gains on disposal of investments and tangible fixed assets | | | 19 | | | 210 | | | 15 | |
| |
Profit on ordinary activities before tax (cash basis) | | | 3,543 | | | 3,457 | | | 3,010 | |
| |
| Share of HSBC’s pre-tax profits (cash basis) (per cent) | | | 33.7 | | | 39.3 | | | 29.2 | |
| | |
| Cost: income ratio (excluding goodwill amortisation) (per cent) | | | 61.1 | | | 61.3 | | | 62.6 | |
| | | | | | | | | | | |
| Selected balance sheet data (third party items only) |
| | | At
| |
Figures in US$m | | | 31 December 2002 | | | 31 December 2001* | | | 31 December 2000* | |
| |
| Loans and advances to customers (net) | | | 143,696 | | | 113,844 | | | 103,901 | |
| Customer deposits | | | 257,880 | | | 228,931 | | | 216,058 | |
| * | Restatement consistent with page 81. |
| |
| Year ended 31 December 2002 compared with year ended 31 December 2001 |
On a cash basis Personal Financial Services contributed US$3,543 million to pre-tax profits in 2002 and represented 33.7 per cent of such profits. Growth in pre-tax profits over 2001 amounted to US$86 million, an increase of 2 per cent.
Revenues grew by 8 per cent driven by strong growth in net interest income as mortage banking and personal savings grew strongly. Cost growth of 8 per cent tracked revenue growth, with benefits from moving activity to the HSBC’s Group’s Shared Service Centres offset by increased marketing costs and property costs arising on surplus space following relocation of the PFS central London based staff to the new head office at Canary Wharf.
Provisions for bad and doubtful debts rose by US$90 million, an increase of 12 per cent, but less than the rise in customer lending. Disposal gains were significantly lower than 2001, which benefited from the sale of the HSBC’s interest in British Interactive Broadcasting in May 2001.
Net interest income increased by US$753 million or 11 per cent. Within this, net interest income in Europe rose by US$405 million as the investment made in improving customer relationship management systems improved the ability of front office staff in the branches to sell more effectively. In the low interest rate environment, there has been significant growth in personal lending and with the property market continuing to rise there has been strong demand for mortgages and equity release loans. Personal current accounts and savings accounts continued to grow as customers preferred liquidity and security in the uncertain investment climate. The impact of product re-pricing initiatives in the UK in late 2001 and the benefit of lower cost of funds has increased spreads.
83
Back to Contents
HSBC HOLDINGS PLC
Financial Review (continued)
|
In Hong Kong, net interest income was broadly in line with 2001. The benefits of increased credit card and mortgage lending and improved spreads arising from lower funding deposit costs were largely offset by the impact of competitive pricing initiatives on residential mortgage spreads. In addition, there was also a reduction in the benefit of free funds as average interest rates remained low.
Net interest income grew by US$107 million within the rest of Asia-Pacific driven by significant growth in credit card advances and personal lending across the region, particularly in Taiwan, Singapore and India. In Malaysia growth also reflected the acquisition of the ABN AMRO mortgage portfolio in the first half of 2002 together with significant growth in credit card advances. In Australia the inclusion of a full year’s income from the acquisition of the former NRMA Building Society in November 2001 contributed to increased net interest income.
In North America, net interest income rose by US$258 million of which US$60 million reflected the inclusion of GFBital since acquisition in late November 2002. Excluding the impact of GFBital, the rise in net interest income reflected growth in deposits and record mortgage banking activity as customers sought to minimise risks whilst equity markets remain volatile and invested in property. Homeowners also took advantage of the low interest rate environment to re-mortgage at lower rates. The increase in spreads arising from lower funding costs was partly offset by a lower benefit of net free funds.
Net interest income in South America was US$27 million lower than 2001, reflecting the effect of the severe economic conditions in Argentina and the impact of non-performing loans, together with currency translation impacts.
In Brazil, net interest income rose by US$21 million or 29 per cent in local currency terms as competitive pricing initiatives and targeted marketing campaigns led to strong growth in personal lending products, particularly credit cards and overdrafts.
Net fees and commissions increased by US$102 million or 4 per cent. Hong Kong was the major contributor, where net fees increased by US$64 million driven by growth in revenues from wealth management products, increased commissions from sales of unit trusts, higher revenues from insurance and increased card fee income.
In Europe, fee income was broadly in line with 2001 in constant currency terms. The inclusion of a full year’s income for Demirbank, and Benkar from September 2002, resulted in increased card fee income on the acquired credit card portfolios. Elsewhere, increased sales of HSBC branded life, critical illness and income protection products, were offset by the impact of the sustained fall in equity markets which reduced the value of long-term assurance business and depressed sales of investment products.
Net fees grew by US$41 million in the rest of Asia-Pacific largely due to a significant increase in credit card income principally in Taiwan, Malaysia, Indonesia and the Middle East, in addition to growth in account service fee income.
In North America, excluding the impact of GFBital, which contributed US$35 million, net fees increased by US$34 million, reflecting strong growth in brokerage and wealth management products and successful re-pricing of account service charges.
Net fees in South America declined by US$110 million mainly due to the effect of the severe economic conditions in Argentina and turbulent financial markets during the year. In Brazil, the decline in fee income reflected competitive pricing initiatives and the loss of revenue from account fees as the Brazilian government have outlawed the levying of fees on certain accounts.
Other income decreased by US$18 million. Increases in Hong Kong, rest of Asia-Pacific and North America were more than offset by reductions in South America and Europe.
Operating expenses increased US$496 million or 8 per cent. Costs in Europe increased by US$356 million, including a full year’s costs for Demirbank, the acquisition of Benkar and the full consolidation of Merrill Lynch HSBC from July 2002. Excluding the impact of these acquisitions, costs rose by US$227 million in part reflecting increased premises and equipment costs relating to the relocation to a new headquarters in the second half of 2002, and increased marketing and IT costs, as further investment was made in both front office and customer contact systems.
84
Back to Contents
HSBC HOLDINGS PLC
In constant currency terms, the UK bank’s staff costs fell by 2 per cent due to the impact of outsourcing and offshore processing.
Costs in Hong Kong were in line with 2001. The increased cost of continuing marketing initiatives and higher IT costs to support business growth were funded by reduction in staff costs driven by a reduction in headcount as back office processing functions transferred to HSBC’s service centres in India and China, and the non-recurrence of pension top-up fees in Hang Seng Bank in 2001.
In the rest of Asia-Pacific costs increased by US$114 million reflecting an increase in costs in Australia resulting from the acquisition of NRMA Building society in November 2001 and increased costs in the Middle East, Taiwan, Singapore and India funding the expansion of personal banking. In addition, there were increased staff costs relating to the expansion of service centres in India and China.
Costs in North America increased by US$182 million, of which US$72 million reflected the impact of GFBital. The underlying increase of US$110 million reflected higher IT and marketing costs, partially offset by a 6 per cent fall in staff costs reflecting lower revenue related remuneration.
Costs in South America declined by US$163 million entirely due to translation effects. In constant currency terms, operating costs were 15 per cent higher than 2001 as savings from a reduction in headcount were offset by severance payments made.
Operating costs in Brazil declined by US$14 million. In constant currency terms, costs increased by 21 per cent due to increased staff costs caused by an increase in inflation linked pension costs and an industry-wide union-agreed salary increase. IT costs were higher to support key business initiatives.
Provisions for bad and doubtful debts rose from US$767 million to US$857 million. Provisions in Hong Kong rose by US$110 million, where increased card lending and significantly higher personal bankruptcy filings resulted in additional provisions for credit card accounts. Provisions against the mortgage portfolio fell slightly.
In Europe, increased provisions in CCF were offset by lower provisions for personal customers in the UK as credit quality remained stable and improved debt counselling services proved effective.
Provisions for bad debts increased by US$12 million in the rest of Asia-Pacific, following increased credit card lending in India, Indonesia and Taiwan. Improved credit control procedures in the Middle East reduced the cost of new specific provisions against personal customers.
Provisions in South America fell by US$53 million. In Brazil, new provisions raised to reflect the increased level of personal lending were more than offset by the release of a number of provisions, particularly in the credit card portfolio, reflecting Brazil’s pro-active management of the personal loan portfolio.
Provisions for contingent liabilities and commitments saw a US$42 million charge in the year compared with US$17 million in 2001.
Losses from joint ventures reduced by US$76 million reflecting the full consolidation of Merrill Lynch HSBC from the second half of 2002.
Share of associates operating profit reduced from US$43 million to US$17 million largely due to lower profits in the personal banking business in Cyprus Popular Bank and Saudi British Bank.
| Year ended 31 December 2001 compared with year ended 31 December 2000 |
Personal Financial Services contributed US$3,457 million to pre-tax profits in 2001 and represented 39.3 per cent of such profits. Growth in pre-tax profits over 2000 amounted to US$447million, an increase of 15 per cent. This was driven by good growth in operating profits before provisions with revenues rising 6 per cent against cost growth of 4 per cent. Reflecting significant growth in personal lending, provisions for bad and doubtful debts rose US$165 million an increase of 27 per cent. Disposal gains were exceptionally high as a result of the disposal of the Group’s interest in British Interactive Broadcasting.
Net interest income increased by US$320 million or 5 per cent. Within this, net interest income in Europe rose by US$217 million, mainly reflecting the inclusion of a full year’s income for CCF in 2001. Excluding the impact of CCF, net interest income in Europe was effectively flat. In the UK, the benefit of customer deposit growth was offset by the impact on margins of competitive pricing initiatives in mortgages and savings accounts.
85
Back to Contents
HSBC HOLDINGS PLC
Financial Review (continued)
|
In Hong Kong net interest income rose by US$41 million as the benefits of increased credit card lending and wider spreads on non-Hong Kong dollar lending were largely offset by lower spreads on Hong Kong Dollar savings and deposit accounts and on residential mortgages.
Net interest income for the Rest of Asia-Pacific rose by US$53 million with encouraging growth in most entities in the region. In North America increased net interest income of US$73 million reflected wider margins as funding costs fell more quickly than lending, particularly mortgage lending, repriced. The decline in funding costs was further helped by a switch by depositors away from fixed rate CDs to lower-paying savings and current accounts.
Net fees and commissions rose by US$233 million or 9 per cent on the year. US$127 million of this rise was in Europe, again mainly reflecting the inclusion of a full year of results for CCF. Fees in the UK fell slightly as lower overdraft fees and the effect of removing ATM fees on the LINK network and mortgage valuation fees were only partially offset by growth in wealth management income and fees on investment products. Net fees in Hong Kong were up by US$76 million, with outstanding success in fees earned from sales of capital-guaranteed funds.
In North America fee income was effectively unchanged; strongly rising wealth management income and fees from high levels of mortgage augmentation were offset by increased write-offs of mortgage servicing rights as mortgage prepayments rose in response to falling interest rates. The mortgage business also suffered losses on instruments held as hedges against the value of mortgage servicing rights; such losses are reflected in dealing profits. Overall the mortgage business generated positive net interest and non-interest income.
Other income rose by US$95 million, primarily in Hong Kong due to strong growth in life insurance income fees and the growth in embedded value in this business.
Operating expenses increased by US$240 million or 4 per cent, mainly reflecting a US$137 million rise in staff costs and US$43 million of increased premises and equipment expenses. In Europe, expenses rose by US$229 million, mainly due to the inclusion of a full year’s costs for CCF. Excluding this increase, costs in Europe were down. In constant currency terms, the UK bank’s staff costs rose 4 per cent due to annual pay rises and increased headcount in wealth management and customer telephone services.
Costs in Hong Kong increased by US$147 million, reflecting increased marketing and IT costs, together with the impact of annual salary increments and expansion of the cards business and Mandatory Provident Fund services. In the rest of Asia-Pacific, a US$96 million rise in costs included increased costs following acquisitions and branch openings, higher costs associated with the expansion of wealth management services, costs of mortgage incentives in Malaysia and branch expansion in a number of countries.
Operating costs declined by US$66 million in North America mainly due to the non-recurrence of restructuring costs associated with the RNYC acquisition in 2000, partly offset by increased wealth management expenses together with lower performance-based salaries in Canada. Costs in South America were lower by US$165 million, mainly due to the effect of exchange rate changes in Brazil. Local currency costs were up slightly in Brazil, reflecting higher transactional taxes.
Provisions for bad and doubtful debts rose from US$602 million to US$767 million. In Europe lower provisions (down by US$58 million), partly reflected improved recovery procedures in First Direct and the cards portfolio.
Provisions in Hong Kong rose by US$94 million as the weakening economic environment led to an increase in personal bankruptcies and this, together with a rise in card lending, resulted in increased provisions on credit cards. Provisions in the Rest of Asia-Pacific rose by US$84 million, with higher charges in Taiwan and the non-recurrence of the benefit seen in 2000 from the release of part of the Asia special general provision. South American loan losses rose by US$23 million, including US$11 million in Argentina due to the economic situation in the country. South American provisioning excludes the exceptional provision taken against 2001 results following the formal default of sovereign debt and the pesification of the banking system. Brazil’s growing provisioning requirements reflected planned expansion of the personal lending portfolio in 2000.
86
Back to Contents
HSBC HOLDINGS PLC
Provisions for contingent liabilities and commitments saw a US$17 million charge in the year, compared with US$31 million in 2000, all of which arose in Europe. The 2001 charge included US$13 million relating to CCF.
Losses from joint ventures and associates reduced by US$40 million, mainly reflecting the sale of British Interactive Broadcasting which also contributed US$202 million to profit on disposal of fixed asset investments. In other associates and joint ventures, an improved performance in Cyprus partly offset higher losses in Merrill Lynch HSBC and lower profits in the personal banking business of Saudi British Bank.
| Cash basis profit before tax |
| | | Year ended
| |
| | | 31 December 2002
| | 31 December 2001
| | 31 December 2000
| |
| | | | US$m | | | % | | | US$m | | | % | | | US$m | | | % | |
| |
| Europe | | | 1,344 | | | 44.3 | | | 986 | | | 41.4 | | | 1,139 | | | 41.0 | |
| Hong Kong | | | 733 | | | 24.2 | | | 726 | | | 30.4 | | | 781 | | | 28.1 | |
| Rest of Asia-Pacific | | | 423 | | | 13.9 | | | 277 | | | 11.6 | | | 376 | | | 13.5 | |
| North America | | | 455 | | | 15.0 | | | 410 | | | 17.2 | | | 387 | | | 13.9 | |
| South America | | | 79 | | | 2.6 | | | (14 | ) | | (0.6 | ) | | 97 | | | 3.5 | |
| |
| |
| | | | 3,034 | | | 100.0 | | | 2,385 | | | 100.0 | | | 2,780 | | | 100.0 | |
| |
| | | Year ended
| |
Figures in US$m | | | 31 December 2002 | | | 31 December 2001* | | | 31 December 2000* | |
| |
| Net interest income | | | 3,855 | | | 3,821 | | | 3,541 | |
| | | | | | | | | |
| Dividend income | | | 6 | | | 7 | | | 3 | |
| Net fees and commissions | | | 1,934 | | | 1,751 | | | 1,681 | |
| Dealing profits | | | 107 | | | 103 | | | 82 | |
| Other income | | | 463 | | | 422 | | | 368 | |
| Other operating income | | | 2,510 | | | 2,283 | | | 2,134 | |
| |
Total operating income | | | 6,365 | | | 6,104 | | | 5,675 | |
| | | | | | | | | |
| Operating expenses (excluding goodwill amortisation) | | | (3,153 | ) | | (3,116 | ) | | (2,738 | ) |
| |
Operating profit before provisions | | | 3,212 | | | 2,988 | | | 2,937 | |
| | | | | | | | | |
| Provisions for bad and doubtful debts | | | (269 | ) | | (662 | ) | | (202 | ) |
| Provisions for contingent liabilities and commitments | | | 19 | | | 16 | | | 5 | |
| Amounts written off fixed asset investments | | | 3 | | | (1 | ) | | 2 | |
| |
Operating profit | | | 2,965 | | | 2,341 | | | 2,742 | |
| | | | | | | | | |
| Share of operating profit in joint ventures | | | 2 | | | 6 | | | – | |
| Share of operating profit in associates | | | 16 | | | 28 | | | 26 | |
| Gains on disposal of investments and tangible fixed assets | | | 51 | | | 10 | | | 12 | |
| |
Profit on ordinary activities before tax (cash basis) | | | 3,034 | | | 2,385 | | | 2,780 | |
| |
| Share of HSBC’s pre-tax profits (cash basis) (per cent) | | | 28.8 | | | 27.1 | | | 27.0 | |
| Cost: income ratio (excluding goodwill amotisation) (per cent) | | | 49.5 | | | 51.0 | | | 48.2 | |
| | |
| * | Restatement consistent with page 81 |
87
Back to Contents
HSBC HOLDINGS PLC
Financial Review (continued)
|
| Selected balance sheet data (third party items only) |
| | | At
| |
Figures in US$m | | | 31 December
2002 | | | 31 December
2001 | | | 31 December
2000 | |
| |
| Loans and advances to customers (net) | | | 90,562 | | | 81,999 | | | 79,103 | |
| Customer deposits | | | 92,884 | | | 81,038 | | | 82,113 | |
Year ended 31 December 2002 compared with year ended 31 December 2001
On a cash basis, Commercial Banking contributed US$3,034 million to pre-tax profits in 2002 and represented 28.8 per cent of such profits. These profits were US$649 million, or 27 per cent, higher than 2001 mainly reflecting increased fees and commissions and lower provisions for bad and doubtful debts.
Net interest income remained broadly in line with 2001. Net interest income in Europe rose by US$248 million (in constant currency US$180 million) mainly due to growth in UK current accounts and lending partly offset by lower margins. Increased net interest income in CCF was due to strong growth in lending and sight deposits. In addition, the inclusion of a full year’s income for Banque Hervet and Demirbank increased net interest income.
In Hong Kong, net interest income fell as low interest rates reduced the value of interest free balances. The rest of Asia-Pacific saw a 10 per cent decline in net interest income reflecting subdued commercial loan demand and lower lending margins.
In North America, net interest income was broadly in line with 2001. The inclusion of GFBital was offset by reduced net interest income in the United States reflecting lower lending levels.
In South America, net interest income was broadly flat in constant currency terms.
Net fees and commissions increased by US$183 million or 10 per cent against 2001. In constant currency the growth was US$171 million. Most of the increase was in Europe reflecting success in generating lending fee income and money transmission income together with transaction fees on current accounts and overdrafts. In addition, corporate cards income grew by 6 per cent. In Hong Kong, cross-selling initiatives with HSBC Asset Management and Treasury led to higher levels of fee income on investment funds. Insurance and trade services income also increased.
Operating expenses were broadly in line with 2001. In constant currency terms the increase was US$27 million. There was modest growth in Europe reflecting increased premises costs in the UK and one-off IT costs related to the introduction of the Euro. Offsetting these were savings in Hong Kong due to rationalisation of sales teams within the area.
Contributing to the good cost performance in 2002, HSBC continued to expand its utilisation of Group Service Centres with new centres opening in Shanghai and Bangalore in addition to existing centres in Hyderabad and Guangzhou. There are now 12,400 calls from UK business telephone banking customers being answered each week in the Bangalore call centre. In addition, Business Internet Banking which was launched during 2002 in Canada, the Hong Kong SAR, India, Argentina and the UK already has over 200,000 registered customers.
Provisions for bad and doubtful debts fell by US$393 million. Following corporate debt restructurings and repayments there were net releases of specific provisions in the Middle East, Indonesia, Singapore, Taiwan and Thailand together with a release of general provisions in the UK and Hong Kong as the risk profile of the commercial portfolio improved. These were partly offset by additional specific provisions elsewhere following difficulties by customers in the timber, hotel, construction, knitwear, cement and yarn industries inter alia. Provisions in North America were broadly in line with last year.
Gains on disposal of investments increased by US$41 million, mainly due to the sale of CCF’s holding in Lixxbail.
2002 included the full year contribution from the acquisition of Banque Hervet in France and Demirbank in Turkey. Both performed in line with expectations and have integrated well into HSBC.
The Bank has responded to the UK’s Competition Commission Review of banking services to small and medium size businesses with changes to its business banking propositions. The Review covered the Money Transmission and Liability businesses, with a particular emphasis on the Current Account market. The Commercial market is highly competitive and the Government proposals are aimed at increasing customer switching between players. Approximately fifty per cent of HSBC’s Commercial income is now subject to Government price controls and the cost of implementing these pricing adjustments is estimated to be US$130 million per annum.
88
Back to Contents
HSBC HOLDINGS PLC
| Year ended 31 December 2001 compared with year ended 31 December 2000 |
The Commercial Banking line of business contributed US$2,385 million to pre-tax profits in 2001 and represented 27.1 per cent of such profits. Pre-tax profits were US$395 million lower, a decline of 14 per cent reflecting higher net provisions for bad and doubtful debts as recoveries fell and the impact of the release of the Asian special general provision in 2000 was not repeated. Operating profits before provisions were up slightly, by US$51 million or 2 per cent.
Net interest income increased by US$280 million or 8 per cent. Net interest income in Europe rose by US$254 million, mainly reflecting the inclusion of a full year’s income for CCF in 2001. Excluding the impact of CCF, net interest income in Europe was down slightly, mainly due to foreign exchange movements. Underlying net interest income in the UK was broadly unchanged, as significant growth in UK commercial loans and deposits was offset by falling margins due to lower base rates and increased competitive pressures. Net interest income in Hong Kong fell slightly, by US$44 million, due to lower margins on current account deposits. The rest of Asia-Pacific saw a small rise in net interest income as the benefit of lower funding costs in the Middle East offset lower margins in Singapore.
North America saw strong growth in net interest income, which rose by US$97 million reflecting organic growth, increased commercial deposit levels and improved margins in commercial real estate lending.
Net fees and commissions rose by US$70 million or 4 per cent against 2000. The main part of this rise was in Europe, again mainly reflecting the impact of including a full year of results for CCF. Fees in the UK were broadly flat in constant currency terms.
Operating expenses increased by US$378 million or 14 per cent, within which US$227 million reflected a rise in staff costs and US$64 million increased premises and equipment. Again, the inclusion of a full impact for CCF was the main contributor.
Provisions for bad and doubtful debts rose sharply from US$202 million to US$662 million. Of the increase in Europe (up by US$171 million), US$60 million related to CCF, with the remainder mainly reflecting higher provisions in the UK due to the less favourable economic environment and pressures on UK manufacturing industry. Provisions in the rest of Asia-Pacific rose by US$123 million, notably due to further charges in Indonesia and the non-recurrence of the benefit seen in 2000 from the release of the special general provision.
In North America provisions rose by US$86 million, reflecting losses in receivables lending and equipment lending. Canada also experienced increased loan losses, particularly to one name in the telecommunications sector. South American loan losses rose by US$79 million, including US$58 million in Argentina, with increased losses in Brazil.
89
Back to Contents
HSBC HOLDINGS PLC
Financial Review (continued)
|
| |
| |
| |
| |
Corporate, Investment Banking and Markets |
| |
| Cash basis profit before tax |
| | | Year ended
| |
| | | 31 December
2002
| | 31 December
2001*
| | 31 December
2000*
| |
| | | | US$m | | | % | | | US$m | | | % | | | US$m | | | % | |
| |
| Europe | | | 1,438 | | | 38.6 | | | 1,438 | | | 35.6 | | | 1,501 | | | 42.2 | |
| Hong Kong | | | 1,226 | | | 33.0 | | | 1,244 | | | 30.9 | | | 1,012 | | | 28.4 | |
| Rest of Asia-Pacific | | | 706 | | | 19.0 | | | 725 | | | 18.0 | | | 666 | | | 18.7 | |
| North America | | | 315 | | | 8.5 | | | 441 | | | 10.9 | | | 211 | | | 5.9 | |
| South America | | | 32 | | | 0.9 | | | 185 | | | 4.6 | | | 169 | | | 4.8 | |
| |
| | | | 3,717 | | | 100.0 | | | 4,033 | | | 100.0 | | | 3,559 | | | 100.0 | |
| |
| | | Year ended
| |
Figures in US$m | | | 31 December
2002 | | | 31 December
2001* | | | 31 December
2000* | |
| |
| Net interest income | | | 3,521 | | | 3,419 | | | 2,849 | |
| | | | | | | | | | | |
| Dividend income | | | 230 | | | 138 | | | 148 | |
| Net fees and commissions | | | 2,164 | | | 2,140 | | | 2,305 | |
| Dealing profits | | | 1,008 | | | 1,411 | | | 1,370 | |
| Other income | | | 610 | | | 568 | | | 610 | |
| Other operating income | | | 4,012 | | | 4,257 | | | 4,433 | |
| |
Total operating income | | | 7,533 | | | 7,676 | | | 7,282 | |
| Operating expenses (excluding goodwill amortisation) | | | (3,901 | ) | | (3,920 | ) | | (3,836 | ) |
| |
Operating profit before provisions | | | 3,632 | | | 3,756 | | | 3,446 | |
| Provisions for bad and doubtful debts | | | (184 | ) | | (34 | ) | | (146 | ) |
| Provisions for contingent liabilities and commitments | | | 12 | | | (14 | ) | | (10 | ) |
| Amounts written off fixed asset investments | | | (109 | ) | | (72 | ) | | (33 | ) |
| |
Operating profit | | | 3,351 | | | 3,636 | | | 3,257 | |
| Share of operating profit in joint ventures | | | 3 | | | 10 | | | – | |
| Share of operating profit in associates | | | 46 | | | 33 | | | 59 | |
| Gains on disposal of investments and tangible fixed assets | | | 317 | | | 354 | | | 243 | |
| |
Profit on ordinary activities before tax (cash basis) | | | 3,717 | | | 4,033 | | | 3,559 | |
| |
| Share of HSBC’s pre-tax profits (cash basis) (per cent) | | | 35.4 | | | 45.8 | | | 34.6 | |
| Cost: income ratio (excluding goodwill amortisation) (per cent) | | | 51.8 | | | 51.1 | | | 52.7 | |
| Selected balance sheet data (third party items only) |
| | | At
| |
Figures in US$m | | | 31 December
2002 | | | 31 December
2001* | | | 31 December
2000* | |
| |
| Loans and advances to banks (net) | | | 80,870 | | | 83,312 | | | 100,073 | |
| Loans and advances to customers (net) | | | 101,770 | | | 99,260 | | | 92,851 | |
| Debt securities, treasury bills & other eligible bills | | | 162,583 | | | 155,330 | | | 134,823 | |
| Deposits by banks | | | 48,895 | | | 49,785 | | | 55,700 | |
| Customer deposits | | | 95,351 | | | 88,618 | | | 80,421 | |
| | |
| * | Restatement consistent with page 81. |
Year ended 31 December 2002 compared with year ended 31 December 2001
This segment covers HSBC’s Corporate and Institutional Banking and Investment Banking and Markets businesses. These businesses cover HSBC’s provision of integrated solutions to the major international clients of the Corporate and Institutional Banking business.
Corporate, Investment Banking and Markets (CIBM) contributed US$3,717 million of pre-tax profits (cash basis) in 2002 representing 35.4 per cent of HSBC’s pre-tax profits. These profits were US$316 million or 8 per cent lower than 2001 reflecting higher credit costs and muted corporate activity in global market conditions that continue to suffer from both economic and political uncertainty. In constant currency pre-tax profits were US$294 million lower. Weakness in the equity market, high profile US corporate scandals and Middle East tensions combined to create an extremely challenging business environment for HSBC and its customers. In addition, economic conditions in South America continued to be difficult during 2002.
90
Back to Contents
HSBC HOLDINGS PLC
Net interest income increased by US$102 million or 3 per cent. Money market income was strong as Treasury continued to benefit from the steeper yield curve following the significant interest rate cuts during 2001. The impact of this reduced during the second half of the year as maturing liquidity was redeployed in lower yielding assets. Net interest income also benefited as Treasury continued to grow the proportion of its liquid assets held in high quality corporate bonds as opposed to interbank placement. Increased equity swap activity also generated additional cash deposits. The effect of the above was offset by significant reductions in net interest income in South America, due to the large non-performing loan book in Argentina. Corporate loan demand continued to be subdued.
Net fees and commissions increased by US$24 million or 1 per cent. There was higher income from merchant banking activities, particularly in Asia-Pacific, where transactions were structured for a number of key CIBM relationships. Debt capital markets activity also grew in Europe and Asia-Pacific, by 30 per cent to US$175 million, as origination and syndication revenues benefited from the continuing alignment between client service teams. The global new equity issues and financial advisory markets continued to be depressed, and trading volumes on the world’s stock markets remained at subdued levels negatively impacting commission revenues. In asset management revenues were reduced, consistent with the fall in the level of world stock market indices seen during the year.
Dealing profits decreased by US$403 million or 29 per cent. In Europe there was strong growth in trading revenues in emerging markets and in currency options, and improved results in government bond trading. These were offset by weaker revenues in debt securities trading across all major regions. These declined against a backdrop of widening credit spreads on corporate debt securities following the widely publicised accounting scandals across the US, and concerns about a slowdown in global economic growth.
Interest rate derivatives undertaken to hedge the interest rate risk arising on holding of corporate bonds generated dealing losses, although this was offset by increased net interest income on the bonds.
In the UK, increased activity in equity swap transactions generated dealing losses which were offset by significantly increased dividend income.
Other income increased by US$42 million or 7 per cent due to improvements in North America together with higher income from Rail Finance.
Outside the major centres, there were strong results from Singapore, India, China and Japan.
Operating expenses were in line with 2001. Whilst there were significant reductions in staff costs in Investment Banking as staff numbers were reduced in the light of market conditions, these were offset by increased revenue related costs in Treasury and Capital Markets.
Provisions for bad and doubtful debts increased by US$150 million due to lower levels of provision release compared to 2001, which had included a significant recovery relating to an historic Olympia and York exposure. Provisioning in 2002 was dominated by a small number of telecommunications related exposures in the UK and Canada.
Amounts written off fixed asset investments increased by US$37 million or 51 per cent reflecting the writedown of a limited number of venture capital investments across the Group.
Gains on disposal of investments and tangible fixed assets decreased by US$37 million or 10 per cent.
Year ended 31 December 2001 compared with year ended 31 December 2000
Corporate, Investment Banking and Markets contributed US$4,033 million of pre-tax profits in 2001 representing 45.8 per cent of such profits. Compared with 2000, pre-tax profits were US$474 million higher, an increase of 13 per cent, driven by lower bad debt charges and a substantial increase in net interest income in the markets business in the falling interest rate environment.
Net interest income increased by US$570 million or 20 per cent. The increase reflected a number of factors; money market income was strong, as treasury was positioned to take advantage of falling rates, treasury also improved its yield by shifting part of its holding of liquid assets from government bonds to high quality corporate bonds. Increased equity swap activity generated additional cash deposits and in a number of emerging markets, notably Turkey, treasury operations benefited from high interest rates and volatile market conditions in 2001.
Net fees and commissions declined by US$165 million or 7 per cent on the year. A year of severely adverse conditions in global new equity issues and financial advisory markets and lower turnover on the world’s stock exchanges significantly reduced revenues in these areas. However, in debt capital markets progress in the continuing alignment of client service teams, and from the combination of strengths of CCF with HSBC in euro and sterling markets, generated stronger revenues from a much improved market position.
91
Back to Contents
HSBC HOLDINGS PLC
Financial Review (continued)
|
Dealing profits rose by US$41 million with foreign exchange and interest rate products compensating for lower revenues in equities and equity derivatives trading.
Dealing profits in North America were particularly strong, up by US$171 million, reflecting investment to strengthen the Group’s capabilities in a number of areas, including foreign exchange, interest rate derivatives and structured products. South America’s dealing profits were down by US$53 million, mainly reflecting lower profits in Argentina and the impact of foreign currency translation movements on the profits reported by Brazil.
In regional markets outside the major centres, India, Turkey, Japan, Thailand and the Philippines all produced strong results.
Operating expenses increased by US$84 million or 2 per cent, essentially reflecting the inclusion of a full year’s results for CCF offset by currency translation impacts.
Provisions for bad and doubtful debts fell by US$112 million to US$34 million. Higher provisions in the United States were offset by lower requirements in Hong Kong, together with a large write-back of provisions held against the historical Olympia and York exposure as the security held against this investment was sold.
Amounts written off fixed asset investments amounted to US$72 million, reflecting write-downs of private equity and other investments.
The significant increase in profits on disposal of investments from US$243 million to US$354 million reflected a number of disposals in Europe including Quilter by CCF and Pulsiv and ERGO by HSBC Trinkaus.
In Hong Kong, disposal profits in 2001 included the Group’s investment in Hong Kong Central Registration and certain investment securities.
In North America, the business sought to reduce its exposure to future interest rate movements by realising mortgage-backed and other investment debt securities which resulted in a large increase in disposal profit, from US$33 million in 2000 to US$133 million in 2001.
| |
| Cash basis profit before tax |
| | | Year ended
| |
| | | 31 December
2002
| | 31 December
2001*
| | 31 December
2000*
| |
| | | | US$m | | | % | | | US$m | | | % | | | US$m | | | % | |
| |
| Europe | | | 236 | | | 56.2 | | | 310 | | | 68.0 | | | 406 | | | 70.3 | |
| Hong Kong | | | 107 | | | 25.5 | | | 84 | | | 18.4 | | | 85 | | | 14.7 | |
| Rest of Asia-Pacific | | | 25 | | | 6.0 | | | (16 | ) | | (3.5 | ) | | (1 | ) | | (0.2 | ) |
| North America | | | 64 | | | 15.2 | | | 81 | | | 17.8 | | | 80 | | | 13.8 | |
| South America | | | (12 | ) | | (2.9 | ) | | (3 | ) | | (0.7 | ) | | 8 | | | 1.4 | |
| |
| | | | 420 | | | 100.0 | | | 456 | | | 100.0 | | | 578 | | | 100.0 | |
| |
* Restatement consistent with page 81. |
| | | Year ended
| |
Figures in US$m | | | 31 December
2002 | | | 31 December
2001* | | | 31 December
2000* | |
| |
| Net interest income | | | 556 | | | 577 | | | 569 | |
| | | | | | | | | |
| Dividend income | | | 2 | | | 4 | | | 2 | |
| Net fees and commissions | | | 623 | | | 602 | | | 555 | |
| Dealing profits | | | 137 | | | 124 | | | 110 | |
| Other income | | | 102 | | | 87 | | | 90 | |
| Other operating income | | | 864 | | | 817 | | | 757 | |
| |
Total operating income | | | 1,420 | | | 1,394 | | | 1,326 | |
| Operating expenses (excluding goodwill amortisation) | | | (987 | ) | | (919 | ) | | (759 | ) |
| |
Operating profit before provisions | | | 433 | | | 475 | | | 567 | |
| Provisions for bad and doubtful debts | | | (5 | ) | | 24 | | | (6 | ) |
| Provisions for contingent liabilities and commitments | | | (21 | ) | | (46 | ) | | — | |
| Amounts written off fixed asset investments | | | (22 | ) | | (2 | ) | | (4 | ) |
| |
Operating profit | | | 385 | | | 451 | | | 557 | |
| Share of operating profit/(losses) in associates | | | (11 | ) | | – | | | 2 | |
| Gains/(losses) on disposal of investments and tangible fixed assets | | | 46 | | | 5 | | | 19 | |
| |
Profit on ordinary activities before tax (cash basis) | | | 420 | | | 456 | | | 578 | |
| |
| Share of HSBC’s pre-tax profits (cash basis) (per cent) | | | 4.0 | | | 5.2 | | | 5.6 | |
| Cost: income ratio (excluding goodwill amotisation)(per cent) | | | 69.5 | | | 65.9 | | | 57.2 | |
92
Back to Contents
HSBC HOLDINGS PLC
| Selected balance sheet data (third party items only) |
| | | At
| |
Figures in US$m | | | 31 December
2002 | | | 31 December
2001 | * | | 31 December
2000 | * |
| |
| Loans and advances to customers (net) | | | 14,115 | | | 12,137 | | | 11,930 | |
| | | | | | | | | | | |
| Customer deposits | | | 49,012 | | | 51,199 | | | 48,003 | |
| | |
| * | Restatement consistent with page 81. |
Year ended 31 December 2002 compared with year ended 31 December 2001
The Private Banking division of HSBC includes all of the activities of HSBC Private Banking Holdings (Suisse) S.A., which contains HSBC Republic Bank (Suisse) S.A. and Guyerzeller Bank AG, the private banking operations of HSBC Bank USA, CCF and HSBC Trinkaus & Burkhardt.
HSBC continued with the integration of various businesses into Group Private Banking. This is now complete in Asia. Additionally, the process of alignment of domestic and international operations was completed in the UK during 2002 and is ongoing in America. Comparative figures for 2001 and 2000 have been restated to reflect the changes made in organisation structure.
Private Banking contributed US$420 million to HSBC’s pre-tax profits (cash basis) and represented 4.0 per cent of such profits. These profits were 8 per cent lower than in 2001.
Despite the decline in the world stock markets the Private Banking division grew client funds under management, including trust assets, from US$129.7 billion to US$144.0 billion or 11 per cent.
Excellent teamwork with HSBC’s personal banking operations led to a significant increase in client referrals during 2002.
Net interest income declined by US$21 million to US$556 million as lower interest rates reduced the benefit of free funds. In addition, asset portfolios were moved to lower yielding but higher grade securities at the beginning of the year in expectation of difficult credit markets.
Other operating income, including fees and commissions, increased by US$47 million, or 6 per cent, reflecting an increase in fees from greater client assets under management and fee income from the newly formed WTAS which provides private tax services to wealthy clients.
Trust business was expanded in the United States, Asia and the Channel Islands. Working with Group Insurance, the Private Bank launched new tax efficient insurance wrapper products. In fund management the range of funds expanded especially in the alternative or hedge fund sector. There was strong growth in investment fees, which benefited from the success of the Hermitage Fund, which provided clients access to investment opportunities in Russia.
Operating expenses increased by US$68 million. In constant currency, operating expenses increased by US$28 million mainly due to the launch of WTAS.
The provision for bad and doubtful debts was US$5 million in 2002 compared with a credit of US$24 million in 2001. The prior year credit reflected the reduction in the allowance based upon a study of actual loss history on the loan book.
Amounts written off fixed asset investments of US$22 million related to the write-down of one specific debt instrument of a company in the telecommunications sector.
The share of profit in associated undertakings was a loss of US$11 million in 2002. This reflected a drop in the value of a partially owned private equity company.
Gain on disposal of investments and tangible assets were US$46 million compared with US$5 million in 2001. The increase related to debt instruments sold during the year and the liquidation of a Russian Recovery fund established in 2000 to manage previously written down Russian debt instruments.
Year ended 31 December 2001 compared with year ended 31 December 2000
Private Banking contributed US$456 million to pre-tax profits in 2001 which represented 5.2 per cent of such profits. These profits were US$122 million or 21 per cent lower than in 2000, reflecting a decline in customer activity, lower disposal gains and costs associated with restructuring the business.
93
Back to Contents
HSBC HOLDINGS PLC
Financial Review (continued)
|
Net interest income was broadly in line. Offsetting the effect of a full year’s income from CCF entities, the underlying change mainly reflects a switch to lower yielding assets and a lower benefit from free capital as interest rates fell and a more conservative risk profile was taken.
Net fees and commissions rose by US$47 million or 8 per cent on the year. US$40 million of this rise occurred in Europe again mainly due to the impact of including a full year of results for CCF. North America increased fee income by US$17 million on fees generated from increased assets under management.
Operating expenses increased by US$160 million or 21 per cent and included a US$144 million rise in staff costs and US$33 million of increased premises and equipment expenses. The greatest increase in costs was in Europe, where expenses rose by US$122 million, mainly due to the inclusion of a full year’s costs for CCF. Excluding CCF, costs in Europe were up by US$34 million, in part relating to the cost of restructuring the Group’s private banking operations during 2001 and the expansion of headcount as part of business growth.
There was a net write-back of provisions for bad and doubtful debts, amounting to US$24 million, against a net charge of US$6 million in 2000. The reduction reflected a write-back of general provisions in Switzerland following a review of the level of provisions held in the light of historical loan loss experience.
The US$46 million of provisions for contingent liabilities and commitments included US$31m relating to CCF’s operation in Lebanon, now closed, and smaller amounts relating to a number of individual items of litigation.
Private Banking achieved US$5 million of gains on the disposal of fixed asset investments, compared with US$19 million in 2000.
| |
| Cash basis profit before tax |
| | | Year ended
| |
| | | 31 December
2002
| | 31 December
2001
| | 31 December
2000
| |
| | | | US$m | | | % | | | US$m | | | % | | | US$m | | | % | |
| |
| Europe | | | 155 | | | (77.1 | ) | | 357 | | | (23.4 | ) | | 351 | | | 94.1 | |
| Hong Kong | | | (61 | ) | | 30.3 | | | 198 | | | (13.0 | ) | | 134 | | | 35.9 | |
| Rest of Asia-Pacific | | | 12 | | | (6.0 | ) | | 30 | | | (2.0 | ) | | 40 | | | 10.7 | |
| North America | | | (207 | ) | | 103.0 | | | (877 | ) | | 57.6 | | | (156 | ) | | (41.8 | ) |
| South America | | | (100 | ) | | 49.8 | | | (1,232 | ) | | 80.8 | | | 4 | | | 1.1 | |
| |
| | | | (201 | ) | | 100.0 | | | (1,524 | ) | | 100.0 | | | 373 | | | 100.0 | |
| |
94
Back to Contents
HSBC HOLDINGS PLC
| | | Year ended
| |
Figures in US$m | | | 31 December 2002 | | | 31 December 2001* | | | 31 December 2000* | |
| |
| Net interest income | | | (53 | ) | | 80 | | | 256 | |
| Dividend income | | | 34 | | | 32 | | | 43 | |
| Net fees and commissions | | | 124 | | | 100 | | | 126 | |
| Dealing profits | | | 11 | | | (6 | ) | | (33 | ) |
| Other income | | | 905 | | | 996 | | | 868 | |
| Other operating income | | | 1,074 | | | 1,122 | | | 1,004 | |
| |
Total operating income | | | 1,021 | | | 1,202 | | | 1,260 | |
| | | | | | | | | |
| Operating expenses (excluding goodwill amortisation) | | | (1,088 | ) | | (1,230 | ) | | (938 | ) |
| |
Operating profit before provisions | | | (67 | ) | | (28 | ) | | 322 | |
| | | | | | | | | |
| Provisions for bad and doubtful debts | | | (6 | ) | | 2 | | | 24 | |
| Argentine general provision | | | – | | | (600 | )# | | – | |
| Provisions for contingent liabilities and commitments | | | (7 | ) | | (13 | ) | | (35 | ) |
| Princeton Note Settlement | | | – | | | (575 | ) | | – | |
| Loss from currency redenomination in Argentina | | | (68 | ) | | (520 | ) | | – | |
| Amounts written off fixed asset investments | | | (194 | ) | | (45 | ) | | (1 | ) |
| |
Operating profit | | | (342 | ) | | (1,779 | ) | | 310 | |
| | | | | | | | | |
| Share of operating profit/(losses) in joint ventures | | | (1 | ) | | – | | | 1 | |
| Share of operating profit/(losses) in associates | | | 67 | | | 60 | | | 47 | |
| Gains/(losses) on disposal of investments and tangible fixed assets | | | 75 | | | 195 | | | 15 | |
| |
Profit on ordinary activities before tax (cash basis) | | | (201 | ) | | (1,524 | ) | | 373 | |
| |
| Share of HSBC’s pre-tax profits (cash basis) (per cent) | | | (1.9 | ) | | (17.4 | ) | | 3.6 | |
| | | | | | | | | |
| Cost: income ratio (excluding goodwill amotisation) (per cent) | | | 106.6 | | | 102.3 | | | 74.4 | |
| | |
| * | Restatement consistent with page 81. |
| # | In 2002, this provision was partially utilised to absorb specific bad debt provisions raised against Personal Financial Services (US$19 million), Commercial Banking (US$103 million) and Corporate, Investment Banking and Markets (US$74 million). |
| |
| Selected balance sheet data (third party items only) |
| | | At
| |
Figures in US$m | | | 31 December 2002 | | | 31 December 2001 | * | | 31 December 2000 | * |
| |
| Loans and advances to customers (net) | | | 2,201 | | | 1,409 | | | 2,052 | |
| | |
| Customer deposits | | | 311 | | | 205 | | | 474 | |
| |
| Year ended 31 December 2002 compared with year ended 31 December 2001 |
The main items reported under Other are the income and expenses of wholesale insurance operations, certain property activities, unallocated investment activities including hsbc.com, centrally held investment companies and HSBC’s holding company and financing operations. The results include net interest earned on free capital held centrally and operating costs incurred by the head office operations in providing stewardship and central management services to HSBC. A number of exceptional items are also reported in this segment including in 2001 the impact of the Princeton Note provision and exceptional bad debt provisions and currency redenomination losses in Argentina.
Net fees and commissions and other income of the Group’s wholesale insurance operations amounted to US$324 million in 2002, US$297 million in 2001 and US$256 million in 2000.
The provision for the diminution in value of a minority holding in a European life company acquired in the CCF acquisition has also been reported in this section.
| Year ended 31 December 2001 compared with year ended 31 December 2000 |
The main items reported under Other are the income and expenses of wholesale insurance operations, certain property activities, unallocated investment activities including hsbc.com, central held investment companies and HSBC’s holding company and financing operations. The results include net interest earned on free capital held centrally and operating costs incurred by the head office operations in providing stewardship and central management services to HSBC. A number of exceptional items are also reported in this segment including the impact of the Princeton Note provision and exceptional bad debt provisions and currency redenomination losses in Argentina.
95
Back to Contents
HSBC HOLDINGS PLC
Financial Review (continued)
|
Net fees and commissions and other income of the Group’s wholesale insurance operations amounted to US$321 million in 2001 and US$281 million in 2000.
Critical Accounting Policies
|
Introduction
The results of HSBC Holdings plc are sensitive to the accounting policies, assumptions and estimates that underlie the preparation of its consolidated financial statements. The accounting policies used in the preparation of the consolidated financial statements are set out in Note 2 in the ‘Notes to the financial statements’ on pages 197 to 202.
When preparing the financial statements, it is the directors’ responsibility under UK company law to select suitable accounting policies and to make judgements and estimates that are reasonable and prudent. Under UK GAAP, Financial Reporting Standard 18 ‘Accounting Policies’ requires the Group to adopt the most appropriate accounting policies in order to give a true and fair view.
HSBC also provides details of its net income and shareholders’ equity calculated in accordance with US GAAP. US GAAP differs in certain respects from UK GAAP. Details of these differences are set out in Note 50 to the financial statements on pages 286 to 313.
The accounting policies that are deemed critical to the Group’s results and financial position, based upon materiality and significant judgement and estimates, are discussed below.
Provisions for bad and doubtful debts |
HSBC’s accounting policy for provisions for bad and doubtful debts on customer loans is described in Note 2 (b) to the financial statements on pages 197 to 199. The process for applying this policy is described on pages 122 to 124.
Specific provisions are established either on a case-by-case basis or on a portfolio basis, depending on the nature of the asset. In addition, provisions for the sovereign risk inherent in cross-border credit exposures are established for certain countries; this element is not currently significant.
Where specific provisions are established on a case-by-case basis, the most important factors are:
| • | the amount and timing of cashflows forecast to be received from the borrower; and
|
| • | the enforceability and amount which may be recovered through the sale of any security held. |
In many cases, the determination of these factors will be judgmental, either because the security may not be readily marketable or the cashflows will require an assessment of the customer’s future performance. HSBC’s practice is to make a conservative estimate of these factors and to review and update them on a regular basis.
This basis of determining provisions is applied to residential mortgages more than 90 days delinquent and to most corporate loans. Corporate loans and residential mortgages together comprise about 85 per cent of loans and advances to non-financial customers.
HSBC has no individual loans for which specific bad and doubtful debt provisions have been established on a case-by-case basis where changes in the underlying factors could cause a material change to the Group’s reported results.
Where specific provisions are raised on a portfolio basis, the most important factors are:
| • | loss rate set for each delinquency category;
|
| • | roll rates where determined for specific portfolios; and
|
| • | the period embedded in the loss rate and roll rate calculations which is designed to reflect only losses inherent at the reporting date and not future losses. |
The factor most susceptible to variability in management judgement is the period used in the loss rate and roll rate calculations. This factor is kept under continuous review based on the incidence of losses experienced.
The portfolio basis is applied to small corporate accounts (typically less than US$15,000) in certain countries, residential mortgages overdue but less than 90 days overdue, credit card and other unsecured consumer lending products. Credit card and other unsecured consumer lending products comprise about 15 per cent of loans and advances to customers.
96
Back to Contents
HSBC HOLDINGS PLC
General provisions augment specific provisions and provide cover for loans which are impaired at the balance sheet date but which will not be identified as such until some time in the future. HSBC requires operating companies to maintain a general provision which is determined taking into account the structure and risk characteristics of each company’s loan portfolio.
The most important factors in determining general loan loss provisions are:
| • | historical loss rates for each separately identified portfolio;
|
| • | determination of the period between losses occurring and establishment of a specific provision for this loss; and
|
| • | management’s judgement of the extent to which current economic and credit conditions are such that the actual level of inherent losses is greater or less than that suggested by historical experience. |
The main areas of judgement are in determining the period and assessing current economic conditions. These are kept under continuous review based on an analysis of economic forecasts, industry sector performance, insolvency and bankruptcy statistics together with details of the rate and nature of losses experienced.
HSBC’s accounting policy for goodwill is described in Note 2 (d) (v) to the financial statements on pages 199 to 200.
In accordance with the requirements of FRS 10 ‘Goodwill and Intangible Assets’, HSBC reviews goodwill arising on the acquisition of subsidiary undertakings, joint ventures and interests in associates when there is an indication that impairment may have taken place and at the end of the first full year after an acquisition. Where identified, impairments of goodwill are accounted for in accordance with FRS 11 ‘Impairment of Fixed Assets and Goodwill’. Indications of impairment include any events or changes in circumstance that indicate that the carrying amount of goodwill may not be recoverable.
If management believes there is an indication that an impairment may have taken place, then the valuation of each of the entity’s relevant ‘Income Generating Units’ (IGUs) is compared to its respective carrying value (including related goodwill). The valuation of each IGU is generated from a discounted cashflow model. Management judgement is involved in three elements of the process of identifying and evaluating impairments of goodwill.
Firstly, other than at the end of the first full year after acquisition, the identification that a possible impairment of goodwill has occurred and that an impairment test needs to be carried out in respect of the goodwill of the relevant IGU will be a matter of management judgement. While this judgement will be exercised in the light of the indications of possible impairment contained in FRS 10, the interpretation of these guidelines will involve judgement of whether the indications of impairment are significant enough to require a full test to be undertaken. It should be noted, however, that the identification of a requirement to undertake an impairment test in respect of a particular IGU will not, in itself, give rise to any impairment charge for the goodwill associated with that unit.
Secondly, management judgement will be required in deriving the forecast cashflows to be used in the discounted cashflow valuation of the IGU. The valuation of an IGU, and hence the possible identification of an impairment of its goodwill, will be sensitive to the cashflows used, and in particular to the assumed long-term sustainable growth rate of cashflows after the initial period for which more detailed forecasts are available. While the cashflow forecasts will reflect management’s view of future business growth and developments, the range of reasonably-acceptable cash forecasts will be constrained by the requirement for such forecasts to be compared against actual performance in future years and verifiable economic data.
Finally, the assignment of a cost of capital to an individual IGU will also have a significant impact on its valuation. The appropriate cost of capital will generally be determined by applying the capital asset pricing model but the application of this model itself requires a number of inputs which need to be established on the basis of management’s judgement.
Where management’s judgement is that the expected cashflows of an IGU have declined and/or that its cost of capital has increased, the effect will be to reduce the estimated fair value of the IGU. If this results in a fair value that is lower than the carrying value of the IGU, an impairment of goodwill will be recorded.
97
Back to Contents
HSBC HOLDINGS PLC
Financial Review (continued)
|
| |
Valuation of unquoted and illiquid debt and equity securities |
HSBC’s accounting policy for these instruments is described in Note 2 (c) on page 199 of the financial statements.
HSBC carries its debt and equity securities held for trading purposes at fair value. For those debt and equity securities which are not carried at fair value, the fair value of the security is taken into consideration in determining whether the asset should be written down to reflect a permanent impairment.
The fair value determined for unquoted and illiquid debt and equity securities reflects management’s assessment of the value of these securities. This assessment may be based upon the use of a discounted cashflow model (particularly for debt securities) or determined by looking directly at the valuation of comparable securities for which an independent price can be established.
The main factors which management consider when applying a cashflow model are:
| • | the likelihood and expected timing of future cashflows on the instrument. These cashflows are usually determined by the terms of the instrument, although management judgement may be required in situations where the ability of the counterparty to service the instrument in accordance with its contractual terms is in doubt; and
|
| • | an appropriate discount rate for the instrument. Again management determines this rate, based on its assessment of the appropriate spread of the rate for the instrument over the risk free rate. |
Where management values the instrument by reference to comparable securities, the basis of valuation takes account of the maturity, structure and rating of the security to which the position held is being compared.
In assessing the valuation of securities, management also takes account of the size of the position held relative to market liquidity and conditions. Where considered appropriate, the assessed fair value of the securities will be reduced to reflect the amount which management estimate could be realised on their sale.
Changes in any of the assumptions used by management to determine the valuation will give rise to changes in the recorded fair value of unquoted securities. Such changes will result in changes in the carrying value of the securities where they are carried at fair value. Where the securities are carried at amortised cost, changes in their estimated fair value, arising from changes in management’s assumptions on the above variables, may result in the recording of a permanent diminution in their value. In this case, it will also be necessary for HSBC’s management to exercise judgement as to whether or not changes in the underlying valuation assumptions are only temporary.
UK GAAP compared with US GAAP
|
| | | | | | | | | | | |
Figures in US$m | | | 2002 | | | 2001 | | | 2000 | |
| |
| Net income: | | | | | | | | | | |
| US GAAP | | | 4,900 | | | 4,911 | | | 6,236 | |
| UK GAAP | | | 6,239 | | | 4,992 | | | 6,457 | |
| | | | | | | | | |
| Shareholder’s equity: | | | | | | | | | | |
| US GAAP | | | 55,831 | | | 48,444 | | | 48,072 | |
| UK GAAP | | | 52,406 | | | 46,388 | | | 46,393 | |
Differences result from the different treatment of lease financing, shareholders’ interest in the long-term assurance fund, pension costs, stock-based compensation, goodwill, internal software costs, revaluation of property, purchase accounting adjustments, accruals accounted derivatives, permanent diminution in value of available-for-sale securities, foreign exchange gains on investment securities, foreign exchange losses on Argentine funding, fair value adjustment for securities available-for-sale, dividends payable, own shares held and deferred taxation. See Note 50 of the ‘Notes on the Financial Statements’.
Future accounting developments
|
The Accounting Standards Board (UK GAAP) and the Financial Accounting Standards Board (US GAAP) have issued the following accounting standards, which become effective in future financial statements. HSBC is currently reviewing the likely impact of these statements.
98
Back to Contents
HSBC HOLDINGS PLC
FRS 17 ‘Retirement benefits’ was issued in December 2000. FRS 17 when applied in full will replace SSAP 24 ‘Accounting for pension costs’. There are also amendments to other accounting standards and UITF Abstracts.
FRS 17 requires that financial statements report at fair value the assets and liabilities arising from an employer’s retirement benefit obligations and any related funding. The operating costs of providing retirement benefits to employees are recognised in the accounting periods in which the benefits are earned by the employees, and the related finance costs and any changes in value of the assets and liabilities are recognised in the accounting periods in which they arise.
Under FRS 17 as originally issued, the primary statement impact was to have been recognised initially from 1 January 2003. In November 2002, the ASB issued an amendment to FRS 17 which defers the full accounting impact of FRS 17 until 1 January 2005. In the period until full implementation the transitional disclosures required by FRS 17 will be included in the Notes on the Financial Statements. Note 5 (b) (ii) and (iii) contain information on the effect of FRS 17. The effect on reserves at 31 December 2002, if the FRS 17 pension liability were to be recognised, would be a reduction of US$2,333 million.
SFAS 146 ‘Accounting for Costs Associated with Exit or Disposal Activities’ was issued on 30 July 2002. The statement requires that a liability for costs associated with exit or disposal activities be recognised when the liability is incurred. Existing generally accepted accounting principles provide for the recognition of such costs at the date of management’s commitment to an exit plan. In addition, SFAS 146 requires that the liability be measured at fair value and adjusted for changes in estimated cash flows. SFAS 146 is effective for exit and disposal activities initiated after 31 December 2002. Management are currently assessing the impact of the statement on HSBC’s reconciliation to US GAAP.
FASB Interpretation No. 45 ‘Guarantor’s Accounting and Disclosure Requirements for Guarantees, Including Indirect Guarantees of Indebtedness of Others’ was issued in November 2002. The Interpretation requires that a guarantor shall recognise, at the inception of a guarantee, a liability in respect of the non-contingent element of that guarantee, that is the obligation to stand ready to perform in the event that specified triggering events or conditions occur. The disclosure requirements of the statement are applicable for the year ended 31 December 2002 but the recognition and measurement provision requirements only relate to those guarantees issued or modified after 31 December 2002. HSBC has adopted the disclosure requirements of the Interpretation and will apply the recognition and measurement provisions for all guarantees entered into or modified after 31 December 2002. Adoption is not expected to have a material i mpact on HSBC’s reconciliation to US GAAP.
SFAS 148 ‘Accounting for Stock-Based Compensation – Transition and Disclosure – an amendment of FASB Statement No. 123’ was issued in December 2002. The Standard provides alternative methods of transition for a voluntary change to the fair value based method of accounting for stock-based compensation. Since HSBC already uses the fair value based method of accounting for stock-based compensation adoption of SFAS 148 will have no impact on HSBC’s reconciliation to US GAAP.
FASB Interpretation No. 46 ‘Consolidation of Variable Interest Entities’ was issued in January 2003. The Interpretation identifies an entity as a VIE if:
| • | the total equity investment at risk is not sufficient for the entity to finance its activities without support from other parties; or
|
| • | the equity investors do not have the characteristics of a controlling financial interest. |
HSBC will be required to consolidate a VIE if it has a variable interest which will absorb a majority of the VIE’s losses or receive a majority of its residual returns, or both. HSBC should consolidate the assets and liabilities of a VIE initially at their fair value at the date HSBC is first required to consolidate the VIE. Management have performed an initial review of HSBC’s VIEs in order to provide the disclosures required in respect of VIEs both where HSBC is and is not likely to be the primary beneficiary.
99
Back to Contents
HSBC HOLDINGS PLC
Financial Review (continued)
HSBC has adopted the disclosure requirements of the Interpretation. The accounting requirements apply immediately to VIEs, in which HSBC has a variable interest created after 31 January 2003, and to existing VIEs from 1 July 2003. The impact of the accounting provisions of the Interpretation on HSBC’s financial statements is still being assessed.
100
Back to Contents
HSBC HOLDINGS PLC
Average balance sheet and net interest income
|
Average balances and the related interest are shown for the domestic operations of HSBC’s principal commercial banks by geographic region with all other commercial banking and investment banking balances and transactions included in ‘Other operations’. Additional information on the basis of preparation is set out in the notes on page 109.
| | | | Year ended
31 December 2002
| | Year ended
31 December 2001
| | Year ended
31 December 2000
| |
| | | | | Average balance | | | Interest income | | | Yield | | | Average balance | | | Interest income | | | Yield | | | Average balance | | | Interest income | | | Yield | |
| | | |
|
| |
|
| |
|
| |
|
| |
|
| |
|
| |
|
| |
|
| |
|
| |
| Assets | | | | US$m | | | US$m | | | % | | | US$m | | | US$m | | | % | | | US$m | | | US$m | | | % | |
| Short-term funds and loans to banks | | | | | | | | | | | | | | | | | | | | | | | | | | | | |
| Europe | HSBC Bank plc | | | 16,691 | | | 595 | | | 3.56 | | | 13,841 | | | 803 | | | 5.80 | | | 18,667 | | | 1,084 | | | 5.81 | |
| | HSBC Private Banking Holdings | | | 5,500 | | | 144 | | | 2.62 | | | 10,529 | | | 488 | | | 4.63 | | | 8,927 | | | 520 | | | 5.83 | |
| | CCF | | | 12,650 | | | 647 | | | 5.11 | | | 12,600 | | | 787 | | | 6.25 | | | 7,368 | | | 471 | | | 6.39 | |
| Hong Kong | Hang Seng Bank | | | 15,205 | | | 409 | | | 2.69 | | | 19,285 | | | 905 | | | 4.69 | | | 20,862 | | | 1,317 | | | 6.31 | |
| | The Hongkong and Shanghai Banking Corporation Limited | | | 17,776 | | | 496 | | | 2.79 | | | 23,455 | | | 1,129 | | | 4.81 | | | 27,352 | | | 1,906 | | | 6.97 | |
| Rest of Asia-Pacific | The Hongkong and Shanghai Banking Corporation Limited | | | 6,686 | | | 187 | | | 2.80 | | | 5,710 | | | 268 | | | 4.69 | | | 6,350 | | | 351 | | | 5.53 | |
| | HSBC Bank Malaysia Berhad | | | 547 | | | 15 | | | 2.74 | | | 1,346 | | | 43 | | | 3.19 | | | 1,842 | | | 57 | | | 3.09 | |
| | HSBC Bank Middle East | | | 1,857 | | | 39 | | | 2.10 | | | 1,846 | | | 78 | | | 4.23 | | | 1,432 | | | 91 | | | 6.35 | |
| North America | HSBC USA Inc. | | | 2,248 | | | 63 | | | 2.80 | | | 3,845 | | | 179 | | | 4.66 | | | 4,141 | | | 247 | | | 5.96 | |
| | HSBC Bank Canada | | | 1,291 | | | 26 | | | 2.01 | | | 1,574 | | | 64 | | | 4.07 | | | 1,395 | | | 83 | | | 5.95 | |
| | HSBC Markets Inc | | | 3,756 | | | 48 | | | 1.28 | | | 3,136 | | | 85 | | | 2.71 | | | 3,198 | | | 147 | | | 4.60 | |
| South America | HSBC Bank Brasil | | | 1,065 | | | 177 | | | 16.62 | | | 1,306 | | | 206 | | | 15.77 | | | 1,039 | | | 159 | | | 15.30 | |
| | HSBC Bank Argentina S.A. | | | 164 | | | 14 | | | 8.54 | | | 746 | | | 39 | | | 5.23 | | | 824 | | | 51 | | | 6.19 | |
| Other operations | | | | 8,998 | | | 360 | | | 4.00 | | | 10,977 | | | 710 | | | 6.47 | | | 11,295 | | | 881 | | | 7.80 | |
| | | |
|
| |
|
| |
|
| |
|
| |
|
| |
|
| |
|
| |
|
| |
|
| |
| | | | | 94,434 | | | 3,220 | | | 3.41 | | | 110,196 | | | 5,784 | | | 5.25 | | | 114,692 | | | 7,365 | | | 6.42 | |
| | | |
|
| |
|
| |
|
| |
|
| |
|
| |
|
| |
|
| |
|
| |
|
| |
| Loans and advances to customers | | | | | | | | | | | | | | | | | | | | | | | | | | | | |
| Europe | HSBC Bank plc | | | 105,456 | | | 5,865 | | | 5.56 | | | 89,987 | | | 6,056 | | | 6.73 | | | 87,684 | | | 6,721 | | | 7.67 | |
| | HSBC Private Banking Holdings | | | 2,881 | | | 81 | | | 2.81 | | | 2,695 | | | 112 | | | 4.16 | | | 2,728 | | | 139 | | | 5.10 | |
| | CCF | | | 29,111 | | | 1,657 | | | 5.69 | | | 25,559 | | | 1,705 | | | 6.67 | | | 11,679 | | | 776 | | | 6.64 | |
| Hong Kong | Hang Seng Bank | | | 28,820 | | | 1,083 | | | 3.76 | | | 28,673 | | | 1,688 | | | 5.89 | | | 27,515 | | | 2,279 | | | 8.28 | |
| | The Hongkong and Shanghai Banking Corporation Limited | | | 39,040 | | | 1,713 | | | 4.39 | | | 37,142 | | | 2,324 | | | 6.26 | | | 34,863 | | | 3,095 | | | 8.88 | |
| Rest of Asia-Pacific | The Hongkong and Shanghai Banking Corporation Limited | | | 22,898 | | | 1,284 | | | 5.61 | | | 20,343 | | | 1,351 | | | 6.64 | | | 19,149 | | | 1,483 | | | 7.74 | |
| | HSBC Bank Malaysia Berhad | | | 4,237 | | | 251 | | | 5.92 | | | 3,829 | | | 242 | | | 6.32 | | | 3,702 | | | 237 | | | 6.41 | |
| | HSBC Bank Middle East | | | 5,243 | | | 366 | | | 6.98 | | | 4,668 | | | 410 | | | 8.78 | | | 4,854 | | | 464 | | | 9.56 | |
| North America | HSBC USA Inc | | | 44,130 | | | 2,419 | | | 5.48 | | | 41,457 | | | 2,815 | | | 6.79 | | | 37,626 | | | 2,983 | | | 7.93 | |
| | HSBC Bank Canada | | | 15,631 | | | 835 | | | 5.34 | | | 14,731 | | | 988 | | | 6.71 | | | 14,170 | | | 1,056 | | | 7.45 | |
| | HSBC Markets Inc | | | 8,975 | | | 115 | | | 1.28 | | | 7,197 | | | 183 | | | 2.54 | | | 5,821 | | | 277 | | | 4.76 | |
| South America | HSBC Bank Brasil | | | 2,542 | | | 821 | | | 32.30 | | | 2,879 | | | 896 | | | 31.12 | | | 2,706 | | | 908 | | | 33.56 | |
| | HSBC Bank Argentina S.A. | | | 889 | | | 261 | | | 29.36 | | | 2,122 | | | 371 | | | 17.48 | | | 2,263 | | | 350 | | | 15.47 | |
| Other operations | | | | 17,031 | | | 773 | | | 4.54 | | | 15,222 | | | 745 | | | 4.89 | | | 15,233 | | | 761 | | | 4.99 | |
| | | |
|
| |
|
| |
|
| |
|
| |
|
| |
|
| |
|
| |
|
| |
|
| |
| | | | | 326,884 | | | 17,524 | | | 5.36 | | | 296,504 | | | 19,886 | | | 6.71 | | | 269,993 | | | 21,529 | | | 7.97 | |
| | | |
|
| |
|
| |
|
| |
|
| |
|
| |
|
| |
|
| |
|
| |
|
| |
101
Back to Contents
HSBC HOLDINGS PLC
Financial Review (continued)
|
| | | | Year ended
31 December 2002
| | Year ended
31 December 2001
| | Year ended
31 December 2000
| |
| | | | | Average balance | | | Interest income | | | Yield | | | Average balance | | | Interest income | | | Yield | | | Average balance | | | Interest income | | | Yield | |
| | | |
|
| |
|
| |
|
| |
|
| |
|
| |
|
| |
|
| |
|
| |
|
| |
| Assets (continued) | | | US$m | | | US$m | | | % | | | US$m | | | US$m | | | % | | | US$m | | | US$m | | | % | |
| Trading securities | | | | | | | | | | | | | | | | | | | | | | | | | | | | |
| Europe | HSBC Bank plc | | | 25,104 | | | 1,084 | | | 4.32 | | | 18,352 | | | 963 | | | 5.25 | | | 7,380 | | | 467 | | | 6.33 | |
| | HSBC Private Banking Holdings | | | – | | | – | | | – | | | – | | | – | | | – | | | 179 | | | 11 | | | 6.15 | |
| | CCF | | | 10,435 | | | 235 | | | 2.25 | | | 13,275 | | | 508 | | | 3.83 | | | 3,135 | | | 218 | | | 6.95 | |
| Hong Kong | Hang Seng Bank | | | 569 | | | 18 | | | 3.16 | | | 761 | | | 40 | | | 5.26 | | | 210 | | | 13 | | | 6.41 | |
| | The Hongkong and Shanghai Banking Corporation Limited | | | 11,915 | | | 432 | | | 3.63 | | | 10,667 | | | 545 | | | 5.11 | | | 6,742 | | | 450 | | | 6.67 | |
| Rest of Asia-Pacific | The Hongkong and Shanghai Banking Corporation Limited | | | 2,452 | | | 112 | | | 4.57 | | | 2,042 | | | 113 | | | 5.53 | | | 1,433 | | | 99 | | | 6.91 | |
| | HSBC Bank Malaysia Berhad | | | 309 | | | 9 | | | 2.91 | | | 223 | | | 7 | | | 3.14 | | | 195 | | | 7 | | | 3.64 | |
| North America | HSBC USA Inc. | | | 4,294 | | | 140 | | | 3.26 | | | 3,898 | | | 181 | | | 4.64 | | | 1,826 | | | 105 | | | 5.75 | |
| | HSBC Bank Canada | | | 755 | | | 18 | | | 2.38 | | | 475 | | | 19 | | | 4.00 | | | 188 | | | 11 | | | 5.85 | |
| | HSBC Markets Inc | | | 16,768 | | | 752 | | | 4.48 | | | 17,439 | | | 877 | | | 5.03 | | | 10,879 | | | 660 | | | 6.07 | |
| South America | HSBC Bank Brasil | | | 34 | | | – | | | – | | | 104 | | | 8 | | | 7.69 | | | 95 | | | 23 | | | 24.21 | |
| | HSBC Bank Argentina S.A. | | | 2 | | | – | | | – | | | 116 | | | 16 | | | 13.79 | | | 192 | | | 21 | | | 10.94 | |
| Other operations | | | | 2,164 | | | 111 | | | 5.13 | | | 1,974 | | | 135 | | | 6.84 | | | 2,009 | | | 153 | | | 7.61 | |
| | | |
|
| |
|
| |
|
| |
|
| |
|
| |
|
| |
|
| |
|
| |
|
| |
| | | | | 74,801 | | | 2,911 | | | 3.89 | | | 69,326 | | | 3,412 | | | 4.92 | | | 34,463 | | | 2,238 | | | 6.49 | |
| | | |
|
| |
|
| |
|
| |
|
| |
|
| |
|
| |
|
| |
|
| |
|
| |
| Investment securities | | | | | | | | | | | | | | | | | | | | | | | | | | | | |
| Europe | HSBC Bank plc | | | 13,071 | | | 623 | | | 4.77 | | | 14,939 | | | 851 | | | 5.70 | | | 20,573 | | | 1,231 | | | 5.98 | |
| | HSBC Private Banking Holdings | | | 14,454 | | | 503 | | | 3.48 | | | 11,376 | | | 611 | | | 5.37 | | | 8,424 | | | 593 | | | 7.04 | |
| | CCF | | | 2,052 | | | 141 | | | 6.87 | | | 2,425 | | | 130 | | | 5.36 | | | 3,285 | | | 180 | | | 5.48 | |
| Hong Kong | Hang Seng Bank | | | 10,629 | | | 375 | | | 3.53 | | | 8,529 | | | 453 | | | 5.31 | | | 6,003 | | | 395 | | | 6.59 | |
| | The Hongkong and Shanghai Banking Corporation Limited | | | 29,945 | | | 955 | | | 3.19 | | | 24,937 | | | 1,173 | | | 4.70 | | | 18,026 | | | 974 | | | 5.40 | |
| Rest of Asia-Pacific | The Hongkong and Shanghai Banking Corporation Limited | | | 10,534 | | | 448 | | | 4.25 | | | 8,587 | | | 475 | | | 5.53 | | | 6,203 | | | 418 | | | 6.74 | |
| | HSBC Bank Malaysia Berhad | | | 981 | | | 34 | | | 3.47 | | | 733 | | | 28 | | | 3.82 | | | 676 | | | 29 | | | 4.26 | |
| | HSBC Bank Middle East | | | 760 | | | 30 | | | 3.95 | | | 755 | | | 48 | | | 6.36 | | | 692 | | | 55 | | | 7.95 | |
| North America | HSBC USA Inc | | | 17,795 | | | 927 | | | 5.21 | | | 19,244 | | | 1,232 | | | 6.40 | | | 19,952 | | | 1,403 | | | 7.03 | |
| | HSBC Bank Canada | | | 2,440 | | | 78 | | | 3.20 | | | 2,105 | | | 99 | | | 4.70 | | | 2,209 | | | 127 | | | 5.75 | |
| | HSBC Markets Inc | | | 17 | | | 1 | | | 5.88 | | | 17 | | | 1 | | | 5.88 | | | 16 | | | 1 | | | 6.25 | |
| South America | HSBC Bank Brasil | | | 1,470 | | | 314 | | | 21.36 | | | 2,745 | | | 462 | | | 16.83 | | | 2,781 | | | 467 | | | 16.79 | |
| | HSBC Bank Argentina S.A. | | | 185 | | | 34 | | | 18.38 | | | 949 | | | 113 | | | 11.91 | | | 808 | | | 86 | | | 10.64 | |
| Other operations | | | | 7,292 | | | 337 | | | 4.62 | | | 5,481 | | | 365 | | | 6.66 | | | 6,678 | | | 492 | | | 7.37 | |
| | | |
|
| |
|
| |
|
| |
|
| |
|
| |
|
| |
|
| |
|
| |
|
| |
| | | | | 111,625 | | | 4,800 | | | 4.30 | | | 102,822 | | | 6,041 | | | 5.88 | | | 96,326 | | | 6,451 | | | 6.70 | |
| | | |
|
| |
|
| |
|
| |
|
| |
|
| |
|
| |
|
| |
|
| |
|
| |
102
Back to Contents
HSBC HOLDINGS PLC
| | | | Year ended
31 December 2002 | | Year ended
31 December 2001 | | Year ended
31 December 2000 | |
| | | |
| |
| |
| |
| | | | | Average
balance | | | Interest
income | | | Yield | | | Average
balance | | | Interest
Income | | | Yield | | | Average
balance | | | Interest
income | | | Yield | |
| | | |
|
| |
|
| |
|
| |
|
| |
|
| |
|
| |
|
| |
|
| |
|
| |
| Assets (continued) | | | US$m | | | US$m | | | % | | | US$m | | | US$m | | | % | | | US$m | | | US$m | | | % | |
| Other interest-earning assets | | | | | | | | | | | | | | | | | | | | | | | | | | | | |
| Europe | HSBC Bank plc | | | 10,384 | | | 198 | | | 1.91 | | | 2,981 | | | 218 | | | 7.31 | | | 2,522 | | | 183 | | | 7.26 | |
| | HSBC Private Banking Holdings | | | 3,964 | | | 119 | | | 3.00 | | | 287 | | | 85 | | | 29.62 | | | 1,915 | | | 124 | | | 6.48 | |
| | CCF | | | 2,701 | | | 56 | | | 2.07 | | | 1,586 | | | 82 | | | 5.17 | | | 45 | | | 3 | | | 6.67 | |
| Hong Kong | Hang Seng Bank | | | 1,158 | | | 33 | | | 2.85 | | | 1,081 | | | 56 | | | 5.18 | | | 1,335 | | | 92 | | | 6.89 | |
| | The Hongkong and Shanghai Banking Corporation Limited | | | 9,128 | | | 238 | | | 2.61 | | | 7,958 | | | 353 | | | 4.44 | | | 9,890 | | | 487 | | | 4.92 | |
| Rest of Asia-Pacific | The Hongkong and Shanghai Banking Corporation Limited | | | 4,349 | | | 87 | | | 2.00 | | | 4,799 | | | 181 | | | 3.77 | | | 5,599 | | | 201 | | | 3.59 | |
| | HSBC Bank Malaysia Berhad | | | 25 | | | 1 | | | 4.00 | | | 72 | | | 4 | | | 5.56 | | | 30 | | | 3 | | | 11.52 | |
| | HSBC Bank Middle East | | | 744 | | | 17 | | | 2.28 | | | 915 | | | 46 | | | 5.03 | | | 905 | | | 60 | | | 6.63 | |
| North America | HSBC USA Inc. | | | 320 | | | 24 | | | 7.50 | | | 665 | | | 46 | | | 6.92 | | | 1,159 | | | 96 | | | 8.28 | |
| | HSBC Bank Canada | | | 1 | | | 1 | | | 100.00 | | | – | | | 3 | | | – | | | – | | | 3 | | | – | |
| | HSBC Markets Inc | | | 64 | | | 2 | | | 3.13 | | | 54 | | | 2 | | | 3.70 | | | 153 | | | 8 | | | 5.23 | |
| South America | HSBC Bank Brasil | | | 196 | | | 24 | | | 12.24 | | | 370 | | | 20 | | | 5.41 | | | 302 | | | 31 | | | 10.26 | |
| | HSBC Bank Argentina S.A | | | 53 | | | 6 | | | 11.32 | | | 50 | | | 5 | | | 10.00 | | | 4 | | | 1 | | | 25.00 | |
| Other operations | | | (32,082 | ) | | (666 | ) | | 2.08 | | | (20,001 | ) | | (963 | ) | | 4.81 | | | (23,148 | ) | | (1,129 | ) | | 4.88 | |
| | | |
|
| |
|
| |
|
| |
|
| |
|
| |
|
| |
|
| |
|
| |
|
| |
| | | | | 1,005 | | | 140 | | | 13.93 | | | 817 | | | 138 | | | 16.89 | | | 711 | | | 163 | | | 22.93 | |
| | | |
|
| |
|
| |
|
| |
|
| |
|
| |
|
| |
|
| |
|
| |
|
| |
| Total interest-earning assets | | | | | | | | | | | | | | | | | | | | | | | | | | | | |
| Europe | HSBC Bank plc | | | 170,706 | | | 8,365 | | | 4.90 | | | 140,100 | | | 8,891 | | | 6.35 | | | 136,826 | | | 9,686 | | | 7.08 | |
| | HSBC Private Banking Holdings | | | 26,799 | | | 847 | | | 3.16 | | | 24,887 | | | 1,296 | | | 5.21 | | | 22,173 | | | 1,387 | | | 6.26 | |
| | CCF | | | 56,949 | | | 2,736 | | | 4.80 | | | 55,445 | | | 3,212 | | | 5.79 | | | 25,512 | | | 1,648 | | | 6.46 | |
| Hong Kong | Hang Seng Bank | | | 56,381 | | | 1,918 | | | 3.40 | | | 58,329 | | | 3,142 | | | 5.39 | | | 55,925 | | | 4,096 | | | 7.32 | |
| | The Hongkong and Shanghai Banking Corporation Limited | | | 107,804 | | | 3,834 | | | 3.56 | | | 104,159 | | | 5,524 | | | 5.30 | | | 96,873 | | | 6,912 | | | 7.13 | |
| Rest of Asia-Pacific | The Hongkong and Shanghai Banking Corporation Limited | | | 46,919 | | | 2,118 | | | 4.51 | | | 41,481 | | | 2,388 | | | 5.76 | | | 38,734 | | | 2,552 | | | 6.59 | |
| | HSBC Bank Malaysia Berhad | | | 6,099 | | | 310 | | | 5.08 | | | 6,203 | | | 324 | | | 5.22 | | | 6,444 | | | 333 | | | 5.17 | |
| | HSBC Bank Middle East | | | 8,604 | | | 452 | | | 5.25 | | | 8,184 | | | 582 | | | 7.11 | | | 7,883 | | | 670 | | | 8.50 | |
| North America | HSBC USA Inc | | | 68,787 | | | 3,573 | | | 5.19 | | | 69,109 | | | 4,453 | | | 6.44 | | | 64,704 | | | 4,834 | | | 7.47 | |
| | HSBC Bank Canada | | | 20,118 | | | 958 | | | 4.76 | | | 18,885 | | | 1,173 | | | 6.21 | | | 17,962 | | | 1,280 | | | 7.13 | |
| | HSBC Markets Inc | | | 29,580 | | | 918 | | | 3.10 | | | 27,843 | | | 1,148 | | | 4.12 | | | 20,067 | | | 1,093 | | | 5.45 | |
| South America | HSBC Bank Brasil | | | 5,307 | | | 1,336 | | | 25.17 | | | 7,404 | | | 1,592 | | | 21.50 | | | 6,923 | | | 1,588 | | | 22.94 | |
| | HSBC Bank Argentina S.A. | | | 1,293 | | | 315 | | | 24.36 | | | 3,983 | | | 544 | | | 13.66 | | | 4,091 | | | 509 | | | 12.44 | |
| Other operations | | | | 3,403 | | | 915 | | | 26.89 | | | 13,653 | | | 992 | | | 7.27 | | | 12,068 | | | 1,158 | | | 9.60 | |
| | | |
|
| |
|
| |
|
| |
|
| |
|
| |
|
| |
|
| |
|
| |
|
| |
| | | | | 608,749 | | | 28,595 | | | 4.70 | | | 579,665 | | | 35,261 | | | 6.08 | | | 516,185 | | | 37,746 | | | 7.31 | |
| | | |
|
| |
|
| |
|
| |
|
| |
|
| |
|
| |
|
| |
|
| |
|
| |
| Summary | | | | | | | | | | | | | | | | | | | | | | | | | | | | |
| Total interest-earning assets | | | 608,749 | | | 28,595 | | | 4.70 | | | 579,665 | | | 35,261 | | | 6.08 | | | 516,185 | | | 37,746 | | | 7.31 | |
| Provisions for bad and doubtful debts | | | (7,809 | ) | | | | | | | | (7,816 | ) | | | | | | | | (7,980 | ) | | | | | | |
| Non interest-earning assets* | | | 132,898 | | | | | | | | | 125,290 | | | | | | | | | 107,480 | | | | | | | |
| | |
| | | | | | | |
| | | | | | | |
| | | | | | | |
| Total assets & interest income* | | | 733,838 | | | 28,595 | | | 3.90 | | | 697,139 | | | 35,261 | | | 5.06 | | | 615,685 | | | 37,746 | | | 6.13 | |
| | |
| |
| | | | |
| |
| | | | |
| |
| | | | |
| * | Figures for 2001 have been restated to reflect the adoption of UK Reporting Standard 19 ‘Deferred Tax’, details of which are set out in Note 1 on the Summary Financial Statements on pages 195 to 197. |
103
Back to Contents
HSBC HOLDINGS PLC
Financial Review (continued)
|
| | | Year ended 31 December
|
| | | | 2002
% | | | 2001
% | | | 2000
% | |
| Assets (continued) | | | | | | | | | |
| Distribution of average total assets: | | | | | | | | | |
| Europe | HSBC Bank plc | | 28.7 | | | 25.1 | | | 27.9 | |
| | HSBC Private Banking Holdings | | 3.8 | | | 3.8 | | | 3.8 | |
| | CCF | | 9.7 | | | 10.1 | | | 4.8 | |
| | | | | | | | | | | |
| Hong Kong | Hang Seng Bank | | 7.9 | | | 8.8 | | | 9.6 | |
| | The Hongkong and Shanghai Banking Corporation Limited | | 18.6 | | | 19.3 | | | 20.5 | |
| | | | | | | | | | | |
| Rest of Asia-Pacific | The Hongkong and Shanghai Banking Corporation Limited | | 7.1 | | | 6.9 | | | 7.0 | |
| | HSBC Bank Malaysia Berhad | | 0.8 | | | 0.9 | | | 1.0 | |
| | HSBC Bank Middle East | | 1.2 | | | 1.2 | | | 1.4 | |
| | | | | | | | | | | |
| North America | HSBC USA Inc | | 11.5 | | | 12.3 | | | 12.5 | |
| | HSBC Bank Canada | | 2.8 | | | 2.9 | | | 3.1 | |
| | HSBC Markets Inc | | 5.3 | | | 5.5 | | | 3.9 | |
| | | | | | | | | | | |
| South America | HSBC Bank Brasil | | 1.1 | | | 1.4 | | | 1.4 | |
| | HSBC Bank Argentina S.A. | | 0.2 | | | 0.7 | | | 0.8 | |
| | | | | | | | | | | |
| Other operations (including consolidation adjustments) | | 1.3 | | | 1.1 | | | 2.3 | |
| | |
|
| |
|
| |
|
| |
| | | | 100.0 | | | 100.0 | | | 100.0 | |
| | |
|
| |
|
| |
|
| |
104
Back to Contents
HSBC HOLDINGS PLC
| | | | Year ended
31 December 2002
| | Year ended
31 December 2001
| | Year ended
31 December 2000
| |
| | | | | Average
balance | | | Interest
expense | | | Cost | | | Average
Balance | | | Interest
Expense | | | Cost | | | Average
balance | | | Interest
expense | | | Cost | |
| | | |
|
| |
|
| |
|
| |
|
| |
|
| |
|
| |
|
| |
|
| |
|
| |
| Liabilities and shareholders’ funds | | | US$m | | | US$m | | | % | | | US$m | | | US$m | | | % | | | US$m | | | US$m | | | % | |
| Deposits by banks# | | | | | | | | | | | | | | | | | | | | | | | | | | | | |
| Europe | HSBC Bank plc | | | 18,259 | | | 212 | | | 1.16 | | | 13,890 | | | 451 | | | 3.25 | | | 12,725 | | | 668 | | | 5.25 | |
| | HSBC Private Banking Holdings | | | 1,976 | | | 60 | | | 3.04 | | | 1,708 | | | 66 | | | 3.86 | | | 2,158 | | | 103 | | | 4.77 | |
| | CCF | | | 13,456 | | | 596 | | | 4.43 | | | 17,393 | | | 1,136 | | | 6.53 | | | 11,534 | | | 644 | | | 5.58 | |
| Hong Kong | Hang Seng Bank | | | 83 | | | 1 | | | 1.20 | | | 256 | | | 9 | | | 3.52 | | | 632 | | | 37 | | | 5.79 | |
| | The Hongkong and Shanghai Banking Corporation Limited | | | 2,066 | | | 35 | | | 1.69 | | | 1,933 | | | 70 | | | 3.62 | | | 1,911 | | | 113 | | | 5.93 | |
| Rest of Asia-Pacific | The Hongkong and Shanghai Banking Corporation Limited | | | 2,683 | | | 103 | | | 3.84 | | | 2,757 | | | 146 | | | 5.30 | | | 1,956 | | | 109 | | | 5.57 | |
| | HSBC Bank Malaysia Berhad | | | 113 | | | 3 | | | 2.65 | | | 32 | | | 1 | | | 3.13 | | | 51 | | | 1 | | | 2.26 | |
| | HSBC Bank Middle East | | | 531 | | | 15 | | | 2.82 | | | 315 | | | 14 | | | 4.44 | | | 326 | | | 21 | | | 6.44 | |
| North America | HSBC USA Inc. | | | 4,216 | | | 46 | | | 1.09 | | | 3,702 | | | 100 | | | 2.70 | | | 2,776 | | | 102 | | | 3.67 | |
| | HSBC Bank Canada | | | 679 | | | 26 | | | 3.83 | | | 439 | | | 18 | | | 4.10 | | | 374 | | | 21 | | | 5.61 | |
| | HSBC Markets Inc | | | 3,190 | | | 44 | | | 1.38 | | | 3,654 | | | 114 | | | 3.12 | | | 2,791 | | | 131 | | | 4.69 | |
| South America | HSBC Bank Brasil | | | 693 | | | 79 | | | 11.40 | | | 1,177 | | | 106 | | | 9.01 | | | 920 | | | 101 | | | 10.98 | |
| | HSBC Bank Argentina S.A. | | | 164 | | | 69 | | | 42.07 | | | 432 | | | 29 | | | 6.71 | | | 425 | | | 35 | | | 8.24 | |
| Other operations | | | | 4,985 | | | 133 | | | 2.67 | | | 5,506 | | | 199 | | | 3.61 | | | 5,664 | | | 270 | | | 4.76 | |
| | | |
|
| |
|
| |
|
| |
|
| |
|
| |
|
| |
|
| |
|
| |
|
| |
| | | | | 53,094 | | | 1,422 | | | 2.68 | | | 53,194 | | | 2,459 | | | 4.62 | | | 44,243 | | | 2,356 | | | 5.33 | |
| | | |
|
| |
|
| |
|
| |
|
| |
|
| |
|
| |
|
| |
|
| |
|
| |
| Customer accounts# | | | | | | | | | | | | | | | | | | | | | | | | | | | | |
| Europe | HSBC Bank plc | | | 106,301 | | | 2,387 | | | 2.25 | | | 90,055 | | | 3,300 | | | 3.66 | | | 88,360 | | | 4,037 | | | 4.57 | |
| | HSBC Private Banking Holdings | | | 20,476 | | | 549 | | | 2.68 | | | 20,839 | | | 937 | | | 4.50 | | | 16,421 | | | 965 | | | 5.88 | |
| | CCF | | | 11,841 | | | 593 | | | 5.01 | | | 12,174 | | | 665 | | | 5.46 | | | 7,181 | | | 421 | | | 5.86 | |
| Hong Kong | Hang Seng Bank | | | 48,074 | | | 448 | | | 0.93 | | | 49,842 | | | 1,502 | | | 3.01 | | | 47,432 | | | 2,397 | | | 5.05 | |
| | The Hongkong and Shanghai Banking Corporation Limited | | | 82,535 | | | 616 | | | 0.75 | | | 81,484 | | | 2,219 | | | 2.72 | | | 75,534 | | | 3,651 | | | 4.83 | |
| Rest of Asia-Pacific | The Hongkong and Shanghai Banking Corporation Limited | | | 29,965 | | | 705 | | | 2.35 | | | 25,581 | | | 969 | | | 3.79 | | | 22,994 | | | 1,117 | | | 4.86 | |
| | HSBC Bank Malaysia Berhad | | | 4,347 | | | 131 | | | 3.01 | | | 4,456 | | | 145 | | | 3.25 | | | 4,360 | | | 146 | | | 3.35 | |
| | HSBC Bank Middle East | | | 6,176 | | | 106 | | | 1.72 | | | 6,311 | | | 250 | | | 3.96 | | | 5,937 | | | 331 | | | 5.58 | |
| North America | HSBC USA Inc | | | 45,438 | | | 860 | | | 1.89 | | | 45,817 | | | 1,609 | | | 3.51 | | | 41,966 | | | 1,951 | | | 4.65 | |
| | HSBC Bank Canada | | | 13,708 | | | 257 | | | 1.87 | | | 12,876 | | | 474 | | | 3.68 | | | 12,314 | | | 593 | | | 4.82 | |
| | HSBC Markets Inc | | | 6,972 | | | 112 | | | 1.61 | | | 7,820 | | | 295 | | | 3.77 | | | 4,427 | | | 234 | | | 5.29 | |
| South America | HSBC Bank Brasil | | | 3,066 | | | 491 | | | 16.01 | | | 4,086 | | | 598 | | | 14.64 | | | 4,275 | | | 553 | | | 12.94 | |
| | HSBC Bank Argentina S.A. | | | 757 | | | 217 | | | 28.67 | | | 2,689 | | | 226 | | | 8.40 | | | 2,854 | | | 191 | | | 6.69 | |
| Other operations | | | 26,949 | | | 704 | | | 2.61 | | | 23,919 | | | 1,062 | | | 4.44 | | | 22,972 | | | 1,168 | | | 5.08 | |
| | | |
|
| |
|
| |
|
| |
|
| |
|
| |
|
| |
|
| |
|
| |
|
| |
| | | | | 406,605 | | | 8,176 | | | 2.01 | | | 387,949 | | | 14,251 | | | 3.67 | | | 357,027 | | | 17,755 | | | 4.97 | |
| | | |
|
| |
|
| |
|
| |
|
| |
|
| |
|
| |
|
| |
|
| |
|
| |
| # | Further analysis is given on pages 145 and 146. |
105
Back to Contents
HSBC HOLDINGS PLC
Financial Review (continued)
|
| | | | Year ended
31 December 2002
| | Year ended
31 December 2001
| | Year ended
31 December 2000
| |
| | | | | Average
balance | | | Interest
expense | | | Cost | | | Average
Balance | | | Interest
expense | | | Cost | | | Average
balance | | | Interest
expense | | | Cost | |
| | | |
|
| |
|
| |
|
| |
|
| |
|
| |
|
| |
|
| |
|
| |
|
| |
Liabilities and shareholders’ funds (continued) | | | US$m | | | US$m | | | % | | | US$m | | | US$m | | | % | | | US$m | | | US$m | | | % | |
CDs and other money market instruments # | | | | | | | | | | | | | | | | | | | | | | | | | | | | |
| Europe | HSBC Bank plc | | | 2,088 | | | 83 | | | 3.98 | | | 1,257 | | | 65 | | | 5.17 | | | 1,284 | | | 79 | | | 6.15 | |
| | HSBC Private Banking Holdings | | | – | | | – | | | – | | | – | | | – | | | – | | | – | | | – | | | – | |
| | CCF | | | 4,856 | | | 201 | | | 4.14 | | | 5,547 | | | 262 | | | 4.72 | | | 2,489 | | | 136 | | | 5.46 | |
| Hong Kong | Hang Seng Bank | | | 2,150 | | | 65 | | | 3.02 | | | 2,040 | | | 94 | | | 4.61 | | | 2,195 | | | 147 | | | 6.71 | |
| | The Hongkong and Shanghai Banking Corporation Limited | | | 5,331 | | | 258 | | | 4.84 | | | 3,851 | | | 242 | | | 6.28 | | | 3,933 | | | 291 | | | 7.39 | |
| Rest of Asia-Pacific | The Hongkong and Shanghai Banking Corporation Limited | | | 1,659 | | | 69 | | | 4.16 | | | 1,298 | | | 67 | | | 5.16 | | | 1,397 | | | 82 | | | 5.87 | |
| | HSBC Bank Malaysia Berhad | | | 148 | | | 7 | | | 4.73 | | | 121 | | | 6 | | | 4.96 | | | 175 | | | 8 | | | 4.29 | |
| | HSBC Bank Middle East | | | – | | | – | | | – | | | – | | | – | | | – | | | – | | | – | | | – | |
| North America | HSBC USA Inc | | | 2,286 | | | 62 | | | 2.71 | | | 2,030 | | | 92 | | | 4.53 | | | 2,192 | | | 72 | | | 3.28 | |
| | HSBC Bank Canada | | | 2,168 | | | 56 | | | 2.58 | | | 2,193 | | | 104 | | | 4.74 | | | 1,589 | | | 91 | | | 5.73 | |
| South America | HSBC Bank Brasil | | | 53 | | | 14 | | | 26.42 | | | 29 | | | 4 | | | 13.79 | | | 53 | | | 5 | | | 9.43 | |
| | HSBC Bank Argentina S.A. | | | 105 | | | 7 | | | 6.67 | | | 284 | | | 21 | | | 7.39 | | | 113 | | | 10 | | | 8.85 | |
| Other operations | | | | 1,081 | | | 38 | | | 3.52 | | | 475 | | | 3 | | | 0.63 | | | 539 | | | 22 | | | 4.17 | |
| | | |
|
| |
|
| |
|
| |
|
| |
|
| |
|
| |
|
| |
|
| |
|
| |
| | | | | 21,925 | | | 860 | | | 3.92 | | | 19,125 | | | 960 | | | 5.02 | | | 15,959 | | | 943 | | | 5.91 | |
| | | |
|
| |
|
| |
|
| |
|
| |
|
| |
|
| |
|
| |
|
| |
|
| |
Loan capital | | | | | | | | | | | | | | | | | | | | | | | | | | | | |
| Europe | HSBC Bank plc | | | 7,053 | | | 463 | | | 6.56 | | | 10,136 | | | 625 | | | 6.17 | | | 9,445 | | | 668 | | | 7.07 | |
| | HSBC Private Banking Holdings | | | – | | | – | | | – | | | – | | | – | | | – | | | 91 | | | 8 | | | 8.79 | |
| | CCF | | | 3,941 | | | 164 | | | 4.16 | | | 2,939 | | | 163 | | | 5.55 | | | 1,093 | | | 58 | | | 5.31 | |
| Hong Kong | The Hongkong and Shanghai Banking Corporation Limited | | | 1,786 | | | 83 | | | 4.65 | | | 1,805 | | | 99 | | | 5.48 | | | 1,820 | | | 121 | | | 6.64 | |
| Rest of Asia-Pacific | The Hongkong and Shanghai Banking Corporation Limited | | | 151 | | | 12 | | | 7.95 | | | 47 | | | 6 | | | 12.77 | | | 107 | | | 13 | | | 12.15 | |
| North America | HSBC USA Inc. | | | 3,396 | | | 214 | | | 6.30 | | | 3,969 | | | 280 | | | 7.05 | | | 5,271 | | | 462 | | | 8.76 | |
| | HSBC Bank Canada | | | 1,014 | | | 65 | | | 6.41 | | | 1,272 | | | 80 | | | 6.29 | | | 1,628 | | | 107 | | | 6.57 | |
| South America | HSBC Bank Brasil | | | 271 | | | 44 | | | 16.24 | | | 208 | | | 11 | | | 5.29 | | | 72 | | | 8 | | | 11.11 | |
| | HSBC Bank Argentina S.A. | | | 319 | | | 62 | | | 19.44 | | | 245 | | | 24 | | | 9.80 | | | 281 | | | 27 | | | 9.61 | |
| Other operations | | | 7,167 | | | 169 | | | 2.36 | | | 5,952 | | | 264 | | | 4.44 | | | 4,771 | | | 322 | | | 6.75 | |
| | | |
|
| |
|
| |
|
| |
|
| |
|
| |
|
| |
|
| |
|
| |
|
| |
| | | | | 25,098 | | | 1,276 | | | 5.08 | | | 26,573 | | | 1,552 | | | 5.84 | | | 24,579 | | | 1,794 | | | 7.30 | |
| | | |
|
| |
|
| |
|
| |
|
| |
|
| |
|
| |
|
| |
|
| |
|
| |
| | |
| # | Further analysis is given on page 147. |
106
Back to Contents
HSBC HOLDINGS PLC
| | | Year ended
31 December 2002
| | Year ended
31 December 2001
| | Year ended
31 December 2000
| |
| | | | Average
balance | | | Interest
expense | | | Cost | | | Average
balance | | | Interest
expense | | | Cost | | | Average
balance | | | Interest
expense | | | Cost | |
| | |
|
| |
|
| |
|
| |
|
| |
|
| |
|
| |
|
| |
|
| |
|
| |
Liabilities and shareholders’ funds (continued) | | US$m | | | US$m | | | % | | | US$m | | | US$m | | | % | | | US$m | | | US$m | | | % | |
| | | | | | | | | | | | | | | | | | | | | | | | | | | |
Other interest-bearing liabilities | | | | | | | | | | | | | | | | | | | | | | | | | | | |
| Europe | HSBC Bank plc | | 21,006 | | | 581 | | | 2.77 | | | 10,273 | | | 525 | | | 5.11 | | | 10,849 | | | 582 | | | 5.36 | |
| | HSBC Private Banking Holdings | | 1,645 | | | 37 | | | 2.25 | | | 1,152 | | | 69 | | | 5.99 | | | 840 | | | 30 | | | 3.57 | |
| | CCF | | 10,725 | | | 154 | | | 1.44 | | | 6,496 | | | 92 | | | 1.42 | | | 118 | | | 6 | | | 5.08 | |
| | | | | | | | | | | | | | | | | | | | | | | | | | | |
| Hong Kong | Hang Seng Bank | | 684 | | | 19 | | | 2.78 | | | 869 | | | 42 | | | 4.83 | | | 251 | | | 14 | | | 5.67 | |
| | The Hongkong and Shanghai Banking Corporation Limited | | 7,753 | | | 179 | | | 2.31 | | | 7,367 | | | 309 | | | 4.19 | | | 6,009 | | | 342 | | | 5.78 | |
| | | | | | | | | | | | | | | | | | | | | | | | | | | |
| Rest of Asia-Pacific | The Hongkong and Shanghai Banking CorporationLimited | | 8,744 | | | 195 | | | 2.23 | | | 7,433 | | | 273 | | | 3.67 | | | 8,153 | | | 385 | | | 4.72 | |
| | HSBC Bank Malaysia Berhad | | 51 | | | 1 | | | 1.96 | | | 40 | | | 1 | | | 2.50 | | | 80 | | | 4 | | | 4.86 | |
| | HSBC Bank Middle East | | 179 | | | 6 | | | 3.35 | | | 46 | | | 4 | | | 8.70 | | | 96 | | | 6 | | | 6.25 | |
| | | | | | | | | | | | | | | | | | | | | | | | | | | |
| North America | HSBC USA Inc | | 9,545 | | | 280 | | | 2.93 | | | 7,425 | | | 462 | | | 6.22 | | | 9,767 | | | 603 | | | 6.17 | |
| | HSBC Bank Canada | | 415 | | | 15 | | | 3.61 | | | 374 | | | 16 | | | 4.28 | | | 406 | | | 20 | | | 4.93 | |
| | HSBC Markets Inc. | | 19,141 | | | 832 | | | 4.35 | | | 16,568 | | | 740 | | | 4.47 | | | 12,634 | | | 681 | | | 5.39 | |
| | | | | | | | | | | | | | | | | | | | | | | | | | | |
| South America | HSBC Bank Brasil | | 467 | | | 79 | | | 16.92 | | | 633 | | | 133 | | | 21.01 | | | 261 | | | 49 | | | 18.77 | |
| | HSBC Bank Argentina S.A. | | 299 | | | (5 | ) | | (1.67 | ) | | 80 | | | 19 | | | 23.75 | | | 102 | | | 19 | | | 18.63 | |
| | | | | | | | | | | | | | | | | | | | | | | | | | | |
| Other operations | | | (47,127 | ) | | (972 | ) | | 2.06 | | | (30,800 | ) | | (1,371 | ) | | 4.45 | | | (30,359 | ) | | (1,566 | ) | | 5.16 | |
| | |
|
| |
|
| |
|
| |
|
| |
|
| |
|
| |
|
| |
|
| |
|
| |
| | | | 33,527 | | | 1,401 | | | 4.18 | | | 27,956 | | | 1,314 | | | 4.70 | | | 19,207 | | | 1,175 | | | 6.12 | |
| | |
|
| |
|
| |
|
| |
|
| |
|
| |
|
| |
|
| |
|
| |
|
| |
107
Back to Contents
HSBC HOLDINGS PLC
Financial Review (continued)
|
| | | Year ended
31 December 2002
| | Year ended
31 December 2001
| | Year ended
31 December 2000
| |
| | | | Average
balance | | | Interest
expense | | | Cost | | | Average
balance | | | Interest
expense | | | Cost | | | Average
balance | | | Interest
expense | | | Cost | |
| | |
|
| |
|
| |
|
| |
|
| |
|
| |
|
| |
|
| |
|
| |
|
| |
Liabilities and shareholders’ funds (continued) | | US$m | | | US$m | | | % | | | US$m | | | US$m | | | % | | | US$m | | | US$m | | | % | |
| | | | | | | | | | | | | | | | | | | | | | | | | | | |
Total interest-bearing liabilities | | | | | | | | | | | | | | | | | | | | | | | | | | | |
| | | | | | | | | | | | | | | | | | | | | | | | | | | |
| Europe | HSBC Bank plc | | 154,707 | | | 3,726 | | | 2.41 | | | 125,611 | | | 4,966 | | | 3.95 | | | 122,663 | | | 6,034 | | | 4.92 | |
| | HSBC Private Banking Holdings | | 24,097 | | | 646 | | | 2.68 | | | 23,699 | | | 1,072 | | | 4.52 | | | 19,510 | | | 1,106 | | | 5.67 | |
| | CCF | | 44,819 | | | 1,708 | | | 3.81 | | | 44,549 | | | 2,318 | | | 5.20 | | | 22,415 | | | 1,265 | | | 5.64 | |
| | | | | | | | | | | | | | | | | | | | | | | | | | | |
| Hong Kong | Hang Seng Bank | | 50,991 | | | 533 | | | 1.05 | | | 53,007 | | | 1,647 | | | 3.11 | | | 50,510 | | | 2,595 | | | 5.14 | |
| | The Hongkong and Shanghai Banking Corporation Limited | | 99,471 | | | 1,171 | | | 1.18 | | | 96,440 | | | 2,939 | | | 3.05 | | | 89,207 | | | 4,518 | | | 5.08 | |
| | | | | | | | | | | | | | | | | | | | | | | | | | | |
| Rest of Asia- Pacific | The Hongkong and Shanghai Banking Corporation Limited | | 43,202 | | | 1,084 | | | 2.51 | | | 37,116 | | | 1,461 | | | 3.94 | | | 34,607 | | | 1,706 | | | 4.93 | |
| | HSBC Bank Malaysia Berhad | | 4,659 | | | 142 | | | 3.05 | | | 4,649 | | | 153 | | | 3.29 | | | 4,666 | | | 159 | | | 3.40 | |
| | HSBC Bank Middle East | | 6,886 | | | 127 | | | 1.84 | | | 6,672 | | | 268 | | | 4.02 | | | 6,359 | | | 358 | | | 5.63 | |
| | | | | | | | | | | | | | | | | | | | | | | | | | | |
| North America | HSBC USA Inc | | 64,881 | | | 1,462 | | | 2.25 | | | 62,943 | | | 2,543 | | | 4.04 | | | 61,972 | | | 3,190 | | | 5.15 | |
| | HSBC Bank Canada | | 17,984 | | | 419 | | | 2.33 | | | 17,154 | | | 692 | | | 4.03 | | | 16,311 | | | 832 | | | 5.10 | |
| . | HSBC Markets Inc | | 29,303 | | | 988 | | | 3.37 | | | 28,042 | | | 1,149 | | | 4.10 | | | 19,852 | | | 1,046 | | | 5.27 | |
| | | | | | | | | | | | | | | | | | | | | | | | | | | |
| South America | HSBC Bank Brasil | | 4,550 | | | 707 | | | 15.54 | | | 6,133 | | | 852 | | | 13.89 | | | 5,581 | | | 716 | | | 12.83 | |
| | HSBC Bank Argentina S.A. | | 1,644 | | | 350 | | | 21.29 | | | 3,730 | | | 319 | | | 8.55 | | | 3,775 | | | 282 | | | 7.47 | |
| | | | | | | | | | | | | | | | | | | | | | | | | | | |
| Other operations | | | (6,945 | ) | | 72 | | | (1.04 | ) | | 5,052 | | | 157 | | | 3.11 | | | 3,587 | | | 216 | | | 6.03 | |
| | |
|
| |
|
| |
|
| |
|
| |
|
| |
|
| |
|
| |
|
| |
|
| |
| | | | 540,249 | | | 13,135 | | | 2.43 | | | 514,797 | | | 20,536 | | | 3.99 | | | 461,015 | | | 24,023 | | | 5.21 | |
| | |
|
| |
|
| |
|
| |
|
| |
|
| |
|
| |
|
| |
|
| |
|
| |
| Total interest-bearing liabilities | | 540,249 | | | 13,135 | | | 2.43 | | | 514,797 | | | 20,536 | | | 3.99 | | | 461,015 | | | 24,023 | | | 5.21 | |
| Non interest-bearing current accounts | | 40,220 | | | | | | | | | 36,090 | | | | | | | | | 27,199 | | | | | | | |
| Shareholders’ funds & other non interest-bearing liabilities* | | 153,369 | | | | | | | | | 146,252 | | | | | | | | | 127,471 | | | | | | | |
| | |
| | | | | | | |
| | | | | | | |
| | | | | | | |
| Total liabilities & interest expense* | | 733,838 | | | 13,135 | | | 1.79 | | | 697,139 | | | 20,536 | | | 2.95 | | | 615,685 | | | 24,023 | | | 3.90 | |
| | |
| |
| | | | |
| |
| | | | |
| |
| | | | |
| * | Figures for 2001 have been restated to reflect the adoption of UK Financial Reporting Standard 19 ‘Deferred Tax’, details of which are set out in Note 1 on the Summary Financial Statements on pages 195 to 197. |
108
Back to Contents
HSBC HOLDINGS PLC
| | | Year ended 31 December
| |
| | | | 2002 | | | 2001 | | | 2000 | |
Net interest margin | | | % | | | % | | | % | |
| Europe | HSBC Bank plc | | 2.72 | | | 2.80 | | | 2.67 | |
| | HSBC Private Banking Holdings | | 0.75 | | | 0.90 | | | 1.27 | |
| | CCF | | 1.81 | | | 1.61 | | | 1.50 | |
| Hong Kong | Hang Seng Bank | | 2.46 | | | 2.56 | | | 2.68 | |
| | The Hongkong and Shanghai Banking Corporation Limited | | 2.47 | | | 2.48 | | | 2.47 | |
| Rest of Asia-Pacific | The Hongkong and Shanghai Banking Corporation Limited | | 2.20 | | | 2.23 | | | 2.18 | |
| | HSBC Bank Malaysia Berhad | | 2.76 | | | 2.76 | | | 2.71 | |
| | HSBC Bank Middle East | | 3.78 | | | 3.84 | | | 3.96 | |
| North America | HSBC USA Inc. | | 3.07 | | | 2.76 | | | 2.54 | |
| | HSBC Bank Canada | | 2.68 | | | 2.55 | | | 2.49 | |
| | HSBC Markets Inc. | | (0.24 | ) | | 0.00 | | | 0.23 | |
| South America | HSBC Bank Brasil | | 11.85 | | | 9.99 | | | 12.60 | |
| | HSBC Bank Argentina S.A. | | (2.71 | ) | | 5.65 | | | 5.55 | |
| Other operations | | | 24.77 | | | 6.12 | | | 7.80 | |
| | |
|
| |
|
| |
|
| |
| HSBC margin | | | 2.54 | | | 2.54 | | | 2.66 | |
| | |
|
| |
|
| |
|
| |
| (i) | Average balances are based on daily averages for the principal areas of HSBC’s banking activities with monthly or less frequent averages used elsewhere. |
| (ii) | ’Loans accounted for on a non-accrual basis’ and ‘Loans on which interest has been accrued but suspended’ have been included in ‘Loans and advances to banks’ and ‘Loans and advances to customers’. Interest income on such loans is included in the consolidated profit and loss account to the extent it has been received. |
| (iii) | Balances and transactions with fellow subsidiaries are reported gross in the principal commercial banking entities within ‘Other interest-earning assets’ and ‘Other interest-bearing liabilities’ as appropriate and the elimination entries included within ‘Other operations’ in those two categories. |
| (iv) | Other than as noted in (iii) above, ‘Other operations’ comprise the operations of the principal commercial banking entities outside their domestic markets and all other banking operations. |
| (v) | Non-equity minority interests are included within shareholders’ funds and other non interest-bearing liabilities and the related coupon payments are included within minority interests in the profit and loss account. |
109
Back to Contents
HSBC HOLDINGS PLC
Financial Review (continued)
|
Analysis of changes in net interest income |
The following table allocates changes in net interest income between volume and rate for 2002 compared with 2001, and for 2001 compared with 2000. Changes due to a combination of volume and rate are allocated to rate.
| | | 2002 compared with 2001
Increase/(decrease)
| | 2001 compared with 2000
Increase/(decrease)
| | | | |
| | | | 2002 | | | Volume | | | Rate | | | 2001 | | | Volume | | | Rate | | | 2000 | |
Interest income | | | US$m | | | US$m | | | US$m | | | US$m | | | US$m | | | US$m | | | US$m | |
Short-term funds and loans to banks | | | | | | | | | | | | | | | | | | | | | |
| Europe | HSBC Bank plc | | 595 | | | 165 | | | (373 | ) | | 803 | | | (280 | ) | | (1 | ) | | 1,084 | |
| | HSBC Private Banking Holdings | | 144 | | | (233 | ) | | (111 | ) | | 488 | | | 93 | | | (125 | ) | | 520 | |
| | CCF | | 647 | | | 3 | | | (143 | ) | | 787 | | | 334 | | | (18 | ) | | 471 | |
| Hong Kong | Hang Seng Bank | | 409 | | | (191 | ) | | (305 | ) | | 905 | | | (100 | ) | | (312 | ) | | 1,317 | |
| | The Hongkong and Shanghai Banking Corporation Limited | | 496 | | | (273 | ) | | (360 | ) | | 1,129 | | | (272 | ) | | (505 | ) | | 1,906 | |
| Rest of Asia-Pacific | The Hongkong and Shanghai Banking Corporation Limited | | 187 | | | 46 | | | (127 | ) | | 268 | | | (35 | ) | | (48 | ) | | 351 | |
| | HSBC Bank Malaysia Berhad | | 15 | | | (26 | ) | | (2 | ) | | 43 | | | (15 | ) | | 1 | | | 57 | |
| | HSBC Bank Middle East | | 39 | | | – | | | (39 | ) | | 78 | | | 26 | | | (39 | ) | | 91 | |
| North America | HSBC USA Inc. | | 63 | | | (74 | ) | | (42 | ) | | 179 | | | (18 | ) | | (50 | ) | | 247 | |
| | HSBC Bank Canada | | 26 | | | (12 | ) | | (26 | ) | | 64 | | | 11 | | | (30 | ) | | 83 | |
| | HSBC Markets Inc | | 48 | | | 17 | | | (54 | ) | | 85 | | | (3 | ) | | (59 | ) | | 147 | |
| South America | HSBC Bank Brasil | | 177 | | | (38 | ) | | 9 | | | 206 | | | 41 | | | 6 | | | 159 | |
| | HSBC Bank Argentina S.A. | | 14 | | | (30 | ) | | 5 | | | 39 | | | (5 | ) | | (7 | ) | | 51 | |
| Other operations | | | 360 | | | (128 | ) | | (222 | ) | | 710 | | | (25 | ) | | (146 | ) | | 881 | |
| | |
| | | | | | | |
| | | | | | | |
| |
| | | | 3,220 | | | (827 | ) | | (1,737 | ) | | 5,784 | | | (289 | ) | | (1,292 | ) | | 7,365 | |
| | |
| | | | | | | |
| | | | | | | |
| |
Loans and advances to customers | | | | | | | | | | | | | | | | | | | | | |
| Europe | HSBC Bank plc | | 5,865 | | | 1,041 | | | (1,232 | ) | | 6,056 | | | 177 | | | (842 | ) | | 6,721 | |
| | HSBC Private Banking Holdings | | 81 | | | 8 | | | (39 | ) | | 112 | | | (2 | ) | | (25 | ) | | 139 | |
| | CCF | | 1,657 | | | 237 | | | (285 | ) | | 1,705 | | | 922 | | | 7 | | | 776 | |
| Hong Kong | Hang Seng Bank | | 1,083 | | | 9 | | | (614 | ) | | 1,688 | | | 96 | | | (687 | ) | | 2,279 | |
| | The Hongkong and Shanghai Banking Corporation Limited | | 1,713 | | | 119 | | | (730 | ) | | 2,324 | | | 202 | | | (973 | ) | | 3,095 | |
| Rest of Asia-Pacific | The Hongkong and Shanghai Banking Corporation Limited | | 1,284 | | | 170 | | | (237 | ) | | 1,351 | | | 92 | | | (224 | ) | | 1,483 | |
| | HSBC Bank Malaysia Berhad | | 251 | | | 26 | | | (17 | ) | | 242 | | | 8 | | | (3 | ) | | 237 | |
| | HSBC Bank Middle East | | 366 | | | 51 | | | (95 | ) | | 410 | | | (18 | ) | | (36 | ) | | 464 | |
| North America | HSBC USA Inc. | | 2,419 | | | 182 | | | (578 | ) | | 2,815 | | | 304 | | | (472 | ) | | 2,983 | |
| | HSBC Bank Canada | | 835 | | | 60 | | | (213 | ) | | 988 | | | 42 | | | (110 | ) | | 1,056 | |
| | HSBC Markets Inc | | 115 | | | 45 | | | (113 | ) | | 183 | | | 65 | | | (159 | ) | | 277 | |
| South America | HSBC Bank Brasil | | 821 | | | (105 | ) | | 30 | | | 896 | | | 58 | | | (70 | ) | | 908 | |
| | HSBC Bank Argentina S.A. | | 261 | | | (216 | ) | | 106 | | | 371 | | | (22 | ) | | 43 | | | 350 | |
| Other operations | | | 773 | | | 89 | | | (61 | ) | | 745 | | | (1 | ) | | (15 | ) | | 761 | |
| | |
| | | | | | | |
| | | | | | | |
| |
| | | | 17,524 | | | 2,038 | | | (4,400 | ) | | 19,886 | | | 2,114 | | | (3,757 | ) | | 21,529 | |
| | |
| | | | | | | |
| | | | | | | |
| |
110
Back to Contents
HSBC HOLDINGS PLC
| | | 2002 compared with 2001
Increase/(decrease)
| | 2001 compared with 2000
Increase/(decrease)
| | | | |
| | | | 2002 | | | Volume | | | Rate | | | 2001 | | | Volume | | | Rate | | | 2000 | |
Interest income (continued) | | US$m | | | US$m | | | US$m | | | US$m | | | US$m | | | US$m | | | US$m | |
| | | | | | | | | | | | | | | | | | | | | | | |
Trading securities | | | | | | | | | | | | | | | | | | | | | |
| Europe | HSBC Bank plc | | 1,084 | | | 354 | | | (233 | ) | | 963 | | | 694 | | | (198 | ) | | 467 | |
| HSBC Private Banking Holdings | | – | | | – | | | – | | | – | | | (11 | ) | | – | | | 11 | |
| | CCF | | 235 | | | (109 | ) | | (164 | ) | | 508 | | | 705 | | | (415 | ) | | 218 | |
| | | | | | | | | | | | | | | | | | | | | | | |
| Hong Kong | Hang Seng Bank | | 18 | | | (10 | ) | | (12 | ) | | 40 | | | 34 | | | (7 | ) | | 13 | |
| The Hongkong and Shanghai
Banking Corporation
Limited | | 432 | | | 64 | | | (177 | ) | | 545 | | | 262 | | | (167 | ) | | 450 | |
| | | | | | | | | | | | | | | | | | | | | | |
| Rest of Asia-Pacific | The Hongkong and Shanghai
Banking Corporation
Limited | | 112 | | | 23 | | | (24 | ) | | 113 | | | 42 | | | (28 | ) | | 99 | |
| HSBC Bank Malaysia Berhad | | 9 | | | 3 | | | (1 | ) | | 7 | | | 1 | | | (1 | ) | | 7 | |
| | | | | | | | | | | | | | | | | | | | | | |
| North America | HSBC USA Inc. | | 140 | | | 18 | | | (59 | ) | | 181 | | | 119 | | | (43 | ) | | 105 | |
| | HSBC Bank Canada | | 18 | | | 11 | | | (12 | ) | | 19 | | | 17 | | | (9 | ) | | 11 | |
| HSBC Markets Inc | | 752 | | | (34 | ) | | (91 | ) | | 877 | | | 398 | | | (181 | ) | | 660 | |
| | | | | | | | | | | | | | | | | | | | | | | |
| South America | HSBC Bank Brasil | | – | | | (5 | ) | | (3 | ) | | 8 | | | 2 | | | (17 | ) | | 23 | |
| | HSBC Bank Argentina S.A. | | – | | | (16 | ) | | – | | | 16 | | | (8 | ) | | 3 | | | 21 | |
| | | | | | | | | | | | | | | | | | | | | | | |
| Other operations | | | 111 | | | 13 | | | (37 | ) | | 135 | | | (3 | ) | | (15 | ) | | 153 | |
| | |
| | | | | | | |
| | | | | | | |
| |
| | | | 2,911 | | | 269 | | | (770 | ) | | 3,412 | | | 2,264 | | | (1,090 | ) | | 2,238 | |
| | |
| | | | | | | |
| | | | | | | |
| |
| Investment securities |
| Europe | HSBC Bank plc | | 623 | | | (106 | ) | | (122 | ) | | 851 | | | (337 | ) | | (43 | ) | | 1,231 | |
| | HSBC Private Banking
Holdings | | 503 | | | 165 | | | (273 | ) | | 611 | | | 208 | | | (190 | ) | | 593 | |
| | CCF | | 141 | | | (20 | ) | | 31 | | | 130 | | | (47 | ) | | (3 | ) | | 180 | |
| | | | | | | | | | | | | | | | | | | | | | | |
| Hong Kong | Hang Seng Bank | | 375 | | | 112 | | | (190 | ) | | 453 | | | 166 | | | (108 | ) | | 395 | |
| The Hongkong and Shanghai
Banking Corporation
Limited | | 955 | | | 236 | | | (454 | ) | | 1,173 | | | 373 | | | (174 | ) | | 974 | |
| | | | | | | | | | | | | | | | | | | | | | | |
| Rest of Asia-Pacific | The Hongkong and Shanghai
Banking Corporation
Limited | | 448 | | | 108 | | | (135 | ) | | 475 | | | 161 | | | (104 | ) | | 418 | |
| | HSBC Bank Malaysia Berhad | | 34 | | | 9 | | | (3 | ) | | 28 | | | 2 | | | (3 | ) | | 29 | |
| | HSBC Bank Middle East | | 30 | | | 0 | | | (18 | ) | | 48 | | | 5 | | | (12 | ) | | 55 | |
| | | | | | | | | | | | | | | | | | | | | | | |
| North America | HSBC USA Inc. | | 927 | | | (93 | ) | | (212 | ) | | 1,232 | | | (50 | ) | | (121 | ) | | 1,403 | |
| | HSBC Bank Canada | | 78 | | | 16 | | | (37 | ) | | 99 | | | (6 | ) | | (22 | ) | | 127 | |
| | HSBC Markets Inc | | 1 | | | – | | | – | | | 1 | | | – | | | – | | | 1 | |
| | | | | | | | | | | | | | | | | | | | | | | |
| South America | HSBC Bank Brasil | | 314 | | | (215 | ) | | 67 | | | 462 | | | (6 | ) | | 1 | | | 467 | |
| | HSBC Bank Argentina S.A. | | 34 | | | (91 | ) | | 12 | | | 113 | | | 15 | | | 12 | | | 86 | |
| | | | | | | | | | | | | | | | | | | | | | | |
| Other operations | | 337 | | | 121 | | | (149 | ) | | 365 | | | (88 | ) | | (39 | ) | | 492 | |
| | |
| | | | | | | |
| | | | | | | |
| |
| | | | 4,800 | | | 517 | | | (1,758 | ) | | 6,041 | | | 435 | | | (845 | ) | | 6,451 | |
| | |
| | | | | | | |
| | | | | | | |
| |
111
Back to Contents
HSBC HOLDINGS PLC
Financial Review (continued)
|
| | 2002 compared with 2001
Increase/(decrease)
| | 2001 compared with 2000
Increase/(decrease)
| | | | |
| | | | 2002 | | | Volume | | | Rate | | | 2001 | | | Volume | | | Rate | | | 2000 | |
Interest expense | | | US$m | | | US$m | | | US$m | | | US$m | | | US$m | | | US$m | | | US$m | |
| Deposits by banks | | | | | | | | | | | | | | | | | | | | | |
| Europe | HSBC Bank plc | | 212 | | | 142 | | | (381 | ) | | 451 | | | 61 | | | (278 | ) | | 668 | |
| HSBC Private Banking
Holdings | | 60 | | | 10 | | | (16 | ) | | 66 | | | (21 | ) | | (16 | ) | | 103 | |
| | CCF | | 596 | | | (257 | ) | | (283 | ) | | 1,136 | | | 327 | | | 165 | | | 644 | |
| | | | | | | | | | | | | | | | | | | | | | | |
| Hong Kong | Hang Seng Bank | | 1 | | | (6 | ) | | (2 | ) | | 9 | | | (22 | ) | | (6 | ) | | 37 | |
| | The Hongkong and Shanghai
Banking Corporation
Limited | | 35 | | | 5 | | | (40 | ) | | 70 | | | 1 | | | (44 | ) | | 113 | |
| | | | | | | | | | | | | | | | | | | | | | | |
| Rest of Asia-Pacific | The Hongkong and Shanghai
Banking Corporation
Limited | | 103 | | | (4 | ) | | (39 | ) | | 146 | | | 45 | | | (8 | ) | | 109 | |
| | HSBC Bank Malaysia Berhad | | 3 | | | 3 | | | (1 | ) | | 1 | | | – | | | – | | | 1 | |
| | HSBC Bank Middle East | | 15 | | | 10 | | | (9 | ) | | 14 | | | (1 | ) | | (6 | ) | | 21 | |
| | | | | | | | | | | | | | | | | | | | | | | |
| North America | HSBC USA Inc. | | 46 | | | 14 | | | (68 | ) | | 100 | | | 34 | | | (36 | ) | | 102 | |
| | HSBC Bank Canada | | 26 | | | 10 | | | (2 | ) | | 18 | | | 4 | | | (7 | ) | | 21 | |
| | HSBC Markets Inc | | 44 | | | (14 | ) | | (56 | ) | | 114 | | | 41 | | | (58 | ) | | 131 | |
| | | | | | | | | | | | | | | | | | | | | | | |
| South America | HSBC Bank Brasil | | 79 | | | (44 | ) | | 17 | | | 106 | | | 28 | | | (23 | ) | | 101 | |
| | HSBC Bank Argentina S.A. | | 69 | | | (18 | ) | | 58 | | | 29 | | | 1 | | | (7 | ) | | 35 | |
| | | | | | | | | | | | | | | | | | | | | | | |
| Other operations | | | 133 | | | (19 | ) | | (47 | ) | | 199 | | | (8 | ) | | (63 | ) | | 270 | |
| | |
| | | | | | | |
| | | | | | | |
| |
| | | | 1,422 | | | (5 | ) | | (1,032 | ) | | 2,459 | | | 477 | | | (374 | ) | | 2,356 | |
| | |
| | | | | | | |
| | | | | | | |
| |
| Customer accounts | | | | | | | | | | | | | | | | | | | | | |
| Europe | HSBC Bank plc | | 2,387 | | | 595 | | | (1,508 | ) | | 3,300 | | | 77 | | | (814 | ) | | 4,037 | |
| | HSBC Private Banking
Holdings | | 549 | | | (16 | ) | | (372 | ) | | 937 | | | 260 | | | (288 | ) | | 965 | |
| | CCF | | 593 | | | (18 | ) | | (54 | ) | | 665 | | | 293 | | | (49 | ) | | 421 | |
| | | | | | | | | | | | | | | | | | | | | | | |
| Hong Kong | Hang Seng Bank | | 448 | | | (53 | ) | | (1,001 | ) | | 1,502 | | | 122 | | | (1,017 | ) | | 2,397 | |
| | The Hongkong and Shanghai
Banking Corporation
Limited | | 616 | | | 29 | | | (1,632 | ) | | 2,219 | | | 288 | | | (1,720 | ) | | 3,651 | |
| | | | | | | | | | | | | | | | | | | | | | | |
| Rest of Asia-Pacific | The Hongkong and Shanghai
Banking Corporation
Limited | | 705 | | | 166 | | | (430 | ) | | 969 | | | 126 | | | (274 | ) | | 1,117 | |
| | HSBC Bank Malaysia Berhad | | 131 | | | (4 | ) | | (10 | ) | | 145 | | | 3 | | | (4 | ) | | 146 | |
| | HSBC Bank Middle East | | 106 | | | (5 | ) | | (139 | ) | | 250 | | | 21 | | | (102 | ) | | 331 | |
| | | | | | | | | | | | | | | | | | | | | | | |
| North America | HSBC USA Inc. | | 860 | | | (13 | ) | | (736 | ) | | 1,609 | | | 179 | | | (521 | ) | | 1,951 | |
| | HSBC Bank Canada | | 257 | | | 31 | | | (248 | ) | | 474 | | | 27 | | | (146 | ) | | 593 | |
| | HSBC Markets Inc | | 112 | | | (32 | ) | | (151 | ) | | 295 | | | 179 | | | (118 | ) | | 234 | |
| | | | | | | | | | | | | | | | | | | | | | | |
| South America | HSBC Bank Brasil | | 491 | | | (149 | ) | | 42 | | | 598 | | | (24 | ) | | 69 | | | 553 | |
| | HSBC Bank Argentina S.A. | | 217 | | | (162 | ) | | 153 | | | 226 | | | (11 | ) | | 46 | | | 191 | |
| Other operations | | | 704 | | | 135 | | | (493 | ) | | 1,062 | | | 48 | | | (154 | ) | | 1,168 | |
| | |
| | | | | | | |
| | | | | | | |
| |
| | | | 8,176 | | | 685 | | | (6,760 | ) | | 14,251 | | | 1,538 | | | (5,042 | ) | | 17,755 | |
| | |
| | | | | | | |
| | | | | | | |
| |
112
Back to Contents
HSBC HOLDINGS PLC
| | | 2002 compared with 2001
Increase/(decrease)
| | 2001 compared with 2000
Increase/(decrease)
| | | | |
| | | | 2002 | | | Volume | | | Rate | | | 2001 | | | Volume | | | Rate | | | 2000 | |
Interest expense | | | US$m | | | US$m | | | US$m | | | US$m | | | US$m | | | US$m | | | US$m | |
| CDs and other money market instruments | | | | | | | | | | | | | | | | | | | | | |
| | | | | | | | | | | | | | | | | | | | | | |
| Europe | HSBC Bank plc | | 83 | | | 43 | | | (25 | ) | | 65 | | | (2 | ) | | (12 | ) | | 79 | |
| | CCF | | 201 | | | (33 | ) | | (28 | ) | | 262 | | | 167 | | | (41 | ) | | 136 | |
| | | | | | | | | | | | | | | | | | | | | | | |
| Hong Kong | Hang Seng Bank | | 65 | | | 5 | | | (34 | ) | | 94 | | | (10 | ) | | (43 | ) | | 147 | |
| | The Hongkong and Shanghai
Banking Corporation
Limited | | 258 | | | 93 | | | (77 | ) | | 242 | | | (6 | ) | | (43 | ) | | 291 | |
| | | | | | | | | | | | | | | | | | | | | | | |
| Rest of Asia-Pacific | The Hongkong and Shanghai
Banking Corporation
Limited | | 69 | | | 19 | | | (17 | ) | | 67 | | | (6 | ) | | (9 | ) | | 82 | |
| | HSBC Bank Malaysia Berhad | | 7 | | | 1 | | | – | | | 6 | | | (2 | ) | | – | | | 8 | |
| | HSBC Bank Middle East | | – | | | – | | | – | | | – | | | – | | | – | | | – | |
| | | | | | | | | | | | | | | | | | | | | | | |
| North America | HSBC USA Inc. | | 62 | | | 12 | | | (42 | ) | | 92 | | | (5 | ) | | 25 | | | 72 | |
| | HSBC Bank Canada | | 56 | | | (1 | ) | | (47 | ) | | 104 | | | 35 | | | (22 | ) | | 91 | |
| | | | | | | | | | | | | | | | | | | | | | | |
| South America | HSBC Bank Brasil | | 14 | | | 3 | | | 7 | | | 4 | | | (2 | ) | | 1 | | | 5 | |
| | HSBC Bank Argentina S.A. | | 7 | | | (13 | ) | | (1 | ) | | 21 | | | 15 | | | (4 | ) | | 10 | |
| Other operations | | | 38 | | | 4 | | | 31 | | | 3 | | | (3 | ) | | (16 | ) | | 22 | |
| | |
| | | | | | | |
| | | | | | | |
| |
| | | | 860 | | | 141 | | | (241 | ) | | 960 | | | 187 | | | (170 | ) | | 943 | |
| | |
| | | | | | | |
| | | | | | | |
| |
Loan capital | | | | | | | | | | | | | | | | | | | | | | |
| Europe | HSBC Bank plc | | 463 | | | (190 | ) | | 28 | | | 625 | | | 49 | | | (92 | ) | | 668 | |
| | HSBC Private Banking
Holdings | | – | | | – | | | – | | | – | | | (8 | ) | | – | | | 8 | |
| | CCF | | 164 | | | 56 | | | (55 | ) | | 163 | | | 98 | | | 7 | | | 58 | |
| | | | | | | | | | | | | | | | | | | | | | | |
| Hong Kong | The Hongkong and Shanghai
Banking Corporation
Limited | | 83 | | | (1 | ) | | (15 | ) | | 99 | | | (1 | ) | | (21 | ) | | 121 | |
| | | | | | | | | | | | | | | | | | | | | | | |
| Rest of Asia-Pacific | The Hongkong and Shanghai
Banking Corporation
Limited | | 12 | | | 13 | | | (7 | ) | | 6 | | | (7 | ) | | – | | | 13 | |
| | | | | | | | | | | | | | | | | | | | | | | |
| North America | HSBC USA Inc. | | 214 | | | (40 | ) | | (26 | ) | | 280 | | | (114 | ) | | (68 | ) | | 462 | |
| | HSBC Bank Canada | | 65 | | | (16 | ) | | 1 | | | 80 | | | (23 | ) | | (4 | ) | | 107 | |
| | | | | | | | | | | | | | | | | | | | | | | |
| South America | HSBC Bank Brasil | | 44 | | | 3 | | | 30 | | | 11 | | | 15 | | | (12 | ) | | 8 | |
| | HSBC Bank Argentina S.A. | | 62 | | | 7 | | | 31 | | | 24 | | | (3 | ) | | – | | | 27 | |
| Other operations | | | 169 | | | 54 | | | (149 | ) | | 264 | | | 80 | | | (138 | ) | | 322 | |
| | |
| | | | | | | |
| | | | | | | |
| |
| | | | 1,276 | | | (86 | ) | | (190 | ) | | 1,552 | | | 146 | | | (388 | ) | | 1,794 | |
| | |
| | | | | | | |
| | | | | | | |
| |
113
Back to Contents
HSBC HOLDINGS PLC
Financial Review (continued)
|
All of HSBC’s activities involve analysis, evaluation and management of some degree of risk or combination of risks. The most important types of risk are credit risk (which includes cross-border risk), liquidity risk, market risk and operational risk. Market risk includes foreign exchange, interest rate and equity price risks.
HSBC’s risk management policy is designed to identify and analyse credit risk, liquidity and market risk, operational risk and other risks, to set appropriate risk limits, and to monitor these risks and limits continually by means of reliable and up-to-date administrative and information systems. HSBC continually modifies and enhances its risk management policies and systems to reflect changes in markets and products. Training, individual responsibility and accountability and a disciplined cautious and conventional culture of control lie at the heart of HSBC’s management of risk.
The Group Executive Committee, comprising executive Directors and Group General Managers appointed by the Board of Directors, formulates risk management policy, monitors risk and regularly reviews the effectiveness of HSBC’s risk management policies.
Credit risk is the risk that a customer or counterparty will be unable or unwilling to meet a commitment that it has entered into with HSBC. It arises principally from lending, trade finance, treasury and leasing activities. HSBC has dedicated standards, policies and procedures to control and monitor all such risks.
Within Group Head Office, Group Credit and Risk is mandated to provide high level centralised management of credit risk for HSBC on a global basis. Group Credit and Risk is headed by a Group General Manager who reports to the Group Chief Executive, and its responsibilities include the following:
| • | Formulation of high level credit policies. These are embodied in HSBC standards with which all HSBC subsidiaries are required to comply in formulating their own more detailed credit policies and procedures, which are written in each HSBC subsidiary’s dedicated credit policy manuals. The credit policies and procedures are monitored by Group Credit and Risk.
|
| • | Establishment and maintenance of HSBC’s large credit exposure policy which sets controls at the HSBC level on exposures to customers and customer groups and on other risk concentrations. HSBC’s policy, which is designed to be more conservative than the internationally accepted regulatory standards, is required to be adopted by all the banking subsidiaries within HSBC.
|
| • | Issue of lending guidelines which provide HSBC subsidiaries with clear guidance on HSBC’s attitude towards and appetite for lending to, amongst others, different market sectors, industries and products. Each HSBC subsidiary and major business unit is required to produce its own lending guidelines which conform with HSBC guidelines and which are regularly updated and provided to all credit and marketing executives.
|
| • | An independent review and objective assessment of risk. Group Credit and Risk undertakes an independent assessment of all commercial non-bank credit facilities over designated limits originated by all HSBC’s subsidiaries, prior to the facilities being offered to the customer. The business may not proceed without the concurrence of Group Credit and Risk. Similarly, renewals and reviews of commercial non-bank facilities over designated levels are subject to review by and concurrence of Group Credit and Risk.
|
| • | Control of exposures to banks and financial institutions. HSBC’s credit and settlement risk limits to counterparties in the financial and government sectors are approved centrally to optimise the use of credit availability and to avoid excessive risk concentration. A dedicated unit within Group Credit and Risk controls and manages these exposures on a global basis using centralised systems and automated processes. Full authority is devolved to this unit by the respective HSBC subsidiaries.
|
| • | Control of cross-border exposures. Control of country and cross-border risk is also managed by a dedicated unit within Group Credit and Risk using centralised systems, through the imposition of country limits with sub-limits by maturity and type of business. Country limits are determined by taking into account economic and political factors, together with local business knowledge. Transactions with countries deemed to be higher risk are considered on a case-by-case basis. |
114
Back to Contents
HSBC HOLDINGS PLC
| • | Control of exposure to certain industries. Group Credit and Risk controls HSBC’s exposure to the shipping and aviation industries, and closely monitors exposures to other industries or products such as telecoms and commercial real estate. Controls, such as restrictions on new business or the capping of exposure within HSBC subsidiaries, may be introduced where necessary.
|
| • | Maintenance of HSBC’s universal facility grading process. HSBC’s grading structure contains seven grades, the first three of which are applied to differing levels of satisfactory risk. Of the four unsatisfactory grades, grades 6 and 7 are non-performing loans. In the case of banks, the grading structure involves 9 tiers, five of which cover satisfactory risk. It is the responsibility of the final approving executive to approve the facility grade. Facility grades are subject to frequent review and amendments, where necessary, are required to be undertaken promptly.
|
| • | Review of efficiency and effectiveness of subsidiaries’ credit approval processes. Regular reports are provided to Group Credit and Risk on the credit quality of the local portfolios and corrective action is taken where necessary.
|
| • | Reporting to senior executives on aspects of the HSBC loan portfolio. Reports are produced for senior management, including the Group Executive Committee, Group Audit Committee and the Board, covering:
|
| | – | risk concentrations and exposures to industry sectors; |
| | – | large customer group exposures; |
| | – | emerging market debt and provisioning; |
| | – | large non-performing accounts and provisions; |
| | – | specific segments of the portfolio: commercial real estate, telecoms, aviation, shipping, credit cards, as well as ad hoc reviews as necessary; and |
| | – | country limits and cross-border exposures.
|
| • | Management and direction of credit-related systems initiatives. HSBC has a centralised database of large corporate, sovereign and bank facilities and is currently rolling out a new standard corporate credit application system.
|
| • | Provision of advice and guidance to HSBC’s subsidiaries. In order to promote best practice throughout HSBC, advice is given and procedures approved where necessary on numerous credit-related issues such as:
|
| | – | credit-related reporting.
|
| • | Primary interface for credit-related issues on behalf of HSBC Holdings with external parties including the Bank of England and the UK Financial Services Authority (‘FSA’), the rating agencies and corporate analysts and counterparts in the world’s major banks and non-bank financial institutions. |
In each of HSBC’s subsidiaries, local management is responsible for the quality of its credit portfolio. Each major subsidiary has an appointed Chief Credit Officer, who reports to the local Chief Executive Officer, with a functional reporting line to the Group General Manager, Group Credit and Risk. Each subsidiary has established a credit process involving credit policies, procedures and lending guidelines conforming with HSBC requirements, and credit approval authorities delegated from the Board of Directors of HSBC Holdings to the local Chief Executive Officer. The objective is to build and maintain risk assets of high quality where risk and return are commensurate.
Each subsidiary is responsible for the assets in its portfolio, including any subject to central control by Group Credit and Risk, and for managing its own risk concentrations on a market sector, geographical and product basis. Each HSBC subsidiary has systems in place to control and monitor its exposures at the customer and counterparty level.
Special attention is paid to the management of problem loans. Where deemed appropriate, specialist units are established by HSBC subsidiaries to provide intensive management and control in order to maximise recoveries of doubtful debts.
115
Back to Contents
HSBC HOLDINGS PLC
Financial Review (continued)
|
Regular audits of subsidiaries’ credit processes are undertaken by HSBC’s Internal Audit function. Such audits include consideration of the completeness and adequacy of credit manuals and lending guidelines, together with an in-depth analysis of a representative sample of accounts in the portfolio to assess the quality of the loan book and other exposures. Individual accounts are reviewed to ensure that the facility grade is appropriate, that credit procedures have been properly followed and that where an account is non-performing, provisions raised are adequate. Internal Audit will discuss any facility grading they consider should be revised at the end of the audit and their subsequent recommendations for revised grades must then be assigned to the facility.
Loans and advances to customers are spread across the various industrial sectors, as well as geographically.
At constant exchange rates, loans and advances to customers (excluding the finance sector and settlement accounts) grew by US$31.5 billion, or 10.7 per cent during 2002 of which US$9.7 billion, or 3.2 per cent, related to the acquisition of GFBital in Mexico. Excluding the impact of GFBital, personal lending grew by 14.9 per cent and loans and advances to the commercial and corporate customer base grew by 1.6 per cent.
| Figures in US$m | | | 2001 | | | Exchange
variance | | | Underlying
change | | | GF Bital | | | 2002 | |
| | | | | | | | | | | | | | | | | |
Personal: | | | | | | | | | | | | | | | | |
| Residential mortgages | | | 78,215 | | | 3,339 | | | 14,227 | | | 1,203 | | | 96,984 | |
| Hong Kong SAR Government Home Ownership Scheme | | | 8,123 | | | (1 | ) | | (867 | ) | | – | | | 7,255 | |
| Other personal | | | 39,125 | | | 2,101 | | | 6,142 | | | 1,194 | | | 48,562 | |
| |
| Total personal | | | 125,463 | | | 5,439 | | | 19,502 | | | 2,397 | | | 152,801 | |
| | | | | | | | | | | | | | | |
Corporate and commercial: | | | | | | | | | | | | | | | | |
| Commercial, industrial and international trade | | | 70,158 | | | 5,219 | | | 1,953 | | | 1,685 | | | 79,015 | |
| Commercial real estate | | | 26,315 | | | 1,471 | | | 1,394 | | | 87 | | | 29,267 | |
| Other property-related | | | 14,594 | | | 519 | | | (17 | ) | | 251 | | | 15,347 | |
| Government | | | 5,339 | | | (37 | ) | | (476 | ) | | 4,127 | | | 8,953 | |
| Other commercial | | | 37,265 | | | 2,812 | | | (292 | ) | | 889 | | | 40,674 | |
| |
| Total Corporate and commercial | | | 153,671 | | | 9,984 | | | 2,562 | | | 7,039 | | | 173,256 | |
| | | | | | | | | | | | | | | |
Financial: | | | | | | | | | | | | | | | | |
| Non-bank financial institutions | | | 26,473 | | | 1,473 | | | (733 | ) | | 274 | | | 27,487 | |
| Settlement accounts | | | 11,761 | | | 260 | | | (3,636 | ) | | – | | | 8,385 | |
| |
| Total financial | | | 38,234 | | | 1,733 | | | (4,369 | ) | | 274 | | | 35,872 | |
| | | | | | | | | | | | | | | |
| Total gross loans and advances to customers | | | 317,368 | | | 17,156 | | | 17,695 | | | 9,710 | | | 361,929 | |
| |
The commentary below excludes the impact of foreign exchange transaction movements and the acquisition of GFBital except where stated.
Residential mortgages increased by US$14.2 billion, or 18 per cent and including GFBital comprised 26.8 per cent of total gross loans to customers at 31 December 2002. Residential mortgages in Europe increased by US$8.2 billion of which US$8.0 billion arose in UK Banking as market initiatives, including First Direct’s smart mortgage, and competitive pricing resulted in improved mortgage retention rates and increased share of the remortgage market. Residential mortgage lending in Hong Kong was slightly higher than 2001 against a background of intense mortgage price competition as HSBC increased its share of the remortgaging market. This growth was more than offset by a reduction in loans made under the Hong Kong SAR Government Home Ownership Scheme (‘GHOS’). At US$7.3 billion residential mortgage loans under GHOS were US$0.9 billion lower than at 31 December 2001 and resulted from the suspension of the sale of new homes under this scheme by the Hong Hong SAR Government in the second half of 2001. In the rest of Asia-Pacific, residential mortgages grew by US$2.1 billion with strong growth in Singapore, Malaysia, South Korea, India and Taiwan. In North America, residential mortgage lending grew strongly by US$3.3 billion due to strong mortgage origination as interest rates remained low.
Including GFBital other personal lending increased to approximately 13.4 per cent of total gross loans to customers. Personal lending grew by US$3.2 billion in Europe. Strong organic growth was achieved in consumer lending in the UK with an increase of 10 per cent in credit card advances at 31 December 2002.
Corporate commercial lending grew modestly, less than 2 per cent, reflecting muted corporate loan demand and cautious risk appetite.
116
Back to Contents
HSBC HOLDINGS PLC
| Areas of special interest |
| |
Telecoms industry exposure |
Telecoms industry exposure is a designated special category of exposure and is controlled under agreed caps. The exposure analysed below is well spread across geographical markets reflecting HSBC’s international footprint.
Group exposure to the telecom sector reduced during the year to US$4.8 billion, which as a percentage of total loans and advances, was 1.34 per cent as at 31 December 2002 as compared with US$6.6 billion or 2.1 per cent as at 31 December 2001. This exposure had the following characteristics:
| | | Percentage of telecoms industry
exposure | |
| | |
| |
| | | | At 31 December
2002 | | | At 31 December
2001 | |
| | |
| |
| Satisfactory grades under HSBC gradings | | | 57 | | | 85 | |
| Under one year remaining maturity | | | 33 | | | 47 | |
| Telecom operators | | | 79 | | | 70 | |
| Telecom manufacturers | | | 21 | | | 30 | |
| Non-performing | | | | | | | |
| accounts | | | 6 | | | 2 | |
| of which provided | | | 59 | | | 55 | |
The rise in non-performing assets relates primarily to three accounts, with the quantum of balances in this category actually decreasing in the second half of 2002.
HSBC’s banking operations’ exposure to Argentina as at 31 December 2002 amounted to US$1.7 billion. Of this amount, US$1.3 billion was in-country exposure, including US$0.6 billion of loan exposures to the Argentine Government received in exchange for debt securities. These figures are prepared in accordance with the Bank of England Country Exposure Report (Form C1) guidelines and therefore exclude the exposures of insurance subsidiaries. HSBC’s insurance subsidiaries’ exposures to Argentina as at 31 December 2002 amounted to total assets of US$0.6 billion, of which US$0.3 billion related to long-term assurance assets attributable to policyholders, mainly comprising loans to the Argentine Government received in exchange for debt securities. Overall, provisions of US$317 million were held against gross customer non-government loans of US$522 million.
HSBC continues to monitor closely developments in Argentina and has restructured its Argentine operations to reflect the current economic environment. HSBC still hopes to be able to continue to operate in Argentina and contribute to a revitalised financial sector following forthcoming elections. However, HSBC is also prepared to take the necessary actions if required to protect the value of its shareholders’ interests in the event of unforeseen political and economic events.
HSBC’s banking operations’ exposure to Brazil as at 31 December 2002 amounted to US$5.7 billion. Of this amount, US$5.6 billion was in-country exposure. These figures are prepared in accordance with the Bank of England Country Exposure Report (Form C1) guidelines and therefore exclude the exposures of insurance subsidiaries. HSBC’s insurance subsidiaries’ exposures to Brazil as at 31 December 2002 amounted to total assets of US$0.5 billion, of which US$0.1 billion related to long-term assurance assets attributable to policyholders. Non-performing loans net of suspended interest were US$146 million, against which specific provisions outstanding were US$121 million.
| Analysis of loans and advances to customers by geographical region and by type of customer |
The following tables analyse loans by industry sector and by the location of the principal operations of the lending subsidiary or, in the case of The Hongkong and Shanghai Banking Corporation, HSBC Bank plc, HSBC Bank Middle East and HSBC Bank USA operations, by the location of the lending branch.
117
Back to Contents
HSBC HOLDINGS PLC
Financial Review (continued)
|
| |
| | | Europe | | Hong Kong | | Rest of
Asia-Pacific | # | North
America | | South
America | | Gross
loans and
advances to
customers | | Gross loans
by customer
type as a
% of total
gross
loans |
| Provisions
for bad
and
doubtful
debts | |
| |
| | | US$m | | US$m | | US$m | | US$m | | US$m | | US$m | | % | | US$m | |
31 December 2002 | | | | | | | | | | | | | | | | | | | | | | | | | |
| | | | | | | | | | | | | | | | | | | | | | | | | | |
Personal: | | | | | | | | | | | | | | | | | | | | | | | | | |
| Residential mortgages | | | 38,719 | | | 23,839 | | | 7,507 | | | 26,666 | | | 253 | | | 96,984 | | | 26.9 | | | (548 | ) |
| Hong Kong SAR Government Home Ownership Scheme | | | – | | | 7,255 | | | – | | | – | | | – | | | 7,255 | | | 2.0 | | | – | |
| Other personal | | | 26,748 | | | 7,066 | | | 5,900 | | | 7,836 | | | 1,012 | | | 48,562 | | | 13.4 | | | (1,527 | ) |
| |
| Total personal | | | 65,467 | | | 38,160 | | | 13,407 | | | 34,502 | | | 1,265 | | | 152,801 | | | 42.3 | | | (2,075 | ) |
| | | | | | | | | | | | | | | | | | | | | | | | | | |
Corporate and commerical: | | | | | | | | | | | | | | | | | | | | | | | | | |
| Commercial, industrial and international trade | | | 44,424 | | | 10,173 | | | 12,582 | | | 10,773 | | | 1,063 | | | 79,015 | | | 21.8 | | | (2,603 | ) |
| Commercial real estate | | | 11,887 | | | 8,336 | | | 2,701 | | | 6,297 | | | 46 | | | 29,267 | | | 8.1 | | | (221 | ) |
| Other property-related | | | 3,970 | | | 4,805 | | | 2,031 | | | 4,515 | | | 26 | | | 15,347 | | | 4.2 | | | (397 | ) |
| Government | | | 2,164 | | | 719 | | | 933 | | | 4,575 | | | 562 | | | 8,953 | | | 2.5 | | | (4 | ) |
| Other commercial* | | | 22,712 | | | 6,612 | | | 5,950 | | | 4,835 | | | 565 | | | 40,674 | | | 11.2 | | | (1,077 | ) |
| |
| Total corporate and commercial | | | 85,157 | | | 30,645 | | | 24,197 | | | 30,995 | | | 2,262 | | | 173,256 | | | 47.8 | | | (4,302 | ) |
| | | | | | | | | | | | | | | | | | | | | | | | | | |
Financial: | | | | | | | | | | | | | | | | | | | | | | | | | |
| Non-bank financial institutions | | | 15,221 | | | 2,055 | | | 931 | | | 9,231 | | | 49 | | | 27,487 | | | 7.6 | | | (229 | ) |
| Settlement accounts | | | 2,622 | | | 347 | | | 192 | | | 5,224 | | | – | | | 8,385 | | | 2.3 | | | – | |
| |
| Total financial | | | 17,843 | | | 2,402 | | | 1,123 | | | 14,455 | | | 49 | | | 35,872 | | | 9.9 | | | (229 | ) |
| | | | | | | | | | | | | | | | | | | | | | | | | | |
| Total gross loans and advances to customers | | | 168,467 | | | 71,207 | | | 38,727 | | | 79,952 | | | 3,576 | | | 361,929 | | | 100.0 | | | (6,606 | ) |
|
|
|
|
|
|
|
|
|
|
|
|
|
|
|
| | | | |
|
| | | | |
| General provisions | | | | | | | | | | | | | | | | | | | | | | | | (2,511 | ) |
| Suspended interest | | | | | | | | | | | | | | | | | | (467 | ) | | | | | | |
| | | | | | | | | | | | | | | | | |
|
| | | | |
|
| |
| Total | | | | | | | | | | | | | | | | | | 361,462 | | | | | | (9,117 | ) |
| | | | | | | | | | | | | | | | | |
|
| | | | |
|
| |
| * | Other commercial includes advances in respect of agriculture, transport, energy and utilities. |
| # | Further analysis is given on page 121. |
118
Back to Contents
HSBC HOLDINGS PLC
| | | Europe | † | Hong Kong | | Rest of
Asia-Pacific | ¶ | North
America | | South
America | # | Gross
Loans and Advances to Customers | † | Gross loans by customer type as a % of total gross loans | | Provisions for bad and doubtful debts | |
| |
| | | US$m | | US$m | | US$m | | US$m | | US$m | | US$m | | % | | US$m | |
| 31 December 2001 | | | | | | | | | | | | | | | | | | | | | | | | | |
| | | | | | | | | | | | | | | | | | | | | | | | | | |
Personal: | | | | | | | | | | | | | | | | | | | | | | | | | |
| Residential mortgages | | | 27,282 | | | 23,125 | | | 5,134 | | | 22,126 | | | 548 | | | 78,215 | | | 24.7 | | | (248 | ) |
| Hong Kong SAR Government Home Ownership Scheme | | | – | | | 8,123 | | | – | | | – | | | – | | | 8,123 | | | 2.6 | | | – | |
| Other personal | | | 21,065 | | | 6,227 | | | 4,616 | | | 6,273 | | | 1,280 | | | 39,461 | | | 12.3 | | | (1,208 | ) |
| |
| Total personal | | | 48,347 | | | 37,475 | | | 9,750 | | | 28,399 | | | 1,828 | | | 125,799 | | | 39.6 | | | (1,456 | ) |
| | | | | | | | | | | | | | | | | | | | | | | | | | |
Corporate and commerical: | | | | | | | | | | | | | | | | | | | | | | | | | |
| Commercial, industrial and international trade | | | 38,476 | | | 9,662 | | | 11,226 | | | 9,018 | | | 1,720 | | | 70,102 | | | 22.1 | | | (2,262 | ) |
| Commercial real estate | | | 9,475 | | | 8,474 | | | 2,395 | | | 5,877 | | | 77 | | | 26,298 | | | 8.3 | | | (235 | ) |
| Other property-related | | | 3,630 | | | 4,710 | | | 2,169 | | | 4,011 | | | 69 | | | 14,589 | | | 4.6 | | | (315 | ) |
| Government | | | 2,393 | | | 543 | | | 900 | | | 728 | | | 775 | | | 5,339 | | | 1.7 | | | (18 | ) |
| Other commercial* | | | 20,510 | | | 6,349 | | | 5,457 | | | 4,230 | | | 617 | | | 37,163 | | | 11.7 | | | (1,008 | ) |
| |
| Total corporate and commercial | | | 74,484 | | | 29,738 | | | 22,147 | | | 23,864 | | | 3,258 | | | 153,491 | | | 48.4 | | | (3,838 | ) |
| | | | | | | | | | | | | | | | | | | | | | | | | | |
Financial: | | | | | | | | | | | | | | | | | | | | | | | | | |
| Non-bank financial institutions | | | 11,329 | | | 1,546 | | | 752 | | | 12,572 | | | 118 | | | 26,317 | | | 8.3 | | | (206 | ) |
| Settlement accounts | | | 2,361 | | | 223 | | | 189 | | | 8,984 | | | 4 | | | 11,761 | | | 3.7 | | | – | |
| |
| Total financial | | | 13,690 | | | 1,769 | | | 941 | | | 21,556 | | | 122 | | | 38,078 | | | 12.0 | | | (206 | ) |
| | | | | | | | | | | | | | | | | | | | | | | | | | |
| Total gross loans and advances to customers | | | 136,521 | | | 68,982 | | | 32,838 | | | 73,819 | | | 5,208 | | | 317,368 | | | 100.0 | | | (5,500 | ) |
|
|
|
|
|
|
|
|
|
|
|
|
|
|
|
| | | | | | | | | | |
| General provisions | | | | | | | | | | | | | | | | | | | | | | | | (2,661 | ) |
| Suspended interest | | | | | | | | | | | | | | | | | | (558 | ) | | | | | | |
| | | | | | | | | | | | | | | | | |
|
| | | | |
|
| |
| Total | | | | | | | | | | | | | | | | | | 316,810 | | | | | | (8,161 | ) |
| | | | | | | | | | | | | | | | | |
|
| | | | |
|
| |
| 31 December 2000 | | | | | | | | | | | | | | | | | | | | | | | | | |
| | | | | | | | | | | | | | | | | | | | | | | | | | |
Personal: | | | | | | | | | | | | | | | | | | | | | | | | | |
| Residential mortgages | | | 24,048 | | | 23,121 | | | 3,723 | | | 19,931 | | | 809 | | | 71,632 | | | 24.0 | | | (324 | ) |
| Hong Kong SAR Government Home Ownership Scheme | | | – | | | 7,353 | | | – | | | – | | | – | | | 7,353 | | | 2.5 | | | – | |
| Other personal | | | 20,537 | | | 4,923 | | | 4,110 | | | 6,847 | | | 1,364 | | | 37,781 | | | 12.5 | | | (1,149 | ) |
| |
| Total personal | | | 44,585 | | | 35,397 | | | 7,833 | | | 26,778 | | | 2,173 | | | 116,766 | | | 39.0 | | | (1,473 | ) |
| | | | | | | | | | | | | | | | | | | | | | | | | | |
Corporate and commerical: | | | | | | | | | | | | | | | | | | | | | | | | | |
| Commercial, industrial and international trade | | | 38,012 | | | 9,584 | | | 11,583 | | | 9,274 | | | 2,803 | | | 71,256 | | | 23.9 | | | (2,663 | ) |
| Commercial real estate | | | 10,053 | | | 8,293 | | | 2,749 | | | 6,915 | | | 77 | | | 28,087 | | | 9.4 | | | (307 | ) |
| Other property-related | | | 3,121 | | | 3,850 | | | 1,815 | | | 4,072 | | | 156 | | | 13,014 | | | 4.4 | | | (376 | ) |
| Government | | | 2,572 | | | 130 | | | 574 | | | 715 | | | 50 | | | 4,041 | | | 1.4 | | | (44 | ) |
| Other commercial* | | | 19,570 | | | 7,459 | | | 5,406 | | | 3,753 | | | 937 | | | 37,125 | | | 12.4 | | | (924 | ) |
| |
| Total corporate and commercial | | | 73,328 | | | 29,316 | | | 22,127 | | | 24,729 | | | 4,023 | | | 153,523 | | | 51.5 | | | (4,314 | ) |
| | | | | | | | | | | | | | | | | | | | | | | | | | |
Financial: | | | | | | | | | | | | | | | | | | | | | | | | | |
| Non-bank financial institutions | | | 10,374 | | | 1,664 | | | 629 | | | 8,629 | | | 152 | | | 21,448 | | | 7.2 | | | (278 | ) |
| Settlement accounts | | | 3,946 | | | 142 | | | 361 | | | 2,464 | | | 41 | | | 6,954 | | | 2.3 | | | – | |
| |
| Total financial | | | 14,320 | | | 1,806 | | | 990 | | | 11,093 | | | 193 | | | 28,402 | | | 9.5 | | | (278 | ) |
| | | | | | | | | | | | | | | | | | | | | | | | | | |
| Total gross loans and advances to customers | | | 132,233 | | | 66,519 | | | 30,950 | | | 62,600 | | | 6,389 | | | 298,691 | | | 100.0 | | | (6,065 | ) |
|
|
|
|
|
|
|
|
|
|
|
|
|
|
|
| | | | |
|
| | | | |
| | | | | | | | | | | | | | | | | | | | | | | | | | |
| General provisions | | | | | | | | | | | | | | | | | | | | | | | | (2,102 | ) |
| Suspended interest | | | | | | | | | | | | | | | | | | (687 | ) | | | | | | |
| | | | | | | | | | | | | | | | | |
|
| | | | |
|
| |
| Total | | | | | | | | | | | | | | | | | | 298,004 | | | | | | (8,167 | ) |
| | | | | | | | | | | | | | | | | |
|
| | | | |
|
| |
| * | Other commercial includes advances in respect of agriculture, transport, energy and utilities. |
| † | The figures for 31 December 2000 have been presented on a consistent basis with 31 December 2001 for residential mortgages and other personal lending. |
| ¶ | The years 1998 to 2001 have been restated to reflect a reclassification of loans to personal investment vehicles to ‘Other personal’ category, from ‘corporate and commercial’ and ‘non-bank financial institutions’ as this provides a more accurate desription of the borrower. |
| # | Formerly described as Latin America, which included Group Entities in Panama and Mexico, which are now included in North America, figures for 1998 to 2001 have been restated to reflect this change. |
119
Back to Contents
HSBC HOLDINGS PLC
Financial Review (continued)
|
| | | Europe | | Hong Kong | | Rest of
Asia-Pacific | ¶ | North
America | | South
America | | Gross
loans and advances to customers | | Gross loans by customer type as a % of total gross loans | | Provisions for bad and doubtful debts | |
| |
| | | US$m | | US$m | | US$m | | US$m | | US$m | | US$m | | % | | US$m | |
| 31 December 1999 | | | | | | | | | | | | | | | | | | | | | | | | | |
| | | | | | | | | | | | | | | | | | | | | | | | | | |
Personal: | | | | | | | | | | | | | | | | | | | | | | | | | |
| Residential mortgages | | | 22,047 | | | 23,614 | | | 3,028 | | | 16,962 | | | 746 | | | 66,397 | | | 25.2 | | | (228 | ) |
| Hong Kong SAR Government Home Ownership Scheme | | | – | | | 6,565 | | | – | | | – | | | – | | | 6,565 | | | 2.5 | | | – | |
| Other personal | | | 16,668 | | | 4,409 | | | 3,979 | | | 5,864 | | | 1,017 | | | 31,937 | | | 12.2 | | | (921 | ) |
| |
| Total personal | | | 38,715 | | | 34,588 | | | 7,007 | | | 22,826 | | | 1,763 | | | 104,899 | | | 39.9 | | | (1,149 | ) |
| | | | | | | | | | | | | | | | | | | | | | | | | | |
Corporate and commercial: | | | | | | | | | | | | | | | | | | | | | | | | | |
| Commercial, industrial and international trade | | | 27,380 | | | 9,762 | | | 12,250 | | | 9,129 | | | 2,255 | | | 60,776 | | | 23.2 | | | (2,468 | ) |
| Commercial real estate | | | 6,519 | | | 8,987 | | | 3,353 | | | 5,709 | | | 255 | | | 24,823 | | | 9.5 | | | (248 | ) |
| Other property-related | | | 2,020 | | | 2,093 | | | 2,033 | | | 4,114 | | | 151 | | | 10,411 | | | 4.0 | | | (319 | ) |
| Government | | | 3,405 | | | 140 | | | 749 | | | 730 | | | 149 | | | 5,173 | | | 2.0 | | | (90 | ) |
| Other commercial* | | | 17,982 | | | 6,874 | | | 5,249 | | | 4,481 | | | 852 | | | 35,438 | | | 13.5 | | | (1,143 | ) |
| |
| Total corporate and commercial | | | 57,306 | | | 27,856 | | | 23,634 | | | 24,163 | | | 3,662 | | | 136,621 | | | 52.2 | | | (4,268 | ) |
| | | | | | | | | | | | | | | | | | | | | | | | | | |
Financial: | | | | | | | | | | | | | | | | | | | | | | | | | |
| Non-bank financial institutions | | | 7,227 | | | 2,262 | | | 984 | | | 6,402 | | | 187 | | | 17,062 | | | 6.5 | | | (275 | ) |
| Settlement accounts | | | 2,827 | | | 114 | | | 200 | | | 619 | | | 9 | | | 3,769 | | | 1.4 | | | – | |
| |
| Total financial | | | 10,054 | | | 2,376 | | | 1,184 | | | 7,021 | | | 196 | | | 20,831 | | | 7.9 | | | (275 | ) |
| | | | | | | | | | | | | | | | | | | | | | | | | | |
| Total gross loans and advances to customers | | | 106,075 | | | 64,820 | | | 31,825 | | | 54,010 | | | 5,621 | | | 262,351 | | | 100.0 | | | (5,692 | ) |
|
|
|
|
|
|
|
|
|
|
|
|
|
|
|
| | | | |
|
|
| | | |
| | | | | | | | | | | | | | | | | | | | | | | | | | |
| General provisions | | | | | | | | | | | | | | | | | | | | | | | | (2,304 | ) |
| Suspended interest | | | | | | | | | | | | | | | | | | (788 | ) | | | | | | |
| | | | | | | | | | | | | | | | | |
|
| | | | |
|
| |
| Total | | | | | | | | | | | | | | | | | | 261,563 | | | | | | (7,996 | ) |
| | | | | | | | | | | | | | | | | |
|
| | | | |
|
| |
| 31 December 1998 | | | | | | | | | | | | | | | | | | | | | | | | | |
| | | | | | | | | | | | | | | | | | | | | | | | | | |
Personal: | | | | | | | | | | | | | | | | | | | | | | | | | |
| Residential mortgages | | | 20,716 | | | 25,051 | | | 2,746 | | | 13,073 | | | 626 | | | 62,212 | | | 25.7 | | | (156 | ) |
| Hong Kong SAR Government Home Ownership Scheme | | | – | | | 6,291 | | | – | | | – | | | – | | | 6,291 | | | 2.6 | | | – | |
| Other personal | | | 12,000 | | | 4,257 | | | 3,548 | | | 5,270 | | | 883 | | | 25,958 | | | 10.7 | | | (789 | ) |
| |
| Total personal | | | 32,716 | | | 35,599 | | | 6,294 | | | 18,343 | | | 1,509 | | | 94,461 | | | 39.0 | | | (945 | ) |
| | | | | | | | | | | | | | | | | | | | | | | | | | |
Corporate and commercial: | | | | | | | | | | | | | | | | | | | | | | | | | |
| Commercial, industrial and international trade | | | 28,224 | | | 10,952 | | | 13,131 | | | 6,623 | | | 2,423 | | | 61,353 | | | 25.3 | | | (1,973 | ) |
| Commercial real estate | | | 6,418 | | | 9,420 | | | 3,598 | | | 4,615 | | | 62 | | | 24,113 | | | 9.9 | | | (232 | ) |
| Other property-related | | | 2,110 | | | 2,248 | | | 2,125 | | | 1,602 | | | 163 | | | 8,248 | | | 3.4 | | | (194 | ) |
| Government | | | 3,381 | | | 551 | | | 567 | | | 653 | | | 133 | | | 5,285 | | | 2.2 | | | (141 | ) |
| Other commercial* | | | 15,200 | | | 7,377 | | | 4,986 | | | 3,958 | | | 861 | | | 32,382 | | | 13.4 | | | (967 | ) |
| |
| Total corporate and commercial | | | 55,333 | | | 30,548 | | | 24,407 | | | 17,451 | | | 3,642 | | | 131,381 | | | 54.2 | | | (3,507 | ) |
| | | | | | | | | | | | | | | | | | | | | | | | | | |
Financial: | | | | | | | | | | | | | | | | | | | | | | | | | |
| Non-bank financial institutions | | | 4,638 | | | 2,259 | | | 1,448 | | | 3,265 | | | 74 | | | 11,684 | | | 4.8 | | | (156 | ) |
| Settlement accounts | | | 877 | | | 78 | | | 231 | | | 3,734 | | | 43 | | | 4,963 | | | 2.0 | | | – | |
| |
| Total financial | | | 5,515 | | | 2,337 | | | 1,679 | | | 6,999 | | | 117 | | | 16,647 | | | 6.8 | | | (156 | ) |
| | | | | | | | | | | | | | | | | | | | | | | | | | |
| Total gross loans and advances to customers | | | 93,564 | | | 68,484 | | | 32,380 | | | 42,793 | | | 5,268 | | | 242,489 | | | 100.0 | | | (4,608 | ) |
|
|
|
|
|
|
|
|
|
|
|
|
|
|
|
| | | | |
|
|
| | | |
| | | | | | | | | | | | | | | | | | | | | | | | | | |
| General provisions | | | | | | | | | | | | | | | | | | | | | | | | (2,019 | ) |
| Suspended interest | | | | | | | | | | | | | | | | | | (567 | ) | | | | | | |
| | | | | | | | | | | | | | | | | |
|
| | | | |
|
| |
| Total | | | | | | | | | | | | | | | | | | 241,922 | | | | | | (6,627 | ) |
| | | | | | | | | | | | | | | | | |
|
| | | | |
|
| |
| ¶ | The years 1998 to 2001 have been restated to reflect a reclassification of loans to personal investment vehicles to ‘Other personal’ category, from ‘corporate and commercial’ and ‘non-bank financial institutions’ as this provides a more accurate description of the borrower. |
120
Back to Contents
HSBC HOLDINGS PLC
| Customer loans and advances by principal area within rest of Asia-Pacific and South America |
| | | | Residential
mortgages | | | Other
Personal | | | Property-
related | | | Commercial,
industrial and
international
trade and other | | | Total | |
| |
| | | | US$m | | | US$m | | | US$m | | | US$m | | | US$m | |
31 December 2002 | | | | | | | | | | | | | | | | |
| | | | | | | | | | | | | | | | | |
| Loans and advances to customers (gross) | | | | | | | | | | | | | | | | |
| | | | | | | | | | | | | | | | | |
| Singapore | | | 960 | | | 2,023 | | | 925 | | | 2,296 | | | 6,204 | |
| Australia and New Zealand | | | 2,742 | | | 290 | | | 1,187 | | | 2,821 | | | 7,040 | |
| Malaysia | | | 1,558 | | | 453 | | | 333 | | | 2,521 | | | 4,865 | |
| Middle East | | | 36 | | | 1,544 | | | 1,086 | | | 3,518 | | | 6,184 | |
| Indonesia | | | 9 | | | 91 | | | 27 | | | 581 | | | 708 | |
| South Korea | | | 800 | | | 67 | | | – | | | 855 | | | 1,722 | |
| Thailand | | | 26 | | | 80 | | | 26 | | | 705 | | | 837 | |
| Japan | | | 12 | | | 67 | | | 592 | | | 2,010 | | | 2,681 | |
| Mainland China | | | 29 | | | 4 | | | 298 | | | 1,410 | | | 1,741 | |
| India | | | 216 | | | 288 | | | 18 | | | 1,236 | | | 1,758 | |
| Taiwan | | | 918 | | | 420 | | | 1 | | | 909 | | | 2,248 | |
| Other | | | 201 | | | 573 | | | 239 | | | 1,726 | | | 2,739 | |
| |
| Total of rest of Asia-Pacific | | | 7,507 | | | 5,900 | | | 4,732 | | | 20,588 | | | 38,727 | |
| |
| | | | | | | | | | | | | | | | | |
| Brazil | | | 158 | | | 979 | | | 48 | | | 1,162 | | | 2,347 | |
| Argentina | | | 94 | | | 31 | | | 15 | | | 940 | * | | 1,080 | |
| Other | | | 1 | | | 2 | | | 9 | | | 137 | | | 149 | |
| |
| Total of South America | | | 253 | | | 1,012 | | | 72 | | | 2,239 | | | 3,576 | |
| |
| | |
| * | includes US$558 million of loan exposures to the Argentine Government received in exchange for debt securities |
| | | | Residential
Mortgages | | | Other
Personal | | | Property-
related | | | Commercial,
industrial and
international
trade and other | | | Total | |
| |
| | | | US$m | | | US$m | | | US$m | | | US$m | | | US$m | |
| 31 December 2001 | | | | | | | | | | | | | | | | |
| | | | | | | | | | | | | | | | | |
| Loans and advances to customers (gross) | | | | | | | | | | | | | | | | |
| | | | | | | | | | | | | | | | | |
| Singapore† | | | 536 | | | 1,110 | | | 915 | | | 2,795 | | | 5,356 | |
| | | | | | | | | | | | | | | | | |
| Australia and New Zealand | | | 1,539 | | | 281 | | | 1,225 | | | 2,109 | | | 5,154 | |
| Malaysia | | | 1,196 | | | 435 | | | 455 | | | 2,400 | | | 4,486 | |
| Middle East | | | 31 | | | 1,415 | | | 920 | | | 2,934 | | | 5,300 | |
| Indonesia | | | 5 | | | 48 | | | 31 | | | 757 | | | 841 | |
| South Korea | | | 597 | | | 56 | | | 14 | | | 516 | | | 1,183 | |
| Thailand | | | 32 | | | 56 | | | 35 | | | 659 | | | 782 | |
| Japan | | | 1 | | | 53 | | | 288 | | | 1,119 | | | 1,461 | |
| Mainland China | | | 22 | | | – | | | 384 | | | 1,456 | | | 1,862 | |
| India | | | 125 | | | 254 | | | 18 | | | 1,161 | | | 1,558 | |
| Taiwan | | | 843 | | | 364 | | | 3 | | | 931 | | | 2,141 | |
| Other | | | 207 | | | 439 | | | 297 | | | 1,771 | | | 2,714 | |
| |
| Total of rest of Asia-Pacific | | | 5,134 | | | 4,511 | | | 4,585 | | | 18,608 | | | 32,838 | |
| |
| | | | | | | | | | | | | | | | | |
| Brazil | | | 276 | | | 1,140 | | | 57 | | | 1,484 | | | 2,957 | |
| Argentina | | | 263 | | | 140 | | | 59 | | | 1,584 | * | | 2,046 | |
| Other | | | 9 | | | – | | | 30 | | | 166 | | | 205 | |
| |
| Total of South America | | | 548 | | | 1,280 | | | 146 | | | 3,234 | | | 5,208 | |
| |
| | |
| * | includes US$774 million of loan exposures to the Argentine Government received in exchange for debt securities |
| | |
| † | The figures for 2001 have been restated to reflect a reclassification of loans to personal investment vehicles to ‘Other personal’ category, from ‘corporate and commercial’ and ‘non-bank financial institutions’ as this provides a more accurate description of the borrower. |
121
Back to Contents
HSBC HOLDINGS PLC
Financial Review (continued)
|
| |
| |
| |
| Analysis of loans and advances to banks by geographical region |
| | | | Europe | | | Hong Kong | | | Rest of
Asia-Pacific | | | North America | | | South America | * | | Gross
loans and
advances to banks | | | Provisions
for bad and
doubtful
debts | |
| |
| | | | US$m | | | US$m | | | US$m | | | US$m | | | US$m | | | US$m | | | US$m | |
| 31 December 2002 | | | 39,398 | | | 33,359 | | | 10,708 | | | 10,391 | | | 1,665 | | | 95,521 | | | (23 | ) |
| Suspended interest | | | | | | | | | | | | | | | | | | (2 | ) | | | |
| | | | | | | | | | | | | | | | | |
| | | | |
| Total | | | | | | | | | | | | | | | | | | 95,519 | | | | |
| | | | | | | | | | | | | | | | | |
| | | | |
| 31 December 2001 | | | 40,665 | | | 42,516 | | | 11,253 | | | 7,979 | | | 2,252 | | | 104,665 | | | (22 | ) |
| Suspended interest | | | | | | | | | | | | | | | | | | (2 | ) | | | |
| | | | | | | | | | | | | | | | | |
| | | | |
| Total | | | | | | | | | | | | | | | | | | 104,663 | | | | |
| | | | | | | | | | | | | | | | | |
| | | | |
| 31 December 2000 | | | 45,072 | | | 57,154 | | | 11,197 | | | 9,441 | | | 3,200 | | | 126,064 | | | (30 | ) |
| Suspended interest | | | | | | | | | | | | | | | | | | (2 | ) | | | |
| | | | | | | | | | | | | | | | | |
| | | | |
| Total | | | | | | | | | | | | | | | | | | 126,062 | | | | |
| | | | | | | | | | | | | | | | | |
| | | | |
| 31 December 1999 | | | 29,395 | | | 53,778 | | | 10,024 | | | 4,568 | | | 2,337 | | | 100,102 | | | (24 | ) |
| Suspended interest | | | | | | | | | | | | | | | | | | (1 | ) | | | |
| | | | | | | | | | | | | | | | | |
| | | | |
| Total | | | | | | | | | | | | | | | | | | 100,101 | | | | |
| | | | | | | | | | | | | | | | | |
| | | | |
| 31 December 1998 | | | 22,713 | | | 44,938 | | | 11,433 | | | 4,615 | | | 1,648 | | | 85,347 | | | (31 | ) |
| Suspended interest | | | | | | | | | | | | | | | | | | (1 | ) | | | |
| | | | | | | | | | | | | | | | | |
| | | | |
| Total | | | | | | | | | | | | | | | | | | 85,346 | | | | |
| | | | | | | | | | | | | | | | | |
| | | | |
| | |
| * | Formerly described as Latin America, which included group entities in Panama and Mexico, which are now included in North America, figures for 1998 to 2001 have been restated to reflect this change. |
| |
| |
Provisions for bad and doubtful debts |
It is HSBC’s policy that each operating company will make provisions for bad and doubtful debts promptly where required and on a prudent and consistent basis in accordance with established group guidelines.
HSBC maintains a universal grading process for credit facilities that members of its group extend. This grading system currently has three satisfactory and four less than satisfactory grades, and is being expanded to refine the measure of credit quality used by management. Management regularly reviews the appropriateness of grades assigned to a facility, and amendments, where necessary, are required to be undertaken promptly. Management also regularly performs an assessment of the adequacy of the provision for bad and doubtful debts by conducting a detailed review of the loan portfolio. Particular attention is paid to those borrowers classified in one of the four less than satisfactory grades.
Loans are designated as non-performing as soon as management has doubts as to the ultimate collectability of principal or interest or when contractual payments of principal or interest are 90 days overdue. When a loan is designated as non-performing, interest is suspended (see below) and a specific provision raised if required.
The suspension of interest may, however be deferred for up to 12 months in either of the following situations:
| • | where cash collateral is held covering the total of principal and interest due and the right to set-off is legally sound; or |
| | |
| • | where the value of net realisable tangible security is considered more than sufficient to cover the full repayment of all principal and interest due and credit approval has been given to the rolling-up or capitalisation of interest payments. This exception is used infrequently. |
There are two types of provision, specific and general as discussed below.
Specific provisions represent the quantification of actual and inherent losses from identified accounts that are deducted from loans and advances in the balance sheet.
The majority of specific provisions are determined by an evaluation of individual exposures on a case by case basis. This procedure is applied to all corporate accounts with the exception of small exposures (typically less than US$15,000) in certain countries, and to all residential mortgages where delinquencies exceed 90 days. In determining such provisions account is taken of the following factors:
122
Back to Contents
HSBC HOLDINGS PLC
| • | the bank’s exposure to the customer (including contingent liabilities); |
| | |
| • | the likely dividend available on liquidation/bankruptcy; |
| | |
| • | the extent of other creditors’ commitments ranking ahead of or pari passu with the Group; |
| | |
| • | the amount and timing of expected receipts and recoveries; |
| | |
| • | the realisable value of security and likelihood of successful repossession; |
| | |
| • | the deduction of any costs involved in recovery of amounts outstanding; and |
| | |
| • | if loans are not in local currency, the ability of the borrower to obtain the relevant foreign currency. |
Group policy requires a review of the level of specific provisions on individual facilities at least half yearly or more regularly where individual circumstances require. This should include the revaluation of collateral held (including reconfirmation of its enforceability) and a review of actual and anticipated receipts. For significant commercial debts, specialised loan ‘work-out’ teams are used who have experience in insolvency and specific markets. This expertise is leveraged to assess more accurately likely losses on the individual exposures. Releases on individually calculated specific provisions are determined whenever the Group has a reasonable indication that the estimate of loss has been reduced.
For portfolios of low value, high volume homogenous facilities, specific provisions are raised to reflect the quantum of balances at each stage of delinquency. The principal portfolios assessed for specific provision on a portfolio basis are overdue credit cards and other unsecured consumer lending products and residential mortgages overdue, but less than 90 days overdue. The Group has used loss rate data to develop guidelines for the loss rates that should be applied to overdue accounts, based on the severity of delinquency. The major operating units maintain their own loss data which is used to validate the Group’s guidelines. This has generally confirmed the appropriateness of the guidelines although it has led in some isolated cases to higher provision rates being applied. For portfolios of non-mortgage personal lending the provision policy guidelines require 100 per cent provision after 180 days of delinquency. The Group al so uses flow rate methodology. At present this has been adopted in limited circumstances, but the Group is broadening its use as appropriate data becomes available.
These portfolio provisions are generally reassessed monthly and charges for new provisions, or releases of existing provisions, are calculated separately for each portfolio type.
Specific provisions are established in respect of cross border exposures to countries assessed by the management to be vulnerable to foreign currency payment restrictions. This assessment includes an analysis of both economic and political factors. Economic factors include the level of external indebtedness, the debt service burden and access to external sources of funds to meet the country’s financing requirements. Political factors include the stability of the country and its government, potential threats to security and the quality of the legal system.
Provisions are applied to all exposures within such countries unless the facilities:
| | |
| • | are fully performing and of less than one year’s duration; |
| | |
| • | are mitigated by acceptable security cover held outside the country concerned; and |
| | |
| • | related to securities held for short term trading purposes where there is a liquid security market and they are marked to marked daily. |
General provisions augment specific provisions and provide cover for loans which are impaired at the balance sheet date but which will not be identified as such until some time in the future. HSBC requires each operating company to maintain a general provision which is determined taking into account:
| • | the historical loss experienced in portfolios of similar risk characteristics (generally divided by industry sector and for HSBC Bank USA also by loan grade); |
| | |
| • | the estimated period between losses occurring and establishment of a specific provision for this loss; and |
| | |
| • | management’s judgement of whether the current economic and credit conditions are such that the actual level of inherent losses is greater or less than that suggested by historical experience. |
123
Back to Contents
HSBC HOLDINGS PLC
Financial Review (continued)
|
Loss experience is defined as the annual new provisions (net of recoveries for personal lending) over a five-year period. These loss rates are applied to all loans, other than those for which a specific provision has been established in order to develop an estimate of the level of losses inherent in the portfolio at the reporting date. Management reviews the need to hold a different level of general allowance than that suggested by historical loss rates by reference to current economic conditions and loan gradings. Any adjustment made as a result of this management judgement, and the basis for this adjustment for each reporting entity, is documented and reviewed by senior Group credit management.
The estimated period between losses occurring and establishment of a specific provision for this loss is determined by management for each identified portfolio, having regard to the robustness of the specific provisioning process and the availability of information on which to assess specific provisions.
In general, the periods used vary between four and nine months. In certain circumstances, such as Argentina in 2001, economic conditions are such that it is clear that historical loss experience provides little evidence as to the inherent loss. In such circumstances management will use their judgement and any relevant experience from similar situations to determine an appropriate provision.
Loans (and the related provisions) are charged off either partially or in full when there is the prospect of recovery of these amounts. HSBC therefore generally writes off loans less quickly than US banks leading to a higher reported level of credit risk elements and associated provisions. New provisions rather than amounts written off should be taken as indications of current loss trends.
Loans on which interest is suspended |
Provided that there is a realistic prospect of interest being paid at some future date, interest on non-performing loans is charged to the customer’s account. However, the interest is not credited to the profit and loss account but to an interest suspense account in the balance sheet which is netted against the relevant loan. On receipt of cash (other than from the realisation of security), suspended interest is recovered and taken to the profit and loss account. A specific provision of the same amount as the interest receipt is then raised against the principal balance. Amounts received from the realisation of security are applied to the repayment of outstanding indebtedness, with any surplus used to recover any specific provisions and then suspended interest.
Where the probability of receiving interest payments is remote, interest is no longer accrued and any suspended interest balance is written off.
Loans are not reclassified as accruing until interest and principal payments are up-to-date and future payments are reasonably assured.
Assets acquired in exchange for advances in order to achieve an orderly realisation continue to be reported as advances. The asset acquired is recorded at the carrying value of the advance disposed of at the date of the exchange and provisions are based on any subsequent deterioration in its value.
124
Back to Contents
HSBC HOLDINGS PLC
The following tables show details of the movements in HSBC’s provisions for bad and doubtful debts by location of lending office for each of the past five years. A discussion of the material movements in the charge for provisions by region is included within the analysis of results for operating segments on pages 54 to 81.
| | | | Europe | | |
Hong Kong | | |
Rest of Asia Pacific | | | North America | | | South America | | | Total | |
| | |
|
| |
|
| |
|
| |
|
| |
|
| |
|
| |
2002 | | | US$m | | | US$m | | | US$m | | | US$m | | | US$m | | | US$m | |
| Provisions at 1 January | | | 3,067 | | | 1,408 | | | 1,952 | | | 723 | | | 1,033 | | | 8,183 | |
| | | | | | | | | | | | | | | | | | | | |
| Amounts written off: | | | | | | | | | | | | | | | | | | | |
| Banks | | | – | | | – | | | – | | | – | | | (1 | ) | | (1 | ) |
| Commercial, industrial and international trade | | | (161 | ) | | (59 | ) | | (255 | ) | | (92 | ) | | (28 | ) | | (595 | ) |
| Real estate | | | (31 | ) | | (18 | ) | | (88 | ) | | (9 | ) | | (4 | ) | | (150 | ) |
| Non-bank financial institutions | | | (4 | ) | | (11 | ) | | (2 | ) | | (12 | ) | | (2 | ) | | (31 | ) |
| Governments | | | (1 | ) | | – | | | – | | | – | | | – | | | (1 | ) |
| Other commercial | | | (54 | ) | | (11 | ) | | (116 | ) | | (149 | ) | | (22 | ) | | (352 | ) |
| Residential mortgages | | | (2 | ) | | (109 | ) | | (7 | ) | | (2 | ) | | (10 | ) | | (130 | ) |
| Other personal | | | (199 | ) | | (328 | ) | | (132 | ) | | (96 | ) | | (96 | ) | | (851 | ) |
| | |
|
| |
|
| |
|
| |
|
| |
|
| |
|
| |
| Total amounts written off | | | (452 | ) | | (536 | ) | | (600 | ) | | (360 | ) | | (163 | ) | | (2,111 | ) |
| | | | | | | | | | | | | | | | | | | | |
| Recoveries of amounts written off in previous years: | | | | | | | | | | | | | | | | | | | |
| Commercial, industrial and international trade | | | 15 | | | 1 | | | 4 | | | 6 | | | 2 | | | 28 | |
| Real estate | | | 6 | | | – | | | 2 | | | 6 | | | – | | | 14 | |
| Non-bank financial institutions | | | – | | | – | | | 1 | | | – | | | – | | | 1 | |
| Governments | | | – | | | – | | | – | | | – | | | – | | | – | |
| Other commercial | | | 7 | | | 3 | | | 14 | | | 9 | | | – | | | 33 | |
| Residential mortgages | | | 1 | | | 7 | | | – | | | – | | | – | | | 8 | |
| Other personal | | | 29 | | | 14 | | | 31 | | | 14 | | | 8 | | | 96 | |
| | |
|
| |
|
| |
|
| |
|
| |
|
| |
|
| |
| Total recoveries | | | 58 | | | 25 | | | 52 | | | 35 | | | 10 | | | 180 | |
| | | | | | | | | | | | | | | | | | | | |
| Net charge to profit and loss account: | | | | | | | | | | | | | | | | | | | |
| Banks | | | (2 | ) | | – | | | – | | | – | | | – | | | (2 | ) |
| Commercial, industrial and international trade | | | 345 | | | (22 | ) | | 38 | | | 89 | | | 30 | | | 480 | |
| Real estate | | | (4 | ) | | 9 | | | (11 | ) | | 5 | | | 2 | | | 1 | |
| Non-bank financial institutions | | | 3 | | | (14 | ) | | (29 | ) | | 18 | | | 11 | | | (11 | ) |
| Governments | | | (1 | ) | | – | | | – | | | (5 | ) | | 4 | | | (2 | ) |
| Other commercial | | | 50 | | | (22 | ) | | (22 | ) | | 116 | | | 177 | | | 299 | |
| Residential mortgages | | | – | | | 70 | | | 11 | | | (4 | ) | | 10 | | | 87 | |
| Other personal | | | 243 | | | 322 | | | 93 | | | 66 | | | 96 | | | 820 | |
| General provisions | | | (65 | ) | | (97 | ) | | 9 | | | 15 | | | (213 | ) | | (351 | ) |
| | |
|
| |
|
| |
|
| |
|
| |
|
| |
|
| |
| Total charge | | | 569 | | | 246 | | | 89 | | | 300 | | | 117 | | | 1,321 | |
| | | | | | | | | | | | | | | | | | | | |
| Foreign exchange and other movements † | | | 426 | | | – | | | 3 | | | 1,658 | | | (520 | ) | | 1,567 | |
| | |
|
| |
|
| |
|
| |
|
| |
|
| |
|
| |
| Provisions at 31 December | | | 3,668 | | | 1,143 | | | 1,496 | | | 2,356 | | | 477 | | | 9,140 | |
| | |
|
| |
|
| |
|
| |
|
| |
|
| |
|
| |
| Provisions against banks: | | | | | | | | | | | | | | | | | | | |
| Specific provisions | | | 23 | | | – | | | – | | | – | | | – | | | 23 | |
| Provisions against customers: | | | | | | | | | | | | | | | | | | | |
| Specific provisions | | | 2,774 | | | 688 | | | 1,321 | | | 1,482 | | | 341 | | | 6,606 | |
| General provisions* | | | 871 | | | 455 | | | 175 | | | 874 | | | 136 | | | 2,511 | |
| | |
|
| |
|
| |
|
| |
|
| |
|
| |
|
| |
| Provisions at 31 December | | | 3,668 | | | 1,143 | | | 1,496 | | | 2,356 | | | 477 | | | 9,140 | |
| | |
|
| |
|
| |
|
| |
|
| |
|
| |
|
| |
| Provisions against customers as a % of gross loans and advances to customers: | | | | | | | | | | | | | | | | | | | |
| Specific provisions | | | 1.65 | | | 0.97 | | | 3.42 | | | 1.85 | | | 9.73 | | | 1.83 | |
| General provisions | | | 0.52 | | | 0.64 | | | 0.45 | | | 1.09 | | | 3.88 | | | 0.69 | |
| | |
|
| |
|
| |
|
| |
|
| |
|
| |
|
| |
| Total | | | 2.17 | | | 1.61 | | | 3.87 | | | 2.94 | | | 13.61 | | | 2.52 | |
| | |
|
| |
|
| |
|
| |
|
| |
|
| |
|
| |
| | |
| * | General provisions are allocated to geographical segments based on the location of the office booking the provision. Consequently, the general provision booked in Hong Kong may cover assets booked in branches located outside Hong Kong, principally in the rest of Asia-Pacific, as well as those booked in Hong Kong. |
| | |
| † | Other movements include amounts transferred in on the acquisition of GFBital of US$1,704 million. |
125
Back to Contents
HSBC HOLDINGS PLC
Financial Review (continued)
|
| | | | Europe | | | Hong Kong | | | Rest of Asia-Pacific | | | North America | | | South America | ¶ | | Total | |
| | |
|
| |
|
| |
|
| |
|
| |
|
| |
|
| |
| 2001 | | | US$m | | | US$m | | | US$m | | | US$m | | | US$m | | | US$m | |
| | | | | | | | | | | | | | | | | | | | |
| Provisions at 1 January | | | 3,025 | | | 1,802 | | | 2,091 | | | 739 | | | 540 | | | 8,197 | |
| | | | | | | | | | | | | | | | | | | | |
| Amounts written off: | | | | | | | | | | | | | | | | | | | |
| Banks | | | (5 | ) | | – | | | – | | | – | | | – | | | (5 | ) |
| Commercial, industrial and international trade | | | (123 | ) | | (238 | ) | | (256 | ) | | (107 | ) | | (29 | ) | | (753 | ) |
| Real estate | | | (27 | ) | | (29 | ) | | (18 | ) | | (10 | ) | | (4 | ) | | (88 | ) |
| Non-bank financial institutions | | | (5 | ) | | (53 | ) | | (5 | ) | | (3 | ) | | (1 | ) | | (67 | ) |
| Governments | | | – | | | – | | | – | | | – | | | – | | | – | |
| Other commercial | | | (54 | ) | | (34 | ) | | (48 | ) | | (107 | ) | | (215 | ) | | (458 | ) |
| Residential mortgages | | | (4 | ) | | (121 | ) | | (7 | ) | | (2 | ) | | (13 | ) | | (147 | ) |
| Other personal | | | (224 | ) | | (155 | ) | | (93 | ) | | (93 | ) | | (95 | ) | | (660 | ) |
| | |
|
| |
|
| |
|
| |
|
| |
|
| |
|
| |
| Total amounts written off | | | (442 | ) | | (630 | ) | | (427 | ) | | (322 | ) | | (357 | ) | | (2,178 | ) |
| | | | | | | | | | | | | | | | | | | | |
| Recoveries of amounts written off in previous years: | | | | | | | | | | | | | | | | | | | |
| Commercial, industrial and international trade | | | 12 | | | 1 | | | 11 | | | 18 | | | 3 | | | 45 | |
| Real Estate | | | 1 | | | 2 | | | 1 | | | – | | | – | | | 4 | |
| Non-bank financial institutions | | | – | | | 3 | | | 1 | | | – | | | – | | | 4 | |
| Governments | | | – | | | – | | | – | | | – | | | – | | | – | |
| Other commercial | | | 17 | | | 12 | | | 99 | | | 11 | | | 1 | | | 140 | |
| Residential mortgages | | | 1 | | | 5 | | | – | | | – | | | – | | | 6 | |
| Other personal | | | 34 | | | 8 | | | 26 | | | 14 | | | 4 | | | 86 | |
| | |
|
| |
|
| |
|
| |
|
| |
|
| |
|
| |
| Total recoveries | | | 65 | | | 31 | | | 138 | | | 43 | | | 8 | | | 285 | |
| | | | | | | | | | | | | | | | | | | | |
| Net charge to profit and loss account: | | | | | | | | | | | | | | | | | | | |
| Banks | | | (1 | ) | | – | | | – | | | – | | | – | | | (1 | ) |
| Commercial, industrial and international trade | | | 164 | | | 15 | | | 157 | | | 93 | | | 55 | | | 484 | |
| Real estate | | | (35 | ) | | 16 | | | (6 | ) | | 2 | | | 7 | | | (16 | ) |
| Non-bank financial institutions | | | (2 | ) | | (20 | ) | | (14 | ) | | 2 | | | – | | | (34 | ) |
| Governments | | | (2 | ) | | – | | | – | | | (3 | ) | | – | | | (5 | ) |
| Other commercial | | | 143 | | | (84 | ) | | (58 | ) | | 151 | | | 90 | | | 242 | |
| Residential mortgages | | | (47 | ) | | 111 | | | 10 | | | 1 | | | 17 | | | 92 | |
| Other personal | | | 257 | | | 168 | | | 82 | | | 70 | | | 125 | | | 702 | |
| General provisions | | | (36 | ) | | (9 | ) | | 1 | | | (16 | ) | | 633 | | | 573 | |
| | |
|
| |
|
| |
|
| |
|
| |
|
| |
|
| |
| Total charge | | | 441 | | | 197 | | | 172 | | | 300 | | | 927 | | | 2,037 | |
| Foreign exchange and other movements | | | (22 | ) | | 8 | | | (22 | ) | | (37 | ) | | (85 | ) | | (158 | ) |
| | |
|
| |
|
| |
|
| |
|
| |
|
| |
|
| |
| Provisions at 31 December | | | 3,067 | | | 1,408 | | | 1,952 | | | 723 | | | 1,033 | | | 8,183 | |
| | |
|
| |
|
| |
|
| |
|
| |
|
| |
|
| |
| Provisions against banks: | | | | | | | | | | | | | | | | | | | |
| Specific provisions | | | 22 | | | – | | | – | | | – | | | – | | | 22 | |
| Provisions against customers: | | | | | | | | | | | | | | | | | | | |
| Specific provisions | | | 2,204 | | | 856 | | | 1,786 | | | 289 | | | 365 | | | 5,500 | |
| General provisions* | | | 841 | | | 552 | | | 166 | | | 434 | | | 668 | | | 2,661 | |
| | |
|
| |
|
| |
|
| |
|
| |
|
| |
|
| |
| Provisions at 31 December | | | 3,067 | | | 1,408 | | | 1,952 | | | 723 | | | 1,033 | | | 8,183 | |
| | |
|
| |
|
| |
|
| |
|
| |
|
| |
|
| |
| Provisions against customers as a % of gross loans and | | | | | | | | | | | | | | | | | | | |
| advances to customers: | | | | | | | | | | | | | | | | | | | |
| Specific provisions | | | 1.61 | | | 1.24 | | | 5.44 | | | 0.39 | | | 7.03 | | | 1.73 | |
| General provisions | | | 0.62 | | | 0.80 | | | 0.51 | | | 0.59 | | | 12.87 | # | | 0.84 | |
| | |
|
| |
|
| |
|
| |
|
| |
|
| |
|
| |
| Total | | | 2.23 | | | 2.04 | | | 5.95 | | | 0.98 | | | 19.90 | | | 2.57 | |
| | |
|
| |
|
| |
|
| |
|
| |
|
| |
|
| |
| | |
| * | General provisions are allocated to geographical segments based on the location of the office booking the provision. Consequently, the general provision booked in Hong Kong may cover assets booked in branches located outside Hong Kong, principally in the rest of Asia-Pacific, as well as those booked in Hong Kong. |
| | |
| # | Includes US$600 million of additional general provisions held against Argentine loans. |
| | |
| ¶ | Formerly described as Latin America, which included group entities in Panama and Mexico, which are now included in North America. Figures for 1998 to 2001 have been restated to reflect this change. |
126
Back to Contents
HSBC HOLDINGS PLC
| | | | Europe | | | Hong Kong | | | Rest of Asia-Pacific | | | North America | | | South America¶ | | | Total | |
| | |
|
| |
|
| |
|
| |
|
| |
|
| |
|
| |
| 2000 | | | US$m | | | US$m | | | US$m | | | US$m | | | US$m | | | US$m | |
| | | | | | | | | | | | | | | | | | | | |
| Provisions at 1 January | | | 2,153 | | | 1,887 | | | 2,686 | | | 864 | | | 430 | | | 8,020 | |
| | | | | | | | | | | | | | | | | | |
| Amounts written off: | | | (9 | ) | | – | | | – | | | – | | | – | | | (9 | ) |
| Commercial, industrial and international trade | | | (154 | ) | | (202 | ) | | (191 | ) | | (97 | ) | | (36 | ) | | (680 | ) |
| Real estate | | | (27 | ) | | (9 | ) | | (58 | ) | | (13 | ) | | (3 | ) | | (110 | ) |
| Non-bank financial institutions | | | (2 | ) | | (8 | ) | | (3 | ) | | – | | | – | | | (13 | ) |
| Governments | | | (37 | ) | | – | | | – | | | – | | | – | | | (37 | ) |
| Other commercial | | | (68 | ) | | (68 | ) | | (149 | ) | | (97 | ) | | (15 | ) | | (397 | ) |
| Residential mortgages | | | (5 | ) | | (82 | ) | | (5 | ) | | (4 | ) | | (7 | ) | | (103 | ) |
| Other personal | | | (181 | ) | | (73 | ) | | (88 | ) | | (90 | ) | | (30 | ) | | (462 | ) |
| | |
|
| |
|
| |
|
| |
|
| |
|
| |
|
| |
| Total amounts written off | | | (483 | ) | | (442 | ) | | (494 | ) | | (301 | ) | | (91 | ) | | (1,811 | ) |
| | | | | | | | | | | | | | | | | | |
| Recoveries of amounts written off in previous years: | | | | | | | | | | | | | | | | | | | |
| Banks | | | – | | | – | | | – | | | – | | | – | | | – | |
| Commercial, industrial and international trade | | | 4 | | | 3 | | | 3 | | | 1 | | | 2 | | | 13 | |
| Real estate | | | 7 | | | – | | | 2 | | | 3 | | | – | | | 12 | |
| Non-bank financial institutions | | | 3 | | | – | | | 2 | | | 1 | | | – | | | 6 | |
| Governments | | | 3 | | | – | | | – | | | – | | | – | | | 3 | |
| Other commercial | | | 4 | | | 4 | | | 23 | | | 11 | | | 1 | | | 43 | |
| Residential mortgages | | | 1 | | | 1 | | | – | | | – | | | 1 | | | 3 | |
| Other personal | | | 32 | | | 8 | | | 19 | | | 15 | | | 6 | | | 80 | |
| | |
|
| |
|
| |
|
| |
|
| |
|
| |
|
| |
| Total recoveries | | | 54 | | | 16 | | | 49 | | | 31 | | | 10 | | | 160 | |
| | | | | | | | | | | | | | | | | | |
| Net charge to profit and loss account: | | | | | | | | | | | | | | | | | | | |
| Banks | | | 2 | | | – | | | – | | | – | | | – | | | 2 | |
| Commercial, industrial and international trade | | | 87 | | | 81 | | | 107 | | | 89 | | | 43 | | | 407 | |
| Real estate | | | (9 | ) | | 40 | | | 19 | | | 10 | | | 5 | | | 65 | |
| Non-bank financial institutions | | | 1 | | | – | | | (3 | ) | | (2 | ) | | 2 | | | (2 | ) |
| Governments | | | (19 | ) | | – | | | – | | | – | | | – | | | (19 | ) |
| Other commercial | | | (3 | ) | | (30 | ) | | (18 | ) | | 80 | | | 21 | | | 50 | |
| Residential mortgages | | | 1 | | | 101 | | | 5 | | | 9 | | | 12 | | | 128 | |
| Other personal | | | 245 | | | 55 | | | 63 | | | 109 | | | 109 | | | 581 | |
| General provisions | | | 43 | | | 1 | | | (188 | ) | | (138 | ) | | 2 | | | (280 | ) |
| | |
|
| |
|
| |
|
| |
|
| |
|
| |
|
| |
| Total charge | | | 348 | | | 248 | | | (15 | ) | | 157 | | | 194 | | | 932 | |
| | | | | | | | | | | | | | | | | | |
| Foreign exchange and other movements# | | | 953 | | | 93 | | | (135 | ) | | (12 | ) | | (3 | ) | | 896 | |
| | |
|
| |
|
| |
|
| |
|
| |
|
| |
|
| |
| Provisions at 31 December | | | 3,025 | | | 1,802 | | | 2,091 | | | 739 | | | 540 | | | 8,197 | |
| | |
|
| |
|
| |
|
| |
|
| |
|
| |
|
| |
| | | | | | | | | | | | | | | | | | |
| Provisions against banks: | | | | | | | | | | | | | | | | | | | |
| Specific provisions | | | 30 | | | – | | | – | | | – | | | – | | | 30 | |
| Provisions against customers: | | | | | | | | | | | | | | | | | | | |
| Specific provisions | | | 2,135 | | | 1,241 | | | 1,929 | | | 278 | | | 482 | | | 6,065 | |
| General provisions* | | | 860 | | | 561 | | | 162 | | | 461 | | | 58 | | | 2,102 | |
| | |
|
| |
|
| |
|
| |
|
| |
|
| |
|
| |
| Provisions at 31 December | | | 3,025 | | | 1,802 | | | 2,091 | | | 739 | | | 540 | | | 8,197 | |
| | |
|
| |
|
| |
|
| |
|
| |
|
| |
|
| |
| | | | | | | | | | | | | | | | | | |
| Provisions against customers as a % of gross loans and | | | | | | | | | | | | | | | | | | | |
| Advances to customers: | | | | | | | | | | | | | | | | | | | |
| Specific provisions | | | 1.61 | | | 1.87 | | | 6.23 | | | 0.44 | | | 7.54 | | | 2.03 | |
| General provisions | | | 0.65 | | | 0.84 | | | 0.53 | | | 0.74 | | | 0.91 | | | 0.70 | |
| | |
|
| |
|
| |
|
| |
|
| |
|
| |
|
| |
| Total | | | 2.26 | | | 2.71 | | | 6.76 | | | 1.18 | | | 8.45 | | | 2.73 | |
| | |
|
| |
|
| |
|
| |
|
| |
|
| |
|
| |
| | |
| * | General provisions are allocated to geographical segments based on the location of the office booking the provision. Consequently, the general provision booked in Hong Kong may cover assets booked in branches located outside Hong Kong, principally in the rest of Asia-Pacific, as well as those booked in Hong Kong. |
| | |
| # | Other movements include amounts transferred in on the acquisition of CCF of US$882 million. |
| | |
| ¶ | Formerly described as Latin America, which included group entities in Panama and Mexico, which are now included in North America. Figures for 1998 to 2001 have been restated to reflect this change. |
127
Back to Contents
HSBC HOLDINGS PLC
Financial Review (continued)
|
| | | | Europe | | | Hong Kong | | | Rest of Asia-Pacific | | | North America | | | South America¶ | | | Total | |
| | |
|
| |
|
| |
|
| |
|
| |
|
| |
|
| |
| 1999 | | | US$m | | | US$m | | | US$m | | | US$m | | | US$m | | | US$m | |
| | | | | | | | | | | | | | | | | | | | |
| Provisions at 1 January | | | 1,932 | | | 1,554 | | | 2,181 | | | 599 | | | 392 | | | 6,658 | |
| | | | | | | | | | | | | | | | | | |
| Amounts written off: | | | | | | | | | | | | | | | | | | | |
| Banks | | | | | | | | | | | | | | | | | | | |
| Commercial, industrial and international trade | | | (89 | ) | | (146 | ) | | (130 | ) | | (33 | ) | | (36 | ) | | (434 | ) |
| Real estate | | | (25 | ) | | (14 | ) | | (32 | ) | | (2 | ) | | (1 | ) | | (74 | ) |
| Non-bank financial institutions | | | (1 | ) | | – | | | (35 | ) | | (2 | ) | | – | | | (38 | ) |
| Governments | | | – | | | – | | | – | | | – | | | – | | | – | |
| Other commercial | | | (43 | ) | | (15 | ) | | (49 | ) | | (12 | ) | | (14 | ) | | (133 | ) |
| Residential mortgages | | | (2 | ) | | (3 | ) | | (5 | ) | | (10 | ) | | (4 | ) | | (24 | ) |
| Other personal | | | (222 | ) | | (78 | ) | | (62 | ) | | (106 | ) | | (15 | ) | | (483 | ) |
| | |
|
| |
|
| |
|
| |
|
| |
|
| |
|
| |
| Total amounts written off | | | (382 | ) | | (256 | ) | | (313 | ) | | (165 | ) | | (70 | ) | | (1,186 | ) |
| | | | | | | | | | | | | | | | | | |
| Recoveries of amounts written off in previous years: | | | | | | | | | | | | | | | | | | | |
| Banks | | | – | | | – | | | 1 | | | – | | | – | | | 1 | |
| Commercial, industrial and international trade | | | 15 | | | 1 | | | 1 | | | 3 | | | 2 | | | 22 | |
| Real estate | | | 2 | | | – | | | 2 | | | 13 | | | – | | | 17 | |
| Non-bank financial institutions | | | 20 | | | – | | | – | | | – | | | – | | | 20 | |
| Governments | | | 11 | | | – | | | – | | | – | | | – | | | 11 | |
| Other commercial | | | 10 | | | 1 | | | 1 | | | 9 | | | – | | | 21 | |
| Other personal | | | 32 | | | 8 | | | 13 | | | 19 | | | 1 | | | 73 | |
| | |
|
| |
|
| |
|
| |
|
| |
|
| |
|
| |
| Total recoveries | | | 90 | | | 10 | | | 18 | | | 44 | | | 3 | | | 165 | |
| | | | | | | | | | | | | | | | | | |
| Net charge to profit and loss account: | | | | | | | | | | | | | | | | | | | |
| Banks | | | (2 | ) | | – | | | (2 | ) | | – | | | – | | | (4 | ) |
| Commercial, industrial and international trade | | | 155 | | | 273 | | | 414 | | | 60 | | | 44 | | | 946 | |
| Real estate | | | (14 | ) | | 96 | | | 86 | | | (18 | ) | | 4 | | | 154 | |
| Non-bank financial institutions | | | 11 | | | 45 | | | 75 | | | 1 | | | – | | | 132 | |
| Governments | | | (62 | ) | | – | | | – | | | (2 | ) | | – | | | (64 | ) |
| Other commercial | | | 19 | | | 42 | | | 169 | | | 11 | | | 33 | | | 274 | |
| Residential mortgages | | | – | | | 86 | | | 7 | | | 1 | | | 8 | | | 102 | |
| Other personal | | | 312 | | | 77 | | | 74 | | | 79 | | | 38 | | | 580 | |
| General provisions | | | 19 | | | (34 | ) | | (14 | ) | | (23 | ) | | 5 | | | (47 | ) |
| | |
|
| |
|
| |
|
| |
|
| |
|
| |
|
| |
| Total charge | | | 438 | | | 585 | | | 809 | | | 109 | | | 132 | | | 2,073 | |
| | | | | | | | | | | | | | | | | | |
| Foreign exchange and other movements | | | 75 | | | (6 | ) | | (9 | ) | | 277 | | | (27 | ) | | 310 | |
| | |
|
| |
|
| |
|
| |
|
| |
|
| |
|
| |
| Provisions at 31 December | | | 2,153 | | | 1,887 | | | 2,686 | | | 864 | | | 430 | | | 8,020 | |
| | |
|
| |
|
| |
|
| |
|
| |
|
| |
|
| |
| | | | | | | | | | | | | | | | | | |
| Provisions against banks: | | | | | | | | | | | | | | | | | | | |
| Specific provisions | | | 24 | | | – | | | – | | | – | | | – | | | 24 | |
| Provisions against customers: | | | | | | | | | | | | | | | | | | | |
| Specific provisions | | | 1,411 | | | 1,428 | | | 2,221 | | | 261 | | | 371 | | | 5,692 | |
| General provisions* | | | 718 | | | 459 | | | 465 | | | 603 | | | 59 | | | 2,304 | |
| | |
|
| |
|
| |
|
| |
|
| |
|
| |
|
| |
| Provisions at 31 December | | | 2,153 | | | 1,887 | | | 2,686 | | | 864 | | | 430 | | | 8,020 | |
| | |
|
| |
|
| |
|
| |
|
| |
|
| |
|
| |
| Provisions against customers as a % of gross loans and | | | | | | | | | | | | | | | | | | | |
| Advances to customers: | | | | | | | | | | | | | | | | | | | |
| Specific provisions | | | 1.33 | | | 2.20 | | | 6.98 | | | 0.48 | | | 6.60 | | | 2.17 | |
| General provisions | | | 0.68 | | | 0.71 | | | 1.46 | | | 1.12 | | | 1.05 | | | 0.88 | |
| | |
|
| |
|
| |
|
| |
|
| |
|
| |
|
| |
| Total | | | 2.01 | | | 2.91 | | | 8.44 | | | 1.60 | | | 7.65 | | | 3.05 | |
| | |
|
| |
|
| |
|
| |
|
| |
|
| |
|
| |
| | |
| * | General provisions are allocated to geographical segments based on the location of the office booking the provision. Consequently, the general provision booked in Hong Kong may cover assets booked in branches located outside Hong Kong, principally in the rest of Asia-Pacific, as well as those booked in Hong Kong. |
| | |
| ¶ | Formerly described as Latin America, which included group entities in Panama and Mexico, which are now included in North America. Figures for 1998 to 2001 have been restated to reflect this change. |
128
Back to Contents
HSBC HOLDINGS PLC
| | | | Europe | | | Hong Kong | | | Rest of Asia-Pacific | | | North America | | | South America | ¶ | | Total | |
| | |
|
| |
|
| |
|
| |
|
| |
|
| |
|
| |
| 1998 | | | US$m | | | US$m | | | US$m | | | US$m | | | US$m | | | US$m | |
| | | | | | | | | | | | | | | | | | | | |
| Provisions at 1 January | | | 2,076 | | | 934 | | | 1,300 | | | 635 | | | 233 | | | 5,178 | |
| | | | | | | | | | | | | | | | | | |
| Acquisition of subsidiaries | | | | | | | | | | | | | | | | | | | |
| Amounts written off: | | | | | | | | | | | | | | | | | | | |
| Banks | | | (24 | ) | | – | | | (4 | ) | | – | | | – | | | (28 | ) |
| Commercial, industrial and international trade | | | (147 | ) | | (34 | ) | | (19 | ) | | (32 | ) | | (3 | ) | | (235 | ) |
| Real estate | | | (54 | ) | | (10 | ) | | (18 | ) | | (13 | ) | | – | | | (95 | ) |
| Non-bank financial institutions | | | (2 | ) | | – | | | – | | | – | | | – | | | (2 | ) |
| Governments | | | (10 | ) | | – | | | – | | | – | | | – | | | (10 | ) |
| Other commercial | | | (203 | ) | | (50 | ) | | (300 | ) | | (19 | ) | | (4 | ) | | (576 | ) |
| Residential mortgages | | | (3 | ) | | – | | | (1 | ) | | (10 | ) | | – | | | (14 | ) |
| Other personal | | | (190 | ) | | (47 | ) | | (55 | ) | | (122 | ) | | (24 | ) | | (438 | ) |
| | |
|
| |
|
| |
|
| |
|
| |
|
| |
|
| |
| Total amounts written off | | | (633 | ) | | (141 | ) | | (397 | ) | | (196 | ) | | (31 | ) | | (1,398 | ) |
| | | | | | | | | | | | | | | | | | |
| Recoveries of amounts written off in previous years: | | | | | | | | | | | | | | | | | | | |
| Banks | | | – | | | – | | | – | | | – | | | – | | | – | |
| Commercial, industrial and international trade | | | 28 | | | 1 | | | 6 | | | 3 | | | – | | | 38 | |
| Real estate | | | 25 | | | – | | | 1 | | | 21 | | | – | | | 47 | |
| Non-bank financial institutions | | | 1 | | | – | | | – | | | 1 | | | – | | | 2 | |
| Governments | | | 1 | | | – | | | – | | | – | | | – | | | 1 | |
| Other commercial | | | 4 | | | 3 | | | – | | | 14 | | | – | | | 21 | |
| Other personal | | | 27 | | | 5 | | | 9 | | | 22 | | | – | | | 63 | |
| | |
|
| |
|
| |
|
| |
|
| |
|
| |
|
| |
| Total recoveries | | | 86 | | | 9 | | | 16 | | | 61 | | | – | | | 172 | |
| | | | | | | | | | | | | | | | | | |
| Net charge to profit and loss account: | | | | | | | | | | | | | | | | | | | |
| Banks | | | 4 | | | – | | | 5 | | | – | | | – | | | 9 | |
| Commercial, industrial and international trade | | | 67 | | | 361 | | | 679 | | | 48 | | | 70 | | | 1,225 | |
| Real estate | | | (54 | ) | | 105 | | | 113 | | | (45 | ) | | 2 | | | 121 | |
| Non-bank financial institutions | | | (1 | ) | | 45 | | | 43 | | | – | | | – | | | 87 | |
| Governments | | | – | | | – | | | – | | | 1 | | | – | | | 1 | |
| Other commercial | | | 60 | | | 107 | | | 272 | | | 3 | | | 27 | | | 469 | |
| Residential mortgages | | | – | | | 59 | | | 27 | | | 8 | | | 9 | | | 103 | |
| Other personal | | | 245 | | | 88 | | | 88 | | | 129 | | | 62 | | | 612 | |
| General provisions | | | 48 | | | (18 | ) | | (8 | ) | | (36 | ) | | 24 | | | 10 | |
| | |
|
| |
|
| |
|
| |
|
| |
|
| |
|
| |
| Total charge | | | 369 | | | 747 | | | 1,219 | | | 108 | | | 194 | | | 2,637 | |
| | | | | | | | | | | | | | | | | | |
| Foreign exchange and other movements | | | 34 | | | 5 | | | 43 | | | (9 | ) | | (4 | ) | | 69 | |
| | |
|
| |
|
| |
|
| |
|
| |
|
| |
|
| |
| Provisions at 31 December | | | 1,932 | | | 1,554 | | | 2,181 | | | 599 | | | 392 | | | 6,658 | |
| | |
|
| |
|
| |
|
| |
|
| |
|
| |
|
| |
| Provisions against banks: | | | | | | | | | | | | | | | | | | | |
| Specific provisions | | | 28 | | | – | | | 3 | | | – | | | – | | | 31 | |
| Provisions against customers: | | | | | | | | | | | | | | | | | | | |
| Specific provisions | | | 1,286 | | | 1,059 | | | 1,701 | | | 228 | | | 334 | | | 4,608 | |
| General provisions* | | | 618 | | | 495 | | | 477 | | | 371 | | | 58 | | | 2,019 | |
| | |
|
| |
|
| |
|
| |
|
| |
|
| |
|
| |
| Provisions at 31 December | | | 1,932 | | | 1,554 | | | 2,181 | | | 599 | | | 392 | | | 6,658 | |
| | |
|
| |
|
| |
|
| |
|
| |
|
| |
|
| |
| Provisions against customers as a % of gross loans and Advances to customers: | | | | | | | | | | | | | | | | | | | |
| Specific provisions | | | 1.37 | | | 1.55 | | | 5.26 | | | 0.53 | | | 6.34 | | | 1.90 | |
| General provisions | | | 0.66 | | | 0.72 | | | 1.47 | | | 0.87 | | | 1.10 | | | 0.83 | |
| | |
|
| |
|
| |
|
| |
|
| |
|
| |
|
| |
| Total | | | 2.03 | | | 2.27 | | | 6.73 | | | 1.40 | | | 7.44 | | | 2.73 | |
| | |
|
| |
|
| |
|
| |
|
| |
|
| |
|
| |
| | |
| * | General provisions are allocated to geographical segments based on the location of the office booking the provision. Consequently, the general provision booked in Hong Kong may cover assets booked in branches located outside Hong Kong, principally in the rest of Asia-Pacific, as well as those booked in Hong Kong. |
| | |
| ¶ | Formerly described as Latin America, which included group entities in Panama and Mexico, which are now included in North America. Figures for 1998 to 2001 have been restated to reflect this change. |
129
Back to Contents
HSBC HOLDINGS PLC
Financial Review (continued)
|
| |
Provisions against loans and advances to customers |
| | | | 31 December | | | 31 December | |
| | | | 2002 | | | 2001 | |
| |
| | | | % | | | % | |
| Total provisions to gross lending* | | | | | | | |
| Specific provisions | | | 1.94 | | | 1.90 | |
| |
| General provisions | | | | | | | |
| – held against Argentine risk | | | 0.04 | | | 0.21 | |
| – other | | | 0.70 | | | 0.71 | |
| |
| Total provisions | | | 2.68 | | | 2.82 | |
| |
| | |
| * | Net of suspended interest, reverse repo transactions and settlement accounts. |
| |
| |
Risk elements in the loan portfolio |
The SEC requires disclosure of credit risk elements under the following headings that reflect US accounting practice and classifications:
| • | loans accounted for on a non-accrual basis; |
| | |
| • | accruing loans contractually past due 90 days or more as to interest or principal; and |
| | |
| • | troubled debt restructurings not included in the above. |
HSBC, however, classifies loans in accordance with UK accounting practice which differs from US practice as follows:
Under the UK Statement of Recommended Practice on Advances, UK banks continue to charge interest on doubtful debts where there is a realistic prospect of recovery. This interest is credited to a suspense account and is not included in the profit and loss account. In the United States, loans on which interest has been accrued but suspended would be included in risk elements as loans accounted for on a non-accrual basis.
Assets acquired in exchange for advances |
Under US GAAP, assets acquired in exchange for advances in order to achieve an orderly realisation are usually reported in a separate balance sheet category, ‘Owned Real Estate’. Under UK GAAP, these assets are reported within loans and advances.
Troubled debt restructurings |
US GAAP requires separate disclosure of any loans whose terms have been modified due to problems with the borrower. Such disclosures may be discontinued after the first year if the new terms were in line with market conditions at the time of the restructuring and the borrower has remained current with the new terms.
In addition, US banks typically charge off problem lending more quickly than is the practice in the United Kingdom. This practice means that HSBC’s reported level of credit risk elements is likely to be higher than for a comparable US bank.
Credit risk elements also cover potential problem loans. These are loans where known information about possible credit problems of borrowers causes management serious doubts as to the borrowers’ ability to comply with the loan repayment terms. At 31 December 2002, all loans and advances in Argentina, and all cross-border loans to Argentina, which were not included as part of total risk elements have been designated as potential problem loans. There were no other significant potential problem loans at 31 December 2001.
| | | | 31 December | | | 31 December | |
| | | | 2002 | | | 2001 | |
| | | | US$m | | | US$m | |
| |
Non-performing loans and advances* | | | | | | | |
| Banks | | | 17 | | | 9 | |
| Customers | | | 10,523 | | | 9,649 | |
| |
| Total non-performing loans and advances | | | 10,540 | | | 9,658 | |
| |
| Total provisions cover as a percentage of non-performing loans and advances | | | 86.7% | | | 84.7% | |
| | |
| * | Net of suspended interest. |
Total non-performing loans to customers increased by US$874 million, however excluding the increase of US$1,224 million arising on the acquisition of GFBital, non-performing loans reduced by US$350 million during 2002. At 31 December 2002, non-performing loans represented 2.9 per cent of total lending compared with 3.0 per cent at 31 December 2001.
In Europe, total non-performing loans to customers increased by US$813 million during 2002. In the UK, and to a lesser extent France, there was some weakening in business confidence due to the continued uncertainty and weaknesses in global economies. In addition, intense competition and over-capacity in the energy and telecommunications sectors resulted in the downgrading to non-performing loan status of a small number of corporate accounts in these sectors.
In Hong Kong, non-performing loans decreased by US$304 million during 2002 due mainly to write-offs, recoveries and a return to performing status of some customer accounts.
130
Back to Contents
HSBC HOLDINGS PLC
In the rest of Asia-Pacific, non-performing loans decreased by US$668 million during 2002 due mainly to the combination of write-offs, recoveries and a return to performing status of exposures in Indonesia, Malaysia, Singapore and mainland China.
The level of non-performing loans in North America increased by US$1,101 million. The underlying level of non-performing loans, excluding the increase of the US$1,224 million on the acquisition of GFBital, fell by US$123 million during 2002 due mainly to the write-offs of a few customer accounts.
In South America, there was an increase in non-performing loans in local terms in Argentina where 74 per cent of the non-government loan book is now classified as non-performing. In Brazil, the level of non-performing loans reduced slightly.
The following table provides an analysis of risk elements in the loan portfolios as at 31 December for the past five years:
| | | | 31 December 2002 | | | 31 December 2001 | | | 31 December 2000 | | | 31 December 1999 | | | 31 December 1998 | |
| |
Loans accounted for on a non-accrual basis: | | | US$m | | | US$m | | | US$m | | | US$m | | | US$m | |
| Europe | | | 2,393 | | | 2,052 | | | 1,985 | | | 1,176 | | | 1,092 | |
| Hong Kong | | | 247 | | | 213 | | | 236 | | | 163 | | | 77 | |
| Rest of Asia-Pacific | | | 294 | | | 195 | | | 429 | | | 435 | | | 344 | |
| North America | | | 1,624 | | | 593 | | | 627 | | | 550 | | | 546 | |
| South America* | | | 293 | | | 429 | | | 550 | | | 447 | | | 355 | |
| |
| Total non-accrual loans | | | 4,851 | | | 3,482 | | | 3,827 | | | 2,771 | | | 2,414 | |
| |
Loans on which interest has been accrued but suspended: | | | | | | | | | | | | | | | | |
| Europe | | | 2,086 | | | 1,553 | | | 1,389 | | | 1,514 | | | 1,243 | |
| Hong Kong | | | 1,460 | | | 1,795 | | | 2,259 | | | 2,898 | | | 2,443 | |
| Rest of Asia-Pacific | | | 1,714 | | | 2,497 | | | 2,627 | | | 3,097 | | | 2,691 | |
| North America | | | 48 | | | 67 | | | 39 | | | 34 | | | 31 | |
| South America* | | | 183 | | | 115 | | | 160 | | | 133 | | | 41 | |
| |
| Total suspended interest loans | | | 5,491 | | | 6,027 | | | 6,474 | | | 7,676 | | | 6,449 | |
| |
Assets acquired in exchange for advances: | | | | | | | | | | | | | | | | |
| Europe | | | 26 | | | 84 | | | 25 | | | 27 | | | 28 | |
| Hong Kong | | | 17 | | | 19 | | | 26 | | | 72 | | | – | |
| Rest of Asia-Pacific | | | 54 | | | 32 | | | 24 | | | 2 | | | – | |
| North America | | | 101 | | | 14 | | | 19 | | | 17 | | | 22 | |
| |
| Total assets acquired in exchange for advances | | | 198 | | | 149 | | | 94 | | | 118 | | | 50 | |
| |
| Total non-performing loans | | | 10,540 | | | 9,658 | | | 10,395 | | | 10,565 | | | 8,913 | |
| |
Troubled debt restructurings: | | | | | | | | | | | | | | | | |
| Europe | | | 41 | | | – | | | – | | | – | | | 22 | |
| Hong Kong | | | 396 | | | 381 | | | 395 | | | 266 | | | 187 | |
| Rest of Asia-Pacific | | | 89 | | | 131 | | | 231 | | | 138 | | | 68 | |
| North America | | | 4 | | | 3 | | | 7 | | | 9 | | | 2 | |
| South America* | | | 669 | | | 144 | | | 142 | | | 146 | | | 17 | |
| |
| Total troubled debt restructurings | | | 1,199 | | | 659 | | | 775 | | | 559 | | | 296 | |
| |
Accruing loans contractually past due 90 days or more as to principal or interest: | | | | | | | | | | | | | | | | |
| Europe | | | 16 | | | 15 | | | 11 | | | 21 | | | 1 | |
| Hong Kong | | | 193 | | | 98 | | | 76 | | | 84 | | | 121 | |
| Rest of Asia-Pacific | | | 33 | | | 38 | | | 66 | | | 54 | | | 69 | |
| North America | | | 42 | | | 52 | | | 64 | | | 59 | | | 30 | |
| South America* | | | 7 | | | 47 | | | 82 | | | 58 | | | 67 | |
| |
| Total accruing loans contractually past due 90 days or more | | | 291 | | | 250 | | | 299 | | | 276 | | | 288 | |
| |
Total risk elements: | | | | | | | | | | | | | | | | |
| Europe | | | 4,562 | | | 3,704 | | | 3,410 | | | 2,738 | | | 2,386 | |
| Hong Kong | | | 2,313 | | | 2,506 | | | 2,992 | | | 3,483 | | | 2,828 | |
| Rest of Asia-Pacific | | | 2,184 | | | 2,893 | | | 3,377 | | | 3,726 | | | 3,172 | |
| North America | | | 1,819 | | | 729 | | | 756 | | | 669 | | | 631 | |
| South America* | | | 1,152 | | | 735 | | | 934 | | | 784 | | | 480 | |
| |
| Total risk elements | | | 12,030 | | | 10,567 | | | 11,469 | | | 11,400 | | | 9,497 | |
| |
| Provisions for bad and doubtful debts as a % of total risk elements | | | 76.0 | | | 77.4 | | | 71.5 | | | 70.3 | | | 70.1 | |
| |
| | |
| * | Formerly described as Latin America, which included group entities in Panama and Mexico, which are now included in North America. Figures for 1998 to 2001 have been restated to reflect this change. |
At 31 December 2002, there were potential problem loans of US$599 million in respect of exposure to Argentine loans (31 December 2001: US$2,604 million).
131
Back to Contents
HSBC HOLDINGS PLC
Financial Review (continued)
|
Interest forgone on non-performing lendings |
Interest income that would have been recognised under the original terms of the non-accrual, suspended interest and restructured loans amounted to approximately US$617 million in 2002 compared with US$640 million in 2001, US$955 million in 2000, US$946 million in 1999 and US$811 million in 1998. Interest income of approximately US$258 million in 2002 from such loans was recorded in 2002, compared with US$261 million in 2001, US$324 million in 2000, US$328 million in 1999 and US$192 million in 1998.
Non-performing customer loans* and related specific provisions outstanding by geographical segment |
| | | | Non-
performing loans | | | Specific Provisions | | | Non-
performing loans | | | Specific provisions | |
| | |
|
| |
|
| |
|
| |
|
| |
| | | | 2002 | | | 2002 | | | 2001 | | | 2001 | |
| | | | US$m | | | US$m | | | US$m | | | US$m | |
| Europe | | | 4,495 | | | 2,774 | | | 3,682 | | | 2,204 | |
| Hong Kong | | | 1,724 | | | 688 | | | 2,028 | | | 856 | |
| Rest of Asia-Pacific | | | 2,055 | | | 1,321 | | | 2,723 | | | 1,786 | |
| North America | | | 1,773 | | | 1,482 | | | 672 | | | 289 | |
| South America# | | | 476 | | | 341 | | | 544 | | | 365 | |
| | |
|
| |
|
| |
|
| |
|
| |
| | | | 10,523 | | | 6,606 | | | 9,649 | | | 5,500 | |
| | |
|
| |
|
| |
|
| |
|
| |
| | |
| * | net of suspended interest |
| | |
| # | Formerly described as Latin America, which included Group Entities in Panama and Mexico, which are now included in North America, figures for 2001 have been restated to reflect this change. |
| |
| Country distribution of outstandings and cross-border exposures |
HSBC controls the risks associated with cross-border lending, essentially the risk of foreign currency required for payments not being available to local residents, through a central process of internal country limits which are determined by taking into account both economic and political risks. Exposure to individual countries and cross-border exposure in aggregate is kept under continuous review.
The following tables analyse in-country foreign currency and cross-border outstandings by type of borrower to countries which individually represent in excess of 1 per cent of HSBC’s total assets. Classification is based upon the country of residence of the borrower but recognises the transfer of country risk in respect of third party guarantees or residence of the head office where the borrower is a branch. In accordance with the Bank of England Country Exposure Report (Form C1) guidelines, outstandings comprise loans and advances (excluding settlement accounts), amounts receivable under finance leases, acceptances, commercial bills, certificates of deposit and debt and equity securities (net of short positions), and exclude accrued interest and intra-HSBC exposures. Outstandings to counterparties in the United Kingdom, HSBC Holdings’ country of domicile, are not recorded on Form C1 and have not been disclosed below.
| | | | Banks | | | Government and official institutions | | | Other | | | Total | |
| | |
|
| |
|
| |
|
| |
|
| |
31 December 2002 | | | US$bn | | | US$bn | | | US$bn | | | US$bn | |
| | | | | | | | | | | | | | |
| United States | | | 5.6 | | | 9.6 | | | 9.7 | | | 24.9 | |
| Germany | | | 16.9 | | | 2.4 | | | 2.7 | | | 22.0 | |
| France | | | 5.8 | | | 1.7 | | | 5.0 | | | 12.5 | |
| The Netherlands | | | 7.5 | | | 0.4 | | | 4.0 | | | 11.9 | |
| Hong Kong | | | 0.9 | | | 0.7 | | | 9.1 | | | 10.7 | |
| Canada | | | 4.8 | | | 2.9 | | | 2.4 | | | 10.1 | |
| Japan | | | 4.0 | | | 4.1 | | | 1.0 | | | 9.1 | |
| Italy | | | 4.7 | | | 2.2 | | | 1.1 | | | 8.0 | |
| Australia | | | 5.8 | | | 0.5 | | | 1.6 | | | 7.9 | |
| | | | | | | | | | | | | | |
132
Back to Contents
HSBC HOLDINGS PLC
| | | | Banks | | | Government and official institutions | | | Other | | | Total | |
| | |
|
| |
|
| |
|
| |
|
| |
| 31 December 2001 | | | US$bn | | | US$bn | | | US$bn | | | US$bn | |
| | | | | | | | | | | | | | |
| Germany | | | 22.0 | | | 2.1 | | | 2.4 | | | 26.5 | |
| United States | | | 5.1 | | | 9.8 | | | 9.6 | | | 24.5 | |
| France | | | 8.1 | | | 1.5 | | | 4.1 | | | 13.7 | |
| The Netherlands | | | 6.9 | | | 0.3 | | | 3.4 | | | 10.6 | |
| Hong Kong | | | 0.8 | | | 0.7 | | | 9.0 | | | 10.5 | |
| Italy | | | 8.3 | | | 1.5 | | | 0.6 | | | 10.4 | |
| Canada | | | 5.6 | | | 2.2 | | | 1.5 | | | 9.3 | |
| Japan | | | 3.4 | | | 4.4 | | | 0.8 | | | 8.6 | |
| | | | | | | | | | | | | | |
| | | | | | | | | | | | | | |
| | | | Banks | | | Government and official institutions | | | Other | | | Total | |
| | |
|
| |
|
| |
|
| |
|
| |
| 31 December 2000 | | | US$bn | | | US$bn | | | US$bn | | | US$bn | |
| | | | | | | | | | | | | | |
| United States | | | 6.3 | | | 10.3 | | | 6.0 | | | 22.6 | |
| Germany | | | 18.4 | | | 0.9 | | | 1.3 | | | 20.6 | |
| France | | | 10.0 | | | 1.9 | | | 3.8 | | | 15.7 | |
| Italy | | | 7.3 | | | 3.8 | | | 0.7 | | | 11.8 | |
| Hong Kong | | | 1.0 | | | 0.6 | | | 10.0 | | | 11.6 | |
| Canada | | | 7.7 | | | 2.2 | | | 1.4 | | | 11.3 | |
| The Netherlands | | | 7.1 | | | 0.1 | | | 2.1 | | | 9.3 | |
| Japan | | | 4.5 | | | 2.6 | | | 0.5 | | | 7.6 | |
As at 31 December 2002, HSBC had in-country foreign currency and cross-border outstandings to counterparties in Belgium of between 0.75% and 1% of total assets. The aggregate in-country foreign currency and cross-border outstandings were US$5.9 billion.
As at 31 December 2001, HSBC had in-country foreign currency and cross-border outstandings to counterparties in Australia, of between 0.75% and 1% of total assets. The aggregate in-country foreign currency and cross-border outstandings were: US$6.0 billion.
As at 31 December 2000, HSBC had in-country foreign currency and cross-border outstandings to counterparties in Australia and Switzerland of between 0.75% and 1% of total assets. The aggregate in-country foreign currency and cross-border outstandings were: Australia: US$6.5 billion; and Switzerland: US$6.0 billion.
Liquidity relates to the ability of a company to meet its obligations as they fall due. Management of liquidity in HSBC therefore is carried out at local level in individual companies instead of on a consolidated basis because the range of currencies, markets and time zones across which HSBC operates means that resources may not readily be transferred across HSBC to meet liquidity needs.
HSBC requires operating entities to maintain a strong liquidity position and to manage the liquidity structure of their assets, liabilities and commitments so that cash flows are appropriately balanced and all funding obligations are met when due.
It is the responsibility of local management to ensure compliance with local regulatory and Group Executive Committee requirements. Liquidity is managed on a daily basis by local treasury functions, with the larger regional treasury sites providing support to smaller entities where required.
Compliance with liquidity requirements is monitored by local Asset and Liability Policy Committees which report to Group Head Office on a regular basis. This process includes:
| | |
| • | projecting cash flows by major currency and a consideration of the level of liquid assets in relation thereto; |
133
Back to Contents
HSBC HOLDINGS PLC
Financial Review (continued)
|
| | |
| • | maintenance of strong balance sheet liquidity ratios; |
| | |
| • | monitoring of depositor concentration both in terms of the overall funding mix and to avoid undue reliance on large individual depositors; and |
| | |
| • | maintenance of liquidity contingency plans. These plans include the identification of early indicators of liquidity problems and actions which are to be taken to improve the liquidity position at this stage, together with the actions which the entity can take to maintain liquidity in a crisis situation while minimising the long-term impact on its business. |
Current accounts and savings deposits payable on demand or at short notice form a significant part of HSBC’s overall funding. HSBC places considerable importance on the stability of these deposits, which is achieved through HSBC’s diverse geographical retail banking activities and by maintaining depositor confidence in HSBC’s capital strength. Professional markets are accessed for the purposes of providing additional funding, maintaining a presence in local money markets and optimising asset and liability maturities.
HSBC funds itself essentially by raising customer deposits in local markets and makes limited use of wholesale market funding, indeed HSBC is a liquidity provider to financial markets placing significantly more funds with other banks than it borrows.
While consolidated figures are not useful for management purposes, they do provide a broad overview of the nature of HSBC’s liquidity position.
Of total liabilities of US$759 billion, funding from customers amounted to US$495 billion, of which US$485 billion was contractually repayable within one year. However in practice, although many customer accounts are contractually repayable on demand or at short notice, deposit balances remain stable as in the normal course of business deposits and withdrawals will offset each other as long as customers have no doubts that their funds will be available when required. Other liabilities include US$53 billion deposits by banks (US$50 billion repayable within one year), US$22 billion of short positions in securities and US$35 billion of securities in issue. Assets available to meet these liabilities, and to cover outstanding commitments to lend (US$51 billion), include cash, central bank balances, items in course of collection and treasury and other bills (US$31 billion); loans to banks (US$95 billion – including US$92 billion repay able within one year) and loans to customers (US$352 billion – including US$164 billion repayable within one year). A proportion of customer loans contractually repayable within one year will be extended in the normal course of business. In addition, HSBC held US$176 billion of debt securities marketable at a value US$2.0 billion in excess of that carrying value. Of these assets, some US$41 billion of debt securities and treasury and other bills have been pledged to secure liabilities. HSBC’s ability to sell securities together with its access to alternative funding sources such as inter-bank markets or securitisation, would be the routes through which HSBC would meet unexpected outflows in excess of available liquid assets.
| |
| |
| |
Asset, deposits and advances (US$bn) |
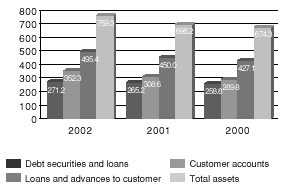
HSBC’s strong liquidity is demonstrated by the surplus of its lending to other banks over its borrowings from banks. As HSBC is a net lender to the inter-bank market, which is much more sensitive than customers to credit ratings, a limited credit rating downgrade of HSBC should not significantly impair its liquidity.
HSBC does not use securitisations as a material source of off-balance-sheet funding for its ongoing businesses.
Other than in respect of its operations in Argentina, HSBC is not aware of any conditions that are reasonably likely to negatively affect the liquidity of individual group companies.
134
Back to Contents
HSBC HOLDINGS PLC
Customer accounts and deposits by banks 2002 |

| |
| |
Customer accounts and deposits by banks 2001 |
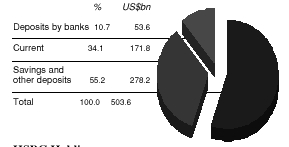
HSBC Holdings’ primary source of cash is dividends from its directly and indirectly held subsidiaries. The ability of these subsidiaries to pay dividends or loan or advance monies to HSBC Holdings depends, among other things, on their respective regulatory capital requirements, statutory reserves, and their financial and operating performance. The diversity of HSBC’s activities means that HSBC Holdings is not dependent on a single source of profits to generate dividends. HSBC Bank and The Hongkong and Shanghai Banking Corporation, which currently provide most of the cash paid up to HSBC Holdings, are themselves diversified banking businesses. HSBC Holdings also periodically issues capital securities and subordinated debt which provides both regulatory capital for HSBC and funding for HSBC Holdings. During 2002, HSBC Holdings issued US$3.4 billion of subordinated debt.
At 31 December 2002, the short term liabilities of HSBC Holdings plc totalled US$5.0 billion, including US$3.1 billion in respect of the proposed second interim dividend for 2002. In practice, shareholders may elect to receive their dividend entitlement in scrip rather than cash so that the full amount of the proposed dividend is not paid out. Short term assets of US$9.3 billion, consisting mainly of cash at bank and money market deposits of US$6.6 billion, and other amounts due from HSBC undertakings (including dividends) of US$1.6 billion, exceeded short term liabilities.
HSBC Holdings actively manages the cash flows from its subsidiaries to maximise the amount of cash held at the holding company and non-trading subsidiary levels and expects to continue to do so in the future. With its accumulated liquid assets, HSBC Holdings believes that dividends from subsidiaries, coupled with debt and equity financing, will enable it to meet anticipated cash obligations.
Market risk is the risk that foreign exchange rates, interest rates or equity and commodity prices will move and result in profits or losses to HSBC. Market risk arises on financial instruments which are valued at current market prices (mark-to-market basis) and those valued at cost plus any accrued interest (accruals basis).
Trading positions are valued on a mark-to-market basis.
In liquid portfolios, market values are determined by reference to independently sourced mid-market prices where it is reasonable to assume the positions could be sold at that price. In those instances where markets are less liquid and/or where positions have been held for extended periods, portfolios are valued by reference to bid or offer prices as appropriate.
In relation to certain products, such as over-the counter derivative instruments, there are no independent prices quoted in the markets. In these circumstances market values are determined by reference to standard industry models, which typically utilise discounted cash flow techniques to derive the market value. The models may be in-house developed or software vendor packages.
In valuing transactions, prices may be amended in respect of those positions considered illiquid, having recognition of the size of the position vis-a-vis the normal market trading volume in that product.
The main valuation sources are securities prices, foreign exchange rates, and interest rate yield curves.
In excess of 95 per cent of HSBC’s derivative transactions are in plain vanilla instruments, primarily comprising interest rate and foreign exchange contracts, where the marked to market values are readily determinable by reference to independent prices and valuation quotes, as described above.
135
Back to Contents
HSBC HOLDINGS PLC
Financial Review (continued)
|
In the limited number of circumstances, where standard industry models are not available, and where there is no directly relevant market quotation, HSBC has developed its own proprietary models for the purposes of performing valuations. Such circumstances normally would be where HSBC has tailored a transaction to meet a specific customer need. The models used are checked by Finance and Operations departments and are subject to audit review on an ongoing basis to ensure that the model assumptions are, and remain, valid over the transaction life which is generally less than five years.
HSBC makes markets in exchange rate and interest rate instruments, as well as in debt, equities and other securities. Trading risks arise either from customer-related business or from position taking.
HSBC manages market risk through risk limits approved by the Group Executive Committee. Traded Markets Development and Risk, an independent unit within the Corporate Investment Banking and Markets operation, develops risk management policies and measurement techniques, and reviews limit utilisation on a daily basis.
Risk limits are determined for each location and, within location, for each portfolio. Limits are set by product and risk type with market liquidity being a principal factor in determining the level of limits set. Only those offices with sufficient derivative product expertise and appropriate control systems are authorised to trade derivative products. Limits are set using a combination of risk measurement techniques, including position limits, sensitivity limits, as well as value at risk (‘VAR’) limits at a portfolio level. Similarly, options risks are controlled through full revaluation limits in conjunction with limits on the underlying variables that determine each option’s value.
VAR is a technique that estimates the potential losses that could occur on risk positions taken due to movements in market rates and prices over a specified time horizon and to a given level of confidence.
HSBC’s VAR, predominantly calculated on a variance/co-variance basis, uses historical movements in market rates and prices, a 99 per cent confidence level, a 10-day holding period and takes account of correlations between different markets and rates within the same risk type and is calculated daily. The movement in market prices is calculated by reference to market data from the last two years. Aggregation of VAR from different risk types is based upon the assumption of independence between risk types.
HSBC’s VAR should be viewed in the context of the limitations of the methodology used. These include:
| | |
| • | the model assumes that changes in risk factors follow a normal distribution. This may not be the case in reality and may lead to an underestimation of the probability of extreme market movements; |
| | |
| • | the use of a 10-day holding period assumes that all positions can be liquidated or hedged in 10 days. This may not fully reflect the market risk arising from times of severe illiquidity, when a 10-day holding period may be insufficient to fully liquidate or hedge all positions; |
| | |
| • | the use of a 99 per cent confidence level does not take account of any losses that might occur beyond this level of confidence; |
| | |
| • | the use of historical data as a proxy for estimating future events may not encompass all potential events, particularly those which are extreme in nature; |
| | |
| • | the assumption of independence between risk types may not always hold and therefore result in VAR not fully capturing market risk where correlation between variables is exhibited; |
| | |
| • | VAR is calculated at the close of business, with intra-day exposures not being subject to intra-day VAR calculations on an HSBC basis; and |
| | |
| • | VAR does not necessarily capture all of the higher order market risks and may underestimate real market risk exposure. |
HSBC recognises these limitations by augmenting the VAR limits with other position and sensitivity limit structures, as well as with stress testing, both on individual portfolios and on a consolidated basis. HSBC’s stress testing regime provides senior management with an assessment of the impact of extreme events on the market risk exposures of HSBC.
136
Back to Contents
HSBC HOLDINGS PLC
| Trading VAR for HSBC for 2002 was: |
| | | | At
31 December
2002
US$m | | | Minimum
during the
year end
2002
US$m | | | Maximum
during the
year end
2002
US$m | | | Average
for the
year end
2002
US$m | | | At 31
December
2001
US$m | |
| Total trading activities | | | 71.6 | | | 66.7 | | | 130.0 | | | 93.9 | | | 122.0 | |
| Foreign exchange trading positions | | | 12.9 | | | 2.4 | | | 47.0 | | | 21.0 | | | 13.3 | |
| Interest rate trading positions | | | 63.2 | | | 60.2 | | | 120.9 | | | 82.4 | | | 111.7 | |
| Equities trading positions | | | 27.1 | | | 20.4 | | | 40.6 | | | 29.0 | | | 45.5 | |
| Trading VAR for HSBC for 2001 was: |
| | | | At 31
Decembe r
2001
US$m | | | Minimum
during
the year
US$m | | | Maximum
during
the year
US$m | | | Average
for the
year
US$m | | | | |
| Total trading activities | | | 122.0 | | | 60.8 | | | 173.4 | | | 102.2 | | | | |
| Foreign exchange trading positions | | | 13.3 | | | 1.8 | | | 50.6 | | | 22.1 | | | | |
| Interest rate trading positions | | | 111.7 | | | 48.1 | | | 160.2 | | | 86.7 | | | | |
| Equities trading positions | | | 45.5 | | | 27.4 | | | 79.6 | | | 41.9 | | | | |
The average daily revenue earned from market risk-related treasury activities in 2002, including accrual book net interest income and funding related to dealing positions, was US$14.6 million, compared with US$13.9 million for 2001. The standard deviation of these daily revenues was US$8.9 million compared with US$7.7 million in 2001. An analysis of the frequency distribution of daily revenues shows that there were 10 days with negative revenues during 2002. The most frequent result was a daily revenue of between US$12 million and US$13 million with 18 occurrences. The highest daily revenue was US$41.5 million.
Daily distribution of market risk revenues in 2002 |

Daily distribution of market risk revenues in 2001 |
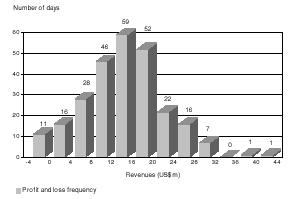
Foreign exchange exposure |
HSBC’s foreign exchange exposures comprise trading exposures and structural foreign currency translation exposure.
Foreign exchange trading exposures comprise those which arise from foreign exchange dealing within Treasury, and currency exposures originated by commercial banking businesses in HSBC. The latter are transferred to local treasury units where they are managed, together with exposures which result from dealing activities, within limits approved by the Group Executive Committee. VAR on foreign exchange trading positions is shown in the table above.
The average one-day foreign exchange revenue in 2002 was US$3.2 million compared with US$3.0 million in 2001.
| Structural currency exposure |
HSBC’s main operations are in the United Kingdom, Hong Kong, France, the United States and Brazil, although it also has operations elsewhere in Europe, the rest of Asia-Pacific, North America and Latin America. The main operating (or functional) currencies in which HSBC’s business is transacted are, therefore, sterling, Hong Kong dollars, euros, US dollars and Brazilian reais.
Since the currency in which HSBC Holdings prepares its consolidated financial statements is US dollars, HSBC’s consolidated balance sheet is affected by movements in the exchange rates between these functional currencies and the US dollar. These currency exposures are referred to as structural currency exposures. Translation gains and losses arising from these exposures are recognised in the statement of total consolidated recognised gains and losses. These exposures are represented by the net asset value of the foreign currency equity and subordinated debt investments in subsidiaries, branches and associated undertakings.
137
Back to Contents
HSBC HOLDINGS PLC
Financial Review (continued)
|
HSBC’s structural foreign currency exposures are managed with the primary objective of ensuring, where practical, that HSBC’s and individual banking subsidiaries’ tier 1 capital ratios are protected from the effect of changes in exchange rates. This is usually achieved by holding qualifying tier 1 capital broadly in proportion to the corresponding foreign-currency-denominated risk-weighted assets at a subsidiary bank level. HSBC considers hedging structural foreign currency exposures only in limited circumstances, to protect the tier 1 capital ratio or the US dollar value of capital invested. Such hedging would be undertaken using forward foreign exchange contracts or by financing with borrowings in the same currencies as the functional currencies involved.
As subsidiaries are generally able to balance adequately foreign currency tier 1 capital with foreign currency risk-weighted assets, HSBC’s foreign currency structural exposures are usually unhedged, including exposures due to foreign-currency-denominated profits arising during the year. Selective hedges were, however, transacted during 2002.
There was no material effect from foreign currency exchange rate movements on HSBC or, outside of Argentina, subsidiary tier 1 capital ratios during the year. The Government of Argentina is still deliberating on compensation for structural losses arising from the pesification of formerly US dollar denominated assets and liabilities that occurred.
Details of HSBC’s structural foreign currency exposures are given in Note 40(d) in the ‘Notes on the Financial Statements’.
HSBC’s interest rate exposures comprise those originating in its treasury trading activities and structural interest rate exposures; both are managed under limits described on page 136. Interest rate risk arises on both trading positions and accrual books.
The average daily revenues earned from treasury-related interest rate activities for 2002 were US$10.7 million compared with US$10.3 million for 2001. The interest rate risk on interest rate trading positions is set out in the trading VAR table on page 137.
| |
| Structural interest rate risk |
Structural interest rate risk arises from the differing repricing characteristics of commercial banking assets and liabilities, including non-interest bearing liabilities such as shareholders’ funds and some current accounts.
Each operating entity assesses the structural interest rate risks which arise in its business and either transfers such risks to its local treasury unit for management or transfers the risks to separate books managed by the local asset and liability management committee (‘ALCO’). The primary objective of such interest rate risk management is to limit potential adverse effects of interest rate movements on net interest income.
Local ALCOs regularly monitor all such interest rate risk positions, subject to interest rate risk limits which are agreed with HSBC Holdings on an annual basis.
Limits are approved at an operating entity level, covering both the quantum of risk that may be established, and the maximum maturity of risk exposures. The limit setting process takes account of the liquidity of the respective currencies with risk exposures concentrated in the period up to five years, and not generally permitted beyond ten years.
In assessing the interest risk position ALCOs take account both of the behavioural characteristics, as well as the contractual terms of any underlying balances. In the cases of assumptions in respect of behavioural characteristics, these must be based on detailed analysis of historical trends and are subject to ratification by a central function within HSBC Holdings.
In the course of managing interest rate risk, quantitative techniques and simulation models are used, where appropriate, to identify and assess the potential net interest income and market value effects of the interest rate position in different interest rate scenarios.
Where considered appropriate, treasury units and ALCO may use a variety of instruments to manage interest rate risk, for example to lengthen or to shorten the duration of the interest risk position. The range of permitted instruments varies by location, but is generally restricted to on-balance sheet financial instruments and plain vanilla interest rate swaps.
138
Back to Contents
HSBC HOLDINGS PLC
In addition, in the second half of 2002, in response to the low level of interest rates in the Asian bloc, ALCO approved the purchase of an interest rate floor to reduce the effect of further interest rate cuts to interest margins. The effect of the floor is included in the sensitivity tables shown below.
Assuming no management action in response to interest rate movements, an immediate hypothetical 100 basis points parallel fall in all yield curves worldwide on 1 January 2003 would decrease planned net interest income for the 12 months to 31 December 2003 by US$690 million while a hypothetical 100 basis points parallel rise in all yield curves would decrease planned net interest income by US$252 million.
Rather than assuming that all interest rates move together, HSBC’s interest rate exposures can be grouped into currency blocs whose interest rates are considered more likely to move together. The sensitivity of net interest income for 2003 can then be described as follows:
| Figures in US$ m | | | US dollar
bloc | | | Sterling
bloc | | | Asian
bloc | | | Latin
American
bloc | | | Euro
bloc | | | Total
2003 | | | Total
2002 | |
| |
| Change in 2003 projected net interest income | | | | | | | | | | | | | | | | | | | | | | |
| +100 basis points shift in yield curves | | | – | | | (47 | ) | | (225 | ) | | 69 | | | (49 | ) | | (252 | ) | | (200 | ) |
| (100 basis points shift in yield curves | | | (243 | ) | | 6 | | | (437 | ) | | (66 | ) | | 50 | | | (690 | ) | | (196 | ) |
The change in HSBC’s sensitivity to a fall of 100 basis points is mainly because further interest rate cuts in the US dollar and Asian blocs at 1 January 2003 would not offer scope to reduce rates on current and savings accounts by as much as the full 100 basis points in view of the already low rates payable on these liabilities, so compressing the margins on these products.
The projections assume that rates of all maturities move by the same amount and, therefore, do not reflect the potential impact on net interest income of some rates changing while others remain unchanged. The projections also make other simplifying assumptions, including an assumption that all positions run to maturity. In practice, these exposures are actively managed.
HSBC’s equities exposure comprises trading equities, forming the basis of VAR, and long-term equity investments. The latter are reviewed annually by the Group Executive Committee and regularly monitored by the subsidiaries’ ALCOs. VAR on equities trading positions is set out in the trading VAR table on page 137.
Operational risk management
|
Operational risk is the risk of loss arising through fraud, unauthorised activities, error, omission, inefficiency, systems failure or from external events. It is inherent to every business organisation and covers a wide spectrum of issues.
HSBC manages this risk through a controls-based environment in which processes are documented, authorisation is independent and where transactions are reconciled and monitored. This is supported by an independent programme of periodic reviews undertaken by internal audit and internal peer benchmarking studies which ensure that HSBC stays in line with best practice and takes account of lessons learned from publicised operational failures within the financial services industry. With effect from the beginning of 2001, operational risk losses are formally monitored quarterly. In each of HSBC’s subsidiaries local management is responsible for establishing an effective and efficient operational control environment in accordance with HSBC standards so that HSBC’s assets are adequately protected, and whereby the operational risks have been identified and adequate risk management procedures maintained to control those risks.
HSBC maintains and tests contingency facilities to support operations in the event of disasters. Additional reviews and tests were conducted following the terrorist events of 11 September 2001 to incorporate lessons learned in the operational recovery from those circumstances. Insurance cover is arranged to mitigate potential losses associated with certain operational risk events.
139
Back to Contents
HSBC HOLDINGS PLC
Financial Review (continued)
|
Capital management and allocation
|
Capital measurement and allocation
The Financial Services Authority (‘FSA’) is the supervisor of HSBC on a consolidated basis and, in this capacity, receives information on the capital adequacy of, and sets capital requirements for, HSBC as a whole. Individual banking subsidiaries are directly regulated by the appropriate local banking supervisors, which set and monitor capital adequacy requirements for them. Similarly, non-banking subsidiaries may be subject to supervision and capital requirements of relevant local regulatory authorities. Since 1988, when the governors of the Group of Ten central banks agreed to guidelines for the international convergence of capital measurement and standards, the banking supervisors of HSBC’s major banking subsidiaries have exercised capital adequacy supervision in a broadly similar framework.
Under the European Union’s Banking Consolidation Directive, the FSA requires each bank and banking group to maintain an individually prescribed ratio of total capital to risk-weighted assets. The method the FSA uses to assess the capital adequacy of banks and banking groups has been modified as a result of its implementation of the European Union’s Amending Directive (Directive 98/31/EC) to the Capital Adequacy Directive (‘CAD2’). This modification allows banks to calculate capital requirements for market risk in the trading book using VAR techniques.
Capital adequacy is measured by the ratio of HSBC’s capital to risk-weighted assets, taking into account both balance sheet assets and off-balance-sheet transactions.
HSBC’s capital is divided into two tiers: tier 1, comprising shareholders’ funds excluding revaluation reserves, innovative tier 1 securities and minority interests in tier 1 capital; and tier 2, comprising general loan loss provisions, property revaluation reserves, qualifying subordinated loan capital and minority and other interests in tier 2 capital. The amount of qualifying tier 2 capital cannot exceed that of tier 1 capital, and term subordinated loan capital may not exceed 50 per cent of tier 1 capital. There are also limitations on the amount of general provisions which may be included in tier 2 capital. Deductions in respect of goodwill and intangible assets are made from tier 1 capital, and in respect of unconsolidated investments, investments in the capital of banks and other regulatory deductions are made from total capital.
Under CAD2, banking operations are categorised as either trading book (broadly, marked-to-market activities) or banking book (all other activities) and risk-weighted assets are determined accordingly. Banking book risk-weighted assets are measured by means of a hierarchy of risk weightings classified according to the nature of each asset and counterparty, taking into account any eligible collateral or guarantees. Banking book off-balance-sheet items giving rise to credit, foreign exchange or interest rate risk are assigned weights appropriate to the category of the counterparty, taking into account any eligible collateral or guarantees. Trading book risk-weighted assets are determined by taking into account market-related risks, such as foreign exchange, interest rate and equity position risks, as well as counterparty risk.
It is HSBC’s policy to maintain a strong capital base to support the development of HSBC’s business. HSBC seeks to maintain a prudent balance between the different components of its capital and, in HSBC Holdings, between the composition of its capital and that of its investment in subsidiaries. This is achieved by each subsidiary managing its own capital within the context of an approved annual plan which determines the optimal amount and mix of capital to support planned business growth and to meet local regulatory capital requirements. Capital generated in excess of planned requirements is paid up to HSBC Holdings normally by way of dividends and represents a source of strength for HSBC.
It is HSBC policy that HSBC Holdings is primarily a provider of equity capital to its subsidiaries with such equity investment substantially funded by HSBC Holdings own equity issuance and profit retentions. Non-equity tier 1 and subordinated debt requirements of major subsidiaries are normally met by their own market issuance within HSBC guidelines regarding market and investor concentration, cost, market conditions, timing and the effect on the components and maturity profile of HSBC capital. Subordinated debt requirements of other HSBC companies are provided internally.
HSBC recognises the impact on shareholder returns of the level of equity capital employed within HSBC and seeks to maintain a prudent balance between the advantages and flexibility afforded by a strong capital position and the higher returns on equity possible with greater leverage. In the current environment HSBC uses a benchmark tier 1 capital ratio of 8 per cent in considering its long term capital planning.
140
Back to Contents
HSBC HOLDINGS PLC
Source and application of tier 1 capital |
| | | | 2002
US$m | | | 2001
US$m | |
| |
Movement of tier 1 capital | | | | | | | |
| Opening tier 1 capital | | | 35,073 | | | 34,620 | |
| Attributable profits | | | 6,239 | | | 5,406 | |
| add back: goodwill amortisation | | | 863 | | | 807 | |
| Dividends | | | (5,001 | ) | | (4,467 | ) |
| add back: shares issued in lieu of dividends | | | 1,023 | | | 866 | |
| Other movement in goodwill deducted | | | (3,729 | ) | | (199 | ) |
| Shares issued | | | 338 | | | 112 | |
| Redemption of preference shares | | | (50 | ) | | (825 | ) |
| Other (including exchange movements) | | | 4,193 | | | (1,247 | ) |
| | |
|
| |
|
| |
| Closing tier 1 capital | | | 38,949 | | | 35,073 | |
| | |
|
| |
|
| |
Movement in risk-weighted assets | | | | | | | |
| Opening risk-weighted assets | | | 391,478 | | | 383,687 | |
| Movements | | | 39,073 | | | 7,791 | |
| | |
|
| |
|
| |
| Closing risk-weighted assets | | | 430,551 | | | 391,478 | |
| | |
|
| |
|
| |
The table below sets out the analysis of regulatory capital at the end of 2002 and 2001.
| | | | 2002
US$m | | | 2001
US$m | |
| |
| Composition of capital | | | | | | | |
| Tier 1: | | | | | | | |
| Shareholders’ funds | | | 52,406 | | | 45,979 | |
| Minority interests | | | 3,306 | | | 3,515 | |
| Innovative tier 1 securities | | | 3,647 | | | 3,467 | |
| Less : | property revaluation reserves | | | (1,954 | ) | | (2,271 | ) |
| goodwill capitalised and intangible assets | | | (17,855 | ) | | (14,989 | ) |
| own shares held* | | | (601 | ) | | (628 | ) |
| |
| Total qualifying tier 1 capital | | | 38,949 | | | 35,073 | |
| |
| Tier 2: | | | | | | | |
| Property revaluation reserves | | | 1,954 | | | 2,271 | |
| General provisions | | | 2,348 | | | 2,091 | |
| Perpetual subordinated debt | | | 3,542 | | | 3,338 | |
| Term subordinated debt | | | 12,875 | | | 9,912 | |
| Minority and other interests in tier 2 capital | | | 775 | | | 693 | |
| |
| Total qualifying tier 2 capital | | | 21,494 | | | 18,305 | |
| |
| Unconsolidated investments | | | (2,231 | ) | | (1,781 | ) |
| Investments in other banks | | | (638 | ) | | (627 | ) |
| Other deductions | | | (144 | ) | | (116 | ) |
| |
| Total capital | | | 57,430 | | | 50,854 | |
| |
| Total risk-weighted assets | | | 430,551 | | | 391,478 | |
| Capital ratios (per cent): | | | | | | | |
| Total capital | | | 13.3 | | | 13.0 | |
| Tier 1 capital | | | 9.0 | | | 9.0 | |
| * | This principally reflects shares held in trust available to fulfil HSBC’s obligations under employee share option plans. |
141
Back to Contents
HSBC HOLDINGS PLC
Financial Review (continued)
|
The above figures were computed in accordance with the EU Banking Consolidation Directive. The comparative figures for 31 December 2001 have not been restated for the impact of FRS19, details of which are set out in Note 1 on pages 195 to 197.
Tier 1 capital increased by US$3.9 billion. Retained profits on a cash basis (excluding goodwill amortisation) contributed US$2.1 billion and shares issued through options and scrip dividends contributed US$1.4 billion. Exchange movements on reserves also contributed US$3.7 billion to this increase. The acquisition of Grupo Financiero Bital and currency translation differences contributed US$1.9 billion and US$1.7 billion to the increase in goodwill and intangible assets deducted from tier 1 capital.
The increase of US$3.2 billion in tier 2 capital mainly reflects the proceeds of capital issues, net of redemption and regulatory amortisation.
Total risk-weighted assets increased by US$39 billion. The acquisition of GFBital contributed US$8 billion to this increase. The remaining increase was largely due to currency translation differences together with the effect of growth in the loan book.
Risk-weighted assets by principal subsidiary |
In order to give an indication as to how HSBC’s capital is deployed, the table below analyses the disposition of risk-weighted assets by principal subsidiary. The risk-weighted assets are calculated using FSA rules and exclude intra-HSBC items.
| | | | 2002
US$m | | | 2001
US$m | |
| |
| Hang Seng Bank Limited | | | 32,350 | | | 31,992 | |
| The Hongkong and Shanghai Banking Corporation Limited and other subsidiaries | | | 87,932 | | | 80,492 | |
| The Hongkong and Shanghai Banking Corporation Limited and subsidiaries | | | 120,282 | | | 112,484 | |
| HSBC Bank plc (excluding CCF and HSBC Private Banking Holdings (Suisse) S.A.) | | | 138,206 | | | 113,643 | |
| HSBC Private Banking Holdings (Suisse) S.A.* | | | 20,374 | | | 14,611 | |
| CCF | | | 40,399 | | | 35,706 | |
| HSBC Bank plc | | | 198,979 | | | 163,960 | |
| HSBC USA Inc | | | 54,576 | | | 53,945 | |
| HSBC Bank Middle East | | | 6,573 | | | 5,699 | |
| HSBC Bank Malaysia Berhad | | | 4,713 | | | 4,215 | |
| HSBC Bank Canada | | | 15,499 | | | 14,400 | |
| GFBital | | | 7,853 | | | – | |
| HSBC South American operations | | | 4,865 | | | 8,044 | |
| HSBC Holdings sub-group | | | 554 | | | 966 | |
| Other | | | 16,657 | | | 27,765 | |
| |
| HSBC risk-weighted assets | | | 430,551 | | | 391,478 | |
| |
142
Back to Contents
HSBC HOLDINGS PLC
| |
Loan maturity and interest sensitivity analysis
|
There follows a geographic analysis of loan maturity and interest sensitivity by loan type on a contractual repayment basis as at 31 December 2002. All amounts are net of suspended interest.
| | | | Europe | | | Hong Kong | | | Rest of
Asia-Pacific | | | North America | | | South America | | | Total | |
| | |
|
| |
|
| |
|
| |
|
| |
|
| |
|
| |
| | | | US$m | | | US$m | | | US$m | | | US$m | | | US$m | | | US$m | |
Maturity of 1 year or less | | | | | | | | | | | | | | | | | | | |
| Loans and advances to banks* | | | 38,089 | | | 33,352 | | | 10,301 | | | 8,866 | | | 1,665 | | | 92,273 | |
| | |
|
| |
|
| |
|
| |
|
| |
|
| |
|
| |
| Commercial loans to customers | | | | | | | | | | | | | | | | | | | |
| – Commercial, industrial and international trade | | | 25,845 | | | 7,365 | | | 10,422 | | | 7,142 | | | 911 | | | 51,685 | |
| – Real estate and other property related | | | 6,691 | | | 4,030 | | | 2,333 | | | 4,209 | | | 58 | | | 17,321 | |
| – Non-bank financial institutions | | | 13,512 | | | 1,372 | | | 828 | | | 8,653 | | | 41 | | | 24,406 | |
| – Governments | | | 322 | | | 280 | | | 489 | | | 848 | | | 11 | | | 1,950 | |
| – Other commercial | | | 15,013 | | | 1,918 | | | 4,028 | | | 8,525 | | | 384 | | | 29,868 | |
| | |
|
| |
|
| |
|
| |
|
| |
|
| |
|
| |
| | | | 61,383 | | | 14,965 | | | 18,100 | | | 29,377 | | | 1,405 | | | 125,230 | |
Hong Kong SAR Government Home
Ownership Scheme | | | – | | | 742 | | | – | | | – | | | – | | | 742 | |
| Residential mortgages and other personal loans | | | 15,918 | | | 8,695 | | | 5,042 | | | 7,509 | | | 965 | | | 38,129 | |
| | |
|
| |
|
| |
|
| |
|
| |
|
| |
|
| |
| Loans and advances to customers | | | 77,301 | | | 24,402 | | | 23,142 | | | 36,886 | | | 2,370 | | | 164,101 | |
| | |
|
| |
|
| |
|
| |
|
| |
|
| |
|
| |
| Total loans maturing in one year or less | | | 115,390 | | | 57,754 | | | 33,443 | | | 45,752 | | | 4,035 | | | 256,374 | |
| | |
|
| |
|
| |
|
| |
|
| |
|
| |
|
| |
Maturity after 1 year but within 5 years | | | | | | | | | | | | | | | | | | | |
| Loans and advances to banks | | | 883 | | | 7 | | | 251 | | | 70 | | | – | | | 1,211 | |
| | |
|
| |
|
| |
|
| |
|
| |
|
| |
|
| |
| Commercial loans to customers | | | | | | | | | | | | | | | | | | | |
| – Commercial, industrial and international | | | 12,464 | | | 2,575 | | | 1,826 | | | 2,992 | | | 113 | | | 19,970 | |
| – Real estates and other property related | | | 5,621 | | | 7,617 | | | 1,961 | | | 3,840 | | | 8 | | | 19,047 | |
| – Non-bank financial institutions | | | 1,085 | | | 656 | | | 86 | | | 393 | | | 6 | | | 2,226 | |
| – Governments | | | 816 | | | 436 | | | 289 | | | 1,987 | | | 135 | | | 3,663 | |
| – Other commercial | | | 5,812 | | | 3,400 | | | 1,635 | | | 1,152 | | | 111 | | | 12,110 | |
| | |
|
| |
|
| |
|
| |
|
| |
|
| |
|
| |
| | | | 25,798 | | | 14,684 | | | 5,797 | | | 10,364 | | | 373 | | | 57,016 | |
| Hong Kong SAR Government Home Ownership Scheme | | | – | | | 2,331 | | | – | | | – | | | – | | | 2,331 | |
| Residential mortgages and other personal loans | | | 16,470 | | | 7,594 | | | 3,280 | | | 10,165 | | | 212 | | | 37,721 | |
| | |
|
| |
|
| |
|
| |
|
| |
|
| |
|
| |
| Loans and advances to customers | | | 42,268 | | | 24,609 | | | 9,077 | | | 20,529 | | | 585 | | | 97,068 | |
| | |
|
| |
|
| |
|
| |
|
| |
|
| |
|
| |
| Total loans maturing after 1 year but within 5 years | | | 43,151 | | | 24,616 | | | 9,328 | | | 20,599 | | | 585 | | | 98,279 | |
| | |
|
| |
|
| |
|
| |
|
| |
|
| |
|
| |
| * | Excludes sight balances with central banks |
143
Back to Contents
HSBC HOLDINGS PLC
Other information (continued)
|
| | | | Europe | | | Hong Kong | | | Rest of
Asia-Pacific | | | North America | | | South America | | | Total | |
| | |
|
| |
|
| |
|
| |
|
| |
|
| |
|
| |
| | | | US$m | | | US$m | | | US$m | | | US$m | | | US$m | | | US$m | |
Maturity after 1 year but within 5 years (continued) | | | | | | | | | | | | | | | | | | | |
| Interest rate sensitivity of loans and advances to banks and commercial loans to customers: | | | | | | | | | | | | | | | | | | | |
| – Fixed interest rate | | | 6,016 | | | 80 | | | 3,292 | | | 2,971 | | | 68 | | | 12,427 | |
| – Variable interest rate | | | 20,663 | | | 14,611 | | | 2,756 | | | 7,462 | | | 305 | | | 45,797 | |
| | |
|
| |
|
| |
|
| |
|
| |
|
| |
|
| |
| Total | | | 26,679 | | | 14,691 | | | 6,048 | | | 10,433 | | | 373 | | | 58,224 | |
| | |
|
| |
|
| |
|
| |
|
| |
|
| |
|
| |
Maturity after 5 years | | | | | | | | | | | | | | | | | | | |
| Loans and advances to banks | | | 425 | | | – | | | 157 | | | 1,453 | | | – | | | 2,035 | |
| | |
|
| |
|
| |
|
| |
|
| |
|
| |
|
| |
| Commercial loans to customers | | | | | | | | | | | | | | | | | | | |
| – Commercial, industrial and international trade | | | 6,061 | | | 184 | | | 235 | | | 635 | | | 28 | | | 7,143 | |
| – Real estate and other property related | | | 3,533 | | | 1,472 | | | 413 | | | 2,764 | | | 3 | | | 8,185 | |
| – Non-bank financial institutions | | | 612 | | | 25 | | | 16 | | | 185 | | | 1 | | | 839 | |
| – Governments | | | 1,024 | | | 3 | | | 155 | | | 1,740 | | | 416 | | | 3,338 | |
| – Other commercial | | | 4,486 | | | 1,622 | | | 458 | | | 381 | | | 25 | | | 6,972 | |
| | |
|
| |
|
| |
|
| |
|
| |
|
| |
|
| |
| | | | 15,716 | | | 3,306 | | | 1,277 | | | 5,705 | | | 473 | | | 26,477 | |
| Hong Kong SAR Government Home Ownership Scheme | | | – | | | 4,181 | | | – | | | – | | | – | | | 4,181 | |
| Residential mortgages and other personal loans | | | 33,061 | | | 14,601 | | | 5,071 | | | 16,826 | | | 75 | | | 69,634 | |
| | |
|
| |
|
| |
|
| |
|
| |
|
| |
|
| |
| Loans and advances to customers | | | 48,777 | | | 22,088 | | | 6,348 | | | 22,531 | | | 548 | | | 100,292 | |
| | |
|
| |
|
| |
|
| |
|
| |
|
| |
|
| |
| Total loans maturing after 5 years | | | 49,202 | | | 22,088 | | | 6,505 | | | 23,984 | | | 548 | | | 102,327 | |
| | |
|
| |
|
| |
|
| |
|
| |
|
| |
|
| |
| Interest rate sensitivity of loans and advances to banks and commercial loans to customers: | | | | | | | | | | | | | | | | | | | |
| – Fixed interest rate | | | 4,209 | | | 31 | | | 663 | | | 1,609 | | | 23 | | | 6,535 | |
| – Variable interest rate | | | 11,932 | | | 3,274 | | | 769 | | | 5,548 | | | 450 | | | 21,973 | |
| | |
|
| |
|
| |
|
| |
|
| |
|
| |
|
| |
| Total | | | 16,141 | | | 3,305 | | | 1,432 | | | 7,157 | | | 473 | | | 28,508 | |
| | |
|
| |
|
| |
|
| |
|
| |
|
| |
|
| |
144
Back to Contents
HSBC HOLDINGS PLC
The following table analyses the average amount of bank and customer deposits and certificates of deposit (‘CDs’) and other money market instruments (which are included within ‘debt securities in issue’ in the balance sheet) together with the average interest rates paid thereon for each of the past three years. The geographical analysis of average deposits is based on the location of the office in which the deposits are recorded and excludes balances with HSBC companies. The ‘Other’ category includes securities sold under agreements to repurchase.
| | | Year ended 31 December | |
| | | 2002
| | 2001
| | 2000
| |
| | | | Average
Balance | | | Average
Rate | | | Average
balance | | | Average
rate | | | Average
balance | | | Average
rate | |
| | |
|
| |
|
| |
|
| |
|
| |
|
| |
|
| |
| | | | US$m | | | % | | | US$m | | | % | | | US$m | | | % | |
Deposits by banks | | | | | | | | | | | | | | | | | | | |
Europe | | | | | | | | | | | | | | | | | | | |
| Demand and other – non-interest bearing | | | 7,626 | | | – | | | 8,184 | | | – | | | 3,842 | | | – | |
| Demand – interest bearing | | | 5,282 | | | 3.0 | | | 5,130 | | | 3.4 | | | 6,402 | | | 4.5 | |
| Time | | | 19,053 | | | 2.0 | | | 20,672 | | | 5.5 | | | 14,981 | | | 5.9 | |
| Other | | | 12,113 | | | 3.0 | | | 10,437 | | | 3.9 | | | 8,895 | | | 4.3 | |
| | |
| | | | |
| | | | |
| | | | |
| Total | | | 44,074 | | | | | | 44,423 | | | | | | 34,120 | | | | |
| | |
| | | | |
| | | | |
| | | | |
Hong Kong | | | | | | | | | | | | | | | | | | | |
| Demand and other – non-interest bearing | | | 1,011 | | | – | | | 1,085 | | | – | | | 945 | | | – | |
| Demand – interest bearing | | | 1,910 | | | 1.6 | | | 1,740 | | | 3.6 | | | 1,581 | | | 5.7 | |
| Time | | | 321 | | | 2.0 | | | 495 | | | 4.1 | | | 1,075 | | | 6.4 | |
| Other | | | 39 | | | 7.0 | | | 43 | | | 3.2 | | | 12 | | | 9.8 | |
| | |
| | | | |
| | | | |
| | | | |
| Total | | | 3,281 | | | | | | 3,363 | | | | | | 3,613 | | | | |
| | |
| | | | |
| | | | |
| | | | |
Rest of Asia-Pacific | | | | | | | | | | | | | | | | | | | |
| Demand and other – non-interest bearing | | | 898 | | | – | | | 596 | | | – | | | 692 | | | – | |
| Demand – interest bearing | | | 663 | | | 2.4 | | | 600 | | | 4.4 | | | 525 | | | 4.0 | |
| Time | | | 2,804 | | | 4.4 | | | 2,820 | | | 5.7 | | | 2,485 | | | 6.7 | |
| Other | | | 786 | | | 4.6 | | | 556 | | | 4.3 | | | 252 | | | 5.6 | |
| | |
| | | | |
| | | | |
| | | | |
| Total | | | 5,151 | | | | | | 4,572 | | | | | | 3,954 | | | | |
| | |
| | | | |
| | | | |
| | | | |
North America | | | | | | | | | | | | | | | | | | | |
| Demand and other – non-interest bearing | | | 1,271 | | | – | | | 1,447 | | | – | | | 725 | | | – | |
| Demand – interest bearing | | | 3,566 | | | 1.0 | | | 2,962 | | | 2.5 | | | 2,323 | | | 3.4 | |
| Time | | | 2,205 | | | 2.4 | | | 1,876 | | | 3.9 | | | 1,319 | | | 6.3 | |
| Other | | | 3,488 | | | 1.7 | | | 4,015 | | | 3.4 | | | 2,984 | | | 4.8 | |
| | |
| | | | |
| | | | |
| | | | |
| Total | | | 10,530 | | | | | | 10,300 | | | | | | 7,351 | | | | |
| | |
| | | | |
| | | | |
| | | | |
South America | | | | | | | | | | | | | | | | | | | |
| Demand and other – non-interest bearing | | | 19 | | | – | | | 149 | | | – | | | 197 | | | – | |
| Demand – interest bearing | | | 385 | | | 29.4 | | | 916 | | | 10.8 | | | 810 | | | 12.1 | |
| Time | | | 296 | | | 5.2 | | | 712 | | | 4.1 | | | 418 | | | 5.0 | |
| Other | | | 180 | | | 15.0 | | | 221 | | | 13.3 | | | 181 | | | 13.6 | |
| | |
| | | | |
| | | | |
| | | | |
Total | | | 880 | | | | | | 1,998 | | | | | | 1,606 | | | | |
| | |
| | | | |
| | | | |
| | | | |
| Total | | | | | | | | | | | | | | | | | | | |
| Demand and other – non-interest bearing | | | 10,825 | | | – | | | 11,461 | | | – | | | 6,401 | | | – | |
| Demand – interest bearing | | | 11,806 | | | 3.0 | | | 11,348 | | | 3.9 | | | 11,641 | | | 4.9 | |
| Time | | | 24,679 | | | 2.3 | | | 26,575 | | | 5.4 | | | 20,278 | | | 6.0 | |
| Other | | | 16,606 | | | 2.9 | | | 15,272 | | | 3.9 | | | 12,324 | | | 4.6 | |
| | |
| | | | |
| | | | |
| | | | |
| Total | | | 63,916 | | | | | | 64,656 | | | | | | 50,644 | | | | |
| | |
| | | | |
| | | | |
| | | | |
145
Back to Contents
HSBC HOLDINGS PLC
Other information (continued)
|
| | | Year ended 31 December | |
| | | 2002
| | 2001
| | 2000
| |
| | | | Average
Balance | | | Average
Rate | | | Average
balance | | | Average
rate | | | Average
balance | | | Average
rate | |
| | |
|
| |
|
| |
|
| |
|
| |
|
| |
|
| |
| | | | US$m | | | % | | | US$m | | | % | | | US$m | | | % | |
Customer accounts | | | | | | | | | | | | | | | | | | | |
Europe | | | | | | | | | | | | | | | | | | | |
| Demand and other – non-interest bearing | | | 29,109 | | | – | | | 26,084 | | | – | | | 19,521 | | | – | |
| Demand – interest bearing | | | 77,835 | | | 2.0 | | | 62,475 | | | 3.0 | | | 55,269 | | | 3.6 | |
| Savings | | | 23,587 | | | 2.9 | | | 24,305 | | | 4.5 | | | 21,204 | | | 5.7 | |
| Time | | | 44,745 | | | 2.7 | | | 43,637 | | | 4.8 | | | 45,587 | | | 5.9 | |
| Other | | | 6,621 | | | 6.4 | | | 5,177 | | | 8.6 | | | 1,440 | | | 5.6 | |
| | |
| | | | |
| | | | |
| | | | |
| Total | | | 181,897 | | | | | | 161,678 | | | | | | 143,021 | | | | |
| | |
| | | | |
| | | | |
| | | | |
Hong Kong | | | | | | | | | | | | | | | | | | | |
| Demand and other – non-interest bearing | | | 6,743 | | | – | | | 5,804 | | | – | | | 5,465 | | | – | |
| Demand – interest bearing | | | 62,922 | | | 0.3 | | | 53,470 | | | 2.0 | | | 46,208 | | | 4.2 | |
| Savings | | | 65,914 | | | 1.2 | | | 76,277 | | | 3.3 | | | 76,503 | | | 5.2 | |
| Time | | | 8,630 | | | 1.9 | | | 8,361 | | | 3.8 | | | 6,477 | | | 5.8 | |
| Other | | | 413 | | | 1.2 | | | 434 | | | 4.5 | | | 353 | | | 7.0 | |
| | |
| | | | |
| | | | |
| | | | |
| Total | | | 144,622 | | | | | | 144,346 | | | | | | 135,006 | | | | |
| | |
| | | | |
| | | | |
| | | | |
Rest of Asia-Pacific | | | | | | | | | | | | | | | | | | | |
| Demand and other – non-interest bearing | | | 4,913 | | | – | | | 4,328 | | | – | | | 4,301 | | | – | |
| Demand – interest bearing | | | 13,903 | | | 1.3 | | | 10,930 | | | 2.1 | | | 8,749 | | | 3.0 | |
| Savings | | | 23,711 | | | 3.1 | | | 22,023 | | | 4.5 | | | 20,128 | | | 5.3 | |
| Time | | | 5,508 | | | 2.0 | | | 6,006 | | | 4.3 | | | 7,141 | | | 5.6 | |
| Other | | | 1,338 | | | 2.3 | | | 1,008 | | | 2.9 | | | 775 | | | 4.8 | |
| | |
| | | | |
| | | | |
| | | | |
| Total | | | 49,373 | | | | | | 44,295 | | | | | | 41,094 | | | | |
| | |
| | | | |
| | | | |
| | | | |
North America | | | | | | | | | | | | | | | | | | | |
| Demand and other – non-interest bearing | | | 14,412 | | | – | | | 14,209 | | | – | | | 8,000 | | | – | |
| Demand – interest bearing | | | 7,088 | | | 1.7 | | | 5,380 | | | 4.1 | | | 3,802 | | | 5.4 | |
| Savings | | | 44,913 | | | 1.4 | | | 43,181 | | | 3.2 | | | 39,059 | | | 3.9 | |
| Time | | | 6,266 | | | 4.9 | | | 7,396 | | | 5.2 | | | 7,989 | | | 7.5 | |
| Other | | | 10,219 | | | 2.3 | | | 11,752 | | | 3.8 | | | 8,818 | | | 5.6 | |
| | |
| | | | |
| | | | |
| | | | |
| Total | | | 82,898 | | | | | | 81,918 | | | | | | 67,668 | | | | |
| | |
| | | | |
| | | | |
| | | | |
South America | | | | | | | | | | | | | | | | | | | |
| Demand and other – non-interest bearing | | | 1,038 | | | – | | | 1,212 | | | – | | | 1,018 | | | – | |
| Demand – interest bearing | | | 606 | | | 21.7 | | | 1,577 | | | 14.4 | | | 895 | | | 16.2 | |
| Savings | | | 3,438 | | | 17.1 | | | 5,315 | | | 11.4 | | | 6,039 | | | 9.7 | |
| Time | | | 11 | | | 4.2 | | | 316 | | | 3.5 | | | 212 | | | 9.8 | |
| Other | | | 255 | | | 4.8 | | | 345 | | | 3.7 | | | 379 | | | 6.7 | |
| | |
| | | | |
| | | | |
| | | | |
| Total | | | 5,348 | | | | | | 8,765 | | | | | | 8,543 | | | | |
| | |
| | | | |
| | | | |
| | | | |
Total | | | | | | | | | | | | | | | | | | | |
| Demand and other – non-interest bearing | | | 56,215 | | | – | | | 51,637 | | | – | | | 38,305 | | | – | |
| Demand – interest bearing | | | 162,354 | | | 1.4 | | | 133,832 | | | 2.7 | | | 114,923 | | | 4.0 | |
| Savings | | | 161,563 | | | 2.1 | | | 171,101 | | | 3.9 | | | 162,933 | | | 5.2 | |
| Time | | | 65,160 | | | 2.8 | | | 65,716 | | | 4.7 | | | 67,406 | | | 6.1 | |
| Other | | | 18,846 | | | 3.8 | | | 18,716 | | | 5.1 | | | 11,765 | | | 5.7 | |
| | |
| | | | |
| | | | |
| | | | |
| Total | | | 464,138 | | | | | | 441,002 | | | | | | 395,332 | | | | |
| | |
| | | | |
| | | | |
| | | | |
CDs and other money market instruments | | | | | | | | | | | | | | | | | | | |
| Europe | | | 6,958 | | | 4.1 | | | 6,828 | | | 4.8 | | | 3,821 | | | 6.5 | |
| Hong Kong | | | 7,546 | | | 4.0 | | | 5,902 | | | 5.1 | | | 6,163 | | | 6.4 | |
| Rest of Asia-Pacific | | | 2,418 | | | 4.3 | | | 1,653 | | | 5.4 | | | 1,890 | | | 5.8 | |
| North America | | | 4,838 | | | 3.0 | | | 4,393 | | | 5.5 | | | 3,885 | | | 4.4 | |
| South America | | | 165 | | | 13.8 | | | 350 | | | 12.9 | | | 200 | | | 10.4 | |
| | |
|
| |
|
| |
|
| |
|
| |
|
| |
|
| |
| Total | | | 21,925 | | | 3.9 | | | 19,126 | | | 5.0 | | | 15,959 | | | 5.9 | |
| | |
|
| |
|
| |
|
| |
|
| |
|
| |
|
| |
146
Back to Contents
HSBC HOLDINGS PLC
Certificates of deposit and other time deposits
|
At 31 December 2002 the maturity analysis of certificates of deposit and other wholesale time deposits, by remaining maturity, was as follows:
| | | | 3 months or less | | | After 3 months but within 6 months | | | After 6 months but within 12 months | | | After 12 months | | | Total | |
| | |
|
| |
|
| |
|
| |
|
| |
|
| |
| | | | US$m | | | US$m | | | US$m | | | US$m | | | US$m | |
Europe | | | | | | | | | | | | | | | | |
| Certificates of deposit | | | 3,792 | | | 96 | | | 12 | | | 4 | | | 3,904 | |
| Time deposits: | | | | | | | | | | | | | | | | |
| – banks | | | 13,116 | | | 765 | | | 1,634 | | | 1,665 | | | 17,180 | |
| – customers | | | 35,159 | | | 1,941 | | | 1,027 | | | 4,279 | | | 42,406 | |
| | |
|
| |
|
| |
|
| |
|
| |
|
| |
| Total | | | 52,067 | | | 2,802 | | | 2,673 | | | 5,948 | | | 63,490 | |
| | |
|
| |
|
| |
|
| |
|
| |
|
| |
Hong Kong | | | | | | | | | | | | | | | | |
| Certificates of deposit | | | 547 | | | 770 | | | 1,155 | | | 5,738 | | | 8,210 | |
| Time deposits: | | | | | | | | | | | | | | | | |
| – banks | | | 172 | | | – | | | – | | | 5 | | | 177 | |
| – customers | | | 8,505 | | | 229 | | | 78 | | | 170 | | | 8,982 | |
| | |
|
| |
|
| |
|
| |
|
| |
|
| |
| Total | | | 9,224 | | | 999 | | | 1,233 | | | 5,913 | | | 17,369 | |
| | |
|
| |
|
| |
|
| |
|
| |
|
| |
Rest of Asia-Pacific | | | | | | | | | | | | | | | | |
| Certificates of deposit | | | 1,806 | | | 174 | | | 61 | | | 133 | | | 2,174 | |
| Time deposits: | | | | | | | | | | | | | | | | |
| – banks | | | 2,412 | | | 227 | | | 262 | | | 474 | | | 3,375 | |
| – customers | | | 5,180 | | | 67 | | | 158 | | | 221 | | | 5,626 | |
| | |
|
| |
|
| |
|
| |
|
| |
|
| |
| Total | | | 9,398 | | | 468 | | | 481 | | | 828 | | | 11,175 | |
| | |
|
| |
|
| |
|
| |
|
| |
|
| |
North America | | | | | | | | | | | | | | | | |
| Certificates of deposit | | | 3,474 | | | 35 | | | 23 | | | – | | | 3,532 | |
| Time deposits: | | | | | | | | | | | | | | | | |
| – banks | | | 2,654 | | | 405 | | | 192 | | | 370 | | | 3,621 | |
| – customers | | | 2,965 | | | 2,095 | | | 919 | | | 257 | | | 6,236 | |
| | |
|
| |
|
| |
|
| |
|
| |
|
| |
| Total | | | 9,093 | | | 2,535 | | | 1,134 | | | 627 | | | 13,389 | |
| | |
|
| |
|
| |
|
| |
|
| |
|
| |
South America | | | | | | | | | | | | | | | | |
| Certificates of deposit | | | – | | | – | | | – | | | – | | | – | |
| Time deposits: | | | | | | | | | | | | | | | | |
| – banks | | | 175 | | | 78 | | | 21 | | | 8 | | | 282 | |
| – customers | | | 193 | | | 14 | | | – | | | – | | | 207 | |
| | |
|
| |
|
| |
|
| |
|
| |
|
| |
| Total | | | 368 | | | 92 | | | 21 | | | 8 | | | 489 | |
| | |
|
| |
|
| |
|
| |
|
| |
|
| |
Total | | | | | | | | | | | | | | | | |
| Certificates of deposit | | | 9,619 | | | 1,075 | | | 1,251 | | | 5,875 | | | 17,820 | |
| Time deposits: | | | | | | | | | | | | | | | | |
| – banks | | | 18,529 | | | 1,475 | | | 2,109 | | | 2,522 | | | 24,635 | |
| – customers | | | 52,002 | | | 4,346 | | | 2,182 | | | 4,927 | | | 63,457 | |
| | |
|
| |
|
| |
|
| |
|
| |
|
| |
| Total | | | 80,150 | | | 6,896 | | | 5,542 | | | 13,324 | | | 105,912 | |
| | |
|
| |
|
| |
|
| |
|
| |
|
| |
The geographical analysis of deposits is based on the location of the office in which the deposits are recorded and excludes balances with HSBC companies. The majority of certificates of deposit and time deposits are in amounts of US$100,000 and over or the equivalent in other currencies.
147
Back to Contents
HSBC HOLDINGS PLC
Other information (continued)
|
HSBC includes short-term borrowings within customer accounts, deposits by banks and debt securities in issue and does not show short-term borrowings separately on the balance sheet. Short-term borrowings are defined by the SEC as Federal funds purchased and securities sold under agreements to repurchase, commercial paper and other short-term borrowings. Securities sold under agreements to repurchase are the only significant short-term borrowings of HSBC. The following table provides additional information with respect to HSBC’s securities sold under agreements to repurchase for each of the past three years.
| | | Year ended 31 December
| |
| | | | 2002 | | | 2001 | | | 2000 | |
| | | | US$m | | | US$m | | | US$m | |
| | | | | | | | | | | |
| Outstanding at 31 December | | | 21,397 | | | 16,882 | | | 16,312 | |
| Average amount outstanding during the year | | | 21,089 | | | 23,850 | | | 15,374 | |
| Maximum quarter-end balance outstanding during the year | | | 21,468 | | | 24,901 | | | 16,313 | |
| Weighted average interest rate during the year | | | 4.0% | | | 4.9% | | | 7.5% | |
| Weighted average interest rate at the year-end | | | 3.9% | | | 5.1% | | | 6.6% | |
Within the 90 day period prior to the filing of this report, an evaluation has been carried out under the supervision and with the participation of the Company’s management, including the Company’s Group Chairman and Group Finance Director, of the effectiveness of the design and operation of the Company’s disclosure controls and procedures. Based upon and as of that evaluation, the Group Chairman and Group Finance Director concluded that the disclosure controls and procedures are effective in all material respects to ensure that information required to be disclosed in the report the Company files and submits under the Exchange Act is recorded, processed, summarised and reported as and when required.
In addition, there have been no significant changes in the Company’s internal controls or in other factors that could significantly affect these controls subsequent to the date of their evaluation.
148
Back to Contents
HSBC HOLDINGS PLC
Board of Directors and Senior Management
|
| |
Sir John Bond, Group Chairman |
Age 61. An executive Director since 1990; Group Chief Executive from 1993 to 1998. Joined HSBC in 1961; an executive Director of The Hongkong and Shanghai Banking Corporation Limited from 1988 to 1992. Chairman of HSBC Bank plc, HSBC USA Inc., HSBC Bank USA and HSBC Bank Middle East and a Director of The Hongkong and Shanghai Banking Corporation Limited and HSBC Bank Canada. Chairman of The Institute of International Finance, Inc. and a Director of Ford Motor Company. A member of the Court of the Bank of England.
| * The Baroness Dunn, DBE, Deputy Chairman and senior non-executive Director |
Age 63. Executive Director of John Swire & Sons Limited and a Director of Swire Pacific Limited. A non-executive Director since 1990 and a non-executive Deputy Chairman since 1992. A non-executive Director of The Hongkong and Shanghai Banking Corporation Limited from 1981 to 1996. Former Senior Member of the Hong Kong Executive Council and Legislative Council.
| † Sir Brian Moffat, OBE, Deputy Chairman and senior independent non-executive Director |
Age 64. Chairman of Corus Group plc. A non-executive Director since 1998. A member of the Court of the Bank of England.
Age 59. Group Chief Executive. An executive Director since 1994. A Director of HSBC Bank plc since 1992, Chief Executive from 1994 to 1998 and Deputy Chairman since 1998. Joined HSBC in 1961. Chairman of HSBC Bank A.S. and Deputy Chairman of the Supervisory Board of HSBC Trinkaus & Burkhardt KGaA. A Director of The Hongkong and Shanghai Banking Corporation Limited, HSBC USA Inc., HSBC Bank Canada and Grupo Financiero Bital, S.A. de C.V. A non-executive Director of the Financial Services Authority.
| † The Lord Butler, GCB, CVO |
Age 65. Master, University College, Oxford and a non-executive Director of Imperial Chemical Industries plc. A non-executive Director since 1998. Responsible for the policy overview of HSBC in the Community and Chairman of HSBC Education Trust. Secretary of the Cabinet and Head of the Home Civil Service in the United Kingdom from 1988 to 1998.
Age 51. Executive Chairman of chinadotcom corporation and Chairman of its subsidiary, hongkong.com corporation. A non-executive Director since 1998. Chairman of HSBC Private Equity (Asia) Limited and a Director of MTR Corporation Limited, Inchcape plc, Inmarsat Ventures Plc, Convenience Retail Asia Limited, VTech Holdings Ltd. and The Wharf (Holdings) Limited. Chairman of the Hong Kong/Japan Business Co-operation Committee and the Advisory Committee on Corruption of the Independent Commission Against Corruption. A non-executive Director of The Hongkong and Shanghai Banking Corporation Limited since 1997.
Age 59. An executive Director since 2000. Chairman and Chief Executive Officer of CCF S.A. Joined CCF S.A. in 1980 having previously held senior appointments in the French civil service. A Director of HSBC Bank plc.
Age 59. An executive Director since 1998. Director and Chief Executive of HSBC Bank plc since 1998. Joined HSBC in 1980. President and Chief Executive Officer, HSBC Bank Canada from 1992 to 1997. A Director of CCF S.A., HSBC Investment Bank Holdings plc and HSBC Private Banking Holdings (Suisse) S.A. Vice-President of the Chartered Institute of Bankers. A non-executive Director of MasterCard International Inc. and a non- executive Director and Chairman of Young Enterprise.
Age 57. An executive Director since 1999. Joined HSBC in 1968. Appointed an executive Director and Chief Executive Officer of The Hongkong and Shanghai Banking Corporation Limited in 1996; Chairman since 1999. Non-executive Chairman of Hang Seng Bank Limited and a non-executive Director of Swire Pacific Limited and MTR Corporation Limited.
Age 47. Group Finance Director. An executive Director since 1995. A Director of HSBC Bank Malaysia Berhad, HSBC USA Inc. and HSBC Bank USA. A member of The Accounting Standards Board and the Standards Advisory Council of the International Accounting Standards Committee Foundation. A former partner in KPMG.
149
Back to Contents
HSBC HOLDINGS PLC
Board of Directors and Senior Management (continued)
|
Age 54. Group Managing Director and Chief Executive Officer of Li & Fung Limited. A non-executive Director since 1998. Past Chairman of the Hong Kong General Chamber of Commerce, the Hong Kong Exporters’ Association and the Hong Kong Committee for the Pacific Economic Co-operation Council. A non-executive Director of The Hongkong and Shanghai Banking Corporation Limited since 1995.
Age 54. Executive Director, Corporate, Investment Banking and Markets. An executive Director since 1998. Joined HSBC in 1982. Group Treasurer from 1992 to 1998. Chairman of HSBC Investment Bank Holdings plc and a Director of HSBC Bank plc, CCF S.A., HSBC Guyerzeller Bank AG, HSBC USA Inc., HSBC Bank USA, HSBC Private Banking Holdings (Suisse) S.A. and HSBC Trinkaus & Burkhardt KGaA.
Age 58. Former Chief Operating Officer of Barilla S.P.A. and former Senior Vice President of Nestlé S.A. With Mars Incorporated from 1972 to 1993, latterly as Executive Vice President of M&M/Mars in New Jersey. A non-executive Director since 2001. A non-executive Director of Safeway plc.
Age 53. Group IT Director. An executive Director since 2000. Joined HSBC in 1978. A non-executive Deputy Chairman of CLS Group Holdings AG.
† Sir John Kemp-WelchAge 66. Former Joint Senior Partner of Cazenove & Co and former Chairman of the London Stock Exchange. A non-executive Director since 2000.
* The Lord Marshall Age 69. Chairman of British Airways Plc and Invensys plc. A non-executive Director since 1993. A non-executive Director of HSBC Bank plc from 1989 to 1994.
| † Sir Mark Moody-Stuart, KCMG |
Age 62. Chairman of Anglo American plc. Director and former Chairman of The ‘Shell’ Transport and Trading Company, plc and former Chairman of the Committee of Managing Directors of the Royal Dutch/Shell Group of Companies. A Director of Accenture Limited, a Governor of Nuffield Hospitals and President of the Liverpool School of Tropical Medicine. Member of the UN Secretary General’s Advisory Council for the Global Compact. A non-executive Director since 2001.
Age 61. Founder of Newton Investment Management, from which he retired in April 2002. A non-executive Director since 27 September 2002. A Member of the Advisory Board of the East Asia Institute at Cambridge University.
Age 63. Chairman of World-Wide Shipping Agency Limited, World-Wide Shipping Group Limited, World Maritime Limited, World Shipping and Investment Company Limited and World Finance International Limited. A non-executive Director since 1990. A non-executive Director of The Hongkong and Shanghai Banking Corporation Limited since 1984 and Deputy Chairman since 1996.
Age 57. Chair of Canadian Broadcasting Corporation. A non-executive Director since 27 September 2002. Chair of Vancouver Board of Trade from 2001 to 2002. A Director of Canfor Corporation, Fairmont Hotels and Resorts, HSBC USA Inc., HSBC North America Inc. and HSBC Bank USA.
† Sir Brian Williamson, CBE |
Age 58. Chairman of London International Financial Futures and Options Exchange. Chairman of Electra Investment Trust plc. A Director of Templeton Emerging Markets Investment Trust plc. A non-executive Director since 27 September 2002. A former Chairman of Gerrard Group plc and a former Director of the Financial Services Authority and of the Court of The Bank of Ireland.
| † | Independent non-executive Director |
150
Back to Contents
HSBC HOLDINGS PLC
Age 56. An Adviser to the Board since 1998. Solicitor. A partner of Norton Rose from 1973 to 1998. A Director of HSBC Investment Bank Holdings plc and HSBC Private Banking Holdings (Suisse) S.A.
Age 54. Group General Manager, Global e-business. Joined HSBC in 1999. Appointed a Group General Manager in 2000.
Age 44. Chief Executive Officer, Group Private Banking. Joined HSBC in 1994. Appointed a Group General Manager in 2001.
Age 52. Group Company Secretary since 1990. Joined HSBC in 1980; Corporation Secretary of The Hongkong and Shanghai Banking Corporation Limited from 1986 to 1992. Company Secretary of HSBC Bank plc from 1994 to 1996.
Age 51. Group General Manager, Legal and Compliance. Joined HSBC in 1979. Appointed a Group General Manager in 1998.
Age 55. Deputy Chairman and Chief Executive Officer, HSBC Bank Malaysia Berhad. Joined HSBC in 1968. Appointed a Group General Manager in 2001.
Age 54. Executive Director, The Hongkong and Shanghai Banking Corporation Limited and Chief Executive Officer, Hang Seng Bank Limited. Joined HSBC in 1978. Appointed a Group General Manager in 1995.
Age 58. Deputy Chairman, HSBC Bank Middle East. Joined HSBC in 1965. Appointed a Group General Manager in 1995.
Age 50. Group General Manager and Global Head of Corporate and Institutional Banking. Joined HSBC in 1987. Appointed a Group General Manager in 2001.
Age 51. Group General Manager and Chief Executive Officer, Mexico. Joined HSBC in 1974. Appointed a Group General Manager in October 2002.
Age 49. President and Chief Executive Officer, HSBC Bank Brasil S.A.-Banco Múltiplo. Joined HSBC in 1973. Appointed a Group General Manager in 1997.
Age 51. President and Chief Executive Officer, HSBC Bank Canada. Joined HSBC in 1982. Appointed a Group General Manager in 2001.
Age 43. Group General Manager and Head of Global Markets. Joined HSBC in 1980. Appointed a Group General Manager in 2000.
Age 56. Group General Manager, Insurance. Joined HSBC in 1971. Appointed a Group General Manager in 1996.
151
Back to Contents
HSBC HOLDINGS PLC
Board of Directors and Senior Management (continued)
|
Age 52. Chief Operating Officer and Director, HSBC Bank plc. Joined HSBC in 1972. Appointed a Group General Manager in 2000.
Age 46. Group General Manager, Internal Audit. Joined HSBC in 1986. Appointed a Group General Manager in June 2002.
Age 61. Group General Manager, Credit and Risk. Joined HSBC in 1984. Appointed a Group General Manager in 1997.
Age 56. Chief Executive Officer, The Hongkong and Shanghai Banking Corporation Limited. Joined HSBC in 1968. Appointed a Group General Manager in 1991.
Age 48. President and Chief Executive Officer, HSBC USA Inc. and HSBC Bank USA. Joined HSBC in 1976. Appointed a Group General Manager in 1998.
Age 55. Group General Manager, Strategic Development. Joined HSBC in 1969. Appointed a Group General Manager in 1992.
Age 53. General Manager, The Hongkong and Shanghai Banking Corporation Limited. Joined HSBC in 1972. Appointed a Group General Manager in 2000.
Age 54. Chairman, Global Investment Banking Division, HSBC Bank plc. Joined HSBC in 1984. Appointed a Group General Manager in 2000.
Age 45. Joined HSBC in 1993. Group Chief Accounting Officer since 1995.
Age 44. Group General Manager and Head of Corporate Investment Banking and Markets, Asia-Pacific. Joined HSBC in 1982. Appointed a Group General Manager in March 2003.
Age 61. Group General Manager, Human Resources. Joined HSBC in 1960. Appointed a Group General Manager in 1990.
Age 48. Group General Manager and Head of Corporate Investment Banking and Markets-North America, HSBC Bank USA. Joined HSBC in 1975. Appointed a Group General Manager in March 2003.
Age 64. Chairman of the Managing Partners, HSBC Trinkaus & Burkhardt KGaA. Joined HSBC in 1983. Appointed a Group General Manager in 2001.
Age 46. Group General Manager. Joined HSBC in 1978. Appointed a Group General Manager in 2000.
Age 44. Group General Manager and Head of Investment Banking and Markets, Americas. Joined HSBC in 1980. Appointed a Group General Manager in 2000.
Age 53. Group General Manager, Marketing. Joined HSBC in 2001. Appointed a Group General Manager in 2001.
152
Back to Contents
HSBC HOLDINGS PLC
HSBC reported operating profit before provisions of US$10,787 million. Profit attributable to shareholders of HSBC Holdings was US$6,239 million, a 12.3 per cent return on shareholders’ funds. The retained profit to be transferred to reserves was US$1,238 million.
A first interim dividend of US$0.205 per ordinary share was paid on 9 October 2002. The Directors have declared a second interim dividend of US$0.325 per ordinary share in lieu of a final dividend, making a total distribution for the year of US$5,001 million. The second interim dividend will be payable on 6 May 2003 in cash in United States dollars, or in sterling or Hong Kong dollars at exchange rates to be determined on 28 April 2003, with a scrip dividend alternative. The reserves available for distribution before accounting for the second interim dividend of US$3,069 million are US$10,943 million.
Further information about the results is given in the consolidated profit and loss account on page 190.
Principal activities and business review
|
Through its subsidiary and associated undertakings, HSBC provides a comprehensive range of banking and related financial services through an international network of over 8,000 offices in 80 countries and territories in Europe, the Asia-Pacific region, the Americas, the Middle East and Africa. Taken together, the five largest customers of HSBC do not account for more than 2 per cent of HSBC’s income.
On 29 May 2002, HSBC Holdings and AEA Investors Inc. agreed in principle that HSBC will invest up to US$750 million over the next five years in a new US$1 billion plus private equity fund being organised by AEA.
On 28 June 2002, Merrill Lynch HSBC (‘MLHSBC’) became a 100 per cent owned subsidiary of HSBC. MLHSBC was formed as a 50:50 joint venture between HSBC and Merrill Lynch in April 2000 to provide direct investment and banking services primarily over the internet to mass affluent investors outside the United States.
On 14 November 2002, HSBC and Household International, Inc. (“Household”) entered into an agreement for HSBC to acquire Household. The agreeement is subject to a number of conditions including the approval of shareholders of Household, and regulatory and other consents and approvals in the USA, Canada, UK and other relevant jurisdictions. Under the terms of the agreement, Household common shareholders will be entitled to receive 2.675 HSBC ordinary shares or 0.535 HSBC American Depositary Shares for each share of Household common stock.
On 25 November 2002, HSBC Insurance Holdings Limited subscribed for new common shares of Ping An Insurance Company of China, Ltd. equivalent to 10 per cent of Ping An’s enlarged issued share capital, for a consideration of US$600 million.
On 25 November 2002, HSBC completed the acquisition of 99.59 per cent of GF Bital for a consideration of US$1,135 million.
A review of the development of the business of HSBC undertakings during the year and an indication of likely future developments are given in the ‘Description of Business’ on pages 8 to 33.
HSBC’s five-year strategy, launched in December 1998, is designed to focus on shareholder value. HSBC Holdings’ governing objective is to exceed the total shareholder return of a benchmark comprising a peer group of financial institutions, with a minimum objective of doubling shareholder return over the five-year period. Total shareholder return for the first four years was 155 per cent, compared to 95 per cent for the benchmark (starting point 100 per cent on 31 December 1998). An explanation of the basis of calculation of total shareholder return can be found on page 174.
The following events occurred during the year:
| | |
| 1. | 75,150,755 ordinary shares of US$0.50 each were issued at par on 7 May 2002 to shareholders who elected to receive new shares in lieu of the 2001 second interim dividend. The market value per share used to calculate shareholders’ entitlements to new shares was US$11.3968, being the United States dollar equivalent of £8.009. |
| | |
| 2. | 14,434,840 ordinary shares of US$0.50 each were issued at par on 9 October 2002 to shareholders who elected to receive new shares in lieu of the 2002 first interim dividend. The market value per share used to calculate shareholders’ entitlements to new shares was US$11.5172 being the United States dollar equivalent of £7.505. |
153
Back to Contents
HSBC HOLDINGS PLC
Report of the Directors (continued)
|
| | |
| 3. | 6,040,317 ordinary shares of US$0.50 each were issued at prices ranging from £3.059 to £6.7536 per share in connection with the exercise of options under the HSBC Holdings Savings-Related Share Option Plan. Options over 10,915,990 ordinary shares of US$0.50 each lapsed. |
| | |
| 4. | 850,582 ordinary shares of US$0.50 each were issued at prices ranging from £3.7768 to £6.5187 per share in connection with the exercise of options under the HSBC Holdings Savings-Related Share Option Scheme: USA Section. |
| | |
| 5. | The HSBC Qualifying Employee Share Ownership Trust (“the QUEST”) was established in 1999 to satisfy options exercised by UK participants of the HSBC Holdings Savings-Related Share Option Plan. At 1 January 2002, the QUEST held 4,905,939 ordinary shares of US$0.50 each. During 2002, HSBC QUEST Trustee (UK) Limited, the corporate trustee of the QUEST, subscribed for 6,147,311 ordinary shares of US$0.50 each at market values ranging from £6.61 to £8.43, using funds from those employees who exercised options under the HSBC Holdings Savings-Related Share Option Plan. In addition, 9,564,355 ordinary shares were transferred from the QUEST to employees who exercised options under the HSBC Holdings Savings-Related Share Option Plan. At 31 December 2002, the QUEST held 1,488,895 ordinary shares of US$0.50 each. |
| | |
| 6. | Under the authority granted by shareholders at the Annual General Meeting in 2000, 2,542,180 ordinary shares of US$0.50 each were issued at €10.5638 in connection with a Plan d’Epargne Entreprise for the benefit of non-UK resident employees of CCF and its subsidiaries. |
| | |
| 7. | Options over 19,828,037 ordinary shares of US$0.50 each were awarded at nil consideration on 2 May 2002 to 41,401 HSBC employees resident in 51 countries and territories under the HSBC Holdings savings-related share option plans. The options are exercisable within six months following the third or fifth anniversary of the commencement of the relevant savings contracts on 1 August 2002 at a price of £6.3224 per share, a 20 per cent discount to the average market value over the five business days immediately preceding the date of the invitation. |
| |
Discretionary share incentive plans |
| | |
| 8. | 21,069,640 ordinary shares of US$0.50 each were issued at prices ranging from £2.1727 to £7.421 per share in connection with the exercise of options under the HSBC Holdings Executive Share Option Scheme. Options over 2,083,441 ordinary shares of US$0.50 each lapsed. |
| | |
| 9. | Options over 56,763,464 ordinary shares of US$0.50 each were awarded at nil consideration on 7 May 2002 under the HSBC Holdings Group Share Option Plan. The options are exercisable between the third and 10th anniversaries of the award at a price of £8.4050 per share, the market value of the ordinary shares on the date of award. |
| | |
| 10. | Options over 472,050 ordinary shares of US$0.50 each were awarded at nil consideration on 30 August 2002 under the HSBC Holdings Group Share Option Plan. The options are exercisable between the third and 10th anniversaries of the award at a price of £7.455 per share, the average market value over the five business days immediately preceding the date of the award. Options over 1,896,660 ordinary shares of US$0.50 each lapsed. |
| |
Redemption of HSBC Holdings plc 11.69 per cent Subordinated Bonds 2002 of £1. |
| | |
| 11. | On 31 July 2002, HSBC Holdings redeemed £413,000,000 11.69 per cent Subordinated Bonds 2002 of £1 each. |
| |
Authority to repurchase shares |
| | |
| 12. | At the Annual General Meeting in 2002 shareholders gave authority for the Company to make market repurchases of up to 935,560,000 ordinary shares of US$0.50 each. Your Directors have not exercised this authority. |
154
Back to Contents
HSBC HOLDINGS PLC
Authority to allot shares |
| | |
| 13. | At the Annual General Meeting in 2002 shareholders gave authority for the Directors to allot up to 1,871,120,000 ordinary shares of US$0.50 each. Within this amount the Directors were granted authority to allot up to 467,780,000 ordinary shares of US$0.50 each wholly for cash to persons other than existing shareholders. |
| |
| |
Employee share option plans
|
In order to align the interests of staff with those of shareholders, share options are awarded to employees under all-employee share plans and discretionary share incentive plans. The following are particulars of outstanding employee share options, including those held by employees working under employment contracts that are regarded as “continuous contracts” for the purposes of the Hong Kong Employment Ordinance. The options are granted at nil consideration unless otherwise indicated. No options have been granted to substantial shareholders, suppliers of goods or services, or in excess of the individual limit for each share plan. No options were cancelled during the year. The total number of new HSBC Holdings shares that may be issued or become issuable under all the share option plans in any ten year period is 848,847,000 ordinary shares of US$0.50 each (approximately 9 per cent of HSBC Holdings’ issued ordinary share capital on 3 March 2003). Within this limit not more than 5 per cent of the issued ordinary share capital of HSBC Holdings from time to time may be put under option under the HSBC Holdings Group Share Option Plan and the HSBC Holdings Restricted Share Plan 2000 in any ten year period (approximately 474,072,000 ordinary shares of US$0.50 each on 3 March 2003). Particulars of options held by Directors of HSBC Holdings are set out on pages 182 to 185 of the Directors’ Remuneration Report.
The HSBC Holdings Savings-Related Share Option Plan, HSBC Holdings Savings-Related Share Option Plan: Overseas Section, and previously the HSBC Holdings Savings-Related Share Option Scheme: USA Section, are all-employee share plans under which eligible HSBC employees (those with six months continuous service from July to December of the year preceding the date of grant) are granted options to acquire HSBC Holdings ordinary shares of US$0.50 each. Employees may make monthly contributions up to £250 (or equivalent) over a period of three or five years which may be used, on the third or fifth anniversary of the commencement of the relevant savings contract, to exercise the options; alternatively the employee may elect to have the savings (plus interest) repaid in cash. The options are exercisable within six months following the third or fifth anniversary of the commencement of the relevant savings contract. In the case of redundancy, retirement on grounds of injury or ill health, retirement at age 50 or over, the transfer of employing business to another party, or a change of control of employing company, options may be exercised before completion of the relevant savings contract.
Under the HSBC Holdings Savings-Related Share Option Plan and the HSBC Holdings Savings-Related Share Option Plan: Overseas Section the option exercise price is determined by reference to the average market value of the ordinary shares on the five business days immediately preceding the invitation date, then applying a discount of up to 20 per cent. The Plans will terminate on 26 May 2010 unless the Directors resolve to terminate the Plans at an earlier date.
155
Back to Contents
HSBC HOLDINGS PLC
Report of the Directors (continued)
|
| HSBC Holdings Savings-Related Share Option Plan |
HSBC Holdings ordinary shares of US$0.50 each |
| Date of award | | | Exercise price (£) | | | Exercisable from1 | | | Exercisable until2 | | | Options at 1 January 2002 | | | Options awarded during year | 3 | | Options exercised during year | 4 | | Options lapsed during year | | | Options at 31 December 2002 | |
| |
|
| |
|
| |
|
| |
|
| |
|
| |
|
| |
|
| |
|
| |
| 3 Apr 1996 | | | 3.0590 | | | 1 Aug 2001 | | | 31 Jan 2002 | | | 72,519 | | | – | | | 58,115 | | | 14,404 | | | – | |
| 9 Apr 1997 | | | 4.5206 | | | 1 Aug 2002 | | | 31 Jan 2003 | | | 8,721,489 | | | – | | | 8,377,754 | | | 116,326 | | | 227,409 | |
| 6 Apr 1998 | | | 5.2212 | | | 1 Aug 2003 | | | 31 Jan 2004 | | | 9,609,696 | | | – | | | 408,223 | | | 464,903 | | | 8,736,570 | |
| 1 Apr 1999 | | | 5.3980 | | | 1 Aug 2004 | | | 31 Jan 2005 | | | 12,681,199 | | | – | | | 339,272 | | | 806,740 | | | 11,535,187 | |
| 10 Apr 2000 | | | 6.0299 | | | 1 Aug 2005 | | | 31 Jan 2006 | | | 15,875,709 | | | – | | | 264,453 | | | 1,466,152 | | | 14,145,104 | |
| 11 Apr 2001 | | | 6.7536 | | | 1 Aug 2004 | | | 31 Jan 2005 | | | 4,251,916 | | | – | | | 67,617 | | | 712,433 | | | 3,471,866 | |
| 11 Apr 2001 | | | 6.7536 | | | 1 Aug 2006 | | | 31 Jan 2007 | | | 9,221,110 | | | – | | | 52,699 | | | 858,267 | | | 8,310,144 | |
| 2 May 2002 | | | 6.3224 | | | 1 Aug 2005 | | | 31 Jan 2006 | | | – | | | 3,366,992 | | | 617 | | | 182,789 | | | 3,183,586 | |
| 2 May 2002 | | | 6.3224 | | | 1 Aug 2007 | | | 31 Jan 2008 | | | – | | | 7,572,479 | | | 387 | | | 191,825 | | | 7,380,267 | |
| | | | | | | | | | | | | | | | | | | | | | | | | | |
| 1 | May be advanced to an earlier date in certain circumstances, e.g. retirement. |
| 2 | May be extended to a later date in certain circumstances, e.g. on death of a participant, the executors may exercise the option up to six months beyond the normal exercise period. |
| 3 | The closing price per share on 1 May 2002 was £8.08. |
| 4 | The weighted average closing price of the securities immediately before the dates on which options were exercised was £7.43. |
| HSBC Holdings Savings-Related Share Option Plan: Overseas Section |
HSBC Holdings ordinary shares of US$0.50 each |
| Date of award | | | Exercise price (£) | | | Exercisable from1 | | | Exercisable until2 | | | Options at 1 January 2002 | | | Options awarded during year | 3 | | Options exercised during year | 4 | | Options lapsed during year | | | Options at 31 December 2002 | |
| |
|
| |
|
| |
|
| |
|
| |
|
| |
|
| |
|
| |
|
| |
| 3 Apr 1996 | | | 3.0590 | | | 1 Aug 2001 | | | 31 Jan 2002 | | | 45,483 | | | – | | | 39,750 | | | 5,733 | | | – | |
| 9 Apr 1997 | | | 4.5206 | | | 1 Aug 2002 | | | 31 Jan 2003 | | | 5,696,106 | | | – | | | 5,469,602 | | | 142,087 | | | 84,417 | |
| 6 Apr 1998 | | | 5.2212 | | | 1 Aug 2003 | | | 31 Jan 2004 | | | 3,393,848 | | | – | | | 70,385 | | | 136,068 | | | 3,187,395 | |
| 1 Apr 1999 | | | 5.3980 | | | 1 Aug 2004 | | | 31 Jan 2005 | | | 12,870,183 | | | – | | | 180,251 | | | 853,351 | | | 11,836,581 | |
| 10 Apr 2000 | | | 6.0299 | | | 1 Aug 2005 | | | 31 Jan 2006 | | | 27,773,999 | | | – | | | 216,594 | | | 2,974,540 | | | 24,582,865 | |
| 11 Apr 2001 | | | 6.7536 | | | 1 Aug 2004 | | | 31 Jan 2005 | | | 10,805,468 | | | – | | | 44,924 | | | 1,333,738 | | | 9,426,806 | |
| 11 Apr 2001 | | | 6.7536 | | | 1 Aug 2006 | | | 31 Jan 2007 | | | 3,317,457 | | | – | | | 10,081 | | | 372,842 | | | 2,934,534 | |
| 2 May 2002 | | | 6.3224 | | | 1 Aug 2005 | | | 31 Jan 2006 | | | – | | | 6,427,955 | | | 3,139 | | | 228,877 | | | 6,195,939 | |
| 2 May 2002 | | | 6.3224 | | | 1 Aug 2007 | | | 31 Jan 2008 | | | – | | | 2,460,611 | | | 809 | | | 54,915 | | | 2,404,887 | |
| | | | | | | | | | | | | | | | | | | | | | | | | | |
| 1 | May be advanced to an earlier date in certain circumstances, e.g. retirement. |
| 2 | May be extended to a later date in certain circumstances, e.g. on death of a participant, the executors may exercise the option up to six months beyond the normal exercise period. |
| 3 | The closing price per share on 1 May 2002 was £8.08. |
| 4 | The weighted average closing price of the securities immediately before the dates on which options were exercised was £7.39. |
156
Back to Contents
HSBC HOLDINGS PLC
| HSBC Holdings Savings-Related Share Option Scheme: USA Section |
HSBC Holdings ordinary shares of US$0.50 each |
| Date of award | | | Exercise price (£) | | | Exercisable from1 | | | Exercisable until2 | | | Options at 1 January 2002 | | | Options exercised during year | 3 | | Options lapsed during year | | | Options at
31 December 2002 | |
| |
|
| |
|
| |
|
| |
|
| |
|
| |
|
| |
|
| |
| 16 Aug 1996 | | | 3.2530 | | | 1 Jul 2001 | | | 31 Dec 2001 | | | 881,199 | | | – | | | 881,199 | | | – | |
| 12 Aug 1997 | | | 6.5187 | | | 1 Jul 2002 | | | 31 Dec 2002 | | | 1,320,588 | | | 814,854 | | | 505,734 | | | – | |
| 24 Aug 1998 | | | 3.7768 | | | 1 Jul 2003 | | | 31 Dec 2003 | | | 2,411,881 | | | 29,413 | | | – | | | 2,382,468 | |
| 10 Aug 1999 | | | 6.3078 | | | 1 Jul 2004 | | | 31 Dec 2004 | | | 1,499,721 | | | 6,315 | | | – | | | 1,493,406 | |
| | | | | | | | | | | | | | | | | | | | | | | |
No options were awarded during the year. |
| 1 | May be advanced to an earlier date in certain circumstances, e.g. retirement. |
| 2 | May be extended to a later date in certain circumstances, e.g. on death of a participant, the executors may exercise the option up to six months beyond the normal exercise period. |
| 3 | The weighted average closing price of the securities immediately before the dates on which options were exercised was £7.08. |
Discretionary share incentive plans |
The HSBC Holdings Group Share Option Plan, and previously the HSBC Holdings Executive Share Option Scheme, are discretionary share incentive plans under which HSBC employees, based on performance criteria and potential, are granted options to acquire HSBC Holdings ordinary shares of US$0.50 each. Since 1996 the vesting of these awards has been subject to the attainment of pre-determined performance criteria, except within CCF (which was acquired in 2000) where performance criteria are being phased in. The maximum value of options which may be granted to an employee in any one year (together with any Performance Share Awards under the HSBC Holdings Restricted Share Plan 2000) is 150 per cent of the employee’s annual salary at the date of grant plus any bonus paid for the previous year. In exceptional circumstances this could be raised to 225 per cent. Subject to achievement of the performance condition, options are exercisable between the third and tenth an niversary of the date of grant. Employees of a subsidiary that is sold or transferred out of HSBC may exercise options awarded under the HSBC Holdings Group Share Option Plan within six months regardless of whether the performance condition is met.
The terms of the HSBC Holdings Group Share Option Plan were amended in 2001 so that the exercise price of options granted under the Plan in 2002 and beyond would be the higher of the average market value of the ordinary shares on the five business days prior to the grant of the option or the market value of the ordinary shares on the date of grant of the option. The HSBC Holdings Group Share Option Plan will terminate on 26 May 2005 unless the Directors resolve to terminate the Plan at an earlier date.
157
Back to Contents
HSBC HOLDINGS PLC
Report of the Directors (continued) |
| HSBC Holdings Executive Share Option Scheme |
HSBC Holdings ordinary shares of US$0.50 each |
| Date of award | | | Exercise
price (£) | | | Exercisable
from1 | | | Exercisable
until2 | | | Options at 1 January
2002 | | | Options exercised during year | 3 | | Options lapsed during year | | | Options at
31 December 2002 | |
| |
|
| |
|
| |
|
| |
|
| |
|
| |
|
| |
|
| |
| 12 Oct 1993 | | | 2.4062 | | | 12 Oct 1996 | | | 12 Oct 2003 | | | 31,785 | | | 9,081 | | | – | | | 22,704 | |
| 8 Mar 1994 | | | 2.8376 | | | 8 Mar 1997 | | | 8 Mar 2004 | | | 250,860 | | | 79,086 | | | – | | | 171,774 | |
| 7 Mar 1995 | | | 2.1727 | | | 7 Mar 1998 | | | 7 Mar 2005 | | | 603,000 | | | 185,250 | | | 6,000 | | | 411,750 | |
| 1 Apr 1996 | | | 3.3334 | | | 1 Apr 1999 | | | 1 Apr 2006 | | | 1,644,210 | | | 457,759 | | | 25,500 | | | 1,160,951 | |
| 24 Mar 1997 | | | 5.0160 | | | 24 Mar 2000 | | | 24 Mar 2007 | | | 1,899,484 | | | 361,129 | | | 16,618 | | | 1,521,737 | |
| 12 Aug 1997 | | | 7.7984 | | | 12 Aug 2000 | | | 12 Aug 2007 | | | 14,625 | | | – | | | – | | | 14,625 | |
| 16 Mar 1998 | | | 6.2767 | | | 16 Mar 2001 | | | 16 Mar 2008 | | | 3,182,024 | | | 524,536 | | | – | | | 2,657,488 | |
| 29 Mar 1999 | | | 6.3754 | | | 3 Apr 2002 | | | 29 Mar 2009 | | | 64,647,156 | | | 19,193,029 | | | 1,030,711 | | | 44,423,416 | |
| 10 Aug 1999 | | | 7.4210 | | | 10 Aug 2002 | | | 10 Aug 2009 | | | 264,750 | | | 16,200 | | | 4,200 | | | 244,350 | |
| 31 Aug 1999 | | | 7.8710 | | | 31 Aug 2002 | | | 31 Aug 2009 | | | 4,000 | | | – | | | – | | | 4,000 | |
| 3 Apr 2000 | | | 7.4600 | | | 3 Apr 2003 | | | 3 Apr 2010 | | | 30,507,764 | | | 243,570 | | | 1,057,655 | | | 29,206,539 | |
| | | | | | | | | | | | | | | | | | | | | | | |
| 1 | May be advanced to an earlier date in certain circumstances, e.g. retirement. |
| 2 | May be extended to a later date in certain circumstances, e.g. on death of a participant, the executors may exercise the option up to twelve months beyond the normal exercise period. |
| 3 | The weighted average closing price of the securities immediately before the dates on which options were exercised was £8.08. |
The HSBC Holdings Executive Share Option Scheme was replaced by the HSBC Holdings Group Share Option Plan on 26 May 2000. No options have been granted under the Scheme since that date. |
| HSBC Holdings Group Share Option Plan |
HSBC Holdings ordinary shares of US$0.50 each |
| Date of award | | | Exercise
price (£) | | | Exercisable
from | | | Exercisable
until | 1 | | Options at
1 January 2002 | | | Options awarded during year | | | Options exercised during year | | | Options lapsed
during year | | | Options at
31 December 2002 | |
| |
|
| |
|
| |
|
| |
|
| |
|
| |
|
| |
|
| |
|
| |
| 4 Oct 2000 | | | 9.6420 | | | 4 Oct 2003 | | | 4 Oct 2010 | | | 443,522 | | | – | | | – | | | 26,996 | | | 416,526 | |
| 23 Apr 2001 | | | 8.7120 | | | 23 Apr 2004 | | | 23 Apr 2011 | | | 50,006,367 | | | – | | | – | | | 1,215,869 | | | 48,790,498 | |
| 30 Aug 2001 | | | 8.2280 | | | 30 Aug 2004 | | | 30 Aug 2011 | | | 375,405 | | | – | | | – | | | 11,975 | | | 363,430 | |
| 7 May 2002 | | | 8.4050 | | | 7 May 2005 | | | 7 May 2012 | | | – | | | 56,763,4642 | | | – | | | 638,320 | | | 56,125,144 | |
| 30 Aug 2002 | | | 7.4550 | | | 30 Aug 2005 | | | 30 Aug 2012 | | | – | | | 472,0503 | | | – | | | 3,500 | | | 468,550 | |
| | | | | | | | | | | | | | | | | | | | | | | | | | |
| 1 | May be extended to a later date in certain circumstances, e.g. on death of a participant, the executors may exercise the option up to twelve months beyond the normal exercise period. |
| 2 | The closing price per share on 6 May 2002 was £8.37. |
| 3 | The closing price on 29 August 2002 was £7.30. |
CCF S.A. and subsidiary company plans
When it was acquired in July 2000 CCF and certain of its subsidiary companies operated employee share option plans under which options could be granted over their respective shares. With the exception of the Banque Eurofin plan, under which further options can be granted, no further options will be granted under any of these subsidiary company plans.
The following are outstanding options to acquire shares in CCF S.A. and its subsidiaries.
158
Back to Contents
HSBC HOLDINGS PLC
| Date of award | | | Exercise price(€) | | | Exercisable from | | | Exercisable until | | | Options at 1 January 2002 | | | Options exercised during year | 1 | | Options lapsed during year | | | Options at
31 December 2002 | |
| |
|
| |
|
| |
|
| |
|
| |
|
| |
|
| |
|
| |
| 4 May 1993 | | | 33.69 | | | 4 May 1995 | | | 4 May 2003 | | | 100 | | | – | | | – | | | 100 | |
| 23 Jun 1994 | | | 32.78 | | | 23 Jun 1996 | | | 23 Jun 2004 | | | 15,000 | | | 4,200 | | | – | | | 10,800 | |
| 22 Jun 1995 | | | 34.00 | | | 22 Jun 1997 | | | 22 Jun 2005 | | | 58,300 | | | 2,170 | | | – | | | 56,130 | |
| 9 May 1996 | | | 35.52 | | | 9 May 1998 | | | 9 May 2006 | | | 121,826 | | | 25,326 | | | – | | | 96,500 | |
| 7 May 1997 | | | 37.05 | | | 7 Jun 2000 | | | 7 May 2007 | | | 554,000 | | | 193,370 | | | – | | | 360,630 | |
| 29 Apr 1998 | | | 73.50 | | | 7 Jun 2000 | | | 29 Apr 2008 | | | 673,400 | | | – | | | – | | | 673,400 | |
| 7 Apr 1999 | | | 81.71 | | | 7 Jun 2000 | | | 7 Apr 2009 | | | 794,700 | | | – | | | – | | | 794,700 | |
| 12 Apr 2000 | | | 142.50 | | | 1 Jan 2002 | | | 12 Apr 2010 | | | 860,500 | | | 4,000 | | | – | | | 856,500 | |
| | | | | | | | | | | | | | | | | | | | | | | |
| 1 | On exercise of the options, the CCF shares will be exchanged for HSBC Holdings ordinary shares of US$0.50 each in the same ratio as for the acquisition of CCF (13 HSBC Holdings shares for each CCF share). At 31 December 2002 HSBC Holdings General Employee Benefit Trust held 35,745,555 HSBC Holdings ordinary shares of US$0.50 each which may be exchanged for CCF shares arising from the exercise of options. |
| Date of award | | | Exercise
price (£) | | | Exercisable
from | | | Exercisable
until | | | Options at
1 January 2002 | | | Options exercised during year | | | Options lapsed
during year | | | Options at
31 December 2002 | |
| |
|
| |
|
| |
|
| |
|
| |
|
| |
|
| |
|
| |
| 28 Oct 1997 | | | 88.73 | | | 28 Oct 2001 | | | 28 Jan 2003 | | | 10,000 | | | 10,000 | | | – | | | – | |
| 10 Jul 1998 | | | 94.52 | | | 10 Jul 2002 | | | 10 Oct 2003 | | | 10,000 | | | – | | | – | | | 10,000 | |
| 21 Jun 1999 | | | 100.31 | | | 21 Jun 2004 | | | 21 Dec 2004 | | | 10,000 | | | – | | | – | | | 10,000 | |
| 7 Jun 2000 | | | 105.94 | | | 7 Jun 2005 | | | 7 Dec 2005 | | | 10,000 | | | – | | | – | | | 10,000 | |
| Date of award | | | Exercise
price (£) | | | Exercisable
from | | | Exercisable
until | | | Options at
1 January 2002 | | | Options exercised during year | | | Options lapsed
during year | | | Options at
31 December 2002 | |
| |
|
| |
|
| |
|
| |
|
| |
|
| |
|
| |
|
| |
| 17 Oct 1997 | | | 32.88 | | | 17 Oct 2002 | | | 17 Oct 2003 | | | 28,500 | | | – | | | – | | | 28,500 | |
| 22 Dec 2000 | | | 61.66 | | | 22 Dec 2003 | | | 22 Dec 2005 | | | 11,500 | | | – | | | – | | | 11,500 | |
| Date of award | | | Exercise
price (£) | | | Exercisable
from | | | Exercisable
until | | | Options at
1 January 2002 | | | Options exercised during year | | | Options lapsed
during year | | | Options at
31 December 2002 | |
| |
|
| |
|
| |
|
| |
|
| |
|
| |
|
| |
|
| |
| 24 Dec 1998 | | | 61.85 | | | 24 Dec 2003 | | | 24 Jun 2004 | | | 5,000 | | | – | | | – | | | 5,000 | |
| 9 Sep 1999 | | | 64.79 | | | 9 Sep 2004 | | | 9 Mar 2005 | | | 5,000 | | | – | | | – | | | 5,000 | |
| 14 Jun 2000 | | | 69.52 | | | 14 Jun 2005 | | | 14 Dec 2005 | | | 5,100 | | | – | | | – | | | 5,100 | |
159
Back to Contents
HSBC HOLDINGS PLC
Report of the Directors (continued)
|
Banque du Louvre
shares of no par value |
| Date of award | | | Exercise
price(€) | | | Exercisable
from | | | Exercisable
until | | | Options at
1 January 2002 | | | Options exercised
during year | | | Options lapsed
during year | | | Options at 31 December 2002 | |
| |
|
| |
|
| |
|
| |
|
| |
|
| |
|
| |
|
| |
| 31 Mar 1999 | | | 68.65 | | | 1 Jul 2000 | | | 31 Mar 2009 | | | 17,600 | | | 17,600 | | | – | | | – | |
| 7 Sep 2001 | | | 154.75 | | | 7 Sep 2005 | | | 7 Oct 2007 | | | 78,600 | | | – | | | 4,400 | | | 74,200 | |
| Date of award | | | Exercise
price(€) | | | Exercisable
from | | | Exercisable
until | | | Options at
1 January 2002 | | | Options exercised
during year | | | Options lapsed
during year | | | Options at 31 December 2002 | |
| |
|
| |
|
| |
|
| |
|
| |
|
| |
|
| |
|
| |
| 3 Mar 1997 | | | 32.01 | | | 3 Mar 2002 | | | 3 Jun 2002 | | | 5,000 | | | 5,000 | | | – | | | – | |
| 1 Jul 1998 | | | 33.31 | | | 1 Jul 2003 | | | 1 Oct 2003 | | | 5,000 | | | – | | | – | | | 5,000 | |
| 1 Jul 1999 | | | 34.76 | | | 1 Jul 2004 | | | 1 Oct 2004 | | | 5,000 | | | – | | | – | | | 5,000 | |
| 3 Apr 2000 | | | 36.36 | | | 3 Apr 2005 | | | 3 Jul 2005 | | | 5,000 | | | – | | | – | | | 5,000 | |
| 8 Jun 2000 | | | 39.48 | | | 8 Jun 2005 | | | 8 Sep 2005 | | | 5,000 | | | – | | | – | | | 5,000 | |
Banque Eurofin
shares of €16 each |
| Date of award | | | Exercise
price(€) | | | Exercisable
from | | | Exercisable
until | | | Options at
1 January 2002 | | | Options exercised during year | | | Options exercised
during year | | | Options lapsed
during year | | | Options at 31 December 2002 | |
| |
|
| |
|
| |
|
| |
|
| |
|
| |
|
| |
|
| |
|
| |
30 Nov 19981 | | | 25.92 | | | 30 Nov 2001 | | | 29 Nov 2003 | | | 7,200 | | | – | | | 4,200 | | | – | | | 3,000 | |
| 21 Dec 1999 | | | 48.78 | | | 21 Dec 2000 | | | 21 Dec 2009 | | | 66,000 | | | – | | | – | | | 5,500 | | | 60,500 | |
| 15 May 2001 | | | 93.60 | | | 15 May 2002 | | | 15 May 2011 | | | 60,000 | | | – | | | – | | | 2,300 | | | 57,700 | |
| 1 Oct 2002 | | | 100.00 | | | 2 Oct 2005 | | | 1 Oct 2012 | | | – | | | 51,100 | | | – | | | – | | | 51,100 | |
| | | | | | | | | | | | | | | | | | | | | | | | | | |
| 1 | Consideration of €1.52 per share paid on grant of options. |
CCF Banque Privée Internationale
shares of no par value |
| Date of award | | | Exercise
price(€) | | | Exercisable
from | | | Exercisable
until | | | Options at
1 January 2002 | | | Options exercised
during year | | | Options lapsed
during year | | | Options at 31 December 2002 | |
| |
|
| |
|
| |
|
| |
|
| |
|
| |
|
| |
|
| |
| 9 Mar 2000 | | | 116.93 | | | 9 Mar 2005 | | | 31 Dec 2010 | | | 18,000 | | | – | | | 500 | | | 17,500 | |
Crédit Commercial du Sud Ouest
shares of €15.25 each |
| Date of award | | | Exercise
price(€) | | | Exercisable
from | | | Exercisable
until | | | Options at
1 January 2002 | | | Options exercised
during year | | | Options lapsed
during year | | | Options at 31 December 2002 | |
| |
|
| |
|
| |
|
| |
|
| |
|
| |
|
| |
|
| |
| 1 Oct 1996 | | | 80.49 | | | 1 Oct 2001 | | | 1 Apr 2002 | | | 6,375 | | | 6,375 | | | – | | | – | |
| 7 Nov 1997 | | | 85.68 | | | 7 Nov 2002 | | | 7 Nov 2003 | | | 5,625 | | | – | | | – | | | 5,625 | |
| 8 Jul 1998 | | | 90.25 | | | 8 Jul 2003 | | | 8 Jan 2004 | | | 7,500 | | | – | | | – | | | 7,500 | |
| 9 Sep 1999 | | | 95.89 | | | 9 Sep 2004 | | | 9 Mar 2005 | | | 7,500 | | | – | | | – | | | 7,500 | |
| 7 Jun 2000 | | | 102.29 | | | 7 Jun 2005 | | | 7 Dec 2005 | | | 7,500 | | | – | | | – | | | 7,500 | |
160
Back to Contents
HSBC HOLDINGS PLC
shares of €415 each
| Date of award | | | Exercise
price(€) | | | Exercisable
from | | | Exercisable
until | | | Options at
1 January
2002 | | | Options
exercised
during year | | | Options lapsed
during year | | | Options at 31 December 2002 | |
| |
|
| |
|
| |
|
| |
|
| |
|
| |
|
| |
|
| |
| 22 Dec 1999 | | | 415 | | | 22 Dec 2004 | | | 22 Dec 2006 | | | 2,410 | | | – | | | – | | | 2,410 | |
| 19 Dec 2000 | | | 415 | | | 19 Dec 2005 | | | 19 Dec 2007 | | | 3,480 | | | – | | | 140 | | | 3,340 | |
shares of €0.5 each
| Date of award | | | Exercise
price(€) | | | Exercisable
from | | | Exercisable
until | | | Options at
1 January
2002 | | | Options
exercised
during year | | | Options lapsed
during year | | | Options at 31 December 2002 | 1 |
| |
|
| |
|
| |
|
| |
|
| |
|
| |
|
| |
|
| |
| 24 Jun 1997 | | | 6.13 | | | 24 Jun 2002 | | | 24 Dec 2002 | | | 91,200 | | | 91,200 | | | – | | | – | |
| 18 Mar 1998 | | | 8.61 | | | 18 Mar 2003 | | | 18 Sep 2003 | | | 94,400 | | | – | | | – | | | 94,400 | |
| 22 Mar 1999 | | | 21.85 | | | 22 Mar 2004 | | | 22 Sep 2004 | | | 81,000 | | | – | | | 2,000 | | | 79,000 | |
| 15 Oct 1999 | | | 18.80 | | | 15 Oct 2004 | | | 15 Apr 2005 | | | 45,000 | | | – | | | – | | | 45,000 | |
| 18 Feb 2000 | | | 18.66 | | | 18 Feb 2005 | | | 18 Aug 2005 | | | 120,500 | | | – | | | 23,000 | | | 97,500 | |
| | |
| 1 | On exercise of the options, the Sinopia shares will be exchanged for HSBC Holdings ordinary shares of US$0.50 each in the ratio of 2.143 HSBC Holdings shares for each Sinopia share. At 31 December 2002 HSBC General Trust Employee Benefit Trust held 685,549 HSBC Holdings ordinary shares of US$0.50 each which may be exchanged for Sinopia Asset Management shares arising from the exercise of options. |
shares of €16 each
| Date of award | | | Exercise
price(€) | | | Exercisable
from | | | Exercisable
until | | | Options at
1 January
2002 | | | Options
exercised
during year | | | Options lapsed
during year | | | Options at 31 December 2002 | |
| |
|
| |
|
| |
|
| |
|
| |
|
| |
|
| |
|
| |
| 3 Jul 1997 | | | 19.06 | | | 3 Jul 2002 | | | 3 Jan 2003 | | | 47,850 | | | 46,150 | | | 1,700 | | | – | |
| 25 Nov 1998 | | | 19.97 | | | 25 Nov 2003 | | | 25 May 2004 | | | 27,900 | | | – | | | – | | | 27,900 | |
| 22 Nov 1999 | | | 33.54 | | | 22 Nov 2004 | | | 22 May 2005 | | | 27,900 | | | – | | | 1,700 | | | 26,200 | |
| 12 Jul 2000 | | | 47.81 | | | 12 Jul 2005 | | | 12 Jan 2006 | | | 28,400 | | | – | | | 2,000 | | | 26,400 | |
| |
| |
| |
| |
Valuation of freehold and leasehold land and buildings
|
HSBC’s freehold and long leasehold properties, together with all leasehold properties in the Hong Kong SAR, were revalued in September 2002 in accordance with HSBC’s policy of annual valuation. As a result of this revaluation, the net book value of land and buildings has decreased by US$359 million.
Further details are included in Note 25 of the ‘Notes on the Financial Statements’.
The objectives of the management structures within HSBC, headed by the Board of Directors of HSBC Holdings and led by the Group Chairman, are to deliver sustainable value to shareholders. Implementation of the strategy set by the Board is delegated to the Group Executive Committee under the leadership of the Group Chief Executive.
The Board meets regularly and Directors receive information between meetings about the activities of committees and developments in HSBC’s business. All Directors have full and timely access to all relevant information and may take independent professional advice if necessary.
161
Back to Contents
HSBC HOLDINGS PLC
Report of the Directors (continued)
|
The Directors who served during the year were Sir John Bond, Baroness Dunn, Sir Brian Moffat, Sir Keith Whitson, Lord Butler, R K F Ch’ien, C F W de Croisset, W R P Dalton, D G Eldon, D J Flint, W K L Fung, S K Green, S Hintze, A W Jebson, Sir John Kemp-Welch, Lord Marshall, Sir Mark Moody-Stuart, M Murofushi, S W Newton, C E Reichardt, H Sohmen, Sir Adrian Swire, C S Taylor and Sir Brian Williamson.
M Murofushi, C E Reichardt and Sir Adrian Swire retired on 31 May 2002.
S W Newton, C S Taylor and Sir Brian Williamson were appointed Directors on 27 September 2002. Having been appointed since the last Annual General Meeting, they will retire at the forthcoming Annual General Meeting and offer themselves for election.
On 14 November 2002 it was announced that W F Aldinger will be invited to join the Board subject to the completion of the acquisition of Household.
R K F Ch’ien, S K Green, A W Jebson, Sir Brian Moffat, H Sohmen and Sir Keith Whitson will retire by rotation at the forthcoming Annual General Meeting. With the exception of Sir Keith Whitson, who is to retire, they will offer themselves for re-election.
S K Green will succeed Sir Keith Whitson as Group Chief Executive and A W Jebson will take up the new position of Group Chief Operating Officer following the Annual General Meeting.
Brief biographical particulars for each Director are set out on pages 149 to 151.
None of the Directors had, during the year or at the end of the year, a material interest, directly or indirectly, in any contract of significance with HSBC Holdings or any of its subsidiary undertakings.
The Board has appointed a number of committees consisting of certain Directors and Group General Managers. The following are the principal committees:
Group Executive Committee |
The Group Executive Committee meets regularly and operates as a general management committee under the direct authority of the Board. The members of the Group Executive Committee are Sir Keith Whitson (Chairman), Sir John Bond, C F W de Croisset, W R P Dalton, D G Eldon, D J Flint, S K Green and A W Jebson, all of whom are executive Directors, and R J Arena, C-H Filippi, A P Hope, M B McPhee, A Mehta and Y A Nasr, all of whom are Group General Managers.
The Group Audit Committee meets regularly with HSBC’s senior financial, internal audit, legal and compliance management and the external auditor to consider HSBC Holdings financial reporting, the nature and scope of audit reviews and the effectiveness of the systems of internal control and compliance. The members of the Group Audit Committee are Sir Brian Moffat (Chairman), R K F Ch’ien and Sir John Kemp-Welch, all of whom are independent non-executive Directors.
The role of the Remuneration Committee and its membership are set out in the Directors’ Remuneration Report on page 170.
The Nomination Committee carries out the process of nominating candidates to fill vacancies on the Board of Directors. Nominations are considered by the Board. All Directors are subject to election by shareholders at the Annual General Meeting following their appointment and to re-election at least every three years. The members of the Nomination Committee are Baroness Dunn (Chairman), Lord Butler, H Sohmen and Sir Brian Moffat.
HSBC is committed to high standards of corporate governance. HSBC Holdings has complied throughout the year with the best practice provisions of the Combined Code on corporate governance appended to the Listing Rules of the Financial Services Authority and with the provisions of Appendix 14 to the Rules Governing the Listing of Securities on The Stock Exchange of Hong Kong.
162
Back to Contents
HSBC HOLDINGS PLC
The Directors are responsible for internal control in HSBC and for reviewing its effectiveness. Procedures have been designed for safeguarding assets against unauthorised use or disposition; for maintaining proper accounting records; and for the reliability of financial information used within the business or for publication. Such procedures are designed to manage rather than eliminate the risk of failure to achieve business objectives and can only provide reasonable and not absolute assurance against material errors, losses or fraud. The procedures also enable HSBC Holdings to discharge its obligations under the Handbook of Rules and Guidance issued by the Financial Services Authority, HSBC’s lead regulator.
The key procedures that the Directors have established are designed to provide effective internal control within HSBC and accord with the Internal Control Guidance for Directors on the Combined Code issued by the Institute of Chartered Accountants in England and Wales. Such procedures have been in place throughout the year and up to 3 March 2003, the date of approval of the Annual Report and Accounts. In the case of companies acquired during the year, including GF Bital, the internal controls in place are being reviewed against HSBC’s benchmarks and they are being integrated into HSBC’s systems. HSBC’s key internal control procedures include the following:
| • | Authority to operate the various subsidiaries is delegated to their respective chief executive officers within limits set by the Board of Directors of HSBC Holdings or by the Group Executive Committee under powers delegated by the Board. Sub-delegation of authority from the Group Executive Committee to individuals requires these individuals, within their respective delegation, to maintain a clear and appropriate apportionment of significant responsibilities and to oversee the establishment and maintenance of systems of controls appropriate to the business. The appointment of executives to the most senior positions within HSBC requires the approval of the Board of Directors of HSBC Holdings. |
| | |
| • | Functional, operating, financial reporting and certain management reporting standards are established by Group Head Office management for application across the whole of HSBC. These are supplemented by operating standards set by the local management as required for the type of business and geographical location of each subsidiary. |
| | |
| • | Systems and procedures are in place in HSBC to identify, control and report on the major risks including credit, changes in the market prices of financial instruments, liquidity, operational error, unauthorised activities and fraud. Exposure to these risks is monitored by asset and liability committees and executive committees in subsidiaries and by the Group Executive Committee for HSBC as a whole. |
| | |
| • | Comprehensive annual financial plans are prepared by subsidiaries and are reviewed and approved at Group Head Office. Results are monitored regularly and reports on progress as compared with the related plan are prepared throughout HSBC each quarter. A strategic plan is prepared by major operating subsidiaries every three years. |
| | |
| • | Centralised functional control is exercised over all computer system developments and operations. Common systems are employed where possible for similar business processes. Credit and market risks are measured and reported on in subsidiaries and aggregated for review of risk concentrations on a group-wide basis. |
| | |
| • | Responsibilities for financial performance against plans and for capital expenditure, credit exposures and market risk exposures are delegated with limits to line management in the subsidiaries. In addition, functional management in Group Head Office has been given responsibility to set policies, procedures and standards in the areas of finance; legal and regulatory compliance; internal audit; human resources; credit; market risk; operational risk; computer systems and operations; property management; and for certain global product lines. |
163
Back to Contents
HSBC HOLDINGS PLC
Report of the Directors (continued)
|
| • | Policies and procedures to guide subsidiary companies and management at all levels in the conduct of business to avoid reputational risk are established by the Board of HSBC Holdings, the Group Executive Committee, subsidiary company boards, board committees or senior management. Reputational risks can arise from social, ethical or environmental issues, or as a consequence of operational risk events. As a banking group, HSBC’s good reputation depends upon the way in which it conducts its business but it can also be affected by the way in which clients, to which it provides financial services, conduct their business. |
| | |
| • | The internal audit function, which is centrally controlled, monitors compliance with policies and standards and the effectiveness of internal control structures across the whole of HSBC. The work of the internal audit function is focused on areas of greatest risk to HSBC as determined by a risk management approach. The head of this function reports to the Group Chairman and the Group Audit Committee. |
The Group Audit Committee has kept under review the effectiveness of this system of internal control and has reported regularly to the Board of Directors. The key processes used by the Committee in carrying out its reviews include regular reports from the heads of key risk functions; the production and regular updating of summaries of key controls applied by subsidiary companies measured against HSBC benchmarks which cover all internal controls, both financial and non-financial; annual confirmations from chief executives of principal subsidiary companies that there have been no material losses, contingencies or uncertainties caused by weaknesses in internal controls; internal audit reports; external audit reports; prudential reviews; and regulatory reports.
The Directors, through the Group Audit Committee, have conducted an annual review of the effectiveness of HSBC’s system of internal control covering all controls, including financial, operational and compliance controls and risk management.
Reputational, Strategic and Operational Risk
|
HSBC regularly updates its policies and procedures for safeguarding against reputational, strategic and operational risks. This is an evolutionary process which now takes account of The Association of British Insurers’ guidance on best practice when responding to social, ethical and environmental (SEE) risks.
The safeguarding of HSBC’s reputation is of paramount importance to its continued prosperity and is the responsibility of every member of staff. HSBC has always operated to the highest standards of conduct and, as a matter of routine, takes account of reputational risks to its business. The training of Directors on appointment includes reputational matters.
Reputational risks, including SEE matters, are considered and assessed by the Board, the Group Executive Committee, subsidiary company boards, board committees and/or senior management during the formulation of policy and the establishment of HSBC standards. Standards on all major aspects of business are set for HSBC Group and for individual subsidiary companies, businesses and functions. These policies, which form an integral part of the internal control systems, and which were strengthened considerably during 2002, are communicated through manuals and statements of policy and are promulgated through internal communications. The policies include social, ethical and environmental issues and set out operational procedures in all areas of reputational risk, including money laundering deterrence, environment impact, anti-corruption measures and employee relations. The policy manuals address risk issues in detail and co-operation between head office departments and businesses is required to ensure a strong adherence to HSBC’s risk management system and its corporate social responsibility practices.
Internal controls are an integral part of how HSBC conducts its business. HSBC’s manuals and statements of policy are the foundation of these internal controls. There is a strong process in place to ensure controls operate effectively. Any significant failings are reported through the control mechanisms, internal audit and compliance functions to subsidiary company audit committees and to the Group Audit Committee, which keeps under review the effectiveness of the system of internal controls and reports regularly to HSBC Holdings’ Board. In addition, all Group businesses and major functions are required to review their control procedures and to make regular reports about any losses arising from operational risks.
164
Back to Contents
HSBC HOLDINGS PLC
KPMG continues to assist HSBC in developing systems to quantify the key direct environmental impact of its principal operations around the world. This third party scrutiny of the environmental reporting system supports HSBC’s internal risk management procedures. HSBC is a participant in the Dow Jones Sustainability, FTSE4Good and Business in Environment indices. Further details are contained in the HSBC in the Community brochure which is published to coincide with each Annual General Meeting.
The maintenance of appropriate health and safety standards throughout HSBC remains a key responsibility of all managers and HSBC is committed to actively managing all health and safety risks associated with its business. HSBC’s objectives are to identify, remove, reduce or control material risks of fires and of accidents or injuries to employees and visitors.
Health and Safety Policies, Group standards and procedures are set by Group Fire and Safety and are implemented by Health, Safety and Fire Co-ordinators based in each country in which HSBC operates.
Communication with shareholders
|
Communication with shareholders is given high priority. Extensive information about HSBC’s activities is provided in the Annual Report and Accounts, Annual Review and the Interim Report which are sent to shareholders. There is regular dialogue with institutional investors and enquiries from individuals on matters relating to their shareholdings and the business of HSBC are welcomed and are dealt with in an informative and timely manner. All shareholders are encouraged to attend the Annual General Meeting or the informal meeting of shareholders held in Hong Kong to discuss the progress of HSBC.
According to the registers of Directors’ interests maintained by HSBC Holdings pursuant to section 325 of the Companies Act 1985 and section 29 of the Securities (Disclosure of Interests) Ordinance, the Directors of HSBC Holdings at the year-end had the following interests, all beneficial unless otherwise stated, in the shares and loan capital of HSBC:
165
Back to Contents
HSBC HOLDINGS PLC
Report of the Directors (continued)
|
| | | | At
1 January | | At 31 December 2002 | |
| | | | 2002 | | | Personal | | | Family | | | Corporate | | | Other | | | Total | |
| | |
| |
| |
HSBC Holdings ordinary shares of US$0.50 | | | | | | | | | | | | | | | | | | | |
Sir John Bond1 | | | 273,841 | | | 271,060 | | | 3,309 | | | – | | | – | | | 274,369 | |
| R K F Ch’ien | | | 23,671 | | | 24,273 | | | – | | | – | | | – | | | 24,273 | |
C F W de Croisset1 | | | 34,170 | | | 35,664 | | | – | | | – | | | – | | | 35,664 | |
W R P Dalton1 | | | 21,484 | | | 22,624 | | | – | | | – | | | – | | | 22,624 | |
| Baroness Dunn | | | 131,477 | | | 112,172 | | | – | | | – | | | 24,000 | 2 | | 136,172 | |
D G Eldon1 | | | 13,419 | | | 12,816 | | | 863 | | | – | | | – | | | 13,679 | |
D J Flint1 | | | 30,173 | | | 35,590 | | | 1,789 | | | – | | | – | | | 37,379 | |
| W K L Fung | | | 328,000 | | | 328,000 | | | – | | | – | | | – | | | 328,000 | |
S K Green1 | | | 127,804 | | | 159,271 | | | 14,337 | | | – | | | – | | | 173,608 | |
A W Jebson1 | | | 20,859 | | | 45,254 | | | – | | | – | | | – | | | 45,254 | |
| Sir John Kemp-Welch | | | 331,800 | | | 25,000 | | | – | | | – | | | 381,800 | 2 | | 406,800 | |
| Lord Marshall | | | 7,261 | | | 7,578 | | | – | | | – | | | – | | | 7,578 | |
| Sir Brian Moffat | | | 5,289 | | | 5,640 | | | – | | | – | | | – | | | 5,640 | |
| Sir Mark Moody-Stuart | | | 5,840 | | | 5,000 | | | 840 | | | – | | | – | | | 5,840 | |
| H Sohmen | | | 2,815,144 | | | – | | | 382,138 | | | 2,504,636 | 3 | | – | | | 2,886,774 | |
C S Taylor4 | | | 500 | | | 500 | | | – | | | – | | | – | | | 500 | |
Sir Keith Whitson1 | | | 121,484 | | | 101,687 | | | 20,000 | | | – | | | – | | | 121,687 | |
Sir Brian Williamson4 | | | 14,500 | | | 14,500 | | | – | | | – | | | – | | | 14,500 | |
| | | | | | | | | | | | | | | | | | |
HSBC Holdings 11.69 per cent subordinated bonds 2002 of £15 | | | | | | | | | | | | | | | | | | | |
| Sir John Bond | | | 500,000 | | | – | | | – | | | – | | | – | | | – | |
| A W Jebson | | | 100,000 | | | – | | | – | | | – | | | – | | | – | |
| Lord Marshall | | | 975 | | | – | | | – | | | – | | | – | | | – | |
| | |
| 1 | Details of additional interests in ordinary shares of US$0.50 each under the share option plans and Restricted Share Plan are set out on pages 183 to 185 of the Directors’ Remuneration Report. |
| 3 | Interests held by private investment companies. |
| 4 | Interests at 27 September 2002 – date of appointment. |
| 5 | Redeemed on 31 July 2002. |
Sir John Bond has a personal interest in £290,000 of HSBC Capital Funding (Sterling 1) L.P. 8.208 per cent Non-cumulative Step-up Perpetual Preferred Securities, which he held throughout the year.
D G Eldon has a personal interest in 300 Hang Seng Bank Limited ordinary shares of HK$5.00 each, which he held throughout the year.
S K Green has a personal interest in €75,000 of HSBC Holdings plc 51/2 per cent Subordinated Notes 2009 and in £100,000 of HSBC Bank plc 9 per cent Subordinated Notes 2005, which he held throughout the year.
H Sohmen has a corporate interest in £1,200,000 of HSBC Bank plc 9 per cent Subordinated Notes 2005, in US$3,000,000 of HSBC Bank plc Senior Subordinated Floating Rate Notes 2009, in US$3,000,000 of HSBC Capital Funding (Dollar 1) L.P. 9.547 per cent Non-cumulative Step-up Perpetual Preferred Securities, Series 1 and in US$2,900,000 of HSBC Finance Nederland BV 7.40 per cent securities 2003, which he held throughout the year.
As Directors of CCF S.A., C F W de Croisset, W R P Dalton and S K Green, each have a personal interest in one share of €5 each in that company, which they held throughout the year. The Directors have waived their rights to receive dividends on these shares and undertaken on cessation of this directorship to transfer these shares to HSBC.
166
Back to Contents
HSBC HOLDINGS PLC
Following the acquisition of CCF in 2000, HSBC Holdings ordinary shares of US$0.50 each were purchased by the HSBC Holdings General Employee Benefit Trust. These shares may be exchanged for CCF shares upon the exercise of CCF employee share options in the same ratio as the Exchange Offer for CCF (13 HSBC Holdings ordinary shares of US$0.50 for each CCF share). As a potential beneficiary of the Trust, C F W de Croisset has a technical interest in all of the shares held by the Trust. At 31 December 2002, the Trust held 35,745,555 HSBC Holdings ordinary shares of US$0.50 each.
Save as stated above and in the Directors’ Remuneration Report, none of the Directors had an interest in any shares or debentures of any Group company at the beginning or at the end of the year.
Since the end of the year, the beneficial interests of Sir John Bond, W R P Dalton, D J Flint, S K Green and Sir Keith Whitson each increased by 19 HSBC Holdings ordinary shares of US$0.50 each, which were acquired by Computershare Trustees Limited using monthly contributions to the HSBC UK Share Ownership Plan. The automatic reinvestment of a tax credit carried forward by an Individual Savings Account manager has resulted in the family interests of D J Flint being increased by one HSBC Holdings ordinary share of US$0.50. There have been no other changes in Directors’ interests from 31 December 2002 to the date of this Report. Any subsequent changes up to the last practicable date before the publication of the ‘Notice of Annual General Meeting’ will be set out in the notes to that Notice.
At 31 December 2002, Directors and Senior Management held, in aggregate, beneficial interests in 12,202,827 HSBC Holdings ordinary shares of US$0.50 each (0.13 per cent of the issued ordinary shares).
HSBC Holdings continues to regard communication with its employees as a key aspect of its policies. Information is given to employees about employment matters and about the financial and economic factors affecting HSBC’s performance through management channels, in-house magazines and by way of attendance at internal seminars and training programmes. Employees are encouraged to discuss operational and strategic issues with their line management and to make suggestions aimed at improving performance. The involvement of employees in the performance of HSBC is further encouraged through participation in bonus and share option plans as appropriate.
About half of all HSBC employees now participate in one or more of HSBC’s employee share plans.
Employment of disabled persons
|
HSBC Holdings continues to be committed to providing equal opportunities to employees. The employment of disabled persons is included in this commitment and the recruitment, training, career development and promotion of disabled persons is based on the aptitudes and abilities of the individual. Should employees become disabled during employment, every effort is made to continue their employment and, if necessary, appropriate training is provided.
HSBC Holdings subscribes to the Better Payment Practice Code for all suppliers, the four principles of which are: to agree payment terms at the outset and stick to them; to explain payment procedures to suppliers; to pay bills in accordance with any contract agreed with the supplier or as required by law; and to tell suppliers without delay when an invoice is contested and settle disputes quickly. Copies of, and information about, the Code are available from: The Department of Trade and Industry, 1 Victoria Street, London SW1H 0ET.
It is HSBC Holdings’ practice to organise payment to its suppliers through a central accounts function operated by its subsidiary undertaking, HSBC Bank plc. Included in the balance with HSBC Bank plc is the amount due to trade creditors which, at 31 December 2002, represented 15 days’ average daily purchases of goods and services received from such creditors, calculated in accordance with the Companies Act 1985, as amended by Statutory Instrument 1997/571.
Substantial interests in share capital
|
According to the register maintained under section 211 of the Companies Act 1985, Legal and General Investment Management Limited notified HSBC Holdings on 11 June 2002 that it had an interest in 284,604,788 HSBC Holdings ordinary shares, representing 3.01 per cent of the ordinary shares in issue at that date. On 21 January 2003 the Hong Kong Monetary Authority gave notice that the Hong Kong Special Administrative Region Government had ceased to have a notifiable interest in 3 per cent or more of HSBC Holdings ordinary shares.
167
Back to Contents
HSBC HOLDINGS PLC
Report of the Directors (continued)
|
No substantial interest, being 10 per cent or more, in any of the equity share capital is recorded in the register maintained under section 16(1) of the Securities (Disclosure of Interests) Ordinance.
Dealings in HSBC Holdings plc shares
|
Save for dealings by HSBC Investment Bank plc (until 29 November 2002) and HSBC Bank plc (since 30 November 2002) trading as intermediaries in HSBC Holdings’ shares in London, and the redemption on 31 July 2002 by HSBC Holdings of £413,000,000 11.69 per cent Subordinated Bonds 2002 of £1 each, neither HSBC Holdings nor any subsidiary undertaking has bought, sold or redeemed any securities of HSBC Holdings during the 12 months ended 31 December 2002.
The following constituted a connected transaction under the rules of The Stock Exchange of Hong Kong Limited.
In January 2003 CCF, a subsidiary of HSBC Holdings, agreed to acquire, subject to regulatory approval, 11.31% of the capital of Banque Eurofin S.A. (‘Eurofin’) jointly held by Jean and Odon Vallet. Odon Vallet is a Director of Eurofin. The consideration of €15.05 million in cash is payable on completion. The transaction will increase CCF’s interest in Eurofin from 59.9% to 71.21%.
Since 1999 Lord Butler has, at the Board’s request, taken a policy overview of HSBC in the Community, the principal objectives of which are to support access to primary and secondary education for those who are disadvantaged and the Environment. In addition, Lord Butler is Chairman of the HSBC Education Trust, which began operation in 2001.
Considerable progress continues to be made in these important areas.
On 21 February 2002, HSBC’s five-year partnerships, called ‘Investing in Nature’, with Botanic Gardens Conservation International (“BGCI”), Earthwatch and WWF, were announced.
To date more than 190 of our employees from 39 countries have participated in Earthwatch projects in 25 countries. BGCI have also listed and conserved 8,000 threatened plant species out of a five year target of 20,000. WWF have selected project administration sites in Brazil, China and the UK with the USA to follow. HSBC has committed to providing US$50 million in funding over five years in supporting these partnerships. Further information is available in the HSBC in the Community brochure.
During the year, HSBC made charitable donations totalling US$34,500,000. Of this amount, US$16,700,000 was given for charitable purposes in the United Kingdom.
No political donations were made during the year.
At the Annual General Meeting in 2002 shareholders gave authority for HSBC Holdings and HSBC Bank plc to make political donations and incur political expenditure up to a maximum aggregate sum of £250,000 and £50,000 respectively as a precautionary measure in light of the wide definitions in The Political Parties, Elections and Referendums Act 2000. These authorities have not been used and it is not proposed that HSBC’s longstanding policy of not making contributions to any political party be changed. However, as a precautionary measure a resolution will again be proposed at the Annual General Meeting. On this occasion it is intended that these precautionary authorities should cover a period of four years. At the Annual General Meeting in 2002 shareholders gave authority in these amounts for one year.
The Annual General Meeting of HSBC Holdings will be held at the Barbican Hall, Barbican Centre, London EC2 on Friday 30 May 2003 at 11.00 am.
An informal meeting of shareholders will be held at Level 28, 1 Queen’s Road Central, Hong Kong on Tuesday 27 May 2003 at 4.30 pm.
A live webcast of the Annual General Meeting will be available on www.hsbc.com. From shortly after the conclusion of the Meeting until 30 June 2003 a recording of the proceedings will be available on www.hsbc.com.
168
Back to Contents
HSBC HOLDINGS PLC
KPMG Audit Plc has expressed its willingness to continue in office. The Group Audit Committee and the Board recommend that it be reappointed. A resolution proposing the reappointment of KPMG Audit Plc as auditor of HSBC Holdings and giving authority to the Directors to determine its remuneration will be submitted to the forthcoming Annual General Meeting.
On behalf of the Board
R G Barber, Secretary 3 March 2003
169
Back to Contents
HSBC HOLDINGS PLC
Directors’ Remuneration Report
|
The Remuneration Committee meets regularly to consider human resource issues, particularly terms and conditions of employment, remuneration, retirement benefits, development of high potential employees and key succession planning. During 2002, the members of the Remuneration Committee were W K L Fung, Sir John Kemp-Welch, Lord Marshall and Sir Mark Moody-Stuart, all of whom were independent non-executive Directors. Sir Mark Moody-Stuart succeeded Lord Marshall, who retired as a member of the Committee, as Chairman of the Committee on 1 January 2003.
The Remuneration Committee retains the services of Towers Perrin, a specialist remuneration consulting firm, who provide advice on executive pay issues. The Remuneration Committee also receives advice from the Group General Manager, Group Human Resources and the Senior Executive, Group Reward Management. Towers Perrin also provide other remuneration, actuarial and retirement consulting services to various parts of the HSBC Group. Other consultants are used from time to time to validate their findings.
In common with most businesses, HSBC’s performance depends on the quality and commitment of its people. Accordingly, the Board’s stated strategy is to attract, retain and motivate the very best people.
In a business that is based on trust and relationships, HSBC’s broad policy is to look for people who want to make a long-term career with the organisation because trust and relationships are built over time.
Remuneration is an important component in people’s decisions on which company to join, but it is not the only one; it is HSBC’s experience that people are attracted to an organisation with good values, fairness, the potential for success and the scope to develop a broad, interesting career.
Within the authority delegated by the Board of Directors, the Remuneration Committee is responsible for determining the remuneration policy of HSBC including the terms of bonus plans, share option plans and other long-term incentive plans, and for agreeing the individual remuneration packages of executive Directors and other senior Group employees. No Directors are involved in deciding their own remuneration.
The Remuneration Committee applies the following key principles:
| • | to pay against a market of comparative organisations |
| | |
| • | to offer fair and realistic salaries with an important element of variable pay based on relative performance |
| | |
| • | to have as many top-performers as possible at all levels within HSBC participating in some form of long-term share plan |
| | |
| • | since 1996, to follow a policy of moving progressively from defined benefit to defined contribution Group pension schemes for new employees only. |
| |
| |
| |
| Basic salary and benefits |
Salaries are reviewed annually in the context of individual and business performance, market practice, internal relativities and competitive market pressures. Allowances and benefits are largely determined by local market practice.
| Annual performance-related payments |
The level of performance-related variable pay depends upon the performance of HSBC Holdings, constituent businesses and the individual concerned. Key measures of success include achievement of financial goals, concerning both revenue generation and expense control; customer relationships; full utilisation of professional skills; and adherence to HSBC’s ethical standards. HSBC has a long history of paying close attention to its customers in order to provide value for shareholders. This has been achieved by ensuring that the interests of HSBC and its staff are aligned with those of its shareholders and that HSBC’s approach to risk management serves the interests of all. Closer alignment with the interests of shareholders continues to be achieved through the promotion and extension of employee participation in the existing share plans.
170
Back to Contents
HSBC HOLDINGS PLC
Bonus ranges are reviewed in the context of prevailing market practice and overall remuneration.
In order to align the interests of staff with those of shareholders, share options are awarded to employees under the HSBC Holdings Group Share Option Plan and the HSBC Holdings savings-related share option plans. When share options are granted, which are to be satisfied by the issue of new shares, the impact on existing equity is shown in diluted earnings per share on the face of the consolidated profit and loss account, with further details being disclosed in Note 11 of the ‘Notes on the Financial Statements’. The dilutive effect of exercising all outstanding share options would be 0.5 per cent of basic earnings per share.
For the majority of employees, the vesting of share awards under the HSBC Holdings Group Share Option Plan is subject to the attainment of total shareholder return (‘TSR’) targets (full details are set out on pages 174 to 177). Separate transitional arrangements are currently in place for those employed by CCF. The Remuneration Committee seeks to respond to the variety of environments and circumstances which are faced by different businesses in different markets at different times.
The HSBC Holdings Restricted Share Plan 2000 is intended to align the interests of executives with those of shareholders by linking executive awards to the creation of superior shareholder value. This is achieved by focusing on predetermined targets. The shares awarded are normally held under restrictions for five years and are transferred to the individuals only after attainment of a performance condition which demonstrates the sustained and above average financial performance of HSBC.
Executive Directors and Group General Managers have been eligible to receive conditional awards of Performance Shares under the HSBC Holdings Restricted Share Plan and the HSBC Holdings Restricted Share Plan 2000 since 1997. The award of Performance Shares under these plans was extended to other senior executives from 1999.
In appropriate circumstances, employees may receive awards under the HSBC Holdings Restricted Share Plan 2000 and the HSBC Holdings Group Share Option Plan. Participants, including executive Directors and Senior Management, in these Plans are also eligible to participate in the HSBC Holdings savings-related share option plans on the same terms as other eligible employees.
As part of HSBC’s strategy, the use of the existing share plans has been extended so that more employees participate in the success they help to create. In the UK, the HSBC Holdings UK Share Ownership Plan enables employees to purchase HSBC Holdings shares from pre-tax salary. In addition, employees in France may participate in a Plan d’ Epargne Entreprise through which they may subscribe for HSBC Holdings shares.
Directors and Senior Management |
HSBC Holdings’ Board is currently composed of 13 non-executive Directors and eight executive Directors. With businesses in 80 countries and territories, HSBC aims to attract Directors with a variety of different experience, both in its key markets and internationally. The Board currently includes nationals of seven different countries. The eight executive Directors and 27 Group General Managers have in total more than 800 years of service with HSBC.
The aggregate remuneration of Directors and Senior Management for the year ended 31 December 2002 was US$70,886,000.
The aggregate amount set aside or accrued to provide pension, retirement or similar benefits for Directors and Senior Management for the year ended 31 December 2002 was US$3,864,000.
At 31 December 2002, executive Directors and Senior Management held, in aggregate, options to subscribe for 2,036,492 ordinary shares of US$0.50 each in HSBC Holdings under the HSBC Holdings Executive Share Option Scheme, HSBC Holdings Group Share Option Plan and HSBC Holdings savings-related share option plans. These options are exercisable between 2003 and 2012 at prices ranging from £2.1727 to £8.712.
171
Back to Contents
HSBC HOLDINGS PLC
Directors’ Remuneration Report
|
Directors’ fees are regularly reviewed and compared with other large international companies. The current basic fee is £35,000 per annum.
In addition, non-executive Directors receive with effect from 1 January 2003 the following fees:
| Chairman, Audit Committee | £15,000 p.a.
|
| Member, Audit Committee | £10,000 p.a. |
During 2002 six Audit Committee meetings were held. A Director’s commitment to each meeting can be as much as 15 hours.
| Chairman, Remuneration Committee | £15,000 p.a.
|
| Member, Remuneration Committee | £10,000 p.a. |
During 2002, seven meetings of the Remuneration Committee were held.
| Non-executive Director responsible for policy overview of HSBC in the Community | £10,000 p.a. |
Executive Directors are normally permitted to retain only one Directors’ fee from HSBC. Executive Directors who are also Directors of The Hongkong and Shanghai Banking Corporation Limited may elect to receive a fee from either HSBC Holdings or The Hongkong and Shanghai Banking Corporation Limited.
| Executive Directors’ remuneration |
HSBC’s operations are large, diverse and international; for example, more than 60 per cent of net income is derived from outside the United Kingdom.
The executive Directors are experienced executives with detailed knowledge of the financial services business in various countries. In most cases there has been a need to attract them from abroad to work in the United Kingdom.
It became clear to the Board over three years ago that executive Directors’ total remuneration had fallen steadily behind the competition. This became apparent from ‘league tables’ in the press, surveys from remuneration consultants, comparisons with top executives in acquired companies such as Republic Bank of New York and CCF and, perhaps above all, from the fact that some of the next generation of top management, due to the need to retain market competitiveness in certain overseas locations, were already being paid more than the current executive Directors.
The market survey conducted in 2000 confirmed the need to make major changes in order to bring total remuneration to the chosen competitive position for this group of executives, i.e. the 75th percentile of market comparators. Recent information shows that, even with the action taken, total remuneration for this group remains below the 75th percentile in 2003.
There are four key components of executive Directors’ remuneration:
Base salaries with effect from April 2003 will be:
| | Sir John Bond | | | £970,000 | |
| | C F W de Croisset | | | €541,660 | |
| | W R P Dalton | | | £496,500 | |
| | D G Eldon | | | US$286,752 | |
| | D J Flint | | | £440,500 | |
| | S K Green | | | £470,500 | |
| | A W Jebson | | | £440,000 | |
| | Sir Keith Whitson | | | £790,000 | |
| | | | | | |
| | D G Eldon’s current base salary, as an International Manager, shown above, is calculated on a net basis and will be subject to a separate review in April 2003. |
| | |
| | This represents an average increase from 2002 of 4.3 per cent. |
| | |
| | Cash bonuses for executive Directors and members of Senior Management are based on two key factors: individual performance taking account of, as appropriate, results against plan of the business unit or performance of the support function for which the individual has responsibility; and Group performance measured by operating profit before tax against plan. The Remuneration Committee has discretion to eliminate extraordinary items when assessing bonuses, if the main cause did not arise during the current bonus year. |
| | |
| | From 2002, combining these two key performance factors may result in cash bonuses ranging from 35 per cent to 250 per cent of basic salary (against Group performance ranging from within 10 per cent of plan to 50 per cent above plan). Actual awards have ranged from 40 per cent to 195 per cent with only three awards being greater than 100 per cent. |
172
Back to Contents
HSBC HOLDINGS PLC
| iii | Long Term Incentive Plan (LTIP)
|
| | Executive Directors and members of Senior Management have been eligible to receive conditional awards of Performance Shares under the HSBC Holdings Restricted Share Plan and the HSBC Holdings Restricted Share Plan 2000 since 1997.
|
| | Full details of the 2003 conditional awards to executive Directors, together with vesting arrangements, are set out on pages 174 to 175.
|
| | It is the Remuneration Committee’s current intention that the annual value of awards to executive Directors and members of Senior Management will not as a general rule exceed 100 per cent of earnings (defined as base salary and bonus in respect of the previous performance year).
|
| | In appropriate circumstances, executive Directors and members of Senior Management may receive awards under the HSBC Holdings Restricted Share Plan 2000 and the HSBC Holdings Group Share Option Plan. In line with prevailing practice in France and arrangements made at the time of the acquisition of CCF, C F W de Croisset will receive an award of options to acquire shares under the HSBC Holdings Group Share Option Plan, instead of an award under the HSBC Holdings Restricted Share Plan 2000; particulars are set out on page 174.
|
| | The pension entitlements earned by the executive Directors during the year are set out on pages 181 to 182.
|
| | Only basic salary is pensionable. No other Director participated in any Group pension schemes and none of the Directors participating in Group ‘approved’ pension schemes is subject to the earnings cap introduced by the 1989 Finance Act.
|
| | The increase in accrued pension benefits during 2002 were: |
| | | | Increase in accrued pension during 2002, excluding any increase for inflation
£000 | | | Transfer value (less personal contributions) at 31 December 2002 relating to increase in accrued pensions during 2002
£000 | 1 |
| | | | | | | | |
| | |
|
| |
|
| |
| Sir John Bond | | | 15 | | | 272 | |
| C F W de Croisset | | | 7 | | | 74 | |
| W R P Dalton | | | (5 | )2 | | (74 | ) |
| D G Eldon | | | 17 | | | 325 | |
| S K Green | | | 16 | | | 196 | |
| A W Jebson | | | 15 | | | 171 | |
| Sir Keith Whitson | | | 26 | | | 462 | |
| | |
| 1 | The transfer value represents a liability of HSBC’s pension funds and not a sum paid or due to the individual; it cannot therefore meaningfully be added to annual remuneration.
|
| 2 | While the accrued pension has increased marginally, after excluding the impact of inflation in Canada and movements in exchange rates, the transfer value has decreased. |
173
Back to Contents
HSBC HOLDINGS PLC
Directors’ Remuneration Report (continued)
|
The Remuneration Committee has proposed to the Trustee of the HSBC Holdings Restricted Share Plan 2000 that conditional awards of Performance Shares under the Plan should be made in 2003 as set out below. The Trustee to the Plan will be provided with funds to acquire ordinary shares of US$0.50 each at an appropriate time after the announcement of the annual results. The 2003 awards proposed for executive Directors and members of Senior Management in respect of 2002 will have an aggregate value at the date of award of £11.4 million including awards to the following values to executive Directors:
| | | | £000 | |
| | |
|
| |
| Sir John Bond | | | 1,100 | |
| W R P Dalton | | | 750 | |
| D G Eldon | | | 500 | |
| D J Flint | | | 750 | |
| S K Green | | | 750 | |
| A W Jebson | | | 750 | |
| | |
|
| |
| Total | | | 4,600 | |
| | |
|
| |
No share options will be granted under the HSBC Holdings Group Share Option Plan in respect of 2002 to the executive Directors listed above; they have not received share option awards since the HSBC Holdings Restricted Share Plan was introduced in 1997.
No award under the HSBC Holdings Restricted Share Plan 2000 will be made to C F W de Croisset in respect of 2002. Mr de Croisset will instead receive an award of options to acquire 206,000 ordinary shares of US$0.50 each under the HSBC Group Share Option Plan. Taking account of market practice in France, transitional arrangements will gradually align share options awards in CCF more closely with those elsewhere in HSBC. In this respect only 50 per cent of the above-mentioned award will be subject to the same TSR performance conditions set out below for the HSBC Holdings Restricted Share Plan 2000. Any future share option awards he may receive will be wholly subject to these performance conditions. In accordance with the arrangements agreed at the acquisition of CCF in 2000, the HSBC Group Share Option Plan awards made to Mr de Croisset in 2001 and 2002 were not subject to performance conditions.
The 1998 Restricted Share Plan awards were subject to performance conditions of earnings per share, to be achieved in whole or in part, as follows:
| • | earnings per share in the year 2001 (the fourth year of the performance period) to be greater than earnings per share in 1997 (the base year for the calculation) by a factor equivalent to the composite rate of inflation (a weighted average of inflation in the UK, USA and Hong Kong) plus 2 per cent, compounded over each year of the performance period; |
| • | earnings per share to increase relative to the previous year in not less than three of the four years of the performance period; and |
| • | cumulative earnings per share over the four years of the performance period, 1998 to 2001 inclusive, must exceed an aggregate figure calculated by compounding 1997 earnings per share by a factor equivalent to the annual composite rate of inflation plus 2 per cent for each year of the performance period. |
On meeting all of these three primary tests, 50 per cent of the conditional awards would be released to each eligible participant. A secondary test would apply such that, if the cumulative earnings per share over the performance period exceeded an aggregate figure calculated by compounding 1997 earnings per share by a factor equivalent to the same annual composite rate of inflation as described above, plus 5 per cent or more, or 8 per cent or more, for each year of the performance period, 75 per cent or 100 per cent respectively of the conditional awards would be released.
In accordance with the rules of the plan, as these tests were not satisfied over the years 1998 to 2001, the same tests are to be applied over the years 1999 to 2002. If the tests are not satisfied, the conditional share awards will be forfeited.
From 1999, the vesting of awards has been linked to the attainment of predetermined TSR targets as set out below.
Particulars of executive Directors’ interests in shares held in the Restricted Share Plan are set out on page 185.
The HSBC Holdings Restricted Share Plan 2000
|
The HSBC Holdings Restricted Share Plan 2000 is intended to reward the delivery of sustained financial growth of HSBC Holdings. So as to align the interests of the Directors and senior employees more closely with those of shareholders, the HSBC Holdings Restricted Share Plan 2000 links the vesting of 2003 awards to the attainment of predetermined TSR targets.
Total Shareholder Return (TSR) is defined as the growth in share value and declared dividend income during the relevant period. In calculating TSR, dividend income is assumed to be reinvested in the underlying shares.
174
Back to Contents
HSBC HOLDINGS PLC
Having regard to HSBC Holdings’ size and status within the financial sector, a benchmark has been established which takes account of:
| 1. | a peer group of nine banks (ABN AMRO Holding N.V., Citigroup Inc., Deutsche Bank A.G., J. P. Morgan Chase & Co., Lloyds TSB Group plc, Oversea-Chinese Banking Corporation Limited, Mitsubishi Tokyo Financial Group Inc., Standard Chartered PLC, The Bank of East Asia, Limited) weighted by market capitalisation;
|
| 2. | the five largest banks from each of the United States, the United Kingdom, continental Europe and the Far East, other than any within 1 above, weighted by market capitalisation; and
|
| 3. | the banking sector of the Morgan Stanley Capital International World Index, excluding any within 1 and 2 above, weighted by market capitalisation. |
By combining the above three elements and weighting the average so that 50 per cent is applied to 1, 25 per cent is applied to 2 and 25 per cent is applied to 3, an appropriate market comparator benchmark is determined.
The extent to which awards will vest will be determined by reference to HSBC Holdings’ TSR measured against the benchmark TSR. The calculation of the share price component within HSBC Holdings’ TSR will be the average market price over the 20 trading days commencing on the day when the annual results are announced, which in 2003 is 3 March. The starting point will be, therefore, the average over the period 3 to 28 March inclusive. TSR for the benchmark constituents will be based on their published share prices for 28 March 2003.
If HSBC Holdings’ TSR over the performance period exceeds the mean of the benchmark TSR, awards with a value, at the date of grant, of up to 100 per cent of earnings, will vest. For higher value awards, the greater of 50 per cent of the award or the number of shares, equating at the date of grant to 100 per cent of earnings, will vest at this level of performance. If HSBC Holdings’ TSR over the performance period places it within the upper quartile in the ranked list against the benchmark, these higher value awards will vest in full. For performance between the median and the upper quartile, vesting will be on a straight line basis.
The initial performance period will be three years. If the upper quartile performance target is achieved at the third anniversary of the date of grant, but not if it is achieved later, an additional award equal to 20 per cent of the initial performance share award will be made and will vest at the same time as the original award to which it relates. However, regardless of whether the upper quartile target is achieved on the third, fourth or fifth anniversary, full vesting and transfer of the shares will not generally occur until the fifth anniversary.
As a secondary condition, options and awards will only vest if the Remuneration Committee is satisfied that HSBC Holdings’ financial performance has shown a sustained improvement in the period since the date of grant.
Awards will vest immediately in cases of death. The Remuneration Committee retains discretion to recommend early release of the shares to the Trustee in certain instances, e.g. in the event of redundancy, retirement on grounds of injury or ill health, early retirement, retirement on or after contractual retirement or if the business is no longer part of HSBC Holdings. Awards will normally be forfeited if the participant is dismissed or resigns from HSBC.
Where events occur which cause the Remuneration Committee to consider that the performance condition has become unfair or impractical, the right is reserved to the Remuneration Committee to make such adjustments as in its absolute discretion it deems appropriate to make.
175
Back to Contents
HSBC HOLDINGS PLC
Directors’ Remuneration Report (continued)
|
The following graph shows HSBC Holdings’ TSR performance against the benchmark TSR.
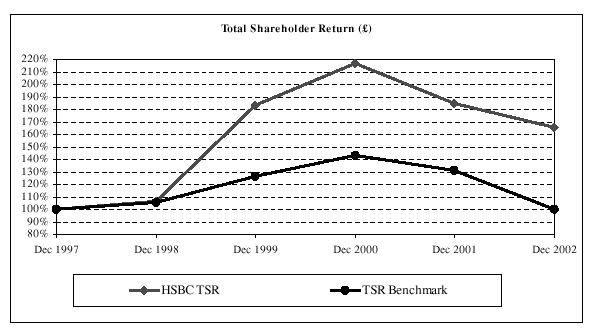
Pursuant to the Directors’ Remuneration Report Regulations 2002, the following graphs show HSBC Holdings’ TSR performance against the Financial Times Stock Exchange (FTSE) 100 Index, the Morgan Stanley Capital International (MSCI) World Index and Morgan Stanley Capital International (MSCI) Financials Index.
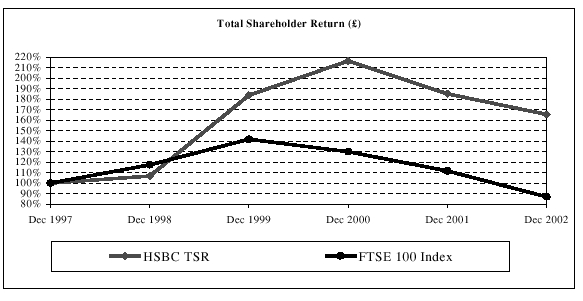
176
Back to Contents
HSBC HOLDINGS PLC
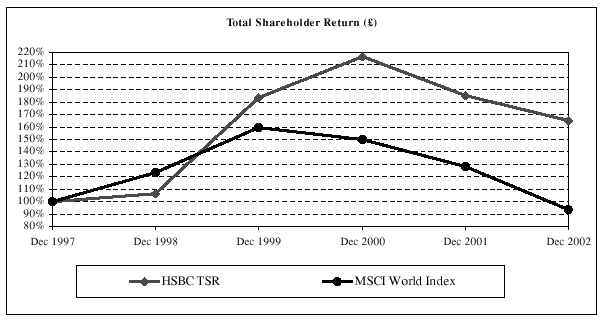

177
Back to Contents
HSBC HOLDINGS PLC
Directors’ Remuneration Report (continued)
|
The basic salaries of Group General Managers are within the following bands:
| | | Number of Group
General Managers | |
| | |
| |
| £150,001 – £250,000 | | | 15 | |
| £250,001 – £350,000 | | | 10 | |
| £350,001 – £450,000 | | | 1 | |
| £450,001 – £550,000 | | | 1 | |
Set out below is information in respect of the five individuals, who are not Directors of HSBC Holdings, whose emoluments (excluding commissions or bonuses related to the revenue or profits generated by employees individually or collectively with others engaged in similar activities) were the highest in HSBC for the year ended 31 December 2002.
| | | | £000 | |
| | |
| |
| Basic salaries, allowances and benefits in kind | | | 1,286 | |
| Pension contributions | | | 98 | |
| Bonuses paid or receivable | | | 26,237 | |
| Compensation for loss of office | | | | |
| – contractual | | | – | |
| – other | | | – | |
| | |
| |
| Total (£) | | | 27,621 | |
| | |
| |
| Total (US$) | | | 41,446 | |
| | |
| |
Their emoluments are within the following bands:
| | | Number of
Employees | |
| | |
| |
| £4,100,001 – £4,200,000 | | | 1 | |
| £4,500,001 – £4,600,000 | | | 1 | |
| £5,300,001 – £5,400,000 | | | 1 | |
| £6,000,001 – £6,100,000 | | | 1 | |
| £7,400,001 – £7,500,000 | | | 1 | |
| |
| |
| |
| |
Service contracts and terms of appointment |
HSBC’s policy is to employ executive Directors on one-year rolling contracts, although on recruitment longer initial terms may be approved by the Remuneration Committee. The Remuneration Committee will, consistent with the best interests of the Company, seek to minimise termination payments.
No executive Director has a service contract with HSBC Holdings or any of its subsidiaries with a notice period in excess of one year or with provisions for predetermined compensation on termination which exceeds one year’s salary and benefits in kind save as referred to below. There are no provisions for compensation upon early termination of executive Directors’ service contracts save for C F W de Croisset, details of which are set out below.
Sir John Bond is employed on a rolling contract dated 1 January 1993 which requires 12 months’ notice to be given by either party.
C F W de Croisset has a contract of employment dated 7 January 1980 that was in force before he joined the Board of CCF. The contract has no set term but provides for three months’ notice to be given by either party. Under the terms of the contract Mr de Croisset would be entitled to receive one month’s salary for each year of service with CCF on termination of his employment with CCF. However, in accordance with French legal requirements and practice, this contract is suspended while he serves as an executive Director of CCF.
W R P Dalton is employed on a rolling contract dated 5 January 1998 which requires 12 months’ notice to be given by either party.
D G Eldon is employed on a rolling contract dated 1 January 1968 which requires three months’ notice to be given by either party.
D J Flint is employed on a rolling contract dated 29 September 1995 which requires 12 months’ notice to be given by the Company and nine months’ notice to be given by Mr Flint.
S K Green, who is to stand for re-election at the forthcoming Annual General Meeting, is employed on a rolling contract dated 9 March 1998 which requires 12 months’ notice to be given by either party.
A W Jebson, who is to stand for re-election at the forthcoming Annual General Meeting, is employed on a rolling contract dated 14 January 2000 which requires 12 months’ notice to be given by either party.
Sir Keith Whitson is employed on a rolling contract dated 1 August 1992 which requires 12 months’ notice to be given by either party.
178
Back to Contents
HSBC HOLDINGS PLC
Members of Senior Management are employed on service contracts which generally provide for a term of service expiring at the end of a period of up to two years, or the individual’s sixtieth birthday, whichever is earlier.
Non-executive Directors are appointed for fixed terms not exceeding three years, subject to their re-election by shareholders at the subsequent Annual General Meeting. Non-executive Directors have no service contract and are not eligible to participate in HSBC’s share plans. Non-executive Directors’ terms of appointment will expire in 2004 – Lord Butler, R K F Ch’ien, W K L Fung, S Hintze, Sir John Kemp-Welch, Lord Marshall, Sir Brian Moffat and Sir Mark Moody-Stuart; and 2006 – Baroness Dunn, S W Newton, H Sohmen, C S Taylor and Sir Brian Williamson.
Executive Directors, if so authorised by the Board, may accept appointments as non-executive Directors of suitable companies which are not part of HSBC. Executive Directors normally would be permitted to take on no more than one such appointment. Any remuneration receivable in respect of this appointment is normally paid to the HSBC company by which the executive Director is employed, unless otherwise approved by the Remuneration Committee.
In October 2000, the Remuneration Committee granted an exemption for Sir John Bond to retain his non-executive directors’ fees from the Ford Motor Company, which are provided partly in the form of deferred shares, to vest after five years.
179
Back to Contents
HSBC HOLDINGS PLC
Directors’ Remuneration Report (continued)
|
Audited Information
The emoluments of the Directors of HSBC Holdings for 2002 were as follows:
| | | | Fees | | | Salary and other remuneration | | | Benefits in kind | | | Discretionary Bonuses1 | | | Total 2002 | | | Total 2001 | |
| | | | £000 | | | £000 | | | £000 | | | £000 | | | £000 | | | £000 | |
| | |
|
| |
|
| |
|
| |
|
| |
|
| |
|
| |
Executive Directors | | | | | | | | | | | | | | | | | | | |
| Sir John Bond | | | 35 | | | 926 | | | 1 | | | 923 | | | 1,885 | | | 1,820 | |
| C F W de Croisset | | | 35 | | | 339 | | | – | | | 235 | | | 609 | | | 609 | |
| W R P Dalton | | | 35 | | | 566 | | | 26 | | | – | 2 | | 627 | | | 612 | |
D G Eldon3 | | | 21 | | | 417 | | | 576 | | | 212 | | | 1,226 | | | 1,204 | |
| D J Flint | | | 35 | | | 567 | | | 8 | | | 350 | | | 960 | | | 848 | |
| S K Green | | | 35 | | | 463 | | | 6 | | | 461 | | | 965 | | | 797 | |
| AW Jebson | | | 35 | | | 437 | | | 1 | | | 175 | 4 | | 648 | | | 715 | |
| Sir Keith Whitson | | | 35 | | | 722 | | | 13 | | | 1,400 | | | 2,170 | | | 1,515 | |
| | | | | | | | | | | | | | | | | | | | |
Non-executive Directors | | | | | | | | | | | | | | | | | | | |
| Lord Butler | | | 40 | | | – | | | – | | | – | | | 40 | | | 40 | |
| R K F Ch’ien | | | 167 | 5 | | – | | | – | | | – | | | 167 | | | 164 | |
| Baroness Dunn | | | 35 | | | – | | | – | | | – | | | 35 | | | 35 | |
| W K L Fung | | | 61 | 6 | | – | | | – | | | – | | | 61 | | | 62 | |
| S Hintze | | | 35 | | | – | | | – | | | – | | | 35 | | | 29 | |
| Sir John Kemp-Welch | | | 48 | | | – | | | – | | | – | | | 48 | | | 44 | |
| Lord Marshall | | | 45 | | | – | | | – | | | – | | | 45 | | | 43 | |
| Sir Brian Moffat | | | 45 | | | – | | | – | | | – | | | 45 | | | 45 | |
| Sir Mark Moody-Stuart | | | 40 | | | – | | | – | | | – | | | 40 | | | 31 | |
M Murofushi7 | | | 15 | | | – | | | – | | | – | | | 15 | | | 35 | |
S W Newton8 | | | 9 | | | – | | | – | | | – | | | 9 | | | – | |
C E Reichardt7 | | | 18 | | | – | | | – | | | – | | | 18 | | | 43 | |
H Sohmen9 | | | 27 | | | – | | | – | | | – | | | 27 | | | 28 | |
Sir Adrian Swire7 | | | 15 | | | – | | | – | | | – | | | 15 | | | 35 | |
C S Taylor8 | | | 17 | 10 | | – | | | – | | | – | | | 17 | | | – | |
Sir Brian Williamson8 | | | 9 | | | – | | | – | | | – | | | 9 | | | – | |
| | |
| |
| Total (£) | | | 892 | | | 4,437 | | | 631 | | | 3,756 | | | 9,716 | | | 8,834 | |
| | |
| |
| Total (US$) | | | 1,338 | | | 6,658 | | | 947 | | | 5,636 | | | 14,579 | | | 12,718 | |
| | |
| |
| | |
| 1 | These discretionary bonuses are in respect of 2002 and will be paid in 2003. |
| 2 | In return for the prior waiver of bonus, the employer contribution into the pension scheme has been increased by the amount of £400,000 (2001: £300,000) which would otherwise have been paid. |
| 3 | The emoluments of D G Eldon include housing and other expatriate benefits in kind that are normal within the location in which he is employed. |
| 4 | In return for a partial prior waiver of bonus, the employer contribution into the pension scheme has been increased by the amount of £175,000 (2001: £nil) which would otherwise have been paid. |
| 5 | Includes fees as non-executive Chairman of HSBC Private Equity (Asia) Limited and as a non-executive Director of The Hongkong and Shanghai Banking Corporation Limited. |
| 6 | Includes fee as a non-executive Director of The Hongkong and Shanghai Banking Corporation Limited. |
| 8 | Appointed on 27 September 2002. |
| 9 | H Sohmen has elected to waive any fees payable to him by HSBC Holdings – 2002: £35,000 (2001: £35,000). |
| 10 | Includes fee as a non-executive Director of HSBC Bank USA. |
180
Back to Contents
HSBC HOLDINGS PLC
H Sohmen has elected to waive any fees payable to him by HSBC Holdings.
A fee of £25,000 (2001: £25,000) was paid to Sir Wilfrid Newton, a former Director, in respect of his role as Chairman of the HSBC Bank plc committee overseeing the construction and occupation of the new HSBC headquarters. Following the dissolution of this committee, payment of the fee ceased, with effect from 31 December 2002.
There are separate schemes for UK-based and overseas-based employees: the UK scheme has a normal retirement age of 60; retirement ages for overseas schemes vary in accordance with local legislation and practice. With three exceptions (see paragraphs below on C F W de Croisset, D J Flint and W R P Dalton), the executive Directors are members of defined benefit pension schemes, having joined HSBC at a time when these were the norm.
The pension arrangements for Sir John Bond, S K Green, A W Jebson and Sir Keith Whitson to contractual retirement age of 60 are provided under the HSBC Bank (UK) Pension Scheme. The pensions accrue at a rate of one-thirtieth of pensionable salary per year of pensionable service in the UK. In addition, until 2001, supplementary provision was made for S K Green, via an employer contribution to a personal pension plan, with £1,123 having been made during 2001.
C F W de Croisset is eligible for pension benefits which are supplementary to those accrued under the French State and Compulsory arrangements. The amount of this supplementary pension, payable from age 60, currently accrues at the rate of €6,098 per annum for each year of service (maximum 18 years) as an executive Director of CCF. The whole cost of this benefit is met by CCF.
The pension arrangements for W R P Dalton to contractual retirement age of 60 are provided on a defined benefit basis (details of which are set out in the table below) under the HSBC Canada Pension Plan A, at an accrual rate of one-thirtieth of pensionable salary per year of pensionable service until his transfer to the UK in 1998. Since taking up his appointment in the UK, he has joined the HSBC Holdings Overseas (No.1) Pension Plan on a defined contribution basis, with an employer contribution in respect of 2002, including a bonus waiver of £400,000 (2001: £300,000), of £529,000 (2001: £429,000).
The pension arrangements for D J Flint to contractual retirement age of 60 are provided through an executive allowance paid to fund personal pension arrangements set at 30 per cent of basic salary. This is supplemented through the HSBC Holdings plc Funded Unapproved Retirement Benefits Scheme on a defined contribution basis with an employer contribution during 2002 of £80,092 (2001: £78,150). The intention of these arrangements is to provide benefits broadly comparable to an accrual rate of one-thirtieth of pensionable salary for each year of pensionable service.
The pension arrangements for D G Eldon are provided under the HSBC International Staff Retirement Benefits Scheme. Pension accrues at a rate of one twenty-seventh of pensionable salary per year of pensionable service.
181
Back to Contents
HSBC HOLDINGS PLC
Directors’ Remuneration Report (continued)
|
Audited Information
| | | | Accrued annual pension at
31 December 2002 | | | Increase in
accrued pension during 2002 | | | Transfer value of accrued pension at
1 January 2002 | | | Transfer value of accrued pension at 31 December 2002 | | | Increase of transfer value of accrued pension (less
personal contributions)
1 January-
31 December 2002 | |
| | | | £000 | | | £000 | | | £0001 | | | £0001 | | | £0001 | |
| | |
|
| |
|
| |
|
| |
|
| |
|
| |
|
Sir John Bond2 | | | 308 | | | 20 | | | 5,046 | | | 5,504 | | | 458 | |
| C F W de Croisset | | | 56 | | | 7 | | | 516 | | | 626 | | | 110 | |
| W R P Dalton | | | 257 | | | 6 | | | 3,028 | | | 3,680 | | | 652 | |
D G Eldon3 | | | 234 | | | 21 | | | 4,218 | | | 4,703 | | | 4714 | |
| S K Green | | | 159 | | | 19 | | | 1,833 | | | 1,901 | | | 68 | |
A W Jebson5 | | | 123 | | | 17 | | | 1,334 | | | 1,384 | | | 50 | |
| Sir Keith Whitson | | | 251 | 6 | | 29 | | | 5,181 | 6 | | 4,514 | | | 676 | |
| | | | | | | | | | | | | | | | | |
| 1 | The transfer value represents a liability of HSBC’s pension funds and not a sum paid or due to the individual; it cannot therefore meaningfully be added to annual remuneration. |
| 2 | On attaining age 60, Sir John Bond has been able, under the terms of the scheme, to retire at any time with an immediate pension equal to his accrued pension which, at 31 December 2002, is shown above. |
| 3 | On attaining age 53, D G Eldon has been able, under the terms of the scheme, to retire at any time with an immediate pension equal to his accrued pension which, at 31 December 2002, is shown above. |
| 4 | D G Eldon made personal contributions towards his pension of £14,000 in respect of 2002. |
| 5 | A W Jebson’s entitlement will be supplemented by an employer contribution of £175,000 in return for the prior waiver of part of his bonus in respect of 2002. |
| 6 | In addition, Sir Keith Whitson had a deferred pension entitlement under the HSBC International Staff Retirement Benefits Scheme in respect of his Group service up to 1992 prior to his transfer to the UK. This deferred pension entitlement was increased in accordance with the Rules of the Scheme during the deferred period. This gave a pension entitlement at 1 January 2002 of £78,859 per annum and a pension entitlement of £84,678 per annum as at 31 October 2002. With the agreement of the Trustee, Sir Keith Whitson exercised his option under the Rules of the Scheme to fully commute this accrued pension for a lump sum payment amounting to £1,100,390, which was paid in November 2002. Sir John Bond, S K Green and A W Jebson were also members of the HSBC International Staff Retirement Benefits Scheme but fully commuted their entitlement in 1993,1992 and 1994 respectively. |
The following unfunded pension payments, in respect of which provision has been made, were made during 2002 to four former Directors of HSBC Holdings:
| | | | 2002 | | | 2001 | |
| | |
| |
| B H Asher | | | £81,564 | | | £80,277 | |
| R Delbridge | | | £117,313 | | | £115,595 | |
| Sir Brian Pearse | | | £48,918 | | | £48,147 | |
| Sir William Purves | | | £86,343 | | | £84,981 | |
| | |
| |
| | | | £334,138 | | | £329,000 | |
| | |
| |
The payments in respect of R Delbridge and Sir Brian Pearse were made by HSBC Bank plc as former Directors of the bank.
At 31 December 2002, the undernamed Directors held options to acquire the number of HSBC Holdings ordinary shares of US$0.50 each set against their respective names. The options were awarded for nil consideration at exercise prices equivalent to the market value at the date of award, except that options awarded under the HSBC Holdings savings-related share option plans since 2001 are exercisable at a 20 per cent discount to the market value at the date of award and those awarded before 2001 at a 15 per cent discount. There are no remaining performance criteria conditional upon which the outstanding options are exercisable. No options held by the Directors lapsed during the year. The market value of the ordinary shares at 31 December 2002 was £6.865. The highest and lowest market values during the period were £8.66 and £6.43. Market value is the mid-market price derived from the London Stock Exchange Daily Official List on the releva nt date.
182
Back to Contents
HSBC HOLDINGS PLC
| | | | Options | | | Options | | | Options | | | Options | | | | | | | | | | 1 | | | |
| | | | held at | | | awarded | | | exercised | | | held at 31 | | | Exercise | | | | | | | | | |
| | | | 1 January | | | during | | | during | | | December | | | price | | | Date of | | | Exercisable | | Exercisable | |
| | | | 2002 | | | year | | | year | | | 2002 | | | in £ | | | award | | | from | | until | |
| | |
|
| |
|
| |
|
| |
|
| |
|
| |
|
| |
|
| |
|
| |
| Sir John Bond | | | 75,000 | | | – | | | – | | | 75,0002 | | | 3.3334 | | | 1 Apr 1996 | | | 1 Apr 1999 | | | 1 Apr 2006 | |
| | | | 2,798 | | | – | | | – | | | 2,7983 | | | 6.0299 | | | 10 Apr 2000 | | | 1 Aug 2005 | | | 31 Jan 2006 | |
C F W de Croisset4 | | | 206,000 | | | – | | | – | | | 206,000 | | | 8.7120 | | | 23 Apr 2001 | | | 23 Apr 2004 | | | 23 Apr 2011 | |
| | | | – | | | 206,000 | | | – | | | 206,000 | | | 8.4050 | | | 7 May 2002 | | | 7 May 2005 | | | 7 May 2012 | |
| W R P Dalton | | | 22,704 | | | – | | | – | | | 22,704 | | | 2.4062 | | | 12 Oct 1993 | | | 12 Oct 1996 | | | 12 Oct 2003 | |
| | | | 30,273 | | | – | | | – | | | 30,273 | | | 2.8376 | | | 8 Mar 1994 | | | 8 Mar 1997 | | | 8 Mar 2004 | |
| | | | 36,000 | | | – | | | – | | | 36,000 | | | 2.1727 | | | 7 Mar 1995 | | | 7 Mar 1998 | | | 7 Mar 2005 | |
| | | | 36,000 | | | – | | | – | | | 36,0002 | | | 3.3334 | | | 1 Apr 1996 | | | 1 Apr 1999 | | | 1 Apr 2006 | |
| | | | 2,798 | | | – | | | – | | | 2,7983 | | | 6.0299 | | | 10 Apr 2000 | | | 1 Aug 2005 | | | 31 Jan 2006 | |
| D G Eldon | | | 36,000 | | | – | | | – | | | 36,000 | | | 2.1727 | | | 7 Mar 1995 | | | 7 Mar 1998 | | | 7 Mar 2005 | |
| | | | 40,500 | | | – | | | – | | | 40,5002 | | | 3.3334 | | | 1 Apr 1996 | | | 1 Apr 1999 | | | 1 Apr 2006 | |
| D J Flint | | | 27,000 | | | – | | | – | | | 27,0002 | | | 3.3334 | | | 1 Apr 1996 | | | 1 Apr 1999 | | | 1 Apr 2006 | |
| | | | 3,8133 | | | – | | | 3,8135 | | | – | | | 4.5206 | | | 9 Apr 1997 | | | 1 Aug 2002 | | | 31 Jan 2003 | |
| | | | – | | | 2,6173 | | | – | | | 2,617 | | | 6.3224 | | | 2 May 2002 | | | 1 Aug 2007 | | | 31 Jan 2008 | |
| S K Green | | | 45,0002 | | | – | | | 45,0006 | | | – | | | 3.3334 | | | 1 Apr 1996 | | | 1 Apr 1999 | | | 1 Apr 2006 | |
| | | | 2,498 | | | – | | | – | | | 2,4983 | | | 6.7536 | | | 11 Apr 2001 | | | 1 Aug 2006 | | | 31 Jan 2007 | |
| A W Jebson | | | 22,5002 | | | – | | | 22,5007 | | | – | | | 3.3334 | | | 1 Apr 1996 | | | 1 Apr 1999 | | | 1 Apr 2006 | |
| | | | 1,434 | | | – | | | – | | | 1,4343 | | | 6.7536 | | | 11 Apr 2001 | | | 1 Aug 2004 | | | 31 Jan 2005 | |
| Sir Keith Whitson | | | 60,000 | | | – | | | – | | | 60,0002 | | | 3.3334 | | | 1 Apr 1996 | | | 1 Apr 1999 | | | 1 Apr 2006 | |
| | | | 2,798 | | | – | | | – | | | 2,7983 | | | 6.0299 | | | 10 Apr 2000 | | | 1 Aug 2005 | | | 31 Jan 2006 | |
| | | | | | | | | | | | | | | | | | | | | | | | | | |
| 1 | May be advanced to an earlier date in certain circumstances, e.g. retirement. |
| 2 | The exercise of these options was conditional upon the growth in earnings per share over a three-year period being equal to or greater than a composite rate of inflation (comprising 50 per cent of the Hong Kong Composite Consumer Price Index, 35 per cent of the UK Retail Price Index and 15 per cent of the USA All Urban Consumer Price Index) plus 2 per cent per annum. This condition has been satisfied. |
| 3 | Options awarded under the HSBC Holdings Savings-Related Share Option Plan. |
| 4 | Options awarded under the HSBC Holdings Group Share Option Plan. In accordance with agreements made at the time of the acquisition of CCF there are no performance criteria conditional upon which the outstanding options are exercisable. |
| 5 | At the date of exercise, 8 August 2002, the market value per share was £7.45. |
| 6 | At the date of exercise, 13 March 2002, the market value per share was £8.34. |
| 7 | At the date of exercise, 22 March 2002, the market value per share was £8.045. |
At 31 December 2002, C F W de Croisset held the following options to acquire CCF shares of €5 each. On exercise of these options each CCF share will be exchanged for 13 HSBC Holdings ordinary shares of US$0.50 each. The options were granted by CCF for nil consideration at a 5 per cent discount to the market value at the date of award. There are no remaining performance criteria conditional upon which the outstanding options are exercisable.
183
Back to Contents
HSBC HOLDINGS PLC
Directors’ Remuneration Report (continued) |
|
CCF S.A. shares of €5 each |
Options held at
1 January 2002 | | | Exercise price per share(€) | | | Options held at
31 December
2002 | | | Equivalent HSBC Holdings ordinary shares of US$0.50 each at
31 December 2002 | | | Date of award | | | Exercisable from | | | Exercisable until | |
| |
|
| |
|
| |
|
| |
|
| |
|
| |
|
| |
| 10,000 | | | 32.78 | | | 10,000 | | | 130,000 | | | 23 Jun 1994 | | | 23 Jun 1996 | | | 23 Jun 2004 | |
| 30,000 | | | 34.00 | | | 30,000 | | | 390,000 | | | 22 Jun 1995 | | | 22 Jun 1997 | | | 22 Jun 2005 | |
| 30,000 | | | 35.52 | | | 30,000 | | | 390,000 | | | 9 May 1996 | | | 9 May 1998 | | | 9 May 2006 | |
| 30,000 | | | 37.05 | | | 30,000 | | | 390,000 | | | 7 May 1997 | | | 7 Jun 2000 | | | 7 May 2007 | |
| 30,000 | | | 73.50 | | | 30,000 | | | 390,000 | | | 29 Apr 1998 | | | 7 Jun 2000 | | | 29 Apr 2008 | |
| 28,000 | | | 81.71 | | | 28,000 | | | 364,000 | | | 7 Apr 1999 | | | 7 Jun 2000 | | | 7 Apr 2009 | |
| 28,000 | | | 142.50 | | | 28,000 | | | 364,000 | | | 12 Apr 2000 | | | 1 Jan 2002 | | | 12 Apr 2010 | |
No options over CCF shares of €5 each were awarded to or exercised by C F W de Croisset during the year.
Save as stated above, none of the Directors, or members of their immediate families, was awarded or exercised any right to subscribe for any shares or debentures during the year.
184
Back to Contents
HSBC HOLDINGS PLC
HSBC Holdings ordinary shares of US$0.50 |
| | | | Awards held at
1 January
2002 | | | Awards made during year | | | Monetary value of awards made during year
(£000) | | | Awards held at
31 December
20021 | | | Date of award | | | Year in which awards may vest | |
| | |
|
| |
|
| |
|
| |
|
| |
|
| |
|
| |
| Sir John Bond | | | 28,501 | | | – | | | – | | | 29,746 | | | 2 Mar 1998 | | | 2003 | |
| | | | 55,353 | | | 10,0452 | | | 84 | | | 67,996 | | | 4 Mar 1999 | | | 2004 | |
| | | | 81,791 | | | – | | | – | | | 85,365 | | | 10 Mar 2000 | | | 2005 | |
| | | | 76,651 | | | – | | | – | | | 80,001 | | | 12 Mar 2001 | | | 2006 | |
| | | | – | | | 114,7793 | | | 950 | | | 119,795 | | | 8 Mar 2002 | | | 2007 | |
| | | | | | | | | | | | | | | | | | | | |
| W R P Dalton | | | 19,003 | | | – | | | – | | | 19,833 | | | 2 Mar 1998 | | | 2003 | |
| | | | 32,290 | | | 5,8592 | | | 49 | | | 39,665 | | | 4 Mar 1999 | | | 2004 | |
| | | | 37,178 | | | – | | | – | | | 38,803 | | | 10 Mar 2000 | | | 2005 | |
| | | | 43,801 | | | – | | | – | | | 45,715 | | | 12 Mar 2001 | | | 2006 | |
| | | | – | | | 72,4923 | | | 600 | | | 75,660 | | | 8 Mar 2002 | | | 2007 | |
| | | | | | | | | | | | | | | | | | | | |
| D G Eldon | | | 22,799 | | | – | | | – | | | 23,796 | | | 2 Mar 1998 | | | 2003 | |
| | | | 32,290 | | | 5,8592 | | | 49 | | | 39,665 | | | 4 Mar 1999 | | | 2004 | |
| | | | 37,178 | | | – | | | – | | | 38,803 | | | 10 Mar 2000 | | | 2005 | |
| | | | 7,079 | | | – | | | – | | | 7,3884 | | | 3 Apr 2000 | | | 2003 | |
| | | | 43,801 | | | – | | | – | | | 45,715 | | | 12 Mar 2001 | | | 2006 | |
| | | | 6,454 | | | – | | | – | | | 6,7364 | | | 30 Apr 2001 | | | 2004 | |
| | | | – | | | 48,3283 | | | 400 | | | 50,440 | | | 8 Mar 2002 | | | 2007 | |
| | | | – | | | 9,1764 | | | 75 | | | 9,340 | | | 15 May 2002 | | | 2005 | |
| D J Flint | | | 19,003 | | | – | | | – | | | 19,833 | | | 2 Mar 1998 | | | 2003 | |
| | | | 32,290 | | | 5,8592 | | | 49 | | | 39,665 | | | 4 Mar 1999 | | | 2004 | |
| | | | 33,460 | | | – | | | – | | | 34,922 | | | 10 Mar 2000 | | | 2005 | |
| | | | 54,751 | | | – | | | – | | | 57,144 | | | 12 Mar 2001 | | | 2006 | |
| | | | – | | | 72,4923 | | | 600 | | | 75,660 | | | 8 Mar 2002 | | | 2007 | |
| | | | | | | | | | | | | | | | | | | | |
| S K Green | | | 22,799 | | | – | | | – | | | 23,796 | | | 2 Mar 1998 | | | 2003 | |
| | | | 32,290 | | | 5,8592 | | | 49 | | | 39,665 | | | 4 Mar 1999 | | | 2004 | |
| | | | 37,178 | | | – | | | – | | | 38,803 | | | 10 Mar 2000 | | | 2005 | |
| | | | 76,651 | | | – | | | – | | | 80,001 | | | 12 Mar 2001 | | | 2006 | |
| | | | – | | | 90,6153 | | | 750 | | | 94,575 | | | 8 Mar 2002 | | | 2007 | |
| | | | | | | | | | | | | | | | | | | | |
| A W Jebson | | | 9,502 | | | – | | | – | | | 9,917 | | | 2 Mar 1998 | | | 2003 | |
| | | | 27,677 | | | 5,0222 | | | 42 | | | 33,998 | | | 4 Mar 1999 | | | 2004 | |
| | | | 29,742 | | | – | | | – | | | 31,041 | | | 10 Mar 2000 | | | 2005 | |
| | | | 65,701 | | | – | | | – | | | 68,572 | | | 12 Mar 2001 | | | 2006 | |
| | | | – | | | 84,5743 | | | 700 | | | 88,270 | | | 8 Mar 2002 | | | 2007 | |
| | | | | | | | | | | | | | | | | | | | |
| Sir Keith Whitson | | | 22,799 | | | – | | | – | | | 23,796 | | | 2 Mar 1998 | | | 2003 | |
| | | | 46,128 | | | 8,3712 | | | 70 | | | 56,663 | | | 4 Mar 1999 | | | 2004 | |
| | | | 52,049 | | | – | | | – | | | 54,323 | | | 10 Mar 2000 | | | 2005 | |
| | | | 60,226 | | | – | | | – | | | 62,858 | | | 12 Mar 2001 | | | 2006 | |
| | | | – | | | 90,6153 | | | 750 | | | 94,575 | | | 8 Mar 2002 | | | 2007 | |
| |
| |
| Unless otherwise indicated, vesting of these shares is subject to the performance tests described in the ‘Report of the Directors’ in the 1998, 1999, 2000 and 2001 Annual Report and Accounts respectively being satisfied. |
| |
| 1 | Includes additional shares arising from scrip dividends. |
|
| 2 | In accordance with the performance conditions over the three-year period to 31 December 2001 set out in the Annual Report and Accounts 1998, an additional award of 20 per cent of the initial performance share award was made on 7 May 2002. The market value per share on 7 May 2002 was £8.405. The shares acquired by the Trustee of the Plan were purchased at an average price of £8.13. |
|
| 3 | The market value per share on 8 March 2002 was £8.34. The shares acquired by the Trustee of the Plan were purchased at an average price of £8.28. |
|
| 4 | 50 per cent of D G Eldon’s discretionary bonus for 1999, 2000 and 2001 respectively was awarded in Restricted Shares with a three-year restricted period. |
|
185
Back to Contents
HSBC HOLDINGS PLC
Directors’ Remuneration Report (continued)
|
| |
On behalf of the Board
Sir Mark Moody-Stuart, Chairman of Remuneration Committee 3 March 2003
186
Back to Contents
HSBC HOLDINGS PLC
Statement of Directors’ Responsibilities in Relation to Financial Statements
|
The following statement, which should be read in conjunction with the Auditors’ statement of their responsibilities set out in its report on page 188, is made with a view to distinguishing for shareholders the respective responsibilities of the Directors and of the Auditors in relation to the financial statements.
The Directors are required by the Companies Act 1985 to prepare financial statements for each financial year which give a true and fair view of the state of affairs of HSBC Holdings plc together with its subsidiary undertakings as at the end of the financial year and of the profit or loss for the financial year. They are also required to present additional information for US shareholders. Accordingly, these financial statements are framed to meet both UK and US requirements, including those of the United States Securities and Exchange Commission, to give a consistent view to all shareholders. The Directors are required to prepare these financial statements on the going concern basis unless it is not appropriate. Since the Directors are satisfied that HSBC has the resources to continue in business for the foreseeable future, the financial statements continue to be prepared on the going concern basis. The Directors consider that in pre paring the financial statements on pages 190 to 313, HSBC Holdings has used appropriate accounting policies, consistently applied, save as disclosed in the ‘Notes on the Financial Statements’, and supported by reasonable and prudent judgements and estimates, and that all accounting standards which they consider to be applicable have been followed.
The Directors have responsibility for ensuring that HSBC Holdings keeps accounting records which disclose with reasonable accuracy the financial position of HSBC Holdings and which enable them to ensure that the financial statements comply with the Companies Act 1985.
The Directors have general responsibility for taking such steps as are reasonably open to them to safeguard the assets of HSBC and to prevent and detect fraud and other irregularities.
| On behalf of the Board | 3 March 2003 |
| R G Barber, Secretary | |
187
Back to Contents
HSBC HOLDINGS PLC
Independent auditors’ report to the Members of HSBC Holdings plc
|
We have audited the financial statements on pages 190 to 313. We have also audited certain of the information in the directors’ remuneration report that is required to be audited by the Companies Act 1985; this information is set out on pages 180 to 186.
Respective responsibilities of Directors and Auditors |
The directors are responsible for preparing the Annual Report, the Annual Report on Form 20-F and the directors’ remuneration report. As described on page 187, this includes responsibility for preparing the financial statements in accordance with applicable United Kingdom law and accounting standards; the Directors have also presented additional information under US requirements. Our responsibilities, as independent auditors, are established in the United Kingdom by statute, the Auditing Practices Board in the United Kingdom and the auditing standards generally accepted in the United States, the Listing Rules of the UK Financial Services Authority, the United States Securities and Exchange Commission and by our profession’s ethical guidance.
We report to you in our United Kingdom opinion as to whether the financial statements give a true and fair view and whether the financial statements and the part of the directors’ remuneration report required to be audited have been properly prepared in accordance with the Companies Act 1985. We also report to you if, in our opinion, the directors’ report is not consistent with the financial statements, if HSBC Holdings has not kept proper accounting records, if we have not received all the information and explanations we require for our audit, or if information specified by law regarding directors’ remuneration and transactions with HSBC Holdings together with its subsidiary undertakings (‘HSBC’) is not disclosed.
We review whether the statement on pages 162 to 164 reflects HSBC Holdings’ compliance with the seven provisions of the Combined Code specified for our review by the Listing Rules, and we report if it does not. We are not required to consider whether the board’s statements on internal control cover all risks and controls, or form an opinion on the effectiveness of HSBC’s corporate governance procedures or its risk and control procedures.
We read the other information contained in the Annual Report, including the corporate governance statement and the unaudited part of the directors’ remuneration report, and consider whether it is consistent with the audited financial statements. We consider the implications for our report if we become aware of any apparent misstatements or material inconsistencies with the financial statements.
We conducted our audit of the financial statements in accordance with auditing standards issued by the Auditing Practices Board in the United Kingdom and those generally accepted in the United States. An audit includes examination, on a test basis, of evidence relevant to the amounts and disclosures in the financial statements. It also includes an assessment of the significant estimates and judgements made by the directors in the preparation of the financial statements, and of whether the accounting policies are appropriate to HSBC’s circumstances, consistently applied and adequately disclosed. We conducted our audit of the part of the directors’ remuneration report required to be audited by the Companies Act 1985 in accordance with auditing standards issued by the Auditing Practices Board in the United Kingdom.
We planned and performed our audit so as to obtain all the information and explanations which we considered necessary in order to provide us with sufficient evidence to give reasonable assurance that the financial statements and the part of the directors’ remuneration report required to be audited by the Companies Act 1985 are free from material misstatement, whether caused by fraud or other irregularity or error. In forming our opinion we also evaluated the overall adequacy of the presentation of information in the financial statements and the part of the directors’ remuneration report required to be audited by the Companies Act 1985.
188
Back to Contents
HSBC HOLDINGS PLC
Independent auditors’ report to the Members of HSBC Holdings plc
|
In our opinion:
| • | the financial statements give a true and fair view of the state of affairs of HSBC Holdings and HSBC as at 31 December 2002 and of the profit of HSBC for the year then ended; and |
| | |
| • | the financial statements and the part of the directors’ remuneration report required to be audited have been properly prepared in accordance with the Companies Act 1985. |
In our opinion, the financial statements referred to above present fairly, in all material respects, the financial position of HSBC and HSBC Holdings as at 31 December 2002 and 2001, and the results of HSBC’s operations and cash flows for each of the years in the three-year period ended 31 December 2002, in conformity with generally accepted accounting principles in the United Kingdom.
Generally accepted accounting principles in the United Kingdom vary in certain significant respects from generally accepted accounting principles in the United States. Application of generally accepted accounting principles in the United States would have affected HSBC’s results of operations for each of the years in the three-year period ended 31 December 2002 and the shareholders’ equity as of 31 December 2002 and 2001 to the extent summarised in Note 50 of ‘Notes on the Financial Statements’.
| KPMG Audit Plc | 3 March 2003 |
Registered Auditor
Chartered Accountants, London | |
189
Back to Contents
HSBC HOLDINGS PLC
Consolidated profit and loss account for the year ended 31 December 2002
| | | | Note | | | 2002 | | | 2001 | * | | 2000 | * |
| | | | | | | US$m | | | US$m | | | US$m | |
| Interest receivable | | | | | | | | | | | | | |
| – interest receivable and similar income arising from debt securities | | | | | | 7,253 | | | 8,590 | | | 7,458 | |
| – other interest receivable and similar income | | | | | | 21,342 | | | 26,671 | | | 30,288 | |
| Interest payable | | | | | | (13,135 | ) | | (20,536 | ) | | (24,023 | ) |
| | | | | |
| |
| |
| |
Net interest income | | | | | | 15,460 | | | 14,725 | | | 13,723 | |
| Dividend income | | | 3 | | | 278 | | | 186 | | | 197 | |
| Fees and commissions receivable | | | | | | 9,245 | | | 8,756 | | | 8,576 | |
| Fees and commissions payable | | | | | | (1,421 | ) | | (1,286 | ) | | (1,265 | ) |
| Dealing profits | | | 4 | | | 1,313 | | | 1,685 | | | 1,626 | |
| Other operating income | | | | | | 1,720 | | | 1,822 | | | 1,716 | |
| | | | | |
| |
| |
| |
Operating income | | | 7 | | | 26,595 | | | 25,888 | | | 24,573 | |
| Administrative expenses | | | 5,7 | | | (13,764 | ) | | (13,471 | ) | | (12,496 | ) |
| Depreciation and amortisation | | | | | | | | | | | | | |
| – tangible fixed assets | | | 25 | | | (1,190 | ) | | (1,134 | ) | | (1,081 | ) |
| – goodwill | | | 24 | | | (854 | ) | | (799 | ) | | (510 | ) |
| | | | | |
| |
| |
| |
Operating profit before provisions | | | | | | 10,787 | | | 10,484 | | | 10,486 | |
| Provisions | | | | | | | | | | | | | |
| – provisions for bad and doubtful debts | | | 17 | | | (1,321 | ) | | (2,037 | ) | | (932 | ) |
| – provisions for contingent liabilities and commitments | | | 32 | | | (39 | ) | | (649 | ) | | (71 | ) |
| Loss from foreign currency redenomination in Argentina | | | 6 | | | (68 | ) | | (520 | ) | | — | |
| Amounts written off fixed asset investments | | | | | | (324 | ) | | (125 | ) | | (36 | ) |
| | | | | |
| |
| |
| |
Operating profit | | | | | | 9,035 | | | 7,153 | | | 9,447 | |
| Share of operating loss in joint ventures | | | | | | (28 | ) | | (91 | ) | | (51 | ) |
| Share of operating profit in associates | | | | | | 135 | | | 164 | | | 75 | |
| Gains/(losses) on disposal of | | | | | | | | | | | | | |
| – investments | | | | | | 532 | | | 754 | | | 302 | |
| – tangible fixed assets | | | | | | (24 | ) | | 20 | | | 2 | |
| | | | | |
| |
| |
| |
Profit on ordinary activities before tax | | | 7 | | | 9,650 | | | 8,000 | | | 9,775 | |
| Tax on profit on ordinary activities | | | 8 | | | (2,534 | ) | | (1,988 | ) | | (2,409 | ) |
| | | | | |
| |
| |
| |
Profit on ordinary activities after tax | | | | | | 7,116 | | | 6,012 | | | 7,366 | |
| Minority interests | | | | | | | | | | | | | |
| – equity | | | | | | (505 | ) | | (579 | ) | | (558 | ) |
| – non-equity | | | | | | (372 | ) | | (441 | ) | | (351 | ) |
| | | | | |
| |
| |
| |
Profit attributable to shareholders | | | | | | 6,239 | | | 4,992 | | | 6,457 | |
| Dividends | | | 10 | | | (5,001 | ) | | (4,467 | ) | | (4,010 | ) |
| | | | | |
| |
| |
| |
Retained profit for the year | | | | | | 1,238 | | | 525 | | | 2,447 | |
| | | | | |
| |
| |
| |
| | | | | | | | | | | | |
| | | | | | | US$ | | | US$ | | | US$ | |
| Basic earnings per ordinary share | | | 11 | | | 0.67 | | | 0.54 | | | 0.74 | |
| | | | | |
| |
| |
| |
| Diluted earnings per ordinary share | | | 11 | | | 0.66 | | | 0.53 | | | 0.73 | |
| | | | | |
| |
| |
| |
| Dividends per ordinary share | | | 10 | | | 0.530 | | | 0.480 | | | 0.435 | |
| | | | | |
| |
| |
| |
| |
Movements in reserves are set out in Note 36. |
The accompanying notes are an integral part of the Consolidated Financial Statements. |
| * | Figures for 2001 and 2000 have been restated to reflect the adoption of UK Financial Reporting Standard 19 ‘Deferred Tax’, details of which are set out in Note 1 on the Financial Statements on pages 195 to 197. |
190
Back to Contents
HSBC HOLDINGS PLC
Consolidated balance sheet at 31 December 2002
| | | | Notes | | | 2002 | | | 2001 | * |
ASSETS | | | | | | US$m | | | US$m | |
| Cash and balances at central banks | | | | | | 7,659 | | | 6,185 | |
| Items in the course of collection from other banks | | | | | | 5,651 | | | 5,775 | |
| Treasury bills and other eligible bills | | | 12 | | | 18,141 | | | 17,971 | |
| Hong Kong SAR Government certificates of indebtedness | | | 13 | | | 9,445 | | | 8,637 | |
| Loans and advances to banks | | | 15 | | | 95,496 | | | 104,641 | |
| Loans and advances to customers | | | 16 | | | 352,344 | | | 308,649 | |
| Debt securities | | | 19 | | | 175,730 | | | 160,579 | |
| Equity shares | | | 20 | | | 8,213 | | | 8,057 | |
| Interests in joint ventures: gross assets | | | | | | 486 | | | 2,168 | |
Interests in joint ventures: gross liabilities | | | | | | (296 | ) | | (1,876 | ) |
| | | | 21 | | | 190 | | | 292 | |
| Interests in associates | | | 22 | | | 1,116 | | | 1,056 | |
| Other participating interests | | | 23 | | | 651 | | | 120 | |
| Intangible fixed assets | | | 24 | | | 17,163 | | | 14,564 | |
| Tangible fixed assets | | | 25 | | | 14,181 | | | 13,521 | |
| Other assets | | | 27 | | | 45,884 | | | 38,632 | |
| Prepayments and accrued income | | | | | | 7,382 | | | 7,566 | |
| | | | | |
| |
| |
| Total assets | | | | | | 759,246 | | | 696,245 | |
| | | | | |
| |
| |
LIABILITIES | | | | | | | | | | |
| Hong Kong SAR currency notes in circulation | | | 13 | | | 9,445 | | | 8,637 | |
| Deposits by banks | | | 28 | | | 52,933 | | | 53,640 | |
| Customer accounts | | | 29 | | | 495,438 | | | 449,991 | |
| Items in the course of transmission to other banks | | | | | | 4,634 | | | 3,798 | |
| Debt securities in issue | | | 30 | | | 34,965 | | | 27,098 | |
| Other liabilities | | | 31 | | | 72,090 | | | 72,623 | |
| Accruals and deferred income | | | | | | 7,574 | | | 7,149 | |
| Provisions for liabilities and charges | | | 32 | | | | | | | |
| – deferred taxation | | | | | | 1,154 | | | 1,057 | |
| – other provisions for liabilities and charges | | | | | | 3,683 | | | 3,883 | |
| Subordinated liabilities | | | 33 | | | | | | | |
| – undated loan capital | | | | | | 3,540 | | | 3,479 | |
| – dated loan capital | | | | | | 14,831 | | | 12,001 | |
| Minority interests | | | | | | | | | | |
| – equity | | | | | | 2,122 | | | 2,210 | |
| – non-equity | | | 34 | | | 4,431 | | | 4,291 | |
| Called up share capital | | | 35 | | | 4,741 | | | 4,678 | |
| Share premium account | | | 36 | | | 3,647 | | | 3,373 | |
| Other reserves | | | 36 | | | 8,729 | | | 8,770 | |
| Revaluation reserves | | | 36 | | | 1,954 | | | 2,271 | |
| Profit and loss account | | | 36 | | | 33,335 | | | 27,296 | |
| Shareholders’ funds | | | | | | 52,406 | | | 46,388 | |
| | | | | |
| |
| |
| Total liabilities | | | | | | 759,246 | | | 696,245 | |
| | | | | |
| |
| |
MEMORANDUM ITEMS | | | | | | | | | | |
| Contingent liabilities | | | 39 | | | | | | | |
| – acceptances and endorsements | | | | | | 4,711 | | | 4,219 | |
| – guarantees and assets pledged as collateral security | | | | | | 46,527 | | | 39,817 | |
| – other contingent liabilities | | | | | | 17 | | | 9 | |
| | | | | |
| |
| |
| | | | | | | 51,255 | | | 44,045 | |
| | | | | |
| |
| |
| Commitments | | | 39 | | | 225,629 | | | 198,459 | |
| | | | | |
| |
| |
| |
Sir John Bond, Group Chairman. |
| |
The accompanying notes are an integral part of the Consolidated Financial Statements. |
| | |
| * | Figures for 2001 have been restated to reflect the adoption of UK Financial Reporting Standard 19 ‘Deferred Tax’, details of which are set out in Note 1 on the Financial Statements on pages 195 to 197. |
191
Back to Contents
HSBC HOLDINGS PLC
Financial Statements (continued)
|
| |
HSBC Holdings balance sheet at 31 December 2002 |
| | | | Notes | | | 2002 | | | 2001 | * |
FIXED ASSETS | | | | | | US$m | | | US$m | |
| | | | | | | | | | | |
| Tangible assets | | | 25 | | | 2 | | | 7 | |
| Investments | | | 26 | | | | | | | |
| – shares in HSBC undertakings | | | | | | 57,637 | | | 49,762 | |
| – loans to HSBC undertakings | | | | | | 4,163 | | | 4,172 | |
| – other investments other than loans | | | | | | 484 | | | 441 | |
| – own shares | | | | | | 514 | | | 555 | |
| | | | | |
| |
| |
| | | | | | | 62,800 | | | 54,937 | |
| | | | | |
| |
| |
CURRENT ASSETS | | | | | | | | | | |
| Debtors | | | | | | | | | | |
| – money market deposits with HSBC undertakings | | | | | | 5,708 | | | 2,685 | |
| – other amounts owed by HSBC undertakings | | | | | | 1,634 | | | 1,794 | |
| – amounts owed by HSBC undertakings (falling due after more than 1 year) | | | | | | 1,012 | | | 301 | |
| – other debtors | | | | | | 28 | | | 8 | |
| | | | | |
| |
| |
| | | | | | | 8,382 | | | 4,788 | |
| Cash at bank and in hand | | | | | | | | | | |
| – balances with HSBC undertakings | | | | | | 870 | | | 728 | |
| | | | | |
| |
| |
| | | | | | | 9,252 | | | 5,516 | |
| | | | | |
| |
| |
CREDITORS: amounts falling due within 1 year | | | | | | | | | | |
| Amounts owed to HSBC undertakings | | | | | | (1,370 | ) | | (973 | ) |
| Subordinated liabilities | | | 33 | | | | | | | |
| – owed to third parties | | | | | | – | | | (599 | ) |
| – owed to HSBC undertakings | | | | | | (350 | ) | | – | |
| Other creditors | | | | | | (196 | ) | | (184 | ) |
| Proposed dividend | | | 10 | | | (3,069 | ) | | (2,700 | ) |
| | | | | |
| |
| |
| | | | | | | (4,985 | ) | | (4,456 | ) |
| | | | | |
| |
| |
NET CURRENT ASSETS | | | | | | 4,267 | | | 1,060 | |
| | | | | |
| |
| |
TOTAL ASSETS LESS CURRENT LIABILITIES | | | | | | 67,067 | | | 55,997 | |
CREDITORS: amounts falling due after more than 1 year | | | | | | | | | | |
| Subordinated liabilities | | | 33 | | | | | | | |
| – owed to third parties | | | | | | (5,790 | ) | | (2,221 | ) |
| – owed to HSBC undertakings | | | | | | (3,686 | ) | | (3,856 | ) |
| Amounts owed to HSBC undertakings | | | | | | (5,092 | ) | | (3,434 | ) |
PROVISIONS FOR LIABILITIES AND CHARGES | | | | | | | | | | |
| Deferred taxation | | | 32 | | | (93 | ) | | (98 | ) |
| | | | | |
| |
| |
NET ASSETS | | | | | | 52,406 | | | 46,388 | |
| | | | | |
| |
| |
CAPITAL AND RESERVES | | | | | | | | | | |
| Called up share capital | | | 35 | | | 4,741 | | | 4,678 | |
| Share premium account | | | 36 | | | 3,647 | | | 3,373 | |
| Revaluation reserve | | | 36 | | | 37,010 | | | 32,581 | |
| Reserve in respect of obligations under CCF share options | | | 36 | | | 439 | | | 480 | |
| Profit and loss account | | | 36 | | | 6,569 | | | 5,276 | |
| | | | | |
| |
| |
| | | | | | | 52,406 | | | 46,388 | |
| | | | | |
| |
| |
Sir John Bond, Group Chairman.
The accompanying notes are an integral part of the Financial Statements.
|
| * | Figures for 2001 have been restated to reflect the adoption of UK Financial Reporting Standard 19 ‘Deferred Tax’, details of which are set out in Note 1 on the Financial Statements on pages 195 to 197. |
192
Back to Contents
HSBC HOLDINGS PLC
Statement of total consolidated recognised gains and losses for the year ended 31 December 2002 |
| | | | 2002 | | | 2001 | * | | 2000 | * |
| | | | US$m | | | US$m | | | US$m | |
| | | | | | | | | | | |
| Profit for the financial year attributable to shareholders | | | 6,239 | | | 4,992 | | | 6,457 | |
| Unrealised (deficit)/surplus on revaluation of investment properties: | | | | | | | | | | |
| – subsidiaries | | | (22 | ) | | (18 | ) | | 6 | |
| – associates | | | (1 | ) | | (5 | ) | | 8 | |
Unrealised (deficit)/surplus on revaluation of land and buildings
(excluding investment properties): | | | | | | | | | | |
| – subsidiaries | | | (297 | ) | | (227 | ) | | 357 | |
| – associates | | | – | | | – | | | 4 | |
| Exchange and other movements | | | 3,781 | | | (1,242 | ) | | (1,064 | ) |
| | |
|
| |
|
| |
|
| |
| Total recognised gains and losses for the year | | | 9,700 | | | 3,500 | | | 5,768 | |
| | | | | |
| |
| |
| Prior period adjustment (as explained in Note 1) | | | 409 | | | | | | | |
| | |
| | | | | | | |
| Total gains and losses since last annual report | | | 10,109 | | | | | | | |
| | |
| | | | | | | |
Reconciliation of movements in consolidated shareholders’ funds for the year ended 31 December 2002 |
| | | | 2002 | | | 2001 | * | | 2000 | * |
| | | | US$m | | | US$m | | | US$m | |
| | | | | | | | | | | |
| Profit for the financial year attributable to shareholders | | | 6,239 | | | 4,992 | | | 6,457 | |
| Dividends | | | (5,001 | ) | | (4,467 | ) | | (4,010 | ) |
| | |
|
| |
|
| |
|
| |
| | | | 1,238 | | | 525 | | | 2,447 | |
| Other recognised gains and losses relating to the year | | | 3,461 | | | (1,492 | ) | | (689 | ) |
| New share capital subscribed, net of costs | | | 337 | | | 112 | | | 488 | |
| New share capital issued in connection with the acquisition of CCF | | | – | | | – | | | 8,629 | |
| Reserve in respect of obligations under CCF share options | | | (41 | ) | | (16 | ) | | 496 | |
| Amounts arising on shares issued in lieu of dividends | | | 1,023 | | | 866 | | | 944 | |
| Capitalised reserves arising on issue of shares to a qualifying employee share ownership trust (‘QUEST’) | | | – | | | – | | | (324 | ) |
| | |
|
| |
|
| |
|
| |
| Net addition to shareholders’ funds | | | 6,018 | | | (5 | ) | | 11,991 | |
| Shareholders’ funds at 1 January as reported | | | 45,979 | | | 45,570 | | | 33,408 | |
| Prior period adjustment (as explained in Note 1) | | | 409 | | | 823 | | | 994 | |
| Shareholders’ funds at 1 January | | | 46,388 | | | 46,393 | | | 34,402 | |
| | |
|
| |
|
| |
|
| |
| Shareholders’ funds at 31 December | | | 52,406 | | | 46,388 | | | 46,393 | |
| | |
|
| |
|
| |
|
| |
No note of historical cost profits and losses has been presented as there is no material difference between HSBC’s results as disclosed in the consolidated profit and loss account and the results on an unmodified historical cost basis.
|
The accompanying notes are an integral part of the Consolidated Financial Statements.
|
| * | Figures for 2001 and 2000 have been restated to reflect the adoption of UK Financial Reporting Standard 19 ‘Deferred Tax’, details of which are set out in Note 1 on the Financial Statements on pages 195 to 197. |
193
Back to Contents
HSBC HOLDINGS PLC
Financial Statements (continued)
|
| |
Consolidated cash flow statement for the year ended 31 December 2002 |
| | | | | | | 2002 | | | 2001 | | | 2000 | |
| | | | Note | | | US$m | | | US$m | | | US$m | |
| | | | | | | | | | | | | | |
Net cash inflow from operating activities | | | 41 | | | 16,426 | | | 12,915 | | | 15,223 | |
Dividends received from associates | | | | | | 114 | | | 113 | | | 88 | |
Returns on investments and servicing of finance: | | | | | | | | | | | | | |
| Interest paid on finance leases and similar hire purchase contracts | | | | | | (29 | ) | | (27 | ) | | (26 | ) |
| Interest paid on subordinated loan capital | | | | | | (870 | ) | | (1,116 | ) | | (1,217 | ) |
| Dividends paid to minority interests: | | | | | | | | | | | | | |
| – equity | | | | | | (480 | ) | | (472 | ) | | (443 | ) |
| – non-equity | | | | | | (357 | ) | | (599 | ) | | (105 | ) |
| | | | | |
| |
| |
| |
Net cash (outflow) from returns on investments and servicing of finance | | | | | | (1,736 | ) | | (2,214 | ) | | (1,791 | ) |
Taxation paid | | | | | | (1,371 | ) | | (2,106 | ) | | (2,290 | ) |
Capital expenditure and financial investments: | | | | | | | | | | | | | |
| Purchase of investment securities | | | | | | (130,171 | ) | | (148,826 | ) | | (175,176 | ) |
| Proceeds from sale and maturities of investment securities | | | | | | 122,559 | | | 145,361 | | | 180,044 | |
| Purchase of tangible fixed assets | | | | | | (1,723 | ) | | (1,873 | ) | | (1,663 | ) |
| Proceeds from sale of tangible fixed assets | | | | | | 328 | | | 557 | | | 383 | |
| | | | | |
| |
| |
| |
Net cash (outflow)/inflow from capital expenditure and
financial investments | | | | | | (9,007 | ) | | (4,781 | ) | | 3,588 | |
| | | | | |
| |
| |
| |
Acquisitions and disposals: | | | | | | | | | | | | | |
| Net cash inflow/(outflow) from acquisition of and increase in stake in subsidiary undertakings | | | | | | 264 | | | (834 | ) | | 687 | |
| Net cash inflow from disposal of subsidiary undertakings | | | | | | – | | | 26 | | | 333 | |
| Payment to Republic and Safra Republic shareholders | | | | | | – | | | – | | | (9,733 | ) |
| Purchase of interest in associated undertakings and other participating interests | | | | | | (649 | ) | | (154 | ) | | (54 | ) |
| Proceeds from disposal of associated undertakings and other participating interests | | | | | | 341 | | | 79 | | | 138 | |
| | | | | |
| |
| |
| |
Net cash (outflow) from acquisitions and disposals | | | | | | (44 | ) | | (883 | ) | | (8,629 | ) |
Equity dividends paid | | | | | | (3,609 | ) | | (3,528 | ) | | (2,193 | ) |
| | | | | |
| |
| |
| |
Net cash inflow/(outflow) before financing | | | | | | 773 | | | (484 | ) | | 3,996 | |
Financing: | | | | | | | | | | | | | |
| Issue of ordinary share capital | | | | | | 337 | | | 112 | | | 164 | |
| Issue of perpetual preferred securities | | | | | | – | | | – | | | 3,626 | |
| Own shares acquired by employee share ownership trust | | | | | | – | | | – | | | (556 | ) |
| Redemption of preference share capital | | | | | | (50 | ) | | (825 | ) | | – | |
| Subordinated loan capital issued | | | | | | 4,105 | | | 456 | | | 948 | |
| Subordinated loan capital repaid | | | | | | (1,923 | ) | | (965 | ) | | (708 | ) |
| | | | | |
| |
| |
| |
Net cash inflow/(outflow) from financing | | | 42 | | | 2,469 | | | (1,222 | ) | | 3,474 | |
Increase/(decrease) in cash | | | 43 | | | 3,242 | | | (1,706 | ) | | 7,470 | |
| | | | | |
| |
| |
| |
The accompanying notes are an integral part of the Consolidated Financial Statements |
194
Back to Contents
HSBC HOLDINGS PLC
Notes on the Financial Statements
|
| | (a) | The financial statements have been prepared under the historical cost convention, as modified by the revaluation of certain investments and land and buildings, and in accordance with applicable accounting standards.
|
| | | The consolidated financial statements are prepared in accordance with the special provisions of Part VII Chapter II of the UK Companies Act 1985 (‘the Act’) relating to banking groups. The consolidated financial statements comply with Schedule 9 and the financial statements of HSBC Holdings comply with Schedule 4 to the Act.
|
| | | As permitted by Section 230 of the Act, no profit and loss account is presented for HSBC Holdings.
|
| | | HSBC has adopted the provisions of the UK Financial Reporting Standard (‘FRS’) FRS 19 ‘Deferred Tax’ with effect from 1 January 2002, and the transitional arrangements of FRS 17 ‘Retirement benefits’, which require additional disclosures only. For a discussion of the impact of the adoption of FRS 19 see Note 1(e) below.
|
| | | The accounts have been prepared in accordance with the Statements of Recommended Accounting Practice (‘SORPs’) issued by the British Bankers’ Association (‘BBA’) and Irish Bankers’ Federation (‘IBF’) and with the SORP ‘Accounting issues in the asset finance and leasing industry’ issued by the Finance & Leasing Association (‘FLA’).
|
| | | The SORP issued by the Association of British Insurers (‘ABI’) ‘Accounting for insurance business’ contains recommendations on accounting for insurance business for insurance companies and insurance groups. HSBC is primarily a banking group, rather than an insurance group, and, consistent with previously established practice for such groups preparing consolidated financial statements complying with Schedule 9 to the Act, values its long-term assurance businesses using the Embedded Value method. This method includes a prudent valuation of the discounted future earnings expected to emerge from business currently in force, taking into account factors such as recent experience and general economic conditions, together with the surplus retained in the long-term assurance funds.
|
| | (b) | The preparation of financial information requires the use of estimates and assumptions about future conditions. In this connection, management believes that the critical accounting policies are those in relation to provisions for bad and doubtful debts, goodwill impairment, and the valuation of unquoted and illiquid debt and equity securities. Application of these policies and the key estimates and assumptions used are described in the Financial Review section on pages 96 to 98 under the heading ‘Critical Accounting Policies’.
|
| | (c) | The consolidated financial statements of HSBC comprise the financial statements of HSBC Holdings and its subsidiary undertakings. Financial statements of subsidiary undertakings are made up to 31 December. In the case of the principal banking and insurance subsidiaries of HSBC Bank Argentina, whose financial statements are made up to 30 June annually to comply with local regulations, HSBC uses audited interim financial statements, drawn up to 31 December annually. The consolidated financial statements include the attributable share of the results and reserves of joint ventures and associates, based on financial statements made up to dates not earlier than six months prior to 31 December.
|
| | | All significant intra-HSBC transactions are eliminated on consolidation.
|
| | (d) | HSBC’s financial statements are prepared in accordance with UK generally accepted accounting principles (‘UK GAAP’), which differ in certain respects from US generally accepted accounting principles (‘US GAAP’). For a discussion of significant differences between UK GAAP and US GAAP and a reconciliation to US GAAP of certain amounts see Note 50. In addition, certain disclosures in the Notes on the Financial Statements have been made to comply with US reporting requirements.
|
| | (e) | The adoption of FRS 19 has required a change in the method of accounting for deferred tax. Deferred tax is now recognised in full, subject to recoverability of deferred tax assets. Previously, deferred tax assets and liabilities were recognised only to the extent they were expected to crystallise. As deferred tax liabilities have generally been fully provided, the main impact of the change in method for HSBC has been the recognition of deferred tax assets previously not recognised. The change in accounting policy has been reflected by way of a prior period adjustment. The comparative figures have been restated as follows: |
195
Back to Contents
HSBC HOLDINGS PLC
Notes on the Financial Statements (continued)
|
| | |
| Profit and loss account – tax on profit on ordinary activities |
| | | HSBC | | HSBC Holdings | |
Figures in US$m | | | 2001 | | | 2000 | | | 2001 | | | 2000 | |
| | |
|
| |
|
| |
|
| |
|
| |
| Under previous policy | | | (1,574 | ) | | (2,238 | ) | | 183 | | | 227 | |
| Adoption of FRS 19 | | | (414 | ) | | (171 | ) | | (112 | ) | | (191 | ) |
| | |
|
| |
|
| |
|
| |
|
| |
| Under new policy | | | (1,988 | ) | | (2,409 | ) | | 71 | | | 36 | |
| | |
|
| |
|
| |
|
| |
|
| |
| The effect on the results for the current period of the adoption of FRS 19 is immaterial.
|
| Consolidated balance sheet |
| |
Figures in US$m | | | Intangible fixed assets | | | Other assets | | | Provisions for liabilities and charges – deferred tax | | | Minority interests – equity | | | Reserves | |
| | |
|
| |
|
| |
|
| |
|
| |
|
| |
At 31 December 2001 | | | | | | | | | | | | | | | | |
| Under previous policy | | | 14,581 | | | 38,247 | | | 1,109 | | | 2,199 | | | 41,301 | |
| Adoption of FRS 19 | | | (17 | ) | | 385 | | | (52 | ) | | 11 | | | 409 | |
| | |
|
| |
|
| |
|
| |
|
| |
|
| |
| Under new policy | | | 14,564 | | | 38,632 | | | 1,057 | | | 2,210 | | | 41,710 | |
| | |
|
| |
|
| |
|
| |
|
| |
|
| |
At 31 December 2000 | | | | | | | | | | | | | | | | |
| Under previous policy | | | 15,089 | | | 35,562 | | | 1,251 | | | 2,138 | | | 40,936 | |
| Adoption of FRS 19 | | | (17 | ) | | 468 | | | (383 | ) | | 11 | | | 823 | |
| | |
|
| |
|
| |
|
| |
|
| |
|
| |
| Under new policy | | | 15,072 | | | 36,030 | | | 868 | | | 2,149 | | | 41,759 | |
| | |
|
| |
|
| |
|
| |
|
| |
|
| |
At 31 December 1999 | | | | | | | | | | | | | | | | |
| Under previous policy | | | 6,541 | | | 29,363 | | | 1,388 | | | 2,072 | | | 29,178 | |
| Adoption of FRS 19 | | | 34 | | | 735 | | | (236 | ) | | 11 | | | 994 | |
| | |
|
| |
|
| |
|
| |
|
| |
|
| |
| Under new policy | | | 6,575 | | | 30,098 | | | 1,152 | | | 2,083 | | | 30,172 | |
| | |
|
| |
|
| |
|
| |
|
| |
|
| |
| HSBC Holdings balance sheet |
Figures in US$m | | | Investments in subsidiary undertakings | | | Provisions for liabilities and charges – deferred tax | | | Revaluation reserve | | | Profit and loss account reserve | |
| | |
|
| |
|
| |
|
| |
|
| |
At 31 December 2001 | | | | | | | | | | | | | |
| Under previous policy | | | 49,353 | | | 98 | | | 32,172 | | | 5,276 | |
| Adoption of FRS 19 | | | 409 | | | – | | | 409 | | | – | |
| | |
|
| |
|
| |
|
| |
|
| |
| Under new policy | | | 49,762 | | | 98 | | | 32,581 | | | 5,276 | |
| | |
|
| |
|
| |
|
| |
|
| |
At 31 December 2000 | | | | | | | | | | | | | |
| Under previous policy | | | 46,395 | | | 173 | | | 31,652 | | | 5,483 | |
| Adoption of FRS 19 | | | 711 | | | (112 | ) | | 711 | | | 112 | |
| | |
|
| |
|
| |
|
| |
|
| |
| Under new policy | | | 47,106 | | | 61 | | | 32,363 | | | 5,595 | |
| | |
|
| |
|
| |
|
| |
|
| |
At 31 December 1999 | | | | | | | | | | | | | |
| Under previous policy | | | 32,079 | | | 289 | | | 21,874 | | | 4,422 | |
| Adoption of FRS 19 | | | 691 | | | (303 | ) | | 691 | | | 303 | |
| | |
|
| |
|
| |
|
| |
|
| |
| Under new policy | | | 32,770 | | | (14 | ) | | 22,565 | | | 4,725 | |
| | |
|
| |
|
| |
|
| |
|
| |
196
Back to Contents
HSBC HOLDINGS PLC
| | | The increase in HSBC’s tax charge for 2001 as restated can be explained as follows: |
| | | | |
| | | • | reversal of benefit taken in 2001 under SSAP 15 in respect of deferred tax assets attributable under FRS 19 to prior periods; |
| | | | |
| | | • | reversal of a benefit taken in 2001 under SSAP 15 in respect of the utilisation and release of a provision for additional UK tax on remittances from overseas, such provisions not being permissible under FRS 19; and |
| | | | |
| | | • | establishment of a provision required under FRS 19 in respect of a possible claw-back of capital allowances. |
| | | |
| | | The increase in HSBC’s tax charge for 2000 as restated can be explained as follows: |
| | | | |
| | | • | reversal of a benefit taken in 2000 under SSAP 15 in respect of the utilisation of a provision for additional UK tax on remittances from overseas, such provisions not being allowable under FRS19; and |
| | | | |
| | | • | reduction in the deferred tax asset under FRS19 relating to general bad debt provisions in line with the reduction in the underlying general provisions. |
| | | |
| | | The increase in HSBC Holdings’ tax charge for 2001 as restated can be explained as follows: |
| | | | |
| | | • | reversal of a benefit taken in 2001 under SSAP15 in respect of the utilisation and release of a provision for additional UK tax on remittances from overseas, such provisions not being permissible under FRS19. |
| | | |
| | | The increase in HSBC Holdings’ tax charge for 2000 as restated can be explained as follows: |
| | | | |
| | | • | reversal of a benefit taken in 2000 under SSAP15 in respect of the utilisation and release of a provision for additional UK tax on remittances from overseas, such provisions not being permissible under FRS19; and |
| | | | |
| | | • | reduction in the deferred tax asset under FRS19 relating to various provisions. |
| | |
| | |
| 2 | Principal accounting policies |
|
| | | |
| | | Interest income is recognised in the profit and loss account as it accrues, except in the case of doubtful debts (Note 2 (b)). |
| | | |
| | | Fee and commission income is accounted for in the period when receivable, except where it is charged to cover the costs of a continuing service to, or risk borne for, the customer, or is interest in nature. In these cases, it is recognised on an appropriate basis over the relevant period. |
| | |
| | (b) | Loans and advances and doubtful debts |
| | | |
| | | It is HSBC’s policy that each operating company will make provisions for bad and doubtful debts promptly where required and on a prudent and consistent basis. |
| | | |
| | | Loans are designated as non-performing as soon as management has doubts as to the ultimate collectibility of principal or interest or when contractual payments of principal or interest are 90 days overdue. When a loan is designated as non-performing, interest will be suspended (see below) and a specific provision raised if required. |
| | | |
| | | However, the suspension of interest may exceptionally be deferred for up to 12 months past due in the following situations: |
| | | | |
| | | – | where cash collateral is held covering the total of principal and interest due and the right of set-off is legally sound; or |
| | | | |
| | | – | where the value of net realisable tangible security is considered more than sufficient to cover the full repayment of all principal and interest due and credit approval has been given to the rolling-up or capitalisation of interest payments. |
| | | |
| | | There are two basic types of provision, specific and general, each of which is considered in terms of the charge and the amount outstanding. |
197
Back to Contents
HSBC HOLDINGS PLC
Notes on the Financial Statements (continued)
|
| | | |
| | | Specific provisions represent the quantification of actual and expected losses from identified accounts and are deducted from loans and advances in the balance sheet. |
| | | |
| | | Other than where provisions on smaller balance homogenous loans are assessed on a portfolio basis, the amount of specific provision raised is assessed on a case by case basis. The amount of specific provision raised is HSBC’s conservative estimate of the amount needed to reduce the carrying value of the asset to the expected ultimate net realisable value, and in reaching a decision consideration is given, among other things, to the following factors: |
| | | | |
| | | – | the financial standing of the customer, including a realistic assessment of the likelihood of repayment of the loan within an acceptable period and the extent of HSBC’s other commitments to the same customer; |
| | | | |
| | | – | the realisable value of any security for the loan; |
| | | | |
| | | – | the costs associated with obtaining repayment and realisation of the security; and |
| | | | |
| | | – | if loans are not in local currency, the ability of the borrower to obtain the relevant foreign currency. |
| | | |
| | | Where specific provisions are raised on a portfolio basis, the level of provisioning takes into account management’s assessment of the portfolio’s structure, past and expected credit losses, business and economic conditions, and any other relevant factors. The principal portfolios evaluated on this basis are credit cards and other consumer lending products. |
| | | |
| | | General provisions augment specific provisions and provide cover for loans which are impaired at the balance sheet date but which will not be identified as such until some time in the future. HSBC requires operating companies to maintain a general provision which is determined taking into account the structure and risk characteristics of each company’s loan portfolio. Historical levels of latent risk are regularly reviewed by each operating company to determine that the level of general provisioning continues to be appropriate. Where entities operate in a significantly higher risk environment, an increased level of general provisioning will apply taking into account local market conditions and economic and political factors. General provisions are deducted from loans and advances to customers in the balance sheet. |
| | | |
| | | Loans on which interest is being suspended |
| | | |
| | | Provided that there is a realistic prospect of interest being paid at some future date, interest on non-performing loans is charged to the customer’s account. However, the interest is not credited to the profit and loss account but to an interest suspense account in the balance sheet which is netted against the relevant loan. On receipt of cash (other than from the realisation of security), suspended interest is recovered and taken to the profit and loss account. A specific provision of the same amount as the interest receipt is then raised against the principal balance. Amounts received from the realisation of security are applied to the repayment of outstanding indebtedness, with any surplus used to recover any specific provisions and then suspended interest. |
| | | |
| | | Where the probability of receiving interest payments is remote, interest is no longer accrued and any suspended interest balance is written off. |
| | | |
| | | Loans are not reclassified as accruing until interest and principal payments are up-to-date and future payments are reasonably assured. |
| | | |
| | | Loans and suspended interest are written off, either partially or in full, when there is no prospect of recovery of these amounts. |
| | | |
| | | Assets acquired in exchange for advances |
| | | |
| | | Assets acquired in exchange for advances in order to achieve an orderly realisation continue to be reported as advances. The asset acquired is recorded at the carrying value of the advance disposed of at the date of the exchange and provisions are based on any subsequent deterioration in its value. |
198
Back to Contents
HSBC HOLDINGS PLC
| | (c) | Treasury bills, debt securities and equity shares |
| | | |
| | | Treasury bills, debt securities and equity shares intended to be held on a continuing basis are disclosed as investment securities and are included in the balance sheet at cost less provision for any permanent diminution in value. |
| | | |
| | | Where dated investment securities have been purchased at a premium or discount, these premiums and discounts are amortised through the profit and loss account over the period from the date of purchase to the date of maturity so as to give a constant rate of return. If the maturity is at the borrowers’ option within a specified range of years, the maturity date which gives the more conservative result is adopted. These securities are included in the balance sheet at cost adjusted for the amortisation of premiums and discounts arising on acquisition. The amortisation of premiums and discounts is included in ‘Interest receivable’. Any profit or loss on realisation of these securities is recognised in the profit and loss account as it arises and included in ‘Gains on disposal of investments’. |
| | | |
| | | Other treasury bills, debt securities, equity shares and short positions in securities are included in the balance sheet at market value. Changes in the market value of such assets and liabilities are recognised in the profit and loss account as ‘Dealing profits’ as they arise. For liquid portfolios market values are determined by reference to independently sourced mid-market prices. In certain less liquid portfolios securities are valued by reference to bid or offer prices as appropriate. Where independent prices are not available, market values may be determined by discounting the expected future cash flows using an appropriate interest rate adjusted for the credit risk of the counterparty. In addition, adjustments are made for illiquid positions where appropriate. |
| | | |
| | | Where securities are sold subject to a commitment to repurchase them at a predetermined price, they remain on the balance sheet and a liability is recorded in respect of the consideration received. Conversely, securities purchased under analogous commitments to resell are not recognised on the balance sheet and the consideration paid is recorded in ‘Loans and advances to banks’ or ‘Loans and advances to customers’. |
| | | |
| | (d) | Subsidiary undertakings, joint ventures, associates and other participating interests |
| | | | |
| | | (i) | HSBC Holdings’ investments in subsidiary undertakings are stated at net asset values, including attributable goodwill. Changes in net assets of subsidiary undertakings are accounted for as movements in the revaluation reserve. |
| | | | |
| | | (ii) | Interests in joint ventures are stated at HSBC’s share of gross assets, including attributable goodwill, less HSBC’s share of gross liabilities. |
| | | | |
| | | (iii) | Interests in associates are stated at HSBC’s share of net assets, including attributable goodwill. |
| | | | |
| | | (iv) | Other participating interests are investments in the shares of undertakings which are held on a long-term basis for the purpose of securing a contribution to HSBC’s business, other than subsidiary undertakings, joint ventures or associates. Other participating interests are stated at cost less any permanent diminution in value. |
| | | | |
| | | (v) | Goodwill arises on the acquisition of subsidiary undertakings, joint ventures or associates when the cost of acquisition exceeds the fair value of HSBC’s share of separable net assets acquired. Negative goodwill arises on the acquisition of subsidiary undertakings, joint ventures and associates when the fair value of HSBC’s share of separable net assets acquired exceeds the cost of acquisition. For acquisitions made on or after 1 January 1998, goodwill is included in the balance sheet in ‘Intangible fixed assets’ in respect of subsidiary undertakings, in ‘Interests in joint ventures’ in respect of joint ventures and in ‘Interests in associates’ in respect of associates. Capitalised goodwill is amortised over its estimated life on a straight-line basis. For acquisitions prior to 1 January 1998, goodwill was charged against reserves in the year of acquisition. Capitalised goodwill is tested for impairment when necessary by comparing the present value of the expected future cash flows from an entity with the carrying value of its net assets, including attributable goodwill. Negative goodwill is credited in the profit and loss account in the periods expected to be benefited. |
199
Back to Contents
HSBC HOLDINGS PLC
Notes on the Financial Statements (continued)
|
| | | | |
| | | | At the date of disposal of subsidiary undertakings, joint ventures or associates, any unamortised goodwill or goodwill charged directly to reserves is included in HSBC’s share of net assets of the undertaking in the calculation of the gain or loss on disposal of the undertaking. |
| | | | |
| | | (i) | Land and buildings are stated at valuation or cost less depreciation calculated to write off the assets over their estimated useful lives as follows: |
| | | | | |
| | | | – | freehold land and land held on leases with more than 50 years to expiry are not depreciated; |
| | | | | |
| | | | – | land held on leases with 50 years or less to expiry is depreciated over the unexpired terms of the leases; and |
| | | | | |
| | | | – | buildings and improvements thereto are depreciated on cost or valuation at the greater of 2% per annum on the straight-line basis or over the unexpired terms of the leases or over the remaining useful lives. |
| | | | |
| | | (ii) | Equipment, fixtures and fittings are stated at cost less depreciation calculated on the straight-line basis to write off the assets over their estimated useful lives, which are generally between 5 years and 20 years. |
| | | | |
| | | (iii) | HSBC holds certain properties as investments. No depreciation is provided in respect of such properties other than leaseholds with 20 years or less to expiry. Investment properties are included in the balance sheet at their open market value and the aggregate surplus or deficit, where material, is transferred to the investment property revaluation reserve. |
| | | |
| | (f) | Finance and operating leases |
| | | | |
| | | (i) | Assets leased to customers under agreements which transfer substantially all the risks and rewards associated with ownership, other than legal title, are classified as finance leases. Where HSBC is a lessor under finance leases the amounts due under the leases, after deduction of unearned charges, are included in ‘Loans and advances to banks’ or ‘Loans and advances to customers’. Finance charges receivable are recognised over the periods of the leases so as to give a constant rate of return on the net cash investment in the leases, taking into account tax payments and receipts associated with the leases. |
| | | | |
| | | (ii) | Where HSBC is a lessee under finance leases the leased assets are capitalised and included in ‘Equipment, fixtures and fittings’ and the corresponding liability to the lessor is included in ‘Other liabilities’. Finance charges payable are recognised over the periods of the leases based on the interest rates implicit in the leases. |
| | | | |
| | | (iii) | All other leases are classified as operating leases and, where HSBC is the lessor, are included in ‘Tangible fixed assets’. The residual values of equipment on operating leases are regularly monitored. Provision is made to the extent that the carrying value of equipment is impaired through residual values not being fully recoverable. Rentals payable and receivable under operating leases are accounted for on the straight-line basis over the periods of the leases and are included in ‘Administrative expenses’ and ‘Other operating income’ respectively. |
| | | |
| | | Deferred tax is recognised in full on timing differences between the accounting and taxation treatment of income and expenditure, subject to assessment of the recoverability of deferred tax assets. Deferred tax balances are not discounted. |
| | | |
| | (h) | Pension and other post-retirement benefits |
| | | |
| | | HSBC operates a number of pension and other post-retirement benefit schemes throughout the world. |
200
Back to Contents
HSBC HOLDINGS PLC
| | | For UK defined benefit schemes annual contributions are made, on the advice of qualified actuaries, for funding of retirement benefits in order to build up reserves for each scheme member during the employee’s working life and used to pay a pension to the employee or dependant after retirement. The costs of providing these benefits are charged to the profit and loss account on a regular basis. |
| | | |
| | | Arrangements for staff retirement benefits in overseas locations vary from country to country and are made in accordance with local regulations and custom. The pension cost of the major overseas schemes is assessed in accordance with the advice of qualified actuaries so as to recognise the cost of pensions on a systematic basis over employees’ service lives. |
| | | |
| | | Since 1 January 1993, the cost of providing post-retirement health-care benefits, which is assessed in accordance with the advice of qualified actuaries, has been recognised on a systematic basis over employees’ service lives. At 1 January 1993, there was an accumulated obligation in respect of these benefits relating to current and retired employees which is being charged to the profit and loss account in equal instalments over 20 years. |
| | | | |
| | | (i) | Assets and liabilities denominated in foreign currencies are translated into US dollars at the rates of exchange ruling at the year-end. The results of branches, subsidiary undertakings, joint ventures and associates not reporting in US dollars are translated into US dollars at the average rates of exchange for the year. Further information on the translation of assets and liabilities in Argentina is set out in Note 6. |
| | | | |
| | | (ii) | Exchange differences arising from the retranslation of opening foreign currency net investments and the related cost of hedging and exchange differences arising from retranslation of the result for the year from the average rate to the exchange rate ruling at the year-end are accounted for in reserves. |
| | | | |
| | | (iii) | Other exchange differences are recognised in the profit and loss account. |
| | | |
| | (j) | Off-balance-sheet financial instruments |
| | | |
| | | Off-balance-sheet financial instruments comprise futures, forward, swap and option transactions undertaken by HSBC in the foreign exchange, interest rate, equity and credit derivative markets. Netting is applied where a legal right of set-off exists. Mark-to-market assets and liabilities are presented gross, with netting shown separately. |
| | | |
| | | Accounting for these instruments is dependent upon whether the transactions are undertaken for trading or non-trading purposes. |
| | | |
| | | Trading transactions include transactions undertaken for market-making, to service customers’ needs and for proprietary purposes, as well as any related hedges. |
| | | |
| | | Transactions undertaken for trading purposes are marked-to-market and the net present value of any gain or loss arising is recognised in the profit and loss account as ‘Dealing profits’, after appropriate deferrals for unearned credit margin and future servicing costs. Off-balance-sheet trading transactions are valued by reference to an independent liquid price where this is available. For those transactions where there are no readily quoted prices, which predominantly relates to over the counter transactions, market values are determined by reference to independently sourced rates, using valuation models. Adjustments are made for illiquid positions where appropriate. |
| | | |
| | | Assets, including gains, resulting from off-balance-sheet exchange rate, interest rate, equities and credit derivative contracts which are marked-to-market are included in ‘Other assets’. Liabilities, including losses, resulting from such contracts, are included in ‘Other liabilities’. |
201
Back to Contents
HSBC HOLDINGS PLC
Notes on the Financial Statements (continued)
|
| | |
| | Non-trading transactions are those which are held for hedging purposes as part of HSBC’s risk management strategy against assets, liabilities, positions or cash flows measured on an accruals basis. Non-trading transactions include qualifying hedges and positions that synthetically alter the characteristics of specified financial instruments. |
| | |
| | Non-trading transactions are accounted for on an equivalent basis to the underlying assets, liabilities or net positions. Any profit or loss arising is recognised on the same basis as that arising from the related assets, liabilities or positions. |
| | |
| | To qualify as a hedge, a derivative must effectively reduce the price or interest rate risk of the asset, liability or anticipated transaction to which it is linked and be designated as a hedge at inception of the derivative contract. Accordingly, changes in the market value of the derivative must be highly correlated with changes in the market value of the underlying hedged item at inception of the hedge and over the life of the hedge contract. If these criteria are met, the derivative is accounted for on the same basis as the underlying hedged item. Derivatives used for hedging purposes include swaps, forwards and futures. |
| | |
| | Interest rate swaps are also used to alter synthetically the interest rate characteristics of financial instruments. In order to qualify for synthetic alteration, a derivative instrument must be linked to specific individual, or pools of similar, assets or liabilities by the notional principal and interest rate risks of the associated instruments, and must achieve a result that is consistent with defined risk management objectives. If these criteria are met, accruals based accounting is applied, i.e. income or expense is recognised and accrued to the next settlement date in accordance with the contractual terms of the agreement. |
| | |
| | Any gain or loss arising on the termination of a qualifying derivative is deferred and amortised to earnings over the original life of the terminated contract. Where the underlying asset, liability or position is sold or terminated, the qualifying derivative is immediately marked-to-market and any profit or loss arising is taken to the profit and loss account. |
| | |
| (k) | Long-term assurance business |
| | |
| | The value placed on HSBC’s interest in long-term assurance business includes a prudent valuation of the discounted future earnings expected to emerge from business currently in force, taking into account factors such as recent experience and general economic conditions, together with the surplus retained in the long-term assurance funds. These are determined annually in consultation with independent actuaries and are included in ‘Other assets’. |
| | |
| | Changes in the value placed on HSBC’s interest in long-term assurance business are calculated on a post-tax basis and reported in the profit and loss account as part of ‘Other operating income’ after adjusting for taxation. |
| | |
| | Long-term assurance assets and liabilities attributable to policyholders are recognised in HSBC’s accounts in ‘Other assets’ and ‘Other liabilities’. |
| | | | 2002 | | | 2001 | | | 2000 | |
| | | | US$m | | | US$m | | | US$m | |
| Income from equity shares | | | 274 | | | 184 | | | 195 | |
Income from participating interests other than joint ventures
and associates | | | 4 | | | 2 | | | 2 | |
| | |
|
| |
|
| |
|
| |
| | | | 278 | | | 186 | | | 197 | |
| | |
|
| |
|
| |
|
| |
202
Back to Contents
HSBC HOLDINGS PLC
| 4 | Analysis of income from dealing in financial instruments |
|
| | | | | | | | |
| | | 2002 | | 2001 | | 2000 | |
| | |
| |
| |
| |
| | | | Dealing profits | | | Dividend and net interest income | | | Total | | | Dealing profits | | | Dividend and net interest income | | | Total | | | Dealing profits | | | Dividend and net interest income | | | Total | |
| | |
|
| |
|
| |
|
| |
|
| |
|
| |
|
| |
|
| |
|
| |
|
| |
| | | | US$m | | | US$m | | | US$m | | | US$m | | | US$m | | | US$m | | | US$m | | | US$m | | | US$m | |
| |
| Foreign exchange | | | 1,167 | | | 43 | | | 1,210 | | | 1,120 | | | 1 | | | 1,121 | | | 965 | | | 18 | | | 983 | |
| Interest rate derivatives | | | 47 | | | (7 | ) | | 40 | | | 159 | | | 20 | | | 179 | | | 57 | | | 16 | | | 73 | |
| Debt securities | | | 75 | | | 259 | | | 334 | | | 311 | | | 174 | | | 485 | | | 281 | | | 161 | | | 442 | |
| Equities and other trading | | | 24 | | | 186 | | | 210 | | | 95 | | | 75 | | | 170 | | | 323 | | | 52 | | | 375 | |
| | |
|
| |
|
| |
|
| |
|
| |
|
| |
|
| |
|
| |
|
| |
|
| |
| | | | 1,313 | | | 481 | | | 1,794 | | | 1,685 | | | 270 | | | 1,955 | | | 1,626 | | | 247 | | | 1,873 | |
| | |
|
| |
|
| |
|
| |
|
| |
|
| |
|
| |
|
| |
|
| |
|
| |
| (a) | | | 2002 | | | 2001 | | | 2000 | |
| | | | US$m | | | US$m | | | US$m | |
| Staff costs | | | | | | | | | | |
| – wages and salaries | | | 7,367 | | | 7,329 | | | 7,139 | |
| – social security costs | | | 630 | | | 613 | | | 454 | |
| – retirement benefits (Note 5(b) below) | | | 612 | | | 611 | | | 464 | |
| | |
|
| |
|
| |
|
| |
| | | | 8,609 | | | 8,553 | | | 8,057 | |
| Premises and equipment (excluding depreciation) | | | 1,824 | | | 1,639 | | | 1,480 | |
| Other administrative expenses | | | 3,331 | | | 3,279 | | | 2,959 | |
| | |
|
| |
|
| |
|
| |
| | | | 13,764 | | | 13,471 | | | 12,496 | |
| | |
|
| |
|
| |
|
| |
| | | The average number of persons employed by HSBC during the year was made up as follows: |
| | | | 2002 | | | 2001 | | | 2000 | |
| | | | Number | | | Number | | | Number | |
| Europe | | | 76,924 | | | 77,435 | | | 68,208 | |
| Hong Kong | | | 24,452 | | | 25,081 | | | 24,446 | |
| Rest of Asia-Pacific | | | 27,584 | | | 25,142 | | | 22,020 | |
| North America | | | 22,262 | | | 21,136 | | | 21,489 | |
| South America* | | | 26,253 | | | 27,888 | | | 26,465 | |
| | |
|
| |
|
| |
|
| |
| | | | 177,475 | | | 176,682 | | | 162,628 | |
| | |
|
| |
|
| |
|
| |
| | |
| * | Formerly described as Latin America, which included Group entities in Panama and Mexico, which are now included in North America. Figures for 2001 and 2000 have been restated to reflect this change |
| (b) | Retirement benefits |
| | |
| | HSBC has continued to account for pensions in accordance with Statement of Standard Accounting Practice (‘SSAP’) 24 ‘Accounting for pension costs’ and the disclosures given in (i) are those required by that standard. FRS 17 ‘Retirement benefits’ was issued in November 2000. Prior to full implementation, which has been deferred until accounting periods beginning on or after 1 January 2005, phased transitional disclosures are required from 31 December 2001. These disclosures, to the extent not given in (i), are set out in (ii). |
203
Back to Contents
HSBC HOLDINGS PLC
Notes on the Financial Statements (continued)
|
| | |
| | HSBC operates some 169 pension schemes throughout the world, covering 91% of HSBC’s employees, with a total pension cost of US$558 million (2001: US$572 million; 2000: US$422 million;), of which US$316 million (2001: US$349 million; 2000: US$210 million) relates to overseas schemes. Of the overseas schemes, US$43 million (2001: US$31 million; 2000:US$30 million) has been determined in accordance with best practice and regulations in the United States and Canada. |
| | |
| | The majority of the schemes are funded defined benefit schemes, which cover 53% of HSBC’s employees, with assets, in the case of most of the larger schemes, held in trust or similar funds separate from HSBC. The pension cost relating to these schemes was US$406 million (2001: US$428 million; 2000: US$341 million) which is assessed in accordance with the advice of qualified actuaries. The schemes are reviewed at least on a triennial basis or in accordance with local practice and regulations. The actuarial assumptions used to calculate the projected benefit obligations of HSBC’s pension schemes vary according to the economic conditions of the countries in which they are situated. |
| | |
| | In the United Kingdom, the HSBC Bank (UK) Pension Scheme covers employees of HSBC Bank plc and certain other employees of HSBC. This scheme comprises a funded defined benefit scheme (‘the principal scheme’) and a defined contribution scheme which was established on 1 July 1996 for new employees. The actuarial valuation as at 31 December 2002 is currently in the course of preparation based on the circumstances as at that date. The latest valuation of the principal scheme was made at 31 December 1999 by C G Singer, Fellow of the Institute of Actuaries, of Watson Wyatt Partners. At that date, the market value of the principal scheme’s assets was US$10,888 million. The actuarial value of the assets represented 104% of the benefits accrued to members, after allowing for expected future increases in earnings, and the resulting surplus amounted to US$346 million. The method adopted for this valuation was the projected unit method and the main assumptions used were a long-term investment return of 6.85% per annum, salary increases of 4.0% per annum, equity dividend increases and rental growth of 3.5% per annum, and post-retirement pension increases of 2.5% per annum. |
| | |
| | Following an interim review, HSBC decided to increase contributions from 16.9% to 20.0% of pensionable salaries with effect from 1 August 2002, until completion of the actuarial valuation as at 31 December 2002. |
| | |
| | HSBC has given preliminary consideration to its funding strategy in advance of knowing the results of the 2002 triennial valuation. The funding policy itself is reviewed on a systematic basis in consultation with the independent Scheme Actuary in order to ensure that the funding contributions from the sponsoring employers are appropriate to meet the liabilities of the Scheme over the long term. Full valuation calculations are currently in hand but HSBC anticipates there will be a shortfall of at least US$800 million on the funding basis which will be adopted for the Scheme. HSBC has therefore decided to pay this amount into the Scheme (this amount has been paid since the year end). Further contributions to the Scheme will be assessed after considering the advice of the independent Scheme Actuary and taking into account long-term rates of returns on the underlying investments assessed with an appropriate degree of prudence. |
| | |
| | In Hong Kong, the HSBC Group Hong Kong Local Staff Retirement Benefit Scheme covers employees of the Hongkong and Shanghai Banking Corporation Limited and certain other employees of HSBC. The scheme comprises a funded defined benefit scheme (which is a lump sum scheme) and a defined contribution scheme. The latter was established on 1 January 1999 for new employees. The latest valuation of the defined benefit scheme was made at 31 December 2002 and was performed by E Chiu, Fellow of the Society of Actuaries of the United States of America, of HSBC Life (International) Limited, a subsidiary of HSBC Holdings. At that date, the market value of the defined benefit scheme’s assets was US$794 million. On an ongoing basis, the actuarial value of the scheme’s assets represented 111% of the benefits accrued to members, after allowing for expected future increases in salaries, and the resulting surplus amounted to US$81 million. On a wind-up basis, the actuarial value of the scheme’s assets represents 114% of the members’ vested benefits, based on current salaries, and the resulting surplus amounted to US$100 million. The actuarial method used was the projected unit credit method and the main assumptions used in this valuation were a long-term investment return of 5.5% per annum and salary increases of 4.5% per annum. |
204
Back to Contents
HSBC HOLDINGS PLC
| | In the United States, the HSBC Bank USA Pension Plan (the ‘principal scheme’) covers employees of HSBC Bank USA and certain other employees of HSBC. The latest valuation of the principal scheme was made at 1 January 2002 by R G Gendron and K G Leister, Fellows of the Society of Actuaries, of Hewitt Associates LLC. At that date, the market value of the principal scheme’s assets was US$772 million. The actuarial value of the assets represented 92% of the benefits accrued to members, after allowing for expected future increases in earnings, and the resulting deficit amounted to US$67 million. This deficit was eliminated by means of contributions made to the scheme in 2002. The method employed for this valuation was the projected unit credit method and the main assumptions used were a discount rate of 7.25% per annum and average salary increases of 4.0% per annum. |
| | |
| | The HSBC Bank (UK) Pension Scheme, The HSBC Group Hong Kong Local Staff Retirement Benefits Scheme and the HSBC Bank USA Pension Plan cover 37% (2001: 42%, 2000: 45%) of HSBC’s employees. |
| | |
| | The pension cost for defined contribution schemes, which cover 38% (2001: 41%; 2000: 24%) of HSBC’s employees, was US$152 million (2001: US$144 million; 2000: US$81 million). |
| | |
| (ii) | FRS 17 Retirement Benefits |
| | |
| | At 31 December 2002 the assumptions used to calculate scheme liabilities for HSBC’s main defined benefit pension schemes under FRS 17 are: |
| | | | | | | | | | | | | | |
| | | | Discount
rate | | | Inflation Assumption | | | Rate of increase for pensions in payment and deferred pension | | | Rate of pay increase | |
| | |
|
| |
|
| |
|
| |
|
| |
| | | | % | | | % | | | % | | | % | |
| United Kingdom | | | 5.6 | | | 2.25 | | | 2.25 | | | 2.75 | |
| Hong Kong | | | 5.5 | | | N/A | | | N/A | | | 4.5 | |
| United States | | | 6.75 | | | 2.5 | | | N/A | | | 3.75 | |
| Jersey | | | 5.6 | | | 2.25 | | | 2.25 | | | 4.0 | |
| Mexico | | | 10.78 | | | 5.0 | | | 5.0 | | | 7.62 | |
| Brazil | | | 10.25 | | | 5.0 | | | 5.0 | | | 6.05 | |
| France | | | 5.5 | | | 2.0 | | | 2.0 | | | 3.5 | |
| Other | | | 3.75-6.75 | | | 1.5-2.0 | | | 0-1.5 | | | 2.5-3.0 | |
205
Back to Contents
HSBC HOLDINGS PLC
Notes on the Financial Statements (continued)
|
| | |
| | At 31 December 2001 the assumptions used to calculate scheme liabilities for HSBC’s main defined benefit pension schemes under FRS 17 were: |
| | | | Discount rate | | | Inflation Assumption | | | Rate of increase for pensions in payment and deferred pension | | | Rate of pay increase | |
| | |
|
| |
|
| |
|
| |
|
| |
| | | | % | | | % | | | % | | | % | |
| United Kingdom | | | 5.9 | | | 2.5 | | | 2.5 | | | 3.75 | |
| Hong Kong | | | 6.5 | | | N/A | | | N/A | | | 6.0 | |
| United States | | | 7.25 | | | 2.75 | | | N/A | | | 4.0 | |
| Jersey | | | 5.9 | | | 2.5 | | | 2.5 | | | 4.25 | |
| Brazil | | | 10.25 | | | 5.0 | | | 5.0 | | | 6.05 | |
| France | | | 5.5 | | | 2.0 | | | 2.0 | | | 3.5 | |
| Other | | | 4.5-6.25 | | | 1.5-2.0 | | | 1.5-2.0 | | | 2.5-3.5 | |
The assets in the defined benefit schemes and the expected rates of return are:
| | | HSBC Bank (UK) Pension Scheme
| | Other Schemes
| |
| | | | Expected rate of return at 31 December 2002 | | | Value at 31 December 2002 | | | Expected rate of return at 31 December 2002 | | | Value at 31 December 2002 | |
| | |
|
| |
|
| |
|
| |
|
| |
| | | | % | | | US$m | | | % | | | US$m | |
| Equities | | | 8.5 | | | 5,682 | | | 10.75 | | | 1,491 | |
| Bonds | | | 5.0 | | | 2,032 | | | 6.3 | | | 1,418 | |
| Property | | | 7.0 | | | 1,139 | | | - | | | - | |
| Other | | | 3.75 | | | 415 | | | 3.1 | | | 402 | |
| | | | | |
| | | | |
| |
| Total market value of assets | | | | | | 9,268 | | | | | | 3,311 | |
| Present value of scheme liabilities | | | | | | (12,094 | ) | | | | | (4,030 | ) |
| | | | | |
| | | | |
| |
| Deficit in the schemes | | | | | | (2,826 | ) | | | | | (719 | )* |
| Related deferred tax asset | | | | | | 848 | | | | | | 150 | |
| | | | | |
| | | | |
| |
| Net pension liability | | | | | | (1,978 | ) | | | | | (569 | ) |
| | | | | |
| | | | | | | |
| Less: net amounts provided in the balance sheet for unfunded schemes | | | | | | | | | | | | 402 | |
| | | | | | | | | | | |
| |
| Net unprovided pension liability | | | | | | | | | | | | (167 | ) |
| | | | | | | | | | | |
| |
| | | |
| * | Of the deficit in other schemes, US$832 million relates to schemes in deficit and US$113 million relates to schemes in surplus. Of the schemes in deficit, US$442 million relates to unfunded pension schemes in respect of which a provision, net of deferred tax, of US$402 million has been made. In relation to main schemes, there is a surplus of US$86 million in HSBC Group Hong Kong Local Staff Retirement Benefit Scheme and a deficit of US$79 million in HSBC Bank USA Pension Plan. |
| | |
| | |
| | The net pension liability will have a consequent effect on reserves when FRS17 is fully implemented. |
206
Back to Contents
HSBC HOLDINGS PLC
The defined benefit section of the HSBC Bank (UK) Pension Scheme and the HSBC Group Hong Kong Local Staff Retirement Benefit Scheme are closed to new entrants. For these schemes the current service cost will increase as the members of the scheme approach retirement under the projected unit credit method.
| | | HSBC Bank (UK) Pension Scheme
| | Other Schemes
| |
| | | | Expected rate of return at 31 December 2001 | | | Value at 31 December 2001 | | | Expected rate of return at 31 December 2001 | | | Value at 31 December 2001 | |
| | |
|
| |
|
| |
|
| |
|
| |
| | | | % | | | US$m | | | % | | | US$m | |
| Equities | | | 7.5 | | | 6,385 | | | 9.7 | | | 1,652 | |
| Bonds | | | 5.1 | | | 1,329 | | | 6.0 | | | 1,212 | |
| Property | | | 7.5 | | | 1,066 | | | – | | | – | |
| Other | | | 4.0 | | | 865 | | | 3.4 | | | 221 | |
| | | | | |
| | | | |
| |
| Total market value of assets | | | | | | 9,645 | | | | | | 3,085 | |
| Present value of scheme liabilities | | | | | | (10,736 | ) | | | | | (3,739 | ) |
| | | | | |
| | | | |
| |
| Deficit in the schemes | | | | | | (1,091 | ) | | | | | (654 | )* |
| Related deferred tax asset | | | | | | 327 | | | | | | 166 | |
| Net pension liability | | | | | | (764 | ) | | | | | (488 | ) |
| | | | | |
| | | | |
| |
| Less: net amounts provided in the balance sheet for unfunded schemes | | | | | | | | | | | | 356 | |
| | | | | | | | | | | |
| |
| Net unprovided pension liability | | | | | | | | | | | | (132 | ) |
| | | | | | | | | | | |
| |
| | | | | | | | | | | | | |
| * | Of the deficit in other schemes, US$738 million relates to schemes in deficit and US$84 million relates to schemes in surplus. Of the schemes in deficit, US$565 million relates to unfunded pension schemes in respect of which a provision, net of deferred tax, of US$356 million has been made. In relation to main schemes, there is a surplus of US$17 million in HSBC Group Hong Kong Local Staff Retirement Benefit Scheme and a deficit of US$48 million in HSBC Bank USA Pension Plan. |
The following amounts would be reflected in the profit and loss account and statement of total consolidated recognised gains and losses on implementation of FRS 17:
| | | Year ended 31 December 2002 | |
| | |
| |
| | | | HSBC Bank (UK) Pension Schemes | | | Other Schemes | |
| | |
|
| |
|
| |
| | | | US$m | | | US$m | |
| Amount that would be charged to operating profit | | | | | | | |
| Current service cost | | | 280 | | | 184 | |
| Past service cost | | | – | | | – | |
| | |
|
| |
|
| |
| Total operating charge | | | 280 | | | 184 | |
| | |
|
| |
|
| |
| Amount that would be credited to other finance income | | | | | | | |
| Expected return on pension scheme assets | | | 673 | | | 236 | |
| Interest on pension scheme liabilities | | | (645 | ) | | (234 | ) |
| | |
|
| |
|
| |
| Net return | | | 28 | | | 2 | |
| | |
|
| |
|
| |
207
Back to Contents
HSBC HOLDINGS PLC
Notes on the Financial Statements (continued)
|
| | | Year ended 31 December 2002
| |
| | | | HSBC Bank (UK) Pension Scheme | | | Other Schemes | |
| | |
|
| |
|
| |
| | | | US$m | | | US$m | |
| Amount that would be recognised in the statement of total consolidated recognised gains and losses | | | | | | | |
| Actual return less expected return on pension scheme assets | | | (1,825 | ) | | (510 | ) |
| Experience gains and losses arising on the scheme liabilities | | | (18 | ) | | 95 | |
| Changes in assumptions underlying the present value of the scheme liabilities | | | 402 | | | 59 | |
| | |
|
| |
|
| |
| Actuarial loss | | | (1,441 | ) | | (356 | ) |
| | |
|
| |
|
| |
| Movement in pension scheme deficit during the year | | | | | | | |
| Deficit in the pension schemes at 1 January 2002 | | | (1,091 | ) | | (654 | ) |
| Movement in year: | | | | | | | |
| Current service cost | | | (280 | ) | | (184 | ) |
| Contributions | | | 191 | | | 445 | |
| Other finance income | | | 28 | | | 2 | |
| Actuarial loss | | | (1,441 | ) | | (356 | ) |
| Exchange and other movements | | | (233 | ) | | 28 | |
| | |
|
| |
|
| |
| Deficit in the pension schemes at 31 December 2002 | | | (2,826 | ) | | (719 | ) |
| | |
|
| |
|
| |
| History of experience gains and losses | | | | | | | |
| Difference between expected and actual return on scheme assets: | | | | | | | |
| amount | | | (1,825 | ) | | (510 | ) |
| percentage of scheme assets | | | (20% | ) | | (15% | ) |
| | | | | | |
| Experience gains and losses arising on scheme liabilities: | | | | | | | |
| amount | | | (18 | ) | | 95 | |
| percentage of the present value of scheme liabilities | | | (0.1% | ) | | 2% | |
| | | | | | |
| Total amount recognised in the statement of total consolidated gains and losses: | | | | | | | |
| amounts | | | (1,441 | ) | | (356 | ) |
| percentage of the present value of scheme liabilities | | | (12% | ) | | (9% | ) |
Most of the employees of HSBC Holdings are members of the HSBC Bank (UK) Pension Scheme. HSBC Holdings is unable to identify its share of the underlying assets and liabilities of this scheme attributable to its employees.
| (iii) | Post-retirement healthcare benefits |
| | |
| HSBC also provides post-retirement healthcare benefits under schemes, mainly in the United Kingdom and also in the United States, Canada, Mexico and Brazil. The charge relating to these schemes is US$54 million for the year (2001: US$39 million; 2000:US$42 million). The schemes are unfunded, except for the scheme in Mexico which had assets of US$13 million at 31 December 2002 comprising US$2 million in equities, US$6 million in bonds and US$5 million in cash. The latest full actuarial valuations of the liability were carried out at dates between 31 December 1999 and 31 December 2002 by independent qualified actuaries and have been updated to 31 December 2002 as necessary. This latest actuarial review (in accordance with FRS 17) estimated the present value of the accumulated post-retirement benefit obligation at US$491 million (2001: US$404 million; 2000: US$411 million), of which US$366 million (2001: US$269 million; 2000: US$253 million) has been provided and US$13million is held in assets in the funded scheme in Mexico. The actuarial assumptions used to estimate this obligation vary according to the claims experience and economic conditions of the countries in which the schemes are situated. For the UK schemes, the main financial assumptions used at 31 December 2002 were price inflation of 2.5% per annum (2001: 2.5%), health-care claims cost escalation of 7.5% per annum (2001: 7.5%) and a discount rate of 5.6% per annum (2001: 5.9%). Under FRS 17, the deferred tax asset related to the unprovided liability of US$112 million (2001: US$135 million) would be US$38 million (2001: US$47 million). |
208
Back to Contents
HSBC HOLDINGS PLC
The movement in the FRS 17 liability is as follows:
| | | US$m | |
| Deficit at 1 January 2002 | | (404 | ) |
| Current service cost | | (5 | ) |
| Contributions | | 15 | |
| Interest cost on liabilities | | (28 | ) |
| Experience gains and losses arising on liabilities | | (21 | ) |
| Change in assumptions underlying the present value of scheme liabilities | | 40 | |
| Acquisition of subsidiary undertaking | | (67 | ) |
| Exchange and other movements | | (8 | ) |
| |
|
| |
| Deficit at 31 December 2002 | | (478 | ) |
| |
|
| |
(c) Directors’ emoluments
| The aggregate emoluments of the Directors of HSBC Holdings, computed in accordance with Part I of Schedule 6 of the Act were: |
| | | 2002 | | | 2001 | | | 2000 | |
| | | US$000 | | | US$000 | | | US$000 | |
| Fees | | 1,338 | | | 1,412 | | | 1,362 | |
| Salaries and other emoluments | | 7,605 | | | 7,445 | | | 6,525 | |
| Discretionary bonuses | | 5,636 | | | 3,861 | | | 3,854 | |
| |
|
| |
|
| |
|
| |
| | | 14,579 | | | 12,718 | | | 11,741 | |
| |
|
| |
|
| |
|
| |
| Gains on the exercise of share options | | 514 | | | 1,990 | | | 4,187 | |
| |
|
| |
|
| |
|
| |
| Vesting of Restricted Share Plan awards | | – | | | 756 | | | 491 | |
| |
|
| |
|
| |
|
| |
| | | | | | | | | | |
| In addition, there were payments under retirement benefit agreements with former Directors of US$501,000 (2001: US$472,000; 2000: US$483,000). The provision as at 31 December 2002 in respect of unfunded pension obligations to former Directors amounted to US$6,942,000 (2001: US$6,281,000; 2000: US$6,535,000). |
| |
| During the year, aggregate contributions to pension schemes in respect of Directors were US$1,592,024 (2001: US$1,462,000; 2000: US$798,000). |
| |
| Discretionary bonuses for Directors are based on a combination of individual and corporate performance and are determined by the Remuneration Committee. The cost of the conditional awards under the Restricted Share Plan is recognised through an annual charge based on the likely level of vesting of shares, apportioned over the period of service to which the award relates. |
| |
| Details of Directors’ remuneration, share options and conditional awards under the Restricted Share Plan are included in the ‘Report of the Directors’ on pages 165 to 167 and ‘Directors’ Remuneration Report’ on pages 170 to 186. |
209
Back to Contents
HSBC HOLDINGS PLC
Notes on the Financial Statements (continued)
|
| (d) | Auditors’ remuneration |
| | |
| Auditors’ remuneration amounted to US$24.8 million (2001:US$24.3 million; 2000: US$25.8 million). In addition, US$13.8 million (2001: US$13.3 million; 2000: US$15.0 million) was paid by HSBC companies to the HSBC Holdings’ auditor and its associates for non-audit work analysed as follows: |
| | | | 2002 | | | 2001 | | | 2000 | |
| | | | US$m | | | US$m | | | US$m | |
| Independent attestation | | | | | | | | | | |
| – audit reports for US and other non-UK reporting | | | 0.3 | | | 0.2 | | | 0.1 | |
| – review of information for publication, including work in connection with securities issuance | | | 0.1 | | | 0.4 | | | 0.5 | |
| – reviews and reporting under regulatory requirements (including interim profits review) | | | 5.2 | | | 5.0 | | | 3.7 | |
| | |
|
| |
|
| |
|
| |
| Total independent attestation | | | 5.6 | | | 5.6 | | | 4.3 | |
| | | | | | | | | |
| Acquisition due diligence | | | 0.8 | | | 0.6 | | | 5.2 | |
| | |
|
| |
|
| |
|
| |
| Total audit-related services | | | 6.4 | | | 6.2 | | | 9.5 | |
| | |
|
| |
|
| |
|
| |
| Taxation services | | | 3.3 | | | 2.1 | | | 2.1 | |
| | | | | | | | | |
| Other Services | | | | | | | | | | |
| – group reorganisation | | | 0.5 | | | 0.6 | | | 0.5 | |
| – financial systems | | | 0.1 | | | 0.8 | | | 0.3 | |
| – consultancy services | | | 2.0 | | | 1.9 | | | 0.8 | |
| – other | | | 1.5 | | | 1.7 | | | 1.8 | |
| | |
|
| |
|
| |
|
| |
| Total other services | | | 4.1 | | | 5.0 | | | 3.4 | |
| | |
|
| |
|
| |
|
| |
| Total non-audit fees paid to KPMG | | | 13.8 | | | 13.3 | | | 15.0 | |
| | |
|
| |
|
| |
|
| |
| | | | | | | | | | | |
| Of fees paid to auditors for non-audit work, US$0.4 million were capitalised (2001: US$0.4 million; 2000: US$4.8 million). |
| 6 | Loss from foreign currency redenomination in Argentina |
| The losses in 2002 reflect the further impact of the pesification at the start of the year including revisions to government decrees, renegotiation of banking contracts and payments to certain customers who had obtained court orders requiring HSBC to repay their deposits historically denominated in US dollars at current market rates rather than the pesification rate specified by the Argentine Government. The loss of US$520 million in 2001 arose on the redenomination by the Argentine Government of certain in-country US dollar assets and liabilities into pesos at various mandatory but different rates of exchange. |
210
Back to Contents
HSBC HOLDINGS PLC
| 7 | Profit on ordinary activities before tax |
|
| Profit on ordinary activities before tax is stated after: |
| | | | 2002 | | | 2001 | | | 2000 | |
| | | | US$m | | | US$m | | | US$m | |
| (a) Income | | | | | | | | | | |
| Aggregate rentals receivable, including capital repayments, under | | | | | | | | | | |
| – finance leases and hire purchase contracts | | | 2,502 | | | 3,458 | | | 2,956 | |
| – operating leases | | | 490 | | | 465 | | | 481 | |
| Income from listed investments | | | 4,361 | | | 4,761 | | | 4,534 | |
| Profits less losses on debt securities and equities dealing | | | 19 | | | 348 | | | 456 | |
| Gains on disposal of investment securities | | | 405 | | | 475 | | | 324 | |
| | | | | | | | | |
| (b) Charges | | | | | | | | | | |
| Charges incurred with respect to subordinated liabilities | | | 862 | | | 1,074 | | | 1,216 | |
| Finance charges in respect of finance leases and similar hire purchase contracts | | | 36 | | | 27 | | | 26 | |
| Hire of plant and machinery | | | 81 | | | 90 | | | 92 | |
| Rentals payable on premises held under operating leases | | | 548 | | | 516 | | | 467 | |
| | | | | | | | | | | |
| Gains on the disposal of investments and tangible fixed assets attracted a tax charge of US$86million (2001: US$114million; 2000: US$82 million). Of the after-tax amount, US$23 million (2001: US$18 million; 2000: US$11 million) is attributable to minority interests. |
| 8 | Tax on profit on ordinary activities |
|
| The charge for taxation comprises: |
| | | | 2002 | | | 2001 | * | | 2000 | * |
| | | | US$m | | | US$m | | | US$m | |
| United Kingdom corporation tax charge – current year | | | 899 | | | 1,217 | | | 1,865 | |
| United Kingdom corporation tax charge – adjustment in respect of prior years | | | (68 | ) | | (261 | ) | | (39 | ) |
| Relief for overseas taxation | | | (147 | ) | | (540 | ) | | (970 | ) |
| | |
|
| |
|
| |
|
| |
| | | | 684 | | | 416 | | | 856 | |
| Overseas taxation – current year | | | 1,246 | | | 1,638 | | | 1,477 | |
| Overseas taxation – adjustment in respect of prior years | | | (29 | ) | | (68 | ) | | (9 | ) |
| Joint ventures | | | (6 | ) | | (13 | ) | | (7 | ) |
| Associates | | | 17 | | | 26 | | | (1 | ) |
| | |
|
| |
|
| |
|
| |
| Current taxation | | | 1,912 | | | 1,999 | | | 2,316 | |
| | |
|
| |
|
| |
|
| |
| Origination and reversal of timing differences | | | 615 | | | (176 | ) | | 89 | |
| Effect of decreased tax rate on opening asset | | | — | | | 3 | | | 4 | |
| Adjustment in respect of previous periods | | | 7 | | | 162 | | | — | |
| | |
|
| |
|
| |
|
| |
| Deferred taxation | | | 622 | | | (11 | ) | | 93 | |
| | |
|
| |
|
| |
|
| |
| Total charge for taxation | | | 2,534 | | | 1,988 | | | 2,409 | |
| | |
|
| |
|
| |
|
| |
| | | | | | | | | | | |
| * | The figures for 2001 and 2000 have been restated to reflect the adoption of UK Financial Reporting Standard 19 “Deferred Tax” details of which are set out in Note 1 on the Financial Statements on pages 195 to 197 . |
211
Back to Contents
HSBC HOLDINGS PLC
Notes on the Financial Statements (continued)
|
| | | | | | | | | | | |
| | | | | | | | | | | |
| | | | | | | | | | | |
| | | | 2002 | | | 2001 | * | | 2000 | * |
| | | | US$m | | | US$m | | | US$m | |
| Group tax charge | | | 2,523 | | | 1,975 | | | 2,417 | |
| Joint ventures tax charge | | | (6 | ) | | (13 | ) | | (7 | ) |
| Associates tax charge | | | 17 | | | 26 | | | (1 | ) |
| | |
|
| |
|
| |
|
| |
| Total charge for taxation | | | 2,534 | | | 1,988 | | | 2,409 | |
| | |
|
| |
|
| |
|
| |
| * | The figures for 2001 and 2000 have been restated to reflect the adoption of UK Financial Reporting Standard 19 “Deferred Tax” details of which are set out in Note 1 on the Financial Statements on pages 195 to 197. |
| | |
| HSBC Holdings and its subsidiary undertakings in the United Kingdom provide for UK corporation tax at 30% (2001: 30%; 2000: 30%). Overseas tax includes Hong Kong profits tax of US$408 million (2001: US$450 million; 2000: US$478 million). Subsidiary undertakings in Hong Kong provide for Hong Kong profits tax at the rate of 16% (2001: 16%; 2000: 16%) on the profits for the year assessable in Hong Kong. Other overseas subsidiary undertakings and overseas branches provide for taxation at the appropriate rates in the countries in which they operate. |
| |
| Analysis of overall tax charge: |
| | | | 2002 | | | 2001 | * | | 2000 | * |
| | | | US$m | | | US$m | | | US$m | |
Taxation at UK corporate tax rate of 30% (2001: 30%;
2000: 30%) | | | 2,895 | | | 2,400 | | | 2,932 | |
| Impact of differently taxed overseas profits in principal locations | | | (472 | ) | | (616 | ) | | (498 | ) |
| Tax free gains | | | (19 | ) | | (102 | ) | | (15 | ) |
| Argentine losses unrelieved | | | 87 | | | 336 | | | – | |
| Goodwill amortisation | | | 261 | | | 263 | | | 172 | |
| Prior period adjustments | | | (90 | ) | | (167 | ) | | (48 | ) |
| Other items | | | (128 | ) | | (126 | ) | | (134 | ) |
| | |
|
| |
|
| |
|
| |
| Overall tax charge | | | 2,534 | | | 1,988 | | | 2,409 | |
| | |
|
| |
|
| |
|
| |
| Timing differences subject to deferred tax: | | | | | | | | | | |
| | | | | | | | | | | |
| Accelerated capital allowances | | | 23 | | | (84 | ) | | 22 | |
| Timing differences on lease income | | | (90 | ) | | (97 | ) | | (48 | ) |
| Provision for bad and doubtful debts | | | (29 | ) | | 46 | | | (60 | ) |
| Relief for losses brought forward | | | (125 | ) | | 85 | | | 18 | |
| Provision for Princeton Note settlement | | | (221 | ) | | 221 | | | – | |
| Other short term timing differences | | | (180 | ) | | (160 | ) | | (25 | ) |
| | |
|
| |
|
| |
|
| |
| Deferred tax (charge)/credit | | | (622 | ) | | 11 | | | (93 | ) |
| | |
|
| |
|
| |
|
| |
| Current tax charge | | | 1,912 | | | 1,999 | | | 2,316 | |
| | |
|
| |
|
| |
|
| |
| * | The figures for 2001 and 2000 have been restated to reflect the adoption of UK Financial Reporting Standard 19 “Deferred Tax” details of which are set out in Note 1 on the Financial Statements on pages 195 to 197. |
212
Back to Contents
HSBC HOLDINGS PLC
| | | | 2002 | | | 2001 | * | | 2000 | * |
| | | | US$m | | | US$m | | | US$m | |
| | | | | | | | | | | |
| Profit on ordinary activities before tax | | | 5,185 | | | 3,211 | | | 4,224 | |
| Tax credit on profit on ordinary activities | | | 82 | | | 71 | | | 36 | |
| | |
|
| |
|
| |
|
| |
Profit for the financial year attributable to shareholders | | | 5,267 | | | 3,282 | | | 4,260 | |
| | |
|
| |
|
| |
|
| |
| Profit on ordinary activities before tax includes dividend income from subsidiary undertakings for the years ended 31 December as follows: |
| | | | 2002 | | | 2001 | | | 2000 | |
| | | | US$m | | | US$m | | | US$m | |
| | | | | | | | | | | |
| Bank | | | 1,715 | | | 2,156 | | | 1,727 | |
| | |
|
| |
|
| |
|
| |
| Non-bank | | | 3,745 | | | 1,251 | | | 2,598 | |
| | |
|
| |
|
| |
|
| |
| * | The figures for 2001 and 2000 have been restated to reflect the adoption of UK Financial Reporting Standard 19 “Deferred Tax” details of which are set out in Note 1 on the Financial Statements on pages 195 to 197. |
| | | 2002 | | 2001 | | 2000 | |
| | |
| |
| |
| |
| | | | US$ per
share | | | US$m | | | US$ per
share | | | US$m | | | US$ per
share | | | US$m | |
| | | | | | | | | | | | | | | | | | |
| First interim | | | 0.205 | | | 1,932 | | | 0.190 | | | 1,767 | | | 0.150 | | | 1,383 | |
| Second interim | | | 0.325 | | | 3,069 | | | 0.290 | | | 2,700 | | | 0.285 | | | 2,627 | |
| | |
|
| |
|
| |
|
| |
|
| |
|
| |
|
| |
| | | | 0.530 | | | 5,001 | | | 0.480 | | | 4,467 | | | 0.435 | | | 4,010 | |
| | |
|
| |
|
| |
|
| |
|
| |
|
| |
|
| |
| Of the first interim dividend for 2002, US$166 million (2001: US$129 million; 2000: US$476 million) was settled by the issue of shares. Of the second interim dividend for 2001, US$857 million (2000: US$737 million; 1999: US$468 million) was settled by the issue of shares in 2002. |
| | |
| 11 | Earnings per ordinary share |
|
Basic earnings per ordinary share was calculated by dividing the earnings of US$6,239 million (2001: US$4,992 million; 2000: US$6,457 million) by the weighted average number of ordinary shares, excluding own shares held, outstanding in 2002 of 9,339 million (2001: 9,237 million; 2000: 8,777 million). Diluted earnings per share was calculated by dividing the basic earnings, which require no adjustment for the effects of dilutive potential ordinary shares, by the weighted average number of ordinary shares outstanding, excluding own shares held, plus the weighted average number of ordinary shares that would be issued on ordinary conversion of dilutive potential ordinary shares (being share options outstanding not yet exercised) in 2002 of 9,436 million (2001: 9,336 million; 2000: 8,865 million). The effect of dilutive share options on the weighted average number of ordinary shares in issue is as follows: |
| | | Number of shares (millions)
| |
| | | | 2002 | | | 2001 | | | 2000 | |
| | | | | | | | | |
| Average number of shares in issue | | | 9,339 | | | 9,237 | | | 8,777 | |
| Savings-related Share Option Plan | | | 30 | | | 46 | | | 57 | |
| Executive Share Option Scheme | | | 11 | | | 4 | | | 5 | |
| Restricted Share Plan | | | 38 | | | 27 | | | 17 | |
| CCF share options | | | 18 | | | 22 | | | 9 | |
| | |
|
| |
|
| |
|
| |
| Average number of shares in issue assuming dilution | | | 9,436 | | | 9,336 | | | 8,865 | |
| | |
|
| |
|
| |
|
| |
| Of the total number of employee share options existing at 31 December 2002, none were antidilutive (2001 and 2000: nil). |
213
Back to Contents
HSBC HOLDINGS PLC
Notes on the Financial Statements (continued)
|
| | |
| | |
| | |
| 12 | Treasury bills and other eligible bills |
|
| | | | 2002 | | | 2001 | | | 2000 | |
| | | | US$m | | | US$m | | | US$m | |
| Treasury bills and similar securities | | | 16,759 | | | 17,180 | | | 19,373 | |
| Other eligible bills | | | 1,382 | | | 791 | | | 3,758 | |
| | |
|
| |
|
| |
|
| |
| | | | 18,141 | | | 17,971 | | | 23,131 | |
| | |
|
| |
|
| |
|
| |
Of the total treasury and other eligible bills, US$12,902 million (2001: US$12,902 million; 2000: US$15,862million) are non-trading book items; these are mainly short-term in maturity and are analysed below. Investment securities: |
| | | | Cost and
book value | |
| | |
|
| |
| | | | US$m | |
| At 1 January 2002 | | | 12,902 | |
| Additions | | | 42,581 | |
| Acquisition of subsidiaries | | | 50 | |
| Disposals and amounts repaid | | | (43,434 | ) |
| Amortisation of discounts and premiums | | | 315 | |
| Exchange and other movements | | | 488 | |
| | |
|
| |
At 31 December 2002 | | | 12,902 | |
| | |
|
| |
The book value of non-trading treasury bills and other eligible bills, analysed by type of borrower, is as follows: |
| | | | 2002 | | | 2001 | | | 2000 | |
| | | | US$m | | | US$m | | | US$m | |
| | | | | | | | | |
| US Treasury and Government agencies | | | 2,888 | | | 2,303 | | | 2,165 | |
| UK Government | | | 740 | | | 3,013 | | | 2,716 | |
| Hong Kong SAR Government | | | 2,898 | | | 2,181 | | | 2,007 | |
| Other governments | | | 5,344 | | | 4,907 | | | 7,416 | |
| Corporate debt and other securities | | | 1,032 | | | 498 | | | 1,558 | |
| | |
|
| |
|
| |
|
| |
| | | | 12,902 | | | 12,902 | | | 15,862 | |
| | |
|
| |
|
| |
|
| |
| |
| The following tables provide an analysis of gross unrealised gains and losses for available-for-sale treasury bills and other eligible bills: |
| | | | | | | | | | | | | | |
| | | | Carrying value | | | Gross unrealised gains | | | Gross unrealised losses | | | Market valuation | |
| | |
|
| |
|
| |
|
| |
|
| |
| | | | US$m | | | US$m | | | US$m | | | US$m | |
31 December 2002 | | | | | | | | | | | | | |
| US Treasury and Government agencies | | | 2,888 | | | 3 | | | – | | | 2,891 | |
| UK Government | | | 740 | | | – | | | – | | | 740 | |
| Hong Kong SAR Government | | | 2,898 | | | 2 | | | – | | | 2,900 | |
| Other governments | | | 5,344 | | | 8 | | | (1 | ) | | 5,351 | |
| Corporate debt and other securities | | | 1,032 | | | – | | | – | | | 1,032 | |
| | |
|
| |
|
| |
|
| |
|
| |
| | | | 12,902 | | | 13 | | | (1 | ) | | 12,914 | |
| | |
|
| |
|
| |
|
| |
|
| |
214
Back to Contents
HSBC HOLDINGS PLC
| | | | Carrying value | | | Gross unrealised gains | | | Gross unrealised losses | | | Market valuation | |
| | |
|
| |
|
| |
|
| |
|
| |
| | | | US$m | | | US$m | | | US$m | | | US$m | |
| 31 December 2001 | | | | | | | | | | | | | |
| US Treasury and Government agencies | | | 2,303 | | | 1 | | | – | | | 2,304 | |
| UK Government | | | 3,013 | | | 6 | | | – | | | 3,019 | |
| Hong Kong SAR Government | | | 2,181 | | | 2 | | | – | | | 2,183 | |
| Other governments | | | 4,907 | | | 7 | | | (3 | ) | | 4,911 | |
| Corporate debt and other securities | | | 498 | | | – | | | – | | | 498 | |
| | |
|
| |
|
| |
|
| |
|
| |
| | | | 12,902 | | | 16 | | | (3 | ) | | 12,915 | |
| | |
|
| |
|
| |
|
| |
|
| |
| | | | | | | | | | | | | | |
| | | | Carrying value | | | Gross unrealised gains | | | Gross unrealised losses | | | Market valuation | |
| | |
|
| |
|
| |
|
| |
|
| |
| | | | US$m | | | US$m | | | US$m | | | US$m | |
| 31 December 2000 | | | | | | | | | | | | | |
| US Treasury and Government agencies | | | 2,165 | | | 1 | | | – | | | 2,166 | |
| UK Government | | | 2,716 | | | – | | | (15 | ) | | 2,701 | |
| Hong Kong SAR Government | | | 2,007 | | | – | | | – | | | 2,007 | |
| Other governments | | | 7,416 | | | 13 | | | (6 | ) | | 7,423 | |
| Corporate debt and other securities | | | 1,558 | | | – | | | (24 | ) | | 1,534 | |
| | |
|
| |
|
| |
|
| |
|
| |
| | | | 15,862 | | | 14 | | | (45 | ) | | 15,831 | |
| | |
|
| |
|
| |
|
| |
|
| |
| The amounts shown under “other governments” in the above table include securities with a book value of US$1,122 million (2001: US$1,793 million) and a market value of US$1,122 million (2001: US$1,792 million) issued by the government of Japan. | |
| | |
| The maturities of available-for-sale treasury bills and other eligible bills at 31 December 2002 are analysed as follows: | |
| | | | | | | | |
| | | | Carrying value | | | Market valuation | |
| | |
|
| |
|
| |
| | | | US$m | | | US$m | |
| 1 year or less | | | 12,344 | | | 12,294 | |
| 5 years or less but over 1 year | | | 510 | | | 569 | |
| 10 years or less but over 5 years | | | 48 | | | 51 | |
| | |
|
| |
|
| |
| | | | 12,902 | | | 12,914 | |
| | |
|
| |
|
| |
| The following table provides an analysis of contractual maturities and weighted average yields of available-for-sale treasury bills and other eligible bills as at 31 December 2002. |
| | | | | | | | |
| | | Within one year | | After one but within
five years | | After five but within
ten years | |
| | |
| |
| |
| |
| | | | Amount | | | Yield | | | Amount | | | Yield | | | Amount | | | Yield | |
| | |
|
| |
|
| |
|
| |
|
| |
|
| |
|
| |
| | | | US$m | | | % | | | US$m | | | % | | | US$m | | | % | |
| US Treasury and Government agencies | | | 2,866 | | | 1.3 | | | 11 | | | 6.1 | | | 11 | | | 6.2 | |
| UK Government | | | 529 | | | 4.0 | | | 211 | | | 5.2 | | | – | | | – | |
| Hong Kong SAR Government | | | 2,898 | | | 1.6 | | | – | | | – | | | – | | | – | |
| Other governments | | | 5,023 | | | 2.9 | | | 284 | | | 7.4 | | | 37 | | | 5.4 | |
| Corporate debt and other securities | | | 1,028 | | | 3.5 | | | 4 | | | – | | | – | | | – | |
| | |
| | | | |
| | | | |
| | | | |
| | | | 12,344 | | | | | | 510 | | | | | | 48 | | | | |
| | |
| | | | |
| | | | |
| | | | |
| | | | | | | | | | | | | | | | | | | | |
215
Back to Contents
HSBC HOLDINGS PLC
Notes on the Financial Statements (continued)
|
| | |
| | |
| | |
| 13 | Hong Kong SAR currency notes in circulation |
|
| The Hong Kong Special Administrative Region currency notes in circulation are secured by the deposit of funds in respect of which the Government of the Hong Kong Special Administrative Region certificates of indebtedness are held. |
| |
| HSBC’s credit risk management process is discussed in the ‘Financial Review’ section in the paragraph headed ‘Credit risk management’ on pages 114 to 116. |
| |
| 15 | Loans and advances to banks |
|
| | | | 2002 | | | 2001 | |
| | | | US$m | | | US$m | |
| Remaining maturity: | | | | | | | |
| – repayable on demand | | | 19,211 | | | 16,039 | |
| – 3 months or less but not repayable on demand | | | 63,526 | | | 72,785 | |
| – 1 year or less but over 3 months | | | 9,536 | | | 13,530 | |
| – 5 years or less but over 1 year | | | 1,211 | | | 1,849 | |
| – over 5 years | | | 2,035 | | | 460 | |
| Specific bad and doubtful debt provisions (Note 17) | | | (23 | ) | | (22 | ) |
| | |
|
| |
|
| |
| | | | 95,496 | | | 104,641 | |
| | |
|
| |
|
| |
| Amounts include: | | | | | | | |
| Due from joint ventures | | | | | | | |
| – unsubordinated | | | – | | | 8 | |
| | |
|
| |
|
| |
| Due from associates | | | | | | | |
| – unsubordinated | | | 53 | | | 147 | |
| | |
|
| |
|
| |
| 16 | Loans and advances to customers |
|
| | | | 2002 | | | 2001 | |
| | | | US$m | | | US$m | |
| Remaining maturity: | | | | | | | |
| – repayable on demand or at short notice | | | 48,463 | | | 51,980 | |
| – 3 months or less but not repayable on demand or at short notice | | | 74,193 | | | 61,851 | |
| – 1 year or less but over 3 months | | | 41,444 | | | 37,886 | |
| – 5 years or less but over 1 year | | | 97,068 | | | 82,811 | |
| – over 5 years | | | 100,293 | | | 82,282 | |
| General and specific bad and doubtful debt provisions (Note 17) | | | (9,117 | ) | | (8,161 | ) |
| | |
|
| |
|
| |
| | | | 352,344 | | | 308,649 | |
| | |
|
| |
|
| |
| Amounts include: | | | | | | | |
| Subordinated advances | | | 187 | | | 149 | |
| | |
|
| |
|
| |
Securitised advances not qualifying for linked presentation under FRS 5
(‘Reporting the Substance of Transactions’) | | | 655 | | | 678 | |
| | |
|
| |
|
| |
| Due from joint ventures | | | | | | | |
| – unsubordinated | | | 61 | | | 879 | |
| | |
|
| |
|
| |
| Due from associates | | | | | | | |
| – subordinated | | | 29 | | | 10 | |
| | |
|
| |
|
| |
| – unsubordinated | | | 460 | | | 215 | |
| | |
|
| |
|
| |
216
Back to Contents
HSBC HOLDINGS PLC
Securitisation transactions |
Loans and advances to customers include balances that have been securitised. Certain of these balances meet the requirements for linked presentation under FRS 5 ‘Reporting the substance of transactions’.
The non-recourse finance has been netted against customer loans as follows:
| | 2002 | | 2001 | |
| | US$m | | US$m | |
| Customer loans | 2,294 | | 1,865 | |
| Non-recourse finance | (2,049 | ) | (1,659 | ) |
| |
| |
| |
| Funding provided by HSBC | 245 | | 206 | |
| |
| |
| |
HSBC has securitised a designated portion of its corporate loan portfolio. The transaction was effected through a declaration of trust in favour of Clover Securitisation Limited. Clover Securitisation Limited holds its beneficial interest in the trust for Clover Funding No. 1 plc, Clover Funding No. 2 plc, Clover Funding No. 3 plc, Clover Funding No. 4 plc (collectively ‘Clover Funding’) and HSBC.
To fund the acquisition of this beneficial interest, Clover Funding has issued US$2,294 million (2001: US$1,865 million) floating rate notes (FRN). The offering circulars for the FRNs stated that they are the obligations of Clover Funding only and are not guaranteed by, or the responsibility of, any other party. Non-returnable proceeds of US$2,049 million (2001: US$ 1,659 million) received by HSBC from Clover Funding have been deducted from ‘Loans and advances to customers’. Clover Securitisation Limited has entered into swap agreements with HSBC under which Clover Securitisation Limited pays the floating rate of interest on the loans and receives interest linked to 3 month LIBOR. The proceeds generated from the loans are used in priority to meet the claims of the FRN holders, and amounts payable in respect of the interest rate swap arrangements, after the payment of trustee and administration expenses.
There is no provision whatsoever, either in the financing arrangements or otherwise, whereby HSBC has a right or obligation either to keep the loans and advances on repayment of the finance or to repurchase them at any time other than in certain circumstances where HSBC is in breach of warranty.
HSBC is not obliged to support any losses that may be suffered by the FRN holders and does not intend to provide such support.
HSBC has taken up US$66 million (2001: US$51 million) of subordinated FRNs that are repayable after payments in respect of senior FRNs. HSBC has made subordinated loans of US$42 million (2001: US$33 million) to Clover Funding that are repayable after all other payments. Interest is payable on the subordinated FRNs and subordinated loans conditional upon Clover Funding having funds available.
Clover Securitisation Limited’s entire share capital is held by Clover Holdings Limited. Clover Funding’s entire share capital is held by Clover Holdings Limited. Clover Holdings Limited’s entire share capital is held by trustees under the terms of a trust for charitable purposes.
HSBC recognised net income of US$4 million (2001: US$3 million) which comprised US$96 million (2001: US$45 million) interest receivable by Clover Funding less US$92 million (2001: US$42 million) of interest on FRN’s and other third party expenses payable by Clover Funding.
217
Back to Contents
HSBC HOLDINGS PLC
Notes on the Financial Statements (continued) |
|
|
| 17 | Provisions for bad and doubtful debts |
|
| | | Provisions against advances | | | | |
| | |
| | | | |
| | | | Specific | | | General | | | Total | | | Suspended
interest | |
| | |
|
| |
|
| |
|
| |
|
| |
| | | | US$m | | | US$m | | | US$m | | | US$m | |
| At 1 January 2002 | | | 5,522 | | | 2,661 | | | 8,183 | | | 861 | |
| Amounts written off | | | (2,111 | ) | | – | | | (2,111 | ) | | (327 | ) |
| Recoveries of advances written off in previous years | | | 180 | | | – | | | 180 | | | – | |
| Charge/(credit) to profit and loss account | | | 1,672 | | | (351 | ) | | 1,321 | | | – | |
| Interest suspended during the year | | | – | | | – | | | – | | | 426 | |
| Suspended interest recovered | | | – | | | – | | | – | | | (214 | ) |
| Acquisition of subsidiaries | | | 1,278 | | | 426 | | | 1,704 | | | – | |
| Exchange and other movements | | | 88 | | | (225 | ) | | (137 | ) | | (180 | ) |
| | |
|
| |
|
| |
|
| |
|
| |
At 31 December 2002 | | | 6,629 | | | 2,511 | | | 9,140 | | | 566 | |
| | |
|
| |
|
| |
|
| |
|
| |
| Included in: | | | | | | | | | | | | | |
| Loans and advances to banks (Note 15) | | | | | | | | | 23 | | | | |
| Loans and advances to customers (Note 16) | | | | | | | | | 9,117 | | | | |
| | | | | | | | |
| | | | |
| | | | | | | | | | 9,140 | | | | |
| | | | | | | | |
| | | | |
| | | Provisions against advances | | | | |
| | |
| | | | |
| | | | Specific | | | General | | | Total | | | Suspended
interest | |
| | |
|
| |
|
| |
|
| |
|
| |
| | | | US$m | | | US$m | | | US$m | | | US$m | |
| At 1 January 200 | | | 6,095 | | | 2,102 | | | 8,197 | | | 1,016 | |
| Amounts written off | | | (2,178 | ) | | – | | | (2,178 | ) | | (437 | ) |
| Recoveries of advances written off in previous years | | | 285 | | | – | | | 285 | | | – | |
| Charge to profit and loss account | | | 1,464 | | | 573 | * | | 2,037 | | | – | |
| Interest suspended during the year | | | – | | | – | | | – | | | 542 | |
| Suspended interest recovered | | | – | | | – | | | – | | | (228 | ) |
| Acquisition of subsidiaries | | | – | | | 7 | | | 7 | | | – | |
| Exchange and other movements | | | (144 | ) | | (21 | ) | | (165 | ) | | (32 | ) |
| | |
|
| |
|
| |
|
| |
|
| |
| At 31 December 2001 | | | 5,522 | | | 2,661 | | | 8,183 | | | 861 | |
| | |
|
| |
|
| |
|
| |
|
| |
| Included in: | | | | | | | | | | | | | |
| Loans and advances to banks (Note 15) | | | | | | | | | 22 | | | | |
| Loans and advances to customers (Note 16) | | | | | | | | | 8,161 | | | | |
| | | | | | | | |
| | | | |
| | | | | | | | | | 8,183 | | | | |
| | | | | | | | |
| | | | |
| * | includes an additional general provision of US$600 million for Argentinian exposures. |
218
Back to Contents
HSBC HOLDINGS PLC
| | | Provisions against advances | | | | |
| | |
| | | | |
| | | | Specific | | | General | | | Total | | | Suspended
interest | |
| | |
|
| |
|
| |
|
| |
|
| |
| | | | US$m | | | US$m | | | US$m | | | US$m | |
| At 1 January 2000 | | | 5,716 | | | 2,304 | | | 8,020 | | | 1,073 | |
| Amounts written off | | | (1,811 | ) | | – | | | (1,811 | ) | | (370 | ) |
| Recoveries of advances written off in previous years | | | 160 | | | – | | | 160 | | | – | |
| Charge/(credit) to profit and loss account | | | 1,212 | | | (280 | ) | | 932 | | | – | |
| Interest suspended during the year | | | – | | | – | | | – | | | 689 | |
| Suspended interest recovered | | | – | | | – | | | – | | | (291 | ) |
| Acquisition of subsidiaries | | | 941 | | | 146 | | | 1,087 | | | 2 | |
| Exchange and other movements | | | (123 | ) | | (68 | ) | | (191 | ) | | (87 | ) |
| | |
|
| |
|
| |
|
| |
|
| |
| At 31 December 2000 | | | 6,095 | | | 2,102 | | | 8,197 | | | 1,016 | |
| | |
|
| |
|
| |
|
| |
|
| |
| Included in: | | | | | | | | | | | | | |
| Loans and advances to banks | | | | | | | | | 30 | | | | |
| Loans and advances to customers | | | | | | | | | 8,167 | | | | |
| | | | | | | | |
| | | | |
| | | | | | | | | | 8,197 | | | | |
| | | | | | | | |
| | | | |
| |
| The total of customer advances, net of suspended interest, on which interest is being placed in suspense, is as follows: |
| | | | 2002 | | | 2001 | | | 2000 | |
| | | | US$m | | | US$m | | | US$m | |
| Gross | | | 5,485 | | | 6,022 | | | 6,464 | |
| | |
|
| |
|
| |
|
| |
| Net of specific provisions | | | 2,780 | | | 2,936 | | | 2,964 | |
| | |
|
| |
|
| |
|
| |
219
Back to Contents
HSBC HOLDINGS PLC
Notes on the Financial Statements (continued) |
|
|
| 18 | Concentrations of exposure |
|
HSBC has the following concentrations of gross loans and advances to customers: |
| | | | | | | | | | | | | | |
| | | Europe | | Hong
Kong | | Rest of
Asia-Pacific | † | North America | | South
America¶ | | Total | |
| | |
| |
| |
| |
| |
| |
| |
| | | US$m | | US$m | | US$m | | US$m | | US$m | | US$m | |
|
Total gross advances to customers: | | | | | | | | | | | | | |
| Residential mortgages | | 38,719 | | 23,839 | | 7,507 | | 26,666 | | 253 | | 96,984 | |
| Hong Kong SAR Government Home Ownership Scheme | | – | | 7,255 | | – | | – | | – | | 7,255 | |
| Other personal | | 26,748 | | 7,066 | | 5,900 | | 7,836 | | 1,012 | | 48,562 | |
| | |
| |
| |
| |
| |
| |
| |
| Total personal | | 65,467 | | 38,160 | | 13,407 | | 34,502 | | 1,265 | | 152,801 | |
| | |
| |
| |
| |
| |
| |
| |
| Commercial, industrial and international trade | | 44,424 | | 10,173 | | 12,582 | | 10,773 | | 1,063 | | 79,015 | |
| Commercial real estate | | 11,887 | | 8,336 | | 2,701 | | 6,297 | | 46 | | 29,267 | |
| Other property related | | 3,970 | | 4,805 | | 2,031 | | 4,515 | | 26 | | 15,347 | |
| Government | | 2,164 | | 719 | | 933 | | 4,575 | | 562 | | 8,953 | |
| Other commercial* | | 22,712 | | 6,612 | | 5,950 | | 4,835 | | 565 | | 40,674 | |
| | |
| |
| |
| |
| |
| |
| |
| Total corporate and commercial | | 85,157 | | 30,645 | | 24,197 | | 30,995 | | 2,262 | | 173,256 | |
| | |
| |
| |
| |
| |
| |
| |
| Non-bank financial institutions | | 15,221 | | 2,055 | | 931 | | 9,231 | | 49 | | 27,487 | |
| Settlement accounts | | 2,622 | | 347 | | 192 | | 5,224 | | – | | 8,385 | |
| | |
| |
| |
| |
| |
| |
| |
| Total financial | | 17,843 | | 2,402 | | 1,123 | | 14,455 | | 49 | | 35,872 | |
| | |
| |
| |
| |
| |
| |
| |
| | | | | | | | | | | | |
At 31 December 2002 | | 168,467 | | 71,207 | | 38,727 | | 79,952 | | 3,576 | | 361,929 | |
| | |
| |
| |
| |
| |
| |
| |
| | | | | | | | | | | | |
| Residential mortgages | | 27,282 | | 23,125 | | 5,134 | | 22,126 | | 548 | | 78,215 | |
| Hong Kong SAR Government Home Ownership Scheme | | – | | 8,123 | | – | | – | | – | | 8,123 | |
| Other personal | | 21,065 | | 6,227 | | 4,616 | | 6,273 | | 1,280 | | 39,461 | |
| | |
| |
| |
| |
| |
| |
| |
| Total personal | | 48,347 | | 37,475 | | 9,750 | | 28,399 | | 1,828 | | 125,799 | |
| | |
| |
| |
| |
| |
| |
| |
| Commercial, industrial and international trade | | 38,476 | | 9,662 | | 11,226 | | 9,018 | | 1,720 | | 70,102 | |
| Commercial real estate | | 9,475 | | 8,474 | | 2,395 | | 5,877 | | 77 | | 26,298 | |
| Other property related | | 3,630 | | 4,710 | | 2,169 | | 4,011 | | 69 | | 14,589 | |
| Government | | 2,393 | | 543 | | 900 | | 728 | | 775 | | 5,339 | |
| Other commercial* | | 20,510 | | 6,349 | | 5,457 | | 4,230 | | 617 | | 37,163 | |
| | |
| |
| |
| |
| |
| |
| |
| Total corporate and commercial | | 74,484 | | 29,738 | | 22,147 | | 23,864 | | 3,258 | | 153,491 | |
| | |
| |
| |
| |
| |
| |
| |
| Non-bank financial institutions | | 11,329 | | 1,546 | | 752 | | 12,572 | | 118 | | 26,317 | |
| Settlement accounts | | 2,361 | | 223 | | 189 | | 8,984 | | 4 | | 11,761 | |
| | |
| |
| |
| |
| |
| |
| |
| Total financial | | 13,690 | | 1,769 | | 941 | | 21,556 | | 122 | | 38,078 | |
| | |
| |
| |
| |
| |
| |
| |
| | | | | | | | | | | | |
| At 31 December 2001 | | 136,521 | | 68,982 | | 32,838 | | 73,819 | | 5,208 | | 317,368 | |
| | |
| |
| |
| |
| |
| |
| |
| * | Other commercial includes advances in respect of agriculture, transport, energy and utilities. |
| † | The figures for 2001 have been restated to reflect a reclassification of loans to personal investment vehicles to ‘Other personal’ category, from ‘Corporate and commercial’ and ‘Non-bank financial institutions’ as this provides a more accurate description of the borrower. |
| ¶ | Formerly described as Latin America, which included Group entities in Panama and Mexico, which are now included in North America. Figures for 2001 have been restated to reflect this change. |
| | |
| The geographical information shown above has been classified by the location of the principal operations of the subsidiary undertaking, or in the case of The Hongkong and Shanghai Banking Corporation Limited, HSBC Bank plc, HSBC Bank Middle East and HSBC Bank USA, by location of the branch responsible for advancing the funds. |
220
Back to Contents
HSBC HOLDINGS PLC
| | | 2002
| | 2001
| | 2000
| |
| | | | Book value | | | Market valuation | | | Book value | | | Market valuation | | | Book value | | | Market valuation | |
| | |
|
| |
|
| |
|
| |
|
| |
|
| |
|
| |
| | | | US$m | | | US$m | | | US$m | | | US$m | | | US$m | | | US$m | |
Issued by public bodies | | | | | | | | | | | | | | | | | | | |
| Investment securities: | | | | | | | | | | | | | | | | | | | |
| – government securities and US government agencies | | | 42,706 | | | 43,591 | | | 39,943 | | | 40,470 | | | 37,955 | | | 38,535 | |
| – other public sector securities | | | 5,369 | | | 5,670 | | | 4,908 | | | 5,014 | | | 3,261 | | | 3,337 | |
| | |
|
| |
|
| |
|
| |
|
| |
|
| |
|
| |
| | | | 48,075 | | | 49,261 | | | 44,851 | | | 45,484 | | | 41,216 | | | 41,872 | |
| | | | | |
| | | | |
| | | | |
| |
| | | | | | | | | | | | | | | | | | |
| Other securities: | | | | | | | | | | | | | | | | | | | |
| – government securities and US government agencies | | | 27,664 | | | | | | 27,366 | | | | | | 22,134 | | | | |
| – other public sector securities | | | 1,095 | | | | | | 1,091 | | | | | | 545 | | | | |
| | |
| | | | |
| | | | |
| | | | |
| | | | 76,834 | | | | | | 73,308 | | | | | | 63,895 | | | | |
| | |
| | | | |
| | | | |
| | | | |
| | | | | | | | | | | | | | | | | | |
Issued by other bodies | | | | | | | | | | | | | | | | | | | |
| Investment securities: | | | | | | | | | | | | | | | | | | | |
| – bank and building society certificates of deposit | | | 6,097 | | | 6,142 | | | 6,782 | | | 6,800 | | | 13,745 | | | 13,759 | |
| – other debt securities | | | 53,753 | | | 54,494 | | | 41,633 | | | 42,030 | | | 31,993 | | | 32,113 | |
| | |
|
| |
|
| |
|
| |
|
| |
|
| |
|
| |
| | | | 59,850 | | | 60,636 | | | 48,415 | | | 48,830 | | | 45,738 | | | 45,872 | |
| | | | | |
| | | | |
| | | | |
| |
| | | | | | | | | | | | | | | | | | |
| Other securities: | | | | | | | | | | | | | | | | | | | |
| – bank and building society certificates of deposit | | | 11,309 | | | | | | 10,893 | | | | | | 852 | | | | |
| – other debt securities | | | 27,737 | | | | | | 27,963 | | | | | | 22,333 | | | | |
| | |
| | | | |
| | | | |
| | | | |
| | | | 98,896 | | | | | | 87,271 | | | | | | 68,923 | | | | |
| | |
| | | | |
| | | | |
| | | | |
| | | | 175,730 | | | | | | 160,579 | | | | | | 132,818 | | | | |
| | |
| | | | |
| | | | |
| | | | |
| | | | | | | | | | | | | | | | | | |
| Due within 1 year | | | 56,052 | | | | | | 43,803 | | | | | | 44,731 | | | | |
| Due 1 year and over | | | 119,678 | | | | | | 116,776 | | | | | | 88,087 | | | | |
| | |
| | | | |
| | | | |
| | | | |
| | | | 175,730 | | | | | | 160,579 | | | | | | 132,818 | | | | |
| | |
| | | | |
| | | | |
| | | | |
| | | | | | | | | | | | | | | | | | |
| Amounts include: | | | | | | | | | | | | | | | | | | | |
| Subordinated debt securities | | | 311 | | | | | | 241 | | | | | | 584 | | | | |
| | |
| | | | |
| | | | |
| | | | |
| Unamortised net premium/(discount) on investment securities | | | 594 | | | | | | (102 | ) | | | | | (761 | ) | | | |
| | |
| | | | |
| | | | |
| | | | |
221
Back to Contents
HSBC HOLDINGS PLC
Notes on the Financial Statements (continued)
|
| | | 2002
| | 2001
| | 2000
| |
| | | | Book value | | | Market valuation | | | Book value | | | Market valuation | | | Book value | | | Market valuation | |
| | |
|
| |
|
| |
|
| |
|
| |
|
| |
|
| |
| | | | US$m | | | US$m | | | US$m | | | US$m | | | US$m | | | US$m | |
| Investment securities: | | | | | | | | | | | | | | | | | | | |
| – listed on a recognised UK exchange | | | 17,651 | | | 18,082 | | | 13,769 | | | 13,877 | | | 9,514 | | | 9,564 | |
| – listed in Hong Kong | | | 1,530 | | | 1,640 | | | 915 | | | 959 | | | 795 | | | 830 | |
| – listed elsewhere | | | 50,221 | | | 51,354 | | | 45,750 | | | 46,327 | | | 40,884 | | | 41,392 | |
| – unlisted | | | 38,523 | | | 38,821 | | | 32,832 | | | 33,151 | | | 35,761 | | | 35,958 | |
| | |
|
| |
|
| |
|
| |
|
| |
|
| |
|
| |
| | | | 107,925 | | | 109,897 | | | 93,266 | | | 94,314 | | | 86,954 | | | 87,744 | |
| | | | | |
| | | | |
| | | | |
| |
| Other securities: | | | | | | | | | | | | | | | | | | | |
| – listed on a recognised UK exchange | | | 9,158 | | | | | | 6,525 | | | | | | 5,309 | | | | |
| – listed in Hong Kong | | | 2,397 | | | | | | 1,828 | | | | | | 1,788 | | | | |
| – listed elsewhere | | | 29,434 | | | | | | 35,597 | | | | | | 26,923 | | | | |
| – unlisted | | | 26,816 | | | | | | 23,363 | | | | | | 11,844 | | | | |
| | |
| | | | |
| | | | |
| | | | |
| | | | 175,730 | | | | | | 160,579 | | | | | | 132,818 | | | | |
| | |
| | | | |
| | | | |
| | | | |
Where securities are carried at market value, and the market value is higher than cost, the difference between cost and market value is not disclosed as it cannot be determined without unreasonable expense. The above market valuations do not take account of transactions entered into to hedge the value of HSBC’s investment securities. If the effect of these transactions was included, the market valuation of investment securities would be US$109,204 million (2001: US$94,100 million; 2000: US$87,665 million). Investment securities: |
| | | | Cost | | | Provisions | | | Book Value | |
| | |
|
| |
|
| |
|
| |
| | | | US$m | | | US$m | | | US$m | |
| At 1 January 2002 | | | 93,345 | | | (79 | ) | | 93,266 | |
| Additions | | | 85,837 | | | – | | | 85,837 | |
| Acquisition of subsidiaries | | | 2,004 | | | – | | | 2,004 | |
| Disposals and amounts repaid | | | (76,935 | ) | | – | | | (76,935 | ) |
| Provisions made | | | – | | | (14 | ) | | (14 | ) |
| Amortisation of discounts and premiums | | | (289 | ) | | – | | | (289 | ) |
| Exchange and other movements | | | 4,078 | | | (22 | ) | | 4,056 | |
| | |
|
| |
|
| |
|
| |
At 31 December 2002 | | | 108,040 | | | (115 | ) | | 107,925 | |
| | |
|
| |
|
| |
|
| |
222
Back to Contents
HSBC HOLDINGS PLC
The book value of investment securities, analysed by type of borrower, is as follows:
Available-for-sale | | | 2002 | | | 2001 | | | 2000 | |
| | |
|
| |
|
| |
|
| |
| | | | US$m | | | US$m | | | US$m | |
| US Treasury and Government agencies | | | 18,574 | | | 17,452 | | | 18,381 | |
| UK Government | | | 1,064 | | | 1,880 | | | 3,276 | |
| Hong Kong SAR governments | | | 1,042 | | | 490 | | | 306 | |
| Other governments | | | 18,067 | | | 16,212 | | | 12,302 | |
| Asset-backed securities | | | 3,697 | | | 4,535 | | | 4,497 | |
| Corporate debt and other securities | | | 60,852 | | | 48,021 | | | 43,754 | |
| | |
|
| |
|
| |
|
| |
| | | | 103,296 | | | 88,590 | | | 82,516 | |
| | |
|
| |
|
| |
|
| |
Held-to-maturity | | | | | | | | | | |
| US Treasury and Government agencies | | | 3,918 | | | 3,907 | | | 3,690 | |
| Obligations of US state and political sub-divisions | | | 711 | | | 769 | | | 718 | |
| Corporate debt and other securities | | | – | | | – | | | 30 | |
| | |
|
| |
|
| |
|
| |
| | | | 4,629 | | | 4,676 | | | 4,438 | |
| | |
|
| |
|
| |
|
| |
The following table provides an analysis of gross unrealised gains and losses for investment securities by instrument type as at 31 December for the past three years:
Available-for-sale | | | Carrying value | | | Gross unrealised gains | | | Gross unrealised losses | | | Market valuation | |
| | |
|
| |
|
| |
|
| |
|
| |
| | | | US$m | | | US$m | | | US$m | | | US$m | |
31 December 2002 | | | | | | | | | | | | | |
| US Treasury and Government agencies | | | 18,574 | | | 445 | | | (7 | ) | | 19,012 | |
| UK Government | | | 1,064 | | | 4 | | | – | | | 1,068 | |
| Hong Kong SAR governments | | | 1,042 | | | 70 | | | (2 | ) | | 1,110 | |
| Other governments | | | 18,067 | | | 370 | | | (228 | ) | | 18,209 | |
| Asset-backed securities | | | 3,697 | | | 25 | | | (7 | ) | | 3,715 | |
| Corporate debt and other securities | | | 60,852 | | | 1,146 | | | (121 | ) | | 61,877 | |
| | |
|
| |
|
| |
|
| |
|
| |
| | | | 103,296 | | | 2,060 | | | (365 | ) | | 104,991 | |
| | |
|
| |
|
| |
|
| |
|
| |
| 31 December 2001 | | | | | | | | | | | | | |
| US Treasury and Government agencies | | | 17,452 | | | 237 | | | (62 | ) | | 17,627 | |
| UK Government | | | 1,880 | | | 12 | | | – | | | 1,892 | |
| Hong Kong SAR governments | | | 490 | | | 30 | | | (2 | ) | | 518 | |
| Other governments | | | 16,212 | | | 311 | | | (158 | ) | | 16,365 | |
| Asset-backed securities | | | 4,535 | | | 45 | | | (6 | ) | | 4,574 | |
| Corporate debt and other securities | | | 48,021 | | | 604 | | | (153 | ) | | 48,472 | |
| | |
|
| |
|
| |
|
| |
|
| |
| | | | 88,590 | | | 1,239 | | | (381 | ) | | 89,448 | |
| | |
|
| |
|
| |
|
| |
|
| |
| 31 December 2000 | | | | | | | | | | | | | |
| US Treasury and Government agencies | | | 18,381 | | | 347 | | | (79 | ) | | 18,649 | |
| UK Government | | | 3,276 | | | 7 | | | (1 | ) | | 3,282 | |
| Hong Kong SAR governments | | | 306 | | | 30 | | | – | | | 336 | |
| Other government | | | 12,302 | | | 187 | | | (46 | ) | | 12,443 | |
| Asset-backed securities | | | 4,497 | | | 38 | | | (10 | ) | | 4,525 | |
| Corporate debt and other securities | | | 43,754 | | | 323 | | | (172 | ) | | 43,905 | |
| | |
|
| |
|
| |
|
| |
|
| |
| | | | 82,516 | | | 932 | | | (308 | ) | | 83,140 | |
| | |
|
| |
|
| |
|
| |
|
| |
223
Back to Contents
HSBC HOLDINGS PLC
Notes on the Financial Statements (continued)
|
The amounts shown under other governments in the above table include securities with a book value of US$5,616 million (2001: US$4,283 million) and a market value of US$5,630 million (2001: US$4,289 million) issued by the Government of Japan.
Held-to-maturity | | | Carrying value | | | Gross unrealised gains | | | Gross unrealised losses | | | Market valuation | |
| | |
|
| |
|
| |
|
| |
|
| |
| | | | US$m | | | US$m | | | US$m | | | US$m | |
31 December 2002 | | | | | | | | | | | | | |
| US Treasury and Government agencies | | | 3,918 | | | 234 | | | (1 | ) | | 4,151 | |
| Obligations of US state and political sub-divisions | | | 711 | | | 45 | | | (1 | ) | | 755 | |
| Corporate debt and other securities | | | – | | | – | | | – | | | – | |
| | |
|
| |
|
| |
|
| |
|
| |
| | | | 4,629 | | | 279 | | | (2 | ) | | 4,906 | |
| | |
|
| |
|
| |
|
| |
|
| |
| 31 December 2001 | | | | | | | | | | | | | |
| US Treasury and Government agencies | | | 3,907 | | | 168 | | | (9 | ) | | 4,066 | |
| Obligations of US state and political sub-divisions | | | 769 | | | 32 | | | (1 | ) | | 800 | |
| | |
|
| |
|
| |
|
| |
|
| |
| | | | 4,676 | | | 200 | | | (10 | ) | | 4,866 | |
| | |
|
| |
|
| |
|
| |
|
| |
| 31 December 2000 | | | | | | | | | | | | | |
| US Treasury and Government agencies | | | 3,690 | | | 136 | | | – | | | 3,826 | |
| Obligations of US state and political sub-divisions | | | 718 | | | 31 | | | (1 | ) | | 748 | |
| Corporate debt and other securities | | | 30 | | | – | | | – | | | 30 | |
| | |
|
| |
|
| |
|
| |
|
| |
| | | | 4,438 | | | 167 | | | (1 | ) | | 4,604 | |
| | |
|
| |
|
| |
|
| |
|
| |
The maturities of investment securities at 31 December 2002 are analysed as follows:
Available-for-sale | | | Book value | | | Market valuation | |
| | |
|
| |
|
| |
| | | | US$m | | | US$m | |
| 1 year or less | | | 30,013 | | | 30,208 | |
| 5 years or less but over 1 year | | | 46,545 | | | 47,230 | |
| 10 years or less but over 5 years | | | 8,712 | | | 9,111 | |
| Over 10 years | | | 16,923 | | | 17,342 | |
| No fixed maturity | | | 1,103 | | | 1,100 | |
| | |
|
| |
|
| |
| | | | 103,296 | | | 104,991 | |
| | |
|
| |
|
| |
Held-to-maturity | | | Book value | | | Market valuation | |
| | |
|
| |
|
| |
| | | | US$m | | | US$m | |
| 1 year or less | | | 103 | | | 105 | |
| 5 years or less but over 1 year | | | 232 | | | 240 | |
| 10 years or less but over 5 years | | | 323 | | | 348 | |
| Over 10 years | | | 3,971 | | | 4,213 | |
| | |
|
| |
|
| |
| | | | 4,629 | | | 4,906 | |
| | |
|
| |
|
| |
224
Back to Contents
HSBC HOLDINGS PLC
The following table provides an analysis of contractual maturities and weighted average yields of investment debt securities as at 31 December 2002:
| | Within one year | | After one but within five years | | After five but within
ten years | | After ten years | | No fixed maturity | |
| |
| |
| |
| |
| |
| |
| | Amount | | Yield | | Amount | | Yield | | Amount | | Yield | | Amount | | Yield | | Amount | | Yield | |
| |
| |
| |
| |
| |
| |
| |
| |
| |
| |
| |
Available-for-sale | US$m | | % | | US$m | | % | | US$m | | % | | US$m | | % | | US$m | | % | |
| US Treasury and Government agencies | 1,993 | | 1.97 | | 2,989 | | 3.53 | | 904 | | 5.06 | | 12,688 | | 4.23 | | – | | – | |
| UK Government | 1,059 | | 4.92 | | 5 | | – | | – | | – | | – | | – | | – | | – | |
| Hong Kong SAR governments | 212 | | 4.17 | | 745 | | 4.26 | | 85 | | 8.70 | | – | | – | | – | | – | |
| Other governments | 5,245 | | 4.10 | | 10,547 | | 5.17 | | 1,802 | | 5.86 | | 473 | | 6.78 | | – | | – | |
| Asset-backed securities | 116 | | 14.41 | | 996 | | 2.64 | | 1,265 | | 2.28 | | 1,320 | | 2.23 | | – | | – | |
| Corporate debt and other securities | 21,388 | | 4.27 | | 31,263 | | 3.86 | | 4,656 | | 5.31 | | 2,442 | | 4.12 | | 1,103 | | 0.28 | |
| |
| | | |
| | | |
| | | |
| | | |
| | | |
| | 30,013 | | | | 46,545 | | | | 8,712 | | | | 16,923 | | | | 1,103 | | | |
| |
| | | |
| | | |
| | | |
| | | |
| | | |
Held-to-maturity | | | | | | | | | | | | | | | | | | | | |
| US Treasury and Government agencies | – | | – | | 187 | | 7.27 | | 193 | | 7.19 | | 3,538 | | 6.68 | | – | | | |
| Corporate debt and other securities | 103 | | 7.14 | | 45 | | 6.07 | | 130 | | 5.55 | | 433 | | 6.70 | | – | | | |
| |
| | | |
| | | |
| | | |
| | | |
| | | |
| | 103 | | | | 232 | | | | 323 | | | | 3,971 | | | | – | | | |
| |
| | | |
| | | |
| | | |
| | | |
| | | |
The maturity distributions of asset-backed securities are presented in the above table based upon contractual maturity dates. The weighted average yield for each range of maturities in the above table is calculated by dividing the annualised interest income for the year ended 31 December 2002 by the book amount of available-for-sale debt securities at that date. The yields do not include the effect of related derivatives.
Proceeds from the sale and redemption of investment securities were US$77,105 million (2001: US$87,626 million; 2000: US$109,300 million). Gross realised gains of US$247 million (2001: US$359 million; 2000: US$123 million) and gross realised losses of US$77 million (2001: US$180 million; 2000: US$58 million) were recorded on those sales. Realised gains and losses are computed using the weighted average cost method. There were no gains or losses recorded on securities transferred from the investment book to the trading book.
The cost of investment securities purchased during the year ended 31 December 2002 was US$85,837 million (2001: US$94,214 million; 2000: US$107,025 million).
225
Back to Contents
HSBC HOLDINGS PLC
Notes on the Financial Statements (continued)
|
|
|
|
|
|
|
|
|
| | | | | | | | |
| | | 2002 | | 2001 | | 2000 | |
| | |
| |
| |
| |
| | | | Book value | | | Market valuation | | | Book value | | | Market valuation | | | Book value | | | Market valuation | |
| | |
|
| |
|
| |
|
| |
|
| |
|
| |
|
| |
| | | | US$m | | | US$m | | | US$m | | | US$m | | | US$m | | | US$m | |
| Investment securities: | | | | | | | | | | | | | | | | | | | |
| – listed on a recognised UK exchange | | | 563 | | | 505 | | | 695 | | | 688 | | | 722 | | | 1,005 | |
| – listed in Hong Kong | | | 241 | | | 400 | | | 245 | | | 564 | | | 270 | | | 742 | |
| – listed elsewhere | | | 1,163 | | | 1,207 | | | 1,389 | | | 1,436 | | | 1,247 | | | 1,382 | |
| – unlisted | | | 2,866 | | | 3,127 | | | 2,426 | | | 2,606 | | | 2,399 | | | 2,644 | |
| | |
|
| |
|
| |
|
| |
|
| |
|
| |
|
| |
| | | | 4,833 | | | 5,239 | | | 4,755 | | | 5,294 | | | 4,638 | | | 5,773 | |
| | | | | |
| | | | |
| | | | |
| |
| Other securities: | | | | | | | | | | | | | | | | | | | |
| – listed on a recognised UK exchange | | | 670 | | | | | | 713 | | | | | | 1,071 | | | | |
| – listed in Hong Kong | | | 9 | | | | | | 74 | | | | | | 228 | | | | |
| – listed elsewhere | | | 2,576 | | | | | | 2,405 | | | | | | 1,953 | | | | |
| – unlisted | | | 125 | | | | | | 110 | | | | | | 214 | | | | |
| | |
| | | | |
| | | | |
| | | | |
| | | | 8,213 | | | | | | 8,057 | | | | | | 8,104 | | | | |
| | |
| | | | |
| | | | |
| | | | |
| |
| Where securities are carried at market value, and the market value is higher than cost, the difference between cost and market value is not disclosed as it cannot be determined without unreasonable expense. |
| |
| Included within Investment securities – listed on a recognised UK exchange are US$549 million (2001: US$608 million; 2000:US$582 million) of shares in HSBC Holdings with a market value of US$519 million (2001: US$541 million; 2000: US$596 million), comprising: |
| | |
| (a) | US$514 million (2001: US$555 million; 2000: US$564 million) of shares as explained in note 26 (a). |
| | |
| (b) | US$14 million, after amortisation, (2001: US$43 million; 2000: US$18 million) of shares held in trusts established by subsidiary companies for the purposes of conditional awards under the Restricted Share Plan, details of which are provided in the Directors’ Remuneration Report on pages 173 and 177. At 31 December 2002, such trusts held 5,029,157 ordinary shares (2001: 3,455,821; 2000: 2,143,646) with a market value at that date of US$56 million (2001: US$40 million; 2000: US$ 32 million) |
| | |
| (c) | US$21 million, after amortisation, (2001: US$10 million; 2000: US$ nil) of shares held in trusts established by subsidiary companies which may be used in respect of the exercise of share options or for the purposes of share awards as detailed in note 35. At 31 December 2002, such trusts held 1,482,249 (2001: 796,700; 2000: nil) shares with a market value at that date of US$16 million (2001: US$10 million; 2000: US$ nil). |
| |
| Included within ‘Other securities – listed on a recognised UK exchange’ are 3,090,776 (2001: 1,369,901; 2000: 5,871,062) shares in HSBC Holdings valued at US$34 million (2001: US$16 million; 2000: US$86 million) held by subsidiary undertakings as equity market-makers. |
226
Back to Contents
HSBC HOLDINGS PLC
| | | | Cost | | | Provisions | | | Book value | |
| | |
|
| |
|
| |
|
| |
| | | | US$m | | | US$m | | | US$m | |
| At 1 January 2002 | | | 4,959 | | | (204 | ) | | 4,755 | |
| Additions | | | 1,753 | | | – | | | 1,753 | |
| Acquisition of subsidiaries | | | 7 | | | – | | | 7 | |
| Disposals | | | (1,791 | ) | | 17 | | | (1,774 | ) |
| Provisions made | | | – | | | (155 | ) | | (155 | ) |
| Provisions written off | | | (24 | ) | | 24 | | | – | |
| Exchange and other movements | | | 304 | | | (57 | ) | | 247 | |
| | |
|
| |
|
| |
|
| |
At 31 December 2002 | | | 5,208 | | | (375 | ) | | 4,833 | |
| | |
|
| |
|
| |
|
| |
| The following table provides an analysis of gross unrealised gains and losses as at 31 December for the past three years: |
| | | | Carrying value | | | Gross unrealised gains | | | Gross unrealised losses | | | Market valuation | |
| | |
|
| |
|
| |
|
| |
|
| |
| | | | US$m | | | US$m | | | US$m | | | US$m | |
31 December 2002 | | | 4,833 | | | 603 | | | (197 | ) | | 5,239 | |
| | |
|
| |
|
| |
|
| |
|
| |
| 31 December 2001 | | | 4,755 | | | 669 | | | (130 | ) | | 5,294 | |
| | |
|
| |
|
| |
|
| |
|
| |
| 31 December 2000 | | | 4,638 | | | 1,183 | | | (48 | ) | | 5,773 | |
| | |
|
| |
|
| |
|
| |
|
| |
| | | | | | | | | | | | | | |
| Proceeds from the sale of investment securities were US$1,980 million (2001: US$1,796 million; 2000: US$1,259 million). Gross realised gains of US$215 million (2001: US$290 million; 2000: US$225 million) and gross realised losses of US$9 million (2001: US$25 million; 2000: US$20 million) were recorded on those sales. Realised gains and losses are computed using the weighted average cost method. There were no gains recorded on securities transferred from the investment book to the trading book. |
| |
| The cost of investment securities purchased during the year ended 31 December 2002 was US$1,753 million (2001: US$1,670 million; 2000: US$1,822 million). |
| 21 | Interests in joint ventures |
|
| | | | 2002 | |
| | | | US$m | |
| | | |
| At 1 January 2002 | | | 292 | |
| Additions and acquisitions of subsidiaries | | | 67 | |
| Amortisation of goodwill | | | (9 | ) |
| Disposals | | | (111 | ) |
| Transfer to subsidiaries | | | (67 | ) |
| Retained profits and losses | | | (17 | ) |
| Exchange and other movements | | | 35 | |
| | |
|
| |
At 31 December 2002 | | | 190 | |
| | |
|
| |
227
Back to Contents
HSBC HOLDINGS PLC
Notes on the Financial Statements (continued) |
|
| | | | | 2002 | | | 2001 | |
| | | | | US$m | | | US$m | |
| (a) | Shares in banks | | | – | | | 51 | |
| | Other | | | 190 | | | 241 | |
| | | |
|
| |
|
| |
| | | | | 190 | | | 292 | |
| | | |
|
| |
|
| |
| | All shares are unlisted. | | | | | | | |
| | | | | | | | | |
| (b) | The principal joint ventures of HSBC are: | | | | | | | |
| | | | Country of incorporation | | | Principal activity | | | HSBC’s interest in equity capital | | | Issued equity capital | |
| | |
|
| |
|
| |
|
| |
|
| |
| Framlington Group Limited | | | England | | | Asset management | | | 51% | | | £3m | |
| Pensiones Bital S.A. | | | Mexico | | | Pensions | | | 51% | | | MXP 237m | |
| Seguros Bital, S.A. de C.V., Grupo Financiero Bital | | | Mexico | | | Insurance | | | 51% | | | MXP 413m | |
| | All of the above interests in joint ventures are owned by subsidiaries of HSBC Holdings. All of the above make their financial statements up to 31 December. |
| | |
| | The principal countries of operation are the same as the countries of incorporation. |
| | |
| (c) | HSBC’s share of total operating income in joint ventures is US$19 million (2001: US$79 million). |
| | |
| | HSBC’s share of contingent liabilities in joint ventures is US$nil (2001: US$56 million). HSBC’s share of commitments by joint ventures is US$nil (2001: US$nil). |
| | |
| (d) | Included within HSBC’s share of gross assets of joint ventures is goodwill as follows: |
| | | | Cost | |
| | |
|
| |
| | | | US$m | |
Goodwill | | | | |
| At 1 January 2002 | | | 199 | |
| Additions and acquisition of subsidiaries | | | 15 | |
| Disposals | | | (63 | ) |
| Exchange and other movements | | | 17 | |
| | |
|
| |
Cost at 31 December 2002 | | | 168 | |
| | |
|
| |
| | | | Accumulated amortisation | |
| | |
|
| |
| | | | US$m | |
| Accumulated amortisation at 1 January 2002 | | | (12 | ) |
| Disposals | | | 6 | |
| Charge to the profit and loss account | | | (9 | ) |
| Exchange and other movements | | | (4 | ) |
| | |
|
| |
Accumulated amortisation at 31 December 2002 | | | (19 | ) |
| | |
|
| |
Net book value at 31 December 2002 | | | 149 | |
| | |
|
| |
| Net book value at 31 December 2001 | | | 187 | |
| | |
|
| |
228
Back to Contents
HSBC HOLDINGS PLC
| 22 | Interests in associates |
|
| | | 2002 | |
| | | US$m | |
| At 1 January 2002 | | 1,056 | |
| Additions | | 6 | |
| Disposals | | (19 | ) |
| Amounts written off | | (1 | ) |
| Retained profits and losses (Note 36) | | (11 | ) |
| Exchange and other movements | | 85 | |
| |
|
| |
At 31 December 2002 | | 1,116 | |
| |
|
| |
| | There was no goodwill included in the interests in associates at either 31 December 2002 or 2001. |
| | | | 2002 | | | 2001 | |
| | | | US$m | | | US$m | |
| (a) | Shares in banks | | 712 | | | 718 | |
| | Other | | 404 | | | 338 | |
| | |
|
| |
|
| |
| | | | 1,116 | | | 1,056 | |
| | |
|
| |
|
| |
| | | | | | |
| | Listed shares (all listed outside the United Kingdom and Hong Kong) | | 294 | | | 521 | |
| | Unlisted shares | | 822 | | | 535 | |
| | |
|
| |
|
| |
| | | | 1,116 | | | 1,056 | |
| | |
|
| |
|
| |
| (b) | The principal associates of HSBC are: |
| | Financial Statements made up to | | Country of incorporation | | Principal activity | | HSBC’s interest in equity capital | | Issued equity capital | |
| |
|
|
|
|
|
|
|
|
| |
| Barrowgate Limited | 31.12.02 | | Hong Kong | | Property Investment | | 24.64% | | * | |
| British Arab Commercial Bank Limited | 31.12.02 | | England | | Banking | | 46.51% | | US$81m
£32m fully paid,
£5m nil paid | |
The Cyprus Popular Bank Limited# | 31.12.02 | | Cyprus | | Banking | | 21.39% | | C£152m | |
| Erisa | 31.12.02 | | France | | Insurance | | 49.99% | | €65m | |
| The Saudi British Bank | 31.12.02 | | Saudi Arabia | | Banking | | 40% | | SR2,000m | |
| Wells Fargo HSBC Trade Bank, N.A. | 31.12.02 | | United States | | Trade finance | | 20% | | ¶ | |
| World Finance International Limited | 30.6.02 | | Bermuda | | Shipping | | 50% | | US$58m | |
| | | | | | | | | | | |
| * | issued equity capital is less than HK$1 million. |
| ¶ | issued equity capital is less than US$1 million. |
| | |
| | All the above interests in associates are owned by subsidiaries of HSBC Holdings. |
| | The principal countries of operation are the same as the countries of incorporation except for World Finance International Limited which operates worldwide, and British Arab Commercial Bank Limited which operates in the Middle East. |
229
Back to Contents
HSBC HOLDINGS PLC
Notes on the Financial Statements (continued) |
|
| (c) | The associates listed above have no loan capital, except for British Arab Commercial Bank Limited which has issued US$44.5 million of subordinated unsecured loan stock in which HSBC has a 34.66 per cent interest; Barrowgate Limited which has HK$845 million of loan capital in which HSBC has a 25 per cent interest; and The Cyprus Popular Bank Limited which has issued C£21.7 million of convertible debentures in which HSBC has a 30.1 per cent interest. HSBC also has a 100 per cent interest in the issued preferred stock (less than US$1 million) of Wells Fargo HSBC Trade Bank, N.A. HSBC has a 40 per cent economic interest in Wells Fargo HSBC Trade Bank, N.A. by virtue of the joint agreement under which HSBC’s equity capital and preferred stock interests are held. |
| | |
| 23 | Other participating interests |
|
| | | 2002 | | | 2001 | |
| | | US$m | | | US$m | |
| Listed other than on a recognised UK exchange or in Hong Kong | | 3 | | | – | |
| Unlisted | | 648 | | | 120 | |
| |
|
| |
|
| |
| | | 651 | | | 120 | |
| |
|
| |
|
| |
| Market value of listed securities | | 22 | | | 1 | |
| |
|
| |
|
| |
| Other participating interests in banks | | 1 | | | 91 | |
| |
|
| |
|
| |
| | | Cost | | | Provisions | | | Carrying value | |
| |
|
| |
|
| |
|
| |
| | | US$m | | | US$m | | | US$m | |
| At 1 January 2002 | | 164 | | | (44 | ) | | 120 | |
| Additions | | 628 | | | – | | | 628 | |
| Disposals | | (95 | ) | | – | | | (95 | ) |
| Provisions made | | – | | | (9 | ) | | (9 | ) |
| Exchange and other movements | | 7 | | | – | | | 7 | |
| |
|
| |
|
| |
|
| |
At 31 December 2002 | | 704 | | | (53 | ) | | 651 | |
| |
|
| |
|
| |
|
| |
230
Back to Contents
HSBC HOLDINGS PLC
| 24 | Intangible fixed assets |
|
| | | Cost | * |
| |
|
| |
| | | US$m | |
Goodwill | | | |
| At 1 January 2002 | | 15,950 | |
| Additions (positive goodwill of US$2,074 million, negative goodwill of US$82 million) (note 26 (c)) | | 1,992 | |
| Exchange and other movements | | 1,637 | |
| |
|
| |
Cost at 31 December 2002 | | 19,579 | |
| |
|
| |
| | | Accumulated amortisation | |
| |
|
| |
| | | US$m | |
| Accumulated amortisation at 1 January 2002 | | (1,386 | ) |
| Charge to the profit and loss account (net of negative goodwill of US$24 million) | | (854 | ) |
| Exchange and other movements | | (176 | ) |
| |
|
| |
| | | | |
Accumulated amortisation at 31 December 2002 | | (2,416 | ) |
| |
|
| |
Net book value at 31 December 2002 (net of negative goodwill of US$58 million) | | 17,163 | |
| |
|
| |
| Net book value at 31 December 2001 | | 14,564 | |
| |
|
| |
| * | Figures for 2001 have been restated to reflect the adoption of UK Financial Reporting Standard 19 ‘Deferred Tax’, details of which are set out in Note 1 of the Financial Statements on pages 195 to 197. |
| | |
| Additions represent goodwill arising on acquisitions and increases of holdings in subsidiaries and businesses during 2002. Positive goodwill is being amortised over periods of up to 20 years. Negative goodwill is being credited to the profit and loss account over 5 years, the period to be benefited. |
231
Back to Contents
HSBC HOLDINGS PLC
Notes on the Financial Statements (continued) |
|
| 25 | Tangible fixed assets |
| | |
| (a) | HSBC |
| | | | Freehold
land and buildings | | | Long leasehold
land and
buildings | | | Short leasehold
land and buildings | | | Equipment, fixtures and fittings | | | Equipment
on operating leases | | | Total | |
| | |
|
| |
|
| |
|
| |
|
| |
|
| |
|
| |
| | | | US$m | | | US$m | | | US$m | | | US$m | | | US$m | | | US$m | |
| Cost or valuation at 1 January 2002 | | | 3,030 | | | 3,245 | | | 3,081 | | | 5,588 | | | 3,488 | | | 18,432 | |
| Additions | | | 58 | | | 131 | | | 48 | | | 851 | | | 635 | | | 1,723 | |
| Acquisition of subsidiaries | | | 44 | | | – | | | 6 | | | 127 | | | – | | | 177 | |
| Disposals | | | (116 | ) | | (15 | ) | | (56 | ) | | (523 | ) | | (337 | ) | | (1,047 | ) |
| Reclassification | | | 53 | | | (11 | ) | | (111 | ) | | 69 | | | – | | | – | |
| Transfer of accumulated depreciation arising on revaluation | | | (67 | ) | | (57 | ) | | (98 | ) | | – | | | – | | | (222 | ) |
| Impairment of land and buildings | | | (41 | ) | | – | | | – | | | – | | | – | | | (41 | ) |
| Deficit on revaluation | | | (7 | ) | | (218 | ) | | (134 | ) | | – | | | – | | | (359 | ) |
| Exchange and other movements | | | 161 | | | 124 | | | 35 | | | 368 | | | 397 | | | 1,085 | |
| | |
|
| |
|
| |
|
| |
|
| |
|
| |
|
| |
Cost or valuation at 31 December 2002 | | | 3,115 | | | 3,199 | | | 2,771 | | | 6,480 | | | 4,183 | | | 19,748 | |
| | |
|
| |
|
| |
|
| |
|
| |
|
| |
|
| |
| Accumulated depreciation at 1 January 2002 | | | (68 | ) | | (5 | ) | | (517 | ) | | (3,499 | ) | | (822 | ) | | (4,911 | ) |
| Disposals | | | 8 | | | – | | | 36 | | | 424 | | | 227 | | | 695 | |
| Reclassification | | | – | | | (1 | ) | | 34 | | | (33 | ) | | – | | | – | |
| Transfer of accumulated depreciation arising on revaluation | | | 67 | | | 57 | | | 98 | | | – | | | – | | | 222 | |
| Charge to the profit and loss account | | | (54 | ) | | (49 | ) | | (98 | ) | | (709 | ) | | (239 | ) | | (1,149 | ) |
| Exchange and other movements | | | (29 | ) | | (5 | ) | | (28 | ) | | (277 | ) | | (85 | ) | | (424 | ) |
| | |
|
| |
|
| |
|
| |
|
| |
|
| |
|
| |
Accumulated depreciation at 31 December 2002 | | | (76 | ) | | (3 | ) | | (475 | ) | | (4,094 | ) | | (919 | ) | | (5,567 | ) |
| | |
|
| |
|
| |
|
| |
|
| |
|
| |
|
| |
Net book value at 31 December 2002 | | | 3,039 | | | 3,196 | | | 2,296 | | | 2,386 | | | 3,264 | | | 14,181 | |
| | |
|
| |
|
| |
|
| |
|
| |
|
| |
|
| |
| Net book value at 31 December 2001 | | | 2,962 | | | 3,240 | | | 2,564 | | | 2,089 | | | 2,666 | | | 13,521 | |
| | |
|
| |
|
| |
|
| |
|
| |
|
| |
|
| |
| (b) HSBC Holdings | | | | | | | | | | |
| | | | Freehold land and
buildings | | | Equipment, fixtures and fittings | | | Total | |
| | |
|
| |
|
| |
|
| |
| | | | US$m | | | US$m | | | US$m | |
| Cost or valuation at 1 January 2002 | | | 4 | | | 4 | | | 8 | |
| Additions | | | – | | | 1 | | | 1 | |
| Disposals | | | (4 | ) | | (1 | ) | | (5 | ) |
| | |
|
| |
|
| |
|
| |
Cost or valuation at 31 December 2002 | | | – | | | 4 | | | 4 | |
| | |
|
| |
|
| |
|
| |
| Accumulated depreciation at 1 January 2002 | | | – | | | (1 | ) | | (1 | ) |
| Charge to the profit and loss account | | | – | | | (1 | ) | | (1 | ) |
| | |
|
| |
|
| |
|
| |
Accumulated depreciation at 31 December 2002 | | | – | | | (2 | ) | | (2 | ) |
| | |
|
| |
|
| |
|
| |
Net book value at 31 December 2002 | | | – | | | 2 | | | 2 | |
| | |
|
| |
|
| |
|
| |
| Net book value at 31 December 2001 | | | 4 | | | 3 | | | 7 | |
| | |
|
| |
|
| |
|
| |
232
Back to Contents
HSBC HOLDINGS PLC
| | | HSBC | | HSBC Holdings | |
| | |
| |
| |
| | | | 2002 | | | 2001 | | | 2002 | | | 2001 | |
| | | | US$m | | | US$m | | | US$m | | | US$m | |
| Cost or valuation of freehold and long and short leasehold land and buildings (excluding investment properties): | | | | | | | | | | | | | |
| At 2002 valuation (2001: at 2001 valuation) | | | 7,733 | | | 7,103 | | | – | | | 4 | |
| At cost | | | 827 | | | 1,697 | | | – | | | – | |
| | |
|
| |
|
| |
|
| |
|
| |
| | | | 8,560 | | | 8,800 | | | – | | | 4 | |
| | |
|
| |
|
| |
|
| |
|
| |
| On the historical cost basis, freehold and long and short leasehold land and buildings would have been included as follows (excluding investment properties): | | | | | | | | | | | | | |
| Cost | | | 7,839 | | | 7,538 | | | – | | | – | |
| Accumulated depreciation | | | (1,752 | ) | | (1,575 | ) | | – | | | – | |
| | |
|
| |
|
| |
|
| |
|
| |
| | | | 6,087 | | | 5,963 | | | – | | | – | |
| | |
|
| |
|
| |
|
| |
|
| |
| | | |
| HSBC values its non-investment properties on an annual basis. In September 2002, except as noted below, HSBC’s freehold and long leasehold properties, together with all leasehold properties in Hong Kong, were revalued on an existing use basis or open market value as appropriate or, in the case of a few specialised properties, at depreciated replacement cost. The properties were valued either by professional external valuers or by professionally qualified staff and updated for any material changes at 31 December 2002. |
| |
| As a result of the revaluation, the net book value of land and buildings (excluding investment properties) decreased by US$322 million (2001: decrease US$241 million). A deficit of US$297 million (2001: deficit of US$227 million), net of minority interest of US$25 million (2001:US$14 million) was debited to reserves at 31 December 2002. |
| |
| Included within ‘Short leasehold land and buildings’ are the following amounts in respect of assets classed as improvements to buildings, which are carried at depreciated historical cost: |
| | | | Cost | | | Accumulated
depreciation | |
| | |
|
| |
|
| |
| | | | US$m | | | US$m | |
| At 1 January 2002 | | | 776 | | | (273 | ) |
| Additions | | | 45 | | | – | |
| Disposals | | | (39 | ) | | – | |
| Charge for the year | | | – | | | (22 | ) |
| Exchange and other movements | | | (14 | ) | | (13 | ) |
| | |
|
| |
|
| |
At 31 December 2002 | | | 768 | | | (308 | ) |
| | |
| |
| |
Net book value at 31 December 2002 (2001: US$503 million) | | | 460 | | | | |
| | |
| | | | |
233
Back to Contents
HSBC HOLDINGS PLC
Notes on the Financial Statements (continued) |
| |
| The valuation at which investment properties are included in tangible fixed assets, together with the net book value of these properties calculated under the historical cost basis, is as follows: |
| | | 2002 | | 2001 | |
| | |
| |
| |
| | | | At valuation | | | At cost | | | At valuation | | | At cost | |
| | |
|
| |
|
| |
|
| |
|
| |
| | | | US$m | | | US$m | | | US$m | | | US$m | |
| Freehold land and buildings | | | 80 | | | 80 | | | 80 | | | 80 | |
| Short and long leasehold land and buildings | | | 445 | | | 146 | | | 476 | | | 145 | |
| | |
|
| |
|
| |
|
| |
|
| |
| | | | 525 | | | 226 | | | 556 | | | 225 | |
| | |
|
| |
|
| |
|
| |
|
| |
| |
| Investment properties are valued on an open market value basis at 31 December annually by professional valuers. Investment properties in Hong Kong, the Macau Special Administrative Region and mainland China, which represent 89% by value of HSBC’s properties subject to revaluation, were valued by Chesterton Petty. The valuations were carried out by qualified valuers who are members of the Hong Kong Institute of Surveyors. As a result of the revaluation, the net book value of investment properties has decreased by US$36 million (2001: deficit of US$30 million). A deficit of US$22 million, net of minority interests of US$14 million, has been debited to reserves at 31 December 2002. |
| |
| HSBC Holdings had no investment properties at 31 December 2002 or 2001. |
| | |
| (e) | HSBC properties leased to customers |
| |
| HSBC properties leased to customers, none of which was held by HSBC Holdings, included US$502 million at 31 December 2002 (2001: US$522 million) let under operating leases, net of accumulated depreciation of US$39 million (2001: US$27million). |
| | |
| (f) | Land and buildings occupied for own activities |
| | | | 2002 | | | 2001 | |
| | |
|
| |
|
| |
| | | | US$m | | | US$m | |
| Net book value | | | 7,608 | | | 7,468 | |
| | |
|
| |
|
| |
| (g) | Residual values of equipment on operating leases |
| |
| Included in the net book value of equipment on operating leases are residual values at the end of current lease terms, which will be recovered through re-letting or disposal in the following periods: |
| | | | 2002 | | | 2001 | |
| | |
|
| |
|
| |
| | | | US$m | | | US$m | |
| Within 1 year | | | 559 | | | 248 | |
| Between 1-2 years | | | 1,108 | | | 386 | |
| Between 2-5 years | | | 290 | | | 1,017 | |
| More than 5 years | | | 715 | | | 527 | |
| | |
|
| |
|
| |
| Total exposure | | | 2,672 | | | 2,178 | |
| | |
|
| |
|
| |
| |
| Residual value risk arises in relation to an operation lease transaction to the extent that the actual value of the leased asset at the end of the lease term (the residual value) recovered through disposing of or re-letting the asset at the end of the lease term, could be different to that projected at the inception of the lease. Residual value exposure is regularly monitored by the business through reviewing the recoverability of the residual value projected at lease inception. This entails considering the re-lettability and projected disposal proceeds of operating lease assets at the end of their lease terms. Provision is made to the extent that the carrying values of leased assets are impaired through residual values not being fully recoverable. |
234
Back to Contents
HSBC HOLDINGS PLC
| | Shares in HSBC undertakings | | Loans to HSBC undertakings | | Other investments other than loans | | Own shares | | Total | |
| |
| |
| |
| |
| |
| |
| | US$m | | US$m | | US$m | | US$m | | US$m | |
| | | | | | | | | |
| At 1 January 2002 | 49,762 | | 4,172 | | 441 | | 555 | | 54,930 | |
| Additions | 3,361 | | 248 | | 44 | | 18 | | 3,671 | |
| Repayments and redemptions | – | | (257 | ) | – | | (41 | ) | (298 | ) |
| Amortisation | – | | – | | (1) | | (18 | ) | (19 | ) |
| Provisions for diminution in value | (21 | ) | – | | – | | – | | (21 | ) |
| Write-up of subsidiary undertakings to net asset value, including attributable goodwill (Note 36) | 4,535 | | – | | – | | – | | 4,535 | |
| |
| |
| |
| |
| |
| |
At 31 December 2002 | 57,637 | | 4,163 | | 484 | | 514 | | 62,798 | |
| |
| |
| |
| |
| |
| |
| | | |
| ‘Loans to HSBC undertakings’ includes qualifying or regulatory capital and similar financing which can only be repaid by the relevant HSBC undertaking with the consent of its local regulatory authority. |
| | | |
| Included within ‘Own shares’ are: |
| | | | |
| (i) | US$17 million, after amortisation, of HSBC Holdings’ own shares (2001: US$16 million) held in trust for the purposes of conditional awards under the Restricted Share Plan, details of which are provided in the Directors’ Remuneration Report on pages 173 to 177. At 31 December 2002, the trust held 4,664,315 ordinary shares (2001: 3,230,422 ordinary shares) with a market value at that date of US$51,610,678 (2001: US$37,735,716) in respect of these conditional awards. |
| | | | |
| (ii) | US$497 million of HSBC Holdings’ own shares (2001: US$539 million) held in trust which may be used in respect of the exercise of share options as detailed in note 35. At 31 December 2002, the trust held 35,745,555 ordinary shares (2001: 38,788,413 ordinary shares) with a market value of US$395,524,816 (2001: US$453,101,339) in respect of these option holders. |
| | | |
| HSBC Holdings’ own shares are included within ‘Equity Shares’ (Note 20) in the Consolidated Balance Sheet. |
| | | | 2002 | | | 2001 | |
| | | | US$m | | | US$m | |
| On the historical cost basis, shares in HSBC undertakings would have been included as follows: | | | | | | | |
| Cost less provisions of US$191 million (2001: US$170 million) | | | 43,731 | | | 40,391 | |
| | |
|
| |
|
| |
235
Back to Contents
HSBC HOLDINGS PLC
Notes on the Financial Statements (continued) |
|
| (b) | The principal subsidiary undertakings of HSBC Holdings are: |
| | | | Country of incorporation or registration | | | Principal activity | | | Issued equity capital | |
| | |
|
| |
|
| |
|
| |
Europe | | | | | | | | | | |
| CCF (formerly Crédit Commercial de France S.A.) (99.99% owned) | | |
France | | | Banking | | | €371m | |
| HSBC Bank AS | | | Turkey | | | Banking | | | TRL277bn | |
| HSBC Asset Management (Europe) Limited | | | England | | | Investment banking | | | £142m | |
| HSBC Asset Finance (UK) Limited | | | England | | | Finance | | | £265m | |
| HSBC Bank Malta p.l.c. (70.03% owned) | | | Malta | | | Banking | | | Lm9m | |
| HSBC Bank Middle East | | | England | | | Banking | | | US$331m | |
| HSBC Bank plc (directly owned) | | | England | | | Banking | | | £797m | |
HSBC Guyerzeller Bank AG (96.64% owned)1 | | | Switzerland | | | Banking | | | SFr95m | |
| HSBC Insurance Brokers Limited | | | England | | | Insurance | | | £3m | |
| HSBC Life (UK) Limited | | | England | | | Insurance | | | £34m | |
| HSBC Republic Bank (Guernsey) Limited | | | Guernsey | | | Private banking | | | US$5m2 | |
| HSBC Republic Bank (Suisse) S.A | | | Switzerland | | | Private banking | | | SFr680m | |
| HSBC Republic Bank (UK) Limited | | | England | | | Private banking | | | £112m | |
HSBC Trinkaus & Burkhardt KGaA
(partnership limited by shares, 73.47% owned) | | | Germany | | | Banking | | | €70m | |
| | | | | | | | | |
Hong Kong | | | | | | | | | | |
| Hang Seng Bank Limited (62.14% owned) | | | Hong Kong | | | Banking | | | HK$9,559m | |
| The Hongkong and Shanghai Banking Corporation Limited | | | Hong Kong | | | Banking | | | HK$16,254m | |
| HSBC Insurance (Asia) Limited | | | Hong Kong | | | Insurance | | | HK$125m | |
| HSBC Life (International) Limited | | | Bermuda | | | Retirement benefits
and life assurance | | | HK$327m | |
| | | | | | | | | |
Rest of Asia-Pacific | | | | | | | | | | |
| HSBC Bank Egypt S.A.E. (94.53% owned) | | | Egypt | | | Banking | | | E£352m | |
| HSBC Bank Australia Limited | | | Australia | | | Banking | | | A$600m | |
| HSBC Bank Malaysia Berhad | | | Malaysia | | | Banking | | | RM$114m | |
| HSBC Asset Management (Taiwan) Ltd (99.46% owned) | | | Taiwan | | | Investment banking | | | TWD788m | |
| | | | |
| 1 | Minority interest of 3.36% is through HSBC Trinkaus & Burkhardt KGaA |
| 2 | HSBC also owns 100% of the issued redeemable preference share capital of US$17 million |
236
Back to Contents
HSBC HOLDINGS PLC
| | | Country of incorporation or registration | | | Principal activity | | | Issued equity capital | |
| |
|
| |
|
| |
|
| |
North America | | | | | | | | | |
| HSBC Bank Canada (99.99% owned) | | Canada | | | Banking | | | C$950m | |
| HSBC Bank USA | | United States | | | Banking | | | US$205m | |
| HSBC Securities (USA) Inc | | United States | | | Investment banking | | | – | 3 |
| HSBC USA Inc | | United States | | | Holding company | | | – | 3 |
| Banco Internacional S.A (99.14% owned) | | Mexico | | | Banking | | | MXP2,921m | |
| | | | | | | | |
South America | | | | | | | | | |
| HSBC Bank Argentina S.A (99.92% owned) | | Argentina | | | Banking | | | ARS237m | |
| HSBC Bank Brasil S.A. – Banco Múltiplo | | Brazil | | | Banking | | | BRL1,082m | |
| HSBC Seguros (Brasil) S.A. (97.96% owned) | | Brazil | | | Insurance | | | BRL194m | |
| HSBC La Buenos Aires Seguros S.A. (99.24% owned) | | Argentina | | | Insurance | | | ARS44m | |
| Máxima S.A. AFJP (55.74% owned) | | Argentina | | | Pension fund management | | | ARS84m | 4 |
| | |
| 3 | issued equity capital is less than US$1 million |
| | |
| 4 | HSBC has a 60% economic and voting interest in Máxima S.A. AFJP. |
| | |
| Details of all HSBC companies will be annexed to the next Annual Return of HSBC Holdings filed with the UK Registrar of Companies. |
| |
| Except where indicated otherwise, the issued equity capital of the above undertakings is wholly-owned by HSBC and is held by subsidiaries of HSBC Holdings. All the above make their financial statements up to 31 December except for HSBC Bank Argentina S.A., HSBC La Buenos Aires Seguros S.A. and Maxima S.A. AFJP, whose financial statements are made up to 30 June annually. |
| |
| The principal countries of operation are the same as the countries of incorporation except for HSBC Bank Middle East which operates mainly in the Middle East, and HSBC Life (International) Limited which operates mainly in Hong Kong. All the above subsidiaries are included in the consolidation. |
| |
| HSBC made the following acquisitions of subsidiary undertakings or business operations in 2002, which were accounted for on an acquisition basis: |
| |
| i. | On 28 June 2002, HSBC increased its stake in Merrill Lynch HSBC from 50% to 100% for nil consideration. Negative goodwill of US$82 million arose on this acquisition. Prior to becoming a subsidiary undertaking, HSBC’s 50% interest in MLHSBC was accounted for as a joint venture. |
| | |
| | In accordance with FRS 2 ‘Accounting for subsidiary undertakings’, and in order to give a true and fair view, negative goodwill on the acquisition in June has been calculated as that arising on the later acquisition of shares, being the difference between the fair value of consideration paid and the fair values of the identifiable assets and liabilities attributable to the further 50% interest purchased. This represents a departure from the method required by Schedule 4A to the Act, under which goodwill is calculated as the difference between total consideration paid and the fair values of the identifiable assets and liabilities on the date that MLHSBC became a subsidiary undertaking. |
| | |
| | The method required by the Act would not give a true and fair view because it would result in the Group’s share of MLHSBC’s retained losses, during the period that it was a joint venture, being reclassified as goodwill. The effect of this departure is to reduce positive goodwill by US$89 million, recognise negative goodwill of US$82 million, and reduce retained profits by US$171 million. |
| | |
| ii. | On 1 July 2002, CCF, a 99.9 per cent owned subsidiary of HSBC, acquired the business in respect of 11 branches of Banques Worms for a cash consideration of US$10 million. Goodwill of US$10 million arose on this acquisition. |
237
Back to Contents
HSBC HOLDINGS PLC
Notes on the Financial Statements (continued) |
|
| iii. | On 29 July 2002, HSBC Bank Australia Limited, a wholly owned subsidiary of HSBC, acquired the corporate banking and trade finance business of State Street Bank and Trust Company’s Global Trade Banking Australia business for a cash consideration of US$75 million. Goodwill of US$1 million arose on this acquisition. |
| | |
| iv. | On 19 September 2002, HSBC Bank A.S., a wholly owned subsidiary of HSBC, acquired 100 per cent of the issued share capital of Benkar Tuketici Finansmani ve Kart Hizmetleri A.S. for a cash consideration of US$72 million. Of this, US$31 million is deferred consideration, payable over five years and conditional on achievement of specific business objectives. Goodwill of US$53 million arose on this acquisition. The fair values of the assets and liabilities acquired have been determined only on a provisional basis pending completion of the fair value appraisal process. |
| | |
| v. | On 25 November 2002, HSBC Holdings plc acquired 99.21 per cent of the total capital stock of Grupo Financiero Bital S.A. for a cash consideration of US$1,140 million. Goodwill of US$2,003 million arose on this acquisition. The fair values of the assets and liabilities acquired have been determined only on a provisional basis pending completion of the fair value appraisal process. |
| | |
| vi. | On 31 December 2002, The Hongkong and Shanghai Banking Corporation Limited, a 100 per cent owned subsidiary of HSBC, acquired certain business operations from the trade finance business of State Street Corporation’s Global Trade Banking Division for a cash consideration of US$nil. Goodwill of US$7 million arose on this acquisition. |
| | |
| vii. | Increases in stakes in a number of existing subsidiaries are excluded from the table below. On 8 April 2002, HSBC Insurance Brokers Limited increased its stake in GHC Treaty from 71.48 per cent to 81.20 per cent for a cash consideration of US$5 million, on which goodwill of US$4 million arose. On 31 October 2002, CCF increased its stake in Banque du Louvre from 88.6 per cent to 100 per cent for a cash consideration of US$26 million, on which goodwill of US$11 million arose. |
238
Back to Contents
HSBC HOLDINGS PLC
| The assets and liabilities at the dates of acquisition and the total consideration paid are set out in the following table: |
| | Book value | | Revaluations | | Accounting policy alignments | | Fair value | |
| |
| |
| |
| |
| |
| | US$m | | US$m | | US$m | | US$m | |
| At date of acquisition: | | | | | | | | |
| Cash and balances at central banks | 498 | | – | | – | | 498 | |
| Treasury bills and other eligible bills | 935 | | – | | – | | 935 | |
| Loans and advances to banks | 5,293 | | – | | – | | 5,293 | |
| Loans and advances to customers | 9,805 | | (176 | ) | (310 | ) | 9,319 | |
| Debt securities | 5,491 | | (374 | ) | – | | 5,117 | |
| Equity shares | 7 | | – | | – | | 7 | |
| Tangible fixed assets | 242 | | (8 | ) | (57 | ) | 177 | |
| Other asset categories | 930 | | 183 | | 29 | | 1,142 | |
| Deposits by banks | (2,798 | ) | – | | – | | (2,798 | ) |
| Customer accounts | (14,286 | ) | – | | – | | (14,286 | ) |
| Items in the course of transmission to other banks | (120 | ) | – | | – | | (120 | ) |
| Debt securities in issue | (4,932 | ) | – | | – | | (4,932 | ) |
| Provisions for liabilities and charges | (50 | ) | (129 | ) | (12 | ) | (191 | ) |
| Subordinated liabilities | (214 | ) | – | | – | | (214 | ) |
| Other liability categories | (530 | ) | (54 | ) | – | | (584 | ) |
| |
| |
| |
| |
| |
| | 271 | | (558 | ) | (350 | ) | (637 | ) |
| Add: minority interests – equity | 4 | | – | | – | | 4 | |
| Less: carrying value of HSBC’s existing interest in MLHSBC (note i above) | (62 | ) | – | | – | | (62 | ) |
| |
| |
| |
| |
| |
| Net assets acquired | 213 | | (558 | ) | (350 | ) | (695 | ) |
| |
| |
| |
| | | |
| Goodwill attributable: | | | | | | | | |
| – subsidiaries (Note 24) | | | | | | | 1,977 | |
| – joint ventures (Note 21) | | | | | | | 15 | |
| | | | | | | | 1,992 | |
| | | | | | | |
| |
Total consideration including costs of acquisition | | | | | | | 1,297 | |
| | | | | | | |
| |
| The fair value adjustments in the above table represent the following: |
| |
| Revaluations, reflecting the recognition of: |
| |
| – | the fair value of financial instruments acquired; |
| | |
| – | liabilities under pension and other post-retirement benefit schemes; and |
| | |
| – | recognition of deferred tax benefits. |
| | |
| Accounting policy alignments reflecting: |
| |
| – | introduction of HSBC’s criteria for raising provisions against doubtful loans; |
| | |
| – | introduction of HSBC’s policy in relation to the depreciation of fixed assets; and |
| | |
| – | HSBC’s criteria for recognising deferred tax. |
239
Back to Contents
HSBC HOLDINGS PLC
Notes on the Financial Statements (continued) |
|
| | | | 2002 | | | 2001 | * |
| | | | US$m | | | US$m | |
| Bullion | | | 2,962 | | | 1,619 | |
| Assets, including gains, resulting from off-balance-sheet interest rate, exchange rate and equities contracts which are marked to market | | | 21,163 | | | 15,575 | |
| Current taxation recoverable | | | 134 | | | 287 | |
| Deferred taxation (Note 32) | | | 1,135 | | | 1,115 | |
| Long-term assurance assets attributable to policyholders (Note 31) | | | 10,356 | | | 9,712 | |
| Other accounts | | | 10,134 | | | 10,324 | |
| | |
|
| |
|
| |
| | | | 45,884 | | | 38,632 | |
| | |
|
| |
|
| |
| | | | | | | | |
| * | Figures for 2001 have been restated to reflect the adoption of UK Financial Reporting Standard 19 ‘Deferred Tax’, details of which are set out in Note 1 on the Financial Statements on pages 195 to 197. |
| | |
| The composition of the net tangible assets relating to long-term assurance and retirement funds is analysed as follows: |
| | | | 2002 | | | 2001 | |
| | | | US$m | | | US$m | |
| Loans and advances to banks – with HSBC companies | | | 234 | | | 318 | |
| Debt securities | | | 4,436 | | | 3,381 | |
| Equity shares | | | 3,690 | | | 3,863 | |
| Other assets | | | 2,131 | | | 2,298 | |
| Prepayments and accrued income | | | 78 | | | 46 | |
| Other liabilities | | | (213 | ) | | (194 | ) |
| | |
|
| |
|
| |
| | | | 10,356 | | | 9,712 | |
| | |
|
| |
|
| |
| Included in the above are 8,302,220 (2001: 8,104,024) shares in HSBC Holdings valued at US$92 million (2001:US$95 million) held by subsidiary undertakings, as part of their long-term assurance and retirement funds for the benefit of the policyholders. |
| | | | 2002 | | | 2001 | |
| | | | US$m | | | US$m | |
| Repayable on demand | | | 18,093 | | | 18,132 | |
| With agreed maturity dates or periods of notice, by remaining maturity: | | | | | | | |
| – 3 months or less but not repayable on demand | | | 27,416 | | | 27,845 | |
| – 1 year or less but over 3 months | | | 4,804 | | | 5,234 | |
| – 5 years or less but over 1 year | | | 1,671 | | | 1,808 | |
| – over 5 years | | | 949 | | | 621 | |
| | |
|
| |
|
| |
| | | | 52,933 | | | 53,640 | |
| | |
|
| |
|
| |
| Amounts include: | | | | | | | |
| Due to joint ventures | | | – | | | 192 | |
| | |
|
| |
|
| |
| Due to associates | | | 214 | | | 29 | |
| | |
|
| |
|
| |
240
Back to Contents
HSBC HOLDINGS PLC
| The composition of deposits by banks on a geographical basis is set out below: |
| | | 2002 | | 2001 | |
| | |
| |
| |
| | | | Interest-bearing | | | Non
interest-bearing | | | Total | | | Interest-bearing | | | Non
interest-bearing | | | Total | |
| | |
|
| |
|
| |
|
| |
|
| |
|
| |
|
| |
| | | | US$m | | | US$m | | | US$m | | | US$m | | | US$m | | | US$m | |
| Europe | | | 29,741 | | | 4,818 | | | 34,559 | | | 32,998 | | | 3,910 | | | 36,908 | |
| Hong Kong | | | 1,741 | | | 638 | | | 2,379 | | | 2,876 | | | 395 | | | 3,271 | |
| Rest of Asia-Pacific | | | 4,674 | | | 688 | | | 5,362 | | | 3,640 | | | 370 | | | 4,010 | |
| North America | | | 9,174 | | | 798 | | | 9,972 | | | 6,975 | | | 1,139 | | | 8,114 | |
| South America* | | | 655 | | | 6 | | | 661 | | | 1,311 | | | 26 | | | 1,337 | |
| | |
|
| |
|
| |
|
| |
|
| |
|
| |
|
| |
| | | | 45,985 | | | 6,948 | | | 52,933 | | | 47,800 | | | 5,840 | | | 53,640 | |
| | |
|
| |
|
| |
|
| |
|
| |
|
| |
|
| |
| | | | | | | | | | | | | | | | | | | | |
| * | Formerly described as Latin America, which included Group entities in Panama and Mexico, which are now included in North America. Figures for 2001 have been restated to reflect this change. |
| | |
| The geographical analysis of deposits is based on the location of the office in which the deposits are recorded and excludes balances with HSBC companies. |
| | | | 2002 | | | 2001 | |
| | | | US$m | | | US$m | |
| Repayable on demand | | | 256,723 | | | 209,634 | |
| With agreed maturity dates or periods of notice, by remaining maturity: | | | | | | | |
| – 3 months or less but not repayable on demand | | | 202,578 | | | 205,231 | |
| – 1 year or less but over 3 months | | | 25,793 | | | 26,591 | |
| – 5 years or less but over 1 year | | | 9,216 | | | 7,519 | |
| – over 5 years | | | 1,128 | | | 1,016 | |
| | |
|
| |
|
| |
| | | | 495,438 | | | 449,991 | |
| | |
|
| |
|
| |
| Amounts include: | | | | | | | |
| Due to joint ventures | | | 421 | | | 333 | |
| | |
|
| |
|
| |
| Due to associates | | | 25 | | | 19 | |
| | |
|
| |
|
| |
The composition of customer accounts on a geographical basis is set out below:
| | | 2002 | | 2001 | |
| | |
| |
| |
| | | | Interest-bearing | | | Non
interest-bearing | | | Total | | | Interest-bearing | | | Non
interest-bearing | | | Total | |
| | |
|
| |
|
| |
|
| |
|
| |
|
| |
|
| |
| | | | US$m | | | US$m | | | US$m | | | US$m | | | US$m | | | US$m | |
| Europe | | | 169,945 | | | 27,417 | | | 197,362 | | | 141,802 | | | 27,569 | | | 169,371 | |
| Hong Kong | | | 141,267 | | | 7,637 | | | 148,904 | | | 140,097 | | | 6,447 | | | 146,544 | |
| Rest of Asia-Pacific | | | 48,390 | | | 5,782 | | | 54,172 | | | 40,904 | | | 4,594 | | | 45,498 | |
| North America | | | 75,951 | | | 14,186 | | | 90,137 | | | 63,911 | | | 17,144 | | | 81,055 | |
| South America* | | | 3,745 | | | 1,118 | | | 4,863 | | | 6,048 | | | 1,475 | | | 7,523 | |
| | |
|
| |
|
| |
|
| |
|
| |
|
| |
|
| |
| | | | 439,298 | | | 56,140 | | | 495,438 | | | 392,762 | | | 57,229 | | | 449,991 | |
| | |
|
| |
|
| |
|
| |
|
| |
|
| |
|
| |
| | | | | | | | | | | | | | | | | | | | |
| * | Formerly described as Latin America, which included Group entities in Panama and Mexico, which are now included in North America. Figures for 2001 have been restated to reflect this change. |
| | |
| The geographical analysis of deposits is based on the location of the office in which the deposits are recorded and excludes balances with HSBC companies. |
241
Back to Contents
HSBC HOLDINGS PLC
Notes on the Financial Statements (continued) |
| | | | | | | | |
| | | | 2002 | | | 2001 | |
| | | | US$m | | | US$m | |
| Bonds and medium-term notes, by remaining maturity: | | | | | | | |
| – within 1 year | | | 2,775 | | | 2,351 | |
| – between 1 and 2 years | | | 379 | | | 2,179 | |
| – between 2 and 5 years | | | 4,857 | | | 2,511 | |
| – over 5 years | | | 846 | | | 740 | |
| | |
|
| |
|
| |
| | | | 8,857 | | | 7,781 | |
| Other debt securities in issue, by remaining maturity: | | | | | | | |
| – 3 months or less | | | 14,966 | | | 10,437 | |
| – 1 year or less but over 3 months | | | 3,833 | | | 3,103 | |
| – 5 years or less but over 1 year | | | 6,466 | | | 4,810 | |
| – over 5 years | | | 843 | | | 967 | |
| | |
|
| |
|
| |
| | | | 34,965 | | | 27,098 | |
| | |
|
| |
|
| |
|
| | | | 2002 | | | 2001 | |
| | | | US$m | | | US$m | |
| Short positions in securities: | | | | | | | |
| Treasury bills and other eligible bills | | | 1,270 | | | 1,613 | |
| Debt securities: | | | | | | | |
| – government securities | | | 17,141 | | | 25,250 | |
| – other public sector securities | | | 89 | | | 235 | |
| – other debt securities | | | 2,336 | | | 2,352 | |
| Equity shares | | | 1,470 | | | 2,487 | |
| | |
|
| |
|
| |
| | | | 22,306 | | | 31,937 | |
| Liabilities, including losses, resulting from off-balance-sheet interest rate, exchange rate and equities contracts which are marked-to-market | | | 22,306 | | | 15,399 | |
| Current taxation | | | 1,463 | | | 1,172 | |
| Obligations under finance leases | | | 346 | | | 354 | |
| Dividend payable by HSBC Holdings | | | 3,069 | | | 2,700 | |
| Long-term assurance liabilities attributable to policyholders (Note 27) | | | 10,356 | | | 9,712 | |
| Other liabilities | | | 12,244 | | | 11,349 | |
| | |
|
| |
|
| |
| | | | 72,090 | | | 72,623 | |
| | |
|
| |
|
| |
| Obligations under finance leases fall due as follows: | | | | | | | |
| – within 1 year | | | 42 | | | 58 | |
| – between 1 and 5 years | | | 22 | | | 53 | |
| – over 5 years | | | 282 | | | 243 | |
| | |
|
| |
|
| |
| | | | 346 | | | 354 | |
| | |
|
| |
|
| |
| | | | | | | | |
| | | | 2002 | | | 2001 | |
| | | | US$m | | | US$m | |
| Short positions in debt securities are in respect of securities: | | | | | | | |
| – due within 1 year | | | 1,890 | | | 997 | |
| – due 1 year and over | | | 17,676 | | | 26,840 | |
| | |
|
| |
|
| |
| | | | 19,566 | | | 27,837 | |
| | |
|
| |
|
| |
| – listed | | | 12,121 | | | 22,728 | |
| – unlisted | | | 7,445 | | | 5,109 | |
| | |
|
| |
|
| |
| | | | 19,566 | | | 27,837 | |
| | |
|
| |
|
| |
242
Back to Contents
HSBC HOLDINGS PLC
| 32 | Provisions for liabilities and charges |
| | | | | | | | |
| | | | HSBC | | | HSBC Holdings | |
| | | | US$m | | | US$m | |
| At 1 January 2002 | | | (58 | ) | | 98 | |
| Charge/(release) to profit and loss account (Note 8) | | | 622 | | | (5 | ) |
| Movements arising from acquisitions and disposals | | | (575 | ) | | – | |
| Exchange and other movements | | | 30 | | | – | |
| | |
|
| |
|
| |
At 31 December 2002 | | | 19 | | | 93 | |
| | |
|
| |
|
| |
| | | | | | |
| | | HSBC | | HSBC Holdings | |
| | |
| |
| |
| | | | 2002 | | | 2001* | | | 2002 | | | 2001* | |
| | | | US$m | | | US$m | | | US$m | | | US$m | |
| Included in ‘Provisions for liabilities and charges’ | | | 1,154 | | | 1,057 | | | 93 | | | 98 | |
| Included in ‘Other assets’ (Note 27) | | | (1,135 | ) | | (1,115 | ) | | – | | | – | |
| | |
|
| |
|
| |
|
| |
|
| |
| Net deferred taxation provision | | | 19 | | | (58 | ) | | 93 | | | 98 | |
| | |
|
| |
|
| |
|
| |
|
| |
| Comprising: | | | | | | | | | | | | | |
| Accelerated capital allowances | | | 115 | | | 138 | | | – | | | – | |
| Timing differences on lease income | | | 1,243 | | | 1,010 | | | – | | | – | |
| Provision for bad and doubtful debts | | | (1,192 | ) | | (724 | ) | | – | | | – | |
| Relief for losses brought forward | | | (179 | ) | | (164 | ) | | – | | | – | |
| Provision for Princeton Note settlement | | | – | | | (221 | ) | | – | | | – | |
| Other short term timing differences | | | 32 | | | (97 | ) | | 93 | | | 98 | |
| | |
|
| |
|
| |
|
| |
|
| |
| | | | 19 | | | (58 | ) | | 93 | | | 98 | |
| | |
|
| |
|
| |
|
| |
|
| |
| * Figures for 2001 have been restated to reflect the adoption of UK Financial Reporting Standard 19 ‘Deferred Tax’, details of which are set out in Note 1 on the Financial Statements on pages 195 to 197. |
| |
| There is no material deferred taxation liability not provided for. |
| |
(i) | At 31 December 2002, there were potential future tax benefits of approximately US$885 million (2001: US$906 million) in respect of trading losses, allowable expenditure charged to the profit and loss account but not yet allowed for tax and capital losses which have not been recognised because recoverability of the potential benefits is not considered likely. |
243
Back to Contents
HSBC HOLDINGS PLC
Notes on the Financial Statements (continued) |
|
|
| |
(b) Other provisions for liabilities and charges |
| | | | Provisions for pension and other post-retirement obligations | | | Provisions for contingent liabilities and commitments | | | Insurance provisions | | | Other provisions | | | Total | |
| | |
|
| |
|
| |
|
| |
|
| |
|
| |
| | | | US$m | | | US$m | | | US$m | | | US$m | | | US$m | |
| At 1 January 2002 | | | 928 | | | 1,164 | | | 1,185 | | | 606 | | | 3,883 | |
| Additional provisions/increase in provisions* | | | 127 | | | 39 | | | 563 | | | 150 | | | 879 | |
| Acquisition of subsidiaries | | | 79 | | | 22 | | | – | | | 89 | | | 190 | |
| Provisions utilised | | | (91 | ) | | (850 | ) | | (239 | ) | | (151 | ) | | (1,331 | ) |
| Exchange and other movements | | | (5 | ) | | 199 | | | (97 | ) | | (35 | ) | | 62 | |
| | |
|
| |
|
| |
|
| |
|
| |
|
| |
At 31 December 2002 | | | 1,038 | | | 574 | | | 1,412 | | | 659 | | | 3,683 | |
| | |
|
| |
|
| |
|
| |
|
| |
|
| |
| * | The increase in ‘other provisions’ includes unwinding of discounts of US$7 million (2001: US$5 million) in relation to vacant space provisions and US$5 million (2001: US$1 million) in relation to Brazilian labour claims provisions. |
| | | |
| Included within ‘Provisions for contingent liabilities and commitments’ are provisions for the costs of possible redress relating to the sales of certain personal pension plans of US$35 million (2001: US$64 million). This is the result of an actuarial calculation extrapolated from a sample of cases and the timing of the expenditure depends on settlement of the individual claims. This caption also includes US$17 million in connection with the Princeton Notes matter (2001: US$665 million). On 10 January 2002, US$569 million was paid out as settlement in connection with this matter. |
| |
| Included within ‘Other provisions’ are: |
| |
| (i) | Provisions for onerous property contracts of US$189 million (2001: US$144 million), of which US$110 million (2001: US$127 million) relates to discounted future costs associated with leasehold properties that became vacant as a consequence of HSBC’s move to Canary Wharf in 2002. The provisions cover rent voids whilst finding new tenants, shortfalls in expected rent receivable compared to rent payable and costs of refurbishing the building to attract tenants. Uncertainties relate to movements in market rents, the delay in finding new tenants and the timing of rental reviews. |
| |
| (ii) | Labour, civil and fiscal litigation provisions in HSBC Bank Brasil S.A.- Banco Múltiplo of US$135 million (2001: US$230 million). This relates to labour and overtime litigation claims brought by employees after leaving the bank. The provision is based on the expected number of departing employees, their individual salaries and historical trends. Timing of settlement of these potential claims is uncertain. |
244
Back to Contents
HSBC HOLDINGS PLC
| 33 | Subordinated liabilities |
|
|
|
|
|
|
|
|
| | | | | | | | |
| | | | 2002 | | | 2001 | |
| | | | US$m | | | US$m | |
| Undated subordinated loan capital: | | | | | | | |
| – HSBC Holdings | | | – | | | – | |
| – Other HSBC | | | 3,540 | | | 3,479 | |
| | |
|
| |
|
| |
| | | | 3,540 | | | 3,479 | |
| | |
|
| |
|
| |
| Dated subordinated loan capital: | | | | | | | |
| – HSBC Holdings | | | 5,790 | | | 2,820 | |
| – Other HSBC | | | 9,041 | | | 9,181 | |
| | |
|
| |
|
| |
| | | | 14,831 | | | 12,001 | |
| | |
|
| |
|
| |
| Total subordinated liabilities: | | | | | | | |
| – HSBC Holdings | | | 5,790 | | | 2,820 | |
| – Other HSBC | | | 12,581 | | | 12,660 | |
| | |
|
| |
|
| |
| | | | 18,371 | | | 15,480 | |
| | |
|
| |
|
| |
| Dated subordinated loan capital is repayable: | | | | | | | |
| – within 1 year | | | 956 | | | 1,393 | |
| – between 1 and 2 years | | | 862 | | | 950 | |
| – between 2 and 5 years | | | 1,957 | | | 2,165 | |
| – over 5 years | | | 11,056 | | | 7,493 | |
| | |
|
| |
|
| |
| | | | 14,831 | | | 12,001 | |
| | |
|
| |
|
| |
245
Back to Contents
HSBC HOLDINGS PLC
Notes on the Financial Statements (continued) |
|
|
| The total subordinated borrowings of HSBC Holdings are as follows: |
| | | | | | | | | |
| | | | | 2002 | | | 2001 | |
| | | | | US$m | | | US$m | |
| Amounts owed to third parties: amounts falling due after more than 1 year: | | | | | | | |
| US$1,400m | 5.25% subordinated notes 2012 | | | 1,394 | | | – | |
| €1,000m | 5.375% subordinated notes 2012 | | | 1,045 | | | – | |
| £650m | 5.75% subordinated notes 2027 | | | 1,041 | | | – | |
| US$1,000m | 7.5% subordinated notes 2009 | | | 999 | | | 999 | |
| £250m | 9.875% subordinated bonds 20181 | | | 397 | | | 357 | |
| US$350m | Subordinated step-up coupon floating rate notes 20102 | | | 349 | | | 349 | |
| €300m | 5.5% subordinated notes 2009 | | | 315 | | | 266 | |
| US$250m | Subordinated collared floating rate notes 20083 | | | 250 | | | 250 | |
| | | |
|
| |
|
| |
| | | | | 5,790 | | | 2,221 | |
| | | |
|
| |
|
| |
| Amounts owed to third parties: amounts falling due within 1 year | | | | | | | |
| £413m | 11.69% subordinated bonds 2002 | | | – | | | 599 | |
| | | |
|
| |
|
| |
| | | | | 5,790 | | | 2,820 | |
| | |
|
| |
|
| |
| Amounts owed to HSBC undertakings: | | | | | | | |
| US$1,350m | 9.547% subordinated step-up cumulative notes 2040 – | | | | | | | |
| | HSBC Capital Funding (Dollar 1) LP | | | 1,350 | | | 1,350 | |
| US$900m | 10.176% subordinated step-up cumulative notes 2040 – | | | | | | | |
| | HSBC Capital Funding (Dollar 1) LP | | | 900 | | | 900 | |
| £500m | 8.208% subordinated step-up cumulative notes 2040 – | | | | | | | |
| | HSBC Capital Funding (Sterling 1) LP | | | 806 | | | 725 | |
| €600m | 8.03% subordinated step-up cumulative notes 2040 – | | | | | | | |
| | HSBC Capital Funding (Euro 1) LP. | | | 630 | | | 531 | |
| US$350m | 7.525% subordinated loan 2003 – HSBC Finance Nederland B.V. | | | 350 | | | 350 | |
| | | |
|
| |
|
| |
| | | | | 4,036 | | | 3,856 | |
| | | |
|
| |
|
| |
| | | | | 9,826 | | | 6,676 | |
| | | |
|
| |
|
| |
| | HSBC Holdings’ dated subordinated loan capital is repayable: | | | | | | | |
| | – within 1 year | | | 350 | | | 599 | |
| | – between 1 and 2 years | | | – | | | 350 | |
| | – between 2 and 5 years | | | – | | | – | |
| | – over 5 years | | | 9,476 | | | 5,727 | |
| | | |
|
| |
|
| |
| | | | | 9,826 | | | 6,676 | |
| | | |
|
| |
|
| |
| 1 | The interest rate on the 9.875 per cent subordinated bonds 2018 changes in April 2013 to become the higher of i) 9.875 per cent or ii) the sum of the yield on the relevant benchmark treasury stock plus 2.5 per cent. The bonds may be redeemed in April 2013 at par and redemption has also been allowed from April 1998, subject to the prior consent of the Financial Services Authority, for an amount based on the redemption yields of the relevant benchmark treasury stocks. |
| | |
| 2 | The interest margin on the Subordinated Step-up coupon floating rate notes 2010 increases by 0.5 per cent from April 2005. The notes are repayable from their step up date at the option of the borrower, subject to the prior consent of the Financial Services Authority. |
| | |
| 3 | The interest payable ceases to be collared from November 2003 and becomes payable at a floating rate plus margin. The notes are repayable in November 2003 at the option of the borrower, subject to the prior consent of the Financial Services Authority. |
246
Back to Contents
HSBC HOLDINGS PLC
At 31 December 2002, the other HSBC subordinated borrowings were as follows:
| | | | 2002 | | | 2001 | |
| | | | US$m | | | US$m | |
| US$1,200m | Primary capital subordinated undated floating rate notes | | 1,200 | | | 1,200 | |
| US$750m | Undated floating rate primary capital notes | | 750 | | | 750 | |
| £350m | Callable subordinated variable coupon notes 20171 | | 564 | | | – | |
| US$500m | Undated floating rate primary capital notes | | 500 | | | 500 | |
| US$500m | 7.625% subordinated notes 2006 | | 500 | | | 500 | |
| £300m | 6.5% subordinated notes 2023 | | 480 | | | 432 | |
| US$400m | 8.625% subordinated notes 2004 | | 399 | | | 400 | |
| HK$3,000m | Subordinated collared (7% to 9%) floating rate notes 2003 | | 385 | | | 385 | |
| US$375m | Subordinated step-up coupon floating rate notes 20092 | | 374 | | | 375 | |
| US$350m | 7.4% subordinated guaranteed notes 2003 | | 350 | | | 350 | |
| £225m | 6.25% subordinated notes 2041 | | 360 | | | 323 | |
| US$300m | Undated floating rate primary capital notes (Series 3) | | 300 | | | 300 | |
| US$300m | 6.95% subordinated notes 2011 | | 300 | | | 300 | |
| US$300m | 7.65% subordinated notes 20253 | | 299 | | | 300 | |
| US$300m | 7% subordinated notes 2006 | | 299 | | | 299 | |
| £200m | 9% subordinated notes 2005 | | 322 | | | 290 | |
| US$250m | 7.25% subordinated notes 2002 | | – | | | 250 | |
| US$250m | 5.875% subordinated notes 2008 | | 230 | | | 226 | |
| £150m | 9.25% step-up undated subordinated notes4 | | 242 | | | 217 | |
| £150m | 8.625% step-up undated subordinated notes5 | | 242 | | | 217 | |
| £150m | Subordinated step-up coupon floating rate notes 2007 | | – | | | 217 | |
| US$250m | 7.20% subordinated debentures 2097 | | 215 | | | 215 | |
| BRL472m | Subordinated debentures 2008 | | 134 | | | 204 | |
| US$200m | 6.625% subordinated notes 2009 | | 200 | | | 200 | |
| US$200m | 7.808% capital securities 2026 | | 200 | | | 200 | |
| US$200m | 8.38% capital securities 2027 | | 200 | | | 200 | |
| JP¥24,800m | Fixed rate (5.0% to 5.5%) Subordinated Loans 2004 | | 209 | | | 189 | |
| | |
|
| |
|
| |
| Other subordinated liabilities less than US$200m | | 3,327 | | | 3,621 | |
| |
|
| |
|
| |
| | | 12,581 | | | 12,660 | |
| |
|
| |
|
| |
| | |
| 1 | The interest on the Callable subordinated variable coupon notes is fixed at 5.75 per cent until June 2012. Thereafter, the rate per annum is the sum of the gross redemption yield of the then prevailing five-year UK gilt plus 1.70 per cent. The notes are repayable at the option of the borrower in June 2012, subject to the prior consent of the Financial Services Authority. |
| | |
| 2 | The interest margin on the Subordinated Step-up coupon floating rate notes 2009 increases by 0.5 per cent five years prior to its maturity date. The notes are then repayable at the option of the borrower, subject to the prior consent of the Financial Services Authority. |
| | |
| 3 | The 7.65 per cent Subordinated notes are repayable at the option of each of the holders in May 2007. |
| | |
| 4 | The interest rate on the 9.25 per cent Step-up undated subordinated notes changes in December 2006 to become, for each successive five year period, the rate per annum which is the sum of the yield on the then five year benchmark UK gilt plus 2.15 per cent. The notes are then repayable at the option of the borrower, subject to the prior consent of the Financial Services Authority. |
| | |
| 5 | The interest rate on the 8.625 per cent Step-up undated subordinated notes changes in December 2007 to become, for each successive five year period, the rate per annum which is the sum of the yield on the then five year benchmark UK gilt plus 1.87 per cent. The notes are then repayable at the option of the borrower, subject to the prior consent of the Financial Services Authority. |
| |
| Subordinated loan capital is repayable at par on maturity, but some is repayable prior to maturity at the option of the borrower, generally with the consent of the Financial Services Authority, in certain cases at a premium over par. Interest rates on the floating rate loan capital are related to interbank offered rates. On the remaining subordinated loan capital, interest is payable at fixed rates up to 9.875%. |
247
Back to Contents
HSBC HOLDINGS PLC
Notes on the Financial Statements (continued) |
|
|
| | |
| 34 | Minority interests – non-equity |
|
|
| Preference shares issued by subsidiaries: |
| | | | 2002 | | 2001 | |
| | | | US$m | | US$m | |
| US$1,350m | 9.547% Non-cumulative Step-up Perpetual Preferred Securities, Series 1 | | 1,335 | | 1,337 | |
| US$900m | 10.176% Non-cumulative Step-up Perpetual Preferred Securities, Series 2 | | 889 | | 891 | |
| £500m | 8.208% Non-cumulative Step-up Perpetual Preferred Securities | | 801 | | 717 | |
| €600m | 8.03% Non-cumulative Step-up Perpetual Preferred Securities | | 622 | | 526 | |
| US$1m | Non-cumulative preference shares1 | | – | | 50 | |
| US$150m | Depositary shares each representing 25% interest in a share of adjustable rate cumulative preferred stock, Series D2 | | 150 | | 150 | |
| US$150m | Cumulative preferred stock3 | | 150 | | 150 | |
| US$125m | Dutch auction rate transferable securities preferred stock, Series A and B4 | | 125 | | 125 | |
| US$125m | 7.20% Series A cumulative preference shares5 | | 125 | | 125 | |
| CAD125m | Non-cumulative redeemable class 1 preferred shares, Series A | | 78 | | 77 | |
| €77m | 6.35% Series B cumulative preference shares | | 81 | | 68 | |
| US$75m | Cumulative preferred stock | | 75 | | 75 | |
| | | |
| |
| |
| | | | 4,431 | | 4,291 | |
| | | |
| |
| |
| | |
| 1 | HSBC Bank plc redeemed in full its preference shares at an aggregate amount of US$50 million during 2002. |
| | |
| 2 | The preferred stock is redeemable, at the option of HSBC USA Inc., in whole or in part on or after 1 July 1999 at par. |
| | |
| 3 | The preferred stock is redeemable at the option of HSBC USA Inc., in whole or in part, at any time on or after 1 October 2007 at par. |
| | |
| 4 | The preferred stock of each series is redeemable at the option of HSBC USA Inc., in whole or in part, on any dividend payment date at par. |
| | |
| 5 | The preference shares are redeemable at the option of HSBC Republic Holdings (Luxembourg) S.A., in whole but not in part, on any dividend date falling on or after 30 April 2003 at an aggregate amount of US$125 million. |
| | |
| The redemption of all preference shares is subject to the prior consent of the FSA and the relevant local banking regulator. |
| | |
Step-up Perpetual Preferred Securities |
| |
| The four issues of Non-cumulative Step-up Perpetual Preferred Securities were issued by Jersey limited partnerships and are guaranteed, on a subordinated basis, by HSBC Holdings. The proceeds of the issues were on-lent to HSBC Holdings by the limited partnerships by issue of subordinated notes. The Preferred Securities qualify as innovative tier 1 capital for HSBC. The Preferred Securities, together with the guarantee, are intended to provide investors with rights to income and capital distributions and distributions upon liquidation of HSBC Holdings that are equivalent to the rights they would have had if they had purchased non- cumulative perpetual preference shares of HSBC Holdings. |
| |
| The Preferred Securities are perpetual, but redeemable in 2010, 2030, 2015 and 2012, respectively, at the option of the general partners of the limited partnerships. If not redeemed the distributions payable step-up and become floating rate. There are limitations on the payment of distributions if prohibited under UK banking regulations or other requirements, if a payment would cause a breach of HSBC’s capital adequacy requirements, or if HSBC Holdings has insufficient distributable reserves (as defined). |
| |
| HSBC Holdings has covenanted that if it has been prevented under certain circumstances from paying distributions on the Preferred Securities in full, it will not pay dividends or other distributions in respect of its ordinary shares, or effect repurchase or redemption of its ordinary shares, until after a distribution has been paid in full. |
248
Back to Contents
HSBC HOLDINGS PLC
| If i) HSBC’s total capital ratio falls below the regulatory minimum ratio required, or ii) in view of the deteriorating financial condition of HSBC Holdings, the Directors expect i) to occur in the near term, then the Preferred Securities will be substituted by Preference Shares of HSBC Holdings having economic terms which are in all material respects equivalent to those of the Preferred Securities and the guarantee taken together. |