S&P500 was up about 9 per cent from the beginning of the year.Over approximately the same period, the value of the US dollar fell, reaching US$1.36 to the euro by the end of December.
InCanada, annualised GDP growth slowed to 2.7 per cent in the first quarter of 2004 from 3.3 per cent in the final quarter of 2003, largely because of a fall in stockbuilding. Consumer spending and investment growth began the year strongly. However, the Bank of Canada (‘BoC’) cut interest rates three times in the first half of 2004 in response to low inflation and currency appreciation. With the global economy recovering and Canadian GDP growth having rebounded to 3.9 per cent in the second quarter, the BoC started to reverse its policy, raising rates by 25 basis points in both September and October. Growth remained robust in the second half of the year with consumer spending accelerating. Import growth was significant, partly reflecting a very large build-up of inventory in the third quarter, much of it related to the auto sector. Although inflation picked up a little, the BoC kept rates on hold in November and December, because of concerns about the impact of a stronger Canadian dollar. This left the overnight rate at 2.5 per cent, still below the rate at which it started the year.
Mexico’s macro-economic fundamentals remained strong in 2004, with year-on-year GDP growth of 4.4 per cent in line with that of the US. At year-end, the fiscal accounts were showing relatively low deficits helped by the windfall of high oil prices. Driven by oil receipts and an unprecedented level of workers´ remittances, the current account deficit shrank to a figure below the level of reinvested earnings from existing foreign direct investment. Inflation increased from 4.0 per cent at the end of 2003 to 5.2 per cent in 2004, as a result of increases in external energy and food prices, but remained manageable. HSBC anticipates that inflation will be reduced in 2005 due to a restrictive monetary policy, and that moderate to strong GDP growth will continue with a mildly appreciating currency.
On 1 July 2004, HSBC Bank USA, Inc. consolidated its banking operations under a single national charter, following approval from the Office of Comptroller of Currency. This enabled the newly formed HSBC Bank USA to serve its customers more efficiently and effectively across the US and provide an expanded range of products. It also put HSBC Bank USA on the same footing as other major US banks.
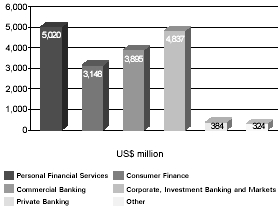
HSBC’s operations in North America reported a pre-tax profit of US$5,419 million, compared with US$3,613 million in 2003. Excluding goodwill
amortisation, pre-tax profit was US$6,180 million, compared with US$4,257 million in 2003, and represented 32 per cent of HSBC’s total pre-tax profit on this basis.
Within these figures HSBC Finance reported a pre-tax profit, before goodwill amortisation, of US$3,576 million in 2004, an increase of US$1,524 million, of which US$1,084 million was an additional quarter’s contribution. Profit was 21 per cent higher than for the comparable period in the prior year.
Bank of Bermuda, acquired in February 2004, contributed US$73 million to pre-tax profit, before goodwill amortisation, in the North American segment.
At constant exchange rates, and on an underlying basis, HSBC’s pre-tax profit, before goodwill amortisation, was 17 per cent higher than in 2003.
The detailed customer group commentary that follows is based on constant exchange rates.
Excluding Consumer Finance,Personal Financial Services generated a pre-tax profit, before goodwill amortisation, of US$1,164 million, 35 per cent higher than in 2003. Approximately 22 per cent of this growth arose from the acquisition of Bank of Bermuda and certain insurance interests in Mexico.
Growth in net interest income was 19 per cent. This was driven mainly by a 34 per cent increase in Mexico, where growth in low cost deposits and consumer loans, and higher interest income from the insurance business, contributed to the rise. Acquisitions in Mexico accounted for 17 per cent of the overall improvement. HSBC attracted 359,000 net new deposit customers in Mexico during the year, and this contributed to the US$1.6 billion rise in average deposit balances. Despite an increasingly competitive marketplace, market share in deposits rose to 14.4 per cent, driven by the bank’s extensive branch and ATM network. Consumer loan growth was robust in the second half of the year, particularly in pre-approved payroll loans offered through the ATM network, and residential mortgages.
Net interest income in the US grew by 10 per cent, reflecting a US$10.9 billion, or 58 per cent, increase in average residential mortgage balances and the widening of spreads on savings and deposits, as interest rates rose. Sales of residential mortgages remained strong following an expansion of the sales force and the development of the correspondent network, competitive pricing and increased marketing. In 2004, customers generally favoured variable rate products over fixed. Several new
Back to Contents
H S B C H O L D I N G S P L C
Financial Review(continued)
products, including a range of adjustable rate mortgages, were launched during the year contributing to an overall increase in gross new lending of 3 per cent to US$32.6 billion. The income benefit of this growth, however, was partly offset by pressure on spreads. Competitive pricing in a contracting market forced a general downward trend in mortgage yields in 2004 compared with the levels seen in 2003.
Other operating income rose by US$164 million or 20 per cent to US$979 million, of which US$82 million came from acquisitions. Growth was largely attributable to the strong performance in Mexico, where expansion of the pension funds business, acquired in the last quarter of 2003, complemented higher fee income from credit cards, deposit-related services and international remittances. Sales of pension and bancassurance products grew strongly, attracting some 270,000 new customers, following an expansion of the sales force. An enhanced customer relationship management system and the employment of WHIRL helped the number of credit cards in circulation in Mexico to rise by 29 per cent to 568,000. Fee income from credit cards rose by 20 per cent compared with 2003. Operations in Canada benefited from a rise in retail broking volumes, as market activity revived. In the US, a revised fee structure and improved collection processes produced a 9 per cent increase in fee income from cards and deposit-related services.
The US mortgage banking business contributed a pre-tax profit of US$270 million, in line with 2003, despite a fall in other operating income. Lower origination and sales-related income in the secondary market was only partly offset by a reduction in net servicing expenses. There was a net loss of US$4 million from sale of mortgage loans in 2004 compared with a net gain of US$117 million in 2003. This was mainly driven by lower gains on sales of mortgages, as narrower spreads combined with a fall in the volume of loans originated for sale. As interest rates increased in 2004 from the historically low levels experienced in 2003, prepayments of residential mortgages, mostly in the form of loan refinancing, reduced significantly and residential mortgages originated for sale declined by 64 per cent compared with 2003, despite an overall increase in mortgage lending. Loan refinancing activity represented 50 per cent of the total loan originations, compared with 74 per cent in 2003. Pricing also fell from the unusually high levels seen in 2003 and, as a result, HSBC earned lower returns on loans sold.
The net cost of servicing mortgages fell, improved primarily as a result of lower amortisation
expenses on mortgage servicing rights (‘MSR’) and increased income associated with the derivatives used to offset the changes in the economic value of the MSRs. The reduction in amortisation expenses was also partly affected by lower MSR balances in 2004. The cost reduction was partly offset by higher temporary impairment reserves.
Operating expenses, excluding goodwill amortisation, were 16 per cent higher than in 2003. This was due mainly to a 15 per cent increase in costs in Mexico, where the expansion of the pension funds business and the inclusion of the insurance business acquired in the last quarter of 2003 contributed to generally higher salaries and performance-related bonuses. Staff numbers increased in the Mexican branch network to support growth in business volumes, improve customer service, and support the rollout of HSBCPremier. The introduction of the WHIRL credit card system in Mexico and the US, at a cost of US$23 million, was completed by the end of October. In the US, expansion in the mortgage sales force and higher performance-related bonuses led to higher staff costs, while the launch of advertising campaigns for mortgages and deposits added to marketing costs. Additional staff were recruited in the branch network to support business expansion and to improve customer service. Costs in Canada increased by 4 per cent, principally due to higher performance-related staff costs in the brokerage business and restructuring expenses arising from the integration of Intesa Bank Canada, acquired in May.
The net bad debts charge fell by 29 per cent to US$99 million. Recoveries of amounts previously written-off in Mexico more than offset the US$11 million increase in new specific provisions in the US, predominantly for the credit cards portfolio within HSBC Bank USA. There was also a US$28 million release of general provisions in Mexico following a review of historical loss experience, reflecting a general improvement in the credit quality of consumer loan portfolios, and the improved market environment.
Consumer Finance contributed a pre-tax profit, before goodwill amortisation, of US$3,576 million in 2004, an increase of US$1,508 million of which US$1,097 million was an additional quarter’s contribution. On an underlying basis, pre-tax profit, before goodwill amortisation, grew by 20 per cent to US$2,479 million.
The integration of HSBC Finance Corporation into HSBC continued to deliver funding benefits in line with those anticipated. Since December 2003, HSBC Finance Corporation has sold US$3.7 billion
96
Back to Contents
of residential mortgages and US$15.6 billion of its domestic private label assets to HSBC Bank USA, the latter in December 2004. Under various service level agreements, HSBC Finance Corporation will continue to maintain the related customer account relationships for the assets transferred. By the end of 2004, HSBC had provided a total of US$35.6 billion in direct and client funding to HSBC Finance Corporation, and cash savings realised in 2004 were in excess of US$400 million.
Following receipt of regulatory approval for the sale of the private label portfolio, and prior to the sale, HSBC Finance Corporation adopted charge-off and account management policies in accordance with the Uniform Retail Credit Classification and Account Management Policy issued by the Federal Financial Institutions Examination Council (‘FFIEC policies’), for its domestic private label, MasterCard and Visa credit card portfolios. The main effect of this was on the private label credit card portfolio, where the FFIEC policies resulted in accounts being charged-off earlier. Certain pools of accounts were already following FFIEC policies, and so their adoption improved conformity across all relevant portfolios. The FFIEC account management practices change the delinquency and roll rates applicable to these portfolios, and resulted in a one-off charge to pre-tax profit, before goodwill amortisation, of US$154 million, which is expected to be offset by future funding benefits in the region of US$47 million per annum.
Net interest income of US$10,541 million was US$2,690 million higher than in 2003, although on an underlying basis adjusting for the additional quarter in 2004, it was only marginally higher. Average customer loan balances increased by 11 per cent to US$120.6 billion. Lower funding costs gave HSBC Finance Corporation the opportunity to expand its prime and near-prime customer base, particularly in the mortgage business. Average mortgage balances grew by 23 per cent to US$54.1 billion. Some US$3.9 billion of gross new lending balances were originated from a single correspondent relationship, while balances of US$1.6 billion were originated following the launch in 2003 of the ‘Secured Plus’ mortgage product.
Organic growth of 16 per cent to US$9.6 billion in vehicle finance loans was primarily achieved through a network of 5,200 motor dealers, extensive alliance relationships and direct sales channels.
Loans in the MasterCardand Visa credit card portfolios grew by 3 per cent to US$18 billion, driven largely by growth in the sub-prime portfolio. Spreads widened reflecting the change in product
mix towards the sub-prime market. The private label business also achieved growth in average loan balances, 5 per cent higher than in 2003, through new and existing merchant agreements.
The benefit of strong growth in loan balances was reduced significantly by lower yields. A greater than normal run-off of older, higher-yielding loans, product expansion into near-prime customer segments, and competitive pricing pressures from excess capacity, particularly in the mortgage market, contributed to an overall decline in loan yields. The decline was only partly offset by increased pricing of variable-rate products in line with interest rate movements, and continued growth in sub-prime credit cards. Also, the adoption of the FFIEC policies reduced net interest income by US$57 million.
Other operating income rose by US$895 million, or 52 per cent, to US$2,602 million, largely reflecting the additional quarter’s income. On an underlying basis, and excluding the effect of adopting the FFIEC policies, the increase was 10 per cent, predominantly reflecting strong growth in fee income from credit cards, and increased revenue from sales of value added products.
Operating expenses, excluding goodwill amortisation, of US$4,470 million were 44 per cent higher than in 2003. On an underlying basis, operating expenses, excluding goodwill amortisation, increased by 10 per cent to US$3,422 million due mainly to increased staff costs and higher IT and marketing expenditure. Additional staff were recruited in the branch network and in the mortgage services business to support growth in volumes and to improve customer service. Increased business volumes also led to higher performance-related bonuses and higher IT costs. Marketing costs increased, largely due to changes in contractual obligations associated with the General Motors co-branded credit card portfolio, but were partly offset by lower account origination costs. Marketing expenses were also incurred in support of income growth initiatives in the sub-prime market. In September 2004, HSBC rebranded a number of its Consumer Finance businesses at a cost of US$8 million.
The charge for bad and doubtful debts rose by 17 per cent to US$5,136 million. On an underlying basis and excluding the effect of adopting the FFIEC policies, the charge fell by 12 per cent. This reflected a marked improvement in credit quality, driven by the economic upturn, improved origination, growth in the proportion of secured lending, improved
97
Back to Contents
H S B C H O L D I N G S P L C
FinancialReview(continued)
collections, and the move into prime and near-prime markets. Improvements in delinquency were seen across most products and in a number of key indicators, including early stage delinquency, charge-offs and year-on-year bankruptcy filings. The rate of improvement declined in the second half of the year reflecting seasonality, a slowdown in employment growth and rising energy prices.
Commercial Banking reported pre-tax profits, before amortisation of goodwill, of US$845 million for 2004, an improvement of 41 per cent over 2003.
Net interest income increased by 8 per cent, of which 3 per cent was attributable to the acquisition of Bank of Bermuda. Adjusting for the loss of net interest income following the disposal of the US equipment-leasing portfolio last year, underlying growth was 7 per cent.
In the US, the recruitment of 50 additional relationship managers, focusing on the SME market, contributed to a 12 per cent rise in lending balances and a 17 per cent increase in commercial deposits. Improved economic conditions and stronger consumer confidence also led to increased demand for credit, but spreads suffered in the competitive marketplace. Commercial real estate lending increased by 11 per cent, largely as a result of expansion into the US West Coast and Miami.
In Canada, net interest income increased by 16 per cent. Growth in lending reflected stronger demand for credit in the low interest rate environment, improved market conditions and additional income following the integration of Intesa Bank. In Mexico, competitors displaying a greater appetite for risk enabled HSBC to selectively reduce loan balances. This, together with the effect of lower interest rates on deposit spreads and a restructuring of prices, which emphasised fees at the expense of margin, led to an 11 per cent reduction in Mexican net interest income.
Other operating income was US$13 million or 3 per cent higher than in 2003. Excluding the disposal of the US factoring and equipment leasing businesses, which in 2003 contributed other operating income of US$109 million, the underlying growth was 25 per cent. The impact of acquisitions during 2004 was not material.
In Mexico, fees and commissions grew by US$10 million or 11 per cent. Fees earned from payments and cash management and electronic banking both increased. The Mexican authorities changed the tax regulations to require all companies to make tax payments via electronic banking channels from January 2004. HSBC seized the
opportunities presented by this change to increase both the number of clients using electronic banking, and the number of transactions and income per client. Earnings from new trade services products and increased loan fees (from the price restructuring) also contributed.
Operating expenses declined by 6 per cent compared with 2003 as a result of the disposal of the factoring and equipment leasing businesses in the US. Adjusting for this, there was a 3 per cent rise in expenses reflecting additional costs from the restructuring and integration of Intesa Bank, the inclusion of Bank of Bermuda, and the effect of increased transaction volumes and business flows between Mexico and the US.
The charge for bad and doubtful debts fell by 90 per cent to US$13 million, reflecting an improved economic environment and falling corporate default rates. In 2003, the charge included US$33 million in the US factoring and leasing businesses which were sold during that year.
Corporate, Investment Banking and Marketsreported pre-tax profit, before amortisation of goodwill, of US$750 million, 11 per cent lower than in 2003.
Net interest income was 11 per cent lower than in 2003, notwithstanding the first contribution from Bank of Bermuda, which added US$31 million, or 4 per cent to the total. In part this reflected the cost of funding trading strategies where the offsetting income arises within dealing revenues. The return on investments held for liquidity fell and the yield on loans dropped as re-financing reached record levels following the reductions in interest rates in the latter part of 2003 and early 2004. The lower interest rates resulted in large early redemptions of mortgage-backed securities. Reinvestment opportunities, however, failed to match the yields given up on these redemptions. In Canada, a combination of interest rate cuts in the early part of 2004 and lower corporate loan balances reduced net interest income. However, in Mexico, investment portfolios profited from having locked into higher long-term interest rate str uctures.
Other operating income improved by 15 per cent, of which 7 per cent was attributable to Bank of Bermuda, which improved its market share in funds administration following its acquisition. A 23 per cent increase in fees and commissions in the US was driven by increased underwriting fees from debt issues and syndication, coupled with higher deal execution revenues. Increased revenues from customers reflected improved client coverage. The growing use of electronic trading by clients resulted
98
Back to Contents
in increased commissions from futures transactions, while structured finance and HSBC Amanah benefited from higher transaction fees and new deals. In Global Transaction Banking, higher payment and cash management revenues reflected an increase in volumes. Dealing profits benefited from a reduced level of losses in respect of mortgage hedging activities transacted on behalf of other HSBC customer groups. These transactions resulted in an offsetting reduction in other income. Although credit spread volatility was relatively low, movements in individual corporate spreads, primarily in the industrials sector, adversely affected corporate bond trading revenues. Global Markets continued to benefit from the previous year’s expansion of derivatives capabilities and higher profits from improved marketing and delivery of structured solutions. Proprietary trading revenues increased, mainly through profits on long futures positions and foreign exchang e gains which arose from successful positioning against the weakening US dollar. Foreign exchange also benefited from a higher volume of customer transactions.
In Mexico, earnings from debt trading fell as interest rates rose during the year, while in Canada, higher fees from securities sales and corporate finance reflected improved market sentiment in local equity markets. Foreign exchange income in Canada grew by 10 per cent in response to the continued volatility of the Canadian and US dollars.
Operating expenses, before goodwill amortisation, of US$1,014 million rose by 31 per cent, of which 12 per cent related to costs in Bank of Bermuda. In New York, the significant expansion of the Corporate Investment Banking and Markets’ business resulted in an increase of some 300 in headcount and a corresponding rise in salary costs. Incentive compensation also rose, largely due to the costs of recruiting and retaining the high quality staff needed to deliver the business strategy. Key hires within the expanded complement included the establishment of a mergers and acquisitions and advisory group, and product teams to develop asset-backed and mortgage-backed securitisation and trading. Non-staff costs grew correspondingly and included investment in technology to support the new business streams and the related control environment.
A net release of provisions for bad and doubtful debts reflected a significant improvement in credit quality as corporate restructuring and refinancing was facilitated by the better economic conditions. This resulted in releases and recoveries across a number of sectors.
Private Banking contributed a pre-tax profit, before goodwill amortisation, of US$66 million, an increase of 6 per cent on the result achieved in 2003. Good progress was made in the integration of Bank of Bermuda’s Private Client Services business, which added an onshore banking capability in Bermuda, and complementary offshore and trust products and services to HSBC’s North American operations. In aggregate, Bank of Bermuda’s North American Private Banking operations added US$2 million to pre-tax profits, before goodwill amortisation, in 2004.
Net interest income increased by 37 per cent, due largely to balance sheet growth. Strong growth in customer loans, which were 50 per cent higher than in 2003, reflected the success of the insurance premium financing business, an expanded customer base, and growth in secured borrowing by clients to invest in higher-yielding assets or funds. The larger customer base resulted from an expansion of Private Banking’s geographical presence, and cross-referrals generated through the alignment of Private Banking’s operations with other customer groups. This contributed to an increase in average customer deposits.
Other operating income was 4 per cent below that achieved in 2003 but was 23 per cent lower excluding the Bank of Bermuda. The fall in other operating income was mainly driven by client anticipation of interest rate rises, which reduced demand for interest-rate-linked structured products, and sales of fixed interest bonds. WTAS increased revenue despite subdued demand for tax planning services. As a consequence of restrictions placed on the personal tax practices in the major accounting firms engaged in providing audit services, WTAS increased both its customer base and the number of fee-generating staff. Cross-referrals also grew.
Operating expenses, before goodwill amortisation and excluding Bank of Bermuda, were broadly flat compared with 2003. Savings were generated from the continuing alignment of international and domestic client servicing units and from operational efficiencies in WTAS.
The gain on disposal of investments and tangible fixed assets reflected the sale of seed capital holdings.
99
Back to Contents
H S B C H O L D I N G S P L C
Financial Review(continued)
Year ended 31 December 2003 compared with year ended 31 December 2002
Fuelled by fiscal stimuli and a further interest rate reduction, the US economy steadily gained momentum in 2003. GDP expanded at an annualised rate of 8.2 per cent in the third quarter, the strongest rate since 1984. A strong revival in profits growth boosted investment spending while consumer spending remained strong, supported by tax cuts, a buoyant housing market, and equity releases from refinancing mortgages at record low interest rates. By the end of the year there was some evidence of the long-awaited recovery in the labour market, with the economy adding jobs, albeit modestly. In June the Federal Reserve cut its Fed Funds rate by 25 basis points to 1 per cent. Subsequently, 10-year bond yields rose by 100 basis points from their mid-June low of 3.1 per cent. Equity markets recovered strongly following the end of the Iraq war: by the end of December the S&P 500 had risen by 39 per cent from its March low and was at its highest level since July 2002. This supported consumer confidence. However, with the US current account deficit continuing to deteriorate, the US dollar remained under downward pressure, falling to US$1.26 against the euro by the end of the year.
Canada’s central bank was the first of the G7 countries to embark on a policy of raising interest rates in 2003. In response to inflationary pressures in the early part of the year, overnight lending rates were raised on two occasions, by a total of 50 basis points. However, with the Canadian dollar strengthening against the US dollar, inflation worries easing, and concerns about subdued GDP growth, the Central Bank reversed the earlier interest rate rises to take the overnight rate back down to 2.75 per cent in September. Many of the reasons for the disappointing growth were temporary, such as SARS, BSE, forest fires and the Ontario power blackout, and their immediate impact abated. Consumer spending growth remained robust all year, but the ongoing impact of the strong Canadian dollar appeared set to continue, restraining export growth.
The Mexican economy continued to lag behind the US recovery, largely because, apart from technology, the US manufacturing sector remained subdued. However, the impact of stronger US growth is expected to benefit Mexico in the near term, boosting exports and growth. Meanwhile, political conflicts delayed the passage of critical reform legislation, threatening approval of the 2004 budget. This notwithstanding, a solid macroeconomic foundation had been established and was expected to be maintained.
On 28 March 2003, HSBC completed its acquisition of HSBC Finance Corporation for a consideration of US$14.8 billion, expanding significantly its existing North American business. The addition of HSBC Finance Corporation’s substantial consumer lending portfolio increased the proportion of HSBC’s assets in North America from 19 per cent to 28 per cent of the total Group.
The results of HSBC Finance Corporation’s consumer finance business for the period from 29 March to 31 December 2003 are tabulated separately under Consumer Finance in order to highlight their significance to HSBC’s overall performance in North America. HSBC’s results at the pre-tax level and before amortising goodwill also benefited from a US$534 million contribution from HSBC Mexico in its first full year. The integration of both HSBC Finance Corporation and HSBC Mexico progressed well, with synergy benefits and business opportunities generally meeting or exceeding expectations.
The following discussion of HSBC’s North American performance highlights the impact of the additions of HSBC Finance Corporation and HSBC Mexico. The phrase ‘on an underlying basis’ is used to describe performance excluding these acquisitions.
HSBC’s operations in North America contributed US$3,613 million to HSBC’s profit before tax, an increase of US$2,375 million, compared with 2002. Excluding goodwill amortisation, pre-tax profit was US$4,257 million, compared with US$1,384 million in 2002, which was equivalent to 30 per cent of HSBC’s total pre-tax profit on this basis. On an underlying basis, HSBC’s pre-tax profit, before goodwill amortisation, of US$1,672 million was US$320 million, or 24 per cent, higher than in 2002. Goodwill amortisation was US$644 million in 2003, compared with US$146 million last year, predominantly reflecting the acquisition of HSBC Finance Corporation and, to a lesser extent, HSBC Mexico.
The commentaries that follow are based on constant exchange rates.
Personal Financial Services, excluding Consumer Finance, generated pre-tax profit, before goodwill amortisation, of US$870 million in 2003, 40 per cent higher than last year. HSBC Mexico contributed US$350 million to pre-tax profit for the year. On an underlying basis, pre-tax profit, before goodwill amortisation, was 13 per cent lower than in 2002 mainly due to lower earnings from mortgage servicing and higher staff costs.
100
Back to Contents
Net interest income increased by 53 per cent to US$2,116 million mainly as a result of the inclusion of HSBC Mexico. The first full year’s result for HSBC Mexico was strong and ahead of expectations. Growth in Mexico from a relatively weak performance in 2002 reflected an improvement in net interest income driven by a greater level of low cost deposits and an expanding consumer loan portfolio. Interest spreads benefited from a change in asset mix, with over 25 per cent growth in higher yielding assets, including motor vehicle finance, credit cards and payroll loans.
On an underlying basis, growth in net interest income of 7 per cent was mainly driven by growth of US$2.5 billion in residential mortgage balances in the US and Canada. In both countries, the low interest rate environment proved attractive to new homebuyers and encouraged existing homeowners to refinance their mortgages. In the US, net interest income further benefited from improved spreads on mortgages and an improved mix of loans and savings deposits.
Other operating income of US$825 million was 62 per cent higher than in 2002. Operations in Mexico contributed US$461 million to other operating income in the year. Transaction volumes on core banking related products, such as credit cards, deposit-related services and ATMs, grew significantly. HSBC Mexico led the market with a 34 per cent share in domestic interbank ATM transactions across Mexico, delivering fee revenue of US$92 million. In addition, a growing level of fee income was generated from bancassurance sales and international remittances.
On an underlying basis, other operating income fell by 23 per cent. This was primarily caused by a fall in mortgage banking-related income in the US. Total servicing-related income decreased by US$210 million compared with 2002. This decrease was driven by accelerated amortisation and large write-downs of mortgage servicing rights (‘MSRs’) as many customers refinanced mortgages in order to take advantage of the low interest rate environment. MSR income also declined as a result of significant losses on derivative instruments used to protect the economic value of MSRs.
In addition, the June/July time period was one of the more difficult periods related to derivative activity. Specifically, in June, positions were taken in derivative instruments to further reduce HSBC’s exposure to these losses as mortgage rates continued to fall. However, in July extreme interest rate volatility ensued and there was a significant rise in interest rates resulting in a substantial loss in the
value of the derivative instruments. These losses were only partly offset by subsequent falls in interest rates, and gains from the sale of certain mortgage-backed securities available-for-sale that were used as on-balance sheet economic hedges of the MSRs.
While the value of MSRs generally declines in a falling interest rate environment as mortgages are repaid, the effect of this decline is often mitigated by income from refinancing mortgage loans and subsequent sales to mortgage agencies. Total loan volumes sold in 2003 were US$20.1 billion compared with US$12.4 billion in 2002. Market conditions during 2003 permitted favourable pricing which allowed HSBC to earn higher gains on loans sold as well as a higher spread on refinanced loans. As a result, sales-related income for 2003 increased by US$82 million compared with 2002.
Overall, the US mortgage banking business contributed US$210 million to pre-tax profit in 2003, compared with US$251 million in 2002. In the US, HSBC generated increases in deposit-related service charges and in card fees, though sales of investment products fell reflecting a lack of confidence in the equity markets. Increased fees in Canada reflected higher insurance sales and increased commissions from retail broking activities as the equity markets rebounded in 2003.
Growth in operating expenses, excluding goodwill amortisation, of 65 per cent to US$1,965 million was substantially attributable to the addition of HSBC Mexico, which contributed US$758 million to the overall cost base in 2003. In Mexico, savings in operating expenses were achieved from merging HSBC Mexico with HSBC’s existing operations in the country. These savings funded investment to improve technology support for HSBC Mexico’s branch network.
On an underlying basis, operating expenses, excluding goodwill amortisation, increased by 7 per cent. Pension costs rose due to falls in the long-term rates of return on assets, and higher profitability drove increased staff incentive payments. Following the integration with HSBC Finance Corporation, long-term restructuring programmes, including the rationalisation of staff functions, were initiated, adding US$20 million of costs in the year.
Operations in Mexico contributed US$67 million to the overall net charge for bad and doubtful debts of US$142 million. On an underlying basis, credit provisions in Personal Financial Services were broadly in line with the prior year, a good performance in view of strong growth in personal lending. Overall credit quality improved, reflecting the improved economic environment.
101
Back to Contents
H S B C H O L D I N G S P L C
Financial Review (continued)
Consumer Finance contributedUS$2,068 million to pre-tax profit, before goodwill amortisation, in the nine months since HSBC Finance Corporation became a member of HSBC. The integration of HSBC Finance Corporation into HSBC delivered anticipated benefits in improved funding costs, and technology and administrative cost savings. Significant progress has been made in exporting HSBC Finance Corporation’s core skills, particularly in the areas of credit risk management, sales-focused organisation and customer-centred technology, to other parts of the Group. Further synergies are planned in card processing, IT contingency rationalisation, purchasing, call-centre operations and the shared use of HSBC’s Group Service Centres. HSBC Finance Corporation’s business model is being taken to selected markets overseas and established alongside existing HSBC operations to meet the growing global demand for consumer finance.
Net interest margin benefited by US$531 million from purchase accounting adjustments relating to the acquisition of HSBC Finance Corporation in the nine months in which HSBC Finance Corporation was part of the HSBC Group. This comprised of a US$946 million benefit in respect of debt funding, offset by the amortisation of purchase accounting adjustments relating to loans and advances to customers totalling US$415 million. Purchase accounting adjustments restated the book value of debt to fair value at that date and, therefore, reflected the improvement in spread already in the market as well as falling interest rates. They are being amortised in line with the residual maturity of the debt. Assuming credit spreads remain consistent, savings on future debt issues will replace the fair value adjustments relating to credit spreads. Since acquisition, HSBC Finance Corporation’s funding costs on new issues have, in fact , fallen as the credit spreads sought by the market decreased, reflecting the improvement in HSBC Finance Corporation’s credit rating on joining the HSBC Group. During 2003, net interest income benefited by US$124 million as a result of such savings.
All consumer portfolios grew during the year, except for personal unsecured loans, with the strongest growth in the real estate secured and private label portfolios. The secured real estate portfolio growth was driven by the correspondent business while the private label portfolio benefited from a number of new relationships added during the year. Growth in MasterCard and Visa loans benefited from portfolio acquisitions made during the year in advantageous circumstances and growth in the General Motors portfolio. The motor vehicle finance
business also benefited from new originations from strategic alliances during the year.
Included within operating expenses were one-off retention payments arising on the change of control amounting to US$52 million. Headcount increased to support business expansion, particularly in the consumer lending and mortgage services businesses.
The charge for bad and doubtful debts in 2003 reflected growth in receivables, increases in personal bankruptcy filings and the weak US economy. However, in the second half of the year credit quality stabilised and improvement was seen in a number of key indicators, including early stage delinquency, charge-offs, bankruptcy filings and collection activities. The improvement reflected resumed domestic economic growth which is forecast to continue into 2004.
Commercial Banking in North America reported pre-tax profit, before goodwill amortisation, of US$595 million, an increase of 32 per cent, compared with 2002. On an underlying basis, HSBC generated pre-tax profit, before goodwill amortisation, of US$498 million, 12 per cent higher than last year.
Net interest income on an underlying basis was marginally lower than 2002. In Canada, income growth was generated from increased balances on loans and deposits. There were increases in commercial real estate lending where growth in market share was concentrated primarily in New York. Service delivered to SMEs was enhanced as part of the strategy to focus on that market. Notably, the credit application process was re-engineered to make it easier for customers and the number of relationship managers doubled. As a result, lending to SMEs increased by 17 per cent. Net interest income further benefited from steady growth in deposit balances and lower funding costs. Offsetting this was the impact of business disposals as HSBC disposed of its equipment leasing portfolio in the first half of 2003 following a re-evaluation of its core businesses.
On an underlying basis, other operating income rose by 20 per cent, reflecting income on the sale of the factoring business and increases in fees related to commercial real estate lending, deposit taking and trade.
The inclusion of HSBC Finance Corporation’s commercial portfolio reduced other operating income by US$17 million. These losses were more than offset by tax credits, resulting in an overall benefit to post tax profits of US$40 million.
102
Back to Contents
HSBC Mexico contributed US$325 million to total operating income in the Commercial Banking segment in North America, reflecting a strong position in customer deposits. In addition, a growing level of fee income was generated from payments and cash management, loan and credit card fees.
Of the total increase in operating expenses, US$163 million was attributable to HSBC Mexico. Underlying operating expenses, excluding goodwill amortisation, increased by 9 per cent to US$614 million. This was driven by higher pension and incentive compensation expenses. In Canada, staff costs increased, primarily due to increased variable incentive payments.
Credit quality remained satisfactory. On an underlying basis, provisions for bad and doubtful debts fell by 40 per cent to US$88 million, reflecting the improved credit environment in North America in 2003. Low interest rates, declining credit spreads and positive economic sentiment all contributed to this improvement.
Corporate, Investment Banking and Marketsreported pre-tax profit, before amortisation of goodwill, of US$837 million, an increase of 70 per cent, compared with 2002. On an underlying basis, the Corporate, Investment Banking and Markets business generated pre-tax profit, before amortisation of goodwill, of US$772 million, 58 per cent higher than in 2002. In generally favourable trading conditions, Global Markets achieved higher customer sales from structured finance and hedging products as institutional and corporate borrowers took advantage of low interest rates to raise finance or fix the cost of existing facilities.
HSBC’s North American securities trading and debt capital markets business was substantially restructured and refocused towards the end of 2002 and this was reflected positively in its 2003 financial performance. Government and agency securities arbitrage activities were wound down. Corporate bond trading returned to profitability, contrasting with the heavy losses suffered in 2002 as a result of widening credit spreads, particularly in the telecommunications and auto sectors. The turnaround in performance added US$67 million to profit before tax. Investment in relationship management generated new business from major institutional and corporate clients. Global Markets also expanded its structured credit derivatives trading in response to the evolving requirements of its institutional customer base, allowing these clients to risk manage their portfolios more actively, thereby generating fees and trading revenues for HSBC.
Underlying net interest income ofUS$685 million, increased by 28 per cent, compared with 2002. This was partly attributable to the restructuring initiatives in the securities trading and debt capital markets business. As part of this restructuring, large arbitrage trading portfolios, which had historically contributed dealing profits but incurred significant funding costs, were eliminated. Net interest income further benefited from good balance sheet management and effective interest rate positioning in the US and Canada.
Underlying total other operating income, at US$738 million improved by 32 per cent. Strong foreign exchange and domestic dollar book trading activity contributed to increased revenues, driven by historically low interest rates and volatile currency markets. Derivatives trading revenues increased, reflecting the growth in demand for the structuring of tailored products for corporate and institutional customers.
HSBC Mexico generated other operating income of US$90 million, of which US$64 million was accounted for by dealing profits. Volatility in the Mexican markets enabled the Group to increase trading volumes and capitalise on favourable market movements. These positive market conditions led to increased profits from foreign exchange and fixed income.
Underlying operating expenses, before goodwill amortisation, of US$706 million, increased by 9 per cent. Investment in the core business added to the expenditure but was partly funded by lower costs in the securities trading and debt capital markets business, elements of which were wound down.
Credit experience on major corporate customers in the US was better in 2003. Many accounts which were potentially problematic at the end of 2002 were successfully refinanced and restructured in the strong debt market at the start of 2003. Elsewhere, credit quality remained satisfactory and consequently, on an underlying basis, there was a net release of US$7 million for bad and doubtful debts.
Profits on disposal of investments, on an underlying basis, were US$57 million, a decline of 53 per cent compared with 2002, which included a higher level of securities disposals arising from the restructuring of investment portfolios.
HSBC’sPrivate Banking operations in North America contributed US$63 million to pre-tax profits, before goodwill amortisation, an increase of 11 per cent compared with 2002.
During the year the North American business continued its evolution from a deposit-based
103
Back to Contents
H S B C H O L D I N G S P L C
Financial Review (continued)
business to broader wealth advisory service, with a resulting shift from net interest income to fees and commissions. Despite this, net interest income was 3 per cent higher than 2002, reflecting an improved funding environment in 2003.
An increase in net fees and commissions and other income of US$52 million, or 37 per cent, mainly reflected the benefit from increased investment activity by clients and a greater emphasis on fee-based non-discretionary advisory and structured products. In addition, WTAS (HSBC’s tax
advisory service for high net-worth clients), in its first full year of operation, contributed to this increase.
The inclusion of WTAS was the principal contributor to the US$48 million increase in operating expenses, before goodwill amortisation. Cost savings from the alignment of international and domestic client servicing units offset higher staff and restructuring costs. Excluding this operating expenses were essentially flat year-on-year.
104
Back to Contents
Profit/(loss) excluding goodwill amortisation by customer group
| | Year ended 31 December 2004 | |
| |
| |
| | | | | | Total | | | | Corporate, | | | | | | | | | |
| | Personal | | | | Personal | | | | Investment | | | | | | Inter- | | | |
| | Financial | | Consumer | | Financial | | Commercial | | Banking & | | Private | | | | segment | | | |
| | Services | | Finance | 4 | Services | | Banking | | Markets | | Banking | | Other | | elimination | | Total | |
| North America | US$m | | US$m | | US$m | | US$m | | US$m | | US$m | | US$m | | US$m | | US$m | |
| | | | | | | | | | | | | | | | | | | |
| Net interest | | | | | | | | | | | | | | | | | | |
| income/(expense) | 2,498 | | 10,541 | | 13,039 | | 1,146 | | 664 | | 166 | | (102 | ) | – | | 14,913 | |
| Dividend income | 4 | | 9 | | 13 | | – | | 19 | | – | | – | | – | | 32 | |
| Net fees and commissions | 829 | | 1,828 | | 2,657 | | 302 | | 492 | | 176 | | (92) | | – | | 3,535 | |
| Dealing profits | 54 | | – | | 54 | | 15 | | 364 | | 6 | | – | | – | | 439 | |
| Other income | 92 | | 765 | | 857 | | 159 | | 82 | | 4 | | 1,067 | | (1,011) | | 1,158 | |
| Other operating income | 979 | | 2,602 | | 3,581 | | 476 | | 957 | | 186 | | 975 | | (1,011 | ) | 5,164 | |
| |
| |
| |
| |
| |
| |
| |
| |
| |
| |
| Operating income | 3,477 | | 13,143 | | 16,620 | | 1,622 | | 1,621 | | 352 | | 873 | | (1,011 | ) | 20,077 | |
| | | | | | | | | | | | | | | | | | | |
| Operating expenses | | | | | | | | | | | | | | | | | | |
| excluding goodwill | | | | | | | | | | | | | | | | | | |
| amortisation1 | (2,270 | ) | (4,470 | ) | (6,740 | ) | (749 | ) | (1,014 | ) | (294 | ) | (1,101 | ) | 1,011 | | (8,887 | ) |
| |
| |
| |
| |
| |
| |
| |
| |
| |
| |
| Operating profit/(loss) | | | | | | | | | | | | | | | | | | |
| before provisions1 | 1,207 | | 8,673 | | 9,880 | | 873 | | 607 | | 58 | | (228 | ) | – | | 11,190 | |
| | | | | | | | | | | | | | | | | | | |
| Provisions for bad and | | | | | | | | | | | | | | | | | | |
| doubtful debts | (99 | ) | (5,136 | ) | (5,235 | ) | (13 | ) | 60 | | 2 | | – | | – | | (5,186 | ) |
| Provisions for contingent | | | | | | | | | | | | | | | | | | |
| liabilities and | | | | | | | | | | | | | | | | | | |
| commitments | (13 | ) | – | | (13 | ) | (20 | ) | (8 | ) | – | | (1 | ) | – | | (42 | ) |
| |
| |
| |
| |
| |
| |
| |
| |
| |
| |
| Operating profit/(loss)1 | 1,095 | | 3,537 | | 4,632 | | 840 | | 659 | | 60 | | (229 | ) | – | | 5,962 | |
| | | | | | | | | | | | | | | | | | | |
| Share of operating | | | | | | | | | | | | | | | | | | |
| profit/(loss) | | | | | | | | | | | | | | | | | | |
| in associates2 | – | | – | | – | | – | | (16 | ) | – | | 8 | | – | | (8 | ) |
| Gains on disposal of | | | | | | | | | | | | | | | | | | |
| investments and tangible | | | | | | | | | | | | | | | | | | |
| fixed assets | 69 | | 39 | | 108 | | 5 | | 107 | | 6 | | – | | – | | 226 | |
| |
| |
| |
| |
| |
| |
| |
| |
| |
| |
| Profit/(loss) on ordinary | | | | | | | | | | | | | | | | | | |
| activities before tax3 | 1,164 | | 3,576 | | 4,740 | | 845 | | 750 | | 66 | | (221 | ) | – | | 6,180 | |
| |
| |
| |
| |
| |
| |
| |
| |
| |
| |
| | % | | % | | % | | % | | % | | % | | % | | | | % | |
| Share of HSBC’s pre-tax | | | | | | | | | | | | | | | | | | |
| profits3 | 6.0 | | 18.4 | | 24.4 | | 4.3 | | 3.9 | | 0.3 | | (1.1 | ) | | | 31.8 | |
| Cost:income ratio1 | 65.3 | | 34.0 | | 40.6 | | 46.2 | | 62.6 | | 83.5 | | 126.1 | | | | 44.3 | |
| | | | | | | | | | | | | | | | | | | |
| | US$m | | US$m | | US$m | | US$m | | US$m | | US$m | | US$m | | | | US$m | |
| Selected balance sheet | | | | | | | | | | | | | | | | | | |
| data5 | | | | | | | | | | | | | | | | | | |
| Loans and advances to | | | | | | | | | | | | | | | | | | |
| customers (net) | 65,850 | | 126,543 | | 192,393 | | 26,844 | | 26,142 | | 3,871 | | 1 | | | | 249,251 | |
| Total assets | 77,054 | | 150,633 | | 227,687 | | 31,426 | | 106,785 | | 4,548 | | 31 | | | | 370,477 | |
| Customer accounts | 50,659 | | 506 | | 51,165 | | 27,167 | | 46,745 | | 7,822 | | 1 | | | | 132,900 | |
| The following assets and | | | | | | | | | | | | | | | | | | |
| liabilities were also | | | | | | | | | | | | | | | | | | |
| significant to the customer | | | | | | | | | | | | | | | | | | |
| groups noted: | | | | | | | | | | | | | | | | | | |
| Loans and advances to | | | | | | | | | | | | | | | | | | |
| banks (net) | | | | | | | | | 23,814 | | | | | | | | | |
| Debt securities, treasury | | | | | | | | | | | | | | | | | | |
| bills and other eligible | | | | | | | | | | | | | | | | | | |
| bills | | | | | | | | | 45,688 | | | | | | | | | |
| Deposits by banks | | | | | | | | | 14,887 | | | | | | | | | |
| Debt securities in issue | | | 113,729 | | | | | | | | | | | | | | | |
| | | | | | | | | | | | | | | | | | | |
| Goodwill amortisation excluded: | | | | | | | | | | | | | | | | | | |
| 1 | from (1) above | 125 | | 475 | | 600 | | 79 | | 57 | | 25 | | – | | | | 761 | |
| 2 | from (2) above | – | | – | | – | | – | | – | | – | | – | | | | – | |
| 3 | from (3) above | 125 | | 475 | | 600 | | 79 | | 57 | | 25 | | – | | | | 761 | |
| 4 | Comprises HSBC Finance Corporation’s consumer finance business and the US residential mortgages and credit card portfolios acquired by HSBC Bank USA from HSBC Finance Corporation and its correspondents since December 2003. |
| 5 | Third party only. |
105
Back to Contents
H S B C H O L D I N G S P L C
Financial Review(continued)
Profit/(loss) excluding goodwill amortisation by customer group(continued)
| | Year ended 31 December 2003 | |
| |
| |
| | | | | | Total | | | | Corporate, | | | | | | | | | |
| | Personal | | | | Personal | | | | Investment | | | | | | Inter- | | | |
| | Financial | | Consumer | | Financial | | Commercial | | Banking & | | Private | | | | segment | | | |
| | Services | | Finance5 | | Services | | Banking | | Markets | | Banking | | Other | | elimination | | Total | |
| North America | US$m | | US$m | | US$m | | US$m | | US$m | | US$m | | US$m | | US$m | | US$m | |
| | | | | | | | | | | | | | | | | | | |
| Net interest | | | | | | | | | | | | | | | | | | |
| income/(expense) | 2,116 | | 7,851 | | 9,967 | | 1,046 | | 743 | | 121 | | (100 | ) | – | | 11,777 | |
| | | | | | | | | | | | | | | | | | | |
| Dividend income | – | | 12 | | 12 | | – | | 20 | | 1 | | 1 | | – | | 34 | |
| Net fees and commissions | 720 | | 1,170 | | 1,890 | | 292 | | 351 | | 155 | | (12) | | – | | 2,676 | |
| Dealing profits | 19 | | – | | 19 | | 18 | | 301 | | 2 | | – | | – | | 340 | |
| Other income | 86 | | 525 | | 611 | | 152 | | 156 | | 36 | | 33 | | (56) | | 932 | |
| Other operating income | 825 | | 1,707 | | 2,532 | | 462 | | 828 | | 194 | | 22 | | (56 | ) | 3,982 | |
| |
| |
| |
| |
| |
| |
| |
| |
| |
| |
| Operating income | 2,941 | | 9,558 | | 12,499 | | 1,508 | | 1,571 | | 315 | | (78 | ) | (56 | ) | 15,759 | |
| | | | | | | | | | | | | | | | | | | | |
| Operating expenses | | | | | | | | | | | | | | | | | | |
| excluding goodwill | | | | | | | | | | | | | | | | | | |
| amortisation1 | (1,965 | ) | (3,098 | ) | (5,063 | ) | (786 | ) | (777 | ) | (254 | ) | (123 | ) | 56 | | (6,947 | ) |
| | |
| |
| |
| |
| |
| |
| |
| |
| |
| |
| Operating profit/(loss) | | | | | | | | | | | | | | | | | | |
| before provisions1 | 976 | | 6,460 | | 7,436 | | 722 | | 794 | | 61 | | (201 | ) | – | | 8,812 | |
| | | | | | | | | | | | | | | | | | | | |
| Provisions for bad and | | | | | | | | | | | | | | | | | | |
| doubtful debts | (142 | ) | (4,395 | ) | (4,537 | ) | (133 | ) | (6 | ) | 1 | | (1 | ) | – | | (4,676 | ) |
| Provisions for contingent | | | | | | | | | | | | | | | | | | |
| liabilities and | | | | | | | | | | | | | | | | | | |
| commitments | – | | – | | – | | 4 | | – | | – | | (1 | ) | – | | 3 | |
| Amounts written off fixed | | | | | | | | | | | | | | | | | | |
| asset investments | – | | – | | – | | – | | (9 | ) | – | | – | | – | | (9 | ) |
| | |
| |
| |
| |
| |
| |
| |
| |
| |
| |
| Operating profit/(loss)1 | 834 | | 2,065 | | 2,899 | | 593 | | 779 | | 62 | | (203 | ) | – | | 4,130 | |
| | | | | | | | | | | | | | | | | | | | |
| Share of operating profit | | | | | | | | | | | | | | | | | | |
| in joint ventures | 11 | | – | | 11 | | – | | – | | – | | – | | – | | 11 | |
| Share of operating profit | | | | | | | | | | | | | | | | | | |
| in associates2 | – | | – | | – | | – | | – | | – | | 7 | | – | | 7 | |
| Gains on disposal of | | | | | | | | | | | | | | | | | | |
| investments and | | | | | | | | | | | | | | | | | | |
| tangible fixed assets | 25 | | 3 | | 28 | | 2 | | 58 | | 1 | | 20 | | – | | 109 | |
| | |
| |
| |
| |
| |
| |
| |
| |
| |
| |
| Profit/(loss) on ordinary | | | | | | | | | | | | | | | | | | |
| activities before tax3 | 870 | | 2,068 | | 2,938 | | 595 | | 837 | | 63 | | (176 | ) | – | | 4,257 | |
| | |
| |
| |
| |
| |
| |
| |
| |
| |
| |
| | | % | | % | | % | | % | | % | | % | | % | | | | % | |
| Share of HSBC’s pre-tax | | | | | | | | | | | | | | | | | | |
| profits3 | 6.0 | | 14.4 | | 20.4 | | 4.1 | | 5.8 | | 0.4 | | (1.1 | ) | | | 29.6 | |
| Cost:income ratio1 | 66.8 | | 32.4 | | 40.5 | | 52.1 | | 49.5 | | 80.6 | | (157.7 | ) | | | 44.1 | |
| | | | | | | | | | | | | | | | | | | | |
| | | US$m | | US$m | | US$m | | US$m | | US$m | | US$m | | US$m | | | | US$m | |
| Selected balance sheet data5 | | | | | | | | | | | | | | | | | | |
| Loans and advances to | | | | | | | | | | | | | | | | | | |
| customers (net) | 43,608 | | 107,957 | | 151,565 | | 23,553 | | 13,758 | | 2,574 | | – | | | | 191,450 | |
| Total assets | 53,082 | | 134,857 | | 187,939 | | 27,444 | | 70,223 | | 3,108 | | 1,086 | | | | 289,800 | |
| Customer accounts | 48,576 | | 1 | | 48,577 | | 20,032 | | 17,239 | | 8,148 | | – | | | | 93,996 | |
| The following assets and | | | | | | | | | | | | | | | | | | |
| liabilities were also | | | | | | | | | | | | | | | | | | |
| significant to the customer | | | | | | | | | | | | | | | | | | |
| groups noted: | | | | | | | | | | | | | | | | | | |
| Loans and advances to | | | | | | | | | | | | | | | | | | |
| banks (net) | | | | | | | | | 11,577 | | | | | | | | | |
| Debt securities, treasury | | | | | | | | | | | | | | | | | | |
| bills and other eligible | | | | | | | | | | | | | | | | | | |
| bills | | | | | | | | | 36,026 | | | | | | | | | |
| Deposits by banks | | | | | | | | | 9,958 | | | | | | | | | |
| Debt securities in issue | | | 107,673 | | | | | | | | | | | | | | | |
| | | | | | | | | | | | | | | | | | | |
| Goodwill amortisation | | | | | | | | | | | | | | | | | | |
| | excluded: | | | | | | | | | | | | | | | | | | |
| 1 | from (1) above | 117 | | 356 | | 473 | | 100 | | 45 | | 25 | | – | | | | 643 | |
| 2 | from (2) above | 1 | | – | | 1 | | – | | – | | – | | – | | | | 1 | |
| 3 | from (3) above | 118 | | 356 | | 474 | | 100 | | 45 | | 25 | | – | | | | 644 | |
| 4 | Comprises HSBC Finance Corporation’s consumer finance business and the US residential mortgages acquired by HSBC Bank USA from HSBC Finance Corporation and its correspondents in December 2003. |
| 5 | Third party only. |
106
Back to Contents
| | Year ended 31 December 2002 | |
| |
| |
| | | | | | Corporate, | | | | | | | | | |
| | Personal | | | | Investment | | | | | | Inter- | | | |
| | Financial | | Commercial | | Banking & | | Private | | | | segment | | | |
| | Services | | Banking | | Markets | | Banking | | Other | | elimination | | Total | |
| North America | US$m | | US$m | | US$m | | US$m | | US$m | | US$m | | US$m | |
| Net interest income/(expense) | 1,352 | | 844 | | 539 | | 117 | | (120 | ) | – | | 2,732 | |
| | | | | | | | | | | | | | | |
| Dividend income | – | | – | | 24 | | – | | – | | – | | 24 | |
| Net fees and commissions | 437 | | 222 | | 268 | | 61 | | (4) | | – | | 984 | |
| Dealing profits/(losses) | (63) | | 18 | | 204 | | 9 | | (7) | | – | | 161 | |
| Other income | 126 | | 61 | | 61 | | 78 | | 29 | | (22) | | 333 | |
| Other operating income | 500 | | 301 | | 557 | | 148 | | 18 | | (22 | ) | 1,502 | |
| |
| |
| |
| |
| |
| |
| |
| |
| Operating income | 1,852 | | 1,145 | | 1,096 | | 265 | | (102 | ) | (22 | ) | 4,234 | |
| | | | | | | | | | | | | | | |
| Operating expenses excluding | | | | | | | | | | | | | | |
| goodwill amortisation1 | (1,172 | ) | (567 | ) | (649 | ) | (206 | ) | (103 | ) | 22 | | (2,675 | ) |
| |
| |
| |
| |
| |
| |
| |
| |
| Operating profit/(loss) before | | | | | | | | | | | | | | |
| provisions1 | 680 | | 578 | | 447 | | 59 | | (205 | ) | – | | 1,559 | |
| | | | | | | | | | | | | | | |
| Provisions for bad and doubtful | | | | | | | | | | | | | | |
| debts | (76 | ) | (150 | ) | (66 | ) | (2 | ) | (6 | ) | – | | (300 | ) |
| Provisions for contingent liabilities | | | | | | | | | | | | | | |
| and commitments | – | | 2 | | 2 | | – | | (1 | ) | – | | 3 | |
| Amounts written off fixed asset | | | | | | | | | | | | | | |
| investments | – | | – | | (9 | ) | – | | – | | – | | (9 | ) |
| |
| |
| |
| |
| |
| |
| |
| |
| Operating profit/(loss)1 | 604 | | 430 | | 374 | | 57 | | (212 | ) | – | | 1,253 | |
| | | | | | | | | | | | | | | |
| Share of operating loss in joint | | | | | | | | | | | | | | |
| ventures2 | (1 | ) | – | | – | | (1 | ) | – | | – | | (2 | ) |
| Share of operating profit in | | | | | | | | | | | | | | |
| associates2 | 2 | | – | | – | | – | | 6 | | – | | 8 | |
| Gains/(losses) on disposal of | | | | | | | | | | | | | | |
| investments and tangible fixed | | | | | | | | | | | | | | |
| assets | – | | 5 | | 120 | | 1 | | (1 | ) | – | | 125 | |
| |
| |
| |
| |
| |
| |
| |
| |
| Profit/(loss) on ordinary activities | | | | | | | | | | | | | | |
| before tax3 | 605 | | 435 | | 494 | | 57 | | (207 | ) | – | | 1,384 | |
| |
| |
| |
| |
| |
| |
| |
| |
| | % | | % | | % | | % | | % | | | | % | |
| Share of HSBC’s pre-tax profits3 | 5.8 | | 4.1 | | 4.7 | | 0.5 | | (1.9 | ) | | | 13.2 | |
| Cost:income ratio1 | 63.3 | | 49.5 | | 59.2 | | 77.7 | | (101.0 | ) | | | 63.2 | |
| | | | | | | | | | | | | | | |
| | US$m | | US$m | | US$m | | US$m | | US$m | | | | US$m | |
| Selected balance sheet data4 | | | | | | | | | | | | | | |
| Loans and advances to | | | | | | | | | | | | | | |
| customers (net) | 37,922 | | 25,361 | | 12,604 | | 1,701 | | 1 | | | | 77,589 | |
| Total assets | 46,777 | | 29,166 | | 63,161 | | 2,707 | | 221 | | | | 142,032 | |
| Customer accounts | 46,002 | | 17,717 | | 19,396 | | 6,969 | | 53 | | | | 90,137 | |
| The following assets and liabilities | | | | | | | | | | | | | | |
| were also significant to Corporate, | | | | | | | | | | | | | | |
| Investment Banking and Markets: | | | | | | | | | | | | | | |
| Loans and advances to banks (net) . | | | | | 9,948 | | | | | | | | | |
| Debt securities, treasury bills and | | | | | | | | | | | | | | |
| other eligible bills | | | | | 34,926 | | | | | | | | | |
| Deposits by banks | | | | | 9,545 | | | | | | | | | |
| | | | | | | | | | | | | | | |
| Goodwill amortisation excluded: | | | | | | | | | | | | | | |
| 1 | from (1) above | 55 | | 32 | | 34 | | 25 | | – | | | | 146 | |
| 2 | from (2) above | – | | – | | – | | – | | – | | | | – | |
| 3 | from (3) above | 55 | | 32 | | 34 | | 25 | | – | | | | 146 | |
| 4 | Third party only. | | | | | | | | | | | | | | |
107
Back to Contents
H S B C H O L D I N G S P L C
Financial Review (continued)
| South America | | | | | | |
| | | | | | | |
| Profit/(loss) before tax excluding goodwill amortisation | | | | | | |
| | Year ended 31 December | |
| |
| |
| | 2004 | | 2003 | | 2002 | |
| | US$m | | US$m | | US$m | |
| | | | | | | |
| Personal Financial Services | 47 | | (27 | ) | (33 | ) |
| Brazil | 51 | | (31) | | 11 | |
| Argentina | (4) | | 3 | | (45) | |
| Other | – | | 1 | | 1 | |
| | | | | | | |
| Commercial Banking | 165 | | 99 | | 79 | |
| Brazil | 113 | | 65 | | 54 | |
| Argentina | 51 | | 34 | | 27 | |
| Other | 1 | | – | | (2 | ) |
| | | | | | | |
| Corporate, Investment Banking and Markets | 150 | | (24 | ) | 32 | |
| Brazil | 134 | | 49 | | 125 | |
| Argentina | 8 | | (72 | ) | (101 | ) |
| Other | 8 | | (1 | ) | 8 | |
| | | | | | | |
| Private Banking | 1 | | (2 | ) | (12 | ) |
| Brazil | 1 | | (1 | ) | (1 | ) |
| Other | – | | (1 | ) | (11 | ) |
| | | | | | | |
| Other | 81 | | 80 | | (100 | ) |
| Brazil | (18 | ) | 1 | | (62 | ) |
| Argentina | 101 | | 83 | | (91 | ) |
| Other | (2 | ) | (4 | ) | 53 | |
| |
| |
| |
| |
| | | | | | | |
| Total1 | 444 | | 126 | | (34 | ) |
| Brazil | 281 | | 83 | | 127 | |
| Argentina | 156 | | 48 | | (210 | ) |
| Other | 7 | | (5 | ) | 49 | |
| | | | | | | |
| 1Goodwill amortisation arising on subsidiaries excluded | 29 | | 11 | | 24 | |
108
Profit/(loss) before tax
| | Year ended 31 December | |
| |
| |
| | | | | | | |
| | 2004 | | 2003 | | 2002 | |
| South America | US$m | | US$m | | US$m | |
| | | | | | | |
| Net interest income | 1,355 | | 640 | | 645 | |
| | | | | | | |
| Dividend income | 2 | | 3 | | 15 | |
| Net fees and commissions | 480 | | 338 | | 324 | |
| Dealing profits | 50 | | 136 | | 147 | |
| Other income | 207 | | 201 | | 110 | |
| | | | | | | |
| Other operating income | 739 | | 678 | | 596 | |
| |
| |
| |
| |
| Total operating income | 2,094 | | 1,318 | | 1,241 | |
| |
| |
| |
| |
| | | | | | | |
| Staff costs | (660 | ) | (584 | ) | (572 | ) |
| Premises and equipment | (174 | ) | (124 | ) | (113 | ) |
| Other | (549 | ) | (327 | ) | (330 | ) |
| Depreciation and intangible asset amortisation | (61 | ) | (40 | ) | (45 | ) |
| |
| |
| |
| |
| | (1,444 | ) | (1,075 | ) | (1,060 | ) |
| | | | | | | |
| Goodwill amortisation | (29 | ) | (11 | ) | (24 | ) |
| |
| |
| |
| |
| Operating expenses | (1,473 | ) | (1,086 | ) | (1,084 | ) |
| |
| |
| |
| |
| | | | | | | |
| Operating profit before provisions | 621 | | 232 | | 157 | |
| | | | | | | |
| Provisions for bad and doubtful debts | (269 | ) | (58 | ) | (117 | ) |
| Provisions for contingent liabilities and commitments | 30 | | 2 | | (31 | ) |
| Loss from foreign currency redenomination in Argentina | – | | (9 | ) | (68 | ) |
| Amounts written off fixed asset investments | (6 | ) | (62 | ) | (36 | ) |
| |
| |
| |
| |
| Operating profit/(loss) | 376 | | 105 | | (95 | ) |
| | | | | | | |
| Share of operating profit in associated undertakings | 1 | | 1 | | – | |
| Gains on disposal of investments and tangible fixed assets | 38 | | 9 | | 37 | |
| |
| |
| |
| |
| Profit/(loss) on ordinary activities before tax | 415 | | 115 | | (58 | ) |
| |
| |
| |
| |
| | | | | | | |
| | % | | % | | % | |
| Share of HSBC’s pre-tax profits (excluding goodwill amortisation) | 2.3 | | 0.9 | | (0.3 | ) |
| Share of HSBC’s pre-tax profits | 2.4 | | 0.9 | | (0.6 | ) |
| Cost:income ratio (excluding goodwill amortisation) | 69.0 | | 81.6 | | 85.4 | |
| | | | | | | |
| Period-end staff numbers (full-time equivalent) | 32,108 | | 28,292 | | 25,522 | |
| | | | | | | |
| | | | | | | |
| | US$m | | US$m | | US$m | |
| Selected balance sheet data1 | | | | | | |
| Loans and advances to customers (net) | 6,933 | | 4,982 | | 3,028 | |
| Loans and advances to banks (net) | 2,597 | | 1,922 | | 1,665 | |
| Debt securities, treasury bills and other eligible bills | 3,742 | | 2,151 | | 1,450 | |
| Total assets | 17,397 | | 12,549 | | 8,491 | |
| Deposits by banks | 680 | | 828 | | 661 | |
| Customer accounts | 10,957 | | 6,945 | | 4,863 | |
| | | | | | | |
| 1 Third party only. | | | | | | |
Year ended 31 December 2004 compared with year ended 31 December 2003
Reaping the rewards of measures taken in 2003 and helped by a buoyant external environment,Brazilenjoyed an outstanding economic performance in 2004. Annualised GDP growth topped 4 per cent in each of the first three quarters of 2004 and, for the year as a whole, HSBC expects growth to exceed 5
per cent, driven by external demand. The 2004 trade surplus reached US$34 billion and the current account surplus US$12 billion. Employment and real wages both expanded in 2004. Faster than anticipated growth and some unexpected consequences of tax changes pushed fiscal revenues to record highs allowing the public sector to produce a consolidated primary surplus in excess of 4 per
109
Back to Contents
H S B C H O L D I N G S P L C
Financial Review (continued)
cent of GDP in 2004. This, together with the growth in the economy and an appreciating currency, reduced the ratio of debt to GDP, ushering in a virtuous circle of declining risk spreads, growing confidence and a return of investment. This was despite the rekindling of inflationary pressures from rising commodity prices early in 2004, adjustments in administered prices and a very rapidly narrowing output gap. Core inflation remained in excess of 7 per cent throughout the year, and the Central Bank raised interest rates and tightened monetary policy in an attempt to avert higher inflation in 2005. The combined effect of the global slowdown and local policy restrictions is slowing the Brazilian economy. Nevertheless, the short-term outlook remains encouragingly positive.
InArgentina, the recovery from the crisis of 2001 continued in 2004, helped by the favourable external environment and the absence of effective pressure to improve the exchange offer on defaulted debt. Year-on-year GDP growth was 8.8 per cent. Employment in the formal economy in October was up by 6.8 per cent on the year before, continuing the trend of the past two years. By the end of 2004, the stock market index had surpassed the levels last achieved in August 2001, and stood almost 12 per cent above the minimum reached in September 2002, when the economy began its current expansionary phase. Inflation appeared to be under control and the government, buoyed by revenues from exports, was able to post large fiscal surpluses, with a primary surplus in excess of 5 per cent of GDP. By contrast, the progress on debt restructuring was slow. Though the rate of investment returned to the pre-crisis level of 20 per cent of GDP – arguably, too low to sustain growth in excess of 3 to 4 per cent per annum – it is likely that the re-investment cycle will falter without a workable solution to the debt crisis. To that extent, the outlook for Argentina remains uncertain.
HSBC’s operations in South America reported a pre-tax profit of US$415 million, substantially ahead of the US$115 million achieved in 2003. Excluding goodwill amortisation, pre-tax profit was US$444 million compared with US$126 million in 2003, and represented 2 per cent of HSBC’s total pre-tax profit on this basis. The 2004 results include the first full year’s contribution from the Brazilian consumer finance company, Losango, acquired in December 2003, along with contributions from CreditMatone S.A., acquired in November 2004, and Valeu Promotora de Vendas, the consumer finance operations of Indusval Multistock Group, acquired in August 2004. Together, these three businesses contributed US$72 million to pre tax profits before goodwill amortisation, representing 23 per cent of
the growth. There were no significant exchange rate impacts in 2004.
The commentary that follows is based on constant exchange rates.
Personal Financial Services’ pre-tax profit, before goodwill amortisation, of US$47 million predominantly reflected the Losango consumer finance business acquired in December 2003, which contributed US$72 million. It was pleasing to note that, in its first full year in HSBC, Losango’s full-year profitability doubled compared with 2003. Excluding Losango at constant exchange rates, the pre-tax loss before goodwill amortisation improved by 50 per cent on the previous year.
The integration of Losango progressed extremely well. There was strong growth across the product portfolios during the period, notably in store loans and personal lending products. Good progress was made in delivering anticipated operational synergies. Plans to embed Losango branches within the HSBC Brazil network are well advanced. In the second half of the year, Losango benefited from the acquisition of the two consumer finance portfolios noted above.
Excluding the impact of the acquired businesses, net interest income grew by 15 per cent, reflecting good asset growth in Brazil, partly offset by reduced spreads on credit cards in Argentina.
Auto finance loans in Brazil grew by 69 per cent, reflecting the success of a number of initiatives taken to enhance the distribution channels in the branch network, and effective marketing promotions and incentive campaigns. Market share increased from 3.1 per cent to 4.1 per cent. The income benefit arising from the increase in balances was only partly offset by narrower spreads.
Competitive pricing was used to grow the cards business to take advantage of strong growth in consumer spending: this generated an 11 per cent increase in balances. Growth in demand deposits was augmented by a widening of spreads. However, the benefit was partly offset by narrower spreads on savings accounts, where rates are set by the Brazilian Government, and on time deposits.
Other operating income rose by 32 per cent, of which 17 per cent came from Losango and its consumer lending acquisitions. The remaining 15 per cent arose principally from growth in fee income in Brazil driven by increased lending activity and higher revenues from the life insurance business in Argentina.
110
Back to Contents
Excluding Losango, credit-related fee income grew by 44 per cent in Brazil, as a result of growth in customer lending and the introduction of a new pricing structure. Greater use of a new automated collection service and revised fee charging led to a 19 per cent increase in account service fees. Strong growth in the cards business, where cards in circulation rose by 30 per cent, generated a significant increase in fee income of 27 per cent. Higher consumer lending also contributed to an overall increase in brokerage fees from insurance operations.
Operating expenses, excluding goodwill amortisation, increased by 38 per cent, of which 25 per cent was attributable to Losango and its acquisitions. Marketing expenditure increased by 58 per cent as HSBC sought to build and reinforce brand awareness in Brazil. Transactional taxes increased by 26 per cent in line with operating income growth. Prices also increased on the renewal of a number of service contracts. Costs in Argentina were 21 per cent higher, largely from increased staff costs, notably pensions and labour claims, together with higher marketing expenditure and regulatory fees.
The provision for bad and doubtful debts increased by 88 per cent or US$126 million, of which US$107 million or 75 per cent arose in Losango. The remaining increase was driven by the growth in unsecured lending in Brazil. Credit quality in both Brazil and Argentina was relatively stable throughout 2004 as unemployment and inflation rates declined and domestic economic growth strengthened.
Commercial Banking reported pre-tax profits, before goodwill amortisation, of US$165 million, an increase of 62 per cent over 2003, due largely to higher net interest income in Brazil.
Net interest income of US$234 million was US$59 million or 34 per cent higher than in 2003. In Brazil, overdraft balances increased by 44 per cent as a result of strong growth in the demand for credit and the introduction of a new pricing structure for SME customers. This led to a 22 per cent increase in income despite a marginal fall in spreads and this, together with strong growth inGiro fácil, a combined loan and overdraft product, contributed US$26 million of additional income. Total commercial lending balances increased by 58 per cent to US$1.4 billion and, following product development expenditure in 2003, lending backed by discounted receivables increased by 81 per cent. Spreads on deposit balances benefited from a reduction in the compulsory deposit rate and lower
rural loans, while deposit balances increased by 29 per cent, contributing further to the increase in net interest income. In Argentina, net interest income declined as the low interest rate environment led to reduced spreads on deposits.
Other operating income increased by 14 per cent to US$136 million. In Brazil, the growth in lending balances resulted in higher arrangement fee income, while current account fees rose by 15 per cent following the introduction of the new SME pricing structure. Income in Argentina was in line with 2003.
Operating expenses of US$203 million were 12 per cent higher than in 2003. In Brazil, growth in staff numbers in support of business expansion and increased transactional tax costs contributed to a 17 per cent rise in costs. Marketing expenses also increased reflecting the SME initiatives taken during the year. In Argentina, cost control initiatives resulted in a 7 per cent reduction in operating expenses.
Provisions for bad and doubtful debts were 82 per cent lower than in 2003. Recoveries and releases in Argentina reflected the improved economic conditions. These were partly offset by higher specific provisions raised in Brazil, in line with growth in the small business portfolio.
Corporate, Investment Banking and Marketsreported pre-tax profit, before amortisation of goodwill, of US$150 million, compared with a small loss in 2003.
Net interest income of US$165 million contrasted with a net interest expense in 2003. In Brazil, sharp falls in interest rates in the latter part of 2003 and into early 2004 resulted in lower funding costs, which enabled Global Markets to benefit from large fixed rate positions taken in anticipation of interest rate reductions. Argentina also benefited from a significant decline in interest rates, as a lower interest expense reflected the reduced cost of funding non-performing loans.
The more stable political and interest rate environment led to lower volatility in the value of the Brazilian real and interest rates, resulting in fewer opportunities for arbitrage. As a consequence, other operating income declined, mainly through reduced dealing profits in Brazil.
Operating expenses, excluding goodwill amortisation, increased as transactional taxes rose in line with improved revenues in Brazil. In addition, bonuses increased in line with significantly higher profits.
111
Back to Contents
H S B C H O L D I N G S P L C
FinancialReview(continued)
There was a small net release for bad and doubtful debts compared with a net charge in 2003, mainly due to lower provisions in the consumer brands sector and higher releases in the energy and utilities sector in Brazil.
Amounts written-off fixed assets fell, mainly due to lower provisions for certain Argentine government bonds which rose in value as the timing and nature of the external debt exchange offer were clarified.
Private Banking reported a pre-tax profit, before goodwill amortisation, of US$1 million, compared with a small loss of US$2 million in 2003. An increase in net interest income was driven by higher time deposits in Brazil, while operating expenses, excluding goodwill amortisation, reduced following a reorganisation of the business.
Other includes the ongoing impact of the pesification in Argentina. In 2004, higher earnings from compensation bonds, lower litigation provisions and increased gains on the sale of government securities were largely offset by lower general provision releases.
Year ended 31 December 2003 compared with year ended 31 December 2002
2003 was a year of recovery across the region following the economic and political uncertainty experienced during 2002.
In Brazil, the turnaround in 2003 was noteworthy. After a difficult start, the new Government demonstrated prudent control of macroeconomic policy including, importantly, inflation. A difficult and costly disinflationary programme was put into effect with the central bank’s reference rate reaching 26.5 per cent in June. The programme was successful within a surprisingly short time horizon. Inflation fell from 17.3 per cent to 9.3 per cent, and reference interest rates ended the year at 16.5 per cent. Actions to reduce Brazil’s two key vulnerabilities, its fiscal and external deficits, were effective. On the fiscal front, Brazil’s Congress approved public sector social security reforms and 2003 was the fifth consecutive year IMF fiscal targets were achieved. On the external front, Brazil is expected to register its first current account surplus in over a decade.
Buoyed by a surge in exports and large trade surpluses, the Argentinian economy recovered at a fast pace. Inflation remained under control and the Argentine peso appreciated from 3.60 to the US dollar in May 2002 to 2.93 at December 2003.
Unemployment fell and tax revenues and collections increased.
Fundamental legal uncertainty persists, particularly regarding the position of pension fund assets following pesification, the ability of utilities to raise prices, and the position of holders of pesified and defaulted government bonds. Although the financial system is emerging slowly from near collapse, questions about the sustainability of the recovery persist and a resolution of the historic sovereign debt default is a pre-condition for stability and sustained new investment.
HSBC’s operations in South America reported a pre-tax profit of US$115 million, compared with a loss of US$58 million in 2002. Excluding goodwill amortisation, pre-tax profit was US$126 million, compared with a loss of US$34 million in 2002. Key to this improvement was a turnaround in Argentina, from a loss of US$210 million to a modest profit of US$48 million. This followed the release of part of the general provision previously raised against customer advances, as the economy improved and, in December 2003, compensation bonds with a face value of US$109 million were received from the Argentine government. These have been included at an estimated fair value of US$63 million in the results of the Other segment. Goodwill amortisation at US$11 million was US$13 million lower than in 2002, which included a goodwill write-off relating to the purchase of insurance subsidiaries.
The commentaries that follow are based on constant exchange rates.
InPersonal Financial Services there was a pre-tax loss, before goodwill amortisation, of US$27 million, an improvement against the loss suffered in 2002. The acquisition of Lloyds TSB Group’s businesses and assets in Brazil contributed US$7 million to this overall improvement. Lending growth was stronger in Brazil, while higher bad debt recoveries benefited operations in Argentina.
Net interest income was broadly in line with last year. The benefit from higher personal lending balances in Brazil was offset by lower interest income from the insurance businesses in Argentina, largely due to lower CER, an inflation adjustment applied to all pesified loans.
Other operating income of US$316 million was 51 per cent higher than in 2002, largely due to a strong performance in Brazil. Growth in customer lending volumes generated an increase in credit-related fee income and account service fees. Following strong marketing support, fee income from cards in Brazil grew by 24 per cent, driven by a
112
Back to Contents
30 per cent increase in cards in circulation to 1.4 million. Other operating income also improved in Argentina, reflecting a strong performance in the insurance business.
Operating expenses, excluding goodwill amortisation, were broadly in line with 2002. In Brazil, costs increased by 15 per cent, largely due to higher staff costs, notably labour claims, together with higher costs from marketing initiatives taken in 2003 and an increase in the transactional taxation charge on higher operating income. Costs in Argentina were significantly lower than prior year, mainly due to lower severance costs.
The provision for bad and doubtful debts of US$138 million was 50 per cent higher than in 2002. In Brazil, specific provisions increased, predominantly in the first half of 2003, reflecting the prevailing economic conditions. High inflation, interest rates and unemployment reduced customers’ repayment capacity. However, credit quality began to show signs of improvement in the second half of the year.
Commercial Banking in South America contributed pre-tax profit, before amortisation of goodwill, of US$99 million, 23 per cent higher than in 2002.
Net interest income increased by 39 per cent, to US$168 million. In Argentina, net interest income benefited from lower Argentine peso rates paid on deposits and recoveries of interest suspended on non-performing loans. In Brazil, successful marketing campaigns led to a significant growth in income from overdrafts and working capital products. Other growth areas included discounted receivables and vehicle leasing, supported by the introduction of pre-approved facilities.
Other operating income increased by 23 per cent to US$115 million. Credit related fee income in Brazil increased, reflecting the expansion in the current account customer base by 8 per cent. Fees earned on foreign exchange rose from a higher volume of transactions. In response to aggressive pricing by competitors, the introduction of a new fee pricing structure in the first half of 2003 stimulated an increase in the volume of loan fees and funds under management leading to higher fee income.
At US$173 million, total operating expenses, before goodwill amortisation, were 25 per cent higher than 2002. The cost increases partly reflected increased business volumes as well as the impact of various initiatives which had been delayed pending evidence of improvement in economic conditions. These included increased advertising, the
implementation of a sales structure to support business development, and investment in new products and delivery channels. These were partly funded by the centralisation of support processes which resulted in a reduction of associated costs and reduced the administrative workload for relationship managers, leaving them more time for their customers.
Corporate, Investment Banking and Marketsreported a loss, before amortisation of goodwill, of US$24 million, broadly in line with 2002, at constant exchange rates. Profit before tax and amortisation of goodwill in Brazil was US$49 million, compared with US$104 million in 2002. Argentina recorded a loss of US$72 million compared with a loss of US$143 million in 2002.
Net interest expense was US$51 million, an increase of 16 per cent compared with 2002. In Brazil, net interest income decreased due to lower spreads in Global Markets, partly offset by the impact of downward yield curve movements which allowed the funding of long positions at lower rates. In corporate banking, a lack of attractive risks restricted lending growth. In Argentina, the lower cost of funding non-performing assets and a lower level of suspended interest resulted in a decrease in net interest expense.
Dealing profits were broadly in line with 2002. In Brazil, higher dealing profits reflected gains resulting from a fall in interest rates. Brokerage, custody and clearing businesses also grew significantly, taking advantage of market opportunities. These factors were offset in part by lower foreign exchange income in Argentina.
Staff costs were higher than in 2002, mainly in Brazil, reflecting improved performance in specific products.
Provisions for bad and doubtful debts rose in difficult market conditions. Higher interest rates, currency weakness, and a reduced availability of foreign currency funding all contributed to problems encountered by corporate customers in the first half of 2003 in Brazil. Although the situation improved during the year, new specific provisions were raised against two sizeable corporate accounts as a consequence of business failure in one case and fraud in the other.
Private Banking’spre-tax loss, before goodwill amortisation, of US$2 million compared with a loss of US$12 million in 2002. A lower bad debt charge reflected an improvement in the overall credit quality of the segment.
113
Back to Contents
H S B C H O L D I N G S P L C
Financial Review(continued)
Within theOther customer group, there was a US$113 million release of the special general provision raised in respect of Argentina. This release followed a period of improved market conditions and collections within the lending portfolios.
Provisions for contingent liabilities and commitments reflected court decisions (amparos) relating to formally frozen US dollar denominated customer deposits required to be settled at the prevailing market rate.
114
Back to Contents
Profit/(loss) excluding goodwill amortisation by customer group
| | Year ended 31 December 2004 | |
| |
| |
| | | | | | Corporate, | | | | | | | | | |
| | Personal | | | | Investment | | | | | | Inter- | | | |
| | Financial | | Commercial | | Banking & | | Private | | | | segment | | | |
| | Services | | Banking | | Markets | | Banking | | Other | | elimination | | Total | |
| South America | US$m | | US$m | | US$m | | US$m | | US$m | | US$m | | US$m | |
| | | | | | | | | | | | | | | |
| Net interest income | 895 | | 234 | | 165 | | 4 | | 57 | | – | | 1,355 | |
| | | | | | | | | | | | | | | |
| Dividend income | – | | – | | – | | – | | 2 | | – | | 2 | |
| Net fees and commissions | 358 | | 119 | | 66 | | 12 | | (75) | | – | | 480 | |
| Dealing profits | 4 | | 5 | | 41 | | – | | – | | – | | 50 | |
| Other income | 69 | | 12 | | 22 | | 1 | | 131 | | (28) | | 207 | |
| | | | | | | | | | | | | | | |
| Other operating income | 431 | | 136 | | 129 | | 13 | | 58 | | (28 | ) | 739 | |
| |
| |
| |
| |
| |
| |
| |
| |
| Operating income | 1,326 | | 370 | | 294 | | 17 | | 115 | | (28 | ) | 2,094 | |
| | | | | | | | | | | | | | | |
Operating expenses excluding goodwill amortisation1 | (1,010 | ) | (203 | ) | (135 | ) | (16 | ) | (108 | ) | 28 | | (1,444 | ) |
| |
| |
| |
| |
| |
| |
| |
| |
Operating profit before provisions1 | 316 | | 167 | | 159 | | 1 | | 7 | | – | | 650 | |
| | | | | | | | | | | | | | | |
Provisions for bad and doubtful debts | (270 | ) | (2 | ) | 2 | | – | | 1 | | – | | (269 | ) |
| Provisions for contingent liabilities and commitments | 1 | | – | | (10 | ) | – | | 39 | | – | | 30 | |
| Amounts written off fixed asset investments | – | | – | | (2 | ) | – | | (4 | ) | – | | (6 | ) |
| |
| |
| |
| |
| |
| |
| |
| |
| Operating profit1 | 47 | | 165 | | 149 | | 1 | | 43 | | – | | 405 | |
| | | | | | | | | | | | | | | |
Share of operating profit in associates2 | – | | – | | – | | – | | 1 | | – | | 1 | |
| Gains on disposal of investments and tangible fixed assets | – | | – | | 1 | | – | | 37 | | – | | 38 | |
| |
| |
| |
| |
| |
| |
| |
| |
Profit on ordinary activities before tax3 | 47 | | 165 | | 150 | | 1 | | 81 | | – | | 444 | |
| |
| |
| |
| |
| |
| |
| |
| |
| | | | | | | | | | | | | | | |
| | % | | % | | % | | % | | % | | | | % | |
Share of HSBC’s pre-tax profits3 | 0.2 | | 0.8 | | 0.8 | | – | | 0.5 | | | | 2.3 | |
| Cost:income ratio1 | 76.2 | | 54.9 | | 45.9 | | 94.1 | | 93.9 | | | | 69.0 | |
| | | | | | | | | | | | | | | |
| | US$m | | US$m | | US$m | | US$m | | US$m | | | | US$m | |
| Selected balance sheet data4 | | | | | | | | | | | | | | |
| Loans and advances to customers (net) | 3,211 | | 1,526 | | 1,854 | | 2 | | 340 | | | | 6,933 | |
| Total assets | 5,796 | | 2,408 | | 7,685 | | 34 | | 1,474 | | | | 17,397 | |
| Customer accounts | 3,458 | | 2,229 | | 5,150 | | 11 | | 109 | | | | 10,957 | |
| The following assets and liabilities were also significant to Corporate,Investment Banking and Markets: | | | | | | | | | | | | | | |
| Loans and advances to banks (net) | | | | | 1,779 | | | | | | | | | |
Debt securities, treasury bills and other eligible bills | | | | | 3,004 | | | | | | | | | |
| Deposits by banks | | | | | 549 | | | | | | | | | |
| | | | | | | | | | | | | | | |
| Goodwill amortisation excluded: | | | | | | | | | | | | | | |
| 1 from (1) above | 23 | | 1 | | 5 | | – | | – | | | | 29 | |
| 2 from (2) above | – | | – | | – | | – | | – | | | | – | |
| 3 from (3) above | 23 | | 1 | | 5 | | – | | – | | | | 29 | |
| 4 Third party only. | | | | | | | | | | | | | | |
115
Back to Contents
H S B C H O L D I N G S P L C
Financial Review(continued)
Profit/(loss) excluding goodwill amortisation by customer group(continued)
| | Year ended 31 December 2003 | |
| |
| | | | | Corporate, | | | | | | | | | |
| Personal | | Investment | | | Inter- | | |
| Financial | Commercial | Banking & | Private | | segment | | |
| Services | Banking | Markets | Banking | Other | elimination | Total | |
| South America | US$m | US$m | US$m | US$m | US$m | US$m | US$m | |
| | | | | | | | | | | | | | | |
| Net interest income/(expense) | 499 | | 168 | | (51 | ) | 2 | | 22 | | – | | 640 | |
| | | | | | | | | | | | | | | |
| Dividend income | – | | – | | – | | – | | 3 | | – | | 3 | |
| Net fees and commissions | 245 | | 94 | | 54 | | 14 | | (69) | | – | | 338 | |
| Dealing profits | 2 | | 7 | | 118 | | 1 | | 8 | | – | | 136 | |
| Other income | 69 | | 14 | | 36 | | 1 | | 119 | | (38) | | 201 | |
| | | | | | | | | | | | | | | |
| Other operating income | 316 | | 115 | | 208 | | 16 | | 61 | | (38 | ) | 678 | |
| |
| |
| |
| |
| |
| |
| |
| |
Operating income | 815 | | 283 | | 157 | | 18 | | 83 | | (38 | ) | 1,318 | |
| | | | | | | | | | | | | | | |
| Operating expenses excluding goodwill amortisation1 | (706 | ) | (173 | ) | (113 | ) | (21 | ) | (100 | ) | 38 | | (1,075 | ) |
| |
| |
| |
| |
| |
| |
| |
| |
Operating profit/(loss) before provisions1 | 109 | | 110 | | 44 | | (3 | ) | (17 | ) | – | | 243 | |
| | | | | | | | | | | | | | | |
| Provisions for bad and doubtful debts | (138 | ) | (11 | ) | (26 | ) | 1 | | 116 | | – | | (58 | ) |
| Provisions for contingent liabilities and commitments | 10 | | – | | – | | – | | (17 | ) | – | | (7 | ) |
| Amounts written off fixed asset investments | (17 | ) | – | | (44 | ) | – | | (1 | ) | – | | (62 | ) |
| |
| |
| |
| |
| |
| |
| |
| |
| Operating profit/(loss)1 | (36 | ) | 99 | | (26 | ) | (2 | ) | 81 | | – | | 116 | |
| | | | | | | | | | | | | | | |
Share of operating profit in associates2 | – | | – | | 1 | | – | | – | | – | | 1 | |
Gains/(losses) on disposal of investments and tangible fixed assets | 9 | | – | | 1 | | – | | (1 | ) | – | | 9 | |
| |
| |
| |
| |
| |
| |
| |
| |
Profit/(loss) on ordinary activities before tax3 | (27 | ) | 99 | | (24 | ) | (2 | ) | 80 | | – | | 126 | |
| |
| |
| |
| |
| |
| |
| |
| |
| | | | | | | | | | | | | | | |
| | % | | % | | % | | % | | % | | | | % | |
Share of HSBC’s pre-tax profits3 | (0.2 | ) | 0.7 | | (0.2 | ) | 0.0 | | 0.6 | | | | 0.9 | |
| Cost:income ratio1 | 86.6 | | 61.1 | | 72.0 | | 116.7 | | 120.5 | | | | 81.6 | |
| | | | | | | | | | | | | | | |
| | US$m | | US$m | | US$m | | US$m | | US$m | | | | US$m | |
Selected balance sheet data4 | | | | | | | | | | | | | | |
| Loans and advances to customers (net) | 2,224 | | 852 | | 1,679 | | 16 | | 211 | | | | 4,982 | |
| Total assets | 4,211 | | 1,357 | | 5,505 | | 70 | | 1,406 | | | | 12,549 | |
| Customer accounts | 2,035 | | 1,429 | | 3,108 | | 61 | | 312 | | | | 6,945 | |
| The following assets and liabilities were also significant to Corporate, Investment Banking and Markets: | | | | | | | | | | | | | | |
| Loans and advances to banks (net) | | | | | 1,384 | | | | | | | | | |
| Debt securities, treasury bills and other eligible bills | | | | | 1,311 | | | | | | | | | |
| Deposits by banks | | | | | 593 | | | | | | | | | |
| | | | | | | | | | | | | | | |
| Goodwill amortisation excluded: | | | | | | | | | | | | | | |
| 1 from (1) above | 4 | | – | | 6 | | – | | 1 | | | | 11 | |
| 2 from (2) above | – | | – | | – | | – | | – | | | | – | |
| 3 from (3) above | 4 | | – | | 6 | | – | | 1 | | | | 11 | |
| 4 Third party only. | | | | | | | | | | | | | | |
116
Back to Contents
| | Year ended 31 December 2002 | |
| |
| |
| | Personal
Financial
Services | | Commercial
Banking | | Corporate,
Investment
Banking &
Markets | | Private
Banking | | Other | | Inter-
segment
elimination | | Total | |
| South America | US$m | | US$m | | US$m | | US$m | | US$m | | US$m | | US$m | |
| | | | | | | | | | | | | | | |
| Net interest income/(expense) | 539 | | 126 | | (5 | ) | 6 | | (21 | ) | – | | 645 | |
| | | | | | | | | | | | | | | |
| Dividend income | – | | – | | 1 | | – | | 14 | | – | | 15 | |
| Net fees and commissions | 218 | | 87 | | 67 | | 12 | | (60) | | – | | 324 | |
| Dealing profits/(losses) | 10 | | 9 | | 120 | | (3) | | 11 | | – | | 147 | |
| Other income/(expenses) | 11 | | 4 | | (18) | | – | | 135 | | (22) | | 110 | |
| | | | | | | | | | | | | | | |
| Other operating income | 239 | | 100 | | 170 | | 9 | | 100 | | (22 | ) | 596 | |
| |
| |
| |
| |
| |
| |
| |
| |
| Operating income | 778 | | 226 | | 165 | | 15 | | 79 | | (22 | ) | 1,241 | |
| | | | | | | | | | | | | | | |
| Operating expenses excluding | | | | | | | | | | | | | | |
| goodwill amortisation1 | (691 | ) | (147 | ) | (106 | ) | (17 | ) | (121 | ) | 22 | | (1,060 | ) |
| |
| |
| |
| |
| |
| |
| |
| |
| Operating profit/(loss) before | | | | | | | | | | | | | | |
| provisions1 | 87 | | 79 | | 59 | | (2 | ) | (42 | ) | – | | 181 | |
| Provisions for bad and doubtful | | | | | | | | | | | | | |
| debts | (100 | ) | – | | (15 | ) | (7 | ) | 5 | | – | | (117 | ) |
| Provisions for contingent liabilities | | | | | | | | | | | | | | |
| and commitments | (19 | ) | – | | – | | – | | (80 | ) | – | | (99 | ) |
| Amounts written off fixed asset | | | | | | | | | | | | | | |
| investments | (1 | ) | – | | (22 | ) | – | | (13 | ) | – | | (36 | ) |
| |
| |
| |
| |
| |
| |
| |
| |
| Operating profit/(loss)1 | (33 | ) | 79 | | 22 | | (9 | ) | (130 | ) | – | | (71 | ) |
| | | | | | | | | | | | | | | |
| Gains/(losses) on disposal of | | | | | | | | | | | | | | |
| investments and tangible fixed | | | | | | | | | | | | | | |
| assets | – | | – | | 10 | | (3 | ) | 30 | | – | | 37 | |
| |
| |
| |
| |
| |
| |
| |
| |
| Profit/(loss) on ordinary activities | | | | | | | | | | | | | | |
| before tax1 | (33 | ) | 79 | | 32 | | (12 | ) | (100 | ) | – | | (34 | ) |
| |
| |
| |
| |
| |
| |
| |
| |
| | % | | % | | % | | % | | % | | | | % | |
| Share of HSBC’s pre-tax profits1 | (0.3 | ) | 0.8 | | 0.3 | | (0.1 | ) | (1.0 | ) | | | (0.3 | ) |
| Cost:income ratio1 | 88.8 | | 65.0 | | 64.2 | | 113.3 | | 153.2 | | | | 85.4 | |
| | | | | | | | | | | | | | | |
| | US$m | | US$m | | US$m | | US$m | | US$m | | | | US$m | |
| Selected balance sheet data2 | | | | | | | | | | | | | | |
| Loans and advances to | | | | | | | | | | | | | | |
| customers (net) | 1,094 | | 505 | | 1,401 | | 28 | | – | | | | 3,028 | |
| Total assets | 2,062 | | 704 | | 4,273 | | 37 | | 1,415 | | | | 8,491 | |
| Customer accounts | 1,366 | | 934 | | 2,477 | | 44 | | 42 | | | | 4,863 | |
| The following assets and liabilities | | | | | | | | | | | | | | |
| were also significant to Corporate, | | | | | | | | | | | | | | |
| Investment Banking and Markets: | | | | | | | | | | | | | | |
| Loans and advances to banks (net) | | | | | 987 | | | | | | | | | |
| Debt securities, treasury bills and | | | | | | | | | | | | | | |
| other eligible bills | | | | | 977 | | | | | | | | | |
| Deposits by banks | | | | | 609 | | | | | | | | | |
| | | | | | | | | | | | | | | |
| Goodwill amortisation excluded: | | | | | | | | | | | | | | |
| 1 from (1) above | 18 | | – | | 4 | | 1 | | 1 | | | | 24 | |
| 2 Third party only. | | | | | | | | | | | | | | |
117
Back to Contents
H S B C H O L D I N G S P L C
Financial Review (continued)
| Critical accounting policies |
|
Introduction
The results of HSBC Holdings are sensitive to the accounting policies, assumptions and estimates that underlie the preparation of its consolidated financial statements. The accounting policies used in the preparation of the consolidated financial statements are described in detail in Note 2 in the ‘Notes on the Financial Statements’ on pages 243 to 356.
When preparing the financial statements, it is the directors’ responsibility under UK company law to select suitable accounting policies and to make judgements and estimates that are reasonable and prudent. Under UK GAAP, Financial Reporting Standard (‘FRS’) 18 ‘Accounting policies’ requires the Group to adopt the most appropriate accounting policies in order to give a true and fair view.
HSBC also provides details of its net income and shareholders’ equity calculated in accordance with US GAAP. US GAAP differs in certain respects from UK GAAP. Details of these differences are set out in Note 49 in the ‘Notes on the Financial Statements’ on pages 322 to 356.
The accounting policies that are deemed critical to HSBC’s UK GAAP results and financial position, in terms of materiality and the degree of judgement and estimation involved, are discussed below.
Provisions for bad and doubtful debts
HSBC’s accounting policy for provisions for bad and doubtful debts on customer loans is described in Note 2(c) in the ‘Notes on the Financial Statements’ on pages 244 to 246.
Charges for provisions for bad and doubtful debts are reflected in HSBC’s profit and loss account under the caption ‘Provision for bad and doubtful debts’. Any increase in these provisions has the effect of lowering HSBC’s profit on ordinary activities by a corresponding amount (while any decrease in provisions or release of provisions would have the opposite effect).
Specific provisions
Specific provisions are established either on a portfolio basis or on a case-by-case basis depending on the nature of the exposure and the manner in which risks inherent in that exposure are managed. In addition, provisions for the sovereign risk inherent in cross-border credit exposures are established for certain countries; this element is not currently significant.
When specific provisions are raised on a portfolio basis, the most important factors in calculating the quantum of the required provision are:
| • | the roll or loss rates set for each category; and |
| | |
| • | the periods embedded in the calculations of roll and loss rates which are designed to reflect fully but not excessively losses inherent at the reporting date and not future losses. |
The portfolio basis is applied to overdue accounts in HSBC Finance Corporation’s consumer portfolios and to the following portfolios in the rest of HSBC:
| • | low value, homogeneous small business accounts in certain jurisdictions; |
| | |
| • | residential mortgages less than 90 days overdue; and |
| | |
| • | credit cards and other unsecured consumer lending products. |
When establishing specific provisions on a case-by-case basis, the most important factors are:
| • | the Group’s aggregate exposure to the customer (including contingent liabilities); |
| | |
| • | the viability of the customer’s business model and capability to trade successfully out of financial difficulties and generate sufficient cash flow to service debt obligations; |
| | |
| • | the likely dividend available on liquidation or bankruptcy; |
| | |
| • | the extent of other creditors’ commitments ranking ahead of, or pari passu with, the Group and the likelihood of other creditors continuing to support the company; |
| | |
| • | the complexity of determining the aggregate amount and ranking of all creditor claims and the extent to which legal and insurance uncertainties are evident; |
| | |
| • | the amount and timing of expected receipts and recoveries; |
| | |
| • | the realisable value of security (or other credit mitigants) and likelihood of successful repossession; |
| | |
| • | the deduction of any costs involved in recovery of amounts outstanding; |
| | |
| • | the ability of the borrower to obtain and make payments in the relevant foreign currency if loans are not in local currency; and, |
118
Back to Contents
| • | where available, the secondary market price for the debt. |
In many cases, the determination of these factors will be judgemental, because either the security may not be readily marketable or the cashflows will require an assessment of the customer’s future performance or the impact of litigation. HSBC’s practice is to make estimates against these factors and to review and update them regularly. If management were to take a more cautious view of the customer’s future cash flows (either by being less optimistic of the ability of the customer to generate profits or general economic conditions) or the availability or value of any security, the provision charge would be higher and HSBC’s profit on ordinary activities would be lower.
This method of determining provisions is applied to most corporate loans and, with the exception of HSBC Finance Corporation, which utilises portfolio analysis, to residential mortgages 90 days or more overdue.
HSBC has no individual loans where changes in the underlying factors upon which specific bad and doubtful debt provisions have been established could cause a material change to the Group’s reported results.
General provisions
General provisions augment specific provisions and provide cover for loans which are impaired at the balance sheet date but which will not be identified as such until some time in the future. HSBC requires each operating company to maintain a general provision which is determined by taking into account the structure and risk characteristics of each company’s loan portfolios. Provisions held against homogeneous portfolios of assets which are not overdue and which have neither been restructured nor are in bankruptcy are classified as general rather than specific.
The most important factors in determining general loan loss provisions are:
| • | historical loss experience in portfolios of similar risk characteristics, for example, by industry sector, loan grade or product; |
| | |
| • | the estimated period between a loss occurring and that loss being identified and evidenced by the establishment of a specific provision against that loss; and |
| | |
| • | management’s judgement as to whether the current economic and credit conditions are such that the actual level of inherent losses is likely to |
| | be greater or less than that suggested by historical experience. |
The main areas of judgement are in determining the periods during which latent losses emerge and assessing whether current economic conditions are likely to produce credit default rates and loss severity in line with historical precedent. These factors are kept under review based on an analysis of economic forecasts, industry sector performance, insolvency and bankruptcy statistics, together with details of the rate and nature of losses experienced.
If management were to take a more conservative view of economic conditions or increase the loss emergence periods, the provisions charged would increase and HSBC’s profit on ordinary activities would be lower.
Goodwill impairment
HSBC’s accounting policy for goodwill is described in Note 2(f) in the ‘Notes on the Financial Statements’ on page 247.
Amortisation of goodwill is recorded on HSBC’s profit and loss account under the caption ‘Depreciation and Amortisation – Goodwill’. Any impairments or reductions of goodwill are also charged to the profit and loss account (hence reducing HSBC’s operating profit on ordinary activities after tax by a corresponding amount) and also result in a corresponding reduction of ‘Goodwill’ on the balance sheet.
In accordance with the requirements of FRS 10 ‘Goodwill and intangible assets’, HSBC reviews goodwill which has arisen on the acquisition of subsidiary undertakings, joint ventures and interests in associates at the end of the first full year after an acquisition, and whenever there is an indication that impairment may have taken place. Impaired goodwill is accounted for in accordance with FRS 11 ‘Impairment of fixed assets and goodwill’.Indications of impairment include any events or changes in circumstance that cast doubt on the recoverability of the carrying amount of goodwill.
If management believes that a possible impairment is indicated in respect of a particular entity, the valuations of each of the entity’s relevant ‘Income Generating Units’ (‘IGUs’) are compared with their respective carrying values (including related goodwill). The IGU valuations are derived from discounted cashflow models. Significant management judgement is involved in two elements of the process of identifying and evaluating goodwill impairment.
119
Back to Contents
H S B C H O L D I N G S P L C
FinancialReview(continued)
First, the cost of capital assigned to an individual IGU and used to discount its future cash flows can have a significant effect on its valuation. The cost of capital percentage is generally derived from an appropriate capital asset pricing model, which itself depends on a number of financial and economic variables which are established on the basis of management’s judgement.
Second, management judgement is required in deriving discounted cash flow valuations of IGUs. These valuations are sensitive to the cash flows in the initial periods for which detailed forecasts are available, and to assumptions regarding the long-term sustainable growth rates of cash flows thereafter. While the acceptable range within which underlying assumptions can be applied is governed by the requirement for resulting forecasts to be compared with actual performance and verifiable economic data in future years, the cash flow forecasts necessarily reflect management’s view of future business prospects.
Where management’s judgement is that the expected cash flows of an IGU have declined and/or that its cost of capital has increased, the effect will be to reduce the estimated fair value of the IGU. If this results in an estimated fair value that is lower than the carrying value of the IGU, an impairment of goodwill will be recorded and HSBC’s profit on ordinary activities will be lower.
Valuation of securities and derivatives
HSBC’s accounting policy for these instruments is described in Note 2 (d) and Note 2 (l) in the ‘Notes on the Financial Statements’ on pages 246 and 248.
HSBC carries debt and equity securities and derivatives held for trading purposes at fair or ‘mark-to-market’ value. The mark-to-market of a financial instrument is defined as the amount at which the instrument could be exchanged in a current transaction between willing parties, other than in a forced or liquidation sale. For those debt and equity securities not held for trading purposes, and carried in the accounts at amortised historical cost, consideration as to whether any such asset should be written down to reflect impairment takes into account the fair value of the relevant security. Non-trading derivatives (which are primarily interest rate swaps) are accounted for on an accruals basis. Changes in the value of securities and derivatives held for trading purposes are reflected in ‘Dealing profits’ and hence directly impact HSBC’s profit on ordinary activities. Any impairment in the value of debt and equity securities not held for trading purposes is reported in ‘Amounts written of fixed
asset investments’ and hence reduces HSBC’s profit on ordinary activities.
The majority of the Group’s financial instruments held for trading purposes are valued based on quoted market prices. Where quoted market prices are not available, the fair value reflects management’s assessment of the value of these financial instruments. This assessment may look to a valuation of comparable instruments for which an independent price can be established or use a discounted cash flow model (particularly for debt securities and derivatives) or model the valuation of complex instruments based on a components approach where independent pricing is available for the underlying components, including interest rate yield curves, option volatilities and currency rates.
The main factors which management considers when applying a cash flow model are:
| • | the likelihood and expected timing of future cash flows on the instrument. These cash flows are usually governed by the terms of the instrument, although management judgement may be required in situations where the ability of the counterparty to service the instrument in accordance with its contractual terms is in doubt; and |
| | |
| • | an appropriate discount rate for the instrument. Again, management determines this rate, based on its assessment of the appropriate spread of the rate for the instrument over the risk free rate. |
When valuing instruments by reference to comparable instruments management takes into account the maturity, structure and rating of the instrument to which the position held is being compared.
When valuing instruments on a model basis using the fair value of underlying components, management additionally considers the need for adjustments to take account of counterparty creditworthiness, model uncertainty and the future costs of servicing the portfolio. These adjustments are based on defined policies which are applied consistently across the Group.
For derivatives where market observable data are not available, the initial increase in fair value indicated by the valuation model, but based on unobservable inputs, is not recognised immediately in the profit and loss account. This amount is held back and recognised over the life of the transaction in a systematic manner where appropriate, or released to the profit and loss account when the inputs become observable, or, when the transaction matures or is closed out.
Back to Contents
For securities carried at amortised cost impairment may result from changes in their estimated fair value if management changes its assumptions regarding the above variables. In such circumstances, it will also be necessary for management to exercise judgement as to whether or not the indicative change in estimated fair value
arising from revisions to the underlying valuation assumptions are only temporary.
The table below summarises HSBC’s trading portfolios by valuation methodology at 31 December 2004:
| | Trading assets | | Trading liabilities | |
| |
| |
| |
| | Securities | | | | Securities | | | |
| | purchased | | Derivatives | | sold | | Derivatives | |
| | % | | % | | % | | % | |
| Fair value based on: | | | | | | | | |
| Quoted market prices | 81.0 | | 6.0 | | 81.0 | | 6.0 | |
| Internal models with significant observable market parameters | 18.0 | | 93.0 | | 19.0 | | 94.0 | |
| Internal models with significant unobservable market parameters | 1.0 | | 1.0 | | – | | – | |
| |
| |
| |
| |
| |
| Total | 100.0 | | 100.0 | | 100.0 | | 100.0 | |
| |
| |
| |
| |
| |
For a discussion of market risk management, see Market Risk Management on pages 167 to 172.
| UK GAAP compared with US GAAP | | | | | | |
|
| | | | | | | |
| | 2004 | | 2003 | | 2002 | |
| | US$m | | US$m | | US$m | |
| Net income | | | | | | |
| US GAAP | 12,506 | | 7,231 | | 4,900 | |
| UK GAAP | 11,840 | | 8,774 | | 6,239 | |
| Shareholders’ equity | | | | | | |
| US GAAP | 90,082 | | 80,251 | | 55,831 | |
| UK GAAP | 86,623 | | 74,473 | | 51,765 | |
Differences in net income and shareholders’ equity are explained in Note 49 of the ‘Notes on the Financial Statements on pages 322 to 356.
Future accounting developments
Transition to International Financial Reporting Standards
The adoption of International Financial Reporting Standards (‘IFRS’) from 1 January 2005 is the most significant accounting development for HSBC.
The European Union (‘EU’) requires that listed European companies prepare their 2005 financial statements in accordance with EU-endorsed IFRS. HSBC’s 2005 interim financial statements will, therefore, be prepared in accordance with IFRS. The European Union endorsement process for IFRS is ongoing but the majority of standards are now endorsed including IAS 32 ‘Financial Instruments: Disclosure and Presentation’ and most of IAS 39 ‘Financial Instruments: Recognition and Measurement’ with the exception of the deletion of a limited number of words and paragraphs in IAS 39
including those relating to the use of the ‘fair value option’ for financial liabilities.
HSBC has substantially completed its transition to IFRS. The process of refining systems and processes in order to collect data on a fully IFRS-compliant basis for 2005 reporting is well advanced.
On 9 December 2004, HSBC filed with the US Securities and Exchange Commission a summary of the applicable significant differences between UK GAAP and IFRS. This should be referred to for details of the major IFRS effects on HSBC Group, and is included as Annex A to this annual report.
IFRS will also impact HSBC Holdings’ individual accounts. Investments in subsidiary undertakings will be carried at cost rather than net asset value, including attributable goodwill, adjusted for shares held by subsidiaries in HSBC Holdings. Under IFRS, in addition to the balance sheet, HSBC Holdings will publish an income statement and other primary financial statements.
HSBC currently intends to file 2004 comparative data and the 2005 opening balance sheet on an IFRS basis in the second quarter of 2005.
FRS 27 ‘Life Assurance’ was issued by the UK Accounting Standards Board (‘ASB’) in December 2004. This standard is effective under UK GAAP for 2005 reporting and thus should not ostensibly be applicable to companies adopting IFRS for 2005. However, FRS 27 adds to the requirements of IFRS 4 ‘Insurance contracts’ with regard to further requirements in relation to measurement of realistic liabilities and disclosure of capital position. HSBC continues to assess the likely impact of this accounting standard.
Back to Contents
H S B C H O L D I N G S P L C
FinancialReview(continued)
US GAAP
The Financial Accounting Standards Board (‘FASB’) (US GAAP) has issued the following accounting standards, which become fully effective in future financial statements.
In December 2003, the American Institute of Certified Public Accountants (‘AICPA’) released Statement of Position 03-3, ‘Accounting for Certain Loans or Debt Securities Acquired in a Transfer’ (‘SOP 03-3’). SOP 03-3 addresses accounting for differences between contractual cash flows and cash flows expected to be collected from an investor’s initial investment in loans or debt securities acquired in a transfer if those differences are attributable to credit quality. SOP 03-3 is effective for loans acquired in fiscal years beginning after 15 December 2004. Adoption is not expected to have a material impact on the US GAAP information in HSBC’s financial statements.
In March 2004, the FASB reached a consensus on Emergent Issues Task Force (‘EITF’) 03-1, ‘The Meaning of Other-Than-Temporary Impairment and Its Application to Certain Investments’. EITF 03-1 provides guidance for determining when an investment is impaired and whether the impairment is other than temporary. EITF 03-1 also incorporates into its consensus the required disclosures about unrealised losses on investments announced by the EITF in late 2003 and adds new disclosure requirements relating to cost-method investments. The new disclosure requirements are effective for annual reporting periods ending after June 15, 2004 and the new impairment accounting guidance was to become effective for reporting periods beginning after June 15, 2004. In September 2004, the FASB delayed the effective date of EITF 03-1 for measurement and recognition of impairment losses until implementation guidance is iss ued. In December 2004, the FASB decided to reconsider in
its entirety all guidance on disclosing, measuring and recognising other-than-temporary impairments of debt and equity securities and requires companies to continue to comply with existing accounting literature. Until the new guidance is finalised, the impact on HSBC’s financial position and results of operations cannot be determined.
SFAS 123 (revised 2004) ‘Share-Based Payment’ (‘SFAS 123R’) was issued in December 2004 to replace SFAS 123 ‘Accounting for Stock Based Compensation’ (‘SFAS 123’). SFAS 123R requires a fair value method of accounting for stock-based compensation plans. Under the fair value method, compensation cost is measured at the date of grant based on the value of the award and is recognised over the service period. HSBC had already elected to follow the fair value method encouraged by SFAS 123. Where annual bonuses are awarded in restricted shares, and the employee must remain with HSBC for a fixed period in order to receive the shares, HSBC has, to date, interpreted the service period as being the year to which the bonus relates. HSBC has fully expensed the share award in that year under US GAAP, consistent with the UK GAAP treatment. Under SFAS 123R, the service period is presumed to be the vesting period, i.e. the period the employee must remain with HSBC. Accordingly, for awards granted after the effective date of SFAS 123R, the expense of such awards will be spread forward over the vesting period. HSBC will adopt SFAS 123R from 1 July 2005.
The effect of adopting this new accounting treatment will be that 2005 bonuses paid in restricted shares will be excluded from staff costs for 2005 and instead will be expensed over the vesting period with a corresponding increase in net income. The amount of these awards is dependent on 2005 performance. 2004 bonuses that will be paid in restricted shares were approximately US$130 million.
Back to Contents
| Average balance sheet and net interest income |
|
Average balances and the related interest are shown for the domestic operations of HSBC’s principal
commercial banks by geographic region with all other commercial banking and investment banking balances and transactions included in ‘Other operations’. Additional information on the basis of preparation is set out in the notes on page 130.
| | | | Year ended 31 December | |
| | | |
| |
| | | | 2004 | | 2003 | | 2002 | |
| | | |
| |
| |
| |
| | | | Average | | Interest | | | | Average | | Interest | | | | Average | | Interest | | | |
| Assets | | | balance | | income | | Yield | | balance | | income | | Yield | | balance | | income | | Yield | |
| | | | US$m | | US$m | | % | | US$ | | US$m | | % | | US$m | | US$m | | % | |
| Short-term funds and loans to banks | | | | | | | | | | | | | | | | | | |
| | | | | | | | | | | | | | | | | | | | | |
| Europe | | HSBC Bank | 24,308 | | 672 | | 2.76 | | 22,534 | | 657 | | 2.92 | | 16,691 | | 595 | | 3.56 | |
| | | HSBC Private Banking | | | | | | | | | | | | | | | | | | |
| | | Holdings (Suisse) | 2,644 | | 89 | | 3.37 | | 3,394 | | 75 | | 2.21 | | 5,500 | | 144 | | 2.62 | |
| | | CCF | 26,008 | | 960 | | 3.69 | | 17,519 | | 573 | | 3.27 | | 12,650 | | 647 | | 5.11 | |
| | | | | | | | | | | | | | | | | | | | | |
| Hong Kong | | Hang Seng Bank | 8,259 | | 219 | | 2.65 | | 10,172 | | 212 | | 2.08 | | 15,205 | | 409 | | 2.69 | |
| | | The Hongkong and | | | | | | | | | | | | | | | | | | |
| | | Shanghai Banking | | | | | | | | | | | | | | | | | | |
| | | Corporation | 28,172 | | 538 | | 1.91 | | 20,735 | | 517 | | 2.49 | | 17,776 | | 496 | | 2.79 | |
| | | | | | | | | | | | | | | | | | | | | |
| Rest of Asia- | | The Hongkong and | | | | | | | | | | | | | | | | | | |
| Pacific | | Shanghai Banking | | | | | | | | | | | | | | | | | | |
| | | Corporation | 9,180 | | 198 | | 2.16 | | 6,893 | | 138 | | 2.00 | | 6,686 | | 187 | | 2.80 | |
| | | HSBC Bank Malaysia | 1,348 | | 36 | | 2.67 | | 693 | | 17 | | 2.45 | | 547 | | 15 | | 2.74 | |
| | | HSBC Bank Middle East | 1,619 | | 29 | | 1.79 | | 1,925 | | 29 | | 1.51 | | 1,857 | | 39 | | 2.10 | |
| | | | | | | | | | | | | | | | | | | | | |
| North America | | HSBC Bank USA | 2,323 | | 56 | | 2.41 | | 1,808 | | 35 | | 1.94 | | 2,248 | | 63 | | 2.80 | |
| | | HSBC Bank Canada | 2,162 | | 45 | | 2.08 | | 1,711 | | 31 | | 1.81 | | 1,291 | | 26 | | 2.01 | |
| | | HSBC Markets Inc | 7,807 | | 91 | | 1.17 | | 2,535 | | 20 | | 0.79 | | 3,756 | | 48 | | 1.28 | |
| | | HSBC Mexico1 | 3,771 | | 227 | | 6.02 | | 4,199 | | 214 | | 5.10 | | 421 | | 32 | | 7.60 | |
| | | | | | | | | | | | | | | | | | | | | |
| South America | | Brazilian operations | 1,954 | | 237 | | 12.13 | | 1,237 | | 242 | | 19.56 | | 1,065 | | 177 | | 16.62 | |
| | | HSBC Bank Argentina | 250 | | 3 | | 1.20 | | 231 | | 2 | | 0.87 | | 164 | | 14 | | 8.54 | |
| Other operations | 11,201 | | 237 | | 2.12 | | 7,206 | | 159 | | 2.21 | | 8,577 | | 328 | | 3.82 | |
| |
| |
| | | |
| |
| | | |
| |
| | | |
| | | | 131,006 | | 3,637 | | 2.78 | | 102,792 | | 2,921 | | 2.84 | | 94,434 | | 3,220 | | 3.41 | |
| |
| |
| | | |
| |
| | | |
| |
| | | |
| | | | | | | | | | | | | | | | | | | | | |
| Loans and advances to customers | | | | | | | | | | | | | | | | | | |
| | | | | | | | | | | | | | | | | | | | | |
| Europe | | HSBC Bank | 168,175 | | 9,298 | | 5.53 | | 130,178 | | 6,739 | | 5.18 | | 105,456 | | 5,865 | | 5.56 | |
| | | HSBC Private Banking | | | | | | | | | | | | | | | | | | |
| | | Holdings (Suisse) | 4,700 | | 115 | | 2.45 | | 3,385 | | 79 | | 2.33 | | 2,881 | | 81 | | 2.81 | |
| | | CCF | 42,149 | | 1,892 | | 4.49 | | 37,456 | | 1,897 | | 5.06 | | 29,111 | | 1,657 | | 5.69 | |
| | | HSBC Finance | | | | | | | | | | | | | | | | | | |
| | | Corporation1 | 9,310 | | 1,055 | | 11.33 | | 5,934 | | 671 | | 11.31 | | – | | – | | – | |
| | | | | | | | | | | | | | | | | | | | | |
| Hong Kong | | Hang Seng Bank | 31,234 | | 882 | | 2.82 | | 29,138 | | 938 | | 3.22 | | 28,820 | | 1,083 | | 3.76 | |
| | | The Hongkong and | | | | | | | | | | | | | | | | | | |
| | | Shanghai Banking | | | | | | | | | | | | | | | | | | |
| | | Corporation | 41,906 | | 1,406 | | 3.36 | | 41,517 | | 1,517 | | 3.65 | | 39,040 | | 1,713 | | 4.39 | |
| | | | | | | | | | | | | | | | | | | | | |
| Rest of Asia- | | The Hongkong and | | | | | | | | | | | | | | | | | | |
| Pacific | | Shanghai Banking | | | | | | | | | | | | | | | | | | |
| | | Corporation | 37,068 | | 1,838 | | 4.96 | | 28,594 | | 1,457 | | 5.10 | | 22,898 | | 1,284 | | 5.61 | |
| | | HSBC Bank Malaysia | 4,937 | | 279 | | 5.65 | | 4,567 | | 266 | | 5.82 | | 4,237 | | 251 | | 5.92 | |
| | | HSBC Bank Middle East. | 7,421 | | 418 | | 5.63 | | 5,725 | | 352 | | 6.15 | | 5,243 | | 366 | | 6.98 | |
| | | | | | | | | | | | | | | | | | | | | |
| North America | | HSBC Bank USA | 61,659 | | 2,936 | | 4.76 | | 45,727 | | 2,256 | | 4.93 | | 44,130 | | 2,419 | | 5.48 | |
| | | HSBC Finance | | | | | | | | | | | | | | | | | | |
| | | Corporation1 | 114,461 | | 13,146 | | 11.49 | | 81,973 | | 9,631 | | 11.75 | | – | | – | | – | |
| | | HSBC Bank Canada | 22,603 | | 1,099 | | 4.86 | | 18,791 | | 982 | | 5.23 | | 15,631 | | 835 | | 5.34 | |
| | | HSBC Markets Inc | 9,170 | | 126 | | 1.37 | | 3,515 | | 24 | | 0.68 | | 8,975 | | 115 | | 1.28 | |
| | | HSBC Mexico1 | 8,095 | | 878 | | 10.85 | | 9,103 | | 862 | | 9.47 | | 913 | | 102 | | 11.17 | |
| | | | | | | | | | | | | | | | | | | | | |
| South America | | Brazilian operations | 4,758 | | 1,569 | | 32.98 | | 2,930 | | 1,044 | | 35.63 | | 2,542 | | 821 | | 32.30 | |
| | | HSBC Bank Argentina | 905 | | 101 | | 11.16 | | 792 | | 103 | | 13.01 | | 889 | | 261 | | 29.36 | |
| Other operations | | | 20,400 | | 864 | | 4.24 | | 20,284 | | 627 | | 3.09 | | 16,118 | | 671 | | 4.16 | |
| |
| |
| | | |
| |
| | | |
| |
| | | |
| | | | 588,951 | | 37,902 | | 6.44 | | 469,609 | | 29,445 | | 6.27 | | 326,884 | | 17,524 | | 5.36 | |
| |
| |
| | | |
| |
| | | |
| |
| | | |
| | | | | | | | | | | | | | | | | | | |
| 1 Yields annualised on the basis of the period of ownership in the year of acquisition. | | | | | | | | | | | | |
123
Back to Contents
H S B C H O L D I N G S P L C
Financial Review(continued)
| | | | Year ended 31 December | |
| | | |
| |
| | | | 2004 | | 2003 | | 2002 | |
| | | |
| |
| |
| |
| | | | Average | | Interest | | | | Average | | Interest | | | | Average | | Interest | | | |
| Assets(continued) | balance | | income | | Yield | | balance | | income | | Yield | | balance | | income | | Yield | |
| | | | US$m | | US$m | | % | | US$m | | US$m | | % | | US$m | | US$m | | % | |
| Trading securities | | | | | | | | | | | | | | | | | | |
| | | | | | | | | | | | | | | | | | | | | |
| Europe | | HSBC Bank | 23,093 | | 846 | | 3.66 | | 24,758 | | 945 | | 3.82 | | 25,104 | | 1,084 | | 4.32 | |
| | | CCF | 13,662 | | 365 | | 2.67 | | 7,043 | | 236 | | 3.35 | | 10,435 | | 235 | | 2.25 | |
| Hong Kong | | Hang Seng Bank | 336 | | 11 | | 3.27 | | 536 | | 15 | | 2.80 | | 569 | | 18 | | 3.16 | |
| | | The Hongkong and | | | | | | | | | | | | | | | | | | |
| | | Shanghai Banking Corporation | 11,209 | | 298 | | 2.66 | | 11,351 | | 334 | | 2.94 | | 11,915 | | 432 | | 3.63 | |
| | | | | | | | | | | | | | | | | | | | | |
| Rest of Asia-Pacific | | The Hongkong and
Shanghai Banking Corporation | 2,487 | | 101 | | 4.06 | | 2,823 | | 124 | | 4.39 | | 2,452 | | 112 | | 4.57 | |
| | | HSBC Bank Malaysia | 145 | | 5 | | 3.45 | | 377 | | 11 | | 2.92 | | 309 | | 9 | | 2.91 | |
| | | | | | | | | | | | | | | | | | | | | |
| North America | | HSBC Bank USA | 5,447 | | 115 | | 2.11 | | 4,236 | | 102 | | 2.41 | | 4,294 | | 140 | | 3.26 | |
| | | HSBC Bank Canada | 1,177 | | 25 | | 2.12 | | 774 | | 17 | | 2.20 | | 755 | | 18 | | 2.38 | |
| | | HSBC Markets Inc | 11,543 | | 421 | | 3.65 | | 8,837 | | 303 | | 3.43 | | 16,768 | | 752 | | 4.48 | |
| | | HSBC Mexico1 | 2,957 | | 173 | | 5.85 | | 4,303 | | 261 | | 6.07 | | 346 | | 27 | | 7.80 | |
| | | | | | | | | | | | | | | | | | | | | |
| South America | | Brazilian operations | 842 | | 129 | | 15.32 | | – | | – | | – | | 34 | | – | | – | |
| | | HSBC Bank Argentina | 19 | | 1 | | 5.26 | | 7 | | 1 | | 14.29 | | 2 | | – | | – | |
| Other operations | 10,239 | | 511 | | 4.99 | | 4,115 | | 138 | | 3.35 | | 1,818 | | 84 | | 4.62 | |
| |
| |
| | | |
| |
| | | |
| |
| | | |
| | | | 83,156 | | 3,001 | | 3.61 | | 69,160 | | 2,487 | | 3.60 | | 74,801 | | 2,911 | | 3.89 | |
| | | |
| |
| | | |
| |
| | | |
| |
| | | |
| Investment securities | | | | | | | | | | | | | | | | | | |
| | | | | | | | | | | | | | | | | | | |
| Europe | | HSBC Bank | 28,572 | | 1,145 | | 4.01 | | 16,449 | | 659 | | 4.01 | | 13,071 | | 623 | | 4.77 | |
| | | HSBC Private Banking | | | | | | | | | | | | | | | | | | |
| | | Holdings (Suisse) | 10,828 | | 303 | | 2.80 | | 14,298 | | 397 | | 2.78 | | 14,454 | | 503 | | 3.48 | |
| | | CCF | 6,957 | | 239 | | 3.44 | | 3,365 | | 210 | | 6.24 | | 2,052 | | 141 | | 6.87 | |
| | | HSBC Finance Corporation1 | 55 | | 1 | | 1.82 | | 231 | | 2 | | 0.87 | | – | | – | | – | |
| | | | | | | | | | | | | | | | | | | | | |
| Hong Kong | | Hang Seng Bank | 20,356 | | 479 | | 2.35 | | 16,458 | | 460 | | 2.79 | | 10,629 | | 375 | | 3.53 | |
| | | The Hongkong and | | | | | | | | | | | | | | | | | | |
| | | Shanghai Banking Corporation | 33,798 | | 779 | | 2.30 | | 31,774 | | 829 | | 2.61 | | 29,945 | | 955 | | 3.19 | |
| | | | | | | | | | | | | | | | | | | | | |
| Rest of Asia- | | The Hongkong and | | | | | | | | | | | | | | | | | | |
| Pacific | | Shanghai Banking Corporation | 15,902 | | 537 | | 3.38 | | 13,906 | | 487 | | 3.50 | | 10,534 | | 448 | | 4.25 | |
| | | HSBC Bank Malaysia | 1,156 | | 40 | | 3.46 | | 1,101 | | 37 | | 3.36 | | 981 | | 34 | | 3.47 | |
| | | HSBC Bank Middle East | 1,104 | | 27 | | 2.45 | | 873 | | 24 | | 2.75 | | 760 | | 30 | | 3.95 | |
| | | | | | | | | | | | | | | | | | | | | |
| North America | | HSBC Bank USA | 18,213 | | 884 | | 4.85 | | 18,753 | | 894 | | 4.77 | | 17,795 | | 927 | | 5.21 | |
| | | HSBC Finance Corporation1 | 4,153 | | 87 | | 2.09 | | 3,370 | | 59 | | 1.75 | | – | | – | | – | |
| | | HSBC Bank Canada | 2,814 | | 65 | | 2.31 | | 2,681 | | 75 | | 2.80 | | 2,440 | | 78 | | 3.20 | |
| | | HSBC Markets Inc | 18 | | 1 | | 5.56 | | 17 | | 1 | | 5.88 | | 17 | | 1 | | 5.88 | |
| | | HSBC Mexico1 | 3,822 | | 395 | | 10.33 | | 2,041 | | 254 | | 12.44 | | 175 | | 14 | | 8.00 | |
| | | | | | | | | | | | | | | | | | | | | |
| South America | | Brazilian operations | 1,380 | | 301 | | 21.81 | | 1,323 | | 250 | | 18.90 | | 1,470 | | 314 | | 21.36 | |
| | | HSBC Bank Argentina | 164 | | 12 | | 7.32 | | 120 | | 13 | | 10.83 | | 185 | | 34 | | 18.38 | |
| Other operations | 9,748 | | 196 | | 2.01 | | 8,056 | | 345 | | 4.28 | | 7,117 | | 323 | | 4.54 | |
| |
| |
| | | |
| |
| | | |
| |
| | | |
| | | | 159,040 | | 5,491 | | 3.45 | | 134,816 | | 4,996 | | 3.71 | | 111,625 | | 4,800 | | 4.30 | |
| | | |
| |
| | | |
| |
| | | |
| |
| | | |
| | | | | | | | | | | | | | | | | | | | | |
| 1 Yields annualised on the basis of the period of ownership in the year of acquisition. | | | | | | | | | | | |
124
Back to Contents
| | | | Year ended 31 December | |
| | | |
| |
| | | | 2004 | | 2003 | | 2002 | |
| | | |
| |
| |
| |
| | | | Average | | Interest | | | | Average | | Interest | | | | Average | | Interest | | | |
| Assets(continued) | balance | | income | | Yield | | balance | | income | | Yield | | balance | | income | | Yield | |
| | | | US$m | | US$m | | % | | US$m | | US$m | | % | | US$m | | US$m | | % | |
| Other interest-earning assets | | | | | | | | | | | | | | | | | | |
| | | | | | | | | | | | | | | | | | | |
| Europe | | HSBC Bank | 8,522 | | 351 | | 4.12 | | 6,190 | | 173 | | 2.79 | | 10,384 | | 198 | | 1.91 | |
| | | HSBC Private Banking | | | | | | | | | | | | | | | | | | |
| | | Holdings (Suisse) | 7,611 | | 146 | | 1.92 | | 5,420 | | 102 | | 1.88 | | 3,964 | | 119 | | 3.00 | |
| | | CCF | 7,534 | | 63 | | 0.84 | | 3,276 | | 34 | | 1.04 | | 2,701 | | 56 | | 2.07 | |
| | | | | | | | | | | | | | | | | | | | | |
| Hong Kong | | Hang Seng Bank | 701 | | 10 | | 1.43 | | 1,097 | | 25 | | 2.28 | | 1,158 | | 33 | | 2.85 | |
| | | The Hongkong and | | | | | | | | | | | | | | | | | | |
| | | Shanghai Banking | | | | | | | | | | | | | | | | | | |
| | | Corporation | 16,927 | | 316 | | 1.87 | | 12,680 | | 264 | | 2.08 | | 9,128 | | 238 | | 2.61 | |
| | | | | | | | | | | | | | | | | | | | | |
| Rest of Asia- | | The Hongkong and | | | | | | | | | | | | | | | | | | |
| Pacific | | Shanghai Banking | | | | | | | | | | | | | | | | | | |
| | | Corporation | 5,697 | | 117 | | 2.05 | | 4,511 | | 81 | | 1.80 | | 4,349 | | 87 | | 2.00 | |
| | | HSBC Bank Malaysia | 153 | | 1 | | 0.65 | | 22 | | 1 | | 4.55 | | 25 | | 1 | | 4.00 | |
| | | HSBC Bank Middle East | 200 | | 11 | | 5.50 | | 491 | | 9 | | 1.83 | | 744 | | 17 | | 2.28 | |
| | | | | | | | | | | | | | | | | | | | | |
| North America | | HSBC Bank USA | 784 | | 26 | | 3.32 | | 371 | | 17 | | 4.58 | | 320 | | 24 | | 7.50 | |
| | | HSBC Finance | | | | | | | | | | | | | | | | | | |
| | | Corporation1 | 651 | | 63 | | 9.68 | | 484 | | 23 | | 4.75 | | – | | – | | – | |
| | | HSBC Bank Canada | 234 | | 8 | | 3.42 | | 170 | | 10 | | 5.88 | | 1 | | 1 | | 100.00 | |
| | | HSBC Markets Inc | 683 | | 12 | | 1.76 | | 159 | | 4 | | 2.52 | | 64 | | 2 | | 3.13 | |
| | | HSBC Mexico1 | 336 | | 5 | | 1.49 | | 74 | | 3 | | 4.05 | | – | | – | | – | |
| | | | | | | | | | | | | | | | | | | | | |
| South America | | Brazilian operations | 284 | | 36 | | 12.68 | | 162 | | 27 | | 16.67 | | 196 | | 24 | | 12.24 | |
| | | HSBC Bank Argentina | 30 | | – | | – | | 44 | | 2 | | 4.55 | | 53 | | 6 | | 11.32 | |
| Other operations | (48,195 | ) | (993 | ) | | | (33,113 | ) | (656 | ) | | | (32,082 | ) | (666 | ) | | |
| |
| |
| | | |
| |
| | | |
| |
| | | |
| | | | 2,152 | | 172 | | 7.99 | | 2,038 | | 119 | | 5.84 | | 1,005 | | 140 | | 13.93 | |
| | | |
| |
| | | |
| |
| | | |
| |
| | | |
| Total interest-earning assets | | | | | | | | | | | | | | | | | | |
| | | | | | | | | | | | | | | | | | | |
| Europe | | HSBC Bank | 252,670 | | 12,312 | | 4.87 | | 200,109 | | 9,173 | | 4.58 | | 170,706 | | 8,365 | | 4.90 | |
| | | HSBC Private Banking | | | | | | | | | | | | | | | | | | |
| | | Holdings (Suisse) | 25,783 | | 653 | | 2.53 | | 26,497 | | 653 | | 2.46 | | 26,799 | | 847 | | 3.16 | |
| | | CCF | 96,310 | | 3,519 | | 3.65 | | 68,659 | | 2,950 | | 4.30 | | 56,949 | | 2,736 | | 4.80 | |
| | | HSBC Finance | | | | | | | | | | | | | | | | | | |
| | | Corporation1 | 9,365 | | 1,056 | | 11.28 | | 6,165 | | 673 | | 10.92 | | – | | – | | – | |
| | | | | | | | | | | | | | | | | | | | | |
| Hong Kong | | Hang Seng Bank | 60,886 | | 1,601 | | 2.63 | | 57,401 | | 1,650 | | 2.87 | | 56,381 | | 1,918 | | 3.40 | |
| | | The Hongkong and | | | | | | | | | | | | | | | | | | |
| | | Shanghai Banking | | | | | | | | | | | | | | | | | | |
| | | Corporation | 132,012 | | 3,337 | | 2.53 | | 118,057 | | 3,461 | | 2.93 | | 107,804 | | 3,834 | | 3.56 | |
| | | | | | | | | | | | | | | | | | | | | |
| Rest of Asia- | | The Hongkong and | | | | | | | | | | | | | | | | | | |
| Pacific | | Shanghai Banking | | | | | | | | | | | | | | | | | | |
| | | Corporation | 70,334 | | 2,791 | | 3.97 | | 56,727 | | 2,287 | | 4.03 | | 46,919 | | 2,118 | | 4.51 | |
| | | HSBC Bank Malaysia | 7,739 | | 361 | | 4.66 | | 6,760 | | 332 | | 4.91 | | 6,099 | | 310 | | 5.08 | |
| | | HSBC Bank Middle East | 10,344 | | 485 | | 4.69 | | 9,014 | | 414 | | 4.59 | | 8,604 | | 452 | | 5.25 | |
| | | | | | | | | | | | | | | | | | | | | |
| North America | | HSBC Bank USA | 88,426 | | 4,017 | | 4.54 | | 70,895 | | 3,304 | | 4.66 | | 68,787 | | 3,573 | | 5.19 | |
| | | HSBC Finance | | | | | | | | | | | | | | | | | | |
| | | Corporation1 | 119,265 | | 13,296 | | 11.15 | | 85,827 | | 9,713 | | 11.32 | | – | | – | | – | |
| | | HSBC Bank Canada | 28,990 | | 1,242 | | 4.28 | | 24,127 | | 1,115 | | 4.62 | | 20,118 | | 958 | | 4.76 | |
| | | HSBC Markets Inc | 29,221 | | 651 | | 2.23 | �� | 15,063 | | 352 | | 2.34 | | 29,580 | | 918 | | 3.10 | |
| | | HSBC Mexico1 | 18,981 | | 1,678 | | 8.84 | | 19,720 | | 1,594 | | 8.08 | | 1,855 | | 175 | | 9.43 | |
| | | | | | | | | | | | | | | | | | | | | |
| South America | | Brazilian operations | 9,218 | | 2,272 | | 24.65 | | 5,652 | | 1,563 | | 27.65 | | 5,307 | | 1,336 | | 25.17 | |
| | | HSBC Bank Argentina | 1,368 | | 117 | | 8.55 | | 1,194 | | 121 | | 10.13 | | 1,293 | | 315 | | 24.36 | |
| Other operations | 3,393 | | 815 | | 24.02 | | 6,548 | | 613 | | 9.36 | | 1,548 | | 740 | | 47.80 | |
| |
| |
| | | |
| |
| | | |
| |
| | | |
| | | | 964,305 | | 50,203 | | 5.21 | | 778,415 | | 39,968 | | 5.13 | | 608,749 | | 28,595 | | 4.70 | |
| | | |
| |
| | | |
| |
| | | |
| |
| | | |
| Summary | | | | | | | | | | | | | | | | | | | | |
| | | | | | | | | | | | | | | | | | | | | |
| Total interest-earning assets | 964,305 | | 50,203 | | 5.21 | | 778,415 | | 39,968 | | 5.13 | | 608,749 | | 28,595 | | 4.70 | |
| Provisions for bad and doubtful debts | (12,992 | ) | | | | | (12,816 | ) | | | | | (7,809 | ) | | | | |
| Non-interest earning assets | 218,143 | | | | | | 192,251 | | | | | | 132,227 | | | | | |
| |
| |
| | | |
| |
| | | |
| |
| | | |
| Total assets and interest income | 1,169,456 | | 50,203 | | 4.29 | | 957,850 | | 39,968 | | 4.17 | | 733,167 | | 28,595 | | 3.90 | |
| |
| |
| | | |
| |
| | | |
| |
| | | |
| 1 Yields annualised on the basis of the period of ownership in the year of acquisition. | | | | | | | | | | | |
125
Back to Contents
H S B C H O L D I N G S P L C
Financial Review(continued)
| | | Year ended 31 December | |
| | |
| |
| | | 2004 | | 2003 | | 2002 | |
| Assets (continued) | % | | % | | % | |
| | | | | | | | |
| Distribution of average total assets | | | | | | |
| | | | | | | |
| Europe | HSBC Bank | 27.5 | | 27.8 | | 28.7 | |
| | HSBC Private Banking | | | | | | |
| | Holdings (Suisse) | 2.4 | | 3.0 | | 3.8 | |
| | CCF | 10.5 | | 9.3 | | 9.7 | |
| | HSBC Finance | | | | | | |
| | Corporation | 1.0 | | 0.7 | | – | |
| | | | | | | | |
| Hong Kong | Hang Seng Bank | 5.6 | | 6.4 | | 7.9 | |
| | The Hongkong and | | | | | | |
| | Shanghai Banking Corporation | 15.9 | | 16.7 | | 18.6 | |
| | | | | | | | |
| Rest of Asia- | The Hongkong and | | | | | | |
| Pacific | Shanghai Banking Corporation | 6.9 | | 6.8 | | 7.1 | |
| | HSBC Bank Malaysia | 0.7 | | 0.7 | | 0.8 | |
| | HSBC Bank Middle East | 1.0 | | 1.0 | | 1.2 | |
| | | | | | | | |
| North America | HSBC Bank USA | 9.4 | | 9.6 | | 11.5 | |
| | HSBC Finance | | | | | | |
| | Corporation | 11.6 | | 10.2 | | – | |
| | HSBC Bank Canada | 2.6 | | 2.6 | | 2.8 | |
| | HSBC Markets Inc | 3.5 | | 2.6 | | 5.3 | |
| | HSBC Mexico | 1.8 | | 2.1 | | 0.3 | |
| | | | | | | | |
| South America | Brazilian operations | 1.0 | | 0.9 | | 1.1 | |
| | HSBC Bank Argentina | 0.1 | | 0.1 | | 0.2 | |
| | | | | | | |
| Other operations (including consolidation | | | | | | |
| adjustments) | | (1.5 | ) | (0.5 | ) | 1.0 | |
| | |
| |
| |
| |
| | | 100.0 | | 100.0 | | 100.0 | |
| | |
| |
| |
| |
126
Back to Contents
| | | Year ended 31 December | |
| | |
| |
| | | 2004 | | 2003 | | 2002 | |
| | |
| |
| |
| |
| | | Average | | Interest | | | | Average | | Interest | | | | Average | | Interest | | | |
| Liabilities and shareholders’ funds | balance | | expense | | Cost | | balance | | expense | | Cost | | balance | | expense | | Cost | |
| | | US$m | | US$m | | % | | US$m | | US$m | | % | | US$m | | US$m | | % | |
| Deposits by banks1 | | | | | | | | | | | | | | | | | | |
| | | | | | | | | | | | | | | | | | | |
| Europe | HSBC Bank | 27,687 | | 415 | | 1.50 | | 19,898 | | 404 | | 2.03 | | 18,259 | | 376 | | 2.06 | |
| | HSBC Private Banking | | | | | | | | | | | | | | | | | | |
| | Holdings (Suisse) | 1,446 | | 27 | | 1.87 | | 1,865 | | 28 | | 1.50 | | 1,976 | | 60 | | 3.04 | |
| | CCF | 22,161 | | 525 | | 2.37 | | 12,594 | | 398 | | 3.16 | | 13,456 | | 596 | | 4.43 | |
| | HSBC Finance | | | | | | | | | | | | | | | | | | |
| | Corporation2 | 243 | | 2 | | 0.82 | | 734 | | 31 | | 4.22 | | – | | – | | – | |
| | | | | | | | | | | | | | | | | | | | |
| Hong Kong | Hang Seng Bank | 685 | | 14 | | 2.04 | | 161 | | 2 | | 1.24 | | 83 | | 1 | | 1.20 | |
| | The Hongkong and | | | | | | | | | | | | | | | | | | |
| | Shanghai Banking Corporation | 3,139 | | 39 | | 1.24 | | 2,358 | | 28 | | 1.19 | | 2,066 | | 35 | | 1.69 | |
| | | | | | | | | | | | | | | | | | | | |
Rest of
Asia-Pacific | The Hongkong and
Shanghai Banking
Corporation | 3,505 | | 95 | | 2.71 | | 2,599 | | 81 | | 3.12 | | 2,683 | | 103 | | 3.84 | |
| | HSBC Bank Malaysia | 98 | | 2 | | 2.04 | | 121 | | 3 | | 2.48 | | 113 | | 3 | | 2.65 | |
| | HSBC Bank Middle East | 1,104 | | 23 | | 2.08 | | 764 | | 16 | | 2.09 | | 531 | | 15 | | 2.82 | |
| | | | | | | | | | | | | | | | | | | | |
| North America | HSBC Bank USA | 3,833 | | 74 | | 1.93 | | 3,915 | | 39 | | 1.00 | | 4,216 | | 46 | | 1.09 | |
| | HSBC Bank Canada | 392 | | 8 | | 2.04 | | 501 | | 11 | | 2.20 | | 679 | | 26 | | 3.83 | |
| | HSBC Markets Inc | 4,367 | | 76 | | 1.74 | | 2,191 | | 22 | | 1.00 | | 3,190 | | 44 | | 1.38 | |
| | HSBC Mexico2 | 914 | | 48 | | 5.25 | | 1,039 | | 59 | | 5.68 | | 213 | | 11 | | 5.16 | |
| | | | | | | | | | | | | | | | | | | | |
| South America | Brazilian operations | 914 | | 57 | | 6.24 | | 527 | | 93 | | 17.65 | | 693 | | 79 | | 11.40 | |
| | HSBC Bank Argentina | 140 | | 8 | | 5.71 | | 176 | | 14 | | 7.95 | | 164 | | 69 | | 42.07 | |
| | | | | | | | | | | | | | | | | | | |
| Other operations | 6,201 | | 128 | | 2.06 | | 5,346 | | 80 | | 1.50 | | 4,772 | | 122 | | 2.56 | |
| |
| |
| | | |
| |
| | | |
| |
| | | |
| | | 76,829 | | 1,541 | | 2.01 | | 54,789 | | 1,309 | | 2.39 | | 53,094 | | 1,586 | | 2.99 | |
| | |
| |
| | | |
| |
| | | |
| |
| | | |
| Customer accounts1 | | | | | | | | | | | | | | | | | | |
| | | | | | | | | | | | | | | | | | | |
| Europe | HSBC Bank | 170,262 | | 4,010 | | 2.36 | | 134,421 | | 2,741 | | 2.04 | | 106,301 | | 2,551 | | 2.40 | |
| | HSBC Private Banking | | | | | | | | | | | | | | | | | | |
| | Holdings (Suisse) | 17,339 | | 377 | | 2.17 | | 19,238 | | 401 | | 2.08 | | 20,476 | | 549 | | 2.68 | |
| | CCF | 22,072 | | 575 | | 2.61 | | 17,435 | | 606 | | 3.48 | | 11,841 | | 593 | | 5.01 | |
| | HSBC Finance | | | | | | | | | | | | | | | | | | |
| | Corporation2 | 87 | | 2 | | 2.30 | | 412 | | 28 | | 6.80 | | – | | – | | – | |
| | | | | | | | | | | | | | | | | | | | |
| Hong Kong | Hang Seng Bank | 50,948 | | 291 | | 0.57 | | 49,492 | | 289 | | 0.58 | | 48,074 | | 448 | | 0.93 | |
| | The Hongkong and | | | | | | | | | | | | | | | | | | |
| | Shanghai Banking
Corporation | 92,586 | | 392 | | 0.42 | | 86,836 | | 379 | | 0.44 | | 82,535 | | 616 | | 0.75 | |
| | | | | | | | | | | | | | | | | | | | |
| Rest of Asia- | The Hongkong and | | | | | | | | | | | | | | | | | | |
| Pacific | Shanghai Banking
Corporation | 42,625 | | 891 | | 2.09 | | 35,933 | | 719 | | 2.00 | | 29,965 | | 705 | | 2.35 | |
| | HSBC Bank Malaysia | 5,744 | | 151 | | 2.63 | | 4,796 | | 142 | | 2.96 | | 4,347 | | 131 | | 3.01 | |
| | HSBC Bank Middle East | 5,978 | | 60 | | 1.00 | | 5,863 | | 61 | | 1.04 | | 6,176 | | 106 | | 1.72 | |
| | | | | | | | | | | | | | | | | | | | |
| North America | HSBC Bank USA | 52,813 | | 680 | | 1.29 | | 44,986 | | 553 | | 1.23 | | 45,438 | | 860 | | 1.89 | |
| | HSBC Bank Canada | 18,192 | | 351 | | 1.93 | | 15,775 | | 326 | | 2.07 | | 13,708 | | 257 | | 1.87 | |
| | HSBC Markets Inc | 11,544 | | 165 | | 1.43 | | 4,915 | | 52 | | 1.06 | | 6,972 | | 112 | | 1.61 | |
| | HSBC Mexico2 | 11,157 | | 377 | | 3.38 | | 11,542 | | 408 | | 3.53 | | 1,032 | | 51 | | 4.94 | |
| | | | | | | | | | | | | | | | | | | | |
| South America | Brazilian operations | 5,786 | | 842 | | 14.55 | | 3,888 | | 755 | | 19.42 | | 3,066 | | 491 | | 16.01 | |
| | HSBC Bank Argentina | 898 | | 27 | | 3.01 | | 778 | | 57 | | 7.33 | | 757 | | 217 | | 28.67 | |
| | | | | | | | | | | | | | | | | | | |
| Other operations | 44,054 | | 741 | | 1.68 | | 29,130 | | 510 | | 1.75 | | 25,917 | | 653 | | 2.52 | |
| |
| |
| | | |
| |
| | | |
| |
| | | |
| | | 552,085 | | 9,932 | | 1.80 | | 465,440 | | 8,027 | | 1.72 | | 406,605 | | 8,340 | | 2.05 | |
| | |
| |
| | | |
| |
| | | |
| |
| | | |
| 1 | Further analysis is given on pages 180 and 181. |
| 2 | Costs annualised on the basis of the period of ownership in the year of acquisition. |
127
Back to Contents
H S B C H O L D I N G S P L C
Financial Review (continued)
| | | | | | | | | Year ended 31 December | | | | | | | |
| | |
| |
| | | 2004 | | 2003 | | 2002 | |
| | |
| |
| |
| |
| Liabilities and shareholders’ funds | Average | | Interest | | | | Average | | Interest | | | | Average | | Interest | | | |
| (continued) | | balance | | expense | | Cost | | balance | | expense | | Cost | | balance | | expense | | Cost | |
| | | US$m | | US$m | | % | | US$m | | US$m | | % | | US$m | | US$m | | % | |
| CDs and other money market instruments1 | | | | | | | | | | | | | | | | | | |
| | | | | | | | | | | | | | | | | | | |
| Europe | HSBC Bank | 12,427 | | 424 | | 3.41 | | 5,417 | | 151 | | 2.79 | | 2,088 | | 83 | | 3.98 | |
| | CCF | 9,885 | | 214 | | 2.16 | | 5,739 | | 162 | | 2.82 | | 4,856 | | 201 | | 4.14 | |
| | | | | | | | | | | | | | | | | | | | |
| Hong Kong | Hang Seng Bank | 1,266 | | 30 | | 2.37 | | 1,399 | | 36 | | 2.57 | | 2,150 | | 65 | | 3.02 | |
| | The Hongkong and | | | | | | | | | | | | | | | | | | |
| | Shanghai Banking
Corporation | 9,565 | | 357 | | 3.73 | | 8,257 | | 321 | | 3.89 | | 5,331 | | 258 | | 4.84 | |
| | | | | | | | | | | | | | | | | | | | |
| Rest of Asia- | The Hongkong and | | | | | | | | | | | | | | | | | | |
| Pacific | Shanghai Banking
Corporation | 4,489 | | 183 | | 4.08 | | 3,163 | | 121 | | 3.83 | | 1,659 | | 69 | | 4.16 | |
| | HSBC Bank Malaysia | 261 | | 8 | | 3.07 | | 263 | | 8 | | 3.04 | | 148 | | 7 | | 4.73 | |
| | | | | | | | | | | | | | | | | | | | |
| North America | HSBC Bank USA | 1,755 | | 26 | | 1.48 | | 1,604 | | 26 | | 1.62 | | 2,286 | | 62 | | 2.71 | |
| | HSBC Finance | | | | | | | | | | | | | | | | | | |
| | Corporation2 | 11,441 | | 188 | | 1.64 | | 5,522 | | 60 | | 1.09 | | – | | – | | – | |
| | HSBC Bank Canada | 4,028 | | 89 | | 2.21 | | 3,132 | | 84 | | 2.68 | | 2,168 | | 56 | | 2.58 | |
| | HSBC Mexico2 | 3,566 | | 134 | | 3.76 | | 4,052 | | 169 | | 4.17 | | 318 | | 22 | | 6.92 | |
| | | | | | | | | | | | | | | | | | | | |
| South America | Brazilian operations | 102 | | 15 | | 14.71 | | 63 | | 12 | | 19.05 | | 53 | | 14 | | 26.42 | |
| | HSBC Bank Argentina | – | | – | | – | | | | – | | – | | 105 | | 7 | | 6.67 | |
| | | | | | | | | | | | | | | | | | | |
| Other operations | 2,029 | | 106 | | 5.22 | | 1,479 | | 59 | | 3.99 | | 763 | | 16 | | 2.10 | |
| |
| |
| | | |
| |
| | | |
| |
| | | |
| | | 60,814 | | 1,774 | | 2.92 | | 40,090 | | 1,209 | | 3.02 | | 21,925 | | 860 | | 3.92 | |
| | |
| |
| | | |
| |
| | | |
| |
| | | |
| | | | | | | | | | | | | | | | | | | | |
| Loan capital | | | | | | | | | | | | | | | | | | | |
| | | | | | | | | | | | | | | | | | | | |
| Europe | HSBC Bank | 10,523 | | 579 | | 5.50 | | 8,790 | | 466 | | 5.30 | | 7,053 | | 463 | | 6.56 | |
| | CCF | 6,365 | | 219 | | 3.44 | | 5,686 | | 187 | | 3.29 | | 3,941 | | 164 | | 4.16 | |
| | HSBC Finance | | | | | | | | | | | | | | | | | | |
| | Corporation2 | 3,485 | | 161 | | 4.62 | | 2,230 | | 111 | | 4.98 | | – | | – | | – | |
| | | | | | | | | | | | | | | | | | | | |
| Hong Kong | The Hongkong and | | | | | | | | | | | | | | | | | | |
| | Shanghai Banking
Corporation | 1,632 | | 80 | | 4.90 | | 1,796 | | 80 | | 4.45 | | 1,786 | | 83 | | 4.65 | |
| | | | | | | | | | | | | | | | | | | | |
| Rest of Asia- | The Hongkong and | | | | | | | | | | | | | | | | | | |
| Pacific | Shanghai Banking Corporation | 713 | | 42 | | 5.89 | | 270 | | 17 | | 6.30 | | 151 | | 12 | | 7.95 | |
| | | | | | | | | | | | | | | | | | | | |
| North America | HSBC Bank USA | 9,370 | | 350 | | 3.74 | | 3,284 | | 178 | | 5.42 | | 3,396 | | 214 | | 6.30 | |
| | HSBC Finance | | | | | | | | | | | | | | | | | | |
| | Corporation2 | 101,269 | | 2,751 | | 2.72 | | 71,346 | | 1,779 | | 2.49 | | – | | – | | – | |
| | HSBC Bank Canada | 1,967 | | 76 | | 3.86 | | 1,288 | | 66 | | 5.12 | | 1,014 | | 65 | | 6.41 | |
| | HSBC Mexico2 | – | | – | | – | | 188 | | 13 | | 6.91 | | 19 | | 2 | | 10.53 | |
| | | | | | | | | | | | | | | | | | | | |
| South America | Brazilian operations | 258 | | 49 | | 18.99 | | 205 | | 46 | | 22.44 | | 271 | | 44 | | 16.24 | |
| | HSBC Bank Argentina | 95 | | 7 | | 7.37 | | 353 | | 30 | | 8.50 | | 319 | | 62 | | 19.44 | |
| | | | | | | | | | | | | | | | | | | |
| Other operations | 104 | | (22 | ) | (21.15 | ) | 9,324 | | 133 | | 1.43 | | 7,148 | | 167 | | 2.34 | |
| |
| |
| | | |
| |
| | | |
| |
| | | |
| | | 135,781 | | 4,292 | | 3.16 | | 104,760 | | 3,106 | | 2.96 | | 25,098 | | 1,276 | | 5.08 | |
| | |
| |
| | | |
| |
| | | |
| |
| | | |
| 1 | Further analysis is given on page 182. |
| 2 | Costs annualised on the basis of the period of ownership in the year of acquisition. |
128
Back to Contents
| | Year ended 31 December | |
|
| 2004 | | 2003 | | 2002 |
|
|
|
Liabilities and shareholders’ funds
(continued) | Average
balance
US$m | | Interest
expense
US$m | | Cost
% | Average
balance
US$m | | Interest
expense
US$m | | Cost
% | Average
balance
US$m | | Interest
expense
US$m | | Cost
% | |
| Other interest bearing liabilities | | | | | | | | | | | | | | | | | | |
| | | | | | | | | | | | | | | | | | | |
| Europe | HSBC Bank | 24,557 | | 736 | | 3.00 | | 21,502 | | 213 | | 0.99 | | 21,006 | | 253 | | 1.20 | |
| | HSBC Private Banking Holdings (Suisse) | 2,505 | | 38 | | 1.52 | | 1,509 | | 26 | | 1.72 | | 1,645 | | 37 | | 2.25 | |
| | CCF | 20,118 | | 602 | | 2.99 | | 12,994 | | 327 | | 2.52 | | 10,725 | | 154 | | 1.44 | |
| | HSBC Finance
Corporation1 | 4,337 | | 260 | | 5.99 | | 1,359 | | 65 | | 4.78 | | – | | – | | – | |
| | | | | | | | | | | | | | | | | | | | |
| Hong Kong | Hang Seng Bank | 1,161 | | 22 | | 1.89 | | 639 | | 15 | | 2.35 | | 684 | | 19 | | 2.78 | |
| | The Hongkong and
Shanghai Banking
Corporation | 10,495 | | 170 | | 1.62 | | 8,178 | | 136 | | 1.66 | | 7,753 | | 179 | | 2.31 | |
| | | | | | | | | | | | | | | | | | | | |
Rest of Asia-
Pacific | The Hongkong and
Shanghai Banking
Corporation | 13,175 | | 227 | | 1.72 | | 10,732 | | 202 | | 1.88 | | 8,744 | | 195 | | 2.23 | |
| | HSBC Bank Malaysia | 195 | | 2 | | 1.03 | | 246 | | 3 | | 1.22 | | 51 | | 1 | | 1.96 | |
| | HSBC Bank Middle East | 407 | | 13 | | 3.19 | | 335 | | 9 | | 2.69 | | 179 | | 6 | | 3.35 | |
| | | | | | | | | | | | | | | | | | | | |
| North America | HSBC Bank USA | 12,618 | | 324 | | 2.57 | | 10,317 | | 240 | | 2.33 | | 9,545 | | 280 | | 2.93 | |
| | | | | | | | | | | | | | | | | | | | |
| | HSBC Finance
Corporation1 | 263 | | 25 | | 9.51 | | 2,077 | | 7 | | 0.34 | | – | | – | | – | |
| | HSBC Bank Canada | 937 | | 20 | | 2.13 | | 691 | | 16 | | 2.32 | | 415 | | 15 | | 3.61 | |
| | HSBC Markets Inc | 12,652 | | 460 | | 3.64 | | 7,680 | | 276 | | 3.59 | | 19,141 | | 832 | | 4.35 | |
| | HSBC Mexico1 | 195 | | 15 | | 7.69 | | – | | – | | – | | – | | – | | – | |
| | | | | | | | | | | | | | | | | | | | |
| South America | Brazilian operations | 566 | | 47 | | 8.30 | | 296 | | 48 | | 16.22 | | 467 | | 79 | | 16.92 | |
| | HSBC Bank Argentina | 320 | | 4 | | 1.25 | | 346 | | 16 | | 4.62 | | 299 | | (5) | | (1.67 | ) |
| | | | | | | | | | | | | | | | | | | | |
| Other operations | (58,260 | ) | (1,325 | ) | | | (49,719 | ) | (880 | ) | | | (47,127 | ) | (972 | ) | | |
| | |
| |
| | | |
| |
| | | |
| |
| | | |
| | | 46,241 | | 1,640 | | 3.55 | | 29,182 | | 719 | | 2.46 | | 33,527 | | 1,073 | | 3.20 | |
| | |
| |
| | | |
| |
| | | |
| |
| | | |
| Total interest bearing liabilities | | | | | | | | | | | | | | | | | | |
| | | | | | | | | | | | | | | | | | | |
| Europe | HSBC Bank | 245,456 | | 6,164 | | 2.51 | | 190,028 | | 3,975 | | 2.09 | | 154,707 | | 3,726 | | 2.41 | |
| | HSBC Private Banking Holdings (Suisse) | 21,290 | | 442 | | 2.08 | | 22,612 | | 455 | | 2.01 | | 24,097 | | 646 | | 2.68 | |
| | CCF | 80,601 | | 2,135 | | 2.65 | | 54,448 | | 1,680 | | 3.09 | | 44,819 | | 1,708 | | 3.81 | |
| | HSBC Finance Corporation1 | 8,152 | | 425 | | 5.21 | | 4,735 | | 235 | | 4.96 | | – | | – | | – | |
| Hong Kong | Hang Seng Bank | 54,060 | | 357 | | 0.66 | | 51,691 | | 342 | | 0.66 | | 50,991 | | 533 | | 1.05 | |
| | The Hongkong and
Shanghai Banking
Corporation | 117,417 | | 1,038 | | 0.88 | | 107,425 | | 944 | | 0.88 | | 99,471 | | 1,171 | | 1.18 | |
| | | | | | | | | | | | | | | | | | | | |
Rest of Asia-
Pacific | The Hongkong and
Shanghai Banking
Corporation | 64,507 | | 1,438 | | 2.23 | | 52,697 | | 1,140 | | 2.16 | | 43,202 | | 1,084 | | 2.51 | |
| | HSBC Bank Malaysia | 6,298 | | 163 | | 2.59 | | 5,426 | | 156 | | 2.88 | | 4,659 | | 142 | | 3.05 | |
| | HSBC Bank Middle East | 7,489 | | 96 | | 1.28 | | 6,962 | | 86 | | 1.24 | | 6,886 | | 127 | | 1.84 | |
| | | | | | | | | | | | | | | | | | | | |
| North America | HSBC Bank USA | 80,389 | | 1,454 | | 1.81 | | 64,106 | | 1,036 | | 1.62 | | 64,881 | | 1,462 | | 2.25 | |
| | HSBC Finance
Corporation1 | 112,973 | | 2,964 | | 2.62 | | 78,945 | | 1,846 | | 2.34 | | – | | – | | – | |
| | HSBC Bank Canada | 25,516 | | 544 | | 2.13 | | 21,387 | | 503 | | 2.35 | | 17,984 | | 419 | | 2.33 | |
| | HSBC Markets Inc | 28,563 | | 701 | | 2.45 | | 14,786 | | 350 | | 2.37 | | 29,303 | | 988 | | 3.37 | |
| | HSBC Mexico1 | 15,832 | | 574 | | 3.63 | | 16,821 | | 649 | | 3.86 | | 1,582 | | 86 | | 5.44 | |
| | | | | | | | | | | | | | | | | | | | |
| South America | Brazilian operations | 7,626 | | 1,010 | | 13.24 | | 4,979 | | 954 | | 19.16 | | 4,550 | | 707 | | 15.54 | |
| | HSBC Bank Argentina | 1,453 | | 46 | | 3.17 | | 1,653 | | 117 | | 7.08 | | 1,644 | | 350 | | 21.29 | |
| | | | | | | | | | | | | | | | | | | | |
| Other operations | | (5,872 | ) | (372 | ) | | | (4,440 | ) | (98 | ) | | | (8,527 | ) | (14 | ) | | |
| | |
| |
| | | |
| |
| | | |
| |
| | | |
| | | 871,750 | | 19,179 | | 2.20 | | 694,261 | | 14,370 | | 2.07 | | 540,249 | | 13,135 | | 2.43 | |
| | |
| |
| | | |
| |
| | | |
| |
| | | |
| Summary | | | | | | | | | | | | | | | | | | |
| | | | | | | | | | | | | | | | | | | |
| Total interest-bearing liabilities | 871,750 | | 19,179 | | 2.20 | | 694,261 | | 14,370 | | 2.07 | | 540,249 | | 13,135 | | 2.43 | |
| Non interest-bearing current accounts | 56,141 | | | | | | 44,233 | | | | | | 40,220 | | | | | |
Shareholders’ funds & other non interest-
bearing liabilities | 241,565 | | | | | | 219,356 | | | | | | 152,698 | | | | | |
| | |
| |
| | | |
| |
| | | |
| |
| | | |
| Total liabilities & interest expense | 1,169,456 | | 19,179 | | 1.64 | | 957,850 | | 14,370 | | 1.50 | | 733,167 | | 13,135 | | 1.79 | |
| |
| |
| | | |
| |
| | | |
| |
| | | |
| 1 Costs annualised on the basis of the period of ownership in the year of acquisition. |
129
| | Year ended 31 December | |
|
| 2004 | | 2003 | | 2002 |
| % | % | % |
| Net interest margin | | | | | | |
| | | | | | | |
| Europe | HSBC Bank | 2.43 | | 2.60 | | 2.72 | |
| | HSBC Private Banking Holdings (Suisse) | 0.82 | | 0.75 | | 0.75 | |
| | CCF | 1.44 | | 1.85 | | 1.81 | |
| | HSBC Finance Corporation1 | 6.74 | | 7.10 | | – | |
| | | | | | | | |
| Hong Kong | Hang Seng Bank | 2.04 | | 2.28 | | 2.46 | |
| | The Hongkong and Shanghai Banking Corporation | 1.74 | | 2.13 | | 2.47 | |
| | | | | | | | |
| Rest of Asia-Pacific | The Hongkong and Shanghai Banking Corporation | 1.92 | | 2.02 | | 2.20 | |
| | HSBC Bank Malaysia | 2.56 | | 2.60 | | 2.76 | |
| | HSBC Bank Middle East | 3.76 | | 3.64 | | 3.78 | |
| | | | | | | | |
| North America | HSBC Bank USA | 2.90 | | 3.20 | | 3.07 | |
| | HSBC Finance Corporation1 | 8.66 | | 9.17 | | – | |
| | HSBC Bank Canada | 2.41 | | 2.54 | | 2.68 | |
| | HSBC Markets Inc | (0.17 | ) | 0.01 | | (0.24 | ) |
| | HSBC Mexico1 | 5.82 | | 4.79 | | 4.80 | |
| | | | | | | | |
| South America | Brazilian operations | 13.69 | | 10.77 | | 11.85 | |
| | HSBC Bank Argentina | 5.19 | | 0.34 | | (2.71 | ) |
| | | | | | | | |
| Other operations2 | | 2.20 | | 1.96 | | 1.86 | |
| | |
| |
| |
| |
| | | 3.22 | | 3.29 | | 2.54 | |
| | |
| |
| |
| |
| 1 Net interest margins annualised on the basis of the period of ownership in the year of acquisition. |
| 2 Excludes eliminations (see note (iii)). |
| |
| Notes |
| |
| (i) | Average balances are based on daily averages for the principal areas of HSBC’s banking activities with monthly or less frequent averages used elsewhere. |
| | |
| (ii) | ‘Loans accounted for on a non-accrual basis’ and ‘Loans on which interest has been accrued but suspended’ have been included in ‘Loans and advances to banks’ and ‘Loans and advances to customers’. Interest income on such loans is included in the consolidated profit and loss account to the extent to which it has been received. |
| | |
| (iii) | Balances and transactions with fellow subsidiaries are reported gross in the principal commercial banking and consumer finance entities within ‘Other interest-earning assets’ and ‘Other interest-bearing liabilities’ as appropriate and the elimination entries are included within ‘Other operations’ in those two categories. |
| | |
| (iv) | Other than as noted in (iii) above, ‘Other operations’ comprise the operations of the principal commercial banking and consumer finance entities outside their domestic markets and all other banking operations. |
| | |
| (v) | Non-equity minority interests are included within shareholders’ funds and other non interest-bearing liabilities and the related coupon payments are included within minority interests in the profit and loss account. |
130
Back to Contents
Analysis of changes in net interest income
The following table allocates changes in net interest income between volume and rate for 2004 compared with 2003, and for 2003 compared with 2002. Changes due to a combination of volume and rate are allocated to rate.
| | 2004 compared with 2003 | | 2003 compared with 2002 | | |
| Increase/(decrease) | Increase/(decrease) |
|
|
| Interest income | | 2004 | | Volume | | Rate | | 2003 | | Volume | | Rate | | 2002 |
| | | US$m | | US$m | | US$m | | US$m | | US$m | | US$m | | US$m |
| Short-term funds and loans to banks | | | | | | | | | | | | | |
| | | | | | | | | | | | | | |
| Europe | HSBC Bank | 672 | | 52 | | (37 | ) | 657 | | 208 | | (146 | ) | 595 |
| | HSBC Private Banking | | | | | | | | | | | | | |
| | Holdings (Suisse) | 89 | | (17 | ) | 31 | | 75 | | (55 | ) | (14 | ) | 144 |
| | CCF | 960 | | 278 | | 109 | | 573 | | 249 | | (323 | ) | 647 |
| | | | | | | | | | | | | | | |
| Hong Kong | Hang Seng Bank | 219 | | (40 | ) | 47 | | 212 | | (135 | ) | (62 | ) | 409 |
| | The Hongkong and
Shanghai Banking | | | | | | | | | | | | | |
| | Corporation | 538 | | 185 | | (164 | ) | 517 | | 83 | | (62 | ) | 496 |
| | | | | | | | | | | | | | | |
| Rest of Asia- | The Hongkong and
| | | | | | | | | | | | | |
| Pacific | Shanghai Banking
Corporation | 198 | | 46 | | 14 | | 138 | | 6 | | (55 | ) | 187 |
| | HSBC Bank Malaysia | 36 | | 16 | | 3 | | 17 | | 4 | | (2 | ) | 15 |
| | HSBC Bank Middle East | 29 | | (5 | ) | 5 | | 29 | | 1 | | (11 | ) | 39 |
| | | | | | | | | | | | | | | |
| North America | HSBC Bank USA | 56 | | 10 | | 11 | | 35 | | (12 | ) | (16 | ) | 63 |
| | HSBC Bank Canada | 45 | | 8 | | 6 | | 31 | | 8 | | (3 | ) | 26 |
| | HSBC Markets Inc | 91 | | 42 | | 29 | | 20 | | (16 | ) | (12 | ) | 48 |
| | HSBC Mexico | 227 | | (22 | ) | 35 | | 214 | | 287 | | (105 | ) | 32 |
| | | | | | | | | | | | | | | |
| South America | Brazilian operations | 237 | | 140 | | (145 | ) | 242 | | 29 | | 36 | | 177 |
| | HSBC Bank Argentina | 3 | | – | | 1 | | 2 | | 6 | | (18 | ) | 14 |
| | | | | | | | | | | | | | | |
| Other operations | | 237 | | 88 | | (10 | ) | 159 | | (52 | ) | (117 | ) | 328 |
| | |
| | | | | |
| | | | | |
|
| | | 3,637 | | 802 | | (86 | ) | 2,921 | | 285 | | (584 | ) | 3,220 |
| | |
| | | | | |
| | | | | |
|
| Loans and advances to customers | | | | | | | | | | | | | |
| | | | | | | | | | | | | | | |
| Europe | HSBC Bank | 9,298 | | 1,967 | | 592 | | 6,739 | | 1,375 | | (501 | ) | 5,865 |
| | HSBC Private Banking | | | | | | | | | | | | | |
| | Holdings (Suisse) | 115 | | 31 | | 5 | | 79 | | 14 | | (16 | ) | 81 |
| | CCF | 1,892 | | 238 | | (243 | ) | 1,897 | | 475 | | (235 | ) | 1,657 |
| | HSBC Finance
Corporation | 1,055 | | 382 | | 2 | | 671 | | 671 | | – | | – |
| | | | | | | | | | | | | | | |
| Hong Kong | Hang Seng Bank | 882 | | 67 | | (123 | ) | 938 | | 12 | | (157 | ) | 1,083 |
| | The Hongkong and
Shanghai Banking | | | | | | | | | | | | | |
| | Corporation | 1,406 | | 14 | | (125 | ) | 1,517 | | 109 | | (305 | ) | 1,713 |
| | | | | | | | | | | | | | | |
| Rest of Asia- | The Hongkong and Shanghai | | | | | | | | | | | | | |
| Pacific | Banking Corporation | 1,838 | | 432 | | (51 | ) | 1,457 | | 320 | | (147 | ) | 1,284 |
| | HSBC Bank Malaysia | 279 | | 22 | | (9 | ) | 266 | | 20 | | (5 | ) | 251 |
| | HSBC Bank Middle East | 418 | | 104 | | (38 | ) | 352 | | 34 | | (48 | ) | 366 |
| | | | | | | | | | | | | | | |
| North America | HSBC Bank USA | 2,936 | | 786 | | (106 | ) | 2,256 | | 88 | | (251 | ) | 2,419 |
| | HSBC Finance
Corporation | 13,146 | | 3,817 | | (302 | ) | 9,631 | | 9,631 | | – | | – |
| | HSBC Bank Canada | 1,099 | | 199 | | (82 | ) | 982 | | 169 | | (22 | ) | 835 |
| | HSBC Markets Inc | 126 | | 39 | | 63 | | 24 | | (70 | ) | (21 | ) | 115 |
| | HSBC Mexico | 878 | | (95 | ) | 111 | | 862 | | 915 | | (155 | ) | 102 |
| | | | | | | | | | | | | | | |
| South America | Brazilian operations | 1,569 | | 651 | | (126 | ) | 1,044 | | 125 | | 98 | | 821 |
| | HSBC Bank Argentina | 101 | | 15 | | (17 | ) | 103 | | (28 | ) | (130 | ) | 261 |
| | | | | | | | | | | | | | | |
| Other operations | | 864 | | 4 | | 233 | | 627 | | 173 | | (217 | ) | 671 |
| | |
| | | | | |
| | | | | |
|
| | | 37,902 | | 7,483 | | 974 | | 29,445 | | 13,240 | | (1,319 | ) | 17,524 |
| | |
| | | | | |
| | | | | |
|
131
Back to Contents
H S B C H O L D I N G S P L C
Financial Review(continued)
| | | 2004 compared with 2003 | | 2003 compared with 2002 | | | |
| | | Increase/(decrease) | | Increase/(decrease) | | | |
| | |
| |
| | | |
| Interest income(continued) | 2004 | | Volume | | Rate | | 2003 | | Volume | | Rate | | 2002 | |
| | | US$m | | US$m | | US$m | | US$m | | US$m | | US$m | | US$m | |
| Trading securities | | | | | | | | | | | | | | |
| | | | | | | | | | | | | | | | |
| Europe | HSBC Bank | 846 | | (64 | ) | (35 | ) | 945 | | (15 | ) | (124 | ) | 1,084 | |
| | CCF | 365 | | 222 | | (93 | ) | 236 | | (76 | ) | 77 | | 235 | |
| | | | | | | | | | | | | | | | |
| Hong Kong | Hang Seng Bank | 11 | | (6 | ) | 2 | | 15 | | (1 | ) | (2 | ) | 18 | |
| | The Hongkong and Shanghai | | | | | | | | | | | | | | |
| | Banking Corporation | 298 | | (4 | ) | (32 | ) | 334 | | (20 | ) | (78 | ) | 432 | |
| | | | | | | | | | | | | | | | |
| Rest of Asia- | The Hongkong and Shanghai | | | | | | | | | | | | | | |
| Pacific | Banking Corporation | 101 | | (15 | ) | (8 | ) | 124 | | 17 | | (5 | ) | 112 | |
| | HSBC Bank Malaysia | 5 | | (7 | ) | 1 | | 11 | | 2 | | – | | 9 | |
| | | | | | | | | | | | | | | | |
| North America | HSBC Bank USA. | 115 | | 29 | | (16 | ) | 102 | | (2 | ) | (36 | ) | 140 | |
| | HSBC Bank Canada | 25 | | 9 | | (1 | ) | 17 | | – | | (1 | ) | 18 | |
| | HSBC Markets Inc | 421 | | 93 | | 25 | | 303 | | (355 | ) | (94 | ) | 752 | |
| | HSBC Mexico | 173 | | (82 | ) | (6 | ) | 261 | | 309 | | (75 | ) | 27 | |
| | | | | | | | | | | | | | | | |
| South America | Brazilian operations | 129 | | – | | 129 | | – | | – | | – | | – | |
| | HSBC Bank Argentina | 1 | | 2 | | (2 | ) | 1 | | – | | 1 | | – | |
| Other operations | | 511 | | 205 | | 168 | | 138 | | 106 | | (52 | ) | 84 | |
| | |
| | | | | |
| | | | | |
| |
| | | 3,001 | | 503 | | 11 | | 2,487 | | (219 | ) | (205 | ) | 2,911 | |
| |
| | | | | |
| | | | | |
| |
| Investment securities | | | | | | | | | | | | | | |
| | | | | | | | | | | | | | | | |
| Europe | HSBC Bank | 1,145 | | 486 | | – | | 659 | | 161 | | (125 | ) | 623 | |
| | HSBC Private Banking Holdings | | | | | | | | | | | | | | |
| | (Suisse) | 303 | | (96 | ) | 2 | | 397 | | (5 | ) | (101 | ) | 503 | |
| | CCF | 239 | | 224 | | (195 | ) | 210 | | 90 | | (21 | ) | 141 | |
| | HSBC Finance Corporation | 1 | | (2 | ) | 1 | | 2 | | 2 | | – | | – | |
| | | | | | | | | | | | | | | | |
| Hong Kong | Hang Seng Bank | 479 | | 109 | | (90 | ) | 460 | | 206 | | (121 | ) | 375 | |
| | The Hongkong and Shanghai | | | | | | | | | | | | | | |
| | Banking Corporation | 779 | | 53 | | (103 | ) | 829 | | 58 | | (184 | ) | 955 | |
| | | | | | | | | | | | | | | | |
| Rest of Asia- | The Hongkong and Shanghai | | | | | | | | | | | | | | |
| Pacific | Banking Corporation | 537 | | 70 | | (20 | ) | 487 | | 143 | | (104 | ) | 448 | |
| | HSBC Bank Malaysia | 40 | | 2 | | 1 | | 37 | | 4 | | (1 | ) | 34 | |
| | HSBC Bank Middle East | 27 | | 6 | | (3 | ) | 24 | | 4 | | (10 | ) | 30 | |
| | | | | | | | | | | | | | | | |
| North America | HSBC Bank USA | 884 | | (26 | ) | 16 | | 894 | | 50 | | (83 | ) | 927 | |
| | HSBC Finance Corporation | 87 | | 14 | | 14 | | 59 | | 59 | | – | | – | |
| | HSBC Bank Canada | 65 | | 4 | | (14 | ) | 75 | | 8 | | (11 | ) | 78 | |
| | HSBC Markets Inc | 1 | | – | | – | | 1 | | – | | – | | 1 | |
| | HSBC Mexico | 395 | | 222 | | (81 | ) | 254 | | 149 | | 91 | | 14 | |
| | | | | | | | | | | | | | | | |
| South America | Brazilian operations | 301 | | 11 | | 40 | | 250 | | (31 | ) | (33 | ) | 314 | |
| | HSBC Bank Argentina | 12 | | 5 | | (6 | ) | 13 | | (12 | ) | (9 | ) | 34 | |
| | | | | | | | | | | | | | | | |
| Other operations | | 196 | | 72 | | (221 | ) | 345 | | 43 | | (21 | ) | 323 | |
| | |
| | | | | |
| | | | | |
| |
| | | 5,491 | | 898 | | (403 | ) | 4,996 | | 903 | | (707 | ) | 4,800 | |
| | |
| | | | | |
| | | | | |
| |
132
Back to Contents
| | | 2004 compared with 2003 | | 2003 compared with 2002 | | | |
| | | Increase/(decrease) | | Increase/(decrease) | | | |
| | |
| |
| | | |
| Interest expense | 2004 | | Volume | | Rate | | 2003 | | Volume | | Rate | | 2002 | |
| | | US$m | | US$m | | US$m | | US$m | | US$m | | US$m | | US$m | |
| Deposits by banks | | | | | | | | | | | | | | |
| | | | | | | | | | | | | | | |
| Europe | HSBC Bank | 415 | | 158 | | (147 | ) | 404 | | 19 | | 9 | | 376 | |
| | HSBC Private Banking Holdings | | | | | | | | | | | | | | |
| | (Suisse) | 27 | | (6 | ) | 5 | | 28 | | (3 | ) | (29 | ) | 60 | |
| | CCF | 525 | | 302 | | (175 | ) | 398 | | (38 | ) | (160 | ) | 596 | |
| | HSBC Finance Corporation | 2 | | (21 | ) | (8) | | 31 | | 31 | | – | | – | |
| | | | | | | | | | | | | | | | |
| Hong Kong | Hang Seng Bank | 14 | | 7 | | 5 | | 2 | | 1 | | – | | 1 | |
| | The Hongkong and Shanghai | | | | | | | | | | | | | | |
| | Banking Corporation | 39 | | 9 | | 2 | | 28 | | 5 | | (12 | ) | 35 | |
| | | | | | | | | | | | | | | | |
| Rest of Asia- | The Hongkong and Shanghai | | | | | | | | | | | | | | |
| Pacific | Banking Corporation | 95 | | 28 | | (14 | ) | 81 | | (3 | ) | (19 | ) | 103 | |
| | HSBC Bank Malaysia | 2 | | (1 | ) | – | | 3 | | – | | – | | 3 | |
| | HSBC Bank Middle East | 23 | | 7 | | – | | 16 | | 7 | | (6 | ) | 15 | |
| | | | | | | | | | | | | | | | |
| North America | HSBC USA Inc. | 74 | | (1 | ) | 36 | | 39 | | (3 | ) | (4 | ) | 46 | |
| | HSBC Bank Canada | 8 | | (2 | ) | (1 | ) | 11 | | (7 | ) | (8 | ) | 26 | |
| | HSBC Markets Inc | 76 | | 22 | | 32 | | 22 | | (14 | ) | (8 | ) | 44 | |
| | HSBC Mexico | 48 | | (7 | ) | (4 | ) | 59 | | 43 | | 5 | | 11 | |
| | | | | | | | | | | | | | | | |
| South America | Brazilian operations | 57 | | 68 | | (104 | ) | 93 | | (19 | ) | 33 | | 79 | |
| | HSBC Bank Argentina | 8 | | (3 | ) | (3 | ) | 14 | | 5 | | (60 | ) | 69 | |
| | | | | | | | | | | | | | | |
| Other operations | 128 | | 13 | | 35 | | 80 | | 15 | | (57 | ) | 122 | |
| | |
| | | | | |
| | | | | |
| |
| | | 1,541 | | 527 | | (295 | ) | 1,309 | | 57 | | (334 | ) | 1,586 | |
| | |
| | | | | |
| | | | | |
| |
| Customer accounts | | | | | | | | | | | | | | |
| | | | | | | | | | | | | | | | |
| Europe | HSBC Bank | 4,010 | | 731 | | 538 | | 2,741 | | 633 | | (443 | ) | 2,551 | |
| | HSBC Private Banking Holdings | | | | | | | | | | | | | | |
| | (Suisse) | 377 | | (40 | ) | 16 | | 401 | | (33 | ) | (115 | ) | 549 | |
| | CCF | 575 | | 161 | | (192 | ) | 606 | | 280 | | (267 | ) | 593 | |
| | HSBC Finance Corporation | 2 | | (22 | ) | (4 | ) | 28 | | 28 | | – | | – | |
| | | | | | | | | | | | | | | | |
| Hong Kong | Hang Seng Bank | 291 | | 9 | | (7 | ) | 289 | | 13 | | (172 | ) | 448 | |
| | The Hongkong and Shanghai | | | | | | | | | | | | | | |
| | Banking Corporation | 392 | | 25 | | (12 | ) | 379 | | 32 | | (269 | ) | 616 | |
| | | | | | | | | | | | | | | | |
| Rest of Asia- | The Hongkong and Shanghai | | | | | | | | | | | | | | |
| Pacific | Banking Corporation | 891 | | 134 | | 38 | | 719 | | 140 | | (126 | ) | 705 | |
| | HSBC Bank Malaysia | 151 | | 28 | | (19 | ) | 142 | | 14 | | (3 | ) | 131 | |
| | HSBC Bank Middle East | 60 | | 1 | | (2 | ) | 61 | | (5 | ) | (40 | ) | 106 | |
| | | | | | | | | | | | | | | | |
| North America | HSBC USA Inc | 680 | | 96 | | 31 | | 553 | | (9 | ) | (298 | ) | 860 | |
| | HSBC Bank Canada | 351 | | 50 | | (25 | ) | 326 | | 39 | | 30 | | 257 | |
| | HSBC Markets Inc | 165 | | 70 | | 43 | | 52 | | (33 | ) | (27 | ) | 112 | |
| | HSBC Mexico | 377 | | (14 | ) | (17 | ) | 408 | | 519 | | (162 | ) | 51 | |
| | | | | | | | | | | | | | | | |
| South America | Brazilian operations | 842 | | 369 | | (282 | ) | 755 | | 132 | | 132 | | 491 | |
| | HSBC Bank Argentina | 27 | | 9 | | (39 | ) | 57 | | 6 | | (166 | ) | 217 | |
| | | | | | | | | | | | | | | |
| Other operations | 741 | | 261 | | (30 | ) | 510 | | 81 | | (224 | ) | 653 | |
| |
| | | | | |
| | | | | |
| |
| | 9,932 | | 1,494 | | 411 | | 8,027 | | 1,202 | | (1,515 | ) | 8,340 | |
| |
| | | | | |
| | | | | |
| |
133
Back to Contents
H S B C H O L D I N G S P L C
Financial Review(continued)
| | | 2004 compared with 2003 | | 2003 compared with 2002 | | | |
| | | Increase/(decrease) | | Increase/(decrease) | | | |
| | |
| |
| | | |
| Interest expense(continued) | 2004 | | Volume | | Rate | | 2003 | | Volume | | Rate | | 2002 | |
| | | US$m | | US$m | | US$m | | US$m | | US$m | | US$m | | US$m | |
| CDs and other money market instruments | | | | | | | | | | | | | | |
| | | | | | | | | | | | | | | |
| Europe | HSBC Bank | 424 | | 195 | | 78 | | 151 | | 132 | | (64 | ) | 83 | |
| | CCF | 214 | | 117 | | (65 | ) | 162 | | 37 | | (76 | ) | 201 | |
| | | | | | | | | | | | | | | | |
| Hong Kong | Hang Seng Bank | 30 | | (3 | ) | (3 | ) | 36 | | (23 | ) | (6 | ) | 65 | |
| | The Hongkong and Shanghai | | | | | | | | | | | | | | |
| | Banking Corporation | 357 | | 51 | | (15 | ) | 321 | | 142 | | (79 | ) | 258 | |
| | | | | | | | | | | | | | | | |
| Rest of Asia- | The Hongkong and Shanghai | | | | | | | | | | | | | | |
| Pacific | Banking Corporation | 183 | | 51 | | 11 | | 121 | | 63 | | (11 | ) | 69 | |
| | HSBC Bank Malaysia | 8 | | – | | – | | 8 | | 5 | | (4 | ) | 7 | |
| | | | | | | | | | | | | | | | |
| North America | HSBC USA Inc | 26 | | 2 | | (2 | ) | 26 | | (18 | ) | (18 | ) | 62 | |
| | HSBC Finance Corporation | 188 | | 64 | | 64 | | 60 | | 60 | | – | | – | |
| | HSBC Bank Canada | 89 | | 24 | | (19 | ) | 84 | | 25 | | 3 | | 56 | |
| | HSBC Mexico | 134 | | (20 | ) | (15 | ) | 169 | | 258 | | (111 | ) | 22 | |
| | | | | | | | | | | | | | | | |
| South America | Brazilian operations | 15 | | 7 | | (4 | ) | 12 | | 3 | | (5 | ) | 14 | |
| | HSBC Bank Argentina | – | | – | | – | | – | | (7 | ) | – | | 7 | |
| | | | | | | | | | | | | | | |
| Other operations | 106 | | 22 | | 25 | | 59 | | 15 | | 28 | | 16 | |
| | |
| | | | | |
| | | | | |
| |
| | | 1,774 | | 625 | | (60 | ) | 1,209 | | 556 | | (207 | ) | 860 | |
| | |
| | | | | |
| | | | | |
| |
| Loan capital | | | | | | | | | | | | | | | |
| | | | | | | | | | | | | | | | |
| Europe | HSBC Bank | 579 | | 92 | | 21 | | 466 | | 114 | | (111 | ) | 463 | |
| | CCF | 219 | | 22 | | 10 | | 187 | | 73 | | (50 | ) | 164 | |
| | HSBC Finance Corporation | 161 | | 62 | | (12 | ) | 111 | | 111 | | – | | – | |
| | | | | | | | | | | | | | | | |
| Hong Kong | The Hongkong and Shanghai | | | | | | | | | | | | | | |
| | Banking Corporation | 80 | | (7 | ) | 7 | | 80 | | – | | (3 | ) | 83 | |
| | | | | | | | | | | | | | | | |
| Rest of Asia- | The Hongkong and Shanghai | | | | | | | | | | | | | | |
| Pacific | Banking Corporation | 42 | | 28 | | (3 | ) | 17 | | 9 | | (4 | ) | 12 | |
| | | | | | | | | | | | | | | | |
| North America | HSBC USA Inc | 350 | | 330 | | (158 | ) | 178 | | (7 | ) | (29 | ) | 214 | |
| | HSBC Finance Corporation | 2,751 | | 746 | | 226 | | 1,779 | | 1,779 | | – | | – | |
| | HSBC Bank Canada | 76 | | 35 | | (25 | ) | 66 | | 18 | | (17 | ) | 65 | |
| | HSBC Mexico | – | | (13 | ) | – | | 13 | | 18 | | (7 | ) | 2 | |
| | | | | | | | | | | | | | | | |
| South America | Brazilian operations | 49 | | 12 | | (9 | ) | 46 | | (11 | ) | 13 | | 44 | |
| | HSBC Bank Argentina | 7 | | (22 | ) | (1 | ) | 30 | | 7 | | (39 | ) | 62 | |
| | | | | | | | | | | | | | | |
| Other operations | (22 | ) | (132 | ) | (23 | ) | 133 | | 51 | | (85 | ) | (167 | ) |
| | |
| | | | | |
| | | | | |
| |
| | | 4,292 | | 920 | | 266 | | 3,106 | | 2,199 | | (369 | ) | 1,276 | |
| | |
| | | | | |
| | | | | |
| |
| | | | | | | | | | | | | | | | |
134
Back to Content
All HSBC’s activities involve analysis, evaluation, acceptance and management of some degree of risk or combination of risks. The most important types of risk are credit risk (which includes country and cross-border risk), liquidity risk, market risk, reputational risk and operational risk. Market risk includes foreign exchange, interest rate and equity price risks.
HSBC’s risk management policies are designed to identify and analyse these risks, to set appropriate risk limits and controls, and to monitor the risks and limits continually by means of reliable and up-to-date administrative and information systems. HSBC continually modifies and enhances its risk management policies and systems to reflect changes in markets and products and in best practice risk management processes. Training, individual responsibility and accountability, together with a disciplined, conservative and constructive culture of control, lie at the heart of HSBC’s management of risk.
The Group Management Board, under authority delegated by the Board of Directors, formulates high level Group risk management policy. A separately constituted Risk Management Meeting monitors risk and receives reports which allow it to review the effectiveness of HSBC’s risk management policies.
Credit risk management
Credit risk is the risk that financial loss arises from the failure of a customer or counterparty to meet its obligations under a contract. It arises principally from lending, trade finance, treasury and leasing activities. HSBC has dedicated standards, policies and procedures to control and monitor all such risks.
Within Group Head Office, a separate function, Group Credit and Risk, is mandated to provide high-level centralised management of credit risk for HSBC worldwide. Group Credit and Risk is headed by a Group General Manager who reports to the Group Chief Executive, and its responsibilities include the following:
| • | Formulating credit policies. These are embodied in HSBC standards with which all HSBC’s operating companies are required to comply in formulating and recording in dedicated manuals their own more detailed credit policies and procedures. All such credit policies and procedures are monitored by Group Credit and Risk. |
| | |
| • | Establishing and maintaining HSBC’s large credit exposure policy. This policy sets controls |
| | over the maximum level of HSBC’s exposure to customers, customer groups and other risk concentrations in an approach which is designed to be more conservative than internationally accepted regulatory standards. All operating companies within HSBC are required to adopt this approach. |
| | |
| • | Issuing lending guidelines to HSBC’s operating companies on the Group’s attitude towards, and appetite for lending to,inter alia, specified market sectors, industries and products. Each HSBC operating company and major business unit is required to base its own lending guidelines on HSBC’s standards, regularly update them and disseminate them to all credit and marketing executives. |
| | |
| • | Undertaking an independent review and objective assessment of risk. Group Credit and Risk assesses all commercial non-bank credit facilities originated by HSBC’s operating companies in excess of designated limits, prior to the facilities being committed to customers. Operating companies may not confirm credit approval without this concurrence. Renewals and reviews of commercial non-bank facilities over designated levels are subject to the same process. |
| | |
| • | Controlling exposures to banks and other financial institutions. HSBC’s credit and settlement risk limits to counterparties in the finance and government sectors are approved centrally to optimise the use of credit availability and avoid excessive risk concentration. A dedicated unit within Group Credit and Risk controls and manages these exposures globally using centralised systems and automated processes. |
| | |
| • | Controlling cross-border exposures. Country and cross-border risk is managed by a dedicated unit within Group Credit and Risk using centralised systems, through the imposition of country limits with sub-limits by maturity and type of business. Country limits are determined by taking into account economic and political factors, and applying local business knowledge. Transactions with countries deemed to be high risk are considered case-by-case. |
| | |
| • | Controlling exposures to selected industries. Group Credit and Risk controls HSBC’s exposure to the shipping and aviation sectors, and closely monitors exposures to other industries such as telecommunications, automobiles, insurance and real estate. Where necessary, restrictions are imposed on new |
135
Back to Content
H S B C H O L D I N G S P L C
Financial Review(continued)
| | business, or exposure within HSBC’s operating companies is capped. |
| | |
| • | Maintaining and developing HSBC’s facility grading process in order to categorise exposures into meaningful segments and facilitate focused management of the identified risks. Historically, HSBC’s grading framework involved a minimum of seven grades, the first three of which are applied to differing levels of satisfactory risk. Of the four unsatisfactory grades, grades 6 and 7 are non-performing loans. For banks, the grading structure involves ten tiers, six of which cover satisfactory risk. A more sophisticated grading framework, based on default probability and loss estimates and comprising up to 22 categories, is being progressively implemented across the HSBC Group and is already operative in several major business units. This new approach will increasingly allow a more granular analysis of risk trends. Grading methodology is based upon a wide range of financial analytics together with market data-based tools which are core inputs to the assessment of counterparty risk. Although automated grading processes are increasingly in use for the larger facilities, ultimate responsibility for setting facility grades rests with the final approving executive in each case. Facility grades are reviewed frequently and amendments, where necessary, are implemented promptly. |
| | |
| • | Reviewing the performance and effectiveness of operating companies’ credit approval processes. Regular reports are provided to Group Credit and Risk on the credit quality of local portfolios and corrective action is taken where necessary. |
| | |
| • | Reporting to certain senior executives on aspects of the HSBC loan portfolio. These executives, as well as the Group Management Board, the Risk Management Meeting, the Group Audit Committee and the Board, receive a variety of regular reports covering: |
| | | |
| | – | risk concentrations and exposure to industry sectors; |
| | | |
| | – | large customer group exposures; |
| | | |
| | – | emerging market debt and provisioning; |
| | | |
| | – | large non-performing accounts and provisions; |
| | | |
| | – | specific segments of the portfolio: real estate, telecommunications, automobiles, insurance, aviation and shipping, as well asad hocreviews; |
| | – | country limits and cross-border exposures; and |
| | | |
| | – | causes of unexpected loss and lessons learned. |
| | |
| • | Managing and directing credit-related systems initiatives. HSBC has a centralised database of large corporate, sovereign and bank facilities and is constructing a database comprising all Group credit assets. A systems-based credit application process for bank lending is operational in all jurisdictions and a common electronic corporate credit application system is deployed in all of the Group’s major businesses. |
| | |
| • | Providing advice and guidance to HSBC’s operating companies in order to promote best practice throughout the Group on credit-related matters such as: |
| | | |
| | – | regulatory developments; |
| | | |
| | – | implementing environmental and social responsibility policies; |
| | | |
| | – | scoring and portfolio provisioning; |
| | | |
| | – | new products; |
| | | |
| | – | training courses; and |
| | | |
| | – | credit-related reporting. |
| | |
| • | Acting on behalf of HSBC Holdings as the primary interface for credit-related issues with external parties including the Bank of England, the UK FSA, rating agencies, corporate analysts, trade associations and counterparts in the world’s major banks and non-bank financial institutions. |
| | |
| Each operating company is required to implement credit policies, procedures and lending guidelines which conform to HSBC Group standards, with credit approval authorities delegated from the Board of Directors of HSBC Holdings to the relevant Chief Executive Officer. In each major subsidiary, management includes a Chief Risk Officer (or Chief Credit Officer) who reports to the local Chief Executive Officer on credit-related issues. All Chief Credit/Risk Officers have a functional reporting line to the Group General Manager, Group Credit and Risk. |
| | |
| Each operating company is responsible for the quality and performance of its credit portfolios and for monitoring and controlling all credit risks in its portfolios, including those subject to central approval by Group Credit and Risk. This includes managing its own risk concentrations by market sector, geography and product. Local systems are in |
136
Back to Content
place throughout the Group to enable operating companies to control and monitor exposures by customer and counterparty.
Special attention is paid to problem loans. When appropriate, specialist units are established by HSBC’s operating companies to provide customers with intensive management and control support in order to help them avoid default wherever possible thereby maximising recoveries for HSBC.
Regular audits of operating companies’ credit processes are undertaken by HSBC’s Internal Audit function. Audits include consideration of the completeness and adequacy of credit manuals and lending guidelines, an in-depth analysis of a representative sample of accounts, an overview of homogeneous portfolios of similar assets to assess the quality of the loan book and other exposures, and adherence to Group standards and policies in the extension of credit facilities. Individual accounts are reviewed to ensure that facility grades are appropriate, that credit and collection procedures have been properly followed and that, where an account or portfolio evidences deterioration, adequate provisions are raised in accordance with the Group’s established processes. Internal Audit will discuss with management facility gradings they consider to be inappropriate, and their subsequent recommendations for revised g rades must then be assigned to the facilities concerned.
Provisions for bad and doubtful debts
It is HSBC’s policy that each operating company make provision for bad and doubtful debts promptly when required and on a consistent basis in accordance with established Group guidelines.
HSBC’s grading process for credit facilities extended by members of the Group is designed to highlight exposures requiring greater management attention based on a higher probability of default and potential loss. Management particularly focuses on facilities to those borrowers and portfolio segments classified below satisfactory grades. Amendments to facility grades, where necessary, are required to be undertaken promptly. Management also regularly evaluates the adequacy of the established provisions for bad and doubtful debts by conducting a detailed review of the loan portfolio, comparing performance and delinquency statistics to historical trends and assessing the impact of current economic conditions.
Two types of provision are in place: specific and general. These are discussed below.
Specific provisions
Specific provisions represent the quantification of actual and inherent losses from homogeneous portfolios of assets and individually identified accounts. In addition, specific provisions for the sovereign risk inherent in cross-border credit exposures are established for certain countries. Specific provisions are deducted from loans and advances in the balance sheet.
Portfolios
Where homogeneous groups of assets are reviewed on a portfolio basis, for example credit cards, other unsecured consumer lending, motor vehicle financing and residential mortgage loans, two alternative methods are used to calculate specific provisions:
| • | When appropriate empirical information is available, the Group utilises roll rate methodology (a statistical analysis of historical trends of the probability of default and amount of consequential loss, assessed at each time period for which payments are overdue), other historical data and an evaluation of current economic conditions, to calculate an appropriate level of specific provision based on inherent loss. In certain highly developed markets, sophisticated models also take into account behavioural and account management trends such as bankruptcy and restructuring statistics. Roll rates are regularly benchmarked against actual outcomes to ensure that they remain appropriate. |
| | |
| • | When the portfolio size is less than US$20 million or when information is insufficient or not sufficiently reliable for a roll rate methodology to be adopted, the Group uses a formulaic method which allocates progressively higher loss rates in line with the period of time through which a customer’s loan is overdue. |
| | |
| The Group intends to extend the use of the roll rate methodologies to all homogeneous portfolios of assets (for calculating specific provisions) as information becomes available. |
| | |
| The portfolio approach is applied to accounts in the following portfolios: |
| | |
| • | low value, homogeneous small business accounts in certain jurisdictions; |
| | |
| • | residential mortgages less than 90 days overdue; and |
| | |
| • | credit cards and other unsecured consumer lending products. |
137
Back to Content
H S B C H O L D I N G S P L C
FinancialReview(continued)
These portfolio provisions are generally reassessed monthly and charges for new provisions, or releases of existing provisions, are calculated for each separately identified portfolio.
Individually assessed accounts
Specific provisions on individually assessed accounts are determined by an evaluation of the exposures case-by-case. This procedure is applied to all accounts that do not qualify for, or are not subject to, a portfolio-based approach outlined above. In determining such provisions on individually assessed accounts, the following factors are considered:
| • | the Group’s aggregate exposure to the customer (including contingent liabilities); |
| | |
| • | the viability of the customer’s business model and capability to trade successfully out of financial difficulties and generate sufficient cash flow to service debt obligations; |
| | |
| • | the likely dividend available on liquidation or bankruptcy; |
| | |
| • | the extent of other creditors’ commitments ranking ahead of, orpari passuwith, the Group and the likelihood of other creditors continuing to support the company; |
| | |
| • | the complexity of determining the aggregate amount and ranking of all creditor claims and the extent to which legal and insurance uncertainties are evident; |
| | |
| • | the amount and timing of expected receipts and recoveries; |
| | |
| • | the realisable value of security (or other credit mitigants) and likelihood of successful repossession; |
| | |
| • | the deduction of any costs involved in recovery of amounts outstanding; |
| | |
| • | the ability of the borrower to obtain and make payments in the relevant foreign currency if loans are not in local currency; and, |
| | |
| • | where available, the secondary market price for the debt. |
| | |
| Group policy requires a review of the level of specific provisions on individual facilities above materiality thresholds at least half-yearly, or more regularly where individual circumstances require. This will normally include a review of collateral held (including re-confirmation of its enforceability) and an assessment of actual and anticipated receipts. For significant commercial and corporate debts, specialised loan ‘work-out’ teams with experience in |
insolvency and specific market sectors are used. This expertise enables likely losses on significant individual exposures to be assessed more accurately. Releases on individually calculated specific provisions are recognised whenever the Group has reasonable evidence that the established estimate of loss has been reduced.
Cross-border exposures
Specific provisions are established in respect of cross-border exposures to countries assessed by management to be vulnerable to foreign currency payment restrictions. This assessment includes analysis of both economic and political factors. Economic factors include the level of external indebtedness, the debt service burden and access to external sources of funds to meet the debtor country’s financing requirements. Political factors taken into account include the stability of the country and its government, potential threats to security and the quality and independence of the legal system.
Provisions are applied to all qualifying exposures within these countries unless these exposures:
| • | are performing, trade-related and of less than one year’s maturity; |
| | |
| • | are mitigated by acceptable security cover which is, other than in exceptional cases, held outside the country concerned; or |
| | |
| • | are represented by securities held for trading purposes for which a liquid and active market exists, and which are marked to market daily. |
General provisions
General provisions augment specific provisions and provide cover for loans which are impaired at the balance sheet date but which will not be individually identified as such until some time in the future. HSBC requires each operating company to maintain a general provision which is determined after taking into account:
| • | historical loss experience in portfolios of similar risk characteristics, for example, by industry sector, loan grade or product; |
| | |
| • | the estimated period between a loss occurring and that loss being identified and evidenced by the establishment of a specific provision against that loss; and |
| | |
| • | management’s judgement as to whether the current economic and credit conditions are such that the actual level of inherent losses is likely to be greater or less than that suggested by |
138
Back to Content
historical experience.
The estimated period between a loss occurring and its identification (as evidenced by the establishment of a specific provision for this loss) is determined by local management for each identified portfolio. In general, the periods used vary between four and twelve months.
In normal circumstances, historical experience is the most objective and accurate framework used to assess inherent loss within each portfolio. Historical loss experience is generally benchmarked against the weighted average annual rate of losses over a five-year period.
In certain circumstances, economic conditions are such that historical loss experience provides insufficient evidence of the inherent loss in a given portfolio. In such circumstances, management uses its judgement, supported by relevant experience from similar situations, to determine an appropriate general provision.
The basis used to establish the general provision within each reporting entity is documented, and is reviewed by senior Group credit management for conformity with Group policy.
Suspended and non-accrual interest
For individually assessed accounts, loans are designated as non-performing as soon as management has doubts as to the ultimate collectibility of principal or interest, or when contractual payments of principal or interest are 90 days overdue. When a loan is designated as non-performing, interest is not normally credited to the profit and loss account and either interest accruals will cease (‘non-accrual loans’) or interest will be credited to an interest suspense account in the balance sheet which is netted against the relevant loan (‘suspended interest’).
Within portfolios of low value, high volume, homogeneous loans, interest will normally be suspended on facilities 90 days or more overdue. In certain operating subsidiaries, interest income on credit cards may continue to be included in earnings after the account is 90 days overdue, provided that a suitable provision is raised against the portion of accrued interest which is considered to be irrecoverable.
The designation of a loan as non-performing and the suspension of interest may be deferred for up to 12 months in either of the following situations:
| • | cash collateral is held covering the total of principal and interest due and the right of set-off |
is legally sound; or
| • | the value of any net realisable tangible security is considered more than sufficient to cover the full repayment of all principal and interest due and credit approval has been given to the rolling-up or capitalisation of interest payments. |
| | |
| On receipt of cash (other than from the realisation of security), the overall risk is reevaluated and, if appropriate, suspended or non-accrual interest is recovered and taken to the profit and loss account. Amounts received from the realisation of security are applied first to the repayment of outstanding indebtedness, with any surplus used to recover specific provisions and then suspended interest. |
Charge-offs
Loans (and the related provisions) are normally charged off, either partially or in full, when there is no realistic prospect of recovery of these amounts and when the proceeds from the realisation of security have been received. Unsecured consumer facilities are charged off between 150 and 210 days overdue. In the case of HSBC Finance, this period is generally extended to 300 days overdue (270 days for real estate secured products). There are no cases where the charge-off period exceeds 360 days except for the UK where certain consumer finance accounts are still deemed collectible beyond this point. In the case of bankruptcy, charge-off can occur earlier.
US banks typically write off problem lending more quickly than is the practice in the UK. This means that HSBC’s reported levels of credit risk elements and associated provisions are likely to be higher than those of comparable US banks.
Restructuring of loans
Restructuring activity is designed to manage customer relationships, maximise collection opportunities and avoid foreclosure or repossession, if possible. Following restructuring, an overdue consumer account will normally be reset to current status. Restructuring policies and practices are based on indicators or criteria which, in the judgement of local management, evidence the probability that payment will continue. These policies are continually reviewed and their application varies depending upon the nature of the market, the product and the availability of empirically based data. Where empirical evidence indicates an increased propensity to default on restructured accounts, the use of roll rate methodologies for the calculation of provisions results in the increased default propensity being reflected in provisions.
139
Back to Content
H S B C H O L D I N G S P L C
FinancialReview(continued)
Restructuring activity is used most commonly within consumer finance portfolios. The largest concentration is domiciled in the US in HSBC Finance Corporation. The majority of restructured accounts relate to secured lending.
In addition to restructuring, HSBC’s consumer lending businesses, principally HSBC Finance Corporation’s, use other account management techniques on a more limited basis, such as extended payment arrangements, approved external debt management plans, deferring foreclosure, modification, loan rewrites and/or deferral of payments pending a change in circumstances. When using such techniques, accounts may be treated as current, although if payment difficulties are subsequently experienced they will be re-designated as delinquent.
At 31 December 2004, the total value of accounts which have been either restructured or subject to other account management techniques in HSBC Finance was US$15 billion, representing 12 per cent of the HSBC Finance loan book, compared with US$18 billion or some 15 per cent at 31 December 2003.
Assets acquired
Assets acquired in exchange for advances in order to achieve an orderly realisation continue to be reported as advances. The asset acquired is recorded at the carrying value of the advance disposed of at the date of the exchange and subsequent provisions are based on any further deterioration in value.
Loan portfolio
Loans and advances to customers are well spread across the various industrial sectors, as well as geographically.
At constant exchange rates, loans and advances to customers (excluding the finance sector and settlement accounts) grew by US$101.4 billion or 20 per cent, during 2004. On the same basis, personal lending comprised 63 per cent of HSBC’s loan portfolio and over 72 per cent of the growth in loans in 2004 related to personal and consumer lending.
Overall, including the finance sector and settlement accounts, personal lending represented 57 per cent of total advances to customers at 31 December 2004.
Gross loans and advances to customers
| | | | | | | | | |
| | | | Constant | | Under- | | | |
| | | | currency | | lying | | | |
| | 2003 | | effect | | change | | 2004 | |
| | US$m | | US$m | | US$m | | US$m | |
| Personal | | | | | | | | |
| Residential mortgages | 165,464 | | 5,634 | | 51,367 | | 222,465 | |
| Hong Kong Government Home Ownership Scheme | 6,290 | | (8 | ) | (880 | ) | 5,402 | |
| Other personal | 134,145 | | 2,935 | | 22,926 | | 160,006 | |
| |
| |
| |
| |
| |
| Total personal | 305,899 | | 8,561 | | 73,413 | | 387,873 | |
| |
| |
| |
| |
| |
| Corporate and commercial | | | | | | | | |
| Commercial, industrial and international trade | 85,668 | | 4,686 | | 10,987 | | 101,341 | |
| Commercial real estate | 35,088 | | 1,596 | | 6,699 | | 43,383 | |
| Other property-related | 17,140 | | 584 | | 2,924 | | 20,648 | |
| Government | 9,590 | | 223 | | 400 | | 10,213 | |
| Other commercial1 | 44,030 | | 2,325 | | 6,955 | | 53,310 | |
| |
| |
| |
| |
| |
| Total corporate and commercial | 191,516 | | 9,414 | | 27,965 | | 228,895 | |
| |
| |
| |
| |
| |
| Financial | | | | | | | | |
| Non-bank financial institutions | 37,091 | | 1,878 | | 13,271 | | 52,240 | |
| Settlement accounts | 8,594 | | 267 | | 4,973 | | 13,834 | |
| |
| |
| |
| |
| |
| Total financial | 45,685 | | 2,145 | | 18,244 | | 66,074 | |
| |
| |
| |
| |
| |
| Total gross loans and advances to customers | 543,100 | | 20,120 | | 119,622 | | 682,842 | |
| |
| |
| |
| |
| |
| | | | | | | | | |
| 1 Other commercial includes advances in respect of agriculture, transport, energy and utilities. |
140
Back to Contents
The commentary below is on a constant currency basis.
Residential mortgages increased by 28 per cent to US$227.9 billion and comprised 33 per cent of total gross loans to customers at 31 December 2004. Growth was particularly strong in North America where residential mortgages rose by 44 per cent to US$112.9 billion. A combination of low unemployment and low interest rates encouraged both growth in new lending and the refinancing of existing mortgages. HSBC Finance also introduced a number of new products and activated a new correspondent relationship in the first half of the year. Residential mortgages in Europe increased by 26 per cent, predominantly in the UK, reflecting the success of a number of marketing initiatives, competitive pricing and continued buoyancy in the housing market. Mortgage balances in Hong Kong were marginally lower than in 2003 as a 14 per cent fall in GHOS, which remained suspended during the year, offset a small rise in non-scheme mortgages. In the rest of Asia-Pacific, residential mortgages grew by US$2.0 billion, or 16 per cent, with particularly strong growth in China, the Middle East, India, South Korea, Taiwan and Singapore.
Other personal lending, which represented 23 per cent of total gross loans to customers at 31 December 2004, increased by 17 per cent to US$160.0 billion. Excluding the impact of the acquisition of M&S Money in the UK in November 2004, the increase was 13 per cent. In Europe, excluding this acquisition, other personal lending grew by 18 per cent as consumer expenditure remained strong, particularly in the UK, while
lending to European Private Banking clients rose by 22 per cent as customers took advantage of low interest rates to finance higher returning securities. Hong Kong and the rest of Asia-Pacific also benefited from improved consumer sentiment and other personal lending in Hong Kong increased by 23 per cent. In the rest of Asia-Pacific, an expansion of consumer credit and growth in the credit cards base contributed to a 25 per cent increase in other personal lending while the US benefited from strong growth in both the cards base and balances, and an expansion of auto finance lending.
Loans and advances to the large corporate sector remained subdued but commercial lending in Hong Kong and in the rest of Asia-Pacific expanded as regional trade volumes grew. International trade balances in Hong Kong increased by 26 per cent to US$7.8 billion, as economic expansion in mainland China, and buoyant consumer spending in the US encouraged business expansion. Inter-regional trade volumes also grew across the rest of Asia-Pacific and trade finance lending in the region increased by 30 per cent with particularly strong growth in the Middle East, where oil producing countries benefited from high global oil prices, Singapore, Korea and Japan.
The following tables analyse loans by industry sector and by the location of the principal operations of the lending subsidiary or, in the case of the operations of The Hongkong and Shanghai Banking Corporation, HSBC Bank, HSBC Bank Middle East and HSBC Bank USA, by the location of the lending branch.
141
Back to Contents
H S B C H O L D I N G S P L C
Financial Review(continued)
Customer loans and advances by industry sector
| | At 31 December 2004 | |
| |
| |
| | | | | | | | | | | | | | Gross loans | |
| | | | | | | | | | | | Gross | | by customer | |
| | | | | | Rest of | | | | | | loans and | | type as a | |
| | | | Hong | | Asia- | | North | | South | | advances to | | % of total | |
| | Europe | | Kong | | Pacific | | America | | America | | customers | | gross loans | |
| | US$m | | US$m | | US$m | | US$m | | US$m | | US$m | | % | |
| Personal | | | | | | | | | | | | | | |
| Residential mortgages | 70,552 | | 24,040 | | 14,799 | | 112,866 | | 208 | | 222,465 | | 32.6 | |
| Hong Kong Government Home | | | | | | | | | | | | | | |
| Ownership Scheme | – | | 5,402 | | – | | – | | – | | 5,402 | | 0.8 | |
| Other personal | 57,920 | | 9,104 | | 9,075 | | 80,463 | | 3,444 | | 160,006 | | 23.4 | |
| |
| |
| |
| |
| |
| |
| |
| |
| Total personal | 128,472 | | 38,546 | | 23,874 | | 193,329 | | 3,652 | | 387,873 | | 56.8 | |
| |
| |
| |
| |
| |
| |
| |
| |
| Corporate and commercial | | | | | | | | | | | | | | |
| Commercial, industrial and | | | | | | | | | | | | | | |
| international trade | 54,438 | | 14,138 | | 19,178 | | 11,599 | | 1,988 | | 101,341 | | 14.8 | |
| Commercial real estate | 18,827 | | 10,391 | | 4,232 | | 9,798 | | 135 | | 43,383 | | 6.4 | |
| Other property-related | 6,750 | | 5,959 | | 3,349 | | 4,518 | | 72 | | 20,648 | | 3.0 | |
| Government | 3,663 | | 615 | | 1,432 | | 3,868 | | 635 | | 10,213 | | 1.5 | |
| Other commercial1 | 31,626 | | 7,294 | | 7,023 | | 6,448 | | 919 | | 53,310 | | 7.8 | |
| |
| |
| |
| |
| |
| |
| |
| |
| Total corporate and commercial | 115,304 | | 38,397 | | 35,214 | | 36,231 | | 3,749 | | 228,895 | | 33.5 | |
| |
| |
| |
| |
| |
| |
| |
| |
| Financial | | | | | | | | | | | | | | |
| Non-bank financial institutions | 30,809 | | 1,932 | | 2,297 | | 17,090 | | 112 | | 52,240 | | 7.7 | |
| Settlement accounts | 4,491 | | 596 | | 305 | | 8,431 | | 11 | | 13,834 | | 2.0 | |
| |
| |
| |
| |
| |
| |
| |
| |
| Total financial | 35,300 | | 2,528 | | 2,602 | | 25,521 | | 123 | | 66,074 | | 9.7 | |
| |
| |
| |
| |
| |
| |
| |
| |
| Total gross loans and advances to | | | | | | | | | | | | | | |
| customers2 | 279,076 | | 79,471 | | 61,690 | | 255,081 | | 7,524 | | 682,842 | | 100.0 | |
| |
| |
| |
| |
| |
| |
| |
| |
| Percentage of Group loans and | | | | | | | | | | | | | | |
| advances by geographical | | | | | | | | | | | | | | |
| region | 40.9% | | 11.6% | | 9.0% | | 37.4% | | 1.1% | | 100.0% | | | |
| |
| |
| |
| |
| |
| |
| | | |
| Non-performing loans3,4 | 6,065 | | 773 | | 1,180 | | 4,583 | | 658 | | 13,259 | | | |
| Non-performing loans as a | | | | | | | | | | | | | | |
| percentage of gross loans and | | | | | | | | | | | | | | |
| advances to customers3,4 | 2.2% | | 1.0% | | 1.9% | | 1.8% | | 8.7% | | 1.9% | | | |
| Specific provisions outstanding | | | | | | | | | | | | | | |
| against loans and advances | 4,036 | | 331 | | 791 | | 4,420 | | 522 | | 10,100 | | | |
| Specific provisions outstanding | | | | | | | | | | | | | | |
| as a percentage of non- | | | | | | | | | | | | | | |
| performing loans3,4 | 66.5% | | 42.8% | | 67.0% | | 96.4% | | 79.3% | | 76.2% | | | |
| | | | | | | | | | | | | | | |
| 1 | Other commercial includes advances in respect of agriculture, transport, energy and utilities. |
| 2 | Included within this total is credit card lending of US$56,222 million. |
| 3 | Net of suspended interest. |
| 4 | Included in North America are non-performing loans of US$3,782 million and specific provisions of US$3,443 million in HSBC
Finance; excluding HSBC Finance, specific provisions outstanding as a percentage of non-performing loans was 54.6 per cent. |
Included in gross loans and advances to customers are the following numbers in respect of HSBC Finance, 92 per cent of which relate to North America:
| | 2004 | | 2003 | |
| | US$m | | US$m | |
| | | | | |
| Residential mortgages | 60,829 | | 46,057 | |
| Motor vehicle finance | 10,237 | | 8,868 | |
| MasterCard/Visa credit cards | 22,225 | | 21,207 | |
| Private label cards | 15,891 | | 15,413 | |
| Other unsecured personal lending | 32,677 | | 30,130 | |
| Corporate and commercial lending | 44 | | 101 | |
| |
| |
| |
| Total | 141,903 | | 121,776 | |
| |
| |
| |
142
Back to Contents
| | At 31 December 2003 | |
| |
| |
| | | | | | | | | | | | | | Gross loans | |
| | | | | | | | | | | | Gross | | by customer | |
| | | | | | Rest of | | | | | | loans and | | type as a | |
| | | | Hong | | Asia- | | North | | South | | advances to | | % of total | |
| | Europe | | Kong | | Pacific | | America | | America | | customers | | gross loans | |
| | US$m | | US$m | | US$m | | US$m | | US$m | | US$m | | % | |
| Personal | | | | | | | | | | | | | | |
| Residential mortgages | 51,721 | | 23,664 | | 12,101 | | 77,754 | | 224 | | 165,464 | | 30.3 | |
| Hong Kong Government Home | | | | | | | | | | | | | | |
| Ownership Scheme | – | | 6,290 | | – | | – | | – | | 6,290 | | 1.2 | |
| Other personal | 42,041 | | 7,420 | | 7,135 | | 75,173 | | 2,376 | | 134,145 | | 24.7 | |
| |
| |
| |
| |
| |
| |
| |
| |
| Total personal | 93,762 | | 37,374 | | 19,236 | | 152,927 | | 2,600 | | 305,899 | | 56.2 | |
| |
| |
| |
| |
| |
| |
| |
| |
| Corporate and commercial | | | | | | | | | | | | | | |
| Commercial, industrial and | | | | | | | | | | | | | | |
| international trade | 49,468 | | 10,966 | | 14,892 | | 8,907 | | 1,435 | | 85,668 | | 15.8 | |
| Commercial real estate | 15,517 | | 8,548 | | 3,149 | | 7,785 | | 89 | | 35,088 | | 6.5 | |
| Other property-related | 5,416 | | 5,075 | | 2,597 | | 3,994 | | 58 | | 17,140 | | 3.2 | |
| Government | 2,462 | | 927 | | 1,450 | | 4,104 | | 647 | | 9,590 | | 1.8 | |
| Other commercial1 | 24,239 | | 6,754 | | 5,735 | | 6,619 | | 683 | | 44,030 | | 8.1 | |
| |
| |
| |
| |
| |
| |
| |
| |
| Total corporate and commercial | 97,102 | | 32,270 | | 27,823 | | 31,409 | | 2,912 | | 191,516 | | 35.4 | |
| |
| |
| |
| |
| |
| |
| |
| |
| Financial | | | | | | | | | | | | | | |
| Non-bank financial institutions | 21,226 | | 4,921 | | 2,027 | | 8,839 | | 78 | | 37,091 | | 6.8 | |
| Settlement accounts | 3,068 | | 556 | | 188 | | 4,767 | | 15 | | 8,594 | | 1.6 | |
| |
| |
| |
| |
| |
| |
| |
| |
| Total financial | 24,294 | | 5,477 | | 2,215 | | 13,606 | | 93 | | 45,685 | | 8.4 | |
| |
| |
| |
| |
| |
| |
| |
| |
| Total gross loans and advances to | | | | | | | | | | | | | | |
| customers2 | 215,158 | | 75,121 | | 49,274 | | 197,942 | | 5,605 | | 543,100 | | 100.0 | |
| |
| |
| |
| |
| |
| |
| |
| |
| Percentage of Group loans and | | | | | | | | | | | | | | |
| advances by geographical | | | | | | | | | | | | | | |
| region | 39.7% | | 13.8% | | 9.1% | | 36.4% | | 1.0% | | 100.0% | | | |
| |
| |
| |
| |
| |
| |
| | | |
| Non-performing loans3 | 5,701 | | 1,671 | | 1,538 | | 5,444 | 4 | 696 | | 15,050 | | | |
| | | | | | | | | | | | | | | |
| Non-performing loans as a | | | | | | | | | | | | | | |
| percentage of gross loans and | | | | | | | | | | | | | | |
| advances to customers3 | 2.6% | | 2.2% | | 3.1% | | 2.8% | | 12.4% | | 2.8% | | | |
| Specific provisions outstanding | | | | | | | | | | | | | | |
| against loans and advances | 3,554 | | 629 | | 981 | | 5,184 | 4 | 530 | | 10,878 | | | |
| | | | | | | | | | | | | | | |
| Specific provisions outstanding | | | | | | | | | | | | | | |
| as a percentage of non- | | | | | | | | | | | | | | |
| performing loans3 | 62.3% | | 37.6% | | 63.8% | | 95.2% | 4 | 76.1% | | 72.3% | | | |
| | | | | | | | | | | | | | | |
| 1 | Other commercial includes advances in respect of agriculture, transport, energy and utilities. |
| 2 | Included within this total is credit card lending of US$48,634 million. |
| 3 | Net of suspended interest. |
| 4 | Includes non-performing loans of US$4,380 million and specific provisions of US$4,448 million in HSBC Finance; excluding HSBC
Finance, specific provisions outstanding as a percentage of non-performing loans was 69.2 per cent. |
143
Back to Contents
H S B C H O L D I N G S P L C
Financial Review(continued)
Customer loans and advances by industry sector(continued)
| | At 31 December 2002 | |
| |
|
|
|
|
|
|
|
|
|
|
| |
| | | | | | | | | | | | | | Gross loans | |
| | | | | | | | | | | | Gross | | by customer | |
| | | | | | Rest of | | | | | | loans and | | type as a | |
| | | | Hong | | Asia- | | North | | South | | advances to | | % of total | |
| | Europe | | Kong | | Pacific | | America | | America | | customers | | gross loans | |
| | US$m | | US$m | | US$m | | US$m | | US$m | | US$m | | % | |
| Personal | | | | | | | | | | | | | | |
| Residential mortgages | 38,719 | | 23,839 | | 7,507 | | 26,666 | | 253 | | 96,984 | | 26.9 | |
| Hong Kong Government Home Ownership Scheme | – | | 7,255 | | – | | – | | – | | 7,255 | | 2.0 | |
| Other personal | 26,748 | | 7,066 | | 5,900 | | 7,836 | | 1,012 | | 48,562 | | 13.4 | |
| |
| |
| |
| |
| |
| |
| |
| |
| Total personal | 65,467 | | 38,160 | | 13,407 | | 34,502 | | 1,265 | | 152,801 | | 42.3 | |
| |
| |
| |
| |
| |
| |
| |
| |
| Corporate and commercial | | | | | | | | | | | | | | |
| Commercial, industrial and international trade | 44,424 | | 10,173 | | 12,582 | | 10,773 | | 1,063 | | 79,015 | | 21.8 | |
| Commercial real estate | 11,887 | | 8,336 | | 2,701 | | 6,297 | | 46 | | 29,267 | | 8.1 | |
| Other property-related | 3,970 | | 4,805 | | 2,031 | | 4,515 | | 26 | | 15,347 | | 4.2 | |
| Government | 2,164 | | 719 | | 933 | | 4,575 | | 562 | | 8,953 | | 2.5 | |
| Other commercial1 | 22,712 | | 6,612 | | 5,950 | | 4,835 | | 565 | | 40,674 | | 11.2 | |
| |
| |
| |
| |
| |
| |
| |
| |
| Total corporate and commercial | 85,157 | | 30,645 | | 24,197 | | 30,995 | | 2,262 | | 173,256 | | 47.8 | |
| |
| |
| |
| |
| |
| |
| |
| |
| Financial | | | | | | | | | | | | | | |
| Non-bank financial institutions | 15,221 | | 2,055 | | 931 | | 9,231 | | 49 | | 27,487 | | 7.6 | |
| Settlement accounts | 2,622 | | 347 | | 192 | | 5,224 | | – | | 8,385 | | 2.3 | |
| |
| |
| |
| |
| |
| |
| |
| |
| Total financial | 17,843 | | 2,402 | | 1,123 | | 14,455 | | 49 | | 35,872 | | 9.9 | |
| |
| |
| |
| |
| |
| |
| |
| |
| | | | | | | | | | | | | | | |
| Total gross loans and advances to customers2 | 168,467 | | 71,207 | | 38,727 | | 79,952 | | 3,576 | | 361,929 | | 100.0 | |
| |
| |
| |
| |
| |
| |
| |
| |
| Percentage of Group loans and advances by geographical region | 46.5% | | 19.7% | | 10.7% | | 22.1% | | 1.0% | | 100.0% | | | |
| |
| |
| |
| |
| |
| |
| | | |
| Non-performing loans3 | 4,495 | | 1,724 | | 2,055 | | 1,773 | | 476 | | 10,523 | | | |
| | | | | | | | | | | | | | | |
| Non-performing loans as a percentage of gross loans and advances to customers3 | 2.7% | | 2.4% | | 5.3% | | 2.2% | | 13.3% | | 2.9% | | | |
| Specific provisions outstanding against loans and advances | 2,774 | | 688 | | 1,321 | | 1,482 | | 341 | | 6,606 | | | |
| | | | | | | | | | | | | | | |
| Specific provisions outstanding as a percentage of non-performing loans3 | 61.7% | | 39.9% | | 64.3% | | 83.6% | | 71.6% | | 62.8% | | | |
| | |
1
| Other commercial includes advances in respect of agriculture, transport, energy and utilities. |
2 | Included within this total is credit card lending of US$9,950 million. |
| 3 | Net of suspended interest. |
144
Back to Contents
| | At 31 December 2001 | |
| |
| |
| | | | | | | | | | | | | | Gross loans | |
| | | | | | | | | | | | Gross | | by customer | |
| | | | | | Rest of | | | | | | loans and | | type as a | |
| | | | Hong | | Asia- | | North | | South | | advances to | | % of total | |
| | Europe | | Kong | | Pacific | | America | | America | | customers | | gross loans | |
| | US$m | | US$m | | US$m | | US$m | | US$m | | US$m | | % | |
| Personal | | | | | | | | | | | | | | |
| Residential mortgages | 27,282 | | 23,125 | | 5,134 | | 22,126 | | 548 | | 78,215 | | 24.7 | |
| Hong Kong Government Home | | | | | | | | | | | | | | |
| Ownership Scheme | – | | 8,123 | | – | | – | | – | | 8,123 | | 2.6 | |
| Other personal | 21,065 | | 6,227 | | 4,616 | | 6,273 | | 1,280 | | 39,461 | | 12.3 | |
| |
| |
| |
| |
| |
| |
| |
| |
| Total personal | 48,347 | | 37,475 | | 9,750 | | 28,399 | | 1,828 | | 125,799 | | 39.6 | |
| |
| |
| |
| |
| |
| |
| |
| |
| Corporate and commercial | | | | | | | | | | | | | | |
| Commercial, industrial and | | | | | | | | | | | | | | |
| international trade | 38,476 | | 9,662 | | 11,226 | | 9,018 | | 1,720 | | 70,102 | | 22.1 | |
| Commercial real estate | 9,475 | | 8,474 | | 2,395 | | 5,877 | | 77 | | 26,298 | | 8.3 | |
| Other property-related | 3,630 | | 4,710 | | 2,169 | | 4,011 | | 69 | | 14,589 | | 4.6 | |
| Government | 2,393 | | 543 | | 900 | | 728 | | 775 | | 5,339 | | 1.7 | |
| Other commercial1 | 20,510 | | 6,349 | | 5,457 | | 4,230 | | 617 | | 37,163 | | 11.7 | |
| |
| |
| |
| |
| |
| |
| |
| |
| Total corporate and commercial | 74,484 | | 29,738 | | 22,147 | | 23,864 | | 3,258 | | 153,491 | | 48.4 | |
| |
| |
| |
| |
| |
| |
| |
| |
| Financial | | | | | | | | | | | | | | |
| Non-bank financial institutions | 11,329 | | 1,546 | | 752 | | 12,572 | | 118 | | 26,317 | | 8.3 | |
| Settlement accounts | 2,361 | | 223 | | 189 | | 8,984 | | 4 | | 11,761 | | 3.7 | |
| |
| |
| |
| |
| |
| |
| |
| |
| Total financial | 13,690 | | 1,769 | | 941 | | 21,556 | | 122 | | 38,078 | | 12.0 | |
| |
| |
| |
| |
| |
| |
| |
| |
| Total gross loans and advances | | | | | | | | | | | | | | |
| to customers2 | 136,521 | | 68,982 | | 32,838 | | 73,819 | | 5,208 | | 317,368 | | 100.0 | |
| |
| |
| |
| |
| |
| |
| |
| |
| Percentage of Group loans and | | | | | | | | | | | | | | |
| advances by geographical | | | | | | | | | | | | | | |
| region | 43.0% | | 21.7% | | 10.3% | | 23.3% | | 1.7% | | 100.0% | | | |
| |
| |
| |
| |
| |
| |
| | | |
| Non-performing loans3 | 3,682 | | 2,028 | | 2,723 | | 672 | | 544 | | 9,649 | | | |
| | | | | | | | | | | | | | | |
| Non-performing loans as a | | | | | | | | | | | | | | |
| percentage of gross loans and | | | | | | | | | | | | | | |
| advances to customers3 | 2.7% | | 2.9% | | 8.3% | | 0.9% | | 10.4% | | 3.0% | | | |
| | | | | | | | | | | | | | | |
| Specific provisions outstanding | | | | | | | | | | | | | | |
| against loans and advances | 2,204 | | 856 | | 1,786 | | 289 | | 365 | | 5,500 | | | |
| | | | | | | | | | | | | | | |
| Specific provisions outstanding | | | | | | | | | | | | | | |
| as a percentage of non- | | | | | | | | | | | | | | |
| performing loans3 | 59.8% | | 42.2% | | 65.6% | | 43.0% | | 67.1% | | 57.0% | | | |
| | |
| 1 | Other commercial includes advances in respect of agriculture, transport, energy and utilities. |
| 2 | Included within this total is credit card lending of US$8,289 million. |
| 3 | Net of suspended interest. |
145
Back to Contents
H S B C H O L D I N G S P L C
Financial Review(continued)
Customer loans and advances by industry sector(continued)
| | At 31 December 2000 | |
| |
| |
| | | | | | | | | | | | | | Gross loans | |
| | | | | | | | | | | | Gross | | by customer | |
| | | | | | Rest of | | | | | | loans and | | type as a | |
| | | | Hong | | Asia- | | North | | South | | advances to | | % of total | |
| | Europe | | Kong | | Pacific | | America | | America | | customers | | gross loans | |
| | US$m | | US$m | | US$m | | US$m | | US$m | | US$m | | % | |
| Personal | | | | | | | | | | | | | | |
| Residential mortgages | 24,048 | | 23,121 | | 3,723 | | 19,931 | | 809 | | 71,632 | | 24.0 | |
| Hong Kong Government Home | | | | | | | | | | | | | | |
| Ownership Scheme | – | | 7,353 | | – | | – | | – | | 7,353 | | 2.5 | |
| Other personal | 20,537 | | 4,923 | | 4,110 | | 6,847 | | 1,364 | | 37,781 | | 12.5 | |
| |
| |
| |
| |
| |
| |
| |
| |
| Total personal | 44,585 | | 35,397 | | 7,833 | | 26,778 | | 2,173 | | 116,766 | | 39.0 | |
| |
| |
| |
| |
| |
| |
| |
| |
| Corporate and commercial | | | | | | | | | | | | | | |
| Commercial, industrial and | | | | | | | | | | | | | | |
| international trade | 38,012 | | 9,584 | | 11,583 | | 9,274 | | 2,803 | | 71,256 | | 23.9 | |
| Commercial real estate | 10,053 | | 8,293 | | 2,749 | | 6,915 | | 77 | | 28,087 | | 9.4 | |
| Other property-related | 3,121 | | 3,850 | | 1,815 | | 4,072 | | 156 | | 13,014 | | 4.4 | |
| Government | 2,572 | | 130 | | 574 | | 715 | | 50 | | 4,041 | | 1.4 | |
| Other commercial1 | 19,570 | | 7,459 | | 5,406 | | 3,753 | | 937 | | 37,125 | | 12.4 | |
| |
| |
| |
| |
| |
| |
| |
| |
| Total corporate and commercial | 73,328 | | 29,316 | | 22,127 | | 24,729 | | 4,023 | | 153,523 | | 51.5 | |
| |
| |
| |
| |
| |
| |
| |
| |
| Financial | | | | | | | | | | | | | | |
| Non-bank financial institutions | 10,374 | | 1,664 | | 629 | | 8,629 | | 152 | | 21,448 | | 7.2 | |
| Settlement accounts | 3,946 | | 142 | | 361 | | 2,464 | | 41 | | 6,954 | | 2.3 | |
| |
| |
| |
| |
| |
| |
| |
| |
| Total financial | 14,320 | | 1,806 | | 990 | | 11,093 | | 193 | | 28,402 | | 9.5 | |
| |
| |
| |
| |
| |
| |
| |
| |
| Total gross loans and advances | | | | | | | | | | | | | | |
| to customers2 | 132,233 | | 66,519 | | 30,950 | | 62,600 | | 6,389 | | 298,691 | | 100.0 | |
| |
| |
| |
| |
| |
| |
| |
| |
| Percentage of Group loans and | | | | | | | | | | | | | | |
| advances by geographical | | | | | | | | | | | | | | |
| region | 44.3% | | 22.3% | | 10.4% | | 20.9% | | 2.1% | | 100.0% | | | |
| |
| |
| |
| |
| |
| |
| | | |
| Non-performing loans3 | 3,376 | | 2,521 | | 3,081 | | 684 | | 710 | | 10,372 | | | |
| | | | | | | | | | | | | | | |
| Non-performing loans as a | | | | | | | | | | | | | | |
| percentage of gross loans and | | | | | | | | | | | | | | |
| advances to customers3 | 2.6% | | 3.8% | | 9.9% | | 1.1% | | 11.1% | | 3.5% | | | |
| | | | | | | | | | | | | | | |
| Specific provisions outstanding | | | | | | | | | | | | | | |
| against loans and advances | 2,135 | | 1,241 | | 1,929 | | 278 | | 482 | | 6,065 | | | |
| | | | | | | | | | | | | | | |
| Specific provisions outstanding | | | | | | | | | | | | | | |
| as a percentage of non- | | | | | | | | | | | | | | |
| performing loans3 | 63.2% | | 49.2% | | 62.6% | | 40.6% | | 67.9% | | 58.5% | | | |
| | |
| 1 | Other commercial includes advances in respect of agriculture, transport, energy and utilities. |
| 2 | Included within this total is credit card lending of US$7,604 million. |
| 3 | Net of suspended interest. |
146
Back to Contents
Customer loans and advances by principal area within rest of Asia-Pacific and South America
| | At 31 December 2004 |
| |
|
| | | | | | | | Commercial, | | | |
| | | | | | | | international
| | | |
| | Residential | | Other | | Property- | | trade and | | | |
| | mortgages | | personal | | related | | other | | Total | |
| | US$m | | US$m | | US$m | | US$m | | US$m | |
| Loans and advances to customers (gross) | | | | | | | | | | |
| Australia and New Zealand | 5,871 | | 635 | | 2,580 | | 3,761 | | 12,847 | |
| India | 778 | | 371 | | 56 | | 1,440 | | 2,645 | |
| Indonesia | 12 | | 166 | | 9 | | 769 | | 956 | |
| Japan | 12 | | 106 | | 689 | | 3,532 | | 4,339 | |
| Mainland China | 256 | | 10 | | 794 | | 3,329 | | 4,389 | |
| Malaysia | 2,029 | | 670 | | 407 | | 2,611 | | 5,717 | |
| Middle East | 129 | | 1,976 | | 1,414 | | 6,326 | | 9,845 | |
| Singapore | 2,139 | | 3,027 | | 1,263 | | 2,259 | | 8,688 | |
| South Korea | 1,834 | | 189 | | 6 | | 1,559 | | 3,588 | |
| Taiwan | 1,509 | | 762 | | – | | 805 | | 3,076 | |
| Thailand | 28 | | 178 | | 75 | | 1,135 | | 1,416 | |
| Other | 202 | | 985 | | 288 | | 2,709 | | 4,184 | |
| |
| |
| |
| |
| |
| |
| Total of rest of Asia-Pacific | 14,799 | | 9,075 | | 7,581 | | 30,235 | | 61,690 | |
| |
| |
| |
| |
| |
| |
| Argentina | 37 | | 69 | | 21 | | 1,061 | | 1,188 | |
| Brazil | 170 | | 3,374 | | 158 | | 2,433 | | 6,135 | |
| Other | 1 | | 1 | | 28 | | 171 | | 201 | |
| |
| |
| |
| |
| |
| |
| Total of South America | 208 | | 3,444 | | 207 | | 3,665 | | 7,524 | |
| |
| |
| |
| |
| |
| |
| | | | | | | | | | | |
| | At 31 December 2003 |
| |
|
| | | | | | | | Commercial, | | | |
| | | | | | | | international | | | |
| | Residential | | Other | | Property- | | trade and | | | |
| | mortgages | | personal | | related | | other | | Total | |
| | US$m | | US$m | | US$m | | US$m | | US$m | |
| Loans and advances to customers (gross) | | | | | | | | | | |
| Australia and New Zealand | 5,436 | | 497 | | 1,835 | | 3,460 | | 11,228 | |
| India | 424 | | 305 | | 10 | | 1,329 | | 2,068 | |
| Indonesia | 13 | | 135 | | 20 | | 670 | | 838 | |
| Japan | 13 | | 75 | | 613 | | 2,731 | | 3,432 | |
| Mainland China | 78 | | 6 | | 614 | | 1,887 | | 2,585 | |
| Malaysia | 1,837 | | 518 | | 311 | | 2,591 | | 5,257 | |
| Middle East | 61 | | 1,660 | | 923 | | 4,726 | | 7,370 | |
| Singapore | 1,521 | | 2,420 | | 1,142 | | 2,219 | | 7,302 | |
| South Korea | 1,430 | | 81 | | – | | 847 | | 2,358 | |
| Taiwan | 1,073 | | 506 | | – | | 852 | | 2,431 | |
| Thailand | 32 | | 129 | | 82 | | 743 | | 986 | |
| Other | 183 | | 803 | | 196 | | 2,237 | | 3,419 | |
| |
| |
| |
| |
| |
| |
| Total of rest of Asia-Pacific | 12,101 | | 7,135 | | 5,746 | | 24,292 | | 49,274 | |
| |
| |
| |
| |
| |
| |
| Argentina | 47 | | 62 | | 16 | | 975 | | 1,100 | |
| Brazil | 176 | | 2,313 | | 122 | | 1,715 | | 4,326 | |
| Other | 1 | | 1 | | 9 | | 168 | | 179 | |
| |
| |
| |
| |
| |
| |
| Total of South America | 224 | | 2,376 | | 147 | | 2,858 | | 5,605 | |
| |
| |
| |
| |
| |
| |
H S B C H O L D I N G S P L C
FinancialReview(continued)
Analysis of loans and advances to banks by geographical region
| | | | | | | | | | | | | | Provisions | |
| | | | | | | | | | | | Gross | | for bad | |
| | | | | | Rest of | | | | | | loans and | | and | |
| | | | Hong | | Asia- | | North | | South | | advances | | doubtful | |
| | Europe | | Kong | | Pacific | | America | | America | | to banks | | debts | |
| | US$m | | US$m | | US$m | | US$m | | US$m | | US$m | | US$m | |
| | | | | | | | | | | | | | | |
| 31 December 2004 | 55,876 | | 45,300 | | 14,783 | | 24,176 | | 2,597 | | 142,732 | | (17 | ) |
| Suspended interest | | | | | | | | | | | (3 | ) | | |
| | | | | | | | | | | |
| | | |
| Total | | | | | | | | | | | 142,729 | | | |
| | | | | | | | | | | |
| | | |
| 31 December 2003 | 51,806 | | 38,639 | | 12,948 | | 11,885 | | 1,922 | | 117,200 | | (24 | ) |
| Suspended interest | | | | | | | | | | | (3 | ) | | |
| | | | | | | | | | | |
| | | |
| Total | | | | | | | | | | | 117,197 | | | |
| | | | | | | | | | | |
| | | |
| 31 December 2002 | 39,398 | | 33,359 | | 10,708 | | 10,391 | | 1,665 | | 95,521 | | (23 | ) |
| Suspended interest | | | | | | | | | | | (2 | ) | | |
| | | | | | | | | | | |
| | | |
| Total | | | | | | | | | | | 95,519 | | | |
| | | | | | | | | | | |
| | | |
| 31 December 2001 | 40,665 | | 42,516 | | 11,253 | | 7,979 | | 2,252 | | 104,665 | | (22 | ) |
| Suspended interest | | | | | | | | | | | (2 | ) | | |
| | | | | | | | | | | |
| | | |
| Total | | | | | | | | | | | 104,663 | | | |
| | | | | | | | | | | |
| | | |
| 31 December 2000 | 45,072 | | 57,154 | | 11,197 | | 9,441 | | 3,200 | | 126,064 | | (30 | ) |
| Suspended interest | | | | | | | | | | | (2 | ) | | |
| | | | | | | | | | | |
| | | |
| Total | | | | | | | | | | | 126,062 | | | |
| | | | | | | | | | | |
| | | |
Provisions against total loans and advances
| | Year ended 31 December 2004 |
| |
|
| | Specific | | | General | | | Total | | |
| | US$m | | | US$m | | | US$m | | |
| | | | | | | | | | |
| At 1 January 2004 | 10,902 | | | 2,813 | | | 13,715 | | |
| Amounts written off | (8,896 | ) | | – | | | (8,896 | ) | |
| Recoveries of advances written off in previous years | 912 | | | – | | | 912 | | |
| Charge/(credit) to profit and loss account | 6,793 | | | (436 | ) | | 6,357 | | |
| Acquisition of subsidiaries | 219 | | | 37 | | | 256 | | |
| Exchange and other movements | 187 | | | 155 | | | 342 | | |
| |
| | |
| | |
| | |
| At 31 December 2004 | 10,117 | | | 2,569 | | | 12,686 | | |
| |
| | |
| | |
| | |
| – HSBC Finance | 3,672 | | | 616 | | | 4,288 | | |
| – Rest of HSBC | 6,445 | | | 1,953 | | | 8,398 | | |
| | | | | | | | | | |
| | | | | | | | | | |
Provisions against loans and advances to customers
| | 2004 | | 2003 | | 2002 | | 2001 | | 2000 | |
| | % | | % | | % | | % | | % | |
| Total provisions to gross lending1 | | | | | | | | | | |
| Specific provisions | 1.58 | | 2.11 | | 1.94 | | 1.90 | | 2.17 | |
| General provisions | | | | | | | | | | |
| Additional general provisions held against Argentine risk | – | | – | | 0.04 | | 0.21 | | – | |
| Other | 0.40 | | 0.54 | | 0.70 | | 0.71 | | 0.75 | |
| |
| |
| |
| |
| |
| |
| Total provisions | 1.98 | | 2.65 | | 2.68 | | 2.82 | | 2.92 | |
| |
| |
| |
| |
| |
| |
| | | | | | | | | | | |
| 1 | Net of suspended interest, reverse repo transactions and settlement accounts. |
Back to Contents
The following tables show details of the movements in HSBC’s provisions for bad and doubtful debts by location of lending office for each of the past five
years. A discussion of the material movements in the charge for provisions by region follows these tables.
| | Year ended 31 December 2004 |
| |
|
| | | | | | | Rest of | | | | | | | |
| | | | | Hong | | Asia- | | North | | South | | | |
| | | Europe | | Kong | | Pacific | | America | | America | | Total | |
| | | US$m | | US$m | | US$m | | US$m | | US$m | | US$m | |
| | | | | | | | | | | | | | |
| Provisions at 1 January | | 4,435 | | 1,055 | | 1,181 | | 6,461 | | 583 | | 13,715 | |
| | | | | | | | | | | | | | |
| Amounts written off: | | | | | | | | | | | | | |
| Commercial, industrial and international trade | | (298 | ) | (35 | ) | (165 | ) | (72 | ) | (65 | ) | (635 | ) |
| Real estate | | (30 | ) | (55 | ) | (17 | ) | (3 | ) | (3 | ) | (108 | ) |
| Non-bank financial institutions | | (14 | ) | (2 | ) | (1 | ) | (3 | ) | – | | (20 | ) |
| Other commercial | | (211 | ) | (33 | ) | (42 | ) | (206 | ) | (24 | ) | (516 | ) |
| Residential mortgages | | (10 | ) | (52 | ) | (8 | ) | (493 | ) | (3 | ) | (566 | ) |
| Other personal | | (768 | ) | (161 | ) | (179 | ) | (5,640 | ) | (303 | ) | (7,051 | ) |
| | |
| |
| |
| |
| |
| |
| |
| Total amounts written off | | (1,331 | ) | (338 | ) | (412 | ) | (6,417 | ) | (398 | ) | (8,896 | ) |
| | |
| |
| |
| |
| |
| |
| |
| Recoveries of amounts written off in previous years: | | | | | | | | | | | | | |
| Commercial, industrial and international trade | | 27 | | 10 | | 4 | | 73 | | 4 | | 118 | |
| Real estate | | 3 | | – | | 10 | | 4 | | – | | 17 | |
| Non-bank financial institutions | | 3 | | – | | – | | – | | – | | 3 | |
| Other commercial | | 6 | | 3 | | 9 | | 34 | | 30 | | 82 | |
| Residential mortgages | | 1 | | 12 | | 1 | | 18 | | – | | 32 | |
| Other personal | | 97 | | 21 | | 41 | | 455 | | 46 | | 660 | |
| | |
| |
| |
| |
| |
| |
| |
| Total recoveries | | 137 | | 46 | | 65 | | 584 | | 80 | | 912 | |
| | |
| |
| |
| |
| |
| |
| |
| Net charge to profit and loss account1: | | | | | | | | | | | | | |
| Banks | | (7 | ) | – | | (1 | ) | – | | (2 | ) | (10 | ) |
| Commercial, industrial and international trade | | 181 | | (56 | ) | 49 | | (44 | ) | 47 | | 177 | |
| Real estate | | 21 | | (15 | ) | (29 | ) | (1 | ) | 1 | | (23 | ) |
| Non-bank financial institutions | | 19 | | (3 | ) | (1 | ) | – | | – | | 15 | |
| Governments | | (1 | ) | – | | – | | 1 | | – | | – | |
| Other commercial | | (68 | ) | (29 | ) | (18 | ) | (37 | ) | (38 | ) | (190 | ) |
| Residential mortgages | | 4 | | (12 | ) | 4 | | 485 | | 4 | | 485 | |
| Other personal | | 1,037 | | 116 | | 144 | | 4,783 | | 259 | | 6,339 | |
| General provisions | | (161 | ) | (224 | ) | (48 | ) | (1 | ) | (2 | ) | (436 | ) |
| | |
| |
| |
| |
| |
| |
| |
| Total charge | | 1,025 | | (223 | ) | 100 | | 5,186 | | 269 | | 6,357 | |
| Foreign exchange and other movements | | 547 | | (7 | ) | 15 | | (1 | ) | 44 | | 598 | |
| | |
| |
| |
| |
| |
| |
| |
| Provisions at 31 December | | 4,813 | | 533 | | 949 | | 5,813 | | 578 | | 12,686 | |
| | |
| |
| |
| |
| |
| |
| |
| Provisions against banks: | | | | | | | | | | | | | |
| Specific provisions | | 14 | | – | | 3 | | – | | – | | 17 | |
| Provisions against customers: | | | | | | | | | | | | | |
| Specific provisions | | 4,036 | | 331 | | 791 | | 4,420 | | 522 | | 10,100 | |
| General provisions2 | | 763 | | 202 | | 155 | | 1,393 | | 56 | | 2,569 | |
| | |
| |
| |
| |
| |
| |
| |
| Provisions at 31 December | | 4,813 | | 533 | | 949 | | 5,813 | | 578 | | 12,686 | |
| | |
| |
| |
| |
| |
| |
| |
| Provisions against customers as a percentage of loans and advances to customers: | | % | | % | | % | | % | | % | | % | |
| Specific provisions | | 1.45 | | 0.42 | | 1.28 | | 1.73 | | 6.94 | | 1.48 | |
| General provisions | | 0.27 | | 0.25 | | 0.25 | | 0.55 | | 0.74 | | 0.38 | |
| | |
| |
| |
| |
| |
| |
| |
| Total | | 1.72 | | 0.67 | | 1.53 | | 2.28 | | 7.68 | | 1.86 | |
| | |
| |
| |
| |
| |
| |
| |
| | | | | | | | | | | | | | |
| 1 | See table below ‘Net charge to the profit and loss account for bad and doubtful debts’. |
| 2 | General provisions are allocated to geographical segments based on the location of the office booking the provision. Consequently, the general provision booked in Hong Kong may cover assets booked in branches located outside Hong Kong, principally in the rest of Asia-Pacific, as well as those booked in Hong Kong. |
Back to Contents
H S B C H O L D I N G S P L C
Financial Review(continued)
| | Year ended 31 December 2003 | |
| |
| |
| | | | | | Rest of | | | | | | | |
| | | | Hong | | Asia- | | North | | South | | | |
| | Europe | | Kong | | Pacific | | America | | America | | Total | |
| | US$m | | US$m | | US$m | | US$m | | US$m | | US$m | |
| | | | | | | | | | | | | |
| Provisions at 1 January | 3,668 | | 1,143 | | 1,496 | | 2,356 | | 477 | | 9,140 | |
| | | | | | | | | | | | | |
| Amounts written off: | | | | | | | | | | | | |
| Commercial, industrial and international trade | (338 | ) | (71 | ) | (201 | ) | (337 | ) | (69 | ) | (1,016 | ) |
| Real estate | (31 | ) | (12 | ) | (18 | ) | (113 | ) | (5 | ) | (179 | ) |
| Non-bank financial institutions | (3 | ) | (13 | ) | (21 | ) | (30 | ) | – | | (67 | ) |
| Governments | (1 | ) | – | | (1 | ) | – | | – | | (2 | ) |
| Other commercial | (54 | ) | (65 | ) | (42 | ) | (104 | ) | (30 | ) | (295 | ) |
| Residential mortgages | (4 | ) | (121 | ) | (16 | ) | (529 | ) | (5 | ) | (675 | ) |
| Other personal | (471 | ) | (302 | ) | (146 | ) | (4,225 | ) | (78 | ) | (5,222 | ) |
| |
| |
| |
| |
| |
| |
| |
| Total amounts written off | (902 | ) | (584 | ) | (445 | ) | (5,338 | ) | (187 | ) | (7,456 | ) |
| |
| |
| |
| |
| |
| |
| |
| Recoveries of amounts written off in previous | | | | | | | | | | | | |
| years: | | | | | | | | | | | | |
| Commercial, industrial and international trade | 25 | | 16 | | 18 | | 20 | | 3 | | 82 | |
| Real estate | 3 | | – | | 4 | | 2 | | – | | 9 | |
| Non-bank financial institutions | 2 | | – | | 5 | | 4 | | – | | 11 | |
| Governments | – | | – | | – | | – | | – | | – | |
| Other commercial | 49 | | 4 | | 11 | | 10 | | 7 | | 81 | |
| Residential mortgages | 1 | | 6 | | 1 | | 4 | | 1 | | 13 | |
| Other personal | 62 | | 16 | | 35 | | 295 | | 6 | | 414 | |
| |
| |
| |
| |
| |
| |
| |
| Total recoveries | 142 | | 42 | | 74 | | 335 | | 17 | | 610 | |
| |
| |
| |
| |
| |
| |
| |
| Net charge to profit and loss account1: | | | | | | | | | | | | |
| Banks | (6 | ) | – | | 3 | | – | | – | | (3 | ) |
| Commercial, industrial and international trade | 286 | | (3 | ) | (45 | ) | 78 | | 60 | | 376 | |
| Real estate | 15 | | (18 | ) | (8 | ) | (1 | ) | 1 | | (11 | ) |
| Non-bank financial institutions | (1 | ) | 1 | | (17 | ) | (5 | ) | (1 | ) | (23 | ) |
| Governments | – | | – | | 1 | | – | | – | | 1 | |
| Other commercial | 216 | | 78 | | (4 | ) | 55 | | (6 | ) | 339 | |
| Residential mortgages | – | | 102 | | 23 | | 421 | | 6 | | 552 | |
| Other personal | 482 | | 271 | | 116 | | 3,992 | | 122 | | 4,983 | |
| General Provisions | (118 | ) | (31 | ) | 16 | | 136 | | (124 | ) | (121 | ) |
| |
| |
| |
| |
| |
| |
| |
| Total charge | 874 | | 400 | | 85 | | 4,676 | | 58 | | 6,093 | |
| | | | | | | | | | | | | |
| Foreign exchange and other movements2 | 653 | | 54 | | (29 | ) | 4,432 | | 218 | | 5,328 | |
| |
| |
| |
| |
| |
| |
| |
| Provisions at 31 December | 4,435 | | 1,055 | | 1,181 | | 6,461 | | 583 | | 13,715 | |
| |
| |
| |
| |
| |
| |
| |
| Provisions against banks: | | | | | | | | | | | | |
| Specific provisions | 20 | | – | | 4 | | – | | – | | 24 | |
| Provisions against customers: | | | | | | | | | | | | |
| Specific provisions | 3,554 | | 629 | | 981 | | 5,184 | | 530 | | 10,878 | |
| General provisions3 | 861 | | 426 | | 196 | | 1,277 | | 53 | | 2,813 | |
| |
| |
| |
| |
| |
| |
| |
| Provisions at 31 December | 4,435 | | 1,055 | | 1,181 | | 6,461 | | 583 | | 13,715 | |
| |
| |
| |
| |
| |
| |
| |
| Provisions against customers as a percentage | | | | | | | | | | | | |
| of loans and advances to customers: | % | | % | | % | | % | | % | | % | |
| Specific provisions | 1.65 | | 0.84 | | 1.99 | | 2.62 | | 9.46 | | 2.00 | |
| General provisions | 0.40 | | 0.57 | | 0.40 | | 0.65 | | 0.95 | | 0.52 | |
| |
| |
| |
| |
| |
| |
| |
| Total | 2.05 | | 1.41 | | 2.39 | | 3.27 | | 10.41 | | 2.52 | |
| |
| |
| |
| |
| |
| |
| |
| | | | | | | | | | | | | |
| 1 | See table below ‘Net charge to the profit and loss account for bad and doubtful debts’. |
| 2 | Other movements include amounts of US$129 million in Europe and US$4,524 million in North America transferred in on the acquisition of HSBC Finance Corporation, and of US$116 million in South America transferred in on the acquisition of Lloyds TSB Group’s Brazilian businesses and assets. |
| 3 | General provisions are allocated to geographical segments based on the location of the office booking the provision. Consequently, the general provision booked in Hong Kong may cover assets booked in branches located outside Hong Kong, principally in the rest of Asia-Pacific, as well as those booked in Hong Kong. |
150
Back to Contents
| | Year ended 31 December 2002 | |
| |
| |
| | | | | | Rest of | | | | | | | |
| | | | Hong | | Asia- | | North | | South | | | |
| | Europe | | Kong | | Pacific | | America | | America | | Total | |
| | US$m | | US$m | | US$m | | US$m | | US$m | | US$m | |
| | | | | | | | | | | | | |
| Provisions at 1 January | 3,067 | | 1,408 | | 1,952 | | 723 | | 1,033 | | 8,183 | |
| | | | | | | | | | | | | |
| Amounts written off: | | | | | | | | | | | | |
| Banks | – | | – | | – | | – | | (1 | ) | (1 | ) |
| Commercial, industrial and international trade | (161 | ) | (59 | ) | (255 | ) | (92 | ) | (28 | ) | (595 | ) |
| Real estate | (31 | ) | (18 | ) | (88 | ) | (9 | ) | (4 | ) | (150 | ) |
| Non-bank financial institutions | (4 | ) | (11 | ) | (2 | ) | (12 | ) | (2 | ) | (31 | ) |
| Governments | (1 | ) | – | | – | | – | | – | | (1 | ) |
| Other commercial | (54 | ) | (11 | ) | (116 | ) | (149 | ) | (22 | ) | (352 | ) |
| Residential mortgages | (2 | ) | (109 | ) | (7 | ) | (2 | ) | (10 | ) | (130 | ) |
| Other personal | (199 | ) | (328 | ) | (132 | ) | (96 | ) | (96 | ) | (851 | ) |
| |
| |
| |
| |
| |
| |
| |
| Total amounts written off | (452 | ) | (536 | ) | (600 | ) | (360 | ) | (163 | ) | (2,111 | ) |
| |
| |
| |
| |
| |
| |
| |
| Recoveries of amounts written off in previous | | | | | | | | | | | | |
| years: | | | | | | | | | | | | |
| Banks | | | | | | | | | | | | |
| Commercial, industrial and international trade | 15 | | 1 | | 4 | | 6 | | 2 | | 28 | |
| Real estate | 6 | | – | | 2 | | 6 | | – | | 14 | |
| Non-bank financial institutions | – | | – | | 1 | | – | | – | | 1 | |
| Governments | – | | – | | – | | – | | – | | – | |
| Other commercial | 7 | | 3 | | 14 | | 9 | | – | | 33 | |
| Residential mortgages | 1 | | 7 | | – | | – | | – | | 8 | |
| Other personal | 29 | | 14 | | 31 | | 14 | | 8 | | 96 | |
| |
| |
| |
| |
| |
| |
| |
| Total recoveries | 58 | | 25 | | 52 | | 35 | | 10 | | 180 | |
| |
| |
| |
| |
| |
| |
| |
| Net charge to profit and loss account1: | | | | | | | | | | | | |
| Banks | (2 | ) | – | | – | | – | | – | | (2 | ) |
| Commercial, industrial and international trade | 345 | | (22 | ) | 38 | | 89 | | 30 | | 480 | |
| Real estate | (4 | ) | 9 | | (11 | ) | 5 | | 2 | | 1 | |
| Non-bank financial institutions | 3 | | (14 | ) | (29 | ) | 18 | | 11 | | (11 | ) |
| Governments | (1 | ) | – | | – | | (5 | ) | 4 | | (2 | ) |
| Other commercial | 50 | | (22 | ) | (22 | ) | 116 | | 177 | | 299 | |
| Residential mortgages | – | | 70 | | 11 | | (4 | ) | 10 | | 87 | |
| Other personal | 243 | | 322 | | 93 | | 66 | | 96 | | 820 | |
| General Provisions | (65 | ) | (97 | ) | 9 | | 15 | | (213 | ) | (351 | ) |
| |
| |
| |
| |
| |
| |
| |
| Total charge | 569 | | 246 | | 89 | | 300 | | 117 | | 1,321 | |
| | | | | | | | | | | | | |
| Foreign exchange and other movements2 | 426 | | – | | 3 | | 1,658 | | (520 | ) | 1,567 | |
| |
| |
| |
| |
| |
| |
| |
| Provisions at 31 December | 3,668 | | 1,143 | | 1,496 | | 2,356 | | 477 | | 9,140 | |
| |
| |
| |
| |
| |
| |
| |
| Provisions against banks: | | | | | | | | | | | | |
| Specific provisions | 23 | | – | | – | | – | | – | | 23 | |
| Provisions against customers: | | | | | | | | | | | | |
| Specific provisions | 2,774 | | 688 | | 1,321 | | 1,482 | | 341 | | 6,606 | |
| General provisions3 | 871 | | 455 | | 175 | | 874 | | 136 | | 2,511 | |
| |
| |
| |
| |
| |
| |
| |
| Provisions at 31 December | 3,668 | | 1,143 | | 1,496 | | 2,356 | | 477 | | 9,140 | |
| |
| |
| |
| |
| |
| |
| |
| Provisions against customers as a percentage | | | | | | | | | | | | |
| of loans and advances to customers: | % | | % | | % | | % | | % | | % | |
| Specific provisions | 1.65 | | 0.97 | | 3.42 | | 1.85 | | 9.73 | | 1.83 | |
| General provisions | 0.52 | | 0.64 | | 0.45 | | 1.09 | | 3.88 | | 0.69 | |
| |
| |
| |
| |
| |
| |
| |
| Total | 2.17 | | 1.61 | | 3.87 | | 2.94 | | 13.61 | | 2.52 | |
| |
| |
| |
| |
| |
| |
| |
| | | | | | | | | | | | | |
| 1 | See table below ‘Net charge to the profit and loss account for bad and doubtful debts’. |
| 2 | Other movements include amounts transferred in on the acquisition of HSBC Mexico of US$1,704 million. |
| 3 | General provisions are allocated to geographical segments based on the location of the office booking the provision. Consequently, the general provision booked in Hong Kong may cover assets booked in branches located outside Hong Kong, principally in the Rest of Asia-Pacific, as well as those booked in Hong Kong. |
151
Back to Contents
H S B C H O L D I N G S P L C
Financial Review(continued)
| | Year ended 31 December 2001 | |
| |
| |
| | | | | | Rest of | | | | | | | |
| | | | Hong | | Asia- | | North | | South | | | |
| | Europe | | Kong | | Pacific | | America | | America | | Total | |
| | US$m | | US$m | | US$m | | US$m | | US$m | | US$m | |
| | | | | | | | | | | | | |
| Provisions at 1 January | 3,025 | | 1,802 | | 2,091 | | 739 | | 540 | | 8,197 | |
| | | | | | | | | | | | | |
| Amounts written off: | | | | | | | | | | | | |
| Banks | (5 | ) | – | | – | | – | | – | | (5 | ) |
| Commercial, industrial and international trade | (123 | ) | (238 | ) | (256 | ) | (107 | ) | (29 | ) | (753 | ) |
| Real estate | (27 | ) | (29 | ) | (18 | ) | (10 | ) | (4 | ) | (88 | ) |
| Non-bank financial institutions | (5 | ) | (53 | ) | (5 | ) | (3 | ) | (1 | ) | (67 | ) |
| Governments | – | | – | | – | | – | | – | | – | |
| Other commercial | (54 | ) | (34 | ) | (48 | ) | (107 | ) | (215 | ) | (458 | ) |
| Residential mortgages | (4 | ) | (121 | ) | (7 | ) | (2 | ) | (13 | ) | (147 | ) |
| Other personal | (224 | ) | (155 | ) | (93 | ) | (93 | ) | (95 | ) | (660 | ) |
| |
| |
| |
| |
| |
| |
| |
| Total amounts written off | (442 | ) | (630 | ) | (427 | ) | (322 | ) | (357 | ) | (2,178 | ) |
| |
| |
| |
| |
| |
| |
| |
| Recoveries of amounts written off in previous | | | | | | | | | | | | |
| years: | | | | | | | | | | | | |
| Banks | | | | | | | | | | | | |
| Commercial, industrial and international trade | 12 | | 1 | | 11 | | 18 | | 3 | | 45 | |
| Real estate | 1 | | 2 | | 1 | | – | | – | | 4 | |
| Non-bank financial institutions | – | | 3 | | 1 | | – | | – | | 4 | |
| Governments | – | | – | | – | | – | | – | | – | |
| Other commercial | 17 | | 12 | | 99 | | 11 | | 1 | | 140 | |
| Residential mortgages | 1 | | 5 | | – | | – | | – | | 6 | |
| Other personal | 34 | | 8 | | 26 | | 14 | | 4 | | 86 | |
| |
| |
| |
| |
| |
| |
| |
| Total recoveries | 65 | | 31 | | 138 | | 43 | | 8 | | 285 | |
| |
| |
| |
| |
| |
| |
| |
| Net charge to profit and loss account1: | | | | | | | | | | | | |
| Banks | (1 | ) | – | | – | | – | | – | | (1 | ) |
| Commercial, industrial and international trade | 164 | | 15 | | 157 | | 93 | | 55 | | 484 | |
| Real estate | (35 | ) | 16 | | (6 | ) | 2 | | 7 | | (16 | ) |
| Non-bank financial institutions | (2 | ) | (20 | ) | (14 | ) | 2 | | – | | (34 | ) |
| Governments | (2 | ) | – | | – | | (3 | ) | – | | (5 | ) |
| Other commercial | 143 | | (84 | ) | (58 | ) | 151 | | 90 | | 242 | |
| Residential mortgages | (47 | ) | 111 | | 10 | | 1 | | 17 | | 92 | |
| Other personal | 257 | | 168 | | 82 | | 70 | | 125 | | 702 | |
| General provisions | (36 | ) | (9 | ) | 1 | | (16 | ) | 633 | | 573 | |
| |
| |
| |
| |
| |
| |
| |
| Total charge | 441 | | 197 | | 172 | | 300 | | 927 | | 2,037 | |
| | | | | | | | | | | | | |
| Foreign exchange and other movements | (22 | ) | 8 | | (22 | ) | (37 | ) | (85 | ) | (158 | ) |
| |
| |
| |
| |
| |
| |
| |
| Provisions at 31 December | 3,067 | | 1,408 | | 1,952 | | 723 | | 1,033 | | 8,183 | |
| |
| |
| |
| |
| |
| |
| |
| Provisions against banks: | | | | | | | | | | | | |
| Specific provisions | 22 | | – | | – | | – | | – | | 22 | |
| Provisions against customers: | | | | | | | | | | | | |
| Specific provisions | 2,204 | | 856 | | 1,786 | | 289 | | 365 | | 5,500 | |
| General provisions2 | 841 | | 552 | | 166 | | 434 | | 668 | | 2,661 | |
| |
| |
| |
| |
| |
| |
| |
| Provisions at 31 December | 3,067 | | 1,408 | | 1,952 | | 723 | | 1,033 | | 8,183 | |
| |
| |
| |
| |
| |
| |
| |
| Provisions against customers as a percentage | | | | | | | | | | | | |
| of loans and advances to customers: | % | | % | | % | | % | | % | | % | |
| Specific provisions | 1.61 | | 1.24 | | 5.44 | | 0.39 | | 7.03 | | 1.73 | |
| General provisions | 0.62 | | 0.80 | | 0.51 | | 0.59 | | 12.87 | 3 | 0.84 | |
| |
| |
| |
| |
| |
| |
| |
| Total | 2.23 | | 2.04 | | 5.95 | | 0.98 | | 19.90 | | 2.57 | |
| |
| |
| |
| |
| |
| |
| |
| | | | | | | | | | | | | |
| 1 | See table below ‘Net charge to the profit and loss account for bad and doubtful debts’. |
| 2 | General provisions are allocated to geographical segments based on the location of the office booking the provision. Consequently, the general provision booked in Hong Kong may cover assets booked in branches located outside Hong Kong, principally in the Rest of Asia-Pacific, as well as those booked in Hong Kong. |
| 3 | Includes US$600 million of additional provisions held against Argentine loans. |
152
Back to Contents
| | Year ended 31 December 2000 | |
| |
| |
| | | | | | Rest of | | | | | | | |
| | | | Hong | | Asia- | | North | | South | | | |
| | Europe | | Kong | | Pacific | | America | | America | | Total | |
| | US$m | | US$m | | US$m | | US$m | | US$m | | US$m | |
| | | | | | | | | | | | | |
| Provisions at 1 January | 2,153 | | 1,887 | | 2,686 | | 864 | | 430 | | 8,020 | |
| | | | | | | | | | | | | |
| Amounts written off: | | | | | | | | | | | | |
| Banks | (9 | ) | – | | – | | – | | – | | (9 | ) |
| Commercial, industrial and international trade | (154 | ) | (202 | ) | (191 | ) | (97 | ) | (36 | ) | (680 | ) |
| Real estate | (27 | ) | (9 | ) | (58 | ) | (13 | ) | (3 | ) | (110 | ) |
| Non-bank financial institutions | (2 | ) | (8 | ) | (3 | ) | – | | – | | (13 | ) |
| Governments | (37 | ) | – | | – | | – | | – | | (37 | ) |
| Other commercial | (68 | ) | (68 | ) | (149 | ) | (97 | ) | (15 | ) | (397 | ) |
| Residential mortgages | (5 | ) | (82 | ) | (5 | ) | (4 | ) | (7 | ) | (103 | ) |
| Other personal | (181 | ) | (73 | ) | (88 | ) | (90 | ) | (30 | ) | (462 | ) |
| |
| |
| |
| |
| |
| |
| |
| Total amounts written off | (483 | ) | (442 | ) | (494 | ) | (301 | ) | (91 | ) | (1,811 | ) |
| |
| |
| |
| |
| |
| |
| |
| Recoveries of amounts written off in previous | | | | | | | | | | | | |
| years: | | | | | | | | | | | | |
| Banks | – | | – | | – | | – | | – | | – | |
| Commercial, industrial and international trade | 4 | | 3 | | 3 | | 1 | | 2 | | 13 | |
| Real estate | 7 | | – | | 2 | | 3 | | – | | 12 | |
| Non-bank financial institutions | 3 | | – | | 2 | | 1 | | – | | 6 | |
| Governments | 3 | | – | | – | | – | | – | | 3 | |
| Other commercial | 4 | | 4 | | 23 | | 11 | | 1 | | 43 | |
| Residential mortgages | 1 | | 1 | | – | | – | | 1 | | 3 | |
| Other personal | 32 | | 8 | | 19 | | 15 | | 6 | | 80 | |
| |
| |
| |
| |
| |
| |
| |
| Total recoveries | 54 | | 16 | | 49 | | 31 | | 10 | | 160 | |
| |
| |
| |
| |
| |
| |
| |
| Net charge to profit and loss account1: | | | | | | | | | | | | |
| Banks | 2 | | – | | – | | – | | – | | 2 | |
| Commercial, industrial and international trade | 87 | | 81 | | 107 | | 89 | | 43 | | 407 | |
| Real estate | (9 | ) | 40 | | 19 | | 10 | | 5 | | 65 | |
| Non-bank financial institutions | 1 | | – | | (3 | ) | (2 | ) | 2 | | (2 | ) |
| Governments | (19 | ) | – | | – | | – | | – | | (19 | ) |
| Other commercial | (3 | ) | (30 | ) | (18 | ) | 80 | | 21 | | 50 | |
| Residential mortgages | 1 | | 101 | | 5 | | 9 | | 12 | | 128 | |
| Other personal | 245 | | 55 | | 63 | | 109 | | 109 | | 581 | |
| General provisions | 43 | | 1 | | (188 | ) | (138 | ) | 2 | | (280 | ) |
| |
| |
| |
| |
| |
| |
| |
| Total charge | 348 | | 248 | | (15 | ) | 157 | | 194 | | 932 | |
| | | | | | | | | | | | | |
| Foreign exchange and other movements2 | 953 | | 93 | | (135 | ) | (12 | ) | (3 | ) | 896 | |
| |
| |
| |
| |
| |
| |
| |
| Provisions at 31 December | 3,025 | | 1,802 | | 2,091 | | 739 | | 540 | | 8,197 | |
| |
| |
| |
| |
| |
| |
| |
| Provisions against banks: | | | | | | | | | | | | |
| Specific provisions | 30 | | – | | – | | – | | – | | 30 | |
| Provisions against customers: | | | | | | | | | | | | |
| Specific provisions | 2,135 | | 1,241 | | 1,929 | | 278 | | 482 | | 6,065 | |
| General provisions3 | 860 | | 561 | | 162 | | 461 | | 58 | | 2,102 | |
| |
| |
| |
| |
| |
| |
| |
| Provisions at 31 December | 3,025 | | 1,802 | | 2,091 | | 739 | | 540 | | 8,197 | |
| |
| |
| |
| |
| |
| |
| |
| Provisions against customers as a percentage | | | | | | | | | | | | |
| of loans and advances to customers: | % | | % | | % | | % | | % | | % | |
| Specific provisions | 1.61 | | 1.87 | | 6.23 | | 0.44 | | 7.54 | | 2.03 | |
| General provisions | 0.65 | | 0.84 | | 0.53 | | 0.74 | | 0.91 | | 0.70 | |
| |
| |
| |
| |
| |
| |
| |
| Total | 2.26 | | 2.71 | | 6.76 | | 1.18 | | 8.45 | | 2.73 | |
| |
| |
| |
| |
| |
| |
| |
| | | | | | | | | | | | | |
| 1 | See table below ‘Net charge to the profit and loss account for bad and doubtful debts’. |
| 2 | Other movements include amounts transferred in on the acquisition of CCF of US$882 million. |
| 3 | General provisions are allocated to geographical segments based on the location of the office booking the provision. Consequently, the general provision booked in Hong Kong may cover assets booked in branches located outside Hong Kong, principally in the Rest of Asia-Pacific, as well as those booked in Hong Kong. |
153
Back to Contents
H S B C H O L D I N G S P L C
FinancialReview(continued)
Net charge to the profit and loss account for bad and doubtful debts
The charge for bad and doubtful debts and non-performing customer loans and related customer provisions can be analysed as follows:
| | Year ended 31 December 2004 | |
| |
| |
| | | | | Rest of | | | | | | | |
| | | | Hong | | Asia- | | North | | South | | | |
| | Europe | | Kong | | Pacific | | America | | America | | Total | |
| | US$m | | US$m | | US$m | | US$m | | US$m | | US$m | |
| Specific provisions: | | | | | | | | | | | | |
| New provisions | 2,049 | | 245 | | 418 | | 5,877 | | 400 | | 8,989 | |
| HSBC Finance | 382 | | – | | – | | 5,549 | | – | | 5,931 | |
| Rest of HSBC | 1,667 | | 245 | | 418 | | 328 | | 400 | | 3,058 | |
| Release of provisions no longer required | (726 | ) | (198 | ) | (205 | ) | (106 | ) | (49 | ) | (1,284 | ) |
| HSBC Finance | – | | – | | – | | – | | – | | – | |
| Rest of HSBC | (726 | ) | (198 | ) | (205 | ) | (106 | ) | (49 | ) | (1,284 | ) |
| Recoveries of amounts previously written off | (137 | ) | (46 | ) | (65 | ) | (584 | ) | (80 | ) | (912 | ) |
| HSBC Finance | (49 | ) | – | | – | | (428 | ) | – | | (477 | ) |
| Rest of HSBC | (88 | ) | (46 | ) | (65 | ) | (156 | ) | (80 | ) | (435 | ) |
| |
| |
| |
| |
| |
| |
| |
| | 1,186 | | 1 | | 148 | | 5,187 | | 271 | | 6,793 | |
| |
| |
| |
| |
| |
| |
| |
| General provisions: | | | | | | | | | | | | |
| HSBC Finance | (13 | ) | – | | – | | 16 | | – | | 3 | |
| Rest of HSBC | (148 | ) | (224 | ) | (48 | ) | (17 | ) | (2 | ) | (439 | ) |
| |
| |
| |
| |
| |
| |
| |
| | (161 | ) | (224 | ) | (48 | ) | (1 | ) | (2 | ) | (436 | ) |
| |
| |
| |
| |
| |
| |
| |
| Total bad and doubtful debt charge | 1,025 | | (223 | ) | 100 | | 5,186 | | 269 | | 6,357 | |
| |
| |
| |
| |
| |
| |
| |
| Bank | (7 | ) | – | | (1 | ) | – | | (2 | ) | (10 | ) |
| Customer | 1,032 | | (223 | ) | 101 | | 5,186 | | 271 | | 6,367 | |
| |
| |
| |
| |
| |
| |
| |
| Customer bad and doubtful debt charge | | | | | | | | | | | | |
| as a percentage of closing gross loans | | | | | | | | | | | | |
| and advances | 0.37 | % | (0.28 | %) | 0.16 | % | 2.03 | % | 3.60 | % | 0.93 | % |
| |
| |
| |
| |
| |
| |
| |
| | US$m | | US$m | | US$m | | US$m | | US$m | | US$m | |
| 31 December 2004 | | | | | | | | | | | | |
| Non-performing loans | 6,065 | | 773 | | 1,180 | | 4,583 | | 658 | | 13,259 | |
| HSBC Finance | 419 | | – | | – | | 3,782 | | – | | 4,201 | |
| Rest of HSBC | 5,646 | | 773 | | 1,180 | | 801 | | 658 | | 9,058 | |
| Provisions | 4,799 | | 533 | | 946 | | 5,813 | | 578 | | 12,669 | |
| HSBC Finance | 207 | | – | | – | | 4,081 | | – | | 4,288 | |
| Rest of HSBC | 4,592 | | 533 | | 946 | | 1,732 | | 578 | | 8,381 | |
The total bad and doubtful debt charge for HSBC Finance includes charges for:
| | | | North | | | |
| | Europe | | America | | Total | |
| | US$m | | US$m | | US$m | |
| Year ended 31 December 2004 | | | | | | |
| | | | | | | |
| Residential mortgages | 1 | | 518 | | 519 | |
| Credit cards | 66 | | 2,459 | | 2,525 | |
| Other personal lending | 253 | | 2,160 | | 2,413 | |
| | | | | | | |
| Year ended 31 December 2003 | | | | | | |
| Residential mortgages | – | | 423 | | 423 | |
| Credit cards | 59 | | 1,740 | | 1,799 | |
| Other personal lending | 122 | | 2,231 | | 2,353 | |
154
Back to Contents
| | Year ended 31 December 2003 | |
| |
| |
| | | | | | Rest of | | North | | South | | | |
| | Europe | | Hong Kong | | Asia-Pacific | | America | | America | | Total | |
| | US$m | | US$m | | US$m | | US$m | | US$m | | US$m | |
| Specific provisions: | | | | | | | | | | | | |
| New provisions | 1,485 | | 655 | | 412 | | 4,962 | | 263 | | 7,777 | |
| HSBC Finance1 | 193 | | – | | – | | 4,580 | | – | | 4,773 | |
| Rest of HSBC | 1,292 | | 655 | | 412 | | 382 | | 263 | | 3,004 | |
| Release of provisions no longer required | (351 | ) | (182 | ) | (269 | ) | (87 | ) | (64 | ) | (953 | ) |
| HSBC Finance1 | – | | – | | – | | (4 | ) | – | | (4 | ) |
| Rest of HSBC | (351 | ) | (182 | ) | (269 | ) | (83 | ) | (64 | ) | (949 | ) |
| Recoveries of amounts previously written off | (142 | ) | (42 | ) | (74 | ) | (335 | ) | (17 | ) | (610 | ) |
| HSBC Finance1 | (25 | ) | – | | – | | (282 | ) | – | | (307 | ) |
| Rest of HSBC | (117 | ) | (42 | ) | (74 | ) | (53 | ) | (17 | ) | (303 | ) |
| |
| |
| |
| |
| |
| |
| |
| | 992 | | 431 | | 69 | | 4,540 | | 182 | | 6,214 | |
| |
| |
| |
| |
| |
| |
| |
| General provisions: | | | | | | | | | | | | |
| HSBC Finance1 | 13 | | – | | – | | 100 | | – | | 113 | |
| Rest of HSBC | (131 | ) | (31 | ) | 16 | | 36 | | (124 | ) | (234 | ) |
| |
| |
| |
| |
| |
| |
| |
| | (118 | ) | (31 | ) | 16 | | 136 | | (124 | ) | (121 | ) |
| |
| |
| |
| |
| |
| |
| |
| Total bad and doubtful debt charge | 874 | | 400 | | 85 | | 4,676 | | 58 | | 6,093 | |
| Bank | (6 | ) | – | | 3 | | – | | – | | (3 | ) |
| Customer | 880 | | 400 | | 82 | | 4,676 | | 58 | | 6,096 | |
| |
| |
| |
| |
| |
| |
| |
| Customer bad and doubtful debt charge | | | | | | | | | | | | |
| as a percentage of closing gross loans | | | | | | | | | | | | |
| and advances | 0.41 | % | 0.53 | % | 0.17 | % | 2.36 | % | 1.03 | % | 1.12 | % |
| |
| |
| |
| |
| |
| |
| |
| | US$m | | US$m | | US$m | | US$m | | US$m | | US$m | |
| 31 December 2003 | | | | | | | | | | | | |
| Non-performing loans | 5,701 | | 1,671 | | 1,538 | | 5,444 | | 696 | | 15,050 | |
| HSBC Finance | 326 | | – | | – | | 4,380 | | – | | 4,706 | |
| Rest of HSBC | 5,375 | | 1,671 | | 1,538 | | 1,064 | | 696 | | 10,344 | |
| Provisions | 4,415 | | 1,055 | | 1,177 | | 6,461 | | 583 | | 13,691 | |
| HSBC Finance | 154 | | – | | – | | 5,047 | | – | | 5,201 | |
| Rest of HSBC | 4,261 | | 1,055 | | 1,177 | | 1,414 | | 583 | | 8,490 | |
1 Since the date of acquisition.
| | Year ended 31 December 2002 | |
| |
| |
| | | | | | Rest of | | North | | South | | | |
| | Europe | | Hong Kong | | Asia-Pacific | | America | | America | | Total | |
| | US$m | | US$m | | US$m | | US$m | | US$m | | US$m | |
| Specific provisions: | | | | | | | | | | | | |
| New provisions | 963 | | 528 | | 400 | | 399 | | 388 | | 2,678 | |
| Release of provisions no longer required | (271 | ) | (160 | ) | (268 | ) | (79 | ) | (48 | ) | (826 | ) |
| Recoveries of amounts previously written off | (58 | ) | (25 | ) | (52 | ) | (35 | ) | (10 | ) | (180 | ) |
| |
| |
| |
| |
| |
| |
| |
| | 634 | | 343 | | 80 | | 285 | | 330 | | 1,672 | |
| |
| |
| |
| |
| |
| |
| |
| General provisions: | | | | | | | | | | | | |
| Argentine additional provision | – | | – | | – | | – | | (196 | ) | (196 | ) |
| Other | (65 | ) | (97 | ) | 9 | | 15 | | (17 | ) | (155 | ) |
| |
| |
| |
| |
| |
| |
| |
| | (65 | ) | (97 | ) | 9 | | 15 | | (213 | ) | (351 | ) |
| |
| |
| |
| |
| |
| �� |
| |
| Total bad and doubtful debt charge | 569 | | 246 | | 89 | | 300 | | 117 | | 1,321 | |
| |
| |
| |
| |
| |
| |
| |
| Customer bad and doubtful debt charge | 569 | | 246 | | 89 | | 300 | | 117 | | 1,321 | |
| Customer bad and doubtful debt charge | | | | | | | | | | | | |
| as a percentage of closing gross loans | | | | | | | | | | | | |
| and advances | 0.34 | % | 0.35 | % | 0.23 | % | 0.38 | % | 3.27 | % | 0.36 | % |
| |
| |
| |
| |
| |
| |
| |
| | US$m | | US$m | | US$m | | US$m | | US$m | | US$m | |
| 31 December 2002 | | | | | | | | | | | | |
| Non-performing loans | 4,495 | | 1,724 | | 2,055 | | 1,773 | | 476 | | 10,523 | |
| Provisions | 3,645 | | 1,143 | | 1,496 | | 2,356 | | 477 | | 9,117 | |
155
Back to Contents
H S B C H O L D I N G S P L C
Financial Review(continued)
Net charge to the profit and loss account for bad and doubtful debts(continued)
| | Year ended 31 December 2001 | |
| |
| |
| | | | | | Rest of | | North | | South | | | |
| | Europe | | Hong Kong | | Asia-Pacific | | America | | America | | Total | |
| | US$m | | US$m | | US$m | | US$m | | US$m | | US$m | |
| Specific provisions: | | | | | | | | | | | | |
| New provisions | 802 | | 449 | | 577 | | 392 | | 346 | | 2,566 | |
| Release of provisions no longer required | (260 | ) | (212 | ) | (268 | ) | (42 | ) | (35 | ) | (817 | ) |
| Recoveries of amounts previously written off | (65 | ) | (31 | ) | (138 | ) | (43 | ) | (8 | ) | (285 | ) |
| |
| |
| |
| |
| |
| |
| |
| | 477 | | 206 | | 171 | | 307 | | 303 | | 1,464 | |
| |
| |
| |
| |
| |
| |
| |
| General provisions: | | | | | | | | | | | | |
| Argentine additional provision | – | | – | | – | | – | | 600 | | 600 | |
| Other | (36 | ) | (9 | ) | 1 | | (7 | ) | 24 | | (27 | ) |
| |
| |
| |
| |
| |
| |
| |
| | (36 | ) | (9 | ) | 1 | | (7 | ) | 624 | | 573 | |
| |
| |
| |
| |
| |
| |
| |
| Total bad and doubtful debt charge | 441 | | 197 | | 172 | | 300 | | 927 | | 2,037 | |
| |
| |
| |
| |
| |
| |
| |
| Customer bad and doubtful debt charge | 441 | | 197 | | 172 | | 300 | | 927 | | 2,037 | |
Customer bad and doubtful debt charge as a percentage of closing gross loans and advances | 0.32% | | 0.29% | | 0.52% | | 0.41% | | 17.80% | | 0.64% | |
| |
| |
| |
| |
| |
| |
| |
| | US$m | | US$m | | US$m | | US$m | | US$m | | US$m | |
| 31 December 2001 | | | | | | | | | | | | |
| Non-performing loans | 3,682 | | 2,028 | | 2,723 | | 672 | | 544 | | 9,649 | |
| Provisions | 3,045 | | 1,408 | | 1,952 | | 723 | | 1,033 | | 8,161 | |
| | | | | | | | | | | | | |
| | Year ended 31 December 2000 | |
| |
| |
| | | | | | Rest of | | North | | South | | | |
| | Europe | | Hong Kong | | Asia-Pacific | | America | | America | | Total | |
| | US$m | | US$m | | US$m | | US$m | | US$m | | US$m | |
| Specific provisions: | | | | | | | | | | | | |
| New provisions | 609 | | 454 | | 543 | | 395 | | 232 | | 2,233 | |
| Release of provisions no longer required | (248 | ) | (192 | ) | (321 | ) | (72 | ) | (28 | ) | (861 | ) |
| Recoveries of amounts previously written off | (56 | ) | (15 | ) | (49 | ) | (31 | ) | (9 | ) | (160 | ) |
| |
| |
| |
| |
| |
| |
| |
| | 305 | | 247 | | 173 | | 292 | | 195 | | 1,212 | |
| |
| |
| |
| |
| |
| |
| |
| General provisions: | | | | | | | | | | | | |
Special provision reflecting Asian risk raised in 1997 | – | | – | | (174 | ) | – | | – | | (174 | ) |
| Other | 43 | | 1 | | (14 | ) | (135 | ) | (1 | ) | (106 | ) |
| |
| |
| |
| |
| |
| |
| |
| | 43 | | 1 | | (188 | ) | (135 | ) | (1 | ) | (280 | ) |
| |
| |
| |
| |
| |
| |
| |
| Total bad and doubtful debt charge | 348 | | 248 | | (15 | ) | 157 | | 194 | | 932 | |
| |
| |
| |
| |
| |
| |
| |
| Customer bad and doubtful debt charge | 346 | | 248 | | (15 | ) | 157 | | 194 | | 930 | |
Customer bad and doubtful debt charge as a percentage of closing gross loans and advances | 0.26% | | 0.37% | | – | | 0.25% | | 3.04% | | 0.31% | |
| |
| |
| |
| |
| |
| |
| |
| | US$m | | US$m | | US$m | | US$m | | US$m | | US$m | |
| 31 December 2000 | | | | | | | | | | | | |
| Non-performing loans | 3,376 | | 2,521 | | 3,081 | | 684 | | 710 | | 10,372 | |
| Provisions | 2,995 | | 1,802 | | 2,091 | | 739 | | 540 | | 8,167 | |
156
Back to Contents
Year ended 31 December 2004 compared with year ended 31 December 2003
This commentary discusses the movements in the numbers reported on pages 142 to 156. In cases where exchange rate changes have contributed significantly to the movements, the exchange rate effect is quantified and the underlying movements are explained in terms of constant currency.
| The increase in the level of new specific provisions was principally driven by: |
| | |
| • | New specific provisions in North America, which were US$915 million, or 18 per cent, higher than in 2003, reflected the impact of an additional quarter’s charge for HSBC Finance of US$1,269 million. This was partly offset by a US$323 million reduction in the level of new specific provisions in HSBC Finance in the last nine months of the year compared with the equivalent period in 2003, despite a US$202 million increase resulting from the adoption of FFIEC provisioning policies in December 2004. The majority of HSBC Finance’s customer loans are in the consumer finance sector and are geographically well-spread across the United States, and the decline in new provisions in 2004 reflected the continued improvement in economic conditions, an expansion of near prime lending and the positive impact of tightened underwriting. By 31 December 2004, HSBC Finance’s two-month-and-over consumer delinquency ratio had improved to 4.4 per cent from 5.8 per cent in 2003. The improvement in the US economy was reflected in a fall in new specific provisions for commercial loans in HSBC Bank USA although this was partly offset by a rise in the level of new provisions for personal loans, in line with the growth in the portfolio. Portfolio growth also contributed to a rise in new specific provisions in both Mexico and Canada. |
| | |
| • | In Europe, new specific provisions were US$564 million, or 38 per cent, higher than in 2003, of which US$140 million or 9 per cent reflected the effects of foreign currency translation. Excluding the currency effect, US$98 million of the increase related to the impact of an additional quarter’s charge for HSBC Finance’s UK consumer finance business and US$61 million was in respect of Marks and Spencer Financial Services, which was acquired in November 2004. Underlying growth in provisions reflected the effect of an increase in unsecured personal lending, where higher levels of personal indebtedness and rising delinquency rates, and higher levels of personal |
| | bankruptcies, caused a rise in new specific provisions for unsecured personal lending. As a proportion of lending to the UK personal and consumer finance customer bases, credit costs represented 0.60 per cent and 3.09 per cent of lending respectively, compared with 0.42 per cent and 2.56 per cent in 2003. In the corporate and commercial portfolios, new specific provisions were raised against a small number of accounts in the commercial and industrial sectors although these were offset by a fall in new specific provisions required in the energy and utilities sectors compared with the levels seen in 2003. In France there were higher provisions, raised principally against the personal, financial and industrial sectors. |
| | |
| • | The US$137 million rise in new specific provisions in South America came largely from the full year impact of the Losango consumer finance business, acquired in December 2003, and from organic growth in the personal lending portfolios in Brazil as the economy grew. Argentina experienced a lower level of new specific provisions in 2004 than in 2003. |
| | |
| • | In Hong Kong, new specific provisions were US$410 million lower than in 2003. In an environment of falling unemployment, stronger GDP growth and reduced levels of bankruptcies, new specific provisions against unsecured personal lending fell by 51 per cent. The mortgage book benefited from rising property prices and the continued improvement in the economy, and new specific provisions were 79 per cent lower than in 2003. A lower level of new specific provisions was also experienced in the commercial portfolios and the relatively benign credit conditions during the year were particularly reflected in lower provisions in the electronic/electrical and international trade sectors. In 2003, the charge included a significant provision against one borrower in the corporate telecommunications sector. |
| | |
| • | New specific provisions in the rest of Asia-Pacific increased by US$6 million. At constant exchange rates, new specific provisions were broadly in line with 2003. There was a modest rise in new provisions against the personal sector in a number of countries across the region in line with the growth in personal lending. |
| | |
| • | In aggregate, specific provision releases and recoveries increased by US$633 million, or 40 per cent, compared with 2003. HSBC Finance contributed US$167 million of the increase due to the inclusion of an additional |
157
Back to Contents
H S B C H O L D I N G S P L C
Financial Review(continued)
| | quarter, improved collections and the sales of charged-off accounts. In Europe, excluding HSBC Finance, releases and recoveries were US$344 million higher, of which US$51 million arose from currency translation effects. At constant currencies, the increase reflected releases of provisions in the energy, utilities and petroleum sectors in the UK and manufacturing and transport equipment sectors in France, while recoveries benefited from the sale in the secondary market of loans to a borrower in the engineering sector. In North America, excluding HSBC Finance, releases and recoveries increased by US$126 million. The improvement reflected an ongoing workout programme to reduce the legacy bad debt portfolio in Mexico, higher repayments of previously non-performing loans in the US and the sale of impaired loans in the US secondary market. In Hong Kong, the benign credit environment and rising house prices contributed to a rise in releases and recoveries for residential mortgages. This offset a general fall in the levels of releases and recoveries in the Hong Kong commercial sector that was also evident across the Rest of Asia-Pacific. The sharp increase in releases and recoveries in South America largely reflected the inclusion of the Losango consumer lending business and organic growth in Brazil, together with successful collections activities in Argentina. |
| | |
| • | The general provision release of US$436 million in 2004 compared with a release of US$121 million in 2003. In Hong Kong, the net release of US$224 million reflected a reduction in the estimated latent loan losses at 31 December 2004. Estimates of latent losses reflect the historical experience of the rate at which such losses occur and are based on the structure of the credit portfolio and the economic and credit conditions prevailing at the balance sheet date. A similar situation was seen in Malaysia, Singapore and Indonesia where stable economic conditions were reflected in an improvement in credit quality and reduction in latent loan losses. As a result, the net charge for the Rest of Asia-Pacific in 2003 became a net release in 2004. In North America, the small general provision release compared with a charge of US$136 million in 2003 and reflected an improvement in the economic outlook and delinquency roll-rate trends in HSBC Finance Corp, and a smaller charge in Mexico. In Europe, the increase in general provisions required from the growth in lending balances was offset by the impact of the improvement in |
| | both historical loss experience and credit conditions in general. The substantial general provision release in South America in 2003 reflecting improved collections and an improvement in the general quality of the loan book in Argentina was not repeated in 2004. |
| | |
| Year ended 31 December 2003 compared with year ended 31 December 2002 |
| | |
| The increase in the level of new specific provisions was principally driven by: |
| | |
| • | New provisions in North America, which were US$4,563 million higher than in 2002, essentially reflected the acquisition of HSBC Finance Corporation, which reported US$4,580 million of new provisions. The majority of HSBC Finance’s customer loans are in the consumer finance sector and are geographically well-spread across the United States. During the period since its acquisition, HSBC Finance Corporation’s new provisions reflected the impact of the weak economy, including higher personal bankruptcy filings and a higher level of amounts becoming past due. In the latter part of 2003, there were signs of an improvement in credit quality and delinquency levels stabilised. At 31 December 2003, HSBC Finance’s two-month-and-over consumer contractual delinquency ratio was 5.8 per cent. A charge of US$48 million from HSBC Mexico arose from consumer lending and credit card portfolios, which are provisioned on a portfolio basis. In Canada, new provisions in 2003 were US$66 million lower than in 2002, when significant new provisions for a small number of commercial facilities were necessary, most notably in the telecommunications sector. |
| | |
| • | In Europe, new provisions were US$522 million higher than in 2002 of which US$193 million related to HSBC Finance Corporation’s UK consumer finance business, which is provisioned on a portfolio basis. Elsewhere in the UK, the increase in new provisions in personal lending reflected the growth in loan portfolios. In the corporate and commercial portfolio, new provisions were raised to cover a number of accounts in the energy and manufacturing sectors. In France, there were higher provisions, principally due to the deterioration of a borrower in the engineering sector. |
| | |
| • | New provisions in Hong Kong were US$127 million higher than in 2002. Higher levels of new provisions were required in the |
158
Back to Contents
| | electronics sector against a small number of customers in niche markets which suffered from a combination of technological developments and excess market capacity. New specific provisions for personal lending (including credit cards) reduced in 2003, reflecting a reduction in bankruptcy filings and improving economic conditions. This more than offsets increased charges in respect of residential mortgages, which reflected the fall in the first half of 2003 in the value of residential property. The second half of 2003 saw property prices stabilise, delinquencies fall and the percentage of the mortgage book with negative equity reduce. |
| | |
| • | New specific provisions in the rest of Asia-Pacific were broadly in line with 2002, reflecting the relatively stable and improving economic environment across much of the region during 2003. |
| | |
| • | In South America, new provisions decreased by US$125 million, mainly reflecting an improvement in the economic conditions in Argentina. This was partly offset by increased new provisions in Brazil’s personal lending as a difficult economic environment led to higher levels of delinquencies. There were also higher new specific provisions for corporate customers in the commodities and food sectors as a result of business failure and, in one case, fraud. |
In aggregate, releases and recoveries increased by US$557 million compared with 2002. HSBC Finance Corp. contributed US$311 million of the increase due to collections and sales of written-off accounts. In Europe, excluding HSBC Finance Corporation’s UK consumer finance business, releases and recoveries were US$139 million higher, mainly the result of a recovery from an exposure in the transport sector and the upgrading of corporate exposures in the telecommunications and retail sectors.
There was a net release of general provisions of US$121 million in 2003 compared with a release of US$351 million in 2002. There were general provision charges of US$113 million in HSBC Finance and US$78 million in HSBC Mexico, reflecting growth in lending. In Europe, excluding HSBC Finance Corporation’s UK consumer finance business, a net release of general provision of US$131 million reflected an improved economic outlook and successful restructuring and refinancing activity in industry sectors which had been causing concern. In Argentina, a net release of US$122 million reflected success in collections and the improved environment and hence quality of the remaining loan book. At 31 December 2003, specific and general provisions together covered about 47 per cent of non-government loans (net of suspended interest) in Argentina.
159
Back to Contents
H S B C H O L D I N G S P L C
Financial Review(continued)
Provisions for bad and doubtful debts as a percentage of average gross loans and advances to customers
| | | | | | Rest of | | North | | South | | | |
| | Europe | | Hong Kong | | Asia-Pacific | | America | | America | | Total | |
| | % | | % | | % | | % | | % | | % | |
| Year ended 31 December 2004 | | | | | | | | | | | | |
| | | | | | | | | | | | | |
| New provisions | 0.82 | | 0.32 | | 0.77 | | 2.59 | | 6.49 | | 1.46 | |
| Releases and recoveries | (0.35 | ) | (0.32 | ) | (0.50 | ) | (0.30 | ) | (2.09 | ) | (0.36 | ) |
| |
| |
| |
| |
| |
| |
| |
| Net charge for specific provisions | 0.47 | | – | | 0.27 | | 2.29 | | 4.40 | | 1.10 | |
| | | | | | | | | | | | | |
| Total provisions charged | 0.41 | | (0.29 | ) | 0.19 | | 2.28 | | 4.40 | | 1.04 | |
| Amount written off net of recoveries | 0.48 | | 0.38 | | 0.64 | | 2.57 | | 5.16 | | 1.30 | |
| |
| |
| |
| |
| |
| |
| |
| | | | | | | | | | | | | |
| Year ended 31 December 2003 | | | | | | | | | | | | |
| | | | | | | | | | | | | |
| New provisions | 0.76 | | 0.89 | | 0.96 | | 2.91 | | 6.09 | | 1.60 | |
| Releases and recoveries | (0.25 | ) | (0.30 | ) | (0.80 | ) | (0.25 | ) | (1.88 | ) | (0.32 | ) |
| |
| |
| |
| |
| |
| |
| |
| Net charge for specific provisions | 0.51 | | 0.59 | | 0.16 | | 2.66 | | 4.21 | | 1.28 | |
| Total provisions charged | 0.45 | | 0.54 | | 0.20 | | 2.74 | | 1.34 | | 1.25 | |
| Amount written off net of recoveries | 0.39 | | 0.73 | | 0.86 | | 2.93 | | 3.94 | | 1.40 | |
| |
| |
| |
| |
| |
| |
| |
| | | | | | | | | | | | | |
| Year ended 31 December 2002 | | | | | | | | | | | | |
| | | | | | | | | | | | | |
| New provisions | 0.62 | | 0.75 | | 1.13 | | 0.51 | | 9.97 | | 0.78 | |
| Releases and recoveries | (0.21 | ) | (0.26 | ) | (0.90 | ) | (0.15 | ) | (1.48 | ) | (0.29 | ) |
| |
| |
| |
| |
| |
| |
| |
| Net charge for specific provisions | 0.41 | | 0.49 | | 0.23 | | 0.36 | | 8.49 | | 0.49 | |
| Total provisions charged | 0.37 | | 0.35 | | 0.25 | | 0.38 | | 3.01 | | 0.38 | |
| | | | | | | | | | | | | |
| Amount written off net of recoveries | 0.25 | | 0.72 | | 1.55 | | 0.41 | | 3.91 | | 0.56 | |
| |
| |
| |
| |
| |
| |
| |
Areas of special interest
Group advances to personal customers
The charge for bad and doubtful debts in 2004 was dominated by the charge relating to the personal sector, this figure representing more than 100 per cent of the Group total after taking account of the Group’s commercial lending activities. Within this total, losses on residential mortgages remained modest.
Lending to personal customers has increased substantially in recent years as a result of both organic growth and acquisitions, most notably HSBC Finance Corporation in March 2003. At 31 December 2004, HSBC’s lending to the personal sector amounted to US$388 billion, or 57 per cent of total gross advances to customers, compared with US$306 billion at 31 December 2003. The main attributes of this portfolio and the economic influences affecting it are outlined below.
Secured residential mortgages accounted for US$228 billion or 59 per cent of total lending to the personal sector compared with US$172 billion, or 56 per cent, at 31 December 2003. The main areas of growth in 2004 were the US and the UK, which together accounted for US$54 billion of the increase.
The unsecured element of the portfolio consisted of credit and charge card advances, personal loans, car finance facilities and other varieties of instalment finance. At 31 December 2004, the combined portfolios totalled US$160 billion, or 41 per cent of total lending to the personal sector, compared with US$134 billion, or 44 per cent, at 31 December 2003. Growth in these portfolios reflected continued growth in consumer spending within the main economies in which HSBC operates.
Geographically, total lending to personal customers was dominated by the diverse and mature portfolios in the US (US$173 billion), the UK (US$107 billion), and Hong Kong (US$38 billion). Collectively, these books accounted for 82 per cent of total lending to the personal sector, unchanged from the position at 31 December 2003.
Account management within HSBC’s personal lending portfolios in both Personal Financial Services and Consumer Finance is supported by sophisticated statistical techniques, which are enhanced by the availability of credit reference data in key local markets. The expansion of an increasingly analytical approach to the management of these portfolios across the Group remains an ongoing objective.
160
Back to Contents
In view of the high levels of personal indebtedness in many of the world’s leading economies, guidelines for the restructuring of customer facilities in the event of financial difficulty have been reinforced.
In the US, the strength of the housing market continued unabated, driven mainly by affordability. Low interest rates, lower transaction costs and increased availability of credit all fuelled the rise in demand. However, recent rises in interest rates are likely to affect growth adversely and add pressure to some borrowers, particularly in certain overpriced locations. The portfolios, however, remain geographically diverse and are secured largely by senior lien positions.
Although increased mortgage borrowing has contributed to the record level of consumer debt, levels have largely stabilised and are expected to decline gradually, as incomes rise sufficiently to pay down debt, notwithstanding higher interest rates. Against this background, delinquency rates fell across the majority of portfolios during 2004 and trends in lending quality showed an improvement.
Personal lending in the UK also continued to grow strongly, particularly in the mortgage market. This secured portfolio, representing 55 per cent of total lending to personal customers in the UK, continued to suffer negligible delinquency and losses. The unsecured portfolio also continued to expand both through organic growth and with the acquisition of Marks and Spencer Financial Services, which added US$5.3 billion to the portfolio in November 2004. Underwriting criteria were regularly reviewed to ensure that they remained appropriate in prevailing market conditions, which have seen a steady rise in personal bankruptcies and delinquencies over the course of the year.
With consumer spending rising in Hong Kong and the levels of bankruptcies and unemployment both falling, the improvement in the personal portfolios, which first became evident during the second half of 2003, continued throughout 2004. With ongoing property price increases a feature of 2004, the most notable trend was the continued reduction in the level of negative equity on mortgage balances, which is now at modest levels.
Across the other geographical regions the position remained relatively stable, although HSBC continued to monitor carefully those portfolios that have the greatest potential for future economic stress. Delinquency and loss trends differed across jurisdictions, reflecting these varied conditions.
Risk elements in the loan portfolio
The following disclosure of credit risk elements reflects US accounting practice and classifications:
| • | loans accounted for on a non-accrual basis; |
| | |
| • | accruing loans contractually past due 90 days or more as to interest or principal; and |
| | |
| • | troubled debt restructurings not included in the above. |
In accordance with UK accounting practice, a number of operating companies suspend interest rather than ceasing to accrue. This additional category is also reported below, as are assets acquired in exchange for advances.
Non-performing loans and advances1
| | At 31 December | |
| |
| |
| | 2004 | | 2003 | |
| | US$m | | US$m | |
| | | | | |
| Banks | 25 | | 24 | |
| |
| |
| |
| Customers | | | | |
| – HSBC Finance | 4,201 | | 4,706 | |
| – Other HSBC | 9,058 | | 10,344 | |
| |
| |
| |
| | 13,259 | | 15,050 | |
| |
| |
| |
| Total non-performing loans | | | | |
| and advances | 13,284 | | 15,074 | |
| |
| |
| |
| Total provisions cover as a | | | | |
| percentage of non-performing | | | | |
| loans and advances | 95.5 | % | 91.0 | % |
| | | | | |
| 1 | Net of suspended interest. |
Non-performing customer loans1 and related specific provisions outstanding by geographical segment
| | 2004 | | 2003 | |
| |
| |
| |
| | Non- | | | | Non- | | | |
| | performing | | Specific | | performing | | Specific | |
| | loans | | provisions | | loans | | provisions | |
| | US$m | | US$m | | US$m | | US$m | |
| | | | | | | | | |
| Europe | 6,065 | | 4,036 | | 5,701 | | 3,554 | |
| Hong Kong | 773 | | 331 | | 1,671 | | 629 | |
| Rest of Asia-Pacific | 1,180 | | 791 | | 1,538 | | 981 | |
| NorthAmerica | 4,583 | | 4,420 | | 5,444 | | 5,184 | |
| South America | 658 | | 522 | | 696 | | 530 | |
| |
| |
| |
| |
| |
| | 13,259 | | 10,100 | | 15,050 | | 10,878 | |
| |
| |
| |
| |
| |
| | | | | | | | | |
| 1 | Net of suspended interest. |
Total non-performing loans to customers decreased by US$1,791 million during the year. At 31 December 2004, non-performing loans represented 1.9 per cent of total lending compared
161
Back to Contents
H S B C H O L D I N G S P L C
FinancialReview(continued)
with 2.8 per cent at 31 December 2003. At constant exchange rates, non-performing loans decreased by US$2.3 billion, or 15 per cent. Improved economic conditions in most geographical regions were the main driver for the fall in non-performing loans.
Across Europe, at constant exchange rates, non-performing loans declined marginally with underlying credit quality in the UK and France remaining stable. In the UK, releases and recoveries in the corporate sector, primarily as a result of the restructuring of a number of non-performing loans, were partly offset by a rise in delinquencies across most unsecured personal loan products, in line with the broader target markets now being served.
In Hong Kong, non-performing loans decreased by US$0.9 billion, or 54 per cent, during 2004 due to the improved economic climate and rising real estate prices. These factors enabled certain corporate customers to increase repayments through the disposal of assets or improved debt servicing.
In the rest of Asia-Pacific, non-performing loans fell by US$0.4 billion, or 23 per cent, during the year, as a general improvement in the economic environment across the region was reflected in a rise in recoveries and releases of provisions.
The level of non-performing loans in North America decreased by US$0.9 billion, in line with the continued improvement in economic conditions; HSBC Finance’s business particularly benefited from a continued improvement in delinquencies and default trends. In Mexico, there were further write-offs of US$285 million during 2004 in the commercial and consumer loan books, as management continued to reduce the acquired workout portfolio.
South America experienced a modest reduction in non-performing loans in 2004 arising mainly in Argentina as credit quality improved in line with a general upturn in the local economy.
Troubled debt restructurings
US GAAP requires separate disclosure of any loans where terms have been modified to grant
concessions other than warranted by market conditions due to problems with the borrower. These are classified as ‘troubled debt restructurings’ and are distinct from the normal restructuring activities described above. Disclosure of troubled debt restructurings may be discontinued after the first year if the debt is performing in accordance with the new terms.
Troubled debt restructurings decreased significantly in Europe where a number of corporate exposures were regularised, in Hong Kong where balances were repaid on certain restructured borrowings, and in South America.
Accruing loans past due 90 days or more
Accruing loans past due 90 days decreased as the overall credit environment improved, particularly in Hong Kong and the US. HSBC Finance’s business benefited from a continued improvement in delinquency and default trends as the US economy recovered. In common with other card issuers, including other parts of HSBC, HSBC Finance continues to accrue interest on credit cards past 90 days until charged off at 180 days past due. Appropriate provisions are raised against the proportion judged to be irrecoverable.
Potential problem loans
Credit risk elements also cover potential problem loans. These are loans where information about borrowers’ possible credit problems causes management serious doubts about the borrowers’ ability to comply with the loan repayment terms. There are no potential problem loans other than those identified in the table of risk elements set out below.
Risk elements
The following table provides an analysis of risk elements in the loan portfolios at 31 December for the past five years:
162
Back to Contents
| | At 31 December | |
| |
| |
| | 2004 | | 2003 | | 2002 | | 2001 | | 2000 | |
| | US$m | | US$m | | US$m | | US$m | | US$m | |
| Loans accounted for on a non-accrual basis | | | | | | | | | | |
| Europe | 3,498 | | 3,138 | | 2,393 | | 2,052 | | 1,985 | |
| HSBC Finance | 419 | | 326 | | – | | – | | – | |
| Other | 3,079 | | 2,812 | | 2,393 | | 2,052 | | 1,985 | |
| Hong Kong | 116 | | 166 | | 247 | | 213 | | 236 | |
| Rest of Asia-Pacific | 156 | | 168 | | 294 | | 195 | | 429 | |
| North America | 3,856 | | 4,618 | | 1,624 | | 593 | | 627 | |
| HSBC Finance | 3,138 | | 3,683 | | – | | – | | – | |
| Other | 718 | | 935 | | 1,624 | | 593 | | 627 | |
| South America | 589 | | 601 | | 293 | | 429 | | 550 | |
| |
| |
| |
| |
| |
| |
| Total | 8,215 | | 8,691 | | 4,851 | | 3,482 | | 3,827 | |
| |
| |
| |
| |
| |
| |
| Loans on which interest has been | | | | | | | | | | |
| accrued but suspended | | | | | | | | | | |
| Europe | 2,555 | | 2,542 | | 2,086 | | 1,553 | | 1,389 | |
| Hong Kong | 580 | | 1,504 | | 1,460 | | 1,795 | | 2,259 | |
| Rest of Asia-Pacific | 1,016 | | 1,351 | | 1,714 | | 2,497 | | 2,627 | |
| North America | 19 | | 33 | | 48 | | 67 | | 39 | |
| South America | 68 | | 95 | | 183 | | 115 | | 160 | |
| |
| |
| |
| |
| |
| |
| Total | 4,238 | | 5,525 | | 5,491 | | 6,027 | | 6,474 | |
| |
| |
| |
| |
| |
| |
| Assets acquired in exchange for advances | | | | | | | | | | |
| Europe | 27 | | 32 | | 26 | | 84 | | 25 | |
| Hong Kong | 75 | | 2 | | 17 | | 19 | | 26 | |
| Rest of Asia-Pacific | 21 | | 30 | | 54 | | 32 | | 24 | |
| North America | 708 | | 794 | | 101 | | 14 | | 19 | |
| HSBC Finance | 644 | | 697 | | – | | – | | – | |
| Other | 64 | | 97 | | 101 | | 14 | | 19 | |
| Total | 831 | | 858 | | 198 | | 149 | | 94 | |
| |
| |
| |
| |
| |
| |
| Total non-performing loans | 13,284 | | 15,074 | | 10,540 | | 9,658 | | 10,395 | |
| |
| |
| |
| |
| |
| |
| Troubled debt restructurings | | | | | | | | | | |
| Europe | 34 | | 159 | | 41 | | – | | – | |
| HSBC Finance | – | | – | | – | | – | | – | |
| Other | 34 | | 159 | | 41 | | – | | – | |
| Hong Kong | 436 | | 571 | | 396 | | 381 | | 395 | |
| Rest of Asia-Pacific | 56 | | 68 | | 89 | | 131 | | 231 | |
| North America | 144 | | 210 | | 4 | | 3 | | 7 | |
| HSBC Finance | 2 | | 2 | | – | | – | | – | |
| Other | 142 | | 208 | | 4 | | 3 | | 7 | |
| South America | 693 | | 837 | | 669 | | 144 | | 142 | |
| |
| |
| |
| |
| |
| |
| Total | 1,363 | | 1,845 | | 1,199 | | 659 | | 775 | |
| |
| |
| |
| |
| |
| |
| Accruing loans contractually past due 90 | | | | | | | | | | |
| days or more as to principal or interest | | | | | | | | | | |
| Europe | 68 | | 34 | | 16 | | 15 | | 11 | |
| Hong Kong | 67 | | 205 | | 193 | | 98 | | 76 | |
| Rest of Asia-Pacific | 56 | | 45 | | 33 | | 38 | | 66 | |
| North America | 871 | | 1,252 | | 42 | | 52 | | 64 | |
| HSBC Finance | 607 | | 1,215 | | – | | – | | – | |
| Other | 264 | | 37 | | 42 | | 52 | | 64 | |
| South America | – | | 2 | | 7 | | 47 | | 82 | |
| |
| |
| |
| |
| |
| |
| Total | 1,062 | | 1,538 | | 291 | | 250 | | 299 | |
| |
| |
| |
| |
| |
| |
| Total risk elements | | | | | | | | | | |
| Europe | 6,182 | | 5,905 | | 4,562 | | 3,704 | | 3,410 | |
| HSBC Finance | 419 | | 326 | | – | | – | | – | |
| Other | 5,763 | | 5,579 | | 4,562 | | 3,704 | | 3,410 | |
| Hong Kong | 1,274 | | 2,448 | | 2,313 | | 2,506 | | 2,992 | |
| Rest of Asia-Pacific | 1,305 | | 1,662 | | 2,184 | | 2,893 | | 3,377 | |
| North America | 5,598 | | 6,907 | | 1,819 | | 729 | | 756 | |
| HSBC Finance | 4,391 | | 5,597 | | – | | – | | – | |
| Other | 1,207 | | 1,310 | | 1,819 | | 729 | | 756 | |
| South America | 1,350 | | 1,535 | | 1,152 | | 735 | | 934 | |
| Total | 15,709 | | 18,457 | | 12,030 | | 10,567 | | 11,469 | |
| |
| |
| |
| |
| |
| |
| Provisions for bad and doubtful debts as a | | | | | | | | | | |
| percentage of total risk elements | 80.8% | | 74.3% | | 76.0% | | 77.4% | | 71.5% | |
| |
| |
| |
| |
| |
| |
163
Back to Contents
H S B C H O L D I N G S P L C
FinancialReview(continued)
Interest foregone on non-performing lendings
Interest income that would have been recognised under the original terms of the non-accrual, suspended interest and restructured loans amounted to approximately US$300 million in 2004 compared with US$380 million in 2003 and US$406 million in 2002. Interest income of approximately US$184 million from such loans was recorded in 2004, compared with US$230 million in 2003 and US$258 million in 2002.
Country distribution of outstandings and cross-border exposures
HSBC controls the risks associated with cross-border lending, essentially the risk of foreign currency required for payments not being available to local residents, through a central process of internal country limits which are determined by taking into account both economic and political risks. Exposure to individual countries and cross-border exposure in aggregate is kept under continuous review.
The following tables analyse the aggregate of in-country foreign currency and cross-border outstandings by type of borrower to countries which individually represent in excess of 1 per cent of
HSBC’s total assets. Classification is based upon the country of residence of the borrower but recognises the transfer of country risk in respect of third party guarantees, eligible collateral held or residence of the head office where the borrower is a branch. In accordance with the Bank of England Country Exposure Report (Form CE) guidelines, outstandings comprise loans and advances (excluding settlement accounts), amounts receivable under finance leases, acceptances, commercial bills, certificates of deposit and debt and equity securities (net of short positions), and exclude accrued interest and intra-HSBC exposures. Comparative figures for 2003 and 2002 were calculated under the requirements of the Bank of England’s Form C1, which was replaced by Form CE from 31 December 2004 reporting. The requirements of Form CE differ from those of Form C1 in a number of ways, none of which materially affects the exposures reported below. For 200 3, outstandings to counterparties in the UK were collected on a comparable basis to that required for Form C1 for the first time. For 2002, the UK outstandings, which are not recorded on Form C1 because the UK is HSBC’s country of domicile, have not been collected or disclosed.
| | | | | | | | | |
| | | | Government | | | | | |
| | | | and official | | | | | |
| | Banks | | institutions | | Other | | Total | |
| | US$bn | | US$bn | | US$bn | | US$bn | |
| At 31 December 2004 | | | | | | | | |
| United Kingdom | 19.7 | | 3.8 | | 24.5 | | 48.0 | |
| United States | 9.2 | | 13.3 | | 14.0 | | 36.5 | |
| Germany | 17.8 | | 10.4 | | 4.0 | | 32.2 | |
| France | 11.1 | | 3.7 | | 4.6 | | 19.4 | |
| Italy | 5.7 | | 9.7 | | 2.1 | | 17.5 | |
| The Netherlands | 9.1 | | 2.2 | | 4.2 | | 15.5 | |
| Hong Kong | 1.6 | | 1.1 | | 10.3 | | 13.0 | |
| | | | | | | | | |
| At 31 December 2003 | | | | | | | | |
| United Kingdom | 14.2 | | 3.1 | | 20.4 | | 37.7 | |
| Germany | 16.0 | | 8.0 | | 3.7 | | 27.7 | |
| United States | 5.5 | | 8.4 | | 12.3 | | 26.2 | |
| France | 9.5 | | 2.3 | | 5.5 | | 17.3 | |
| The Netherlands | 9.0 | | 0.6 | | 4.6 | | 14.2 | |
| Hong Kong | 1.1 | | 0.7 | | 10.0 | | 11.8 | |
| Canada | 6.0 | | 3.2 | | 1.8 | | 11.0 | |
| Italy | 4.4 | | 5.2 | | 0.8 | | 10.4 | |
| | | | | | | | | |
| At 31 December 2002 | | | | | | | | |
| United States | 5.6 | | 9.6 | | 9.7 | | 24.9 | |
| Germany | 16.9 | | 2.4 | | 2.7 | | 22.0 | |
| France | 5.8 | | 1.7 | | 5.0 | | 12.5 | |
| The Netherlands | 7.5 | | 0.4 | | 4.0 | | 11.9 | |
| Hong Kong | 0.9 | | 0.7 | | 9.1 | | 10.7 | |
| Canada | 4.8 | | 2.9 | | 2.4 | | 10.1 | |
| Japan | 4.0 | | 4.1 | | 1.0 | | 9.1 | |
| Italy | 4.7 | | 2.2 | | 1.1 | | 8.0 | |
| Australia | 5.8 | | 0.5 | | 1.6 | | 7.9 | |
164
Back to Contents
At 31 December 2004, HSBC had in-country foreign currency and cross-border outstandings to counterparties in Australia and Canada of between 0.75 per cent asnd 1 per cent of total assets. The aggregate in-country foreign currency and cross-border outstandings were: Australia: US$12.7 billion; Canada: US$11.8 billion.
At 31 December 2003, HSBC had in-country foreign currency and cross-border outstandings to counterparties in Australia and Japan of between
0.75 per cent and 1 per cent of total assets. The aggregate in-country foreign currency and cross-border outstandings were: Australia: US$9.1 billion; Japan: US$7.9 billion.
At 31 December 2002, HSBC had in-country foreign currency and cross-border outstandings to counterparties in Belgium of between 0.75 per cent and 1 per cent of total assets. The aggregate in-country foreign currency and cross-border outstandings were US$5.9 billion.
165
Back to Contents
H S B C H O L D I N G S P L C
FinancialReview(continued)
Liquidity and funding management
HSBC maintains a diversified and stable funding base of core retail and corporate customer deposits as well as portfolios of highly liquid assets. The objective of HSBC’s liquidity and funding management is to ensure that all foreseeable funding commitments and deposit withdrawals can be met when due.
The management of liquidity and funding is primarily carried out locally in the operating companies of HSBC in accordance with practice and limits set by the Group Management Board. These limits vary by local financial unit to take account of the depth and liquidity of the market in which the entity operates. It is HSBC’s general policy that each banking entity should be self-sufficient with regard to funding its own operations. Exceptions are permitted to facilitate the efficient funding of certain short-term treasury requirements and start-up operations or branches which do not have access to local deposit markets, all of which are funded under strict internal and regulatory guidelines and limits from HSBC’s largest banking operations. These internal and regulatory limits and guidelines serve to place formal limitations on the transfer of resources between HSBC entities and are necessary to reflect the bro ad range of currencies, markets and time zones within which HSBC operates.
HSBC requires operating entities to maintain a strong liquidity position and to manage the liquidity profile of their assets, liabilities and commitments so that cash flows are appropriately balanced and all funding obligations are met when due.
The Group’s liquidity and funding management process includes:
| • | projecting cash flows by major currency and considering the level of liquid assets necessary in relation thereto; |
| | |
| • | monitoring balance sheet liquidity ratios against internal and regulatory requirements; |
| | |
| • | maintaining a diverse range of funding sources with adequate back-up facilities; |
| | |
| • | managing the concentration and profile of debt maturities; |
| | |
| • | maintaining debt financing plans; |
| | |
| • | monitoring depositor concentration in order to avoid undue reliance on large individual depositors and ensure a satisfactory overall funding mix; and |
| | |
| • | maintaining liquidity and funding contingency plans. These plans identify early indicators of |
| | stress conditions and describe actions to be taken in the event of difficulties arising from systemic or other crises while minimising adverse long-term implications for the business. |
Primary sources of funding
Current accounts and savings deposits payable on demand or at short notice form a significant part of HSBC’s funding. HSBC places considerable importance on the stability of these deposits. Stability depends upon maintaining depositor confidence in HSBC’s capital strength and liquidity, and on competitive and transparent deposit-pricing strategies. HSBC actively supports this confidence by consistently reinforcing HSBC’s brand values of trust and solidity across the Group’s geographically diverse retail banking network.
HSBC accesses professional markets in order to provide funding for non-banking subsidiaries that do not accept deposits, to maintain a presence in local money markets and to optimise the funding of asset maturities not naturally matched by core deposit funding. In aggregate, HSBC’s banking entities are liquidity providers to the inter-bank market, placing significantly more funds with other banks than they borrow.
The main operating subsidiary that does not accept deposits is HSBC Finance Corporation, which funds itself principally through taking term funding in the professional markets and through the securitisation of assets. At 31 December 2004, US$112 billion of HSBC Finance Corporation’s liabilities were drawn from professional markets, utilising a range of products, maturities and currencies to avoid undue reliance on any particular funding source. Since becoming a member of the HSBC Group, HSBC Finance Corporation’s access to funding has improved in respect of both the breadth of available sources and the pricing thereof.
Of total liabilities of US$1,277 billion at 31 December 2004, funding from customers amounted to US$694 billion, of which US$671 billion was contractually repayable within one year. However, although the contractual repayments of many customer accounts are on demand or at short notice, in practice short-term deposit balances remain stable as inflows and outflows broadly match.
Other liabilities, including deposits by banks and securities in issue, are set forth in the table on page 167.
Assets available to meet these liabilities, and to cover outstanding commitments to lend
166
Back to Contents
(US$568 billion), included cash, central bank balances, items in the course of collection and treasury and other bills (US$47 billion); loans to banks (US$143 billion, including US$138 billion repayable within one year); and loans to customers (US$670 billion, including US$271 billion repayable within one year). In the normal course of business, a proportion of customer loans contractually repayable within one year will be extended. In addition, HSBC held debt securities marketable at a value of US$242 billion. Of these assets, some US$57 billion of debt securities and treasury and other bills have been pledged to secure liabilities.
HSBC would meet unexpected net cash outflows by selling securities and accessing additional funding sources such as interbank markets or securitisations.
Although not utilised in the management of HSBC’s liquidity, the consolidated figures shown in the following table provide a useful insight into the structure of the Group’s overall funding position.
Debt securities in issue, customer accounts and deposits by banks
| | At 31 December | |
| |
| |
| | 2004 | | 2003 | |
| | US$m | | US$m | |
| Debt securities funding due in: | | | | |
| – less than one year | 99,441 | | 63,810 | |
| – one year or over | 109,152 | | 89,752 | |
| | | | | |
| Deposits by banks repayable: | | | | |
| – in less than one year | 78,087 | | 64,678 | |
| – one year or over | 5,452 | | 5,748 | |
| | | | | |
| Customer accounts repayable: | | | | |
| – on demand | 397,151 | | 323,250 | |
| – with agreed maturity dates | | | | |
| but less than one year | 273,455 | | 234,778 | |
| – with agreed maturity dates | | | | |
| one year or over | 23,145 | | 15,102 | |
| |
| |
| |
| Total | 985,883 | | 797,118 | |
| |
| |
| |
| | | | | |
| | % | | % | |
| Debt securities | 21.2 | | 19.3 | |
| Deposits by banks | 8.4 | | 8.8 | |
| Customer accounts | 70.4 | | 71.9 | |
| |
| |
| |
| Total | 100.0 | | 100.0 | |
| |
| |
| |
HSBC Holdings
HSBC Holdings’ primary sources of cash are interest and capital receipts from its subsidiaries, which it deploys in short-term bank deposits or liquidity funds. HSBC Holdings’ primary uses of cash are investments in subsidiaries, interest payments to debt holders and dividend payments to shareholders. On an ongoing basis, HSBC Holdings replenishes its
liquid resources through the receipt of interest on, and repayment of, intra-group loans, from dividends, and from interest earned on its own liquid funds. The ability of its subsidiaries to pay dividends or advance monies to HSBC Holdings depends, among other things, on their respective regulatory capital requirements, statutory reserves, and financial and operating performance.
HSBC actively manages the cash flows from its subsidiaries to optimise the amount of cash held at the holding company level, and expects to continue doing so in the future. The wide range of HSBC’s activities means that HSBC Holdings is not dependent on a single source of profits to fund its dividends. Together with its accumulated liquid assets, HSBC Holdings believes that planned dividends and interest from subsidiaries will enable it to meet anticipated cash obligations. Also, in normal circumstances, HSBC Holdings has full access to capital markets on normal terms.
At 31 December 2004, the short-term liabilities of HSBC Holdings totalled US$5.3 billion, including US$1.2 billion in respect of the proposed third interim dividend for 2004 and US$3.0 billion in respect of the proposed fourth interim dividend for 2004. In practice, the full amount of the proposed dividend may not be paid out as shareholders can elect to receive their dividend entitlement in scrip rather than in cash. Short-term assets of US$12.4 billion, consisting mainly of cash at bank and money market deposits of US$7.3 billion and other amounts (including dividends) due from HSBC undertakings of US$5.1 billion, exceeded short-term liabilities.
Market risk management
The objective of HSBC’s market risk management is to manage and control market risk exposures in order to optimise return on risk while maintaining a market profile consistent with the Group’s status as a premier provider of financial products and services.
Market risk is the risk that movements in market rates, including foreign exchange rates, interest rates, credit spreads and equity and commodity prices will reduce HSBC’s income or the value of its portfolios.
HSBC separates exposures to market risk into either trading or non-trading portfolios. Trading portfolios include those positions arising from market-making and proprietary position-taking. Non-trading portfolios primarily arise from the management of the commercial banking assets and liabilities.
The management of market risk is principally
167
Back to Contents
H S B C H O L D I N G S P L C
Financial Review(continued)
undertaken in Global Markets using risk limits approved by the Group Management Board. Limits are set for each portfolio, product and risk type, with market liquidity being a principal factor in determining the level of limits set. Traded Markets Development and Risk, an independent unit within Corporate, Investment Banking and Markets, develops the Group’s market risk management policies and measurement techniques. Each major operating entity has an independent Market Risk Control function which is responsible for measuring market risk exposures in accordance with the policies defined by Traded Markets Development and Risk, and monitoring and reporting these exposures against the prescribed limits on a daily basis.
Each operating entity is required to assess the market risks which arise on each product in its business and to transfer these risks to either its local Global Markets unit for management, or to separate books managed under the auspices of the local Asset and Liability Management Committee (‘ALCO’). The aim is to ensure that all market risks are consolidated within operations which have the necessary skills, tools, management and governance to professionally manage such risks.
Fair value and price verification control
Where certain financial instruments are carried on the Group’s balance sheet at their mark-to-market values, the mark-to-market valuation and the related price verification processes are subject to careful governance across the Group. Financial instruments which are accounted for on a fair value basis include assets held in the trading portfolio, obligations related to securities sold short and derivative financial instruments (excluding non-trading derivatives accounted for on an accruals basis).
The determination of mark-to-market values is therefore a significant element in the reporting of the Group’s Global Markets activities.
The responsibility for the determination of accounting policies and procedures governing valuation and validation ultimately rests with the Group Finance and the Corporate, Investment Banking and Markets Finance functions, which report to the Group Finance Director. All significant valuation policies, and any changes thereto, must be approved by senior finance management. HSBC’s governance of financial reporting requires that Financial Control departments across the Group are independent of the risk-taking businesses, with the Finance functions having ultimate responsibility for the determination of fair values included in the
financial statements, and for ensuring that the Group’s policies and relevant accounting standards are adhered to. Both senior management and the Group Audit Committee assess the resourcing and expertise of Finance functions within the Group on a regular basis to ensure that the Group’s financial control and price verification processes are properly staffed to support the required control infrastructure.
Trading
Market risk in trading portfolios is monitored and controlled at both portfolio and position levels using a complementary set of techniques, such as value at risk and present value of a basis point (‘PVBP’), together with stress and sensitivity testing and concentration limits. These techniques quantify the impact on capital of defined market movements.
Other controls include restricting individual operations to trading within a list of permissible instruments authorised for each site by Traded Markets Development and Risk, and enforcing rigorous new product approval procedures. In particular, trading in the more complex derivative products is concentrated in offices with appropriate levels of product expertise and robust control systems.
Trading value at risk (‘VAR’)
One of the principal tools used by HSBC to monitor and limit market risk exposure in its trading portfolios is VAR. VAR is a technique that estimates the potential losses that could occur on risk positions as a result of movements in market rates and prices over a specified time horizon and to a given level of confidence (for HSBC, 99 per cent). HSBC calculates VAR daily. During the year, HSBC refined its basis of calculating VAR from one predominantly based on variance / co-variance to one predominantly based on historical simulation. This latter calculation was introduced because it better captures the non-linear characteristics of certain market risk positions. Historical simulation uses scenarios derived from historical market rates, and takes account of the relationships between different markets and rates, for example, interest rates and foreign exchange rates. Movements in market prices are calculated by reference to market data from the last two years.
Although a valuable guide to risk, VAR should always be viewed in the context of its limitations. For example:
| • | the use of historical data as a proxy for estimating future events may not encompass all |
168
Back to Contents
| | potential events, particularly those which are extreme in nature; |
| | |
| • | the use of a 10-day holding period assumes that all positions can be liquidated or hedged in 10 days. This may not fully reflect the market risk arising at times of severe illiquidity, when a 10-day holding period may be insufficient to liquidate or hedge all positions fully; |
| | |
| • | the use of a 99 per cent confidence level, by definition, does not take into account losses that might occur beyond this level of confidence; |
| | |
| • | VAR is calculated on the basis of exposures outstanding at the close of business and therefore does not necessarily reflect intra-day exposures. |
HSBC recognises these limitations by augmenting its VAR limits with other position and sensitivity limit structures. Additionally, HSBC applies a wide range of stress testing, both on individual portfolios and on the Group’s consolidated positions. HSBC’s stress-testing regime provides senior management with an assessment of the impact of identified extreme events on the market risk exposures of HSBC.
Trading VAR for HSBC is summarised in Note 39(a) in the ‘Notes on the Financial Statements’ on page 308.
The daily revenue earned from market risk-related treasury activities includes accrual book net interest income and funding related to dealing positions. The histogram below illustrates the frequency of daily revenue arising from such market risk-related activities.
The average daily revenue earned from market risk-related treasury activities in 2004 was US$18.3 million, compared with US$17.1 million for 2003. The standard deviation of these daily revenues was US$8.0 million compared with US$12.5 million for 2003. The standard deviation measures the variation of daily revenues about the mean value of those revenues.
An analysis of the frequency distribution of daily revenue shows that there were two days with negative revenues during 2004 compared with 12 days in 2003. The most frequent result was a daily revenue of between US$16 million and US$20 million with 70 occurrences.
Daily distribution of market risk revenues in 2004
Number of days
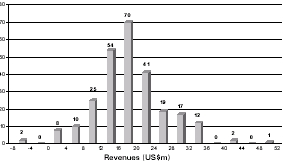
 Profit and loss frequency
Daily distribution of market risk revenues in 2003
Number of days

Profit and loss frequency
Non-trading
The principal objective of market risk management of non-trading portfolios is to optimise net interest income.
Market risk in non-trading portfolios arises principally from mismatches between the future yield on assets and their funding cost as a result of interest rate changes. Analysis of this risk is complicated by having to make assumptions on optionality in certain product areas, for example, mortgage prepayments, and from behavioural assumptions regarding the economic duration of liabilities which are contractually repayable on demand, for example, current accounts. This prospective change in future net interest income from non-trading portfolios will be reflected in the current realisable value of these positions should they be sold or closed prior to maturity. In order to manage this risk optimally, market risk in non-trading portfolios is transferred to Global Markets or to separate books managed under the auspices of the local ALCO.
The transfer of market risk to trading books managed by Global Markets or ALCO is usually achieved by a series of internal deals between the business units and these trading books. When the
169
Back to Contents
H S B C H O L D I N G S P L C
Financial Review(continued)
behavioural characteristics of a product differ from its contractual characteristics, the behavioural characteristics are assessed to determine the true underlying interest rate risk. Local ALCOs regularly monitor all such behavioural assumptions and interest rate risk positions, to ensure they comply with interest rate risk limits established by the Group Management Board.
As noted above, in certain cases, the non-linear characteristics of products cannot be adequately captured by the risk transfer process. For example, both the flow from customer deposit accounts to more attractive investment products and the precise repayment levels of mortgages will vary at different interest rate levels. In such circumstances simulation modelling is used to identify the impact of varying scenarios on valuations and net interest income.
Once market risk has been consolidated in Global Markets or ALCO-managed books, the net exposure is typically managed through the use of interest rate swaps within agreed limits.
In the US, market risk arising within HSBC’s residential mortgage business is primarily managed by a specialist function within the mortgage business under guidelines established by HSBC Bank USA’s ALCO. A range of risk management tools is applied to hedge the sensitivity arising from movements in interest rates. A key element of risk management within the US mortgage business is dealing with the sensitivity of Mortgage Servicing Rights (‘MSRs’) to market risks. MSRs represent the economic value of the right to perform specified residential mortgage servicing activities. They are sensitive to interest rates movements, which change the prepayment speed of the underlying mortgages and therefore the value of the MSRs. HSBC uses a combination of interest-rate-sensitive derivative financial instruments and debt securities to help protect the economic value of MSRs. An accounting asymmetry can arise in this area because the derivative instruments used to hedge the economic exposure arising from MSRs are marked to market, but the MSRs themselves are measured for accounting purposes at the lower of cost or market value. It is, therefore, possible for an economically hedged position not to be shown as such in the accounts, when the hedge shows a loss but the MSR cannot be revalued above cost to reflect an associated profit. HSBC’s policy is to hedge the economic risk.
VAR limits are set to control the exposure to MSRs and MSR hedges. The VAR on MSRs and MSR hedges at 31 December 2004 was US$10 million.
Market risk also arises in the Group’s insurance businesses within their portfolios of investments and policyholder liabilities. The principal market risks are interest rate risk and equity risk which primarily arise where guaranteed investment return policies have been issued. The insurance businesses have a dedicated head office market risk function which oversees management of this risk.
Market risk also arises within the Group’s defined benefit pension schemes to the extent that the obligations of the schemes are not fully matched by assets with determinable cash flows. This risk principally derives from the pension schemes holding equities against their future pension obligations. The risk is that market movements in equity prices could result in assets which are insufficient over time to cover the level of projected liabilities. Management and trustees, who act on behalf of the pension scheme beneficiaries, assess the level of this risk using reports prepared by independent external actuaries.
The present value of the Group’s defined benefit pension schemes liabilities was US$25.8 billion at 31 December 2004 compared with US$21.7 billion at 31 December 2003. Assets of the defined benefit schemes at 31 December 2004 comprised equity investments 53.3 per cent, debt securities 29.1 per cent and other (including property) 17.6 per cent.
Net interest income
Future net interest income is affected by movements in interest rates. A principal part of the Group’s management of market risk in non-trading portfolios is to monitor the sensitivity of projected net interest income at varying interest rate scenarios (simulation modelling). HSBC aims, through its management of market risk in non-trading portfolios, to mitigate the impact of prospective interest rate movements which could reduce future net interest income, whilst balancing the cost of such hedging activities on the current net revenue stream.
For simulation modelling, businesses use a combination of scenarios relevant to local businesses and local markets as well as standard scenarios required to be used across the Group. The Group standard scenarios are consolidated to illustrate the combined pro-forma impact on Group consolidated portfolio valuations and net interest income.
The table below sets out the impact on future net interest income of an immediate hypothetical 100 basis points parallel fall or rise in all yield curves worldwide on 1 January 2005. Assuming no management actions, a 100 basis points parallel fall in all yield curves would increase planned net
170
Back to Contents
interest income for the 12 months to 31 December 2005 by US$495 million while a hypothetical 100 basis points parallel rise in all yield curves would decrease planned net interest income by US$908 million.
Instead of assuming that all interest rates move together, HSBC groups its interest rate exposures into currency blocs whose interest rates are considered likely to move together. The sensitivity of projected net interest income for 2005, on this basis, is described as follows:
| | | | Rest of | | Hong Kong | | Rest of | | | | | | | |
| | US dollar | | Americas | | dollar | | Asia | | Sterling | | Euro | | | |
| | bloc | | bloc | | bloc | | bloc | | bloc | | bloc | | Total | |
| | US$m | | US$m | | US$m | | US$m | | US$m | | US$m | | US$m | |
| Change in 2005 projected net | | | | | | | | | | | | | | |
| interest income | | | | | | | | | | | | | | |
| | | | | | | | | | | | | | | |
| + 100 basis points shift in yield | | | | | | | | | | | | | | |
| curves | (789 | ) | 98 | | 74 | | (4 | ) | (13 | ) | (274 | ) | (908 | ) |
| –100 basis points shift in yield | | | | | | | | | | | | | | |
| curves | 643 | | (108 | ) | (300 | ) | (37 | ) | 15 | | 282 | | 495 | |
| | | | | | | | | | | | | | | |
| Change in 2004 projected net | | | | | | | | | | | | | | |
| interest income | | | | | | | | | | | | | | |
| | | | | | | | | | | | | | | |
| + 100 basis points shift in yield | | | | | | | | | | | | | | |
| curves | (511 | ) | 92 | | (150 | ) | (1 | ) | (21 | ) | (228 | ) | (819 | ) |
| –100 basis points shift in yield | | | | | | | | | | | | | | |
| curves | 157 | | (115 | ) | (689 | ) | (2 | ) | (26 | ) | 212 | | (463 | ) |
The interest rate sensitivities set out in the table above are illustrative only and are based on a single simplified scenario. The figures represent the effect of the pro forma movements in net interest income based on the projected yield curve scenarios and the Group’s current interest rate risk profile. This effect, however, does not incorporate actions that could be taken by Global Markets or in the business units to mitigate the impact of this interest rate risk. In reality, Global Markets would seek to proactively change the interest rate risk profile to minimise losses and optimise net revenues. The projections above also assume that rates of all maturities move by the same amount and, therefore, do not reflect the potential impact on net interest income of some rates changing while others remain unchanged. The projections also make other simplifying assumptions, including that all positions run to maturity.
The Group’s exposure to changes in its net interest income arising from movements in interest rates falls into three areas: core deposit franchises, HSBC Finance Corporation and Global Markets.
| • | Core deposit franchises: these are exposed to changes in the value of the deposits raised and spreads against wholesale funds; in a low interest rate environment, such as at present, the value of core deposits increases as interest rates rise and decreases as interest rates fall. This risk is, however, asymmetrical as there is limited room to lower deposit pricing in the event of interest rate reductions in a low interest rate environment. Although interest rates have risen |
| | over the year, this risk is still particularly acute in the case of Hong Kong dollar deposits. |
| | |
| • | HSBC Finance Corporation’s net interest income sensitivity is such that it benefits in a falling rate environment and its interest margins decline in a rising rate environment. This arises from having substantially fixed rate real estate secured lending funded to an extent with interest rate-sensitive short-term liabilities. |
| | |
| | This feature is important from a Group perspective because it provides a natural offset to the effect of interest rate reductions on the core deposit franchises. |
| | |
| • | Global Markets: the residual interest rate risk is managed within Global Markets. This reflects the Group’s policy of transferring all interest rate risk, other than structural risk, to Global Markets to be managed within defined limits and with flexibility as to the instruments used. |
| | |
The best way of illustrating the active management of this interest rate risk is to highlight the major drivers of the changes shown in the projected effect of interest rate moves in the above table.
| • | In Hong Kong, the rise in interest rates over the year increases the room to lower deposit pricing in the event of falling interest rates. In addition, Global Markets are positioned to increase revenue should rates fall. These two factors have materially reduced the Group’s exposure to falling rates. |
171
Back to Contents
H S B C H O L D I N G S P L C
Financial Review(continued)
| • | Similarly, in the US dollar bloc, the rise in interest rates over the year increases the room to lower deposit pricing in the event of falling interest rates and Global Markets have been able to position themselves to increase revenue if rates fall. In addition, cash balances at the holding company reduced as the Group acquired businesses, principally Bank of Bermuda, M&S Money and the investment in Bank of Communications, increasing the negative impact of rising interest rates. |
| | |
| • | Global Markets increased its exposure to euro assets, contributing to the increased sensitivity to both rising and falling rates. |
It can be seen from the above that projecting the movement in net interest income from prospective changes in interest rates is a complex interaction of structural and managed exposures. In a rising rate environment, the most critical exposures are those managed within Global Markets.
Structural foreign exchange exposures
Structural foreign exchange exposures represent net investments in subsidiaries, branches or associated undertakings, the functional currencies of which are currencies other than US dollars.
Revaluation gains and losses on structural exposures are recorded in the statement of total consolidated recognised gains and losses. The main operating (or functional) currencies in which HSBC’s business is transacted are the US dollar, the Hong Kong dollar, sterling, the euro, the Mexican peso, the Brazilian real, and the Chinese renminbi. As the US dollar and currencies linked to it form the dominant currency bloc in which HSBC’s operations transact business, HSBC Holdings prepares its consolidated financial statements in US dollars. HSBC’s consolidated balance sheet is therefore affected by movements in exchange rates between the US dollar and all the non-US dollar functional currencies of underlying subsidiaries.
HSBC hedges structural foreign currency exposures only in limited circumstances. HSBC’s structural foreign currency exposures are managed with the primary objective of ensuring, where practical, that HSBC’s consolidated tier 1 ratio and the tier 1 ratios of individual banking subsidiaries are protected from the effect of changes in exchange rates. This is usually achieved by ensuring that, for each subsidiary bank, the ratio of structural exposures in a given currency to risk-weighted assets denominated in that currency is broadly equal to the tier 1 ratio of the subsidiary in question.
Selective hedges were in place during 2004. Hedging is undertaken using forward foreign exchange contracts or by financing with borrowings in the same currencies as the functional currencies involved. There was no material effect from foreign currency exchange rate movements on HSBC’s tier 1 capital ratio during the period.
Management of insurance and financial risk
HSBC’s insurance underwriting operations, inter alia, issue contracts that accept the transfer of insurance risk, or accept financial risk, or both. This section summarises these risks and the way that HSBC manages them.
Insurance risk
The principal risk that HSBC faces under the insurance risk transfer contracts that it underwrites is that the eventual claims and benefit payments, together with the costs of managing the business and claims handling, exceed the aggregate amount of premia received and investment income earned thereon, pending settlement of claims. HSBC controls this risk by modelling outcomes using statistical techniques and by holding a diversified portfolio of relatively homogeneous contracts which is considered unlikely to be significantly different from the expected outcome.
HSBC manages the risk of unexpectedly large underwriting losses through its underwriting strategy, reinsurance arrangements and claims handling.
In conjunction with Group Credit and Risk, the central management of HSBC’s insurance operations places reinsurance contracts with the world’s larger reinsurance companies. HSBC assesses the financial strength and creditworthiness of all reinsurers by reviewing publicly available financial information such as credit grades provided by rating agencies. HSBC also takes into account details of recent payment history and the status of any ongoing negotiations between HSBC’s insurance operations and these third parties. Individual operating units maintain records of the payment history of contract holders with whom they conduct regular business.
Financial risk
HSBC’s insurance operations are also exposed to financial risk in circumstances when the proceeds from financial assets are not sufficient to fund the obligations arising from insurance and investment contracts.
The framework for the management of these
172
Back to Contents
risks seeks to integrate the financial risks associated with HSBC’s insurance operations with similar risks arising from other financial assets and liabilities not directly associated with insurance and investment liabilities.
Investment credit risk is the risk that financial loss arises from the failure of an issuer of an investment product or a counterparty to an investment transaction to meet its obligations. Local management of HSBC’s operating insurance companies are responsible for the quality and performance of their respective investment portfolios. Investment guidelines are set at a Group level and refined by local ALCOs which review, on a quarterly basis, investment management performance and compliance with the guidelines. Assessments of the creditworthiness of issuers and counterparties are based primarily upon rating agency and other publicly available information together with investment concentrations. Investment credit exposures are aggregated and reported to HSBC’s Group Credit and Risk function on a quarterly basis.
Operational risk management
Operational risk is the risk of loss arising through fraud, unauthorised activities, error, omission, inefficiency, systems failure or from external events. It is inherent to every business organisation and covers a wide spectrum of issues.
HSBC manages this risk through a controls-based environment in which processes are documented, authorisation is independent and transactions are reconciled and monitored. This is supported by an independent programme of periodic reviews undertaken by Internal Audit, and by monitoring external operational risk events, which ensure that HSBC stays in line with best practice and takes account of lessons learned from publicised operational failures within the financial services industry.
HSBC has codified its operational risk management process by issuing a high level standard. This explains how HSBC manages operational risk by identifying, assessing, monitoring, controlling and mitigating the risk, rectifying operational risk events, and implementing any additional procedures required for compliance with local regulatory requirements. The processes undertaken to manage operational risk are determined by reference to the scale and nature of each HSBC operation. The HSBC standard covers the following:
| • | Operational risk management responsibility is |
| | assigned at senior management level within the business operation. |
| | |
| • | Information systems are used to record the identification and assessment of operational risks and generate appropriate, regular management reporting. |
| | |
| • | Operational risks are identified by risk assessments covering operational risks facing each business and risks inherent in processes, activities and products. Risk assessment incorporates a regular review of risks identified to monitor significant changes. |
| | |
| • | Operational risk loss data is collected and reported to senior management. Aggregate operational risk losses are recorded and details of incidents above a materiality threshold are reported to the Group Audit Committee and the Risk Management Meeting. |
| | |
| • | Risk mitigation, including insurance, is considered where this is cost-effective. |
In each of HSBC’s subsidiaries, local management is responsible for implementation of the HSBC standard on operational risk throughout their operations and, where deficiencies are evident, these are required to be rectified within a reasonable timeframe. Subsidiaries acquired by HSBC since the standard was issued are required to assess and plan the implementation of the standard’s requirements.
HSBC maintains and tests contingency facilities to support operations in the event of disasters. Additional reviews and tests were conducted following the terrorist incidents of 11 September 2001 and, more recently, the two bomb blasts which damaged two of HSBC’s buildings in Istanbul, to incorporate lessons learned in the operational recovery from those circumstances.
Reputational risk management
The reputation of HSBC is paramount to its success. Reputational risks can arise from social, ethical or environmental issues, or as a consequence of operational risk events. As a banking group, HSBC’s good reputation depends upon the way in which it conducts its business, but it can also be affected by the way in which clients, to whom it provides financial services, conduct themselves.
Reputational risks are considered and assessed by the Board, the Group Management Board, the Risk Management Meeting, subsidiary company boards, board committees and/or senior management during the formulation of policy and the establishment of standards. Standards on all major
173
Back to Contents
H S B C H O L D I N G S P L C
FinancialReview(continued)
aspects of business are set for HSBC and for individual subsidiaries, businesses and functions. These are communicated through manuals and statements of policy, and promulgated through internal communications and training. The policies set out operational procedures in all areas of reputational risk, including treating customers fairly, conflicts of interest, money laundering deterrence, environmental impact, anti-corruption measures and employee relations.
Management in all operating entities is required to establish a strong internal control structure to minimise the risk of operational and financial failure, and to ensure that a full appraisal of reputational implications is made before strategic decisions are taken. The Group internal audit function monitors compliance with policies and standards.
Capital management and allocation
Capital measurement and allocation
The FSA supervises HSBC on a consolidated basis and, as such, receives information on the capital adequacy of, and sets capital requirements for, HSBC as a whole. Individual banking subsidiaries are directly regulated by their local banking supervisors, which set and monitor their capital adequacy requirements. In some jurisdictions, certain non-banking subsidiaries are subject to the supervision and capital requirements of local regulatory authorities. Since 1988, when the governors of the Group of Ten central banks agreed to guidelines for the international convergence of capital measurement and standards, the banking supervisors of HSBC’s major banking subsidiaries have exercised capital adequacy supervision in a broadly similar framework. The guidelines agreed in 1988, referred to as the Basel Accord, are applied on a consistent basis across the European Union through directives, which are then implemented by member states.
In implementing the EU’s BankingConsolidation Directive, the FSA requires each bank and banking group to maintain an individually prescribed ratio of total capital to risk-weighted assets taking into account both balance sheet assets and off-balance sheet transactions. Under the EU’s Amending Directive to the Capital Adequacy Directive, the FSA allows banks to calculate capital requirements for market risk in the trading book using VAR techniques.
HSBC’s capital is divided into two tiers: tier 1, comprising shareholders’ funds, innovative tier 1 securities and minority interests in tier 1 capital, but excluding revaluation reserves; and tier 2,
comprising general loan loss provisions, revaluation reserves, qualifying subordinated loan capital and minority and other interests in tier 2 capital. The amount of innovative tier 1 securities cannot exceed 15 per cent of overall tier 1 capital, qualifying tier 2 capital cannot exceed tier 1 capital, and qualifying term subordinated loan capital may not exceed 50 per cent of tier 1 capital. There are also limitations on the amount of general provisions which may be included in tier 2 capital. The book values of goodwill, intangible assets and own shares held are deducted in arriving at tier 1 capital. Total capital is calculated by deducting the book values of unconsolidated investments, investments in the capital of banks, and certain regulatory items from the total of tier 1 and tier 2 capital.
Banking operations are categorised as either trading book (broadly, marked-to-market activities) or banking book (all other activities) and risk-weighted assets are determined accordingly. Banking book risk-weighted assets are measured by means of a hierarchy of risk weightings classified according to the nature of each asset and counterparty, taking into account any eligible collateral or guarantees. Banking book off-balance-sheet items giving rise to credit, foreign exchange or interest rate risk are assigned weights appropriate to the category of the counterparty, taking into account any eligible collateral or guarantees. Trading book risk-weighted assets are determined by taking into account market-related risks such as foreign exchange, interest rate and equity position risks, and counterparty risk.
Future developments
In October 2004, the FSA published a consultation paper CP04/17 ‘Implications of a changing accounting framework’. This paper sets out the FSA’s proposed approach to assessing banks’ capital adequacy after implementation of IFRS. In the absence of the FSA’s final rules on capital adequacy reporting under IFRS, which may be different from the proposals set out in CP04/17, HSBC will follow its proposals with effect from 1 January 2005.
Under the consultation paper, there will be changes to the measurement of banks’ capital adequacy in a number of ways, the most significant of which for HSBC are set out below.
| • | The capital treatment for collective impairment provisions will be the same as previously for general provisions, i.e. they will be included in tier 2 capital. This is expected to have a positive impact on HSBC’s total capital ratio.
|
| | |
| • | Transitional impacts of IFRS implementation, such as the capitalisation of software costs, are
|
Back to Contents
| | likely to have a positive impact on shareholders’ funds. This is expected to result in increases in the tier 1 and total capital ratios. Under IFRS, dividends will not be recognised on the balance sheet until they are declared. This will give rise to an increase in shareholders’ funds at the year-end which will reverse out when the dividend is declared. Banks will take the benefit of this increase to their regulatory capital until the dividend is declared, in line with the accounting treatment. |
The remainder of the proposals in CP04/17 will have a smaller impact on HSBC. They include the reversal of the recognition of the assets and liabilities of defined benefit pension schemes. Instead, banks will deduct from capital their best estimate of the funds that will need to be paid into the schemes in addition to normal contributions over the next five years.
In June 2004, the Basel Committee on Banking Supervision (‘the Basel Committee’) issued a new capital adequacy framework to replace the Basel Accord of 1988 in the form of a final Accord (commonly known as ‘Basel II’). The new capital framework consists of three ‘pillars’: minimum capital requirements, supervisory review process and market discipline. The supervisory objectives of the Basel Committee are for Basel II to promote safety and soundness in the financial system and, as such, at least maintain the current overall level of capital in the system; to enhance competitive equality; to constitute a more comprehensive approach to addressing risks; and to focus on internationally active banks.
With respect to pillar one, Basel II provides three approaches, of increasing sophistication, to the credit risk regulatory capital calculation. The most basic approach is the standardised approach, which uses external credit ratings to determine the risk weighting applied to rated counterparties and groups other counterparties into broad categories and applies standardised risk weightings to these categories. Moving to the internal ratings based foundation approach will allow banks to calculate their credit risk regulatory capital requirement on the basis of their internal assessment of the probability that the counterparty will default. The internal ratings-based advanced approach will allow banks to use their own internal assessment of not only the probability of default, but also the quantification of the exposure to a counterparty and the percentage loss suffered if the counterparty defaults. Pillar one will also introduce capital requirements for operational risk and again three levels of sophistication are available. The capital requirement
under the basic indicator approach is a simple percentage of gross revenues; under the standardised approach it is one of three different percentages of gross revenues applicable to each of eight business lines; and under advanced measurement approaches it is an amount determined using banks’ own statistical analysis techniques on operational risk data.
In Europe, Basel II will be given effect by applying the ‘re-casting technique’ (Interinstitutional Agreement 2002/C 77/01) enabling substantive amendments to existing legislation without a self-standing amending directive. The proposal for recasting of the Banking Consolidation Directive and the Capital Adequacy Directive was published in July 2004. It largely incorporates the requirements set out in Basel II, but there are also a number of differences. This proposal will now be subject to a formal EU co-decision legislative process involving the Council of Ministers and the European Parliament, during which further changes may be made.
In January 2005, the FSA published a consultation paper CP05/3 ‘Strengthening capital standards’. This paper sets out the FSA’s proposed approach to implementing the requirements of the recast EU directives. The FSA proposes that the new requirements will be applied from 1 January 2007, except that under pillar 1 firms may elect to continue to apply the existing capital adequacy framework until 1 January 2008.
HSBC continues to participate actively in the industry consultations surrounding the development and implementation of Basel II and the re-cast EU directives and fully supports a more risk-sensitive regulatory capital framework than the 1988 Basel Accord. The implementation of Basel II across HSBC’s geographically diverse businesses operating in a large number of different regulatory environments represents a significant challenge, and a major programme of projects is in progress. Basel II allows extensive scope for interpretation by regulators and the range of such variation and the interaction of HSBC’s home and host regulators, which is still being developed, will be key factors. In view of this, it is still too early to assess what the impact of Basel II on HSBC’s capital ratios will be. One example of the uncertainty in interpretation by regulators is that the US banking agencies are likely to propose that, in the United States, certain institutions continue to be subject to the 1988 Basel Accord while others be subject to the ‘advanced’ risk and capital methodologies of Basel II. In this latter context, the Federal Reserve Board has determined that HNAH, HSBC’s highest level US bank holding
Back to Contents
H S B C H O L D I N G S P L C
FinancialReview(continued)
company in the US, which holds all HSBC’s US operating subsidiaries and HSBC Canada, will be expected to qualify for, and comply with, the Federal Reserve Board’s ‘advanced’ risk and capital methodologies of Basel II. These guidelines are still in development and may not be finalised before the second quarter of 2006.
Capital management
It is HSBC’s policy to maintain a strong capital base to support the development of its business. HSBC seeks to maintain a prudent balance between the different components of its capital and, in HSBC Holdings, between the composition of its capital and that of its investment in subsidiaries. This is achieved by each subsidiary managing its own capital within the context of an approved annual plan which determines the optimal amount and mix of capital required to support planned business growth and meet local regulatory capital requirements and, in the case of HSBC Finance Corporation, its ratings targets. Capital generated in excess of planned requirements is paid up to HSBC Holdings, normally
by way of dividends, and represents a source of strength for HSBC.
HSBC Holdings is primarily a provider of equity capital to its subsidiaries. These investments are substantially funded by HSBC Holdings’ own equity issuance and profit retentions. Major subsidiaries usually raise their own non-equity tier 1 capital and subordinated debt in accordance with HSBC guidelines regarding market and investor concentration, cost, market conditions, timing and the effect on the composition and maturity profile of HSBC’s capital. The subordinated debt requirements of other HSBC companies are met internally.
HSBC recognises the impact on shareholder returns of the level of equity capital employed within HSBC and seeks to maintain a prudent balance between the advantages and flexibility afforded by a strong capital position and the higher returns on equity possible with greater leverage. In the current environment, HSBC uses a benchmark tier 1 capital ratio of 8.25 per cent in considering its long-term capital planning.
Source and application of tier 1 capital
| | 2004 | | 2003 | |
| | US$m | | US$m | |
| Movement in tier 1 capital | | | | |
| Opening tier 1 capital | 54,863 | | 38,949 | |
| Attributable profits | 11,840 | | 8,774 | |
| Add back: goodwill amortisation | 1,818 | | 1,585 | |
| Dividends | (7,301 | ) | (6,532 | ) |
| Add back: shares issued in lieu of dividends | 2,607 | | 1,423 | |
| Increase in goodwill and intangible assets deducted | (3,088 | ) | (13,650 | ) |
| Merger reserve | – | | 12,768 | |
| Shares issued | 581 | | 1,482 | |
| Innovative tier 1 capital issued | 1,983 | | 4,263 | |
| Other (including exchange movements) | 3,956 | | 5,801 | |
| |
| |
| |
| Closing tier 1 capital | 67,259 | | 54,863 | |
| |
| |
| |
| Movement in risk-weighted assets | | | | |
| Opening risk-weighted assets | 618,662 | | 430,551 | |
| Movements | 140,548 | | 188,111 | |
| |
| |
| |
| Closing risk-weighted assets | 759,210 | | 618,662 | |
| |
| |
| |
Back to Contents
Capital structure
The table below sets out the analysis of regulatory capital.
| | 2004 | | 2003 | |
| | US$m | | US$m | |
| Composition of capital | | | | |
| Tier 1 | | | | |
| Shareholders’ funds | 86,623 | | 74,473 | |
| Minority interests | 4,253 | | 3,711 | |
| Innovative tier 1 securities | 10,077 | | 8,094 | |
| Less : | | | | |
| Property revaluation reserves | (2,660 | ) | (1,615 | ) |
| Goodwill capitalised and intangible assets | (31,190 | ) | (29,920 | ) |
| Own shares held | 156 | | 120 | |
| |
| |
| |
| Total qualifying tier 1 capital | 67,259 | | 54,863 | |
| |
| |
| |
| Tier 2 | | | | |
| Property revaluation reserves | 2,660 | | 1,615 | |
| General provisions | 2,624 | | 2,868 | |
| Perpetual subordinated debt | 3,670 | | 3,608 | |
| Term subordinated debt | 21,373 | | 15,795 | |
| Minority and other interests in tier 2 capital | 519 | | 523 | |
| |
| |
| |
| Total qualifying tier 2 capital | 30,846 | | 24,409 | |
| |
| |
| |
| Unconsolidated investments | (6,361 | ) | (4,101 | ) |
| Investments in other banks | (799 | ) | (911 | ) |
| Other deductions | (165 | ) | (218 | ) |
| |
| |
| |
| Total capital | 90,780 | | 74,042 | |
| |
| |
| |
| Risk-weighted assets | | | | |
| Banking book | 705,302 | | 577,430 | |
| Trading book | 53,908 | | 41,232 | |
| |
| |
| |
| Total | 759,210 | | 618,662 | |
| |
| |
| |
| | % | | % | |
| Capital ratios: | | | | |
| Total capital | 12.0 | | 12.0 | |
| Tier 1 capital | 8.9 | | 8.9 | |
The above figures were computed in accordance with the EU Banking Consolidation Directive.
Tier 1 capital increased by US$12.4 billion. Retained profits (excluding goodwill amortisation) contributed US$6.4 billion. Shares issued in lieu of dividends and innovative tier 1 securities issued contributed US$2.6 billion and US$2.0 billion, respectively. Exchange movements on reserves and other movements also added US$1.4 billion to tier 1 capital.
The increase of US$6.4 billion in tier 2 capital mainly reflects the proceeds of capital issues, net of redemption and regulatory amortisation.
Total risk-weighted assets increased by US$141 billion. This increase was driven by significant growth in loans and advances to customers in North America, the UK and Hong Kong. In constant currency, risk-weighted asset growth was 17 per cent.
Risk-weighted assets by principal subsidiary
In order to give an indication of how HSBC’s capital is deployed, the table below analyses the disposition of risk-weighted assets by principal subsidiary. The risk-weighted assets are calculated using FSA rules and exclude intra-HSBC items.
177
Back to Contents
H S B C H O L D I N G S P L C
FinancialReview(continued)
| | 2004 | | 2003 | |
| | US$m | | US$m | |
| Risk-weighted assets | | | | |
| Hang Seng Bank | 37,918 | | 34,972 | |
| The Hongkong and Shanghai Banking Corporation and other subsidiaries | 119,595 | | 103,557 | |
| | | | | |
| The Hongkong and Shanghai Banking Corporation | 157,513 | | 138,529 | |
| | | | | |
| HSBC Private Banking Holdings (Suisse) | 19,815 | | 22,245 | |
| CCF | 54,569 | | 47,741 | |
| HSBC Bank and other subsidiaries | 220,824 | | 167,754 | |
| | | | | |
| HSBC Bank | 295,208 | | 237,740 | |
| | | | | |
| HSBC Finance Corporation | 110,744 | | 113,186 | |
| HSBC Bank Canada | 26,127 | | 20,852 | |
| HSBC Bank USA and other subsidiaries | 108,577 | | 63,234 | |
| | | | | |
| HSBC North America Holdings Inc. | 245,448 | | 197,272 | |
| | | | | |
| HSBC Mexico | 8,750 | | 7,059 | |
| | | | | |
| HSBC Bank Middle East | 10,088 | | 7,379 | |
| | | | | |
| HSBC Bank Malaysia | 5,472 | | 4,979 | |
| | | | | |
| HSBC’s South American operations | 9,743 | | 6,994 | |
| | | | | |
| Bank of Bermuda | 4,107 | | – | |
| | | | | |
| HSBC Holdings sub-group | 1,380 | | 2,495 | |
| | | | | |
| Other | 21,501 | | 16,215 | |
| |
| |
| |
| Total | 759,210 | | 618,662 | |
| |
| |
| |
178
Back to Contents
H S B C H O L D I N G S P L C
Other information
| Loan maturity and interest sensitivity analysis |
|
At 31 December 2004, the geographical analysis of loan maturity and interest sensitivity by loan type on a contractual repayment basis was as follows. All amounts are net of suspended interest.
| | | | | | Rest | | | | | | | |
| | | | Hong | | of Asia- | | North | | South | | | |
| | Europe | | Kong | | Pacific | | America | | America | | Total | |
| | US$m | | US$m | | US$m | | US$m | | US$m | | US$m | |
| Maturity of 1 year or less | | | | | | | | | | | | |
| | | | | | | | | | | | | |
| Loans and advances to banks | 54,303 | | 45,261 | | 14,074 | | 22,077 | | 2,572 | | 138,287 | |
| |
| |
| |
| |
| |
| |
| |
| Commercial loans to customers | | | | | | | | | | | | |
| Commercial, industrial and international trade | 29,028 | | 10,600 | | 15,421 | | 6,568 | | 1,610 | | 63,227 | |
| Real estate and other property related | 9,675 | | 4,766 | | 3,381 | | 5,002 | | 170 | | 22,994 | |
| Non-bank financial institutions | 26,615 | | 1,328 | | 1,930 | | 15,993 | | 98 | | 45,964 | |
| Governments | 986 | | 83 | | 789 | | 1,638 | | 98 | | 3,594 | |
| Other commercial | 22,699 | | 2,431 | | 4,518 | | 13,205 | | 747 | | 43,600 | |
| |
| |
| |
| |
| |
| |
| |
| | 89,003 | | 19,208 | | 26,039 | | 42,406 | | 2,723 | | 179,379 | |
| |
| |
| |
| |
| |
| |
| |
| Hong Kong Government Home Ownership Scheme | – | | 652 | | – | | – | | – | | 652 | |
| Residential mortgages and other personal loans | 27,587 | | 10,332 | | 7,684 | | 43,006 | | 2,778 | | 91,387 | |
| |
| |
| |
| |
| |
| |
| |
| Loans and advances to customers | 116,590 | | 30,192 | | 33,723 | | 85,412 | | 5,501 | | 271,418 | |
| |
| |
| |
| |
| |
| |
| |
| Total loans maturing in one year or less | 170,893 | | 75,453 | | 47,797 | | 107,489 | | 8,073 | | 409,705 | |
| |
| |
| |
| |
| |
| |
| |
| Maturity after 1 year but within 5 years | | | | | | | | | | | | |
| | | | | | | | | | | | | |
| Loans and advances to banks | 1,087 | | 39 | | 380 | | 83 | | 25 | | 1,614 | |
| |
| |
| |
| |
| |
| |
| |
| Commercial loans to customers | | | | | | | | | | | | |
| Commercial, industrial and international trade | 16,123 | | 3,146 | | 3,249 | | 3,927 | | 358 | | 26,803 | |
| Real estate and other property related | 9,686 | | 8,907 | | 3,324 | | 6,002 | | 34 | | 27,953 | |
| Non-bank financial institutions | 2,064 | | 544 | | 352 | | 841 | | 12 | | 3,813 | |
| Governments | 629 | | 531 | | 510 | | 2,065 | | 508 | | 4,243 | |
| Other commercial | 6,344 | | 3,537 | | 1,922 | | 1,168 | | 173 | | 13,144 | |
| |
| |
| |
| |
| |
| |
| |
| | 34,846 | | 16,665 | | 9,357 | | 14,003 | | 1,085 | | 75,956 | |
| |
| |
| |
| |
| |
| |
| |
| Hong Kong Government Home OwnershipScheme | – | | 1,869 | | – | | – | | – | | 1,869 | |
| Residential mortgages and other personal loans | 35,874 | | 7,629 | | 6,554 | | 44,221 | | 797 | | 95,075 | |
| |
| |
| |
| |
| |
| |
| |
| Loans and advances to customers | 70,720 | | 26,163 | | 15,911 | | 58,224 | | 1,882 | | 172,900 | |
| |
| |
| |
| |
| |
| |
| |
| Total loans maturing after 1 year but within | | | | | | | | | | | | |
| 5 years | 71,807 | | 26,202 | | 16,291 | | 58,307 | | 1,907 | | 174,514 | |
| |
| |
| |
| |
| |
| |
| |
| Interest rate sensitivity of loans and advances to | | | | | | | | | | | | |
| banks and commercial loans to customers: | | | | | | | | | | | | |
Fixed interest rate | 7,783 | | 148 | | 2,875 | | 3,802 | | 627 | | 15,235 | |
| Variable interest rate | 28,150 | | 16,556 | | 6,862 | | 10,284 | | 483 | | 62,335 | |
| |
| |
| |
| |
| |
| |
| |
| Total | 35,933 | | 16,704 | | 9,737 | | 14,086 | | 1,110 | | 77,570 | |
| |
| |
| |
| |
| |
| |
| |
| Maturity after 5 years | | | | | | | | | | | | |
| | | | | | | | | | | | | |
| Loans and advances to banks | 483 | | – | | 329 | | 2,016 | | – | | 2,828 | |
| |
| |
| |
| |
| |
| |
| |
| Commercial loans to customers | | | | | | | | | | | | |
| Commercial, industrial and international trade | 9,242 | | 366 | | 421 | | 1,098 | | 14 | | 11,141 | |
| Real estate and other property related | 6,200 | | 2,674 | | 856 | | 3,310 | | 2 | | 13,042 | |
| Non-bank financial institutions | 2,127 | | 58 | | 15 | | 255 | | 1 | | 2,456 | |
| Governments | 2,048 | | 1 | | 132 | | 165 | | 29 | | 2,375 | |
| Other commercial | 7,057 | | 1,911 | | 874 | | 501 | | 4 | | 10,347 | |
| |
| |
| |
| |
| |
| |
| |
| | 26,674 | | 5,010 | | 2,298 | | 5,329 | | 50 | | 39,361 | |
| |
| |
| |
| |
| |
| |
| |
| Hong Kong Government Home OwnershipScheme | – | | 2,882 | | – | | – | | – | | 2,882 | |
| Residential mortgages and other personal loans | 64,975 | | 15,174 | | 9,613 | | 106,099 | | 78 | | 195,939 | |
| |
| |
| |
| |
| |
| |
| |
| Loans and advances to customers | 91,649 | | 23,066 | | 11,911 | | 111,428 | | 128 | | 238,182 | |
| |
| |
| |
| |
| |
| |
| |
| Total loans maturing after 5 years | 92,132 | | 23,066 | | 12,240 | | 113,444 | | 128 | | 241,010 | |
| |
| |
| |
| |
| |
| |
| |
| Interest rate sensitivity of loans and advances to | | | | | | | | | | | | |
| banks and commercial loans to customers | | | | | | | | | | | | |
| Fixed interest rate | 7,517 | | 175 | | 988 | | 1,869 | | 20 | | 10,569 | |
| Variable interest rate | 19,640 | | 4,835 | | 1,639 | | 5,476 | | 30 | | 31,620 | |
| |
| |
| |
| |
| |
| |
| |
| Total | 27,157 | | 5,010 | | 2,627 | | 7,345 | | 50 | | 42,189 | |
| |
| |
| |
| |
| |
| |
| |
179
Back to Contents
H S B C H O L D I N G S P L C
Other information(continued)
The following table analyses the average amount of bank and customer deposits and certificates of deposit (‘CDs’) and other money market instruments (which are included within ‘debt securities in issue’ in the balance sheet), together with the average interest rates paid thereon for each of the past three years. The geographical analysis of average deposits is based on the location of the office in which the deposits are recorded and excludes balances with HSBC companies. The ‘Other’ category includes securities sold under agreements to repurchase.
| | Year ended 31 December | |
| |
| |
| | 2004 | | 2003 | | 2002 | |
| |
| |
| |
| |
| | Average | | Average | | Average | | Average | | Average | | Average | |
| | balance | | rate | | balance | | rate | | balance | | rate | |
| | US$m | | % | | US$m | | % | | US$m | | % | |
| Deposits by banks | | | | | | | | | | | | |
| | | | | | | | | | | | | |
| Europe | | | | | | | | | | | | |
| Demand and other – non-interest bearing | 14,746 | | – | | 9,895 | | – | | 7,626 | | – | |
| Demand – interest bearing | 9,237 | | 1.5 | | 6,418 | | 3.3 | | 5,282 | | 3.0 | |
| Time | 22,746 | | 2.7 | | 17,877 | | 1.9 | | 19,053 | | 2.8 | |
| Other | 22,884 | | 2.5 | | 13,828 | | 2.5 | | 12,113 | | 3.0 | |
| |
| | | |
| | | |
| | | |
| Total | 69,613 | | | | 48,018 | | | | 44,074 | | | |
| |
| | | |
| | | |
| | | |
| Hong Kong | | | | | | | | | | | | |
| Demand and other – non-interest bearing | 1,723 | | – | | 1,253 | | – | | 1,011 | | – | |
| Demand – interest bearing | 2,484 | | 1.2 | | 2,059 | | 1.0 | | 1,910 | | 1.6 | |
| Time | 1,016 | | 1.6 | | 450 | | 1.1 | | 321 | | 2.0 | |
| Other | 416 | | 1.7 | | 110 | | 5.5 | | 39 | | 7.0 | |
| |
| | | |
| | | |
| | | |
| Total | 5,639 | | | | 3,872 | | | | 3,281 | | | |
| |
| | | |
| | | |
| | | |
| Rest of Asia-Pacific | | | | | | | | | | | | |
| Demand and other – non-interest bearing | 1,641 | | – | | 1,438 | | – | | 898 | | – | |
| Demand – interest bearing | 1,013 | | 2.3 | | 737 | | 1.8 | | 663 | | 2.4 | |
| Time | 4,410 | | 3.1 | | 3,055 | | 3.6 | | 2,804 | | 4.4 | |
| Other | 1,146 | | 2.7 | | 664 | | 1.7 | | 786 | | 4.6 | |
| |
| | | |
| | | |
| | | |
| Total | 8,210 | | | | 5,894 | | | | 5,151 | | | |
| |
| | | |
| | | |
| | | |
| North America | | | | | | | | | | | | |
| Demand and other – non-interest bearing | 1,943 | | – | | 1,442 | | – | | 1,271 | | – | |
| Demand – interest bearing | 3,098 | | 1.4 | | 3,161 | | 0.7 | | 3,566 | | 1.0 | |
| Time | 2,810 | | 3.7 | | 3,151 | | 2.9 | | 2,205 | | 2.4 | |
| Other | 4,480 | | 1.8 | | 2,526 | | 1.2 | | 3,488 | | 1.7 | |
| |
| | | |
| | | |
| | | |
| Total | 12,331 | | | | 10,280 | | | | 10,530 | | | |
| |
| | | |
| | | |
| | | |
| South America | | | | | | | | | | | | |
| Demand and other – non-interest bearing | 13 | | – | | 17 | | – | | 19 | | – | |
| Demand – interest bearing | 148 | | 6.8 | | 181 | | 8.3 | | 385 | | 29.4 | |
| Time | 238 | | 6.3 | | 273 | | 12.8 | | 296 | | 5.2 | |
| Other | 703 | | 5.7 | | 299 | | 19.1 | | 180 | | 15.0 | |
| |
| | | |
| | | |
| | | |
| Total | 1,102 | | | | 770 | | | | 880 | | | |
| |
| | | |
| | | |
| | | |
| Total | | | | | | | | | | | | |
| Demand and other – non-interest bearing | 20,066 | | – | | 14,045 | | – | | 10,825 | | – | |
| Demand – interest bearing | 15,980 | | 1.5 | | 12,556 | | 2.2 | | 11,806 | | 3.0 | |
| Time | 31,220 | | 2.9 | | 24,806 | | 2.3 | | 24,679 | | 3.0 | |
| Other | 29,629 | | 2.4 | | 17,427 | | 2.6 | | 16,606 | | 2.9 | |
| |
| | | |
| | | |
| | | |
| Total | 96,895 | | | | 68,834 | | | | 63,916 | | | |
| |
| | | |
| | | |
| | | |
180
Back to Contents
| | Year ended 31 December | |
| |
| |
| | 2004 | | 2003 | | 2002 | |
| |
| |
| |
| |
| | Average | | Average | | Average | | Average | | Average | | Average | |
| | balance | | rate | | balance | | rate | | balance | | rate | |
| | US$m | | % | | US$m | | % | | US$m | | % | |
| Customer accounts | | | | | | | | | | | | |
| | | | | | | | | | | | | |
| Europe | | | | | | | | | | | | |
| Demand and other – non-interest bearing | 37,396 | | – | | 30,667 | | – | | 29,109 | | – | |
| Demand – interest bearing | 128,382 | | 2.0 | | 101,189 | | 1.8 | | 77,835 | | 2.0 | |
| Savings | 37,846 | | 2.5 | | 33,876 | | 2.3 | | 23,587 | | 2.9 | |
| Time | 48,314 | | 3.1 | | 41,010 | | 2.8 | | 44,745 | | 3.1 | |
| Other | 15,167 | | 2.2 | | 9,696 | | 3.6 | | 6,621 | | 6.4 | |
| |
| | | |
| | | |
| | | |
| Total | 267,105 | | | | 216,438 | | | | 181,897 | | | |
| |
| | | |
| | | |
| | | |
| Hong Kong | | | | | | | | | | | | |
| Demand and other – non-interest bearing | 13,523 | | – | | 8,829 | | – | | 6,743 | | – | |
| Demand – interest bearing | 94,637 | | 0.1 | | 74,818 | | 0.1 | | 62,922 | | 0.3 | |
| Savings | 46,817 | | 1.0 | | 58,646 | | 0.9 | | 65,914 | | 1.2 | |
| Time | 12,015 | | 1.6 | | 10,101 | | 1.4 | | 8,630 | | 1.9 | |
| Other | 106 | | 4.7 | | 379 | | 1.3 | | 413 | | 1.2 | |
| |
| | | |
| | | |
| | | |
| Total | 167,098 | | | | 152,773 | | | | 144,622 | | | |
| |
| | | |
| | | |
| | | |
| Rest of Asia-Pacific | | | | | | | | | | | | |
| Demand and other – non-interest bearing | 8,592 | | – | | 6,467 | | – | | 4,913 | | – | |
| Demand – interest bearing | 24,480 | | 1.2 | | 18,483 | | 1.1 | | 13,903 | | 1.3 | |
| Savings | 27,171 | | 2.9 | | 25,685 | | 2.7 | | 23,711 | | 3.1 | |
| Time | 7,597 | | 2.1 | | 6,105 | | 1.6 | | 5,508 | | 2.0 | |
| Other | 2,866 | | 1.2 | | 2,304 | | 1.2 | | 1,338 | | 2.3 | |
| |
| | | |
| | | |
| | | |
| Total | 70,706 | | | | 59,044 | | | | 49,373 | | | |
| |
| | | |
| | | |
| | | |
| North America | | | | | | | | | | | | |
| Demand and other – non-interest bearing | 21,409 | | – | | 21,364 | | – | | 14,412 | | – | |
| Demand – interest bearing | 16,394 | | 1.0 | | 11,648 | | 1.3 | | 7,088 | | 1.7 | |
| Savings | 52,485 | | 1.3 | | 48,295 | | 1.2 | | 44,913 | | 1.4 | |
| Time | 13,856 | | 2.4 | | 6,652 | | 3.3 | | 6,266 | | 4.9 | |
| Other | 16,988 | | 2.7 | | 11,672 | | 3.3 | | 10,219 | | 2.3 | |
| |
| | | |
| | | |
| | | |
| Total | 121,132 | | | | 99,631 | | | | 82,898 | | | |
| |
| | | |
| | | |
| | | |
| South America | | | | | | | | | | | | |
| Demand and other – non-interest bearing | 1,428 | | – | | 1,192 | | – | | 1,038 | | – | |
| Demand – interest bearing | 308 | | 1.6 | | 207 | | 1.9 | | 606 | | 21.7 | |
| Savings | 5,976 | | 13.5 | | 4,271 | | 18.1 | | 3,438 | | 17.1 | |
| Time | 269 | | 0.4 | | 157 | | – | | 11 | | 4.2 | |
| Other | 411 | | 16.3 | | 246 | | 18.3 | | 255 | | 4.8 | |
| |
| | | |
| | | |
| | | |
| Total | 8,392 | | | | 6,073 | | | | 5,348 | | | |
| |
| | | |
| | | |
| | | |
| Total | | | | | | | | | | | | |
| Demand and other – non-interest bearing | 82,348 | | – | | 68,519 | | – | | 56,215 | | – | |
| Demand – interest bearing | 264,201 | | 1.2 | | 206,345 | | 1.1 | | 162,354 | | 1.4 | |
| Savings | 170,295 | | 2.2 | | 170,773 | | 2.0 | | 161,563 | | 2.1 | |
| Time | 82,051 | | 2.6 | | 64,025 | | 2.5 | | 65,160 | | 3.0 | |
| Other | 35,538 | | 2.5 | | 24,297 | | 3.3 | | 18,846 | | 3.8 | |
| |
| | | |
| | | |
| | | |
| Total | 634,433 | | | | 533,959 | | | | 464,138 | | | |
| |
| | | |
| | | |
| | | |
| | | | | | | | | | | | | |
| CDs and other money market instruments | | | | | | | | | | | | |
| Europe | 22,359 | | 2.9 | | 11,156 | | 2.8 | | 6,958 | | 4.1 | |
| Hong Kong | 10,830 | | 3.5 | | 9,656 | | 3.6 | | 7,546 | | 4.0 | |
| Rest of Asia-Pacific | 6,733 | | 4.4 | | 4,906 | | 4.1 | | 2,418 | | 4.3 | |
| North America | 20,790 | | 2.1 | | 14,309 | | 2.4 | | 4,838 | | 3.0 | |
| South America | 102 | | 14.7 | | 63 | | 19.0 | | 165 | | 13.8 | |
| |
| |
| |
| |
| |
| |
| |
| Total | 60,814 | | 2.9 | | 40,090 | | 3.0 | | 21,925 | | 3.9 | |
| |
| |
| |
| |
| |
| |
| |
181
Back to Contents
H S B C H O L D I N G S P L C
Other information(continued)
| Certificates of deposit and other time deposits |
|
At 31 December 2004, the maturity analysis of certificates of deposit and other wholesale time deposits, by remaining maturity, was as follows:
| | | | After 3 months | | After 6 months | | | | | |
| | 3 months | | but within | | but within | | After | | | |
| | or less | | 6 months | | 12 months | | 12 months | | Total | |
| | US$m | | US$m | | US$m | | US$m | | US$m | |
| Europe | | | | | | | | | | |
| Certificates of deposit | 20,645 | | 3,722 | | 200 | | 1 | | 24,568 | |
| Time deposits: | | | | | | | | | | |
| – banks | 20,769 | | 4,279 | | 609 | | 1,805 | | 27,462 | |
| – customers | 49,633 | | 2,995 | | 1,305 | | 3,863 | | 57,796 | |
| |
| |
| |
| |
| |
| |
| Total | 91,047 | | 10,996 | | 2,114 | | 5,669 | | 109,826 | |
| |
| |
| |
| |
| |
| |
| Hong Kong | | | | | | | | | | |
| Certificates of deposit | 228 | | 495 | | 1,505 | | 9,293 | | 11,521 | |
| Time deposits: | | | | | | | | | | |
| – banks | 1,061 | | 17 | | 2 | | 28 | | 1,108 | |
| – customers | 10,164 | | 477 | | 262 | | 1,998 | | 12,901 | |
| |
| |
| |
| |
| |
| |
| Total | 11,453 | | 989 | | 1,769 | | 11,319 | | 25,530 | |
| |
| |
| |
| |
| |
| |
| Rest of Asia-Pacific | | | | | | | | | | |
| Certificates of deposit | 5,405 | | 1,042 | | 273 | | 48 | | 6,768 | |
| Time deposits: | | | | | | | | | | |
| – banks | 4,065 | | 228 | | 442 | | 72 | | 4,807 | |
| – customers | 7,094 | | 1,020 | | 95 | | 712 | | 8,921 | |
| |
| |
| |
| |
| |
| |
| Total | 16,564 | | 2,290 | | 810 | | 832 | | 20,496 | |
| |
| |
| |
| |
| |
| |
| North America | | | | | | | | | | |
| Certificates of deposit | 3,754 | | 40 | | 13 | | – | | 3,807 | |
| Time deposits: | | | | | | | | | | |
| – banks | 2,383 | | 215 | | 164 | | 228 | | 2,990 | |
| – customers | 11,707 | | 2,871 | | 149 | | 4,717 | | 19,444 | |
| |
| |
| |
| |
| |
| |
| Total | 17,844 | | 3,126 | | 326 | | 4,945 | | 26,241 | |
| |
| |
| |
| |
| |
| |
| South America | | | | | | | | | | |
| Certificates of deposit | – | | – | | – | | – | | – | |
| Time deposits: | | | | | | | | | | |
| – banks | 113 | | 53 | | 48 | | 27 | | 241 | |
| – customers | 151 | | 6 | | 2 | | 1 | | 160 | |
| |
| |
| |
| |
| |
| |
| Total | 264 | | 59 | | 50 | | 28 | | 401 | |
| |
| |
| |
| |
| |
| |
| Total | | | | | | | | | | |
| Certificates of deposit | 30,032 | | 5,299 | | 1,991 | | 9,342 | | 46,664 | |
| Time deposits: | | | | | | | | | | |
| – banks | 28,391 | | 4,792 | | 1,265 | | 2,160 | | 36,608 | |
| – customers | 78,749 | | 7,369 | | 1,813 | | 11,291 | | 99,222 | |
| |
| |
| |
| |
| |
| |
| Total | 137,172 | | 17,460 | | 5,069 | | 22,793 | | 182,494 | |
| |
| |
| |
| |
| |
| |
The geographical analysis of deposits is based on the location of the office in which the deposits are recorded and excludes balances with HSBC companies. The majority of certificates of deposit and time deposits are in amounts of US$100,000 and over or the equivalent in other currencies.
182
Back to Contentss
HSBC includes short-term borrowings within customer accounts, deposits by banks and debt securities in issue and does not show short-term borrowings separately on the balance sheet. Short-term borrowings are defined by the SEC as Federal funds purchased and securities sold under agreements to repurchase, commercial paper and other short-term borrowings. HSBC’s only significant short-term borrowings are securities sold under agreements to repurchase and certain debt securities in issue. Additional information on these is provided in the tables below.
| | Year ended 31 December | |
| |
| |
| | 2004 | | 2003 | | 2002 | |
| Securities sold under agreements to repurchase | US$m | | US$m | | US$m | |
| | | | | | | |
| Outstanding at 31 December | 43,726 | | 27,427 | | 21,397 | |
| Average amount outstanding during the year | 46,229 | | 25,883 | | 21,089 | |
| Maximum quarter-end balance outstanding during the year | 53,188 | | 30,938 | | 21,468 | |
| Weighted average interest rate during the year | 2.7% | | 2.0% | | 4.0% | |
| Weighted average interest rate at the year-end | 2.9% | | 1.9% | | 3.9% | |
| | | | | | | |
| | | |
| | Year ended 31 December | |
| |
| |
| | 2004 | | 2003 | | 2002 | |
| Short term bonds | US$m | | US$m | | US$m | |
| | | | | | | |
| Outstanding at 31 December | 34,987 | | 29,979 | | 2,775 | |
| Average amount outstanding during the year | 28,758 | | 17,445 | | 3,093 | |
| Maximum quarter-end balance outstanding during the year | 34,987 | | 29,979 | | 4,422 | |
| Weighted average interest rate during the year | 2.9% | | 2.5% | | 4.3% | |
| Weighted average interest rate at the year-end | 2.5% | | 2.5% | | 4.7% | |
| Off-balance sheet arrangements |
|
HSBC enters into certain off-balance sheet arrangements with customers in the ordinary course of business, as described below.
| (i) | Financial guarantees, letters of credit and similar undertakings |
| | |
| Note 38(a) of the ‘Notes on the Financial Statements’ on page 306 describes various types of guarantees and discloses the maximum potential future payments under such arrangements. Credit risk associated with all forms of guarantees is assessed in the same manner as for on-balance sheet credit advances and, where necessary, provisions for assessed impairment are included in ‘provisions for contingent liabilities and commitments’. |
| | |
| (ii) | Commitments to lend |
| | |
| Undrawn credit lines are disclosed in Note 38(a) of the ‘Notes on Financial Statements’ on page 306. The majority by value of undrawn credit lines arises from ‘open to buy’ lines on personal credit cards, whereby cheques are issued to potential customers offering them a pre-approved loan, advised overdraft limits, and mortgage offers awaiting customer acceptance. HSBC generally has the right to change or terminate any conditions of a personal customer’s overdraft, credit card or other credit line upon notification to the customer. In respect of corporate commitments to lend, in most contracts HSBC’s position will be protected through restrictions on access to funding in the event of material adverse change. |
| | |
| (iii) | Credit derivatives |
| | |
| | HSBC uses credit derivatives through the dealing operations of certain Group companies, acting as a principal counterparty to a broad range of users, structuring deals to produce risk management products for its customers, or making markets in certain products. Risk is typically controlled through entering into an offsetting credit derivative contract with another counterparty. HSBC also manages its own exposure to industry segments and individual counterparties using credit derivatives. For a more detailed description of credit derivatives and information regarding their carrying amounts in 2004 and 2003, refer to Note 37(a) of the ‘Notes on Financial Statements’ on page 299. |
| | |
183
Back to Contents
H S B C H O L D I N G S P L C
Other information(continued)
| (iv) | Special purpose and variable interest entities |
| | |
| | HSBC predominantly uses special purpose entities (‘SPEs’), or variable interest entities (‘VIEs’), to securitise loans and advances it has originated where this source of funding is cost effective. Such loans and advances generally remain on-balance sheet under UK GAAP. |
| | |
| | HSBC also administers SPEs that have been established for the purpose of providing alternative sources of financing to HSBC’s customers. Such arrangements also enable HSBC to provide tailored investment opportunities for investors. These SPEs, commonly referred to as asset-backed or multi-seller conduits, purchase interests in a diversified pool of receivables from customers or in the market using finance provided by a third party. The cash flows received by the SPE on the pool of receivables are used to service the finance provided by investors. HSBC administers this arrangement, which facilitates diversification of funding sources and the tranching of credit risk. HSBC also typically provides part of the liquidity facilities to the entities, together with secondary credit enhancement. |
| | |
| | HSBC also has relationships with SPEs which offer management of investment funds, provide finance to public and private sector infrastructure projects, and facilitate capital funding through the issue of preference shares via partnerships. |
| | |
| | All SPEs used by HSBC are authorised centrally to ensure appropriate purpose and governance, and the activities of SPEs administered by HSBC are closely monitored by senior management. The use of SPEs is not a significant part of HSBC’s activities and HSBC is not reliant on the use of SPEs for any material part of its business operations. For a further discussion of HSBC’s involvement with VIEs and the accounting treatments under UK and US GAAP see Note 49(p) of the ‘Notes on the Financial Statements’ on page 351. |
| | |
| | |
The table below provides details of HSBC’s material contractual obligations as at 31 December 2004.
| | Payments due by period | |
| |
| |
| | | | Less than | | | | More than | |
| | Total | | 1 year | | 1–5 years | | 5 years | |
| | US$m | | US$m | | US$m | | US$m | |
| | | | | | | | | |
| Long-term debt obligations | 231,393 | | 100,190 | | 88,294 | | 42,909 | |
| Capital (finance) lease obligations | 695 | | 25 | | 40 | | 630 | |
| Operating lease obligations | 3,187 | | 638 | | 1,450 | | 1,099 | |
| Purchase obligations | 1,212 | | 717 | | 495 | | – | |
| Short positions in debt securities | 39,882 | | 39,882 | | – | | – | |
| |
| |
| |
| |
| |
| Total | 276,369 | | 141,452 | | 90,279 | | 44,638 | |
| |
| |
| |
| |
| |
The Group Chairman and Group Finance Director, with the assistance of other members of management, carried out an evaluation of the effectiveness of the design and operation of HSBC Holdings’ disclosure controls and procedures as of 31 December 2004. Based upon that evaluation, the Group Chairman and Group Finance Director concluded that HSBC’s disclosure controls and procedures as of 31 December 2004 were effective to provide reasonable assurance that information required to be disclosed in the reports which the company files and submits under the US Securities Exchange Act of 1934, as amended, is recorded, processed, summarised and reported as and when required. There are inherent limitations to the effectiveness of any system of disclosure controls and procedures, including the possibility of human error and the circumvention or overriding of the controls and procedures. Accordingly, even effective disclosure controls and procedures can only provide reasonable assurance of achieving their control objectives.
In making that evaluation, the Group Chairman and Group Finance Director took into account the fact that the management of HSBC Finance Corporation had concluded that there had been a material weakness in HSBC Finance Corporation’s internal controls over financial reporting under US GAAP relating to the documentation of hedge accounting under Statement of Financial Accounting Standard No. 133, ‘Accounting for Derivative Instruments and Hedging Activities’, (‘SFAS 133’) which had come to light late in 2004 as part of HSBC Finance Corporation’s preparation for the transition from UK GAAP to International Financial Reporting Standards in 2005. This weakness related to deficiencies in documentation designed to re-establish hedge accounting following the acquisition of HSBC Finance Corporation by HSBC and not from the original or economic management of this hedging activity. HSBC
184
Back to Contents
Finance Corporation is taking a number of immediate remedial actions to address these weaknesses and the accounting function has already been strengthened. HSBC Holdings, the Group Chairman and Group Finance Director do not believe that the weaknesses identified by HSBC Finance Corporation management are material to the Group's overall disclosure controls and procedures or evaluation of their effectiveness.
There has been no change in HSBC Holdings’ internal control over financial reporting during the year ended 31 December 2004 that has materially affected, or is reasonably likely to materially affect, HSBC Holdings’ internal control over financial reporting.
185
Back to Contents
H S B C H O L D I N G S P L C
Board of Directors and Senior Management
| | |
| | Sir John Bond, Group Chairman |
| | |
| | Age 63. An executive Director since 1990; Group Chief Executive from 1993 to 1998. Joined HSBC in 1961; a non-executive Director of The Hongkong and Shanghai Banking Corporation Limited, having been an executive Director from 1988 to 1992. A Director of HSBC Bank plc from 1993 to 1997 and Chairman from 1998 to 2004. A non-executive director of Ford Motor Company and of Vodafone Group Plc. |
| |
| * | The Baroness Dunn, DBE, Deputy Chairman and senior non-executive Director |
| | |
| | Age 64. An executive Director of John Swire & Sons Limited and a Director of Swire Pacific Limited. A non-executive Director since 1990 and a non-executive Deputy Chairman since 1992. A member of the Nomination Committee. A non-executive Director of The Hongkong and Shanghai Banking Corporation Limited from 1981 to 1996. A former non-executive Director of Marconi p.l.c. and a former Senior Member of the Hong Kong Executive Council and Legislative Council. |
| | |
| † | Sir Brian Moffat, OBE, Deputy Chairman and senior independent non-executive Director |
| | |
| | Age 66. Former Chairman of Corus Group plc. A non-executive Director since 1998 and a non-executive Deputy Chairman since 2001. Chairman of the Group Audit Committee and of the Nomination Committee. A member of the Court of the Bank of England. A non-executive Director of Macsteel Global BV. |
| | |
| | S K Green, Group Chief Executive |
| | |
| | Age 56. An executive Director since 1998. Executive Director, Corporate, Investment Banking and Markets from 1998 to 2003. Joined HSBC in 1982. Group Treasurer from 1992 to 1998. Chairman of HSBC Bank plc, HSBC Bank Middle East Limited and HSBC Private Banking Holdings (Suisse) S.A. A Director of The Bank of Bermuda Limited, CCF S.A., The Hongkong and Shanghai Banking Corporation Limited, Grupo Financiero HSBC, S.A. de C.V., HSBC North America Holdings Inc. and HSBC Trinkaus & Burkhardt KGaA. |
| | |
| | A W Jebson, Group Chief Operating Officer |
| | |
| | Age 55. An executive Director since 2000. Group IT Director from 2000 to 2003. Group General Manager, Information Technology from 1996 to 2000. Joined HSBC in 1978. A Director of HSBC Finance Corporation. |
| | W F Aldinger, Chairman and Chief Executive Officer, HSBC North America Holdings Inc. |
| | |
| | Age 57. An executive Director since 2003. Joined HSBC Finance Corporation in 1994. Chairman and Chief Executive Officer of HSBC Finance Corporation. Chairman, President and Chief Executive Officer of HSBC North America Inc. Chairman of HSBC Bank USA, N.A. and HSBC USA Inc. A non-executive Director of MasterCard International, Inc., Illinois Tool Works, Inc., AT&T Corp., and the combined board of the Children’s Memorial Medical Center/Children’s Memorial Hospital and the Children’s Memorial Foundation. Former Vice Chairman of Wells Fargo Bank. |
| | |
| † | The Rt Hon the Lord Butler of Brockwell,
KG, GCB, CVO |
| | |
| | Age 67. Master, University College, Oxford. A non-executive Director since 1998. Chairman of the Corporate Social Responsibility Committee, a member of the Nomination Committee and Chairman of the HSBC Education Trust. A non-executive Director of Imperial Chemical Industries plc. Chaired the UK Government Review of Intelligence on Weapons of Mass Destruction. Secretary of the Cabinet and Head of the Home Civil Service in the United Kingdom from 1988 to 1998. |
| | |
| † | R K F Ch’ien, CBE |
| | |
| | Age 53. Executive Chairman of chinadotcom corporation and Chairman of its subsidiary, hongkong.com Corporation. A non-executive Director since 1998. A member of the Group Audit Committee. Non-executive Chairman of HSBC Private Equity (Asia) Limited, and a non-executive Director of The Hongkong and Shanghai Banking Corporation Limited since 1997. Non-executive Chairman of MTR Corporation Limited and a non-executive Director of Convenience Retail Asia Limited, Inchcape plc, VTech Holdings Limited and The Wharf (Holdings) Limited. |
| | |
| † | J D Coombe |
| | |
| | Age 59. Executive Director and Chief Financial Officer of GlaxoSmithKline plc, from which he will retire on 31 March 2005. Appointed a non-executive Director with effect from 1 March 2005 and a member of the Group Audit Committee with effect from 1 July 2005. A non-executive Director of the Supervisory Board of Siemens AG and appointed a non-executive Director of GUS plc with effect from 1 April 2005. A member of The Code Committee of the Panel on Takeovers and Mergers. A former Chairman of The Hundred Group of Finance Directors and a former member of the Accounting Standards Board. |
186
Back to Contents
| | D G Eldon, Chairman, The Hongkong and Shanghai Banking Corporation Limited |
| | |
| | Age 59. An executive Director since 1999. Joined HSBC in 1968. Appointed an executive Director of The Hongkong and Shanghai Banking Corporation Limited in 1994, Chief Executive Officer in 1996 and Chairman in 1999. Non-executive Chairman of Hang Seng Bank Limited and a non-executive Director of Swire Pacific Limited and MTR Corporation Limited. |
| | |
| † | R A Fairhead |
| | |
| | Age 43. Finance Director of Pearson plc. A non-executive Director since 1 March 2004. A member of the Group Audit Committee. Former Executive Vice President, Strategy and Group Control of Imperial Chemical Industries plc. |
| | |
| | D J Flint, Group Finance Director |
| | |
| | Age 49. Joined HSBC as an executive Director in 1995. Director of HSBC Bank Malaysia Berhad. A non-executive Director of BP p.l.c. Chairman of the Financial Reporting Council’s review of the Turnbull Guidance on Internal Control. Served on the Accounting Standards Board and the Standards Advisory Council of the International Accounting Standards Board from 2001 to 2004. A former partner in KPMG. |
| | |
| † | W K L Fung, OBE |
| | |
| | Age 56. Group Managing Director of Li & Fung Limited. A non-executive Director since 1998. A member of the Remuneration Committee and of the Corporate Social Responsibility Committee. A non-executive Director of The Hongkong and Shanghai Banking Corporation Limited since 1995. Former Chairman of the Hong Kong General Chamber of Commerce, the Hong Kong Exporters’ Association and the Hong Kong Committee for the Pacific Economic Co-operation Council. |
| | |
| | |
| | M F Geoghegan, CBE, Chief Executive, HSBC Bank plc |
| | |
| | Age 51. An executive Director since 1 March 2004. Joined HSBC in 1973. Appointed a Director and Chief Executive of HSBC Bank plc in January 2004. A Director of CCF S.A. and HSBC Private Banking Holdings (Suisse) S.A. President of HSBC Bank Brasil S.A. - Banco Múltiplo from 1997 to 2003 and responsible for all of HSBC’s business throughout South America from 2000 to 2003. A non-executive Director and Chairman of Young Enterprise. |
| † | S Hintze |
| | |
| | Age 60. Former Chief Operating Officer of Barilla S.P.A. A non-executive Director since 2001. A member of the Corporate Social Responsibility Committee and of the Remuneration Committee. A non-executive Director of Premier Foods plc and the Society of Genealogists, a registered charity. A former Senior Vice President of Nestlé S.A. With Mars Incorporated from 1972 to 1993, latterly as Executive Vice President of M&M/Mars in New Jersey. A former non-executive Director of Safeway plc. |
| | |
| † | J W J Hughes-Hallett |
| | |
| | Age 55. Chairman of John Swire & Sons Limited. Appointed a non-executive Director with effect from 1 March 2005. A non-executive Director of The Hongkong and Shanghai Banking Corporation Limited from 1999 to 2004. A non-executive Director and formerly Chairman of Cathay Pacific Airways Limited and Swire Pacific Limited. |
| | |
| † | Sir John Kemp-Welch |
| | |
| | Age 68. Former Joint Senior Partner of Cazenove & Co and former Chairman of the London Stock Exchange. A non-executive Director since 2000. A member of the Remuneration Committee and of the Group Audit Committee. A Deputy Chairman of the Financial Reporting Council and a member of the Panel on Takeovers and Mergers from 1994 to 2000. |
| | |
| † | Sir Mark Moody-Stuart, KCMG |
| | |
| | Age 64. Chairman of Anglo American plc. A non-executive Director since 2001. Chairman of the Remuneration Committee. A Director and former Chairman of The ‘Shell’ Transport and Trading Company, plc and former Chairman of the Committee of Managing Directors of the Royal Dutch/Shell Group of Companies. A non-executive Director of Accenture Limited, a Governor of Nuffield Hospitals, President of the Liverpool School of Tropical Medicine and Chairman of the Global Business Coalition on HIV/AIDS. |
| | |
| † | S W Newton |
| | |
| | Age 63. Chairman of The Real Return Holdings Company Limited. A non-executive Director since 2002. A Member of the Advisory Board of the East Asia Institute at Cambridge University. Founder of Newton Investment Management, from which he retired in 2002. |
187
Back to Contents
H S B C H O L D I N G S P L C
Board of Directors and Senior Management(continued)
| * | H Sohmen, OBE |
| | |
| | Age 65. Chairman and President of World-Wide Shipping Group Limited and Chairman of Bergesen d.y. ASA and Bergesen Worldwide Limited. A non-executive Director since 1990. A non-executive Director of The Hongkong and Shanghai Banking Corporation Limited since 1984 and Deputy Chairman since 1996. |
| | |
| † | C S Taylor |
| | |
| | Age 59. Chair of Canadian Broadcasting Corporation. A non-executive Director since 2002. A member of the Corporate Social Responsibility Committee. Appointed a non-executive Director of HSBC North America Holdings Inc. with effect from 1 March 2005. A former non-executive Director of HSBC Bank Canada, HSBC Bank USA, N.A. and HSBC USA Inc. A non-executive Director of Fairmont Hotels and Resorts from 2001 to February 2005. Chair of Vancouver Board of Trade from 2001 to 2002. |
| | |
| † | Sir Brian Williamson, CBE |
| | |
| | Age 60. Chairman of Electra Investment Trust plc and Resolution Life Group Limited. A non-executive Director since 2002. A member of the Nomination Committee. A member of the Supervisory Board of Euronext NV. Senior adviser to Fleming Family and Partners. Former Chairman of London International Financial Futures and Options Exchange and Gerrard Group plc. A former non-executive Director of the Financial Services Authority and of the Court of The Bank of Ireland. |
| | | |
| | * | Non-executive Director |
| | † | Independent non-executive Director |
| | | |
| | Adviser to the Board |
| |
|
| | | |
| | D J Shaw |
| | | |
| | Age 58. An Adviser to the Board since 1998. Solicitor. A partner in Norton Rose from 1973 to 1998. A Director of The Bank of Bermuda Limited and HSBC Private Banking Holdings (Suisse) S.A. |
| | | |
| | Secretary |
| |
|
| | | |
| | R G Barber |
| | | |
| | Age 54. Group Company Secretary since 1990. Joined HSBC in 1980; Corporation Secretary of The Hongkong and Shanghai Banking Corporation Limited from 1986 to 1992. Company Secretary of HSBC Bank plc from 1994 to 1996. |
| | Group Managing Directors |
| |
|
| | |
| | C-H Filippi |
| | |
| | Age 52. A Group Managing Director and Chairman and Chief Executive Officer of CCF S.A. since 1 March 2004. A Director of HSBC Bank plc. Joined CCF S.A. in 1987 having previously held senior appointments in the French civil service. Appointed a Group General Manager in 2001 as Global Head of Corporate and Institutional Banking. |
| | |
| | S T Gulliver |
| | |
| | Age 45. A Group Managing Director since 1 March 2004. Co-Head Corporate, Investment Banking and Markets since 2003. Joined HSBC in 1980. Appointed a Group General Manager in 2000. Head of Treasury and Capital Markets in Asia-Pacific from 1996 to 2002 and Head of Global Markets from 2002 to 2003. |
| | |
| | Y A Nasr |
| | |
| | Age 50. A Group Managing Director since 1 March 2004. President, HSBC Bank Brasil S.A. -Banco Múltiplo since 2003. Joined HSBC in 1976. Appointed a Group General Manager in 1998. President and Chief Executive Officer of HSBC USA Inc. and HSBC Bank USA from 1999 to 2003. President and Chief Executive Officer of HSBC Bank Canada from 1997 to 1999. |
| | |
| | J J Studzinski |
| | |
| | Age 48. A Group Managing Director since 1 March 2004. Co-Head Corporate, Investment Banking and Markets since 2003. Joined HSBC in 2003 having previously been with Morgan Stanley from 1980 to 2003, most recently as Deputy Chairman of Morgan Stanley International. Appointed a Group General Manager in 2003. |
| | |
| | Group General Managers |
| |
|
| | |
| | R J Arena |
| | |
| | Age 56. Group General Manager, Global e-business. Joined HSBC in 1999. Appointed a Group General Manager in 2000. |
| | |
| | C C R Bannister |
| | |
| | Age 46. Chief Executive Officer, Group Private Banking. Joined HSBC in 1994. Appointed a Group General Manager in 2001. |
188
Back to Contents
R E T Bennett
Age 53. Group General Manager, Legal and Compliance. Joined HSBC in 1979. Appointed a Group General Manager in 1998.
N S K Booker
Age 46. Group General Manager and Chief Executive Officer, India. Joined HSBC in 1981. Appointed a Group General Manager in January 2004.
G P S Calvert,OBE
Age 52. Group General Manager and Managing Director, The Saudi British Bank. Joined HSBC in 1974. Appointed a Group General Manager in June 2004.
Z J Cama
Age 57. Deputy Chairman and Chief Executive Officer, HSBC Bank Malaysia Berhad. Joined HSBC in 1968. Appointed a Group General Manager in 2001.
V H C Cheng,OBE
Age 56. Executive Director and Chairman designate, The Hongkong and Shanghai Banking Corporation Limited and Chief Executive Officer, Hang Seng Bank Limited. Joined HSBC in 1978. Appointed a Group General Manager in 1995.
A A Flockhart
Age 53. Group General Manager, Chief Executive Officer and Chairman, Grupo Financiero HSBC, S.A. de C.V. and HSBC Mexico, S.A. Joined HSBC in 1971. Appointed a Group General Manager in 2002.
M J G Glynn
Age 53. Group General Manager, President and Chief Executive Officer, HSBC Bank USA, N.A. Joined HSBC in 1982. Appointed a Group General Manager in 2001.
K M Harvey
Age 44. Group General Manager and Group Chief Information Officer. Joined HSBC Finance Corporation in 1989. Appointed a Group General Manager in August 2004.
D H Hodgkinson
Age 54. Group General Manager, Chief Executive Officer and Deputy Chairman, HSBC Bank Middle East Limited. Joined HSBC in 1969. Appointed a Group General Manager in 2003.
A P Hope
Age 58. Group General Manager, Insurance. Joined HSBC in 1971. Appointed a Group General Manager in 1996.
D D J John
Age 54. Chief Operating Officer and Director, HSBC Bank plc. Joined HSBC Bank plc in 1971. Appointed a Group General Manager in 2000.
M J W King
Age 48. Group General Manager, Internal Audit. Joined HSBC in 1986. Appointed a Group General Manager in 2002.
R C F Or
Age 55. Executive Director, The Hongkong and Shanghai Banking Corporation Limited. Joined HSBC in 1972. Appointed a Group General Manager in 2000.
K Patel
Age 56. Group General Manager and Head of Corporate, Investment Banking and Markets, Emerging Europe & Africa. Joined HSBC in 1984. Appointed a Group General Manager in 2000.
R C Picot
Age 47. Group Chief Accounting Officer. Joined HSBC in 1993. Appointed a Group General Manager in 2003.
J C S Rankin
Age 63. Group General Manager, Human Resources. Joined HSBC in 1960. Appointed a Group General Manager in 1990.
B Robertson
Age 50. Group General Manager, Credit and Risk. Joined HSBC in 1975. Appointed a Group General Manager in 2003.
189
Back to Contents
H S B C H O L D I N G S P L C
Board of Directors and Senior Management (continued)
M R P Smith, OBE
Age 48. President and Chief Executive Officer, The Hongkong and Shanghai Banking Corporation Limited. Joined HSBC in 1978. Appointed a Group General Manager in 2000.
I A Stewart
Age 46. Group General Manager and Head of Transaction Banking, Corporate, Investment Banking and Markets. Joined HSBC in 1980. Appointed a Group General Manager in 2000.
P E Stringham
Age 55. Group General Manager, Marketing. Joined HSBC in 2001. Appointed a Group General Manager in 2001.
P A Thurston
Age 51. Group General Manager, Personal Financial Services, Asia-Pacific. Joined HSBC in 1975. Appointed a Group General Manager in 2003.
190
Back to Contents
H S B C H O L D I N G S P L C
Report ofthe Directors
Results for 2004
HSBC reported operating profit before provisions of US$22,898 million. Profit attributable to shareholders of HSBC Holdings was US$11,840 million, a 14.4 per cent return on shareholders’ funds. The retained profit transferred to reserves was US$4,539 million.
First, second and third interim dividends, each of US$0.13 per ordinary share, were paid on 7 July 2004, 6 October 2004 and 20 January 2005 respectively. The Directors have declared a fourth interim dividend of US$0.27 per ordinary share in lieu of a final dividend, making a total distribution for the year of US$7,301 million. The fourth interim dividend will be payable on 4 May 2005 in cash in United States dollars, or in sterling or Hong Kong dollars at exchange rates to be determined on 25 April 2005, with a scrip dividend alternative. The reserves available for distribution before accounting for the third and fourth interim dividends of US$1,444 million and US$2,996 million respectively are US$10,927 million.
Further information about the results is given in the consolidated profit and loss account on page 237.
Principal activities and business review
Through its subsidiary and associated undertakings, HSBC provides a comprehensive range of banking and related financial services. HSBC operates through long-established businesses and has an international network of over 9,800 offices in 77 countries and territories in Europe; the Asia-Pacific region, the Americas, the Middle East and Africa and serves over 110 million customers. Taken together, the five largest customers of HSBC do not account for more than one per cent of HSBC’s income.
In February 2004, The Bank of Bermuda Limited was acquired for US$1,224 million.
In April 2004, 15.98 per cent of Industrial Bank Co. Limited was acquired by Hang Seng Bank Limited for US$209 million.
In May 2004, 100 per cent of Intesa Bank Canada was acquired for US$88 million.
In June 2004, 14.62 per cent of UTI Bank Limited was acquired for US$68 million.
In August 2004, 19.9 per cent of Bank of Communications Limited was acquired for US$1,747 million.
In November 2004, 100 per cent of Marks and Spencer Retail Financial Services Holdings Limited was acquired for US$1,044 million.
A review of the development of the business of HSBC undertakings during the year and an indication of likely future developments are given in the 'Description of Business' on pages 10 and 11.
Capital and reserves
The following events in relation to the HSBC Holdings ordinary shares of US$0.50 each occurred during the year:
Scrip dividends
| 1. | 35,092,117 ordinary shares were issued at par on 20 January 2004 to shareholders who elected to receive new shares in lieu of the 2003 second interim dividend. The market value per share used to calculate shareholders’ entitlements to new shares was US$15.1987, being the United States dollar equivalent of £8.838. |
| | |
2.
| 22,984,421 ordinary shares were issued at par on 5 May 2004 to shareholders who elected to receive new shares in lieu of the 2003 third interim dividend. The market value per share used to calculate shareholders’ entitlements to new shares was US$15.0552, being the United States dollar equivalent of £8.16. |
| | |
3.
| 52,287,747 ordinary shares were issued at par on 7 July 2004 to shareholders who elected to receive new shares in lieu of the 2004 first interim dividend. The market value per share used to calculate shareholders’ entitlements to new shares was US$14.293 being the United States dollar equivalent of £7.926. |
| | |
4.
| 49,677,957 ordinary shares were issued at par on 6 October 2004 to shareholders who elected to receive new shares in lieu of the 2004 second interim dividend. The market value per share used to calculate shareholders’ entitlements to new shares was US$15.0141 being the United States dollar equivalent of £8.307. |
All-Employee share plans
5.
| 28,472,134 ordinary shares were issued at prices ranging from £5.2212 to £6.7536 per share in connection with the exercise of options under the HSBC Holdings savings-related share option plans. Options over 7,675,359 ordinary shares lapsed. |
| | |
6.
| The HSBC Qualifying Employee Share
Ownership Trust (‘the QUEST’) was established in 1999 to satisfy options exercised by UK |
191
Back to Contents
H S B C H O L D I N G S P L C
Report of the Directors(continued)
| | participants of the HSBC Holdings Savings-Related Share Option Plan. At 1 January 2004, the QUEST held 514,293 ordinary shares. During 2004, HSBC QUEST Trustee (UK) Limited, the corporate trustee of the QUEST, transferred 1,592,371 ordinary shares from the QUEST to employees who exercised options under the HSBC Holdings Savings-Related Share Option Plan and subscribed for 1,079,099 ordinary shares at market values ranging from £7.84 to £9.38 using subscription moneys received from those employees. At 31 December 2004, the QUEST held 1,021 ordinary shares. |
| | |
| 7. | 4,216,456 ordinary shares were issued at €9.679 per share in connection with a Plan d’Epargne Entreprise for the benefit of non-UK resident employees of CCF and its subsidiaries. |
| | |
| 8. | Options over 11,154,679 ordinary shares were awarded at nil consideration on 21 April 2004 and options over 13,885,457 ordinary shares were awarded at nil consideration on 10 May 2004 to over 46,000 HSBC employees resident in more than 56 countries and territories under the HSBC Holdings savings-related share option plans. The options are exercisable within six months following the third or fifth anniversary of the commencement of the relevant savings contracts on 1 August 2004 at a price of £6.472 per share, a 20 per cent discount to the average market value over the five business days immediately preceding the date of the invitation. |
Discretionary share incentive plans
| 9. | 14,905,692 ordinary shares were issued at prices ranging from £2.1727 to £7.46 per share in connection with the exercise of options under the HSBC Holdings Executive Share Option Scheme. Options over 812,836 ordinary shares lapsed. |
| | |
| 10. | 1,460,399 ordinary shares were issued at prices ranging from £6.91 to £8.712 per share in connection with the exercise of options under the HSBC Holdings Group Share Option Plan. Options over 5,548,707 ordinary shares lapsed. |
| | |
| 11. | Options over 63,341,879 ordinary shares were awarded at nil consideration on 30 April 2004 under the HSBC Holdings Group Share Option Plan. The options are normally exercisable between the third and 10th anniversaries of the award at a price of £8.283 per share, the market value of the ordinary shares on the date of award. |
| 12. | Options over 340,160 ordinary shares were awarded at nil consideration on 27 August 2004 under the HSBC Holdings Group Share Option Plan. The options are normally exercisable between the third and 10th anniversaries of the award at a price of £8.65 per share, the market value of the ordinary shares on the date of award. |
HSBC Finance Corporation
| 13. | 1,590,319 ordinary shares were issued at US$9.60 in connection with the early settlement of HSBC Finance Corporation 8.875% Adjustable Conversion-Rate Equity Security Units. |
| | |
| 14. | 293,254 ordinary shares were issued at prices ranging from US$14.11 to US$17.28 in connection with the exercise of options under HSBC Finance Corporation share plans that have been converted into options over HSBC Holdings ordinary shares. |
Authority to allot shares
| 15. | At the Annual General Meeting in 2004 shareholders renewed the authority for the Directors to allot new shares. The authority was to allot up to 2,199,800,000 ordinary shares, 10,000,000 non-cumulative preference shares of £0.01 each, 10,000,000 non-cumulative preference shares of US$0.01 each and 10,000,000 non-cumulative preference shares of €0.01 each. |
| | |
| | Other than as described in paragraphs 1. to 14. above, the Directors did not allot any shares during 2004. |
Authority to repurchase shares
| 16. | At the Annual General Meeting in 2004 shareholders renewed the authority for the Company to make market repurchases of up to 1,099,900,000 ordinary shares. The Directors have not exercised this authority. |
| |
| Employee share option plans |
|
| |
| In order to align the interests of staff with those of shareholders, share options are awarded to employees under all-employee share plans and discretionary share incentive plans. The following are particulars of outstanding employee share options, including those held by employees working under employment contracts that are regarded as “continuous contracts” for the purposes of the Hong Kong Employment Ordinance. The options were |
192
Back to Contents
granted at nil consideration. No options have been granted to substantial shareholders, suppliers of goods or services, or in excess of the individual limit for each share plan. No options were cancelled during the year. Under the authority granted by shareholders at the Annual General Meeting in 2000, the maximum number of new HSBC Holdings ordinary shares that may be issued or become issuable under all the share option plans in any ten year period is 848,847,000 HSBC Holdings ordinary shares (approximately 7.6 per cent of HSBC Holdings’ issued ordinary share capital on 28 February 2005). Within this limit not more than 5 per cent of the issued ordinary share capital of HSBC Holdings from time to time may be put under option under the HSBC Holdings Group Share Option Plan and the HSBC Holdings Restricted Share Plan 2000 (approximately 560,000,000 HSBC Holdings ordinary shares on 28 February 2005). Under the HSBC Holdings savings-related share option plans, HSBC Holdings Group Share Option Plan, HSBC Holdings Executive Share Option Scheme and the HSBC Holdings Restricted Share Plan 2000 there were options outstanding over 374,369,127 HSBC Holdings ordinary shares at 31 December 2004. Particulars of options over HSBC Holdings shares held by Directors of HSBC Holdings are set out on pages 229 to 233 of the Directors’ Remuneration Report. Following a comprehensive review of share-based remuneration arrangements in 2004, resolutions relating to employee share plans will be submitted to the forthcoming Annual General Meeting.
All-Employee share plans
The HSBC Holdings Savings-Related Share Option Plan, HSBC Holdings Savings-Related Share Option Plan: Overseas Section, and previously the HSBC Holdings Savings-Related Share Option Scheme: USA Section, are all-employee share plans under which eligible HSBC employees (those with six months continuous service from July to December of the year preceding the date of grant) are granted options to acquire HSBC Holdings ordinary shares. Employees may make overall contributions of up to £250 (or equivalent) each month over a period of three or five years which may be used on the third or fifth anniversary of the commencement of the relevant savings contract, at their election, to exercise the options; alternatively the employee may elect to have the savings (plus interest) repaid in cash. The options are exercisable within six months following the third or fifth anniversary of the commencement of the relevant savings contract. In the case of redund ancy, retirement on grounds of injury or ill health, retirement at or after normal retirement age, the transfer of the employing business to another party, or a change of control of the employing company, options may be exercised before completion of the relevant savings contract. Under the HSBC Holdings Savings-Related Share Option Plan and the HSBC Holdings Savings-Related Share Option Plan: Overseas Section the option exercise price is determined by reference to the average market value of the ordinary shares on the five business days immediately preceding the invitation date, then applying a discount of 20 per cent. The all-employee share plans will terminate on 26 May 2010 unless the Directors resolve to terminate the plans at an earlier date.
HSBC Holdings Savings-Related Share Option Plan
HSBC Holdings ordinary shares of US$0.50
| | | | | | | | Options at | | Options | | Options | | Options | | Options at | |
| Date of | Exercise | | Exercisable | | Exercisable | | 1 January | | awarded | | exercised | | lapsed | | 31 December | |
| award | price (£) | | from | 1 | until | 2 | 2004 | | during year | 3 | during year | 4 | during year | | 2004 | |
| | | | | | | | | | | | | | | | | |
| 6 Apr 1998 | 5.2212 | | 1 Aug 2003 | | 31 Jan 2004 | | 186,165 | | – | | 139,268 | | 46,897 | | – | |
| 1 Apr 1999 | 5.3980 | | 1 Aug 2004 | | 31 Jan 2005 | | 10,598,682 | | – | | 10,251,424 | | 147,716 | | 199,542 | |
| 10 Apr 2000 | 6.0299 | | 1 Aug 2005 | | 31 Jan 2006 | | 11,163,824 | | – | | 448,670 | | 629,718 | | 10,085,436 | |
| 11 Apr 2001 | 6.7536 | | 1 Aug 2004 | | 31 Jan 2005 | | 1,870,853 | | – | | 1,724,173 | | 78,155 | | 68,525 | |
| 11 Apr 2001 | 6.7536 | | 1 Aug 2006 | | 31 Jan 2007 | | 4,171,431 | | – | | 103,513 | | 339,842 | | 3,728,076 | |
| 2 May 2002 | 6.3224 | | 1 Aug 2005 | | 31 Jan 2006 | | 1,741,719 | | – | | 50,624 | | 216,124 | | 1,474,971 | |
| 2 May 2002 | 6.3224 | | 1 Aug 2007 | | 31 Jan 2008 | | 4,636,144 | | – | | 48,693 | | 374,479 | | 4,212,972 | |
| 23 Apr 2003 | 5.3496 | | 1 Aug 2006 | | 31 Jan 2007 | | 9,056,673 | | – | | 101,884 | | 1,076,787 | | 7,878,002 | |
| 23 Apr 2003 | 5.3496 | | 1 Aug 2008 | | 31 Jan 2009 | | 14,074,491 | | – | | 56,157 | | 968,910 | | 13,049,424 | |
| 21 Apr 2004 | 6.4720 | | 1 Aug 2007 | | 31 Jan 2008 | | – | | 4,556,417 | | 2,162 | | 299,055 | | 4,255,200 | |
| 21 Apr 2004 | 6.4720 | | 1 Aug 2009 | | 31 Jan 2010 | | – | | 6,534,250 | | 411 | | 206,641 | | 6,327,198 | |
| | | | | | | | | | | | | | | | | |
| 1 | May be advanced to an earlier date in certain circumstances, e.g. retirement. |
| 2 | May be extended to a later date in certain circumstances, e.g. on the death of a participant the executors may exercise the option up to six months beyond the normal exercise period. |
| 3 | The closing price per share on 20 April 2004, the day before the options were awarded, was £8.29. |
| 4 | The weighted average closing price of the shares immediately before the dates on which options were exercised was £8.37. |
193
Back to Contents
H S B C H O L D I N G S P L C
Report of the Directors(continued)
HSBC Holdings Savings-Related Share Option Plan: Overseas Section
HSBC Holdings ordinary shares of US$0.50
| | | | | | | | Options at | | Options | | Options | | Options | | Options at | |
| Date of | Exercise | | Exercisable | | Exercisable | | 1 January | | awarded | | exercised | | lapsed | | 31 December | |
| award | price (£) | | from | 1 | until | 2 | 2004 | | during year | | during year | 3 | during year | | 2004 | |
| | | | | | | | | | | | | | | | | |
| 6 Apr 1998 | 5.2212 | | 1 Aug 2003 | | 31 Jan 2004 | | 78,234 | | – | | 39,315 | | 38,919 | | – | |
| 1 Apr 1999 | 5.3980 | | 1 Aug 2004 | | 31 Jan 2005 | | 10,942,536 | | – | | 10,673,901 | | 98,247 | | 170,388 | |
| 10 Apr 2000 | 6.0299 | | 1 Aug 2005 | | 31 Jan 2006 | | 16,622,178 | | – | | 273,551 | | 661,486 | | 15,687,141 | |
| 11 Apr 2001 | 6.7536 | | 1 Aug 2004 | | 31 Jan 2005 | | 5,773,078 | | – | | 5,091,195 | | 307,840 | | 374,043 | |
| 11 Apr 2001 | 6.7536 | | 1 Aug 2006 | | 31 Jan 2007 | | 1,459,237 | | – | | 9,233 | | 108,759 | | 1,341,245 | |
| 2 May 2002 | 6.3224 | | 1 Aug 2005 | | 31 Jan 2006 | | 3,393,662 | | – | | 19,040 | | 310,873 | | 3,063,749 | |
| 2 May 2002 | 6.3224 | | 1 Aug 2007 | | 31 Jan 2008 | | 1,224,697 | | – | | 3,949 | | 69,419 | | 1,151,329 | |
| 23 Apr 2003 | 5.3496 | | 1 Aug 2006 | | 31 Jan 2007 | | 10,459 | | – | | – | | – | | 10,459 | |
| 23 Apr 2003 | 5.3496 | | 1 Aug 2008 | | 31 Jan 2009 | | 10,488 | | – | | – | | – | | 10,488 | |
| 8 May 2003 | 5.3496 | | 1 Aug 2006 | | 31 Jan 2007 | | 17,432,578 | | – | | 67,416 | | 980,573 | | 16,384,589 | |
| 8 May 2003 | 5.3496 | | 1 Aug 2008 | | 31 Jan 2009 | | 6,500,298 | | – | | 9,744 | | 224,861 | | 6,265,693 | |
| 21 Apr 2004 | 6.4720 | | 1 Aug 2007 | | 31 Jan 2008 | | – | | 49,524 | 4 | – | | – | | 49,524 | |
| 21 Apr 2004 | 6.4720 | | 1 Aug 2009 | | 31 Jan 2010 | | – | | 14,488 | 4 | – | | – | | 14,488 | |
| 10 May 2004 | 6.4720 | | 1 Aug 2007 | | 31 Jan 2008 | | – | | 10,550,550 | 5 | 3,358 | | 428,360 | | 10,118,832 | |
| 10 May 2004 | 6.4720 | | 1 Aug 2009 | | 31 Jan 2010 | | – | | 3,334,907 | 5 | 605 | | 61,698 | | 3,272,604 | |
| | | | | | | | | | | | | | | | | |
| 1 | May be advanced to an earlier date in certain circumstances, e.g. retirement. |
| 2 | May be extended to a later date in certain circumstances, e.g. on the death of a participant, the executors may exercise the option up to six months beyond the normal exercise period. |
| 3 | The weighted average closing price of the shares immediately before the dates on which options were exercised was £8.11. |
| 4 | The closing price per share on 20 April 2004, the day before the options were awarded, was £8.29. |
| 5 | The closing price per share on 9 May 2004, the day before the options were awarded, was £8.12. |
HSBC Holdings Savings-Related Share Option Scheme: USA Section
HSBC Holdings ordinary shares of US$0.50
| | | | | | | | Options at | | Options | | Options | | Options at | |
| Date of | Exercise | | Exercisable | | Exercisable | | 1 January | | exercised | | lapsed | | 31 December | |
| award | price (£) | | from | 1 | until | 2 | 2004 | | during year | 3 | during year | | 2004 | |
| | | | | | | | | | | | | | | |
| 10 Aug 1999 | 6.3078 | | 1 Jul 2004 | | 31 Dec 2004 | | 1,477,642 | | 949,150 | | – | | 528,492 | |
| | | | | | | | | | | | | | | |
| 1 | May be advanced to an earlier date in certain circumstances, e.g. retirement. |
| 2 | May be extended to a later date in certain circumstances, e.g. on the death of a participant, the executors may exercise the option up to six months beyond the normal exercise period. |
| 3 | The weighted average closing price of the shares immediately before the dates on which options were exercised was £8.33. |
No options were granted during the period.
Discretionary share incentive plans
The HSBC Holdings Group Share Option Plan, and previously the HSBC Holdings Executive Share Option Scheme, are discretionary share incentive plans under which HSBC employees, based on performance criteria and potential, are granted options to acquire HSBC Holdings ordinary shares. Since 1996 the vesting of these awards has been subject to the attainment of pre-determined performance criteria, except within CCF (which was acquired in 2000) where performance criteria are being phased in. The maximum value of options which may be granted to an employee in any one year (together with any Performance Share awards under the HSBC Holdings Restricted Share Plan 2000) is 150 per cent of the employee’s annual salary at the date of grant plus any bonus paid for the previous year. In exceptional circumstances this could be raised to 225 per cent. Subject to
achievement of the performance condition, options are generally exercisable between the third and tenth anniversary of the date of grant. Employees of a subsidiary that is sold or transferred out of HSBC may exercise options awarded under the HSBC Holdings Group Share Option Plan within six months of the sale or transfer regardless of whether the performance condition is met.
The terms of the HSBC Holdings Group Share Option Plan were amended in 2001 so that the exercise price of options granted under the Plan in 2002 and beyond would be the higher of the average market value of the ordinary shares on the five business days prior to the grant of the option or the market value of the ordinary shares on the date of grant of the option. The HSBC Holdings Group Share Option Plan will terminate on 26 May 2005 unless the Directors resolve to terminate the plan at an earlier date.
194
Back to Contents
HSBC Holdings Executive Share Option Scheme
HSBC Holdings ordinary shares of US$0.50
| | | | | | | | Options at | | Options | | Options | | Options at | |
| Date of | Exercise | | Exercisable | | Exercisable | | 1 January | | exercised | | lapsed | | 31 December | |
| award | price (£) | | from | 1 | until | 2 | 2004 | | during year | 3 | during year | | 2004 | |
| | | | | | | | | | | | | | | |
| 8 Mar 1994 | 2.8376 | | 8 Mar 1997 | | 8 Mar 2004 | | 82,479 | | 82,479 | | – | | – | |
| 7 Mar 1995 | 2.1727 | | 7 Mar 1998 | | 7 Mar 2005 | | 234,000 | | 133,500 | | – | | 100,500 | |
| 1 Apr 1996 | 3.3334 | | 1 Apr 1999 | | 1 Apr 2006 | | 602,019 | | 236,349 | | 15,000 | | 350,670 | |
| 24 Mar 1997 | 5.0160 | | 24 Mar 2000 | | 24 Mar 2007 | | 1,046,174 | | 255,263 | | 9,000 | | 781,911 | |
| 12 Aug 1997 | 7.7984 | | 12 Aug 2000 | | 12 Aug 2007 | | 14,625 | | – | | – | | 14,625 | |
| 16 Mar 1998 | 6.2767 | | 16 Mar 2001 | | 16 Mar 2008 | | 1,954,924 | | 499,281 | | 37,500 | | 1,418,143 | |
| 29 Mar 1999 | 6.3754 | | 3 Apr 2002 | | 29 Mar 2009 | | 32,420,672 | | 8,802,829 | | 299,478 | | 23,318,365 | |
| 10 Aug 1999 | 7.4210 | | 10 Aug 2002 | | 10 Aug 2009 | | 193,800 | | 43,642 | | 7,500 | | 142,658 | |
| 31 Aug 1999 | 7.8710 | | 31 Aug 2002 | | 31 Aug 2009 | | 4,000 | | – | | – | | 4,000 | |
| 3 Apr 2000 | 7.4600 | | 3 Apr 2003 | | 3 Apr 2010 | | 23,142,646 | | 4,852,349 | | 444,358 | | 17,845,939 | |
| | | | | | | | | | | | | | | |
| | |
| 1 | May be advanced to an earlier date in certain circumstances, e.g. retirement. |
| 2 | May be extended to a later date in certain circumstances, e.g. on the death of a participant, the executors may exercise the option up to twelve months beyond the normal exercise period. |
| 3 | The weighted average closing price of the shares immediately before the dates on which options were exercised was £8.61. |
The HSBC Holdings Executive Share Option Scheme was replaced by the HSBC Holdings Group Share Option Plan on 26 May 2000. No options have been granted under the Scheme since that date.
HSBC Holdings Group Share Option Plan
HSBC Holdings ordinary shares of US$0.50
| | | | | | | | | | Options | | Options | | Options | | | |
| | | | | | | | Options at | | awarded | | exercised | | lapsed | | Options at | |
| Date of | Exercise | | Exercisable | | Exercisable | | 1 January | | during | | during | | during | | 31 December | |
| award | price (£) | | from | 1 | until | 2 | 2004 | | year | | year | 3 | year | | 2004 | |
| | | | | | | | | | | | | | | | | |
| 4 Oct 2000 | 9.6420 | | 4 Oct 2003 | | 4 Oct 2010 | | 396,235 | | – | | – | | 6,883 | | 389,352 | |
| 23 Apr 2001 | 8.7120 | | 23 Apr 2004 | | 23 Apr 2011 | | 47,272,814 | | – | | 1,284,499 | | 1,182,858 | | 44,805,457 | |
| 30 Aug 2001 | 8.2280 | | 30 Aug 2004 | | 30 Aug 2011 | | 356,980 | | – | | 25,650 | | 14,100 | | 317,230 | |
| 7 May 2002 | 8.4050 | | 7 May 2005 | | 7 May 2012 | | 54,343,874 | | – | | 71,850 | | 1,658,549 | | 52,613,475 | |
| 30 Aug 2002 | 7.4550 | | 30 Aug 2005 | | 30 Aug 2012 | | 452,350 | | – | | – | | 7,725 | | 444,625 | |
| 2 May 2003 | 6.9100 | | 2 May 2006 | | 2 May 2013 | | 56,527,650 | | – | | 78,400 | | 1,647,400 | | 54,801,850 | |
| 29 Aug 2003 | 8.1300 | | 29 Aug 2006 | | 29 Aug 2013 | | 577,270 | | – | | – | | 8,200 | | 569,070 | |
| 3 Nov 2003 | 9.1350 | | 3 Nov 2006 | | 3 Nov 2013 | | 4,069,800 | | – | | – | | – | | 4,069,800 | |
| 30 Apr 2004 | 8.2830 | | 30 Apr 2007 | | 30 Apr 2014 | | – | | 63,341,879 | 4 | – | | 1,022,692 | | 62,319,187 | |
| 27 Aug 2004 | 8.6500 | | 27 Aug 2007 | | 27 Aug 2014 | | – | | 340,160 | 5 | – | | 300 | | 339,860 | |
| | |
| 1 | May be advanced to an earlier date in certain circumstances, e.g. retirement. |
| 2 | May be extended to a later date in certain circumstances, e.g. on the death of a participant, the executors may exercise the option up to twelve months beyond the normal exercise period. |
| 3 | The weighted average closing price of the shares immediately before the dates on which options were exercised was £9.05. |
| 4 | The closing price per share on 29 April 2004, the day before the options were awarded, was £8.18. |
| 5 | The closing price per share on 26 August 2004, the day before the options were awarded, was £8.61. |
CCF and subsidiary company plans
When it was acquired in 2000, CCF and certain of its subsidiary companies operated employee share option plans under which options could be granted over their respective shares.
No further options will be granted under any of these subsidiary company plans. The following are outstanding options to acquire shares in CCF and its subsidiaries.
195
Back to Contents
H S B C H O L D I N G S P L C
Report of the Directors (continued)
CCF
shares of €5
| | | | | | | | Options at | | Options | | Options | | Options at | |
| Date of | Exercise | | Exercisable | | Exercisable | | 1 January | | exercised | | lapsed | | 31 December | |
| award | price (€) | | from | | until | | 2004 | | during year | 1 | during year | | 2004 | 1 |
| | | | | | | | | | | | | | | |
| 23 Jun 1994 | 32.78 | | 23 Jun 1996 | | 23 Jun 2004 | | 10,800 | | 10,000 | | 800 | | – | |
| 22 Jun 1995 | 34.00 | | 22 Jun 1997 | | 22 Jun 2005 | | 53,130 | | 1,130 | | – | | 52,000 | |
| 9 May 1996 | 35.52 | | 9 May 1998 | | 9 May 2006 | | 89,500 | | 25,000 | | – | | 64,500 | |
| 7 May 1997 | 37.05 | | 7 Jun 2000 | | 7 May 2007 | | 282,630 | | 67,070 | | – | | 215,560 | |
| 29 Apr 1998 | 73.50 | | 7 Jun 2000 | | 29 Apr 2008 | | 535,400 | | 147,102 | | – | | 388,298 | |
| 7 Apr 1999 | 81.71 | | 7 Jun 2000 | | 7 Apr 2009 | | 788,200 | | 199,778 | | – | | 588,422 | |
| 12 Apr 2000 | 142.50 | | 1 Jan 2002 | | 12 Apr 2010 | | 856,000 | | 2,000 | | – | | 854,000 | |
| | |
| 1 | Following exercise of the options, the CCF shares will be exchanged for HSBC Holdings ordinary shares in the same ratio as for the acquisition of CCF (13 HSBC Holdings ordinary shares for each CCF share). At 31 December 2004, The HSBC Holdings Employee Benefit Trust 2001 (No. 1) held 26,787,515 HSBC Holdings ordinary shares which may be exchanged for CCF shares arising from the exercise of these options. |
Banque Chaix
shares of€16
| | | | | | | | | | | | | | |
| | | | | | | | | | | | | | |
| | | | | | | | Options at | | Options | | Options | | Options at | |
| Date of | Exercise | | Exercisable | | Exercisable | | 1 January | | exercised | | lapsed | | 31 December | |
| award | price (€) | | from | | until | | 2004 | | during year | | during year | | 2004 | |
| | | | | | | | | | | | | | | |
| 21 Jun 1999 | 100.31 | | 21 Jun 2004 | | 21 Dec 2004 | | 10,000 | | 10,000 | | – | | – | |
| 7 Jun 2000 | 105.94 | | 7 Jun 2005 | | 7 Dec 2005 | | 10,000 | | – | | – | | 10,000 | |
| | | | | | | | | | | | | | | |
Banque de Baecque Beau
shares of no par value
| | | | | | | | Options at | | Options | | Options | | Options at | |
| Date of | Exercise | | Exercisable | | Exercisable | | 1 January | | exercised | | lapsed | | 31 December | |
| award | price (€) | | from | | until | | 2004 | | during year | | during year | | 2004 | |
| | | | | | | | | | | | | | | |
| 22 Dec 2000 | 61.66 | | 22 Dec 2003 | | 22 Dec 2005 | | 11,500 | | – | | – | | 11,500 | |
| | | | | | | | | | | | | | | |
Banque de Savoie
shares of€16
| | | | | | | | Options at | | Options | | Options | | Options at | |
| Date of | Exercise | | Exercisable | | Exercisable | | 1 January | | exercised | | lapsed | | 31 December | |
| award | price (€) | | from | | until | | 2004 | | during year | | during year | | 2004 | |
| | | | | | | | | | | | | | | |
| 24 Dec 1998 | 61.85 | | 24 Dec 2003 | | 24 Jun 2004 | | 5,000 | | 5,000 | | – | | – | |
| 9 Sep 1999 | 64.79 | | 9 Sep 2004 | | 9 Mar 2005 | | 5,000 | | – | | – | | 5,000 | |
| 14 Jun 2000 | 69.52 | | 14 Jun 2005 | | 14 Dec 2005 | | 5,100 | | – | | – | | 5,100 | |
| | | | | | | | | | | | | | | |
Banque Dupuy de Parseval
shares of€20
| | | | | | | | | | | | | | |
| | | | | | | | Options at | | Options | | Options | | Options at | |
| Date of | Exercise | | Exercisable | | Exercisable | | 1 January | | exercised | | lapsed | | 31 December | |
| award | price (€) | | from | | until | | 2004 | | during year | | during year | | 2004 | |
| | | | | | | | | | | | | | | |
| 1 Jul 1999 | 34.76 | | 1 Jul 2004 | | 1 Oct 2004 | | 5,000 | | 5,000 | | – | | – | |
| 3 Apr 2000 | 36.36 | | 3 Apr 2005 | | 3 Jul 2005 | | 5,000 | | – | | – | | 5,000 | |
| 8 Jun 2000 | 39.48 | | 8 Jun 2005 | | 8 Sep 2005 | | 5,000 | | – | | – | | 5,000 | |
196
Back to Contents
Crédit Commercial du Sud Ouest
shares of€15.25
| | | | | | | | Options at | | Options | | Options | | Options at | |
| Date of | Exercise | | Exercisable | | Exercisable | | 1 January | | exercised | | lapsed | | 31 December | |
| award | price (€) | | from | | until | | 2004 | | during year | | during year | | 2004 | |
| | | | | | | | | | | | | | | |
| 9 Sep 1999 | 95.89 | | 9 Sep 2004 | | 9 Mar 2005 | | 7,500 | | – | | – | | 7,500 | |
| 7 Jun 2000 | 102.29 | | 7 Jun 2005 | | 7 Dec 2005 | | 7,500 | | – | | – | | 7,500 | |
| | | | | | | | | | | | | | | |
HSBC Private Bank France
shares of€2
| | | | | | | | Options at | | Options | | Options | | Options at | |
| Date of | Exercise | | Exercisable | | Exercisable | | 1 January | | exercised | | lapsed | | 31 December | |
| award | price (€) | | from | | until | | 2004 | | during year | | during year | | 2004 | 1 |
| | | | | | | | | | | | | | | |
| 21 Dec 1999 | 10.84 | | 21 Dec 2000 | | 21 Dec 2009 | | 272,250 | | 101,750 | | – | | 170,500 | |
| 9 Mar 2000 | 12.44 | | 27 Jun 2004 | | 31 Dec 2010 | | 149,460 | | – | | – | | 149,460 | |
| 15 May 2001 | 20.80 | | 15 May 2002 | | 15 May 2011 | | 258,525 | | – | | 4,500 | | 254,025 | |
| 7 Sep 2001 | 15.475 | | 7 Sep 2005 | | 7 Oct 2007 | | 448,500 | | – | | 117,000 | | 331,500 | |
| 1 Oct 2002 | 22.22 | | 2 Oct 2005 | | 1 Oct 2012 | | 229,950 | | – | | 4,500 | | 225,450 | |
| | |
| 1 | Following exercise of the options, the HSBC Private Bank France shares will be exchanged for HSBC Holdings ordinary shares in the ratio of 1.83 HSBC Holdings ordinary shares for each HSBC Private Bank France share. At 31 December 2004, The CCF Employee Benefit Trust 2001 held 2,294,066 HSBC Holdings ordinary shares which may be exchanged for HSBC Private Bank France shares arising from the exercise of these options. |
| | |
Netvalor
shares of€415
| | | | | | | | Options at | | Options | | Options | | Options at | |
| Date of | Exercise | | Exercisable | | Exercisable | | 1 January | | exercised | | lapsed | | 31 December | |
| award | price (€) | | from | | until | | 2004 | | during year | | during year | | 2004 | |
| | | | | | | | | | | | | | | |
| 22 Dec 1999 | 415 | | 22 Dec 2004 | | 22 Dec 2006 | | 2,410 | | – | | – | | 2,410 | |
| 19 Dec 2000 | 415 | | 19 Dec 2005 | | 19 Dec 2007 | | 3,340 | | – | | 70 | | 3,270 | |
| | | | | | | | | | | | | | | |
Sinopia Asset Management
shares of€0.50
| | | | | | | | | | | | | | |
| | | | | | | | Options at | | Options | | Options | | Options at | |
| Date of | Exercise | | Exercisable | | Exercisable | | 1 January | | exercised | | lapsed | | 31 December | |
| award | price (€) | | from | | until | | 2004 | | during year | | during year | | 2004 | 1 |
| | | | | | | | | | | | | | | |
| 22 Mar 1999 | 21.85 | | 22 Mar 2004 | | 22 Sep 2004 | | 79,000 | | 79,000 | | – | | – | |
| 15 Oct 1999 | 18.80 | | 15 Oct 2004 | | 15 Apr 2005 | | 45,000 | | 15,000 | | – | | 30,000 | |
| 18 Feb 2000 | 18.66 | | 18 Feb 2005 | | 18 Aug 2005 | | 97,500 | | – | | 2,000 | | 95,500 | |
| | |
| 1 | Following exercise of the options, the Sinopia shares will be exchanged for HSBC Holdings ordinary shares in the ratio of 2.143 HSBC Holdings ordinary shares for each Sinopia share. At 31 December 2004, The CCF Employee Benefit Trust 2001 held 281,814 HSBC Holdings ordinary shares which may be exchanged for Sinopia shares arising from the exercise of these options. |
Union de Banques à Paris
shares of€16
| | | | | | | | Options at | | Options | | Options | | Options at | |
| Date of | Exercise | | Exercisable | | Exercisable | | 1 January | | exercised | | lapsed | | 31 December | |
| award | price (€) | | from | | until | | 2004 | | during year | | during year | | 2004 | |
| | | | | | | | | | | | | | | |
| 25 Nov 1998 | 19.97 | | 25 Nov 2003 | | 25 May 2004 | | 27,000 | | 27,000 | | – | | – | |
| 22 Nov 1999 | 33.54 | | 22 Nov 2004 | | 22 May 2005 | | 26,200 | | 25,400 | | 800 | | – | |
| 12 Jul 2000 | 47.81 | | 12 Jul 2005 | | 12 Jan 2006 | | 25,400 | | 2,200 | | 800 | | 22,400 | |
197
Back to Contents
H S B C H O L D I N G S P L C
Report of the Directors(continued)
HSBC Finance Corporation and subsidiary company plans
Following the acquisition of HSBC Finance Corporation in 2003, all outstanding options and equity-based awards over HSBC Finance Corporation common shares were converted into rights to receive HSBC Holdings ordinary shares in the same ratio as the share exchange offer for the acquisition of HSBC Finance Corporation (2.675 HSBC Holdings ordinary shares for each HSBC Finance Corporation common share) and the exercise prices per share were adjusted accordingly. No further options will be granted under any of these plans.
HSBC Finance Corporation
1984 Long-Term Executive Incentive Compensation Plan
HSBC Holdings ordinary shares of US$0.50
All outstanding options and other equity-based awards over HSBC Finance Corporation common shares granted before 14 November 2002, being the date the transaction was announced, vested on completion of the acquisition. Options and equity-based awards granted on or after 14 November 2002 will be exercisable on their original terms, save that they have been adjusted to reflect the exchange ratio.
At 31 December 2004, the HSBC (Household) Employee Benefit Trust 2003 held 5,645,439 HSBC Holdings ordinary shares and 2,200,000 American Depositary Shares (‘ADSs’), each of which represents five HSBC Holdings ordinary shares, which may be used to satisfy the exercise of employee share options.
| | | | | | | | Options at | | Options | | Options | | Options at | |
| Date of | Exercise | | Exercisable | | Exercisable | | 1 January | | exercised | | lapsed | | 31 December | |
| award | price (US$) | | from | | until | | 2004 | | during year | 1 | during year | | 2004 | |
| | | | | | | | | | | | | | | |
| 1 Feb 1994 | 4.16 | | 1 Feb 1995 | | 1 Feb 2004 | | 135,627 | | 135,627 | | – | | – | |
| 7 Feb 1995 | 5.09 | | 7 Feb 1996 | | 7 Feb 2005 | | 1,532,234 | | 1,384,092 | | – | | 148,142 | |
| 10 May 1995 | 5.91 | | 10 May 1996 | | 10 May 2005 | | 48,150 | | 48,150 | | – | | – | |
| 17 Jul 1995 | 6.42 | | 17 Jul 1996 | | 17 Jul 2005 | | 40,125 | | 40,125 | | – | | – | |
| 13 Nov 1995 | 7.43 | | 13 Nov 1996 | | 13 Nov 2005 | | 2,056,007 | | 1,772,876 | | – | | 283,131 | |
| | |
| 1 | The weighted average closing price of the shares immediately before the dates on which options were exercised was £8.63. |
HSBC Finance Corporation
1996 Long-Term Executive Incentive Compensation Plan
HSBC Holdings ordinary shares of US$0.50
| | | | | | | | Options at | | Options | | Options | | Options at | |
| Date of | Exercise | Exercisable | Exercisable | 1 January | exercised | lapsed | 31 December |
| award | price (US$) | from | until | 2004 | during year | 1 | during year | 2004 |
| | | | | | | | | | | | | | | |
| 11 Nov 1996 | 11.43 | | 11 Nov 1997 | | 11 Nov 2006 | | 2,587,394 | | 1,580,925 | | – | | 1,006,469 | |
| 14 May 1997 | 11.29 | | 14 May 1998 | | 14 May 2007 | | 200,630 | | – | | – | | 200,630 | |
| 10 Nov 1997 | 14.60 | | 10 Nov 1998 | | 10 Nov 2007 | | 4,224,670 | | 208,650 | | – | | 4,016,020 | |
| 15 Jun 1998 | 17.08 | | 15 Jun 1999 | | 15 Jun 2008 | | 802,500 | | – | | – | | 802,500 | |
| 1 Jul 1998 | 19.21 | | 1 Jul 1999 | | 1 Jul 2008 | | 80,250 | | – | | – | | 80,250 | |
| 9 Nov 1998 | 13.71 | | 9 Nov 1999 | | 9 Nov 2008 | | 4,928,354 | | 232,725 | | – | | 4,695,629 | |
| 17 May 1999 | 16.99 | | 17 May 2000 | | 17 May 2009 | | 334,375 | | – | | – | | 334,375 | |
| 3 Jun 1999 | 16.32 | | 3 Jun 2000 | | 3 Jun 2009 | | 200,625 | | – | | – | | 200,625 | |
| 31 Aug 1999 | 13.96 | | 31 Aug 2000 | | 31 Aug 2009 | | 345,077 | | – | | – | | 345,077 | |
| 8 Nov 1999 | 16.96 | | 8 Nov 2000 | | 8 Nov 2009 | | 4,869,841 | | – | | – | | 4,869,841 | |
| 30 Jun 2000 | 15.70 | | 30 Jun 2001 | | 30 Jun 2010 | | 26,846 | | – | | – | | 26,846 | |
| 8 Feb 2000 | 13.26 | | 8 Feb 2001 | | 8 Feb 2010 | | 66,875 | | – | | – | | 66,875 | |
| 13 Nov 2000 | 18.40 | | 13 Nov 2001 | | 13 Nov 2010 | | 6,379,208 | | – | | – | | 6,379,208 | |
| 12 Nov 2001 | 21.37 | | 12 Nov 2002 | | 12 Nov 2011 | | 7,571,322 | | – | | – | | 7,571,322 | |
| 20 Nov 2002 | 10.66 | | 20 Nov 2003 | 2 | 20 Nov 2012 | | 7,315,727 | | 174,139 | | 30,094 | | 7,111,494 | |
| | |
| 1 | The weighted average closing price of the shares immediately before the dates on which options were exercised was £8.85. |
| 2 | 25 per cent of the original award is exercisable on each of the first, second, third and fourth anniversaries of the date of award. May be advanced to an earlier date in certain circumstances, e.g. retirement. |
198
Back to Contents
HSBC Finance Corporation
1996 Long-Term Executive Incentive Compensation Plan1
HSBC Holdings ordinary shares of US$0.50
| | | | | | | | Rights at | | Rights | | Rights | | Rights at | |
| Date of | Exercise | Exercisable | Exercisable | 1 January | exercised | lapsed | 31 December |
| award | price (US$) | from | 2 | until | 2 | 2004 | during year | 3 | during year | 2004 |
| | | | | | | | | | | | | | | |
| 15 Nov 2002 | nil | | 15 Nov 2005 | | 15 Nov 2007 | | 7,222 | | – | | – | | 7,222 | |
| 20 Nov 2002 | nil | | 20 Nov 2005 | | 20 Nov 2007 | | 1,961,448 | | 84,317 | | 88,047 | | 1,789,084 | |
| 2 Dec 2002 | nil | | 2 Dec 2005 | | 2 Dec 2007 | | 10,701 | | – | | – | | 10,701 | |
| 16 Dec 2002 | nil | | 16 Dec 2005 | | 16 Dec 2007 | | 35,846 | | – | | – | | 35,846 | |
| 20 Dec 2002 | nil | | 20 Dec 2005 | | 20 Dec 2007 | | 180,564 | | 10,700 | | 5,350 | | 164,514 | |
| 2 Jan 2003 | nil | | 2 Jan 2006 | | 2 Jan 2008 | | 1,338 | | – | | – | | 1,338 | |
| 15 Jan 2003 | nil | | 15 Jan 2006 | | 15 Jan 2008 | | 33,438 | | – | | 2,006 | | 31,432 | |
| 3 Feb 2003 | nil | | 3 Feb 2006 | | 3 Feb 2008 | | 11,241 | | 1,057 | | 549 | | 9,635 | |
| 14 Feb 2003 | nil | | 14 Feb 2006 | | 14 Feb 2008 | | 267,768 | | 80,250 | | – | | 187,518 | |
| 3 Mar 2003 | nil | | 3 Mar 2006 | | 3 Mar 2008 | | 2,676 | | – | | 1,338 | | 1,338 | |
| | |
| 1 | Awards of Restricted Stock Rights which represent a right to receive shares if the employee remains in the employment of HSBC Finance Corporation at the date of vesting. |
| 2 | Restricted Stock Rights vest one-third on each of the third, fourth and fifth anniversaries of the date of award. Vesting may be advanced to an earlier date in certain circumstances, e.g. retirement. |
| 3 | The weighted average closing price of the shares immediately before the dates on which rights were exercised was £8.57. |
| | |
HSBC Finance Corporation
Deferred Fee Plan for Directors
Prior to 28 March 2003, HSBC Finance Corporation directors could choose to defer all or a portion of their cash compensation under the Deferred Fee Plan for Directors. At the end of the deferred period selected by the director, all accumulated amounts will be paid in shares in one or more instalments. Following the acquisition of HSBC Finance Corporation the rights to receive HSBC Finance Corporation common shares under the plan were
converted into rights to receive HSBC Holdings ordinary shares. No further awards will be granted under this plan. A summary of the rights to receive HSBC Holdings ordinary shares under this plan is set out below. Full details are available on www.hsbc.com by selecting ‘Investor Relations’, then ‘Share plans’ or can be obtained upon request from the Group Company Secretary, 8 Canada Square, London E14 5HQ.
HSBC Holdings ordinary shares of US$0.50
| | | | | Rights at | | Rights | | Rights | | Rights at | |
| Range of | 1 January | exercised | lapsed | 31 December |
| Dates of deferral | prices (US$) | Deferral period | 2004 | during year | 1 | during year | 2 | 2004 |
| | | | | | | | | | | | | |
| 1 Oct 1995 – 15 Jan 2003 | 5.42 – 25.40 | | 1 Jan 2000 – 31 Dec 2021 | | 188,406 | | 2,106 | | 186,300 | | – | |
| | |
| 1 | The weighted average closing price of the shares immediately before the dates on which shares were delivered was £8.57. |
| 2 | In May 2004, the rights of participants to receive new HSBC Holdings ordinary shares under the Deferred Fee Plan for Directors were transferred to the HSBC-North America Directors’ Non-Qualified Deferred Compensation Plan. Under this new plan the rights to receive HSBC Holdings ordinary shares must be met through a grantor trust which has acquired, through market purchase, sufficient ADSs to satisfy all the outstanding obligations to deliver HSBC Holdings ordinary shares. All rights to receive HSBC Holdings ordinary shares under the new plan will be met solely from the HSBC Holdings ordinary shares held by the grantor trust. No further rights to receive HSBC Holdings ordinary shares will be granted and no new HSBC Holdings ordinary shares will be issued under this plan. |
HSBC Finance Corporation
Deferred Phantom Stock Plan for Directors
In 1995, the HSBC Finance Corporation Directors’ Retirement Income Plan was discontinued and the present value of each director’s accrued benefit was exchanged for a deferred right to receive HSBC Finance Corporation common shares. Following the acquisition of HSBC Finance Corporation the rights to receive HSBC Finance Corporation common shares under the plan were converted into rights to receive HSBC Holdings ordinary shares. When a director dies or leaves the Board due to retirement or
resignation, all accumulated amounts will be released in HSBC Holdings ordinary shares in one or more instalments. No further awards will be granted under this plan. A summary of the rights to receive HSBC Holdings ordinary shares under this plan is set out below. Full details are available on www.hsbc.com by selecting ‘Investor Relations’, then ‘Share plans’ or can be obtained upon request from the Group Company Secretary, 8 Canada Square, London E14 5HQ.
199
Back to Contents
H S B C H O L D I N G S P L C
Report of the Directors(continued)
HSBC Holdings ordinary shares of US$0.50
| | | | | | Rights at | | Rights | | Rights | | Rights at | |
| Range of | | 1 January | exercised | lapsed | 31 December |
| Dates of deferral | prices (US$) | Deferral period | 2004 | during year | 1 | during year | 2 | 2004 |
| | | | | | | | | | | | | |
| 30 Jan 1996 – 15 Jan 2003 | 7.75 – 25.40 | | 1 Jan 2000 – 31 Dec 2020 | | 102,468 | | 722 | | 101,746 | | – | |
| | |
| 1 | The weighted average closing price of the shares immediately before the dates on which shares were delivered was £8.45. |
| 2 | In May 2004, the rights of participants to receive new HSBC Holdings ordinary shares under the Deferred Phantom Stock Plan for Directors were transferred to the HSBC-North America Directors’ Non-Qualified Deferred Compensation Plan. Under this new plan the rights to receive HSBC Holdings shares must be met through a grantor trust which has acquired, through market purchase, sufficient ADSs to satisfy all the outstanding obligations to deliver HSBC Holdings ordinary shares. All rights to receive HSBC Holdings ordinary shares under the new plan will be met solely from the HSBC shares held by the grantor trust. No further rights to receive HSBCHoldings ordinary shares will be granted and no new HSBC Holdings ordinary shares will be issued under this plan. |
HSBC Finance Corporation
Non-Qualified Deferred Compensation Plan for Restricted Stock Rights
HSBC Holdings ordinary shares of US$0.50
| | | | | | | | Options at | | Options | | Options | | Options at | |
| Date of | Exercise | Exercisable | Exercisable | 1 January | exercised | lapsed | 31 December |
| award | price (US$) | from | until | 2004 | during year | 1 | during year | 2004 |
| | | | | | | | | | | | | | | |
| 10 May 2000 | nil | | 10 May 2002 | | 10 May 2005 | | 294,329 | | 113,204 | | – | | 181,125 | |
| | |
| 1 | The weighted average closing price of the shares immediately before the dates on which options were exercised was £8.28. |
HSBC Finance Corporation
Non-Qualified Deferred Compensation Plan for Stock Option Exercises
HSBC Holdings ordinary shares of US$0.50
| | | | | | | | Options at | | Options | | Options | | Options at | |
| Date of | Exercise | Exercisable | Exercisable | 1 January | exercised | lapsed | 31 December |
| award | price (US$) | from | until | 2004 | during year | during year | 2004 |
| | | | | | | | | | | | | | | |
| 2 Feb 1991 | 2.48 | | 2 Feb 1992 | | 15 Jul 2005 | | 20,819 | | – | | – | | 20,819 | |
Beneficial Corporation
1990 Non-Qualified Stock Option Plan
HSBC Holdings ordinary shares of US$0.50
| | | | | | | | Options at | | Options | | Options | | Options at | |
| Date of | Exercise | Exercisable | Exercisable | 1 January | exercised | lapsed | 31 December |
| award | price (US$) | from | until | 2004 | during year | 1 | during year | 2004 |
| | | | | | | | | | | | | | | |
| 15 Nov 1994 | 4.56 | | 15 Nov 1995 | | 15 Nov 2004 | | 103,682 | | 103,682 | | – | | – | |
| 15 Nov 1995 | 6.00 | | 15 Nov 1996 | | 15 Nov 2005 | | 215,727 | | 38,127 | | – | | 177,600 | |
| 20 Nov 1996 | 7.86 | | 20 Nov 1997 | | 20 Nov 2006 | | 313,162 | | 23,458 | | – | | 289,704 | |
| 13 Dec 1996 | 7.54 | | 13 Dec 1997 | | 13 Dec 2006 | | 65,624 | | – | | – | | 65,624 | |
| 14 Nov 1997 | 9.20 | | 14 Nov 1998 | | 14 Nov 2007 | | 131,248 | | – | | – | | 131,248 | |
| 19 Nov 1997 | 9.39 | | 19 Nov 1998 | | 19 Nov 2007 | | 429,135 | | 23,861 | | – | | 405,274 | |
| 1 Dec 1997 | 9.68 | | 1 Dec 1998 | | 1 Dec 2007 | | 65,624 | | – | | – | | 65,624 | |
| | |
| 1 | The weighted average closing price of the shares immediately before the dates on which options were exercised was £8.57. |
Beneficial Corporation
BenShares Equity Participation Plan
HSBC Holdings ordinary shares of US$0.50
| | | | | | | | Options at | | Options | | Options | | Options at | |
| Date of | Exercise | Exercisable | Exercisable | 1 January | exercised | lapsed | 31 December |
| award | price (US$) | from | until | 2004 | during year | 1 | during year | 2004 |
| | | | | | | | | | | | | | | |
| 31 Jan 1997 | 9.87 | | 31 Jan 1998 | | 31 Jan 2007 | | 46,243 | | 4,926 | | – | | 41,317 | |
| 15 Nov 1997 | 11.04 | | 15 Nov 1998 | | 15 Nov 2007 | | 62,264 | | 6,568 | | – | | 55,696 | |
| | |
| 1 | The weighted average closing price of the shares immediately before the dates on which options were exercised was £8.62. |
200
Back to Contents
Renaissance Holdings, Inc.
Amended and Restated 1997 Incentive Plan
HSBC Holdings ordinary shares of US$0.50
| | | | | | | | Options at | | Options | | Options | | Options at | |
| Date of | Exercise | | Exercisable | | Exercisable | | 1 January | | exercised | | lapsed | | 31 December | |
| award | price (US$) | | from | | until | | 2004 | | during year | 1 | during year | | 2004 | |
| | | | | | | | | | | | | | | |
| 31 Oct 1997 | 1.25 | | 31 Oct 1998 | | 31 Oct 2007 | | 4,739 | | – | | – | | 4,739 | |
| 1 Jan 1998 | 1.25 | | 1 Jan 1999 | | 1 Jan 2008 | | 3,224 | | 1,800 | | – | | 1,424 | |
| 1 Oct 1998 | 1.74 | | 1 Oct 1999 | | 1 Oct 2008 | | 2,810 | | 1,204 | | – | | 1,606 | |
| 1 Jan 1999 | 2.24 | | 1 Jan 2000 | | 1 Jan 2009 | | 5,024 | | – | | – | | 5,024 | |
| | |
| 1 | The weighted average closing price of the shares immediately before the dates on which options were exercised was £8.84. |
Bank of Bermuda plans
Following the acquisition of Bank of Bermuda on 18 February 2004, all outstanding options over Bank of Bermuda shares were converted into rights to receive HSBC Holdings ordinary shares based on the consideration of US$40 for each Bank of Bermuda share and the average closing price of HSBC Holdings ordinary shares, derived from the London Stock Exchange Daily Official List, for the five business days preceding the closing date of the acquisition. No further options will be granted under any of these plans.
All outstanding options over Bank of Bermuda shares vested on completion of the acquisition. At 31 December 2004, the HSBC (Bank of Bermuda) Employee Benefit Trust 2004 held 3,255,273 HSBC Holdings ordinary shares which may be used to satisfy the exercise of these options.
Bank of Bermuda
Executive Share Option Plan 1997
HSBC Holdings ordinary shares of US$0.50
| | | | | | | | Options at | | Options | | Options | | Options at | |
| Date of | Exercise | | Exercisable | | Exercisable | | 18 February | | exercised | | lapsed | | 31 December | |
| award | price (US$) | | from | | until | | 2004 | | during period | 1 | during period | | 2004 | |
| | | | | | | | | | | | | | | |
| 12 Jun 1997 | 3.86 | | 12 Jun 1998 | | 12 Jun 2007 | | 245,196 | | 245,196 | | – | | – | |
| 22 Dec 1997 | 6.33 | | 22 Dec 1998 | | 22 Dec 2007 | | 33,906 | | 33,906 | | – | | – | |
| 1 Jul 1998 | 9.61 | | 1 Jul 1999 | | 1 Jul 2008 | | 67,813 | | – | | – | | 67,813 | |
| 23 Jul 1998 | 8.58 | | 23 Jul 1999 | | 23 Jul 2008 | | 139,019 | | 139,019 | | – | | – | |
| 23 Feb 1999 | 7.40 | | 23 Feb 2000 | | 23 Feb 2009 | | 24,998 | | 6,534 | | – | | 18,464 | |
| 26 Jul 1999 | 6.66 | | 26 Jul 2000 | | 26 Jul 2009 | | 159,363 | | 159,363 | | – | | – | |
| 3 Aug 1999 | 7.10 | | 3 Aug 2000 | | 3 Aug 2009 | | 9,331 | | – | | – | | 9,331 | |
| 4 Feb 2000 | 7.21 | | 4 Feb 2001 | | 4 Feb 2010 | | 88,777 | | 19,266 | | 1,586 | | 67,925 | |
| 7 Apr 2000 | 7.37 | | 7 Apr 2001 | | 7 Apr 2010 | | 385 | | – | | – | | 385 | |
| 29 May 2000 | 7.21 | | 29 May 2001 | | 29 May 2010 | | 15,411 | | – | | – | | 15,411 | |
| 1 Jun 2000 | 7.04 | | 1 Jun 2001 | | 1 Jun 2010 | | 61,649 | | – | | – | | 61,649 | |
| 31 Jul 2000 | 10.11 | | 31 Jul 2001 | | 31 Jul 2010 | | 166,454 | | – | | – | | 166,454 | |
| 19 Sep 2000 | 11.31 | | 19 Sep 2001 | | 19 Sep 2010 | | 40,458 | | – | | – | | 40,458 | |
| 11 Jan 2001 | 14.27 | | 11 Jan 2002 | | 11 Jan 2011 | | 161,829 | | – | | – | | 161,829 | |
| | |
| 1 | The weighted average closing price of the shares immediately before the dates on which options were exercised was £8.85. |
201
Back to Contents
H S B C H O L D I N G S P L C
Report ofthe Directors(continued)
Bank of Bermuda
Share Option Plan 2000
HSBC Holdings ordinary shares of US$0.50
| | | | | | | | Options at | | Options | | Options | | Options at | |
| Date of | Exercise | | Exercisable | | Exercisable | | 18 February | | exercised | | lapsed | | 31 December | |
| award | price (US$) | | from | | until | | 2004 | | during period | 1 | during period | | 2004 | |
| | | | | | | | | | | | | | | |
| 11 Jan 2001 | 14.27 | | 11 Jan 2002 | | 11 Jan 2011 | | 161,829 | | – | | – | | 161,829 | |
| 6 Feb 2001 | 16.41 | | 6 Feb 2002 | | 6 Feb 2011 | | 1,111,908 | | 33,733 | | 10,569 | | 1,067,606 | |
| 29 Mar 2001 | 15.39 | | 29 Mar 2002 | | 29 Mar 2011 | | 540 | | – | | – | | 540 | |
| 16 Apr 2001 | 15.57 | | 16 Apr 2002 | | 16 Apr 2011 | | 539 | | – | | – | | 539 | |
| 6 Jun 2001 | 18.35 | | 6 Jun 2002 | | 6 Jun 2011 | | 8,091 | | – | | – | | 8,091 | |
| 16 Jul 2001 | 16.87 | | 16 Jul 2002 | | 16 Jul 2011 | | 245,610 | | 20,979 | | – | | 224,631 | |
| 28 Aug 2001 | 15.39 | | 28 Aug 2002 | | 28 Aug 2011 | | 13,486 | | – | | – | | 13,486 | |
| 26 Sep 2001 | 12.79 | | 26 Sep 2002 | | 26 Sep 2011 | | 468,611 | | 6,741 | | 2,219 | | 459,651 | |
| 16 Jan 2002 | 16.11 | | 16 Jan 2003 | | 16 Jan 2012 | | 3,678 | | – | | – | | 3,678 | |
| 30 Jan 2002 | 15.60 | | 30 Jan 2003 | | 30 Jan 2012 | | 1,226 | | – | | – | | 1,226 | |
| 5 Feb 2002 | 16.09 | | 5 Feb 2003 | | 5 Feb 2012 | | 1,483,066 | | 54,204 | | 7,711 | | 1,421,151 | |
| 5 Feb 2002 | 16.41 | | 5 Feb 2003 | | 5 Feb 2012 | | 1,383 | | – | | – | | 1,383 | |
| 10 Jul 2002 | 15.84 | | 10 Jul 2003 | | 10 Jul 2012 | | 12,260 | | – | | – | | 12,260 | |
| 9 Sep 2002 | 12.34 | | 9 Sep 2003 | | 9 Sep 2012 | | 61,299 | | – | | – | | 61,299 | |
| 16 Dec 2002 | 11.27 | | 16 Dec 2003 | | 16 Dec 2012 | | 6,130 | | – | | – | | 6,130 | |
| 4 Feb 2003 | 10.69 | | 4 Feb 2004 | | 4 Feb 2013 | | 387,068 | | 25,786 | | 1,415 | | 359,867 | |
| 1 Apr 2003 | 11.97 | | 1 Apr 2004 | | 1 Apr 2013 | | 28,541 | | – | | – | | 28,541 | |
| 21 Apr 2003 | 11.85 | | 21 Apr 2004 | | 21 Apr 2013 | | 48,853 | | – | | – | | 48,853 | |
| | |
| 1 | The weighted average closing price of the shares immediately before the dates on which options were exercised was £8.90. |
Bank of Bermuda
Directors’ Share Option Plan
HSBC Holdings ordinary shares of US$0.50
| | | | | | | | Options at | | Options | | Options | | Options at | |
| Date of | Exercise | | Exercisable | | Exercisable | | 18 February | | exercised | | lapsed | | 31 December | |
| award | price (US$) | | from | | until | | 2004 | | during period | | during period | | 2004 | |
| | | | | | | | | | | | | | | |
| 22 Sep 1999 | 8.02 | | 22 Sep 2000 | | 22 Sep 2009 | | 7,706 | | – | | – | | 7,706 | |
| 20 Sep 2000 | 11.31 | | 20 Sep 2001 | | 20 Sep 2010 | | 9,440 | | – | | – | | 9,440 | |
| 28 Mar 2001 | 15.76 | | 28 Mar 2002 | | 28 Mar 2011 | | 18,205 | | – | | – | | 18,205 | |
| 3 Apr 2002 | 16.01 | | 3 Apr 2003 | | 3 Apr 2012 | | 34,328 | | – | | – | | 34,328 | |
| 30 Apr 2003 | 12.23 | | 30 Apr 2004 | | 30 Apr 2013 | | 9,808 | | – | | – | | 9,808 | |
Valuation of freehold and leasehold land and buildings
HSBC’s freehold and long leasehold properties, together with all leasehold properties in Hong Kong, were revalued in September 2004in accordance with HSBC’s policy of annual valuation. As a result of this revaluation, the net book value of land and buildings has increased by US$1,246 million. Further details are included in Note 24of the ‘Notes on the Financial Statements’ on page 275.
Corporate Governance Report
The information set out on pages 186 to 234 and information incorporated by reference constitutes the Corporate Governance Report of HSBC Holdings.
Board of Directors
The objectives of the management structures within HSBC, headed by the Board of Directors of HSBC Holdings and led by the Group Chairman, are to deliver sustainable value to shareholders. Implementation of the strategy set by the Board is delegated to the Group Management Board under the leadership of the Group Chief Executive. The Board sets the strategy for HSBC through the five-year strategic plan and approves the annual operating plans presented by management for the achievement of the strategic objectives. The annual operating plans ensure the efficient disposition of HSBC’s resources for the achievement of these objectives. The Board delegates the management and day to day running of HSBC to the Group Management Board but retains to itself approval of certain matters including annual plans and performance targets, procedures for monitoring and
202
Back to Contents
control of operations, specified senior appointments, acquisitions and disposals above predetermined thresholds and any substantial change in balance sheet management policy.
The Board of Directors meets regularly and Directors receive information between meetings about the activities of committees and developments in HSBC’s business. All Directors have full and timely access to all relevant information and may take independent professional advice if necessary.
HSBC Holdings has a unitary Board of Directors. The authority of each Director is exercised in Board Meetings where the Board acts collectively as a unit. At 1 March 2005 the Board will comprise seven executive and 15 non-executive Directors. The roles of Group Chairman and Group Chief Executive are separated and held by experienced executive Directors. The division of responsibilities between the Group Chairman and the Group Chief Executive is clearly established, set out in writing and agreed by the Board. Before assuming the role of Group Chairman in 1998 Sir John Bond had been the Group Chief Executive for five years. The Group Chairman’s knowledge of HSBC’s complex and widespread geographical business from his previous service as Group Chief Executive has been a considerable benefit to HSBC.
Executive Directors are employees who carry out executive functions in HSBC in addition to their duties as Directors. Non-executive Directors are not HSBC employees and do not participate in the daily business management of HSBC. Non-executive Directors constructively challenge and help develop proposals on strategy, scrutinise the performance of management in meeting agreed goals and objectives and monitor the reporting of performance. The roles of non-executive Directors as members of Board committees are set out below. It is estimated that non-executive Directors spend 24 days per annum on HSBC business after an induction phase, with Committee members devoting significant additional time. The names and brief biographical particulars of the Directors are listed on pages 186 to 188.
The Board considers all of the non-executive directors to be independent in character and judgement. Baroness Dunn and H Sohmen have served on the Board for more than nine years, however, and in that respect only, do not meet the usual criteria for independence set out in the UK Combined Code on corporate governance. The Board has therefore determined Lord Butler, R K F Ch’ien, J D Coombe, R A Fairhead, W K L Fung, S Hintze, J W J Hughes-Hallett, Sir John Kemp-Welch, Sir Brian Moffat, Sir Mark Moody-Stuart, S
W Newton, C S Taylor and Sir Brian Williamson to be independent. In reaching its determination of each non-executive Director’s independence the Board has concluded that there are no relationships or circumstances which are likely to affect the Director’s judgement and any relationships or circumstances which could appear to do so were considered not to be material. In accordance with the Rules Governing the Listing of Securities on The Stock Exchange of Hong Kong Limited each non-executive Director determined by the Board to be independent has provided confirmation of his or her independence to HSBC Holdings.
The Directors who served during the year were W F Aldinger, Sir John Bond, Lord Butler, R K F Ch’ien, C F W de Croisset, W R P Dalton, Baroness Dunn, D G Eldon, R A Fairhead, D J Flint, W K L Fung, M F Geoghegan, S K Green, S Hintze, A W Jebson, Sir John Kemp-Welch, Lord Marshall, Sir Brian Moffat, Sir Mark Moody-Stuart, S W Newton, H Sohmen, C S Taylor and Sir Brian Williamson.
C F W de Croisset retired as a Director on 27 February 2004 and W R P Dalton and Lord Marshall retired as Directors on 28 May 2004. R A Fairhead and M F Geoghegan were appointed Directors with effect from 1 March 2004.
J D Coombe and J W J Hughes-Hallett have been appointed Directors with effect from 1 March 2005. Having been appointed since the Annual General Meeting in 2004, they will retire at the forthcoming Annual General Meeting and offer themselves for re-election.
W F Aldinger is to retire as a Director on 29 April 2005.
Sir John Bond, R K F Ch’ien, Baroness Dunn, D G Eldon, D J Flint, Sir Brian Moffat, S W Newton and H Sohmen will retire by rotation at the forthcoming Annual General Meeting. With the exception of D G Eldon, who is to retire, they will offer themselves for re-election.
The Board has undertaken an evaluation of its performance and that of its committees. This evaluation covered board structure; dynamics; capabilities and processes; corporate governance; strategic clarity and alignment; and the performance of individual Directors. In undertaking this review the Group Chairman held structured meetings with each Director using a similar framework to that employed by MWM Consulting, who prepared an independent performance evaluation of the Board and its committees in January 2004. The report on the evaluation of the Board and its committees has been reviewed by the Board and has been used by
203
Back to Contents
H S B C H O L D I N G S P L C
Report of the Directors (continued)
the non-executive Directors, led by Sir Brian Moffat, in their evaluation of the performance of the Group Chairman. The Group Audit Committee, the Remuneration Committee, the Nomination Committee and the Corporate Social Responsibility Committee have also each undertaken a review of their terms of reference and their own effectiveness during 2004.
Following this review the Group Chairman has confirmed that the Directors standing for re-election at the Annual General Meeting continue to perform effectively and to demonstrate commitment to their roles. It is the intention of the Board of HSBC Holdings to continue to review its performance and that of its Directors annually.
Seven regular Board meetings were held during 2004. W F Aldinger, Sir John Bond, Lord Butler, Baroness Dunn, D G Eldon, D J Flint, W K L Fung, S K Green, S Hintze, A W Jebson, Sir John Kemp-Welch, Sir Brian Moffat, S W Newton, C S Taylor and Sir Brian Williamson attended all of the Board meetings. R K F Ch’ien, Sir Mark Moody-Stuart and H Sohmen attended six of the Board meetings. C F W de Croisset attended the two Board meetings held before his retirement. W R P Dalton attended all four Board meetings held before his retirement and Lord Marshall attended three of the four meetings held before his retirement. R A Fairhead attended four, and M F Geoghegan attended all, of the five Board meetings held following their appointment.
During 2004 the non-executive Directors and the Group Chairman met twice to discuss Board performance and succession planning, and the non-executives met once without the Group Chairman to discuss his performance.
In addition to the meetings of the principal committees referred to below, 12 other meetings of committees of the Board were held during the year to discharge business delegated by the Board.
The Board ensures all Directors, including non-executive Directors, develop an understanding of the views of major shareholders through attendance at analyst meetings following results announcements and otherad hoc meetings with investors and their representative bodies. In April 2004 the Board held an informal meeting with representatives of institutional shareholders to discuss corporate governance matters. An Investor Day, attended by executive and non-executive Directors, was held in September 2004 to articulate HSBC’s Managing for Growth strategy.
The Group Chairman, Group Chief Executive and the Group Finance Director hold regular
meetings with institutional investors and report to the Board on those meetings.
All Directors attended the 2004 Annual General Meeting. At the Annual General Meeting shareholders may ask questions and are invited to meet with Directors after the conclusion of the Meeting.
Sir Brian Moffat, Deputy Chairman and senior independent non-executive Director, is available to shareholders should they have concerns which contact through the normal channels of Group Chairman, Group Chief Executive, Group Finance Director or other executives has failed to resolve or for which such contact would be inappropriate. Sir Brian Moffat may be contacted through the Group Company Secretary at 8 Canada Square, London E14 5HQ.
The Group Chairman’s principal commitments outside HSBC are as a non-executive Director of Ford Motor Company and, since January 2005, as a non-executive Director of Vodafone Group plc. During 2004, he ceased to be a member of the Court of the Bank of England.
Full, formal and tailored induction programmes are arranged for newly appointed Directors and opportunities to update and develop skills and knowledge are provided to all Directors. The terms and conditions of appointments of non-executive Directors are available for inspection at 8 Canada Square, London E14 5HQ and will be made available for 15 minutes before the Annual General Meeting and during the Meeting itself.
The Board of HSBC Holdings has adopted a code of conduct for transactions in Group securities by Directors and their connected persons that complies with The Model Code in the Listing Rules of the Financial Services Authority and, except as noted below, with The Model Code for Securities Transactions by Directors of Listed Issuers (‘Hong Kong Model Code’) set out in the Rules Governing the Listing of Securities on The Stock Exchange of Hong Kong Limited. The Stock Exchange of Hong Kong has granted certain waivers from strict compliance with the Hong Kong Model Code, largely to take into account accepted practices in the UK, particularly in respect of employee share plans. Following a specific enquiry, each Director has confirmed he or she has complied with the code of conduct for transactions in Group securities throughout the year.
None of the Directors had, during the year or at the end of the year, a material interest, directly or
204
Back to Contents
indirectly, in any contract of significance with HSBC Holdings or any of its subsidiary undertakings.
The Board has appointed a number of committees consisting of certain Directors, Group Managing Directors and, in the case of the Corporate Social Responsibility Committee, certain co-opted non-director members. The following are the principal committees:
Group Management Board
The Group Management Board meets regularly and operates as a general management committee under the direct authority of the Board. The members of the Group Management Board are S K Green (Chairman), Sir John Bond, W F Aldinger, D G Eldon, D J Flint, M F Geoghegan and A W Jebson, all of whom are executive Directors, and C-H Filippi, S T Gulliver, Y A Nasr and J J Studzinski, all of whom are Group Managing Directors.
The Group Management Board exercises the powers, authorities and discretions of the Board in so far as they concern the management and day to day running of HSBC in accordance with such policies and directions as the Board may from time to time determine. Matters reserved for approval by the Board include annual plans and performance targets, procedures for monitoring and control of operations, specified senior appointments, acquisitions and disposals above predetermined thresholds and any substantial change in balance sheet management policy. The Group Management Board sub-delegates credit, investment and capital expenditure authorities to its members.
Group Audit Committee
The Group Audit Committee meets regularly with HSBC’s senior financial, internal audit, legal and compliance management and the external auditor to consider HSBC Holdings’ financial reporting, the nature and scope of audit reviews and the effectiveness of the systems of internal control and compliance. The members of the Group Audit Committee throughout 2004 were Sir Brian Moffat (Chairman), R K F Ch’ien and Sir John Kemp-Welch. R A Fairhead was appointed a member of the Committee with effect from 1 March 2004 and J D Coombe has been appointed a member of the Committee with effect from 1 July 2005. All members of the Committee are independent non-executive Directors.
The Board has determined that Sir Brian Moffat, R A Fairhead and, with effect from 1 July 2005,
J D Coombe may be regarded as audit committee financial experts for the purposes of section 407 of the Sarbanes Oxley Act and as having recent and relevant financial experience.
Since 2004 appointments to the Committee have been made for periods of up to three years, extendable by no more than two additional three-year periods, so long as members continue to be independent.
Formal and tailored induction programmes are held for newly appointed Committee members and appropriate training is provided on an ongoing and timely basis.
There were seven meetings of the Group Audit Committee during 2004. Sir John Kemp-Welch and Sir Brian Moffat attended all of the meetings and R K F Ch’ien attended five. R A Fairhead attended each of the five meetings held following her appointment.
At the beginning of each meeting the Committee meets with the external auditor, without management present, to facilitate the discussion of any matter relating to its remit and any issue arising from the audit. Similar arrangements have been adopted for the Committee to meet with the internal auditor.
The terms of reference of the Committee, which are reviewed annually, are available on www.hsbc.com by selecting ‘Investor Relations’, then ‘Corporate Governance’, then ‘Board Committees’.
The Group Audit Committee is accountable to the Board and assists the Board in meeting its responsibilities in ensuring an effective system of internal control and compliance and for meeting its external financial reporting obligations. The Committee is directly responsible on behalf of the Board for the selection, oversight and remuneration of the external auditor. The Committee receives frequent comprehensive reports from each of the Head of Group Compliance, the Group General Manager Legal and Compliance, the Group General Manager Internal Audit and the Head of Group Security and receives periodic presentations from other functional heads and line management.
The Committee monitors the integrity of the financial statements of HSBC Holdings, reviewing significant financial reporting judgements contained in them. During 2004 the Committee reviewed the HSBC Holdings 2003 Results Announcement, the Annual Report and Accounts 2003, the Annual Review 2003, Interim Results 2004 Announcement and the Interim Report 2004 before they were submitted to the Board.
205
Back to Contents
H S B C H O L D I N G S P L C
Report of the Directors (continued)
During 2004 the Committee received presentations on the implications of the introduction of International Financial Reporting Standards and the plans for implementing the standards within HSBC in 2005.
In undertaking its annual review of its own effectiveness the Committee discussed with the external auditor the effectiveness of the internal audit function. The Committee also receives summaries of periodic peer reviews of the internal audit functions around HSBC.
The Committee undertakes an annual review of the effectiveness of HSBC’s system of internal control, as set out on page 209.
The Committee reports on its activities at each Board meeting and, twice annually, produces a written summary of its activities.
The Committee has approved procedures for the receipt, retention and treatment of complaints regarding accounting, internal accounting controls and auditing matters, and the confidential and anonymous submission by employees of concerns regarding questionable accounting or auditing matters. The Committee receives regular reports regarding the nature, investigation and resolution of material complaints and concerns from the Head of Group Compliance.
The Committee reviews and monitors the external auditor's independence and objectivity and the effectiveness of the audit process, taking into consideration relevant professional and regulatory requirements. The Committee receives reports from the external auditor on their own policies and procedures regarding independence and quality control and oversees the appropriate rotation of audit partners with the external auditor.
The Group Audit Committee has adopted policies for the pre-approval of specific services that may be provided by the principal auditor, KPMG Audit Plc and its affiliates (‘KPMG’), since 2003. These policies are kept under review and amended as necessary to meet the dual objectives of ensuring that HSBC benefits in a cost effective manner from the cumulative knowledge and experience of its auditor whilst also ensuring that the auditor maintains the necessary degree of independence and objectivity. These pre-approval policies apply to all services where HSBC Holdings or any of its subsidiaries pays for the service, or is a beneficiary or addressee of the service and has selected, or influences the choice of, KPMG. In two instances in 2004, services provided by KPMG were inadvertently not pre-approved individually or
entered into pursuant to the pre-approval policies but were subsequently approved by the Group Audit Committee after the services had been rendered. Total fees billed for such services were US$15,000, which represents less than 0.01 per cent of the total non-audit fees billed by KPMG during 2004. All other services entered into with KPMG during 2004 were pre-approved by the Group Audit Committee or were entered into under pre-approval policies established by the Group Audit Committee.
The pre-approved services relate to the provision of objective advice, attestation type services or opinions on areas such as controls and are used as an input into management decision making. They fall into the following four categories:
Audit services
In addition to the statutory audit appointments, which are approved by the Group Audit Committee, this category includes services that are normally provided by the independent auditor in connection with statutory and regulatory filings or engagements, such as reviews of interim financial information, letters to securities underwriters in connection with debt or equity offerings, the inclusion of auditors’ reports in filings with the SEC and certain reports on internal control over financial reporting.
Audit-related services
These services are those provided by the principal auditor that are reasonably related to the performance of the audit or review of the Group’s financial statements. Examples of such services are due diligence services provided in connection with potential acquisitions, audits or reviews of employee benefit plans,ad hoc attestation or agreed-upon procedures reports (including reports requested by regulators), and accounting and regulatory advice on actual or contemplated transactions.
Tax services
This category includes both tax advice and compliance services. Examples of such services are advice on national and local income taxation matters, (including assistance in data gathering for preparation, review and submission as agent of tax filings), advice on tax consequences of management-proposed transactions and assistance in responding to tax examinations by governmental authorities. The pre-approved tax services explicitly exclude proposals for tax structures unconnected with a contemplated transaction and whose main motive is to reduce taxation.
206
Back to Contents
Other services
This category includes various other assurance and advisory services such as training or advice or assurance provided on specific elements of financial data and models, IT security and advice, and providing due diligence on financial reviews of HSBC customers and private equity investments.
All services provided by KPMG relating to the implementation of section 404 of the Sarbanes-Oxley Act were specifically pre-approved by the Group Audit Committee.
The remuneration paid to KPMG for each of the last three years is disclosed in Note 5(d) on page 258 of the ‘Notes on the Financial Statements’.
The Committee has recommended to the Board that KPMG Audit Plc be reappointed as Auditor at the forthcoming Annual General Meeting.
Remuneration Committee
The role of the Remuneration Committee and its membership are set out in the Directors’ Remuneration Report on page 216.
Nomination Committee
The Nomination Committee is responsible for leading the process for Board appointments and for identifying and nominating, for approval of the Board, candidates for appointment to the Board. Before recommending an appointment to the Board the Committee evaluates the balance of skills, knowledge and experience on the Board and, in the light of this identifies the role and capabilities required for a particular appointment. Candidates are considered on merit against these criteria. Care is taken to ensure that appointees have enough time to devote to HSBC. All Directors are subject to election by shareholders at the Annual General Meeting following their appointment and to re-election at least every three years. The members of the Nomination Committee throughout 2004 were Sir Brian Moffat (Chairman), Lord Butler and Baroness Dunn. Sir Brian Williamson was appointed a Member of the Committee on 1 October 2004.
There were two Nomination Committee meetings during 2004, each of which was attended by Sir Brian Moffat, Lord Butler and Baroness Dunn. There have been no meetings of the Committee since Sir Brian Williamson was appointed a member.
Following each meeting the Committee reports to the Board on its activities.
The terms of reference of the Committee are available on www.hsbc.com by selecting ‘Investor Relations’, then ‘Corporate Governance’, then ‘Board Committees’.
The appointments of R A Fairhead, J D Coombe and J W J Hughes-Hallett as non-executive Directors and M F Geoghegan as an executive Director were made on the advice and recommendation of the Nomination Committee. An external consultancy was used in connection with the appointments of R A Fairhead, J D Coombe and J W J Hughes-Hallett.
The Committee makes recommendations to the Board concerning plans for succession for both executive and non-executive directors; the appointment of any director to executive or other office; suitable candidates for the role of senior independent director; the re-election by shareholders of directors retiring by rotation; the renewal of the terms of office of non-executive directors; membership of Board Committees, in consultation with the Group Chairman and the chairman of such committee as appropriate; any matters relating to the continuation in office of any director at any time; directors’ fees and committee fees for the Company and any of its subsidiaries as appropriate; and appointments and re-appointments to the Boards of Directors of major subsidiary companies as appropriate.
The Committee regularly reviews the structure, size and composition of the Board and keeps under review the leadership needs of HSBC with a view to ensuring the continued ability of HSBC to compete effectively in the marketplace.
The Nomination Committee regularly reviews the structure, size and composition (including the skills, knowledge and experience) required of the Board and makes recommendations to the Board as appropriate. The Board has satisfied itself that the Nomination Committee has in place appropriate plans for orderly succession to the Board and Senior Management positions as well as procedures to ensure an appropriate balance of skills and experience within HSBC and on the Board.
Corporate Social Responsibility Committee
The Corporate Social Responsibility Committee is responsible for overseeing Corporate Social Responsibility and Sustainability policies, principally environmental, social and ethical matters and for advising the Board, committees of the Board and executive management on such matters. The terms of reference of the Committee are available on www.hsbc.com by selecting ‘Investor Relations’,
207
Back to Contents
H S B C H O L D I N G S P L C
Report of the Directors (continued)
then ‘Corporate Governance’ then ‘Board Committees’. The members of the Committee throughout 2004 were Lord Butler (Chairman), W K L Fung, S Hintze, C S Taylor, each of whom is an independent non-executive Director, and G V I Davis and Lord May, who are non-Director members of the Committee. Baroness Brigstocke was a non-Director member of the Committee until her untimely death in April 2004. E M Diggory was appointed as a non-Director member of the Committee on 26 November 2004.
There were four meetings of the Corporate Social Responsibility Committee during 2004. Following each meeting the Committee reports back to the Board on its activities.
Further information is available in HSBC’sCorporate Social Responsibility Report 2004, available in April 2005.
| Corporate Governance Codes |
|
| |
| HSBC is committed to high standards of corporate governance. HSBC Holdings complied throughout the year with the code provisions of the Combined Code on corporate governance appended to the Listing Rules of the Financial Services Authority and with the provisions of Appendix 14 to the Rules Governing the Listing of Securities on The Stock Exchange of Hong Kong Limited. |
Appendix 14 to the Rules Governing the Listing of Securities on The Stock Exchange of Hong Kong Limited was substantially revised during 2004. The new provisions of Appendix 14 will apply for subsequent reporting periods.
Differences in HSBC Holdings/New York Stock Exchange corporate governance practices
In November 2003, the US Securities and Exchange Commission approved the New York Stock Exchange’s (‘NYSE’) new corporate governance rules for listed companies. Under these new rules, as a NYSE-listed foreign private issuer, HSBC Holdings must disclose any significant ways in which its corporate governance practices differ from those followed by US companies subject to NYSE listing standards. HSBC Holdings believes the following to be the significant differences between its corporate governance practices and NYSE corporate governance rules applicable to US companies.
US companies listed on the NYSE are required to adopt and disclose corporate governance guidelines. The Listing Rules of the UK Financial
Services Authority require each listed company incorporated in the United Kingdom to include in its Annual Report and Accounts a narrative statement of how it has applied the principles of the Combined Code on Corporate Governance appended to the Listing Rules (‘Combined Code’) and a statement as to whether or not it has complied with the code provisions of the Combined Code throughout the accounting period covered by the Annual Report and Accounts. A company that has not complied with the Code provisions, or complied with only some of the Code provisions or (in the case of provisions whose requirements are of a continuing nature) complied for only part of an accounting period covered by the report, must specify the Code provisions with which it has not complied, and (where relevant) for what part of the reporting period such non-compliance continued, and give reasons for any non-compliance. As stated above, HSBC Holdings complied throug hout 2004 with the code provisions of the Combined Code. The Combined Code does not require HSBC Holdings to disclose the full range of corporate governance guidelines with which it complies.
Under NYSE standards, companies are required to have a nominating/corporate governance committee, composed entirely of independent directors. In addition to identifying individuals qualified to become board members, this committee must develop and recommend to the board a set of corporate governance principles. HSBC’s Nomination Committee, which follows the requirements of the Combined Code, includes a majority of members who are independent. All members of the Committee are non-executive Directors and three of the four members, including the Committee chairman, are independent non-executive Directors. The Committee’s terms of reference do not require the Committee to develop and recommend corporate governance principles for HSBC Holdings. As stated above, HSBC Holdings is subject to the corporate governance principles of the Combined Code.
Pursuant to NYSE listing standards, non-management directors must meet on a regular basis without management present and independent directors must meet separately at least once per year. During 2004, HSBC Holdings’ non-executive Directors met twice as a group with the Group Chairman, but with no other executive Directors present, and met once as a group without the Group Chairman or other executive Directors present. HSBC Holdings’ practice, in this regard, complies with the Combined Code.
208
Back to Contents
In accordance with the requirements of the Combined Code, HSBC Holdings discloses in its annual report how the Board, its committees and the Directors are evaluated and the results of the evaluation (on pages 217 to 222) and it provides extensive information regarding Directors’ compensation in the Directors’ Remuneration Report (on pages 216 to 233). The terms of reference of HSBC Holdings’ Audit, Nomination and Remuneration Committees are available on www.hsbc.com by selecting ‘Investor Relations’ then ‘Corporate Governance’ then ‘Board Committees’.
NYSE listing standards require US companies to adopt a code of business conduct and ethics for directors, officers and employees, and promptly disclose any waivers of the code for directors or executive officers. In addition to the Group Business Principles and Values, which apply to the employees of all HSBC companies, pursuant to the requirements of the Sarbanes-Oxley Act the Board of HSBC Holdings has adopted a Code of Ethics applicable to the Group Chairman, the Group Finance Director and Group Chief Accounting Officer. HSBC Holdings’ Code of Ethics is available on www.hsbc.com by selecting ‘Investor Relations’, then ‘Corporate Governance’, then ‘Obligations of Senior Financial Officers’. If the Board amends or waives the provisions of the Code of Ethics, details of the amendment or waiver will appear at the same website address. During 2004 HSBC Holdings made no amendments to it s Code of Ethics and granted no waivers from its provisions. The Group Business Principles and Values is available on www.hsbc.com by selecting ‘About HSBC’, then ‘HSBC in Society’, then ‘Living Our Values’, then ‘Our People’.
Under NYSE listing rules applicable to US companies, independent directors must comprise a majority of the board of directors. Currently, over half of HSBC Holdings’ Directors are independent.
Under the Combined Code the HSBC Holdings Board determines whether a director is independent in character and judgement and whether there are relationships or circumstances which are likely to affect, or could appear to affect, the director’s judgement. Under the NYSE rules a director cannot qualify as independent unless the board affirmatively determines that the director has no material relationship with the listed company; in addition the NYSE rules prescribe a list of circumstances in which a director cannot be independent. The Combined Code requires a company’s board to assess director independence by affirmatively concluding that the director is independent of management and free from any business or other
relationship that could materially interfere with the exercise of independent judgement.
Lastly, a chief executive officer of a US company listed on the NYSE must annually certify that he or she is not aware of any violation by the company of NYSE corporate governance standards. In accordance with NYSE listing rules applicable to foreign private issuers, HSBC Holdings’ Group Chairman is not required to provide the NYSE with this annual compliance certification. However, in accordance with rules applicable to both US companies and foreign private issuers, the Group Chairman is required promptly to notify the NYSE in writing after any executive officer becomes aware of any material non-compliance with the NYSE corporate governance standards applicable to HSBC Holdings.
From July 2005 HSBC Holdings will be required to submit annual and interim written affirmations of compliance with applicable NYSE corporate governance standards, similar to the affirmations required of NYSE listed US companies.
| Internal control |
|
| |
| The Directors are responsible for internal control in HSBC and for reviewing its effectiveness. Procedures have been designed for safeguarding assets against unauthorised use or disposition; for maintaining proper accounting records; and for the reliability of financial information used within the business or for publication. Such procedures are designed to manage rather than eliminate the risk of failure to achieve business objectives and can only provide reasonable and not absolute assurance against material errors, losses or fraud. The procedures also enable HSBC Holdings to discharge its obligations under the Handbook of Rules and Guidance issued by the Financial Services Authority, HSBC’s lead regulator. |
The key procedures that the Directors have established are designed to provide effective internal control within HSBC and accord with the Internal Control Guidance for Directors on the Combined Code issued by the Institute of Chartered Accountants in England and Wales. Such procedures have been in place throughout the year and up to 28 February 2005, the date of approval of theAnnual Report and Accounts 2004. In the case of companies acquired during the year, including Bank of Bermuda and Marks and Spencer Retail Financial Services Holdings Limited, the internal controls in place are being reviewed against HSBC’s benchmarks and integrated into HSBC’s systems.
209
Back to Contents
H S B C H O L D I N G S P L C
Report of the Directors(continued)
| HSBC’s key internal control procedures include the following: |
| | |
| • | Authority to operate the various subsidiaries is delegated to their respective chief executive officers within limits set by the Board of Directors of HSBC Holdings or by the Group Management Board under powers delegated by the Board. Sub-delegation of authority from the Group Management Board to individuals requires these individuals, within their respective delegation, to maintain a clear and appropriate apportionment of significant responsibilities and to oversee the establishment and maintenance of systems of controls appropriate to the business. The appointment of executives to the most senior positions within HSBC requires the approval of the Board of Directors of HSBC Holdings. |
| | |
| • | Functional, operating, financial reporting and certain management reporting standards are established by Group Head Office management for application across the whole of HSBC. These are supplemented by operating standards set by functional and local management as required for the type of business and geographical location of each subsidiary. |
| | |
| • | Systems and procedures are in place in HSBC to identify, control and report on the major risks including credit, changes in the market prices of financial instruments, liquidity, operational error, breaches of law or regulations, unauthorised activities and fraud. Exposure to these risks is monitored by asset and liability committees and executive committees in subsidiaries and by the Group Management Board for HSBC as a whole. |
| | |
| • | Customer groups, global product groups, key support functions and certain discrete geographies prepare strategic plans periodically within the framework of the Group Strategic Plan. Operating plans are required to be prepared and adopted by all HSBC members annually, setting out the key business initiatives and the likely financial effects of those initiatives. |
| | |
| • | Centralised functional control is exercised over all computer system developments and operations. Common systems are employed where possible for similar business processes. Credit and market risks are measured and reported on in subsidiaries and aggregated for review of risk concentrations on a group-wide basis. |
| • | Responsibilities for financial performance against plans and for capital expenditure, credit exposures and market risk exposures are delegated with limits to line management in the subsidiaries. In addition, functional management in Group Head Office has been given responsibility to set policies, procedures and standards in the areas of: finance; legal and regulatory compliance; internal audit; human resources; credit; market risk; operational risk; computer systems and operations; property management; and for certain global product lines. |
| | |
| • | Policies and procedures to guide subsidiary companies and management at all levels in the conduct of business to safeguard the Group’s reputation are established by the Board of HSBC Holdings, the Group Management Board, subsidiary company boards, board committees or senior management. Reputational risks can arise from social, ethical or environmental issues, or as a consequence of operational risk events. As a banking group, HSBC’s good reputation depends upon the way in which it conducts its business but it can also be affected by the way in which clients, to which it provides financial services, conduct their business. |
| | |
| • | The internal audit function, which is centrally controlled, monitors compliance with policies and standards and the effectiveness of internal control structures across the whole of HSBC. The work of the internal audit function is focused on areas of greatest risk to HSBC as determined by a risk-based approach. The head of this function reports to the Group Chairman and the Group Audit Committee. |
| | |
| The Group Audit Committee has kept under review the effectiveness of this system of internal control and has reported regularly to the Board of Directors. The key processes used by the Committee in carrying out its reviews include: regular reports from the heads of key risk functions; the production annually of reviews of the internal control framework applied at Group Head Office and major operating subsidiary level measured against HSBC benchmarks, which cover all internal controls, both financial and non-financial; annual confirmations from chief executives of principal subsidiary companies that there have been no material losses, contingencies or uncertainties caused by weaknesses in internal controls; internal audit reports; external audit reports; prudential reviews; and regulatory reports. |
210
Back to Contents
The Directors, through the Group Audit Committee, have conducted an annual review of the effectiveness of HSBC’s system of internal control covering all controls, including financial, operational and compliance controls and risk management.
| Reputational and operational risks |
|
HSBC regularly updates its policies and procedures for safeguarding against reputational and operational risks. This is an evolutionary process which takes account of The Association of British Insurers’ guidance on best practice when responding to social, ethical and environmental (‘SEE’) risks.
The safeguarding of HSBC’s reputation is of paramount importance to its continued prosperity and is the responsibility of every member of staff. HSBC has always aspired to the highest standards of conduct and, as a matter of routine, takes account of reputational risks to its business. The training of Directors on appointment includes reputational matters.
Reputational risks, including SEE matters, are considered and assessed by the Board, the Group Management Board, subsidiary company boards, board committees and/or senior management during the formulation of policy and the establishment of HSBC standards. Standards on all major aspects of business are set for HSBC and for individual subsidiary companies, businesses and functions. These policies, which form an integral part of the internal control systems, are communicated through manuals and statements of policy and are promulgated through internal communications and training. The policies cover SEE issues and set out operational procedures in all areas of reputational risk, including money laundering deterrence, environmental impact, anti-corruption measures and employee relations. The policy manuals address risk issues in detail and co-operation between head office departments and businesses is required to ensure a strong adherence to HSBC’s risk management system and its corporate social responsibility practices.
Internal controls are an integral part of how HSBC conducts its business. HSBC’s manuals and statements of policy are the foundation of these internal controls. There is a strong process in place to ensure controls operate effectively. Any significant failings are reported through the control mechanisms, internal audit and compliance functions to subsidiary company audit committees and to the Group Audit Committee, which keeps under review the effectiveness of the system of internal controls and reports regularly to HSBC Holdings’ Board. In
addition, all HSBC businesses and major functions are required to review their control procedures and to make regular reports about any losses arising from operational risks.
HSBC provides information in its Corporate Social Responsibility Report and website (www.hsbc.com/csr) on the extent to which it has complied with its risk management policies. Aspects covered include: how HSBC is implementing and applying the Equator Principles to manage the environmental and social risks in project finance; employee diversity; environmental management and health and safety. HSBC is using the guidelines of the Global Reporting Initiative in producing its 2004 report.
HSBC’s internal risk management procedures are supported by third party scrutiny and assurance. A commentary by The Corporate Citizenship Company in the Corporate Social Responsibility Report and website includes both assurance and forward-looking recommendations on HSBC’s SEE reporting. HSBC also provides external assurance through its participation in the Dow Jones Sustainability Index and Business in the Community’s Environment Index (HSBC’s feedback reports from which are included on our website) and FTSE4Good. Further details are contained in HSBC’sCorporate Social Responsibility Report 2004, available in April 2005.
The maintenance of appropriate health and safety standards throughout HSBC remains a key responsibility of all managers and HSBC is committed to actively managing all health and safety risks associated with its business. HSBC’s objectives are to identify, remove, reduce or control material risks of fires and of accidents or injuries to employees and visitors.
Health and Safety Policies, Group standards and procedures are set by Group Fire and Safety and are implemented by Health, Safety and Fire Coordinators based in each country in which HSBC operates.
HSBC faces a range of threats from terrorists and criminals across the world. In particular, over recent years the threat from international terrorism has become significant in a number of areas where HSBC operates. This threat has mainly manifested itself in bomb attacks such as the one in Istanbul in 2003 in which HSBC’s Turkish headquarters building was attacked. Despite suffering tragic loss of life and major damage, existing security measures and well-managed contingency procedures ensured
211
Back to Contents
H S B C H O L D I N G S P L C
Report of the Directors(continued)
the business was able to return to normal operations the following day.
Group Security provides regular risk assessments in areas of increased risk to assist management in judging the level of terrorist threat. In addition, Regional Security functions conduct regular security reviews to ensure measures to protect HSBC staff, buildings, assets and information are appropriate for the level of threat.
| Communication with shareholders |
|
Communication with shareholders is given high priority. Extensive information about HSBC’s activities is provided in theAnnual Report and Accounts,Annual Reviewand theInterim Reportwhich are sent to shareholders and on www.hsbc.com. There is regular dialogue with institutional investors and enquiries from individuals
on matters relating to their shareholdings and the business of HSBC are welcomed and are dealt with in an informative and timely manner. All shareholders are encouraged to attend the Annual General Meeting or the informal meeting of shareholders held in Hong Kong to discuss the progress of HSBC.
According to the registers of Directors’ interests maintained by HSBC Holdings pursuant to section 325 of the Companies Act 1985 and section 352 of the Securities and Futures Ordinance of Hong Kong, the Directors of HSBC Holdings at the year-end had the following interests, all beneficial unless otherwise stated, in the shares and loan capital of HSBC and its associated corporations:
| HSBC Holdings ordinary shares of US$0.50 |
| | | At 31 December 2004 |
| | |
|
| | | | | | | | | | Jointly | | | | | | | | Percentage |
| | At | | | | Child | | | | with | | | | | | | | of ordinary |
| | 1 January | | Beneficial | | under 18 | | | | another | | | | Equity | | Total | | shares |
| | 2004 | | owner | | or spouse | | Trustee | | person | | Other | | derivatives | 1 | interests | 2 | in issue |
| | | | | | | | | | | | | | | | | | |
| W F Aldinger | 1,378,974 | | 212,785 | | – | | 15,125 | 3 | – | | – | | 1,363,849 | | 1,591,759 | | 0.01 |
| Sir John Bond | 404,602 | | 385,096 | | 3,604 | | – | | 62,831 | | – | | – | | 451,531 | | 0.00 |
| R K F Ch’ien | 45,860 | | 47,796 | | – | | – | | – | | – | | – | | 47,796 | | 0.00 |
| Baroness Dunn | 154,362 | | 135,761 | | – | | – | | – | | 28,650 | 3 | – | | 164,411 | | 0.00 |
| D G Eldon | 47,094 | | – | | 942 | | – | | 98,904 | | – | | – | | 99,846 | | 0.00 |
| D J Flint | 51,928 | | 52,318 | | 1,953 | | 27,000 | | – | | – | | – | | 81,271 | | 0.00 |
| W K L Fung | 328,000 | | 328,000 | | – | | – | | – | | – | | – | | 328,000 | | 0.00 |
| M F Geoghegan | – | 4 | 37,795 | | – | | – | | – | | – | | – | | 37,795 | | 0.00 |
| S K Green | 198,758 | | 182,616 | | 15,688 | | – | | 45,355 | | – | | – | | 243,659 | | 0.00 |
| S Hintze | 2,037 | | 2,037 | | – | | – | | – | | – | | – | | 2,037 | | 0.00 |
| A W Jebson | 57,794 | | 83,628 | | – | | – | | – | | – | | – | | 83,628 | | 0.00 |
| Sir John Kemp- | | | | | | | | | | | | | | | | | |
| Welch | 411,800 | | 60,000 | | 5,000 | | 31,800 | 3 | – | | – | | – | | 96,800 | | 0.00 |
| Sir Brian Moffat | 10,746 | | – | | – | | – | | 11,157 | | – | | – | | 11,157 | | 0.00 |
| Sir Mark Moody- | | | | | | | | | | | | | | | | | |
| Stuart | 5,840 | | 5,000 | | 840 | | 5,000 | 3 | – | | – | | – | | 10,840 | | 0.00 |
| S W Newton | 5,000 | | 5,170 | | – | | – | | – | | – | | – | | 5,170 | | 0.00 |
| H Sohmen | 2,941,440 | | – | | 1,252,274 | | – | | – | | 2,017,873 | 5 | – | | 3,270,147 | | 0.03 |
| C S Taylor | 10,000 | | 9,500 | | – | | – | | – | | – | | 500 | | 10,000 | | 0.00 |
| Sir Brian | | | | | | | | | | | | | | | | | |
| Williamson | 15,222 | | 15,865 | | – | | – | | – | | – | | – | | 15,865 | | 0.00 |
| | |
| | |
| 1 | Under the Securities and Futures Ordinance of Hong Kong, interests in listed ADSs are categorised as equity derivatives. |
| 2 | Details of executive Directors’ other interests in HSBC Holdings ordinary shares of US$0.50 arising from share option plans and the Restricted Share Plan are set out in the Directors’ Remuneration Report on pages 229 to 233. |
| 3 | Non-beneficial. |
| 4 | Interests at 1 March 2004 – date of appointment. |
| 5 | Interests held by private investment companies. |
212
Back to Contents
Sir John Bond has an interest as beneficial owner in £290,000 of HSBC Capital Funding (Sterling 1) L.P. 8.208 per cent Non-cumulative Step-up Perpetual Securities, which he held throughout the year.
D G Eldon has an interest as beneficial owner in 300 Hang Seng Bank ordinary shares of HK$5.00 each, which he held throughout the year.
S K Green has an interest as beneficial owner in €75,000 of HSBC Holdings plc 5½ per cent Subordinated Notes 2009 and in £100,000 of HSBC Bank plc 9 per cent Subordinated Notes 2005, which he held throughout the year.
H Sohmen has a corporate interest in £1,200,000 of HSBC Bank plc 9 per centSubordinated Notes 2005 which he held throughout the year. During the year, his spouse ceased to have an interest in US$3,000,000 of HSBC Bank plc Senior Subordinated Floating Rate Notes 2009.
As Directors of CCF, S K Green andM F Geoghegan each have an interest as beneficial owner in one share of €5 in that company, which Mr Green held throughout the year and Mr Geoghegan acquired during the year. The Directors have waived their rights to receive dividends on these shares and have undertaken to transfer these shares to HSBC on ceasing to be Directors of CCF.
As Directors of HSBC Private Banking Holdings (Suisse), S K Green and M F Geoghegan each have an interest as beneficial owner in one share of CHF1,000, which Mr Green held throughout the year and Mr Geoghegan acquired during the year. The Directors have waived their
rights to receive dividends on these shares and have undertaken to transfer these shares to HSBC on ceasing to be Directors of HSBC Private Banking Holdings (Suisse).
At 31 December 2004, the aggregate interests of the executive Directors in HSBC Holdings ordinary shares of US$0.50 (each of which represents less than 0.005 per cent of the shares in issue, unless otherwise stated) under the Securities and Futures Ordinance of Hong Kong, including interests arising through share option plans, the Restricted Share Plan and, in the case of W F Aldinger, through an employee benefit trust as detailed in the Directors' Remuneration Report on pages 216 to 233, are: W F Aldinger – 16,324,412 (0.15 per cent of shares in issue); Sir John Bond – 1,194,046 (0.01 per cent of shares in issue); D G Eldon – 441,417; D J Flint – 511,862; M F Geoghegan – 300,775; S K Green – 771,599 (0.01 per cent of shares in issue); and A W Jebson – 533,659.
No directors held any short positions as defined in the Securities and Futures Ordinance of Hong Kong. Save as stated above and in the Directors' Remuneration Report, none of the Directors had an interest in any shares or debentures of any HSBC or associated corporation at the beginning or at the end of the year, and none of the Directors or members of their immediate family was awarded or exercised any right to subscribe for any shares or debentures during the year.
Since the end of the year, the interests of each of the following Directors have increased by the number of HSBC Holdings ordinary shares shown against their name:
HSBC Holdings ordinary shares of US$0.50
| | | | | | | | | | |
| | | | | Child | | | | | |
| | | Beneficial | | under 18 | | Jointly with | | Beneficiary | |
| | | owner | | or spouse | | another person | | of a trust | |
| W F Aldinger | | – | | – | | – | | 8,031 | 1 |
| Sir John Bond | | 65 | 2 | 25 | 3 | – | | 6,448 | 4 |
| R K F Ch’ien | | 365 | 5 | – | | – | | – | |
| Baroness Dunn | | 1,038 | 5 | – | | – | | – | |
| D G Eldon | | – | | 7 | 5 | 756 | 5 | 2,610 | 1 |
| D J Flint | | 427 | 6 | 14 | 3 | – | | 3,273 | 1 |
| M F Geoghegan | | 289 | 5 | – | | – | | 2,007 | 1 |
| S K Green | | 33 | 7 | 120 | 5 | – | | 4,013 | 1 |
| A W Jebson | | 640 | 5 | – | | – | | 3,441 | 1 |
| Sir Brian Moffat | | – | | – | | 85 | 5 | – | |
| S W Newton | | 39 | 5 | – | | – | | – | |
| Sir Brian Williamson | | 121 | 5 | – | | – | | – | |
| | | | | | | | | | |
| 1 | Scrip dividend on awards held under the Restricted Share Plan. |
| 2 | Comprises the automatic reinvestment of dividend income by an Individual Savings Account and Personal Equity Plan manager (32 shares), the acquisition of shares in the HSBC Holdings UK Share Ownership Plan through regular monthly contributions (28 shares) and the automatic reinvestment of dividend income on shares held in the plan (5 shares). |
213
Back to Contents
H S B C H O L D I N G S P L C
Report ofthe Directors(continued)
| 3 | The automatic reinvestment of dividend income by an Individual Savings Account and Personal Equity Plan manager. |
| 4 | Comprises scrip dividend on awards held under the Restricted Share Plan (5,658 shares) and on shares held in a Trust (790 shares). |
| 5 | Scrip dividend. |
| 6 | Comprises scrip dividend on shares held as beneficial owner (360 shares), the acquisition of shares in the HSBC Holdings UK Share Ownership Plan through regular monthly contributions (28 shares), the automatic reinvestment of dividend income on shares held in the plan (5 shares) and the automatic reinvestment of a cash dividend by an Individual Savings Account and Personal Equity Plan manager (34 shares). |
| 7 | Comprises the acquisition of shares in the HSBC Holdings UK Share Ownership Plan through normal monthly contributions (28 shares) and the automatic reinvestment of dividend income on shares held in the plan (5 shares). |
| | |
There have been no other changes in Directors’ interests from 31 December 2004 to the date of this Report. Any subsequent changes up to the last practicable date before the publication of the ‘Notice of Annual General Meeting’ will be set out in the notes to that Notice.
At 31 December 2004, Directors and Senior Management held, in aggregate, beneficial interests in 24,333,045 HSBC Holdings ordinary shares (0.2 per cent of the issued ordinary shares).
HSBC Holdings continues to regard communication with its employees as a key aspect of its policies. Information is given to employees about employment matters and about the financial and economic factors affecting HSBC’s performance through management channels, an intranet site accessible to all HSBC’s employees worldwide, in-house magazines and by way of attendance at internal seminars and training programmes. Employees are encouraged to discuss operational and strategic issues with their line management and to make suggestions aimed at improving performance. The involvement of employees in the performance of HSBC is further encouraged through participation in bonus and share plans as appropriate.
About half of all HSBC employees now participate in one or more of HSBC’s employee share plans.
| Employment of disabled persons |
|
HSBC Holdings continues to be committed to providing equal opportunities to employees. The employment of disabled persons is included in this commitment and the recruitment, training, career development and promotion of disabled persons is based on the aptitudes and abilities of the individual. Should employees become disabled during employment, every effort is made to continue their employment and, if necessary, appropriate training is provided.
HSBC Holdings subscribes to the Better Payment Practice Code for all suppliers, the four principles of which are: to agree payment terms at the outset and stick to them; to explain payment procedures to suppliers; to pay bills in accordance with any contract agreed with the supplier or as required by law; and to tell suppliers without delay when an invoice is contested and settle disputes quickly.
Copies of, and information about, the Code are available from: The Department of Trade and Industry, 1 Victoria Street, London SW1H 0ET; and the internet at www.dti.gov.uk/publications.
It is HSBC Holdings’ practice to organise payment to its suppliers through a central accounts function operated by its subsidiary undertaking, HSBC Bank. Included in the balance with HSBC Bank is the amount due to trade creditors which, at 31 December 2004, represented 16 days’ average daily purchases of goods and services received from such creditors, calculated in accordance with the Companies Act 1985, as amended by Statutory Instrument 1997/571.
| Notifiable interests in share capital |
|
According to the register maintained under section 211 of the Companies Act 1985, Legal and General Investment Management Limited notified HSBC Holdings on 13 June 2002 that it had an interest on 11 June 2002 in 284,604,788 HSBC Holdings ordinary shares, representing 3.01 per cent of the ordinary shares in issue at that date.
Credit Suisse First Boston notified HSBC Holdings on 8 February 2005 that it had an interest on 1 February 2005 in 482,122,209 HSBC Holdings ordinary shares, representing 4.31 per cent of the ordinary shares in issue at that date.
No substantial interest, being 5 per cent or more, in any of the equity share capital is recorded in the register maintained under section 336 of the Securities and Futures Ordinance of Hong Kong.
In compliance with the Rules Governing the Listing of Securities on The Stock Exchange of
214
Back to Contents
Hong Kong Limited at least 25 per cent of the total issued share capital of HSBC Holdings has been held by the public at all times during 2004 and up to the date of this Report.
| Dealings in HSBC Holdings shares |
|
Except for the dealings as intermediaries by HSBC Bank, HSBC CCF Financial Products (France) SNC and The Hongkong and Shanghai Banking Corporation, which are members of a European Economic Area exchange in market-making and other dealing activities, neither HSBC Holdings nor any subsidiary undertaking has bought, sold or redeemed any securities of HSBC Holdings during the year ended 31 December 2004.
During the year, HSBC made charitable donations totalling US$69.2 million. Of this amount, US$21.1 million was given for charitable purposes in the United Kingdom.
No political donations were made during the year.
At the Annual General Meeting in 2003 shareholders gave authority for HSBC Holdings and HSBC Bank to make EU political donations and incur EU political expenditure up to a maximum aggregate sum of £250,000 and £50,000 respectively over a four-year period as a precautionary measure in light of the wide
definitions in The Political Parties, Elections and Referendums Act 2000. These authorities have not been used.
The Annual General Meeting of HSBC Holdings will be held at the Barbican Hall, Barbican Centre, London EC2 on Friday 27 May 2005 at 11.00 am.
An informal meeting of shareholders will be held at Level 28, 1 Queen’s Road Central, Hong Kong on Tuesday 24 May 2005 at 4.30pm.
A live webcast of the Annual General Meeting will be available on www.hsbc.com. From shortly after the conclusion of the Meeting until 30 June 2005 a recording of the proceedings will be available on www.hsbc.com.
KPMG Audit Plc has expressed its willingness to continue in office. The Group Audit Committee and the Board recommend that it be reappointed. A resolution proposing the reappointment of KPMG Audit Plc as auditor of HSBC Holdings and giving authority to the Group Audit Committee to determine its remuneration will be submitted to the forthcoming Annual General Meeting.
| On behalf of the Board | |
| R G Barber,Secretary | 28 February 2005 |
215
Back to Contents
H S B C H O L D I N G S P L C
Directors’ Remuneration Report
The Remuneration Committee meets regularly to consider human resource issues, particularly terms and conditions of employment, remuneration, retirement benefits, development of high potential employees and key succession planning. The Remuneration Committee seeks to respond to the variety of environments and circumstances which are faced by different businesses in different markets at different times and has in place appropriate policies and procedures to monitor the size of the potential remuneration awards. The members of the Remuneration Committee throughout 2004 were Sir Mark Moody-Stuart (Chairman), W K L Fung and Sir John Kemp-Welch. S Hintze was appointed a member of the Committee on 30 January 2004.
There were seven meetings of the Remuneration Committee during 2004. Sir Mark Moody-Stuart and Sir John Kemp-Welch attended all of these meetings, W K L Fung attended five meetings and S Hintze attended five of the six meetings following her appointment. Following each meeting the Committee reports back to the Board on its activities. The terms of reference of the Committee are available on www.hsbc.com by selecting ‘Investor Relations’, then ‘Corporate Governance’, then ‘Board Committees’.
Towers Perrin, a firm of specialist human resources consultants, has been appointed by the Committee to provide independent advice on executive remuneration issues. As a global firm, Towers Perrin also provides other remuneration, actuarial and retirement consulting services to various parts of HSBC. Other than the provision of expert advice in these areas to the Remuneration Committee and to HSBC, Towers Perrin have no connection with HSBC. Other consultants are used from time to time to validate their findings. The Remuneration Committee also receives advice from the Group General Manager, Human Resources, J C S Rankin, and the Senior Executive, Group Reward Management, P M Wood.
| General Policy on Employees |
|
As with most businesses, HSBC’s performance depends on the quality and commitment of its people. Accordingly, the Board’s stated strategy is to attract, retain and motivate the very best people.
In a business that is based on trust and relationships, HSBC’s broad policy is to look for people who want to make a long-term career with the organisation since trust and relationships are built over time.
Remuneration is an important component in people’s decisions on which company to join, but it is not the only one; it is HSBC’s experience that people are attracted to an organisation with good values, fairness, the potential for success and the scope to develop a broad, interesting career.
Within the authority delegated by the Board of Directors, the Remuneration Committee is responsible for determining the remuneration policy of HSBC including the terms of bonus plans, share plans and other long-term incentive plans, and for agreeing the individual remuneration packages of executive Directors and other senior Group employees. No Directors are involved in deciding their own remuneration.
The Remuneration Committee applies the following key principles:
| • | to ensure that the total remuneration package (salary, bonus, long-term incentive awards and other benefits) is competitive in relation to comparable organisations in each of the countries or regions in which HSBC operates; |
| | |
| • | to offer fair and realistic salaries with an important element of variable pay, differentiated by performance; |
| | |
| • | through awards of shares (and in limited circumstances, share options) to recognise high performance and retain key talent; and |
| | |
| • | since 1996, to follow a policy of moving progressively from defined benefit to defined contribution Group pension schemes for new employees only. |
| | |
| | In line with these principles: |
| | |
| • | employees’ salaries are reviewed annually in the context of individual and business performance, market practice, internal relativities and competitive market pressures. Allowances and benefits are largely determined by local market practice; |
| | |
| • | employees participate in various bonus arrangements. The level of performance-related variable pay depends upon the performance of constituent businesses and the individual concerned. During 2004 variable bonus plans were reviewed to give greater emphasis to revenue growth whilst retaining a strong link to expense control; other key measures taken into account in determining individual bonus levels include customer relationships; full utilisation of professional skills; adherence to HSBC’s ethical standards, internal controls and procedures. Bonus ranges are reviewed in the context of |
216
Back to Contents
| | prevailing market practice; and |
| | |
| • | HSBC has a long history of paying close attention to its customers in order to provide value for shareholders. This has been achieved by ensuring that the interests of HSBC and its employees are aligned with those of its shareholders and that HSBC’s approach to risk management serves the interests of all. Accordingly, employees are encouraged to participate in the success they help to create, through participating in the HSBC Holdings savings-related share option plans and in local share ownership and profit sharing arrangements. |
During 2004, a comprehensive review of share-based remuneration arrangements was conducted. This review was undertaken in light of changing business needs, taking into account HSBC’s expansion in certain markets and an evolving external environment.
Approval for The HSBC Share Plan will be sought at the forthcoming Annual General Meeting. The proposed arrangements for the most senior executives of HSBC are described under ‘Long-term incentive plan’ on page 219. Shareholders and their representatives were consulted and the proposed arrangements reflect feedback that has been received.
Below the senior executive level and in the context of an employee’s total remuneration package, the practice of awarding share options at all levels within HSBC has been reconsidered. In future and commencing with awards to be made in 2005, restricted shares will be granted to a substantially smaller number of executives than those who previously received share options, with awards focused on those individuals who bring key talents and high levels of performance to the Group. These awards will normally vest after three years, subject to the individual remaining in employment. Awards of share options will only be granted in limited circumstances. For those who will normally no longer be eligible to receive awards of shares or share options, variable bonus arrangements have been reviewed and enhanced, as appropriate, taking account of local markets. Such changes may include an element of deferral.
To encourage greater participation in the HSBC Holdings Savings-Related Share Option Plan: (International), two amendments to existing arrangements will be proposed for approval at the forthcoming Annual General Meeting. The first is the introduction of the facility to save in US dollars, Hong Kong dollars and euros as well as in pounds
sterling. The maximum savings limit of £250 per month will continue to apply but be converted to the other currencies on a consistent and appropriate date. The second proposal is to offer individuals the choice of options over one year in addition to the existing three and five year terms. This change will carry tax advantages in certain jurisdictions.
The impact on existing equity of granting share options which are to be satisfied by the issue of new shares is shown in diluted earnings per share on the face of the consolidated profit and loss account, with further details disclosed in Note 10 of the ‘Notes on the Financial Statements’ on page 261. The effect on basic earnings per share of exercising all outstanding share options would be to dilute it by 0.6per cent.
At the Annual General Meeting in 2000, shareholders approved a limit of 848,847,000 ordinary shares (approximately 10 per cent of the ordinary shares then in issue), which may be issued or become issuable under all employee share plans in any ten year period. Within this limit, not more than 5 per cent of the ordinary shares in issue from time to time (approximately 560,000,000 ordinary shares at 28 February 2005) may be put under option under the HSBC Holdings Group Share Option Plan and the HSBC Holdings Restricted Share Plan 2000. In the ten year period to 31 December 2004, less than 650 million ordinary shares had been issued or could become issuable under all employee share plans and less than 350 million ordinary shares had been issued or could become issuable under discretionary employee share plans, including the HSBC Holdings Group Share Option Plan and the HSBC Holdings Restricted Share Plan 2000. At the forthcoming Annual General Meeting, revised limits on the number of shares that may be issued or become issuable under employee share plans will be proposed to reflect the increase in share capital since 2000.
| Directors and Senior Management |
|
HSBC’s operations are substantial, diverse and international; for example, over 73 per cent of profit before tax is derived from outside the United Kingdom.
With effect from 1 March 2005 the HSBC Holdings’ Board will comprise 15 non-executive Directors and seven executive Directors. With businesses in 77 countries and territories, HSBC aims to attract Directors with a variety of experience, both in its key areas of activity and internationally. The Board currently includes nationals of five different countries. The seven executive Directors, four Group Managing Directors and 23 Group
217
Back to Contents
H S B C H O L D I N G S P L C
Directors’ Remuneration Report (continued)
General Managers have in total more than 793 years of service with HSBC.
Directors’ fees
Directors’ fees are regularly reviewed and compared with other large international companies. The current fee, which was approved by shareholders in 2004, is £55,000 per annum. With effect from 1 January 2005 Sir John Bond, D J Flint, M F Geoghegan, S K Green and A W Jebson waived their rights to receive a Director’s fee from HSBC Holdings: an appropriate adjustment has been made to their basic salaries which, when taken with the consequent impact on bonuses, long-term incentive awards and pension benefits, will deliver a similar value to the fee that has been waived. W F Aldinger and D G Eldon had previously elected to waive any fees payable by HSBC Holdings.
In addition, non-executive Directors receive the following fees:
| Chairman, Audit Committee | £40,000 p.a. |
| Member, Audit Committee | £15,000 p.a. |
| | |
| During 2004, seven Audit Committee meetings were held. A Director’s commitment to each meeting, including preparatory reading and review, can be 15 hours or more. |
| | |
| Chairman, Remuneration Committee | £20,000 p.a. |
| Member, Remuneration Committee | £15,000 p.a. |
| |
| During 2004, seven meetings of the Remuneration Committee were held. |
| | |
| Chairman, Nomination Committee | £20,000 p.a. |
| Member, Nomination Committee | £15,000 p.a. |
| |
| During 2004, two meetings of the Nomination Committee were held. |
| | |
Chairman, Corporate Social Responsibility Committee | £20,000 p.a. |
Member, Corporate Social Responsibility Committee | £15,000 p.a. |
| | |
| During 2004, four meetings of the Corporate Social Responsibility Committee were held. |
Executive Directors
The executive Directors are experienced executives with detailed knowledge of the financial services business in various countries. In most cases there has been a need to attract them from abroad to work in the United Kingdom.
Consistent with the principles applied by the Committee to employees generally, there are four key components to the executive Directors’ remuneration:
| • | salary; |
| | |
| • | annual cash bonus; |
| • | long-term incentives; and |
| | |
| • | pension. |
To ensure that the executive Directors’remuneration packages are competitive having regard to the broad international nature of the Group, each year the Remuneration Committee considers market data on senior executive remuneration arrangements within primarily:
| • | European banks with significant domestic and/or global operations/influences; these banks include Barclays PLC, Standard Chartered PLC, The Royal Bank of Scotland Group plc, ABN AMRO Holding N.V., Banco Bilbao Vizcaya Argentaria, S.A., Banco Santander Central Hispano, S.A., BNP PARIBAS S.A., Commerzbank AG and Deutsche Bank AG; and |
| | |
| • | other global UK-based organisations with significant exposure to US markets and competitors, including BP p.l.c., Diageo plc, GlaxoSmithKline plc, Unilever PLC, Vodafone Group plc. |
The level of awards available to the executive Directors under the annual cash bonus scheme and as Performance Shares is entirely dependent on performance. Remuneration policy for executive Directors is intended to provide competitive rates of base salary but with the potential for the majority of the value of the remuneration package to be delivered in the form of both short and long-term incentives. This typically results in base salary comprising around 30 per cent of total direct pay and the remaining 70 per cent split between annual bonus and the expected value of Performance Share awards. The remuneration package of W F Aldinger has a smaller proportion of fixed salary and a higher proportion of annual bonus and Restricted Share awards. The awards are in accordance with the minimum level of awards set out under his employment agreement entered into on 14 November 2002 at the time of the acquisition of HSBC Finance Corporation (‘the 2002 employment agreement’).
It was noted by the Committee that the three-year term, and certain other terms, of the 2002 employment agreement represented an exception to HSBC’s normal policy for executive Directors’ service contracts, but that the background and reasons for this were explained in detail at the time of the acquisition and that the terms of the 2002 employment agreement were consistent with practice in the United States.
Since 31 December 2004, the Remuneration Committee has reviewed the financial and other
218
Back to Contents
terms proposed in connection with W F Aldinger’s retirement on 29 April 2005 which are reflected in the amendment agreement dated 26 February 2005 between HSBC Finance Corporation and Mr Aldinger, details of which are summarised below. The Committee, having reviewed the relevant factors and circumstances, considered that these financial and other terms were appropriate and in order and in the best interests of the Group.
Each component of executive Directors’ remuneration is explained in detail below.
Salary
The Committee reviews salary levels for executive Directors each year in the same context as other employees. With reference to market practice and taking account of the international nature of the Group, the Committee benchmarks the salary of each Director and member of Senior Management against those of comparable executives in large, diverse companies.
Base salaries with effect from January 2005 will be:
| | | | |
| W F Aldinger | | US$1,000,000 | |
| Sir John Bond | | £1,276,300 | |
| D G Eldon | | US$425,503 | |
| D J Flint | | £500,000 | |
| M F Geoghegan | | £632,500 | |
| S K Green | | £770,000 | |
| A W Jebson | | £535,000 | |
Excluding the effect of adjustments to salaries following the waivers by Sir John Bond, D J Flint, M F Geoghegan, S K Green and A W Jebson of their HSBC Holdings Director’s fee, this represents an average increase from 2004 of 5.02 per cent.
As an International Manager, D G Eldon’s current base salary, shown above, is calculated on a net basis.
Annual cash bonus
Cash bonuses for executive Directors are based on two key factors: individual performance, taking into account, as appropriate, results against plan of the business unit or performance of the support function for which the individual is responsible; and Group performance, measured by comparing operating profit before tax with plan. The Remuneration Committee has discretion to eliminate extraordinary items when assessing bonuses, if the main cause did not arise during the current bonus year.
Measurement against these key performance factors may result in discretionary cash bonuses of up to 250 per cent of basic salary for executive Directors.
Long-term incentive plan
Long-term incentive plans are designed to reward the delivery of sustained financial growth of HSBC. So as to align the interests of the Directors and senior employees more closely with those of shareholders, the vesting of Performance Share awards is subject to the attainment of predetermined performance criteria.
The Remuneration Committee has generally provided, on a discretionary basis and reflective of individual performance, long-term share incentives to executive Directors and members of Senior Management through conditional awards of Performance Shares under the HSBC Holdings Restricted Share Plan 2000, rather than through the HSBC Holdings Group Share Option Plan.
As part of a comprehensive review of share-based remuneration, the Remuneration Committee considered whether the continued use of Performance Shares was appropriate. The Committee considered several other types of arrangement but concluded that Performance Shares remain the most appropriate vehicle for HSBC’s executive Directors and Senior Management. However, the Committee recognised that there were a number of aspects to the current plan that could be improved to ensure the plan encouraged and rewarded growth and outperformance.
Accordingly, the adoption of The HSBC Share Plan, to replace the HSBC Holdings Restricted Share Plan 2000 and the HSBC Holdings Group Share Option Plan, will be proposed at the forthcoming Annual General Meeting. For executive Directors and members of Senior Management The HSBC Share Plan will:
| • | introduce absolute growth in earnings per share as a performance measure in addition to relative Total Shareholder Return; and |
| | |
| • | require higher levels of performance for full vesting of the conditional awards. |
The effect of these proposals is that the vesting of Performance Share awards will be more challenging and highly geared to performance than under the previous arrangements. To maintain the same approximate expected value (which takes into account factors such as the probability of vesting and risk of forfeiture for early departure) of Performance Share awards under The HSBC Share Plan as previously made under the HSBC Holdings Restricted Share Plan 2000, the face value of conditional awards under The HSBC Share Plan will be greater (as shown under ‘2005 Awards’ below) than those previously made under the HSBC
219
Back to Contents
H S B C H O L D I N G S P L C
Directors’ Remuneration Report(continued)
Holdings Restricted Share Plan 2000. It is proposed that awards under The HSBC Share Plan will be up to a maximum of seven times salary. Whilst having flexibility to make awards at this level in certain exceptional circumstances, the Remuneration Committee does not intend seven times salary to be the normal level of award. The average face value of the awards proposed for executive Directors is just over three times base salary; proposed individual awards are set out in the table below. Awards proposed for 2005 for Group Managing Directors and Group General Managers will generally be below two times salary.
Further details of the performance conditions and vesting arrangements for The HSBC Share Plan are set out below. A summary of the arrangements relevant to previous awards of Performance Shares under The HSBC Holdings Restricted Share Plan 2000 is also given. Subject to approval at the forthcoming Annual General Meeting, all future awards of Performance Shares, including the 2005 awards, will be made under The HSBC Share Plan.
2005 Awards
The Remuneration Committee is proposing that the conditional awards shown in the table below should be made to executive Directors in 2005. The table shows the face value of the full conditional awards and their approximate expected value.
| | Face | | | Expected | |
| | Value | | | Value | |
| | £000 | | | £000 | |
| | | | | | |
| Sir John Bond | 4,000 | | | 1,760 | |
| D J Flint | 1,500 | | | 660 | |
| M F Geoghegan | 2,000 | | | 880 | |
| S K Green | 2,500 | | | 1,100 | |
| A W Jebson | 1,415 | | | 622 | |
| |
| | |
| |
| Total | 11,415 | | | 5,022 | |
| |
| | |
| |
As set out above, the higher face value of these awards than in previous years is balanced by the significantly more challenging vesting schedule of The HSBC Share Plan where maximum value will only be released to the individual if Group performance is at a very high level.
The Trustee to the Plan will be provided with funds to acquire HSBC Holdings ordinary shares at an appropriate time after the announcement of the annual results.
Under the terms of the 2002 employment agreement entered into at the time of the acquisition of HSBC Finance Corporation, W F Aldinger is entitled to receive an award of US$5.5 million which was to be used to purchase Restricted Shares in
HSBC Holdings. However, as referred to below, Mr Aldinger is to retire on 29 April 2005 and it has been agreed that this award will not be made.
C F W de Croisset and W R P Dalton, who retired during 2004, did not receive a long-term incentive award in 2004.
D G Eldon, who is to retire at the forthcoming Annual General Meeting, will not receive a long-term incentive award in 2005.
Performance conditions
Subject to approval of The HSBC Share Plan at the forthcoming Annual General Meeting, awards of Performance Shares, commencing in 2005, will be divided into two equal parts to be subject to separate performance conditions measured over a three-year performance period:
| • | ‘The Total Shareholder Return (TSR) award’: one half of the award will be subject to a relative TSR measure. TSR is defined as the growth in share value and declared dividend income, measured in sterling, during the relevant period. In calculating TSR, dividend income is assumed to be reinvested in the underlying shares; and |
| | |
| • | ‘The earnings per share (‘EPS’) award’: the other half of the award will be based upon the absolute growth in EPS achieved by HSBC Holdings over the three-year performance period. |
The TSR element of the award will be based on HSBC’s ranking against a comparator group of 28 major banks. The comparator group will generally comprise the largest banks in the world measured in terms of market capitalisation, having regard to the geographic spread and the nature of the activities of each bank. The Remuneration Committee will use this criteria in selecting any replacements to the comparator group that may be necessary during the performance period, for example because a bank ceases to exist or to be quoted or if its relevance to HSBC as a comparator significantly diminishes.
The comparator group at 28 February 2005 comprises ABN AMRO Holding N.V., Banco Bilbao Vizcaya Argentaria S.A, Banco Santander Central Hispano S.A., Bank of America Corporation, The Bank of New York Company, Inc., Barclays PLC, BNP PARIBAS S.A., Citigroup Inc., Credit Agricole S.A., Credit Suisse Group, Deutsche Bank AG, HBOS plc, JPMorgan Chase & Co., Lloyds TSB Group plc, Mitsubishi Tokyo Financial Group, Inc., Mizuho Financial Group, Inc., Morgan Stanley, National Australia Bank Limited, Royal Bank of
220
Back to Contents
Canada, The Royal Bank of Scotland Group plc, Société Générale, Standard Chartered PLC, UBS AG, UniCredito Italiano Bank plc, US Bancorp, Wachovia Corporation, Wells Fargo & Company and Westpac Banking Corporation.
The extent to which awards will vest will be determined by reference to HSBC Holdings’ TSR measured against the comparator TSR. The calculation of the share price component within HSBC Holdings’ TSR will be the average market price over the 20 trading days commencing on the day when the annual results are announced, which in 2005 is 28 February. The starting point will be, therefore, the average over the period 28 February to 29 March inclusive. TSR for comparator group constituents will be calculated on the same basis.
For TSR performance in line with the bank ranked 14th, only 30 per cent of the conditional award will vest; if HSBC’s performance is in line with or above the bank ranked 7th in the ranked list all of the TSR award shares will vest.
Vesting between the 14th and 7th ranked banks will be based on HSBC’s position against the ranked list. In simple terms, the percentage vesting will rise in 10 per cent increments for each position that HSBC achieves higher than the 14th bank in the ranked list until full vesting is achieved for TSR performance equal to or greater than the 7th bank in the ranked list. Where HSBC’s performance falls between these incremental steps, account will be taken of how far above or below the next ranked bank HSBC’s TSR performance is positioned.
For example, if HSBC’s TSR falls half way between the bank ranked 12th (where, a release of 50 per cent of the award would occur) and the bank ranked 13th (where a release of 40 per cent of the award would occur), then the actual award released would be 45 per cent, i.e. half way between 40 per cent and 50 per cent.
For the EPS element of the award, the base measure shall be EPS for the financial year preceding that in which the award is made (‘the base year’). Absolute growth in EPS will then be compared with the base year over three consecutive financial years commencing with the year in which the award is made. The EPS growth element will be the absolute level of EPS achieved during the three-year performance period. For this purpose, EPS means the profit attributable to the shareholders (expressed in US dollars), excluding goodwill amortisation, divided by the weighted average number of ordinary shares in issue and held outside the Group during the year in question. In the event that the 2004 published EPS is restated to adjust for
accounting standards changes during the performance period, the restated published EPS will be used for the EPS performance condition for awards made in 2005 under The HSBC Share Plan.
The percentage of the conditional award vesting will depend upon the absolute growth in EPS achieved over the three years (‘the performance period’). 30 per cent of the conditional shares will vest if the incremental EPS over the performance period is 24 per cent or more of EPS in the base year.
The percentage of shares vesting will rise on a straight line proportionate basis to 100 per cent if HSBC’s incremental EPS over the performance period is 52 per cent or more of EPS in the base year.
No element of the ‘TSR award’ will vest if HSBC’s performance is below that of the bank ranked 14th in the ranked list and no element of the ‘EPS award’ will vest if HSBC’s incremental EPS over the performance period is less than 24 per cent of EPS achieved in the base year.
To the extent that the performance conditions have not been met at the third anniversary, the shares will be forfeited.
In addition, awards will only vest if the Remuneration Committee is satisfied that HSBC Holdings’ financial performance has shown a sustained improvement in the period since the date of grant.
In determining whether HSBC has achieved a sustained improvement in performance the Remuneration Committee will take account of, among other factors, the comparison against history and the peer group in the following areas:
| 1. | revenue growth; |
| | |
| 2. | revenue mix; |
| | |
| 3. | cost efficiency; |
| | |
| 4. | credit performance as measured by risk-adjusted revenues; and |
| | |
| 5. | cash return on cash invested, dividend performance and total shareholder return. |
Following the three-year performance period, awards of Performance Shares under The HSBC Share Plan will be tested and vesting will take place shortly afterwards.
Where events occur which cause the Remuneration Committee to consider that the performance condition has become unfair or impractical, the right is reserved to the Remuneration Committee to make such adjustments as in its absolute discretion it deems appropriate to make.
221
Back to Contents
H S B C H O L D I N G S P L C
Directors’ Remuneration Report(continued)
Awards will vest immediately in cases of death. In the event of redundancy, retirement on grounds of injury or ill health, early retirement, normal retirement and where a participant ceases to be employed by HSBC due to a company ceasing to be part of HSBC, awards will normally vest at the end of the vesting period on a time-apportioned basis to the extent that performance conditions have been satisfied. Awards will normally be forfeited if the participant is dismissed or resigns from HSBC. In all of these circumstances the Committee retains discretion to ensure fair and reasonable treatment.
Arrangements from 1999-2004
From 1999 to 2004, the vesting of awards was linked to the attainment of predetermined TSR targets over a three-year period from date of grant as set out below.
The TSR performance condition for awards of Performance Shares remained the same from 1999 to 2003. For awards made in 2004, changes were made to the peer group and re-testing provisions were eliminated such that awards will lapse if the performance condition is not satisfied after the initial three-year performance period.
A benchmark for HSBC Holdings’ TSR, weighted by market capitalisation, was established which takes account of the TSR performance of:
| 1. | a peer group of nine banks weighted by market capitalisation which were considered most relevant to HSBC in terms of size and international scope. For performance periods up to and including the one beginning in 2003, this group comprised ABN AMRO Holding N.V., The Bank of East Asia, Limited, Citigroup Inc., Deutsche Bank AG, JPMorgan Chase & Co., Lloyds TSB Group plc, Mitsubishi Tokyo Financial Group Inc., Oversea-Chinese Banking Corporation Limited and Standard Chartered PLC. To be more relevant to HSBC in terms of size and international scope, this peer group was amended for conditional awards made in 2004 and onwards by the replacement of Lloyds TSB Group plc, Oversea-Chinese Banking Corporation Ltd., Mitsubishi Tokyo Financial Group Inc. and The Bank of East Asia, Limited with Bank of America Corporation, The Royal Bank of Scotland Group plc, Banco Santander Central Hispano S.A. and UBS AG; |
| | |
| 2. | the five largest banks from each of the US, the UK, continental Europe and the Far East, other than any within paragraph 1 above, weighted by market capitalisation; and |
| | |
| 3. | the banking sector of the Morgan Stanley Capital International World Index, excluding any within paragraph 1 and paragraph 2 above, weighted by market capitalisation. |
By combining the weighted average TSR for each of the above three groups and weighting that average so that 50 per cent is applied to paragraph 1, 25 per cent is applied to paragraph 2 and 25 per cent is applied to paragraph 3, a single TSR benchmark for market comparison was determined.
The extent to which each award will vest will be determined by reference to HSBC Holdings’ TSR measured against the TSR benchmark. For each award the calculation of the share price component within HSBC Holdings’ TSR was the average market price over the 20 trading days commencing on the day when the annual results were announced. TSR for the benchmark constituents was based on their published share prices on the 20th trading day after the annual results were announced.
If HSBC Holdings’ TSR over the performance period exceeds the benchmark TSR, awards with a value, at the date of grant, of up to 100 per cent of the individual’s earnings, will vest. For higher value awards, the greater of 50 per cent of the award or the number of shares equating at the date of grant to 100 per cent of the individual’s earnings (base salary and bonus in respect of the previous performance year), will vest at this level of performance. If HSBC Holdings’ TSR over the performance period places it within the upper quartile in the ranked list against the benchmark, these higher value awards will vest in full. For performance between the median and the upper quartile, vesting will be on a straight-line basis.
For awards made in 2004, if the upper quartile performance target is achieved then, as before, an additional award equal to 20 per cent of the initial Performance Share award will be made and will vest at the same time as the original award to which it relates. However, regardless of whether the upper quartile is achieved, full vesting and transfer of the shares will not generally occur until the fifth anniversary of the date of grant. If the performance test is not passed at the third anniversary, the shares will be forfeited.
In addition to these performance conditions, none of the outstanding awards will vest unless the Remuneration Committee is satisfied that, during the performance period, HSBC has achieved a sustained improvement in performance. The Remuneration Committee retains discretion to recommend early release of shares awarded in certain circumstances, for example, redundancy and ill health.
222
Back to Contents
The Performance Shares awarded in 2000 passed their three-year TSR performance condition in March 2003 and will vest on the fifth anniversary of the award, 10 March 2005.
Total Shareholder Return
The graphs below show HSBC Holdings’ TSR performance against the benchmark TSR (graph 1), the Financial Times-Stock Exchange (‘FTSE’) 100 Index (graph 2), the Morgan Stanley Capital International (‘MSCI’) World Index (graph 3) and MSCI Financials Index (graph 4) over the three-year period to March 2004. These measures have been chosen as they are the main published indices against which HSBC monitors its performance.
Graph 1: HSBC TSR and Benchmark TSR

Graph 2: HSBC TSR and FTSE 100 Index

Graph 3: HSBC TSR and MSCI World Index

Graph 4: HSBC TSR and MSCI Financials Index

Pursuant to the Directors’ Remuneration Report Regulations 2002, graph 5 below shows HSBC Holdings’ TSR performance against a broad equity market index, the Financial Times-Stock Exchange (‘FTSE’) 100 Index, for the five-year period ended 31 December 2004.
Graph 5: HSBC TSR and FTSE 100 Index

Source: Datastream
Pensions
The pension entitlements earned by the executive Directors during the year are set out on pages 228 and 229.
Service contracts and terms of appointment
HSBC’s policy is to employ executive Directors on one-year rolling contracts although, on recruitment, longer initial terms may be approved by the Remuneration Committee. The Remuneration Committee will, consistent with the best interests of the Group, seek to minimise termination payments.
No executive Director has a service contract with HSBC Holdings or any of its subsidiaries with a notice period in excess of one year or with provisions for predetermined compensation on termination which exceeds one year’s salary and benefits in kind, save as referred to below. There are
223
Back to Contents
H S B C H O L D I N G S P L C
Directors’ Remuneration Report(continued)
no provisions for compensation upon early termination of executive Directors’ service contracts save for W F Aldinger, details of which are set out below.
As referred to above, Mr Aldinger entered into a new employment agreement with HSBC Finance Corporation on 14 November 2002 for a term of three years, such term to commence on the effective date of the acquisition of HSBC Finance Corporation by HSBC. Full details of the agreement were set out in the Discloseable Transaction Circular relating to the acquisition of HSBC Finance Corporation sent to shareholders on 26 February 2003 in advance of the Extraordinary General Meeting to approve the acquisition. The effective date of the acquisition, and commencement date of the 2002 employment agreement, was 28 March 2003. The terms of the 2002 employment agreement, were amended by an agreement (‘amendment agreement’) entered into between HSBC Finance Corporation and Mr Aldinger, as referred to below.
During the term of the 2002 employment agreement Mr Aldinger is entitled to be paid an annual base salary equal to his annual base salary as at the date of the merger agreement between HSBC Finance Corporation and HSBC (US$1 million) and an annual bonus in an amount at least equal to the annual average of Mr Aldinger’s bonuses earned with respect to the three-year period ended 2001 (pro rated for any partial year) (US$4 million). Within 30 days of the effective date of the acquisition, Mr Aldinger received a one-time special retention grant of HSBC Holdings ordinary shares under the HSBC Holdings Restricted Share Plan 2000 with a value equal to US$10 million on terms that these Restricted Shares will vest in three equal instalments on each of the first three anniversaries of the effective date, as set out on page 232. After each of the first and second anniversaries of the effective date, subject to the approval of the Trustee of the HSBC Holdings Restricted Share Plan 2000, Mr Aldinger is entitled to receive an additional grant of HSBC Holdings ordinary shares with a value equal to at least US$5.5 million. The purpose of these arrangements was to retain the services of Mr Aldinger through the initial integration of HSBC Finance Corporation. HSBC considered it essential that the experience, knowledge and skills of Mr Aldinger be retained for the benefit of HSBC shareholders.
Under the 2002 employment agreement, if Mr Aldinger’s employment is terminated by him during its term for ‘good reason’, or by HSBC
Finance Corporation for reasons other than ‘cause’ or disability, he is entitled to: apro ratatarget annual bonus for the financial year of the date of termination; a payment equal to his annual base salary, plus the average of his annual bonuses with respect to the three-year period ended 2001, times the number of full and partial months from the date of termination until the third anniversary of the effective date, divided by 12; the immediate vesting and exercisability of each stock option, restricted stock award and other equity-based award or performance award (or cash equivalent) that is outstanding as at the date of termination and treatment as retirement eligible for purposes of exercising any such award; for the remainder of his life and that of his current spouse, continued medical and dental benefits at HSBC Finance Corporation’s cost; and his retirement benefits (as set out on page 228) in a lump sum.
Following discussion with Mr Aldinger, it has been agreed that Mr Aldinger will retire as Chairman and Chief Executive of HSBC Finance Corporation and HSBC North America Holdings Inc on 29 April 2005 and will retire as a director of HSBC Holdings on the same date and resign from his directorships and other appointments with Group companies. As indicated above, the original purpose of the 2002 employment agreement was to retain the services of Mr Aldinger before the initial integration of HSBC Finance Corporation with the Group’s other North American businesses. The discussions with Mr Aldinger about his retirement before the expiry of the three-year term took into account that the integration process has now been completed successfully and faster than expected.
Under the amendment agreement, Mr Aldinger will be entitled to receive, on termination of the 2002 employment agreement on 29 April 2005, the same terms and benefits (summarised above) as if his employment had been terminated by him for ‘good reason’ or by HSBC Finance Corporation for reasons other than ‘cause’ or disability, except that he will not be entitled to receive the 2005 restricted share award (or cash equivalent) with a value to at least US$5.5 million that he would have been entitled to receive on or before 28 April 2005. Mr Aldinger will, however, receive a payment of US$4.6 million in lieu of salary and bonus in respect of the remainder of the three-year period. The amendment agreement also provides that the ‘non-competition’ provision in the 2002 employment agreement for a period of one year after termination of his employment, and certain other restrictions, will continue to apply. Under this provision he may not become associated with
224
Back to Contents
certain competitive entities that are actively engaged in the consumer lending business (including mortgage and credit card lending).
Sir John Bond, who is to stand for re-election at the forthcoming Annual General Meeting, is employed on a rolling contract dated 14 July 1994 which requires 12 months’ notice to be given by either party.
W R P Dalton, who retired as a Director on 28 May 2004, was employed on a rolling contract dated 5 January 1998 that required 12 months’ notice to be given by either party.
D G Eldon is employed on a rolling contract dated 1 January 1968 which requires three months’ notice to be given by either party. D G Eldon will retire as a Director at the conclusion of the forthcoming Annual General Meeting.
D J Flint, who is to stand for re-election at the forthcoming Annual General Meeting, is employed on a rolling contract dated 29 September 1995 which requires 12 months’ notice to be given by the Company and nine months’ notice to be given by Mr Flint.
M F Geoghegan is employed on a rolling contract dated 25 May 2004 which requires 12 months’ notice to be given by either party.
S K Green is employed on a rolling contract dated 9 March 1998 which requires 12 months’ notice to be given by either party.
A W Jebson is employed on a rolling contract dated 14 January 2000 which requires 12 months’ notice to be given by either party.
Members of Senior Management are employed on service contracts which generally provide for a term of service expiring at the end of a period of up to two years, or the individual’s sixtieth birthday, whichever is earlier.
Non-executive Directors are appointed for fixed terms not exceeding three years, subject to their re-election by shareholders at subsequent Annual General Meetings. Non-executive Directors have no service contract and are not eligible to participate in HSBC’s share plans. Non-executive Directors’ terms of appointment will expire as follows: in 2006, Baroness Dunn, Sir John Kemp-Welch, S W Newton, H Sohmen, C S Taylor and Sir Brian Williamson; in 2007, Lord Butler, R K F Ch’ien, R A Fairhead, W K L Fung, S Hintze, Sir
Brian Moffat and Sir Mark Moody-Stuart; and (assuming re-election at the 2005 Annual General Meeting) in 2008, J D Coombe and J W J Hughes-Hallett.
Other directorships
Executive Directors, if so authorised by either the Nomination Committee or the Board, may accept appointments as non-executive Directors of suitable companies which are not part of HSBC. Approval will not be given for executive Directors to accept a non-executive directorship of more than one FTSE 100 company. When considering a non-executive appointment, the Nomination Committee or Board will take into account the expected time commitment of such appointment. The time commitment for executive Directors’ external appointments will be reviewed as part of the annual Board review. Any remuneration receivable in respect of an external appointment is normally paid to the HSBC company by which the executive Director is employed, unless otherwise approved by the Remuneration Committee.
Sir John Bond retains his fees as a non-executive director of the Ford Motor Company, which are provided partly in the form of restricted shares, which become unrestricted over a period of five years. During 2004 the fees received were US$82,500 in cash and US$77,500 deferred into Ford common stock units. In addition, Ford provides US$200,000 of life assurance and US$500,000 of accidental death or dismemberment insurance. The life assurance can be continued after retirement from the Board or Sir John Bond could elect to have it reduced to US$100,000 and receive US$15,000 a year for life. The accidental death or dismemberment insurance ends upon retirement from the Board.
W F Aldinger retains his fees as a non-executive director of Illinois Tool Works, Inc. and as a non-executive director of AT&T Corp. During 2004 the fee received from Illinois Tool Works, Inc. was US$67,000 in the form of deferred stock and the fee received from AT&T Corp. was US$84,500 in cash and US$7,785 in cash instead of dividend due on deferred shares. In addition, AT&T Corp. provide travel accident insurance when on AT&T Corp. company business and US$100,000 of life assurance.
225
Back to Contents
H S B C H O L D I N G S P L C
Directors’ Remuneration Report (continued)
Employees’ emoluments
Set out below is information in respect of the five individuals who are not Directors of HSBC Holdings whose emoluments (excluding commissions or bonuses related to the revenue or profits generated by employees individually or collectively with others engaged in similar activities) were the highest in HSBC for the year ended 31 December 2004.
| | £000 | |
| | | |
| Basic salaries, allowances and benefits in kind | 976 | |
| Pension contributions | 90 | |
| Bonuses paid or receivable | 34,038 | |
| Inducements to join paid or receivable | 820 | |
| Compensation for loss of office | | |
| – contractual | – | |
| – other | – | |
| |
| |
| Total | 35,924 | |
| |
| |
| Total (US$000) | 65,803 | |
| |
| |
Their emoluments are within the following bands:
| | Number of | |
| | Employees | |
| | | |
| £4,600,001 – £4,700,000 | 1 | |
| £5,200,001 – £5,300,000 | 2 | |
| £7,300,001 – £7,400,000 | 1 | |
| £13,500,001 – £13,600,000 | 1 | |
The basic salaries of Group Managing Directors and Group General Managers are within the following bands:
| | Number of
Group Managing
Directors and Group
General Managers | |
| | | |
| £150,001 – £250,000 | 6 | |
| £250,001 – £350,000 | 17 | |
| £350,001 – £450,000 | 4 | |
| £450,001 – £550,000 | 1 | |
The aggregate remuneration of Directors and Senior Management for the year ended 31 December 2004 was US$118,290,000.
The aggregate amount set aside or accrued to provide pension, retirement or similar benefits for Directors and Senior Management for the year ended 31 December 2004 was US$6,261,000.
At 31 December 2004, executive Directors and Senior Management held, in aggregate, options to subscribe for 11,398,184 HSBC Holdings ordinary shares under the HSBC Holdings Executive Share Option Scheme, HSBC Holdings Group Share Option Plan and HSBC Holdings savings-related share option plans. These options are exercisable between 2005 and 2014 at prices ranging from £3.3334 to £8.2830.
226
Back to Contents
Directors’ emoluments
The emoluments of the Directors of HSBC Holdings for 2004 were as follows:
| | | | Salary and | | | | | | | | | |
| | | | other | | Benefits | | | | Total | | Total | |
| | Fees | | remuneration | | in kind | 1 | Bonuses | | 2004 | | 2003 | |
| | £000 | | £000 | | £000 | | £000 | | £000 | | £000 | |
| Executive Directors | | | | | | | | | | | | |
| W F Aldinger | – | 2 | 559 | | 79 | | 2,184 | 3 | 2,822 | | 2,157 | |
| Sir John Bond | 55 | | 1,183 | | 5 | | 2,406 | 4 | 3,649 | | 2,147 | |
| C F W de Croisset5 | 9 | | 71 | | – | | 2,116 | 5 | 2,196 | | 1,334 | |
| W R P Dalton6 | 23 | | 246 | | – | | 326 | 4 | 595 | | 631 | |
| D G Eldon7 | 31 | | 395 | | 435 | | 456 | 4 | 1,317 | | 1,180 | |
| D J Flint | 55 | | 603 | 8 | 8 | | 500 | 4 | 1,166 | | 1,057 | |
| M F Geoghegan9 | 46 | | 486 | | 14 | | – | 10 | 546 | | – | |
| S K Green | 55 | | 695 | | 7 | | 1,000 | 4 | 1,757 | | 1,237 | |
| AW Jebson | 55 | | 521 | | – | | 450 | 4 | 1,026 | | 958 | |
| | | | | | | | | | | | | |
| Non-executive Directors | | | | | | | | | | | | |
| Lord Butler | 90 | | – | | – | | – | | 90 | | 45 | |
| R K F Ch’ien | 186 | 11 | – | | – | | – | | 186 | | 159 | |
| Baroness Dunn | 70 | | – | | – | | – | | 70 | | 35 | |
| R A Fairhead9 | 58 | | – | | – | | – | | 58 | | – | |
| W K L Fung | 117 | 12 | – | | – | | – | | 117 | | 65 | |
| S Hintze | 85 | | – | | – | | – | | 85 | | 35 | |
| Sir John Kemp-Welch | 85 | | – | | – | | – | | 85 | | 55 | |
| Lord Marshall | 23 | | – | | – | | – | | 23 | | 35 | |
| Sir Brian Moffat | 115 | | – | | – | | – | | 115 | | 50 | |
| Sir Mark Moody-Stuart | 75 | | – | | – | | – | | 75 | | 50 | |
| S W Newton | 55 | | – | | – | | – | | 55 | | 35 | |
| H Sohmen | 39 | 13 | – | | – | | – | | 39 | | 25 | |
| C S Taylor | 95 | 14 | – | | – | | – | | 95 | | 64 | |
| Sir Brian Williamson | 59 | | – | | – | | – | | 59 | | 35 | |
| |
| |
| |
| |
| |
| |
| |
| Total | 1,481 | | 4,759 | | 548 | | 9,438 | | 16,226 | | 12,272 | 15 |
| |
| |
| |
| |
| |
| |
| |
| Total (US$000) | 2,713 | | 8,717 | | 1,004 | | 17,288 | | 29,722 | | 20,052 | |
| |
| |
| |
| |
| |
| |
| |
| 1 | Benefits in kind for executive Directors include provision of company car, medical insurance, other insurance cover and travel assistance. |
| 2 | W F Aldinger has elected to waive any fees payable to him by HSBC Holdings (2004: £55,000; 2003: £23,300). |
| 3 | Under the terms of his employment contract dated 14 November 2002, W F Aldinger is entitled to a bonus of US$4,000,000 in respect of 2004, which will be paid in 2005. |
| 4 | These discretionary bonuses are in respect of 2004 and will be paid in 2005. |
| 5 | Retired as a Director on 27 February 2004. He had a contract of employment dated 7 January 1980 that was in force before he joined the Board of CCF. The contract had no set term but provided for three months’ notice to be given by either party. Under the terms of the contract, Mr de Croisset would be entitled to receive one month's salary for each year of service with CCF on termination of his employment with CCF. In accordance with French legal requirements and practice, this contract was suspended while he served as an executive Director of CCF. In consideration of Mr de Croisset's early retirement from the Group and in light of French legal requirements, a review of market practice was undertaken and a one-off payment of ;€2,633,742 was made to Mr de Croisset, which was considered to be appropriate in all the circumstances. |
| 6 | Retired as a Director on 28 May 2004. |
| 7 | The emoluments of D G Eldon include a fee from The Hongkong and Shanghai Banking Corporation and housing and other expatriate benefits in kind that are normal within the location in which he is employed. Mr Eldon has elected to waive any fees payable to him by HSBC Holdings (2004: £55,000; 2003: £35,000). |
| 8 | Includes an executive allowance of £137,100 (2003: £96,863) paid to fund personal pension arrangements. |
| 9 | Appointed a Director on 1 March 2004. |
| 10 | In return for the prior waiver of bonus, the employer contribution into the pension scheme has been increased by the amount of £1,200,000 (2003: nil) which would otherwise have been paid. |
| 11 | Includes fees as non-executive Chairman of HSBC Private Equity (Asia) Limited and as a non-executive Director of The Hongkong and Shanghai Banking Corporation. |
| 12 | Includes fee as a non-executive Director of The Hongkong and Shanghai Banking Corporation. |
| 13 | Fees as a non-executive Director and member of the Audit Committee of The Hongkong and Shanghai Banking Corporation. H Sohmen has elected to waive any fees payable to him by HSBC Holdings (2004: £55,000; 2003: £35,000). |
| 14 | Includes fees as a non-executive Director of HSBC Bank USA and HSBC USA Inc. |
| 15 | Includes the emoluments of a Director who retired in 2003. |
227
Back to Contents
H S B C H O L D I N G S P L C
Directors’ Remuneration Report(continued)
Pensions
There are separate schemes for UK-based and overseas-based employees: the UK scheme has a normal retirement age of 60; retirement ages for overseas schemes vary in accordance with local legislation and practice. Save as stated below no other Director participated in any HSBC pension schemes, none of the Directors participating in HSBC’s UK ‘approved’ pension schemes is subject to the earnings cap introduced by the 1989 Finance Act and only basic salary is pensionable. With two exceptions (see paragraphs below on W F Aldinger and D J Flint), the current executive Directors are members of defined benefit pension schemes, having joined HSBC at a time when these were the norm.
Before commencement of the 2002 employment agreement on 28 March 2003, W F Aldinger participated in HSBC Finance Corporation’s ‘qualified’ and ‘non-qualified’ defined benefit pension plans. The annual pension benefit under these arrangements was a function of service and a percentage of Final Average Earnings (which included bonus). The ‘non-qualified plans’ were enhanced before commencement of the 2002 employment agreement. The benefits under the ‘qualified’ and ‘non-qualified’ defined benefit pension plans were then frozen and will be payable in a lump sum on the earlier of the termination of Mr Aldinger’s employment or on Mr Aldinger’s retirement (these benefits will be payable in a lump sum following Mr Aldinger’s retirement on 29 April 2005, referred to above). No further benefits have accrued under these arrangements since 28 March 2003.
Since commencement of the 2002 employment agreement on 28 March 2003, Mr Aldinger has continued to participate in the HSBC Finance Corporation Tax Reduction Investment Plan (‘TRIP’), which is a ‘qualified’ funded deferred profit-sharing and savings plan for eligible employees. Employer contributions of US$10,250 were made to this plan on behalf of Mr Aldinger in 2004 (2003: Nil). On 1 January 2005 the plan name was changed to HSBC-North America (U.S.) Tax Reduction Investment Plan (TRIP). Mr Aldinger also participated in Supplemental TRIP (a ‘non-qualified’ plan), which is an unfunded arrangement under which additional employer provision of US$289,749 has been made for 2004 (2003: US$41,539).
The pension arrangements for Sir John Bond, S K Green and A W Jebson to contractual retirement age of 60 are provided under the HSBC Bank (UK) Pension Scheme. The pensions accrue at a rate of one-thirtieth of pensionable salary per year of pensionable service in the UK.
Until his retirement from CCF on 29 February 2004, C F W de Croisset was eligible for pension benefits which were supplementary to those accrued under the French State and Compulsory arrangements. The amount of this supplementary pension, payable from age 60, accrued at the rate of €6,098 per annum for each year of service (maximum 18 years) as an executive Director of CCF. Consequent upon Mr de Croisset’s early retirement from CCF and following a review of market practice, it was agreed to provide a total pension of €341,467 per annum (equivalent to 32.5 per cent of his average total cash compensation over a three-year period) payable from 1 March 2004.In 2004, CCF paid €213,003 to Mr de Croisset under this arrangement.
The pension arrangements for W R P Dalton to contractual retirement age of 60 were provided on a defined benefit basis (details of which are set out in the table below) under the HSBC Canada Pension Plan A, at an accrual rate of one-thirtieth of pensionable salary per year of pensionable service until his transfer to the UK in 1998. On taking up his appointment in the UK, he joined the HSBC Holdings Overseas (No.1) Pension Plan on a defined contribution basis, with an employer contribution in respect of 2004 of £129,000 (2003: £1,379,000 inclusive of a bonus waiver of £1,250,000).
The pension arrangements for D J Flint to contractual retirement age of 60 are provided through an executive allowance paid to fund personal pension arrangements set at 30 per cent of basic salary. This is supplemented through the HSBC Holdings plc Funded Unapproved Retirement Benefits Scheme on a defined contribution basis with an employer contribution during 2004 of £86,013 (2003: £81,943). The intention of these arrangements is to provide benefits broadly comparable to an accrual rate of one-thirtieth of pensionable salary for each year of pensionable service.
The pension arrangements for D G Eldon and M F Geoghegan are provided under the HSBC International Staff Retirement Benefits Scheme. The pensions accrue at a rate of one twenty-seventh of pensionable salary per year of pensionable service. In addition, Mr Geoghegan has joined the HSBC Asia Holdings Pension Plan, on a defined contribution basis, with an employer contribution in respect of 2004 of £1,200,000, arising entirely from a bonus sacrifice. There were no other employer contributions made to this plan.
228
Back to Contents
| | | | | | | | | | | | | | | | | | | Transfer value | |
| | | | | | | | | | | | | | | | | | | (less personal | |
| | | | | | | | | | | | | | | | | | | contributions) | |
| | | | | | | | | | | | | | | | | | | at | |
| | | | | | | | | | | | | | | | | | | 31 December | |
| | | | | | | | | | | | | | | | | | | 2004 relating | |
| | | | | | | Increase in | | | | | | | | | Increase of | | | to increase | |
| | | | | | | accrued | | | Transfer | | | Transfer | | | transfer value | | | in accrued | |
| | | Accrued | | Increase in | | pension during | | | value | | | value | | | of accrued | | | pensions | |
| | | annual | | accrued | | 2004, | | | of accrued | | | of accrued | | | pension (less | | | during 2004, | |
| | | pension at | | pension | | excluding | | | pension at | | | pension at | | | personal | | | excluding any | |
| | | 31 December | | during | | any increase | | | 1 January | | | 31 December | | | contributions) | | | increase for | |
| | | 2004 | | 2004 | | for inflation | | | 2004 | | | 2004 | | | in 2004 | | | inflation | |
| | | £000 | | £000 | | £000 | | | £000 | 1 | | £000 | 1 | | £000 | 1 | | £000 | 1 |
| | | | | | | | | | | | | | | | | | | | |
| Sir John Bond2 | | 481 | | 57 | | 44 | | | 7,924 | | | 9,230 | | | 1,306 | | | 840 | |
| C F W de Croisset3 | | 193 | | 128 | | 128 | | | 860 | | | 2,623 | | | 1,763 | | | 1,747 | |
| W R P Dalton4 | | 13 | | 3 | | (3 | ) | | 4,258 | | | 4,562 | | | 304 | | | 226 | |
| D G Eldon5 | | 278 | | 27 | | 18 | | | 5,045 | | | 5,275 | | | 328 | 6 | | 215 | 6 |
| M F Geoghegan7 | | 185 | | 34 | | 29 | | | 3,652 | | | 4,042 | | | 620 | 8 | | 376 | 8 |
| S K Green | | 288 | | 110 | | 105 | | | 2,367 | | | 4,401 | | | 2,034 | | | 1,599 | |
| A W Jebson | | 182 | | 41 | | 37 | | | 1,769 | | | 2,612 | | | 843 | | | 529 | |
| 1 | The transfer value represents a liability of HSBC’s pension funds and not a sum paid or due to the individual; it cannot therefore meaningfully be added to annual remuneration. |
| 2 | On attaining age 60, Sir John Bond has been able, under the terms of the scheme, to retire at any time with an immediate pension equal to his accrued pension which, at 31 December 2004, is shown above. |
| 3 | Retired as a Director on 27 February 2004. |
| 4 | W R P Dalton retired from HSBC with effect from 31 May 2004 with a gross pension of £277,000 per annum. Mr Dalton elected to commute part of this pension for a lump sum payment of £4,256,000, leaving a residual pension of £13,000 per annum. As a result the pension in payment at 31 December 2004 is lower than the accrued pension at 1 January 2004. The increase in accrued pension during 2004 reflects the gross pension before commutation. The transfer value of benefits at 31 December 2004 reflects both the pension in payment and the commutation lump sum, increased with interest. |
| 5 | On attaining age 53, D G Eldon has been able, under the terms of the scheme, to retire at any time with an immediate pension equal to his accrued pension which, at 31 December 2004, is shown above. |
| 6 | D G Eldon made personal contributions towards his pension of £15,445 in respect of 2004. |
| 7 | Appointed as a Director on 1 March 2004. |
| 8 | M F Geoghegan made personal contributions towards his pension of £14,182 in respect of 2004. |
In addition to the unfunded pension payments as from 1 March 2004 to C F W de Croisset referred to above, the following unfunded pension payments, in respect of which provision has been made, were made during 2004 to four former Directors of HSBC Holdings:
| | 2004 | | 2003 | |
| | £ | | £ | |
| B H Asher | 85,443 | | 83,277 | |
| R Delbridge | 122,891 | | 119,777 | |
| Sir Brian Pearse | 51,246 | | 49,947 | |
| Sir William Purves | 90,453 | | 88,158 | |
| |
| |
| |
| | 350,033 | | 341,159 | |
| |
| |
| |
The payments in respect of R Delbridge and Sir Brian Pearse were made by HSBC Bank plc as former Directors of the bank.
Share options
At 31 December 2004, the undernamed Directors held options to acquire the number of HSBC Holdings ordinary shares set against their respectivenames. The options were awarded for nil consideration at exercise prices equivalent to the market value at the date of award, except that options awarded under the HSBC Holdings savings-related share option plans before 2001 are exercisable at a 15 per cent discount to the market value at the date of award and those awarded since 2001 at a 20 per cent discount. Under the Securities and Futures Ordinance of Hong Kong the options are categorised as unlisted physically settled equity derivatives.
Except as otherwise indicated, no options were exercised or lapsed during the year and there are no remaining performance criteria conditional upon which the outstanding options are exercisable. The market value of the ordinary shares at 31 December 2004 was £8.79. The highest and lowest market values during the year were £9.535 and £7.84. Market value is the mid-market price derived from the London Stock Exchange Daily Official List on the relevant date.
229
Back to Contents
H S B C H O L D I N G S P L C
Directors’ Remuneration Report(continued)
| | Options | | Options | | Options | | Options | | | | | | | | |
| | held at | | awarded | | exercised | | held at 31 | | | | | | | | |
| | 1 January | | during | | during | | December | | Exercise | | Date of | | Exercisable | | Exercisable |
| | 2004 | | year | | year | | 2004 | | price (£) | | award | | from | 1 | until |
| | | | | | | | | | | | | | | | |
| Sir John Bond | 2,798 | | – | | – | | 2,798 | 2 | 6.0299 | | 10 Apr 2000 | | 1 Aug 2005 | | 31 Jan 2006 |
| | | | | | | | | | | | | | | | |
| C F W de Croisset3 | 206,000 | | – | | – | | 206,000 | 4 | 8.7120 | | 23 Apr 2001 | | 23 Apr 2004 | | 23 Apr 2011 |
| | 206,000 | | – | | – | | 206,000 | 4 | 8.4050 | | 7 May 2002 | | 7 May 2005 | | 7 May 2012 |
| | 206,000 | | – | | – | | 206,000 | 5 | 6.9100 | | 2 May 2003 | | 2 May 2006 | | 1 May 2013 |
| | | | | | | | | | | | | | | | |
| W R P Dalton6 | 2,798 | 2 | – | | – | | 2,798 | 7 | 6.0299 | | 10 Apr 2000 | | 1 Aug 2005 | | 31 Jan 2006 |
| | | | | | | | | | | | | | | | |
| D J Flint | 27,000 | | – | | 27,000 | 8 | – | | 3.3334 | | 1 Apr 1996 | | 1 Apr 1999 | | 1 Apr 2006 |
| | 2,617 | | – | | – | | 2,617 | 2 | 6.3224 | | 2 May 2002 | | 1 Aug 2007 | | 31 Jan 2008 |
| M F Geoghegan | 1,248 | 2,9 | – | | 1,248 | 10 | – | | 5.3980 | | 1 Apr 1999 | | 1 Aug 2004 | | 31 Jan 2005 |
| | 559 | 9 | – | | – | | 559 | 2 | 6.0299 | | 10 Apr 2000 | | 1 Aug 2005 | | 31 Jan 2006 |
| | 573 | 2,9 | – | | 573 | 10 | – | | 6.7536 | | 11 Apr 2001 | | 1 Aug 2004 | | 31 Jan 2005 |
| S K Green | 3,070 | | – | | – | | 3,070 | 2 | 5.3496 | | 23 Apr 2003 | | 1 Aug 2008 | | 31 Jan 2009 |
| | | | | | | | | | | | | | | | |
| A W Jebson | 1,434 | 2 | – | | 1,434 | 11 | – | | 6.7536 | | 11 Apr 2001 | | 1 Aug 2004 | | 31 Jan 2005 |
| 1 | May be advanced to an earlier date in certain circumstances, e.g. retirement. |
| 2 | Options awarded under the HSBC Holdings Savings-Related Share Option Plan. |
| 3 | Retired as a Director on 27 February 2004. |
| 4 | Options held under the HSBC Holdings Group Share Option Plan at date of retirement as a Director (27 February 2004). In accordance with the transitional arrangements agreed with CCF in 2000 the awards were not subject to performance conditions. |
| 5 | Options held under the HSBC Holdings Group Share Option Plan at date of retirement as a Director (27 February 2004). In accordance with the transitional arrangements agreed with CCF in 2000, vesting of 50 per cent of the award is subject to the performance tests set out in the section headed ‘Arrangements from 1999-2004’ on pages 220 to 222. |
| 6 | Retired as a Director on 28 May 2004. |
| 7 | Options held at date of retirement as a Director (28 May 2004). On 11 November 2004, in accordance with the rules of the Plan, the option was exercised in respect of 2,070 ordinary shares and options over 728 shares lapsed. At the date of exercise the market value per share was £9.38. |
| 8 | At the date of exercise, 4 March 2004, the market value per share was £ 8.515. The exercise of these options was conditional upon the growth in earnings per share over a three-year period being equal to or greater than a composite rate of inflation (comprising 50 per cent of the Hong Kong Composite Consumer Price Index, 35 per cent of the UK Retail Price Index and 15 per cent of the USA All Urban Consumer Price Index) plus 2 per cent per annum. This condition has been satisfied. |
| 9 | Interests at date of appointment as a Director (1 March 2004). |
| 10 | At the date of exercise, 16 August 2004, the market value per share was £8.265. |
| 11 | At the date of exercise, 2 August 2004, the market value per share was £8.335. |
At 27 February 2004, the date he retired as a Director, C F W de Croisset held the following options to acquire CCF shares of €5 each. On exercise of these options each CCF share will be exchanged for 13 HSBC Holdings ordinary shares. The options were granted by CCF for nil consideration at a 5 per cent discount to the market
value at the date of award. There are no remaining performance criteria conditional upon which the outstanding options are exercisable. Save as indicated in the following table no options over CCF shares were awarded to or exercised by Mr de Croisset during 2004.
230
Back to Contents
CCF
shares of €
| | | | | | Equivalent | | | | | | | |
| | | | | | HSBC Holdings | | | | | | | |
| Options held | | | Options held | | ordinary shares | | | | | | | |
| at 1 January | Exercise price | | at 27 February | | at 27 February | | Date | | Exercisable | | Exercisable | |
| 2004 | per share (€) | | 2004 | | 2004 | | of award | | from | | until | |
| | | | | | | | | | | | | |
| 10,000 | 32.78 | | 10,000 | 1 | 130,000 | | 23 Jun 1994 | | 23 Jun 1996 | | 23 Jun 2004 | |
| 30,000 | 34.00 | | 30,000 | | 390,000 | | 22 Jun 1995 | | 22 Jun 1997 | | 22 Jun 2005 | |
| 30,000 | 35.52 | | 30,000 | | 390,000 | | 9 May 1996 | | 9 May 1998 | | 9 May 2006 | |
| 30,000 | 37.05 | | 30,000 | | 390,000 | | 7 May 1997 | | 7 Jun 2000 | | 7 May 2007 | |
| 30,000 | 73.50 | | 30,000 | | 390,000 | | 29 Apr 1998 | | 7 Jun 2000 | | 29 Apr 2008 | |
| 28,000 | 81.71 | | 28,000 | | 364,000 | | 7 Apr 1999 | | 7 Jun 2000 | | 7 Apr 2009 | |
| 28,000 | 142.50 | | 28,000 | | 364,000 | | 12 Apr 2000 | | 1 Jan 2002 | | 12 Apr 2010 | |
| | | | | | | | | | | | | |
| 1 | Options exercised on 24 March 2004. At the date of exercise the market value per HSBC Holdings ordinary share was £8.21. |
At 31 December 2004, W F Aldinger held options to acquire HSBC Holdings ordinary shares as set out in the table below. These options arise from options he held over shares of Household International (now HSBC Finance Corporation) before its acquisition, which were converted into options over HSBC Holdings ordinary shares in the same ratio as the offer for HSBC Finance Corporation (2.675 HSBC
HSBC Holdings ordinary shares of US$0.50
Holdings ordinary shares for each HSBC Finance Corporation common share) and the exercise prices per share adjusted accordingly. The HSBC Finance Corporation options were granted at nil consideration.
No options over HSBC Holdings ordinary shares were awarded to Mr Aldinger during 2004.
| Options held | | | Options | | Options held | | | | | | | |
| at 1 January | Exercise price | | exercised | | at 31 December | | Date of | | Exercisable | | Exercisable | |
| 2004 | per share (US$) | | during year | | 2004 | | award | | from | | until | |
| | | | | | | | | | | | | |
| 971,025 | 7.43 | | 971,025 | 1 | – | | 13 Nov 1995 | | 13 Nov 1996 | | 13 Nov 2005 | |
| 1,003,125 | 11.43 | | 1,003,125 | 2 | – | | 11 Nov 1996 | | 11 Nov 1997 | | 11 Nov 2006 | |
| 1,203,750 | 14.60 | | – | | 1,203,750 | | 10 Nov 1997 | | 10 Nov 1998 | | 10 Nov 2007 | |
| 1,337,500 | 13.72 | | – | | 1,337,500 | | 9 Nov 1998 | | 9 Nov 1999 | | 9 Nov 2008 | |
| 1,230,500 | 16.96 | | – | | 1,230,500 | | 8 Nov 1999 | | 8 Nov 2000 | | 8 Nov 2009 | |
| 1,605,000 | 18.40 | | – | | 1,605,000 | | 13 Nov 2000 | | 13 Nov 2001 | | 13 Nov 2010 | |
| 2,140,000 | 21.37 | | – | | 2,140,000 | | 12 Nov 2001 | | 12 Nov 2002 | | 12 Nov 2011 | |
| 2,140,000 | 10.66 | | – | | 2,140,000 | | 20 Nov 2002 | | 20 Nov 2003 | 3 | 20 Nov 2012 | |
| | | | | | | | | | | | | |
| 1 | At the date of exercise, 2 September 2004, the market value per share was £8.755. |
| 2 | At the date of exercise, 7 December 2004, the market value per share was £8.855. |
| 3 | 535,000 options are exercisable on each of the first, second, third and fourth anniversaries of the date of award. May be advanced, under the terms of the HSBC Finance Corporation stock option plan, to an earlier date in certain circumstances e.g. retirement. 1,070,000 options remaining unvested will therefore vest on Mr Aldinger’s retirement on 29 April 2005. Based on the market price of HSBC Holdings shares on 24 February 2005 and after deduction of the option subscription price these options have a value of approximately £3,512,000. |
As a beneficiary of an employee benefit trust W F Aldinger has an interest in the HSBC Holdings ordinary shares held by the trust which may be used to satisfy exercises of his share options. Under the Securities and Futures Ordinance of Hong Kong, the interest is categorised as a ‘beneficiary of a trust’. At 31 December 2004, the trust held 1,525,850 HSBC
Holdings ordinary shares and 500,000 ADSs.
Save as stated above, none of the Directors, or members of their immediate families, were awarded or exercised any right to subscribe for any shares or debentures during the year.
231
Back to Contents
H S B C H O L D I N G S P L C
Directors’ Remuneration Report (continued)
Restricted Share Plan
HSBC Holdings ordinary shares of US$0.50
| | | | | | | | | | Monetary | | | | | | | |
| | | | | | Monetary | | | | value of | | | | | | | |
| | | | | | value of | | | | awards | | | | | | | |
| | Awards | | | | awards made | | Awards | | vested | | Awards | | | | Year in | |
| | held at | | Awards made | | during | | vested | | during | | held at | | | | which | |
| | 1 January | | during the | | the year | | during | | the year | | 31 December | | Date of | | awards | |
| | 2004 | | year | | £000 | | the year | 1 | £000 | | 2004 | 1 | award | | may vest | |
| | | | | | | | | | | | | | | | | |
| W F Aldinger | 960,662 | | – | | – | | 319,521 | 2 | 2,585 | | 670,821 | | 15 Apr 2003 | | 2005 to 2006 | 3 |
| | – | | 372,587 | 4 | 3,068 | | – | | – | | 379,232 | | 10 May 2004 | | 2005 to 2007 | 5 |
| Sir John Bond | 71,386 | | – | | – | | 71,948 | 6 | 613 | | – | | 4 Mar 1999 | | 2004 | |
| | 89,621 | | – | | – | | – | | – | | 93,405 | | 10 Mar 2000 | | 2005 | |
| | 83,988 | | – | | – | | – | | – | | 87,535 | | 12 Mar 2001 | | 2006 | |
| | 125,767 | | – | | – | | – | | – | | 131,077 | | 8 Mar 2002 | | 2007 | |
| | 167,843 | | – | | – | | – | | – | | 174,929 | | 5 Mar 2003 | | 2008 | |
| | – | | 244,445 | 7 | 2,100 | | – | | – | | 252,771 | | 4 Mar 2004 | | 2009 | |
| W R P Dalton | 41,643 | | – | | – | | 41,969 | 6 | 357 | | – | | 4 Mar 1999 | | 2004 | |
| | 40,738 | | – | | – | | 41,714 | 8 | 342 | | – | | 10 Mar 2000 | | 2005 | |
| | 47,994 | | – | | – | | 49,145 | 8 | 403 | | – | | 12 Mar 2001 | | 2006 | |
| | 79,432 | | – | | – | | – | | – | | 81,335 | 9 | 8 Mar 2002 | | 2007 | |
| | 114,438 | | – | | – | | – | | – | | 117,180 | 9 | 5 Mar 2003 | | 2008 | |
| D G Eldon | 41,643 | | – | | – | | 41,969 | 6 | 357 | | – | | 4 Mar 1999 | | 2004 | |
| | 40,738 | | – | | – | | – | | – | | 42,458 | | 10 Mar 2000 | | 2005 | |
| | 47,994 | | – | | – | | – | | – | | 50,021 | | 12 Mar 2001 | | 2006 | |
| | 7,072 | | – | | – | | 7,240 | 10 | 58 | | – | | 30 Apr 2001 | | 2004 | |
| | 52,955 | | – | | – | | – | | – | | 55,191 | | 8 Mar 2002 | | 2007 | |
| | 9,806 | | – | | – | | – | | – | | 10,220 | | 15 May 2002 | | 2005 | |
| | 76,292 | | – | | – | | – | | – | | 79,513 | | 5 Mar 2003 | | 2008 | |
| | 13,329 | | – | | – | | – | | – | | 13,892 | | 12 May 2003 | | 2006 | |
| | – | | 87,302 | 7 | 750 | | – | | – | | 90,276 | | 4 Mar 2004 | | 2009 | |
| D J Flint | 41,643 | | – | | – | | 41,969 | 6 | 357 | | – | | 4 Mar 1999 | | 2004 | |
| | 36,663 | | – | | – | | – | | – | | 38,211 | | 10 Mar 2000 | | 2005 | |
| | 59,992 | | – | | – | | – | | – | | 62,525 | | 12 Mar 2001 | | 2006 | |
| | 79,432 | | – | | – | | – | | – | | 82,786 | | 8 Mar 2002 | | 2007 | |
| | 114,438 | | – | | – | | – | | – | | 119,270 | | 5 Mar 2003 | | 2008 | |
| | – | | 121,058 | 7 | 1,040 | | – | | – | | 125,182 | | 4 Mar 2004 | | 2009 | |
| M F Geoghegan | 35,975 | 11 | – | | – | | 35,974 | 6 | 306 | | – | | 4 Mar 1999 | | 2004 | |
| | 32,846 | 11 | – | | – | | – | | – | | 33,965 | | 10 Mar 2000 | | 2005 | |
| | 36,280 | 11 | – | | – | | – | | – | | 37,515 | | 12 Mar 2001 | | 2006 | |
| | 40,030 | 11 | – | | – | | – | | – | | 41,393 | | 8 Mar 2002 | | 2007 | |
| | 53,827 | 11 | – | | – | | – | | – | | 55,661 | | 5 Mar 2003 | | 2008 | |
| | – | | 90,794 | 7 | 780 | | – | | – | | 93,887 | | 4 Mar 2004 | | 2009 | |
| S K Green | 41,643 | | – | | – | | 41,969 | 6 | 357 | | – | | 4 Mar 1999 | | 2004 | |
| | 40,738 | | – | | – | | – | | – | | 42,458 | | 10 Mar 2000 | | 2005 | |
| | 83,988 | | – | | – | | – | | – | | 87,535 | | 12 Mar 2001 | | 2006 | |
| | 99,290 | | – | | – | | – | | – | | 103,482 | | 8 Mar 2002 | | 2007 | |
| | 114,438 | | – | | – | | – | | – | | 119,270 | | 5 Mar 2003 | | 2008 | |
| | – | | 166,455 | 7 | 1,430 | | – | | – | | 172,125 | | 4 Mar 2004 | | 2009 | |
| A W Jebson | 35,693 | | – | | – | | 35,974 | 6 | 306 | | – | | 4 Mar 1999 | | 2004 | |
| | 32,589 | | – | | – | | – | | – | | 33,965 | | 10 Mar 2000 | | 2005 | |
| | 71,990 | | – | | – | | – | | – | | 75,030 | | 12 Mar 2001 | | 2006 | |
| | 92,671 | | – | | – | | – | | – | | 96,584 | | 8 Mar 2002 | | 2007 | |
| | 114,438 | | – | | – | | – | | – | | 119,270 | | 5 Mar 2003 | | 2008 | |
| | – | | 121,058 | 7 | 1,040 | | – | | – | | 125,182 | | 4 Mar 2004 | | 2009 | |
Unless otherwise indicated, vesting of these shares is subject to the performance tests set out in the section headed ‘Arrangements from 1999-2004’ on pages 222 to 223.
232
Back to Contents
| 1 | Includes additional shares arising from scrip dividends. |
| 2 | At the date of vesting, 31 March 2004, the market value per share was £8.09. At the date of award, 15 April 2003, the market value per share was £6.81. |
| 3 | Under the terms of this award the shares will vest in three instalments on each of the first three anniversaries of 28 March 2003 so long as Mr Aldinger remains employed on the relevant vesting date, subject to accelerated vesting upon a termination of cause, or by Mr Aldinger for good reason or due to his death or disability. Pursuant to the amendment agreement referred to above the 337,976 shares (having a value of approximately £2,994,000 based on the market price on 24 February 2005) not vested at retirement will vest on Mr Aldinger’s retirement on 29 April 2005. |
| 4 | At the date of the award, 10 May 2004, the market value per share was £7.94. The shares acquired by the Trustee of the Plan were purchased at an average price of £8.235. |
| 5 | Under the terms of this award the shares will vest in three instalments on each of 31 March 2005, 2006 and 2007 so long as Mr Aldinger remains employed on the relevant vesting date, subject to accelerated vesting upon a termination of cause, or by Mr Aldinger for good reason or due to his death or disability. Pursuant to the amendment agreement referred to above the 254,755 shares (having a value of approximately £2,257,000 based on the market price on 24 February 2005) not vested at retirement will vest on Mr Aldinger’s retirement on 29 April 2005. |
| 6 | The performance tests described in the 'Report of the Directors' in theAnnual Report and Accounts 1998and set out in the section headed ‘Arrangements from 1999-2004’ on pages 222 to 223 have been met and the shares have vested. At the date of vesting,4 March 2004, the market value per share was £8.515. The market value per share (adjusted for the share capital reorganisation implemented on 2 July 1999) at the date of the award, 4 March 1999, was £5.92. |
| 7 | At the date of the award, 4 March 2004, the market value per share was £8.515. The shares acquired by the Trustee of the Plan were purchased at an average price of £8.5909. |
| 8 | Retired as a Director on 28 May 2004. The awards held at the date of retirement that had passed the performance tests set out in the section headed ‘Arrangements from 1999-2004’ on pages 222 to 223 (the awards made in 2000 and 2001) were released to Mr Dalton on 30 June 2004. At 30 June 2004 the market value per share was £8.20. The market values per share at the dates of the awards, 10 March 2000 and 12 March 2001, were £7.09 and £8.62 respectively. |
| 9 | Interests at date of retirement as a Director (28 May 2004). |
| 10 | 50 per cent of D G Eldon’s discretionary bonus in respect of 2000, 2001 and 2002 respectively was awarded in Restricted Shares with a three-year restricted period. |
| 11 | Interests at date of appointment (1 March 2004). |
| On behalf of the Board | |
| | 28 February 2005 |
| Sir Mark Moody-Stuart, Chairman of Remuneration Committee | |
233
Back to Contents
H S B C H O L D I N G S P L C
Statement of Directors’ Responsibilities in Relation to Financial Statements
The following statement, which should be read in conjunction with the Auditors’ statement of their responsibilities set out in their report on pages 235 and 236, is made with a view to distinguishing for shareholders the respective responsibilities of the Directors and of the Auditors in relation to the financial statements.
The Directors are required by the Companies Act 1985 to prepare financial statements for each financial year which give a true and fair view of the state of affairs of HSBC Holdings plc together with its subsidiary undertakings as at the end of the financial year and of the profit or loss for the financial year. They are also required to present additional information for US shareholders. Accordingly, these financial statements are framed to meet both UK and US requirements to give a consistent view to all shareholders. The Directors are required to prepare these financial statements on the going concern basis unless it is not appropriate. Since the Directors are satisfied that HSBC has the resources to continue in business for the foreseeable future, the financial statements continue to be prepared on the going concern basis. The Directors consider that in preparing the financial statements on pages 237 to 356, HSBC Holdings has used appropriate accounting policies, consistently applied, save as disclosed in the ‘Notes on the Financial Statements’, and supported by reasonable and prudent judgements and estimates, and that all accounting standards which they consider to be applicable have been followed.
The Directors have responsibility for ensuring that HSBC Holdings keeps accounting records which disclose with reasonable accuracy at any time the financial position of HSBC Holdings and which enable them to ensure that the financial statements comply with the Companies Act 1985.
The Directors have general responsibility for taking such steps as are reasonably open to them to safeguard the assets of HSBC and to prevent and detect fraud and other irregularities.
| | |
| | |
| On behalf of the Board | 28 February 2005 |
| | |
| R G Barber, Secretary | |
234
Back to Contents
H S B C H O L D I N G S P L C
Report of Independent registered public accounting firm to the Board of Directors and
shareholders of HSBC Holdings plc
We have audited the accompanying consolidated financial statements of HSBC Holdings plc and its subsidiary undertakings (together ‘HSBC’) on pages 237 to 356 which comprise the consolidated balance sheets as at 31 December 2004 and 2003, and the related consolidated profit and loss accounts, statements of total consolidated recognised gains and losses, reconciliations of movements in consolidated shareholders’ funds and consolidated cash flow statements for each of the years in the three-year period ended 31 December 2004. These consolidated financial statements are the responsibility of management. Our responsibility is to express an opinion on these consolidated financial statements based on our audits.
We conducted our auditsin accordance with the standards of the Public Company Accounting Oversight Board (United States). Those standards require that we plan and perform the audit to obtain reasonable assurance about whether the financial statements are free of material misstatement. An audit includes examining, on a test basis, evidence supporting the amounts and disclosures in the financial statements. An audit also includes assessing the accounting principles used and significant estimates made by management, as well as evaluating the overall financial statement presentation. We believe that our audits provide a reasonable basis for our opinion.
In our opinion, the consolidated financial statements referred to above present fairly, in all material respects, the financial position of HSBC as at 31 December, 2004 and 2003, and the results of its operations and its cash flows for each of the years in the three-year period ended 31 December 2004 in conformity with accounting principles generally accepted in the United Kingdom.
Accounting principles generally accepted in the United Kingdom vary in certain significant respects from accounting principles generally accepted in the United States. Information relating to the nature and effect of such differences is presented in Note 49 to the consolidated financial statements.
KPMG Audit Plc
London, England
28th February 2005
235
Back to Contents
H S B C H O L D I N G S P L C
This page has been left blank intentionally.
236
Back to Contents
H S B C H O L D I N G S P L C
FinancialStatements
Consolidated profit and loss account for the year ended 31 December 2004
| | | 2004 | | 2003 | | 2002 | |
| | Notes | US$m | | US$m | | US$m | |
| Interest receivable | | | | | | | |
| – interest receivable and similar income arising from debt securities | | 7,845 | | 6,947 | | 7,253 | |
| – other interest receivable and similar income | | 42,358 | | 33,021 | | 21,342 | |
| Interest payable | | (19,179 | ) | (14,370 | ) | (13,135 | ) |
| | |
| |
| |
| |
| Net interest income | | 31,024 | | 25,598 | | 15,460 | |
| | | | | | | | |
| Dividend income | 3 | 601 | | 222 | | 278 | |
| Fees and commissions receivable | | 15,877 | | 12,560 | | 9,245 | |
| Fees and commissions payable | | (2,784 | ) | (2,166 | ) | (1,421 | ) |
| Dealing profits | 4 | 2,566 | | 2,178 | | 1,313 | |
| Other operating income | | 3,303 | | 2,680 | | 1,720 | |
| | |
| |
| |
| |
| Operating income | 6 | 50,587 | | 41,072 | | 26,595 | |
| | | | | | | | |
| Administrative expenses | 5,6 | (24,183 | ) | (19,685 | ) | (13,764 | ) |
| Depreciation and amortisation | | | | | | | |
| – tangible fixed assets | 24 | (1,664 | ) | (1,382 | ) | (1,190 | ) |
| – intangible assets | 23 | (28 | ) | (15 | ) | – | |
| – goodwill | 23 | (1,814 | ) | (1,450 | ) | (854 | ) |
| | |
| |
| |
| |
| Operating profit before provisions | | 22,898 | | 18,540 | | 10,787 | |
| | | | | | | | |
| Provisions for bad and doubtful debts | 16 | (6,357 | ) | (6,093 | ) | (1,321 | ) |
| Provisions for contingent liabilities and commitments | 31 | (27 | ) | (44 | ) | (107 | ) |
| Amounts written off fixed asset investments | | – | | (106 | ) | (324 | ) |
| | |
| |
| |
| |
| Operating profit | | 16,514 | | 12,297 | | 9,035 | |
| | | | | | | | |
| Share of operating profit/(loss) in joint ventures | | 5 | | (116 | ) | (28 | ) |
| Share of operating profit in associates | | 287 | | 221 | | 135 | |
| Gains/(losses) on disposal of | | | | | | | |
| – investments | | 770 | | 451 | | 532 | |
| – tangible fixed assets | | 32 | | (37 | ) | (24 | ) |
| | |
| |
| |
| |
| Profit on ordinary activities before tax | 6 | 17,608 | | 12,816 | | 9,650 | |
| | | | | | | | |
| Tax on profit on ordinary activities | 7 | (4,507 | ) | (3,120 | ) | (2,534 | ) |
| | |
| |
| |
| |
| Profit on ordinary activities after tax | | 13,101 | | 9,696 | | 7,116 | |
| | | | | | | | |
| Minority interests | | | | | | | |
| – equity | | (586 | ) | (487 | ) | (505 | ) |
| – non-equity | | (675 | ) | (435 | ) | (372 | ) |
| | |
| |
| |
| |
| Profit attributable to shareholders | | 11,840 | | 8,774 | | 6,239 | |
| | | | | | | | |
| Dividends | 9 | (7,301 | ) | (6,532 | ) | (5,001 | ) |
| | |
| |
| |
| |
| Retained profit for the year | | 4,539 | | 2,242 | | 1,238 | |
| | |
| |
| |
| |
| | | US$ | | US$ | | US$ | |
| Basic earnings per ordinary share | 10 | 1.09 | | 0.84 | | 0.67 | |
| Diluted earnings per ordinary share | 10 | 1.07 | | 0.83 | | 0.66 | |
| Dividends per ordinary share | 9 | 0.66 | | 0.60 | | 0.53 | |
Movements in reserves are set out in Note 35.
The accompanying notes are an integral part of the Consolidated Financial Statements.
All results are from continuing operations.
237
Back to Contents
H S B C H O L D I N G S P L C
Financial Statements(continued)
Consolidated balance sheet at 31 December 2004
| | | 2004 | | | 2003 | |
| | Notes | US$m | | | US$m | |
| ASSETS | | | | | | |
| | | | | | | |
| Cash and balances at central banks | | 9,872 | | | 7,661 | |
| Items in the course of collection from other banks | | 6,352 | | | 6,628 | |
| Treasury bills and other eligible bills | 11 | 30,284 | | | 20,391 | |
| Hong Kong Government certificates of indebtedness | 12 | 11,878 | | | 10,987 | |
| Loans and advances to banks | 14 | 142,712 | | | 117,173 | |
| Loans and advances to customers | 15 | 669,831 | | | 528,977 | |
| Debt securities | 18 | 240,999 | | | 205,722 | |
| Equity shares | 19 | 19,319 | | | 12,879 | |
| | | | | | | |
| Interests in joint ventures: gross assets | | 110 | | | 87 | |
| gross liabilities | | (98 | ) | | (77 | ) |
| | | | | | | |
| | 20 | 12 | | | 10 | |
| Interests in associates | 21 | 3,440 | | | 1,263 | |
| Other participating interests | 22 | 881 | | | 690 | |
| Goodwill and intangible assets | 23 | 29,382 | | | 28,640 | |
| Tangible fixed assets | 24 | 18,829 | | | 15,748 | |
| Other assets | 26 | 73,498 | | | 63,128 | |
| Prepayments and accrued income | | 19,489 | | | 14,319 | |
| | |
| | |
| |
| Total assets | | 1,276,778 | | | 1,034,216 | |
| | |
| | |
| |
238
Back to Contents
| | | 2004 | | 2003 | |
| | Notes | US$m | | US$m | |
| LIABILITIES | | | | | |
| | | | | | |
| Hong Kong currency notes in circulation | 12 | 11,878 | | 10,987 | |
| Deposits by banks | 27 | 83,539 | | 70,426 | |
| Customer accounts | 28 | 693,751 | | 573,130 | |
| Items in the course of transmission to other banks | | 5,301 | | 4,383 | |
| Debt securities in issue | 29 | 208,593 | | 153,562 | |
| Other liabilities | 30 | 123,315 | | 94,669 | |
| Accruals and deferred income | | 16,500 | | 13,760 | |
| Provisions for liabilities and charges | 31 | | | | |
| – deferred taxation | | 2,066 | | 1,670 | |
| – other provisions | | 5,532 | | 5,078 | |
| Subordinated liabilities | 32 | | | | |
| – undated loan capital | | 3,686 | | 3,617 | |
| – dated loan capital | | 22,800 | | 17,580 | |
| Minority interests | | | | | |
| – equity | | 2,476 | | 2,162 | |
| – non-equity | 33 | 10,718 | | 8,719 | |
| | | | | | |
| Called up share capital | 34 | 5,587 | | 5,481 | |
| Share premium account | 35 | 4,881 | | 4,406 | |
| Other reserves | 35 | 21,457 | | 21,543 | |
| Revaluation reserves | 35 | 2,660 | | 1,615 | |
| Profit and loss account | 35 | 52,038 | | 41,428 | |
| | | | | | |
| Shareholders’ funds | | 86,623 | | 74,473 | |
| | |
| |
| |
| Total liabilities | | 1,276,778 | | 1,034,216 | |
| | |
| |
| |
| | | | | | |
| MEMORANDUM ITEMS | | | | | |
| | | | | | |
| Contingent liabilities | 38 | | | | |
| – acceptances and endorsements | | 7,214 | | 5,412 | |
| – guarantees and assets pledged as collateral security | | 64,921 | | 54,439 | |
| – other contingent liabilities | | 57 | | 29 | |
| | |
| |
| |
| | | 72,192 | | 59,880 | |
| | |
| |
| |
| Commitments | 38 | 567,696 | | 428,764 | |
| | |
| |
| |
 | |
| |
| Sir John Bond, Group Chairman | |
| | |
| The accompanying notes are an integral part of the Consolidated Financial Statements. |
239
Back to Contents
H S B C H O L D I N G S P L C
Financial Statements (continued)
HSBC Holdings balance sheet at 31 December 2004
| | | 2004 | | 2003 | |
| | Notes | US$m | | US$m | |
| FIXED ASSETS | | | | | |
| | | | | | |
| Tangible assets | 24 | 2 | | 2 | |
| Investments | 25 | | | | |
| – shares in HSBC undertakings | | 94,885 | | 79,326 | |
| – loans to HSBC undertakings | | 4,712 | | 3,788 | |
| – debt securities of HSBC undertakings | | 1,885 | | 1,175 | |
| – other investments other than loans | | 581 | | 537 | |
| | |
| |
| |
| | | 102,065 | | 84,828 | |
| | |
| |
| |
| CURRENT ASSETS | | | | | |
| | | | | | |
| Debtors | | | | | |
| – money market deposits with HSBC undertakings | | 7,036 | | 6,995 | |
| – other amounts owed by HSBC undertakings | | 5,131 | | 2,526 | |
| – amounts owed by HSBC undertakings (falling due after more than 1 year) | | 1,680 | | 2,412 | |
| – other debtors | | 100 | | 95 | |
| | |
| |
| |
| | | 13,947 | | 12,028 | |
| Cash at bank and in hand | | | | | |
| – balances with HSBC undertakings | | 246 | | 901 | |
| | |
| |
| |
| | | 14,193 | | 12,929 | |
| | |
| |
| |
| CREDITORS: amounts falling due within 1 year | | | | | |
| | | | | | |
| Amounts owed to HSBC undertakings | | (858 | ) | (700 | ) |
| Other creditors | | (191 | ) | (261 | ) |
| Dividends declared | 9 | (4,205 | ) | (3,936 | ) |
| | |
| |
| |
| | | (5,254 | ) | (4,897 | ) |
| | |
| |
| |
| NET CURRENT ASSETS | | 8,939 | | 8,032 | |
| | |
| |
| |
| TOTAL ASSETS LESS CURRENT LIABILITIES | | 111,004 | | 92,860 | |
| | | | | | |
| CREDITORS: amounts falling due after more than 1 year | | | | | |
| | | | | | |
| Subordinated liabilities | 32 | | | | |
| – owed to third parties | | (9,669 | ) | (5,970 | ) |
| – owed to HSBC undertakings | | (8,143 | ) | (6,845 | ) |
| Amounts owed to HSBC undertakings | | (6,494 | ) | (5,479 | ) |
| | | | | | |
| PROVISIONS FOR LIABILITIES AND CHARGES | | | | | |
| | | | | | |
| Deferred taxation | 31 | (75 | ) | (93 | ) |
| | |
| |
| |
| NET ASSETS | | 86,623 | | 74,473 | |
| | |
| |
| |
| | | | | | |
| CAPITAL AND RESERVES | | | | | |
| | | | | | |
| Called up share capital | 34 | 5,587 | | 5,481 | |
| Share premium account | 35 | 4,881 | | 4,406 | |
| Revaluation reserve | 35 | 68,963 | | 57,041 | |
| Reserve in respect of obligations under subsidiary share options | 35 | 399 | | 485 | |
| Profit and loss account | 35 | 6,793 | | 7,060 | |
| | |
| |
| |
| | | 86,623 | | 74,473 | |
| | |
| |
| |
 |
|
| Sir John Bond, Group Chairman |
| |
| The accompanying notes are an integral part of the Consolidated Financial Statements. |
240
Back to Contents
Statement of total consolidated recognised gains and losses for the year ended 31 December 2004
| | 2004 | | 2003 | | 2002 | |
| | US$m | | US$m | | US$m | |
| | | | | | | |
| Profit for the financial year attributable to shareholders | 11,840 | | 8,774 | | 6,239 | |
| Unrealised surplus/(deficit) on revaluation of investment properties: | | | | | | |
| Subsidiaries | 52 | | (28 | ) | (22 | ) |
| Associates | 12 | | (10 | ) | (1 | ) |
| Unrealised surplus/(deficit) on revaluation of land and buildings (excluding investment properties): | | | | | | |
| Subsidiaries | 1,093 | | (292 | ) | (297 | ) |
| Exchange and other movements | 3,404 | | 5,318 | | 3,781 | |
| |
| |
| |
| |
| Total recognised gains and losses for the year | 16,401 | | 13,762 | | 9,700 | |
| |
| |
| |
| |
Reconciliation of movements in consolidated shareholders’ funds for the year ended 31 December 2004
| | 2004 | | | 2003 | | | 2002 | | |
| | US$m | | | US$m | | | US$m | | |
| | | | | | | | | | |
| Profit for the period attributable to shareholders | 11,840 | | | 8,774 | | | 6,239 | | |
| Dividends | (7,301 | ) | | (6,532 | ) | | (5,001 | ) | |
| |
| | |
| | |
| | |
| | 4,539 | | | 2,242 | | | 1,238 | | |
| Other recognised gains and losses relating to the year | 4,561 | | | 4,988 | | | 3,461 | | |
| New share capital subscribed, net of costs | 581 | | | 862 | | | 337 | | |
| | | | | | | | | | |
| Purchases of own shares to meet share awards and share option awards | (345 | ) | | (301 | ) | | (5 | ) | |
| Own shares released on vesting of share awards and exercise of options | 159 | | | 162 | | | 45 | | |
| Amortisation of shares in restricted share plan | 36 | | | 19 | | | 19 | | |
Net purchases and sales of own shares for market making purposes1 | 98 | | | (138 | ) | | – | | |
| Total net change in shareholders’ funds arising from own shares adjustments | (52 | ) | | (258 | ) | | 59 | | |
| Reserve in respect of obligations under CCF share options | (81 | ) | | (41 | ) | | (41 | ) | |
| Net reserve in respect of obligations under the Bank of Bermuda share options | 15 | | | – | | | – | | |
| New share capital issued in connection with the acquisition of HSBC Finance Corporation | – | | | 13,405 | | | – | | |
| Reserve in respect of obligations under HSBC Finance Corporation share options | (19 | ) | | 84 | | | – | | |
Reserve in respect of the equity component of HSBC Finance Corporation 8.875 per cent Adjustable Conversion-Rate Equity Security Units | (1 | ) | | 3 | | | – | | |
| Amounts arising on shares issued in lieu of dividends | 2,607 | | | 1,423 | | | 1,023 | | |
| |
| | |
| | |
| | |
| Net addition to shareholders’ funds | 12,150 | | | 22,708 | | | 6,077 | | |
| Shareholders’ funds at 1 January | 74,473 | | | 51,765 | | | 45,688 | | |
| |
| | |
| | |
| | |
| Shareholders’ funds at 31 December | 86,623 | | | 74,473 | | | 51,765 | | |
| |
| | |
| | |
| | |
No note of historical cost profits and losses has been presented as there is no material difference between HSBC’s results as disclosed in the consolidated profit and loss account and the results on an unmodified historical cost basis.
The accompanying notes are an integral part of the Consolidated Financial Statements.
| 1 | The net purchases and sales for market making purposes relate to long positions. Short positions arising in market making activities are included within ‘Other liabilities’. In 2004, total purchases and sales for market making purposes (including those related to short positions) each amounted to about US$5.9 billion. |
241
Back to Contents
H S B C H O L D I N G S P L C
Financial Statements (continued)
Consolidated cash flow statement for the year ended 31 December 2004
| | | 2004 | | | 2003 | | | 2002 | |
| | Notes | US$m | | | US$m | | | US$m | |
| | | | | | | | | | |
| Net cash inflow from operating activities | 40 | 37,209 | | | 22,675 | | | 16,426 | |
| | | | | | | | | | |
| Dividends received from associated undertakings | | 127 | | | 108 | | | 114 | |
| | | | | | | | | | |
| Returns on investments and servicing of finance | | | | | | | | | |
| Interest paid on finance leases and similar hire purchase contracts | | (45 | ) | | (37 | ) | | (29 | ) |
| Interest paid on subordinated loan capital | | (915 | ) | | (882 | ) | | (870 | ) |
| Dividends paid to minority interests | | | | | | | | | |
| – equity | | (664 | ) | | (514 | ) | | (480 | ) |
| – non-equity | | (548 | ) | | (392 | ) | | (357 | ) |
| | | | | | | | | | |
| Net cash outflow from returns on investments and servicing of finance | | (2,172 | ) | | (1,825 | ) | | (1,736 | ) |
| | | | | | | | | | |
| Taxation paid | | (3,797 | ) | | (2,631 | ) | | (1,371 | ) |
| | | | | | | | | | |
| Capital expenditure and financial investments | | | | | | | | | |
| Purchase of investment securities | | (330,917 | ) | | (218,196) | | | (130,166 | ) |
| Proceeds from sale and maturities of investment securities | | 315,437 | | | 206,099 | | | 122,495 | |
| Purchase of tangible fixed assets | | (2,830 | ) | | (1,981 | ) | | (1,723 | ) |
| Proceeds from sale of tangible fixed assets | | 371 | | | 346 | | | 328 | |
| Purchase of intangible assets | | (108 | ) | | (87 | ) | | – | |
| | | | | | | | | | |
| Net cash outflow from capital expenditure and financial investments | | (18,047 | ) | | (13,819 | ) | | (9,066 | ) |
| | | | | | | | | | |
| Acquisitions and disposals | | | | | | | | | |
Net cash (outflow)/inflow from acquisition of and increase in stake in subsidiary undertakings | 25 | (2,431 | ) | | (2,137 | ) | | 264 | |
| Net cash inflow from disposal of subsidiary undertakings | | 27 | | | 556 | | | – | |
Purchase of interests in associated undertakings and other participating interests | | (2,301 | ) | | (47 | ) | | (649 | ) |
Proceeds from disposal of associated undertakings and other participating interests | | 204 | | | 3 | | | 341 | |
| | | | | | | | | | |
| Net cash outflow from acquisitions and disposals | | (4,501 | ) | | (1,625 | ) | | (44 | ) |
| | | | | | | | | | |
| Equity dividends paid | | (4,425 | ) | | (4,242 | ) | | (3,609 | ) |
| | |
| | |
| | |
| |
| Net cash inflow/(outflow) before financing | | 4,394 | | | (1,359 | ) | | 714 | |
| | | | | | | | | | |
| Financing | | | | | | | | | |
| Issue of ordinary share capital | | 581 | | | 845 | | | 337 | |
| Net purchases and sales of own shares for market making purposes | | 98 | | | (138 | ) | | – | |
Purchases of own shares to meet share awards and share option awards | | (345 | ) | | (301 | ) | | (5 | ) |
Own shares released on vesting of share awards and exercise of options | | 159 | | | 181 | | | 64 | |
| Increase of non equity minority interests | | 1,480 | | | 4,104 | | | – | |
| Decrease of non equity minority interests | | – | | | (206 | ) | | (50 | ) |
| Subordinated loan capital issued | | 6,021 | | | 2,358 | | | 4,105 | |
| Subordinated loan capital repaid | | (1,740 | ) | | (1,464 | ) | | (1,923 | ) |
| | | | | | | | | | |
| Net cash inflow from financing | 41 | 6,254 | | | 5,379 | | | 2,528 | |
| | |
| | |
| | |
| |
| Increase in cash | 42 | 10,648 | | | 4,020 | | | 3,242 | |
| | |
| | |
| | |
| |
The accompanying notes are an integral part of the Consolidated Financial Statements.
242
Back to Contents
H S B C H O L D I N G S P L C
Notes onthe Financial Statements
| 1 | Basis of preparation |
|
| | (a)
| The financial statements have been prepared under the historical cost convention, as modified by the revaluation of certain investments and land and buildings, and in accordance with applicable accounting standards. |
| | | |
| | | The consolidated financial statements are prepared in accordance with the special provisions of Part VII Chapter II of the UK Companies Act 1985 (‘the Act’) relating to banking groups. The consolidated financial statements comply with Schedule 9 and the financial statements of HSBC Holdings comply with Schedule 4 to the Act. |
| | | |
| | | As permitted by Section 230 of the Act, no profit and loss account is presented for HSBC Holdings. |
| | | |
| | | The accounts have been prepared in accordance with the Statements of Recommended Accounting Practice (‘SORPs’) issued by the British Bankers’ Association (‘BBA’) and Irish Bankers’ Federation and with the SORP ‘Accounting issues in the asset finance and leasing industry’ issued by the Finance & Leasing Association. |
| | | |
| | | The SORP issued by the Association of British Insurers ‘Accounting for insurance business’ contains recommendations on accounting for insurance business for insurance companies and insurance groups. HSBC is primarily a banking group, rather than an insurance group, and, consistent with previously established practice for such groups preparing consolidated financial statements complying with Schedule 9 to the Act, places a value on its long-term assurance businesses using a valuation of the discounted future earnings expected to emerge from business currently in force, taking into account factors such as recent experience and general economic conditions, together with the surplus retained in the long-term assurance funds. |
| | | |
| | (b) | The preparation of financial information requires the use of estimates and assumptions about future conditions. In this connection, management believes that the critical accounting policies where management judgement is necessarily applied are those in relation to provisions for bad and doubtful debts, goodwill impairment, and the valuation of securities and derivatives. Application of these policies and the key estimates and assumptions used are described in the Financial Review section on pages 118 to 121 under the heading ‘Critical Accounting Policies’. |
| | | |
| | (c) | The consolidated financial statements of HSBC comprise the financial statements of HSBC Holdings and its subsidiary undertakings. Financial statements of subsidiary undertakings are made up to 31 December, with the exception of the banking and insurance subsidiaries of HSBC Bank Argentina, whose financial statements are made up to 30 June annually to comply with local regulations. Accordingly HSBC uses interim financial statements for its principal banking and insurance subsidiaries in Argentina, drawn up to 31 December annually, and these interim financial statements are audited. |
| | | |
| | | The consolidated financial statements include the attributable share of the results and reserves of joint ventures and associates, based on financial statements made up to dates not earlier than six months prior to 31 December. |
| | | |
| | | All significant intra-HSBC transactions are eliminated on consolidation. |
| | | |
| | (d)
| HSBC’s financial statements are prepared in accordance with UK generally accepted accounting principles (‘UK GAAP’), which differs in certain respects from Hong Kong and US generally accepted accounting principles (‘Hong Kong GAAP’ and ‘US GAAP’). A discussion of the significant differences between UK GAAP and Hong Kong GAAP is contained in note 48. A discussion of the significant differences between UK GAAP and US GAAP and a reconciliation to US GAAP of certain amounts is contained in Note 49. The Notes on the Financial Statements, taken together with the Financial Review, include the aggregate of all disclosures necessary to satisfy both UK and US reporting requirements. |
| | | |
| | | |
| 2 | Principal accounting policies |
|
| | (a) | Income recognition |
| | | |
| | | Interest income is recognised in the profit and loss account as it accrues, except in the case of doubtful debts (Note 2 (c) below). |
| | | |
| | | Fee and commission income is accounted for in the period when receivable, except where it is charged to cover the costs of a continuing service to, or risk borne for, the customer, or is interest in nature. In these cases, it is recognised on an appropriate basis over the relevant period. |
243
Back to Contents
H S B C H O L D I N G S P L C
Notes onthe Financial Statements (continued)
| | (b) | Interest on debt issuance |
| | | |
| | Premiums and discounts on the issue of debt and fair value adjustments to debt arising on acquisitions are amortised to interest payable so as to give a consistent rate over the life of the debt. Where debt is callable, either by HSBC or the holder, the premium or discount is amortised over the period to the earliest call date. |
| | | | |
| | (c) | Loans and advances and doubtful debts |
| | | |
| | It is HSBC’s policy that each operating company will make provisions for bad and doubtful debts promptly where required and on a consistent basis in accordance with established Group guidelines. |
| | | There are two basic types of provision, specific and general, each of which is considered in terms of the charge and the amount outstanding. |
| | | | |
| | | Specific provisions |
| | | | |
| | | Specific provisions represent the quantification of actual and inherent losses from homogeneous portfolios of assets and individually identified accounts. Specific provisions are deducted from loans and advances in the balance sheet. The majority of specific provisions are determined on a portfolio basis. |
| | | | |
| | | Portfolios |
| | | | |
| | | Where homogeneous groups of assets are reviewed on a portfolio basis, two alternative methods are used to calculate specific provisions: |
| | | | |
| | | – | When appropriate empirical information is available, the Group utilises roll rate methodology (a statistical analysis of historical trends of the probability of default and amount of consequential loss, assessed at each time period for which payments are overdue), other historical data and an evaluation of current economic conditions to calculate an appropriate level of specific provision based on inherent loss. Additionally, in certain highly developed markets, sophisticated models also take into account behavioural and account management trends such as bankruptcy and rescheduling statistics. Roll rates are regularly benchmarked against actual outcomes to ensure they remain appropriate. |
| | | | |
| | | – | In other cases, when information is insufficient or not sufficiently reliable to adopt a roll rate methodology, the Group adopts a formulaic approach which allocates progressively higher loss rates in line with the period of time for which a customer’s loan is overdue. |
| | | | |
| | | Individually assessed accounts |
| | | |
| | | Specific provisions on individually assessed accounts are determined by an evaluation of the exposures on a case-by-case basis. This procedure is applied to all accounts that do not qualify for, or are not subject to, a portfolio based approach. In determining such provisions on individually assessed accounts, the following factors are considered: |
| | | | |
| | | – | the Group’s aggregate exposure to the customer (including contingent liabilities); |
| | | | |
| | | – | the viability of the customer’s business model and the capability to trade successfully out of financial difficulties and generate sufficient cash flow to service their debt obligations; |
| | | | |
| | | – | the likely dividend available on liquidation or bankruptcy; |
| | | | |
| | | – | the extent of other creditors’ commitments ranking ahead of, or pari passu with, the Group and the likelihood of other creditors continuing to support the company; |
| | | | |
| | | – | the complexity of determining the aggregate amount and ranking of all creditor claims and the extent to which legal and insurance uncertainties are evident; |
| | | | |
| | | – | the amount and timing of expected receipts and recoveries; |
| | | | |
| | | – | the realisable value of security (or other credit mitigants) and likelihood of successful repossession; |
| | | | |
| | | – | the deduction of any costs involved in recovery of amounts outstanding; |
| | | | |
| | | – | the ability of the borrower to obtain and make payments in the relevant foreign currency if loans are not in local currency; and |
244
Back to Contents
| | | – | where available, the secondary market price for the debt. |
| | | | |
| | | Releases on individually calculated specific provisions are recognised whenever the Group has reasonable evidence that the established estimate of loss has been reduced. |
| | | | |
| | | Cross-border exposures |
| | | |
| | | Specific provisions are established in respect of cross-border exposures to countries assessed by management to be vulnerable to foreign currency payment restrictions. This assessment includes analysis of both economic and political factors. |
| | | | |
| | | Provisions are applied to all qualifying exposures within these countries unless these exposures: |
| | | | |
| | | – | are performing, trade related and of less than one year’s maturity; |
| | | | |
| | | – | are mitigated by acceptable security cover which is, other than in exceptional cases, held outside the country concerned; or |
| | | | |
| | | – | are represented by securities held for trading purposes for which a liquid and active market exists, and which are marked to market daily. |
| | | | |
| | | General provisions |
| | | | |
| | | General provisions augment specific provisions and provide cover for loans that are impaired at the balance sheet date but which will not be individually identified as such until some time in the future. HSBC requires operating companies to maintain a general provision, which is determined after taking into account: |
| | | | |
| | | – | historical loss experience in portfolios of similar risk characteristics (for example, by industry sector, loan grade or product); |
| | | | |
| | | – | the estimated period between a loss occurring and that loss being identified and evidenced by the establishment of a specific provision against that loss; and |
| | | | |
| | | – | management’s judgement as to whether the current economic and credit conditions are such that the actual level of inherent losses is likely to be greater or less than that suggested by historical experience. |
| | | | |
| | | The estimated period between a loss occurring and its identification (as evidenced by the establishment of a specific provision for that loss) is determined by local management for each identified portfolio. |
| | | |
| | | Loans on which interest is being suspended and non-accrual loans |
| | | |
| | | Loans are designated as non-performing as soon as management has doubts as to the ultimate collectibility of principal or interest or when contractual payments of principal or interest are 90 days overdue. When a loan is designated as non-performing, interest is not normally credited to the profit and loss account and either interest accruals will cease (‘non-accrual loans’) or interest will be credited to an interest suspense account in the balance sheet which is netted against the relevant loan (‘suspended interest’). |
| | | | |
| | | Within portfolios of low value, high volume, homogeneous loans, interest will normally be suspended on facilities 90 days or more overdue. In certain operating subsidiaries, interest income on credit cards may continue to be included in earnings after the account is 90 days overdue, provided that a suitable provision is raised against the portion of accrued interest which is considered to be irrecoverable. |
| | | | |
| | | The designation of a loan as non-performing and the suspension of interest may be deferred for up to 12 months in either of the following situations: |
| | | | |
| | | – | cash collateral is held covering the total of principal and interest due and the right of set-off is legally sound; or |
| | | | |
| | | – | the value of any net realisable tangible security is considered more than sufficient to cover the full repayment of all principal and interest due and credit approval has been given to the rolling-up or capitalisation of interest payments. |
| | | | |
| | | In certain subsidiaries, principally those in the UK and Hong Kong, provided that there is a realistic prospect of interest being paid at some future date, interest on non-performing loans is charged to the customer’s account. However, the interest is not credited to the profit and loss account but to an interest suspense account in the |
245
Back to Contents
H S B C H O L D I N G S P L C
Notes on the Financial Statements(continued)
| | balance sheet, which is netted against the relevant loan. |
| | |
| | In other subsidiaries and in any event where the probability of receiving interest payments is remote, interest is no longer accrued and any suspended interest balance is written off. |
| | |
| | On receipt of cash (other than from the realisation of security), the overall risk is re-evaluated and, if appropriate, suspended or non-accrual interest is recovered and taken to the profit and loss account. A specific provision of the same amount as the interest receipt is then raised against the principal balance. Amounts received from the realisation of security are applied to the repayment of outstanding indebtedness, with any surplus used to recover any specific provisions and then suspended interest. |
| | |
| | Loans are not reclassified as accruing until interest and principal payments are up-to-date and future payments are reasonably assured. |
| | |
| | Loan write-offs |
| | |
| | Loans (and the related provisions) are normally written off, either partially or in full, when there is no realistic prospect of recovery of these amounts and when the proceeds from the realisation of security have been received. |
| | |
| | Assets acquired in exchange for advances |
| | |
| | Assets acquired in exchange for advances in order to achieve an orderly realisation continue to be reported as advances. The asset acquired is recorded at the carrying value of the advance disposed of at the date of the exchange and subsequent provisions are based on any further deterioration in value. |
| | |
| (d) | Treasury bills, debt securities and equity shares |
| | |
| | Treasury bills, debt securities and equity shares intended to be held on a continuing basis are disclosed as investment securities and are included in the balance sheet at cost less provision for any permanent diminution in value. |
| | |
| | Where dated investment securities have been purchased at a premium or discount, these premiums and discounts are amortised through the profit and loss account over the period from the date of purchase to the date of maturity so as to give a constant rate of return. If the maturity is at the borrowers’ option within a specified range of years, the earliest maturity is adopted. These securities are included in the balance sheet at cost adjusted for the amortisation of premiums and discounts arising on acquisition. The amortisation of premiums and discounts is included in ‘Interest receivable’. Any profit or loss on realisation of these securities is recognised in the profit and loss account as it arises and included in ‘Gains on disposal of investments’. |
| | |
| | Other treasury bills, debt securities, equity shares and short positions in securities are included in the balance sheet at market value. Changes in the market value of such assets and liabilities are recognised in the profit and loss account as ‘Dealing profits’ as they arise. For liquid portfolios market values are determined by reference to independently sourced mid-market prices. In certain less liquid portfolios securities are valued by reference to bid or offer prices as appropriate. Where independent prices are not available, market values may be determined by discounting the expected future cash flows using an appropriate interest rate adjusted for the credit risk of the counterparty. |
| | |
| | Where securities are sold subject to a commitment to repurchase them at a predetermined price, they remain on the balance sheet and a liability is recorded in respect of the consideration received. Conversely, securities purchased under analogous commitments to resell are not recognised on the balance sheet and the consideration paid is recorded in ‘Loans and advances to banks’ or ‘Loans and advances to customers’. |
| | |
| (e) | Subsidiary undertakings, joint ventures, associates and other participating interests |
| | |
| | (i) | HSBC Holdings’ investments in subsidiary undertakings are stated at net asset values, including attributable goodwill, adjusted for shares held by subsidiaries in HSBC Holdings. Changes in the value of subsidiary undertakings are accounted for as movements in the revaluation reserve. |
| | | |
| | (ii) | Interests in joint ventures are stated at HSBC’s share of gross assets, including attributable goodwill, less HSBC’s share of gross liabilities. |
| | | |
246
Back to Contents
| | (iii) | Interests in associates are stated at HSBC’s share of net assets, including attributable goodwill. |
| | | |
| | (iv) | Other participating interests are investments in the shares of undertakings which are held on a long-term basis for the purpose of securing a contribution to HSBC’s business, other than subsidiary undertakings, joint ventures or associates. Other participating interests are stated at cost less any permanent diminution in value. |
| | |
| (f) | Goodwill and intangible assets |
| | | |
| | (i) | Goodwill arises on the acquisition of subsidiary undertakings, joint ventures or associates when the cost of acquisition exceeds the fair value of HSBC’s share of separable net assets acquired. Negative goodwill arises on the acquisition of subsidiary undertakings, joint ventures and associates when the fair value of HSBC’s share of separable net assets acquired exceeds the cost of acquisition. For acquisitions made on or after 1 January 1998, goodwill is included in the balance sheet in ‘Goodwill and intangible assets’ in respect of subsidiary undertakings, in ‘Interests in joint ventures’ in respect of joint ventures and in ‘Interests in associates’ in respect of associates. Capitalised goodwill is amortised over its estimated life on a straight-line basis. Capitalised goodwill is tested for impairment when necessary by comparing the present value of the expected future cash flows from an entity with the carrying value of its net assets, including attributable goodwill. Negative goodwill is credited to the profit and loss account in the periods expected to be benefited. For acquisitions prior to 1 January 1998, goodwill was charged against reserves in the year of acquisition. |
| | | |
| | | At the date of disposal of subsidiary undertakings, joint ventures or associates, any unamortised goodwill or goodwill previously charged directly to reserves is included in HSBC’s share of net assets of the undertaking in the calculation of the gain or loss on disposal of the undertaking. |
| | | |
| | (ii) | Intangible assets represent contracts with retailers and other organisations to originate and promote HSBC products such as credit cards, store cards and retail loans. They are stated at their cost less amortisation to write off the assets over the contract lives. Intangible assets are subject to impairment review if there are events or changes in circumstances that indicate that the carrying amount may not be recoverable. |
| | | |
| (g) | Tangible fixed assets |
| | | |
| | (i) | Land and buildings are stated at valuation or cost less depreciation calculated to write off the assets over their estimated useful lives as follows: |
| | | |
| | | – | freehold land and land held on leases with more than 50 years to expiry are not depreciated; |
| | | | |
| | | – | land held on leases with 50 years or less to expiry is depreciated over the unexpired terms of the leases; and |
| | | | |
| | | – | buildings and improvements thereto are depreciated on cost or valuation at the greater of 2 per cent per annum on the straight-line basis or over the unexpired terms of the leases or over the remaining useful lives. |
| | | | |
| | (ii) | Equipment, fixtures and fittings are stated at cost less depreciation calculated on the straight-line basis to write off the assets over their estimated useful lives, which are generally between 5 years and 20 years. |
| | | |
| | (iii) | HSBC holds certain properties as investments. No depreciation is provided in respect of such properties other than leaseholds with 20 years or less to expiry. Investment properties are included in the balance sheet at their open market value and the aggregate surplus or deficit, where material, is transferred to the investment property revaluation reserve. |
| | | |
| (h) | Finance and operating leases |
| | | |
| | (i) | Assets leased to customers under agreements which transfer substantially all the risks and rewards associated with ownership, other than legal title, are classified as finance leases. Where HSBC is a lessor under finance leases the amounts due under the leases, after deduction of unearned charges, are included in ‘Loans and advances to banks’ or ‘Loans and advances to customers’. Finance charges receivable are recognised over the periods of the leases so as to give a constant rate of return on the net cash investment in the leases, taking into account tax payments and receipts associated with the leases. |
247
Back to Contents
H S B C H O L D I N G S P L C
Notes on the Financial Statements(continued)
| | (ii) | Where HSBC is a lessee under finance leases the leased assets are capitalised and included in ‘Equipment, fixtures and fittings’ and the corresponding liability to the lessor is included in ‘Other liabilities’. Finance charges payable are recognised over the periods of the leases based on the interest rates implicit in the leases. |
| | | |
| | (iii) | All other leases are classified as operating leases and, where HSBC is the lessor, are included in ‘Tangible fixed assets’. Provision is made to the extent that the carrying value of equipment is impaired through residual values not being fully recoverable. Rentals payable and receivable under operating leases are accounted for on the straight-line basis over the periods of the leases and are included in ‘Administrative expenses’ and ‘Other operating income’ respectively. |
| | | |
| (i) | Deferred taxation |
| | | |
| | Deferred tax is recognised in full on timing differences between the accounting and taxation treatment of income and expenditure, subject to assessment of the recoverability of deferred tax assets. Deferred tax assets are regarded as recoverable to the extent that it is more likely than not there will suitable taxable profits from which the future reversal of the underlying timing differences can be deducted. Deferred tax balances are not discounted. |
| | | |
| (j) | Pension and other post-retirement benefits |
| | | |
| | HSBC operates a number of pension and other post-retirement benefit schemes throughout the world. |
| | | |
| | For UK defined benefit schemes annual contributions are made, on the advice of qualified actuaries, for funding of retirement benefits in order to build up reserves for each scheme member during the employee’s working life and used to pay a pension to the employee or dependant after retirement. The costs of providing these benefits are charged to the profit and loss account on a systematic basis. |
| | | |
| | Arrangements for staff retirement benefits in overseas locations vary from country to country and are made in accordance with local regulations and custom. The pension cost of the major overseas schemes is assessed in accordance with the advice of qualified actuaries so as to recognise the cost of pensions on a systematic basis over employees’ service lives. |
| | | |
| | Since 1 January 1993, the cost of providing post-retirement health-care benefits, which is assessed in accordance with the advice of qualified actuaries, has been recognised on a systematic basis over employees’ service lives. At 1 January 1993, there was an accumulated obligation in respect of these benefits relating to current and retired employees which is being charged to the profit and loss account in equal instalments over 20 years. |
| | | |
| (k) | Foreign currencies |
| | | |
| | (i) | Assets and liabilities denominated in foreign currencies are translated into US dollars at the rates of exchange ruling at the year-end. The results of branches, subsidiary undertakings, joint ventures and associates not reporting in US dollars are translated into US dollars at the average rates of exchange for the year. |
| | | |
| | (ii) | Exchange differences arising from the retranslation of opening foreign currency net investments and the related cost of hedging and exchange differences arising from retranslation of the result for the year from the average rate to the exchange rate ruling at the year-end are accounted for in reserves. |
| | | |
| | (iii) | Other exchange differences are recognised in the profit and loss account. |
| | | |
| (l) | Off-balance-sheet financial instruments |
| | | |
| | Off-balance-sheet financial instruments comprise futures, forward, swap and option transactions undertaken by HSBC in the foreign exchange, interest rate, equity, credit derivative, and commodity markets. Netting is applied where a legal right of set-off exists. |
| | | |
| | Accounting for these instruments is dependent upon whether the transactions are undertaken for trading or non-trading purposes. |
248
Back to Contents
| | | Trading transactions |
| | | |
| | | Trading transactions include transactions undertaken for market-making, to service customers’ needs and for proprietary purposes, as well as any related hedges. |
| | | |
| | | Transactions undertaken for trading purposes are marked-to-market and the net present value of any gain or loss arising is recognised in the profit and loss account as ‘Dealing profits’, after appropriate deferrals for unearned credit margin and future servicing costs. Off-balance sheet trading transactions are valued by reference to an independent liquid price where this is available. For those transactions where there are no readily quoted prices, which predominantly relates to over the counter transactions, market values are determined by reference to independently sourced rates, using valuation models. If market observable data are not available, the initial increase in fair value indicated by the valuation model, but based on unobservable inputs, is not recognised immediately in the profit and loss account. This amount is held back and recognised over the life of the transaction where appropriate, or released to the profit and loss account when the inputs become observable, or, when the transaction matures or is closed out. Adjustments are made for illiquid positions where appropriate. |
| | | |
| | | Assets, including gains, resulting from off-balance sheet exchange rate, interest rate, equities, credit derivative and commodity contracts which are marked-to-market are included in ‘Other assets’. Liabilities, including losses, resulting from such contracts, are included in ‘Other liabilities’. |
| | | |
| | | Non-trading transactions |
| | | |
| | | Non-trading transactions are those which are held for hedging purposes as part of HSBC’s risk management strategy against cashflows, assets, liabilities or positions measured on an accruals basis. Non-trading transactions include qualifying hedges and positions that synthetically alter the characteristics of specified financial instruments. |
| | | |
| | | Non-trading transactions are accounted for on an equivalent basis to the underlying assets, liabilities or net positions. Any gain or loss arising is recognised on the same basis as that arising from the related assets, liabilities or positions. |
| | | |
| | | To qualify as a hedge, a derivative must effectively reduce the price, foreign exchange or interest rate risk of the asset, liability or anticipated transaction to which it is linked and be designated as a hedge at inception of the derivative contract. Accordingly, changes in the market value of the derivative must be highly correlated with changes in the market value of the underlying hedged item at inception of the hedge and over the life of the hedge contract. If these criteria are met, the derivative is accounted for on the same basis as the underlying hedged item. Derivatives used for hedging purposes include swaps, forwards and futures. |
| | | |
| | | Interest rate swaps are also used to alter synthetically the interest rate characteristics of financial instruments. In order to qualify for synthetic alteration, a derivative instrument must be linked to specific individual, or pools of similar, assets or liabilities by the notional principal and interest rate risks of the associated instruments, and must achieve a result that is consistent with defined risk management objectives. If these criteria are met, accruals based accounting is applied, i.e. income or expense is recognised and accrued to the next settlement date in accordance with the contractual terms of the agreement. |
| | | |
| | | Any gain or loss arising on the termination of a qualifying derivative is deferred and amortised to earnings over the original life of the terminated contract. Where the underlying asset, liability or position is sold or terminated, the qualifying derivative is immediately marked-to-market and any gain or loss arising is taken to the profit and loss account. |
| | | |
| | | |
| | (m) | Long-term assurance business |
| | | |
| | | The value placed on HSBC’s interest in long-term assurance business includes a valuation of the discounted future earnings expected to emerge from business currently in force, using appropriate assumptions in assessing factors such as recent experience and general economic conditions, together with the surplus retained in the long-term assurance funds. These are determined annually, in consultation with external actuaries, and included in ‘Other assets’. |
| | | |
| | | Changes in the value placed on HSBC’s interest in long-term assurance business are calculated on a post-tax basis and reported gross in the profit and loss account as part of ‘Other operating income’ after adjusting for taxation. |
249
Back to Contents
H S B C H O L D I N G S P L C
Notes onthe Financial Statements(continued)
| | | Long-term assurance assets excluding own shares held (see note 26) and liabilities attributable to policyholders are recognised in HSBC’s accounts in ‘Other assets’ and ‘Other liabilities’. |
| | | |
| | (n) | Share awards |
| | | |
| | | No costs are recognised for options granted under share option schemes at market price at the date of grant or, for save-as-you-earn schemes, at the approved discount to such market price. |
| | | |
| | | Shares awarded to employees in respect of annual bonuses are charged to the profit and loss account in the relevant performance year. Shares awarded to employees in respect of joining incentives are charged to the profit and loss account over any minimum contract period. |
| | | |
| | | The intrinsic value of shares conditionally awarded under restricted share award schemes is charged to compensation cost over the period in respect of which performance conditions apply. The compensation cost is adjusted in line with any adjustment to the awards due to lapses or application of the performance conditions. |
| | | |
| 3 | Dividend income | | | | | | |
| |
| | | 2004 | | 2003 | | 2002 | |
| | | US$m | | US$m | | US$m | |
| | | | | | | | |
| | Income from equity shares | 588 | | 213 | | 274 | |
| | Income from participating interests other than joint ventures | | | | | | |
| | and associates | 13 | | 9 | | 4 | |
| | |
| |
| |
| |
| | | 601 | | 222 | | 278 | |
| | |
| |
| |
| |
| 4 | Analysis of income from dealing in financial instruments | |
| |
| | | 2004 | | 2003 | | 2002 | |
| | |
| |
| |
| |
| | | | | Dividend | | | | | | Dividend | | | | | | Dividend | | | |
| | | | | and net | | | | | | and net | | | | | | and net | | | |
| | | Dealing | | interest | | | | Dealing | | interest | | | | Dealing | | interest | | | |
| | | profits | | income | | Total | | profits | | income | | Total | | profits | | income | | Total | |
| | | US$m | | US$m | | US$m | | US$m | | US$m | | US$m | | US$m | | US$m | | US$m | |
| | | | | | | | | | | | | | | | | | | | |
| | Foreign exchange | 1,806 | | 34 | | 1,840 | | 1,239 | | 31 | | 1,270 | | 1,167 | | 43 | | 1,210 | |
| | Interest rate derivatives | 727 | | (95 | ) | 632 | | 330 | | 16 | | 346 | | 47 | | (7 | ) | 40 | |
| | Debt securities | 49 | | 305 | | 354 | | 251 | | 460 | | 711 | | 75 | | 259 | | 334 | |
| | Equities and other trading | (16 | ) | 375 | | 359 | | 358 | | 198 | | 556 | | 24 | | 186 | | 210 | |
| | |
| |
| |
| |
| |
| |
| |
| |
| |
| |
| | | 2,566 | | 619 | | 3,185 | | 2,178 | | 705 | | 2,883 | | 1,313 | | 481 | | 1,794 | |
| | |
| |
| |
| |
| |
| |
| |
| |
| |
| |
| 5 | Administrative expenses | | | | | | |
| |
| | (a) | | | 2004 | | 2003 | | 2002 | |
| | | | | US$m | | US$m | | US$m | |
| | | Staff costs | | | | | | |
| | | – | wages and salaries | 12,606 | | 10,434 | | 7,367 | |
| | | – | social security costs | 970 | | 809 | | 630 | |
| | | – | retirement benefits (Note 5(b) below) | 916 | | 868 | | 612 | |
| | | | |
| |
| |
| |
| | | | | 14,492 | | 12,111 | | 8,609 | |
| | | Premises and equipment (excluding depreciation) | 2,726 | | 2,331 | | 1,824 | |
| | | Other administrative expenses | 6,965 | | 5,243 | | 3,331 | |
| | | | |
| |
| |
| |
| | | | | 24,183 | | 19,685 | | 13,764 | |
| | | | |
| |
| |
| |
250
Back to Contents
| | | The average number of persons employed by HSBC during the year was made up as follows: | | | | | |
| | | | | | | | | |
| | | | 2004 | | 2003 | | 2002 | |
| | | | | | | | | |
| | | Europe | 80,930 | | 80,541 | | 76,924 | |
| | | Hong Kong | 25,070 | | 23,871 | | 24,452 | |
| | | Rest of Asia-Pacific | 37,211 | | 30,247 | | 27,584 | |
| | | North America | 70,041 | | 58,964 | | 22,262 | |
| | | South America | 31,475 | | 25,663 | | 26,253 | |
| | | |
| |
| |
| |
| | | | 244,727 | | 219,286 | | 177,475 | |
| | | |
| |
| |
| |
| | (b)
| Retirement benefits
HSBC has continued to account for pensions in accordance with Statement of Standard Accounting Practice (‘SSAP’) 24 ‘Accounting for pension costs’ and the disclosures given in (i) are those required by that standard. FRS 17 ‘Retirement benefits’ was issued in November 2000. Phased transitional disclosures are required from31 December 2001. These disclosures, to the extent not given in (i), are set out in (ii). |
| | | | |
| | | (i)
| HSBC Pension Schemes
HSBC operates some 168 pension schemes throughout the world, covering 85 per cent of HSBC’s employees, with a total pension cost of US$810 million (2003: US$814 million, 2002: US$558 million), of which US$389 million (2003: US$443 million, 2002: US$316 million) relates to overseas schemes. Of the overseas schemes, US$119 million (2003: US$146 million, 2002: US$43 million) has been determined in accordance with best practice and regulations in the United States and Canada. |
| | | | |
| | | | Progressively HSBC has been moving to defined contribution schemes for all new employees. |
| | | | |
| | | | The majority of the extant schemes are funded defined benefit schemes, which cover 50 per cent of HSBC’s employees, with assets, in the case of most of the larger schemes, held in trust or similar funds separate from HSBC. The pension cost relating to these schemes was US$620 million (2003; US$649 million, 2002: US$406 million) which is assessed in accordance with the advice of qualified actuaries. The schemes are reviewed at least on a triennial basis or in accordance with local practice and regulations. The actuarial assumptions used to calculate the projected benefit obligations of HSBC’s pension schemes vary according to the economic conditions of the countries in which they are situated. |
| | | | |
| | | | Included in the above figures is the pension cost relating to the HSBC Bank (UK) Pension Scheme. This comprises: |
| | | | |
| | | | | 2004 | |
| | | | | US$m | |
| | | | | | |
| | | | Regular cost | 223 | |
| | | | Amortisation of deficit | 86 | |
| | | | |
| |
| | | | Total cost for the year | 309 | |
| | | | |
| |
| | | | |
| | | | In the United Kingdom, the HSBC Bank (UK) Pension Scheme covers employees of HSBC Bank plc and certain other employees of HSBC. This scheme comprises a funded defined benefit scheme (‘the principal scheme’) which is closed and a defined contribution scheme which was established on 1 July 1996 for new employees. |
| | | | |
| | | | The latest valuation of the principal scheme was made at 31 December 2002 by C G Singer, Fellow of the Institute of Actuaries, of Watson Wyatt LLP. At that date, the market value of the principal scheme’s assets was US$9,302 million. The actuarial value of the assets represented 88 per cent of the benefits accrued to members, after allowing for expected future increases in earnings, and the resulting deficit amounted to US$1,270 million. The method adopted for this valuation was the projected unit method and the main assumptions used were a long-term investment return of 6.85 per cent per annum, salary increases of 3.0 per cent per annum, and post-retirement pension increases of 2.5 per cent per annum. |
| | | | |
| | | | In anticipation of the above valuation result, HSBC made a payment into the scheme in February 2003 amounting to US$817 million. In addition, following receipt of the valuation results, a further payment of US$137 million was made into the scheme. HSBC has decided to continue ongoing contributions to the |
251
Back to Contents
H S B C H O L D I N G S P L C
Notes onthe Financial Statements(continued)
| | | scheme at the rate of 20 per cent of pensionable salaries until completion of the next actuarial valuation, due as at 31 December 2005. |
| | | |
| | | The deficit as at 31 December 2002 is being amortised over a thirteen year period, the average remaining service life of the existing employed members. The amortisation is net of the interest benefit from the payments of US$817 million in February and US$137 million in August 2003. |
| | | |
| | | In Hong Kong, the HSBC Group Hong Kong Local Staff Retirement Benefit Scheme covers employees of The Hongkong and Shanghai Banking Corporation and certain other employees of HSBC. The scheme comprises a funded defined benefit scheme (which is a lump sum scheme) and a defined contribution scheme. The latter was established on 1 January 1999 for new employees. The latest valuation of the defined benefit scheme was made at 31 December 2004 and was performed by E Chiu, Fellow of the Society of Actuaries of the United States of America, of HSBC Life (International) Limited, a subsidiary of HSBC Holdings. At that date, the market value of the defined benefit scheme’s assets was US$942 million. On an ongoing basis, the actuarial value of the scheme’s assets represented 115 per cent of the benefits accrued to members, after allowing for expected future increases in salaries, and the resulting surplus amounted to US$121 million. On a wind-up basis, the actuarial value of the scheme’s assets represents 128 per cent of the members’ vested benefits, based on current salaries, and the resulting surplus amounted to US$206 million. The actuarial method used was the projected unit credit method and the main assumptions used in this valuation were a discount rate of 4.0 per cent per annum and long-term salary increases of 3.0 per cent per annum (with short-term deviation from 2005 to 2008). HSBC has decided to continue ongoing contributions to the scheme at the rate of 14.4 per cent of pensionable salaries until completion of the next valuation, due as at 31 December 2005. |
| | | |
| | | In the United States, the HSBC Bank USA Pension Plan (the ‘US principal scheme’) covers employees of HSBC Bank USA and certain other employees of HSBC. The latest valuation of the US principal scheme was made at 1 January 2004 by R G Gendron and K G Leister, Fellows of the Society of Actuaries, of Hewitt Associates LLC. At that date, the market value of the scheme’s assets was US$1,222 million. The actuarial value of the assets represented 122 per cent of the benefits accrued to members, after allowing for expected future increases in earnings, and the resulting surplus amounted to US$191 million. The method employed for this valuation was the projected unit credit method and the main assumptions used were a discount rate of 8.0 per cent per annum and average salary increases of 5.0 per cent per annum. HSBC has decided not to pay contributions to the scheme until completion of the next valuation, due as at 31 December 2005. |
| | | |
| | | Also in the United States, the HSBC Finance Corporation Retirement Income Plan, which covers employees of the HSBC Finance Corporation and certain other employees of HSBC, comprises a funded defined benefit scheme (the ‘HSBC Finance Corporation principal scheme’) which is closed and a cash balance plan which was established on 1 January 2000. HSBC has decided not to pay contributions to the scheme until completion of the next valuation, due as at 31 December 2005. |
| | | |
| | | The last reported actuarial valuation was made as at 1 July 2004. At that date, the market value of the HSBC Finance Corporation principal scheme’s assets was US$956 million, representing 129 per cent of the benefits accrued to members, after allowing for future increases in earnings. The resulting surplus amounted to US$213 million. The method employed for this valuation was the projected unit credit method and the main assumptions used were a discount rate of 8.0 per cent per annum and average salary increases of 3.75 per cent per annum. |
| | | |
| | | Effective close of business on 31 December 2004, the HSBC Bank USA Pension Plan and the HSBC Finance Corporation Retirement Income Plan merged, to form the HSBC North America (U.S.) Retirement Income Plan, with all new employees participating in the cash balance plan. |
| | | |
| | | The HSBC Bank (UK) Pension Scheme, The HSBC Group Hong Kong Local Staff Retirement Benefits Scheme, the HSBC Bank USA Pension Plan and the HSBC Finance Corporation Retirement Income Plan cover 40 per cent (2003: 41 per cent, 2002: 37 per cent) of HSBC’s employees. |
| | | |
| | | The pension cost for defined contribution schemes, which cover 34 per cent (2003: 34 per cent, 2002: 38 per cent) of HSBC’s employees, was US$190 million (2003: US$165 million, 2002: US$152 million). |
| | | |
252
Back to Contents
| | (ii) | FRS 17 Retirement Benefits |
| | | |
| | | At 31 December 2004 the assumptions used to calculate scheme liabilities for HSBC’s main defined benefit pension schemes under FRS 17 are: |
| | | |
| | | | | | | Rate of increase | | | |
| | | | | for pensions in | | | |
| | | | | payment and | | | |
| Discount | | Inflation | | deferred | | Rate of pay | |
| rate | | assumption | | pension | | increase | |
| % | | % | | % | | % | |
| | | | | | | | |
| | United Kingdom | 5.3 | | 2.7 | | 2.7 | | 3.2 | |
| | Hong Kong | 4.0 | | n/a | | n/a | | 5.0 | |
| | United States | 6.0 | | 2.5 | | n/a | | 3.75 | |
| | Jersey | 5.3 | | 2.7 | | 2.7 | | 4.45 | |
| | Mexico | 10.75 | | 5.0 | | 5.0 | | 6.50 | |
| | Brazil | 11.75 | | 5.0 | | 5.0 | | 5.0 | |
| | France | 4.5 | | 2.0 | | 2.0 | | 3.5 | |
| | Other | 3.25-6.0 | | 1.5-2.5 | | 0-1.5 | | 2.25-3.0 | |
| | | |
| | | The variation in discount rates between countries reflects the impact of local economic conditions. |
| | | |
| | | At 31 December 2003 the assumptions used to calculate scheme liabilities for HSBC’s main defined benefit pension schemes under FRS 17 were: |
| | | |
| | | | | | | Rate of increase | | | |
| | | | | for pensions in | | | |
| | | | | payment and | | | |
| Discount | | Inflation | | deferred | | Rate of pay | |
| rate | | assumption | | pension | | increase | |
| % | | % | | % | | % | |
| | | | | | | | |
| | United Kingdom | 5.5 | | 2.5 | | 2.5 | | 3.0 | |
| | Hong Kong | 5.5 | | n/a | | n/a | | 4.5 | |
| | United States | 6.25 | | 2.5 | | n/a | | 3.75 | |
| | Jersey | 5.5 | | 2.5 | | 2.5 | | 4.25 | |
| | Mexico | 10.75 | | 5.0 | | 5.0 | | 7.5 | |
| | Brazil | 11.30 | | 5.0 | | 5.0 | | 5.11 | |
| | France | 5.25 | | 2.0 | | 2.0 | | 3.5 | |
| | Other | 3.5-6.25 | | 1.5-2.0 | | 0-1.5 | | 2.5-3.0 | |
| | | | | | | | | | |
| | At 31 December 2002 the assumptions used to calculate scheme liabilities for HSBC’s main defined benefit pension schemes under FRS 17 were: |
| | | | | | | | | | |
| | | | | | | Rate of increase | | | |
| | | | | for pensions in | | | |
| | | | | payment and | | | |
| Discount | | Inflation | | deferred | | Rate of pay | |
| rate | | assumption | | pension | | Increase | |
| % | | % | | % | | % | |
| | | | | | | | |
| | United Kingdom | 5.6 | | 2.25 | | 2.25 | | 2.75 | |
| | Hong Kong | 5.5 | | n/a | | n/a | | 4.5 | |
| | United States | 6.75 | | 2.5 | | n/a | | 3.75 | |
| | Jersey | 5.6 | | 2.25 | | 2.25 | | 4.0 | |
| | Mexico | 10.78 | | 5.0 | | 5.0 | | 7.62 | |
| | Brazil | 10.25 | | 5.0 | | 5.0 | | 6.05 | |
| | France | 5.5 | | 2.0 | | 2.0 | | 3.5 | |
| | Other | 3.75-6.75 | | 1.5-2.0 | | 0-1.5 | | 2.5-3.0 | |
253
Back to Contents
H S B C H O L D I N G S P L C
Notes on the Financial Statements(continued)
| | | The assets in the defined benefit schemes and the expected rates of returns are: |