UNITED STATES SECURITIES AND EXCHANGE COMMISSION
WASHINGTON, D.C. 20549
FORM 10-Q
| | | |
| (mark one) | | |
| |
þ | | QUARTERLY REPORT PURSUANT TO SECTION 13 OR 15(d) OF THE SECURITIES EXCHANGE ACT OF 1934 |
| |
For the Quarterly Period Ended March 31, 2010 |
OR |
o | | TRANSITION REPORT PURSUANT TO SECTION 13 OR 15(d) OF THE SECURITIES EXCHANGE ACT OF 1934 |
Commission File Number 1-15157
PACTIV CORPORATION
(Exact name of registrant as specified in its charter)
| | | |
Delaware
(State or other jurisdiction of
incorporation or organization) | | 36-2552989
(I.R.S. Employer
Identification No.) |
| | | |
| | | |
1900 West Field Court
Lake Forest, Illinois | | 60045
(Zip Code) |
| (Address of principal executive offices) | | |
Registrant’s Telephone Number, including area code:(847) 482-2000
Indicate by check mark whether the registrant (1) has filed all reports required to be filed by Section 13 or 15(d) of the Securities Exchange Act of 1934 during the preceding 12 months (or for such shorter period that the registrant was required to file such reports), and (2) has been subject to such filing requirements for the past 90 days. Yes þ No o
Indicate by check mark whether the registrant has submitted electronically and posted on its corporate Web site, if any, every Interactive Data File required to be submitted and posted pursuant to Rule 405 ofRegulation S-T (§ 232.405 of this chapter) during the preceding 12 months (or for such shorter period that the registrant was required to submit and post such files). Yes o No o
Indicate by check mark whether the registrant is a large accelerated filer, an accelerated filer, a non-accelerated filer, or a smaller reporting company. See definitions of “large accelerated filer,” “accelerated filer” and “smaller reporting company” inRule 12b-2 of the Exchange Act.
| | | | | | | |
Large accelerated filer þ | | Accelerated filer o | | Non-accelerated filer o
(Do not check if a smaller reporting company) | | Smaller reporting company o |
Indicate by check mark whether the registrant is a shell company (as defined inRule 12b-2 of the Exchange Act). Yes o No þ
Indicate the number of shares outstanding of each of the issuer’s classes of common stock as of the latest practicable date: Common stock, par value $0.01 per share: 132,888,667 as of April 30, 2010. (See Notes to Financial Statements.)
TABLE OF CONTENTS
| | |
| * | | No response to this item is included herein because either it is inapplicable or there is nothing to report. |
2
PART I — FINANCIAL INFORMATION
| |
| ITEM 1. | Financial Statements (Unaudited) |
Consolidated Statement of Income
| | | | | | | | | |
| | | Three months ended March 31, | |
| (In millions, except share and per share data) | | 2010 | | | 2009 | |
| |
Sales | | $ | 777 | | | $ | 766 | |
Costs and expenses | | | | | | | | |
| Cost of sales, excluding depreciation and amortization | | | 560 | | | | 495 | |
| Selling, general, and administrative | | | 69 | | | | 80 | |
| Depreciation and amortization | | | 46 | | | | 46 | |
| | | | | | | | | |
| | | | 675 | | | | 621 | |
Operating income | | | 102 | | | | 145 | |
Other income (expense) | | | | | | | | |
| Interest expense, net of interest capitalized | | | (24 | ) | | | (23 | ) |
| | | | | | | | | |
Income before income taxes | | | 78 | | | | 122 | |
| Income tax expense | | | 30 | | | | 45 | |
| | | | | | | | | |
Net income and net income attributable to Pactiv | | $ | 48 | | | $ | 77 | |
| | | | | | | | | |
Earnings per share | | | | | | | | |
| Weighted-average number of shares of common stock outstanding | | | | | | | | |
| Basic | | | 132,569,709 | | | | 131,708,127 | |
| Diluted | | | 133,811,094 | | | | 132,485,534 | |
| Basic earnings per share of common stock attributable to Pactiv common shareholders | | | | | | | | |
| Continuing operations | | $ | 0.36 | | | $ | 0.58 | |
| Discontinued operations | | | — | | | | — | |
| | | | | | | | | |
| Total | | $ | 0.36 | | | $ | 0.58 | |
| | | | | | | | | |
| Diluted earnings per share of common stock attributable to Pactiv common shareholders | | | | | | | | |
| Continuing operations | | $ | 0.36 | | | $ | 0.58 | |
| Discontinued operations | | | — | | | | — | |
| | | | | | | | | |
| Total | | $ | 0.36 | | | $ | 0.58 | |
| | | | | | | | | |
The accompanying notes to the financial statements are an integral part of this statement.
3
Condensed Consolidated Statement of Financial Position
| | | | | | | | | |
| | | March 31,
| | | December 31,
| |
| (In millions, except share data) | | 2010 | | | 2009 | |
| |
Assets | | | | | | | | |
| Current assets | | | | | | | | |
| Cash and temporary cash investments | | $ | 235 | | | $ | 46 | |
| Accounts and notes receivable | | | | | | | | |
| Trade, less allowances of $5 and $6 at the respective dates | | | 19 | | | | 49 | |
| Trade held by variable interest entity (Pactiv RSA) | | | 384 | | | | — | |
| Retained interest in trade receivable securitization (Pactiv RSA) | | | — | | | | 228 | |
| Other | | | 24 | | | | 51 | |
| | | | | | | | | |
| Total accounts and notes receivable | | | 427 | | | | 328 | |
| | | | | | | | | |
| Inventories | | | | | | | | |
| Finished goods | | | 283 | | | | 240 | |
| Work in process | | | 44 | | | | 39 | |
| Raw materials | | | 87 | | | | 63 | |
| Other materials and supplies | | | 55 | | | | 48 | |
| | | | | | | | | |
| Total inventories | | | 469 | | | | 390 | |
| | | | | | | | | |
| Deferred income tax assets | | | 34 | | | | 53 | |
| | | | | | | | | |
| Other | | | 17 | | | | 15 | |
| | | | | | | | | |
| Total current assets | | | 1,182 | | | | 832 | |
| | | | | | | | | |
| Property, plant, and equipment, net | | | 1,170 | | | | 1,172 | |
| | | | | | | | | |
| Other assets | | | | | | | | |
| Goodwill | | | 1,137 | | | | 1,135 | |
| Intangible assets, net | | | 366 | | | | 372 | |
| Other | | | 61 | | | | 63 | |
| | | | | | | | | |
| Total other assets | | | 1,564 | | | | 1,570 | |
| | | | | | | | | |
Total assets | | $ | 3,916 | | | $ | 3,574 | |
| | | | | | | | | |
Liabilities and equity | | | | | | | | |
| Current liabilities | | | | | | | | |
| Short-term debt of variable interest entity (Pactiv RSA) and current maturities of long-term debt | | $ | 135 | | | $ | 5 | |
| Accounts payable | | | 176 | | | | 144 | |
| Taxes accrued | | | 29 | | | | 24 | |
| Interest accrued | | | 28 | | | | 20 | |
| Accrued promotions, rebates, and discounts | | | 74 | | | | 73 | |
| Accrued payroll and benefits | | | 50 | | | | 97 | |
| Other | | | 52 | | | | 54 | |
| | | | | | | | | |
| Total current liabilities | | | 544 | | | | 417 | |
| | | | | | | | | |
| Long-term debt | | | 1,430 | | | | 1,270 | |
| | | | | | | | | |
| Deferred income taxes | | | 75 | | | | 61 | |
| | | | | | | | | |
| Pension and postretirement benefits | | | 662 | | | | 694 | |
| | | | | | | | | |
| Other | | | 144 | | | | 131 | |
| | | | | | | | | |
| Pactiv shareholders’ equity | | | | | | | | |
| Common stock — $0.01 par value, 350,000,000 shares authorized, 132,853,213 and 132,334,417 shares issued and outstanding, after deducting 38,929,964 and 39,448,760 shares held in treasury, at the respective dates | | | 1 | | | | 1 | |
| Premium on common stock and other capital surplus | | | 728 | | | | 729 | |
| Accumulated other comprehensive income (loss) | | | | | | | | |
| Currency translation adjustment | | | 1 | | | | (3 | ) |
| Pension and postretirement plans | | | (1,718 | ) | | | (1,729 | ) |
| Gain (loss) on derivatives | | | 6 | | | | 6 | |
| Retained earnings | | | 2,029 | | | | 1,981 | |
| | | | | | | | | |
| Total Pactiv shareholders’ equity | | | 1,047 | | | | 985 | |
| Noncontrolling interest | | | 14 | | | | 16 | |
| | | | | | | | | |
| Total equity | | | 1,061 | | | | 1,001 | |
| | | | | | | | | |
Total liabilities and equity | | $ | 3,916 | | | $ | 3,574 | |
| | | | | | | | | |
The accompanying notes to the financial statements are an integral part of this statement.
4
Condensed Consolidated Statement of Cash Flows
| | | | | | | | | |
| For the three months ended March 31(In millions) | | 2010 | | | 2009 | |
| |
Operating activities | | | | | | | | |
| Net income | | $ | 48 | | | $ | 77 | |
| Adjustments to reconcile income from continuing operations to cash provided (used) by operating activities: | | | | | | | | |
| Depreciation and amortization | | | 46 | | | | 46 | |
| Deferred income taxes | | | 9 | | | | 11 | |
| Pension income | | | (12 | ) | | | (7 | ) |
| Noncash compensation expense | | | 4 | | | | 3 | |
| Net working capital | | | (63 | ) | | | 90 | |
| Pension contributions | | | — | | | | (100 | ) |
| Other | | | 6 | | | | (4 | ) |
| | | | | | | | | |
Cash provided (used) by operating activities | | $ | 38 | | | $ | 116 | |
| | | | | | | | | |
Investing activities | | | | | | | | |
| Expenditures for property, plant, and equipment | | $ | (29 | ) | | $ | (23 | ) |
| Acquisitions of businesses and assets | | | — | | | | (20 | ) |
| Other investing activities | | | — | | | | 1 | |
| | | | | | | | | |
Cash provided (used) by investing activities | | $ | (29 | ) | | $ | (42 | ) |
| | | | | | | | | |
Financing activities | | | | | | | | |
| Revolving credit facility borrowings | | $ | 160 | | | $ | — | |
| Asset securitization borrowings | | | 20 | | | | — | |
| Other | | | — | | | | (1 | ) |
| | | | | | | | | |
Cash provided (used) by financing activities | | $ | 180 | | | $ | (1 | ) |
| | | | | | | | | |
| Effect of foreign exchange rate changes on cash and temporary cash investments | | | — | | | | (1 | ) |
| | | | | | | | | |
Increase (decrease) in cash and temporary cash investments | | | 189 | | | | 72 | |
| Cash and temporary cash investments, January 1 | | | 46 | | | | 80 | |
| | | | | | | | | |
Cash and temporary cash investments, March 31 | | $ | 235 | | | $ | 152 | |
| | | | | | | | | |
The accompanying notes to the financial statements are an integral part of this statement.
5
Consolidated Statement of Changes in Equity
(In millions, except share data)
| | | | | | | | | | | | | | | | | | | | | | | | | |
| | | Pactiv Shareholders | | | | | | | |
| | | | | | Premium on
| | | | | | | | | | | | | |
| | | | | | common stock
| | | | | | Accumulated
| | | | | | | |
| | | | | | and other
| | | | | | other
| | | | | | | |
| | | Common
| | | capital
| | | Retained
| | | comprehensive
| | | Noncontrolling
| | | Total
| |
| | | stock | | | surplus | | | earnings | | | income (loss) | | | interest | | | equity | |
| |
Three months ended March 31, 2010 | | | | | | | | | | | | | | | | | | | | | | | | |
Balance, December 31, 2009 | | $ | 1 | | | $ | 729 | | | $ | 1,981 | | | $ | (1,726 | ) | | $ | 16 | | | $ | 1,001 | |
| Premium on common stock issued (515,856 shares) | | | | | | | 11 | | | | | | | | | | | | | | | | 11 | |
| Translation of foreign currency statements | | | | | | | | | | | | | | | 4 | | | | | | | | 4 | |
| Stock-based compensation | | | | | | | (12 | ) | | | | | | | | | | | | | | | (12 | ) |
| Change in pension and postretirement plan funded status, net of tax of $10 | | | | | | | | | | | | | | | 11 | | | | | | | | 11 | |
| Dividends to noncontrolling interest | | | | | | | | | | | | | | | | | | | (2 | ) | | | (2 | ) |
| Net income | | | | | | | | | | | 48 | | | | | | | | — | | | | 48 | |
| | | | | | | | | | | | | | | | | | | | | | | | | |
Balance, March 31, 2010 | | $ | 1 | | | $ | 728 | | | $ | 2,029 | | | $ | (1,711 | ) | | $ | 14 | | | $ | 1,061 | |
| | | | | | | | | | | | | | | | | | | | | | | | | |
Three months ended March 31, 2009 | | | | | | | | | | | | | | | | | | | | | | | | |
Balance, December 31, 2008 | | $ | 1 | | | $ | 710 | | | $ | 1,658 | | | $ | (1,698 | ) | | $ | 16 | | | $ | 687 | |
| Premium on common stock issued (371,322 shares) | | | | | | | 11 | | | | | | | | | | | | | | | | 11 | |
| Translation of foreign currency statements | | | | | | | | | | | | | | | (10 | ) | | | — | | | | (10 | ) |
| Stock-based compensation | | | | | | | (12 | ) | | | | | | | | | | | | | | | (12 | ) |
| Change in pension and postretirement plan funded status, net of tax of $5 | | | | | | | | | | | | | | | 8 | | | | | | | | 8 | |
| Net income | | | | | | | | | | | 77 | | | | | | | | — | | | | 77 | |
| | | | | | | | | | | | | | | | | | | | | | | | | |
Balance, March 31, 2009 | | $ | 1 | | | $ | 709 | | | $ | 1,735 | | | $ | (1,700 | ) | | $ | 16 | | | $ | 761 | |
| | | | | | | | | | | | | | | | | | | | | | | | | |
The accompanying notes to the financial statements are an integral part of this statement.
6
Consolidated Statement of Comprehensive Income (Loss)
| | | | | | | | | |
| For the three months ended March 31(In millions) | | 2010 | | | 2009 | |
| |
| Net income | | $ | 48 | | | $ | 77 | |
| Other comprehensive income (loss) | | | | | | | | |
| Pension and postretirement plans | | | 11 | | | | 8 | |
| Net currency translation gain (loss) | | | 4 | | | | (10 | ) |
| | | | | | | | | |
| Total other comprehensive income (loss) | | | 15 | | | | (2 | ) |
| | | | | | | | | |
Consolidated comprehensive income (loss) | | | 63 | | | | 75 | |
| Comprehensive income (loss) attributable to the noncontrolling interest | | | — | | | | — | |
| | | | | | | | | |
Comprehensive income (loss) attributable to Pactiv | | $ | 63 | | | $ | 75 | |
| | | | | | | | | |
The accompanying notes to the financial statements are an integral part of this statement.
7
Notes to Financial Statements (Unaudited)
| |
| Note 1. | Basis of Presentation |
The consolidated statement of income for the three-month period ended March 31, 2010, and 2009, the condensed consolidated statement of financial position at March 31, 2010, the condensed consolidated statement of cash flows for the three-month period ended March 31, 2010, and 2009, the consolidated statement of changes in equity for the three-month period ended March 31, 2010, and 2009, and the consolidated statement of comprehensive income (loss) for the three-month period ended March 31, 2010, and 2009 are unaudited. In our opinion, the accompanying financial statements contain all normal recurring adjustments necessary to present fairly the results of operations, financial position, and cash flows for the periods and at the dates indicated. These statements have been prepared pursuant to the rules and regulations of the Securities and Exchange Commission (SEC). They do not include all of the information and footnotes required by generally accepted accounting principles. Accordingly, these statements should be read in conjunction with Pactiv’sForm 10-K for the year ended December 31, 2009, which may be found at www.pactiv.com, under the Investor Relations link, in the subsection entitled “SEC Filings,” or a free copy may be obtained by contacting Investor Relations at(866) 456-5439. Certain reclassifications have been made to the prior year financial information to conform with the current year presentation.
On January 5, 2009, we purchased the polypropylene cup business of WinCup for $20 million. This business operates one manufacturing facility in North Carolina. The results of this business have been included in the consolidated financial statements as of that date.
We have three reporting segments:
| | |
| | • | Consumer Productsmanufactures disposable plastic, foam, molded fiber, pressed paperboard, and aluminum packaging products, and sells them to customers such as grocery stores, mass merchandisers, and discount chains. Products include waste bags, food storage bags, and disposable tableware and cookware. We sell many of our consumer products under well-known trademarks, such as Hefty®. |
| |
| | • | Foodservice/Food Packagingmanufactures foam, clear plastic, aluminum, pressed paperboard, and molded fiber packaging products, and sells them to customers in the food distribution channel, who prepare and process food for consumption. Customers include foodservice distributors, restaurants, other institutional foodservice outlets, food processors, and grocery chains. |
| |
| | • | Otherincludes corporate and administrative service operations and retiree benefit income and expense. |
The accounting policies of the reporting segments are the same as those for Pactiv as a whole. Where discrete financial information is not available by segment, reasonable allocations of expenses and assets/liabilities are used.
Subsequent Events
On February 3, 2010, the company entered into a Plan of Merger to acquire PWP Holdings, Inc. and PWP Industries for $200 million. PWP Industries manufactures and sells amorphous polyethylene terephthalate (APET) products in the food service market. This transaction closed on April 1, 2010. The purchase price was funded by borrowing $160 million on our revolving credit facility, adding $20 million to the asset securitization program, and utilizing $20 million in cash reserves.
We have evaluated subsequent events through the filing date of thisForm 10-Q, and have determined that there were no other subsequent events to recognize or disclose in these financial statements.
| |
| Note 2. | Summary of Accounting Policies |
For a complete discussion of our accounting policies, refer to Pactiv’s most recent filing onForm 10-K.
8
Changes in Accounting Principles
The Financial Accounting Standards Board (FASB) issued updates to Accounting Standards Codification (ASC)860-10 “Transfers and Servicing,” which were effective for interim and annual periods beginning after November 15, 2009. The updated provisions require additional information about transfers of financial assets and where companies have continuing exposure to the risk related to transferred financial assets, eliminates the concept of a qualifying special purpose entity, changes the requirements for derecognition of financial assets, and requires additional disclosures.ASC 860-10 was effective on January 1, 2010. See “Accounts and Notes Receivables” below and Note 3 for additional details.
The FASB issued updates toASC 810-10 “Consolidation,” which were effective for interim and annual periods beginning after November 15, 2009. These updated provisions require an enterprise to perform an analysis to determine whether the enterprise’s variable interest or interests give it a controlling financial interest in a variable interest entity, require ongoing reassessments of whether an enterprise is the primary beneficiary of a variable interest entity, and eliminate the quantitative approach previously required for determining the primary beneficiary of a variable interest entity. In addition, the provisions include an additional reconsideration event for determining whether an entity is a variable interest entity when any changes in facts and circumstances occur such that holders of the equity investment at risk, as a group, lose the power from voting rights or similar rights of those investments to direct the activities of the entity that most significantly impact the entity’s economic performance. Lastly, the provisions require enhanced disclosures that will provide users of financial statements with more transparent information about an enterprise’s involvement in a variable interest entity.ASC 860-10 was effective on January 1, 2010. See “Accounts and Notes Receivables” below and Note 3 for additional details.
Accounts and Notes Receivable
We have an asset securitization agreement under which certain of our accounts receivable are sold to our variable interest entity (VIE), Pactiv RSA. Under the accounting principles in effect prior to 2010, Pactiv RSA was not consolidated with our financial statements. In accordance with updated provisions withinASC 810-10 and860-10, which we adopted January 1, 2010, Pactiv RSA was included in the consolidated financial statements as of that date.
Pactiv RSA held $384 million of receivables at March 31, 2010, securing $130 million of short-term debt borrowed from various financial institutions that hold interests in the VIE on a pro-rata basis equal to their shares of the total loan. The collection of these receivables is used first to repay the loans. Any remaining amounts collected are retained by Pactiv RSA. If the collection of the receivables is insufficient to repay the loans, the lenders do not have recourse to Pactiv. We maintain an allowance for doubtful accounts for any potential uncollectable amounts after the loans are repaid. At December 31, 2009, under the prior accounting principles, securitized receivables totaling $110 million were recorded as a reduction to accounts and notes receivable and no debt was recorded.
| |
| Note 3. | Long-Term Debt, Short-Term Debt, and Financing Arrangements |
Long-Term Debt
We have a revolving credit facility, and borrowings under this facility totaled $160 million at March 31, 2010, for the PWP Industries acquisition. See Note 1 for additional details. At that date, the fair value of this debt was equal to the outstanding balance.
Short-Term Debt
As a part of our 2007 acquisition of Prairie Packaging, Inc. (Prairie), we assumed Prairie’s liability for $5 million borrowed from the Illinois Department Finance Authority (IDFA), which were funded by industrial
9
development revenue bonds issued by the IDFA. This debt will mature on December 1, 2010, and bears interest at varying rates (0.40% as of March 31, 2010) not to exceed 12% per annum.
On January 1, 2010, we adopted the accounting principles in accordance with updated provisions withinASC 810-10 and860-10 as described in Note 2 related to our asset securitization program. Consequently, we consolidated Pactiv RSA as of the date of adoption, resulting in an increase in short-term debt of $130 million as of March 31, 2010. The asset securitization agreement is a five-year agreement expiring in 2012, which allows us to sell up to $130 million of receivables under the facility. The terms of this agreement are re-negotiated annually; therefore, we have reflected it as short-term debt. Interest on this debt is recorded in interest expense. Under the accounting prior to 2010, the discount on the sold receivables was recorded as a loss on sale in other income. The amounts recorded in interest expense for the three months ended March 31, 2010, and the recorded loss on the sale for the three months ended March 31, 2009, were immaterial.
| |
| Note 4. | Financial Instruments |
Asset and Liability Instruments
At March 31, 2010, and December 31, 2009, the fair value of cash and temporary cash investments, short- and long-term receivables, accounts payable, and short-term debt were the same as, or not materially different from, the amount recorded for these assets and liabilities. The fair value of long-term debt was approximately $1.6 billion at March 31, 2010, and $1.5 billion at December 31, 2009. The recorded amount was $1.4 billion at March 31, 2010, and $1.3 billion at December 31, 2009. The fair value of long-term debt was based on quoted market prices for our debt instruments.
Instruments with Off-Balance Sheet Risk (Including Derivatives)
We use derivative instruments, principally swaps, forward contracts, and options, to manage our exposure to movements in foreign currency values, interest rates, and commodity prices.
Cash Flow Hedges
For derivative instruments that are designated and qualify as cash flow hedges, the effective portion of the gain or loss on the derivative is reported as a component of other comprehensive income (OCI) and reclassified into earnings in the same period or periods in which the hedged transaction affects earnings. Financial instruments designated as cash flow hedges are assessed both at inception and quarterly thereafter to ensure they are effective in offsetting changes in the cash flows of the related underlying exposures. The fair value of the hedge instruments are reclassified from OCI to earnings if the hedge ceases to be highly effective or if the hedged transaction is no longer probable.
Foreign Currency
From time to time, we use derivative financial instruments to hedge our exposure to changes in foreign currency exchange rates, principally using foreign currency purchase and sale contracts with terms of less than one year. We do so to mitigate our exposure to exchange rate changes related to third-party trade receivables and accounts payable. Net gains or losses on such contracts are recognized in the statement of income as offsets to foreign currency exchange gains or losses on the underlying transactions. In the statement of cash flows, cash receipts and payments related to hedging contracts are classified in the same way as cash flows from the transactions being hedged. We had no open foreign currency contracts as of March 31, 2010.
Interest Rates
We entered into interest rate swap agreements in connection with the acquisition of Prairie. The agreements were terminated on June 20, 2007, resulting in a gain of $9 million. This gain is being recorded as a reduction
10
of interest expense over the average life of the underlying debt. Amounts recognized in earnings related to our hedging transactions were immaterial for the three months ended March 31, 2010, and March 31, 2009.
Commodity
During the first quarter of 2010, we entered into natural gas purchase agreements with third parties, hedging a portion of the second and third quarter of 2010 purchases of natural gas used in the production processes at certain of our plants. These purchase agreements are marked to market, with the resulting gains or losses recognized in earnings when hedged transactions are recorded. Themark-to-market adjustments at March 31, 2010, were immaterial.
To minimize volatility in our margins due to large fluctuations in the price of commodities, in the second quarter of 2009 we entered into swap contracts to manage risks associated with market fluctuations in resin prices. These contracts were designated as cash flow hedges of forecasted commodity purchases. All monthly swap contracts entered into in 2009 have expired. There were no resin swap contracts outstanding as of March 31, 2010.
Fair Value Measurements
Financial assets and liabilities that are recorded at fair value consist of derivative contracts that are used to hedge exposures to interest rate, commodity, and currency risks.ASC 820-10-35 sets out a fair value hierarchy that groups fair value measurement inputs into three classifications: Level 1, Level 2, or Level 3. Level 1 inputs are quoted prices in an active market for identical assets or liabilities. Level 2 inputs are inputs other than quoted prices included within Level 1 that are observable for the asset or liability, either directly or indirectly. Level 3 inputs are unobservable inputs for the asset or liability. All of our fair value measurements for derivative contracts use Level 2 inputs.
There were no outstanding derivative instruments recorded in the consolidated balance sheet as of March 31, 2010, and as of December 31, 2009.
There were no gains or losses recognized in OCI for those derivatives designated as cash flow hedges for the three months ended March 31, 2010, and March 31, 2009. There were no gains reclassified from OCI into earnings for the effective portion of commodity contract hedges for the three months ended March 31, 2010, and March 31, 2009. The gains reclassified from OCI into earnings for the effective portion of interest rate contract hedges were immaterial for the three months ended March 31, 2010, and March 31, 2009.
| |
| Note 5. | Goodwill and Intangible Assets |
The changes in the carrying values of goodwill between December 31, 2009, and March 31, 2010, are shown in the following table.
| | | | | | | | | | | | | |
| | | Consumer
| | | Foodservice/
| | | | |
| (In millions) | | Products | | | Food Packaging | | | Total | |
| |
| Balance, December 31, 2009 | | $ | 291 | | | $ | 844 | | | $ | 1,135 | |
| Foreign currency translation adjustment | | | — | | | | 2 | | | | 2 | |
| | | | | | | | | | | | | |
| Balance, March 31, 2010 | | $ | 291 | | | $ | 846 | | | $ | 1,137 | |
| | | | | | | | | | | | | |
11
Intangible assets are summarized in the following table.
| | | | | | | | | | | | | | | | | |
| | | March 31, 2010 | | | December 31, 2009 | |
| | | Carrying
| | | Accumulated
| | | Carrying
| | | Accumulated
| |
| (In millions) | | value | | | amortization | | | value | | | amortization | |
| |
| Intangible assets subject to amortization | | | | | | | | | | | | | | | | |
| Patents | | $ | 87 | | | $ | 75 | | | $ | 87 | | | $ | 74 | |
| Customer relationships | | | 209 | | | | 39 | | | | 209 | | | | 36 | |
| Other | | | 146 | | | | 91 | | | | 145 | | | | 88 | |
| | | | | | | | | | | | | | | | | |
| | | | 442 | | | | 205 | | | | 441 | | | | 198 | |
| Intangible assets not subject to amortization (primarily trademarks) | | | 129 | | | | — | | | | 129 | | | | — | |
| | | | | | | | | | | | | | | | | |
| | | $ | 571 | | | $ | 205 | | | $ | 570 | | | $ | 198 | |
| | | | | | | | | | | | | | | | | |
Amortization expense for intangible assets was $6 million for both the three months ended March 31, 2010, and March 31, 2009. Amortization expense is estimated to total $25 million for 2010, $24 million for 2011, $23 million for 2012, $19 million for 2013, and $19 million for 2014.
We review the carrying value of our goodwill and indefinite-lived intangibles for possible impairment on an annual basis. Our annual review is conducted in the fourth quarter of the year, or earlier if warranted by events or changes in circumstances. There were no events or changes in circumstances in the first three months of 2010 that warranted an impairment review of the goodwill and indefinite-lived intangibles.
| |
| Note 6. | Property, Plant, and Equipment, Net |
| | | | | | | | | |
| | | March 31,
| | | December 31,
| |
| (In millions) | | 2010 | | | 2009 | |
| |
| Original cost | | | | | | | | |
| Land, buildings, and improvements | | $ | 675 | | | $ | 667 | |
| Machinery and equipment | | | 1,936 | | | | 1,929 | |
| Other, including construction in progress | | | 112 | | | | 96 | |
| | | | | | | | | |
| | | $ | 2,723 | | | $ | 2,692 | |
| Less accumulated depreciation and amortization | | | (1,553 | ) | | | (1,520 | ) |
| | | | | | | | | |
| Net property, plant, and equipment | | $ | 1,170 | | | $ | 1,172 | |
| | | | | | | | | |
Capitalized interest was immaterial for both the three months ended March 31, 2010, and March 31, 2009.
Total gross unrecognized income tax benefits were $59 million as of March 31, 2010, and $58 million as of December 31, 2009. At March 31, 2010, and December 31, 2009, the total amount of unrecognized income tax benefits that, if recognized, would favorably impact our effective tax rate for continuing operations in future periods was $50 million. As of March 31, 2010, it is reasonably possible that the amount of unrecognized income tax benefits may increase or decrease during the following twelve months. However, it is not expected that any such changes, individually or in total, would significantly affect our operating results or financial condition.
It is our continuing practice to record accruals for interest and penalties related to income tax matters as income tax expense. Such accruals totaled $12 million as of March 31, 2010, and $11 million as of December 31, 2009. Expense recorded in the first quarter of 2010 for interest and penalties for continuing operations was immaterial.
12
U.S. federal income tax returns filed for the years 2006 through 2008 are open for examination by the Internal Revenue Service. Various state, local, and foreign tax returns filed for the years 2002 through 2008 are open for examination by tax authorities in those jurisdictions.
At March 31, 2010, and December 31, 2009, total gross unrecognized income tax benefits included $1 million related to discontinued operations, all of which, if recognized, would favorably impact income related to discontinued operations in future periods. Expense recorded in the first quarter of 2010 for interest and penalties for discontinued operations was immaterial.
In connection with the adoption ofASC 718-10, “Share-Based Payment,” we elected to use the simplified method in calculating our additional paid-in capital pool, as described in prior authoritative guidance.ASC 718-10 requires that tax deductions for compensation costs in excess of amounts recognized for accounting purposes be reported as cash flow from financing activities, rather than as cash flow from operating activities. Such “excess” amounts were immaterial for the three months ended March 31, 2010.
On March 23, 2010, the Patient Protection and Affordable Care Act (the “Act”) was signed into law. Included in the provisions is a change in the federal income tax treatment of the Medicare Part D subsidy. For periods beginning after December 31, 2012, we will no longer be entitled to receive a federal income tax deduction for payments made to provide our retirees with prescription drug benefits which equal previous subsidies we received from the U.S. government for providing retirees with prescription drug benefits. We had previously recorded a deferred income tax asset for the tax benefit of future payments made with respect to this subsidy. As a result of the Act, we have written-off $3 million of deferred income tax assets as a component of income tax expense from continuing operations for the period ended March 31, 2010.
Earnings Per Share
Earnings per share of common stock outstanding were computed as follows:
| | | | | | | | | |
| | | Three months ended March 31, | |
| (In millions, except share and per share data) | | 2010 | | | 2009 | |
| |
Basic earnings per share | | | | | | | | |
| Net income attributable to Pactiv | | $ | 48 | | | $ | 77 | |
| | | | | | | | | |
| Weighted-average number of shares of common stock outstanding | | | 132,569,709 | | | | 131,708,127 | |
| | | | | | | | | |
| Basic earnings per share attributable to Pactiv | | $ | 0.36 | | | $ | 0.58 | |
| | | | | | | | | |
Diluted earnings per share | | | | | | | | |
| Net income attributable to Pactiv | | $ | 48 | | | $ | 77 | |
| | | | | | | | | |
| Weighted-average number of shares of common stock outstanding | | | 132,569,709 | | | | 131,708,127 | |
| Effect of dilutive securities | | | | | | | | |
| Stock options | | | 362,077 | | | | 136,296 | |
| Performance shares | | | 874,373 | | | | 639,671 | |
| Restricted shares | | | 4,935 | | | | 1,440 | |
| | | | | | | | | |
| Weighted-average number of shares of common stock outstanding, including dilutive securities | | | 133,811,094 | | | | 132,485,534 | |
| | | | | | | | | |
| Diluted earnings per share attributable to Pactiv | | $ | 0.36 | | | $ | 0.58 | |
| | | | | | | | | |
We did not repurchase stock in the first quarter of 2010 or 2009.
13
Rabbi Trust
In November 1999, we established a rabbi trust and reserved 3,200,000 shares of Pactiv common stock for the trust. These shares were issued to the trust in January 2000. This trust is designed to assure the payment of deferred compensation and supplemental pension benefits. These shares are not considered outstanding for purposes of financial reporting.
| |
| Note 9. | Pension Plans and Other Postretirement Benefits |
The impact of pension plans on pretax income was as follows:
| | | | | | | | | |
| | | Three months
| |
| | | ended March 31, | |
| (In millions) | | 2010 | | | 2009 | |
| |
| Components of net periodic benefit income (expense) | | | | | | | | |
| Service cost of benefits earned | | $ | (4 | ) | | $ | (4 | ) |
| Interest cost of benefit obligations | | | (57 | ) | | | (60 | ) |
| Expected return on plan assets | | | 92 | | | | 83 | |
| Amortization of unrecognized net losses | | | (19 | ) | | | (12 | ) |
| | | | | | | | | |
| Total net periodic benefit income (expense) | | $ | 12 | | | $ | 7 | |
| | | | | | | | | |
We have postretirement health care and life insurance plans that cover certain of our salaried and hourly employees who retire in accordance with the various provisions of such plans. Benefits may be subject to deductibles, copayments, and other limitations. These postretirement plans are not funded, and we reserve the right to change them. Interest cost of benefit obligations of $1 million for three months ended March 31, 2010, and March 31, 2009, accounted for the total net periodic benefit expense for our postretirement plans.
| |
| Note 10. | Segment Information |
Our three segments are Consumer Products, Foodservice/Food Packaging, and Other. See Note 1 for additional details.
The following table sets forth certain segment information.
| | | | | | | | | | | | | | | | | |
| | | Consumer
| | | Foodservice/Food
| | | | | | | |
| (In millions) | | Products | | | Packaging | | | Other | | | Total | |
| |
For the three months ended March 31, 2010 | | | | | | | | | | | | | | | | |
| Sales to external customers | | $ | 291 | | | $ | 486 | | | $ | — | | | $ | 777 | |
| Operating income (loss) | | | 53 | | | | 49 | | | | — | (a) | | | 102 | |
| Total assets | | | 1,258 | | | | 2,319 | | | | 339 | (b) | | | 3,916 | |
For the three months ended March 31, 2009 | | | | | | | | | | | | | | | | |
| Sales to external customers | | $ | 283 | | | $ | 483 | | | $ | — | | | $ | 766 | |
| Operating income (loss) | | | 63 | | | | 84 | | | | (2 | ) (a) | | | 145 | |
| Total assets | | | 1,249 | | | | 2,135 | | | | 354 | (b) | | | 3,738 | |
| | |
| (a) | | Includes pension plan income and unallocated corporate expenses. |
| |
| (b) | | Includes administrative service operations. |
| |
| Note 11. | Noncontrolling Interests |
There were no changes in ownership interest in our subsidiaries for the three months ended March 31, 2010, or March 31, 2009.
The preceding notes are an integral part of the foregoing financial statements.
14
| |
| ITEM 2. | Management’s Discussion and Analysis of Financial Condition and Results of Operations |
Basis of Presentation
Financial statements for all periods presented in this report were prepared on a consolidated basis in accordance with generally accepted accounting principles consistently applied. All per share information is presented on a diluted basis unless otherwise noted. Certain reclassifications have been made to prior year financial information to conform to the current year presentation.
On January 5, 2009, we purchased the polypropylene cup business of WinCup for $20 million. This business operates one manufacturing facility in North Carolina. The results of this business have been included in the consolidated financial statements as of that date.
We have three reporting segments:
| | |
| | • | Consumer Productsmanufactures disposable plastic, foam, molded fiber, pressed paperboard, and aluminum packaging products, and sells them to customers such as grocery stores, mass merchandisers, and discount chains. Products include waste bags, food storage bags, and disposable tableware and cookware. We sell many of our consumer products under well-known trademarks, such as Hefty®. |
| |
| | • | Foodservice/Food Packagingmanufactures foam, clear plastic, aluminum, pressed paperboard, and molded fiber packaging products, and sells them to customers in the food distribution channel, who prepare and process food for consumption. Customers include foodservice distributors, restaurants, and other institutional foodservice outlets, food processors, and grocery chains. |
| |
| | • | Otherincludes corporate and administrative service operations and retiree benefit income and expense. |
The accounting policies of the reporting segments are the same as those for Pactiv as a whole. Where discrete financial information is not available by segment, reasonable allocations of expenses and assets/liabilities are used.
Significant Trends, Opportunities and Challenges
The primary raw materials used to manufacture our products are plastic resins, principally polystyrene, polyethylene, polypropylene, and polyethylene terephthalate (PET). Average industry prices as published by Chemical Market Associates, Inc. are depicted in the following graphs.
| | | |
| CMAI Polystyrene (cents/lb) | | CMAI Polyethylene (cents/lb) |
| |
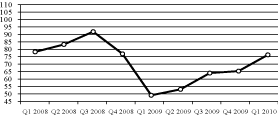 | | 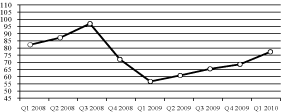 |
15
| | | |
| CMAI Polypropylene (cents/lb) | | CMAI PET (cents/lb) |
| |
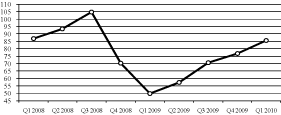 | | 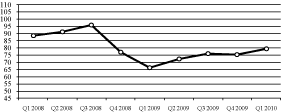 |
The prices of plastic resins are affected by the prices of crude oil and natural gas, as well as supply and demand factors of various intermediate petrochemicals. In recent years, there have been significant movements in resin prices, which rose to historic highs in 2008, dropped precipitously at the end of 2008 and into early 2009, and rose throughout the rest of 2009 and the first quarter of 2010. We have historically adjusted our selling prices to reflect changes in raw material costs, although there is usually a lag of several months. Some of our business is pursuant to contracts that have price indices that automatically adjust after a set number of months, usually three or six, to reflect changes in certain raw materials.
Our business is sensitive to other energy-related cost movements, particularly those that affect transportation and utility costs. Historically, we have been able to mitigate the effect of higher energy-related costs with productivity improvements and other cost reductions.
The economic downturn that began in late 2007 has impacted consumer spending in many areas and has reduced demand for some of our products. However, our overall volume has not been adversely impacted by the economic downturn, and we have seen increases in volume over the past four quarters.
In 2006, we began to introduce “lean” principles and tools in many of our operating facilities. We are expanding the use of lean principles to help us accelerate productivity improvements by reducing inventory and scrap levels, providing rapid stock replenishment, shortening scheduling cycles, improving our “one-stop shopping” service, eliminating nonvalue-added activities, and streamlining processes. As this is a long-term process, we expect our ability to use these tools throughout the organization will have a positive effect on our operating results in future years.
We believe that cash flow from operations, available cash reserves, and the ability to obtain cash under our credit facility and asset securitization program will be sufficient to meet current and future potential pension funding, liquidity, and capital requirements.
Results of Continuing Operations
Three Months Ended March 31, 2010, Compared with Three Months Ended March 31, 2009
Sales
| | | | | | | | | | | | | | | | | |
| | | Three months
| | | | |
| | | ended
| | | Increase
| |
| | | March 31, | | | (decrease) | |
| (In millions) | | 2010 | | | 2009 | | | Amount | | | Percent | |
| |
| Consumer Products | | $ | 291 | | | $ | 283 | | | $ | 8 | | | | 2.8 | % |
| Foodservice/Food Packaging | | | 486 | | | | 483 | | | | 3 | | | | 0.6 | |
| | | | | | | | | | | | | | | | | |
| Total | | $ | 777 | | | $ | 766 | | | $ | 11 | | | | 1.4 | % |
| | | | | | | | | | | | | | | | | |
Sales rose 1%, reflecting volume growth of 8% offset partially by lower pricing of 7%. The lower pricing is a result of normal selling price reductions during 2009 to reflect the impact of lower raw material costs. Because there is a typical lag of several months before our pricing reflects raw material cost movements, there can be
16
periods of time when our pricing is moving the opposite of what is occurring with our raw material costs, as we experienced in the first quarter of 2010.
Sales for Consumer Products increased 3%, reflecting higher volume of 9% and unfavorable pricing of 6%. The volume growth primarily reflected new business in store brand waste bags and tableware. The lower pricing reflects the normal lag in selling price changes in response to raw material changes.
Foodservice/Food Packaging sales rose 1%, driven by volume growth of 7% and favorable foreign exchange of 1%, offset partially by lower pricing of 7%. The volume increase primarily was related to continued growth in cups and cutlery, as well as growth in a number of other product areas, including polypropylene containers, processor trays, and paper-based items. The lower pricing reflects the normal lag in selling price changes in response to raw material changes.
Operating Income
| | | | | | | | | | | | | | | | | |
| | | Three months
| | | | |
| | | ended
| | | Increase
| |
| | | March 31, | | | (decrease) | |
| (In millions) | | 2010 | | | 2009 | | | Amount | | | Percent | |
| |
| Consumer Products | | $ | 53 | | | $ | 63 | | | $ | (10 | ) | | | (15.9 | )% |
| Foodservice/Food Packaging | | | 49 | | | | 84 | | | | (35 | ) | | | (41.7 | ) |
| Other | | | — | | | | (2 | ) | | | 2 | | | | 100.0 | |
| | | | | | | | | | | | | | | | | |
| Total | | $ | 102 | | | $ | 145 | | | $ | (43 | ) | | | (29.7 | )% |
| | | | | | | | | | | | | | | | | |
Operating income decreased primarily as a result of $77 million of unfavorable spread (the difference between selling prices and raw material costs), offset by higher volume of $19 million, lower selling, general, and administrative (SG&A) expense of $11 million, and lower operating costs of $4 million. The decrease in SG&A expense was primarily a result of lower incentive compensation accruals this year, as well as higher pension income.
The decrease in operating income for Consumer Products was driven mainly by lower pricing of $19 million, offset partially by higher volume of $7 million, and $3 million of lower operating and SG&A expenses.
Lower operating income for Foodservice/Food Packaging was driven primarily by unfavorable spread of $56 million due to lower pricing and higher raw material costs, offset partially by increased volume of $12 million and lower SG&A expense of $6 million.
The increase in Other operating income was due mainly to higher pension income.
Net Income attributable to Pactiv
We recorded net income of $48 million, or $0.36 per share, compared with $77 million, or $0.58 per share, in 2009. The change was driven primarily by lower operating income of $27 million ($43 million before tax) as described previously.
17
Liquidity and Capital Resources
Capitalization
| | | | | | | | | | | | | |
| | | March 31,
| | | December 31,
| | | Increase
| |
| (In millions) | | 2010 | | | 2009 | | | (decrease) | |
| |
| Short-term debt, including current maturities of long-term debt (1) | | $ | 135 | | | $ | 5 | | | $ | 130 | |
| Long-term debt (2) | | | 1,430 | | | | 1,270 | | | | 160 | |
| | | | | | | | | | | | | |
| Total debt | | | 1,565 | | | | 1,275 | | | | 290 | |
| Noncontrolling interest | | | 14 | | | | 16 | | | | (2 | ) |
| Pactiv shareholders’ equity | | | 1,047 | | | | 985 | | | | 62 | |
| | | | | | | | | | | | | |
| Total capitalization | | $ | 2,626 | | | $ | 2,276 | | | $ | 350 | |
| | | | | | | | | | | | | |
| Ratio of total debt to total capitalization | | | 59.6 | % | | | 56.0 | % | | | | |
| | |
| (1) | | Short-term debt payable in December 2010. $130 million in 2010 related to asset securitization facility classification as debt due to adoption of Accounting Standards Codification (ASC)810-10 and860-10 disclosure provisions. See Note 2 to the financial statements for additional details. |
| |
| (2) | | $160 million in 2010 related to borrowings against long-term revolving debt to fund the PWP acquisition. |
Cash Flows
| | | | | | | | | | | | | |
| | | Three months
| | | Increase
| |
| | | ended March 31, | | | (decrease)
| |
| (In millions) | | 2010 | | | 2009 | | | in cash flow | |
| |
| Cash provided (used) by: | | | | | | | | | | | | |
| Operating activities | | $ | 38 | | | $ | 116 | | | $ | (78 | ) |
| Investing activities | | | (29 | ) | | | (42 | ) | | | 13 | |
| Financing activities | | | 180 | | | | (1 | ) | | | 181 | |
The decrease in cash provided by operating activities was driven primarily by the impact of higher raw material costs on inventory of $71 million, lower receivable collections of $31 million, and asset securitization due to the adoption of changes to ASC 810 “Consolidation” of $20 million. In addition, higher incentive compensation payments of $31 million and lower income from continuing operations of $29 million added to the decrease. This was offset partially by a $100 million pretax contribution to our U.S. pension plan in 2009, reduced by related favorable cash tax effects of approximately $20 million and higher accounts payable of $21 million.
The increase in cash used by investing activities was driven by the 2009 acquisition of the WinCup polypropylene cup business for $20 million, partially offset by higher capital expenditures of $6 million in 2010.
The increase in cash used by financing activities was a result of borrowing $160 million against long-term revolving debt and adding $20 million to the asset securitization program to fund the PWP acquisition, which closed April 1, 2010.
Capital Commitments
Commitments for authorized capital expenditures totaled approximately $45 million at March 31, 2010. It is anticipated that the majority of these expenditures will be funded from existing cash and short-term investments and internally generated cash.
18
Contractual Obligations
There has been no material change in the company’s aggregate contractual obligations since December 31, 2009.
Liquidity and Off-Balance-Sheet Financing
We use various sources of funding to manage liquidity. Sources of liquidity include cash flow from operations and a5-year revolving credit facility of $750 million, under which $160 million was outstanding at March 31, 2010. We were in full compliance with the covenants of our revolving credit agreement at the end of the period. The two financial covenant ratios contained in our debt agreements are an interest coverage ratio and the total debt to EBITDA ratio. The interest coverage ratio is defined as consolidated earnings before interest, taxes, depreciation and amortization, and other unusual noncash items (EBITDA) divided by interest expense. The minimum required ratio is 3.50 to 1. The total debt to EBITDA ratio is calculated by dividing the total debt by EBITDA. The maximum permitted total debt to EBITDA ratio is 3.50 to 1.
The interest coverage ratio and the debt to EBITDA ratio are shown in the following table.
| | | | | | | | | | | | | | | | | |
| | | | | | Plus
| | | Less
| | | | |
| | | Twelve months
| | | Three months
| | | Three months
| | | Twelve months
| |
| | | ended
| | | ended
| | | ended
| | | ended
| |
| (In millions) | | December 31, 2009 | | | March 31, 2010 | | | March 31, 2009 | | | March 31, 2010 | |
| |
| Net income (1) | | $ | 323 | | | $ | 48 | | | $ | 77 | | | $ | 294 | |
| Adjustments: | | | | | | | | | | | | | | | | |
| Noncash restructuring and other (2) | | | (1 | ) | | | — | | | | — | | | | (1 | ) |
| Discontinued operations, net of tax (1) | | | (15 | ) | | | — | | | | — | | | | (15 | ) |
| Interest expense, net of interest capitalized (1) | | | 94 | | | | 24 | | | | 23 | | | | 95 | |
| Income tax expense (1) | | | 177 | | | | 30 | | | | 45 | | | | 162 | |
| Depreciation and amortization (1) | | | 184 | | | | 46 | | | | 46 | | | | 184 | |
| Noncontrolling interest (1) | | | 1 | | | | — | | | | — | | | | 1 | |
| | | | | | | | | | | | | | | | | |
| EBITDA | | $ | 763 | | | $ | 148 | | | $ | 191 | | | $ | 720 | |
| | | | | | | | | | | | | | | | | |
| EBITDA | | $ | 763 | | | | | | | | | | | $ | 720 | |
| Interest expense, net of interest capitalized (1) | | | 94 | | | | | | | | | | | | 95 | |
| | | | | | | | | | | | | | | | | |
| Interest coverage ratio | | | 8.12 | | | | | | | | | | | | 7.58 | |
| | | | | | | | | | | | | | | | | |
| Total debt (3) | | $ | 1,275 | | | | | | | | | | | $ | 1,565 | |
| EBITDA | | | 763 | | | | | | | | | | | | 720 | |
| | | | | | | | | | | | | | | | | |
| Total debt to EBITDA ratio | | | 1.67 | | | | | | | | | | | | 2.17 | |
| | | | | | | | | | | | | | | | | |
| | |
| (1) | | Amounts per the consolidated statement of income (for 2009 information, refer to our 200910-K and first quarter 200910-Q; for 2009 adjusted interim information, refer to Note 16 of our 200910-K). |
| |
| (2) | | Amounts per the consolidated statement of cash flows (for 2009 information, refer to our 200910-K and first quarter 200910-Q; for 2009 adjusted interim information, refer to Note 16 of our 200910-K). |
| |
| (3) | | Amounts per the consolidated statement of financial position. |
We have an asset securitization agreement under which certain of our accounts receivable are sold to our variable interest entity (VIE), Pactiv RSA. Under the accounting principles in effect prior to 2010, Pactiv RSA was not consolidated with our financial statements. In accordance with updated provisions withinASC 810-10
19
and860-10, which we adopted January 1, 2010, Pactiv RSA is included in the consolidated financial statements as of that date. See Note 2 for additional details.
We have a U.S. qualified pension plan that covers approximately 7,000 of our employees, as well as approximately 65,000 others, mostly retirees and persons who worked for predecessor companies that were part of Tenneco Inc. The requirement to make contributions to this plan is a function of several factors, the most important of which are the return on plan assets and applicable funding discount rate used in calculating plan liabilities. During 2009, we contributed $550 million pretax to the plan, and plan assets earned a return of approximately 26%. As of December 31, 2009, our U.S. pension plan was 94% funded on an ERISA basis, which determines the minimum funding requirements for the plan. As long as our funded ratio is above 60%, there is no meaningful impact on us or to the plan. We do not expect to make additional sizeable contributions to the plan for the foreseeable future.
We believe that cash flow from operations, available cash reserves, and the ability to obtain cash under our credit facility and asset securitization program will be sufficient to meet current and future potential pension funding, liquidity, and capital requirements.
Changes in Accounting Principles
The Financial Accounting Standards Board (FASB) issued updates toASC 860-10 “Transfers and Servicing,” which were effective for interim and annual periods beginning after November 15, 2009. The updated provisions require additional information about transfers of financial assets and where companies have continuing exposure to the risk related to transferred financial assets, eliminates the concept of a qualifying special purpose entity, changes the requirements for derecognizing financial assets, and requires additional disclosures.ASC 860-10 was effective on January 1, 2010. See Note 2 and Note 3 for additional details.
The FASB issued updates toASC 810-10 “Consolidation,” which were effective for interim and annual periods beginning after November 15, 2009. These updated provisions require an enterprise to perform an analysis to determine whether the enterprise’s variable interest or interests give it a controlling financial interest in a variable interest entity, require ongoing reassessments of whether an enterprise is the primary beneficiary of a variable interest entity, and eliminate the quantitative approach previously required for determining the primary beneficiary of a variable interest entity. In addition, the provisions include an additional reconsideration event for determining whether an entity is a variable interest entity when any changes in facts and circumstances occur such that holders of the equity investment at risk, as a group, lose the power from voting rights or similar rights of those investments to direct the activities of the entity that most significantly impact the entity’s economic performance. Lastly, the provisions require enhanced disclosures that will provide users of financial statements with more transparent information about an enterprise’s involvement in a variable interest entity.ASC 860-10 was effective on January 1, 2010. See Note 2 and Note 3 for additional details.
Critical Accounting Policies
For a complete discussion of the company’s critical accounting policies, refer to Pactiv’s most recent filing onForm 10-K.
20
CAUTIONARY STATEMENT FOR PURPOSES OF “SAFE HARBOR” PROVISIONS
OF THE PRIVATE SECURITIES LITIGATION REFORM ACT OF 1995
Certain statements included in this Quarterly Report onForm 10-Q, including statements in the “Management’s Discussion and Analysis of Financial Condition and Results of Operations” section and in the notes to the financial statements, are “forward-looking statements.” All statements other than statements of historical fact, including statements regarding prospects and future results, are forward-looking. These forward-looking statements generally can be identified by the use of terms and phrases such as “will,” “believe,” “anticipate,” “may,” “might,” “could,” “expect,” “estimated,” “projects,” “intends,” “foreseeable future,” and similar terms and phrases. These forward-looking statements are not based on historical facts, but rather on our current expectations or projections about future events. Accordingly, these forward-looking statements are subject to known and unknown risks and uncertainties. While we believe that the assumptions underlying these forward-looking statements are reasonable and make the statements in good faith, actual results almost always vary from expected results, and the differences could be material.
See “Risk Factors” section (Item 1A) in our most recently filed Securities and Exchange Commission (SEC)Form 10-K and Part II (Item 1A) of this report for some of the factors that we believe could cause our actual results to differ materially from future results expressed or implied by these forward-looking statements. These factors include the following:
| | |
| | • | Changes in consumer demand and selling prices for our products, including new products that our competitors or we may introduce that could impact sales and margins. |
| |
| | • | Material substitutions and changes in costs of raw materials, including plastic resins, labor, utilities, or transportation that could impact our expenses and margins. |
| |
| | • | Changes in laws or governmental actions, including changes in regulations such as those relating to air emissions or plastics generally. |
| |
| | • | The availability or cost of capital could impact growth or acquisition opportunities. |
| |
| | • | Workforce factors such as strikes or other labor interruptions. |
| |
| | • | The general economic, political, and competitive conditions in countries in which we operate, including currency fluctuations and other risks associated with operating outside of the U.S. |
| |
| | • | Changes in (1) assumptions regarding the long-term rate of return on pension assets and other factors, (2) the discount rate, and (3) the level of amortization of actuarial gains and losses. |
| |
| | • | Changes inU.S. and/or foreign governmental regulations relating to pension plan funding. |
| |
| | • | Changes enacted by the SEC, the FASB, or other regulatory or accounting bodies. See “Changes in Accounting Principles.” |
| |
| | • | Competition from producers located in countries that have lower labor and other costs. |
| |
| | • | Our ability to integrate new businesses that we have acquired and may acquire, or to dispose of businesses or business segments that we may wish to divest. |
21
| |
| ITEM 3. | Quantitative and Qualitative Disclosures about Market Risk |
Derivative Financial Instruments
We are exposed to market risks related to changes in foreign currency exchange rates, interest rates, and commodity prices. To manage these risks we may enter into various hedging contracts in accordance with established policies and procedures. We do not use hedging instruments for trading purposes and are not a party to any transactions involving leveraged derivatives.
Commodity Derivatives
During the first quarter of 2010, we entered into natural gas purchase agreements with third parties, hedging a portion of the second and third quarter of 2010 purchases of natural gas used in the production processes at certain of our plants. These purchase agreements are marked to market, with the resulting gains or losses recognized in earnings when hedged transactions are recorded. Themark-to-market adjustments at March 31, 2010, were immaterial.
Cash Flow Hedges
To minimize volatility in our margins due to large fluctuations in the price of commodities, in the second quarter of 2009 we entered into swap contracts to manage risks associated with market fluctuations in resin prices. These contracts were designated as cash flow hedges of forecasted commodity purchases. All monthly swap contracts entered into in 2009 have expired. There were no resin swap contracts outstanding as of March 31, 2010.
Interest Rates
At March 31, 2010, we had public debt securities of $1.276 billion outstanding, with fixed interest rates and maturities ranging from 2 to 17 years. Should we decide to redeem these securities prior to their stated maturity, we would incur costs based on the fair value of the securities at that time.
In addition, we have a5-year revolving credit facility of $750 million, against which we borrowed $160 million at March 31, 2010. The fair value of the debt at that date was equal to the outstanding balance.
As a part of our 2007 acquisition of Prairie Packaging Inc. (Prairie), we assumed Prairie’s liability for $5 million borrowed from the Illinois Development Finance Authority (IDFA), which were funded by industrial development revenue bonds issued by the IDFA. The debt matures on December 1, 2010, and bears interest at varying rates (0.40% as of March 31, 2010), not to exceed 12% per annum.
The following table provides information about Pactiv’s financial instruments that are sensitive to interest rate risks.
| | | | | | | | | | | | | | | | | | | | | |
| | | Maturities | | | | |
| (In millions, except percentages) | | 2010 | | | 2011 | | | 2012 | | | Thereafter | | | Total | |
| |
Fixed rate debt | | | | | | | | | | $ | 250 | | | $ | 1,026 | | | $ | 1,276 | |
| Average interest rate | | | | | | | | | | | 5.7 | % | | | 7.7 | % | | | 7.3 | % |
| Fair value | | | | | | | | | | $ | 268 | | | $ | 1,218 | | | $ | 1,486 | |
Floating rate debt | | $ | 135 | | | $ | 160 | | | | | | | | | | | $ | 295 | |
| Average interest rate | | | 0.7 | % | | | 0.7 | % | | | | | | | | | | | 0.7 | % |
| Fair value | | $ | 135 | | | $ | 160 | | | | | | | | | | | $ | 295 | |
Prior to our spin-off from Tenneco Inc., we entered into an interest rate swap to hedge our exposure to interest rate movements. We settled this swap in November 1999, incurring a $43 million loss, which is being recognized as additional interest expense over the average life of the underlying debt.
22
In April 2007, we entered into interest rate swap agreements to hedge the interest rate risk related to $250 million of the debt expected to be issued in connection with the acquisition of Prairie. We entered into these swap agreements to moderate the risk of interest rate changes during the period from the date the agreement to acquire Prairie was signed to the date the notes used to finance the acquisition were issued. The swap agreements were terminated on June 20, 2007, resulting in a gain of $9 million. This gain is being recognized as a reduction of interest expense over the average life of the underlying debt.
| |
| ITEM 4. | Controls and Procedures |
Our disclosure controls and procedures (as defined in Exchange ActRules 13a-15(e) and15d-15(e)) are designed to ensure that information required to be disclosed by us in reports we file or submit under the Securities Exchange Act is recorded, processed, summarized, and reported within the appropriate time periods. We, under the supervision of and with the participation of our management, including our principal executive officer and principal financial officer, have evaluated the effectiveness of our disclosure controls and procedures, and we and such officers have concluded that such controls and procedures were adequate and effective as of March 31, 2010.
There were no changes in internal controls over financial reporting (as defined in Exchange ActRules 13a-15(f) and15d-15(f)) during the quarter ended March 31, 2010, that materially affected, or are reasonably likely to materially affect, our internal controls over financial reporting.
23
PART II — OTHER INFORMATION
ITEM 1. Legal Proceedings
We are party to various legal proceedings arising from our operations. We establish reserves for claims and proceedings when it is probable that liabilities exist and where reasonable estimates of such liabilities can be made. While it is not possible to predict the outcome of any of these matters, based on our assessment of the facts and circumstances now known, we do not believe that any of these matters, individually or in the aggregate, will have a material adverse effect on our financial position. However, actual outcomes may be different from those expected and could have a material effect on our results of operations or cash flows in a particular period.
ITEM 1A. Risk Factors
There has been no material change in the risk factors disclosed in ourForm 10-K for the year ended December 31, 2009.
ITEM 2. Unregistered Sales of Equity Securities and Use of Proceeds
In February 2010, the board of directors approved the repurchase of an additional 10 million shares of our common stock bringing the total number of shares authorized to be repurchased to 10,522,361. We repurchase shares using open market or privately negotiated transactions. Repurchased shares are held in treasury for general corporate purposes. There is no expiration date for the current share repurchase authorization.
We did not repurchase stock in the first quarter of 2010.
ITEM 3-5. None
ITEM 6. Exhibits
Exhibits designated with an asterisk in the following index are furnished or filed herewith; all other exhibits are incorporated by reference.
| | | | | |
| Exhibit No. | | Description |
| |
| | 3 | .1 | | Restated Certificate of Incorporation of the registrant (incorporated herein by reference to Exhibit 3.1 to Pactiv Corporation’s Quarterly Report on Form 10-Q for the quarter ended September 30, 1999, File No. 1-15157). |
| | 3 | .2 | | Amended and Restated By-laws of the registrant (incorporated herein by reference to Exhibit 3.1 to Pactiv Corporation’s Current Report on Form 8-K dated September 4, 2009, File No. 1-15157). |
| | 4 | .1 | | Specimen Stock Certificate of Pactiv Corporation Common Stock (incorporated herein by reference to Exhibit 4.1 to Pactiv Corporation’s Quarterly Report on Form 10-Q for the quarter ended September 30, 1999, File No. 1-15157). |
| | 4 | .2(a) | | Indenture, dated September 29, 1999, by and between the registrant and The Chase Manhattan Bank, as Trustee (incorporated herein by reference to Exhibit 4.1 to Tenneco Packaging Inc.’s Registration Statement on Form S-4, File No. 333-82923). |
| | 4 | .2(b) | | First Supplemental Indenture, dated as of November 4, 1999, to Indenture dated as of September 29, 1999, between the registrant and The Chase Manhattan Bank, as Trustee (incorporated herein by reference to Exhibit 4.3(b) to Pactiv Corporation’s Quarterly Report on Form 10-Q for the quarter ended September 30, 1999, File No. 1-15157). |
| | 4 | .2(c) | | Second Supplemental Indenture, dated as of November 4, 1999, to Indenture dated as of September 29, 1999, between the registrant and The Chase Manhattan Bank, as Trustee (incorporated herein by reference to Exhibit 4.3(c) to Pactiv Corporation’s Quarterly Report on Form 10-Q for the quarter ended September 30, 1999, File No. 1-15157). |
24
| | | | | |
| Exhibit No. | | Description |
| |
| | 4 | .2(d) | | Third Supplemental Indenture, dated as of November 4, 1999, to Indenture dated as of September 29, 1999, between the registrant and The Chase Manhattan Bank, as Trustee (incorporated herein by reference to Exhibit 4.3(d) to Pactiv Corporation’s Quarterly Report on Form 10-Q for the quarter ended September 30, 1999, File No. 1-15157). |
| | 4 | .2(e) | | Fourth Supplemental Indenture, dated as of November 4, 1999, to Indenture dated as of September 29, 1999, between the registrant and The Chase Manhattan Bank, as Trustee (incorporated herein by reference to Exhibit 4.3(e) to Pactiv Corporation’s Quarterly Report on Form 10-Q for the quarter ended September 30, 1999, File No. 1-15157). |
| | 4 | .2(f) | | Fifth Supplemental Indenture, dated as of November 4, 1999, to Indenture dated as of September 29, 1999, between the registrant and The Chase Manhattan Bank, as Trustee (incorporated herein by reference to Exhibit 4.3(f) to Pactiv Corporation’s Quarterly Report on Form 10-Q for the quarter ended September 30, 1999, File No. 1-15157). |
| | 4 | .2(g) | | Sixth Supplemental Indenture dated as of June 25, 2007 to Indenture, dated as of September 29, 1999, between Pactiv Corporation and the Bank of New York Trust Company, N.A., as Trustee (incorporated herein by reference to Exhibit 4.1 to Pactiv Corporation’s Current Report on Form 8-K dated June 25, 2007, File No. 1-15157). |
| | 4 | .2(h) | | Seventh Supplemental Indenture dated as of June 25, 2007 to Indenture, dated as of September 29, 1999, between Pactiv Corporation and the Bank of New York Trust Company, N.A., as Trustee (incorporated herein by reference to Exhibit 4.2 to Pactiv Corporation’s Current Report on Form 8-K dated June 25, 2007, File No. 1-15157). |
| | 4 | .3 | | Registration Rights Agreement, dated as of November 4, 1999, by and between the registrant and the trustees under the Pactiv Corporation Rabbi Trust (incorporated herein by reference to Exhibit 4.4 to Pactiv Corporation’s Quarterly Report on Form 10-Q for the quarter ended September 30, 1999, File No. 1-15157). |
| | 10 | .1 | | Pactiv Corporation (formerly known as Tenneco Packaging Inc.) Executive Incentive Compensation Plan (incorporated herein by reference to Exhibit 10.5 to Pactiv Corporation’s Quarterly Report on Form 10-Q for the quarter ended September 30, 1999, File No. 1-15157). |
| | 10 | .2 | | Pactiv Corporation (formerly known as Tenneco Packaging Inc.) Supplemental Executive Retirement Plan (incorporated herein by reference to Exhibit 10.6 to Pactiv Corporation’s Quarterly Report on Form 10-Q for the quarter ended September 30, 1999, File No. 1-15157). |
| | 10 | .3 | | Amended and Restated Change in Control Severance Benefit Plan for Key Executives (incorporated herein by reference to Exhibit 10.6 to Pactiv Corporation’s Current Report on Form 8-K dated September 4, 2009, File No. 1-15157). |
| | 10 | .4 | | Pactiv Corporation (formerly known as Tenneco Packaging Inc.) Deferred Compensation Plan (incorporated herein by reference to Exhibit 10.8 to Pactiv Corporation’s Quarterly Report on Form 10-Q for the quarter ended September 30, 1999, File No. 1-15157). |
| | 10 | .5 | | Pactiv Corporation Rabbi Trust (incorporated herein by reference to Exhibit 10.11 to Pactiv Corporation’s Quarterly Report on Form 10-Q for the quarter ended September 30, 1999, File No. 1-15157). |
| | 10 | .6 | | Pactiv Corporation 2002 Incentive Compensation Plan (incorporated herein by reference to Exhibit 4.7 to Pactiv Corporation’s Registration Statement on Form S-8 dated November 8, 2002, File No. 333-101121). |
| | 10 | .7 | | Credit Agreement, dated as of April 19, 2006, among the registrant, Bank of America, N.A., as Administrative Agent, JP Morgan Chase Bank, N.A., as Syndication Agent and L/C Issuer, BNP Paribas, SunTrust Bank, and Citibank, N.A., as Co-Documentation Agents, and the other financial institutions party thereto (incorporated herein by reference to Exhibit 10.15 to Pactiv Corporation’s Quarterly Report on Form 10-Q for the quarter ended March 31, 2006, File No. 1-15157). |
| | 10 | .8 | | Pactiv Corporation Deferred Retirement Savings Plan (incorporated herein by reference to Exhibit 10.16 to Pactiv Corporation’s Annual Report on Form 10-K for the year ended December 31, 2004, File No. 1-15157). |
25
| | | | | |
| Exhibit No. | | Description |
| |
| | 10 | .9 | | Receivables Purchase Agreement, dated as of December 21, 2006, among the registrant and Atlantic Asset Securitization LLC and Calyon New York Branch, as agent for Purchasers (incorporated herein by reference to Exhibit 10.22 to Pactiv Corporation’s Annual Report onForm 10-K for the year ended December 31, 2006, File No. 1-15157). |
| | 10 | .10 | | Continuing Agreement for Standby Letters of Credit between Pactiv Corporation and JPMorgan Chase Bank, N.A. dated June 5, 2007 (incorporated herein by reference to Exhibit 10.20 to Pactiv Corporation’s Quarterly Report on Form 10-Q for the quarter ended June 30, 2007, FileNo. 1-15157). |
| | 10 | .11 | | Credit Agreement between Pactiv Corporation and JPMorgan Chase Bank, N.A. dated June 5, 2007 (incorporated herein by reference to Exhibit 10.21 to Pactiv Corporation’s Quarterly Report on Form 10-Q for the quarter ended June 30, 2007, File No. 1-15157). |
| | 11 | | | None. |
| | 15 | | | None. |
| | 18 | | | None. |
| | 19 | | | None. |
| | 22 | | | None. |
| | 23 | | | None. |
| | 24 | | | None. |
| | *31 | .1 | | Rule 13a-14(a)/15d-14(a) Certification. |
| | *31 | .2 | | Rule 13a-14(a)/15d-14(a) Certification. |
| | **32 | .1 | | Section 1350 Certification. |
| | **32 | .2 | | Section 1350 Certification. |
| | |
| * | | Filed herewith |
| |
| ** | | Furnished herewith |
26
SIGNATURES
Pursuant to the requirements of the Securities Exchange Act of 1934, the registrant has duly caused this report to be signed on its behalf by the undersigned thereunto duly authorized.
PACTIV CORPORATION
| | |
| | By: | /s/ EDWARD T. WALTERS |
Edward T. Walters
Senior Vice President and Chief Financial Officer
(Principal Financial Officer)
Date: May 7, 2010
27
SIGNATURES
Pursuant to the requirements of the Securities Exchange Act of 1934, the registrant has duly caused this report to be signed on its behalf by the undersigned thereunto duly authorized.
PACTIV CORPORATION
Donald E. King
Corporate Controller and Chief Accounting Officer
(Principal Accounting Officer)
Date: May 7, 2010
28