August 4, 2020 Q2 2020 Earnings Presentation Exhibit 99.2
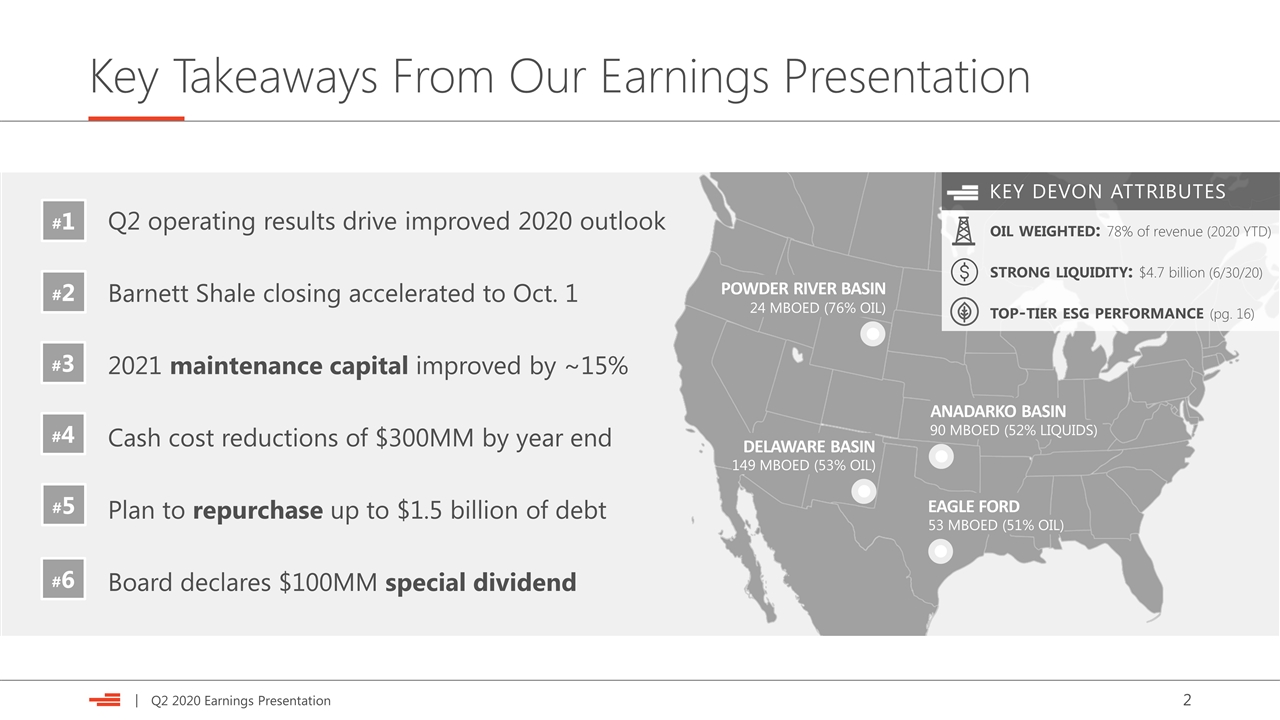
Key Takeaways From Our Earnings Presentation Q2 operating results drive improved 2020 outlook Barnett Shale closing accelerated to Oct. 1 2021 maintenance capital improved by ~15% Cash cost reductions of $300MM by year end Plan to repurchase up to $1.5 billion of debt Board declares $100MM special dividend POWDER RIVER BASIN ANADARKO BASIN EAGLE FORD DELAWARE BASIN 24 MBOED (76% OIL) 149 MBOED (53% OIL) 90 MBOED (52% LIQUIDS) 53 MBOED (51% OIL) KEY DEVON ATTRIBUTES oil weighted: 78% of revenue (2020 YTD) strong liquidity: $4.7 billion (6/30/20) top-tier esg performance (pg. 16) #1 #2 #3 #4 #5 #6
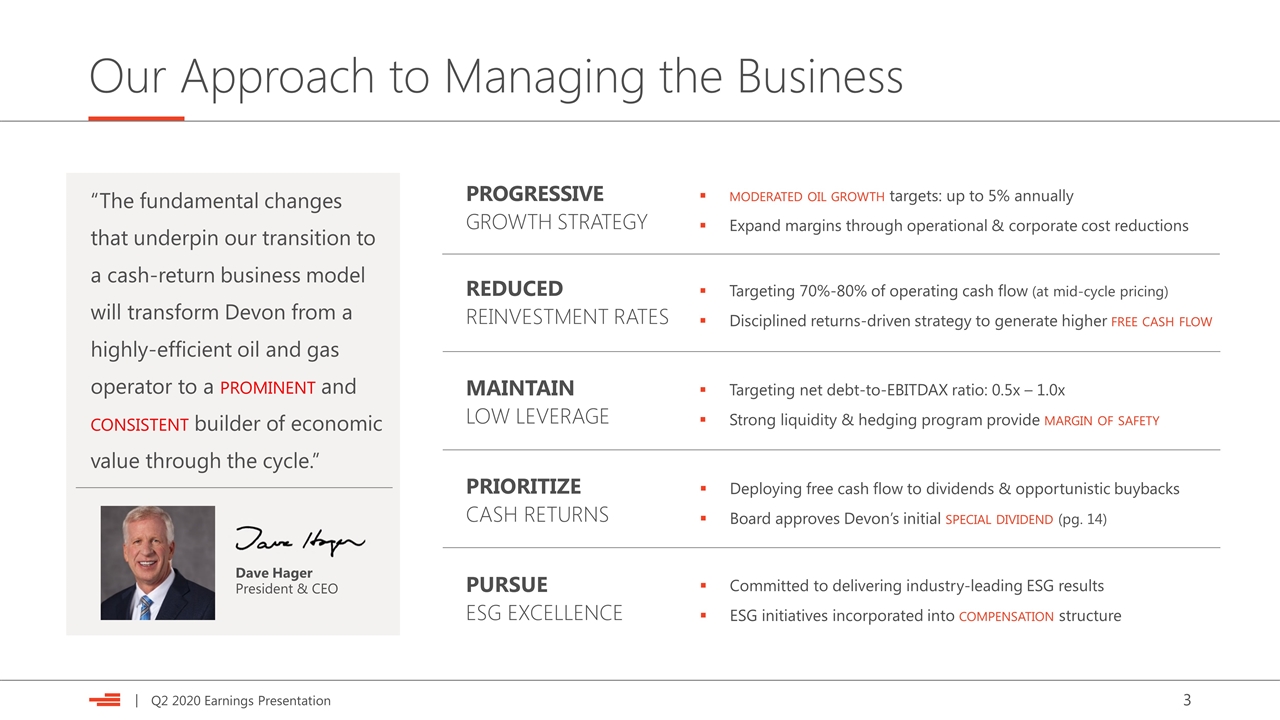
Our Approach to Managing the Business PROGRESSIVE GROWTH STRATEGY moderated oil growth targets: up to 5% annually Expand margins through operational & corporate cost reductions REDUCED REINVESTMENT RATES Targeting 70%-80% of operating cash flow (at mid-cycle pricing) Disciplined returns-driven strategy to generate higher free cash flow MAINTAIN LOW LEVERAGE Targeting net debt-to-EBITDAX ratio: 0.5x – 1.0x Strong liquidity & hedging program provide margin of safety PRIORITIZE CASH RETURNS Deploying free cash flow to dividends & opportunistic buybacks Board approves Devon’s initial special dividend (pg. 14) PURSUE ESG EXCELLENCE Committed to delivering industry-leading ESG results ESG initiatives incorporated into compensation structure “The fundamental changes that underpin our transition to a cash-return business model will transform Devon from a highly-efficient oil and gas operator to a prominent and consistent builder of economic value through the cycle.” Dave Hager President & CEO
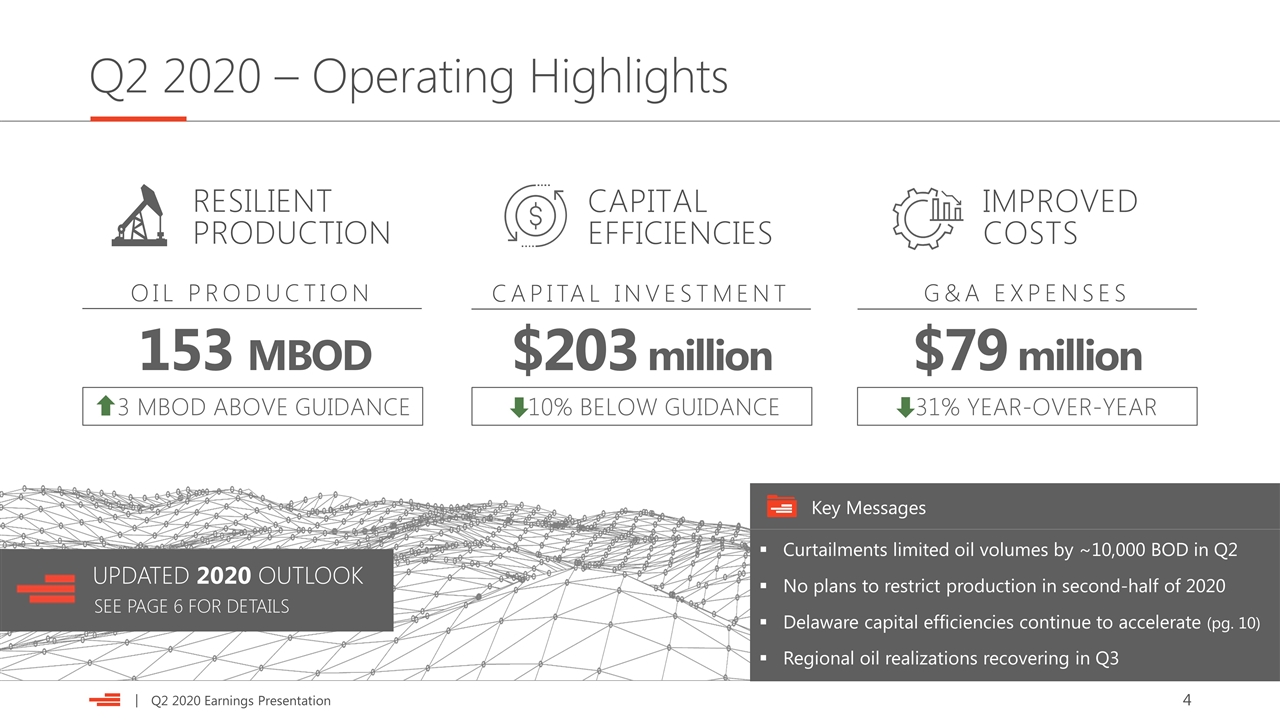
Q2 2020 – Operating Highlights Curtailments limited oil volumes by ~10,000 BOD in Q2 No plans to restrict production in second-half of 2020 Delaware capital efficiencies continue to accelerate (pg. 10) Regional oil realizations recovering in Q3 Key Messages UPDATED 2020 OUTLOOK SEE PAGE 6 FOR DETAILS G&A EXPENSES CAPITAL INVESTMENT OIL PRODUCTION $203 million RESILIENT PRODUCTION $79 million CAPITAL EFFICIENCIES IMPROVED COSTS 3 MBOD ABOVE GUIDANCE 10% BELOW GUIDANCE 31% YEAR-OVER-YEAR 153 MBOD
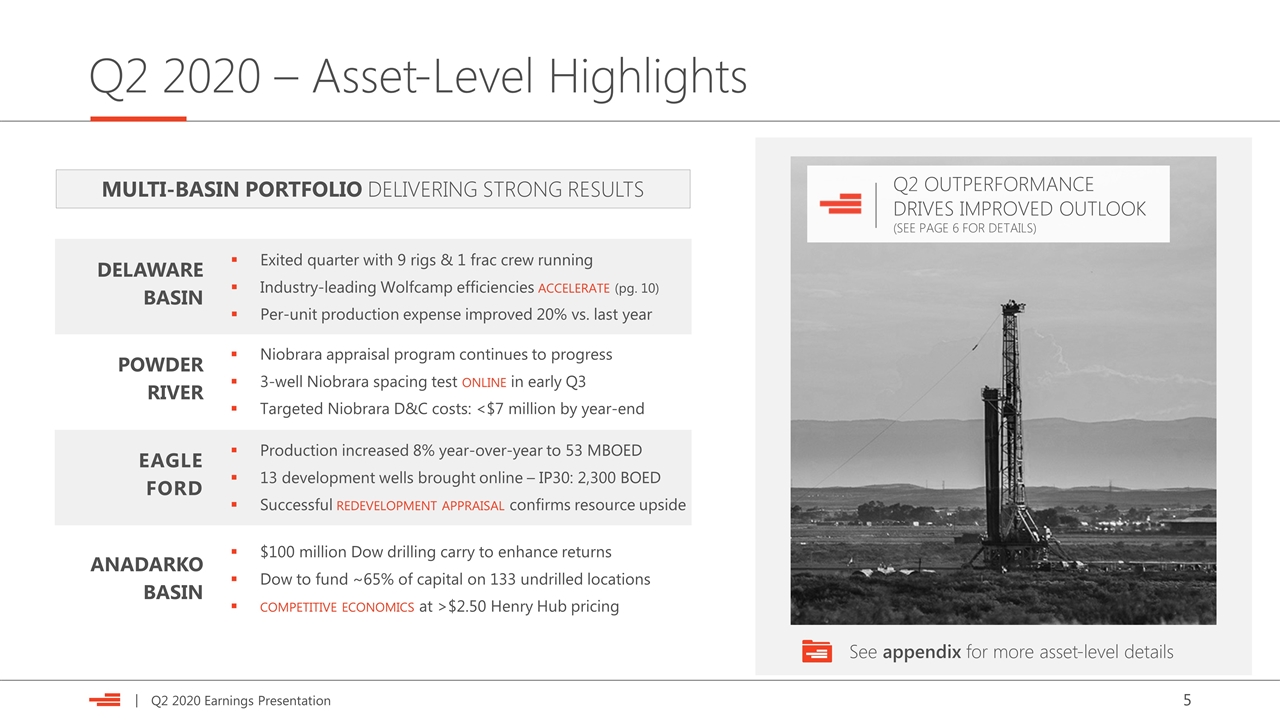
Q2 2020 – Asset-Level Highlights Exited quarter with 9 rigs & 1 frac crew running Industry-leading Wolfcamp efficiencies accelerate (pg. 10) Per-unit production expense improved 20% vs. last year POWDER RIVER EAGLE FORD ANADARKO BASIN MULTI-BASIN PORTFOLIO DELIVERING STRONG RESULTS DELAWARE BASIN Niobrara appraisal program continues to progress 3-well Niobrara spacing test online in early Q3 Targeted Niobrara D&C costs: <$7 million by year-end Production increased 8% year-over-year to 53 MBOED 13 development wells brought online – IP30: 2,300 BOED Successful redevelopment appraisal confirms resource upside $100 million Dow drilling carry to enhance returns Dow to fund ~65% of capital on 133 undrilled locations competitive economics at >$2.50 Henry Hub pricing Q2 OUTPERFORMANCE DRIVES IMPROVED OUTLOOK (SEE PAGE 6 FOR DETAILS) See appendix for more asset-level details
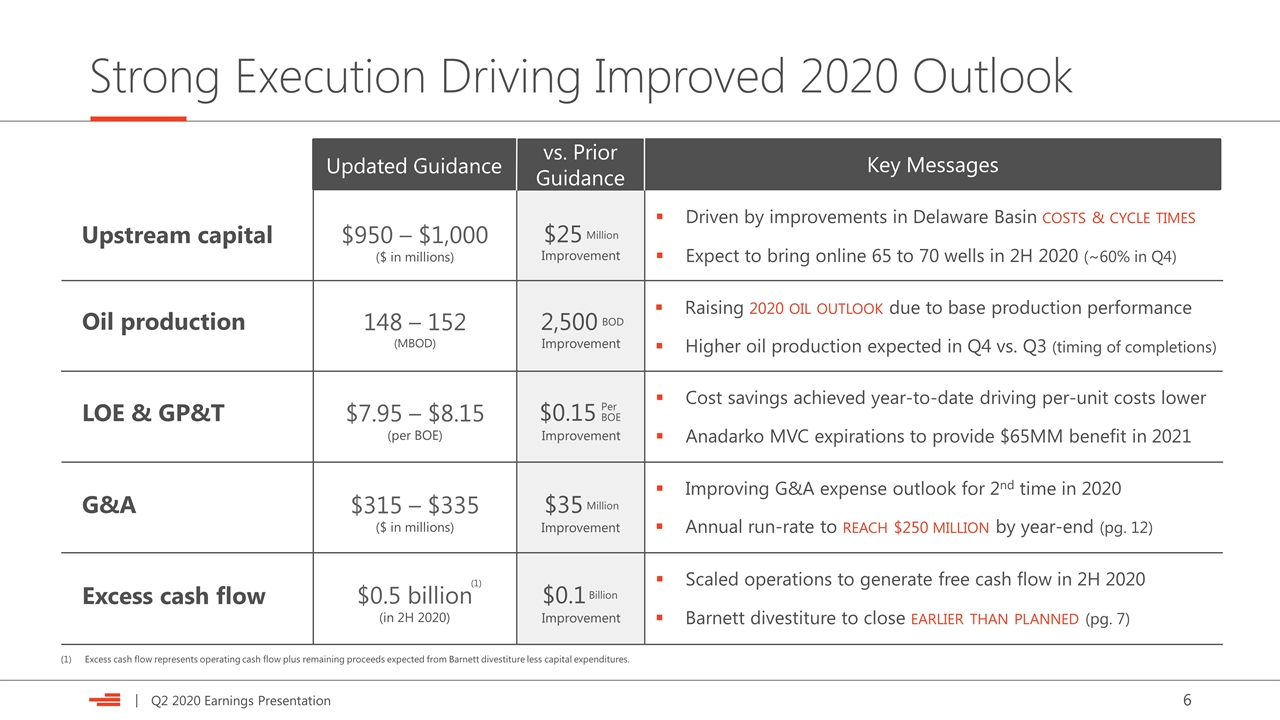
Strong Execution Driving Improved 2020 Outlook Raising 2020 oil outlook due to base production performance Anadarko MVC expirations to provide $65MM benefit in 2021 Improving G&A expense outlook for 2nd time in 2020 Cost savings achieved year-to-date driving per-unit costs lower Higher oil production expected in Q4 vs. Q3 (timing of completions) Expect to bring online 65 to 70 wells in 2H 2020 (~60% in Q4) Driven by improvements in Delaware Basin costs & cycle times Scaled operations to generate free cash flow in 2H 2020 Barnett divestiture to close earlier than planned (pg. 7) Updated Guidance vs. Prior Guidance Key Messages Annual run-rate to reach $250 million by year-end (pg. 12) Excess cash flow represents operating cash flow plus remaining proceeds expected from Barnett divestiture less capital expenditures. Oil production LOE & GP&T G&A Upstream capital Excess cash flow $950 – $1,000 ($ in millions) 148 – 152 (MBOD) $7.95 – $8.15 (per BOE) $315 – $335 ($ in millions) Improvement $0.15 Million $25 Per BOE Improvement Improvement Million $35 2,500 BOD Improvement Improvement $0.1 Billion (1) $0.5 billion (in 2H 2020)
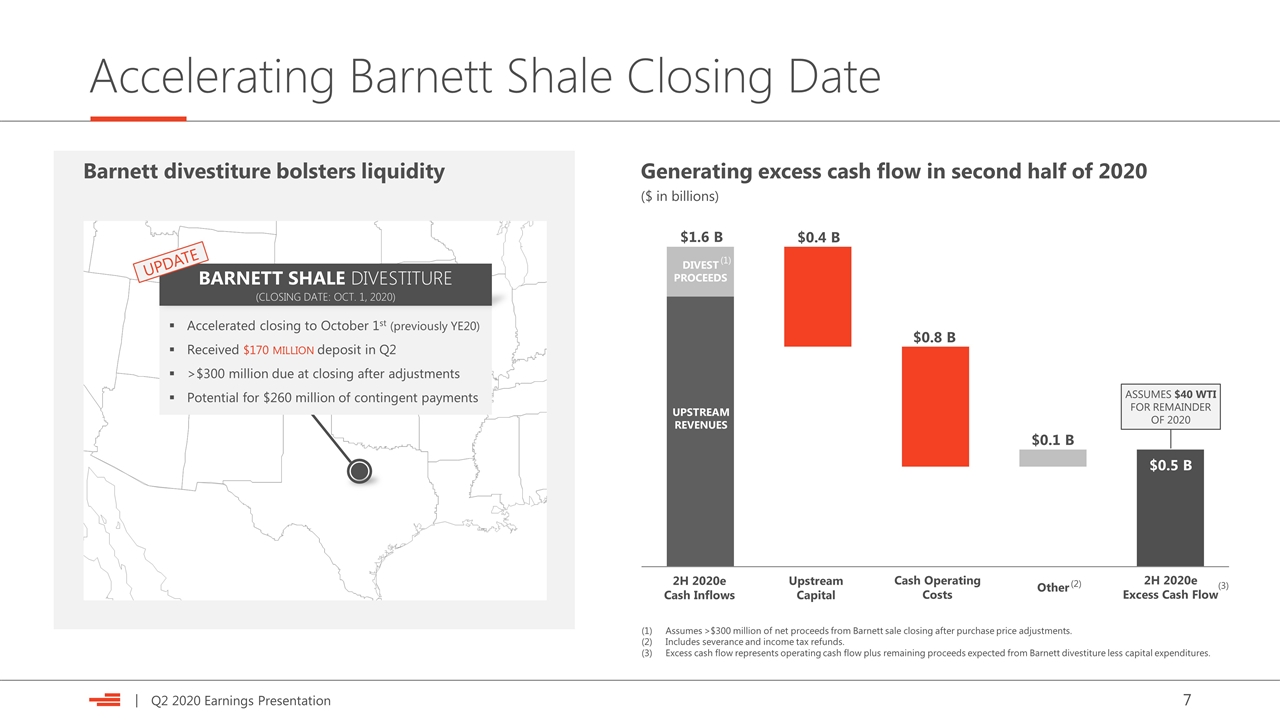
Accelerating Barnett Shale Closing Date Generating excess cash flow in second half of 2020 ($ in billions) $1.6 B $0.8 B $0.4 B $0.5 B Assumes >$300 million of net proceeds from Barnett sale closing after purchase price adjustments. Includes severance and income tax refunds. Excess cash flow represents operating cash flow plus remaining proceeds expected from Barnett divestiture less capital expenditures. DIVEST PROCEEDS UPSTREAM REVENUES 2H 2020e Cash Inflows Upstream Capital Cash Operating Costs 2H 2020e Excess Cash Flow (1) ASSUMES $40 WTI FOR REMAINDER OF 2020 $0.1 B Other (2) Accelerated closing to October 1st (previously YE20) Received $170 million deposit in Q2 >$300 million due at closing after adjustments Potential for $260 million of contingent payments BARNETT SHALE DIVESTITURE (Closing date: Oct. 1, 2020) UPDATE Barnett divestiture bolsters liquidity (3)
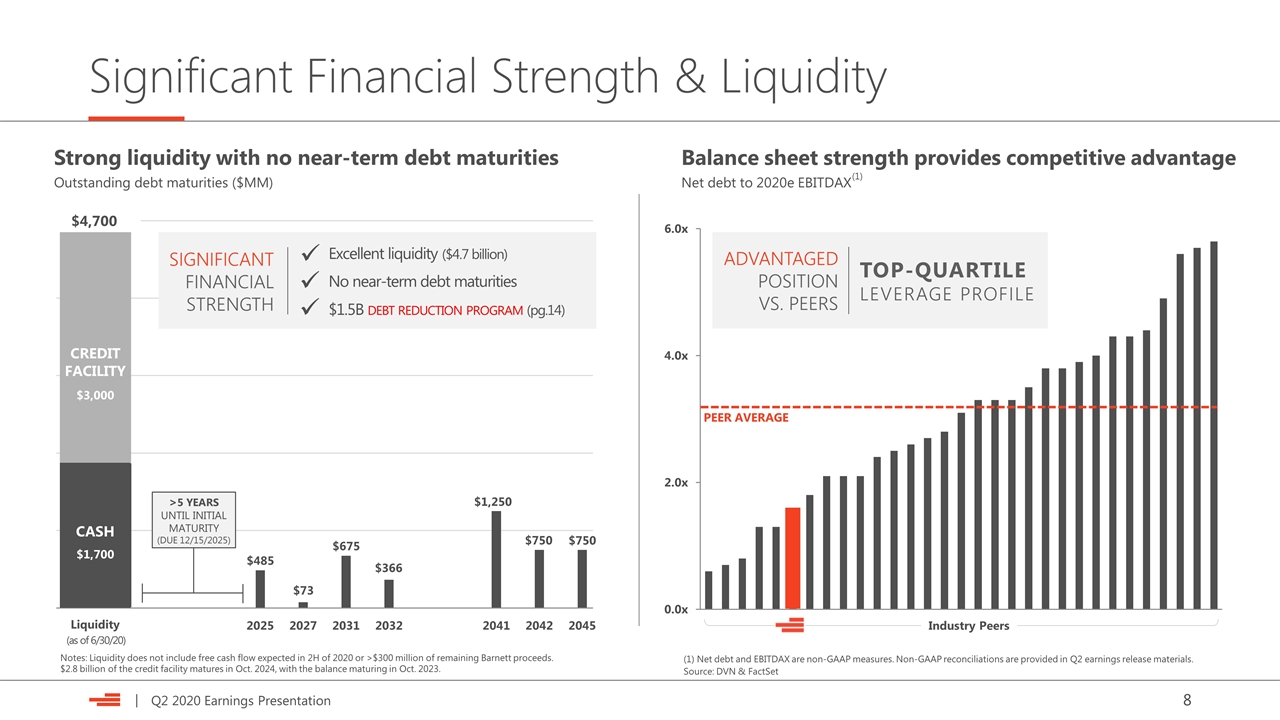
Significant Financial Strength & Liquidity $73 Strong liquidity with no near-term debt maturities Outstanding debt maturities ($MM) $4,700 Liquidity CREDIT FACILITY $3,000 $1,700 CASH $485 >5 YEARS UNTIL INITIAL MATURITY (DUE 12/15/2025) (as of 6/30/20) PEER AVERAGE Source: DVN & FactSet Balance sheet strength provides competitive advantage Net debt to 2020e EBITDAX Industry Peers TOP-QUARTILE LEVERAGE PROFILE ADVANTAGED POSITION VS. PEERS (1) Net debt and EBITDAX are non-GAAP measures. Non-GAAP reconciliations are provided in Q2 earnings release materials. Excellent liquidity ($4.7 billion) No near-term debt maturities $1.5B debt reduction program (pg.14) ü ü ü SIGNIFICANT FINANCIAL STRENGTH (1) Notes: Liquidity does not include free cash flow expected in 2H of 2020 or >$300 million of remaining Barnett proceeds. $2.8 billion of the credit facility matures in Oct. 2024, with the balance maturing in Oct. 2023.
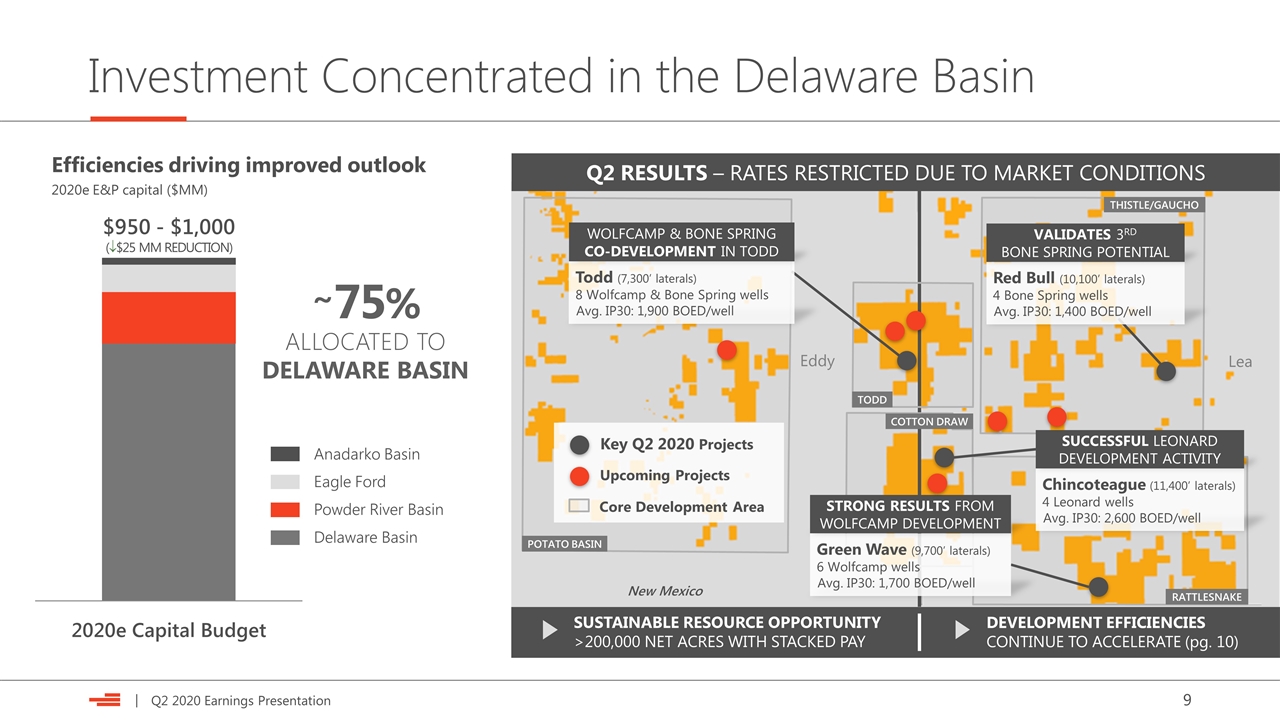
Investment Concentrated in the Delaware Basin Eddy New Mexico Lea POTATO BASIN THISTLE/GAUCHO RATTLESNAKE COTTON DRAW TODD Q2 RESULTS – RATES RESTRICTED DUE TO MARKET CONDITIONS SUSTAINABLE RESOURCE OPPORTUNITY >200,000 NET ACRES WITH STACKED PAY DEVELOPMENT EFFICIENCIES CONTINUE TO ACCELERATE (pg. 10) Todd (7,300’ laterals) 8 Wolfcamp & Bone Spring wells Avg. IP30: 1,900 BOED/well WOLFCAMP & bone SPRING CO-DEVELOPMENT IN TODD Red Bull (10,100’ laterals) 4 Bone Spring wells Avg. IP30: 1,400 BOED/well VALIDATES 3RD Bone Spring POTENTIAL Chincoteague (11,400’ laterals) 4 Leonard wells Avg. IP30: 2,600 BOED/well successful Leonard development activity Green Wave (9,700’ laterals) 6 Wolfcamp wells Avg. IP30: 1,700 BOED/well STRONG RESULTS FROM WOLFCAMP DEVELOPMENT Core Development Area Key Q2 2020 Projects Upcoming Projects ALLOCATED TO DELAWARE BASIN 75% Powder River Basin Delaware Basin Eagle Ford Anadarko Basin ~ Efficiencies driving improved outlook 2020e E&P capital ($MM) $950 - $1,000 (¯$25 MM REDUCTION)
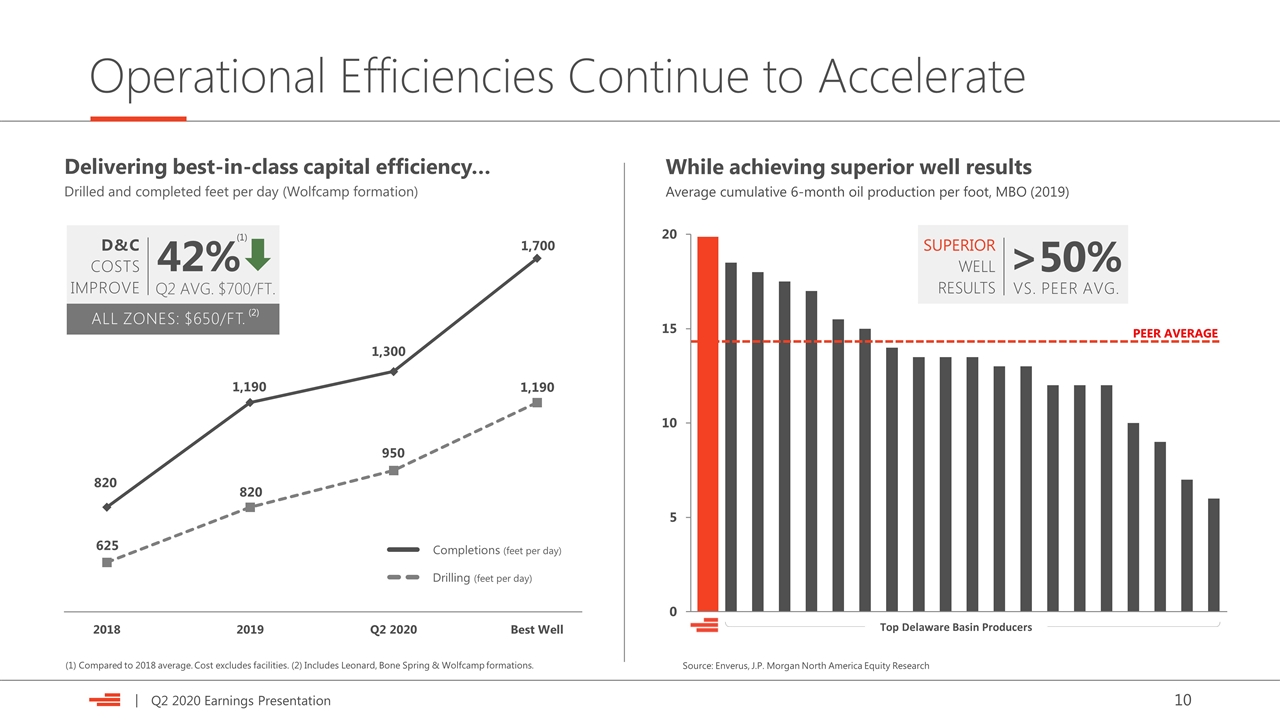
Operational Efficiencies Continue to Accelerate Delivering best-in-class capital efficiency… Drilled and completed feet per day (Wolfcamp formation) 1,190 950 625 820 PEER AVERAGE Source: Enverus, J.P. Morgan North America Equity Research While achieving superior well results Average cumulative 6-month oil production per foot, MBO (2019) Top Delaware Basin Producers Top Delaware Basin Producers SUPERIOR WELL RESULTS >50% VS. PEER AVG. 820 (1) Compared to 2018 average. Cost excludes facilities. (2) Includes Leonard, Bone Spring & Wolfcamp formations. 1,190 1,300 1,700 Drilling (feet per day) Completions (feet per day) D&C COSTS IMPROVE 42% Q2 AVG. $700/FT. (1) ALL ZONES: $650/FT. (2)
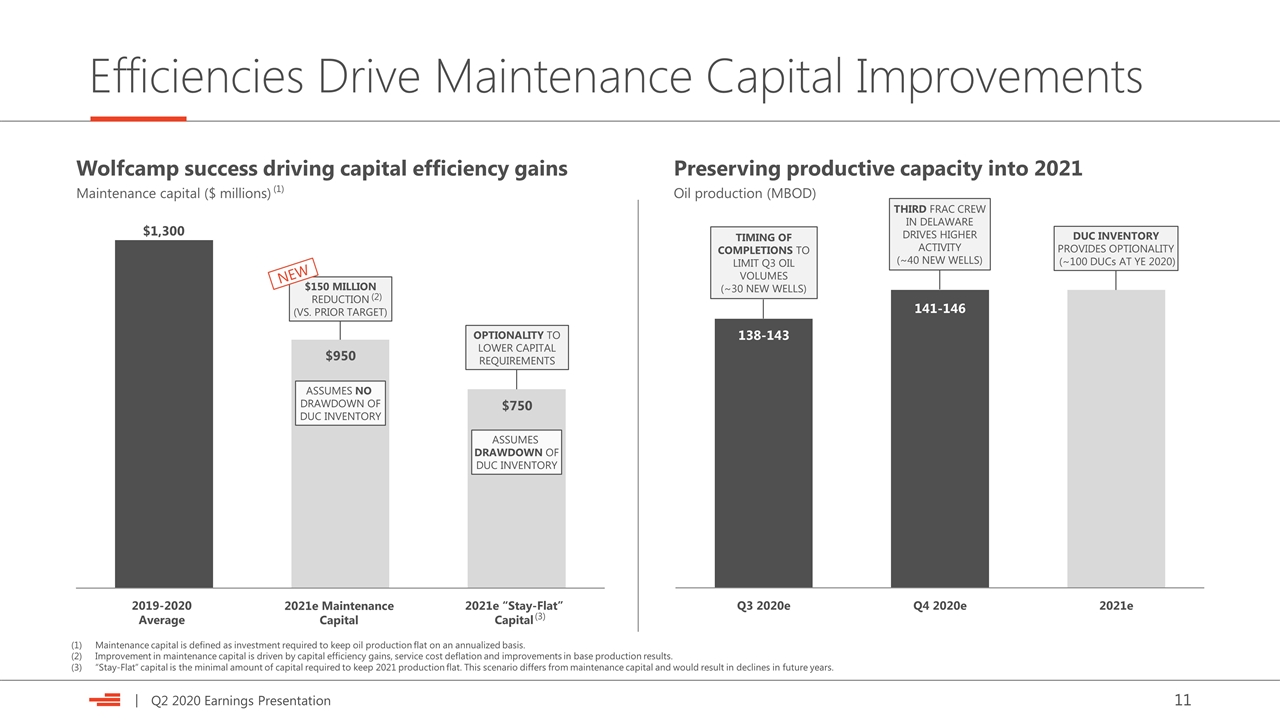
Efficiencies Drive Maintenance Capital Improvements Preserving productive capacity into 2021 Oil production (MBOD) Wolfcamp success driving capital efficiency gains Maintenance capital ($ millions) $1,300 2021e “Stay-Flat” Capital $950 $150 MILLION REDUCTION (VS. PRIOR TARGET) NEW 138-143 DUC INVENTORY PROVIDES OPTIONALITY (~100 DUCs AT YE 2020) 141-146 THIRD FRAC CREW IN DELAWARE DRIVES HIGHER ACTIVITY (~40 NEW WELLS) TIMING OF COMPLETIONS TO LIMIT Q3 OIL VOLUMES (~30 NEW WELLS) $750 OPTIONALITY TO LOWER CAPITAL REQUIREMENTS ASSUMES NO DRAWDOWN OF DUC INVENTORY ASSUMES DRAWDOWN OF DUC INVENTORY 2019-2020 Average 2021e Maintenance Capital Maintenance capital is defined as investment required to keep oil production flat on an annualized basis. Improvement in maintenance capital is driven by capital efficiency gains, service cost deflation and improvements in base production results. “Stay-Flat” capital is the minimal amount of capital required to keep 2021 production flat. This scenario differs from maintenance capital and would result in declines in future years. (3) (2) (1)
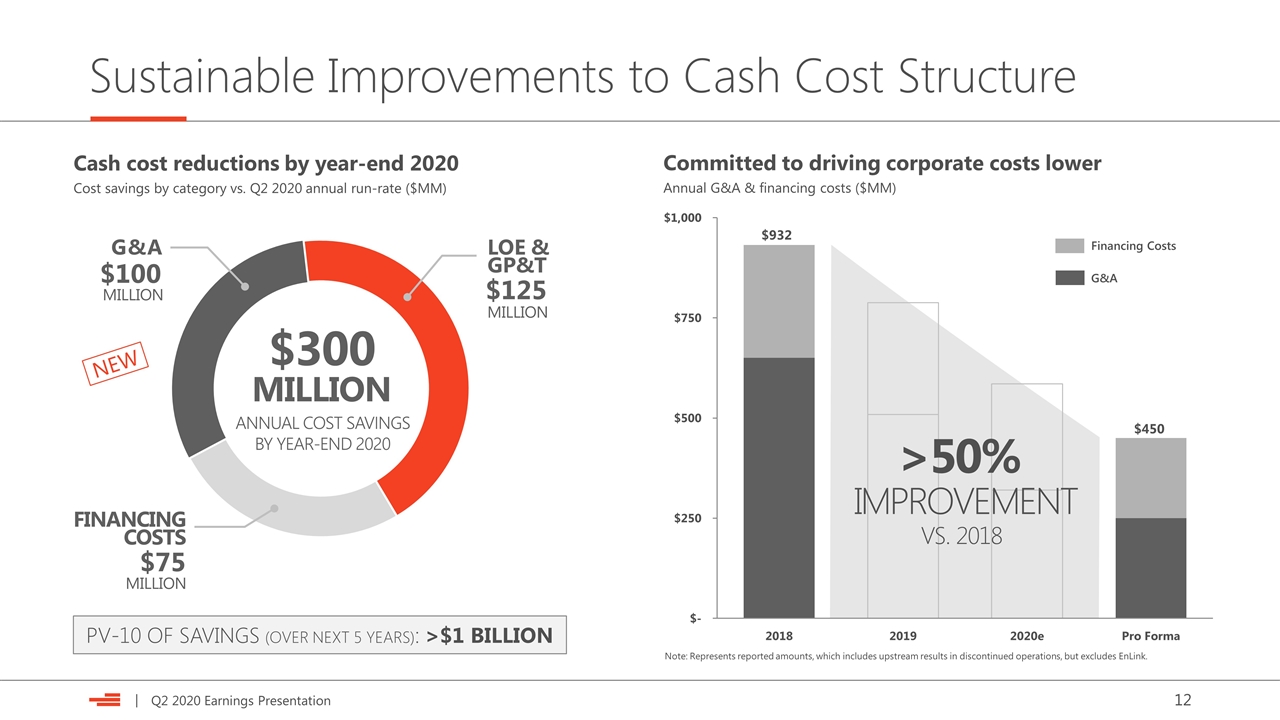
Sustainable Improvements to Cash Cost Structure Note: Represents reported amounts, which includes upstream results in discontinued operations, but excludes EnLink. Cash cost reductions by year-end 2020 Cost savings by category vs. Q2 2020 annual run-rate ($MM) $300 ANNUAL COST SAVINGS BY YEAR-END 2020 $100 G&A FINANCING COSTS LOE & GP&T MILLION MILLION $125 MILLION $75 MILLION PV-10 OF SAVINGS (OVER NEXT 5 YEARS): >$1 BILLION Committed to driving corporate costs lower Annual G&A & financing costs ($MM) $932 Financing Costs G&A $450 VS. 2018 IMPROVEMENT >50% NEW
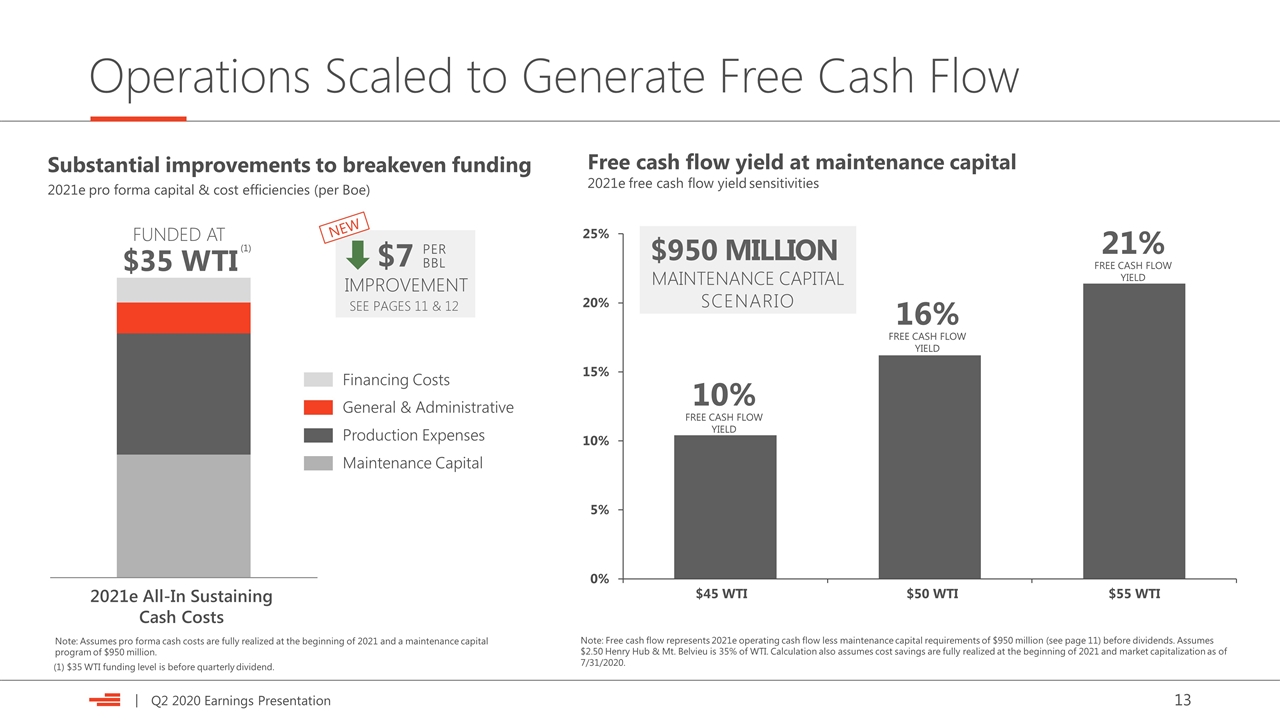
Operations Scaled to Generate Free Cash Flow Substantial improvements to breakeven funding 2021e pro forma capital & cost efficiencies (per Boe) Note: Free cash flow represents 2021e operating cash flow less maintenance capital requirements of $950 million (see page 11) before dividends. Assumes $2.50 Henry Hub & Mt. Belvieu is 35% of WTI. Calculation also assumes cost savings are fully realized at the beginning of 2021 and market capitalization as of 7/31/2020. $45 WTI $50 WTI Free cash flow yield at maintenance capital 2021e free cash flow yield sensitivities $55 WTI 10% FREE CASH FLOW YIELD 16% FREE CASH FLOW YIELD 21% FREE CASH FLOW YIELD MAINTENANCE CAPITAL SCENARIO $950 MILLION Production Expenses Maintenance Capital General & Administrative Financing Costs 2021e All-In Sustaining Cash Costs Note: Assumes pro forma cash costs are fully realized at the beginning of 2021 and a maintenance capital program of $950 million. (1) $35 WTI funding level is before quarterly dividend. $35 WTI FUNDED AT (1) $7 SEE PAGES 11 & 12 IMPROVEMENT PER BBL NEW
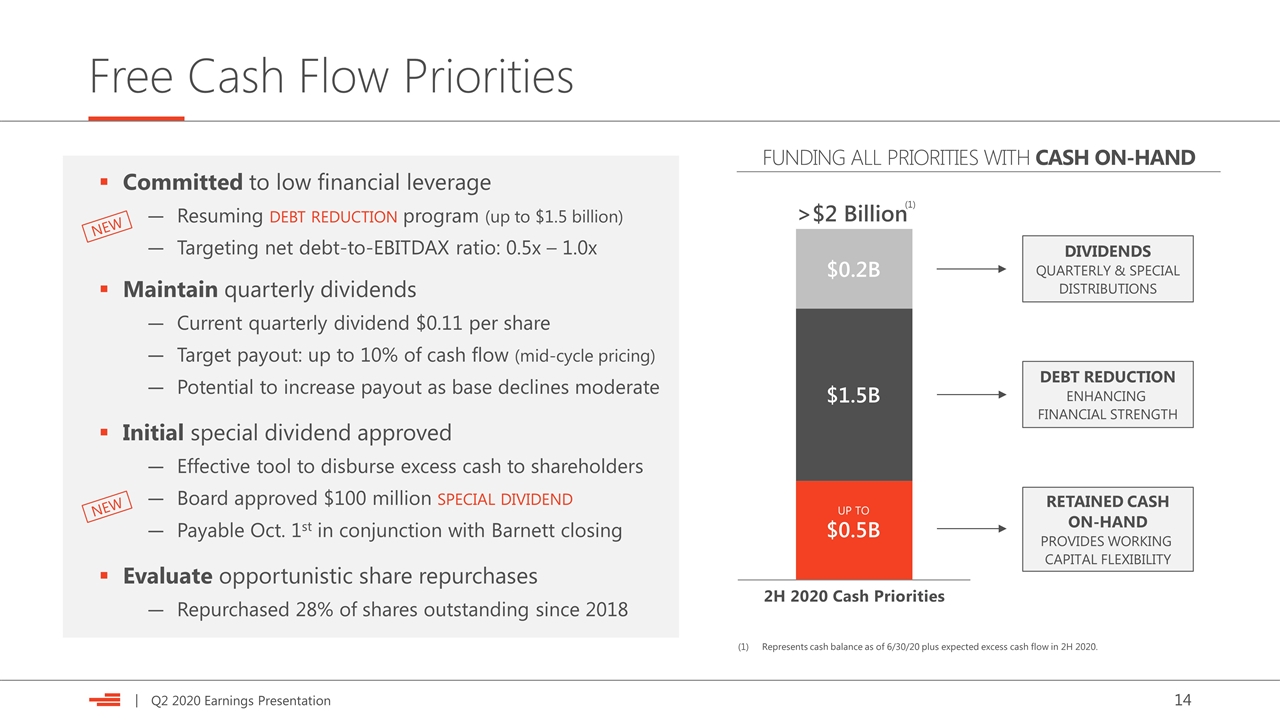
Free Cash Flow Priorities Committed to low financial leverage Resuming debt reduction program (up to $1.5 billion) Targeting net debt-to-EBITDAX ratio: 0.5x – 1.0x Maintain quarterly dividends Current quarterly dividend $0.11 per share Target payout: up to 10% of cash flow (mid-cycle pricing) Potential to increase payout as base declines moderate Initial special dividend approved Effective tool to disburse excess cash to shareholders Board approved $100 million special dividend Payable Oct. 1st in conjunction with Barnett closing Evaluate opportunistic share repurchases Repurchased 28% of shares outstanding since 2018 NEW NEW >$2 Billion $0.2B $1.5B $0.5B DIVIDENDS QUARTERLY & SPECIAL DISTRIBUTIONS Represents cash balance as of 6/30/20 plus expected excess cash flow in 2H 2020. (1) UP TO DEBT REDUCTION ENHANCING FINANCIAL STRENGTH RETAINED CASH ON-HAND PROVIDES WORKING CAPITAL FLEXIBILITY FUNDING ALL PRIORITIES WITH CASH ON-HAND 2H 2020 Cash Priorities
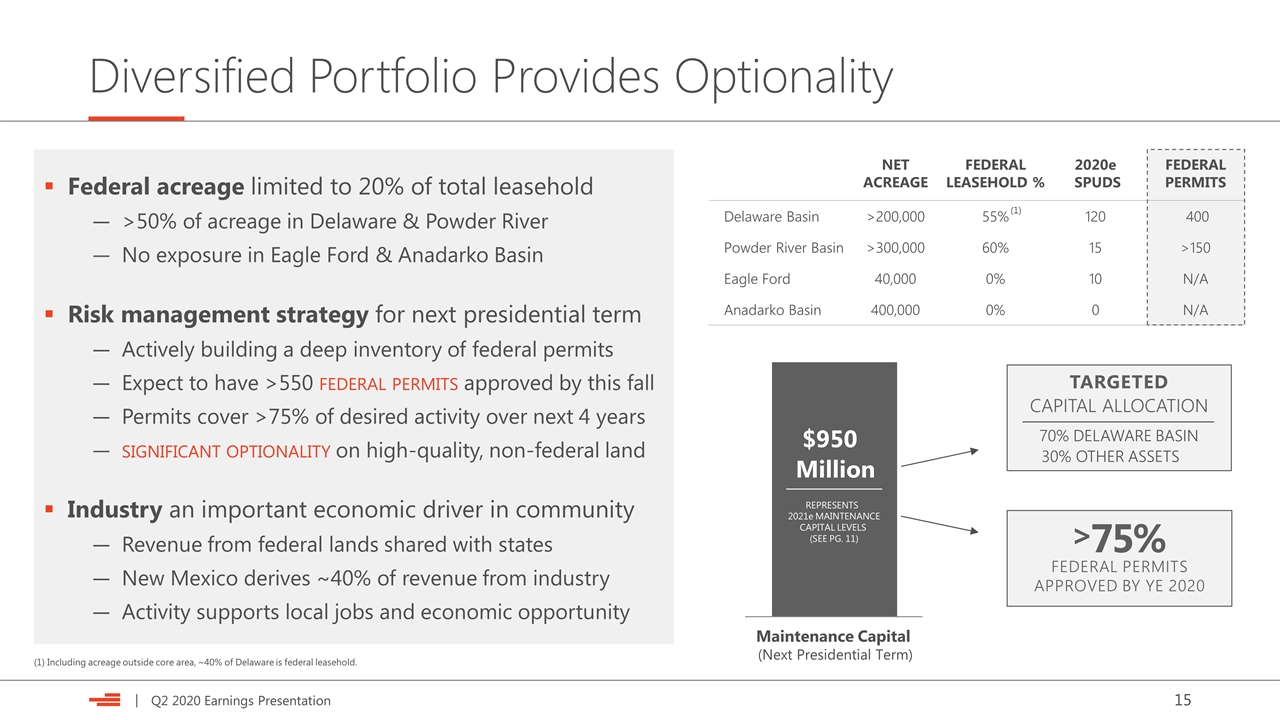
Diversified Portfolio Provides Optionality Federal acreage limited to 20% of total leasehold >50% of acreage in Delaware & Powder River No exposure in Eagle Ford & Anadarko Basin Risk management strategy for next presidential term Actively building a deep inventory of federal permits Expect to have >550 federal permits approved by this fall Permits cover >75% of desired activity over next 4 years significant optionality on high-quality, non-federal land Industry an important economic driver in community Revenue from federal lands shared with states New Mexico derives ~40% of revenue from industry Activity supports local jobs and economic opportunity NET ACREAGE FEDERAL LEASEHOLD % 2020e SPUDS FEDERAL PERMITS Delaware Basin >200,000 55% 120 400 Powder River Basin >300,000 60% 15 >150 Eagle Ford 40,000 0% 10 N/A Anadarko Basin 400,000 0% 0 N/A TARGETED Capital ALLOCATION 70% DELAWARE BASIN 30% OTHER ASSETS $950 Million Maintenance Capital (Next Presidential Term) REPRESENTS 2021e MAINTENANCE CAPITAL LEVELS (SEE PG. 11) 75% FEDERAL PERMITS APPROVED BY YE 2020 > (1) Including acreage outside core area, ~40% of Delaware is federal leasehold. (1)
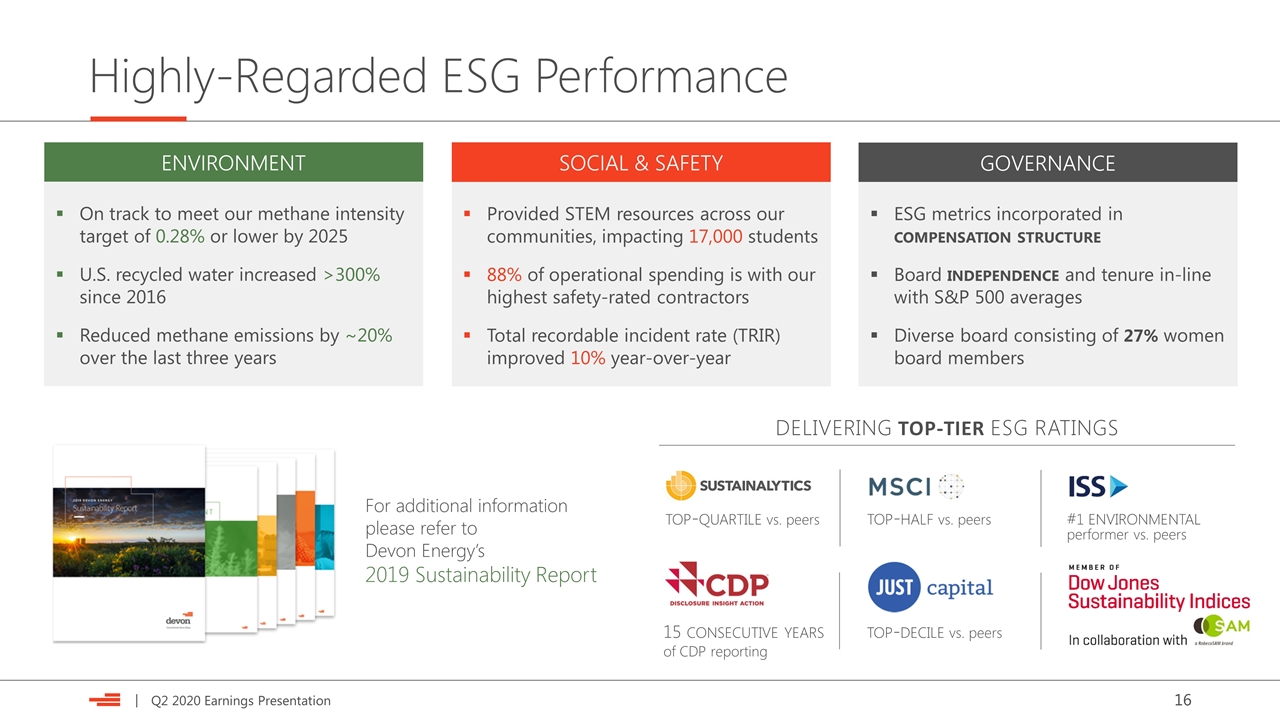
Highly-Regarded ESG Performance top-quartile vs. peers top-half vs. peers 15 consecutive years of CDP reporting top-decile vs. peers ENVIRONMENT SOCIAL & SAFETY GOVERNANCE On track to meet our methane intensity target of 0.28% or lower by 2025 U.S. recycled water increased >300% since 2016 Reduced methane emissions by ~20% over the last three years Provided STEM resources across our communities, impacting 17,000 students 88% of operational spending is with our highest safety-rated contractors Total recordable incident rate (TRIR) improved 10% year-over-year ESG metrics incorporated in compensation structure Board independence and tenure in-line with S&P 500 averages Diverse board consisting of 27% women board members For additional information please refer to Devon Energy’s 2019 Sustainability Report #1 environmental DELIVERING TOP-TIER ESG RATINGS performer vs. peers
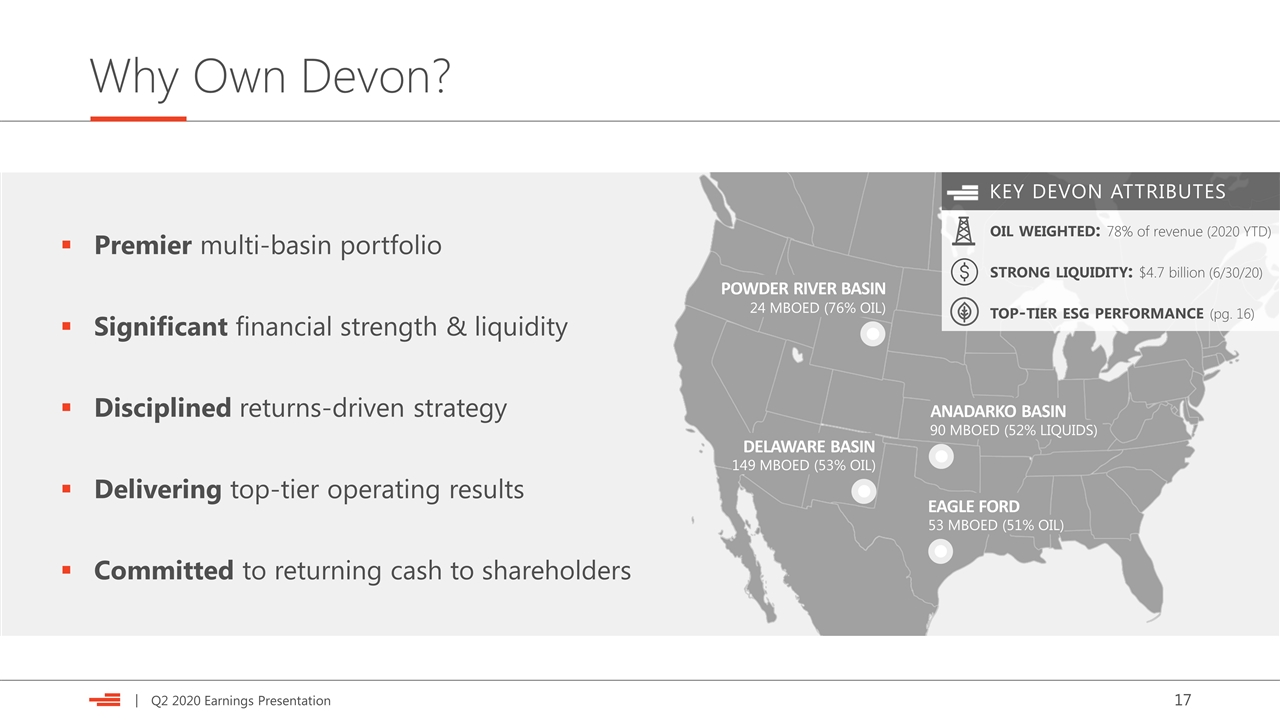
Why Own Devon? Premier multi-basin portfolio Significant financial strength & liquidity Disciplined returns-driven strategy Delivering top-tier operating results Committed to returning cash to shareholders POWDER RIVER BASIN ANADARKO BASIN EAGLE FORD DELAWARE BASIN 24 MBOED (76% OIL) 149 MBOED (53% OIL) 90 MBOED (52% LIQUIDS) 53 MBOED (51% OIL) KEY DEVON ATTRIBUTES oil weighted: 78% of revenue (2020 YTD) strong liquidity: $4.7 billion (6/30/20) top-tier esg performance (pg. 16)
Appendix
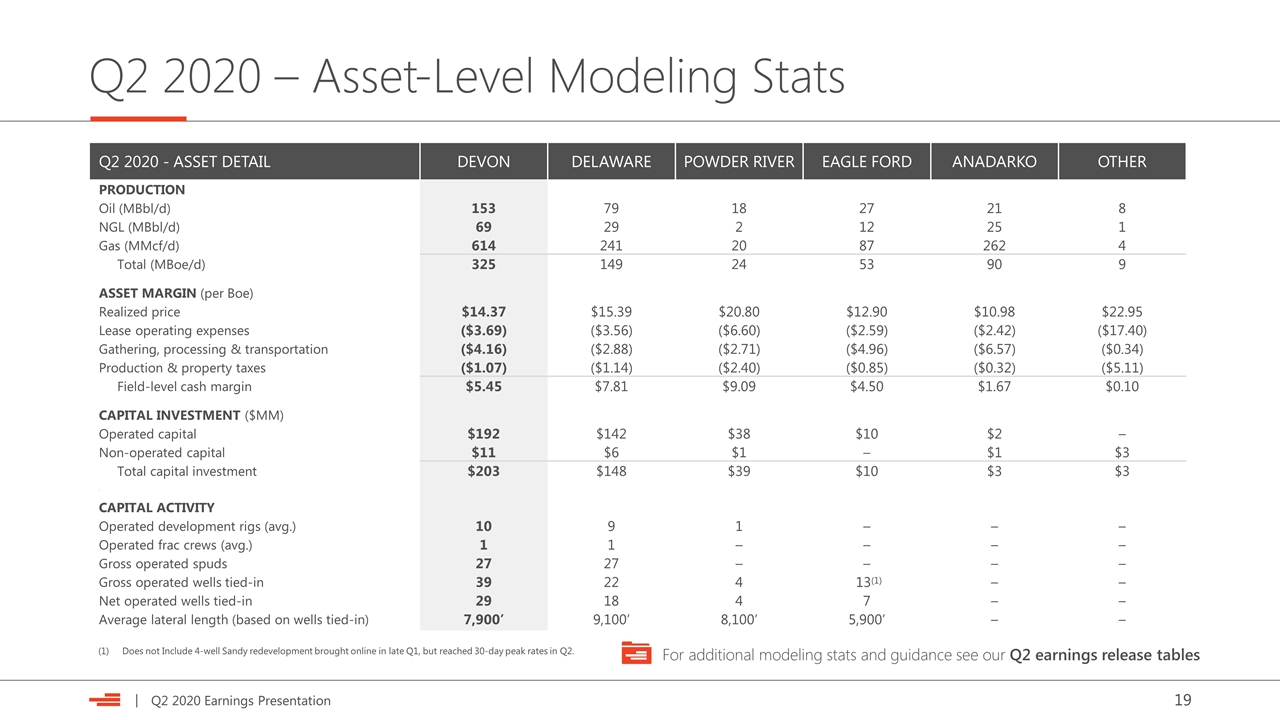
Q2 2020 - ASSET DETAIL DEVON DELAWARE POWDER RIVER EAGLE FORD ANADARKO OTHER PRODUCTION Oil (MBbl/d) 153 79 18 27 21 8 NGL (MBbl/d) 69 29 2 12 25 1 Gas (MMcf/d) 614 241 20 87 262 4 Total (MBoe/d) 325 149 24 53 90 9 ASSET MARGIN (per Boe) Realized price $14.37 $15.39 $20.80 $12.90 $10.98 $22.95 Lease operating expenses ($3.69) ($3.56) ($6.60) ($2.59) ($2.42) ($17.40) Gathering, processing & transportation ($4.16) ($2.88) ($2.71) ($4.96) ($6.57) ($0.34) Production & property taxes ($1.07) ($1.14) ($2.40) ($0.85) ($0.32) ($5.11) Field-level cash margin $5.45 $7.81 $9.09 $4.50 $1.67 $0.10 CAPITAL INVESTMENT ($MM) Operated capital $192 $142 $38 $10 $2 – Non-operated capital $11 $6 $1 – $1 $3 Total capital investment $203 $148 $39 $10 $3 $3 . CAPITAL ACTIVITY Operated development rigs (avg.) 10 9 1 – – – Operated frac crews (avg.) 1 1 – – – – Gross operated spuds 27 27 – – – – Gross operated wells tied-in 39 22 4 13(1) – – Net operated wells tied-in 29 18 4 7 – – Average lateral length (based on wells tied-in) 7,900’ 9,100’ 8,100’ 5,900’ – – Q2 2020 – Asset-Level Modeling Stats For additional modeling stats and guidance see our Q2 earnings release tables Does not Include 4-well Sandy redevelopment brought online in late Q1, but reached 30-day peak rates in Q2.
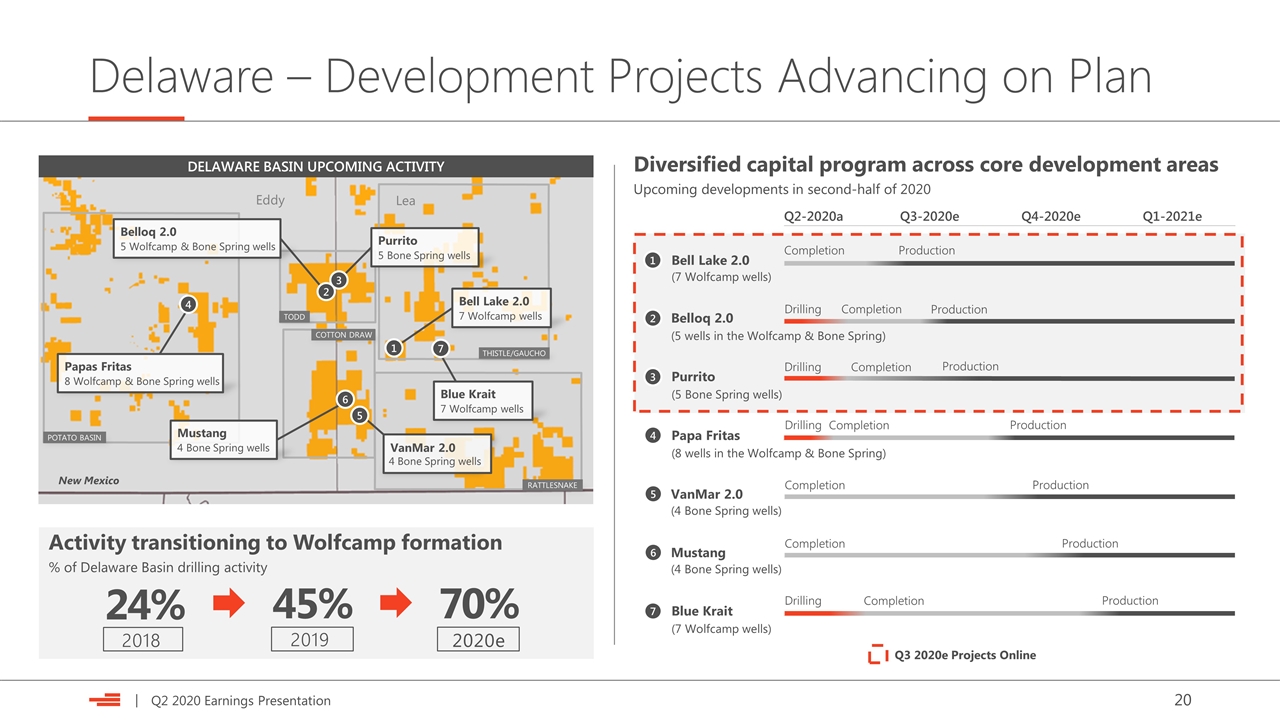
Delaware – Development Projects Advancing on Plan POTATO BASIN TODD COTTON DRAW THISTLE/GAUCHO RATTLESNAKE Eddy Lea New Mexico DELAWARE BASIN UPCOMING ACTIVITY Activity transitioning to Wolfcamp formation % of Delaware Basin drilling activity 24% 45% 70% 2018 2019 2020e VanMar 2.0 4 Bone Spring wells Blue Krait 7 Wolfcamp wells Bell Lake 2.0 7 Wolfcamp wells Purrito 5 Bone Spring wells Belloq 2.0 5 Wolfcamp & Bone Spring wells Papas Fritas 8 Wolfcamp & Bone Spring wells Mustang 4 Bone Spring wells Q2-2020a Q3-2020e Q4-2020e Q1-2021e Drilling Purrito (5 Bone Spring wells) Completion Drilling Belloq 2.0 (5 wells in the Wolfcamp & Bone Spring) Completion Papa Fritas (8 wells in the Wolfcamp & Bone Spring) Drilling Completion Completion Bell Lake 2.0 (7 Wolfcamp wells) Production Production VanMar 2.0 (4 Bone Spring wells) Completion Production Mustang (4 Bone Spring wells) Completion Production Q3 2020e Projects Online Blue Krait (7 Wolfcamp wells) Drilling Completion Production Production Production Diversified capital program across core development areas Upcoming developments in second-half of 2020 1 2 3 4 5 6 1 2 3 4 5 6 7 7
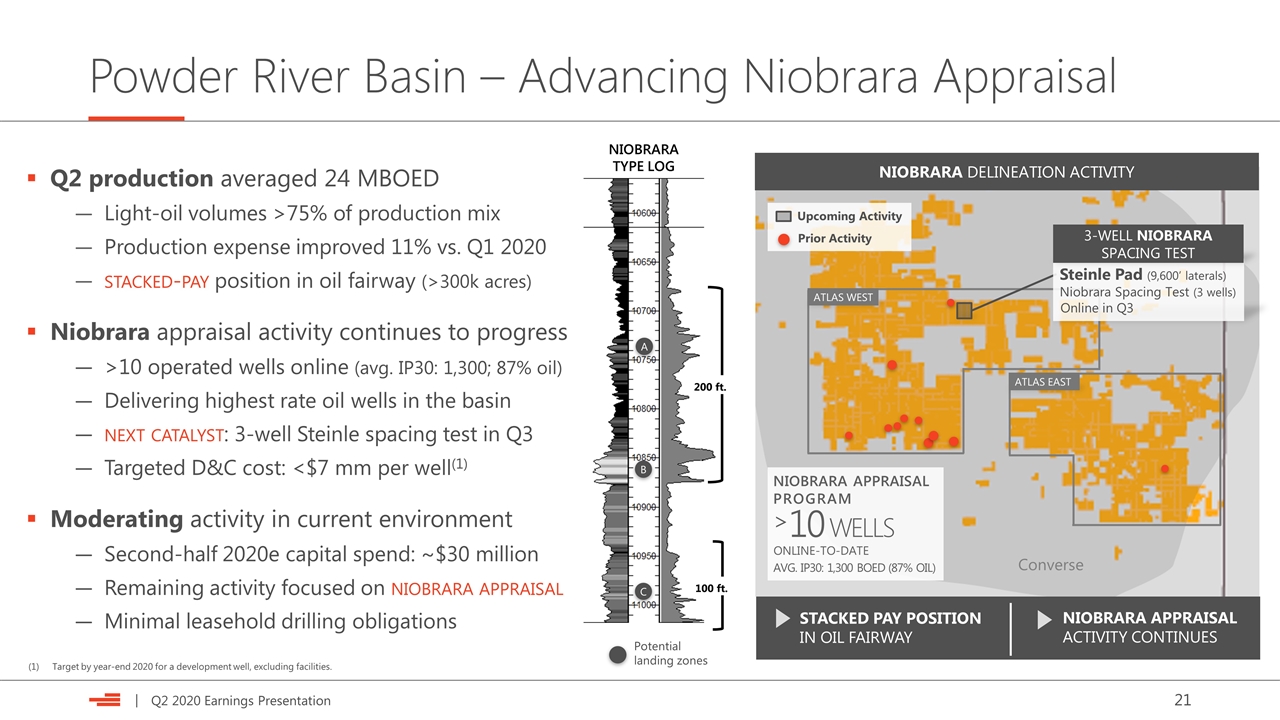
Powder River Basin – Advancing Niobrara Appraisal NIOBRARATYPE LOG 200 ft. Potential landing zones C B A 100 ft. Q2 production averaged 24 MBOED Light-oil volumes >75% of production mix Production expense improved 11% vs. Q1 2020 stacked-pay position in oil fairway (>300k acres) Niobrara appraisal activity continues to progress >10 operated wells online (avg. IP30: 1,300; 87% oil) Delivering highest rate oil wells in the basin next catalyst: 3-well Steinle spacing test in Q3 Targeted D&C cost: <$7 mm per well(1) Moderating activity in current environment Second-half 2020e capital spend: ~$30 million Remaining activity focused on niobrara appraisal Minimal leasehold drilling obligations Target by year-end 2020 for a development well, excluding facilities. NIOBRARA APPRAISAL ACTIVITY CONTINUES STACKED PAY POSITION IN OIL FAIRWAY Converse ATLAS WEST ATLAS EAST Steinle Pad (9,600’ laterals) Niobrara Spacing Test (3 wells) Online in Q3 3-WELL NIOBRARA SPACING TEST NIOBRARA DELINEATION ACTIVITY NIOBRARA APPRAISAL PROGRAM 10 WELLS AVG. IP30: 1,300 BOED (87% OIL) ONLINE-TO-DATE > Upcoming Activity Prior Activity
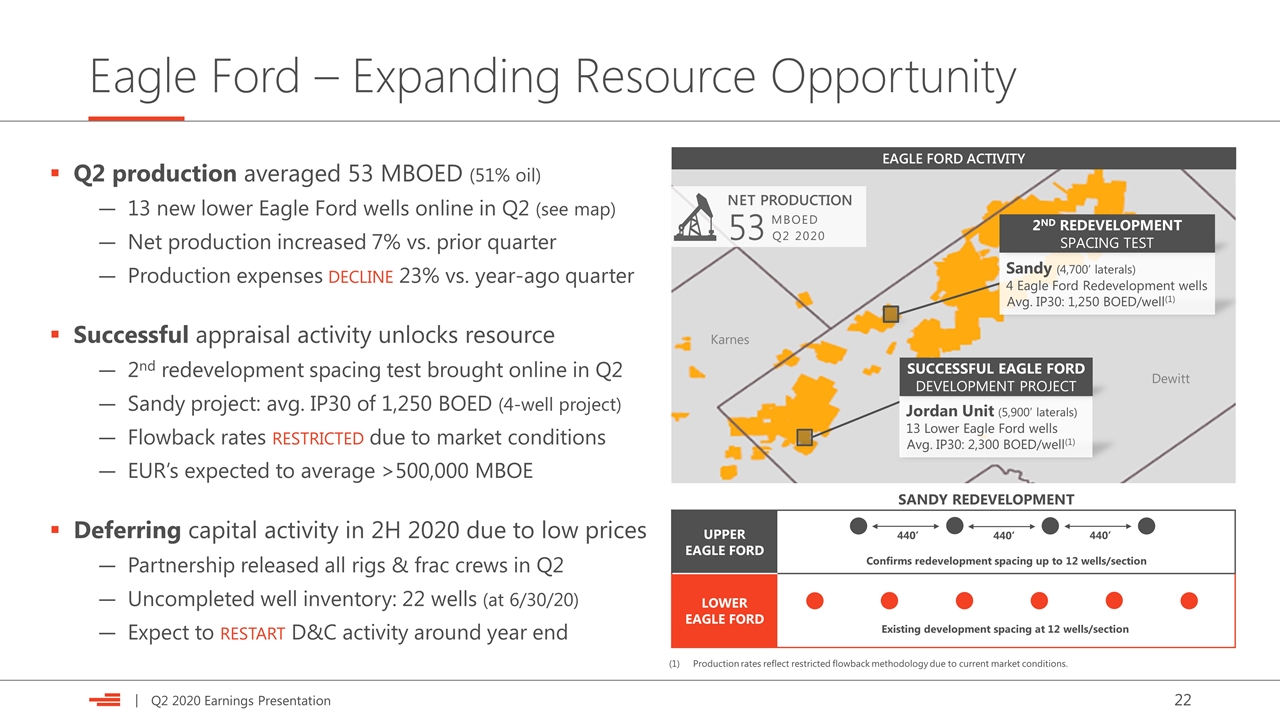
Eagle Ford – Expanding Resource Opportunity Q2 production averaged 53 MBOED (51% oil) 13 new lower Eagle Ford wells online in Q2 (see map) Net production increased 7% vs. prior quarter Production expenses decline 23% vs. year-ago quarter Successful appraisal activity unlocks resource 2nd redevelopment spacing test brought online in Q2 Sandy project: avg. IP30 of 1,250 BOED (4-well project) Flowback rates restricted due to market conditions EUR’s expected to average >500,000 MBOE Deferring capital activity in 2H 2020 due to low prices Partnership released all rigs & frac crews in Q2 Uncompleted well inventory: 22 wells (at 6/30/20) Expect to restart D&C activity around year end EAGLE FORD ACTIVITY Dewitt Karnes UPPER EAGLE FORD LOWER EAGLE FORD 440’ Confirms redevelopment spacing up to 12 wells/section Existing development spacing at 12 wells/section Sandy (4,700’ laterals) 4 Eagle Ford Redevelopment wells Avg. IP30: 1,250 BOED/well(1) 440’ 440’ 2nd redevelopment spacing tesT Jordan Unit (5,900’ laterals) 13 Lower Eagle Ford wells Avg. IP30: 2,300 BOED/well(1) SUCCESSFUL Eagle FORD DEVELOPMENT project Production rates reflect restricted flowback methodology due to current market conditions. NET PRODUCTION 53 MBOED Q2 2020 SANDY REDEVELOPMENT
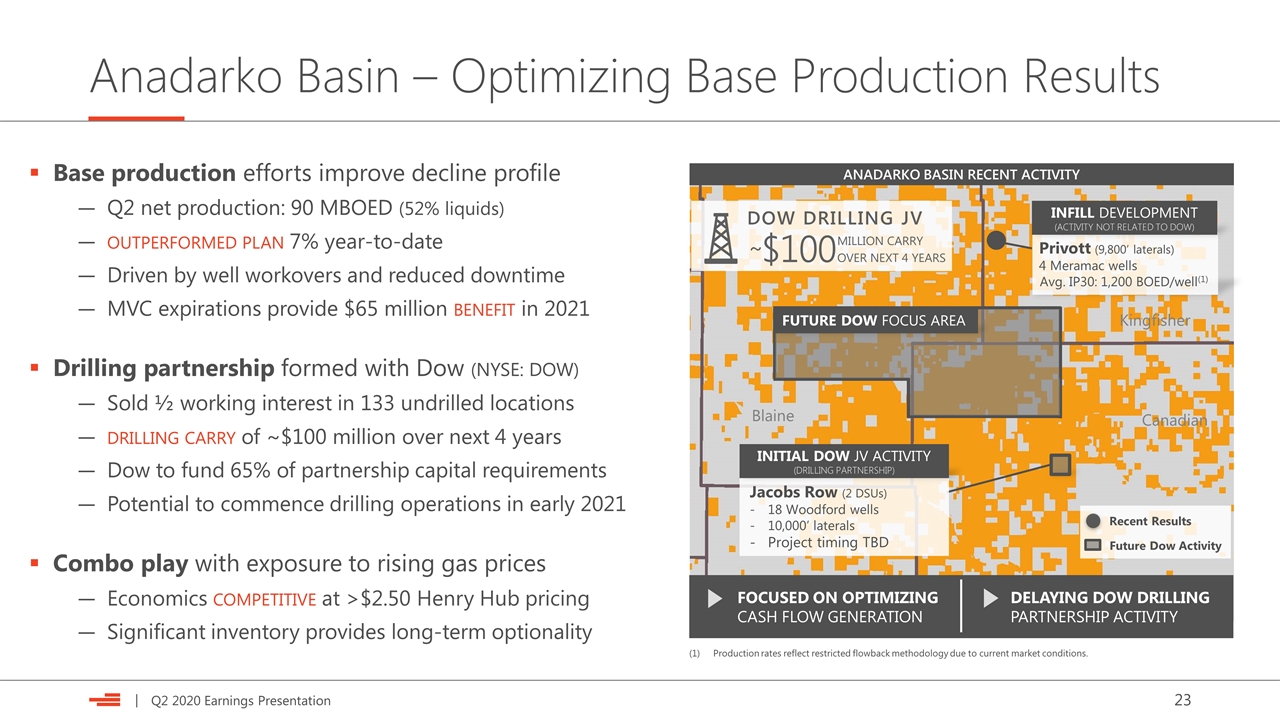
Anadarko Basin – Optimizing Base Production Results Base production efforts improve decline profile Q2 net production: 90 MBOED (52% liquids) outperformed plan 7% year-to-date Driven by well workovers and reduced downtime MVC expirations provide $65 million benefit in 2021 Drilling partnership formed with Dow (NYSE: DOW) Sold ½ working interest in 133 undrilled locations drilling carry of ~$100 million over next 4 years Dow to fund 65% of partnership capital requirements Potential to commence drilling operations in early 2021 Combo play with exposure to rising gas prices Economics competitive at >$2.50 Henry Hub pricing Significant inventory provides long-term optionality ANADARKO BASIN RECENT ACTIVITY Blaine Canadian Kingfisher Future Dow Activity DELAYING DOW DRILLING PARTNERSHIP ACTIVITY FUTURE DOW FOCUS AREA Jacobs Row (2 DSUs) 18 Woodford wells 10,000’ laterals Project timing TBD Recent Results Privott (9,800’ laterals) 4 Meramac wells Avg. IP30: 1,200 BOED/well(1) INFILL DEVELOPMENT (ACTIVITY NOT RELATED TO DOW) INITIAL DOW JV ACTIVITY (DRILLING partnership) FOCUSED ON OPTIMIZING CASH FLOW GENERATION Production rates reflect restricted flowback methodology due to current market conditions. DOW DRILLING JV ~ MILLION CARRY OVER NEXT 4 YEARS $100
Investor Contacts & Notices Investor Relations Contacts Scott CoodyChris Carr VP, Investor RelationsManager, Investor Relations 405-552-4735405-228-2496 Email: investor.relations@dvn.com Forward-Looking Statements This presentation includes “forward-looking statements” as defined by the SEC. Such statements include those concerning strategic plans, our expectations and objectives for future operations, as well as other future events or conditions, and are often identified by use of the words and phrases such as “expects,” “believes,” “will,” “would,” “could,” “continue,” “may,” “aims,” “likely to be,” “intends,” “forecasts,” “projections,” “estimates,” “plans,” “expectations,” “targets,” “opportunities,” “potential,” “anticipates,” “outlook” and other similar terminology. All statements, other than statements of historical facts, included in this presentation that address activities, events or developments that Devon expects, believes or anticipates will or may occur in the future are forward-looking statements. Such statements are subject to a number of assumptions, risks and uncertainties, many of which are beyond our control. Consequently, actual future results could differ materially from our expectations due to a number of factors, including, but not limited to those, identified below. The COVID-19 pandemic and its related repercussions have created significant volatility, uncertainty and turmoil in the global economy and our industry. This turmoil has included an unprecedented supply-and-demand imbalance for oil and other commodities, resulting in a swift and material decline in commodity prices in early 2020. Our future actual results could Investor Notices differ materially from the forward-looking statements in this presentation due to the COVID-19 pandemic and related impacts, including, by, among other things: contributing to a sustained or further deterioration in commodity prices; causing takeaway capacity constraints for production, resulting in further production shut-ins and additional downward pressure on impacted regional pricing differentials; limiting our ability to access sources of capital due to disruptions in financial markets; increasing the risk of a downgrade from credit rating agencies; exacerbating counterparty credit risks and the risk of supply chain interruptions; and increasing the risk of operational disruptions due to social distancing measures and other changes to business practices. In addition to the risks associated with the COVID-19 pandemic and its related impacts, our actual future results could differ materially from our expectations due to other factors, including, among other things: the volatility of oil, gas and NGL prices; uncertainties inherent in estimating oil, gas and NGL reserves; the extent to which we are successful in acquiring and discovering additional reserves; the uncertainties, costs and risks involved in our operations, including as a result of employee misconduct; regulatory restrictions, compliance costs and other risks relating to governmental regulation, including with respect to environmental matters; risks related to regulatory, social and market efforts to address climate change; risks related to our hedging activities; counterparty credit risks; risks relating to our indebtedness; cyberattack risks; our limited control over third parties who operate some of our oil and gas properties; midstream capacity constraints and potential interruptions in production; the extent to which insurance covers any losses we may experience; competition for assets, materials, people and capital; risks related to investors attempting to effect change; our ability to successfully complete mergers, acquisitions and divestitures; and any of the other risks and uncertainties discussed in our 2019 Annual Report on Form 10-K and our other filings with the SEC. All subsequent written and oral forward-looking statements attributable to Devon, or persons acting on its behalf, are expressly qualified in their entirety by the cautionary statements above. We assume no duty to update or revise our forward-looking statements based on new information, future events or otherwise. Use of Non-GAAP Information This presentation may include non-GAAP financial measures. Such non-GAAP measures are not alternatives to GAAP measures, and you should not consider these non-GAAP measures in isolation or as a substitute for analysis of our results as reported under GAAP. For additional disclosure regarding such non-GAAP measures, including reconciliations to their most directly comparable GAAP measure, please refer to Devon’s second-quarter 2020 earnings materials at www.devonenergy.com and Form 10-Q filed with the SEC. Cautionary Note to Investors The SEC permits oil and gas companies, in their filings with the SEC, to disclose only proved, probable and possible reserves that meet the SEC's definitions for such terms, and price and cost sensitivities for such reserves, and prohibits disclosure of resources that do not constitute such reserves. This presentation may contain certain terms, such as high-return inventory, potential locations, risked and unrisked locations, estimated ultimate recovery (EUR), exploration target size and other similar terms. These estimates are by their nature more speculative than estimates of proved, probable and possible reserves and accordingly are subject to substantially greater risk of being actually realized. Investors are urged to consider closely the disclosure in our Form 10-K, available at www.devonenergy.com or the SEC’s website.


