Table of Contents
UNITED STATES
SECURITIES AND EXCHANGE COMMISSION
Washington, D.C. 20549
Form 10-Q
(Mark One)
☑ | QUARTERLY REPORT PURSUANT TO SECTION 13 OR 15(d) OF THE SECURITIES EXCHANGE ACT OF 1934 |
For the quarterly period ended March 31, 2021
or
☐ | TRANSITION REPORT PURSUANT TO SECTION 13 OR 15(d) OF THE SECURITIES EXCHANGE ACT OF 1934 |
Commission File Number 001-32318

DEVON ENERGY CORPORATION
(Exact name of registrant as specified in its charter)
Delaware | | 73-1567067 |
(State or other jurisdiction of incorporation or organization) | | (I.R.S. Employer identification No.) |
| |
333 West Sheridan Avenue, Oklahoma City, Oklahoma | | 73102-5015 |
(Address of principal executive offices) | | (Zip code) |
Registrant’s telephone number, including area code: (405) 235-3611
Former name, address and former fiscal year, if changed from last report: Not applicable
Securities registered pursuant to Section 12(b) of the Act:
| | |
Title of each class | Trading Symbol | Name of each exchange on which registered |
Common Stock, par value $0.10 per share | DVN | The New York Stock Exchange |
Indicate by check mark whether the registrant (1) has filed all reports required to be filed by Section 13 or 15(d) of the Securities Exchange Act of 1934 during the preceding 12 months (or for such shorter period that the registrant was required to file such reports), and (2) has been subject to such filing requirements for the past 90 days. Yes ☑ No ☐
Indicate by check mark whether the registrant has submitted electronically every Interactive Data File required to be submitted pursuant to Rule 405 of Regulation S-T (§232.405 of this chapter) during the preceding 12 months (or for such shorter period that the registrant was required to submit such files). Yes ☑ No ☐
Indicate by check mark whether the registrant is a large accelerated filer, an accelerated filer, a non-accelerated filer, smaller reporting company or an emerging growth company. See the definitions of “large accelerated filer,” “accelerated filer,” “smaller reporting company,” and “emerging growth company” in Rule 12b-2 of the Exchange Act.
| | | | | | | | |
Large accelerated filer | | ☑ | Accelerated filer | | ☐ | Non-accelerated filer | | ☐ |
Smaller reporting company | | ☐ | Emerging growth company | | ☐ | | | |
If an emerging growth company, indicate by check mark if the registrant has elected not to use the extended transition period for complying with any new or revised financial accounting standards provided pursuant to Section 13(a) of the Exchange Act. ☐
Indicate by check mark whether the registrant is a shell company (as defined in Rule 12b-2 of the Act). Yes ☐ No ☑
On April 21, 2021, 676.9 million shares of common stock were outstanding.
Table of Contents
DEVON ENERGY CORPORATION
FORM 10-Q
TABLE OF CONTENTS
2
Table of Contents
DEFINITIONS
Unless the context otherwise indicates, references to “us,” “we,” “our,” “ours,” “Devon,” the “Company” and “Registrant” refer to Devon Energy Corporation and its consolidated subsidiaries. All monetary values, other than per unit and per share amounts, are stated in millions of U.S. dollars unless otherwise specified. In addition, the following are other abbreviations and definitions of certain terms used within this Quarterly Report on Form 10-Q:
“ASU” means Accounting Standards Update.
“Bbl” or “Bbls” means barrel or barrels.
“BKV” means Banpu Kalnin Ventures.
“Boe” means barrel of oil equivalent. Gas proved reserves and production are converted to Boe, at the pressure and temperature base standard of each respective state in which the gas is produced, at the rate of six Mcf of gas per Bbl of oil, based upon the approximate relative energy content of gas and oil. NGL proved reserves and production are converted to Boe on a one-to-one basis with oil.
“Btu” means British thermal units, a measure of heating value.
“Canada” means the division of Devon encompassing oil and gas properties located in Canada. On June 27, 2019, all of Devon’s Canadian operating assets and operations were divested. All dollar amounts associated with Canada are in U.S. dollars, unless stated otherwise.
“Catalyst” means Catalyst Midstream Partners, LLC.
“CDM” means Cotton Draw Midstream, L.L.C.
“DD&A” means depreciation, depletion and amortization expenses.
“Devon Plan” means Devon Energy Corporation Incentive Savings Plan.
“Federal Funds Rate” means the interest rate at which depository institutions lend balances at the Federal Reserve to other depository institutions overnight.
“G&A” means general and administrative expenses.
“GAAP” means U.S. generally accepted accounting principles.
“HEP” means Howard Energy Partners.
“Inside FERC” refers to the publication Inside FERC’s Gas Market Report.
“LOE” means lease operating expenses.
“MBbls” means thousand barrels.
“MBoe” means thousand Boe.
“Mcf” means thousand cubic feet.
“Merger” means the merger of Merger Sub with and into WPX, with WPX continuing as the surviving corporation and a wholly-owned subsidiary of the Company, pursuant to the terms of the Merger Agreement.
“Merger Agreement” means that certain Agreement and Plan of Merger, dated September 26, 2020, by and among the Company, Merger Sub and WPX.
“Merger Sub” means East Merger Sub, Inc., a wholly-owned subsidiary of the Company.
3
Table of Contents
“MMBoe” means million Boe.
“MMBtu” means million Btu.
“MMcf” means million cubic feet.
“N/M” means not meaningful.
“NGL” or “NGLs” means natural gas liquids.
“NYMEX” means New York Mercantile Exchange.
“OPEC” means Organization of the Petroleum Exporting Countries.
“QLCP” means QL Capital Partners, LP
“SEC” means United States Securities and Exchange Commission.
“Senior Credit Facility” means Devon’s syndicated unsecured revolving line of credit, effective as of October 5, 2018.
“TSR” means total shareholder return.
“U.S.” means United States of America.
“VIE” means variable interest entity.
“WPX” means WPX Energy, Inc.
“WTI” means West Texas Intermediate.
“/Bbl” means per barrel.
“/d” means per day.
“/MMBtu” means per MMBtu.
4
Table of Contents
INFORMATION REGARDING FORWARD-LOOKING STATEMENTS
This report includes “forward-looking statements” as defined by the SEC. Such statements include those concerning strategic plans, our expectations and objectives for future operations, as well as other future events or conditions, and are often identified by use of the words and phrases “expects,” “believes,” “will,” “would,” “could,” “continue,” “may,” “aims,” “likely to be,” “intends,” “forecasts,” “projections,” “estimates,” “plans,” “expectations,” “targets,” “opportunities,” “potential,” “anticipates,” “outlook” and other similar terminology. All statements, other than statements of historical facts, included in this report that address activities, events or developments that Devon expects, believes or anticipates will or may occur in the future are forward-looking statements. Such statements are subject to a number of assumptions, risks and uncertainties, many of which are beyond our control. Consequently, actual future results could differ materially and adversely from our expectations due to a number of factors, including, but not limited to:
| • | the volatility of oil, gas and NGL prices; |
| • | risks relating to the COVID-19 pandemic or other future pandemics; |
| • | uncertainties inherent in estimating oil, gas and NGL reserves; |
| • | the extent to which we are successful in acquiring and discovering additional reserves; |
| • | regulatory restrictions, compliance costs and other risks relating to governmental regulation, including with respect to environmental matters; |
| • | risks related to regulatory, social and market efforts to address climate change; |
| • | the uncertainties, costs and risks involved in our operations, including as a result of employee misconduct; |
| • | risks related to our hedging activities; |
| • | counterparty credit risks; |
| • | risks relating to our indebtedness; |
| • | our limited control over third parties who operate some of our oil and gas properties; |
| • | midstream capacity constraints and potential interruptions in production; |
| • | the extent to which insurance covers any losses we may experience; |
| • | competition for assets, materials, people and capital; |
| • | risks related to investors attempting to effect change; |
| • | our ability to successfully complete mergers, acquisitions and divestitures; |
| • | risks related to the Merger, including the risk that we may not realize the anticipated benefits of the Merger or successfully integrate the two legacy businesses; and |
All subsequent written and oral forward-looking statements attributable to Devon, or persons acting on its behalf, are expressly qualified in their entirety by the cautionary statements above. We assume no duty to update or revise our forward-looking statements based on new information, future events or otherwise.
5
Table of Contents
Part I. Financial Information
Item 1. Financial Statements
DEVON ENERGY CORPORATION AND SUBSIDIARIES
CONSOLIDATED STATEMENTS OF COMPREHENSIVE EARNINGS
| | Three Months Ended March 31, | |
| | 2021 | | | 2020 | |
| | (Unaudited) | |
Oil, gas and NGL sales | | $ | 1,788 | | | $ | 807 | |
Oil, gas and NGL derivatives | | | (528 | ) | | | 720 | |
Marketing and midstream revenues | | | 502 | | | | 560 | |
Total revenues | | | 1,762 | | | | 2,087 | |
Production expenses | | | 489 | | | | 318 | |
Exploration expenses | | | 3 | | | | 112 | |
Marketing and midstream expenses | | | 523 | | | | 578 | |
Depreciation, depletion and amortization | | | 467 | | | | 401 | |
Asset impairments | | | — | | | | 2,666 | |
Asset dispositions | | | (32 | ) | | | — | |
General and administrative expenses | | | 107 | | | | 102 | |
Financing costs, net | | | 77 | | | | 65 | |
Restructuring and transaction costs | | | 189 | | | | — | |
Other, net | | | (29 | ) | | | (48 | ) |
Total expenses | | | 1,794 | | | | 4,194 | |
Loss from continuing operations before income taxes | | | (32 | ) | | | (2,107 | ) |
Income tax benefit | | | (248 | ) | | | (417 | ) |
Net earnings (loss) from continuing operations | | | 216 | | | | (1,690 | ) |
Net loss from discontinued operations, net of income taxes | | | — | | | | (125 | ) |
Net earnings (loss) | | | 216 | | | | (1,815 | ) |
Net earnings attributable to noncontrolling interests | | | 3 | | | | 1 | |
Net earnings (loss) attributable to Devon | | $ | 213 | | | $ | (1,816 | ) |
Basic net earnings (loss) per share: | | | | | | | | |
Basic earnings (loss) from continuing operations per share | | $ | 0.33 | | | $ | (4.48 | ) |
Basic loss from discontinued operations per share | | | — | | | | (0.34 | ) |
Basic net earnings (loss) per share | | $ | 0.33 | | | $ | (4.82 | ) |
Diluted net earnings (loss) per share: | | | | | | | | |
Diluted earnings (loss) from continuing operations per share | | $ | 0.32 | | | $ | (4.48 | ) |
Diluted loss from discontinued operations per share | | | — | | | | (0.34 | ) |
Diluted net earnings (loss) per share | | $ | 0.32 | | | $ | (4.82 | ) |
Comprehensive earnings (loss): | | | | | | | | |
Net earnings (loss) | | $ | 216 | | | $ | (1,815 | ) |
Other comprehensive earnings (loss), net of tax: | | | | | | | | |
Pension and postretirement plans | | | 23 | | | | 1 | |
Other comprehensive earnings, net of tax | | | 23 | | | | 1 | |
Comprehensive earnings (loss): | | $ | 239 | | | $ | (1,814 | ) |
Comprehensive earnings attributable to noncontrolling interests | | | 3 | | | | 1 | |
Comprehensive earnings (loss) attributable to Devon | | $ | 236 | | | $ | (1,815 | ) |
See accompanying notes to consolidated financial statements
6
Table of Contents
DEVON ENERGY CORPORATION AND SUBSIDIARIES
CONSOLIDATED STATEMENTS OF CASH FLOWS
| | Three Months Ended March 31, | |
| | 2021 | | | 2020 | |
| | (Unaudited) | |
Cash flows from operating activities: | | | | | | | | |
Net earnings (loss) | | $ | 216 | | | $ | (1,815 | ) |
Adjustments to reconcile net earnings (loss) to net cash from operating activities: | | | | | | | | |
Net loss from discontinued operations, net of income taxes | | | — | | | | 125 | |
Depreciation, depletion and amortization | | | 467 | | | | 401 | |
Asset impairments | | | — | | | | 2,666 | |
Leasehold impairments | | | 1 | | | | 110 | |
(Amortization) accretion of liabilities | | | (54 | ) | | | 8 | |
Total (gains) losses on commodity derivatives | | | 528 | | | | (720 | ) |
Cash settlements on commodity derivatives | | | (232 | ) | | | 101 | |
Gains on asset dispositions | | | (32 | ) | | | — | |
Deferred income tax benefit | | | (243 | ) | | | (311 | ) |
Share-based compensation | | | 41 | | | | 20 | |
Early retirement of debt | | | 27 | | | | — | |
Changes in assets and liabilities, net | | | (127 | ) | | | (56 | ) |
Net cash from operating activities - continuing operations | | | 592 | | | | 529 | |
Cash flows from investing activities: | | | | | | | | |
Capital expenditures | | | (499 | ) | | | (425 | ) |
Acquisitions of property and equipment | | | — | | | | (4 | ) |
Divestitures of property and equipment | | | 15 | | | | 25 | |
WPX acquired cash | | | 344 | | | | — | |
Distributions from equity method investments | | | 10 | | | | — | |
Net cash from investing activities - continuing operations | | | (130 | ) | | | (404 | ) |
Cash flows from financing activities: | | | | | | | | |
Repayments of long-term debt | | | (533 | ) | | | — | |
Early retirement of debt | | | (27 | ) | | | — | |
Repurchases of common stock | | | — | | | | (38 | ) |
Dividends paid on common stock | | | (203 | ) | | | (34 | ) |
Contributions from noncontrolling interests | | | — | | | | 5 | |
Distributions to noncontrolling interests | | | (4 | ) | | | (3 | ) |
Acquisition of noncontrolling interests | | | (24 | ) | | | — | |
Shares exchanged for tax withholdings | | | (33 | ) | | | (17 | ) |
Net cash from financing activities - continuing operations | | | (824 | ) | | | (87 | ) |
Effect of exchange rate changes on cash - continuing operations | | | 3 | | | | — | |
Net change in cash, cash equivalents and restricted cash of continuing operations | | | (359 | ) | | | 38 | |
Cash flows from discontinued operations: | | | | | | | | |
Operating activities | | | 0 | | | | (131 | ) |
Investing activities | | | 0 | | | | (1 | ) |
Financing activities | | | 0 | | | | 0 | |
Effect of exchange rate changes on cash | | | 0 | | | | (23 | ) |
Net change in cash, cash equivalents and restricted cash of discontinued operations | | | 0 | | | | (155 | ) |
Net change in cash, cash equivalents and restricted cash | | | (359 | ) | | | (117 | ) |
Cash, cash equivalents and restricted cash at beginning of period | | | 2,237 | | | | 1,844 | |
Cash, cash equivalents and restricted cash at end of period | | $ | 1,878 | | | $ | 1,727 | |
| | | | | | | | |
Reconciliation of cash, cash equivalents and restricted cash: | | | | | | | | |
Cash and cash equivalents | | $ | 1,683 | | | $ | 1,527 | |
Restricted cash | | | 195 | | | | 200 | |
Total cash, cash equivalents and restricted cash | | $ | 1,878 | | | $ | 1,727 | |
See accompanying notes to consolidated financial statements
7
Table of Contents
DEVON ENERGY CORPORATION AND SUBSIDIARIES
CONSOLIDATED BALANCE SHEETS
| | March 31, 2021 | | | December 31, 2020 | |
| | (Unaudited) | | | | | |
ASSETS | | | | | | | | |
Current assets: | | | | | | | | |
Cash, cash equivalents and restricted cash | | $ | 1,878 | | | $ | 2,237 | |
Accounts receivable | | | 1,089 | | | | 601 | |
Income taxes receivable | | | 166 | | | | 174 | |
Other current assets | | | 334 | | | | 248 | |
Total current assets | | | 3,467 | | | | 3,260 | |
Oil and gas property and equipment, based on successful efforts accounting, net | | | 13,826 | | | | 4,436 | |
Other property and equipment, net ($106 million and $102 million related to CDM in 2021 and 2020, respectively) | | | 1,448 | | | | 957 | |
Total property and equipment, net | | | 15,274 | | | | 5,393 | |
Goodwill | | | 753 | | | | 753 | |
Right-of-use assets | | | 255 | | | | 223 | |
Investments | | | 402 | | | | 12 | |
Other long-term assets | | | 306 | | | | 271 | |
Total assets | | $ | 20,457 | | | $ | 9,912 | |
LIABILITIES AND EQUITY | | | | | | | | |
Current liabilities: | | | | | | | | |
Accounts payable | | $ | 564 | | | $ | 242 | |
Revenues and royalties payable | | | 909 | | | | 662 | |
Short-term debt | | | 226 | | | | — | |
Other current liabilities | | | 1,246 | | | | 536 | |
Total current liabilities | | | 2,945 | | | | 1,440 | |
Long-term debt | | | 7,042 | | | | 4,298 | |
Lease liabilities | | | 260 | | | | 246 | |
Asset retirement obligations | | | 455 | | | | 358 | |
Other long-term liabilities | | | 1,269 | | | | 551 | |
Stockholders' equity: | | | | | | | | |
Common stock, $0.10 par value. Authorized 1.0 billion shares; issued 675 million and 382 million shares in 2021 and 2020, respectively | | | 67 | | | | 38 | |
Additional paid-in capital | | | 8,172 | | | | 2,766 | |
Retained earnings | | | 218 | | | | 208 | |
Accumulated other comprehensive loss | | | (104 | ) | | | (127 | ) |
Total stockholders’ equity attributable to Devon | | | 8,353 | | | | 2,885 | |
Noncontrolling interests | | | 133 | | | | 134 | |
Total equity | | | 8,486 | | | | 3,019 | |
Total liabilities and equity | | $ | 20,457 | | | $ | 9,912 | |
See accompanying notes to consolidated financial statements
8
Table of Contents
DEVON ENERGY CORPORATION AND SUBSIDIARIES
CONSOLIDATED STATEMENTS OF EQUITY
| | | | | | | | | | | | | | Retained | | | Other | | | | | | | | | | | | | |
| | | | | | | | | | Additional | | | Earnings | | | Comprehensive | | | | | | | | | | | | | |
| | Common Stock | | | Paid-In | | | (Accumulated | | | Earnings | | | Treasury | | | Noncontrolling | | | Total | |
| | Shares | | | Amount | | | Capital | | | Deficit) | | | (Loss) | | | Stock | | | Interests | | | Equity | |
| | (Unaudited) | |
Three Months Ended March 31, 2021 | | | | | | | | | | | | | | | | | | | | | | | | | | | | | | | | |
Balance as of December 31, 2020 | | | 382 | | | $ | 38 | | | $ | 2,766 | | | $ | 208 | | | $ | (127 | ) | | $ | — | | | $ | 134 | | | $ | 3,019 | |
Net earnings | | | — | | | | — | | | | — | | | | 213 | | | | — | | | | — | | | | 3 | | | | 216 | |
Other comprehensive earnings, net of tax | | | — | | | | — | | | | — | | | | — | | | | 23 | | | | — | | | | — | | | | 23 | |
Restricted stock grants, net of cancellations | | | 4 | | | | — | | | | — | | | | — | | | | — | | | | — | | | | — | | | | — | |
Common stock repurchased | | | — | | | | — | | | | — | | | | — | | | | — | | | | (38 | ) | | | — | | | | (38 | ) |
Common stock retired | | | (2 | ) | | | — | | | | (38 | ) | | | — | | | | — | | | | 38 | | | | — | | | | — | |
Common stock dividends | | | — | | | | — | | | | — | | | | (203 | ) | | | — | | | | — | | | | — | | | | (203 | ) |
Common stock issued | | | 290 | | | | 29 | | | | 5,403 | | | | — | | | | — | | | | — | | | | — | | | | 5,432 | |
Share-based compensation | | | 1 | | | | — | | | | 41 | | | | — | | | | — | | | | — | | | | — | | | | 41 | |
Contributions from noncontrolling interests | | | — | | | | — | | | | — | | | | — | | | | — | | | | — | | | | — | | | | — | |
Distributions to noncontrolling interests | | | — | | | | — | | | | — | | | | — | | | | — | | | | — | | | | (4 | ) | | | (4 | ) |
Balance as of March 31, 2021 | | | 675 | | | $ | 67 | | | $ | 8,172 | | | $ | 218 | | | $ | (104 | ) | | $ | — | | | $ | 133 | | | $ | 8,486 | |
Three Months Ended March 31, 2020 | | | | | | | | | | | | | | | | | | | | | | | | | | | | | | | | |
Balance as of December 31, 2019 | | | 382 | | | $ | 38 | | | $ | 2,735 | | | $ | 3,148 | | | $ | (119 | ) | | $ | — | | | $ | 118 | | | $ | 5,920 | |
Net earnings (loss) | | | — | | | | — | | | | — | | | | (1,816 | ) | | | — | | | | — | | | | 1 | | | | (1,815 | ) |
Other comprehensive earnings, net of tax | | | — | | | | — | | | | — | | | | — | | | | 1 | | | | — | | | | — | | | | 1 | |
Restricted stock grants, net of cancellations | | | 3 | | | | — | | | | — | | | | — | | | | — | | | | — | | | | — | | | | — | |
Common stock repurchased | | | — | | | | — | | | | — | | | | — | | | | — | | | | (54 | ) | | | — | | | | (54 | ) |
Common stock retired | | | (3 | ) | | | — | | | | (54 | ) | | | — | | | | — | | | | 54 | | | | — | | | | — | |
Common stock dividends | | | — | | | | — | | | | — | | | | (34 | ) | | | — | | | | — | | | | — | | | | (34 | ) |
Share-based compensation | | | 1 | | | | — | | | | 20 | | | | — | | | | — | | | | — | | | | — | | | | 20 | |
Contributions from noncontrolling interests | | | — | | | | — | | | | — | | | | — | | | | — | | | | — | | | | 5 | | | | 5 | |
Distributions to noncontrolling interests | | | — | | | | — | | | | — | | | | — | | | | — | | | | — | | | | (3 | ) | | | (3 | ) |
Balance as of March 31, 2020 | | | 383 | | | $ | 38 | | | $ | 2,701 | | | $ | 1,298 | | | $ | (118 | ) | | $ | — | | | $ | 121 | | | $ | 4,040 | |
See accompanying notes to consolidated financial statements
9
Table of Contents
DEVON ENERGY CORPORATION AND SUBSIDIARIES
NOTES TO CONSOLIDATED FINANCIAL STATEMENTS
(Unaudited)
1. | Summary of Significant Accounting Policies |
The accompanying unaudited interim financial statements and notes of Devon have been prepared pursuant to the rules and regulations of the SEC. Pursuant to such rules and regulations, certain disclosures normally included in financial statements prepared in accordance with U.S. GAAP have been omitted. The accompanying unaudited interim financial statements and notes should be read in conjunction with the financial statements and notes included in Devon’s 2020 Annual Report on Form 10-K. The accompanying unaudited interim financial statements in this report reflect all adjustments that are, in the opinion of management, necessary for a fair statement of Devon’s results of operations and cash flows for the three-month periods ended March 31, 2021 and 2020 and Devon’s financial position as of March 31, 2021.
Devon and WPX completed an all-stock merger of equals on January 7, 2021. On the closing date of the Merger, each share of WPX common stock was automatically converted into the right to receive 0.5165 of a share of Devon common stock. The transaction has been accounted for using the acquisition method of accounting, with Devon being treated as the accounting acquirer. See Note 2 for further discussion.
As further discussed in Note 18, Devon closed on the sale of its Barnett Shale assets in October 2020. Prior to December 31, 2020, activity relating to Devon’s Barnett Shale assets is classified as discontinued operations within Devon’s consolidated statements of comprehensive earnings and consolidated statements of cash flows.
As of March 31, 2021, Devon classified approximately $185 million of cash as restricted cash on the consolidated balance sheets for obligations associated with the abandonment of certain gas processing contracts related to divestitures of other Barnett Shale assets that occurred in 2018 and obligations retained related to the Canadian business. Cash payments for these charges related to the Barnett assets and Canada business total approximately $10 million per quarter.
Variable Interest Entity
Cotton Draw Midstream, L.L.C. (“CDM”) is a joint-venture entity formed by Devon and an affiliate of QL Capital Partners, LP (“QLCP”). CDM provides gathering, compression and dehydration services for natural gas production in the Cotton Draw area of the Delaware Basin. Devon holds a controlling interest in CDM and the portions of CDM’s net earnings and equity not attributable to Devon’s controlling interest are shown separately as noncontrolling interests in the accompanying consolidated statements of comprehensive earnings and consolidated balance sheets. CDM is considered a VIE to Devon. The assets of CDM cannot be used by Devon for general corporate purposes and are included in, and disclosed parenthetically, on Devon's consolidated balance sheets. The carrying amount of liabilities related to CDM for which the creditors do not have recourse to Devon's assets are also included in, and disclosed parenthetically, on Devon's consolidated balance sheets if material.
Investments
In conjunction with the Merger, Devon acquired an interest in Catalyst which is a joint venture established between WPX and Howard Energy Partners (“HEP”) to develop oil gathering and natural gas processing infrastructure in the Stateline area of the Delaware Basin. Under the terms of the agreement, Devon and HEP each have a 50 percent voting interest in the joint venture legal entity and HEP serves as the operator. Through 2038, Devon’s production from 50,000 net acres in the Stateline area of the Delaware Basin has been dedicated to Catalyst subject to fixed-fee oil gathering and natural gas processing agreements. The agreements do not include any minimum volume commitments. Devon accounts for the investment in Catalyst as an equity method investment. Devon’s investment in Catalyst is shown within investments on the consolidated balance sheet and Devon’s share of Catalyst earnings are reflected as a component of other, net in the accompanying consolidated statements of comprehensive earnings.
10
Table of Contents
DEVON ENERGY CORPORATION AND SUBSIDIARIES
NOTES TO CONSOLIDATED FINANCIAL STATEMENTS – (Continued)
(Unaudited)
Disaggregation of Revenue
The following table presents revenue from contracts with customers that are disaggregated based on the type of good or service.
| | Three Months Ended March 31, | |
| | 2021 | | | 2020 | |
Oil | | $ | 1,357 | | | $ | 662 | |
Gas | | | 207 | | | | 70 | |
NGL | | | 224 | | | | 75 | |
Oil, gas and NGL sales | | | 1,788 | | | | 807 | |
| | | | | | | | |
Oil | | | 209 | | | | 329 | |
Gas | | | 118 | | | | 94 | |
NGL | | | 175 | | | | 137 | |
Marketing and midstream revenues | | | 502 | | | | 560 | |
Total revenues from contracts with customers | | $ | 2,290 | | | $ | 1,367 | |
2.Acquisitions and Divestitures
WPX Merger
On January 7, 2021, Devon and WPX completed an all-stock merger of equals. WPX was an oil and gas exploration and production company with assets in the Delaware Basin in Texas and New Mexico and the Williston Basin in North Dakota. On the closing date of the Merger, each share of WPX common stock was automatically converted into the right to receive 0.5165 of a share of Devon common stock. No fractional shares of Devon’s common stock were issued in the Merger, and holders of WPX common stock instead received cash in lieu of fractional shares of Devon common stock, if any. Based on the closing price of Devon’s common stock on January 7, 2021, the total value of Devon common stock issued to holders of WPX common stock as part of this transaction was approximately $5.4 billion. The Merger was structured as a tax-free reorganization for United States federal income tax purposes.
Purchase Price Allocation
The transaction has been accounted for using the acquisition method of accounting, with Devon being treated as the accounting acquirer. Under the acquisition method of accounting, the assets and liabilities of WPX and its subsidiaries have been recorded at their respective fair values as of the date of completion of the Merger and added to Devon’s. The preliminary purchase price assessment remains an ongoing process and is subject to change for up to one year subsequent to the closing date of the Merger. Determining the fair value of the assets and liabilities of WPX requires judgment and certain assumptions to be made, the most significant of these being related to the valuation of WPX’s oil and gas properties. The inputs and assumptions related to the oil and gas properties are categorized as level 3 in the fair value hierarchy.
11
Table of Contents
DEVON ENERGY CORPORATION AND SUBSIDIARIES
NOTES TO CONSOLIDATED FINANCIAL STATEMENTS – (Continued)
(Unaudited)
The following table represents the preliminary allocation of the total purchase price of WPX to the identifiable assets acquired and the liabilities assumed based on the fair values as of the acquisition date.
| | Preliminary Purchase Price Allocation | |
Consideration: | | | | |
WPX Common Stock outstanding | | | 561.2 | |
Exchange Ratio | | | 0.5165 | |
Devon common stock issued | | | 289.9 | |
Devon closing price on January 7, 2021 | | $ | 18.57 | |
Total common equity consideration | | | 5,383 | |
Share-based replacement awards | | | 49 | |
Total consideration | | $ | 5,432 | |
Assets acquired: | | | | |
Cash, cash equivalents and restricted cash | | $ | 344 | |
Accounts receivable | | | 425 | |
Other current assets | | | 49 | |
Right-of-use assets | | | 38 | |
Proved oil and gas property and equipment | | | 7,017 | |
Unproved and properties under development | | | 2,367 | |
Other property and equipment | | | 485 | |
Investments | | | 400 | |
Other long-term assets | | | 43 | |
Total assets acquired | | $ | 11,168 | |
Liabilities assumed: | | | | |
Accounts payable | | $ | 346 | |
Revenue and royalties payable | | | 223 | |
Other current liabilities | | | 454 | |
Debt | | | 3,562 | |
Lease liabilities | | | 38 | |
Asset retirement obligations | | | 94 | |
Deferred income taxes | | | 254 | |
Other long-term liabilities | | | 765 | |
Total liabilities assumed | | | 5,736 | |
Net assets acquired | | $ | 5,432 | |
WPX Revenues and Earnings
The following table represents WPX’s revenues and earnings included in Devon’s consolidated comprehensive statements of earnings subsequent to the closing date of the Merger.
| | Three Months Ended March 31, | |
| | 2021 | |
Total revenues | | $ | 772 | |
Net earnings | | $ | 166 | |
12
Table of Contents
DEVON ENERGY CORPORATION AND SUBSIDIARIES
NOTES TO CONSOLIDATED FINANCIAL STATEMENTS – (Continued)
(Unaudited)
Pro Forma Financial Information
Due to the Merger closing on January 7, 2021, all activity in the first quarter of 2021 except for the first six days of January is included in Devon’s consolidated statements of comprehensive earnings. The following unaudited pro forma financial information for the three months ended March 31, 2020 is based on our historical consolidated financial statements adjusted to reflect as if the Merger had occurred on January 1, 2020. The information below reflects pro forma adjustments to conform WPX’s historical financial information to Devon’s financial statement presentation. The unaudited pro forma financial information is not necessarily indicative of what would have occurred if the Merger had been completed as of the beginning of the periods presented, nor is it indicative of future results.
| | Three Months Ended March 31, | |
Continuing operations: | | 2020 | |
Total revenues | | $ | 3,485 | |
Net loss | | $ | (1,864 | ) |
Basic net loss per share | | $ | (2.77 | ) |
Divestitures
On March 3, 2021, Devon completed the sale of non-core assets in the Rockies for proceeds of $9 million, net of purchase price adjustments, and recognized a $35 million gain related to the sale. The transaction includes contingent earnout payments of up to $8 million. The total estimated proved reserves associated with these divested assets are approximately 3 MMBoe. As of December 31, 2020, the associated assets and liabilities were classified as assets held for sale and included in other current assets and other current liabilities, respectively.
On October 1, 2020, Devon completed the sale of its Barnett Shale assets to BKV for proceeds, net of purchase price adjustments, of $490 million. The agreement with BKV also provides for contingent earnout payments to Devon of up to $260 million based upon future commodity prices, with upside participation beginning at a $2.75 Henry Hub natural gas price or a $50 WTI oil price. The contingent payment period commenced on January 1, 2021 and has a term of four years. Devon recognized a $748 million asset impairment related to these assets in the fourth quarter of 2019 and incremental asset impairments of $179 million and $3 million during the first quarter and third quarter of 2020, respectively. Additional information can be found in Note 18.
3.Derivative Financial Instruments
Objectives and Strategies
Devon enters into derivative financial instruments with respect to a portion of its oil, gas and NGL production to hedge future prices received. Additionally, Devon periodically enters into derivative financial instruments with respect to a portion of its oil, gas and NGL marketing activities. These commodity derivative financial instruments include financial price swaps, price swaptions, basis swaps, costless price collars and call options. Devon periodically enters into interest rate swaps to manage its exposure to interest rate volatility. As of March 31, 2021, Devon did not have any open interest rate swap contracts.
Devon does not intend to hold or issue derivative financial instruments for speculative trading purposes and has elected not to designate any of its derivative instruments for hedge accounting treatment.
Counterparty Credit Risk
By using derivative financial instruments, Devon is exposed to credit risk. Credit risk is the failure of the counterparty to perform under the terms of the derivative contract. To mitigate this risk, the hedging instruments are placed with a number of counterparties whom Devon believes are acceptable credit risks. It is Devon’s policy to enter into derivative contracts only with investment-grade rated counterparties deemed by management to be competent and competitive market makers. Additionally, Devon’s derivative contracts generally contain provisions that provide for collateral payments if Devon’s or its counterparty’s credit rating falls below certain credit rating levels. As of March 31, 2021, Devon neither held cash collateral of its counterparties 0r posted cash collateral to its counterparties.
13
Table of Contents
DEVON ENERGY CORPORATION AND SUBSIDIARIES
NOTES TO CONSOLIDATED FINANCIAL STATEMENTS – (Continued)
(Unaudited)
Commodity Derivatives
As of March 31, 2021, Devon had the following open oil derivative positions. The first table presents Devon’s oil derivatives that settle against the average of the prompt month NYMEX WTI futures price. The second table presents Devon’s oil derivatives that settle against the respective indices noted within the table.
| | Price Swaps | | | Price Swaptions | | | Price Collars | | | Call Options Sold | |
Period | | Volume (Bbls/d) | | | Weighted Average Price ($/Bbl) | | | Volume (Bbls/d) | | | Weighted Average Price ($/Bbl) | | | Volume (Bbls/d) | | | Weighted Average Floor Price ($/Bbl) | | | Weighted Average Ceiling Price ($/Bbl) | | | Volume (Bbls/d) | | | Weighted Average Price ($/Bbl) | |
Q2-Q4 2021 | | | 81,122 | | | $ | 40.45 | | | | 6,691 | | | $ | 40.12 | | | | 40,905 | | | $ | 39.84 | | | $ | 49.84 | | | | 5,000 | | | $ | 39.50 | |
Q1-Q4 2022 | | | 25,619 | | | $ | 43.82 | | | | 10,323 | | | $ | 46.46 | | | | 15,733 | | | $ | 44.92 | | | $ | 54.92 | | | | — | | | $ | — | |
| | Oil Basis Swaps | |
Period | | Index | | Volume (Bbls/d) | | | Weighted Average Differential to WTI ($/Bbl) | |
Q2-Q4 2021 | | Midland Sweet | | | 22,669 | | | $ | 0.84 | |
Q2-Q4 2021 | | Guernsey Light Sweet | | | 2,007 | | | $ | (1.48 | ) |
Q2-Q4 2021 | | BRENT | | | 1,000 | | | $ | (8.00 | ) |
Q2-Q4 2021 | | NYMEX Roll | | | 11,676 | | | $ | 0.38 | |
Q1-Q4 2022 | | BRENT | | | 1,000 | | | $ | (7.75 | ) |
Q1-Q4 2022 | | NYMEX Roll | | | 16,000 | | | $ | 0.37 | |
As of March 31, 2021, Devon had the following open natural gas derivative positions. The first table presents Devon’s natural gas derivatives that settle against the Inside FERC first of the month Henry Hub index and the end of month NYMEX index. The second table presents Devon’s natural gas derivatives that settle against the respective indices noted within the table.
| | Price Swaps (1) | | | Price Swaptions (2) | | | Price Collars (2) | | | Call Options Sold (2) | |
Period | | Volume (MMBtu/d) | | | Weighted Average Price ($/MMBtu) | | | Volume (MMBtu/d) | | | Weighted Average Price ($/MMBtu) | | | Volume (MMBtu/d) | | | Weighted Average Floor Price ($/MMBtu) | | | Weighted Average Ceiling Price ($/MMBtu) | | | Volume (MMBtu/d) | | | Weighted Average Price ($/MMBtu) | |
Q2-Q4 2021 | | | 270,636 | | | $ | 2.63 | | | | — | | | $ | — | | | | 196,218 | | | $ | 2.46 | | | $ | 2.96 | | | | 50,000 | | | $ | 2.68 | |
Q1-Q4 2022 | | | 3,452 | | | $ | 2.85 | | | | 100,000 | | | $ | 2.70 | | | | 69,110 | | | $ | 2.54 | | | $ | 3.04 | | | | — | | | $ | — | |
| (1) | Related to the 2021 open positions, 30,636 MMBtu/d settle against the Inside FERC first of month Henry Hub index at an average price of $2.76 and 240,000 MMBtu/d settle against the end of month NYMEX index at an average price of $2.62. All 2022 open positions settle against the Inside FERC first of month Henry Hub index. |
| (2) | Price swaptions and call options settle against end of the month NYMEX index. Price collars settle against the Inside FERC first of the month Henry Hub Index. |
| | Natural Gas Basis Swaps | |
Period | | Index | | Volume (MMBtu/d) | | | Weighted Average Differential to Henry Hub ($/MMBtu) | |
Q2-Q4 2021 | | El Paso Natural Gas | | | 35,000 | | | $ | (0.92 | ) |
Q2-Q4 2021 | | WAHA | | | 80,000 | | | $ | (0.65 | ) |
Q1-Q4 2022 | | WAHA | | | 70,000 | | | $ | (0.57 | ) |
Q1-Q4 2023 | | WAHA | | | 70,000 | | | $ | (0.51 | ) |
Q1-Q4 2024 | | WAHA | | | 40,000 | | | $ | (0.51 | ) |
14
Table of Contents
DEVON ENERGY CORPORATION AND SUBSIDIARIES
NOTES TO CONSOLIDATED FINANCIAL STATEMENTS – (Continued)
(Unaudited)
As of March 31, 2021, Devon had the following open NGL derivative positions. Devon’s NGL positions settle against the average of the prompt month OPIS Mont Belvieu, Texas index.
| | | | Price Swaps | |
Period | | Product | | Volume (Bbls/d) | | | Weighted Average Price ($/Bbl) | |
Q2-Q4 2021 | | Natural Gasoline | | | 1,000 | | | $ | 47.57 | |
Q2-Q4 2021 | | Normal Butane | | | 1,000 | | | $ | 31.40 | |
Q2-Q4 2021 | | Propane | | | 1,000 | | | $ | 27.88 | |
Financial Statement Presentation
The following table presents the derivative fair values by derivative financial instrument type followed by the corresponding individual consolidated balance sheets caption.
| | March 31, 2021 | | | December 31, 2020 | |
Commodity derivative assets: | | | | | | | | |
Other current assets | | $ | 3 | | | $ | 5 | |
Other long-term assets | | | 3 | | | | 1 | |
Total derivative assets | | $ | 6 | | | $ | 6 | |
Commodity derivative liabilities: | | | | | | | | |
Other current liabilities | | $ | 667 | | | $ | 143 | |
Other long-term liabilities | | | 122 | | | | 5 | |
Total derivative liabilities | | $ | 789 | | | $ | 148 | |
4.Share-Based Compensation
The table below presents the share-based compensation expense included in Devon’s accompanying consolidated statements of comprehensive earnings. The vesting for certain share-based awards was accelerated in conjunction with the reduction of workforce described in Note 6 and is included in restructuring and transaction costs in the accompanying consolidated statements of comprehensive earnings.
| | Three Months Ended March 31, | |
| | 2021 | | | 2020 | |
G&A | | $ | 20 | | | $ | 20 | |
Restructuring and transaction costs | | | 21 | | | | — | |
Total | | $ | 41 | | | $ | 20 | |
15
Table of Contents
DEVON ENERGY CORPORATION AND SUBSIDIARIES
NOTES TO CONSOLIDATED FINANCIAL STATEMENTS – (Continued)
(Unaudited)
Under its approved long-term incentive plan, Devon grants share-based awards to certain employees. The following table presents a summary of Devon’s unvested restricted stock awards and units, performance-based restricted stock awards and performance share units granted under the plan.
| | | | | Performance-Based | | | Performance | |
| | Restricted Stock Awards & Units | | | Restricted Stock Awards | | | Share Units | |
| | Awards/Units | | | Weighted Average Grant-Date Fair Value | | | Awards | | | Weighted Average Grant-Date Fair Value | | | Units | | | | | | Weighted Average Grant-Date Fair Value | |
| | (Thousands, except fair value data) | |
Unvested at 12/31/20 | | | 5,316 | | | $ | 25.82 | | | | 44 | | | $ | 44.70 | | | | 1,994 | | | | | | $ | 31.89 | |
Granted (1) | | | 5,542 | | | $ | 18.71 | | | | — | | | $ | — | | | | 861 | | | | | | $ | 18.08 | |
Vested | | | (4,329 | ) | | $ | 22.63 | | | | (39 | ) | | $ | 45.41 | | | | (754 | ) | | | | | $ | 37.40 | |
Forfeited | | | (20 | ) | | $ | 24.79 | | | | — | | | $ | — | | | | (25 | ) | | | | | $ | 36.04 | |
Unvested at 3/31/21 | | | 6,509 | | | $ | 21.89 | | | | 5 | | | $ | 38.54 | | | | 2,076 | | | (2 | ) | | $ | 24.12 | |
| (1) | Due to the closing of the Merger, each share of WPX common stock was automatically converted into the right to receive 0.5165 of a share of Devon common stock. As a result, approximately 4.9 million awards relate to the conversion of WPX equity awards to Devon equity awards. |
| (2) | A maximum of 4.2 million common shares could be awarded based upon Devon’s final TSR ranking. |
The following table presents the assumptions related to the performance share units granted in 2021, as indicated in the previous summary table.
| | 2021 | |
Grant-date fair value | | $ | 18.08 | |
Risk-free interest rate | | 0.18% | |
Volatility factor | | 67.8% | |
Contractual term (years) | | 2.89 | |
The following table presents a summary of the unrecognized compensation cost and the related weighted average recognition period associated with unvested awards and units as of March 31, 2021.
| | | | | | Performance-Based | | | | | |
| | Restricted Stock | | | Restricted Stock | | | Performance | |
| | Awards/Units | | | Awards | | | Share Units | |
Unrecognized compensation cost | | $ | 88 | | | $ | — | | | $ | 21 | |
Weighted average period for recognition (years) | | | 2.2 | | | | 0.2 | | | | 2.3 | |
5.Asset Impairments
The following table presents a summary of Devon’s asset impairments. Unproved impairments shown below are included in exploration expenses in the consolidated statements of comprehensive earnings.
| | Three Months Ended March 31, | |
| | 2021 | | | 2020 | |
Proved oil and gas assets | | $ | — | | | $ | 2,664 | |
Other assets | | | — | | | | 2 | |
Total asset impairments | | $ | — | | | $ | 2,666 | |
| | | | | | | | |
Unproved impairments | | $ | 1 | | | $ | 110 | |
16
Table of Contents
DEVON ENERGY CORPORATION AND SUBSIDIARIES
NOTES TO CONSOLIDATED FINANCIAL STATEMENTS – (Continued)
(Unaudited)
Proved Oil and Gas and Other Asset Impairments
Due to the reduced demand from the COVID-19 pandemic causing an unprecedented downturn in the price of oil and reductions in near-term capital investment, Devon recognized approximately $2.7 billion of proved asset impairments during the first quarter of 2020. These impairments related to the Anadarko Basin and Rockies fields in which the cost basis included acquisitions completed in 2016 and 2015, respectively, when commodity prices were much higher. During the first quarter of 2020, Devon also recognized $2 million of product line fill impairments.
Unproved Impairments
Due to the downturn in the commodity price environment and reduced near-term investment as discussed above, Devon also recognized $110 million of unproved impairments during the first three months of 2020, primarily in the Rockies field.
6.Restructuring and Transaction Costs
The following table summarizes Devon’s restructuring and transaction costs.
| | Three Months Ended March 31, | |
| | 2021 | | | 2020 | |
Restructuring | | $ | 143 | | | $ | — | |
Transaction costs | | | 46 | | | | — | |
Total | | $ | 189 | | | $ | — | |
In conjunction with the Merger closing, Devon recognized $143 million of restructuring expenses during the first quarter of 2021 related to employee severance and termination benefits, settlements and curtailments from defined retirement benefits and contract terminations. Of these expenses, $37 million and $21 million resulted from settlements and curtailments of defined retirement benefits and accelerated vesting of share-based grants, respectively, which are non-cash charges. Additionally, in conjunction with the Merger closing, Devon recognized $46 million of transaction costs primarily comprised of bank, legal and accounting fees.
The following table summarizes Devon’s restructuring liabilities.
| | Other | | | Other | | | | | |
| | Current | | | Long-term | | | | | |
| | Liabilities | | | Liabilities | | | Total | |
Balance as of December 31, 2020 | | $ | 35 | | | $ | 137 | | | $ | 172 | |
Changes related to 2021 workforce reductions | | | 61 | | | | — | | | | 61 | |
Changes related to prior years' restructurings | | | (2 | ) | | | (7 | ) | | | (9 | ) |
Balance as of March 31, 2021 | | $ | 94 | | | $ | 130 | | | $ | 224 | |
| | | | | | | | | | | | |
Balance as of December 31, 2019 | | $ | 20 | | | $ | 1 | | | $ | 21 | |
Changes related to prior years' restructurings | | | (9 | ) | | | — | | | | (9 | ) |
Balance as of March 31, 2020 | | $ | 11 | | | $ | 1 | | | $ | 12 | |
17
Table of Contents
DEVON ENERGY CORPORATION AND SUBSIDIARIES
NOTES TO CONSOLIDATED FINANCIAL STATEMENTS – (Continued)
(Unaudited)
7.Income Taxes
The following table presents Devon’s total income tax benefit and a reconciliation of its effective income tax rate to the U.S. statutory income tax rate.
| | Three Months Ended March 31, | |
| | 2021 | | | 2020 | |
Loss from continuing operations before income taxes | | $ | (32 | ) | | $ | (2,107 | ) |
| | | | | | | | |
Current income tax benefit | | $ | (5 | ) | | $ | (106 | ) |
Deferred income tax benefit | | | (243 | ) | | | (311 | ) |
Total income tax benefit | | $ | (248 | ) | | $ | (417 | ) |
| | | | | | | | |
U.S. statutory income tax rate | | | 21 | % | | | 21 | % |
State income taxes | | | (1 | %) | | | 1 | % |
Change in tax legislation | | | 0 | % | | | 5 | % |
Unrecognized tax benefits | | | 0 | % | | | 0 | % |
Other | | | (48 | %) | | | (3 | %) |
Deferred tax asset valuation allowance | | | 791 | % | | | (4 | %) |
Effective income tax rate | | | 763 | % | | | 20 | % |
The deferred income tax benefit recognized in the first quarter of 2021 primarily relates to the Merger. As shown in Note 2, Devon recognized $254 million of deferred tax liabilities to account for the Merger. The recognition of these deferred tax liabilities caused a decrease to Devon’s net deferred tax assets and a corresponding decrease to the valuation allowance Devon has recognized on its U.S. Federal deferred tax assets.
As of March 31, 2021, Devon continues to maintain a valuation allowance against materially all U.S. deferred tax assets. Devon continues to assess its valuation allowance position every quarter. Absent any additional objective negative evidence, and with the addition of subjective evidence such as forecasted taxable income, Devon may adjust the valuation allowance on its deferred tax assets in future periods.
In the table above, the “other” effect is composed primarily of permanent differences related to costs incurred in connection with the Merger. Such items represent $15 million of income tax expense in the first quarter of 2021.
The Coronavirus Aid, Relief, and Economic Security Act (“CARES Act”) became law on March 27, 2020. The CARES Act allows net operating losses generated in taxable years beginning after December 31, 2017 and before January 1, 2021 to be carried back five years to offset taxable income and recoup previously paid taxes. As a result, Devon is carrying back net operating losses generated in 2020 and 2019 to 2015 and 2014, respectively. Because the U.S. Federal income tax rate was higher in the carryback periods, Devon recognized an income tax benefit in the first quarter of 2020.
18
Table of Contents
DEVON ENERGY CORPORATION AND SUBSIDIARIES
NOTES TO CONSOLIDATED FINANCIAL STATEMENTS – (Continued)
(Unaudited)
8. | Net Earnings (Loss) Per Share from Continuing Operations |
The following table reconciles net earnings (loss) from continuing operations and weighted-average common shares outstanding used in the calculations of basic and diluted net earnings (loss) per share from continuing operations.
| | Three Months Ended March 31, | |
| | 2021 | | | 2020 | |
Net earnings (loss) from continuing operations: | | | | | | | | |
Net earnings (loss) from continuing operations | | $ | 213 | | | $ | (1,691 | ) |
Attributable to participating securities | | | (2 | ) | | | (1 | ) |
Basic and diluted earnings (loss) from continuing operations | | $ | 211 | | | $ | (1,692 | ) |
Common shares: | | | | | | | | |
Common shares outstanding - total | | | 654 | | | | 383 | |
Attributable to participating securities | | | (5 | ) | | | (6 | ) |
Common shares outstanding - basic | | | 649 | | | | 377 | |
Dilutive effect of potential common shares issuable | | | 2 | | | | — | |
Common shares outstanding - diluted | | | 651 | | | | 377 | |
Net earnings (loss) per share from continuing operations: | | | | | | | | |
Basic | | $ | 0.33 | | | $ | (4.48 | ) |
Diluted | | $ | 0.32 | | | $ | (4.48 | ) |
Antidilutive options | | | — | | | | — | |
9. | Other Comprehensive Earnings (Loss) |
Components of other comprehensive earnings (loss) consist of the following:
| | Three Months Ended March 31, | |
| | 2021 | | | 2020 | |
Pension and postretirement benefit plans: | | | | | | | | |
Beginning accumulated pension and postretirement benefits | | $ | (127 | ) | | $ | (119 | ) |
Recognition of net actuarial loss and prior service cost in earnings (1) | | | 1 | | | | 2 | |
Settlement of pension benefits (2) | | | 15 | | | | — | |
Income tax expense | | | — | | | | (1 | ) |
Other (3) | | | 7 | | | | — | |
Accumulated other comprehensive loss, net of tax | | $ | (104 | ) | | $ | (118 | ) |
| (1) | Recognition of net actuarial loss and prior service cost are included in the computation of net periodic benefit cost, which is a component of other, net in the accompanying consolidated statements of comprehensive earnings. |
| (2) | The Merger triggered settlement payments to certain plan participants, and the expense associated with this settlement is recognized as a component of restructuring and transaction costs in the accompanying consolidated statements of comprehensive earnings. |
| (3) | Includes a remeasurement of the pension obligation due to the change in control described above which was partially offset by a change in mortality assumption. |
19
Table of Contents
DEVON ENERGY CORPORATION AND SUBSIDIARIES
NOTES TO CONSOLIDATED FINANCIAL STATEMENTS – (Continued)
(Unaudited)
10. | Supplemental Information to Statements of Cash Flows |
| | Three Months Ended March 31, | |
| | 2021 | | | 2020 | |
Changes in assets and liabilities, net: | | | | | | | | |
Accounts receivable | | $ | (63 | ) | | $ | 238 | |
Income tax receivable | | | 15 | | | | (113 | ) |
Other current assets | | | (25 | ) | | | (38 | ) |
Other long-term assets | | | (10 | ) | | | (24 | ) |
Accounts payable | | | 71 | | | | 42 | |
Revenues and royalties payable | | | (55 | ) | | | (113 | ) |
Other current liabilities | | | (33 | ) | | | (81 | ) |
Other long-term liabilities | | | (27 | ) | | | 33 | |
Total | | $ | (127 | ) | | $ | (56 | ) |
Supplementary cash flow data - total operations: | | | | | | | | |
Interest paid | | $ | 114 | | | $ | 64 | |
Income taxes paid (refunded) | | $ | (6 | ) | | $ | 151 | |
As of March 31, 2021, Devon had approximately $230 million of accrued capital expenditures included in total property and equipment, net and accounts payable on the consolidated balance sheets. As of December 31, 2020 (pre-merger), Devon had approximately $100 million of accrued capital expenditures in total property and equipment, net and accounts payable on the consolidated balance sheets. As of January 7, 2021 (date of Merger closing), Devon assumed approximately $150 million of accrued capital expenditures included in accounts payable.
Components of accounts receivable include the following:
| | March 31, 2021 | | | December 31, 2020 | |
Oil, gas and NGL sales | | $ | 742 | | | $ | 335 | |
Joint interest billings | | | 127 | | | | 57 | |
Marketing and midstream revenues | | | 181 | | | | 195 | |
Other | | | 54 | | | | 25 | |
Gross accounts receivable | | | 1,104 | | | | 612 | |
Allowance for doubtful accounts | | | (15 | ) | | | (11 | ) |
Net accounts receivable | | $ | 1,089 | | | $ | 601 | |
12.Property, Plant and Equipment
The following table presents the aggregate capitalized costs related to Devon’s oil and gas and non-oil and gas activities.
| | March 31, 2021 | | | December 31, 2020 | |
Property and equipment: | | | | | | | | |
Proved | | $ | 35,119 | | | $ | 27,589 | |
Unproved and properties under development | | | 2,692 | | | | 392 | |
Total oil and gas | | | 37,811 | | | | 27,981 | |
Less accumulated DD&A | | | (23,985 | ) | | | (23,545 | ) |
Oil and gas property and equipment, net | | | 13,826 | | | | 4,436 | |
Other property and equipment | | | 2,060 | | | | 1,737 | |
Less accumulated DD&A | | | (612 | ) | | | (780 | ) |
Other property and equipment, net (1) | | | 1,448 | | | | 957 | |
Property and equipment, net | | $ | 15,274 | | | $ | 5,393 | |
| (1) | $106 million and $102 million related to CDM in 2021 and 2020, respectively. |
20
Table of Contents
DEVON ENERGY CORPORATION AND SUBSIDIARIES
NOTES TO CONSOLIDATED FINANCIAL STATEMENTS – (Continued)
(Unaudited)
13. | Debt and Related Expenses |
See below for a summary of debt instruments and balances. The notes and debentures are senior, unsecured obligations of Devon.
| | March 31, 2021 | | | December 31, 2020 | |
8.25% due August 1, 2023 (1) | | $ | 242 | | | $ | — | |
5.25% due September 15, 2024 (1) | | | 472 | | | | — | |
5.85% due December 15, 2025 | | | 485 | | | | 485 | |
5.75% due June 1, 2026 (1) | | | 500 | | | | — | |
7.50% due September 15, 2027 | | | 73 | | | | 73 | |
5.25% due October 15, 2027 (1) | | | 600 | | | | — | |
5.875% due June 15, 2028 (1) | | | 325 | | | | — | |
4.50% due January 15, 2030 (1) | | | 585 | | | | — | |
7.875% due September 30, 2031 | | | 675 | | | | 675 | |
7.95% due April 15, 2032 | | | 366 | | | | 366 | |
5.60% due July 15, 2041 | | | 1,250 | | | | 1,250 | |
4.75% due May 15, 2042 | | | 750 | | | | 750 | |
5.00% due June 15, 2045 | | | 750 | | | | 750 | |
Net premium (discount) on debentures and notes | | | 226 | | | | (20 | ) |
Debt issuance costs | | | (31 | ) | | | (31 | ) |
Total debt | | $ | 7,268 | | | $ | 4,298 | |
Less amount classified as short-term debt | | | 226 | | | | — | |
Total long-term debt | | $ | 7,042 | | | $ | 4,298 | |
| (1) | These instruments were assumed by Devon in January 2021 in conjunction with the Merger. These instruments are the unsecured and unsubordinated obligation of WPX, a wholly-owned subsidiary of Devon. |
The following schedule includes the summary of the WPX debt Devon assumed upon closing of the Merger on January 7, 2021.
| | Face Value | | | Fair Value | | | Optional Redemption(1) |
6.00% due January 15, 2022 | | $ | 43 | | | $ | 44 | | | |
8.25% due August 1, 2023 | | | 242 | | | | 281 | | | June 1, 2023 |
5.25% due September 15, 2024 | | | 472 | | | | 530 | | | June 15, 2024 |
5.75% due June 1, 2026 | | | 500 | | | | 529 | | | June 1, 2021 |
5.25% due October 15, 2027 | | | 600 | | | | 646 | | | October 15, 2022 |
5.875% due June 15, 2028 | | | 500 | | | | 554 | | | June 15, 2023 |
4.50% due January 15, 2030 | | | 900 | | | | 978 | | | January 15, 2025 |
| | $ | 3,257 | | | $ | 3,562 | | | |
| (1) | At any time prior to these dates, Devon has the option to redeem some or all of the notes at a specified "make whole" premium as described in the indenture documents governing the notes to be redeemed. On or after these dates, Devon has the option to redeem the notes, in whole or in part, at the applicable redemption prices set forth in the indenture documents, plus accrued and unpaid interest thereon to the redemption date as more fully described in such documents. |
Credit Lines
Devon has a $3.0 billion Senior Credit Facility. As of March 31, 2021, Devon had 0 outstanding borrowings under the Senior Credit Facility and had issued $2 million in outstanding letters of credit under this facility. The Senior Credit Facility contains only one material financial covenant. This covenant requires Devon’s ratio of total funded debt to total capitalization, as defined in the credit agreement, to be no greater than 65%. Under the terms of the credit agreement, total capitalization is adjusted to add back non-
21
Table of Contents
DEVON ENERGY CORPORATION AND SUBSIDIARIES
NOTES TO CONSOLIDATED FINANCIAL STATEMENTS – (Continued)
(Unaudited)
cash financial write-downs such as impairments. As of March 31, 2021, Devon was in compliance with this covenant with a debt-to-capitalization ratio of 27.4%.
Retirement of Senior Notes
In first quarter of 2021, Devon redeemed $43 million of the 6.00% senior notes due 2022, $175 million of the 5.875% senior notes due 2028 and $315 million of the 4.50% senior notes due 2030. In the first quarter of 2021, Devon recognized a $20 million gain on early retirement of debt, consisting of $47 million of non-cash premium accelerations partially offset by $27 million of cash retirement costs. The gain on early retirement is included in net financing costs in the consolidated comprehensive statements of earnings. Devon also redeemed $210 million of the 5.25% senior notes due 2027 in April 2021. In May 2021, Devon gave notice to exercise its early redemption to fully retire the 5.75% senior notes due 2026 in June 2021.
Net Financing Costs
The following schedule includes the components of net financing costs.
| | Three Months Ended March 31, | |
| | 2021 | | | 2020 | |
Interest based on debt outstanding | | $ | 105 | | | $ | 65 | |
Gain on early retirement of debt | | | (20 | ) | | | — | |
Interest income | | | (1 | ) | | | (5 | ) |
Other | | | (7 | ) | | | 5 | |
Total net financing costs | | $ | 77 | | | $ | 65 | |
14.Leases
The following table presents Devon’s right-of-use assets and lease liabilities as of March 31, 2021 and December 31, 2020.
| | March 31, 2021 | | | December 31, 2020 | |
| | Finance | | | Operating | | | Total | | | Finance | | | Operating | | | Total | |
Right-of-use assets | | $ | 217 | | | $ | 38 | | | $ | 255 | | | $ | 220 | | | $ | 3 | | | $ | 223 | |
Lease liabilities: | | | | | | | | | | | | | | | | | | | | | | | | |
Current lease liabilities (1) | | $ | 8 | | | $ | 23 | | | $ | 31 | | | $ | 8 | | | $ | 1 | | | $ | 9 | |
Long-term lease liabilities | | | 244 | | | | 16 | | | | 260 | | | | 244 | | | | 2 | | | | 246 | |
Total lease liabilities | | $ | 252 | | | $ | 39 | | | $ | 291 | | | $ | 252 | | | $ | 3 | | | $ | 255 | |
(1)Current lease liabilities are included in other current liabilities on the consolidated balance sheets.
Devon’s right-of-use operating lease assets are for certain leases related to real estate, drilling rigs and other equipment related to the exploration, development and production of oil and gas. Devon’s right-of-use financing lease assets are related to real estate.
15. | Asset Retirement Obligations |
The following table presents the changes in Devon’s asset retirement obligations.
| | Three Months Ended March 31, | |
| | 2021 | | | 2020 | |
Asset retirement obligations as of beginning of period | | $ | 369 | | | $ | 398 | |
Assumed WPX obligations | | | 98 | | | | — | |
Liabilities incurred | | | 9 | | | | 6 | |
Liabilities settled and divested | | | (17 | ) | | | (13 | ) |
Revision of estimated obligation | | | 11 | | | | 4 | |
Accretion expense on discounted obligation | | | 7 | | | | 5 | |
Asset retirement obligations as of end of period | | | 477 | | | | 400 | |
Less current portion | | | 22 | | | | 14 | |
Asset retirement obligations, long-term | | $ | 455 | | | $ | 386 | |
22
Table of Contents
DEVON ENERGY CORPORATION AND SUBSIDIARIES
NOTES TO CONSOLIDATED FINANCIAL STATEMENTS – (Continued)
(Unaudited)
16. | Other Long-Term Liabilities |
Components of other long-term liabilities include the following:
| | March 31, 2021 | | | December 31, 2020 | |
Assumed gathering, processing and transportation contracts | | $ | 482 | | | $ | — | |
Pension and post retirement benefit obligations | | | 225 | | | | 243 | |
Restructuring and transaction costs | | | 130 | | | | 137 | |
Estimated future obligation under a performance guarantee | | | 128 | | | | — | |
Commodity derivatives | | | 122 | | | | 5 | |
Other | | | 182 | | | | 166 | |
Total other long-term liabilities | | $ | 1,269 | | | $ | 551 | |
Devon assumed fixed gathering, processing and transportation contracts in the Merger and recognized a liability related to the difference in the contractual and market rates of these contracts as of the date of the Merger. The terms of the contracts extend through 2038 and all relate to the Delaware Basin. This difference will be recognized as a reduction to production expenses as the associated reserves are produced over the life of the respective contracts. In the first quarter of 2021, Devon recognized $8 million of non-cash amortization of these liabilities as a reduction of production expenses in the consolidated statement of comprehensive earnings.
Additionally, in the Merger, Devon assumed a future obligation under a performance guarantee related to gathering and processing commitments for assets WPX sold in 2018 in which the purchaser of those assets is now not expected to have the financial ability to satisfy the obligations. As of March 31, 2021, Devon has recorded a $164 million liability for the estimated potential exposure based on probability-weighted cash flows for the remainder of the contract term of five years. Of the $164 million, $128 million is included in other long-term liabilities and $36 million is included in other current liabilities on the consolidated balance sheets as of March 31, 2021.
WPX Merger
On January 7, 2021, Devon and WPX completed an all-stock merger of equals. On the closing date of the Merger, each share of WPX common stock was automatically converted into the right to receive 0.5165 of a share of Devon common stock. Consequently, Devon issued approximately 290 million shares of Devon common stock to holders of WPX common stock to effect the Merger on January 7, 2021.
Share Repurchases
The table below provides information regarding purchases of Devon’s common stock that were made in 2020 under a share repurchase program that expired at the end of 2020 (shares in thousands).
| | Total Number of Shares Purchased | | | Dollar Value of Shares Purchased | | | Average Price Paid per Share | |
| | | | | | | | | | | | |
First quarter 2020 | | | 2,243 | | | $ | 38 | | | $ | 16.85 | |
Total | | | 2,243 | | | $ | 38 | | | $ | 16.85 | |
23
Table of Contents
DEVON ENERGY CORPORATION AND SUBSIDIARIES
NOTES TO CONSOLIDATED FINANCIAL STATEMENTS – (Continued)
(Unaudited)
Dividends
Upon completion of the Merger, Devon continued its commitment to pay a quarterly dividend at a fixed rate and instituted a variable quarterly dividend, which is dependent on quarterly cash flows, among other factors. The following table summarizes Devon’s fixed and variable dividends for the first quarter of 2021 and 2020, respectively.
| Amounts | | | Rate Per Share | |
2021: | | | | | | | |
Fixed | $ | 76 | | | $ | 0.11 | |
Variable | | 127 | | | | 0.19 | |
Total | $ | 203 | | | $ | 0.30 | |
2020: | | | | | | | |
Fixed | $ | 34 | | | $ | 0.09 | |
In May 2021, Devon announced a cash dividend in the amount of $0.34 per share payable in the second quarter of 2021. The dividend consists of a fixed quarterly dividend in the amount of approximately $74 million (or $0.11 per share) and a variable quarterly dividend in the amount of approximately $155 million (or $0.23 per share).
Noncontrolling Interests
The noncontrolling interests’ share of CDM’s net earnings and the contributions from and distributions to the noncontrolling interests are presented as components of equity.
18. | Discontinued Operations |
On October 1, 2020, Devon completed the sale of its Barnett Shale assets to BKV for proceeds, net of purchase price adjustments, of $490 million. Additionally, the agreement provides for contingent earnout payments to Devon of up to $260 million based upon future commodity prices, with upside participation beginning at a $2.75 Henry Hub natural gas price or a $50 WTI oil price. The contingent payment period commenced on January 1, 2021 and has a term of four years. The valuation of the future contingent earnout payments included within other current assets in the March 31, 2021 balance sheet was $66 million. The value was derived utilizing a Monte Carlo valuation model and qualifies as a level 3 fair value measurement.
The following table presents the amounts reported in the consolidated statements of comprehensive earnings as discontinued operations.
| | Three Months Ended March 31, 2020 | |
Oil, gas and NGL sales | | $ | 92 | |
Total revenues | | | 92 | |
Production expenses | | | 74 | |
Asset impairments (1) | | | 179 | |
General and administrative expenses | | | 1 | |
Financing costs, net | | | (2 | ) |
Other, net | | | (3 | ) |
Total expenses | | | 249 | |
Loss from discontinued operations before income taxes | | | (157 | ) |
Income tax benefit | | | (32 | ) |
Net loss from discontinued operations, net of tax | | $ | (125 | ) |
| (1) | Devon recognized an $179 million asset impairment in the first quarter of 2020 related to the Barnett Shale assets primarily due to the difference between the net carrying value and the purchase price, net of estimated customary purchase price adjustments, which qualified as a level 2 fair value measurement. |
24
Table of Contents
DEVON ENERGY CORPORATION AND SUBSIDIARIES
NOTES TO CONSOLIDATED FINANCIAL STATEMENTS – (Continued)
(Unaudited)
19. | Commitments and Contingencies |
Devon is party to various legal proceedings and other matters that may result in future payment obligations or other adverse consequences to its business. Matters that are probable of an unfavorable outcome to Devon and which any related potential payment obligation or other liability can be reasonably estimated are accrued. Such accruals are based on information known about the matters, Devon’s estimates of the outcomes of such matters and its experience in contesting, litigating and settling similar matters. While management does not believe any current matter is likely to involve future amounts that would be material to Devon’s financial position or results of operations after consideration of recorded accruals, the ultimate outcome of such matters and the amounts involved could differ materially from management’s estimates.
Royalty Matters
Numerous oil and natural gas producers and related parties, including Devon, have been named in various lawsuits alleging royalty underpayments. Devon is currently defending against a number of such lawsuits, either as a named defendant in the action or pursuant to indemnity obligations for the benefit of a third party. Plaintiffs in some of these lawsuits are seeking class certification. Among the allegations typically asserted in these suits are claims that Devon used below-market prices, made improper deductions, failed to “enhance” the value of gas through processing, used improper measurement techniques, entered into purchase and midstream arrangements with affiliates that resulted in underpayment of royalties or otherwise failed to prudently market oil, natural gas and NGLs produced and sold and pay royalties on the highest obtainable price. Devon is also involved in governmental agency proceedings and royalty audits and is subject to related contracts and regulatory controls in the ordinary course of business, some that may lead to additional royalty claims. Devon does not currently believe that it is subject to material exposure with respect to such royalty matters.
Environmental and Climate Change Matters
Devon’s business is subject to numerous federal, state, local, Native American tribal and foreign laws and regulations governing the discharge of materials into the environment or otherwise relating to environmental protection. Failure to comply with these laws and regulations may result in the assessment of administrative, civil and criminal fines and penalties, as well as remediation costs. Although Devon believes that it is in substantial compliance with applicable environmental laws and regulations and that continued compliance with existing requirements will not have a material adverse impact on its business, there can be no assurance that this will continue in the future.
Beginning in 2013, various parishes in Louisiana filed suit against numerous oil and gas companies, including Devon, alleging that the companies’ operations and activities in certain fields violated the State and Local Coastal Resource Management Act of 1978, as amended, and caused substantial environmental contamination, subsidence and other environmental damages to land and water bodies located in the coastal zone of Louisiana. The plaintiffs’ claims against Devon relate primarily to the operations of several of Devon’s corporate predecessors. The plaintiffs seek, among other things, the payment of the costs necessary to clear, re-vegetate and otherwise restore the allegedly impacted areas. Although Devon cannot predict the ultimate outcome of these matters, Devon believes these claims to be baseless and is vigorously defending against these claims.
The State of Delaware and various municipalities and other governmental and private parties in California have filed legal proceedings against numerous oil and gas companies, including Devon, seeking relief to abate alleged impacts of climate change. These proceedings include far-reaching claims for monetary damages and injunctive relief. Although Devon cannot predict the ultimate outcome of these matters, Devon believes these claims to be baseless and intends to vigorously defend against the proceedings.
Williams’ Former Power Business Matter
Direct and indirect purchasers of natural gas in various states filed individual and class action lawsuits against The Williams Companies, Inc. (“Williams”) and other parties alleging the manipulation of published gas price indices and seeking unspecified amounts of damages. WPX and certain of its subsidiaries, which were then affiliates of Williams, were also named as defendants in these actions. Such actions were transferred to the Nevada federal district court for consolidation of discovery and pre-trial issues. Although certain of the actions were subsequently settled or otherwise resolved, two putative class actions and an individual action remain unresolved.
The putative class actions have been remanded to their originally filed court, the Wisconsin federal district court, and class certification motions are pending. The individual action, Reorganized FLI Inc., has been remanded to its originally filed court, the
25
Table of Contents
DEVON ENERGY CORPORATION AND SUBSIDIARIES
NOTES TO CONSOLIDATED FINANCIAL STATEMENTS – (Continued)
(Unaudited)
Kansas federal district court. The Tenth Circuit granted a petition to reconsider the denial of defendants’ motion for summary judgment, and the decision is pending after oral argument in January 2021.
Because of the uncertainty around pending unresolved issues, including an insufficient description of the purported classes and other related matters, Devon cannot reasonably estimate a range of potential exposure at this time for these matters. In connection with its spin-off from Williams in 2011, WPX entered into a separation and distribution agreement with Williams, pursuant to which Williams agreed to indemnify and hold WPX and its subsidiaries harmless from any losses arising out of these matters.
Other Indemnifications and Legacy Matters
Pursuant to various sale agreements relating to divested businesses and assets, Devon has indemnified various purchasers against liabilities that they may incur with respect to the businesses and assets acquired from Devon. Additionally, federal, state and other laws in areas of former operations may require previous operators (including corporate successors of previous operators) to perform or make payments in certain circumstances where the current operator may no longer be able to satisfy the applicable obligation. Such obligations may include plugging and abandoning wells, removing production facilities or performing requirements under surface agreements in existence at the time of disposition.
In November 2020, the Department of the Interior, Bureau of Safety and Environmental Enforcement, ordered several oil and gas operators, including Devon, to perform decommissioning and reclamation activities related to two California offshore oil and gas production platforms and related facilities. The current operator and owner of the platforms contends that it does not have the financial ability to perform these obligations and relinquished the related federal lease in October 2020. In response to the apparent insolvency of the current operator, the government has ordered the former operators and alleged former lease record title owners to decommission the platforms. The government contends that an alleged corporate predecessor of Devon owned a partial interest in the subject lease and platforms. Although Devon cannot predict the ultimate outcome of this matter, Devon denies any obligation to decommission the subject platforms, has appealed the order, and believes any decommissioning obligation related to the subject platforms should be assumed by others.
20. | Fair Value Measurements |
The following table provides carrying value and fair value measurement information for certain of Devon’s financial assets and liabilities. The carrying values of cash, accounts receivable, other current receivables, accounts payable, other current payables, accrued expenses and lease liabilities included in the accompanying consolidated balance sheets approximated fair value at March 31, 2021 and December 31, 2020, as applicable. Therefore, such financial assets and liabilities are not presented in the following table. Additionally, information regarding the fair values of oil and gas assets is provided in Note 5.
| | | | | | | | | | Fair Value Measurements Using: | |
| | Carrying | | | Total Fair | | | Level 1 | | | Level 2 | | | Level 3 | |
| | Amount | | | Value | | | Inputs | | | Inputs | | | Inputs | |
March 31, 2021 assets (liabilities): | | | | | | | | | | | | | | | | | | | | |
Cash equivalents | | $ | 1,075 | | | $ | 1,075 | | | $ | 1,075 | | | $ | — | | | $ | — | |
Commodity derivatives | | $ | 6 | | | $ | 6 | | | $ | — | | | $ | 6 | | | $ | — | |
Commodity derivatives | | $ | (789 | ) | | $ | (789 | ) | | $ | — | | | $ | (789 | ) | | $ | — | |
Debt | | $ | (7,268 | ) | | $ | (8,091 | ) | | $ | — | | | $ | (8,091 | ) | | $ | — | |
Contingent earnout payments | | $ | 70 | | | $ | 70 | | | $ | — | | | $ | — | | | $ | 70 | |
December 31, 2020 assets (liabilities): | | | | | | | | | | | | | | | | | | | | |
Cash equivalents | | $ | 1,436 | | | $ | 1,436 | | | $ | 1,436 | | | $ | — | | | $ | — | |
Commodity derivatives | | $ | 6 | | | $ | 6 | | | $ | — | | | $ | 6 | | | $ | — | |
Commodity derivatives | | $ | (148 | ) | | $ | (148 | ) | | $ | — | | | $ | (148 | ) | | $ | — | |
Debt | | $ | (4,298 | ) | | $ | (5,365 | ) | | $ | — | | | $ | (5,365 | ) | | $ | — | |
Contingent earnout payments | | $ | 66 | | | $ | 66 | | | $ | — | | | $ | — | | | $ | 66 | |
The following methods and assumptions were used to estimate the fair values in the table above.
Level 1 Fair Value Measurements
Cash equivalents – Amounts consist primarily of money market investments and the fair value approximates the carrying value.
26
Table of Contents
DEVON ENERGY CORPORATION AND SUBSIDIARIES
NOTES TO CONSOLIDATED FINANCIAL STATEMENTS – (Continued)
(Unaudited)
Level 2 Fair Value Measurements
Commodity derivatives – The fair value of commodity derivatives is estimated using internal discounted cash flow calculations based upon forward curves and data obtained from independent third parties for contracts with similar terms or data obtained from counterparties to the agreements.
Debt – Devon’s debt instruments do not consistently trade actively in an established market. The fair values of its debt are estimated based on rates available for debt with similar terms and maturity when active trading is not available.
Level 3 Fair Value Measurements
Contingent Earnout Payments – Devon has the right to receive contingent consideration related to the Barnett and non-core Rockies asset divestitures based on future oil and gas prices. These values were derived using a Monte Carlo valuation model and qualify as a level 3 fair value measurement. For additional information, see Note 2.
27
Table of Contents
Item 2. Management’s Discussion and Analysis of Financial Condition and Results of Operations
The following discussion and analysis addresses material changes in our results of operations for the three-month period ended March 31, 2021 compared to previous periods and in our financial condition and liquidity since December 31, 2020. For information regarding our critical accounting policies and estimates, see our 2020 Annual Report on Form 10-K under “Item 7. Management’s Discussion and Analysis of Financial Condition and Results of Operations.”
COVID – 19
A novel strain of coronavirus, SARS-CoV-2, causing a disease referred to as COVID-19, was reported to have surfaced in China in late 2019 and has subsequently spread to multiple countries worldwide, resulting in a global pandemic and health crisis. Devon began actively monitoring COVID-19 in January 2020 and formally established a COVID-19 cross-functional planning team at the beginning of March 2020. The COVID-19 team has remained focused on two key priorities: the health and safety of our employees and contractors and the uninterrupted operation of our business. For additional information regarding our actions in response to the COVID-19 pandemic, see our 2020 Annual Report on Form 10-K under “Item 2. Management’s Discussion and Analysis of Financial Condition and Results of Operations.”
WPX Merger and Operating Results
On September 26, 2020, we entered into the Merger Agreement, providing for an all-stock merger of equals with WPX which successfully closed on January 7, 2021. The Merger has created a leading unconventional oil producer in the U.S., with an asset base underpinned by premium acreage in the economic core of the Delaware Basin. This strategic combination accelerates our transition to a cash-return business model, including the implementation of a fixed plus variable dividend strategy. We remain focused on building economic value by executing on our strategic priorities of disciplined oil volume growth while capturing operational and corporate synergies, reducing reinvestment rates to maximize free cash flow, maintaining low leverage, delivering cash returns to our shareholders and pursuing ESG excellence. Our recent performance highlights for these priorities include the following items:
| • | Efficiency gains drove first quarter capital expenditures 5% below our plan. |
| • | First quarter oil production totaled 268 MBbls/d, exceeding our plan by 2%. |
| • | On pace to achieve approximately $600 million in annual cost savings by the end of 2021. |
| • | Redeemed approximately $743 million of senior notes in 2021 through early April. |
| • | Exited the first quarter with $4.9 billion of liquidity, including $1.9 billion of cash, with no debt maturities until 2023. |
| • | Including our first variable dividend, paid dividends of $0.30 per share for approximately $203 million in the first quarter. |
Overview of 2021 Results
We operate under a disciplined returns-driven strategy focused on delivering strong operational results, financial strength and value to our shareholders and continuing our commitment to environmental, social and governance excellence, which provides us with a strong foundation to grow returns, margin and profitability. We continue to execute on our strategy and navigate through the challenged economic environment by protecting our financial strength, tailoring our capital investment to market conditions, improving our cash cost structure and preserving operational continuity.
Trends of our quarterly earnings, operating cash flow, EBITDAX and capital expenditures are shown below. The quarterly earnings chart presents amounts pertaining to both Devon’s continuing and discontinuing operations. The quarterly cash flow chart presents amounts pertaining to Devon’s continuing operations. “Core earnings” and “EBITDAX” are financial measures not prepared in accordance with GAAP. For a description of these measures, including reconciliations to the comparable GAAP measures, see “Non-GAAP Measures” in this Item 2.
28
Table of Contents
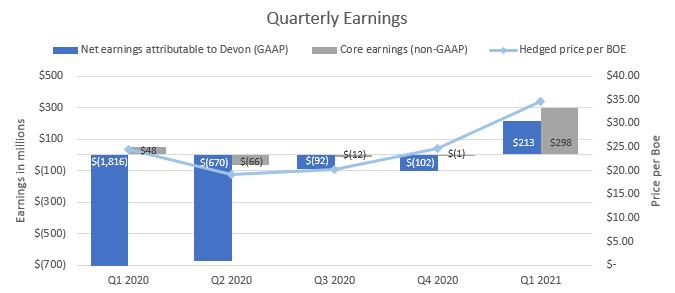
Our net earnings in recent quarters have been significantly impacted by divestiture transactions, asset impairments and temporary, non-cash adjustments to the value of our commodity hedges. Net earnings in the first quarter of 2021, the fourth quarter of 2020, the third quarter of 2020 and the second quarter of 2020 each included a hedge valuation loss, net of tax of $0.2 billion, $0.1 billion, $0.1 billion and $0.5 billion, respectively. Net earnings in the first quarter of 2020 included $2.3 billion of asset impairments on our proved and unproved properties and a $0.5 billion hedge valuation gain, both net of taxes. Excluding these amounts, our core earnings have been more stable over recent quarters but continue to be heavily influenced by commodity prices.
Despite our portfolio enhancements, aggressive cost reductions and operational advancements, our financial results have been challenged by commodity prices and deterioration of the macro-economic environment resulting from the unprecedented COVID-19 pandemic over the past year; however, prices began to recover in the second half of 2020 and have significantly increased in the first quarter of 2021. Our earnings increased from the fourth quarter of 2020 to the first quarter of 2021 due to an increase in overall commodity prices as well as higher volumes resulting from the Merger. Led by a 36% increase in WTI from the fourth quarter of 2020 to the first quarter of 2021, our unhedged combined realized price rose 55%. These increases were partially offset by impacts related to the February 2021 winter storm which reduced first quarter volumes.
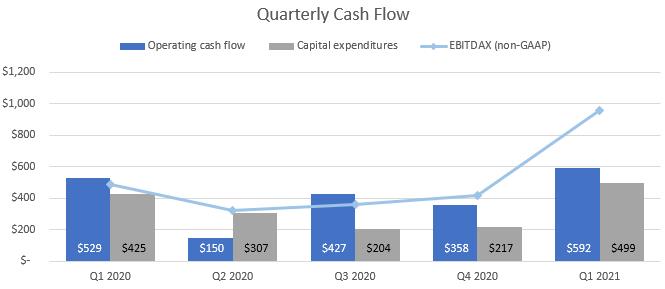
Like earnings, our operating cash flow is sensitive to volatile commodity prices. EBITDAX, which excludes financial amounts related to discontinued operations, and operating cash flows have been impacted by the COVID-19 pandemic and its impact on commodity prices. Our cash flow increased during the first quarter of 2021 primarily due to higher commodity prices and the positive effects of the Merger.
We exited the first quarter of 2021 with $4.9 billion of liquidity, comprised of $1.9 billion of cash and $3.0 billion of available credit under our Senior Credit Facility. We currently have $7.0 billion of debt outstanding with no maturities until the latter half of
29
Table of Contents
2023. We currently have approximately 50% and 60% of our 2021 oil and gas production hedged, respectively. These contracts consist of collars and swaps based off the WTI oil benchmark and the Henry Hub and NYMEX last day natural gas indices. Additionally, we have entered into regional basis swaps in an effort to protect price realizations across our portfolio.
Results of Operations
The following graphs, discussion and analysis are intended to provide an understanding of our results of operations and current financial condition. To facilitate the review, these numbers are being presented before consideration of earnings attributable to noncontrolling interests.
Q1 2021 vs. Q4 2020
Our first quarter 2021 net earnings were $216 million, compared to a net loss of $73 million for the fourth quarter of 2020. The graph below shows the change in the net earnings (loss) from the fourth quarter of 2020 to the first quarter of 2021. The material changes are further discussed by category on the following pages.
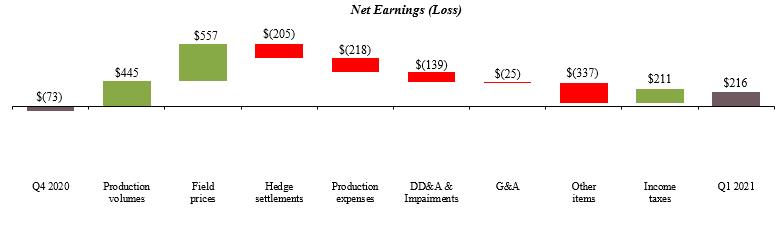
30
Table of Contents
Production Volumes
| | Q1 2021 | | | % of Total | | | Q4 2020 | | | Change | |
Oil (MBbls/d) | | | | | | | | | | | | | | | | |
Delaware Basin | | | 172 | | | | 64 | % | | | 99 | | | | +73 | % |
Anadarko Basin | | | 13 | | | | 5 | % | | | 16 | | | | - 22 | % |
Williston Basin | | | 44 | | | | 17 | % | | | — | | | N/M | |
Eagle Ford | | | 16 | | | | 6 | % | | | 18 | | | | - 10 | % |
Powder River Basin | | | 17 | | | | 6 | % | | | 16 | | | | +6 | % |
Other | | | 6 | | | | 2 | % | | | 7 | | | | - 15 | % |
Total | | | 268 | | | | 100 | % | | | 156 | | | | +71 | % |
| | Q1 2021 | | | % of Total | | | Q4 2020 | | | Change | |
Gas (MMcf/d) | | | | | | | | | | | | | | | | |
Delaware Basin | | | 471 | | | | 60 | % | | | 267 | | | | +77 | % |
Anadarko Basin | | | 200 | | | | 25 | % | | | 233 | | | | - 14 | % |
Williston Basin | | | 49 | | | | 6 | % | | | — | | | N/M | |
Eagle Ford | | | 47 | | | | 6 | % | | | 60 | | | | - 21 | % |
Powder River Basin | | | 21 | | | | 3 | % | | | 22 | | | | - 4 | % |
Other | | | 3 | | | | 0 | % | | | 2 | | | | +37 | % |
Total | | | 791 | | | | 100 | % | | | 584 | | | | +35 | % |
| | Q1 2021 | | | % of Total | | | Q4 2020 | | | Change | |
NGLs (MBbls/d) | | | | | | | | | | | | | | | | |
Delaware Basin | | | 60 | | | | 61 | % | | | 43 | | | | +41 | % |
Anadarko Basin | | | 21 | | | | 21 | % | | | 25 | | | | - 16 | % |
Williston Basin | | | 8 | | | | 8 | % | | | — | | | N/M | |
Eagle Ford | | | 6 | | | | 6 | % | | | 9 | | | | - 31 | % |
Powder River Basin | | | 3 | | | | 3 | % | | | 3 | | | | +6 | % |
Other | | | 1 | | | | 1 | % | | | — | | | N/M | |
Total | | | 99 | | | | 100 | % | | | 80 | | | | +24 | % |
| | Q1 2021 | | | % of Total | | | Q4 2020 | | | Change | |
Combined (MBoe/d) | | | | | | | | | | | | | | | | |
Delaware Basin | | | 310 | | | | 62 | % | | | 186 | | | | +67 | % |
Anadarko Basin | | | 68 | | | | 14 | % | | | 81 | | | | - 16 | % |
Williston Basin | | | 61 | | | | 12 | % | | | — | | | N/M | |
Eagle Ford | | | 30 | | | | 6 | % | | | 37 | | | | - 18 | % |
Powder River Basin | | | 23 | | | | 5 | % | | | 22 | | | | +4 | % |
Other | | | 7 | | | | 1 | % | | | 7 | | | | -4 | % |
Total | | | 499 | | | | 100 | % | | | 333 | | | | +50 | % |
From the fourth quarter of 2020 to the first quarter of 2021, the change in volumes contributed to a $445 million increase in earnings. Due to the Merger closing on January 7, 2021, volumes now include WPX legacy assets in the Delaware Basin in Texas and New Mexico and the Williston Basin in North Dakota. Volumes associated with these WPX legacy assets were approximately 200 MBoe/d in the first quarter of 2021. The increase in volumes associated with the Merger were partially offset by impacts of the February 2021 winter storm. Volumes in the second quarter are expected to range from approximately 538 to 561 MBoe/d.
Field Prices
| | Q1 2021 | | | Realization | | | Q4 2020 | | | Change | |
Oil (per Bbl) | | | | | | | | | | | | | | | | |
WTI index | | $ | 57.87 | | | | | | | $ | 42.65 | | | | +36 | % |
Realized price, unhedged | | $ | 56.36 | | | 97% | | | $ | 39.84 | | | | +41 | % |
Cash settlements | | $ | (9.13 | ) | | | | | | $ | (1.83 | ) | | | | |
Realized price, with hedges | | $ | 47.23 | | | 82% | | | $ | 38.01 | | | | +24 | % |
| | Q1 2021 | | | Realization | | | Q4 2020 | | | Change | |
Gas (per Mcf) | | | | | | | | | | | | | | | | |
Henry Hub index | | $ | 2.71 | | | | | | | $ | 2.67 | | | | +1 | % |
Realized price, unhedged | | $ | 2.91 | | | 107% | | | $ | 1.96 | | | | +48 | % |
Cash settlements | | $ | (0.15 | ) | | | | | | $ | — | | | | | |
Realized price, with hedges | | $ | 2.76 | | | 102% | | | $ | 1.96 | | | | +41 | % |
| | Q1 2021 | | | Realization | | | Q4 2020 | | | Change | |
NGLs (per Bbl) | | | | | | | | | | | | | | | | |
Mont Belvieu blended index (1) | | $ | 25.81 | | | | | | | $ | 20.01 | | | | +29 | % |
Realized price, unhedged | | $ | 25.01 | | | 97% | | | $ | 14.77 | | | | +69 | % |
Cash settlements | | $ | (0.20 | ) | | | | | | $ | (0.01 | ) | | | | |
Realized price, with hedges | | $ | 24.81 | | | 96% | | | $ | 14.76 | | | | +68 | % |
(1)Based upon composition of our NGL barrel.
| | Q1 2021 | | | Q4 2020 | | | Change | |
Combined (per Boe) | | | | | | | | | | | | |
Realized price, unhedged | | $ | 39.84 | | | $ | 25.63 | | | | +55 | % |
Cash settlements | | $ | (5.17 | ) | | $ | (0.86 | ) | | | | |
Realized price, with hedges | | $ | 34.67 | | | $ | 24.77 | | | | +40 | % |
From the fourth quarter of 2020 to the first quarter of 2021, field prices contributed to a $557 million increase in earnings. Unhedged realized oil, gas and NGL prices increased primarily due to higher WTI, Henry Hub and Mont Belvieu index prices. The increase in index prices was partially offset by a decrease in hedge cash settlements related to all products.
We currently have approximately 50% of our 2021 oil production hedged with an average floor price of $40/Bbl and approximately 60% of our 2021 gas production hedged with an average floor price of $2.56/Mcf. We are continuing to build our 2021 and 2022 hedge positions at market prices.
Hedge Settlements
| | Q1 2021 | | | Q4 2020 | | | Change | |
| | Q | | | | | | | | | |
Oil | | $ | (220 | ) | | $ | (27 | ) | | | - 715 | % |
Natural gas | | | (10 | ) | | | — | | | N/M | |
NGL | | | (2 | ) | | | — | | | N/M | |
Total cash settlements (1) | | $ | (232 | ) | | $ | (27 | ) | | | - 759 | % |
| (1) | Included as a component of oil, gas and NGL derivatives on the consolidated statements of comprehensive earnings. |
Cash settlements as presented in the tables above represent realized gains or losses related to the instruments described in Note 3 in “Part I. Financial Information – Item 1. Financial Statements” in this report.
31
Table of Contents
Production Expenses
| | Q1 2021 | | | Q4 2020 | | | Change | |
LOE | | $ | 199 | | | $ | 91 | | | | +119 | % |
Gathering, processing & transportation | | | 160 | | | | 130 | | | | +23 | % |
Production taxes | | | 117 | | | | 47 | | | | +149 | % |
Property taxes | | | 13 | | | | 3 | | | | +333 | % |
Total | | $ | 489 | | | $ | 271 | | | | +80 | % |
Per Boe: | | | | | | | | | | | | |
LOE | | $ | 4.44 | | | $ | 2.97 | | | | +49 | % |
Gathering, processing & transportation | | $ | 3.57 | | | $ | 4.23 | | | | - 16 | % |
Percent of oil, gas and NGL sales: | | | | | | | | | | | | |
Production taxes | | | 6.5 | % | | | 6.1 | % | | | +8 | % |
Production expenses increased from the fourth quarter of 2020 to the first quarter of 2021 primarily due to the Merger closing on January 7, 2021. Partially offsetting increases to gathering, processing and transportation costs were approximately $20 million of Anadarko volume commitments which expired at the end of 2020. LOE per Boe increased due to a different post-Merger asset mix as well as impacts from the February 2021 winter storm. Production taxes also increased due to the rise in commodity prices.
Field-Level Cash Margin
The table below presents the field-level cash margin for each of our operating areas. Field-level cash margin is computed as oil, gas and NGL sales less production expenses and is not prepared in accordance with GAAP. A reconciliation to the comparable GAAP measures is found in “Non-GAAP Measures” in this Item 2. The changes in production volumes, field prices and production expenses, shown above, had the following impact on our field-level cash margins by asset.
| | Q1 2021 | | | $ per BOE | | | Q4 2020 | | | $ per BOE | |
Field-level cash margin (non-GAAP) | | | | | | | | | | | | | | | | |
Delaware Basin | | $ | 895 | | | $ | 32.07 | | | $ | 344 | | | $ | 20.08 | |
Anadarko Basin | | | 85 | | | $ | 14.01 | | | | 61 | | | $ | 8.28 | |
Williston Basin | | | 161 | | | $ | 29.70 | | | | — | | | N/M | |
Eagle Ford | | | 72 | | | $ | 26.57 | | | | 58 | | | $ | 17.13 | |
Powder River Basin | | | 67 | | | $ | 31.99 | | | | 38 | | | $ | 18.69 | |
Other | | | 19 | | | $ | 28.21 | | | | 13 | | | $ | 18.35 | |
Total | | $ | 1,299 | | | $ | 28.95 | | | $ | 514 | | | $ | 16.77 | |
DD&A and Asset Impairments
| | Q1 2021 | | | Q4 2020 | | | Change | | |
Oil and gas per Boe | | $ | 9.78 | | | $ | 9.04 | | | | +8 | % | |
| | | | | | | | | | | | | |
Oil and gas | | $ | 439 | | | $ | 278 | | | | +58 | % | |
Other property and equipment | | | 28 | | | | 23 | | | | +20 | % | |
Total | | $ | 467 | | | $ | 301 | | | | +55 | % | |
| | | | | | | | | | | | | |
Asset impairments | | $ | — | | | $ | 27 | | | N/M | | |
DD&A increased in the first quarter of 2021 primarily due to the Merger closing on January 7, 2021. For additional information, see Note 2 in “Part I. Financial Information – Item 1. Financial Statements” in this report.
General and Administrative Expense
| | Q1 2021 | | | Q4 2020 | | | Change | |
G&A per Boe | | $ | 2.40 | | | $ | 2.65 | | | | - 10 | % |
| | | | | | | | | | | | |
Labor and benefits | | $ | 72 | | | $ | 49 | | | | +47 | % |
Non-labor | | | 35 | | | | 33 | | | | +6 | % |
Total | | $ | 107 | | | $ | 82 | | | | +30 | % |
Labor and benefits increased primarily due to the Merger closing on January 7, 2021. However, Devon’s G&A per Boe rate decreased nearly 10% due to synergies created by the Merger.
Other Items
| | Q1 2021 | | | Q4 2020 | | | Change in earnings | |
Commodity hedge valuation changes (1) | | $ | (296 | ) | | $ | (90 | ) | | $ | (206 | ) |
Marketing and midstream operations | | | (21 | ) | | | (7 | ) | | | (14 | ) |
Exploration expenses | | | 3 | | | | 4 | | | | 1 | |
Asset dispositions | | | (32 | ) | | | (1 | ) | | | 31 | |
Net financing costs | | | 77 | | | | 70 | | | | (7 | ) |
Restructuring and transaction costs | | | 189 | | | | 17 | | | | (172 | ) |
Other, net | | | (29 | ) | | | 1 | | | | 30 | |
| | | | | | | | | | $ | (337 | ) |
| (1) | Included as a component of oil, gas and NGL derivatives on the consolidated statements of comprehensive earnings. |
We recognize fair value changes on our oil, gas and NGL derivative instruments in each reporting period. The changes in fair value resulted from new positions and settlements that occurred during each period, as well as the relationship between contract prices and the associated forward curves. For additional information, see Note 3 in “Part I. Financial Information – Item 1. Financial Statements” in this report.
Net financing costs increased as a result of WPX debt assumed in the Merger, partially offset by a $20 million gain associated with our debt retirements in the first quarter of 2021. For additional information, see Note 13 in “Part I. Financial Information – Item 1. Financial Statements” in this report.
Restructuring and transaction costs reflect workforce reductions in conjunction with the Merger, as well as various transaction costs related to the Merger. For additional information, see Note 6 in “Part I. Financial Information – Item 1. Financial Statements” in this report.
32
Table of Contents
Income Taxes
| | Q1 2021 | | | Q4 2020 | |
Current benefit | | $ | (5 | ) | | $ | (20 | ) |
Deferred benefit | | | (243 | ) | | | (17 | ) |
Total benefit | | $ | (248 | ) | | $ | (37 | ) |
Effective income tax rate | | | 763 | % | | | 33 | % |
For discussion on income taxes, see Note 7 in “Part I. Financial Information – Item 1. Financial Statements” in this report.
33
Table of Contents
Q1 2021 vs. Q1 2020
Our first quarter 2021 net earnings was $216 million, compared to a net loss of $1.7 billion for the first quarter of 2020. The graph below shows the change in the net earnings (loss) from the first quarter of 2020 to the first quarter of 2021. The material changes are further discussed by category on the following pages.
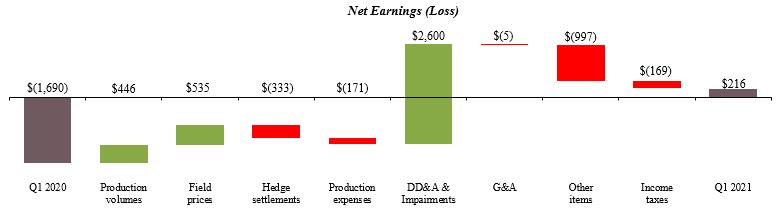
34
Table of Contents
Production Volumes
| | Q1 2021 | | | % of Total | | | Q1 2020 | | | Change | |
Oil (MBbls/d) | | | | | | | | | | | | | | | | |
Delaware Basin | | | 172 | | | | 64 | % | | | 84 | | | | +105 | % |
Anadarko Basin | | | 13 | | | | 5 | % | | | 24 | | | | - 45 | % |
Williston Basin | | | 44 | | | | 17 | % | | | — | | | N/M | |
Eagle Ford | | | 16 | | | | 6 | % | | | 26 | | | | - 39 | % |
Powder River Basin | | | 17 | | | | 6 | % | | | 21 | | | | - 22 | % |
Other | | | 6 | | | | 2 | % | | | 8 | | | | - 27 | % |
Total | | | 268 | | | | 100 | % | | | 163 | | | | +64 | % |
| | Q1 2021 | | | % of Total | | | Q1 2020 | | | Change | |
Gas (MMcf/d) | | | | | | | | | | | | | | | | |
Delaware Basin | | | 471 | | | | 60 | % | | | 244 | | | | +93 | % |
Anadarko Basin | | | 200 | | | | 25 | % | | | 272 | | | | - 26 | % |
Williston Basin | | | 49 | | | | 6 | % | | | — | | | N/M | |
Eagle Ford | | | 47 | | | | 6 | % | | | 86 | | | | - 45 | % |
Powder River Basin | | | 21 | | | | 3 | % | | | 29 | | | | - 27 | % |
Other | | | 3 | | | | 0 | % | | | 3 | | | | - 26 | % |
Total | | | 791 | | | | 100 | % | | | 634 | | | | +25 | % |
| | Q1 2021 | | | % of Total | | | Q1 2020 | | | Change | |
NGLs (MBbls/d) | | | | | | | | | | | | | | | | |
Delaware Basin | | | 60 | | | | 61 | % | | | 37 | | | | +61 | % |
Anadarko Basin | | | 21 | | | | 21 | % | | | 30 | | | | - 28 | % |
Williston Basin | | | 8 | | | | 8 | % | | | — | | | N/M | |
Eagle Ford | | | 6 | | | | 6 | % | | | 9 | | | | - 30 | % |
Powder River Basin | | | 3 | | | | 3 | % | | | 3 | | | | +1 | % |
Other | | | 1 | | | | 1 | % | | | 1 | | | | - 8 | % |
Total | | | 99 | | | | 100 | % | | | 80 | | | | +24 | % |
| | Q1 2021 | | | % of Total | | | Q1 2020 | | | Change | |
Combined (MBoe/d) | | | | | | | | | | | | | | | | |
Delaware Basin | | | 310 | | | | 62 | % | | | 162 | | | | +92 | % |
Anadarko Basin | | | 68 | | | | 14 | % | | | 98 | | | | - 31 | % |
Williston Basin | | | 61 | | | | 12 | % | | | — | | | N/M | |
Eagle Ford | | | 30 | | | | 6 | % | | | 50 | | | | - 39 | % |
Powder River Basin | | | 23 | | | | 5 | % | | | 29 | | | | - 20 | % |
Other | | | 7 | | | | 1 | % | | | 9 | | | | - 17 | % |
Total | | | 499 | | | | 100 | % | | | 348 | | | | +43 | % |
From the first quarter of 2020 to the first quarter of 2021, the change in volumes contributed to a $446 million increase in earnings. Due to the Merger closing on January 7, 2021, volumes now include WPX legacy assets in the Delaware Basin in Texas and New Mexico and the Williston Basin in North Dakota. Volumes associated with these WPX legacy assets were approximately 200 MBoe/d in the first quarter of 2021. Continued development of Devon legacy assets in the Delaware Basin also increased volumes. These increases were partially offset by impacts of the February 2021 winter storm and reduced activity across Devon’s remaining assets.
Field Prices
| | Q1 2021 | | | Realization | | | Q1 2020 | | | Change | |
Oil (per Bbl) | | | | | | | | | | | | | | | | |
WTI index | | $ | 57.87 | | | | | | | $ | 46.44 | | | | +25 | % |
Realized price, unhedged | | $ | 56.36 | | | 97% | | | $ | 44.59 | | | | +26 | % |
Cash settlements | | $ | (9.13 | ) | | | | | | $ | 5.14 | | | | | |
Realized price, with hedges | | $ | 47.23 | | | 82% | | | $ | 49.73 | | | | - 5 | % |
| | Q1 2021 | | | Realization | | | Q1 2020 | | | Change | |
Gas (per Mcf) | | | | | | | | | | | | | | | | |
Henry Hub index | | $ | 2.71 | | | | | | | $ | 1.95 | | | | +39 | % |
Realized price, unhedged | | $ | 2.91 | | | 107% | | | $ | 1.21 | | | | +141 | % |
Cash settlements | | $ | (0.15 | ) | | | | | | $ | 0.36 | | | | | |
Realized price, with hedges | | $ | 2.76 | | | 102% | | | $ | 1.57 | | | | +76 | % |
| | Q1 2021 | | | Realization | | | Q1 2020 | | | Change | |
NGLs (per Bbl) | | | | | | | | | | | | | | | | |
Mont Belvieu blended index (1) | | $ | 25.81 | | | | | | | $ | 14.39 | | | | +79 | % |
Realized price, unhedged | | $ | 25.01 | | | 97% | | | $ | 10.40 | | | | +140 | % |
Cash settlements | | $ | (0.20 | ) | | | | | | $ | 0.61 | | | | | |
Realized price, with hedges | | $ | 24.81 | | | 96% | | | $ | 11.01 | | | | +125 | % |
| (1) | Based upon composition of our NGL barrel. |
| | Q1 2021 | | | Q1 2020 | | | Change | |
Combined (per Boe) | | | | | | | | | | | | |
Realized price, unhedged | | $ | 39.84 | | | $ | 25.43 | | | | +57 | % |
Cash settlements | | $ | (5.17 | ) | | $ | 3.20 | | | | | |
Realized price, with hedges | | $ | 34.67 | | | $ | 28.63 | | | | +21 | % |
From the first quarter of 2020 to the first quarter of 2021, field prices contributed to a $535 million increase in earnings. Unhedged realized oil, gas and NGL prices increased primarily due to higher WTI, Henry Hub and Mont Belvieu index prices. The increase in index prices was partially offset by a decrease in hedge cash settlements related to all products.
Hedge Settlements
| | Q1 2021 | | | Q1 2020 | | | Change | |
| | Q | | | | | | | | | |
Oil | | $ | (220 | ) | | $ | 76 | | | | - 389 | % |
Natural gas | | | (10 | ) | | | 21 | | | | - 148 | % |
NGL | | | (2 | ) | | | 4 | | | | - 150 | % |
Total cash settlements (1) | | $ | (232 | ) | | $ | 101 | | | | - 330 | % |
| (1) | Included as a component of oil, gas and NGL derivatives on the consolidated statements of comprehensive earnings. |
Cash settlements as presented in the tables above represent realized gains or losses related to the instruments described in Note 3 in “Part I. Financial Information – Item 1. Financial Statements” in this report.
35
Table of Contents
Production Expenses
| | Q1 2021 | | | Q1 2020 | | | Change | |
LOE | | $ | 199 | | | $ | 126 | | | | +58 | % |
Gathering, processing & transportation | | | 160 | | | | 130 | | | | +23 | % |
Production taxes | | | 117 | | | | 56 | | | | +109 | % |
Property taxes | | | 13 | | | | 6 | | | | +117 | % |
Total | | $ | 489 | | | $ | 318 | | | | +54 | % |
Per Boe: | | | | | | | | | | | | |
LOE | | $ | 4.44 | | | $ | 3.96 | | | | +12 | % |
Gathering, processing & transportation | | $ | 3.57 | | | $ | 4.11 | | | | - 13 | % |
Percent of oil, gas and NGL sales: | | | | | | | | | | | | |
Production taxes | | | 6.5 | % | | | 6.9 | % | | | - 5 | % |
Production expenses increased from the first quarter of 2020 to the first quarter of 2021 primarily due to the Merger closing on January 7, 2021. Partially offsetting increases to gathering, processing and transportation costs were approximately $10 million of Anadarko volume commitments which expired at the end of 2020. Production taxes also increased due to the rise in commodity prices.
Field-Level Cash Margin
The table below presents the field-level cash margin for each of our operating areas. Field-level cash margin is computed as oil, gas and NGL sales less production expenses and is not prepared in accordance with GAAP. A reconciliation to the comparable GAAP measures is found in “Non-GAAP Measures” in this Item 2. The changes in production volumes, field prices and production expenses, shown above, had the following impact on our field-level cash margins by asset.
| | Q1 2021 | | | $ per BOE | | | Q1 2020 | | | $ per BOE | |
Field-level cash margin (non-GAAP) | | | | | | | | | | | | | | | | |
Delaware Basin | | $ | 895 | | | $ | 32.07 | | | $ | 260 | | | $ | 17.72 | |
Anadarko Basin | | | 85 | | | $ | 14.01 | | | | 74 | | | $ | 8.22 | |
Williston Basin | | | 161 | | | $ | 29.70 | | | | — | | | N/M | |
Eagle Ford | | | 72 | | | $ | 26.57 | | | | 87 | | | $ | 19.20 | |
Powder River Basin | | | 67 | | | $ | 31.99 | | | | 54 | | | $ | 20.48 | |
Other | | | 19 | | | $ | 28.21 | | | | 14 | | | $ | 15.55 | |
Total | | $ | 1,299 | | | $ | 28.95 | | | $ | 489 | | | $ | 15.41 | |
DD&A and Asset Impairments
| | Q1 2021 | | | Q1 2020 | | | Change | |
Oil and gas per Boe | | $ | 9.78 | | | $ | 11.90 | | | | - 18 | % |
| | | | | | | | | | | | |
Oil and gas | | $ | 439 | | | $ | 377 | | | | +16 | % |
Other property and equipment | | | 28 | | | | 24 | | | | +18 | % |
Total | | $ | 467 | | | $ | 401 | | | | +16 | % |
| | | | | | | | | | | | |
Asset impairments | | $ | — | | | $ | 2,666 | | | N/M | |
DD&A increased in the first quarter of 2021 primarily due to the Merger closing on January 7, 2021. For additional information, see Note 2 in “Part I. Financial Information – Item 1. Financial Statements” in this report.
Asset impairments were $2.7 billion in the first quarter of 2020 due to significant decreases in commodity prices resulting primarily from the COVID-19 pandemic. These impairments resulted in lower DD&A rates which decreased DD&A in 2021 compared to 2020. For additional information, see Note 5 in “Part I. Financial Information – Item 1. Financial Statements” in this report.
Other Items
| | Q1 2021 | | | Q1 2020 | | | Change in earnings | |
Commodity hedge valuation changes (1) | | $ | (296 | ) | | $ | 619 | | | $ | (915 | ) |
Marketing and midstream operations | | | (21 | ) | | | (18 | ) | | | (3 | ) |
Exploration expenses | | | 3 | | | | 112 | | | | 109 | |
Asset dispositions | | | (32 | ) | | | — | | | | 32 | |
Net financing costs | | | 77 | | | | 65 | | | | (12 | ) |
Restructuring and transaction costs | | | 189 | | | | — | | | | (189 | ) |
Other, net | | | (29 | ) | | | (48 | ) | | | (19 | ) |
| | | | | | | | | | $ | (997 | ) |
| (1) | Included as a component of oil, gas and NGL derivatives on the consolidated statements of comprehensive earnings. |
We recognize fair value changes on our oil, gas and NGL derivative instruments in each reporting period. The changes in fair value resulted from new positions and settlements that occurred during each period, as well as the relationship between contract prices and the associated forward curves. For additional information, see Note 3 in “Part I. Financial Information – Item 1. Financial Statements” in this report.
Exploration expenses decreased primarily due to unproved asset impairments of $110 million in the first quarter of 2020. For additional information, see Note 5 in “Part I. Financial Information – Item 1. Financial Statements” in this report.
Restructuring and transaction costs reflect workforce reductions in conjunction with the Merger, as well as various transaction costs related to the Merger. For additional information, see Note 6 in “Part I. Financial Information – Item 1. Financial Statements” in this report.
Income Taxes
| | Q1 2021 | | | Q1 2020 | |
Current benefit | | $ | (5 | ) | | $ | (106 | ) |
Deferred benefit | | | (243 | ) | | | (311 | ) |
Total benefit | | $ | (248 | ) | | $ | (417 | ) |
Effective income tax rate | | | 763 | % | | | 20 | % |
For discussion on income taxes, see Note 7 in “Part I. Financial Information – Item 1. Financial Statements” in this report.
36
Table of Contents
Capital Resources, Uses and Liquidity
Sources and Uses of Cash
The following table presents the major changes in cash and cash equivalents for the three months ended March 31, 2021 and 2020.
| | Three Months Ended March 31, | |
| | 2021 | | | 2020 | |
Operating cash flow from continuing operations | | $ | 592 | | | $ | 529 | |
WPX acquired cash | | | 344 | | | | — | |
Divestitures of property and equipment | | | 15 | | | | 25 | |
Capital expenditures | | | (499 | ) | | | (425 | ) |
Debt activity, net | | | (560 | ) | | | — | |
Repurchases of common stock | | | — | | | | (38 | ) |
Common stock dividends | | | (203 | ) | | | (34 | ) |
Noncontrolling interest activity, net | | | (28 | ) | | | 2 | |
Other | | | (20 | ) | | | (21 | ) |
Net change in cash, cash equivalents and restricted cash from discontinued operations | | | — | | | | (155 | ) |
Net change in cash, cash equivalents and restricted cash | | $ | (359 | ) | | $ | (117 | ) |
Cash, cash equivalents and restricted cash at end of period | | $ | 1,878 | | | $ | 1,727 | |
Operating Cash Flow and WPX Acquired Cash
As presented in the table above, net cash provided by operating activities continued to be a significant source of capital and liquidity. Operating cash flow grew 12% during the three months ended March 31, 2021 compared to the three months ended March 31, 2020. The increase was due to the Merger and prices significantly increasing in the first quarter of 2021. Despite our portfolio enhancements, aggressive cost reductions and operational advancements, our 2020 financial results were challenged by commodity prices and deterioration of the macro-economic environment resulting from the unprecedented COVID-19 pandemic.
Divestitures of Property and Equipment
During the first three months of 2021, we sold non-core U.S. assets for approximately $15 million, net of customary purchase price adjustments. For additional information, please see Note 2 in “Part I. Financial Information – Item 1. Financial Statements” in this report.
Capital Expenditures
The amounts in the table below reflect cash payments for capital expenditures, including cash paid for capital expenditures incurred in prior periods.
| | Three Months Ended March 31, | |
| | 2021 | | | 2020 | |
Delaware Basin | | $ | 397 | | | $ | 221 | |
Anadarko Basin | | | 9 | | | | 8 | |
Williston Basin | | | 28 | | | | — | |
Eagle Ford | | | 14 | | | | 94 | |
Powder River Basin | | | 33 | | | | 85 | |
Other | | | — | | | | 3 | |
Total oil and gas | | | 481 | | | | 411 | |
Midstream | | | 5 | | | | 8 | |
Other | | | 13 | | | | 6 | |
Total capital expenditures | | $ | 499 | | | $ | 425 | |
Capital expenditures consist primarily of amounts related to our oil and gas exploration and development operations, midstream operations and other corporate activities. Capital expenditures increased in 2021 primarily due to the Merger closing on January 7, 2021 and results now including activity related to WPX legacy assets in the Delaware Basin in Texas and New Mexico and the
37
Table of Contents
Williston Basin in North Dakota. Our capital program is designed to operate within or near operating cash flow. This is evidenced by our operating cash flow funding all of our capital expenditures for the three months ended March 31, 2021. Our capital investment program is driven by a disciplined allocation process focused on returns. Our capital expenditures are expected to range between $1.7 billion to $2.0 billion for the full year 2021.
Debt Activity
Subsequent to the Merger closing, we redeemed $43 million of 6.00% notes, $175 million of 5.875% notes and $315 million of 4.50% notes in the first quarter of 2021. We also paid $27 million of cash retirement costs related to these redemptions.
Shareholder Distributions and Stock Activity
As part of our fixed dividend program, we paid common stock dividends of $76 million ($0.11 per share) and $34 million ($0.09 per share) during the first three months of 2021 and 2020, respectively. We raised our quarterly dividend by 22% to $0.11 per share in the second quarter of 2020. In addition to the fixed quarterly dividend, we paid a $127 million ($0.19 per share) variable dividend in the first quarter of 2021.
We repurchased 2.2 million shares of common stock for $38 million in the first three months of 2020. For additional information, see Note 17 in “Part I. Financial Information – Item 1. Financial Statements” in this report.
Noncontrolling Interest Activity, net
During the first three months of 2021, we did not receive any contributions from our noncontrolling interests in CDM and distributed $4 million to our noncontrolling interests in CDM. In the first quarter of 2021, we paid $24 million to purchase the noncontrolling interest portion of a partnership that WPX had formed to acquire minerals in the Delaware Basin.
Liquidity
The business of exploring for, developing and producing oil and natural gas is capital intensive. Because oil, natural gas and NGL reserves are a depleting resource, we, like all upstream operators, must continually make capital investments to grow and even sustain production. Generally, our capital investments are focused on drilling and completing new wells and maintaining production from existing wells. At opportunistic times, we also acquire operations and properties from other operators or land owners to enhance our existing portfolio of assets.
On January 7, 2021, Devon and WPX completed an all-stock merger of equals. With the Merger, we are accelerating our transition to a cash-return business model, which moderates growth, emphasizes capital efficiencies and prioritizes cash returns to shareholders. These principles will position Devon to be a consistent builder of economic value through the cycle. The post-merger scalability is expected to enhance Devon’s free cash flow, credit profile and decrease the overall cost of capital.
Historically, our primary sources of capital funding and liquidity have been our operating cash flow, cash on hand and asset divestiture proceeds. Additionally, we maintain a commercial paper program, supported by our revolving line of credit, which can be accessed as needed to supplement operating cash flow and cash balances. If needed, we can also issue debt and equity securities, including through transactions under our shelf registration statement filed with the SEC. We estimate the combination of our sources of capital will continue to be adequate to fund our planned post-merger capital requirements as discussed in this section as well as accelerate our cash-return business model.
Operating Cash Flow
Key inputs into determining our planned capital investment is the amount of cash we hold and operating cash flow we expect to generate over the next one to three or more years. At the end of the first quarter of 2021, we held approximately $1.9 billion of cash, inclusive of $195 million of cash restricted primarily for retained obligations related to divested assets. Our operating cash flow forecasts are sensitive to many variables and include a measure of uncertainty as these variables may differ from our expectations.
Commodity Prices – The most uncertain and volatile variables for our operating cash flow are the prices of the oil, gas and NGLs we produce and sell. Prices are determined primarily by prevailing market conditions. Regional and worldwide economic activity, weather and other highly variable factors influence market conditions for these products. These factors, which are difficult to predict, create volatility in prices and are beyond our control.
38
Table of Contents
To mitigate some of the risk inherent in prices, we utilize various derivative financial instruments to protect a portion of our production against downside price risk. We hedge our production in a manner that systematically places hedges for several quarters in advance, allowing us to maintain a disciplined risk management program as it relates to commodity price volatility. We supplement the systematic hedging program with discretionary hedges that take advantage of favorable market conditions. The key terms to our oil, gas and NGL derivative financial instruments as of March 31, 2021 are presented in Note 3 in “Part I. Financial Information – Item 1. Financial Statements” of this report.
Further, when considering the current commodity price environment and our current hedge position, we expect to achieve our capital investment priorities. Additionally, as commodity prices begin to recover from the COVID-19 pandemic, we remain committed to a maintenance capital program for the foreseeable future. We do not intend to add any growth projects until market fundamentals recover, excess inventory clears up and OPEC+ curtailed volumes are effectively absorbed by the world markets.
Operating Expenses – Commodity prices can also affect our operating cash flow through an indirect effect on operating expenses. Significant commodity price decreases can lead to a decrease in drilling and development activities. As a result, the demand and cost for people, services, equipment and materials may also decrease, causing a positive impact on our cash flow as the prices paid for services and equipment decline. However, the inverse is also generally true during periods of rising commodity prices.
Cost savings from synergies resulting from the Merger are expected to be attained through cost reductions and efficiencies related to our capital programs, G&A, financing costs and production expenses. We anticipate the planned $600 million reduction of annualized costs will occur by year-end 2021. Approximately 35% of the reduced costs are related to our capital programs and the remainder relate to our operating expenses, including G&A, interest expense and production expenses.
Restructuring and Transaction Related Costs – The majority of the Merger-related restructuring and transaction costs cash outflows were paid in the first quarter of 2021 and the remaining costs will be paid mostly over the remaining nine months of 2021. These payments relate to workforce reductions and the associated employee severance benefits, costs to modify or abandon vendor contracts and the acceleration of certain employee benefits triggered by the Merger.
Credit Losses – Our operating cash flow is also exposed to credit risk in a variety of ways. This includes the credit risk related to customers who purchase our oil, gas and NGL production, the collection of receivables from our joint interest partners for their proportionate share of expenditures made on projects we operate and counterparties to our derivative financial contracts. We utilize a variety of mechanisms to limit our exposure to the credit risks of our customers, partners and counterparties. Such mechanisms include, under certain conditions, requiring letters of credit, prepayments or collateral postings.
Assumption and Repayment of WPX Debt
In conjunction with the Merger closing on January 7, 2021, we assumed a principal value of $3.3 billion of WPX debt. Subsequent to the Merger closing, we have reduced our debt by approximately $530 million in the first quarter of 2021. Additionally, we redeemed $210 million of 5.25% notes in April 2021. In May 2021, we gave notice to exercise our early redemption to fully retire the 5.75% senior notes due 2026 in June 2021. We expect these redemptions to lower our annual cash net financing costs by approximately $70 million.
Credit Availability
As of March 31, 2021, we had approximately $3.0 billion of available borrowing capacity under our Senior Credit Facility. This credit facility supports our $3.0 billion of short-term credit under our commercial paper program. At March 31, 2021, there were no borrowings under our commercial paper program, and we were in compliance with the Senior Credit Facility’s financial covenant.
Debt Ratings
We receive debt ratings from the major ratings agencies in the U.S. In determining our debt ratings, the agencies consider a number of qualitative and quantitative items including, but not limited to, commodity pricing levels, our liquidity, asset quality, reserve mix, debt levels, cost structure, planned asset sales and production growth opportunities. Our credit rating from Standard and Poor’s Financial Services is BBB- with a stable outlook. Our credit rating from Fitch is BBB with a positive outlook. Our credit rating from Moody’s Investor Service is Ba1 with a positive outlook. Any rating downgrades may result in additional letters of credit or cash collateral being posted under certain contractual arrangements.
There are no “rating triggers” in any of our contractual debt obligations that would accelerate scheduled maturities should our debt rating fall below a specified level. However, a downgrade could adversely impact our interest rate on any credit facility borrowings and the ability to economically access debt markets in the future.
39
Table of Contents
Fixed Plus Variable Dividend
Following the closing of the Merger, Devon initiated a new “fixed plus variable” dividend strategy. The fixed dividend is currently paid quarterly at a rate of $0.11 per share, and the Board of Directors will consider a number of factors when setting the quarterly dividend, if any, including a general target of paying out approximately 10% of operating cash flow through the fixed dividend. In addition to the fixed quarterly dividend, Devon may pay a variable dividend up to 50 percent of its excess free cash flow, which is a non-GAAP measure. Each quarter’s excess free cash flow is computed as operating cash flow (a GAAP measure) before balance sheet changes, less capital expenditures and the fixed dividend. The declaration and payment of any future dividend, whether fixed or variable, will remain at the full discretion of our Board of Directors and will depend on Devon’s financial results, cash requirements, future prospects, COVID-19 impacts and other factors deemed relevant by the Board.
In May 2021, Devon announced a cash dividend in the amount of $0.34 per share payable in the second quarter of 2021. The dividend consists of a fixed quarterly dividend in the amount of approximately $74 million (or $0.11 per share) and a variable quarterly dividend in the amount of approximately $155 million (or $0.23 per share).
Capital Expenditures
Our 2021 exploration and development budget for the remainder of 2021 is expected to range from approximately $1.1 billion to $1.3 billion.
Critical Accounting Estimates
Income Taxes
The amount of income taxes recorded requires interpretations of complex rules and regulations of federal, state, provincial and foreign tax jurisdictions. We recognize current tax expense based on estimated taxable income for the current period and the applicable statutory tax rates. We routinely assess potential uncertain tax positions and, if required, estimate and establish accruals for such amounts. We have recognized deferred tax assets and liabilities for temporary differences, operating losses and other tax carryforwards. We routinely assess our deferred tax assets and reduce such assets by a valuation allowance if we deem it is more likely than not that some portion or all of the deferred tax assets will not be realized. Due primarily to significant cumulative losses, we recorded a full valuation allowance against U.S. deferred tax assets in 2020 and remain in a full valuation allowance position at March 31, 2021. However, absent any additional objective negative evidence, and with the addition of subjective evidence such as forecasted taxable income, we may adjust the valuation allowance in future periods.
Further, in the event we were to undergo an “ownership change” (as defined in Section 382 of the Internal Revenue Code of 1986, as amended), our ability to use net operating losses and tax credits generated prior to the ownership change may be limited. Generally, an “ownership change” occurs if one or more shareholders, each of whom owns five percent or more in value of a corporation’s stock, increase their aggregate percentage ownership by more than 50 percent over the lowest percentage of stock owned by those shareholders at any time during the preceding three-year period. No ownership change has occurred during 2021 for Devon, but the Merger did cause an ownership change for WPX and increased the likelihood Devon could experience an ownership change over the next three years.
Purchase Accounting
Periodically we acquire assets and assume liabilities in transactions accounted for as business combinations, such as the Merger with WPX. In connection with the Merger, as the accounting acquirer, we allocated the $5.4 billion of purchase price consideration to the assets acquired and liabilities assumed based on estimated fair values as of the date of the Merger. The preliminary purchase price assessment remains an ongoing process and is subject to change for up to one year subsequent to the closing date of the Merger.
We made a number of assumptions in estimating the fair value of assets acquired and liabilities assumed in the Merger. The most significant assumptions relate to the estimated fair values of proved and unproved oil and gas properties. Since sufficient market data was not available regarding the fair values of proved and unproved oil and gas properties, we prepared estimates and engaged third party valuation experts. Significant judgments and assumptions are inherent in these estimates and include, among other things, estimates of reserve quantities, estimates of future commodity prices, drilling plans, expected development costs, lease operating costs, reserve risk adjustment factors and an estimate of an applicable market participant discount rate that reflects the risk of the underlying cash flow estimates.
Estimated fair values ascribed to assets acquired can have a significant impact on future results of operations presented in Devon’s financial statements. A higher fair value ascribed to a property results in higher DD&A expense, which results in lower net
40
Table of Contents
earnings. Fair values are based on estimates of future commodity prices, reserve quantities, development costs and operating costs. In the event that future commodity prices or reserve quantities are lower than those used as inputs to determine estimates of acquisition date fair values, the likelihood increases that certain costs may be determined to not be recoverable.
In addition to the fair value of proved and unproved oil and gas properties, other significant fair value assessments for the assets acquired and liabilities assumed in the Merger relate to debt, the equity method investment in Catalyst Midstream and out-of-market contract assets and liabilities. The fair value of the assumed WPX publicly traded debt was based on available third party quoted prices. We prepared estimates and engaged third party valuation experts to assist in the valuation of the equity method investment in Catalyst Midstream. Significant judgments and assumptions inherent in this estimate included projected Catalyst Midstream cash flows, comparable companies cash flow multiples and an estimate of an applicable market participant discount rate. The fair value of assumed out-of-market contract assets and liabilities associated with longer-term marketing, gathering, processing and transportation contracts included significant judgements and assumptions related to determining the market rates, estimates of future reserves and production associated with the respective contracts and applying an applicable market participant discount rate.
For additional information regarding our critical accounting policies and estimates, see our 2020 Annual Report on Form 10-K.
Non-GAAP Measures
We make reference to “core earnings (loss) attributable to Devon” and “core earnings (loss) per share attributable to Devon” in “Overview of 2021 Results” in this Item 2 that are not required by or presented in accordance with GAAP. These non-GAAP measures are not alternatives to GAAP measures and should not be considered in isolation or as a substitute for analysis of our results reported under GAAP. Core earnings (loss) attributable to Devon, as well as the per share amount, represent net earnings excluding certain non-cash and other items that are typically excluded by securities analysts in their published estimates of our financial results. Our non-GAAP measures are typically used as a quarterly performance measure. Amounts excluded relate to asset dispositions, non-cash asset impairments (including non-cash unproved asset impairments), deferred tax asset valuation allowance, costs associated with early retirement of debt, fair value changes in derivative financial instruments, changes in tax legislation and restructuring and transaction costs associated with the workforce reductions described further in Note 6.
We believe these non-GAAP measures facilitate comparisons of our performance to earnings estimates published by securities analysts. We also believe these non-GAAP measures can facilitate comparisons of our performance between periods and to the performance of our peers.
41
Table of Contents
Below are reconciliations of core earnings and core earnings per share attributable to Devon to comparable GAAP measures.
| Three Months Ended March 31, | |
| Before tax | | | After tax | | | After Noncontrolling Interests | | | Per Diluted Share | |
2021 | | | | | | | | | | | | | | | |
Total | | | | | | | | | | | | | | | |
Earnings (loss) attributable to Devon (GAAP) | $ | (32 | ) | | $ | 216 | | | $ | 213 | | | $ | 0.32 | |
Adjustments: | | | | | | | | | | | | | | | |
Asset dispositions | | (32 | ) | | | (24 | ) | | | (24 | ) | | | (0.04 | ) |
Asset and exploration impairments | | 1 | | | | — | | | | — | | | | 0.00 | |
Deferred tax asset valuation allowance | | — | | | | (263 | ) | | | (263 | ) | | | (0.40 | ) |
Fair value changes in financial instruments and foreign currency | | 294 | | | | 225 | | | | 225 | | | | 0.34 | |
Restructuring and transaction costs | | 189 | | | | 162 | | | | 162 | | | | 0.25 | |
Early retirement of debt | | (20 | ) | | | (15 | ) | | | (15 | ) | | | (0.02 | ) |
Core earnings attributable to Devon (Non-GAAP) | $ | 400 | | | $ | 301 | | | $ | 298 | | | $ | 0.45 | |
2020 | | | | | | | | | | | | | | | |
Continuing Operations | | | | | | | | | | | | | | | |
Loss attributable to Devon (GAAP) | $ | (2,107 | ) | | $ | (1,690 | ) | | $ | (1,691 | ) | | $ | (4.48 | ) |
Adjustments: | | | | | | | | | | | | | | | |
Asset and exploration impairments | | 2,776 | | | | 2,146 | | | | 2,146 | | | | 5.66 | |
Deferred tax asset valuation allowance | | — | | | | 108 | | | | 108 | | | | 0.28 | |
Fair value changes in financial instruments | | (619 | ) | | | (479 | ) | | | (479 | ) | | | (1.24 | ) |
Change in tax legislation | | — | | | | (62 | ) | | | (62 | ) | | | (0.16 | ) |
Core earnings attributable to Devon (Non-GAAP) | $ | 50 | | | $ | 23 | | | $ | 22 | | | $ | 0.06 | |
Discontinued Operations | | | | | | | | | | | | | | | |
Loss attributable to Devon (GAAP) | $ | (157 | ) | | $ | (125 | ) | | $ | (125 | ) | | $ | (0.34 | ) |
Adjustments: | | | | | | | | | | | | | | | |
Asset impairments | | 179 | | | | 141 | | | | 141 | | | | 0.38 | |
Fair value changes in foreign currency and other | | 10 | | | | 10 | | | | 10 | | | | 0.03 | |
Core earnings attributable to Devon (Non-GAAP) | $ | 32 | | | $ | 26 | | | $ | 26 | | | $ | 0.07 | |
Total | | | | | | | | | | | | | | | |
Loss attributable to Devon (GAAP) | $ | (2,264 | ) | | $ | (1,815 | ) | | $ | (1,816 | ) | | $ | (4.82 | ) |
Adjustments: | | | | | | | | | | | | | | | |
Continuing Operations | | 2,157 | | | | 1,713 | | | | 1,713 | | | | 4.54 | |
Discontinued Operations | | 189 | | | | 151 | | | | 151 | | | | 0.41 | |
Core earnings attributable to Devon (Non-GAAP) | $ | 82 | | | $ | 49 | | | $ | 48 | | | $ | 0.13 | |
EBITDAX and Field-Level Cash Margin
To assess the performance of our assets, we use EBITDAX and Field-Level Cash Margin. We compute EBITDAX as net earnings from continuing operations before income tax expense; financing costs, net; exploration expenses; DD&A; asset impairments; asset disposition gains and losses; non-cash share-based compensation; non-cash valuation changes for derivatives and financial instruments; restructuring and transaction costs; accretion on discounted liabilities; and other items not related to our normal operations. Field-Level Cash Margin is computed as oil, gas and NGL sales less production expenses. Production expenses consist of lease operating, gathering, processing and transportation expenses, as well as production and property taxes.
We exclude financing costs from EBITDAX to assess our operating results without regard to our financing methods or capital structure. Exploration expenses and asset disposition gains and losses are excluded from EBITDAX because they generally are not indicators of operating efficiency for a given reporting period. DD&A and impairments are excluded from EBITDAX because capital expenditures are evaluated at the time capital costs are incurred. We exclude share-based compensation, valuation changes, restructuring and transaction costs, accretion on discounted liabilities and other items from EBITDAX because they are not considered a measure of asset operating performance.
We believe EBITDAX and Field-Level Cash Margin provide information useful in assessing our operating and financial performance across periods. EBITDAX and Field-Level Cash Margin as defined by Devon may not be comparable to similarly titled measures used by other companies and should be considered in conjunction with net earnings from continuing operations.
42
Table of Contents
Below are reconciliations of net earnings to EBITDAX and a further reconciliation to Field-Level Cash Margin.
| Three Months Ended March 31, | |
| 2021 | | | 2020 | |
Net earnings (loss) (GAAP) | $ | 216 | | | $ | (1,815 | ) |
Net loss from discontinued operations, net of tax | | — | | | | 125 | |
Financing costs, net | | 77 | | | | 65 | |
Income tax benefit | | (248 | ) | | | (417 | ) |
Exploration expenses | | 3 | | | | 112 | |
Depreciation, depletion and amortization | | 467 | | | | 401 | |
Asset impairments | | — | | | | 2,666 | |
Asset dispositions | | (32 | ) | | | — | |
Share-based compensation | | 20 | | | | 20 | |
Derivative and financial instrument non-cash valuation changes | | 296 | | | | (619 | ) |
Restructuring and transaction costs | | 189 | | | | — | |
Accretion on discounted liabilities and other | | (29 | ) | | | (48 | ) |
EBITDAX (non-GAAP) | | 959 | | | | 490 | |
Marketing and midstream revenues and expenses, net | | 21 | | | | 18 | |
Commodity derivative cash settlements | | 232 | | | | (101 | ) |
General and administrative expenses, cash-based | | 87 | | | | 82 | |
Field-level cash margin (non-GAAP) | $ | 1,299 | | | $ | 489 | |
43
Table of Contents
Item 3. Quantitative and Qualitative Disclosures About Market Risk
Commodity Price Risk
As of March 31, 2021, we have commodity derivatives that pertain to a portion of our estimated production for the last nine months of 2021, as well as for 2022, 2023 and 2024. The key terms to our open oil, gas and NGL derivative financial instruments are presented in Note 3 in “Part I. Financial Information – Item 1. Financial Statements” in this report.
The fair values of our commodity derivatives are largely determined by the forward curves of the relevant price indices. At March 31, 2021, a 10% change in the forward curves associated with our commodity derivative instruments would have changed our net positions by approximately $335 million.
Interest Rate Risk
As of March 31, 2021, we had total debt of $7.3 billion. All of our debt is based on fixed interest rates averaging 5.6%.
Foreign Currency Risk
We had no material foreign currency risk at March 31, 2021.
Item 4. Controls and Procedures
Disclosure Controls and Procedures
We have established disclosure controls and procedures to ensure that material information relating to Devon, including its consolidated subsidiaries, is made known to the officers who certify Devon’s financial reports and to other members of senior management and the Board of Directors.
Based on their evaluation, our principal executive and principal financial officers have concluded that our disclosure controls and procedures (as defined in Rules 13a-15(e) and 15d-15(e) under the Securities Exchange Act of 1934) were effective as of March 31, 2021 to ensure that the information required to be disclosed by Devon in the reports that it files or submits under the Securities Exchange Act of 1934 is recorded, processed, summarized and reported within the time periods specified in the SEC rules and forms.
Changes in Internal Control Over Financial Reporting
In conjunction with the Merger closing, we have integrated WPX’s operations into our overall system of internal controls over financial reporting and they are now included in our assessment of the effectiveness of our internal controls over financial reporting. For additional information regarding the Merger, see Note 2 in “Part I. Financial Information – Item 1. Financial Statements” in this report.
There were no other changes in our internal control over financial reporting that occurred during our most recent fiscal quarter that have materially affected, or are reasonably likely to materially affect, our internal control over financial reporting.
44
Table of Contents
PART II. Other Information
Item 1. Legal Proceedings
We are involved in various legal proceedings incidental to our business. However, to our knowledge as of the date of this report and subject to the matter noted below, there were no material pending legal proceedings to which we are a party or to which any of our property is subject.
On April 7, 2020, WPX Energy, Inc., a wholly-owned subsidiary of the Company, received a notice of violation from the EPA relating to specific historical air emission events occurring on the Fort Berthold Indian Reservation in North Dakota. We have since received information from the EPA that specifies the particular facilities to which the notice of violation applies. We have been in the process of providing the EPA with additional information regarding the specific events and responding to broader information requests from the EPA. Although this matter is ongoing and management cannot predict its ultimate outcome, the resolution of this matter may result in a fine or penalty in excess of $300,000.
Please see our 2020 Annual Report on Form 10-K and other SEC filings for additional information.
Item 1A. Risk Factors
There have been no material changes to the information included in Item 1A. “Risk Factors” in our 2020 Annual Report on Form 10-K.
Item 2. Unregistered Sales of Equity Securities and Use of Proceeds
The following table provides information regarding purchases of our common stock that were made by us during the first quarter of 2021 (shares in thousands).
Period | | Total Number of Shares Purchased (1) | | | Average Price Paid per Share | |
January 1 - January 31 | | | 15 | | | $ | 18.29 | |
February 1 - February 28 | | | 1,011 | | | $ | 19.30 | |
March 1 - March 31 | | | 798 | | | $ | 22.92 | |
Total | | | 1,824 | | | $ | 20.87 | |
| (1) | These amounts reflect the shares received by us from employees for the payment of personal income tax withholding on vesting transactions. |
Item 3. Defaults Upon Senior Securities
Not applicable.
Item 4. Mine Safety Disclosures
Not applicable.
Item 5. Other Information
Not applicable.
45
Table of Contents
Item 6. Exhibits
Exhibit Number | | Description |
| |
4.1 | Stockholders’ Agreement, by and among Devon Energy Corporation, Felix Investment Holdings II, LLC, and EnCap Energy Capital Fund X, L.P., dated January 7, 2021 (incorporated by reference to Exhibit 10.1 to Registrant’s Current Report on Form 8-K filed January 7, 2021; File No. 001-32318). |
| |
4.2 | Registration Rights Agreement, by and between Devon Energy Corporation and Felix Investment Holdings II, LLC, dated January 7, 2021 (incorporated by reference to Exhibit 10.2 to Registrant’s Form 8-K filed January 7, 2021; File No. 001-32318). |
| |
10.1* | 2021 Form of Notice of Grant of Restricted Stock Award and Award Agreement under the 2017 Long-Term Incentive Plan between Devon Energy Corporation and certain officers for restricted stock awarded. |
| |
10.2* | 2021 Form of Notice of Grant of Performance Share Unit Award and Award Agreement under the 2017 Long-Term Incentive Plan between Devon Energy Corporation and certain officers for performance based restricted share units awarded. |
| |
10.3* | 2021 Amendment (effective as of January 7, 2021) to the Devon Energy Corporation 2017 Long-Term Incentive Plan (incorporated by reference to Exhibit 10.7 to Registrant’s Form 10-K filed February 17, 2021; File No. 001-32318). |
| |
10.4* | Employment Agreement, dated January 7, 2021, by and between Registrant and Richard E. Muncrief (incorporated by reference to Exhibit 10.3 to Registrant’s Form 8-K filed January 7, 2021; File No. 001-32318). |
| |
10.5* | Employment Agreement, dated January 7, 2021, by and between Registrant and Clay M. Gaspar (incorporated by reference to Exhibit 10.4 to Registrant’s Form 8-K filed January 7, 2021; File No. 001-32318). |
| |
10.6* | Employment Agreement, dated January 7, 2021, by and between Registrant and Dennis C. Cameron (incorporated by reference to Exhibit 10.5 to Registrant’s Form 8-K filed January 7, 2021; File No. 001-32318). |
| |
31.1 | Certification of principal executive officer pursuant to Section 302 of the Sarbanes-Oxley Act of 2002. |
| |
31.2 | Certification of principal financial officer pursuant to Section 302 of the Sarbanes-Oxley Act of 2002. |
| |
32.1 | Certification of principal executive officer pursuant to Section 906 of the Sarbanes-Oxley Act of 2002. |
| |
32.2 | Certification of principal financial officer pursuant to Section 906 of the Sarbanes-Oxley Act of 2002. |
| |
101.INS | Inline XBRL Instance Document – the XBRL Instance Document does not appear in the Interactive Data File because its XBRL tags are embedded within the Inline XBRL document. |
| |
101.SCH | Inline XBRL Taxonomy Extension Schema Document. |
| |
101.CAL | Inline XBRL Taxonomy Extension Calculation Linkbase Document. |
| |
101.DEF | Inline XBRL Taxonomy Extension Definition Linkbase Document. |
| |
101.LAB | Inline XBRL Taxonomy Extension Labels Linkbase Document. |
| |
101.PRE | Inline XBRL Taxonomy Extension Presentation Linkbase Document. |
| |
104 | Cover Page Interactive Data File (formatted as Inline XBRL and contained in Exhibit 101). |
________________
* Indicates management contract or compensatory plan or arrangement.
46
Table of Contents
SIGNATURES
Pursuant to the requirements of the Securities Exchange Act of 1934, the registrant has duly caused this report to be signed on its behalf by the undersigned thereunto duly authorized.
| | | | DEVON ENERGY CORPORATION |
| | |
Date: May 5, 2021 | | | | /s/ Jeremy D. Humphers |
| | | | Jeremy D. Humphers |
| | | | Senior Vice President and Chief Accounting Officer |
47