UNITED STATES
SECURITIES AND EXCHANGE COMMISSION
Washington, D.C. 20549
FORM N-CSR
CERTIFIED SHAREHOLDER REPORT OF REGISTERED
MANAGEMENT INVESTMENT COMPANIES
| Investment Company Act file number: | 811-09439 | |
| Exact name of registrant as specified in charter: | Prudential Investment Portfolios 5 | |
| Address of principal executive offices: | 655 Broad Street, 17th Floor | |
| Newark, New Jersey 07102 | ||
| Name and address of agent for service: | Deborah A. Docs | |
| 655 Broad Street, 17th Floor | ||
| Newark, New Jersey 07102 | ||
| Registrant’s telephone number, including area code: | 800-225-1852 | |
| Date of fiscal year end: | 7/31/2015 | |
| Date of reporting period: | 7/31/2015 | |
Item 1 – Reports to Stockholders

PRUDENTIAL INVESTMENTS»MUTUAL FUNDS
PRUDENTIAL JENNISON CONSERVATIVE GROWTH FUND
ANNUAL REPORT · JULY 31, 2015
Objective
Seeks long-term capital appreciation
This report is not authorized for distribution to prospective investors unless preceded or accompanied by a current prospectus.
The views expressed in this report and information about the Fund’s portfolio holdings are for the period covered by this report and are subject to change thereafter.
Mutual funds are distributed by Prudential Investment Management Services LLC (PIMS). Jennison Associates is a registered investment adviser. Both are Prudential Financial companies. © 2015 Prudential Financial, Inc. and its related entities. Prudential Investments LLC, Prudential, Jennison Associates, Jennison, the Prudential logo, Bring Your Challenges, and the Rock symbol are service marks of Prudential Financial, Inc. and its related entities, registered in many jurisdictions worldwide.

|  |

September 15, 2015
Dear Shareholder:
We hope you find the annual report for the Prudential Jennison Conservative Growth Fund informative and useful. The report covers performance for the 12-month period that ended July 31, 2015.
Since market conditions change over time, we believe it is important to maintain a diversified portfolio of funds consistent with your tolerance for risk, time horizon, and financial goals.
Your financial advisor can help you create a diversified investment plan that may include funds covering all the basic asset classes and that reflects your personal investor profile and risk tolerance. Keep in mind, however, that diversification and asset allocation strategies do not assure a profit or protect against loss in declining markets.
Prudential Investments® is dedicated to helping you solve your toughest investment challenges—whether it’s capital growth, reliable income, or protection from market volatility and other risks. We offer the expertise of Prudential Financial’s affiliated asset managers that strive to be leaders in a broad range of funds to help you stay on course to the future you envision. They also manage money for major corporations and pension funds around the world, which means you benefit from the same expertise, innovation, and attention to risk demanded by today’s most sophisticated investors.
Thank you for choosing the Prudential Investments family of funds.
Sincerely,

Stuart S. Parker, President
Prudential Jennison Conservative Growth Fund
| Prudential Jennison Conservative Growth Fund | 1 |
Your Fund’s Performance (Unaudited)
Performance data quoted represent past performance. Past performance does not guarantee future results. The investment return and principal value of an investment will fluctuate, so that an investor’s shares, when redeemed, may be worth more or less than their original cost. Current performance may be lower or higher than the past performance data quoted. An investor may obtain performance data as of the most recent month-end by visiting our website at www.prudentialfunds.com or by calling (800) 225-1852.
Cumulative Total Returns (Without Sales Charges) as of 7/31/15 |
| |||||||||||
| One Year | Five Years | Ten Years | ||||||||||
Class A | 11.84 | % | 106.49 | % | 113.20 | % | ||||||
Class B | 11.01 | 99.00 | 98.07 | |||||||||
Class C | 11.01 | 99.00 | 98.07 | |||||||||
Russell 1000® Growth Index | 16.08 | 126.35 | 135.60 | |||||||||
S&P 500 Index | 11.19 | 112.12 | 110.31 | |||||||||
Lipper Large-Cap Growth Funds Average | 15.55 | 115.41 | 120.81 | |||||||||
Average Annual Total Returns (With Sales Charges) as of 6/30/15 |
| |||||||||||
| One Year | Five Years | Ten Years | ||||||||||
Class A | 1.24 | % | 15.15 | % | 7.50 | % | ||||||
Class B | 1.53 | 15.50 | 7.32 | |||||||||
Class C | 5.36 | 15.61 | 7.32 | |||||||||
Russell 1000 Growth Index | 10.56 | 18.59 | 9.10 | |||||||||
S&P 500 Index | 7.41 | 17.33 | 7.89 | |||||||||
Lipper Large-Cap Growth Funds Average | 10.50 | 17.21 | 8.31 | |||||||||
Average Annual Total Returns (With Sales Charges) as of 7/31/15 |
| |||||||||||
| One Year | Five Years | Ten Years | ||||||||||
Class A | 5.69 | % | 14.30 | % | 7.26 | % | ||||||
Class B | 6.01 | 14.64 | 7.07 | |||||||||
Class C | 10.01 | 14.76 | 7.07 | |||||||||
Average Annual Total Returns (Without Sales Charges) as of 7/31/15 |
| |||||||||||
| One Year | Five Years | Ten Years | ||||||||||
Class A | 11.84 | % | 15.61 | % | 7.86 | % | ||||||
Class B | 11.01 | 14.76 | 7.07 | |||||||||
Class C | 11.01 | 14.76 | 7.07 | |||||||||
| 2 | Visit our website at www.prudentialfunds.com |
Growth of a $10,000 Investment
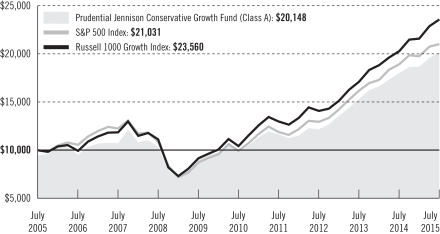
The graph compares a $10,000 investment in the Prudential Jennison Conservative Growth Fund (Class A shares) with a similar investment in the Standard & Poor’s 500 Composite Stock Price Index (S&P 500 Index) and the Russell 1000 Growth Index by portraying the initial account values at the beginning of the 10-year period for Class A shares (July 31, 2005) and the account values at the end of the current fiscal year (July 31, 2015) as measured on a quarterly basis. The S&P 500 Index and the Russell 1000 Growth Index data are measured from the closest month-end to inception date. For purposes of the graph, and unless otherwise indicated, it has been assumed that (a) the maximum applicable front-end sales charge was deducted from the initial $10,000 investment in Class A shares; (b) all recurring fees (including management fees) were deducted; and (c) all dividends and distributions were reinvested. The line graph provides information for Class A shares only. As indicated in the tables provided earlier, performance for Class B, and Class C shares will vary due to the differing charges and expenses applicable to each share class (as indicated in the following paragraphs). Without waiver of fees and/or expense reimbursement, if any, the Fund’s returns would have been lower.
Past performance does not predict future performance. Total returns and the ending account values in the graph include changes in share price and reinvestment of dividends and capital gains distributions in a hypothetical investment for the periods shown. The Fund’s total returns do not reflect the deduction of income taxes on an individual’s investment. Taxes may reduce your actual investment returns on income or gains paid by the Fund or any gains you may realize if you sell your shares.
Source: Prudential Investments LLC and Lipper Inc.
| Prudential Jennison Conservative Growth Fund | 3 |
Your Fund’s Performance (continued)
The returns in the tables do not reflect the deduction of taxes that a shareholder would pay on Fund distributions or following the redemption of Fund shares. The average annual total returns take into account applicable sales charges, which are described for each share class in the table below.
| Class A | Class B* | Class C | ||||
Maximum initial sales charge | 5.50% of the public offering price | None | None | |||
Contingent deferred sales charge (CDSC) (as a percentage of the lower of original purchase price or net asset value at redemption) | 1% on sales of $1 million or more made within 12 months of purchase | 5% (Yr.1) 4% (Yr.2) 3% (Yr.3) 2% (Yr.4) 1% (Yr.5/6) 0% (Yr.7) | 1% on sales made within 12 months of purchase | |||
Annual distribution and service (12b-1) fees (shown as a percentage of average daily net assets) | .30% (.25% currently) | 1% | 1% |
*Class B shares are closed to all purchase activity and no additional Class B shares may be purchased or acquired except by exchange from Class B shares of another Fund or through dividend or capital gains reinvestment.
Benchmark Definitions
Russell 1000 Growth Index
The Russell 1000 Growth Index is an unmanaged index which contains those securities in the Russell 1000 Index with an above-average growth orientation. Companies in this index tend to exhibit higher price-to-book and price-to-earnings ratios, lower dividend yields, and higher forecasted growth rates.
S&P 500 Index
The Standard & Poor’s 500 Composite Stock Price Index (S&P 500 Index) is an unmanaged index of 500 stocks of large US public companies. It gives an indication of how stock prices in the United States have performed.
Lipper Large-Cap Growth Funds Average
The Lipper Large-Cap Growth Funds Average (Lipper Average) is based on the average return of all funds in the Lipper Large-Cap Growth Funds category for the periods noted. Funds in the Lipper Average invest at least 75% of their equity assets in companies with market capitalizations (on a three-year weighted basis) greater than 300% of the dollar-weighted median market capitalization of the middle 1,000 securities of the S&P SuperComposite 1500 Index.
| 4 | Visit our website at www.prudentialfunds.com |
Investors cannot invest directly in an index or average. The returns for the Indexes would be lower if they included the effects of sales charges, operating expenses of a mutual fund, or taxes that may be paid by an investor. Returns for the Lipper Averages reflect the deduction of operating expenses, but not sales charges or taxes.
Five Largest Holdings expressed as a percentage of net assets as of 7/31/15 |
| |||
Apple, Inc., Technology Hardware, Storage & Peripherals | 4.7 | % | ||
Amazon.com, Inc., Internet & Catalog Retail | 3.7 | |||
Walt Disney Co. (The), Media | 2.9 | |||
Bristol-Myers Squibb Co., Pharmaceuticals | 2.8 | |||
Morgan Stanley, Capital Markets | 2.5 | |||
Holdings reflect only long-term investments and are subject to change.
Five Largest Industries expressed as a percentage of net assets as of 7/31/15 |
| |||
Pharmaceuticals | 8.3 | % | ||
Internet & Catalog Retail | 7.5 | |||
Capital Markets | 7.4 | |||
Internet Software & Services | 7.3 | |||
Oil, Gas & Consumable Fuels | 6.8 | |||
Industry weightings reflect only long-term investments and are subject to change.
| Prudential Jennison Conservative Growth Fund | 5 |
Strategy and Performance Overview
How did the Fund perform?
The Prudential Jennison Conservative Growth Fund’s Class A shares returned 11.84% in the 12 months ended July 31, 2015, underperforming the 16.08% gain of the Russell 1000 Growth Index (the Growth Index) and the 15.55% gain of the Lipper Large-Cap Growth Funds Average. The Fund outperformed the style-neutral S&P 500 Index, which advanced 11.19%.
In the Growth Index, gains in the health care, consumer discretionary, and consumer staples sectors exceeded 30%. Energy declined the most, dropping more than 25%.
In the Fund, consumer discretionary and health care positions posted the largest absolute gains and contributed most to positive return. In energy, stock selection was beneficial, although an overweight detracted from return relative to the Growth Index. Stock selection was likewise strong in consumer discretionary and financials, but detrimental in industrials and telecommunication services. Information technology and consumer staples positions posted double-digit gains but lagged the advances of the Growth Index’s respective sectors.
What was the market environment?
Weak energy prices and a strong US dollar were key influences on the global economic landscape in the 12 months. The US remained the strongest of the major global economies. The Federal Reserve ended its quantitative-easing program in December, signaling confidence in the health of US economic activity and labor market conditions. China’s growth continued to slow despite stimulus measures and easing in lending markets. Europe struggled, unsuccessfully, to avert Greece’s looming default even as the country’s new government called for less economic austerity. At the end of the period, eurozone leaders reached an agreement to start negotiations on a third bailout. Tensions between Russia and Ukraine remained elevated. Brazil flirted with recession. Japan showed little economic improvement, although its stock market made progress as investors hoped a weaker yen would boost exports. These challenges, combined with uncertainty about the timing and pace of anticipated monetary tightening in the US, contributed to continued volatility in global financial markets.
Which holdings made the largest positive contributions to the Fund’s return?
Consumer discretionary holdings, including Disney, Amazon.com, and Netflix, were key positive contributors.
| • | See “Comments on Largest Holdings” below for discussion of Disney and Amazon.com. |
| 6 | Visit our website at www.prudentialfunds.com |
| • | Jennison believes several factors have strengthened the long-term competitive positioning of on-demand streaming media network Netflix, including a shift toward exclusive deals and original content, increasing pricing power, international expansion, and the company’s scale advantage. Jennison believes domestic and international subscriber growth reflected the power of the company’s original content. |
In information technology, Apple, Facebook, and MasterCard made strong advances.
| • | See “Comments on Largest Holdings” below for discussion of Apple. |
| • | Internet-based social platform Facebook has successfully implemented its mobile interface, and revenue from both mobile and desktop has improved. Jennison believes that as the company solidifies its dominant position, it continues to increase its appeal to both users and advertisers. Long-term, largely untapped growth drivers include Instagram, WhatsApp, Messenger, and Oculus. Advertising revenue growth has been accelerating, and user growth and engagement remain healthy. |
| • | Jennison expects MasterCard, the No. 2 payment system in the US, to continue to benefit from the long-term shift from cash to electronic credit and debit transactions. The company’s total cardholder spending volume, processed transactions, and cross-border volume have shown healthy growth. |
Which holdings detracted most from the Fund’s return?
Energy positions were key detractors from the Fund’s return.
| • | Energy equipment and services providers National Oilwell Varco, Seadrill, and Schlumberger were pressured as falling energy prices caused their customers to curtail spending. |
| • | Energy exploration and productions companies ExxonMobil and Chevron were likewise hit by greatly reduced energy prices. |
In consumer discretionary, Discovery Communications lost ground.
| • | Cable network Discovery Communications is the largest nonfiction media company in the world and one of the most profitable companies in the media industry. Its decline reflected decelerating domestic advertising growth. |
Were there significant changes to the portfolio?
The Fund’s weights in information technology, financials, and industrials increased, while its weights in energy and health care decreased. Relative to the Growth Index,
| Prudential Jennison Conservative Growth Fund | 7 |
Strategy and Performance Overview (continued)
the Fund was overweight financials, energy, and utilities, and underweight consumer staples, information technology, industrials, health care, and consumer discretionary.
Positions initiated in the period include Cardinal Health, Bristol-Myers Squibb, and Altria. Positions eliminated include Kohl’s, Wal-Mart, and Procter & Gamble.
| 8 | Visit our website at www.prudentialfunds.com |
Comments on Largest Holdings
| 4.7% | Apple, Inc., Technology Hardware, Storage & Peripherals |
Apple designs, manufactures, and markets personal computers (Mac mini, iMac, MacBook, Mac Pro, and MacBook Pro), mobile communication devices (iPhone, iPad), and portable digital music and video players (iPod). The company’s fundamental strength reflects expanding global acceptance of its platform. Jennison expects that new products and updates will sustain attractive revenue growth in the medium term.
| 3.7% | Amazon.com, Inc., Internet & Catalog Retail |
Amazon has been increasing its business investment to drive unit growth not only in its core retail business but through the proliferation of digital commerce via the mobile market. The stock has benefited as investors increasingly appreciate Amazon’s strong execution, long-term revenue growth, margin-expansion potential, and Amazon Web Services (AWS) cloud infrastructure opportunities.
| 2.9% | Walt Disney Co. (The), Media |
Walt Disney is the world’s largest media conglomerate, with one of the sector’s most balanced portfolios. Its TV holdings include the ABC television network and broadcast stations, as well as a portfolio of cable networks including ABC Family, the Disney Channel, and ESPN. Walt Disney Studios produces films through imprints Walt Disney Pictures, Touchstone, and Pixar, while Marvel Entertainment is a top comic book publisher and film producer. In addition, Walt Disney Parks and Resorts operates the company’s popular theme parks including Walt Disney World and Disneyland. In a challenging environment for media stocks, Disney’s diversified business model and strong franchises have largely insulated it from secular concerns that have hit the sector, including a weak advertising market and consolidating distributor network.
| 2.8% | Bristol-Myers Squibb Co., Pharmaceuticals |
Bristol-Myers Squibb is a leader in the development of oncology active immune therapy, an approach that leverages a patient’s own immune system. Jennison believes immunotherapy could result in more durable responses to cancers and become the backbone of cancer treatment protocols in the next decade. The US Food and Drug Administration approved the company’s Opdivo for patients with melanoma in December 2014 and advanced lung cancer in March. Jennison likes Bristol’s overall immune-oncology program and believes the company will continue to benefit from product momentum, new product launches, pipeline data, and strong business development deals.
| 2.5% | Morgan Stanley, Capital Markets |
Morgan Stanley’s investment banking, equities, and wealth and asset management businesses continue to improve. Jennison believes the company benefits from a balanced and diversified business model, and views the firm as a formidable competitor in each of the major businesses in which it competes.
| Prudential Jennison Conservative Growth Fund | 9 |
Fees and Expenses (Unaudited)
As a shareholder of the Fund, you incur two types of costs: (1) transaction costs, including sales charges (loads) on purchase payments and redemptions, as applicable, and (2) ongoing costs, including management fees, distribution and/or service (12b-1) fees, and other Fund expenses, as applicable. This example is intended to help you understand your ongoing costs (in dollars) of investing in the Fund and to compare these costs with the ongoing costs of investing in other mutual funds.
The example is based on an investment of $1,000 invested on February 1, 2015, at the beginning of the period, and held through the six-month period ended July 31, 2015. The example is for illustrative purposes only; you should consult the Prospectus for information on initial and subsequent minimum investment requirements.
Actual Expenses
The first line for each share class in the table on the following page provides information about actual account values and actual expenses. You may use the information on this line, together with the amount you invested, to estimate the expenses that you paid over the period. Simply divide your account value by $1,000 (for example, an $8,600 account value ÷ $1,000 = 8.6), then multiply the result by the number on the first line under the heading “Expenses Paid During the Six-Month Period” to estimate the expenses you paid on your account during this period.
Hypothetical Example for Comparison Purposes
The second line for each share class in the table on the following page provides information about hypothetical account values and hypothetical expenses based on the Fund’s actual expense ratio and an assumed rate of return of 5% per year before expenses, which is not the Fund’s actual return. The hypothetical account values and expenses may not be used to estimate the actual ending account balance or expenses you paid for the period. You may use this information to compare the ongoing costs of investing in the Fund and other funds. To do so, compare this 5% hypothetical example with the 5% hypothetical examples that appear in the shareholder reports of the other funds.
The Fund’s transfer agent may charge additional fees to holders of certain accounts that are not included in the expenses shown in the table on the following page. These fees apply to individual retirement accounts (IRAs) and Section 403(b) accounts. As of the close of the six-month period covered by the table, IRA fees included an annual maintenance fee of $15 per account (subject to a maximum annual maintenance fee of $25 for all accounts held by the same shareholder). Section 403(b) accounts are charged an annual $25 fiduciary maintenance fee. Some of the fees may vary in amount, or may be waived, based on your total account balance or the number of
| 10 | Visit our website at www.prudentialfunds.com |
Prudential Investments Funds, including the Fund, that you own. You should consider the additional fees that were charged to your Fund account over the six-month period when you estimate the total ongoing expenses paid over the period and the impact of these fees on your ending account value, as these additional expenses are not reflected in the information provided in the expense table. Additional fees have the effect of reducing investment returns.
Please note that the expenses shown in the table are meant to highlight your ongoing costs only and do not reflect any transactional costs such as sales charges (loads). Therefore, the second line for each share class in the table is useful in comparing ongoing costs only and will not help you determine the relative total costs of owning different funds. In addition, if these transactional costs were included, your costs would have been higher.
| Prudential Jennison Conservative Growth Fund | Beginning Account Value February 1, 2015 | Ending Account Value July 31, 2015 | Annualized Expense Ratio Based on the Six-Month Period | Expenses Paid During the Six-Month Period* | ||||||||||||||
| Class A | Actual | $ | 1,000.00 | $ | 1,079.10 | 1.18 | % | $ | 6.08 | |||||||||
| Hypothetical | $ | 1,000.00 | $ | 1,018.94 | 1.18 | % | $ | 5.91 | ||||||||||
| Class B | Actual | $ | 1,000.00 | $ | 1,074.80 | 1.93 | % | $ | 9.93 | |||||||||
| Hypothetical | $ | 1,000.00 | $ | 1,015.22 | 1.93 | % | $ | 9.64 | ||||||||||
| Class C | Actual | $ | 1,000.00 | $ | 1,074.80 | 1.93 | % | $ | 9.93 | |||||||||
| Hypothetical | $ | 1,000.00 | $ | 1,015.22 | 1.93 | % | $ | 9.64 | ||||||||||
*Fund expenses (net of fee waivers or subsidies, if any) for each share class are equal to the annualized expense ratio for each share class (provided in the table), multiplied by the average account value over the period, multiplied by the 181 days in the six-month period ended July 31, 2015, and divided by the 365 days in the Fund’s fiscal year ended July 31, 2015 (to reflect the six-month period). Expenses presented in the table include the expenses of any underlying portfolios in which the Fund may invest.
| Prudential Jennison Conservative Growth Fund | 11 |
Fees and Expenses (continued)
The Fund’s annualized expense ratios for the 12-month period ended July 31, 2015, are as follows:
| Class | Gross Operating Expenses | Net Operating Expenses | ||||||
A | 1.29 | % | 1.24 | % | ||||
B | 1.99 | 1.99 | ||||||
C | 1.99 | 1.99 | ||||||
Net operating expenses shown above reflect fee waivers and/or expense reimbursements. Additional information on Fund expenses and any fee waivers and/or expense reimbursements can be found in the “Financial Highlights” tables in this report and in the Notes to the Financial Statements in this report.
| 12 | Visit our website at www.prudentialfunds.com |
Portfolio of Investments
as of July 31, 2015
| Shares | Value (Note 1) | |||||||
LONG-TERM INVESTMENTS 99.3% | ||||||||
COMMON STOCKS | ||||||||
Aerospace & Defense 2.7% | ||||||||
Boeing Co. (The) | 3,429 | $ | 494,359 | |||||
General Dynamics Corp. | 19,449 | 2,900,041 | ||||||
United Technologies Corp. | 32,398 | 3,249,843 | ||||||
|
| |||||||
| 6,644,243 | ||||||||
Automobiles 0.1% | ||||||||
Tesla Motors, Inc.*(a) | 1,073 | 285,579 | ||||||
Banks 4.7% | ||||||||
Bank of America Corp. | 137,603 | 2,460,342 | ||||||
Citigroup, Inc. | 39,549 | 2,312,034 | ||||||
JPMorgan Chase & Co. | 48,526 | 3,325,487 | ||||||
Wells Fargo & Co. | 60,988 | 3,529,376 | ||||||
|
| |||||||
| 11,627,239 | ||||||||
Beverages 0.4% | ||||||||
Dr. Pepper Snapple Group, Inc. | 11,353 | 910,738 | ||||||
Biotechnology 2.3% | ||||||||
Amgen, Inc. | 13,982 | 2,469,081 | ||||||
Biogen, Inc.* | 6,098 | 1,943,921 | ||||||
Celgene Corp.* | 99 | 12,994 | ||||||
Gilead Sciences, Inc. | 11,347 | 1,337,357 | ||||||
|
| |||||||
| 5,763,353 | ||||||||
Capital Markets 7.4% | ||||||||
Ameriprise Financial, Inc. | 9,314 | 1,170,490 | ||||||
Bank of New York Mellon Corp. (The) | 85,120 | 3,694,208 | ||||||
BlackRock, Inc. | 10,334 | 3,475,531 | ||||||
Invesco Ltd. | 94,958 | 3,665,379 | ||||||
Morgan Stanley | 157,946 | 6,134,623 | ||||||
|
| |||||||
| 18,140,231 | ||||||||
Chemicals 1.3% | ||||||||
Dow Chemical Co. (The) | 69,865 | 3,287,847 | ||||||
Consumer Finance 1.0% | ||||||||
Ally Financial, Inc.* | 112,601 | 2,563,925 | ||||||
See Notes to Financial Statements.
| Prudential Jennison Conservative Growth Fund | 13 |
Portfolio of Investments
as of July 31, 2015 continued
| Shares | Value (Note 1) | |||||||
COMMON STOCKS (Continued) | ||||||||
Diversified Financial Services 1.0% | ||||||||
Berkshire Hathaway, Inc. (Class B Stock)* | 16,262 | $ | 2,321,238 | |||||
Diversified Telecommunication Services 0.5% | ||||||||
Verizon Communications, Inc. | 25,934 | 1,213,452 | ||||||
Electrical Equipment 1.4% | ||||||||
Emerson Electric Co. | 64,750 | 3,350,813 | ||||||
Energy Equipment & Services 0.6% | ||||||||
Schlumberger Ltd. | 18,143 | 1,502,603 | ||||||
Food & Staples Retailing 2.7% | ||||||||
Costco Wholesale Corp. | 32,349 | 4,700,310 | ||||||
CVS Health Corp. | 16,809 | 1,890,508 | ||||||
|
| |||||||
| 6,590,818 | ||||||||
Food Products 2.0% | ||||||||
ConAgra Foods, Inc. | 80,502 | 3,546,918 | ||||||
Tyson Foods, Inc. (Class A Stock) | 29,957 | 1,328,593 | ||||||
|
| |||||||
| 4,875,511 | ||||||||
Health Care Equipment & Supplies 1.8% | ||||||||
Abbott Laboratories | 13,141 | 666,117 | ||||||
Baxter International, Inc. | 92,392 | 3,703,072 | ||||||
|
| |||||||
| 4,369,189 | ||||||||
Health Care Providers & Services 2.5% | ||||||||
Anthem, Inc. | 21,731 | 3,352,442 | ||||||
Cardinal Health, Inc. | 33,288 | 2,828,814 | ||||||
|
| |||||||
| 6,181,256 | ||||||||
Hotels, Restaurants & Leisure 0.6% | ||||||||
Starbucks Corp. | 26,438 | 1,531,553 | ||||||
Independent Power & Renewable Electricity Producers 1.3% | ||||||||
Calpine Corp.* | 173,807 | 3,180,668 | ||||||
Insurance 1.6% | ||||||||
Markel Corp.* | 4,419 | 3,931,805 | ||||||
See Notes to Financial Statements.
| 14 |
| Shares | Value (Note 1) | |||||||
COMMON STOCKS (Continued) | ||||||||
Internet & Catalog Retail 7.5% | ||||||||
Amazon.com, Inc.* | 17,057 | $ | 9,145,111 | |||||
Expedia, Inc. | 3,856 | 468,273 | ||||||
JD.com, Inc. (China), ADR* | 76,212 | 2,517,282 | ||||||
Netflix, Inc.* | 51,359 | 5,870,847 | ||||||
Priceline Group, Inc. (The)* | 283 | 351,930 | ||||||
Vipshop Holdings Ltd. (China), ADR*(a) | 9,637 | 187,825 | ||||||
|
| |||||||
| 18,541,268 | ||||||||
Internet Software & Services 7.3% | ||||||||
Alibaba Group Holding Ltd. (China), ADR*(a) | 34,093 | 2,670,846 | ||||||
Facebook, Inc. (Class A Stock)* | 60,953 | 5,730,192 | ||||||
Google, Inc. (Class A Stock)* | 8,327 | 5,475,002 | ||||||
LinkedIn Corp. (Class A Stock)* | 1,225 | 248,993 | ||||||
Tencent Holdings Ltd. (China), ADR(a) | 207,330 | 3,858,411 | ||||||
|
| |||||||
| 17,983,444 | ||||||||
IT Services 5.6% | ||||||||
DST Systems, Inc. | 4,873 | 531,888 | ||||||
International Business Machines Corp. | 21,827 | 3,535,756 | ||||||
MasterCard, Inc. (Class A Stock) | 50,213 | 4,890,746 | ||||||
Visa, Inc. (Class A Stock) | 63,757 | 4,803,452 | ||||||
|
| |||||||
| 13,761,842 | ||||||||
Life Sciences Tools & Services 0.3% | ||||||||
Illumina, Inc.* | 3,426 | 751,322 | ||||||
Machinery 3.9% | ||||||||
Caterpillar, Inc.(a) | 32,388 | 2,546,668 | ||||||
Deere & Co. | 26,011 | 2,459,860 | ||||||
Parker-Hannifin Corp.(a) | 30,648 | 3,455,562 | ||||||
Stanley Black & Decker, Inc. | 11,483 | 1,211,342 | ||||||
|
| |||||||
| 9,673,432 | ||||||||
Media 3.6% | ||||||||
Time Warner, Inc. | 19,083 | 1,680,067 | ||||||
Walt Disney Co. (The) | 59,918 | 7,190,160 | ||||||
|
| |||||||
| 8,870,227 | ||||||||
Multiline Retail 2.4% | ||||||||
Dollar General Corp. | 18,892 | 1,518,350 | ||||||
See Notes to Financial Statements.
| Prudential Jennison Conservative Growth Fund | 15 |
Portfolio of Investments
as of July 31, 2015 continued
| Shares | Value (Note 1) | |||||||
COMMON STOCKS (Continued) | ||||||||
Multiline Retail (cont’d.) | ||||||||
Macy’s, Inc. | 17,876 | $ | 1,234,517 | |||||
Target Corp. | 39,263 | 3,213,676 | ||||||
|
| |||||||
| 5,966,543 | ||||||||
Multi-Utilities 1.6% | ||||||||
Dominion Resources, Inc. | 53,532 | 3,838,244 | ||||||
Oil, Gas & Consumable Fuels 6.8% | ||||||||
Chevron Corp. | 24,412 | 2,159,974 | ||||||
Exxon Mobil Corp. | 54,631 | 4,327,322 | ||||||
HollyFrontier Corp.(a) | 22,990 | 1,109,497 | ||||||
Marathon Petroleum Corp. | 66,773 | 3,650,480 | ||||||
Range Resources Corp. | 27,639 | 1,087,318 | ||||||
Tesoro Corp. | 40,551 | 3,947,234 | ||||||
World Fuel Services Corp. | 10,877 | 442,150 | ||||||
|
| |||||||
| 16,723,975 | ||||||||
Pharmaceuticals 8.3% | ||||||||
Allergan PLC* | 6,070 | 2,010,080 | ||||||
Bristol-Myers Squibb Co. | 106,157 | 6,968,145 | ||||||
Eli Lilly & Co. | 6,856 | 579,401 | ||||||
Johnson & Johnson | 17,758 | 1,779,529 | ||||||
Merck & Co., Inc. | 62,333 | 3,675,154 | ||||||
Novo Nordisk A/S (Denmark), ADR | 45,769 | 2,698,540 | ||||||
Shire PLC (Ireland), ADR | 10,439 | 2,785,230 | ||||||
|
| |||||||
| 20,496,079 | ||||||||
Real Estate Investment Trusts (REITs) 0.8% | ||||||||
Health Care REIT, Inc. | 27,717 | 1,922,728 | ||||||
Semiconductors & Semiconductor Equipment 2.0% | ||||||||
ARM Holdings PLC (United Kingdom), ADR | 30,650 | 1,441,776 | ||||||
Intel Corp. | 118,965 | 3,444,037 | ||||||
|
| |||||||
| 4,885,813 | ||||||||
Software 4.4% | ||||||||
Adobe Systems, Inc.* | 8,847 | 725,366 | ||||||
Microsoft Corp. | 80,782 | 3,772,519 | ||||||
Oracle Corp. | 42,030 | 1,678,678 | ||||||
See Notes to Financial Statements.
| 16 |
| Shares | Value (Note 1) | |||||||
COMMON STOCKS (Continued) | ||||||||
Software (cont’d.) | ||||||||
Red Hat, Inc.* | 47,068 | $ | 3,722,138 | |||||
salesforce.com, inc.* | 13,590 | 996,147 | ||||||
|
| |||||||
| 10,894,848 | ||||||||
Specialty Retail 1.4% | ||||||||
Industria de Diseno Textil SA (Spain), ADR | 148,508 | 2,546,912 | ||||||
Penske Automotive Group, Inc. | 17,835 | 963,090 | ||||||
|
| |||||||
| 3,510,002 | ||||||||
Technology Hardware, Storage & Peripherals 4.7% | ||||||||
Apple, Inc. | 94,533 | 11,466,853 | ||||||
Textiles, Apparel & Luxury Goods 1.8% | ||||||||
Luxottica Group SpA (Italy), ADR | 22,735 | 1,641,922 | ||||||
NIKE, Inc. (Class B Stock) | 25,129 | 2,895,363 | ||||||
|
| |||||||
| 4,537,285 | ||||||||
Tobacco 1.0% | ||||||||
Altria Group, Inc. | 38,277 | 2,081,503 | ||||||
Reynolds American, Inc. | 5,420 | 464,982 | ||||||
|
| |||||||
| 2,546,485 | ||||||||
|
| |||||||
TOTAL LONG-TERM INVESTMENTS | 244,642,451 | |||||||
|
| |||||||
SHORT-TERM INVESTMENT 5.5% | ||||||||
AFFILIATED MONEY MARKET MUTUAL FUND | ||||||||
Prudential Investment Portfolios 2 - Prudential Core Taxable Money Market Fund | 13,619,891 | 13,619,891 | ||||||
|
| |||||||
TOTAL INVESTMENTS 104.8% | 258,262,342 | |||||||
Liabilities in excess of other assets (4.8)% | (11,907,234 | ) | ||||||
|
| |||||||
NET ASSETS 100.0% | $ | 246,355,108 | ||||||
|
| |||||||
See Notes to Financial Statements.
| Prudential Jennison Conservative Growth Fund | 17 |
Portfolio of Investments
as of July 31, 2015 continued
The following abbreviation is used in the portfolio descriptions:
ADR—American Depositary Receipt
| * | Non-income producing security. |
| (a) | All or a portion of security is on loan. The aggregate market value of such securities, including those sold and pending settlement, is $11,249,639; cash collateral of $11,541,608 (included in liabilities) was received with which the Fund purchased highly liquid short-term investments. Securities on loan are subject to contractual netting arrangements. |
| (b) | Prudential Investments LLC, the manager of the Fund, also serves as manager of the Prudential Investment Portfolios 2 - Prudential Core Taxable Money Market. |
| (c) | Represents security, or a portion thereof, purchased with cash collateral received for securities on loan. |
Various inputs are used in determining the value of the Fund’s investments. These inputs are summarized in the three broad levels listed below.
Level 1—quoted prices generally in active markets for identical securities.
Level 2—quoted prices for similar securities, interest rates and yield curves, prepayment speeds, foreign currency exchange rates and other observable inputs.
Level 3—unobservable inputs for securities valued in accordance with Board approved fair valuation procedures.
The following is a summary of the inputs used as of July 31, 2015 in valuing such portfolio securities:
| Level 1 | Level 2 | Level 3 | ||||||||||
Investments in Securities | ||||||||||||
Common Stocks | ||||||||||||
Aerospace & Defense | $ | 6,644,243 | $ | — | $ | — | ||||||
Automobiles | 285,579 | — | — | |||||||||
Banks | 11,627,239 | — | — | |||||||||
Beverages | 910,738 | — | — | |||||||||
Biotechnology | 5,763,353 | — | — | |||||||||
Capital Markets | 18,140,231 | — | — | |||||||||
Chemicals | 3,287,847 | — | — | |||||||||
Consumer Finance | 2,563,925 | — | — | |||||||||
Diversified Financial Services | 2,321,238 | — | — | |||||||||
Diversified Telecommunication Services | 1,213,452 | — | — | |||||||||
Electrical Equipment | 3,350,813 | — | — | |||||||||
Energy Equipment & Services | 1,502,603 | — | — | |||||||||
Food & Staples Retailing | 6,590,818 | — | — | |||||||||
Food Products | 4,875,511 | — | — | |||||||||
See Notes to Financial Statements.
| 18 |
| Level 1 | Level 2 | Level 3 | ||||||||||
Common Stocks (continued) | ||||||||||||
Health Care Equipment & Supplies | $ | 4,369,189 | $ | — | $ | — | ||||||
Health Care Providers & Services | 6,181,256 | — | — | |||||||||
Hotels, Restaurants & Leisure | 1,531,553 | — | — | |||||||||
Independent Power & Renewable Electricity Producers | 3,180,668 | — | — | |||||||||
Insurance | 3,931,805 | — | — | |||||||||
Internet & Catalog Retail | 18,541,268 | — | — | |||||||||
Internet Software & Services | 17,983,444 | — | — | |||||||||
IT Services | 13,761,842 | — | — | |||||||||
Life Sciences Tools & Services | 751,322 | — | — | |||||||||
Machinery | 9,673,432 | — | — | |||||||||
Media | 8,870,227 | — | — | |||||||||
Multiline Retail | 5,966,543 | — | — | |||||||||
Multi-Utilities | 3,838,244 | — | — | |||||||||
Oil, Gas & Consumable Fuels | 16,723,975 | — | — | |||||||||
Pharmaceuticals | 20,496,079 | — | — | |||||||||
Real Estate Investment Trusts (REITs) | 1,922,728 | — | — | |||||||||
Semiconductors & Semiconductor Equipment | 4,885,813 | — | — | |||||||||
Software | 10,894,848 | — | — | |||||||||
Specialty Retail | 3,510,002 | — | — | |||||||||
Technology Hardware, Storage & Peripherals | 11,466,853 | — | — | |||||||||
Textiles, Apparel & Luxury Goods | 4,537,285 | — | — | |||||||||
Tobacco | 2,546,485 | — | — | |||||||||
Affiliated Money Market Mutual Fund | 13,619,891 | — | — | |||||||||
|
|
|
|
|
| |||||||
Total | $ | 258,262,342 | $ | — | $ | — | ||||||
|
|
|
|
|
| |||||||
The industry classification of investments and liabilities in excess of other assets shown as a percentage of net assets as of July 31, 2015 was as follows (Unaudited):
Pharmaceuticals | 8.3 | % | ||
Internet & Catalog Retail | 7.5 | |||
Capital Markets | 7.4 | |||
Internet Software & Services | 7.3 | |||
Oil, Gas & Consumable Fuels | 6.8 | |||
IT Services | 5.6 | |||
Affiliated Money Market Mutual Fund (including 4.7% of collateral for securities on loan) | 5.5 | |||
Banks | 4.7 | |||
Technology Hardware, Storage & Peripherals | 4.7 | |||
Software | 4.4 | |||
Machinery | 3.9 | |||
Media | 3.6 | |||
Aerospace & Defense | 2.7 | % | ||
Food & Staples Retailing | 2.7 | |||
Health Care Providers & Services | 2.5 | |||
Multiline Retail | 2.4 | |||
Biotechnology | 2.3 | |||
Semiconductors & Semiconductor Equipment | 2.0 | |||
Food Products | 2.0 | |||
Textiles, Apparel & Luxury Goods | 1.8 | |||
Health Care Equipment & Supplies | 1.8 | |||
Insurance | 1.6 | |||
Multi-Utilities | 1.6 | |||
Specialty Retail | 1.4 | |||
Electrical Equipment | 1.4 |
See Notes to Financial Statements.
| Prudential Jennison Conservative Growth Fund | 19 |
Portfolio of Investments
as of July 31, 2015 continued
Industry (cont’d.) | ||||
Chemicals | 1.3 | % | ||
Independent Power & Renewable Electricity Producers | 1.3 | |||
Consumer Finance | 1.0 | |||
Tobacco | 1.0 | |||
Diversified Financial Services | 1.0 | |||
Real Estate Investment Trusts (REITs) | 0.8 | |||
Hotels, Restaurants & Leisure | 0.6 | |||
Energy Equipment & Services | 0.6 | % | ||
Diversified Telecommunication Services | 0.5 | |||
Beverages | 0.4 | |||
Life Sciences Tools & Services | 0.3 | |||
Automobiles | 0.1 | |||
|
| |||
| 104.8 | ||||
Liabilities in excess of other assets | (4.8 | ) | ||
|
| |||
| 100.0 | % | |||
|
| |||
See Notes to Financial Statements.
| 20 |
PRUDENTIAL INVESTMENTS»MUTUAL FUNDS
FINANCIAL STATEMENTS
ANNUAL REPORT · JULY 31, 2015
Prudential Jennison Conservative Growth Fund
Statement of Assets & Liabilities
as of July 31, 2015
Assets | ||||
Investments at value, including securities on loan of $11,249,639: | ||||
Unaffiliated investments (cost $199,488,588) | $ | 244,642,451 | ||
Affiliated investments (cost $13,619,891) | 13,619,891 | |||
Dividends and interest receivable | 187,632 | |||
Receivable for Fund shares sold | 42,119 | |||
Tax reclaim receivable | 19,903 | |||
|
| |||
Total Assets | 258,511,996 | |||
|
| |||
Liabilities | ||||
Payable to broker for collateral for securities on loan | 11,541,608 | |||
Payable for Fund shares reacquired | 190,482 | |||
Accrued expenses and other liabilities | 152,641 | |||
Management fee payable | 145,419 | |||
Distribution fee payable | 89,573 | |||
Affiliated transfer agent fee payable | 36,401 | |||
Deferred trustees’ fees | 764 | |||
|
| |||
Total Liabilities | 12,156,888 | |||
|
| |||
Net Assets | $ | 246,355,108 | ||
|
| |||
Net assets were comprised of: | ||||
Shares of beneficial interest, at par | $ | 21,233 | ||
Paid-in capital in excess of par | 184,327,788 | |||
|
| |||
| 184,349,021 | ||||
Undistributed net investment income | 527,817 | |||
Accumulated net realized gain on investment transactions | 16,324,407 | |||
Net unrealized appreciation on investments | 45,153,863 | |||
|
| |||
Net assets, July 31, 2015 | $ | 246,355,108 | ||
|
| |||
See Notes to Financial Statements.
| 22 |
Class A | ||||
Net asset value and redemption price per share | $ | 12.01 | ||
Maximum sales charge (5.50% of offering price) | 0.70 | |||
|
| |||
Maximum offering price to public | $ | 12.71 | ||
|
| |||
Class B | ||||
Net asset value, offering price and redemption price per share | $ | 10.49 | ||
|
| |||
Class C | ||||
Net asset value, offering price and redemption price per share | $ | 10.49 | ||
|
| |||
See Notes to Financial Statements.
| Prudential Jennison Conservative Growth Fund | 23 |
Statement of Operations
Year Ended July 31, 2015
Net Investment Income | ||||
Income | ||||
Unaffiliated dividend income (net of foreign withholding taxes of $33,977) | $ | 4,165,324 | ||
Affiliated income from securities lending, net | 7,648 | |||
Affiliated dividend income | 4,150 | |||
|
| |||
Total income | 4,177,122 | |||
|
| |||
Expenses | ||||
Management fee | 1,699,726 | |||
Distribution fee—Class A | 544,316 | |||
Distribution fee—Class B | 48,006 | |||
Distribution fee—Class C | 565,794 | |||
Transfer agent’s fees and expenses (including affiliated expense of $165,800) | 501,000 | |||
Custodian and accounting fees | 64,000 | |||
Registration fees | 45,000 | |||
Shareholders’ reports | 29,000 | |||
Audit fee | 23,000 | |||
Legal fees and expenses | 20,000 | |||
Trustees’ fees | 18,000 | |||
Insurance expenses | 3,000 | |||
Loan interest expense | 80 | |||
Miscellaneous | 11,710 | |||
|
| |||
Total expenses | 3,572,632 | |||
Less: Distribution fee waiver—Class A | (90,722 | ) | ||
|
| |||
Net expenses | 3,481,910 | |||
|
| |||
Net investment income | 695,212 | |||
|
| |||
Realized And Unrealized Gain (Loss) On Investments | ||||
Net realized gain on investment transactions | 20,291,292 | |||
Net change in unrealized appreciation (depreciation) on investments | 5,651,857 | |||
|
| |||
Net gain on investment transactions | 25,943,149 | |||
|
| |||
Net Increase In Net Assets Resulting From Operations | $ | 26,638,361 | ||
|
| |||
See Notes to Financial Statements.
| 24 |
Statement of Changes in Net Assets
| Year Ended July 31, | ||||||||
| 2015 | 2014 | |||||||
Increase (Decrease) in Net Assets | ||||||||
Operations | ||||||||
Net investment income | $ | 695,212 | $ | 372,097 | ||||
Net realized gain on investment transactions | 20,291,292 | 44,021,889 | ||||||
Net change in unrealized appreciation (depreciation) on investments | 5,651,857 | (7,342,311 | ) | |||||
|
|
|
| |||||
Net increase in net assets resulting from operations | 26,638,361 | 37,051,675 | ||||||
|
|
|
| |||||
Dividends and Distributions (Note 1) | ||||||||
Dividends from net investment income | ||||||||
Class A | (525,523 | ) | (354,917 | ) | ||||
|
|
|
| |||||
Distributions from net realized gains | ||||||||
Class A | (15,995,502 | ) | (6,666,448 | ) | ||||
Class B | (491,252 | ) | (248,876 | ) | ||||
Class C | (5,722,598 | ) | (2,438,100 | ) | ||||
Class X | — | (21,149 | ) | |||||
|
|
|
| |||||
| (22,209,352 | ) | (9,374,573 | ) | |||||
|
|
|
| |||||
Fund share transactions (Net of share conversions) (Note 6) | ||||||||
Net proceeds from shares sold | 10,657,979 | 10,564,986 | ||||||
Net asset value of shares issued in reinvestment of dividends | 22,321,741 | 9,515,343 | ||||||
Cost of shares reacquired | (27,454,459 | ) | (27,315,402 | ) | ||||
|
|
|
| |||||
Net increase (decrease) in net assets from Fund share transactions | 5,525,261 | (7,235,073 | ) | |||||
|
|
|
| |||||
Total increase | 9,428,747 | 20,087,112 | ||||||
Net Assets: | ||||||||
Beginning of year | 236,926,361 | 216,839,249 | ||||||
|
|
|
| |||||
End of year(a) | $ | 246,355,108 | $ | 236,926,361 | ||||
|
|
|
| |||||
(a) Includes undistributed net investment income of: | $ | 527,817 | $ | 353,426 | ||||
|
|
|
| |||||
See Notes to Financial Statements.
| Prudential Jennison Conservative Growth Fund | 25 |
Notes to Financial Statements
Prudential Investment Portfolios 5 (the “Trust”) is an open-end management investment company, registered under the Investment Company Act of 1940, as amended (“1940 Act”), which was established as a Delaware business trust on July 8, 1999. The Trust consists of two separate funds: Prudential Jennison Conservative Growth Fund and Prudential Jennison Rising Dividend Fund. These financial statements relate to Prudential Jennison Conservative Growth Fund (the “Fund”). The financial statements of the other fund are not presented herein.
The Fund’s investment objective is long-term capital appreciation.
1. Accounting Policies
The Trust follows investment company accounting and reporting guidance of the Financial Accounting Standards Board (FASB) Accounting Standard Codification Topic 946 Financial Services—Investment Companies. The following accounting policies conform to U.S. generally accepted accounting principles. The Trust and the Fund consistently follow such policies in the preparation of its financial statements.
Securities Valuation: The Fund holds securities and other assets that are fair valued at the close of each day the New York Stock Exchange (“NYSE”) is open for trading. Fair value is the price that would be received to sell an asset or paid to transfer a liability in an orderly transaction between market participants on the measurement date. The Board of Trustees (the “Board”) has adopted Valuation Procedures for security valuation under which fair valuation responsibilities have been delegated to Prudential Investments LLC (“PI” or “Manager”). Under the current Valuation Procedures, the established Valuation Committee is responsible for supervising the valuation of portfolio securities and other assets. The Valuation Procedures permit the Fund to utilize independent pricing vendor services, quotations from market makers, and alternative valuation methods when market quotations are either not readily available or not deemed representative of fair value. A record of the Valuation Committee’s actions is subject to the Board’s review, approval and ratification at its next regularly-scheduled quarterly meeting.
Various inputs determine how the Fund’s investments are valued, all of which are categorized according to the three broad levels (Level 1, 2, or 3) detailed in the table following the Portfolio of Investments.
| 26 |
Common and preferred stocks, exchange-traded funds, and derivative instruments such as futures or options that are traded on a national securities exchange are valued at the last sale price as of the close of trading on the applicable exchange where the security principally trades. Securities traded via NASDAQ are valued at the NASDAQ official closing price. To the extent these securities are valued at the last sale price or NASDAQ official closing price, they are classified as Level 1 in the fair value hierarchy.
In the event that no sale or official closing price on valuation date exists, these securities are generally valued at the mean between the last reported bid and ask prices, or at the last bid price in the absence of an ask price. These securities are classified as Level 2 in the fair value hierarchy.
Common and preferred stocks traded on foreign securities exchanges are valued using pricing vendor services that provide model prices derived using adjustment factors based on information such as local closing price, relevant general and sector indices, currency fluctuations, depositary receipts, and futures, as applicable. Securities valued using such model prices are classified as Level 2 in the fair value hierarchy. Such securities are valued using model prices to the extent that the valuation meets the established confidence level for each security. If the confidence level is not met or the vendor does not provide a model price, securities are valued in accordance with exchange-traded common and preferred stocks discussed above.
Investments in open-end, non-exchange-traded mutual funds are valued at their net asset values as of the close of the NYSE on the date of valuation. These securities are classified as Level 1 in the fair value hierarchy since they may be purchased or sold at their net asset values on the date of valuation.
Fixed income securities traded in the over-the-counter market are generally valued at prices provided by approved independent pricing vendors. The pricing vendors provide these prices after evaluating observable inputs including, but not limited to yield curves, credit ratings, yield spreads, deal terms, tranche level attributes, default rates, cash flows, prepayment speeds, broker/dealer quotations and reported trades. Securities valued using such vendor prices are classified as Level 2 in the fair value hierarchy.
Over-the-counter derivative instruments are generally valued using pricing vendor services, which derive the valuation based on inputs such as underlying asset prices, indices, spreads, interest rates and exchange rates. These instruments are categorized as Level 2 in the fair value hierarchy.
| Prudential Jennison Conservative Growth Fund | 27 |
Notes to Financial Statements
continued
Centrally cleared swaps listed or traded on a multilateral or trade facility platform, such as a registered exchange, are generally valued at the daily settlement price determined by the respective exchange. These securities are classified as Level 2 in the fair value hierarchy, as the daily settlement price is not public.
Securities and other assets that cannot be priced according to the methods described above are valued based on pricing methodologies approved by the Board. In the event that unobservable inputs are used when determining such valuations, the securities will be classified as Level 3 in the fair value hierarchy.
When determining the fair value of securities, some of the factors influencing the valuation include: the nature of any restrictions on disposition of the securities; assessment of the general liquidity of the securities; the issuer’s financial condition and the markets in which it does business; the cost of the investment; the size of the holding and the capitalization of the issuer; the prices of any recent transactions or bids/offers for such securities or any comparable securities; any available analyst media or other reports or information deemed reliable by the investment adviser regarding the issuer or the markets or industry in which it operates. Using fair value to price securities may result in a value that is different from a security’s most recent closing price and from the price used by other mutual funds to calculate their net asset values.
Foreign Currency Translation: The books and records of the Fund are maintained in U.S. dollars. Foreign currency amounts are translated into U.S. dollars on the following basis:
(i) market value of investment securities, other assets and liabilities-at the current rates of exchange;
(ii) purchases and sales of investment securities, income and expenses-at the rates of exchange prevailing on the respective dates of such transactions.
Although the net assets of the Fund are presented at the foreign exchange rates and market values at the close of the period, the Fund does not isolate that portion of the results of operations arising as a result of changes in the foreign exchange rates from the fluctuations arising from changes in the market prices of long-term portfolio securities held at the end of the period. Similarly, the Fund does not isolate the effect of changes in foreign exchange rates from the fluctuations arising from changes in the
| 28 |
market prices of long-term portfolio securities sold during the period. Accordingly, these realized foreign currency gains or losses are included in the reported net realized gains or losses on investment transactions.
Net realized gains or losses on foreign currency transactions represent net foreign exchange gains or losses from holdings of foreign currencies, forward currency contracts, disposition of foreign currencies, currency gains or losses realized between the trade and settlement dates on securities transactions, and the difference between the amounts of dividends, interest and foreign withholding taxes recorded on the Fund’s books and the U.S. dollar equivalent amounts actually received or paid. Net unrealized currency gains or losses from valuing foreign currency denominated assets and liabilities (other than investments) at period end exchange rates are reflected as a component of net unrealized appreciation (depreciation) on foreign currencies.
Concentration of Risk: Foreign security and currency transactions may involve certain considerations and risks not typically associated with those of domestic origin as a result of, among other factors, the possibility of political and economic instability, or the level of governmental supervision and regulation of foreign securities markets.
Master Netting Arrangements: The Fund is subject to various Master Agreements, or netting arrangements, with select counterparties. These are agreements which a sub-adviser may have negotiated and entered into on behalf of the Fund. A master netting arrangement between the Fund and the counterparty permits the Fund to offset amounts payable by the Fund to the same counterparty against amounts to be received; and by the receipt of collateral from the counterparty by the Fund to cover the Fund’s exposure to the counterparty. However, there is no assurance that such mitigating factors are easily enforceable. The right to set-off exists when all the conditions are met such that each of the parties owes the other determinable amounts, the reporting party has the right to set-off the amount owed with the amount owed by the other party, the reporting party intends to set-off and the right of set-off is enforceable by law. During the reporting period, there were no instances where the right of set-off existed and management has not elected to offset.
REITs: The Fund invests in real estate investment trusts (“REITs”), which report information on the source of their distributions annually. Based on current and historical information, a portion of distributions received from REITs during the period is estimated to be dividend income, capital gain or return of capital and recorded accordingly. These estimates are adjusted periodically when the actual sources of distributions are disclosed by the REITs.
| Prudential Jennison Conservative Growth Fund | 29 |
Notes to Financial Statements
continued
Securities Lending: The Fund may lend its portfolio securities to banks and broker-dealers. The loans are secured by collateral at least equal to the market value of the securities loaned. Collateral pledged by each borrower is invested in a highly liquid short-term money market fund and is marked to market daily, based on the previous day’s market value, such that the value of the collateral exceeds the value of the loaned securities. Loans are subject to termination at the option of the borrower or the Fund. Upon termination of the loan, the borrower will return to the Fund securities identical to the loaned securities. Should the borrower of the securities fail financially, the Fund has the right to repurchase the securities in the open market using the collateral. The Fund recognizes income, net of any rebate and securities lending agent fees, for lending its securities, and any interest on the investment of cash received as collateral. The Fund also continues to receive interest and dividends or amounts equivalent thereto, on the securities loaned and recognizes any unrealized gain or loss in the market price of the securities loaned that may occur during the term of the loan.
Securities Transactions and Net Investment Income: Securities transactions are recorded on the trade date. Realized gains or losses from investment and currency transactions are calculated on the identified cost basis. Dividend income is recorded on the ex-dividend date. Interest income, including amortization of premium and accretion of discount on debt securities, as required, is recorded on an accrual basis. Expenses are recorded on an accrual basis, which may require the use of certain estimates by management that may differ from actual.
Net investment income or loss (other than distribution fees, which are charged directly to the respective class) and unrealized and realized gains or losses are allocated daily to each class of shares based upon the relative proportion of adjusted net assets of each class at the beginning of the day.
Dividends and Distributions: The Fund expects to pay dividends from net investment income annually and distributions from net realized capital gains, if any, annually. Dividends and distributions to shareholders, which are determined in accordance with federal income tax regulations and which may differ from generally accepted accounting principles, are recorded on the ex-dividend date. Permanent book/tax differences relating to income and gains are reclassified amongst undistributed net investment income, accumulated net realized gain or loss and paid-in capital in excess of par, as appropriate.
| 30 |
Taxes: For federal income tax purposes, the Fund is treated as a separate taxpaying entity. It is the Fund’s policy to continue to meet the requirements of the Internal Revenue Code applicable to regulated investment companies and to distribute all of its taxable net investment income and capital gains, if any, to its shareholders. Therefore, no federal income tax provision is required. Withholding taxes on foreign dividends are recorded, net of reclaimable amounts, at the time the related income is earned.
Estimates: The preparation of the financial statements requires management to make estimates and assumptions that affect the reported amounts and disclosures in the financial statements. Actual results could differ from those estimates.
2. Agreements
The Fund has a management agreement with PI. Pursuant to this agreement, PI has responsibility for all investment advisory services and supervises the subadvisor’s performance of such services. PI has entered into a subadvisory agreement with Jennison Associates LLC (“Jennison”). The subadvisory agreement provides that Jennison furnishes investment advisory services in connection with the management of the Fund. In connection therewith, Jennison is obligated to keep certain books and records of the Fund. PI pays for the services of Jennison, the cost of compensation of officers of the Fund, occupancy and certain clerical and bookkeeping costs of the Fund. The Fund bears all other costs and expenses.
The management fee paid to PI is accrued daily and payable monthly at an annual rate of .70% of the Fund’s average daily net assets on the first $500 million, .65% of the average daily net assets on the next $500 million and .60% of the average daily net assets in excess of $1 billion. The effective management fee rate was .70% for the year ended July 31, 2015.
The Fund has a distribution agreement with Prudential Investment Management Services LLC (“PIMS”), which acts as the distributor of the Class A, Class B and Class C shares of the Fund. The Fund compensates PIMS for distributing and servicing the Fund’s Class A, Class B and Class C shares, pursuant to plans of distribution (the “Class A, B and C Plans”), regardless of expenses actually incurred by PIMS. The distribution fees are accrued daily and payable monthly.
Pursuant to the Class A, B and C Plans, the Fund compensates PIMS, as applicable, for distribution related activities at an annual rate of up to .30%, 1% and 1% of the average daily net assets of the Class A, B and C shares, respectively.
| Prudential Jennison Conservative Growth Fund | 31 |
Notes to Financial Statements
continued
PIMS contractually agreed to limit such fees to .25% of the average daily net assets of the Class A shares through November 30, 2015.
PIMS has advised the Fund that it received $96,565 in front-end sales charges resulting from sales of Class A shares during the year ended July 31, 2015. From these fees, PIMS paid such sales charges to affiliated broker-dealers, which in turn paid commissions to salespersons and incurred other distribution costs.
PIMS has advised the Fund that for the year ended July 31, 2015 that it received $125, $5,994 and $815 in contingent deferred sales charges imposed upon redemptions by certain Class A, Class B and Class C shareholders, respectively.
PI, PIMS and Jennison are indirect, wholly-owned subsidiaries of Prudential Financial, Inc. (“Prudential”).
3. Other Transactions with Affiliates
Prudential Mutual Fund Services LLC (“PMFS”), an affiliate of PI and an indirect, wholly-owned subsidiary of Prudential, serves as the Fund’s transfer agent. Transfer agent’s fees and expenses in the Statement of Operations include certain out-of-pocket expenses paid to non-affiliates, where applicable. Prudential Investment Management, Inc. (“PIM”), an indirect, wholly-owned subsidiary of Prudential, is the Fund’s securities lending agent. Earnings from securities lending are disclosed on the Statement of Operations as “Affiliated income from securities lending, net”. For the year ended July 31, 2015, PIM was compensated $2,327 for these services.
The Fund invests in the Prudential Core Taxable Money Market Fund (the “Core Fund”), a portfolio of Prudential Investment Portfolios 2, registered under the 1940 Act and managed by PI. Earnings from the Core Fund are disclosed on the Statement of Operations as “Affiliated dividend income”.
4. Portfolio Securities
Purchases and sales of securities, other than short-term investments and U.S. Government Securities, for the year ended July 31, 2015, were $709,330,626 and $725,998,995, respectively.
| 32 |
5. Distributions and Tax Information
Distributions to shareholders, which are determined in accordance with federal income tax regulations and which may differ from generally accepted accounting principles, are recorded on the ex-dividend date. In order to present undistributed net investment income, accumulated net realized gain on investment transactions and paid-in capital in excess of par on the Statement of Assets and Liabilities that more closely represent their tax character, certain adjustments have been made to undistributed net investment income and accumulated net realized gain on investment transactions. For the year ended July 31, 2015, the adjustments were to increase undistributed net investment income and decrease accumulated net realized gain on investment transactions by $4,702 due to reclassification of distributions. Net investment income, net realized gain on investment transactions and net assets were not affected by this change.
For the year ended July 31, 2015, the tax character of distributions paid were $6,318,494 from ordinary income and $16,416,381 from long-term capital gains. For the year ended July 31, 2014, the tax character of distributions paid were $354,917 from ordinary income and $9,374,573 from long-term capital gains.
As of July 31, 2015, the accumulated undistributed earnings on a tax basis were $6,191,268 of ordinary income and $11,066,468 of long-term capital gains. This differs from the amount shown on the Statement of Assets and Liabilities primarily due to cumulative timing differences between financial and tax reporting.
The United States federal income tax basis of the Fund’s investments and the net unrealized appreciation as of July 31, 2015 were as follows:
Tax Basis | Appreciation | Depreciation | Net | |||
| $213,513,275 | $50,724,713 | $(5,975,646) | $44,749,067 |
The book basis differs from tax basis primarily due to deferred losses on wash sales.
Management has analyzed the Fund’s tax positions taken on federal, state and local income tax returns for all open tax years and has concluded that no provision for income tax is required in the Fund’s financial statements for the current reporting period. The Fund’s federal, state and local income and federal excise tax returns for tax years for which the applicable statutes of limitations have not expired are subject to examination by the Internal Revenue Service and state departments of revenue.
| Prudential Jennison Conservative Growth Fund | 33 |
Notes to Financial Statements
continued
6. Capital
The Fund offers Class A, Class B and Class C shares. Class A shares are subject to a maximum front-end sales charge of 5.50%. All investors who purchase Class A shares in the amount of $1 million or more and sell these shares within 12 months of purchase are subject to a contingent deferred sales charge (“CDSC”) of 1%. The Class A CDSC is waived for purchases by certain retirement or benefit plans. Class B shares are sold with a CDSC which declines from 5% to zero depending on the period of time the shares are held. Class B shares automatically convert to Class A shares on a quarterly basis approximately seven years after purchase. Class B shares are closed to new purchases. Class C shares are sold with a CDSC of 1% on sales of shares purchased during the first 12 months.
Under certain circumstances, an exchange may be made from specified share classes of the Fund to one or more other share classes of the Fund as presented in the table of transactions in shares of common stock.
Transactions in shares of beneficial interest were as follows:
Class A | Shares | Amount | ||||||
Year ended July 31, 2015: | ||||||||
Shares sold | 714,969 | $ | 8,347,424 | |||||
Shares issued in reinvestment of dividends and distributions | 1,431,264 | 16,287,783 | ||||||
Shares reacquired | (1,756,463 | ) | (20,705,364 | ) | ||||
|
|
|
| |||||
Net increase (decrease) in shares outstanding before conversion | 389,770 | 3,929,843 | ||||||
Shares issued upon conversion from other share class(es) | 269,005 | 3,201,400 | ||||||
|
|
|
| |||||
Net increase (decrease) in shares outstanding | 658,775 | $ | 7,131,243 | |||||
|
|
|
| |||||
Year ended July 31, 2014: | ||||||||
Shares sold | 688,947 | $ | 7,710,148 | |||||
Shares issued in reinvestment of dividends and distributions | 631,068 | 6,884,952 | ||||||
Shares reacquired | (1,891,022 | ) | (21,160,174 | ) | ||||
|
|
|
| |||||
Net increase (decrease) in shares outstanding before conversion | (571,007 | ) | (6,565,074 | ) | ||||
Shares issued upon conversion from other share class(es) | 288,550 | 3,295,954 | ||||||
|
|
|
| |||||
Net increase (decrease) in shares outstanding | (282,457 | ) | $ | (3,269,120 | ) | |||
|
|
|
| |||||
| 34 |
Class B | Shares | Amount | ||||||
Year ended July 31, 2015: | ||||||||
Shares sold | 23,813 | $ | 247,228 | |||||
Shares issued in reinvestment of dividends and distributions | 47,745 | 476,976 | ||||||
Shares reacquired | (55,273 | ) | (575,665 | ) | ||||
|
|
|
| |||||
Net increase (decrease) in shares outstanding before conversion | 16,285 | 148,539 | ||||||
Shares reacquired upon conversion into other share class(es) | (105,451 | ) | (1,092,262 | ) | ||||
|
|
|
| |||||
Net increase (decrease) in shares outstanding | (89,166 | ) | $ | (943,723 | ) | |||
|
|
|
| |||||
Year ended July 31, 2014: | ||||||||
Shares sold | 81,731 | $ | 804,605 | |||||
Shares issued in reinvestment of dividends and distributions | 25,328 | 246,697 | ||||||
Shares reacquired | (58,055 | ) | (585,992 | ) | ||||
|
|
|
| |||||
Net increase (decrease) in shares outstanding before conversion | 49,004 | 465,310 | ||||||
Shares reacquired upon conversion into other share class(es) | (118,249 | ) | (1,184,760 | ) | ||||
|
|
|
| |||||
Net increase (decrease) in shares outstanding | (69,245 | ) | $ | (719,450 | ) | |||
|
|
|
| |||||
Class C | ||||||||
Year ended July 31, 2015: | ||||||||
Shares sold | 197,783 | $ | 2,063,327 | |||||
Shares issued in reinvestment of dividends and distributions | 556,254 | 5,556,982 | ||||||
Shares reacquired | (596,239 | ) | (6,173,430 | ) | ||||
|
|
|
| |||||
Net increase (decrease) in shares outstanding before conversion | 157,798 | 1,446,879 | ||||||
Shares reacquired upon conversion into other share class(es) | (201,779 | ) | (2,109,138 | ) | ||||
|
|
|
| |||||
Net increase (decrease) in shares outstanding | (43,981 | ) | $ | (662,259 | ) | |||
|
|
|
| |||||
Year ended July 31, 2014: | ||||||||
Shares sold | 207,404 | $ | 2,050,233 | |||||
Shares issued in reinvestment of dividends and distributions | 242,572 | 2,362,650 | ||||||
Shares reacquired | (556,710 | ) | (5,529,647 | ) | ||||
|
|
|
| |||||
Net increase (decrease) in shares outstanding before conversion | (106,734 | ) | (1,116,764 | ) | ||||
Shares reacquired upon conversion into other share class(es) | (111,825 | ) | (1,188,871 | ) | ||||
|
|
|
| |||||
Net increase (decrease) in shares outstanding | (218,559 | ) | $ | (2,305,635 | ) | |||
|
|
|
| |||||
7. Borrowings
The Fund, along with other affiliated registered investment companies (the “Funds”), is a party to a Syndicated Credit Agreement (“SCA”) with a group of banks. The purpose of the SCA is to provide an alternative source of temporary funding for capital share redemptions. The SCA provides for a commitment of $900 million for the period October 9, 2014 through October 8, 2015. The Funds pay an annualized commitment fee of .075% of the unused portion of the SCA. Prior to October 9, 2014, the Funds had another SCA that provided a commitment of $900 million and the Funds paid an annualized commitment fee of .08% of the unused portion of the SCA.
| Prudential Jennison Conservative Growth Fund | 35 |
Notes to Financial Statements
continued
Interest on any borrowings under the SCA is paid at contracted market rates. The commitment fee for the unused amount is accrued daily and paid quarterly.
The Fund utilized the SCA during the year ended July 31, 2015. The average daily balance for the 5 days that the Fund had loans outstanding during the year was approximately $405,400, borrowed at a weighted average interest rate of 1.47%. The maximum amount of loan outstanding during the year was $423,000. At July 31, 2015, the Fund did not have an outstanding loan amount.
8. New Accounting Pronouncement
In May 2015, the FASB issued Accounting Standards Update (“ASU”) No. 2015-07 regarding “Disclosures for Investments in Certain Entities That Calculate Net Asset Value per Share”. The amendments in this update are effective for the Fund for fiscal years beginning after December 15, 2015, and interim periods within those fiscal years. ASU No. 2015-07 will eliminate the requirement to categorize investments in the fair value hierarchy if their fair value is measured at net asset value (“NAV”) per share (or its equivalent) using the practical expedient in the ASU fair value measurement guidance. At this time, management is evaluating the implications of ASU No. 2015-07 and its impact on the financial statement disclosures has not yet been determined.
| 36 |
Financial Highlights
| Class A Shares | ||||||||||||||||||||
Year Ended July 31, | ||||||||||||||||||||
| 2015 | 2014 | 2013 | 2012 | 2011 | ||||||||||||||||
| Per Share Operating Performance(a): | ||||||||||||||||||||
| Net Asset Value, Beginning Of Year | $11.81 | $10.46 | $8.38 | $8.02 | $6.71 | |||||||||||||||
| Income (loss) from investment operations: | ||||||||||||||||||||
| Net investment income (loss) | .06 | .04 | .05 | .04 | .02 | |||||||||||||||
| Net realized and unrealized gain on investments | 1.28 | 1.78 | 2.07 | .32 | 1.29 | |||||||||||||||
| Total from investment operations | 1.34 | 1.82 | 2.12 | .36 | 1.31 | |||||||||||||||
| Less Dividends and Distributions: | ||||||||||||||||||||
| Dividends from net investment income | (.04 | ) | (.02 | ) | (.04 | ) | - | (d) | - | |||||||||||
| Distributions from net realized gains | (1.10 | ) | (.45 | ) | - | - | - | |||||||||||||
| Total dividends and distributions | (1.14 | ) | (.47 | ) | - | - | - | |||||||||||||
| Net asset value, end of year | $12.01 | $11.81 | $10.46 | $8.38 | $8.02 | |||||||||||||||
| Total Return(b): | 11.84% | 17.78% | 25.45% | 4.54% | 19.52% | |||||||||||||||
| Ratios/Supplemental Data: | ||||||||||||||||||||
| Net assets, end of year (000) | $186,770 | $175,928 | $158,694 | $114,610 | $119,583 | |||||||||||||||
| Average net assets (000) | $181,444 | $169,539 | $143,264 | $112,806 | $117,113 | |||||||||||||||
| Ratios to average net assets(c): | ||||||||||||||||||||
| Expenses after waiver and/or expense reimbursement | 1.24% | 1.26% | 1.35% | 1.45% | 1.38% | |||||||||||||||
| Expenses before waiver and/or expense reimbursement | 1.29% | 1.31% | 1.40% | 1.50% | 1.43% | |||||||||||||||
| Net investment income (loss) | .47% | .36% | .54% | .47% | .33% | |||||||||||||||
| Portfolio turnover rate | 295% | 234% | 148% | 208% | 266% | |||||||||||||||
(a) Calculated based on average shares outstanding during the year.
(b) Total return does not consider the effects of sales loads. Total return is calculated assuming a purchase of a share on the first day and a sale on the last day of each year reported and includes reinvestment of dividends and distributions. Total returns may reflect adjustments to conform to generally accepted accounting principles.
(c) Does not include expenses of the underlying portfolio in which the Fund invests.
(d) Less than $.005 per share.
See Notes to Financial Statements.
| Prudential Jennison Conservative Growth Fund | 37 |
Financial Highlights
continued
| Class B Shares | ||||||||||||||||||||
Year Ended July 31, | ||||||||||||||||||||
| 2015 | 2014 | 2013 | 2012 | 2011 | ||||||||||||||||
| Per Share Operating Performance(a): | ||||||||||||||||||||
| Net Asset Value, Beginning Of Year | $10.49 | $9.38 | $7.53 | $7.26 | $6.12 | |||||||||||||||
| Income (loss) from investment operations: | ||||||||||||||||||||
| Net investment loss | (.03 | ) | (.04 | ) | (.02 | ) | (.02 | ) | (.03 | ) | ||||||||||
| Net realized and unrealized gain on investments | 1.13 | 1.60 | 1.87 | .29 | 1.17 | |||||||||||||||
| Total from investment operations | 1.10 | 1.56 | 1.85 | .27 | 1.14 | |||||||||||||||
| Less Dividends and Distributions: | ||||||||||||||||||||
| Distributions from net realized gains | (1.10 | ) | (.45 | ) | - | - | - | |||||||||||||
| Net asset value, end of year | $10.49 | $10.49 | $9.38 | $7.53 | $7.26 | |||||||||||||||
| Total Return(b): | 11.01% | 16.96% | 24.57% | 3.72% | 18.63% | |||||||||||||||
| Ratios/Supplemental Data: | ||||||||||||||||||||
| Net assets, end of year (000) | $4,200 | $5,138 | $5,244 | $5,193 | $6,853 | |||||||||||||||
| Average net assets (000) | $4,801 | $5,457 | $5,169 | $5,815 | $7,889 | |||||||||||||||
| Ratios to average net assets(c): | ||||||||||||||||||||
| Expenses after waivers and/or expense reimbursement | 1.99% | 2.01% | 2.11% | 2.20% | 2.13% | |||||||||||||||
| Expenses before waivers and/or expense reimbursement | 1.99% | 2.01% | 2.11% | 2.20% | 2.13% | |||||||||||||||
| Net investment loss | (.25)% | (.38)% | (.19)% | (.28)% | (.42)% | |||||||||||||||
| Portfolio turnover rate | 295% | 234% | 148% | 208% | 266% | |||||||||||||||
(a) Calculated based on average shares outstanding during the year.
(b) Total return does not consider the effects of sales loads. Total return is calculated assuming a purchase of a share on the first day and a sale on the last day of each year reported and includes reinvestment of dividends and distributions. Total returns may reflect adjustments to conform to generally accepted accounting principles.
(c) Does not include expenses of the underlying portfolio in which the Fund invests.
See Notes to Financial Statements.
| 38 |
| Class C Shares | ||||||||||||||||||||
Year Ended July 31, | ||||||||||||||||||||
| 2015 | 2014 | 2013 | 2012 | 2011 | ||||||||||||||||
| Per Share Operating Performance(a): | ||||||||||||||||||||
| Net Asset Value, Beginning Of Year | $10.49 | $9.38 | $7.53 | $7.26 | $6.12 | |||||||||||||||
| Income (loss) from investment operations: | ||||||||||||||||||||
| Net investment loss | (.03 | ) | (.04 | ) | (.02 | ) | (.02 | ) | (.03 | ) | ||||||||||
| Net realized and unrealized gain on investments | 1.13 | 1.60 | 1.87 | .29 | 1.17 | |||||||||||||||
| Total from investment operations | 1.10 | 1.56 | 1.85 | .27 | 1.14 | |||||||||||||||
| Less Dividends and Distributions: | ||||||||||||||||||||
| Distributions from net realized gains | (1.10 | ) | (.45 | ) | - | - | - | |||||||||||||
| Net asset value, end of year | $10.49 | $10.49 | $9.38 | $7.53 | $7.26 | |||||||||||||||
| Total Return(b): | 11.01% | 16.96% | 24.57% | 3.72% | 18.63% | |||||||||||||||
| Ratios/Supplemental Data: | ||||||||||||||||||||
| Net assets, end of year (000) | $55,384 | $55,860 | $52,005 | $46,232 | $55,417 | |||||||||||||||
| Average net assets (000) | $56,581 | $55,220 | $48,375 | $49,057 | $56,582 | |||||||||||||||
| Ratios to average net assets(c): | ||||||||||||||||||||
| Expenses after waivers and/or expense reimbursement | 1.99% | 2.01% | 2.10% | 2.20% | 2.13% | |||||||||||||||
| Expenses before waivers and/or expense reimbursement | 1.99% | 2.01% | 2.10% | 2.20% | 2.13% | |||||||||||||||
| Net investment loss | (.27)% | (.39)% | (.21)% | (.28)% | (.42)% | |||||||||||||||
| Portfolio turnover rate | 295% | 234% | 148% | 208% | 266% | |||||||||||||||
(a) Calculated based on average shares outstanding during the year.
(b) Total return does not consider the effects of sales loads. Total return is calculated assuming a purchase of a share on the first day and a sale on the last day of each year reported and includes reinvestment of dividends and distributions. Total returns may reflect adjustments to conform to generally accepted accounting principles.
(c) Does not include expenses of the underlying portfolio in which the Fund invests.
See Notes to Financial Statements.
| Prudential Jennison Conservative Growth Fund | 39 |
Report of Independent Registered Public
Accounting Firm
The Board of Trustees and Shareholders
Prudential Investment Portfolios 5 - Prudential Jennison Conservative Growth Fund:
We have audited the accompanying statement of assets and liabilities of the Prudential Jennison Conservative Growth Fund, a series of Prudential Investment Portfolios 5 (hereafter referred to as the “Fund”), including the portfolio of investments, as of July 31, 2015, and the related statement of operations for the year then ended, the statement of changes in net assets for each of the years in the two-year period then ended and the financial highlights for each of the years in the five-year period then ended. These financial statements and financial highlights are the responsibility of the Fund’s management. Our responsibility is to express an opinion on these financial statements and financial highlights based on our audit.
We conducted our audits in accordance with the standards of the Public Company Accounting Oversight Board (United States). Those standards require that we plan and perform the audit to obtain reasonable assurance about whether the financial statements and financial highlights are free of material misstatement. An audit includes examining, on a test basis, evidence supporting the amounts and disclosures in the financial statements. Our procedures included confirmation of securities owned as of July 31, 2015, by correspondence with the custodian, transfer agent and brokers or by other appropriate auditing procedures when replies from brokers were not received. An audit also includes assessing the accounting principles used and significant estimates made by management, as well as evaluating the overall financial statement presentation. We believe that our audits provide a reasonable basis for our opinion.
In our opinion, the financial statements and financial highlights referred to above present fairly, in all material respects, the financial position of the Fund as of July 31, 2015, and the results of its operations for the year then ended, the changes in its net assets for each of the years in the two-year period then ended and the financial highlights for each of the years in the five-year period then ended, in conformity with U.S. generally accepted accounting principles.

New York, New York
September 17, 2015
| 40 |
Tax Information
(Unaudited)
We are advising you that during the fiscal year ended July 31, 2015, the Fund reported the maximum amount allowed per share but not less than $0.81 per share for Class A, B and C shares as a capital gain distribution in accordance with Section 852(b)(3)(C) of the Internal Revenue Code.
For the year ended July 31, 2015, the Fund reports, in accordance with Section 854 of the Internal Revenue Code, the following percentages of the ordinary income dividends paid as 1) qualified dividend income (QDI); and 2) eligible for corporate dividends received deduction (DRD):
| QDI | DRD | |||||||
Prudential Jennison Conservative Growth Fund | 48.44% | 46.44% | ||||||
In January 2016, you will be advised on IRS Form 1099-DIV or substitute 1099-DIV, as to the federal tax status of dividends received by you in calendar year 2015.
| Prudential Jennison Conservative Growth Fund | 41 |
INFORMATION ABOUT BOARD MEMBERS AND OFFICERS
(Unaudited)
Information about Board Members and Officers of the Fund is set forth below. Board Members who are not deemed to be “interested persons” of the Fund, as defined in the 1940 Act, are referred to as “Independent Board Members.” Board Members who are deemed to be “interested persons” of the Fund are referred to as “Interested Board Members.” The Board Members are responsible for the overall supervision of the operations of the Fund and perform the various duties imposed on the directors of investment companies by the 1940 Act. The Board in turn elects the Officers, who are responsible for administering the day-to-day operations of the Fund.
| Independent Board Members(1) | ||||
Name, Address, Age Position(s) Portfolios Overseen | Principal Occupation(s) During Past Five Years | Other Directorships Held During Past Five Years | ||
Ellen S. Alberding (57) Board Member Portfolios Overseen: 66 | President and Board Member, The Joyce Foundation (charitable foundation) (since 2002); Vice Chair, City Colleges of Chicago (community college system) (since 2011); Trustee, Skills for America’s Future (national initiative to connect employers to community colleges) (since 2011); Trustee, National Park Foundation (charitable foundation for national park system) (since 2009); Trustee, Economic Club of Chicago (since 2009). | None. | ||
Kevin J. Bannon (63) Board Member Portfolios Overseen: 66 | Managing Director (April 2008-May 2015) and Chief Investment Officer (October 2008-November 2013) of Highmount Capital LLC (registered investment adviser); formerly Executive Vice President and Chief Investment Officer (April 1993-August 2007) of Bank of New York Company; President (May 2003-May 2007) of BNY Hamilton Family of Mutual Funds. | Director of Urstadt Biddle Properties (equity real estate investment trust) (since September 2008). | ||
Linda W. Bynoe (63) Board Member Portfolios Overseen: 66 | President and Chief Executive Officer (since March 1995) and formerly Chief Operating Officer (December 1989-February 1995) of Telemat Ltd. (management consulting); formerly Vice President (January 1985-June 1989) at Morgan Stanley & Co. (broker-dealer). | Director of Simon Property Group, Inc. (retail real estate) (May 2003-May 2012); Director of Anixter International, Inc. (communication products distributor) (since January 2006); Director of Northern Trust Corporation (financial services) (since April 2006); Trustee of Equity Residential (residential real estate) (since December 2009). | ||
Prudential Jennison Conservative Growth Fund
| Independent Board Members(1) | ||||
Name, Address, Age Position(s) Portfolios Overseen | Principal Occupation(s) During Past Five Years | Other Directorships Held During Past Five Years | ||
Keith F. Hartstein (58) Board Member Portfolios Overseen: 66 | Retired; Member (since November 2014) of the Governing Council of the Independent Directors Council (organization of independent mutual fund directors); formerly President and Chief Executive Officer (2005-2012), Senior Vice President (2004-2005), Senior Vice President of Sales and Marketing (1997-2004), and various executive management positions (1990-1997), John Hancock Funds, LLC (asset management); Chairman, Investment Company Institute’s Sales Force Marketing Committee (2003-2008). | None. | ||
Michael S. Hyland, CFA (69) Board Member Portfolios Overseen: 66 | Retired (since February 2005); formerly Senior Managing Director (July 2001-February 2005) of Bear Stearns & Co, Inc.; Global Partner, INVESCO (1999-2001); Managing Director and President of Salomon Brothers Asset Management (1989-1999). | None. | ||
Richard A. Redeker (72) Board Member & Independent Chair Portfolios Overseen: 66 | Retired Mutual Fund Senior Executive (47 years); Management Consultant; Director, Mutual Fund Directors Forum (since 2014); Independent Directors Council (organization of independent mutual fund directors)-Executive Committee, Chair of Policy Steering Committee, Governing Council. | None. | ||
Stephen G. Stoneburn (72) Board Member Portfolios Overseen: 66 | Chairman (since July 2011), President and Chief Executive Officer (since June 1996) of Quadrant Media Corp. (publishing company); formerly President (June 1995-June 1996) of Argus Integrated Media, Inc.; Senior Vice President and Managing Director (January 1993-1995) of Cowles Business Media; Senior Vice President of Fairchild Publications, Inc. (1975-1989). | None. | ||
Visit our website at www.prudentialfunds.com
| Interested Board Members(1) | ||||
Name, Address, Age Position(s) Portfolios Overseen | Principal Occupation(s) During Past Five Years | Other Directorships Held During Past Five Years | ||
Stuart S. Parker (52) Board Member & President Portfolios Overseen: 66 | President of Prudential Investments LLC (since January 2012); Executive Vice President of Prudential Investment Management Services LLC (since December 2012); Executive Vice President of Jennison Associates LLC and Head of Retail Distribution of Prudential Investments LLC (June 2005-December 2011). | None. | ||
Scott E. Benjamin (42) Board Member & Vice President Portfolios Overseen: 66 | Executive Vice President (since June 2009) of Prudential Investments LLC; Executive Vice President (June 2009-June 2012) and Vice President (since June 2012) of Prudential Investment Management Services LLC; Executive Vice President (since September 2009) of AST Investment Services, Inc.; Senior Vice President of Product Development and Marketing, Prudential Investments (since February 2006); Vice President of Product Development and Product Management, Prudential Investments (2003-2006). | None. | ||
Grace C. Torres* (56) Board Member Portfolios Overseen: 64 | Retired; formerly Treasurer and Principal Financial and Accounting Officer of the Prudential Investments Funds, Target Funds, Advanced Series Trust, Prudential Variable Contract Accounts and The Prudential Series Fund (1998-June 2014); Assistant Treasurer (March 1999-June 2014) and Senior Vice President (September 1999-June 2014) of Prudential Investments LLC; Assistant Treasurer (May 2003-June 2014) and Vice President (June 2005-June 2014) of AST Investment Services, Inc.; Senior Vice President and Assistant Treasurer (May 2003-June 2014) of Prudential Annuities Advisory Services, Inc. | Director (since July 2015) of Sun Bancorp, Inc. N.A. | ||
| * | Note: Prior to her retirement in 2014, Ms. Torres was employed by Prudential Investments LLC. Due to her prior employment, she is considered to be an “interested person” under the 1940 Act. Ms. Torres is a non-management Interested Board Member. |
| (1) | The year that each Board Member joined the Board is as follows: |
Ellen S. Alberding, 2013; Kevin J. Bannon, 2008; Linda W. Bynoe, 2005; Keith F. Hartstein, 2013; Michael S. Hyland, 2008; Richard A. Redeker, 2003; Stephen G. Stoneburn, 1999; Grace C. Torres, 2014; Stuart S. Parker, Board Member and President since 2012; Scott E. Benjamin, Board Member since 2010 and Vice President since 2009.
Prudential Jennison Conservative Growth Fund
| Fund Officers(a) | ||||
Name, Address and Age Position with Fund | Principal Occupation(s) During Past Five Years | Length of Service as Fund Officer | ||
Raymond A. O’Hara (59) Chief Legal Officer | Vice President and Corporate Counsel (since July 2010) of Prudential Insurance Company of America (Prudential); Vice President (March 2011-Present) of Pruco Life Insurance Company and Pruco Life Insurance Company of New Jersey; Vice President and Corporate Counsel (March 2011-Present) of Prudential Annuities Life Assurance Corporation; Chief Legal Officer of Prudential Investments LLC (since June 2012); Chief Legal Officer of Prudential Mutual Fund Services LLC (since June 2012) and Corporate Counsel of AST Investment Services, Inc. (since June 2012); formerly Assistant Vice President and Corporate Counsel (September 2008-July 2010) of The Hartford Financial Services Group, Inc.; formerly Associate (September 1980-December 1987) and Partner (January 1988-August 2008) of Blazzard & Hasenauer, P.C. (formerly, Blazzard, Grodd & Hasenauer, P.C.). | Since 2012 | ||
Chad A. Earnst (39) Chief Compliance Officer | Chief Compliance Officer (September 2014-Present) of Prudential Investments LLC; Chief Compliance Officer (September 2014-Present) of the Prudential Investments Funds, Target Funds, Advanced Series Trust, The Prudential Series Fund, Prudential’s Gibraltar Fund, Inc., Prudential Global Short Duration High Yield Income Fund, Inc., Prudential Short Duration High Yield Fund, Inc. and Prudential Jennison MLP Income Fund, Inc.; formerly Assistant Director (March 2010-August 2014) of the Asset Management Unit, Division of Enforcement, US Securities & Exchange Commission; Assistant Regional Director (January 2010-August 2014), Branch Chief (June 2006-December 2009) and Senior Counsel (April 2003-May 2006) of the Miami Regional Office, Division of Enforcement, US Securities & Exchange Commission. | Since 2014 | ||
Deborah A. Docs (57) Secretary | Vice President and Corporate Counsel (since January 2001) of Prudential; Vice President (since December 1996) and Assistant Secretary (since March 1999) of Prudential Investments LLC; formerly Vice President and Assistant Secretary (May 2003-June 2005) of AST Investment Services, Inc. | Since 2004 | ||
Jonathan D. Shain (56) Assistant Secretary | Vice President and Corporate Counsel (since August 1998) of Prudential; Vice President and Assistant Secretary (since May 2001) of Prudential Investments LLC; Vice President and Assistant Secretary (since February 2001) of Prudential Mutual Fund Services LLC; formerly Vice President and Assistant Secretary (May 2003-June 2005) of AST Investment Services, Inc. | Since 2005 | ||
Visit our website at www.prudentialfunds.com
| Fund Officers(a) | ||||
Name, Address and Age Position with Fund | Principal Occupation(s) During Past Five Years | Length of Service as Fund Officer | ||
Claudia DiGiacomo (40) Assistant Secretary | Vice President and Corporate Counsel (since January 2005) of Prudential; Vice President and Assistant Secretary of Prudential Investments LLC (since December 2005); Associate at Sidley Austin Brown & Wood LLP (1999-2004). | Since 2005 | ||
Andrew R. French (52) Assistant Secretary | Vice President and Corporate Counsel (since February 2010) of Prudential; formerly Director and Corporate Counsel (2006-2010) of Prudential; Vice President and Assistant Secretary (since January 2007) of Prudential Investments LLC; Vice President and Assistant Secretary (since January 2007) of Prudential Mutual Fund Services LLC. | Since 2006 | ||
Amanda S. Ryan (37) Assistant Secretary | Director and Corporate Counsel (since March 2012) of Prudential; Director and Assistant Secretary (since June 2012) of Prudential Investments LLC; Associate at Ropes & Gray LLP (2008-2012). | Since 2012 | ||
Theresa C. Thompson (52) Deputy Chief Compliance Officer | Vice President, Compliance, Prudential Investments LLC (since April 2004); and Director, Compliance, Prudential Investments LLC (2001-2004). | Since 2008 | ||
Richard W. Kinville (46) Anti-Money Laundering Compliance Officer | Vice President, Corporate Compliance, Anti-Money Laundering Unit (since January 2005) of Prudential; committee member of the American Council of Life Insurers Anti-Money Laundering and Critical Infrastructure Committee (since January 2007); formerly Investigator and Supervisor in the Special Investigations Unit for the New York Central Mutual Fire Insurance Company (August 1994-January 1999); Investigator in AXA Financial’s Internal Audit Department and Manager in AXA’s Anti-Money Laundering Office (January 1999-January 2005); first chair of the American Council of Life Insurers Anti-Money Laundering and Critical Infrastructure Committee (June 2007-December 2009). | Since 2011 | ||
M. Sadiq Peshimam (51) Treasurer and Principal Financial and Accounting Officer | Vice President (since 2005) of Prudential Investments LLC; formerly Assistant Treasurer of funds in the Prudential Mutual Fund Complex (2006-2014). | Since 2006 | ||
Peter Parrella (56) Assistant Treasurer | Vice President (since 2007) and Director (2004-2007) within Prudential Mutual Fund Administration; formerly Tax Manager at SSB Citi Fund Management LLC (1997-2004). | Since 2007 | ||
Lana Lomuti (48) Assistant Treasurer | Vice President (since 2007) and Director (2005-2007), within Prudential Mutual Fund Administration; formerly Assistant Treasurer (December 2007-February 2014) of The Greater China Fund, Inc. | Since 2014 | ||
Linda McMullin (53) Assistant Treasurer | Vice President (since 2011) and Director (2008-2011) within Prudential Mutual Fund Administration. | Since 2014 | ||
Kelly A. Coyne (46) Assistant Treasurer | Director, Investment Operations of Prudential Mutual Fund Services LLC (since 2010). | Since 2015 | ||
Prudential Jennison Conservative Growth Fund
| (a) | Excludes Mr. Parker and Mr. Benjamin, interested Board Members who also serve as President and Vice President, respectively. |
Explanatory Notes to Tables:
| • | Board Members are deemed to be “Interested,” as defined in the 1940 Act, by reason of their affiliation with Prudential Investments LLC and/or an affiliate of Prudential Investments LLC. |
| • | Unless otherwise noted, the address of all Board Members and Officers is c/o Prudential Investments LLC, 655 Broad Street, Newark, New Jersey 07102-4077. |
| • | There is no set term of office for Board Members or Officers. The Board Members have adopted a retirement policy, which calls for the retirement of Board Members on December 31 of the year in which they reach the age of 75. |
| • | “Other Directorships Held” includes only directorships of companies required to register or file reports with the SEC under the 1934 Act (that is, “public companies”) or other investment companies registered under the 1940 Act. |
| • | “Portfolios Overseen” includes all investment companies managed by Prudential Investments LLC. The investment companies for which Prudential Investments LLC serves as manager include the Prudential Investments Mutual Funds, The Prudential Variable Contract Accounts, Target Mutual Funds, Prudential Short Duration High Yield Fund, Inc., Prudential Global Short Duration High Yield Fund, Inc., The Prudential Series Fund, Prudential’s Gibraltar Fund, Inc. and the Advanced Series Trust. |
Visit our website at www.prudentialfunds.com
Approval of Advisory Agreements
The Fund’s Board of Trustees
The Board of Trustees (the “Board”) of Prudential Jennison Conservative Growth Fund (the “Fund”)1 consists of ten individuals, seven of whom are not “interested persons” of the Fund, as defined in the Investment Company Act of 1940, as amended (the “1940 Act”) (the “Independent Trustees”). The Board is responsible for the oversight of the Fund and its operations, and performs the various duties imposed on the directors of investment companies by the 1940 Act. The Independent Trustees have retained independent legal counsel to assist them in connection with their duties. The Chair of the Board is an Independent Trustee. The Board has established three standing committees: the Audit Committee, the Nominating and Governance Committee, and the Investment Committee. Each committee is chaired by, and composed of, Independent Trustees.
Annual Approval of the Fund’s Advisory Agreements
As required under the 1940 Act, the Board determines annually whether to renew the Fund’s management agreement with Prudential Investments LLC (“PI”) and the Fund’s subadvisory agreement with Jennison Associates LLC (“Jennison”). In considering the renewal of the agreements, the Board, including all of the Independent Trustees, met on June 9-11, 2015 and approved the renewal of the agreements through July 31, 2016, after concluding that the renewal of the agreements was in the best interests of the Fund and its shareholders.
In advance of the meetings, the Board requested and received materials relating to the agreements, and had the opportunity to ask questions and request further information in connection with its consideration. Among other things, the Board considered comparative fee information from PI and Jennison. Also, the Board considered comparisons with other mutual funds in relevant Peer Universes and Peer Groups, as is further discussed below.
In approving the agreements, the Board, including the Independent Trustees advised by independent legal counsel, considered the factors it deemed relevant, including the nature, quality and extent of services provided by PI and the subadviser, the performance of the Fund, the profitability of PI and its affiliates, expenses and fees, and the potential for economies of scale that may be shared with the Fund and its shareholders as the Fund’s assets grow. In their deliberations, the Trustees did not identify any single factor which alone was responsible for the Board’s decision to approve the agreements with respect to the Fund. In connection with its deliberations, the Board considered information provided by PI throughout the year at regular Board
| 1 | Prudential Jennison Conservative Growth Fund is a series of Prudential Investment Portfolios 5. |
Prudential Jennison Conservative Growth Fund
Approval of Advisory Agreements (continued)
meetings, presentations from portfolio managers and other information, as well as information furnished at or in advance of the meetings on June 9-11, 2015.
The Trustees determined that the overall arrangements between the Fund and PI, which serves as the Fund’s investment manager pursuant to a management agreement, and between PI and Jennison, which serves as the Fund’s subadviser pursuant to the terms of a subadvisory agreement with PI, are in the best interests of the Fund and its shareholders in light of the services performed, fees charged and such other matters as the Trustees considered relevant in the exercise of their business judgment.
The material factors and conclusions that formed the basis for the Trustees’ determinations to approve the renewal of the agreements are discussed separately below.
Nature, Quality and Extent of Services
The Board received and considered information regarding the nature, quality and extent of services provided to the Fund by PI and Jennison. The Board considered the services provided by PI, including but not limited to the oversight of the subadviser for the Fund, as well as the provision of fund recordkeeping, compliance, and other services to the Fund. With respect to PI’s oversight of the subadviser, the Board noted that PI’s Strategic Investment Research Group (“SIRG”), a business unit of PI, is responsible for monitoring and reporting to PI’s senior management on the performance and operations of the subadviser. The Board also considered that PI pays the salaries of all of the officers and interested Trustees of the Fund who are part of Fund management. The Board also considered the investment subadvisory services provided by Jennison, as well as compliance with the Fund’s investment restrictions, policies and procedures. The Board considered PI’s evaluation of Jennison as well as PI’s recommendation, based on its review of Jennison, to renew the subadvisory agreement.
The Board considered the qualifications, backgrounds and responsibilities of PI’s senior management responsible for the oversight of the Fund and Jennison, and also considered the qualifications, backgrounds and responsibilities of Jennison’s portfolio managers who are responsible for the day-to-day management of the Fund’s portfolio. The Board was provided with information pertaining to PI’s and Jennison’s organizational structure, senior management, investment operations, and other relevant information pertaining to both PI and Jennison. The Board also noted that it received favorable compliance reports from the Fund’s Chief Compliance Officer (“CCO”) as to both PI and Jennison. The Board noted that Jennison is affiliated with PI.
Visit our website at www.prudentialfunds.com
The Board concluded that it was satisfied with the nature, extent and quality of the investment management services provided by PI and the subadvisory services provided to the Fund by Jennison, and that there was a reasonable basis on which to conclude that the Fund benefits from the services provided by PI and Jennison under the management and subadvisory agreements.
Costs of Services and Profits Realized by PI
The Board was provided with information on the profitability of PI and its affiliates in serving as the Fund’s investment manager. The Board discussed with PI the methodology utilized in assembling the information regarding profitability and considered its reasonableness. The Board recognized that it is difficult to make comparisons of profitability from fund management contracts because comparative information is not generally publicly available and is affected by numerous factors, including the structure of the particular adviser, the types of funds it manages, its business mix, numerous assumptions regarding allocations and the adviser’s capital structure and cost of capital. However, the Board considered that the cost of services provided by PI for the year ended December 31, 2014 exceeded the management fees received by PI, resulting in an operating loss to PI. The Board further noted that the subadviser is affiliated with PI and that its profitability is reflected in PI’s profitability report. Taking these factors into account, the Board concluded that the profitability of PI and its affiliates in relation to the services rendered was not unreasonable.
Economies of Scale
PI and the Board previously retained an outside business consulting firm to review management fee breakpoint usage and trends in management fees across the mutual fund industry. The consulting firm presented its analysis and conclusions as to the Funds’ management fee structures to the Board and PI. The Board and PI have discussed these conclusions extensively since that presentation.
The Board received and discussed information concerning economies of scale that PI may realize as the Fund’s assets grow beyond current levels. The Board noted that the management fee schedule for the Fund includes breakpoints, which have the effect of decreasing the fee rate as assets increase, but that at its current level of assets the Fund does not realize the effect of those rate reductions. The Board took note that the Fund’s fee structure currently results in benefits to Fund shareholders whether or not PI realizes any economies of scale. The Board noted that economies of scale can be shared with the Fund in other ways, including low management fees from inception, additional technological and personnel investments to enhance shareholder services, and maintaining existing expense structures in the face of a rising cost environment.
Prudential Jennison Conservative Growth Fund
Approval of Advisory Agreements (continued)
The Board also considered PI’s assertion that it continually evaluates the management fee schedule of the Fund and the potential to share economies of scale through breakpoints or fee waivers as asset levels increase.
The Board recognized the inherent limitations of any analysis of economies of scale, stemming largely from the Board’s understanding that most of PI’s costs are not specific to individual funds, but rather are incurred across a variety of products and services.
Other Benefits to PI and Jennison
The Board considered potential ancillary benefits that might be received by PI and Jennison and their affiliates as a result of their relationship with the Fund. The Board concluded that potential benefits to be derived by PI included fees received by affiliates of PI for serving as the Fund’s securities lending agent, transfer agency fees received by the Fund’s transfer agent (which is affiliated with PI), as well as benefits to its reputation or other intangible benefits resulting from PI’s association with the Fund. The Board concluded that the potential benefits to be derived by Jennison included its ability to use soft dollar credits, as well as the potential benefits consistent with those generally resulting from an increase in assets under management, specifically, potential access to additional research resources and benefits to its reputation. The Board concluded that the benefits derived by PI and Jennison were consistent with the types of benefits generally derived by investment managers and subadvisers to mutual funds.
Performance of the Fund / Fees and Expenses
The Board considered certain additional specific factors and made related conclusions relating to the historical performance of the Fund for the one-, three-, five- and ten-year periods ended December 31, 2014.
The Board also considered the Fund’s actual management fee, as well as the Fund’s net total expense ratio, for the fiscal year ended July 31, 2014. The Board considered the management fee for the Fund as compared to the management fee charged by PI to other funds and the fee charged by other advisers to comparable mutual funds in a Peer Group. The actual management fee represents the fee rate actually paid by Fund shareholders and includes any fee waivers or reimbursements. The net total expense ratio for the Fund represents the actual expense ratio incurred by Fund shareholders.
The mutual funds included in the Peer Universe (the Lipper Large-Cap Growth Funds Performance Universe) and the Peer Group were objectively determined by Lipper Inc. (“Lipper”), an independent provider of mutual fund data. The comparisons placed
Visit our website at www.prudentialfunds.com
the Fund in various quartiles, with the first quartile being the best 25% of the mutual funds (for performance, the best performing mutual funds and, for expenses, the lowest cost mutual funds).
The section below summarizes key factors considered by the Board and the Board’s conclusions regarding the Fund’s performance, fees and overall expenses. The table sets forth gross performance comparisons (which do not reflect the impact on performance of fund expenses, or any subsidies, expense caps or waivers that may be applicable) with the Peer Universe, actual management fees with the Peer Group (which reflect the impact of any subsidies or fee waivers), and net total expenses with the Peer Group, each of which were key factors considered by the Board.
| Performance | 1 Year | 3 Years | 5 Years | 10 Years | ||||
3rd Quartile | 2nd Quartile | 4th Quartile | 2nd Quartile | |||||
| Actual Management Fees: 2nd Quartile | ||||||||
| Net Total Expenses: 3rd Quartile | ||||||||
| • | The Board noted that the Fund outperformed its benchmark index over the three- and ten-year periods, though it underperformed over the other periods. |
| • | The Board noted information provided by PI indicating that the Fund’s net total expense ratio was two basis points higher than the median of all funds in the Peer Group. |
| • | The Board concluded that, in light of the above, it would be in the best interests of the Fund and its shareholders to renew the agreements. |
| • | The Board concluded that the management fees (including subadvisory fees) and total expenses were reasonable in light of the services provided. |
* * *
After full consideration of these factors, the Board concluded that approval of the agreements was in the best interests of the Fund and its shareholders.
Prudential Jennison Conservative Growth Fund
| n MAIL | n TELEPHONE | n WEBSITE | ||
655 Broad Street Newark, NJ 07102 | (800) 225-1852 | www.prudentialfunds.com |
| PROXY VOTING |
| The Board of Trustees of the Fund has delegated to the Fund’s investment subadviser the responsibility for voting any proxies and maintaining proxy recordkeeping with respect to the Fund. A description of these proxy voting policies and procedures is available without charge, upon request, by calling (800) 225-1852. Information regarding how the Fund voted proxies relating to portfolio securities during the most recent 12-month period ended June 30 is available on the Fund’s website and on the Securities and Exchange Commission’s website. |
| TRUSTEES |
| Ellen S. Alberding • Kevin J. Bannon • Scott E. Benjamin • Linda W. Bynoe • Keith F. Hartstein • Michael S. Hyland • Stuart S. Parker • Richard A. Redeker • Stephen G. Stoneburn • Grace C. Torres |
| OFFICERS |
| Stuart S. Parker, President • Scott E. Benjamin, Vice President • M. Sadiq Peshimam, Treasurer and Principal Financial and Accounting Officer • Raymond A. O’Hara, Chief Legal Officer • Chad A. Earnst, Chief Compliance Officer • Deborah A. Docs, Secretary • Theresa C. Thompson, Deputy Chief Compliance Officer • Richard W. Kinville, Anti-Money Laundering Compliance Officer • Jonathan D. Shain, Assistant Secretary • Claudia DiGiacomo, Assistant Secretary • Amanda S. Ryan, Assistant Secretary • Andrew R. French, Assistant Secretary • Peter Parrella, Assistant Treasurer • Lana Lomuti, Assistant Treasurer • Linda McMullin, Assistant Treasurer • Kelly A. Coyne, Assistant Treasurer |
| MANAGER | Prudential Investments LLC | 655 Broad Street Newark, NJ 07102 | ||
| ||||
| INVESTMENT SUBADVISER | Jennison Associates LLC | 466 Lexington Avenue New York, NY 10017 | ||
| ||||
| DISTRIBUTOR | Prudential Investment Management Services LLC | 655 Broad Street Newark, NJ 07102 | ||
| ||||
| CUSTODIAN | The Bank of New York Mellon | One Wall Street New York, NY 10286 | ||
| ||||
| TRANSFER AGENT | Prudential Mutual Fund Services LLC | PO Box 9658 Providence, RI 02940 | ||
| ||||
| INDEPENDENT REGISTERED PUBLIC ACCOUNTING FIRM | KPMG LLP | 345 Park Avenue New York, NY 10154 | ||
| ||||
| FUND COUNSEL | Willkie Farr & Gallagher LLP | 787 Seventh Avenue New York, NY 10019 | ||
| An investor should consider the investment objectives, risks, charges, and expenses of the Fund carefully before investing. The prospectus and summary prospectus contain this and other information about the Fund. An investor may obtain a prospectus and summary prospectus by visiting our website at www.prudentialfunds.com or by calling (800) 225-1852. The prospectus and summary prospectus should be read carefully before investing. |
| E-DELIVERY |
| To receive your mutual fund documents on-line, go to www.prudentialfunds.com/edelivery and enroll. Instead of receiving printed documents by mail, you will receive notification via email when new materials are available. You can cancel your enrollment or change your email address at any time by visiting the website address above. |
| SHAREHOLDER COMMUNICATIONS WITH TRUSTEES |
| Shareholders can communicate directly with the Board of Trustees by writing to the Chair of the Board, Prudential Jennison Conservative Growth Fund, Prudential Investments, Attn: Board of Trustees, 655 Broad Street, Newark, NJ 07102. Shareholders can communicate directly with an individual Trustee by writing to the same address. Communications are not screened before being delivered to the addressee. |
| AVAILABILITY OF PORTFOLIO SCHEDULE |
| The Fund files its complete schedule of portfolio holdings with the Securities and Exchange Commission for the first and third quarters of each fiscal year on Form N-Q. The Fund’s Forms N-Q are available on the Commission’s website at www.sec.gov. The Fund’s Forms N-Q may also be reviewed and copied at the Commission’s Public Reference Room in Washington, D.C. Information on the operation and location of the Public Reference Room may be obtained by calling 1-800-SEC-0330. The Fund’s schedule of portfolio holdings is also available on the Fund’s website as of the end of each month. |
| The Fund’s Statement of Additional Information contains additional information about the Fund’s Trustees and is available without charge, upon request, by calling (800) 225-1852. |
Mutual Funds:
| ARE NOT INSURED BY THE FDIC OR ANY FEDERAL GOVERNMENT AGENCY | MAY LOSE VALUE | ARE NOT A DEPOSIT OF OR GUARANTEED BY ANY BANK OR ANY BANK AFFILIATE |
PRUDENTIAL JENNISON CONSERVATIVE GROWTH FUND
| SHARE CLASS | A | B | C | |||
| NASDAQ | TBDAX | TBDBX | TBDCX | |||
| CUSIP | 74440V104 | 74440V203 | 74440V302 |
MF503E 0282247-00001-00

PRUDENTIAL INVESTMENTS»MUTUAL FUNDS
PRUDENTIAL JENNISON
RISING DIVIDEND FUND
ANNUAL REPORT · JULY 31, 2015
Objective
Capital appreciation and income
This report is not authorized for distribution to prospective investors unless preceded or accompanied by a current prospectus.
The views expressed in this report and information about the Fund’s portfolio holdings are for the period covered by this report and are subject to change thereafter.
Mutual funds are distributed by Prudential Investment Management Services LLC (PIMS). Jennison Associates is a registered investment adviser. Both are Prudential Financial companies. © 2015 Prudential Financial, Inc. and its related entities. Prudential Investments LLC, Prudential, Jennison Associates, Jennison, the Prudential logo, Bring Your Challenges, and the Rock symbol are service marks of Prudential Financial, Inc. and its related entities, registered in many jurisdictions worldwide.

|  |

September 15, 2015
Dear Shareholder:
We hope you find the annual report for the Prudential Jennison Rising Dividend Fund informative and useful. The report covers performance for the 12-month period that ended July 31, 2015.
Since market conditions change over time, we believe it is important to maintain a diversified portfolio of funds consistent with your tolerance for risk, time horizon, and financial goals.
Your financial advisor can help you create a diversified investment plan that may include funds covering all the basic asset classes and that reflects your personal investor profile and risk tolerance. Keep in mind, however, that diversification and asset allocation strategies do not assure a profit or protect against loss in declining markets.
Prudential Investments® is dedicated to helping you solve your toughest investment challenges—whether it’s capital growth, reliable income, or protection from market volatility and other risks. We offer the expertise of Prudential Financial’s affiliated asset managers that strive to be leaders in a broad range of funds to help you stay on course to the future you envision. They also manage money for major corporations and pension funds around the world, which means you benefit from the same expertise, innovation, and attention to risk demanded by today’s most sophisticated investors.
Thank you for choosing the Prudential Investments family of funds.
Sincerely,

Stuart S. Parker, President
Prudential Jennison Rising Dividend Fund
| Prudential Jennison Rising Dividend Fund | 1 |
Your Fund’s Performance (Unaudited)
Performance data quoted represent past performance. Past performance does not guarantee future results. The investment return and principal value of an investment will fluctuate, so that an investor’s shares, when redeemed, may be worth more or less than their original cost. Current performance may be lower or higher than the past performance data quoted. An investor may obtain performance data as of the most recent month-end by visiting our website at www.prudentialfunds.com or by calling (800) 225-1852.
Cumulative Total Returns (Without Sales Charges) as of 7/31/15 | ||||||
| 1 Year | Since Inception | |||||
Class A | 10.93 | % | 15.00% (3/5/14) | |||
Class C | 10.23 | 13.92 (3/5/14) | ||||
Class Z | 11.19 | 15.46 (3/5/14) | ||||
S&P 500 Index | 11.19 | 16.36 | ||||
Lipper Equity Income Funds Average | 4.96 | 9.62 | ||||
Average Annual Total Returns (With Sales Charges) as of 6/30/15 | ||||||
| 1 Year | Since Inception | |||||
Class A | 0.96 | % | 4.56% (3/5/14) | |||
Class C | 5.06 | 8.36 (3/5/14) | ||||
Class Z | 7.09 | 9.47 (3/5/14) | ||||
S&P 500 Index | 7.41 | 10.31 | ||||
Lipper Equity Income Funds Average | 1.74 | 6.38 | ||||
Average Annual Total Returns (With Sales Charges) as of 7/31/15 | ||||||
1 Year | Since Inception | |||||
Class A | 4.83 | % | 6.09% (3/5/14) | |||
Class C | 9.23 | 9.70 (3/5/14) | ||||
Class Z | 11.19 | 10.75 (3/5/14) | ||||
Average Annual Total Returns (Without Sales Charges) as of 7/31/15 | ||||||
| 1 Year | Since Inception | |||||
Class A | 10.93 | % | 10.44% (3/5/14) | |||
Class C | 10.23 | 9.70 (3/5/14) | ||||
Class Z | 11.19 | 10.75 (3/5/14) | ||||
| 2 | Visit our website at www.prudentialfunds.com |
Growth of a $10,000 Investment
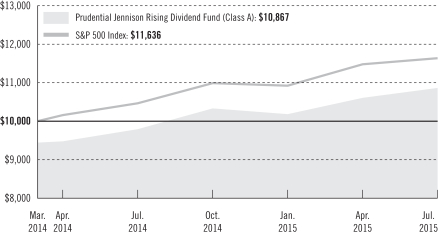
The graph compares a $10,000 investment in the Fund’s Class A shares with a similar investment in the S&P 500 Index by portraying the initial account values at the commencement of operations of Class A shares (March 5, 2014) and the account values at the end of the current fiscal year (July 31, 2015), as measured on a quarterly basis. For purposes of the graph, and unless otherwise indicated, it has been assumed that (a) the maximum applicable front-end sales charge was deducted from the initial $10,000 investment in Class A shares; (b) all recurring fees (including management fees) were deducted; and (c) all dividends and distributions were reinvested. The line graph provides information for Class A shares only. As indicated in the tables provided earlier, performance for Class C and Class Z shares will vary due to the differing charges and expenses applicable to each share class (as indicated in the following paragraphs). Without waiver of fees and/or expense reimbursements, if any, the returns would have been lower.
Past performance does not predict future performance. Total returns and the ending account values in the graphs include changes in share price and reinvestment of dividends and capital gains distributions in a hypothetical investment for the periods shown. The Fund’s total returns do not reflect the deduction of income taxes on an individual’s investment. Taxes may reduce your actual investment returns on income or gains paid by the Fund or any gains you may realize if you sell your shares.
Source: Prudential Investments LLC and Lipper Inc.
Inception returns are provided for any share class with less than 10 calendar years of returns.
| Prudential Jennison Rising Dividend Fund | 3 |
Your Fund’s Performance (continued)
The returns in the tables do not reflect the deduction of taxes that a shareholder would pay on Fund distributions or following the redemption of Fund shares. The average annual total returns take into account applicable sales charges, which are described for each share class in the table below.
| Class A | Class C | Class Z | ||||
Maximum initial sales charge | 5.50% of the public offering price | None | None | |||
Contingent deferred sales charge (CDSC) (as a percentage of the lower of original purchase price or net asset value at redemption) | 1% on sales of $1 million or more made within 12 months of purchase | 1% on sales made within 12 months of purchase | None | |||
Annual distribution and service (12b-1) fees (shown as a percentage of average daily net assets) | .30% (.25% currently) | 1% | None |
Benchmark Definitions
S&P 500 Index
The S&P 500 Index is an unmanaged index of 500 stocks of large U.S. public companies. It gives a broad look at how stock prices have performed in the United States. The cumulative total return for the Index measured from the month-end closest to the inception date for Class A, Class C, and Class Z shares through 7/31/15 is 16.36%. The average annual total return for the Index measured from the month-end closest to the inception date for Class A, Class C, and Class Z shares through 6/30/15 is 10.31%.
Lipper Equity Income Funds Average
Funds in the Lipper Equity Income Funds Average (Lipper Average) seek relatively high current income and growth of income through investing 65% or more of their portfolios in dividend-paying equity securities. The Lipper Equity Income Funds Average is based on the return of all mutual funds in the Lipper Equity Income Funds category and does not include the effect of any sales charges or taxes payable by an investor. The cumulative total return for the Average measured from the month-end closest to the inception date for Class A, Class C, and Class Z shares through 7/31/15 is 9.62%. The average annual total return for the Average measured from the month-end closest to the inception date for Class A, Class C, and Class Z shares through 6/30/15 is 6.38%.
Investors cannot invest directly in an index or average. The returns for the Index would be lower if they included the effects of sales charges, operating expenses of a mutual fund, or taxes that may be paid by an investor. Returns for the Lipper Average reflect the deduction of operating expenses, but not sales charges or taxes. The Since Inception returns for the Index and Lipper Average are measured from the closest month-end to the inception date for the indicated share class.
| 4 | Visit our website at www.prudentialfunds.com |
Five Largest Holdings expressed as a percentage of net assets as of 7/31/15 | ||||
Cisco Systems, Inc., Communications Equipment | 3.7 | % | ||
Apple, Inc., Technology Hardware, Storage & Peripherals | 3.0 | |||
Williams Cos., Inc. (The), Oil, Gas & Consumable Fuels | 2.8 | |||
Boeing Co. (The), Aerospace & Defense | 2.7 | |||
JPMorgan Chase & Co., Banks | 2.6 |
Holdings reflect only long-term investments and are subject to change.
Five Largest Industries expressed as a percentage of net assets as of 7/31/15 | ||||
Banks | 9.1 | % | ||
Oil, Gas & Consumable Fuels | 7.2 | |||
Aerospace & Defense | 6.8 | |||
Pharmaceuticals | 6.0 | |||
Media | 4.8 |
Industry weightings reflect only long-term investments and are subject to change.
| Prudential Jennison Rising Dividend Fund | 5 |
Strategy and Performance Overview
How did the Fund perform?
The Prudential Jennison Rising Dividend Fund’s Class A shares returned 10.93% for the 12 months ending July 31, 2015. Over the same period, the S&P 500 Index (the Index) returned 11.19% and the Lipper Equity Income Average returned 4.96%.
In the Index, seven out of the 10 sectors were positive during the period. Health care, consumer discretionary, and consumer staples were the strongest performing sectors, while energy followed by materials and telecommunication services were the largest decliners.
Stock selection in energy, consumer staples, and industrials contributed the most to relative returns, while both stock selection and allocations to the health care sector were the largest detractors of relative performance during the period.
What was the market environment?
Weak energy prices and a strong US dollar were key influences on the global economic landscape during the 12 months ended July 31, 2015. Energy prices appeared to stabilize during the second quarter of 2015 on the rapid decline in North American shale drilling activity, as the industry moved quickly to curtail spending given lower crude oil prices. The Federal Reserve ended its quantitative-easing program in December, signaling confidence in the health of US economic activity and labor market conditions.
Overseas, many emerging market economies further decelerated, with Europe struggling, unsuccessfully, to avert Greece’s looming default even as the country’s new government called for less economic austerity. At the end of the period, eurozone leaders reached an agreement to start negotiations on a third bailout. China’s growth continued to slow despite stimulus measures and easing in lending markets. In June 2015, Chinese equity prices sold off sharply, by roughly 30% from early June through the second quarter of 2015, after advancing more than 100% in the previous year. Japan showed little economic improvement, although its stock market made progress as investors hoped a weaker yen would boost exports. These challenges, combined with uncertainty about the timing and pace of anticipated monetary tightening in the US, contributed to continued volatility in global financial markets.
Which holdings made the largest positive contributions to the Fund’s return?
Top absolute contributors during the period included Apple, Bristol-Myers Squibb, and Nike.
| • | See “Comments on Largest Holdings” below for discussion of Apple. |
| • | Bristol-Myers Squibb is a pharmaceutical company engaged in the discovery, development, licensing, manufacturing, marketing, distribution, and sale of |
| 6 | Visit our website at www.prudentialfunds.com |
| biopharmaceutical products on a global basis. The company’s products are sold to wholesalers, retail pharmacies, hospitals, government entities, and the medical profession. |
| • | NIKE, Inc. designs, develops, markets, and sells footwear, apparel and equipment, accessories, and services. Its athletic footwear products are designed primarily for specific athletic use, although a large percentage of the products are worn for casual or leisure purposes. The company focuses on NIKE Brand and Jordan Brand product offerings in seven key categories: running, basketball, football, men’s training, women’s training, NIKE sportswear, and action sports. Its wholly owned subsidiaries include Converse Inc. and Hurley International LLC. Jennison believes the company is exceptionally managed, capitalized, and is a powerful brand in a growing category with attractive dividend growth over the next few years. |
Which holdings detracted most from the Fund’s return?
Top absolute detractors included oil and gas storage and transportation firm Williams Companies; data processing and outsourcing services company Xerox; and oil and gas exploration and production company ConocoPhillips.
| • | See “Comments on Largest Holdings” below for discussion of Williams Companies. |
| • | Xerox Corporation offers business process and document management services. Its customers include small and midsize businesses (SMBs), graphic communications companies, governmental entities, educational institutions, and Fortune 1,000 corporate accounts. |
| • | ConocoPhillips is a global independent exploration and production company that explores for, produces, transports, and markets crude oil, bitumen, natural gas, liquefied natural gas (LNG), and natural gas liquids (NGLs). The company has operations in the US, Latin America, Canada, Europe, Asia Pacific, and the Middle East. |
Were there significant changes to the portfolio?
During the reporting period, the Fund reduced its exposures to the energy, industrials, and health care sectors, and increased its overall holdings in consumer staples and consumer discretionary, specifically within the hotels, restaurants and leisure, and multiline retail industries. Despite reducing exposure in the overall energy sector, the Fund maintains an overweight position within the oil and gas storage and transportation segment relative to the Index, as Jennison likes companies with more exposure to the infrastructure portion of energy.
| Prudential Jennison Rising Dividend Fund | 7 |
Comments on Largest Holdings
| 3.7% | Cisco Systems, Communications Equipment |
Cisco Systems designs, manufactures, and sells Internet protocol (IP)-based networking products and services related to the communications and information technology (IT) industry. The company also provides products and services for transporting data, voice, and video traffic across intranets, extranets, and the Internet.
| 3.0% | Apple Inc., Technology Hardware, Storage, and Peripherals |
Apple designs, manufactures, and markets personal computers (Mac mini, iMac, MacBook, Mac Pro, and MacBook Pro), mobile communication devices (iPhone, iPad), and portable digital music and video players (iPod). It sells various related software, services, peripherals, and networking products, as well. Apple’s revenue and earnings strength reflects expanding global acceptance of its platform, especially in China, where iPhone sales have surged after becoming available through China’s largest phone service provider. Jennison expects that upcoming product cycles will sustain attractive revenue growth and continue returning capital to shareholders.
| 2.8% | Williams Companies, Oil, Gas, and Consumable Fuels |
Williams Companies is an integrated natural gas company that explores, produces, transports, sells, and processes natural gas and petroleum products. Williams Companies is the parent company and general partner of Williams Partners, which is engaged in the business of gathering, transporting, and processing natural gas and fractionating and storing natural gas liquids. Jennison believes the company, along with its subsidiaries, is a gas behemoth with premier Northeast and Gulfcoast positioning, which should benefit from a rise in needed transportation projects. With its attractive footprint in fast-growing shale basins—the Marcellus, Utica, Eagle Ford, and Permian Basin—Williams is expected to be a principal beneficiary of rising demand for natural gas and natural gas liquids (NGLs).
| 2.7% | Boeing Company, Aerospace & Defense |
Boeing is the world’s largest aerospace company, the second-largest maker of large commercial jets (behind Airbus), and the second-biggest defense contractor (after Lockheed Martin). The company’s space operations include communications satellites, missiles, and the International Space Station. Jennison believes that given the company’s strong cash flow position, which has significantly increased over the past year or so, management is now in a position where it could either increase its stock buyback program, its dividend, or potentially make strategic acquisitions.
| 2.6% | JPMorgan Chase & Co., Banks |
JPMorgan Chase & Co., along with its subsidiaries, provides financial services worldwide. The company operates through four segments: Consumer and Community Banking, Corporate and Investment Bank, Commercial Banking, and Asset Management.
| 8 | Visit our website at www.prudentialfunds.com |
Fees and Expenses (Unaudited)
As a shareholder of the Fund, you incur two types of costs: (1) transaction costs, including sales charges (loads) on purchase payments and redemptions, as applicable, and (2) ongoing costs, including management fees, distribution, and/or service (12b-1) fees, and other Fund expenses, as applicable. This example is intended to help you understand your ongoing costs (in dollars) of investing in the Fund and to compare these costs with the ongoing costs of investing in other mutual funds.
The example is based on an investment of $1,000 invested on February 1, 2015, at the beginning of the period and held through the six-month period ended July 31, 2015. The example is for illustrative purposes only; you should consult the Prospectus for information on initial and subsequent minimum investment requirements.
Actual Expenses
The first line for each share class in the table on the following page provides information about actual account values and actual expenses. You may use the information on this line, together with the amount you invested, to estimate the expenses that you paid over the period. Simply divide your account value by $1,000 (for example, an $8,600 account value ÷ $1,000 = 8.6), then multiply the result by the number on the first line under the heading “Expenses Paid During the Six-Month Period” to estimate the expenses you paid on your account during this period.
Hypothetical Example for Comparison Purposes
The second line for each share class in the table on the following page provides information about hypothetical account values and hypothetical expenses based on the Fund’s actual expense ratio and an assumed rate of return of 5% per year before expenses, which is not the Fund’s actual return. The hypothetical account values and expenses may not be used to estimate the actual ending account balance or expenses you paid for the period. You may use this information to compare the ongoing costs of investing in the Fund and other funds. To do so, compare this 5% hypothetical example with the 5% hypothetical examples that appear in the shareholder reports of the other funds.
The Fund’s transfer agent may charge additional fees to holders of certain accounts that are not included in the expenses shown in the table on the following page. These fees apply to individual retirement accounts (IRAs) and Section 403(b) accounts. As of the close of the period covered by the table, IRA fees included an annual maintenance fee of $15 per account (subject to a maximum annual maintenance fee of $25 for all accounts held by the same shareholder). Section 403(b) accounts are charged an annual $25 fiduciary maintenance fee. Some of the fees may vary in amount, or may be waived, based on your total account balance or the number of Prudential Investments funds, including the Fund, that you own. You should consider
| Prudential Jennison Rising Dividend Fund | 9 |
Fees and Expenses (continued)
the additional fees that were charged to your Fund account over the six-month period when you estimate the total ongoing expenses paid over the period and the impact of these fees on your ending account value, as these additional expenses are not reflected in the information provided in the expense table. Additional fees have the effect of reducing investment returns.
Please note that the expenses shown in the table are meant to highlight your ongoing costs only and do not reflect any transactional costs such as sales charges (loads). Therefore, the second line for each share class in the table is useful in comparing ongoing costs only and will not help you determine the relative total costs of owning different funds. In addition, if these transactional costs were included, your costs would have been higher.
| Prudential Jennison Rising Dividend Fund | Beginning Account Value February 1, 2015 | Ending Account July 31, 2015 | Annualized Expense Ratio Based on the Six-Month Period | Expenses Paid During the Six-Month Period* | ||||||||||||||
| Class A | Actual | $ | 1,000.00 | $ | 1,066.70 | 1.24 | % | $ | 6.35 | |||||||||
| Hypothetical | $ | 1,000.00 | $ | 1,018.65 | 1.24 | % | $ | 6.21 | ||||||||||
| Class C | Actual | $ | 1,000.00 | $ | 1,063.10 | 1.99 | % | $ | 10.18 | |||||||||
| Hypothetical | $ | 1,000.00 | $ | 1,014.93 | 1.99 | % | $ | 9.94 | ||||||||||
| Class Z | Actual | $ | 1,000.00 | $ | 1,067.90 | 0.99 | % | $ | 5.08 | |||||||||
| Hypothetical | $ | 1,000.00 | $ | 1,019.89 | 0.99 | % | $ | 4.96 | ||||||||||
*Fund expenses (net of fee waivers or subsidies, if any) for each share class are equal to the annualized expense ratio for each share class (provided in the table), multiplied by the average account value over the period, multiplied by the 181 days in the six-month period ended July 31, 2015, and divided by the 365 days in the Fund’s fiscal year ended July 31, 2015 (to reflect the six-month period). Expenses presented in the table include the expenses of any underlying portfolios in which the Fund may invest.
| 10 | Visit our website at www.prudentialfunds.com |
The Fund’s annualized expense ratios for the 12-month period ended July 31, 2015, are as follows:
| Class | Gross Operating Expenses | Net Operating Expenses | ||||||
A | 3.54 | % | 1.24 | % | ||||
C | 4.16 | 1.99 | ||||||
Z | 3.31 | 0.99 | ||||||
Net operating expenses shown above reflect any fee waivers and/or expense reimbursements. Additional information on Fund expenses and any fee waivers and/or expense reimbursements can be found in the “Financial Highlights” tables in this report and in the Notes to the Financial Statements in this report.
| Prudential Jennison Rising Dividend Fund | 11 |
Portfolio of Investments
as of July 31, 2015
| Description | Shares | Value (Note 1) | ||||||
LONG-TERM INVESTMENTS 99.1% | ||||||||
COMMON STOCKS | ||||||||
Aerospace & Defense 6.8% | ||||||||
Boeing Co. (The) | 1,413 | $ | 203,711 | |||||
Honeywell International, Inc. | 1,482 | 155,684 | ||||||
Lockheed Martin Corp. | 794 | 164,438 | ||||||
|
| |||||||
| 523,833 | ||||||||
Air Freight & Logistics 1.0% | ||||||||
FedEx Corp. | 452 | 77,482 | ||||||
Banks 9.1% | ||||||||
Bank of America Corp. | 7,192 | 128,593 | ||||||
Citigroup, Inc. | 2,206 | 128,963 | ||||||
JPMorgan Chase & Co. | 2,941 | 201,546 | ||||||
PNC Financial Services Group, Inc. (The) | 916 | 89,933 | ||||||
Wells Fargo & Co. | 2,663 | 154,108 | ||||||
|
| |||||||
| 703,143 | ||||||||
Beverages 3.3% | ||||||||
Coca-Cola Co. (The) | 1,476 | 60,634 | ||||||
Constellation Brands, Inc. (Class A Stock) | 891 | 106,938 | ||||||
PepsiCo, Inc. | 912 | 87,871 | ||||||
|
| |||||||
| 255,443 | ||||||||
Capital Markets 3.0% | ||||||||
Goldman Sachs Group, Inc. (The) | 665 | 136,371 | ||||||
TD Ameritrade Holding Corp. | 2,511 | 92,229 | ||||||
|
| |||||||
| 228,600 | ||||||||
Chemicals 1.3% | ||||||||
Air Products & Chemicals, Inc. | 402 | 57,289 | ||||||
International Flavors & Fragrances, Inc. | 346 | 39,994 | ||||||
|
| |||||||
| 97,283 | ||||||||
Communications Equipment 3.7% | ||||||||
Cisco Systems, Inc. | 10,139 | 288,150 | ||||||
Containers & Packaging 1.3% | ||||||||
Packaging Corp. of America | 1,364 | 96,557 | ||||||
Diversified Telecommunication Services 0.5% | ||||||||
AT&T, Inc. | 1,082 | 37,589 | ||||||
See Notes to Financial Statements.
| Prudential Jennison Rising Dividend Fund | 13 |
Portfolio of Investments
as of July 31, 2015 continued
| Description | Shares | Value (Note 1) | ||||||
COMMON STOCKS (Continued) | ||||||||
Food & Staples Retailing 3.3% | ||||||||
Costco Wholesale Corp. | 915 | $ | 132,950 | |||||
CVS Health Corp. | 1,054 | 118,543 | ||||||
|
| |||||||
| 251,493 | ||||||||
Food Products 1.2% | ||||||||
Mondelez International, Inc. (Class A Stock) | 1,990 | 89,809 | ||||||
Health Care Equipment & Supplies 1.5% | ||||||||
Abbott Laboratories | 2,204 | 111,721 | ||||||
Health Care Providers & Services 1.4% | ||||||||
UnitedHealth Group, Inc. | 862 | 104,647 | ||||||
Hotels, Restaurants & Leisure 4.1% | ||||||||
McDonald’s Corp. | 936 | 93,469 | ||||||
Starbucks Corp. | 2,266 | 131,269 | ||||||
Starwood Hotels & Resorts Worldwide, Inc. | 1,138 | 90,426 | ||||||
|
| |||||||
| 315,164 | ||||||||
Household Products 0.7% | ||||||||
Procter & Gamble Co. (The) | 661 | 50,699 | ||||||
Insurance 2.2% | ||||||||
American International Group, Inc. | 1,213 | 77,778 | ||||||
MetLife, Inc. | 1,621 | 90,354 | ||||||
|
| |||||||
| 168,132 | ||||||||
IT Services 3.7% | ||||||||
MasterCard, Inc. (Class A Stock) | 1,625 | 158,275 | ||||||
Xerox Corp. | 11,609 | 127,931 | ||||||
|
| |||||||
| 286,206 | ||||||||
Life Sciences Tools & Services 1.7% | ||||||||
Thermo Fisher Scientific, Inc. | 960 | 133,949 | ||||||
Media 4.8% | ||||||||
Comcast Corp. (Class A Stock) | 2,576 | 160,768 | ||||||
Time Warner, Inc. | 1,415 | 124,577 | ||||||
Walt Disney Co. (The) | 731 | 87,720 | ||||||
|
| |||||||
| 373,065 | ||||||||
See Notes to Financial Statements.
| 14 |
| Description | Shares | Value (Note 1) | ||||||
COMMON STOCKS (Continued) | ||||||||
Multi-Utilities 3.1% | ||||||||
NiSource, Inc. | 3,251 | $ | 56,762 | |||||
PG&E Corp. | 1,736 | 91,157 | ||||||
Sempra Energy | 916 | 93,231 | ||||||
|
| |||||||
| 241,150 | ||||||||
Multiline Retail 3.0% | ||||||||
Dollar General Corp. | 1,462 | 117,501 | ||||||
Target Corp. | 1,400 | 114,590 | ||||||
|
| |||||||
| 232,091 | ||||||||
Oil, Gas & Consumable Fuels 7.2% | ||||||||
Chevron Corp. | 353 | 31,233 | ||||||
Columbia Pipeline Group, Inc. | 3,566 | 104,056 | ||||||
ConocoPhillips | 580 | 29,197 | ||||||
Kinder Morgan, Inc. | 3,742 | 129,623 | ||||||
Marathon Petroleum Corp. | 877 | 47,946 | ||||||
Williams Cos., Inc. (The) | 4,058 | 212,964 | ||||||
|
| |||||||
| 555,019 | ||||||||
Pharmaceuticals 6.0% | ||||||||
Bristol-Myers Squibb Co. | 2,969 | 194,885 | ||||||
Merck & Co., Inc. | 2,573 | 151,704 | ||||||
Novartis AG (Switzerland), ADR | 719 | 74,597 | ||||||
Pfizer, Inc. | 1,119 | 40,351 | ||||||
|
| |||||||
| 461,537 | ||||||||
Real Estate Investment Trusts (REITs) 2.1% | ||||||||
Crown Castle International Corp. | 821 | 67,248 | ||||||
CyrusOne, Inc. | 3,093 | 95,079 | ||||||
|
| |||||||
| 162,327 | ||||||||
Road & Rail 1.5% | ||||||||
Canadian Pacific Railway Ltd. (Canada) | 245 | 39,408 | ||||||
Union Pacific Corp. | 803 | 78,365 | ||||||
|
| |||||||
| 117,773 | ||||||||
Semiconductors & Semiconductor Equipment 2.8% | ||||||||
Analog Devices, Inc. | 2,124 | 123,893 | ||||||
Lam Research Corp. | 1,180 | 90,706 | ||||||
|
| |||||||
| 214,599 | ||||||||
See Notes to Financial Statements.
| Prudential Jennison Rising Dividend Fund | 15 |
Portfolio of Investments
as of July 31, 2015 continued
| Description | Shares | Value (Note 1) | ||||||
COMMON STOCKS (Continued) | ||||||||
Software 4.2% | ||||||||
Intuit, Inc. | 1,188 | $ | 125,655 | |||||
Microsoft Corp. | 2,591 | 121,000 | ||||||
Oracle Corp. | 1,923 | 76,804 | ||||||
|
| |||||||
| 323,459 | ||||||||
Specialty Retail 3.9% | ||||||||
GameStop Corp. (Class A Stock) | 2,179 | 99,907 | ||||||
Home Depot, Inc. (The) | 1,033 | 120,892 | ||||||
Lowe’s Cos., Inc. | 1,088 | 75,464 | ||||||
|
| |||||||
| 296,263 | ||||||||
Technology Hardware, Storage & Peripherals 3.0% | ||||||||
Apple, Inc. | 1,933 | 234,473 | ||||||
Textiles, Apparel & Luxury Goods 1.9% | ||||||||
NIKE, Inc. (Class B Stock) | 1,280 | 147,482 | ||||||
Tobacco 3.8% | ||||||||
Philip Morris International, Inc. | 1,088 | 93,057 | ||||||
Reynolds American, Inc. | 2,345 | 201,177 | ||||||
|
| |||||||
| 294,234 | ||||||||
Wireless Telecommunication Services 2.0% | ||||||||
Vodafone Group PLC (United Kingdom), ADR | 4,168 | 157,467 | ||||||
|
| |||||||
TOTAL LONG-TERM INVESTMENTS | 7,630,839 | |||||||
|
| |||||||
SHORT-TERM INVESTMENT 1.4% | ||||||||
AFFILIATED MONEY MARKET MUTUAL FUND | ||||||||
Prudential Investment Portfolios 2 - Prudential Core Taxable Money Market Fund (cost $108,754)(Note 3)(a) | 108,754 | 108,754 | ||||||
|
| |||||||
TOTAL INVESTMENTS 100.5% | 7,739,593 | |||||||
Liabilities in excess of other assets (0.5)% | (39,134 | ) | ||||||
|
| |||||||
NET ASSETS 100.0% | $ | 7,700,459 | ||||||
|
| |||||||
See Notes to Financial Statements.
| 16 |
The following abbreviation is used in the portfolio descriptions:
ADR—American Depositary Receipt
| (a) | Prudential Investments LLC, the manager of the Fund, also serves as manager of the Prudential Investment Portfolios 2 - Prudential Core Taxable Money Market Fund. |
Various inputs are used in determining the value of the Fund’s investments. These inputs are summarized in the three broad levels listed below.
Level 1—quoted prices generally in active markets for identical securities.
Level 2—quoted prices for similar securities, interest rates and yield curves, prepayment speeds, foreign currency exchange rates and other observable inputs.
Level 3—unobservable inputs for securities valued in accordance with Board approved fair valuation procedures.
The following is a summary of the inputs used as of July 31, 2015 in valuing such portfolio securities:
| Level 1 | Level 2 | Level 3 | ||||||||||
Investments in Securities | ||||||||||||
Common Stocks | ||||||||||||
Aerospace & Defense | $ | 523,833 | $ | — | $ | — | ||||||
Air Freight & Logistics | 77,482 | — | — | |||||||||
Banks | 703,143 | — | — | |||||||||
Beverages | 255,443 | — | — | |||||||||
Capital Markets | 228,600 | — | — | |||||||||
Chemicals | 97,283 | — | — | |||||||||
Communications Equipment | 288,150 | — | — | |||||||||
Containers & Packaging | 96,557 | — | — | |||||||||
Diversified Telecommunication Services | 37,589 | — | — | |||||||||
Food & Staples Retailing | 251,493 | — | — | |||||||||
Food Products | 89,809 | — | — | |||||||||
Health Care Equipment & Supplies | 111,721 | — | — | |||||||||
Health Care Providers & Services | 104,647 | — | — | |||||||||
Hotels, Restaurants & Leisure | 315,164 | — | — | |||||||||
Household Products | 50,699 | — | — | |||||||||
Insurance | 168,132 | — | — | |||||||||
IT Services | 286,206 | — | — | |||||||||
Life Sciences Tools & Services | 133,949 | — | — | |||||||||
Media | 373,065 | — | — | |||||||||
Multi-Utilities | 241,150 | — | — | |||||||||
See Notes to Financial Statements.
| Prudential Jennison Rising Dividend Fund | 17 |
Portfolio of Investments
as of July 31, 2015 continued
| Level 1 | Level 2 | Level 3 | ||||||||||
Common Stocks (continued): | ||||||||||||
Multiline Retail | $ | 232,091 | $ | — | $ | — | ||||||
Oil, Gas & Consumable Fuels | 555,019 | — | — | |||||||||
Pharmaceuticals | 461,537 | — | — | |||||||||
Real Estate Investment Trusts (REITs) | 162,327 | — | — | |||||||||
Road & Rail | 117,773 | — | — | |||||||||
Semiconductors & Semiconductor Equipment | 214,599 | — | — | |||||||||
Software | 323,459 | — | — | |||||||||
Specialty Retail | 296,263 | — | — | |||||||||
Technology Hardware, Storage & Peripherals | 234,473 | — | — | |||||||||
Textiles, Apparel & Luxury Goods | 147,482 | — | — | |||||||||
Tobacco | 294,234 | — | — | |||||||||
Wireless Telecommunication Services | 157,467 | — | — | |||||||||
Affiliated Money Market Mutual Fund | 108,754 | — | — | |||||||||
|
|
|
|
|
| |||||||
Total | $ | 7,739,593 | $ | — | $ | — | ||||||
|
|
|
|
|
| |||||||
The industry classification of investments and liabilities in excess of other assets shown as a percentage of net assets as of July 31, 2015 were as follows (Unaudited):
Banks | 9.1 | % | ||
Oil, Gas & Consumable Fuels | 7.2 | |||
Aerospace & Defense | �� | 6.8 | ||
Pharmaceuticals | 6.0 | |||
Media | 4.8 | |||
Software | 4.2 | |||
Hotels, Restaurants & Leisure | 4.1 | |||
Specialty Retail | 3.9 | |||
Tobacco | 3.8 | |||
Communications Equipment | 3.7 | |||
IT Services | 3.7 | |||
Beverages | 3.3 | |||
Food & Staples Retailing | 3.3 | |||
Multi-Utilities | 3.1 | |||
Technology Hardware, Storage & Peripherals | 3.0 | |||
Multiline Retail | 3.0 | |||
Capital Markets | 3.0 | |||
Semiconductors & Semiconductor Equipment | 2.8 | |||
Insurance | 2.2 | |||
Real Estate Investment Trusts (REITs) | 2.1 | % | ||
Wireless Telecommunication Services | 2.0 | |||
Textiles, Apparel & Luxury Goods | 1.9 | |||
Life Sciences Tools & Services | 1.7 | |||
Road & Rail | 1.5 | |||
Health Care Equipment & Supplies | 1.5 | |||
Affiliated Money Market Mutual Fund | 1.4 | |||
Health Care Providers & Services | 1.4 | |||
Chemicals | 1.3 | |||
Containers & Packaging | 1.3 | |||
Food Products | 1.2 | |||
Air Freight & Logistics | 1.0 | |||
Household Products | 0.7 | |||
Diversified Telecommunication Services | 0.5 | |||
|
| |||
| 100.5 | ||||
Liabilities in excess of other assets | (0.5 | ) | ||
|
| |||
| 100.0 | % | |||
|
|
See Notes to Financial Statements.
| 18 |
PRUDENTIAL INVESTMENTS»MUTUAL FUNDS
FINANCIAL STATEMENTS
ANNUAL REPORT · JULY 31, 2015
Prudential Jennison Rising Dividend Fund
Statement of Assets & Liabilities
as of July 31, 2015
Assets | ||||
Investments at value: | ||||
Unaffiliated investments (cost $6,857,973) | $ | 7,630,839 | ||
Affiliated investments (cost $108,754) | 108,754 | |||
Cash | 5 | |||
Receivable for investments sold | 89,414 | |||
Dividends receivable | 12,430 | |||
Due from Manager | 8,749 | |||
Receivable for Fund shares sold | 5,836 | |||
|
| |||
Total assets | 7,856,027 | |||
|
| |||
Liabilities | ||||
Payable for investments purchased | 108,131 | |||
Accrued expenses and other liabilities | 40,704 | |||
Payable for Fund shares reacquired | 5,857 | |||
Distribution fee payable | 582 | |||
Affiliated transfer agent fee payable | 294 | |||
|
| |||
Total liabilities | 155,568 | |||
|
| |||
Net Assets | $ | 7,700,459 | ||
|
| |||
Net assets were comprised of: | ||||
Shares of beneficial interest, at par | $ | 679 | ||
Paid-in capital in excess of par | 6,939,123 | |||
|
| |||
| 6,939,802 | ||||
Undistributed net investment income | 7,648 | |||
Accumulated net realized loss on investment transactions | (19,857 | ) | ||
Net unrealized appreciation on investments | 772,866 | |||
|
| |||
Net assets, July 31, 2015 | $ | 7,700,459 | ||
|
| |||
See Notes to Financial Statements.
| 20 |
Class A | ||||
Net asset value and redemption price per share, | $ | 11.33 | ||
Maximum sales charge (5.50% of offering price) | .66 | |||
|
| |||
Maximum offering price to public | $ | 11.99 | ||
|
| |||
Class C | ||||
Net asset value, offering price and redemption price per share, | $ | 11.32 | ||
|
| |||
Class Z | ||||
Net asset value, offering price and redemption price per share, | $ | 11.33 | ||
|
| |||
See Notes to Financial Statements.
| Prudential Jennison Rising Dividend Fund | 21 |
Statement of Operations
Year Ended July 31, 2015
Net Investment Income |
| |||
Income | ||||
Unaffiliated dividend income (net of foreign withholding taxes of $398) | $ | 161,252 | ||
Affiliated dividend income | 221 | |||
|
| |||
Total income | 161,473 | |||
|
| |||
Expenses | ||||
Management fee | 53,973 | |||
Distribution fee—Class A | 2,467 | |||
Distribution fee—Class C | 1,884 | |||
Custodian and accounting fees | 41,000 | |||
Registration fees | 39,000 | |||
Audit fee | 23,000 | |||
Shareholders’ reports | 22,000 | |||
Legal fees and expenses | 20,000 | |||
Trustees’ fees | 12,000 | |||
Transfer agent’s fees and expenses (including affiliated expense of $1,400) | 9,000 | |||
Insurance expenses | 1,000 | |||
Miscellaneous | 8,428 | |||
|
| |||
Total expenses | 233,752 | |||
Less: Management fee waiver and/or expense reimbursement | (160,457 | ) | ||
Distribution fee waiver—Class A | (411 | ) | ||
|
| |||
Net expenses | 72,884 | |||
|
| |||
Net investment income | 88,589 | |||
|
| |||
Realized and Unrealized Gain (Loss) on Investments | ||||
Net realized loss on investment transactions | (18,334 | ) | ||
Net change in unrealized appreciation (depreciation) on investments | 621,035 | |||
|
| |||
Net gain on investments | 602,701 | |||
|
| |||
Net Increase In Net Assets Resulting From Operations | $ | 691,290 | ||
|
| |||
See Notes to Financial Statements.
| 22 |
Statement of Changes in Net Assets
Year Ended July 31, 2015 | March 5, 2014* Through July 31, 2014 | |||||||
Increase (Decrease) in Net Assets | ||||||||
Operations | ||||||||
Net investment income | $ | 88,589 | $ | 23,467 | ||||
Net realized gain (loss) on investment transactions | (18,334 | ) | 19,240 | |||||
Net change in unrealized appreciation (depreciation) on investments | 621,035 | 151,831 | ||||||
|
|
|
| |||||
Net increase in net assets resulting from operations | 691,290 | 194,538 | ||||||
|
|
|
| |||||
Dividends and Distributions (Note 1) | ||||||||
Dividends from net investment income: | ||||||||
Class A | (9,046 | ) | (603 | ) | ||||
Class C | (610 | ) | (9 | ) | ||||
Class Z | (77,328 | ) | (17,322 | ) | ||||
|
|
|
| |||||
| (86,984 | ) | (17,934 | ) | |||||
|
|
|
| |||||
Distributions from net realized gains: | ||||||||
Class A | (2,545 | ) | — | |||||
Class C | (442 | ) | — | |||||
Class Z | (17,848 | ) | — | |||||
|
|
|
| |||||
| (20,835 | ) | — | ||||||
|
|
|
| |||||
Fund share transactions (Net of share conversions) (Note 6) | ||||||||
Net proceeds from shares sold | 1,988,872 | 5,524,594 | ||||||
Net asset value of shares issued in reinvestment of dividends and distributions | 107,323 | 17,934 | ||||||
Cost of shares reacquired | (694,730 | ) | (3,609 | ) | ||||
|
|
|
| |||||
Net increase in net assets from Fund share transactions | 1,401,465 | 5,538,919 | ||||||
|
|
|
| |||||
Total increase | 1,984,936 | 5,715,523 | ||||||
Net Assets: | ||||||||
Beginning of period | 5,715,523 | — | ||||||
|
|
|
| |||||
End of period(a) | $ | 7,700,459 | $ | 5,715,523 | ||||
|
|
|
| |||||
(a) Includes undistributed net investment income of: | $ | 7,648 | $ | 6,115 | ||||
|
|
|
| |||||
| * | Commencement of operations. |
See Notes to Financial Statements.
| Prudential Jennison Rising Dividend Fund | 23 |
Notes to Financial Statements
Prudential Investment Portfolios 5 (the “Trust”) is an open-end management investment company, registered under the Investment Company Act of 1940, as amended, (“1940 Act”), which was established as a Delaware business trust on July 8, 1999. The Trust consists of two separate funds: Prudential Jennison Conservative Growth Fund and Prudential Jennison Rising Dividend Fund. These financial statements relate to Prudential Jennison Rising Dividend Fund (the “Fund”). The Fund commenced operations on March 5, 2014. The financial statements of the other fund is not presented herein.
The Fund’s investment objectives are capital appreciation and income.
1. Accounting Policies
The Fund follows investment company accounting and reporting guidance of the Financial Accounting Standards Board (“FASB”) Accounting Standard Codification Topic 946 Financial Services—Investment Companies. The following accounting policies conform to U.S. generally accepted accounting principles. The Trust and the Fund consistently follow such policies in the preparation of their financial statements.
Securities Valuation: The Fund holds securities and other assets that are fair valued at the close of each day the New York Stock Exchange (“NYSE”) is open for trading. Fair value is the price that would be received to sell an asset or paid to transfer a liability in an orderly transaction between market participants on the measurement date. The Board of Trustees (the “Board”) has adopted Valuation Procedures for security valuation under which fair valuation responsibilities have been delegated to Prudential Investments LLC (“PI” or “Manager”). Under the current Valuation Procedures, the established Valuation Committee is responsible for supervising the valuation of portfolio securities and other assets. The Valuation Procedures permit the Fund to utilize independent pricing vendor services, quotations from market makers, and alternative valuation methods when market quotations are either not readily available or not deemed representative of fair value. A record of the Valuation Committee’s actions is subject to the Board’s review, approval, and ratification at its next regularly-scheduled quarterly meeting.
Various inputs determine how the Fund’s investments are valued, all of which are categorized according to the three broad levels (Level 1, 2, or 3) detailed in the table following the Portfolio of Investments.
| 24 |
Common and preferred stocks, exchange-traded funds, and derivative instruments such as futures or options that are traded on a national securities exchange are valued at the last sale price as of the close of trading on the applicable exchange where the security principally trades. Securities traded via NASDAQ are valued at the NASDAQ official closing price. To the extent these securities are valued at the last sale price or NASDAQ official closing price, they are classified as Level 1 in the fair value hierarchy.
In the event that no sale or official closing price on valuation date exists, these securities are generally valued at the mean between the last reported bid and ask prices, or at the last bid price in the absence of an ask price. These securities are classified as Level 2 in the fair value hierarchy.
Common and preferred stocks traded on foreign securities exchanges are valued using pricing vendor services that provide model prices derived using adjustment factors based on information such as local closing price, relevant general and sector indices, currency fluctuations, depositary receipts, and futures, as applicable. Securities valued using such model prices are classified as Level 2 in the fair value hierarchy. Such securities are valued using model prices to the extent that the valuation meets the established confidence level for each security. If the confidence level is not met or the vendor does not provide a model price, securities are valued in accordance with exchange-traded common and preferred stocks discussed above.
Participatory Notes (P-Notes) are generally valued based upon the value of a related underlying security that trades actively in the market and are classified as Level 2 in the fair value hierarchy.
Investments in open-end, non-exchange-traded mutual funds are valued at their net asset values as of the close of the NYSE on the date of valuation. These securities are classified as Level 1 in the fair value hierarchy since they may be purchased or sold at their net asset values on the date of valuation.
Fixed income securities traded in the over-the-counter (“OTC”) market are generally valued at prices provided by approved independent pricing vendors. The pricing vendors provide these prices after evaluating observable inputs including, but not limited to yield curves, yield spreads, credit ratings, deal terms, tranche level attributes, default rates, cash flows, prepayment speeds, broker/dealer quotations, and reported trades. Securities valued using such vendor prices are classified as Level 2 in the fair value hierarchy.
OTC derivative instruments are generally valued using pricing vendor services, which derive the valuation based on inputs such as underlying asset prices, indices, spreads, interest rates, and exchange rates. These instruments are categorized as Level 2 in the fair value hierarchy.
| Prudential Jennison Rising Dividend Fund | 25 |
Notes to Financial Statements
continued
Centrally cleared swaps listed or traded on a multilateral or trade facility platform, such as a registered exchange, are generally valued at the daily settlement price determined by the respective exchange. These securities are classified as Level 2 in the fair value hierarchy, as the daily settlement price is not public.
Securities and other assets that cannot be priced according to the methods described above are valued based on pricing methodologies approved by the Board. In the event that unobservable inputs are used when determining such valuations, the securities will be classified as Level 3 in the fair value hierarchy.
When determining the fair value of securities, some of the factors influencing the valuation include: the nature of any restrictions on disposition of the securities; assessment of the general liquidity of the securities; the issuer’s financial condition and the markets in which it does business; the cost of the investment; the size of the holding and the capitalization of the issuer; the prices of any recent transactions or bids/offers for such securities or any comparable securities; any available analyst media or other reports or information deemed reliable by the investment adviser regarding the issuer or the markets or industry in which it operates. Using fair value to price securities may result in a value that is different from a security’s most recent closing price and from the price used by other mutual funds to calculate their net asset values.
Restricted and Illiquid Securities: Subject to guidelines adopted by the Board, the Fund may invest up to 15% of its net assets in illiquid securities, including those which are restricted as to disposition under securities law (“restricted securities”). Restricted securities are valued pursuant to the valuation procedures noted above. Illiquid securities are those that, because of the absence of a readily available market or due to legal or contractual restrictions on resale, cannot be sold within seven days in the ordinary course of business at approximately the amount at which the Fund has valued the investment. Therefore, the Fund may find it difficult to sell illiquid securities at the time considered most advantageous by its Subadviser and may incur expenses that would not be incurred in the sale of securities that were freely marketable. Certain securities that would otherwise be considered illiquid because of legal restrictions on resale to the general public may be traded among qualified institutional buyers under Rule 144A of the Securities Act of 1933. These Rule 144A securities, as well as commercial paper that is sold in private placements under Section 4(2) of the Securities Act, may be deemed liquid by the Fund’s Subadviser under the guidelines adopted by the Trustees of the Fund. However, the liquidity of the Fund’s investments in Rule 144A securities could be impaired if trading does not develop or declines.
| 26 |
Foreign Currency Translation: The books and records of the Fund are maintained in U.S. dollars. Foreign currency amounts are translated into U.S. dollars on the following basis:
(i) market value of investment securities, other assets and liabilities-at the current rates of exchange.
(ii) purchases and sales of investment securities, income and expenses-at the rates of exchange prevailing on the respective dates of such transactions.
Although the net assets of the Fund are presented at the foreign exchange rates and market values at the close of the period, the Fund does not isolate that portion of the results of operations arising as a result of changes in the foreign exchange rates from the fluctuations arising from changes in the market prices of long-term portfolio securities held at the end of the period. Similarly, the Fund does not isolate the effect of changes in foreign exchange rates from the fluctuations arising from changes in the market prices of long-term portfolio securities sold during the period. Accordingly, these realized foreign currency gains or losses are included in the reported net realized gains (losses) on investment transactions.
Net realized gains or losses on foreign currency transactions represent net foreign exchange gains or losses from holdings of foreign currencies, forward currency contracts, disposition of foreign currencies, currency gains or losses realized between the trade and settlement dates on securities transactions, and the difference between the amounts of interest, dividends and foreign withholding taxes recorded on the Fund’s books and the U.S. dollar equivalent amounts actually received or paid. Net unrealized currency gains or losses from valuing foreign currency denominated assets and liabilities (other than investments) at period end exchange rates are reflected as a component of net unrealized appreciation (depreciation) on foreign currencies.
Concentration of Risk: Foreign security and currency transactions may involve certain considerations and risks not typically associated with those of U.S. companies as a result of, among other factors, the possibility of political or economic instability, or the level of governmental supervision and regulation of foreign securities markets.
Master Netting Arrangements: The Fund is subject to various Master Agreements, or netting arrangements, with select counterparties. These are agreements which a sub-adviser may have negotiated and entered into on behalf of the Fund. A master netting arrangement between the Fund and the counterparty permits the Fund to offset amounts payable by the Fund to the same counterparty against amounts to be received; and by the receipt of collateral from the counterparty by the Fund to cover the Fund’s exposure to the counterparty. However, there is no assurance that such
| Prudential Jennison Rising Dividend Fund | 27 |
Notes to Financial Statements
continued
mitigating factors are easily enforceable. The right to set-off exists when all the conditions are met such that each of the parties owes the other determinable amounts, the reporting party has the right to set-off the amount owed with the amount owed by the other party, the reporting party intends to set-off and the right of set-off is enforceable by law. During the reporting period, there were no instances where the right of set-off existed and management has not elected to offset.
Securities Lending: The Fund may lend its portfolio securities to banks and broker-dealers. The loans are secured by collateral at least equal to the market value of the securities loaned. Collateral pledged by each borrower is invested in a highly liquid short-term money market fund and is marked to market daily, based on the previous day’s market value, such that the value of the collateral exceeds the value of the loaned securities. Loans are subject to termination at the option of the borrower or the Fund. Upon termination of the loan, the borrower will return to the Fund securities identical to the loaned securities. Should the borrower of the securities fail financially, the Fund has the right to repurchase the securities in the open market using the collateral. The Fund recognizes income, net of any rebate and securities lending agent fees, for lending its securities, and any interest on the investment of cash received as collateral. The Fund also continues to receive interest and dividends or amounts equivalent thereto, on the securities loaned and recognizes any unrealized gain or loss in the market price of the securities loaned that may occur during the term of the loan.
Securities Transactions and Net Investment Income: Securities transactions are recorded on the trade date. Realized and unrealized gains or losses from security and currency transactions are calculated on the identified cost basis. Dividend income is recorded on the ex-dividend date. Interest income, including amortization of premium and accretion of discount on debt securities, as required, is recorded on the accrual basis. Expenses are recorded on the accrual basis which may require the use of certain estimates by management, that may differ from actual.
REITs: The Fund invests in real estate investment trusts (“REITs”), which report information on the source of their distributions annually. Based on current and historical information, a portion of distributions received from REITs during the period is estimated to be dividend income, capital gain or return of capital and recorded accordingly. These estimates are adjusted periodically when the actual sources of distributions are disclosed by the REITs.
| 28 |
Net investment income or loss, (other than distribution fees, which are charged directly to the respective class) and unrealized and realized gains or losses are allocated daily to each class of shares based upon the relative proportion of adjusted net assets of each class at the beginning of the day.
Dividends and Distributions to Shareholders: Dividends and distributions to shareholders are recorded on the ex-dividend date. Dividends, if any, from net investment income are declared and paid at least quarterly. These dividends and distributions are determined in accordance with federal income tax regulations and may differ from accounting principles generally accepted in the United States of America.
Net realized gains from investment transactions, if any, are distributed at least annually. Permanent book/tax differences relating to income and gains are reclassified amongst undistributed net investment income, accumulated net realized gain or loss and paid-in capital in excess of par, as appropriate.
Taxes: For federal income tax purposes, each Fund in the Trust is treated as a separate taxpaying entity. It is the Fund’s policy to continue to meet the requirements of the Internal Revenue Code applicable to regulated investment companies and to distribute all of its taxable net investment income and capital gains, if any, to shareholders. Therefore, no federal income tax provision is required. Withholding taxes on foreign dividends and interest and foreign capital gains tax are recorded net of reclaimable amounts, at the time the related income is earned.
Estimates: The preparation of financial statements requires management to make estimates and assumptions that affect the reported amounts and disclosures in the financial statements. Actual results could differ from those estimates.
2. Agreements
The Fund has a management agreement with PI. Pursuant to this agreement, PI has responsibility for all investment advisory services for the Fund and supervises the subadvisor’s performance of such services. PI has entered into a subadvisory agreement with Jennison Associates LLC (“Jennison”). The subadvisory agreement provides that Jennison furnishes investment advisory services in connection with the management of the Fund. In connection therewith, Jennison is obligated to keep certain books and records of the Fund. PI pays for the services of Jennison, the cost of compensation of officers of the Fund, occupancy and certain clerical and bookkeeping costs of the Fund. The Fund bears all other costs and expenses.
| Prudential Jennison Rising Dividend Fund | 29 |
Notes to Financial Statements
continued
The management fee paid to PI is accrued daily and payable monthly at an annual rate of .775% of the Fund’s average daily net assets. The management fee amount and/or expense reimbursement exceeds the management fee for the year ended July 31, 2015 due to expense limitations described below.
PI has contractually agreed through November 30, 2015 to limit net annual Fund operating expenses (exclusive of distribution and service (12b-1) fees, extraordinary expenses and certain other expenses such as taxes, interest and brokerage commissions) to 0.99% of the Fund’s average daily net assets. The Fund has a distribution agreement with Prudential Investment Management Services LLC (“PIMS”), which acts as the distributor of the Class A, Class C and Class Z shares of the Fund. The Fund compensates PIMS for distributing and servicing the Fund’s Class A and Class C shares, pursuant to plans of distribution (the “Class A and C Plans”), regardless of expenses actually incurred by PIMS. The distribution fees are accrued daily and payable monthly. No distribution or service fees are paid to PIMS as distributor of the Class Z shares of the Fund.
Pursuant to Class A and C Plans, the Fund compensates PIMS for distribution related activities at an annual rate of up to 0.30% and 1% of the average daily net assets of the Class A and C shares, respectively. PIMS has contractually agreed through November 30, 2016 to reduce its distribution and service (12b-1) fees for Class A shares to .25% of the average daily net assets of the Class A shares.
PIMS has advised the Fund that it received $22,036 in front-end sales charges resulting from sales of Class A shares during the year ended July 31, 2015. From these fees, PIMS paid such sales charges to affiliated broker-dealers, which in turn paid commissions to salespersons and incurred other distribution costs.
PIMS has advised the Fund that for the year ended July 31, 2015, it received $1 in contingent deferred sales charges imposed upon redemptions by certain Class C shareholders.
PI, PIMS and Jennison are indirect, wholly-owned subsidiaries of Prudential Financial, Inc. (“Prudential”).
| 30 |
3. Other Transactions with Affiliates
Prudential Mutual Fund Services LLC (“PMFS”), an affiliate of PI and an indirect, wholly-owned subsidiary of Prudential, serves as the Fund’s transfer agent. Transfer agent’s fees and expenses in the Statement of Operations include certain out-of-pocket expenses paid to non-affiliates, where applicable.
The Fund invests in the Prudential Core Taxable Money Market Fund (the “Core Fund”), a portfolio of Prudential Investment Portfolios 2, registered under the 1940 Act and managed by PI. Earnings from the Core Fund are disclosed on the Statement of Operations as “Affiliated dividend income”.
4. Portfolio Securities
Purchases and sales of securities, other than short-term investments, for the year ended July 31, 2015, were $4,492,435 and $3,121,634, respectively.
5. Distributions and Tax Information
Distributions to shareholders, which are determined in accordance with federal income tax regulations and which may differ from generally accepted accounting principles, are recorded on the ex-dividend date. In order to present undistributed net investment income, accumulated net realized loss on investment transactions and paid-in capital in excess of par on the Statement of Assets and Liabilities that more closely represent their tax character, certain adjustments have been made to undistributed net investment income and accumulated net realized loss on investment transactions. For the year ended July 31, 2015, the adjustments were to decrease undistributed net investment income and decrease accumulated net realized loss on investment transactions by $72 due to the redesignation of distributions paid. Net realized gain (loss) on investments, net investment income and net assets were not affected by this change.
For the year ended July 31, 2015 and the period ended July 31, 2014, the tax character of dividends paid by the Fund was $107,819 and $17,934 of ordinary income, respectively.
As of July 31, 2015, the accumulated undistributed earnings on a tax basis was $7,648 of ordinary income.
| Prudential Jennison Rising Dividend Fund | 31 |
Notes to Financial Statements
continued
The United States federal income tax basis of the Fund’s investments and the net unrealized appreciation as of July 31, 2015 were as follows:
Tax Basis | Appreciation | Depreciation | Net | |||
| $6,967,623 | $867,845 | $(95,875) | $771,970 |
The difference between book basis and tax basis is primarily attributable to deferred losses on wash sales.
For federal income purposes, the Fund had a capital loss carryforward as of July 31, 2015 of approximately $16,000 which can be carried forward for an unlimited period. No capital gains distributions are expected to be paid to shareholders until net gains have been realized in excess of such losses.
The Fund elected to treat post-October capital losses of approximately $3,000 as having been incurred in the following fiscal year (July 31, 2016).
Management has analyzed the Fund’s tax positions taken on federal, state and local income tax returns for all open tax years and has concluded that no provisions for income tax is required in the Fund’s financial statements for the current reporting period. The Fund’s federal, state and local income and federal excise tax returns for tax years for which the applicable statutes of limitations have not expired are subject to examination by the Internal Revenue Service and state departments of revenue.
6. Capital
The Fund offers Class A, Class C, and Class Z shares. Class A shares are sold with a maximum front-end sales charge of up to 5.50%. All investors who purchase Class A shares in an amount of $1 million or more and sell these shares within 12 months of purchase are subject to a contingent deferred sales charge (“CDSC”) of 1%. The Class A CDSC is waived for purchases by certain retirement or benefit plans. Class C shares are sold with a CDSC of 1% for shares redeemed within 12 months of purchase. A special exchange privilege is also available for shareholders who qualify to purchase Class A shares at net asset value. Class Z shares are not subject to any sales or redemption charge and are offered exclusively for sale to a limited group of investors.
| 32 |
Under certain circumstances, an exchange may be made from specified share classes of the Fund to one or more other share classes of the Fund as presented in the table of transactions in shares of beneficial interest.
There is an unlimited number of shares of beneficial interest at $.001 par value per share.
At July 31, 2015, PI owned 1,016, 1,006 and 510,539 Class A, C and Z shares of the Fund, respectively.
Transactions in shares of beneficial interest were as follows:
Class A | Shares | Amount | ||||||
Year ended July 31, 2015: | ||||||||
Shares sold | 91,778 | $ | 1,006,173 | |||||
Shares issued in reinvestment of dividends and distributions | 999 | 11,111 | ||||||
Shares reacquired | (30,500 | ) | (331,573 | ) | ||||
|
|
|
| |||||
Net increase (decrease) in shares outstanding before conversion | 62,277 | 685,711 | ||||||
Shares reacquired upon conversion into other share class | (3,389 | ) | (37,845 | ) | ||||
|
|
|
| |||||
Net increase (decrease) in shares outstanding | 58,888 | $ | 647,866 | |||||
|
|
|
| |||||
Period* ended July 31, 2014: | ||||||||
Shares sold | 37,087 | $ | 378,894 | |||||
Shares issued in reinvestment of dividends and distributions | 57 | 603 | ||||||
Shares reacquired | (58 | ) | (577 | ) | ||||
|
|
|
| |||||
Net increase (decrease) in shares outstanding | 37,086 | $ | 378,920 | |||||
|
|
|
| |||||
Class C | ||||||||
Year ended July 31, 2015: | ||||||||
Shares sold | 35,322 | $ | 390,015 | |||||
Shares issued in reinvestment of dividends and distributions | 93 | 1,037 | ||||||
Shares reacquired | (1,221 | ) | (13,434 | ) | ||||
|
|
|
| |||||
Net increase (decrease) in shares outstanding | 34,194 | $ | 377,618 | |||||
|
|
|
| |||||
Period* ended July 31, 2014: | ||||||||
Shares sold | 3,482 | $ | 35,700 | |||||
Shares issued in reinvestment of dividends and distributions | 1 | 9 | ||||||
Shares reacquired | (286 | ) | (3,032 | ) | ||||
|
|
|
| |||||
Net increase (decrease) in shares outstanding | 3,197 | $ | 32,677 | |||||
|
|
|
| |||||
| Prudential Jennison Rising Dividend Fund | 33 |
Notes to Financial Statements
continued
Class Z | Shares | Amount | ||||||
Year ended July 31, 2015: | ||||||||
Shares sold | 53,094 | $ | 592,684 | |||||
Shares issued in reinvestment of dividends and distributions | 8,572 | 95,175 | ||||||
Shares reacquired | (31,096 | ) | (349,723 | ) | ||||
|
|
|
| |||||
Net increase (decrease) in shares outstanding before conversion | 30,570 | 338,136 | ||||||
Shares issued upon conversion from other share class | 3,386 | 37,845 | ||||||
|
|
|
| |||||
Net increase (decrease) in shares outstanding | 33,956 | $ | 375,981 | |||||
|
|
|
| |||||
Period* ended July 31, 2014: | ||||||||
Shares sold | 510,503 | $ | 5,110,000 | |||||
Shares issued in reinvestment of dividends and distributions | 1,651 | 17,322 | ||||||
|
|
|
| |||||
Net increase (decrease) in shares outstanding | 512,154 | $ | 5,127,322 | |||||
|
|
|
| |||||
| * | Commenced operations March 5, 2014. |
7. Borrowings
The Fund, along with other affiliated registered investment companies (the “Funds”), is a party to a Syndicated Credit Agreement (“SCA”) with a group of banks. The purpose of the SCA is to provide an alternative source of temporary funding for capital share redemptions. The SCA provides for a commitment of $900 million for the period October 9, 2014 through October 8, 2015. The Funds pay an annualized commitment fee of .075% of the unused portion of the SCA. Interest on any borrowings under the SCA is paid at contracted market rates. The commitment fee for the unused amount is accrued daily and paid quarterly.
The Fund did not utilize the SCA during the year ended July 31, 2015.
8. New Accounting Pronouncement
In May 2015, the FASB issued Accounting Standards Update (“ASU”) No. 2015-07 regarding “Disclosures for Investments in Certain Entities That Calculate Net Asset Value per Share”. The amendments in this update are effective for the Fund for fiscal years beginning after December 15, 2015, and interim periods within those fiscal years. ASU No. 2015-07 will eliminate the requirement to categorize investments in the fair value hierarchy if their fair value is measured at net asset value (“NAV”) per share (or its equivalent) using the practical expedient in the FASB’s fair value measurement guidance. At this time, management is evaluating the implications of ASU No. 2015-07 and its impact on the financial statement disclosures has not yet been determined.
| 34 |
Financial Highlights
| Class A Shares | ||||||||||
Year Ended July 31, 2015 | March 5, 2014(b) through July 31, 2014(c) | |||||||||
| Per Share Operating Performance: | ||||||||||
| Net Asset Value, Beginning of Period | $10.34 | $10.00 | ||||||||
| Income (loss) from investment operations: | ||||||||||
| Net investment income | .10 | .04 | ||||||||
| Net realized and unrealized gain on investments | 1.03 | .33 | ||||||||
| Total from investment operations | 1.13 | .37 | ||||||||
| Less Dividends and Distributions: | ||||||||||
| Dividends from net investment income | (.11 | ) | (.03 | ) | ||||||
| Distributions from net realized gains on investments | (.03 | ) | - | |||||||
| Total dividends and distributions | (.14 | ) | (.03 | ) | ||||||
| Net Asset Value, end of period | $11.33 | $10.34 | ||||||||
| Total Return(a): | 11.03% | 3.66% | ||||||||
| Ratios/Supplemental Data: | ||||||||||
| Net assets, end of period (000) | $1,087 | $383 | ||||||||
| Average net assets (000) | $822 | $192 | ||||||||
| Ratios to average net assets(d): | ||||||||||
| Expenses after waivers and/or expense reimbursement | 1.24% | 1.24% | (e) | |||||||
| Expenses before waivers and/or expense reimbursement | 3.54% | 8.18% | (e) | |||||||
| Net investment income | 1.09% | .85% | (e) | |||||||
| Portfolio turnover rate | 45% | 9% | (f) | |||||||
(a) Total return does not consider the effect of sales loads. Total return is calculated assuming a purchase of a share on the first day and a sale on the last day of each period reported and includes reinvestment of dividends and distributions. Total returns may reflect adjustments to conform to generally accepted accounting principles. Total returns for periods less than one full year are not annualized.
(b) Commencement of operations.
(c) Calculated based on the average shares outstanding during the period.
(d) Does not include expenses of the underlying portfolio in which the Fund invests.
(e) Annualized.
(f) Not annualized.
See Notes to Financial Statements.
| Prudential Jennison Rising Dividend Fund | 35 |
Financial Highlights
continued
| Class C Shares | ||||||||||
Year Ended July 31, 2015 | March 5, 2014(b) through July 31, 2014(c) | |||||||||
| Per Share Operating Performance: | ||||||||||
| Net Asset Value, Beginning of Period | $10.33 | $10.00 | ||||||||
| Income (loss) from investment operations: | ||||||||||
| Net investment income | .02 | - | (g) | |||||||
| Net realized and unrealized gain on investments | 1.03 | .33 | ||||||||
| Total from investment operations | 1.05 | .33 | ||||||||
| Less Dividends and Distributions: | ||||||||||
| Dividends from net investment income | (.03 | ) | - | (g) | ||||||
| Distributions from net realized gains on investments | (.03 | ) | - | |||||||
| Total dividends and distributions | (.06 | ) | - | (g) | ||||||
| Net Asset Value, end of period | $11.32 | $10.33 | ||||||||
| Total Return(a): | 10.23% | 3.35% | ||||||||
| Ratios/Supplemental Data: | ||||||||||
| Net assets, end of period (000) | $423 | $33 | ||||||||
| Average net assets (000) | $188 | $16 | ||||||||
| Ratios to average net assets(d): | ||||||||||
| Expenses after waivers and/or expense reimbursement | 1.99% | 1.99% | (e) | |||||||
| Expenses before waivers and/or expense reimbursement | 4.16% | 8.95% | (e) | |||||||
| Net investment income | .32% | .08% | (e) | |||||||
| Portfolio turnover rate | 45% | 9% | (f) | |||||||
(a) Total return does not consider the effect of sales loads. Total return is calculated assuming a purchase of a share on the first day and a sale on the last day of each period reported and includes reinvestment of dividends and distributions. Total returns may reflect adjustments to conform to generally accepted accounting principles. Total returns for periods less than one full year are not annualized.
(b) Commencement of operations.
(c) Calculated based on the average shares outstanding during the period.
(d) Does not include expenses of the underlying portfolio in which the Fund invests.
(e) Annualized.
(f) Not annualized.
(g) Less than $.005.
See Notes to Financial Statements.
| 36 |
| Class Z Shares | ||||||||||
Year Ended July 31, 2015 | March 5, 2014(b) through July 31, 2014(c) | |||||||||
| Per Share Operating Performance: | ||||||||||
| Net Asset Value, Beginning of Period | $10.35 | $10.00 | ||||||||
| Income (loss) from investment operations: | ||||||||||
| Net investment income | .14 | .05 | ||||||||
| Net realized and unrealized gain on investments | 1.01 | .33 | ||||||||
| Total from investment operations | 1.15 | .38 | ||||||||
| Less Dividends and Distributions: | ||||||||||
| Dividends from net investment income | (.14 | ) | (.03 | ) | ||||||
| Distributions from net realized gains on investments | (.03 | ) | - | |||||||
| Total dividends and distributions | (.17 | ) | (.03 | ) | ||||||
| Net Asset Value, end of period | $11.33 | $10.35 | ||||||||
| Total Return(a): | 11.19% | 3.84% | ||||||||
| Ratios/Supplemental Data: | ||||||||||
| Net assets, end of period (000) | $6,190 | $5,299 | ||||||||
| Average net assets (000) | $5,953 | $5,133 | ||||||||
| Ratios to average net assets(d): | ||||||||||
| Expenses after waivers and/or expense reimbursement | .99% | .99% | (e) | |||||||
| Expenses before waivers and/or expense reimbursement | 3.31% | 8.04% | (e) | |||||||
| Net investment income | 1.33% | 1.09% | (e) | |||||||
| Portfolio turnover rate | 45% | 9% | (f) | |||||||
(a) Total return is calculated assuming a purchase of a share on the first day and a sale on the last day of each period reported and includes reinvestment of dividends and distributions. Total returns may reflect adjustments to conform to generally accepted accounting principles. Total returns for periods less than one full year are not annualized.
(b) Commencement of operations.
(c) Calculated based on the average shares outstanding during the period.
(d) Does not include expenses of the underlying portfolio in which the Fund invests.
(e) Annualized.
(f) Not annualized.
See Notes to Financial Statements.
| Prudential Jennison Rising Dividend Fund | 37 |
Report of Independent Registered Public
Accounting Firm
The Board of Trustees and Shareholders
Prudential Investment Portfolio 5 - Prudential Jennison Rising Dividend Fund:
We have audited the accompanying statement of assets and liabilities of the Prudential Jennison Rising Dividend Fund, a series of Prudential Investment Portfolio 5 (hereafter referred to as the “Fund”), including the portfolio of investments, as of July 31, 2015, the related statement of operations for the year then ended, the statement of changes in net assets and financial highlights for the year then ended and the period from March 5, 2014 (commencement of operations) to July 31, 2014. These financial statements and financial highlights are the responsibility of the Fund’s management. Our responsibility is to express an opinion on these financial statements and financial highlights based on our audit.
We conducted our audits in accordance with the standards of the Public Company Accounting Oversight Board (United States). Those standards require that we plan and perform the audit to obtain reasonable assurance about whether the financial statements and financial highlights are free of material misstatement. An audit includes examining, on a test basis, evidence supporting the amounts and disclosures in the financial statements. Our procedures included confirmation of securities owned as of July 31, 2015, by correspondence with the custodian, transfer agent and brokers or by other appropriate auditing procedures when replies from brokers were not received. An audit also includes assessing the accounting principles used and significant estimates made by management, as well as evaluating the overall financial statement presentation. We believe that our audits provide a reasonable basis for our opinion.
In our opinion, the financial statements and financial highlights referred to above present fairly, in all material respects, the financial position of the Fund as of July 31, 2015, and the results of its operations, the changes in its net assets, and the financial highlights for the periods noted in the opening paragraph in conformity with U.S. generally accepted accounting principles.

New York, New York
September 17, 2015
| 38 |
Tax Information
(Unaudited)
For the year ended July 31, 2015, the Fund reports the maximum amount allowable under Section 854 of the Internal Revenue Code, but not less than, the following percentages of the ordinary income dividends paid as: 1) qualified dividend income (QDI); and 2) eligible for corporate dividends received deduction (DRD):
| QDI | DRD | |||||||
Prudential Jennison Rising Dividend Fund | 98.95 | % | 97.65 | % | ||||
In January 2016, you will be advised on IRS Form 1099-DIV or substitute 1099-DIV as to the federal tax status of the distributions received by you in calendar year 2015.
| Prudential Jennison Rising Dividend Fund | 39 |
INFORMATION ABOUT BOARD MEMBERS AND OFFICERS
(Unaudited)
Information about Board Members and Officers of the Fund is set forth below. Board Members who are not deemed to be “interested persons” of the Fund, as defined in the 1940 Act, are referred to as “Independent Board Members.” Board Members who are deemed to be “interested persons” of the Fund are referred to as “Interested Board Members.” The Board Members are responsible for the overall supervision of the operations of the Fund and perform the various duties imposed on the directors of investment companies by the 1940 Act. The Board in turn elects the Officers, who are responsible for administering the day-to-day operations of the Fund.
| Independent Board Members(1) | ||||
Name, Address, Age Position(s) Portfolios Overseen | Principal Occupation(s) During Past Five Years | Other Directorships Held During Past Five Years | ||
| Ellen S. Alberding (57) Board Member Portfolios Overseen: 66 | President and Board Member, The Joyce Foundation (charitable foundation) (since 2002); Vice Chair, City Colleges of Chicago (community college system) (since 2011); Trustee, Skills for America’s Future (national initiative to connect employers to community colleges) (since 2011); Trustee, National Park Foundation (charitable foundation for national park system) (since 2009); Trustee, Economic Club of Chicago (since 2009). | None. | ||
| Kevin J. Bannon (63) Board Member Portfolios Overseen: 66 | Managing Director (April 2008-May 2015) and Chief Investment Officer (October 2008-November 2013) of Highmount Capital LLC (registered investment adviser); formerly Executive Vice President and Chief Investment Officer (April 1993-August 2007) of Bank of New York Company; President (May 2003-May 2007) of BNY Hamilton Family of Mutual Funds. | Director of Urstadt Biddle Properties (equity real estate investment trust) (since September 2008). | ||
| Linda W. Bynoe (63) Board Member Portfolios Overseen: 66 | President and Chief Executive Officer (since March 1995) and formerly Chief Operating Officer (December 1989-February 1995) of Telemat Ltd. (management consulting); formerly Vice President (January 1985-June 1989) at Morgan Stanley & Co. (broker-dealer). | Director of Simon Property Group, Inc. (retail real estate) (May 2003-May 2012); Director of Anixter International, Inc. (communication products distributor) (since January 2006); Director of Northern Trust Corporation (financial services) (since April 2006); Trustee of Equity Residential (residential real estate) (since December 2009). | ||
Prudential Jennison Rising Dividend Fund
| Independent Board Members(1) | ||||
Name, Address, Age Position(s) Portfolios Overseen | Principal Occupation(s) During Past Five Years | Other Directorships Held During Past Five Years | ||
| Keith F. Hartstein (58) Board Member Portfolios Overseen: 66 | Retired; Member (since November 2014) of the Governing Council of the Independent Directors Council (organization of independent mutual fund directors); formerly President and Chief Executive Officer (2005-2012), Senior Vice President (2004-2005), Senior Vice President of Sales and Marketing (1997-2004), and various executive management positions (1990-1997), John Hancock Funds, LLC (asset management); Chairman, Investment Company Institute’s Sales Force Marketing Committee (2003-2008). | None. | ||
Michael S. Hyland, CFA (69) Board Member Portfolios Overseen: 66 | Retired (since February 2005); formerly Senior Managing Director (July 2001-February 2005) of Bear Stearns & Co, Inc.; Global Partner, INVESCO (1999-2001); Managing Director and President of Salomon Brothers Asset Management (1989-1999). | None. | ||
| Richard A. Redeker (72) Board Member & Independent Chair Portfolios Overseen: 66 | Retired Mutual Fund Senior Executive (47 years); Management Consultant; Director, Mutual Fund Directors Forum (since 2014); Independent Directors Council (organization of independent mutual fund directors)-Executive Committee, Chair of Policy Steering Committee, Governing Council. | None. | ||
| Stephen G. Stoneburn (72) Board Member Portfolios Overseen: 66 | Chairman (since July 2011), President and Chief Executive Officer (since June 1996) of Quadrant Media Corp. (publishing company); formerly President (June 1995-June 1996) of Argus Integrated Media, Inc.; Senior Vice President and Managing Director (January 1993-1995) of Cowles Business Media; Senior Vice President of Fairchild Publications, Inc. (1975-1989). | None. | ||
Visit our website at www.prudentialfunds.com
| Interested Board Members(1) | ||||
Name, Address, Age Position(s) Portfolios Overseen | Principal Occupation(s) During Past Five Years | Other Directorships Held During Past Five Years | ||
Stuart S. Parker (52) Board Member & President Portfolios Overseen: 66 | President of Prudential Investments LLC (since January 2012); Executive Vice President of Prudential Investment Management Services LLC (since December 2012); Executive Vice President of Jennison Associates LLC and Head of Retail Distribution of Prudential Investments LLC (June 2005-December 2011). | None. | ||
Scott E. Benjamin (42) Board Member & Vice President Portfolios Overseen: 66 | Executive Vice President (since June 2009) of Prudential Investments LLC; Executive Vice President (June 2009-June 2012) and Vice President (since June 2012) of Prudential Investment Management Services LLC; Executive Vice President (since September 2009) of AST Investment Services, Inc.; Senior Vice President of Product Development and Marketing, Prudential Investments (since February 2006); Vice President of Product Development and Product Management, Prudential Investments (2003-2006). | None. | ||
| Grace C. Torres* (56) Board Member Portfolios Overseen: 64 | Retired; formerly Treasurer and Principal Financial and Accounting Officer of the Prudential Investments Funds, Target Funds, Advanced Series Trust, Prudential Variable Contract Accounts and The Prudential Series Fund (1998-June 2014); Assistant Treasurer (March 1999-June 2014) and Senior Vice President (September 1999-June 2014) of Prudential Investments LLC; Assistant Treasurer (May 2003-June 2014) and Vice President (June 2005-June 2014) of AST Investment Services, Inc.; Senior Vice President and Assistant Treasurer (May 2003-June 2014) of Prudential Annuities Advisory Services, Inc. | Director (since July 2015) of Sun Bancorp, Inc. N.A. | ||
| * | Note: Prior to her retirement in 2014, Ms. Torres was employed by Prudential Investments LLC. Due to her prior employment, she is considered to be an “interested person” under the 1940 Act. Ms. Torres is a non-management Interested Board Member. |
| (1) | The year that each Board Member joined the Board is as follows: |
Ellen S. Alberding, 2013; Kevin J. Bannon, 2008; Linda W. Bynoe, 2005; Keith F. Hartstein, 2013; Michael S. Hyland, 2008; Richard A. Redeker, 2003; Stephen G. Stoneburn, 1999; Grace C. Torres, 2014; Stuart S. Parker, Board Member and President since 2012; Scott E. Benjamin, Board Member since 2010 and Vice President since 2009.
Prudential Jennison Rising Dividend Fund
| Fund Officers(a) | ||||
Name, Address and Age Position with Fund | Principal Occupation(s) During Past Five Years | Length of Service as Fund Officer | ||
Raymond A. O’Hara (59) Chief Legal Officer | Vice President and Corporate Counsel (since July 2010) of Prudential Insurance Company of America (Prudential); Vice President (March 2011-Present) of Pruco Life Insurance Company and Pruco Life Insurance Company of New Jersey; Vice President and Corporate Counsel (March 2011-Present) of Prudential Annuities Life Assurance Corporation; Chief Legal Officer of Prudential Investments LLC (since June 2012); Chief Legal Officer of Prudential Mutual Fund Services LLC (since June 2012) and Corporate Counsel of AST Investment Services, Inc. (since June 2012); formerly Assistant Vice President and Corporate Counsel (September 2008-July 2010) of The Hartford Financial Services Group, Inc.; formerly Associate (September 1980-December 1987) and Partner (January 1988–August 2008) of Blazzard & Hasenauer, P.C. (formerly, Blazzard, Grodd & Hasenauer, P.C.). | Since 2012 | ||
Chad A. Earnst (39) Chief Compliance Officer | Chief Compliance Officer (September 2014-Present) of Prudential Investments LLC; Chief Compliance Officer (September 2014-Present) of the Prudential Investments Funds, Target Funds, Advanced Series Trust, The Prudential Series Fund, Prudential’s Gibraltar Fund, Inc., Prudential Global Short Duration High Yield Income Fund, Inc., Prudential Short Duration High Yield Fund, Inc. and Prudential Jennison MLP Income Fund, Inc.; formerly Assistant Director (March 2010-August 2014) of the Asset Management Unit, Division of Enforcement, US Securities & Exchange Commission; Assistant Regional Director (January 2010-August 2014), Branch Chief (June 2006–December 2009) and Senior Counsel (April 2003-May 2006) of the Miami Regional Office, Division of Enforcement, US Securities & Exchange Commission. | Since 2014 | ||
Deborah A. Docs (57) Secretary | Vice President and Corporate Counsel (since January 2001) of Prudential; Vice President (since December 1996) and Assistant Secretary (since March 1999) of Prudential Investments LLC; formerly Vice President and Assistant Secretary (May 2003-June 2005) of AST Investment Services, Inc. | Since 2004 | ||
Jonathan D. Shain (56) Assistant Secretary | Vice President and Corporate Counsel (since August 1998) of Prudential; Vice President and Assistant Secretary (since May 2001) of Prudential Investments LLC; Vice President and Assistant Secretary (since February 2001) of Prudential Mutual Fund Services LLC; formerly Vice President and Assistant Secretary (May 2003-June 2005) of AST Investment Services, Inc. | Since 2005 | ||
Visit our website at www.prudentialfunds.com
| Fund Officers(a) | ||||
| Name, Address and Age Position with Fund | Principal Occupation(s) During Past Five Years | Length of Service as Fund Officer | ||
Claudia DiGiacomo (40) Assistant Secretary | Vice President and Corporate Counsel (since January 2005) of Prudential; Vice President and Assistant Secretary of Prudential Investments LLC (since December 2005); Associate at Sidley Austin Brown & Wood LLP (1999-2004). | Since 2005 | ||
Andrew R. French (52) Assistant Secretary | Vice President and Corporate Counsel (since February 2010) of Prudential; formerly Director and Corporate Counsel (2006-2010) of Prudential; Vice President and Assistant Secretary (since January 2007) of Prudential Investments LLC; Vice President and Assistant Secretary (since January 2007) of Prudential Mutual Fund Services LLC. | Since 2006 | ||
Amanda S. Ryan (37) Assistant Secretary | Director and Corporate Counsel (since March 2012) of Prudential; Director and Assistant Secretary (since June 2012) of Prudential Investments LLC; Associate at Ropes & Gray LLP (2008-2012). | Since 2012 | ||
Theresa C. Thompson (52) Deputy Chief Compliance Officer | Vice President, Compliance, Prudential Investments LLC (since April 2004); and Director, Compliance, Prudential Investments LLC (2001-2004). | Since 2008 | ||
Richard W. Kinville (46) Anti-Money Laundering Compliance Officer | Vice President, Corporate Compliance, Anti-Money Laundering Unit (since January 2005) of Prudential; committee member of the American Council of Life Insurers Anti-Money Laundering and Critical Infrastructure Committee (since January 2007); formerly Investigator and Supervisor in the Special Investigations Unit for the New York Central Mutual Fire Insurance Company (August 1994-January 1999); Investigator in AXA Financial’s Internal Audit Department and Manager in AXA’s Anti-Money Laundering Office (January 1999-January 2005); first chair of the American Council of Life Insurers Anti-Money Laundering and Critical Infrastructure Committee (June 2007-December 2009). | Since 2011 | ||
M. Sadiq Peshimam (51) Treasurer and Principal Financial and Accounting Officer | Vice President (since 2005) of Prudential Investments LLC; formerly Assistant Treasurer of funds in the Prudential Mutual Fund Complex (2006-2014). | Since 2006 | ||
Peter Parrella (56) Assistant Treasurer | Vice President (since 2007) and Director (2004-2007) within Prudential Mutual Fund Administration; formerly Tax Manager at SSB Citi Fund Management LLC (1997-2004). | Since 2007 | ||
Lana Lomuti (48) Assistant Treasurer | Vice President (since 2007) and Director (2005-2007), within Prudential Mutual Fund Administration; formerly Assistant Treasurer (December 2007-February 2014) of The Greater China Fund, Inc. | Since 2014 | ||
Linda McMullin (53) Assistant Treasurer | Vice President (since 2011) and Director (2008-2011) within Prudential Mutual Fund Administration. | Since 2014 | ||
Kelly A. Coyne (46) Assistant Treasurer | Director, Investment Operations of Prudential Mutual Fund Services LLC (since 2010). | Since 2015 | ||
| (a) | Excludes Mr. Parker and Mr. Benjamin, interested Board Members who also serve as President and Vice President, respectively. |
Prudential Jennison Rising Dividend Fund
Explanatory Notes to Tables:
| • | Board Members are deemed to be “Interested,” as defined in the 1940 Act, by reason of their affiliation with Prudential Investments LLC and/or an affiliate of Prudential Investments LLC. |
| • | Unless otherwise noted, the address of all Board Members and Officers is c/o Prudential Investments LLC, 655 Broad Street, Newark, New Jersey 07102-4077. |
| • | There is no set term of office for Board Members or Officers. The Board Members have adopted a retirement policy, which calls for the retirement of Board Members on December 31 of the year in which they reach the age of 75. |
| • | “Other Directorships Held” includes only directorships of companies required to register or file reports with the SEC under the 1934 Act (that is, “public companies”) or other investment companies registered under the 1940 Act. |
| • | “Portfolios Overseen” includes all investment companies managed by Prudential Investments LLC. The investment companies for which Prudential Investments LLC serves as manager include the Prudential Investments Mutual Funds, The Prudential Variable Contract Accounts, Target Mutual Funds, Prudential Short Duration High Yield Fund, Inc., Prudential Global Short Duration High Yield Fund, Inc., The Prudential Series Fund, Prudential’s Gibraltar Fund, Inc. and the Advanced Series Trust. |
Visit our website at www.prudentialfunds.com
Approval of Advisory Agreements
The Fund’s Board of Trustees
The Board of Trustees (the “Board”) of Prudential Jennison Rising Dividend Fund (the “Fund”)1 consists of ten individuals, seven of whom are not “interested persons” of the Fund, as defined in the Investment Company Act of 1940, as amended (the “1940 Act”) (the “Independent Trustees”). The Board is responsible for the oversight of the Fund and its operations, and performs the various duties imposed on the directors of investment companies by the 1940 Act. The Independent Trustees have retained independent legal counsel to assist them in connection with their duties. The Chair of the Board is an Independent Trustee. The Board has established three standing committees: the Audit Committee, the Nominating and Governance Committee, and the Investment Committee. Each committee is chaired by, and composed of, Independent Trustees.
Annual Approval of the Fund’s Advisory Agreements
As required under the 1940 Act, the Board determines annually whether to renew the Fund’s management agreement with Prudential Investments LLC (“PI”) and the Fund’s subadvisory agreement with Jennison Associates LLC (“Jennison”). In considering the renewal of the agreements, the Board, including all of the Independent Trustees, met on June 9-11, 2015 and approved the renewal of the agreements through July 31, 2016, after concluding that the renewal of the agreements was in the best interests of the Fund and its shareholders.
In advance of the meetings, the Board requested and received materials relating to the agreements, and had the opportunity to ask questions and request further information in connection with its consideration. Among other things, the Board considered comparative fee information from PI and Jennison. Also, the Board considered comparisons with other mutual funds in relevant Peer Universes and Peer Groups, as is further discussed below.
In approving the agreements, the Board, including the Independent Trustees advised by independent legal counsel, considered the factors it deemed relevant, including the nature, quality and extent of services provided by PI and the subadviser, the performance of the Fund, the profitability of PI and its affiliates, expenses and fees, and the potential for economies of scale that may be shared with the Fund and its shareholders as the Fund’s assets grow. In their deliberations, the Trustees did not identify any single factor which alone was responsible for the Board’s decision to approve the agreements with respect to the Fund. In connection with its deliberations, the Board considered information provided by PI throughout the year at regular Board
Prudential Jennison Rising Dividend Fund
| 1 | Prudential Jennison Rising Dividend Fund is a series of Prudential Investment Portfolios 5. |
Approval of Advisory Agreements (continued)
meetings, presentations from portfolio managers and other information, as well as information furnished at or in advance of the meetings on June 9-11, 2015.
The Trustees determined that the overall arrangements between the Fund and PI, which serves as the Fund’s investment manager pursuant to a management agreement, and between PI and Jennison, which serves as the Fund’s subadviser pursuant to the terms of a subadvisory agreement with PI, are in the best interests of the Fund and its shareholders in light of the services performed, fees charged and such other matters as the Trustees considered relevant in the exercise of their business judgment.
Several of the material factors and conclusions that formed the basis for the Trustees’ reaching their determinations to approve the renewal of the agreements are discussed separately below.
Nature, Quality and Extent of Services
The Board received and considered information regarding the nature, quality and extent of services provided to the Fund by PI and Jennison. The Board considered the services provided by PI, including but not limited to the oversight of the subadviser for the Fund, as well as the provision of fund recordkeeping, compliance, and other services to the Fund. With respect to PI’s oversight of the subadviser, the Board noted that PI’s Strategic Investment Research Group (“SIRG”), which is a business unit of PI, is responsible for monitoring and reporting to PI’s senior management on the performance and operations of the subadviser. The Board also considered that PI pays the salaries of all of the officers and interested Trustees of the Fund who are part of Fund management. The Board also considered the investment subadvisory services provided by Jennison, as well as compliance with the Fund’s investment restrictions, policies and procedures. The Board considered PI’s evaluation of Jennison, as well as PI’s recommendation, based on its review of Jennison, to renew the subadvisory agreement.
The Board considered the qualifications, backgrounds and responsibilities of PI’s senior management responsible for the oversight of the Fund and Jennison, and also considered the qualifications, backgrounds and responsibilities of Jennison’s portfolio managers who are responsible for the day-to-day management of the Fund’s portfolio. The Board was provided with information pertaining to PI’s and Jennison’s organizational structure, senior management, investment operations, and other relevant information pertaining to both PI and Jennison. The Board also noted that it received favorable compliance reports from the Fund’s Chief Compliance Officer (“CCO”) as to both PI and Jennison. The Board noted that Jennison is affiliated with PI.
Visit our website at www.prudentialfunds.com
The Board concluded that it was satisfied with the nature, extent and quality of the investment management services provided by PI and the subadvisory services provided to the Fund by Jennison, and that there was a reasonable basis on which to conclude that the Fund benefits from the services provided by PI and Jennison under the management and subadvisory agreements.
Costs of Services and Profits Realized by PI
The Board was provided with information on the profitability of PI and its affiliates in serving as the Fund’s investment manager. The Board discussed with PI the methodology utilized in assembling the information regarding profitability and considered its reasonableness. The Board recognized that it is difficult to make comparisons of profitability from fund management contracts because comparative information is not generally publicly available and is affected by numerous factors, including the structure of the particular adviser, the types of funds it manages, its business mix, numerous assumptions regarding allocations and the adviser’s capital structure and cost of capital. However, the Board considered that the cost of services provided by PI to the Fund during the year ended December 31, 2014 exceeded the management fees paid by the Fund, resulting in an operating loss to PI. The Board further noted that the subadviser is affiliated with PI and that its profitability is reflected in PI’s profitability report. Taking these factors into account, the Board concluded that the profitability of PI and its affiliates in relation to the services rendered was not unreasonable.
Economies of Scale
PI and the Board previously retained an outside business consulting firm to review management fee breakpoint usage and trends in management fees across the mutual fund industry. The consulting firm presented its analysis and conclusions as to the Funds’ management fee structures to the Board and PI. The Board and PI have discussed these conclusions extensively since that presentation.
The Board received and discussed information concerning economies of scale that PI may realize as the Fund’s assets grow beyond current levels. The Board considered information provided by PI regarding the launch date of the Fund, the management fees of the Fund compared to those of similarly managed funds and PI’s investment in the Fund over time. The Board noted that economies of scale, if any, may be shared with the Fund in several ways, including low management fees from inception, additional technological and personnel investments to enhance shareholder services, and maintaining existing expense structures in the face of a rising cost environment. The Board considered PI’s assertion that it continually evaluates the management fee
Prudential Jennison Rising Dividend Fund
Approval of Advisory Agreements (continued)
schedule of the Fund and the potential to share economies of scale through breakpoints or fee waivers as asset levels increase.
The Board recognized the inherent limitations of any analysis of economies of scale, stemming largely from the Board’s understanding that most of PI’s costs are not specific to individual funds, but rather are incurred across a variety of products and services.
Other Benefits to PI and Jennison
The Board considered potential ancillary benefits that might be received by PI and Jennison and their affiliates as a result of their relationship with the Fund. The Board concluded that potential benefits to be derived by PI included fees received by affiliates of PI for serving as the Fund’s securities lending agent, transfer agency fees received by the Fund’s transfer agent (which is affiliated with PI), as well as benefits to its reputation or other intangible benefits resulting from PI’s association with the Fund. The Board concluded that the potential benefits to be derived by Jennison included its ability to use soft dollar credits, as well as the potential benefits consistent with those generally resulting from an increase in assets under management, specifically, potential access to additional research resources and benefits to its reputation. The Board concluded that the benefits derived by PI and Jennison were consistent with the types of benefits generally derived by investment managers and subadvisers to mutual funds.
Performance of the Fund / Fees and Expenses
The Board considered certain additional specific factors and made related conclusions relating to the historical performance of the Fund for the quarter ended December 31, 2014. The Board considered that the Fund commenced operations on March 5, 2015 and that longer-term performance was not yet available.
The Board also considered the Fund’s actual management fee, as well as the Fund’s net total expense ratio, for the fiscal period ended July 31, 2014. The Board considered the management fee for the Fund as compared to the management fee charged by PI to other funds and the fee charged by other advisers to comparable mutual funds in a Peer Group. The actual management fee represents the fee rate actually paid by Fund shareholders and includes any fee waivers or reimbursements. The net total expense ratio for the Fund represents the actual expense ratio incurred by Fund shareholders.
The mutual funds included in the Peer Universe (the Lipper Equity Income Funds Performance Universe) and the Peer Group were objectively determined by Lipper
Visit our website at www.prudentialfunds.com
Inc. (“Lipper”), an independent provider of mutual fund data. To the extent that PI deemed appropriate, and for reasons addressed in detail with the Board, PI may have provided supplemental data compiled by Lipper for the Board’s consideration. The comparisons placed the Fund in various quartiles, with the first quartile being the best 25% of the mutual funds (for performance, the best performing mutual funds and, for expenses, the lowest cost mutual funds).
The section below summarizes key factors considered by the Board and the Board’s conclusions regarding the Fund’s performance, fees and overall expenses. The table sets forth gross performance comparisons (which do not reflect the impact on performance of fund expenses, or any subsidies, expense caps or waivers that may be applicable) with the Peer Universe, actual management fees with the Peer Group (which reflect the impact of any subsidies or fee waivers), and net total expenses with the Peer Group, each of which were key factors considered by the Board.
| Performance | 1 Year | 3 Years | 5 Years | 10 Years | ||||
N/A | N/A | N/A | N/A | |||||
| Actual Management Fees: 1st Quartile | ||||||||
| Net Total Expenses: 1st Quartile | ||||||||
| • | The Board considered that, because the Fund commenced operations during 2014, there was less than a full year of performance to review. |
| • | The Board and PI agreed to continue the Fund’s existing expense cap of 0.99% (exclusive of 12b-1 and certain other fees) through November 30, 2015. |
| • | The Board concluded that in light of the above, it would be in the best interests of the Fund and its shareholders to continue to allow the Fund to create a performance record, and to renew the agreements. |
| • | The Board concluded that the management fees (including subadvisory fees) and total expenses were reasonable in light of the services provided. |
* * *
After full consideration of these factors, the Board concluded that the approval of the agreements was in the best interests of the Fund and its shareholders.
Prudential Jennison Rising Dividend Fund
| n MAIL | n TELEPHONE | n WEBSITE | ||
655 Broad Street Newark, NJ 07102 | (800) 225-1852 | www.prudentialfunds.com |
| PROXY VOTING |
| The Board of Trustees of the Fund has delegated to the Fund’s investment subadviser the responsibility for voting any proxies and maintaining proxy recordkeeping with respect to the Fund. A description of these proxy voting policies and procedures is available without charge, upon request, by calling (800) 225-1852. Information regarding how the Fund voted proxies relating to portfolio securities during the most recent 12-month period ended June 30 is available on the Fund’s website and on the Securities and Exchange Commission’s website. |
| TRUSTEES |
| Ellen S. Alberding • Kevin J. Bannon • Scott E. Benjamin • Linda W. Bynoe • Keith F. Hartstein • Michael S. Hyland • Stuart S. Parker • Richard A. Redeker • Stephen G. Stoneburn • Grace C. Torres |
| OFFICERS |
| Stuart S. Parker, President • Scott E. Benjamin, Vice President • M. Sadiq Peshimam, Treasurer and Principal Financial and Accounting Officer • Raymond A. O’Hara, Chief Legal Officer • Chad A. Earnst, Chief Compliance Officer • Deborah A. Docs, Secretary • Theresa C. Thompson, Deputy Chief Compliance Officer • Richard W. Kinville, Anti-Money Laundering Compliance Officer • Jonathan D. Shain, Assistant Secretary • Claudia DiGiacomo, Assistant Secretary • Amanda S. Ryan, Assistant Secretary • Andrew R. French, Assistant Secretary • Peter Parrella, Assistant Treasurer • Lana Lomuti, Assistant Treasurer • Linda McMullin, Assistant Treasurer • Kelly A. Coyne, Assistant Treasurer |
| MANAGER | Prudential Investments LLC | 655 Broad Street Newark, NJ 07102 | ||
| ||||
| INVESTMENT SUBADVISER | Jennison Associates LLC | 466 Lexington Avenue New York, NY 10017 | ||
| ||||
| DISTRIBUTOR | Prudential Investment Management Services LLC | 655 Broad Street Newark, NJ 07102 | ||
| ||||
| CUSTODIAN | The Bank of New York Mellon | One Wall Street New York, NY 10286 | ||
| ||||
| TRANSFER AGENT | Prudential Mutual Fund Services LLC | PO Box 9658 Providence, RI 02940 | ||
| ||||
| INDEPENDENT REGISTERED PUBLIC ACCOUNTING FIRM | KPMG LLP | 345 Park Avenue New York, NY 10154 | ||
| ||||
| FUND COUNSEL | Willkie Farr & Gallagher LLP | 787 Seventh Avenue New York, NY 10019 | ||
| An investor should consider the investment objectives, risks, charges, and expenses of the Fund carefully before investing. The prospectus and summary prospectus contain this and other information about the Fund. An investor may obtain a prospectus and summary prospectus by visiting our website at www.prudentialfunds.com or by calling (800) 225-1852. The prospectus and summary prospectus should be read carefully before investing. |
| E-DELIVERY |
| To receive your mutual fund documents online, go to www.prudentialfunds.com/edelivery and enroll. Instead of receiving printed documents by mail, you will receive notification via email when new materials are available. You can cancel your enrollment or change your email address at any time by visiting the website address above. |
| SHAREHOLDER COMMUNICATIONS WITH TRUSTEES |
| Shareholders can communicate directly with the Board of Trustees by writing to the Chair of the Board, Prudential Jennison Rising Dividend Fund, Prudential Investments, Attn: Board of Trustees, 655 Broad Street, Gateway Center Three, Newark, NJ 07102. Shareholders can communicate directly with an individual Director by writing to the same address. Communications are not screened before being delivered to the addressee. |
| AVAILABILITY OF PORTFOLIO SCHEDULE |
| The Fund files its complete schedule of portfolio holdings with the Securities and Exchange Commission for the first and third quarters of each fiscal year on Form N-Q. The Fund’s Forms N-Q are available on the Commission’s website at www.sec.gov. The Fund’s Forms N-Q may also be reviewed and copied at the Commission’s Public Reference Room in Washington, D.C. Information on the operation and location of the Public Reference Room may be obtained by calling (202) 551-8090. The Fund’s schedule of portfolio holdings is also available on the Fund’s website as of the end of each month. |
| The Fund’s Statement of Additional Information contains additional information about the Fund’s Trustees and is available without charge, upon request, by calling (800) 225-1852. |
Mutual Funds:
| ARE NOT INSURED BY THE FDIC OR ANY FEDERAL GOVERNMENT AGENCY | MAY LOSE VALUE | ARE NOT A DEPOSIT OF OR GUARANTEED BY ANY BANK OR ANY BANK AFFILIATE |
PRUDENTIAL JENNISON RISING DIVIDEND FUND
| SHARE CLASS | A | C | Z | |||
| NASDAQ | PJDAX | PJDCX | PJDZX | |||
| CUSIP | 74440V823 | 74440V815 | 74440V799 |
MF220E 0282240-00001-00
Item 2 – Code of Ethics — See Exhibit (a)
As of the end of the period covered by this report, the registrant has adopted a code of ethics (the “Section 406 Standards for Investment Companies – Ethical Standards for Principal Executive and Financial Officers”) that applies to the registrant’s Principal Executive Officer and Principal Financial Officer; the registrant’s Principal Financial Officer also serves as the Principal Accounting Officer.
The registrant hereby undertakes to provide any person, without charge, upon request, a copy of the code of ethics. To request a copy of the code of ethics, contact the registrant 800-225-1852, and ask for a copy of the Section 406 Standards for Investment Companies - Ethical Standards for Principal Executive and Financial Officers.
Item 3 – Audit Committee Financial Expert –
The registrant’s Board has determined that Mr. Kevin J. Bannon, member of the Board’s Audit Committee is an “audit committee financial expert,” and that he is “independent,” for purposes of this Item.
Item 4 – Principal Accountant Fees and Services –
(a) Audit Fees
For the fiscal years ended July 31, 2015 and July 31, 2014, KPMG LLP (“KPMG”), the Registrant’s principal accountant, billed the Registrant $44,880 and $74,715, respectively, for professional services rendered for the audit of the Registrant’s annual financial statements or services that are normally provided in connection with statutory and regulatory filings.
(b) Audit-Related Fees
For the fiscal years ended July 31, 2015 and July 31, 2014: none.
(c) Tax Fees
For the fiscal years ended July 31, 2015 and July 31, 2014: none.
(d) All Other Fees
For the fiscal years ended July 31, 2015 and July 31, 2014: none.
(e) (1) Audit Committee Pre-Approval Policies and Procedures
THE PRUDENTIAL MUTUAL FUNDS
AUDIT COMMITTEE POLICY
on
Pre-Approval of Services Provided by the Independent Accountants
The Audit Committee of each Prudential Mutual Fund is charged with the responsibility to monitor the independence of the Fund’s independent accountants. As part of this responsibility, the Audit Committee must pre-approve any independent accounting firm’s engagement to render audit and/or permissible non-audit services, as required by law. In evaluating a proposed engagement of the independent accountants, the Audit Committee will assess the effect that the engagement might reasonably be expected to have on the accountant’s independence. The Committee’s evaluation will be based on:
| • | a review of the nature of the professional services expected to be provided, |
| • | a review of the safeguards put into place by the accounting firm to safeguard independence, and |
| • | periodic meetings with the accounting firm. |
Policy for Audit and Non-Audit Services Provided to the Funds
On an annual basis, the scope of audits for each Fund, audit fees and expenses, and audit-related and non-audit services (and fees proposed in respect thereof) proposed to be performed by the Fund’s independent accountants will be presented by the Treasurer and the independent accountants to the Audit Committee for review and, as appropriate, approval prior to the initiation of such services. Such presentation shall be accompanied by confirmation by both the Treasurer and the independent accountants that the proposed services will not adversely affect the independence of the independent accountants. Proposed services shall be described in sufficient detail to enable the Audit Committee to assess the appropriateness of such services and fees, and the compatibility of the provision of such services with the auditor’s independence. The Committee shall receive periodic reports on the progress of the audit and other services which are approved by the Committee or by the Committee Chair pursuant to authority delegated in this Policy.
The categories of services enumerated under “Audit Services”, “Audit-related Services”, and “Tax Services” are intended to provide guidance to the Treasurer and the independent accountants as to those categories of services which the Committee believes are generally consistent with the independence of the independent accountants and which the Committee (or the Committee Chair) would expect upon the presentation of specific proposals to pre-approve. The enumerated categories are not intended as an exclusive list of audit, audit-related or tax services, which the Committee (or the Committee Chair) would consider for pre-approval.
Audit Services
The following categories of audit services are considered to be consistent with the role of the Fund’s independent accountants:
| • | Annual Fund financial statement audits |
| • | Seed audits (related to new product filings, as required) |
| • | SEC and regulatory filings and consents |
Audit-related Services
The following categories of audit-related services are considered to be consistent with the role of the Fund’s independent accountants:
| • | Accounting consultations |
| • | Fund merger support services |
| • | Agreed Upon Procedure Reports |
| • | Attestation Reports |
| • | Other Internal Control Reports |
Individual audit-related services that fall within one of these categories and are not presented to the Audit Committee as part of the annual pre-approval process will be subject to pre-approval by the Committee Chair (or any other Committee member on whom this responsibility has been delegated) so long as the estimated fee for those services does not exceed $30,000.
Tax Services
The following categories of tax services are considered to be consistent with the role of the Fund’s independent accountants:
| • | Tax compliance services related to the filing or amendment of the following: |
| • | Federal, state and local income tax compliance; and, |
| • | Sales and use tax compliance |
| • | Timely RIC qualification reviews |
| • | Tax distribution analysis and planning |
| • | Tax authority examination services |
| • | Tax appeals support services |
| • | Accounting methods studies |
| • | Fund merger support services |
| • | Tax consulting services and related projects |
Individual tax services that fall within one of these categories and are not presented to the Audit Committee as part of the annual pre-approval process will be subject to pre-approval by the Committee Chair (or any other Committee member on whom this responsibility has been delegated) so long as the estimated fee for those services does not exceed $30,000.
Other Non-audit Services
Certain non-audit services that the independent accountants are legally permitted to render will be subject to pre-approval by the Committee or by one or more Committee members to whom the Committee has delegated this authority and who will report to the full Committee any pre-approval decisions made pursuant to this Policy. Non-audit services presented for pre-approval pursuant to this paragraph will be accompanied by a confirmation from both the Treasurer and the independent accountants that the proposed services will not adversely affect the independence of the independent accountants.
Proscribed Services
The Fund’s independent accountants will not render services in the following categories of non-audit services:
| • | Bookkeeping or other services related to the accounting records or financial statements of the Fund |
| • | Financial information systems design and implementation |
| • | Appraisal or valuation services, fairness opinions, or contribution-in-kind reports |
| • | Actuarial services |
| • | Internal audit outsourcing services |
| • | Management functions or human resources |
| • | Broker or dealer, investment adviser, or investment banking services |
| • | Legal services and expert services unrelated to the audit |
| • | Any other service that the Public Company Accounting Oversight Board determines, by regulation, is impermissible. |
Pre-approval of Non-Audit Services Provided to Other Entities Within the Prudential Fund Complex
Certain non-audit services provided to Prudential Investments LLC or any of its affiliates that also provide ongoing services to the Prudential Mutual Funds will be subject to pre-approval by the Audit Committee. The only non-audit services provided to these entities that will require pre-approval are those related directly to the operations and financial reporting of the Funds. Individual projects that are not presented to the Audit Committee as part of the annual pre-approval process will be subject to pre-approval by the Committee Chair (or any other Committee member on whom this responsibility has been delegated) so long as the estimated fee for those services does not exceed $30,000. Services presented for pre-approval pursuant to this paragraph will be accompanied by a confirmation from both the Treasurer and the independent accountants that the proposed services will not adversely affect the independence of the independent accountants.
Although the Audit Committee will not pre-approve all services provided to Prudential Investments LLC and its affiliates, the Committee will receive an annual report from the Fund’s independent accounting firm showing the aggregate fees for all services provided to Prudential Investments and its affiliates.
(e) (2) Percentage of services referred to in 4(b) – 4(d) that were approved by the audit committee –
For the fiscal years ended July 31, 2015 and July 31, 2014: not applicable.
(f) Percentage of hours expended attributable to work performed by other than full time employees of principal accountant if greater than 50%.
The percentage of hours expended on the principal accountant’s engagement to audit the registrant’s financial statements for the most recent fiscal year that were attributed to work performed by persons other than the principal accountant’s full-time, permanent employees was 0%.
(g) Non-Audit Fees
The aggregate non-audit fees billed by KPMG for services rendered to the registrant’s investment adviser and any entity controlling, controlled by, or under common control with the investment adviser that provides ongoing services to the registrant for the fiscal years ended July 31, 2015 and July 31, 2014 was $0 and $0, respectively.
(h) Principal Accountant’s Independence
Not applicable as KPMG has not provided non-audit services to the registrant’s investment adviser and any entity controlling, controlled by, or under common control with the investment adviser that provides ongoing services to the registrant that were not pre-approved pursuant to Rule 2-01(c)(7)(ii) of Regulation S-X.
| Item 5 | – | Audit Committee of Listed Registrants – Not applicable. | ||
| Item 6 | – | Schedule of Investments – The schedule is included as part of the report to shareholders filed under Item 1 of this Form. | ||
| Item 7 | – | Disclosure of Proxy Voting Policies and Procedures for Closed-End Management Investment Companies – Not applicable. | ||
| Item 8 | – | Portfolio Managers of Closed-End Management Investment Companies – Not applicable. | ||
| Item 9 | – | Purchases of Equity Securities by Closed-End Management Investment Company and Affiliated Purchasers – Not applicable. | ||
| Item 10 | – | Submission of Matters to a Vote of Security Holders – Not applicable. | ||
| Item 11 | – | Controls and Procedures | ||
| (a) | It is the conclusion of the registrant’s principal executive officer and principal financial officer that the effectiveness of the registrant’s current disclosure controls and procedures (such disclosure controls and procedures having been evaluated within 90 days of the date of this filing) provide reasonable assurance that the information required to be disclosed by the registrant has been recorded, processed, summarized and reported within the time period specified in the Commission’s rules and forms and that the information required to be disclosed by the registrant has been accumulated and communicated to the registrant’s principal executive officer and principal financial officer in order to allow timely decisions regarding required disclosure. |
| (b) | There has been no significant change in the registrant’s internal control over financial reporting that occurred during the registrant’s most recent fiscal quarter of the period covered by this report that has materially affected, or is likely to materially affect, the registrant’s internal control over financial reporting. |
Item 12 – Exhibits
| (a) | (1) Code of Ethics – Attached hereto as Exhibit EX-99.CODE-ETH |
(2) Certifications pursuant to Section 302 of the Sarbanes-Oxley Act – Attached hereto as Exhibit EX-99.CERT.
(3) Any written solicitation to purchase securities under Rule 23c-1. – Not applicable.
| (b) | Certifications pursuant to Section 906 of the Sarbanes-Oxley Act – Attached hereto as Exhibit EX-99.906CERT. |
SIGNATURES
Pursuant to the requirements of the Securities Exchange Act of 1934 and the Investment Company Act of 1940, the registrant has duly caused this report to be signed on its behalf by the undersigned, thereunto duly authorized.
Registrant: | Prudential Investment Portfolios 5 |
By: | /s/ Deborah A. Docs | |
| Deborah A. Docs | ||
| Secretary | ||
Date: | September 18, 2015 | |
Pursuant to the requirements of the Securities Exchange Act of 1934 and the Investment Company Act of 1940, this report has been signed below by the following persons on behalf of the registrant and in the capacities and on the dates indicated.
By: | /s/ Stuart S. Parker | |
| Stuart S. Parker | ||
| President and Principal Executive Officer | ||
Date: | September 18, 2015 | |
By: | /s/ M. Sadiq Peshimam | |
| M. Sadiq Peshimam | ||
| Treasurer and Principal Financial and Accounting Officer | ||
Date: | September 18, 2015 | |