UNITED STATES
SECURITIES AND EXCHANGE COMMISSION
Washington, D.C. 20549
FORM N-CSR
CERTIFIED SHAREHOLDER REPORT OF REGISTERED MANAGEMENT
INVESTMENT COMPANIES
| | |
| Investment Company Act file number: | | 811-09439 |
| |
| Exact name of registrant as specified in charter: | | Prudential Investment Portfolios 5 |
| |
| Address of principal executive offices: | | 655 Broad Street, 17th Floor |
| | Newark, New Jersey 07102 |
| |
| Name and address of agent for service: | | Deborah A. Docs |
| | 655 Broad Street, 17th Floor |
| | Newark, New Jersey 07102 |
| |
| Registrant’s telephone number, including area code: | | 800-225-1852 |
| |
| Date of fiscal year end: | | 7/31/2017 |
| |
| Date of reporting period: | | 7/31/2017 |
| Item | 1 – Reports to Stockholders |

PRUDENTIAL JENNISON DIVERSIFIED GROWTH FUND (formerly known as Prudential Jennison Conservative Growth Fund)
ANNUAL REPORT
JULY 31, 2017

To enroll in e-delivery, go to pgiminvestments.com/edelivery
|
| Objective: Seeks long-term capital appreciation |
Highlights
| • | | Information technology positions contributed the most to return. |
| • | | In financials, many holdings, including Goldman Sachs and JPMorgan Chase, advanced on perceptions that they would benefit from the results of the 2016 US presidential election, as the new administration was widely expected to favor a less onerous regulatory environment. |
| • | | Energy positions, including Devon Energy, Newfield Exploration, Apache, and EOG Resources, declined along with the benchmark sector, as expectations that oil prices would stabilize or rise (in the wake of OPEC’s 2016 decision to cut production) and that oil field capital spending programs would accelerate came into question. |
This report is not authorized for distribution to prospective investors unless preceded or accompanied by a current prospectus.
The views expressed in this report and information about the Fund’s portfolio holdings are for the period covered by this report and are subject to change thereafter.
Mutual funds are distributed by Prudential Investment Management Services LLC, member SIPC. Jennison Associates LLC is a registered investment adviser. Both are Prudential Financial companies. © 2017 Prudential Financial, Inc. and its related entities. Jennison Associates, Jennison, the Prudential logo, and the Rock symbol are service marks of Prudential Financial, Inc. and its related entities, registered in many jurisdictions worldwide.
| | |
| 2 | | Visit our website at pgiminvestments.com |
Letter from the President

Dear Shareholder:
As we come to the fiscal year-end of the Prudential Jennison Conservative Growth Fund’s reporting cycle, we have two significant name changes to announce. The first involves renaming the Fund to help better communicate an understanding of its investment strategy among current and prospective shareholders. We have therefore changed its name to the Prudential Jennison Diversified Growth Fund.
In addition to the Fund name change, we are proud to announce that Prudential Investments has changed its name to PGIM® Investments, effective April 3, 2017. Why PGIM? This new name was chosen to further align with the global investment management businesses of Prudential Financial, which rebranded from Prudential Investment Management in January 2016. This new name allows for one brand and reflects our ability and commitment to delivering investment solutions to clients around the globe. Please keep in mind that only the Fund adviser’s name is changing: the name of your Fund and its management and operation will not change.
Major global events during the reporting period included the US presidential election and domestic issues related to the new administration’s policy initiatives. The US economy experienced weak growth during the first quarter of 2017, although stronger growth took place in the second quarter. Britain began its formal legal process to leave the European Union, and recent parliamentary elections in Britain resulted in unseating the majority party. Overall, global economic growth picked up slightly.
Equities in the US reached new highs, and international equities gained significantly. European stocks posted impressive results. Asian markets were solid, and emerging markets outperformed most regions.
In mid-June, the Federal Reserve raised its Federal Funds rate by 0.25% for the second time in 2017. Fixed income markets were mixed, as rising interest rates affected bond markets. High yield and emerging markets bonds were among the top performers.
Given the uncertainty in today’s investment environment, we believe that active professional portfolio management offers a potential advantage. Active managers often have the knowledge and flexibility to find the best investment opportunities in the most challenging markets.
Even so, it’s best if investment decisions are based on your long-term goals rather than on short-term market and economic developments. We also encourage you to work with an experienced financial advisor who can help you set goals, determine your tolerance for risk, and build a diversified plan that’s right for you and make adjustments when necessary.
At PGIM Investments, we consider it a great privilege and responsibility to help investors participate in opportunities across global markets while meeting their toughest investment challenges. We’re part of PGIM, a top-10 global investment manager with more than $1 trillion in assets under management. This investment expertise allows us to deliver actively managed funds and strategies to meet the needs of investors around the globe.
Thank you for choosing our family of funds.
Sincerely,

Stuart S. Parker, President
Prudential Jennison Diversified Growth Fund
September 15, 2017
| | | | |
| Prudential Jennison Diversified Growth Fund | | | 3 | |
Your Fund’s Performance (unaudited)
Performance data quoted represent past performance. Past performance does not guarantee future results. The investment return and principal value of an investment will fluctuate, so that an investor’s shares, when redeemed, may be worth more or less than their original cost. Current performance may be lower or higher than the past performance data quoted. An investor may obtain performance data as of the most recent month-end by visiting our website at www.pgiminvestments.com or by calling (800) 225-1852.
| | | | | | | | | | |
| | | Average Annual Total Returns as of 7/31/17
(with sales charges) | |
| | | One Year (%) | | Five Years (%) | | | Ten Years (%) | |
| Class A | | 13.20 | | | 13.16 | | | | 7.75 | |
| Class B | | 13.90 | | | 13.50 | | | | 7.55 | |
| Class C | | 17.90 | | | 13.63 | | | | 7.56 | |
| Russell 1000 Growth Index | | 18.05 | | | 15.60 | | | | 9.36 | |
| Lipper Large-Cap Growth Funds Average* | | 17.87 | | | 14.71 | | | | 8.34 | |
| Lipper Large-Cap Core Funds Average* | | 15.12 | | | 13.48 | | | | 6.82 | |
| | | | | | | | | | |
| | | Average Annual Total Returns as of 7/31/17
(without sales charges) | |
| | | One Year (%) | | Five Years (%) | | | Ten Years (%) | |
| Class A | | 19.78 | | | 14.44 | | | | 8.36 | |
| Class B | | 18.90 | | | 13.63 | | | | 7.55 | |
| Class C | | 18.90 | | | 13.63 | | | | 7.56 | |
| Russell 1000 Growth Index | | 18.05 | | | 15.60 | | | | 9.36 | |
| Lipper Large-Cap Growth Funds Average* | | 17.87 | | | 14.71 | | | | 8.34 | |
| Lipper Large-Cap Core Funds Average* | | 15.12 | | | 13.48 | | | | 6.82 | |
*The Fund is compared to the Lipper Large-Cap Growth Funds Performance universe although Lipper classifies the Fund in the Lipper Large-Cap Core Funds Performance universe. The Lipper Large-Cap Growth Funds Performance universe is utilized because the Fund’s manager believes the Funds included in this universe provide a more appropriate basis for Fund performance comparisons.
Source: PGIM Investments LLC and Lipper Inc.
| | |
| 4 | | Visit our website at pgiminvestments.com |
Growth of a $10,000 Investment
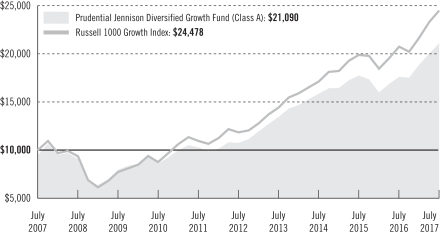
The graph compares a $10,000 investment in the Prudential Jennison Diversified Growth Fund (Class A shares) with a similar investment in the Russell 1000 Growth Index by portraying the initial account values at the beginning of the 10-year period for Class A shares (July 31, 2007) and the account values at the end of the current fiscal year (July 31, 2017) as measured on a quarterly basis. The Russell 1000 Growth Index data is measured from the closest month-end to inception date. For purposes of the graph, and unless otherwise indicated, it has been assumed that (a) the maximum applicable front-end sales charge was deducted from the initial $10,000 investment in Class A shares; (b) all recurring fees (including management fees) were deducted; and (c) all dividends and distributions were reinvested. The line graph provides information for Class A shares only. As indicated in the tables provided earlier, performance for Class B and Class C shares will vary due to the differing charges and expenses applicable to each share class (as indicated in the following paragraphs). Without waiver of fees and/or expense reimbursement, if any, the Fund’s returns would have been lower.
| | | | |
| Prudential Jennison Diversified Growth Fund | | | 5 | |
Your Fund’s Performance (continued)
The returns in the tables do not reflect the deduction of taxes that a shareholder would pay on Fund distributions or following the redemption of Fund shares. The average annual total returns take into account applicable sales charges, which are described for each share class in the table below.
| | | | | | |
| | | Class A | | Class B* | | Class C |
| Maximum initial sales charge | | 5.50% of the public offering price | | None | | None |
| Contingent deferred sales charge (CDSC) (as a percentage of the lower of original purchase price or net asset value at redemption) | | 1% on sales of $1 million or more made within 12 months of purchase | | 5% (Yr.1) 4% (Yr.2) 3% (Yr.3) 2% (Yr.4) 1% (Yr.5/6) 0% (Yr.7) | | 1% on sales made within 12 months of purchase |
| Annual distribution and service (12b-1) fees (shown as a percentage of average daily net assets) | | .30% (.25% currently) | | 1% | | 1% |
*Class B shares are closed to all purchase activity and no additional Class B shares may be purchased or acquired except by exchange from Class B shares of another Fund or through dividend or capital gains reinvestment.
Benchmark Definitions
Russell 1000 Growth Index—The Russell 1000 Growth Index is an unmanaged index which contains those securities in the Russell 1000® Index with an above-average growth orientation. Companies in this index tend to exhibit higher price-to-book and price-to-earnings ratios, lower dividend yields, and higher forecasted growth rates.
Lipper Large-Cap Growth Funds Average—The Lipper Large-Cap Growth Funds Average (Lipper Average) is based on the average return of all funds in the Lipper Large-Cap Growth Funds universe for the periods noted. Funds in the Lipper Average invest at least 75% of their equity assets in companies with market capitalizations (on a three-year weighted basis) greater than 300% of the dollar-weighted median market capitalization of the middle 1,000 securities of the S&P SuperComposite 1500 Index.
Lipper Large-Cap Core Funds Average—The Lipper Large-Cap Core Funds Average (Lipper Average) is based on the average return of all funds in the Lipper Large-Cap Core Funds universe for the periods noted. Funds in the Lipper Average invest at least 75% of their equity assets in companies with market capitalizations (on a three-year weighted basis) greater than 300% of the dollar-weighted median market capitalization of the middle 1,000 securities of the S&P SuperComposite 1500 Index. Large-cap core funds have wide latitude in the companies in which they invest. These funds typically have a below-average price-to-earnings ratio, price-to-book ratio, and three-year sales-per-share-growth value compared with the S&P 500 Index.
| | |
| 6 | | Visit our website at pgiminvestments.com |
Investors cannot invest directly in an index or average. The returns for the Index would be lower if they included the effects of sales charges, operating expenses of a mutual fund, or taxes that may be paid by an investor. Returns for the Lipper Averages reflect the deduction of operating expenses, but not sales charges or taxes.
| | | | |
Five Largest Holdings expressed as a
percentage of net assets as of 7/31/17 (%) | |
| Apple, Inc. | | | 4.5 | |
| Alphabet, Inc. (Class A Stock) | | | 3.8 | |
| Priceline Group, Inc. (The) | | | 3.5 | |
| Amazon.com, Inc. | | | 3.4 | |
| Facebook, Inc. (Class A Stock) | | | 3.2 | |
Holdings reflect only long-term investments and are subject to change.
| | | | |
Five Largest Industries expressed as a
percentage of net assets as of 7/31/17 (%) | |
| Internet Software & Services | | | 11.9 | |
| Internet & Direct Marketing Retail | | | 8.9 | |
| Pharmaceuticals | | | 8.2 | |
| Oil, Gas & Consumable Fuels | | | 6.0 | |
| Insurance | | | 5.8 | |
Industry weightings reflect only long-term investments and are subject to change.
| | | | |
| Prudential Jennison Diversified Growth Fund | | | 7 | |
Strategy and Performance Overview
How did the Fund perform?
The Prudential Jennison Diversified Growth Fund’s Class A shares rose 19.78% in the 12 months ended July 31, 2017. In the same period, the Russell 1000® Growth Index (the Index) advanced 18.05%, and the Lipper Large-Cap Growth Funds Average climbed 17.87%.
What was the market environment?
| • | | The unconventional US presidential election and the new administration’s shaky start contributed to market volatility in the 12-month period ended July 31, 2017. |
| • | | The market’s initial favorable response to the election reflected anticipation of lower corporate tax rates, a less onerous regulatory environment, and increased fiscal spending on infrastructure. With legislative accomplishments elusive and factionalism impeding cooperation, market expectations moderated. |
| • | | Solid economic fundamentals in the US included moderate GDP expansion, robust employment, and accelerating corporate profit growth. Inflation remained benign. The Federal Reserve raised the federal funds target rate to 1.00%-1.25%. |
What worked?
| • | | Information technology positions contributed the most to return. |
| | • | | Alibaba reported impressive financial results that beat consensus expectations on most key metrics. It operates China’s largest global online wholesale platform for small businesses, China’s largest online retail website, and China’s largest online third-party platform for brands and retailers. Jennison believes Alibaba, with its dominant market share, offers an attractive opportunity to invest in the long-term growth of the Chinese e-commerce market. |
| | • | | Apple’s fundamental strength reflects the proliferation of the iOS platform across the global mobile phone, tablet, and personal computer landscape, as well as the financial power related to the attractive margin profile of the company’s hardware products. |
| | • | | Tencent, China’s largest and most visited Internet service portal, continues to perform well, fundamentally driven by its dominant position in China’s online gaming and instant messaging markets and its growing advertising and payment service efforts. With its recent acquisition of two key music platforms, Tencent is also China’s leading online music provider. |
| | • | | Jennison believes that as Internet-based social platform Facebook solidifies its dominant position, it continues to increase its appeal to both users and advertisers. Long-term, largely untapped, growth drivers include Instagram, WhatsApp, and Messenger. The company’s revenue, margins, and earnings beat consensus expectations, with user metrics and engagement remaining strong. |
| | |
| 8 | | Visit our website at pgiminvestments.com |
| | • | | Nvidia has transformed itself from a personal-computer-centric graphics provider to a company focused on key high-growth markets where Jennison believes it can leverage its graphics expertise to offer high-value-added solutions: gaming (where it has dominant market share), automotive, high-performance computing, and cloud and enterprise. Jennison believes Nvidia is uniquely positioned in these markets as developers have coalesced and standardized around its architecture and platform, potentially driving several years of strong top-line growth. |
| • | | In financials, many holdings, including Goldman Sachs and JPMorgan Chase, advanced on perceptions that they would benefit from the results of the 2016 US presidential election, as the new administration was widely expected to favor a less onerous regulatory environment. |
| | • | | Jennison believes Goldman’s strong capital base and leading global positions in investment banking, capital markets, trading, and asset management provide attractive exposure to long-term global economic expansion. |
| | • | | Jennison believes JPMorgan Chase’s diversified franchise has broad earnings capacity supported by a robust capital base. |
| • | | In consumer discretionary: |
| | • | | Amazon continued to invest to drive unit growth in its core retail business and through the proliferation of digital commerce via the mobile market. The stock benefited from strong execution, long-term revenue growth, and development of a meaningfully important business opportunity in cloud infrastructure. Amazon’s proposed acquisition of Whole Foods potentially unlocks another large addressable market over the long term. As Amazon’s business momentum continues, Jennison believes investments in distribution, digital content, Prime Now/Amazon Fresh, Alexa/Echo, and India will continue to fuel growth. |
| | • | | Jennison believes that the long-term competitive positioning of Netflix has been strengthened by exclusive deals and original content, pricing power, international expansion, and scale advantage, which enables the company to fund content costs with a global subscriber base. Jennison expects Netflix to continue to benefit as its dominant positioning within the media landscape becomes increasingly apparent. The company’s subscriber growth and international profit exceeded operations. |
What didn’t work?
| | • | | Bristol-Myers Squibb declined on dashed hopes for an accelerated approval timeline for its combination of two drugs in the treatment of lung cancer. Jennison continues to expect favorable data on the combination therapy in early 2018 and maintains conviction in the long-term value creation of Bristol’s immuno-oncology franchise. |
| | | | |
| Prudential Jennison Diversified Growth Fund | | | 9 | |
Strategy and Performance Overview (continued)
| | • | | Although Jennison expects Novo Nordisk to benefit from the structural growth in the diabetes market, it eliminated the position, as the world’s leading maker of insulin faced heightened competitive pressure. |
| | • | | Specialty pharmaceutical company Shire has product franchises in neuroscience, gastrointestinal, and rare diseases. Its weakness may have been related to the possibility of increased competition for its hemophilia drugs. |
| • | | Energy positions, including Devon Energy, Newfield Exploration, Apache, and EOG Resources, declined along with the benchmark sector, as expectations that oil prices would stabilize or rise (in the wake of OPEC’s 2016 decision to cut production) and that oil field capital spending programs would accelerate came into question. |
The percentage points shown in the tables identify each security’s positive or negative contribution to the Fund’s return, which is the sum of all contributions by individual holdings.
| | | | | | |
| Top contributors (%) | | Top detractors (%) |
| Alibaba Group Holding Ltd. (China) | | 2.02 | | Bristol-Myers Squibb Co. | | –0.73 |
| Apple, Inc. | | 1.45 | | Target Corp. | | –0.44 |
| Amazon.com, Inc. | | 1.36 | | Novo Nordisk, Inc. | | –0.40 |
| Tencent Holdings Ltd. | | 1.30 | | Devon Energy Corp. | | –0.34 |
| Goldman Sachs Group Inc. | | 1.08 | | Shire PLC | | –0.27 |
Current outlook
| • | | Lifted by US GDP expansion that continues at a 2.0%-2.5% rate and corporate earnings that are showing healthy growth across most sectors, investors have largely taken the new US administration’s heterodox approach and the Republican-controlled legislature’s lack of accomplishments in stride. |
| • | | Economic growth in the US looks to be durable at its present rate through the rest of the year, although declining automobile production, a weaker US dollar, and limits to further job growth could pose risk. The positive outlook for corporate profits continues to reflect stable demand patterns with little near-term inflationary pressures. |
| • | | Washington remains a significant uncertainty. A continuing funding resolution, raising the debt ceiling, and a budget resolution are hefty issues to be addressed before the Federal Government’s fiscal-year-end and necessary precursors to progress on tax reform or fiscal stimulus. |
| • | | The interest rate yield curve is flatter across the maturity spectrum than it has been in many years, with three hikes from the Fed at the short-end and a well-contained set of inflationary expectations anchoring long rates. |
| | |
| 10 | | Visit our website at pgiminvestments.com |
| • | | Companies held in the Fund have posted well-above-average earnings growth thus far in 2017, and Jennison expects them to continue to perform well fundamentally throughout the rest of this year and next. |
| | | | |
| Prudential Jennison Diversified Growth Fund | | | 11 | |
Fees and Expenses (unaudited)
As a shareholder of the Fund, you incur two types of costs: (1) transaction costs, including sales charges (loads) on purchase payments and redemptions, as applicable, and (2) ongoing costs, including management fees, distribution and/or service (12b-1) fees, and other Fund expenses, as applicable. This example is intended to help you understand your ongoing costs (in dollars) of investing in the Fund and to compare these costs with the ongoing costs of investing in other mutual funds.
The example is based on an investment of $1,000 held through the six-month period ended July 31, 2017. The example is for illustrative purposes only; you should consult the Prospectus for information on initial and subsequent minimum investment requirements.
Actual Expenses
The first line for each share class in the table on the following page provides information about actual account values and actual expenses. You may use the information on this line, together with the amount you invested, to estimate the expenses that you paid over the period. Simply divide your account value by $1,000 (for example, an $8,600 account value ÷ $1,000 = 8.6), then multiply the result by the number on the first line under the heading “Expenses Paid During the Six-Month Period” to estimate the expenses you paid on your account during this period.
Hypothetical Example for Comparison Purposes
The second line for each share class in the table on the following page provides information about hypothetical account values and hypothetical expenses based on the Fund’s actual expense ratio and an assumed rate of return of 5% per year before expenses, which is not the Fund’s actual return. The hypothetical account values and expenses may not be used to estimate the actual ending account balance or expenses you paid for the period. You may use this information to compare the ongoing costs of investing in the Fund and other funds. To do so, compare this 5% hypothetical example with the 5% hypothetical examples that appear in the shareholder reports of the other funds.
The Fund’s transfer agent may charge additional fees to holders of certain accounts that are not included in the expenses shown in the table on the following page. These fees apply to individual retirement accounts (IRAs) and Section 403(b) accounts. As of the close of the six-month period covered by the table, IRA fees included an annual maintenance fee of $15 per account (subject to a maximum annual maintenance fee of $25 for all accounts held by the same shareholder). Section 403(b) accounts are charged an annual $25 fiduciary maintenance fee. Some of the fees may vary in amount, or may be waived, based on your total account balance or the number of Prudential Funds, including the Fund, that you own. You should consider the additional fees that were charged to your Fund account over the six-month period when you estimate the total ongoing expenses paid over the
| | |
| 12 | | Visit our website at pgiminvestments.com |
period and the impact of these fees on your ending account value, as these additional expenses are not reflected in the information provided in the expense table. Additional fees have the effect of reducing investment returns.
Please note that the expenses shown in the table are meant to highlight your ongoing costs only and do not reflect any transactional costs such as sales charges (loads). Therefore, the second line for each share class in the table is useful in comparing ongoing costs only and will not help you determine the relative total costs of owning different funds. In addition, if these transactional costs were included, your costs would have been higher.
| | | | | | | | | | | | | | | | | | |
Prudential Jennison
Diversified
Growth Fund | | Beginning Account
Value
February 1, 2017 | | | Ending Account
Value
July 31, 2017 | | | Annualized
Expense Ratio | | | Expenses Paid
During the
Six-Month Period* | |
| Class A | | Actual | | $ | 1,000.00 | | | $ | 1,120.00 | | | | 1.20 | % | | $ | 6.31 | |
| | Hypothetical | | $ | 1,000.00 | | | $ | 1,018.84 | | | | 1.20 | % | | $ | 6.01 | |
| Class B | | Actual | | $ | 1,000.00 | | | $ | 1,116.40 | | | | 1.95 | % | | $ | 10.23 | |
| | Hypothetical | | $ | 1,000.00 | | | $ | 1,015.12 | | | | 1.95 | % | | $ | 9.74 | |
| Class C | | Actual | | $ | 1,000.00 | | | $ | 1,116.40 | | | | 1.95 | % | | $ | 10.23 | |
| | | Hypothetical | | $ | 1,000.00 | | | $ | 1,015.12 | | | | 1.95 | % | | $ | 9.74 | |
*Fund expenses (net of fee waivers or subsidies, if any) for each share class are equal to the annualized expense ratio for each share class (provided in the table), multiplied by the average account value over the period, multiplied by the 181 days in the six-month period ended July 31, 2017, and divided by the 365 days in the Fund’s fiscal year ended July 31, 2017 (to reflect the six-month period). Expenses presented in the table include the expenses of any underlying portfolios in which the Fund may invest.
| | | | |
| Prudential Jennison Diversified Growth Fund | | | 13 | |
Schedule of Investments
as of July 31, 2017
| | | | | | | | |
| Description | | Shares | | | Value | |
LONG-TERM INVESTMENTS 99.2% | |
|
COMMON STOCKS | |
|
Aerospace & Defense 2.1% | |
Boeing Co. (The) | | | 1,782 | | | $ | 432,064 | |
General Dynamics Corp. | | | 8,927 | | | | 1,752,638 | |
Raytheon Co. | | | 15,161 | | | | 2,604,205 | |
| | | | | | | | |
| | | | | | | 4,788,907 | |
|
Air Freight & Logistics 0.0% | |
FedEx Corp. | | | 86 | | | | 17,891 | |
|
Automobiles 0.0% | |
Tesla, Inc.* | | | 99 | | | | 32,024 | |
|
Banks 4.8% | |
Bank of America Corp. | | | 10,080 | | | | 243,130 | |
Citigroup, Inc. | | | 29,372 | | | | 2,010,513 | |
JPMorgan Chase & Co. | | | 67,079 | | | | 6,157,852 | |
Wells Fargo & Co. | | | 47,812 | | | | 2,578,979 | |
| | | | | | | | |
| | | | | | | 10,990,474 | |
|
Beverages 2.4% | |
Coca-Cola Co. (The) | | | 74,656 | | | | 3,422,231 | |
Dr. Pepper Snapple Group, Inc. | | | 14,005 | | | | 1,276,696 | |
PepsiCo, Inc. | | | 6,526 | | | | 760,997 | |
| | | | | | | | |
| | | | | | | 5,459,924 | |
|
Biotechnology 2.1% | |
Celgene Corp.* | | | 15,829 | | | | 2,143,405 | |
Gilead Sciences, Inc. | | | 11,839 | | | | 900,829 | |
Shire PLC, ADR | | | 10,489 | | | | 1,757,327 | |
| | | | | | | | |
| | | | | | | 4,801,561 | |
|
Capital Markets 0.6% | |
BGC Partners, Inc. (Class A Stock) | | | 51,672 | | | | 651,584 | |
Goldman Sachs Group, Inc. (The) | | | 3,575 | | | | 805,555 | |
| | | | | | | | |
| | | | | | | 1,457,139 | |
|
Chemicals 1.3% | |
E.I. du Pont de Nemours & Co. | | | 6,301 | | | | 518,005 | |
LyondellBasell Industries NV (Class A Stock) | | | 28,610 | | | | 2,577,475 | |
| | | | | | | | |
| | | | | | | 3,095,480 | |
See Notes to Financial Statements.
| | | | |
| Prudential Jennison Diversified Growth Fund | | | 15 | |
Schedule of Investments (continued)
as of July 31, 2017
| | | | | | | | |
| Description | | Shares | | | Value | |
COMMON STOCKS (Continued) | | | | | | | | |
| |
Commercial Services & Supplies 1.5% | | | | | |
Waste Management, Inc. | | | 45,396 | | | $ | 3,411,509 | |
|
Diversified Financial Services 2.9% | |
Berkshire Hathaway, Inc. (Class B Stock)* | | | 20,276 | | | | 3,547,692 | |
Leucadia National Corp. | | | 124,640 | | | | 3,244,379 | |
| | | | | | | | |
| | | | | | | 6,792,071 | |
|
Diversified Telecommunication Services 1.6% | |
Verizon Communications, Inc. | | | 74,258 | | | | 3,594,087 | |
|
Electrical Equipment 0.9% | |
Emerson Electric Co. | | | 36,273 | | | | 2,162,233 | |
|
Equity Real Estate Investment Trusts (REITs) 2.7% | |
Douglas Emmett, Inc. | | | 23,407 | | | | 895,552 | |
Lamar Advertising Co. (Class A Stock) | | | 44,986 | | | | 3,174,662 | |
Outfront Media, Inc. | | | 98,460 | | | | 2,251,780 | |
| | | | | | | | |
| | | | | | | 6,321,994 | |
|
Food & Staples Retailing 3.2% | |
Costco Wholesale Corp. | | | 39,073 | | | | 6,193,461 | |
Walgreens Boots Alliance, Inc. | | | 13,698 | | | | 1,105,018 | |
Whole Foods Market, Inc. | | | 3,422 | | | | 142,903 | |
| | | | | | | | |
| | | | | | | 7,441,382 | |
|
Health Care Equipment & Supplies 1.4% | |
Baxter International, Inc. | | | 55,471 | | | | 3,354,886 | |
|
Health Care Providers & Services 1.7% | |
Cigna Corp. | | | 2,740 | | | | 475,554 | |
Express Scripts Holding Co.* | | | 9,836 | | | | 616,127 | |
Patterson Cos., Inc. | | | 70,334 | | | | 2,934,335 | |
| | | | | | | | |
| | | | | | | 4,026,016 | |
|
Hotels, Restaurants & Leisure 2.3% | |
Darden Restaurants, Inc. | | | 36,584 | | | | 3,068,666 | |
Marriott International, Inc. (Class A Stock) | | | 20,592 | | | | 2,145,480 | |
McDonald’s Corp. | | | 475 | | | | 73,692 | |
| | | | | | | | |
| | | | | | | 5,287,838 | |
| |
Household Products 1.5% | | | | | |
Procter & Gamble Co. (The) | | | 38,085 | | | | 3,458,880 | |
See Notes to Financial Statements.
| | | | | | | | |
| Description | | Shares | | | Value | |
COMMON STOCKS (Continued) | | | | | | | | |
|
Industrial Conglomerates 1.9% | |
General Electric Co. | | | 35,692 | | | $ | 914,072 | |
Honeywell International, Inc. | | | 24,988 | | | | 3,401,367 | |
| | | | | | | | |
| | | | | | | 4,315,439 | |
|
Insurance 5.8% | |
American International Group, Inc. | | | 52,798 | | | | 3,455,629 | |
Aspen Insurance Holdings Ltd. (Bermuda) | | | 66,301 | | | | 3,235,489 | |
RenaissanceRe Holdings Ltd. (Bermuda) | | | 23,654 | | | | 3,475,009 | |
XL Group Ltd. (Bermuda) | | | 73,718 | | | | 3,273,079 | |
| | | | | | | | |
| | | | | | | 13,439,206 | |
|
Internet & Direct Marketing Retail 8.9% | |
Amazon.com, Inc.* | | | 7,992 | | | | 7,894,338 | |
Netflix, Inc.* | | | 25,033 | | | | 4,547,495 | |
Priceline Group, Inc. (The)* | | | 4,047 | | | | 8,209,339 | |
| | | | | | | | |
| | | | | | | 20,651,172 | |
|
Internet Software & Services 11.9% | |
Alibaba Group Holding Ltd. (China), ADR*(a) | | | 40,445 | | | | 6,266,953 | |
Alphabet, Inc. (Class A Stock)* | | | 9,351 | | | | 8,841,370 | |
Facebook, Inc. (Class A Stock)* | | | 44,275 | | | | 7,493,544 | |
Tencent Holdings Ltd. (China), ADR | | | 125,230 | | | | 5,004,191 | |
| | | | | | | | |
| | | | | | | 27,606,058 | |
|
IT Services 3.9% | |
International Business Machines Corp. | | | 9,882 | | | | 1,429,629 | |
Mastercard, Inc. (Class A Stock) | | | 28,229 | | | | 3,607,666 | |
Visa, Inc. (Class A Stock) | | | 39,905 | | | | 3,972,942 | |
| | | | | | | | |
| | | | | | | 9,010,237 | |
|
Life Sciences Tools & Services 0.5% | |
Waters Corp.* | | | 6,961 | | | | 1,207,316 | |
|
Machinery 0.8% | |
Stanley Black & Decker, Inc. | | | 12,454 | | | | 1,752,153 | |
|
Media 2.8% | |
Charter Communications, Inc. (Class A Stock)* | | | 10,845 | | | | 4,250,264 | |
Interpublic Group of Cos., Inc. (The) | | | 54,355 | | | | 1,174,611 | |
Walt Disney Co. (The) | | | 9,904 | | | | 1,088,747 | |
| | | | | | | | |
| | | | | | | 6,513,622 | |
See Notes to Financial Statements.
| | | | |
| Prudential Jennison Diversified Growth Fund | | | 17 | |
Schedule of Investments (continued)
as of July 31, 2017
| | | | | | | | |
| Description | | Shares | | | Value | |
COMMON STOCKS (Continued) | | | | | | | | |
| |
Oil, Gas & Consumable Fuels 6.0% | | | | | |
Apache Corp. | | | 66,451 | | | $ | 3,287,995 | |
Chevron Corp. | | | 20,327 | | | | 2,219,505 | |
Concho Resources, Inc.* | | | 3,646 | | | | 474,928 | |
EOG Resources, Inc. | | | 9,363 | | | | 890,796 | |
Exxon Mobil Corp. | | | 44,079 | | | | 3,528,083 | |
Williams Cos., Inc. (The) | | | 108,388 | | | | 3,444,571 | |
| | | | | | | | |
| | | | | | | 13,845,878 | |
|
Personal Products 0.0% | |
Nu Skin Enterprises, Inc. (Class A Stock) | | | 350 | | | | 22,176 | |
|
Pharmaceuticals 8.2% | |
Allergan PLC | | | 29,672 | | | | 7,487,136 | |
Bristol-Myers Squibb Co. | | | 83,388 | | | | 4,744,777 | |
Johnson & Johnson | | | 25,144 | | | | 3,337,111 | |
Merck & Co., Inc. | | | 51,993 | | | | 3,321,313 | |
| | | | | | | | |
| | | | | | | 18,890,337 | |
|
Semiconductors & Semiconductor Equipment 1.8% | |
Broadcom Ltd. | | | 2,199 | | | | 542,405 | |
NVIDIA Corp. | | | 13,979 | | | | 2,271,727 | |
QUALCOMM, Inc. | | | 23,650 | | | | 1,257,944 | |
| | | | | | | | |
| | | | | | | 4,072,076 | |
|
Software 4.8% | |
Activision Blizzard, Inc. | | | 17,885 | | | | 1,104,935 | |
Adobe Systems, Inc.* | | | 17,371 | | | | 2,544,678 | |
Microsoft Corp. | | | 71,910 | | | | 5,227,857 | |
salesforce.com, Inc.* | | | 24,256 | | | | 2,202,445 | |
| | | | | | | | |
| | | | | | | 11,079,915 | |
|
Specialty Retail 1.9% | |
Home Depot, Inc. (The) | | | 2,517 | | | | 376,543 | |
Industria de Diseno Textil SA (Spain), ADR | | | 148,719 | | | | 2,955,047 | |
Williams-Sonoma, Inc.(a) | | | 22,409 | | | | 1,040,450 | |
| | | | | | | | |
| | | | | | | 4,372,040 | |
|
Technology Hardware, Storage & Peripherals 4.5% | |
Apple, Inc. | | | 69,221 | | | | 10,295,239 | |
|
Textiles, Apparel & Luxury Goods 1.1% | |
adidas AG (Germany), ADR | | | 22,791 | | | | 2,610,253 | |
See Notes to Financial Statements.
| | | | | | | | |
| Description | | Shares | | | Value | |
COMMON STOCKS (Continued) | | | | | | | | |
|
Tobacco 1.4% | |
Altria Group, Inc. | | | 44,836 | | | $ | 2,912,995 | |
British American Tobacco PLC (United Kingdom), ADR | | | 4,657 | | | | 291,156 | |
| | | | | | | | |
| | | | | | | 3,204,151 | |
| | | | | | | | |
TOTAL LONG-TERM INVESTMENTS
(cost $174,665,459) | | | | 229,381,564 | |
|
SHORT-TERM INVESTMENTS 4.2% | |
|
AFFILIATED MUTUAL FUNDS | |
Prudential Investment Portfolios 2 -
Prudential Core Ultra Short Bond Fund(w) | | | 2,267,112 | | | | 2,267,112 | |
| | | | | | | | |
Prudential Investment Portfolios 2 -
Prudential Institutional Money Market Fund
(cost $7,567,253; includes $7,561,076 of cash collateral for securities on loan)(b)(w) | | | 7,566,776 | | | | 7,567,532 | |
| | | | | | | | |
TOTAL SHORT-TERM INVESTMENTS
(cost $9,834,365) | | | | 9,834,644 | |
| | | | | | | | |
TOTAL INVESTMENTS 103.4%
(cost $184,499,824) | | | | 239,216,208 | |
Liabilities in excess of other assets (3.4)% | | | | (7,899,587 | ) |
| | | | | | | | |
NET ASSETS 100.0% | | | $ | 231,316,621 | |
| | | | | | | | |
The following abbreviations are used in the annual report:
ADR—American Depositary Receipt
LIBOR—London Interbank Offered Rate
REITs—Real Estate Investment Trusts
| * | Non-income producing security. |
| (a) | All or a portion of security is on loan. The aggregate market value of such securities, including those sold and pending settlement, is $7,306,830; cash collateral of $7,561,076 (included in liabilities) was received with which the Fund purchased highly liquid short-term investments. |
| (b) | Represents security purchased with cash collateral received for securities on loan and includes dividend reinvestment. |
| (w) | PGIM Investments LLC, the manager of the Fund, also serves as manager of the Prudential Investment Portfolios 2 - Prudential Core Ultra Short Bond Fund and Prudential Institutional Money Market Fund. |
Fair Value Measurements:
Various inputs are used in determining the value of the Fund’s investments. These inputs are summarized in the three broad levels listed below.
Level 1—unadjusted quoted prices generally in active markets for identical securities.
Level 2—quoted prices for similar securities, interest rates and yield curves, prepayment speeds, foreign currency exchange rates and other observable inputs.
See Notes to Financial Statements.
| | | | |
| Prudential Jennison Diversified Growth Fund | | | 19 | |
Schedule of Investments (continued)
as of July 31, 2017
Level 3—unobservable inputs for securities valued in accordance with Board approved fair valuation procedures.
The following is a summary of the inputs used as of July 31, 2017 in valuing such portfolio securities:
| | | | | | | | | | | | |
| | | Level 1 | | | Level 2 | | | Level 3 | |
Investments in Securities | |
Common Stocks | |
Aerospace & Defense | | $ | 4,788,907 | | | $ | — | | | $ | — | |
Air Freight & Logistics | | | 17,891 | | | | — | | | | — | |
Automobiles | | | 32,024 | | | | — | | | | — | |
Banks | | | 10,990,474 | | | | — | | | | — | |
Beverages | | | 5,459,924 | | | | — | | | | — | |
Biotechnology | | | 4,801,561 | | | | — | | | | — | |
Capital Markets | | | 1,457,139 | | | | — | | | | — | |
Chemicals | | | 3,095,480 | | | | — | | | | — | |
Commercial Services & Supplies | | | 3,411,509 | | | | — | | | | — | |
Diversified Financial Services | | | 6,792,071 | | | | — | | | | — | |
Diversified Telecommunication Services | | | 3,594,087 | | | | — | | | | — | |
Electrical Equipment | | | 2,162,233 | | | | — | | | | — | |
Equity Real Estate Investment Trusts (REITs) | | | 6,321,994 | | | | — | | | | — | |
Food & Staples Retailing | | | 7,441,382 | | | | — | | | | — | |
Health Care Equipment & Supplies | | | 3,354,886 | | | | — | | | | — | |
Health Care Providers & Services | | | 4,026,016 | | | | — | | | | — | |
Hotels, Restaurants & Leisure | | | 5,287,838 | | | | — | | | | — | |
Household Products | | | 3,458,880 | | | | — | | | | — | |
Industrial Conglomerates | | | 4,315,439 | | | | — | | | | — | |
Insurance | | | 13,439,206 | | | | — | | | | — | |
Internet & Direct Marketing Retail | | | 20,651,172 | | | | — | | | | — | |
Internet Software & Services | | | 27,606,058 | | | | — | | | | — | |
IT Services | | | 9,010,237 | | | | — | | | | — | |
Life Sciences Tools & Services | | | 1,207,316 | | | | — | | | | — | |
Machinery | | | 1,752,153 | | | | — | | | | — | |
Media | | | 6,513,622 | | | | — | | | | — | |
Oil, Gas & Consumable Fuels | | | 13,845,878 | | | | — | | | | — | |
Personal Products | | | 22,176 | | | | — | | | | — | |
Pharmaceuticals | | | 18,890,337 | | | | — | | | | — | |
Semiconductors & Semiconductor Equipment | | | 4,072,076 | | | | — | | | | — | |
Software | | | 11,079,915 | | | | — | | | | — | |
Specialty Retail | | | 4,372,040 | | | | — | | | | — | |
Technology Hardware, Storage & Peripherals | | | 10,295,239 | | | | — | | | | — | |
Textiles, Apparel & Luxury Goods | | | 2,610,253 | | | | — | | | | — | |
Tobacco | | | 3,204,151 | | | | — | | | | — | |
Affiliated Mutual Funds | | | 9,834,644 | | | | — | | | | — | |
| | | | | | | | | | | | |
Total | | $ | 239,216,208 | | | $ | — | | | $ | — | |
| | | | | | | | | | | | |
See Notes to Financial Statements.
During the period, there were no transfers between Level 1, Level 2 and Level 3 to report.
Industry Classification:
The industry classification of investments and liabilities in excess of other assets shown as a percentage of net assets as of July 31, 2017 were as follows (unaudited):
| | | | |
Internet Software & Services | | | 11.9 | % |
Internet & Direct Marketing Retail | | | 8.9 | |
Pharmaceuticals | | | 8.2 | |
Oil, Gas & Consumable Fuels | | | 6.0 | |
Insurance | | | 5.8 | |
Software | | | 4.8 | |
Banks | | | 4.8 | |
Technology Hardware, Storage & Peripherals | | | 4.5 | |
Affiliated Mutual Funds (including 3.3% of collateral for securities on loan) | | | 4.2 | |
IT Services | | | 3.9 | |
Food & Staples Retailing | | | 3.2 | |
Diversified Financial Services | | | 2.9 | |
Media | | | 2.8 | |
Equity Real Estate Investment Trusts (REITs) | | | 2.7 | |
Beverages | | | 2.4 | |
Hotels, Restaurants & Leisure | | | 2.3 | |
Biotechnology | | | 2.1 | |
Aerospace & Defense | | | 2.1 | |
Specialty Retail | | | 1.9 | |
Industrial Conglomerates | | | 1.9 | |
Semiconductors & Semiconductor Equipment | | | 1.8 | % |
Health Care Providers & Services | | | 1.7 | |
Diversified Telecommunication Services | | | 1.6 | |
Household Products | | | 1.5 | |
Commercial Services & Supplies | | | 1.5 | |
Health Care Equipment & Supplies | | | 1.4 | |
Tobacco | | | 1.4 | |
Chemicals | | | 1.3 | |
Textiles, Apparel & Luxury Goods | | | 1.1 | |
Electrical Equipment | | | 0.9 | |
Machinery | | | 0.8 | |
Capital Markets | | | 0.6 | |
Life Sciences Tools & Services | | | 0.5 | |
Automobiles | | | 0.0 | * |
Personal Products | | | 0.0 | * |
Air Freight & Logistics | | | 0.0 | * |
| | | | |
| | | 103.4 | |
Liabilities in excess of other assets | | | (3.4 | ) |
| | | | |
| | | 100.0 | % |
| | | | |
Financial Instruments/Transactions—Summary of Offsetting and Netting Arrangements:
The Fund entered into financial instruments/transactions during the reporting period that are either offset in accordance with current requirements or are subject to enforceable master netting arrangements or similar agreements that permit offsetting. The information about offsetting and related netting arrangements for financial instruments/transactions, where the legal right to set-off exists, is presented in the summary below.
Offsetting of financial instrument/transaction assets and liabilities:
| | | | | | | | | | | | |
Description | | Gross
Amounts of
Recognized
Assets(1) | | | Collateral
Received(2) | | | Net
Amount | |
Securities on Loan | | $ | 7,306,830 | | | $ | (7,306,830 | ) | | $ | — | |
| | | | | | | | | | | | |
| (1) | Amount represents market value. |
| (2) | Collateral amount disclosed by the Fund is limited to the market value of financial instruments/transactions. |
See Notes to Financial Statements.
| | | | |
| Prudential Jennison Diversified Growth Fund | | | 21 | |
Statement of Assets & Liabilities
as of July 31, 2017
| | | | |
Assets | |
Investments at value, including securities on loan of $7,306,830: | |
Unaffiliated investments (cost $174,665,459) | | $ | 229,381,564 | |
Affiliated investments (cost $9,834,365) | | | 9,834,644 | |
Dividends receivable | | | 149,515 | |
Tax reclaim receivable | | | 23,970 | |
Receivable for Fund shares sold | | | 20,556 | |
| | | | |
Total Assets | | | 239,410,249 | |
| | | | |
|
Liabilities | |
Payable to broker for collateral for securities on loan | | | 7,561,076 | |
Payable for Fund shares reacquired | | | 146,514 | |
Management fee payable | | | 135,830 | |
Accrued expenses and other liabilities | | | 130,076 | |
Distribution fee payable | | | 81,021 | |
Affiliated transfer agent fee payable | | | 38,968 | |
Deferred trustees’ fees | | | 143 | |
| | | | |
Total Liabilities | | | 8,093,628 | |
| | | | |
| |
Net Assets | | $ | 231,316,621 | |
| | | | |
| | | | | |
Net assets were comprised of: | |
Shares of beneficial interest, at par | | $ | 18,771 | |
Paid-in capital in excess of par | | | 157,863,345 | |
| | | | |
| | | 157,882,116 | |
Undistributed net investment income | | | 351,073 | |
Accumulated net realized gain on investment and foreign currency transactions | | | 18,367,048 | |
Net unrealized appreciation on investments | | | 54,716,384 | |
| | | | |
Net assets, July 31, 2017 | | $ | 231,316,621 | |
| | | | |
|
Class A | |
Net asset value and redemption price per share
($179,539,406 ÷ 14,032,703 shares of beneficial interest issued and outstanding) | | $ | 12.79 | |
Maximum sales charge (5.50% of offering price) | | | 0.74 | |
| | | | |
Maximum offering price to public | | $ | 13.53 | |
| | | | |
|
Class B | |
Net asset value, offering price and redemption price per share
($2,168,518 ÷ 198,482 shares of beneficial interest issued and outstanding) | | $ | 10.93 | |
| | | | |
|
Class C | |
Net asset value, offering price and redemption price per share
($49,608,697 ÷ 4,539,449 shares of beneficial interest issued and outstanding) | | $ | 10.93 | |
| | | | |
See Notes to Financial Statements.
Statement of Operations
Year Ended July 31, 2017
| | | | |
Net Investment Income (Loss) | |
Income | |
Unaffiliated dividend income (net of foreign withholding taxes of $31,430) | | $ | 3,546,163 | |
Income from securities lending, net (including affiliated income of $10,581) | | | 20,869 | |
Affiliated dividend income | | | 17,217 | |
| | | | |
Total income | | | 3,584,249 | |
| | | | |
|
Expenses | |
Management fee | | | 1,543,696 | |
Distribution fee—Class A | | | 508,490 | |
Distribution fee—Class B | | | 25,077 | |
Distribution fee—Class C | | | 485,238 | |
Administration fee | | | 3,681 | |
Transfer agent’s fees and expenses (including affiliated expense of $173,200) | | | 430,000 | |
Custodian and accounting fees | | | 59,000 | |
Registration fees | | | 47,000 | |
Shareholders’ reports | | | 24,000 | |
Audit fee | | | 24,000 | |
Legal fees and expenses | | | 21,000 | |
Trustees’ fees | | | 13,000 | |
Loan interest expense | | | 719 | |
Miscellaneous | | | 16,650 | |
| | | | |
Total expenses | | | 3,201,551 | |
Distribution fee waiver—Class A | | | (84,750 | ) |
| | | | |
Net expenses | | | 3,116,801 | |
| | | | |
Net investment income (loss) | | | 467,448 | |
| | | | |
|
Realized And Unrealized Gain (Loss) On Investments And Foreign Currency Transactions | |
Net realized gain (loss) on: | |
Investment transactions (including affiliated of $(944)) | | | 26,961,812 | |
Foreign currency transactions | | | 99 | |
| | | | |
| | | 26,961,911 | |
| | | | |
Net change in unrealized appreciation (depreciation) on investments (including affiliated of $279) | | | 12,224,121 | |
| | | | |
Net gain (loss) on investment and foreign currency transactions | | | 39,186,032 | |
| | | | |
Net Increase (Decrease) In Net Assets Resulting From Operations | | $ | 39,653,480 | |
| | | | |
See Notes to Financial Statements.
| | | | |
| Prudential Jennison Diversified Growth Fund | | | 23 | |
Statement of Changes in Net Assets
| | | | | | | | |
| | | Year Ended July 31, | |
| | | 2017 | | | 2016 | |
Increase (Decrease) in Net Assets | |
Operations | |
Net investment income (loss) | | $ | 467,448 | | | $ | 750,109 | |
Net realized gain (loss) on investment and foreign currency transactions | | | 26,961,911 | | | | (1,953,787 | ) |
Net change in unrealized appreciation (depreciation) on investments | | | 12,224,121 | | | | (2,661,600 | ) |
| | | | | | | | |
Net increase (decrease) in net assets resulting from operations | | | 39,653,480 | | | | (3,865,278 | ) |
| | | | | | | | |
|
Dividends and Distributions | |
Dividends from net investment income | |
Class A | | | (865,867 | ) | | | (533,907 | ) |
| | | | | | | | |
Distributions from net realized gains | | | | | | | | |
Class A | | | (4,609,408 | ) | | | (12,297,965 | ) |
Class B | | | (78,699 | ) | | | (285,598 | ) |
Class C | | | (1,548,074 | ) | | | (4,135,309 | ) |
| | | | | | | | |
| | | (6,236,181 | ) | | | (16,718,872 | ) |
| | | | | | | | |
|
Fund share transactions (Net of share conversions) | |
Net proceeds from shares sold | | | 6,581,454 | | | | 7,030,841 | |
Net asset value of shares issued in reinvestment of dividends and distributions | | | 7,009,461 | | | | 17,000,403 | |
Cost of shares reacquired | | | (33,578,029 | ) | | | (30,515,992 | ) |
| | | | | | | | |
Net increase (decrease) in net assets from Fund share transactions | | | (19,987,114 | ) | | | (6,484,748 | ) |
| | | | | | | | |
Total increase (decrease) | | | 12,564,318 | | | | (27,602,805 | ) |
|
Net Assets: | |
| |
Beginning of year | | | 218,752,303 | | | | 246,355,108 | |
| | | | | | | | |
End of year(a) | | $ | 231,316,621 | | | $ | 218,752,303 | |
| | | | | | | | |
(a) Includes undistributed net investment income of: | | $ | 351,073 | | | $ | 749,393 | |
| | | | | | | | |
See Notes to Financial Statements.
Notes to Financial Statements
Prudential Investment Portfolios 5 (the “Trust”) is registered under the Investment Company Act of 1940, as amended (“1940 Act”), as an open-end management investment company, which was established as a Delaware business trust on July 8, 1999. The Trust consists of fourteen separate funds: Prudential Day One Income Fund, Prudential Day One 2010 Fund, Prudential Day One 2015 Fund, Prudential Day One 2020 Fund, Prudential Day One 2025 Fund, Prudential Day One 2030 Fund, Prudential Day One 2035 Fund, Prudential Day One 2040 Fund, Prudential Day One 2045 Fund, Prudential Day One 2050 Fund, Prudential Day One 2055 Fund, Prudential Day One 2060 Fund, Prudential Jennison Diversified Growth Fund and Prudential Jennison Rising Dividend Fund. These financial statements relate to Prudential Jennison Diversified Growth Fund (the “Fund”, formerly Prudential Jennison Conservative Growth Fund). The financial statements of the other funds are not presented herein. The Fund is a diversified fund.
The investment objective of the Fund is long-term capital appreciation.
1. Accounting Policies
The Fund follows investment company accounting and reporting guidance of the Financial Accounting Standards Board (“FASB”) Accounting Standard Codification Topic 946 Financial Services—Investment Companies. The following accounting policies conform to U.S. generally accepted accounting principles. The Fund consistently follows such policies in the preparation of its financial statements.
Securities Valuation: The Fund holds securities and other assets and liabilities that are fair valued at the close of each day (generally, 4:00 PM Eastern time) the New York Stock Exchange (“NYSE”) is open for trading. Fair value is the price that would be received to sell an asset or paid to transfer a liability in an orderly transaction between market participants on the measurement date. The Board of Trustees (the “Board”) has adopted valuation procedures for security valuation under which fair valuation responsibilities have been delegated to PGIM Investments LLC (“PGIM Investments” or “the Manager”) (formerly known as Prudential Investments LLC). Under the current valuation procedures, the Valuation Committee is responsible for supervising the valuation of portfolio securities and other assets and liabilities. The valuation procedures permit the Fund to utilize independent pricing vendor services, quotations from market makers, and alternative valuation methods when market quotations are either not readily available or not deemed representative of fair value. A record of the Valuation Committee’s actions is subject to the Board’s review, approval, and ratification at its next regularly scheduled quarterly meeting.
Various inputs determine how the Fund’s investments are valued, all of which are categorized according to the three broad levels (Level 1, 2, or 3) detailed in the Schedule of Investments.
| | | | |
| Prudential Jennison Diversified Growth Fund | | | 25 | |
Notes to Financial Statements (continued)
Common and preferred stocks, exchange-traded funds, and derivative instruments, such as futures or options, that are traded on a national securities exchange are valued at the last sale price as of the close of trading on the applicable exchange where the security principally trades. Securities traded via NASDAQ are valued at the NASDAQ official closing price. To the extent these securities are valued at the last sale price or NASDAQ official closing price, they are classified as Level 1 in the fair value hierarchy. In the event that no sale or official closing price on valuation date exists, these securities are generally valued at the mean between the last reported bid and ask prices, or at the last bid price in the absence of an ask price. These securities are classified as Level 2 in the fair value hierarchy.
Foreign equities traded on foreign securities exchanges are generally valued using pricing vendor services that provide model prices derived using adjustment factors based on information such as local closing price, relevant general and sector indices, currency fluctuations, depositary receipts, and futures, as applicable. Securities valued using such model prices are classified as Level 2 in the fair value hierarchy. The models generate an evaluated adjustment factor for each security, which is applied to the local closing price to adjust it for post closing market movements. Utilizing that evaluated adjustment factor, the vendor provides an evaluated price for each security. If the vendor does not provide an evaluated price, securities are valued in accordance with exchange-traded common and preferred stock valuation policies discussed above.
Investments in open-end, non-exchange-traded mutual funds are valued at their net asset values as of the close of the NYSE on the date of valuation. These securities are classified as Level 1 in the fair value hierarchy since they may be purchased or sold at their net asset values on the date of valuation.
Securities and other assets that cannot be priced according to the methods described above are valued based on pricing methodologies approved by the Board. In the event that unobservable inputs are used when determining such valuations, the securities will be classified as Level 3 in the fair value hierarchy.
When determining the fair value of securities, some of the factors influencing the valuation include: the nature of any restrictions on disposition of the securities; assessment of the general liquidity of the securities; the issuer’s financial condition and the markets in which it does business; the cost of the investment; the size of the holding and the capitalization of the issuer; the prices of any recent transactions or bids/offers for such securities or any comparable securities; any available analyst media or other reports or information deemed reliable by the investment adviser regarding the issuer or the markets or industry in which it operates. Using fair value to price securities may result in a value that is different from a security’s most recent closing price and from the price used by other unaffiliated mutual funds to calculate their net asset values.
Restricted and Illiquid Securities: Subject to guidelines adopted by the Board, the Fund may invest up to 15% of its net assets in illiquid securities, including those which are restricted as to disposition under securities law (“restricted securities”). Restricted securities are valued pursuant to the valuation procedures noted above. Illiquid securities are those that, because of the absence of a readily available market or due to legal or contractual restrictions on resale, cannot be sold within seven days in the ordinary course of business at approximately the amount at which the Fund has valued the investment. Therefore, the Fund may find it difficult to sell illiquid securities at the time considered most advantageous by its Subadviser and may incur expenses that would not be incurred in the sale of securities that were freely marketable. Certain securities that would otherwise be considered illiquid because of legal restrictions on resale to the general public may be traded among qualified institutional buyers under Rule 144A of the Securities Act of 1933. These Rule 144A securities, as well as commercial paper that is sold in private placements under Section 4(2) of the Securities Act, may be deemed liquid by the Fund’s Subadviser under the guidelines adopted by the Directors of the Fund. However, the liquidity of the Fund’s investments in Rule 144A securities could be impaired if trading does not develop or declines.
Foreign Currency Translation: The books and records of the Fund are maintained in U.S. dollars. Foreign currency amounts are translated into U.S. dollars on the following basis:
(i) market value of investment securities, other assets and liabilities—at the current rates of exchange;
(ii) purchases and sales of investment securities, income and expenses—at the rates of exchange prevailing on the respective dates of such transactions.
Although the net assets of the Fund are presented at the foreign exchange rates and market values at the close of the period, the Fund does not generally isolate that portion of the results of operations arising as a result of changes in the foreign exchange rates from the fluctuations arising from changes in the market prices of long-term portfolio securities held at the end of the period. Similarly, the Fund does not isolate the effect of changes in foreign exchange rates from the fluctuations arising from changes in the market prices of long-term portfolio securities sold during the period. Accordingly, holding period realized foreign currency gains (losses) are included in the reported net realized gains (losses) on investment transactions.
Additionally, net realized gains (losses) on foreign currency transactions represent net foreign exchange gains (losses) from the disposition of holdings of foreign currencies, forward currency contracts, currency gains (losses) realized between the trade and settlement dates on securities transactions, and the difference between the amounts of interest, dividends and foreign withholding taxes recorded on the Fund’s books and the U.S. dollar equivalent amounts actually received or paid. Net unrealized currency gains (losses) from valuing foreign currency denominated assets and liabilities (other than investments) at period end exchange rates are reflected as a component of net unrealized appreciation (depreciation) on foreign currencies.
| | | | |
| Prudential Jennison Diversified Growth Fund | | | 27 | |
Notes to Financial Statements (continued)
Master Netting Arrangements: The Trust, on behalf of the Fund, is subject to various Master Agreements, or netting arrangements, with select counterparties. These are agreements which a subadviser may have negotiated and entered into on behalf of the Fund. A master netting arrangement between the Fund and the counterparty permits the Fund to offset amounts payable by the Fund to the same counterparty against amounts to be received; and by the receipt of collateral from the counterparty by the Fund to cover the Fund’s exposure to the counterparty. However, there is no assurance that such mitigating factors are easily enforceable. In addition to master netting arrangements, the right to set-off exists when all the conditions are met such that each of the parties owes the other determinable amounts, the reporting party has the right to set-off the amount owed with the amount owed by the other party, the reporting party intends to set-off and the right of set-off is enforceable by law. During the reporting period, there was no intention to settle on a net basis and all amounts are presented on a gross basis on the Statement of Assets and Liabilities.
Securities Lending: The Fund may lend its portfolio securities to banks and broker-dealers. The loans are secured by collateral at least equal to the market value of the securities loaned. Collateral pledged by each borrower is invested in an affiliated money market fund and is marked to market daily, based on the previous day’s market value, such that the value of the collateral exceeds the value of the loaned securities. Loans are subject to termination at the option of the borrower or the Fund. Upon termination of the loan, the borrower will return to the Fund securities identical to the loaned securities. Should the borrower of the securities fail financially, the Fund has the right to repurchase the securities in the open market using the collateral. The Fund recognizes income, net of any rebate and securities lending agent fees, for lending its securities in the form of fees or interest on the investment of any cash received as collateral. The borrower receives all interest and dividends from the securities loaned and such payments are passed back to the lender in amounts equivalent thereto. The Fund also continues to recognize any unrealized gain (loss) in the market price of the securities loaned and on the change in the value of the collateral invested that may occur during the term of the loan. In addition, realized gain (loss) is recognized on changes in the value of the collateral invested upon liquidation of the collateral. Net earnings from securities lending are disclosed on the Statement of Operations as “Income from securities lending, net”.
Concentration of Risk: Foreign security and currency transactions may involve certain considerations and risks not typically associated with those of domestic origin as a result of, among other factors, the possibility of political or economic instability or the level of governmental supervision and regulation of foreign securities markets.
Equity Real Estate Investment Trusts (REITs): The Fund invests in Equity REITs, which report information on the source of their distributions annually. Based on current and historical information, a portion of distributions received from Equity REITs during the
period is estimated to be dividend income, capital gain or return of capital and recorded accordingly. When material these estimates are adjusted periodically when the actual source of distributions is disclosed by the Equity REITs.
Concentration of Risk for REITs: Real estate securities are subject to the same risks as direct investments in real estate and mortgages, and their value will depend on the value of the underlying properties or the underlying loans or interests. The underlying loans may be subject to the risks of default or of prepayments that occur earlier or later than expected, and such loans may also include so-called “subprime” mortgages. The value of these securities will rise and fall in response to many factors, including economic conditions, the demand for rental property and interest rates. In particular, the value of these securities may decline when interest rates rise and will also be affected by the real estate market and by the management of the underlying properties.
In addition, investing in REITs involves certain unique risks in addition to those risks associated with investing in the real estate industry in general. Equity REITs may be affected by changes in the value of the underlying property owned by the REITs, while mortgage REITs may be affected by the quality of any credit extended. REITs are dependent upon management skills, may not be diversified geographically or by property/mortgage asset type, and are subject to heavy cash flow dependency, default by borrowers and self-liquidation. REITs may be more volatile and/or more illiquid than other types of equity securities. REITs (especially mortgage REITs) are subject to interest rate risks. REITs may incur significant amounts of leverage. The Fund will indirectly bear a portion of the expenses, including management fees, paid by each REIT in which it invests, in addition to the expenses of the Fund.
Securities Transactions and Net Investment Income: Securities transactions are recorded on the trade date. Realized gains (losses) from investment and currency transactions are calculated on the specific identification method. Dividend income is recorded on the ex-date. Interest income, including amortization of premium and accretion of discount on debt securities, as required, is recorded on the accrual basis. Expenses are recorded on an accrual basis, which may require the use of certain estimates by management that may differ from actual.
Net investment income or loss (other than distribution fees which are charged directly to the respective class) and unrealized and realized gains (losses) are allocated daily to each class of shares based upon the relative proportion of adjusted net assets of each class at the beginning of the day.
Taxes: It is the Fund’s policy to continue to meet the requirements of the Internal Revenue Code applicable to regulated investment companies and to distribute all of its taxable net investment income and capital gains, if any, to its shareholders. Therefore, no federal income tax provision is required. Withholding taxes on foreign dividends, interest and capital gains, if any, are recorded, net of reclaimable amounts, at the time the related income is earned.
| | | | |
| Prudential Jennison Diversified Growth Fund | | | 29 | |
Notes to Financial Statements (continued)
Dividends and Distributions: The Fund expects to pay dividends from net investment income and distributions from net realized capital gains, if any, annually. Dividends and distributions to shareholders, which are determined in accordance with federal income tax regulations and which may differ from generally accepted accounting principles, are recorded on the ex-date. Permanent book/tax differences relating to income and gain (loss) are reclassified amongst undistributed net investment income, accumulated net realized gain (loss) and paid-in capital in excess of par, as appropriate.
Estimates: The preparation of financial statements requires management to make estimates and assumptions that affect the reported amounts and disclosures in the financial statements. Actual results could differ from those estimates.
2. Agreements
The Trust, on behalf of the Fund, has a management agreement with PGIM Investments. Pursuant to this agreement, PGIM Investments has responsibility for all investment advisory services and supervises the subadviser’s performance of such services. PGIM Investments has entered into a subadvisory agreement with Jennison Associates LLC (“Jennison”). The subadvisory agreement provides that Jennison will furnish investment advisory services in connection with the management of the Fund. In connection therewith, Jennison is obligated to keep certain books and records of the Fund. PGIM Investments pays for the services of Jennison, the cost of compensation of officers of the Fund, occupancy and certain clerical and bookkeeping costs of the Fund. The Fund bears all other costs and expenses.
The management fee paid to PGIM Investments is accrued daily and payable monthly at an annual rate of .70% of the Fund’s average daily net assets on the first $500 million, .65% of the average daily net assets on the next $500 million and .60% of the average daily net assets in excess of $1 billion. The effective management fee rate was .70% for the year ended July 31, 2017.
The Trust, on behalf of the Fund, has a distribution agreement with Prudential Investment Management Services LLC (“PIMS”), which acts as the distributor of the Class A, Class B and Class C shares of the Fund. The Fund compensates PIMS for distributing and servicing the Fund’s Class A, Class B and Class C shares, pursuant to plans of distribution (the “Distribution Plans”), regardless of expenses actually incurred by PIMS. The distribution fees are accrued daily and payable monthly.
Pursuant to the Distribution Plans, the Fund compensates PIMS for distribution related activities at an annual rate of up to .30%, 1% and 1% of the average daily net assets of the Class A, B and C shares, respectively. PIMS has contractually agreed through
November 30, 2018 to reduce its distribution and service (12b-1) fees for Class A shares to .25% of the average daily net assets of the Class A shares.
PIMS has advised the Fund that it received $96,757 in front-end sales charges resulting from sales of Class A shares during the year ended July 31, 2017. From these fees, PIMS paid such sales charges to affiliated broker-dealers, which in turn paid commissions to salespersons and incurred other distribution costs.
PIMS has advised the Fund that for the year ended July 31, 2017, it received $2,887 and $643 in contingent deferred sales charges imposed upon certain redemptions by Class B and Class C shareholders, respectively.
PGIM Investments, PIMS and Jennison are indirect, wholly-owned subsidiaries of Prudential Financial, Inc. (“Prudential”).
3. Other Transactions with Affiliates
Prudential Mutual Fund Services LLC (“PMFS”), an affiliate of PGIM Investments and an indirect, wholly-owned subsidiary of Prudential, serves as the Fund’s transfer agent. Transfer agent’s fees and expenses in the Statement of Operations include certain out-of-pocket expenses paid to non-affiliates, where applicable.
The Fund may enter into certain securities purchase or sale transactions under Board approved Rule 17a-7 procedures. Rule 17a-7 is an exemptive rule under the 1940 Act, that permits purchase and sale transactions among affiliated investment companies, or between an investment company and a person that is affiliated solely by reason of having a common (or affiliated) investment adviser, common directors, and/or common officers. Such transactions are subject to ratification by the Board. For the period ended July 31, 2017 no such transactions were entered into by the Fund.
The Fund may invest its overnight sweep cash in the Prudential Core Ultra Short Bond Fund (the “Core Fund”), and its securities lending cash collateral in the Prudential Institutional Money Market Fund (the “Money Market Fund”), each a series of the Prudential Investment Portfolios 2, registered under the 1940 Act and managed by PGIM Investments. For the reporting period ended July 31, 2017, PGIM, Inc. was compensated $6,648 by PGIM Investments for managing the Fund’s securities lending cash collateral as subadviser to the Money Market Fund. Earnings from the Core Fund and Money Market Fund are disclosed on the Statement of Operations as “Affiliated dividend income” and “Income from securities lending, net”, respectively.
4. Portfolio Securities
The aggregate cost of purchases and proceeds from sales of portfolio securities (excluding short-term investments and U.S. Treasury securities) for the year ended July 31, 2017, were $396,720,249 and $424,875,296, respectively.
| | | | |
| Prudential Jennison Diversified Growth Fund | | | 31 | |
Notes to Financial Statements (continued)
5. Distributions and Tax Information
Distributions to shareholders, which are determined in accordance with federal income tax regulations and which may differ from generally accepted accounting principles, are recorded on the ex-date. In order to present undistributed net investment income, accumulated net realized gain on investment and foreign currency transactions and paid-in capital in excess of par on the Statement of Assets and Liabilities that more closely represent their tax character, certain adjustments have been made to undistributed net investment income and accumulated net realized gain on investment and foreign currency transactions. For the year ended July 31, 2017, the adjustments were to increase undistributed net investment income and decrease accumulated net realized gain on investment and foreign currency transactions by $99 due to differences in the treatment for book and tax purposes of certain transactions involving foreign currencies. Net investment income, net realized gain (loss) on investment and foreign currency transactions and net assets were not affected by this change.
For the year ended July 31, 2017, the tax character of distributions paid were $2,215,377 from ordinary income and $4,886,671 from long-term capital gains. For the year ended July 31, 2016, the tax character of distributions paid were $6,191,268 from ordinary income and $11,061,511 from long-term capital gains.
As of July 31, 2017, the accumulated undistributed earnings on a tax basis were $12,325,174 of ordinary income and $7,190,264 of long-term capital gains. This differs from the amount shown on the Statement of Assets and Liabilities primarily due to cumulative timing differences between financial and tax reporting.
The United States federal income tax basis of the Fund’s investments and the net unrealized appreciation as of July 31, 2017 were as follows:
| | | | | | |
Tax Basis | | Appreciation | | Depreciation | | Net
Unrealized
Appreciation |
| $185,296,998 | | $56,735,887 | | $(2,816,677) | | $53,919,210 |
The book basis differs from tax basis primarily due to deferred losses on wash sales.
The Fund utilized approximately $1,188,000 of its capital loss carryforward to offset net taxable gains realized in the fiscal year ended July 31, 2017.
Management has analyzed the Fund’s tax positions taken on federal, state and local income tax returns for all open tax years and has concluded that no provision for income tax is required in the Fund’s financial statements for the current reporting period. The
Fund’s federal, state and local income and federal excise tax returns for tax years for which the applicable statutes of limitations have not expired are subject to examination by the Internal Revenue Service and state departments of revenue.
6. Capital
The Fund offers Class A, Class B, and Class C shares. Class A shares are sold with a maximum front-end sales charge of up to 5.50%. Investors who purchase $1 million or more of Class A shares and redeem those shares within 12 months of purchase are subject to a contingent deferred sales charge (“CDSC”) of 1%, but are not subject to an initial sales charge. The Class A CDSC is waived for purchases by certain retirement and/or benefit plans. Class B shares are sold with a CDSC which declines from 5% to zero depending on the period of time the shares are held. Class B shares automatically convert to Class A shares on a quarterly basis, approximately seven years after purchase. Class B shares are closed to new purchases. Class C shares are sold with a CDSC of 1% on shares redeemed within 12 months of purchase. A special exchange privilege is also available for shareholders who qualify to purchase Class A shares at net asset value.
Under certain circumstances, an exchange may be made from specified share classes of the Fund to one or more other share classes of the Fund as presented in the table of transactions in shares of beneficial interest.
The Trust has authorized an unlimited number of shares of beneficial interest at $.001 par value per share.
At reporting period end, three shareholders of record held 26% of the Fund’s outstanding shares on behalf of multiple beneficial owners.
Transactions in shares of beneficial interest were as follows:
| | | | | | | | |
Class A | | Shares | | | Amount | |
Year ended July 31, 2017: | |
Shares sold | | | 464,735 | | | $ | 5,400,607 | |
Shares issued in reinvestment of dividends and distributions | | | 478,707 | | | | 5,418,963 | |
Shares reacquired | | | (2,366,974 | ) | | | (27,332,390 | ) |
| | | | | | | | |
Net increase (decrease) in shares outstanding before conversion | | | (1,423,532 | ) | | | (16,512,820 | ) |
Shares issued upon conversion from other share class(es) | | | 317,278 | | | | 3,739,029 | |
| | | | | | | | |
Net increase (decrease) in shares outstanding | | | (1,106,254 | ) | | $ | (12,773,791 | ) |
| | | | | | | | |
Year ended July 31, 2016: | |
Shares sold | | | 465,449 | | | $ | 5,046,604 | |
Shares issued in reinvestment of dividends and distributions | | | 1,191,030 | | | | 12,684,475 | |
Shares reacquired | | | (2,161,419 | ) | | | (23,099,934 | ) |
| | | | | | | | |
Net increase (decrease) in shares outstanding before conversion | | | (504,940 | ) | | | (5,368,855 | ) |
Shares issued upon conversion from other share class(es) | | | 91,159 | | | | 979,851 | |
| | | | | | | | |
Net increase (decrease) in shares outstanding | | | (413,781 | ) | | $ | (4,389,004 | ) |
| | | | | | | | |
| | | | |
| Prudential Jennison Diversified Growth Fund | | | 33 | |
Notes to Financial Statements (continued)
| | | | | | | | |
Class B | | Shares | | | Amount | |
Year ended July 31, 2017: | |
Shares sold | | | 9,731 | | | $ | 95,850 | |
Shares issued in reinvestment of dividends and distributions | | | 7,848 | | | | 76,286 | |
Shares reacquired | | | (45,825 | ) | | | (453,370 | ) |
| | | | | | | | |
Net increase (decrease) in shares outstanding before conversion | | | (28,246 | ) | | | (281,234 | ) |
Shares reacquired upon conversion into other share class(es) | | | (78,804 | ) | | | (793,809 | ) |
| | | | | | | | |
Net increase (decrease) in shares outstanding | | | (107,050 | ) | | $ | (1,075,043 | ) |
| | | | | | | | |
Year ended July 31, 2016: | |
Shares sold | | | 22,728 | | | $ | 217,564 | |
Shares issued in reinvestment of dividends and distributions | | | 30,060 | | | | 276,556 | |
Shares reacquired | | | (44,961 | ) | | | (418,097 | ) |
| | | | | | | | |
Net increase (decrease) in shares outstanding before conversion | | | 7,827 | | | | 76,023 | |
Shares reacquired upon conversion into other share class(es) | | | (102,832 | ) | | | (956,703 | ) |
| | | | | | | | |
Net increase (decrease) in shares outstanding | | | (95,005 | ) | | $ | (880,680 | ) |
| | | | | | | | |
Class C | | | | | | |
Year ended July 31, 2017: | |
Shares sold | | | 108,548 | | | $ | 1,084,997 | |
Shares issued in reinvestment of dividends and distributions | | | 155,783 | | | | 1,514,212 | |
Shares reacquired | | | (583,348 | ) | | | (5,792,269 | ) |
| | | | | | | | |
Net increase (decrease) in shares outstanding before conversion | | | (319,017 | ) | | | (3,193,060 | ) |
Shares reacquired upon conversion into other share class(es) | | | (291,556 | ) | | | (2,945,220 | ) |
| | | | | | | | |
Net increase (decrease) in shares outstanding | | | (610,573 | ) | | $ | (6,138,280 | ) |
| | | | | | | | |
Year ended July 31, 2016: | |
Shares sold | | | 187,630 | | | $ | 1,766,673 | |
Shares issued in reinvestment of dividends and distributions | | | 439,062 | | | | 4,039,372 | |
Shares reacquired | | | (753,835 | ) | | | (6,997,961 | ) |
| | | | | | | | |
Net increase (decrease) in shares outstanding before conversion | | | (127,143 | ) | | | (1,191,916 | ) |
Shares reacquired upon conversion into other share class(es) | | | (2,453 | ) | | | (23,148 | ) |
| | | | | | | | |
Net increase (decrease) in shares outstanding | | | (129,596 | ) | | $ | (1,215,064 | ) |
| | | | | | | | |
7. Borrowings
The Trust, on behalf of the Fund, along with other affiliated registered investment companies (the “Funds”), is a party to a Syndicated Credit Agreement (“SCA”) with a group of banks. The purpose of the SCA is to provide an alternative source of temporary funding for capital share redemptions. The SCA provides for a commitment of $900 million for the period October 6, 2016 through October 5, 2017. The Funds pay an annualized commitment fee of .15% of the unused portion of the SCA. The Fund’s portion of the commitment fee for the unused amount, allocated based upon a method approved by the Board, is accrued daily and paid quarterly. The interest on borrowings under the SCA is paid monthly and at a per annum interest rate based upon a contractual spread plus the higher of (1) the effective federal funds rate, (2) the 1-month LIBOR rate or (3) zero percent.
Other affiliated registered investment companies that are parties to the SCA include portfolios that are subject to a predetermined mathematical formula used to manage certain benefit guarantees offered under variable annuity contracts. The formula may result in large scale asset flows into and out of the portfolios. Consequently, the portfolios may be more likely to utilize the SCA for purposes of funding redemptions. It may be possible for those portfolios to fully exhaust the committed amount of the SCA, thereby requiring the Manager to allocate available funding per a Board-approved methodology designed to treat the Funds in the SCA equitably.
The Fund utilized the SCA during the year ended July 31, 2017. The average daily balance for the 3 days that the Fund had loans outstanding during the period was $4,252,000, borrowed at a weighted average interest rate of 2.03%. The maximum loan balance outstanding during the period was $4,252,000. At July 31, 2017, the Fund did not have an outstanding loan balance.
8. Recent Accounting Pronouncements and Reporting Updates
On October 13, 2016, the Securities and Exchange Commission (the “SEC”) adopted new rules and forms and amended existing rules and forms which are intended to modernize and enhance the reporting and disclosure of information by registered investment companies and to improve the quality of information that funds provide to investors, including modifications to Regulation S-X which would require standardized, enhanced disclosure about derivatives in investment company financial statements. The compliance dates of the modifications to Regulation S-X are August 1, 2017 and other amendments and rules are generally June 1, 2018 and December 1, 2018. Management is currently evaluating the impacts to the financial statement disclosures.
9. Other
At the Trust’s Board meeting in March, 2017, the Board of Trustees approved a change in the methodology of allocating certain expenses, like Transfer Agent fees (including sub-transfer agent and networking fees) and Blue Sky fees. PGIM Investments implemented the changes effective August 1, 2017.
| | | | |
| Prudential Jennison Diversified Growth Fund | | | 35 | |
Financial Highlights
| | | | | | | | | | | | | | | | | | | | |
| Class A Shares | |
| | | Year Ended July 31, | |
| | | 2017 | | | 2016 | | | 2015 | | | 2014 | | | 2013 | |
| Per Share Operating Performance(a): | | | | | | | | | | | | | | | | | | | | |
| Net Asset Value, Beginning of Year | | | $11.03 | | | | $12.01 | | | | $11.81 | | | | $10.46 | | | | $8.38 | |
| Income (loss) from investment operations: | | | | | | | | | | | | | | | | | | | | |
| Net investment income (loss) | | | .04 | | | | .06 | | | | .06 | | | | .04 | | | | .05 | |
| Net realized and unrealized gain (loss) on investments | | | 2.09 | | | | (.19 | ) | | | 1.28 | | | | 1.78 | | | | 2.07 | |
| Total from investment operations | | | 2.13 | | | | (.13 | ) | | | 1.34 | | | | 1.82 | | | | 2.12 | |
| Less Dividends and Distributions: | | | | | | | | | | | | | | | | | | | | |
| Dividends from net investment income | | | (.06 | ) | | | (.03 | ) | | | (.04 | ) | | | (.02 | ) | | | (.04 | ) |
| Distributions from net realized gains | | | (.31 | ) | | | (.82 | ) | | | (1.10 | ) | | | (.45 | ) | | | - | |
| Total dividends and distributions | | | (.37 | ) | | | (.85 | ) | | | (1.14 | ) | | | (.47 | ) | | | (.04 | ) |
| Net asset value, end of year | | | $12.79 | | | | $11.03 | | | | $12.01 | | | | $11.81 | | | | $10.46 | |
| Total Return(b): | | | 19.78% | | | | (.82)% | | | | 11.84% | | | | 17.78% | | | | 25.45% | |
| |
| Ratios/Supplemental Data: | |
| Net assets, end of year (000) | | | $179,539 | | | | $166,997 | | | | $186,770 | | | | $175,928 | | | | $158,694 | |
| Average net assets (000) | | | $169,500 | | | | $167,524 | | | | $181,444 | | | | $169,539 | | | | $143,264 | |
| Ratios to average net assets(c): | | | | | | | | | | | | | | | | | | | | |
| Expenses after waiver and/or expense reimbursement | | | 1.24% | | | | 1.28% | | | | 1.24% | | | | 1.26% | | | | 1.35% | |
| Expenses before waiver and/or expense reimbursement | | | 1.29% | | | | 1.33% | | | | 1.29% | | | | 1.31% | | | | 1.40% | |
| Net investment income (loss) | | | .38% | | | | .52% | | | | .47% | | | | .36% | | | | .54% | |
| Portfolio turnover rate | | | 181% | | | | 246% | | | | 295% | | | | 234% | | | | 148% | |
| (a) | Calculated based on average shares outstanding during the year. |
| (b) | Total return does not consider the effects of sales loads. Total return is calculated assuming a purchase of a share on the first day and a sale on the last day of each year reported and includes reinvestment of dividends and distributions, if any. Total returns may reflect adjustments to conform to generally accepted accounting principles. |
| (c) | Does not include expenses of the underlying portfolio in which the Fund invests. |
See Notes to Financial Statements.
| | | | | | | | | | | | | | | | | | | | |
| Class B Shares | |
| | | Year Ended July 31, | |
| | | 2017 | | | 2016 | | | 2015 | | | 2014 | | | 2013 | |
| Per Share Operating Performance(a): | | | | | | | | | | | | | | | | | | | | |
| Net Asset Value, Beginning of Year | | | $9.49 | | | | $10.49 | | | | $10.49 | | | | $9.38 | | | | $7.53 | |
| Income (loss) from investment operations: | | | | | | | | | | | | | | | | | | | | |
| Net investment income (loss) | | | (.03 | ) | | | (.02 | ) | | | (.03 | ) | | | (.04 | ) | | | (.02 | ) |
| Net realized and unrealized gain (loss) on investments | | | 1.78 | | | | (.16 | ) | | | 1.13 | | | | 1.60 | | | | 1.87 | |
| Total from investment operations | | | 1.75 | | | | (.18 | ) | | | 1.10 | | | | 1.56 | | | | 1.85 | |
| Less Dividends and Distributions: | | | | | | | | | | | | | | | | | | | | |
| Distributions from net realized gains | | | (.31 | ) | | | (.82 | ) | | | (1.10 | ) | | | (.45 | ) | | | - | |
| Net asset value, end of year | | | $10.93 | | | | $9.49 | | | | $10.49 | | | | $10.49 | | | | $9.38 | |
| Total Return(b): | | | 18.90% | | | | (1.51)% | | | | 11.01% | | | | 16.96% | | | | 24.57% | |
| |
| Ratios/Supplemental Data: | |
| Net assets, end of year (000) | | | $2,169 | | | | $2,898 | | | | $4,200 | | | | $5,138 | | | | $5,244 | |
| Average net assets (000) | | | $2,508 | | | | $3,375 | | | | $4,801 | | | | $5,457 | | | | $5,169 | |
| Ratios to average net assets(c): | | | | | | | | | | | | | | | | | | | | |
| Expenses after waivers and/or expense reimbursement | | | 1.99% | | | | 2.03% | | | | 1.99% | | | | 2.01% | | | | 2.11% | |
| Expenses before waivers and/or expense reimbursement | | | 1.99% | | | | 2.03% | | | | 1.99% | | | | 2.01% | | | | 2.11% | |
| Net investment income (loss) | | | (.33)% | | | | (.21)% | | | | (.25)% | | | | (.38)% | | | | (.19)% | |
| Portfolio turnover rate | | | 181% | | | | 246% | | | | 295% | | | | 234% | | | | 148% | |
| (a) | Calculated based on average shares outstanding during the year. |
| (b) | Total return does not consider the effects of sales loads. Total return is calculated assuming a purchase of a share on the first day and a sale on the last day of each year reported and includes reinvestment of dividends and distributions, if any. Total returns may reflect adjustments to conform to generally accepted accounting principles. |
| (c) | Does not include expenses of the underlying portfolio in which the Fund invests. |
See Notes to Financial Statements.
| | | | |
| Prudential Jennison Diversified Growth Fund | | | 37 | |
Financial Highlights (continued)
| | | | | | | | | | | | | | | | | | | | |
| Class C Shares | |
| | | Year Ended July 31, | |
| | | 2017 | | | 2016 | | | 2015 | | | 2014 | | | 2013 | |
| Per Share Operating Performance(a): | | | | | | | | | | | | | | | | | | | | |
| Net Asset Value, Beginning of Year | | | $9.49 | | | | $10.49 | | | | $10.49 | | | | $9.38 | | | | $7.53 | |
| Income (loss) from investment operations: | | | | | | | | | | | | | | | | | | | | |
| Net investment income (loss) | | | (.04 | ) | | | (.02 | ) | | | (.03 | ) | | | (.04 | ) | | | (.02 | ) |
| Net realized and unrealized gain (loss) on investments | | | 1.79 | | | | (.16 | ) | | | 1.13 | | | | 1.60 | | | | 1.87 | |
| Total from investment operations | | | 1.75 | | | | (.18 | ) | | | 1.10 | | | | 1.56 | | | | 1.85 | |
| Less Dividends and Distributions: | | | | | | | | | | | | | | | | | | | | |
| Distributions from net realized gains | | | (.31 | ) | | | (.82 | ) | | | (1.10 | ) | | | (.45 | ) | | | - | |
| Net asset value, end of year | | | $10.93 | | | | $9.49 | | | | $10.49 | | | | $10.49 | | | | $9.38 | |
| Total Return(b): | | | 18.90% | | | | (1.51)% | | | | 11.01% | | | | 16.96% | | | | 24.57% | |
| |
| Ratios/Supplemental Data: | | | | | | | | | | | | | | | |
| Net assets, end of year (000) | | | $49,609 | | | | $48,858 | | | | $55,384 | | | | $55,860 | | | | $52,005 | |
| Average net assets (000) | | | $48,525 | | | | $49,288 | | | | $56,581 | | | | $55,220 | | | | $48,375 | |
| Ratios to average net assets(c): | | | | | | | | | | | | | | | | | | | | |
| Expenses after waivers and/or expense reimbursement | | | 1.99% | | | | 2.03% | | | | 1.99% | | | | 2.01% | | | | 2.10% | |
| Expenses before waivers and/or expense reimbursement | | | 1.99% | | | | 2.03% | | | | 1.99% | | | | 2.01% | | | | 2.10% | |
| Net investment income (loss) | | | (.36)% | | | | (.23)% | | | | (.27)% | | | | (.39)% | | | | (.21)% | |
| Portfolio turnover rate | | | 181% | | | | 246% | | | | 295% | | | | 234% | | | | 148% | |
| (a) | Calculated based on average shares outstanding during the year. |
| (b) | Total return does not consider the effects of sales loads. Total return is calculated assuming a purchase of a share on the first day and a sale on the last day of each year reported and includes reinvestment of dividends and distributions, if any. Total returns may reflect adjustments to conform to generally accepted accounting principles. |
| (c) | Does not include expenses of the underlying portfolio in which the Fund invests. |
See Notes to Financial Statements.
Report of Independent Registered Public Accounting Firm
The Board of Trustees and Shareholders
Prudential Investment Portfolios 5:
We have audited the accompanying statement of assets and liabilities of Prudential Jennison Diversified Growth Fund (the “Fund,” formerly Prudential Jennison Conservative Growth Fund), a series of Prudential Investment Portfolios 5, including the schedule of investments, as of July 31, 2017, and the related statement of operations for the year then ended, the statements of changes in net assets for each of the years in the two-year period then ended, and the financial highlights for each of the years in the five-year period then ended. These financial statements and financial highlights are the responsibility of the Fund’s management. Our responsibility is to express an opinion on these financial statements and financial highlights based on our audits.
We conducted our audits in accordance with the standards of the Public Company Accounting Oversight Board (United States). Those standards require that we plan and perform the audit to obtain reasonable assurance about whether the financial statements and financial highlights are free of material misstatement. An audit includes examining, on a test basis, evidence supporting the amounts and disclosures in the financial statements. Our procedures included confirmation of securities owned as of July 31, 2017, by correspondence with the custodian, transfer agent and brokers or by other appropriate auditing procedures when replies from brokers were not received. An audit also includes assessing the accounting principles used and significant estimates made by management, as well as evaluating the overall financial statement presentation. We believe that our audits provide a reasonable basis for our opinion.
In our opinion, the financial statements and financial highlights referred to above present fairly, in all material respects, the financial position of the Fund as of July 31, 2017, and the results of its operations for the year then ended, the changes in its net assets for each of the years in the two-year period then ended, and the financial highlights for each of the years in the five-year period then ended, in conformity with U.S. generally accepted accounting principles.

New York, New York
September 18, 2017
| | | | |
| Prudential Jennison Diversified Growth Fund | | | 39 | |
Tax Information
We are advising you that during the fiscal year ended July 31, 2017, the Fund reported the maximum amount allowed per share but not less than $.25 per share for Class A, B and C shares as a capital gain distribution in accordance with Section 852(b)(3)(C) of the Internal Revenue Code.
For the year ended July 31, 2017, the Fund reports, in accordance with Section 854 of the Internal Revenue Code, the following percentages of the ordinary income dividends paid as 1) qualified dividend income (QDI); and 2) eligible for corporate dividends received deduction (DRD):
| | | | | | | | |
| | | QDI | | | DRD | |
Prudential Jennison Diversified Growth Fund | | | 47.59 | % | | | 46.44 | % |
In January 2018, you will be advised on IRS Form 1099-DIV or substitute 1099-DIV, as to the federal tax status of dividends and distributions received by you in calendar year 2017.
INFORMATION ABOUT BOARD MEMBERS AND OFFICERS
(Unaudited)
Information about Board Members and Officers of the Fund is set forth below. Board Members who are not deemed to be “interested persons” of the Fund, as defined in the 1940 Act, are referred to as “Independent Board Members.” Board Members who are deemed to be “interested persons” of the Fund are referred to as “Interested Board Members.” The Board Members are responsible for the overall supervision of the operations of the Fund and perform the various duties imposed on the directors of investment companies by the 1940 Act. The Board in turn elects the Officers, who are responsible for administering the day-to-day operations of the Fund.
| | | | |
| Independent Board Members(1) | | |
Name, Address, Age Position(s) Portfolios Overseen | | Principal Occupation(s) During Past Five Years | | Other Directorships Held During Past Five Years |
Ellen S. Alberding (59) Board Member Portfolios Overseen: 87 | | President and Board Member, The Joyce Foundation (charitable foundation) (since 2002); Vice Chair, City Colleges of Chicago (community college system) (since 2011); Trustee, Skills for America’s Future (national initiative to connect employers to community colleges) (since 2011); Trustee, National Park Foundation (charitable foundation for national park system) (since 2009); Trustee, Economic Club of Chicago (since 2009). | | None. |
Kevin J. Bannon (65) Board Member Portfolios Overseen: 87 | | Retired; Managing Director (April 2008-May 2015) and Chief Investment Officer (October 2008-November 2013) of Highmount Capital LLC (registered investment adviser); formerly Executive Vice President and Chief Investment Officer (April 1993-August 2007) of Bank of New York Company; President (May 2003-May 2007) of BNY Hamilton Family of Mutual Funds. | | Director of Urstadt Biddle Properties (equity real estate investment trust) (since September 2008). |
Linda W. Bynoe (65) Board Member Portfolios Overseen: 87 | | President and Chief Executive Officer (since March 1995) and formerly Chief Operating Officer (December 1989-February 1995) of Telemat Ltd. (management consulting); formerly Vice President (January 1985-June 1989) at Morgan Stanley & Co. (broker-dealer). | | Director of Simon Property Group, Inc. (retail real estate) (May 2003-May 2012); Director of Anixter International, Inc. (communication products distributor) (since January 2006); Director of Northern Trust Corporation (financial services) (since April 2006); Trustee of Equity Residential (residential real estate) (since December 2009). |
Prudential Jennison Diversified Growth Fund
| | | | |
| Independent Board Members(1) |
Name, Address, Age Position(s) Portfolios Overseen | | Principal Occupation(s) During Past Five Years | | Other Directorships Held During Past Five Years |
Barry H. Evans (56)± Board Member Portfolios Overseen: 87 | | Retired; Formerly President (2005–2016), Global Chief Operating Officer (2014–2016), Chief Investment Officer – Global Head of Fixed Income (1998-2014), and various portfolio manager roles (1986-2006), Manulife Asset Management U.S. | | Director, Manulife Trust Company (2011-present); Director, Manulife Asset Management Limited (2015-present); Formerly Chairman of the Board of Directors of Manulife Asset Management U.S. (2005-2016); Formerly Chairman of the Board, Declaration Investment Management and Research (2008-2016) |
Keith F. Hartstein (60) Board Member & Independent Chair Portfolios Overseen: 87 | | Retired; Member (since November 2014) of the Governing Council of the Independent Directors Council (organization of independent mutual fund directors); formerly President and Chief Executive Officer (2005-2012), Senior Vice President (2004-2005), Senior Vice President of Sales and Marketing (1997-2004), and various executive management positions (1990-1997), John Hancock Funds, LLC (asset management); Chairman, Investment Company Institute’s Sales Force Marketing Committee (2003-2008). | | None. |
Laurie Simon Hodrick (55)± Board Member Portfolios Overseen: 87 | | A. Barton Hepburn Professor of Economics in the Faculty of Business, Columbia Business School (since 1996); Visiting Professor of Law and Rock Center for Corporate Governance Fellow, Stanford Law School (since 2015); Visiting Fellow, Hoover Institution, Stanford University (since 2015); Sole Member, ReidCourt LLC (since 2008) (a consulting firm); Formerly Managing Director, Global Head of Alternative Investment Strategies, Deutsche Bank (2006-2008); Formerly Director/Trustee, Merrill Lynch Investment Managers Funds (1999-2006) | | Independent Director, Corporate Capital Trust (since April 2017) (a business development company) |
Michael S. Hyland, CFA (71) Board Member Portfolios Overseen: 87 | | Retired (since February 2005); formerly Senior Managing Director (July 2001-February 2005) of Bear Stearns & Co, Inc.; Global Partner, INVESCO (1999-2001); Managing Director and President of Salomon Brothers Asset Management (1989-1999). | | None. |
Visit our website at pgiminvestments.com
| | | | |
| Independent Board Members(1) |
Name, Address, Age Position(s) Portfolios Overseen | | Principal Occupation(s) During Past Five Years | | Other Directorships Held During Past Five Years |
Richard A. Redeker (74) Board Member & Independent Vice Chair Portfolios Overseen: 87 | | Retired Mutual Fund Senior Executive (47 years); Management Consultant; Director, Mutual Fund Directors Forum (since 2014); Independent Directors Council (organization of independent mutual fund directors)-Executive Committee, Chair of Policy Steering Committee, Governing Council. | | None. |
Stephen G. Stoneburn (74) Board Member Portfolios Overseen: 87 | | Chairman (since July 2011), President and Chief Executive Officer (since June 1996) of Frontline Medical Communications (publishing company); formerly President (June 1995-June 1996) of Argus Integrated Media, Inc.; Senior Vice President and Managing Director (January 1993-1995) of Cowles Business Media; Senior Vice President of Fairchild Publications, Inc. (1975-1989). | | None. |
| ± | Mr. Evans and Ms. Hodrick joined the Board effective as of September 1, 2017. |
| | | | |
| Interested Board Members(1) |
Name, Address, Age Position(s) Portfolios Overseen | | Principal Occupation(s) During Past Five Years | | Other Directorships Held During Past Five Years |
Stuart S. Parker (54) Board Member & President Portfolios Overseen: 87 | | President of PGIM Investments LLC (formerly known as Prudential Investments LLC) (since January 2012); Executive Vice President of Prudential Investment Management Services LLC (since December 2012); Executive Vice President of Jennison Associates LLC and Head of Retail Distribution of PGIM Investments LLC (June 2005-December 2011). | | None. |
Prudential Jennison Diversified Growth Fund
| | | | |
| Interested Board Members(1) |
Name, Address, Age Position(s) Portfolios Overseen | | Principal Occupation(s) During Past Five Years | | Other Directorships Held During Past Five Years |
Scott E. Benjamin (44) Board Member & Vice President Portfolios Overseen: 87 | | Executive Vice President (since June 2009) of PGIM Investments LLC; Executive Vice President (June 2009-June 2012) and Vice President (since June 2012) of Prudential Investment Management Services LLC; Executive Vice President (since September 2009) of AST Investment Services, Inc.; Senior Vice President of Product Development and Marketing, PGIM Investments (since February 2006); Vice President of Product Development and Product Management, Prudential Investments (2003-2006). | | None. |
Grace C. Torres* (58) Board Member Portfolios Overseen: 86 | | Retired; formerly Treasurer and Principal Financial and Accounting Officer of the Prudential Funds, Target Funds, Advanced Series Trust, Prudential Variable Contract Accounts and The Prudential Series Fund (1998-June 2014); Assistant Treasurer (March 1999-June 2014) and Senior Vice President (September 1999-June 2014) of PGIM Investments LLC; Assistant Treasurer (May 2003-June 2014) and Vice President (June 2005-June 2014) of AST Investment Services, Inc.; Senior Vice President and Assistant Treasurer (May 2003-June 2014) of Prudential Annuities Advisory Services, Inc. | | Director (since July 2015) of Sun Bancorp, Inc. N.A. and Sun National Bank |
| * | Note: Prior to her retirement in 2014, Ms. Torres was employed by PGIM Investments LLC. Due to her prior employment, she is considered to be an “interested person” under the 1940 Act. Ms. Torres is a Non-Management Interested Board Member. |
| (1) | The year that each Board Member joined the Board is as follows: |
Ellen S. Alberding, 2013; Kevin J. Bannon, 2008; Linda W. Bynoe, 2005; Barry H. Evans, 2017; Keith F. Hartstein, 2013; Laurie Simon Hodrick, 2017; Michael S. Hyland, 2008; Richard A. Redeker, 2003; Stephen G. Stoneburn, 1999; Grace C. Torres, 2014; Stuart S. Parker, Board Member and President since 2012; Scott E. Benjamin, Board Member since 2010 and Vice President since 2009.
Visit our website at pgiminvestments.com
| | | | |
| Fund Officers(a) |
Name, Address and Age Position with Fund | | Principal Occupation(s) During Past Five Years | | Length of Service as Fund Officer |
Raymond A. O’Hara (62) Chief Legal Officer | | Vice President and Corporate Counsel (since July 2010) of Prudential Insurance Company of America (Prudential); Vice President (March 2011-Present) of Pruco Life Insurance Company and Pruco Life Insurance Company of New Jersey; Vice President and Corporate Counsel (March 2011-Present) of Prudential Annuities Life Assurance Corporation; Chief Legal Officer of PGIM Investments LLC (since June 2012); Chief Legal Officer of Prudential Mutual Fund Services LLC (since June 2012) and Corporate Counsel of AST Investment Services, Inc. (since June 2012); formerly Assistant Vice President and Corporate Counsel (September 2008-July 2010) of The Hartford Financial Services Group, Inc.; formerly Associate (September 1980-December 1987) and Partner (January 1988–August 2008) of Blazzard & Hasenauer, P.C. (formerly, Blazzard, Grodd & Hasenauer, P.C.). | | Since 2012 |
Chad A. Earnst (42) Chief Compliance Officer | | Chief Compliance Officer (September 2014-Present) of PGIM Investments LLC; Chief Compliance Officer (September 2014-Present) of the Prudential Funds, Target Funds, Advanced Series Trust, The Prudential Series Fund, Prudential’s Gibraltar Fund, Inc., Prudential Global Short Duration High Yield Income Fund, Inc., Prudential Short Duration High Yield Fund, Inc. and Prudential Jennison MLP Income Fund, Inc.; formerly Assistant Director (March 2010-August 2014) of the Asset Management Unit, Division of Enforcement, US Securities & Exchange Commission; Assistant Regional Director (January 2010-August 2014), Branch Chief (June 2006–December 2009) and Senior Counsel (April 2003-May 2006) of the Miami Regional Office, Division of Enforcement, US Securities & Exchange Commission. | | Since 2014 |
Deborah A. Docs (59) Secretary | | Vice President and Corporate Counsel (since January 2001) of Prudential; Vice President (since December 1996) and Assistant Secretary (since March 1999) of PGIM Investments LLC; formerly Vice President and Assistant Secretary (May 2003-June 2005) of AST Investment Services, Inc. | | Since 2004 |
Jonathan D. Shain (59) Assistant Secretary | | Vice President and Corporate Counsel (since August 1998) of Prudential; Vice President and Assistant Secretary (since May 2001) of PGIM Investments LLC; Vice President and Assistant Secretary (since February 2001) of Prudential Mutual Fund Services LLC; formerly Vice President and Assistant Secretary (May 2003-June 2005) of AST Investment Services, Inc. | | Since 2005 |
Claudia DiGiacomo (42) Assistant Secretary | | Vice President and Corporate Counsel (since January 2005) of Prudential; Vice President and Assistant Secretary of PGIM Investments LLC (since December 2005); Associate at Sidley Austin Brown & Wood LLP (1999-2004). | | Since 2005 |
Prudential Jennison Diversified Growth Fund
| | | | |
| Fund Officers(a) |
Name, Address and Age Position with Fund | | Principal Occupation(s) During Past Five Years | | Length of Service as Fund Officer |
Andrew R. French (54) Assistant Secretary | | Vice President and Corporate Counsel (since February 2010) of Prudential; formerly Director and Corporate Counsel (2006-2010) of Prudential; Vice President and Assistant Secretary (since January 2007) of PGIM Investments LLC; Vice President and Assistant Secretary (since January 2007) of Prudential Mutual Fund Services LLC. | | Since 2006 |
Charles H. Smith (44) Anti-Money Laundering Compliance Officer | | Vice President, Corporate Compliance, Anti-Money Laundering Unit (since January 2015) of Prudential; committee member of the American Council of Life Insurers Anti-Money Laundering and Critical Infrastructure Committee (since January 2016); formerly Global Head of Economic Sanctions Compliance at AIG Property Casualty (February 2007–December 2014); Assistant Attorney General at the New York State Attorney General’s Office, Division of Public Advocacy. (August 1998—January 2007). | | Since 2016 |
M. Sadiq Peshimam (53) Treasurer and Principal Financial and Accounting Officer | | Vice President (since 2005) of PGIM Investments LLC; formerly Assistant Treasurer of funds in the Prudential Mutual Fund Complex (2006-2014). | | Since 2006 |
Peter Parrella (59) Assistant Treasurer | | Vice President (since 2007) and Director (2004-2007) within Prudential Mutual Fund Administration; formerly Tax Manager at SSB Citi Fund Management LLC (1997-2004). | | Since 2007 |
Lana Lomuti (50) Assistant Treasurer | | Vice President (since 2007) and Director (2005-2007), within Prudential Mutual Fund Administration; formerly Assistant Treasurer (December 2007-February 2014) of The Greater China Fund, Inc. | | Since 2014 |
Linda McMullin (56) Assistant Treasurer | | Vice President (since 2011) and Director (2008-2011) within Prudential Mutual Fund Administration. | | Since 2014 |
Kelly A. Coyne (49) Assistant Treasurer | | Director, Investment Operations of Prudential Mutual Fund Services LLC (since 2010). | | Since 2015 |
| (a) | Excludes Mr. Parker and Mr. Benjamin, interested Board Members who also serve as President and Vice President, respectively. |
Explanatory Notes to Tables:
| • | | Board Members are deemed to be “Interested,” as defined in the 1940 Act, by reason of their affiliation with PGIM Investments LLC and/or an affiliate of PGIM Investments LLC. |
| • | | Unless otherwise noted, the address of all Board Members and Officers is c/o PGIM Investments LLC, 655 Broad Street, Newark, New Jersey 07102-4410. |
| • | | There is no set term of office for Board Members or Officers. The Board Members have adopted a retirement policy, which calls for the retirement of Board Members on December 31 of the year in which they reach the age of 75. |
| • | | “Other Directorships Held” includes only directorships of companies required to register or file reports with the SEC under the 1934 Act (that is, “public companies”) or other investment companies registered under the 1940 Act. |
| • | | “Portfolios Overseen” includes all investment companies managed by PGIM Investments LLC. The investment companies for which PGIM Investments LLC serves as manager include the Prudential Mutual Funds, The Prudential Variable Contract Accounts, Target Mutual Funds, Prudential Short Duration High Yield Fund, Inc., Prudential Global Short Duration High Yield Fund, Inc., The Prudential Series Fund, Prudential’s Gibraltar Fund, Inc. and the Advanced Series Trust. |
Visit our website at pgiminvestments.com
Approval of Advisory Agreements
The Fund’s Board of Trustees
The Board of Trustees (the “Board”) of Prudential Jennison Diversified Growth Fund (the “Fund”)1 consists of twelve individuals, nine of whom are not “interested persons” of the Fund, as defined in the Investment Company Act of 1940, as amended (the “1940 Act”) (the “Independent Trustees”). The Board is responsible for the oversight of the Fund and its operations, and performs the various duties imposed on the directors of investment companies by the 1940 Act. The Independent Trustees have retained independent legal counsel to assist them in connection with their duties. The Chair of the Board is an Independent Trustee. The Board has established four standing committees: the Audit Committee, the Nominating and Governance Committee, and two Investment Committees. Each committee is chaired by, and composed of, Independent Trustees.
Annual Approval of the Fund’s Advisory Agreements
As required under the 1940 Act, the Board determines annually whether to renew the Fund’s management agreement with PGIM Investments LLC (“PGIM Investments”) and the Fund’s subadvisory agreement with Jennison Associates LLC (“Jennison”). In considering the renewal of the agreements, the Board, including all of the Independent Trustees,2 met on June 6-8, 2017 and approved the renewal of the agreements through July 31, 2018, after concluding that the renewal of the agreements was in the best interests of the Fund and its shareholders.
In advance of the meetings, the Board requested and received materials relating to the agreements, and had the opportunity to ask questions and request further information in connection with its consideration. Among other things, the Board considered comparative fee information from PGIM Investments and Jennison. Also, the Board considered comparisons with other mutual funds in relevant Peer Universes and Peer Groups, as is further discussed below.
In approving the agreements, the Board, including the Independent Trustees advised by independent legal counsel, considered the factors it deemed relevant, including the nature, quality and extent of services provided by PGIM Investments and the subadviser, the performance of the Fund, the profitability of PGIM Investments and its affiliates, expenses and fees, and the potential for economies of scale that may be shared with the Fund and its shareholders as the Fund’s assets grow. In their deliberations, the Trustees did not identify any single factor which alone was responsible for the Board’s decision to approve the agreements with respect to the Fund. In connection with its deliberations, the Board considered information provided by PGIM Investments throughout the year at regular Board
| 1 | Prudential Jennison Conservative Growth Fund is a series of Prudential Investment Portfolios 5. |
| 2 | Barry H. Evans and Laurie Simon Hodrick joined the Board effective as of September 1, 2017. Neither Mr. Evans nor Ms. Hodrick participated in the consideration of the approval of the Fund’s advisory agreements. |
| | |
| Prudential Jennison Diversified Growth Fund |
Approval of Advisory Agreements (continued)
meetings, presentations from portfolio managers and other information, as well as information furnished at or in advance of the meetings on June 6-8, 2017.
The Trustees determined that the overall arrangements between the Fund and PGIM Investments, which serves as the Fund’s investment manager pursuant to a management agreement, and between PGIM Investments and Jennison, which serves as the Fund’s subadviser pursuant to the terms of a subadvisory agreement with PGIM Investments, are in the best interests of the Fund and its shareholders in light of the services performed, fees charged and such other matters as the Trustees considered relevant in the exercise of their business judgment.
The material factors and conclusions that formed the basis for the Trustees’ determinations to approve the renewal of the agreements are discussed separately below.
Nature, Quality and Extent of Services
The Board received and considered information regarding the nature, quality and extent of services provided to the Fund by PGIM Investments and Jennison. The Board considered the services provided by PGIM Investments, including but not limited to the oversight of the subadviser for the Fund, as well as the provision of fund recordkeeping, compliance, and other services to the Fund. With respect to PGIM Investments’ oversight of the subadviser, the Board noted that PGIM Investments’ Strategic Investment Research Group (“SIRG”), a business unit of PGIM Investments, is responsible for monitoring and reporting to PGIM Investments’ senior management on the performance and operations of the subadviser. The Board also considered that PGIM Investments pays the salaries of all of the officers and interested Trustees of the Fund who are part of Fund management. The Board also considered the investment subadvisory services provided by Jennison, as well as compliance with the Fund’s investment restrictions, policies and procedures. The Board considered PGIM Investments’ evaluation of Jennison as well as PGIM Investments’ recommendation, based on its review of Jennison, to renew the subadvisory agreement.
The Board considered the qualifications, backgrounds and responsibilities of PGIM Investments’ senior management responsible for the oversight of the Fund and Jennison, and also considered the qualifications, backgrounds and responsibilities of Jennison’s portfolio managers who are responsible for the day-to-day management of the Fund’s portfolio. The Board was provided with information pertaining to PGIM Investments’ and Jennison’s organizational structure, senior management, investment operations, and other relevant information pertaining to both PGIM Investments and Jennison. The Board also noted that it received favorable compliance reports from the Fund’s Chief Compliance Officer (“CCO”) as to both PGIM Investments and Jennison. The Board noted that Jennison is affiliated with PGIM Investments.
| | |
| Visit our website at pgiminvestments.com | | |
The Board concluded that it was satisfied with the nature, extent and quality of the investment management services provided by PGIM Investments and the subadvisory services provided to the Fund by Jennison, and that there was a reasonable basis on which to conclude that the Fund benefits from the services provided by PGIM Investments and Jennison under the management and subadvisory agreements.
Costs of Services and Profits Realized by PGIM Investments
The Board was provided with information on the profitability of PGIM Investments and its affiliates in serving as the Fund’s investment manager. The Board discussed with PGIM Investments the methodology utilized in assembling the information regarding profitability and considered its reasonableness. The Board recognized that it is difficult to make comparisons of profitability from fund management contracts because comparative information is not generally publicly available and is affected by numerous factors, including the structure of the particular adviser, the types of funds it manages, its business mix, numerous assumptions regarding allocations and the adviser’s capital structure and cost of capital. However, the Board considered that the cost of services provided by PGIM Investments for the year ended December 31, 2016 exceeded the management fees received by PGIM Investments, resulting in an operating loss to PGIM Investments. The Board further noted that the subadviser is affiliated with PGIM Investments and that its profitability is reflected in PGIM Investments’ profitability report. Taking these factors into account, the Board concluded that the profitability of PGIM Investments and its affiliates in relation to the services rendered was not unreasonable.
Economies of Scale
The Board received and discussed information concerning economies of scale that PGIM Investments may realize as the Fund’s assets grow beyond current levels. The Board noted that the management fee schedule for the Fund includes breakpoints, which have the effect of decreasing the fee rate as assets increase, but that at its current level of assets the Fund does not realize the effect of those rate reductions. The Board took note that the Fund’s fee structure currently results in benefits to Fund shareholders whether or not PGIM Investments realizes any economies of scale. The Board noted that economies of scale can be shared with the Fund in other ways, including low management fees from inception, additional technological and personnel investments to enhance shareholder services, and maintaining existing expense structures in the face of a rising cost environment. The Board also considered PGIM Investments’ assertion that it continually evaluates the management fee schedule of the Fund and the potential to share economies of scale through breakpoints or fee waivers as asset levels increase.
| | |
| Prudential Jennison Diversified Growth Fund |
Approval of Advisory Agreements (continued)
The Board recognized the inherent limitations of any analysis of economies of scale, stemming largely from the Board’s understanding that most of PGIM Investments’ costs are not specific to individual funds, but rather are incurred across a variety of products and services.
Other Benefits to PGIM Investments and Jennison
The Board considered potential ancillary benefits that might be received by PGIM Investments and Jennison and their affiliates as a result of their relationship with the Fund. The Board concluded that potential benefits to be derived by PGIM Investments included transfer agency fees received by the Fund’s transfer agent (which is affiliated with PGIM Investments), as well as benefits to its reputation or other intangible benefits resulting from PGIM Investments’ association with the Fund. The Board concluded that the potential benefits to be derived by Jennison included its ability to use soft dollar credits, as well as the potential benefits consistent with those generally resulting from an increase in assets under management, specifically, potential access to additional research resources and benefits to its reputation. The Board concluded that the benefits derived by PGIM Investments and Jennison were consistent with the types of benefits generally derived by investment managers and subadvisers to mutual funds.
Performance of the Fund / Fees and Expenses
The Board considered certain additional specific factors and made related conclusions relating to the historical performance of the Fund for the one-, three-, five- and ten-year periods ended December 31, 2016.
The Board also considered the Fund’s actual management fee, as well as the Fund’s net total expense ratio, for the fiscal year ended July 31, 2016. The Board considered the management fee for the Fund as compared to the management fee charged by PGIM Investments to other funds and the fee charged by other advisers to comparable mutual funds in a Peer Group. The actual management fee represents the fee rate actually paid by Fund shareholders and includes any fee waivers or reimbursements. The net total expense ratio for the Fund represents the actual expense ratio incurred by Fund shareholders.
The mutual funds included in the Peer Universe (the Lipper Large-Cap Growth Funds Performance Universe)3, which was used to consider performance, and the Peer Group, which was used to consider fees and expenses, were objectively determined by Broadridge, an independent provider of mutual fund data. To the extent that PGIM Investments deemed appropriate, and for reasons addressed in detail with the Board, PGIM
| 3 | The Fund was compared to the Lipper Large-Cap Growth Funds Performance Universe, although the Fund is classified in the Lipper Large-Cap Core Funds Performance Universe. The Lipper Large-Cap Growth Funds Performance Universe was utilized because PGIM Investments believes that the funds included in this Universe provide a more appropriate basis for Fund performance comparisons. |
| | |
| Visit our website at pgiminvestments.com | | |
Investments may have provided supplemental data compiled by Broadridge for the Board’s consideration. The comparisons placed the Fund in various quartiles, with the first quartile being the best 25% of the mutual funds (for performance, the best performing mutual funds and, for expenses, the lowest cost mutual funds).
The section below summarizes key factors considered by the Board and the Board’s conclusions regarding the Fund’s performance, fees and overall expenses. The table sets forth gross performance comparisons (which do not reflect the impact on performance of fund expenses, or any subsidies, expense caps or waivers that may be applicable) with the Peer Universe, actual management fees with the Peer Group (which reflect the impact of any subsidies or fee waivers), and net total expenses with the Peer Group, each of which were key factors considered by the Board.
| | | | | | | | |
| Performance | | 1 Year | | 3 Years | | 5 Years | | 10 Years |
| | | 1st Quartile | | 2nd Quartile | | 2nd Quartile | | 2nd Quartile |
| Actual Management Fees: 2nd Quartile |
| Net Total Expenses: 3rd Quartile |
| | • | | The Board noted that the Fund outperformed its benchmark index over the one-, five-, and ten-year periods. |
| | • | | The Board noted information provided by PGIM Investments indicating that the Fund’s net total expense ratio was within five basis points of the median of all funds in the Peer Group. |
| | • | | The Board concluded that, in light of the above, it would be in the best interests of the Fund and its shareholders to renew the agreements. |
| | • | | The Board concluded that the management fees (including subadvisory fees) and total expenses were reasonable in light of the services provided. |
* * *
After full consideration of these factors, the Board concluded that approval of the agreements was in the best interests of the Fund and its shareholders.
| | |
| Prudential Jennison Diversified Growth Fund |
| | | | |
| ∎ MAIL | | ∎ TELEPHONE | | ∎ WEBSITE |
655 Broad Street Newark, NJ 07102 | | (800) 225-1852 | | www.pgiminvestments.com |
|
| PROXY VOTING |
| The Board of Trustees of the Fund has delegated to the Fund’s investment subadviser the responsibility for voting any proxies and maintaining proxy recordkeeping with respect to the Fund. A description of these proxy voting policies and procedures is available without charge, upon request, by calling (800) 225-1852. Information regarding how the Fund voted proxies relating to portfolio securities during the most recent 12-month period ended June 30 is available on the Fund’s website and on the Securities and Exchange Commission’s website. |
|
| TRUSTEES |
| Ellen S. Alberding • Kevin J. Bannon • Scott E. Benjamin • Linda W. Bynoe • Barry H. Evans • Keith F. Hartstein • Laurie Simon Hodrick • Michael S. Hyland • Stuart S. Parker • Richard A. Redeker • Stephen G. Stoneburn • Grace C. Torres |
|
| OFFICERS |
| Stuart S. Parker, President • Scott E. Benjamin, Vice President • M. Sadiq Peshimam, Treasurer and Principal Financial and Accounting Officer • Raymond A. O’Hara, Chief Legal Officer • Chad A. Earnst, Chief Compliance Officer • Deborah A. Docs, Secretary • Charles H. Smith, Anti-Money Laundering Compliance Officer • Jonathan D. Shain, Assistant Secretary • Claudia DiGiacomo, Assistant Secretary • Andrew R. French, Assistant Secretary • Peter Parrella, Assistant Treasurer • Lana Lomuti, Assistant Treasurer • Linda McMullin, Assistant Treasurer • Kelly A. Coyne, Assistant Treasurer |
| | | | |
| MANAGER | | PGIM Investments LLC | | 655 Broad Street
Newark, NJ 07102 |
|
| INVESTMENT SUBADVISER | | Jennison Associates LLC | | 466 Lexington Avenue
New York, NY 10017 |
|
| DISTRIBUTOR | | Prudential Investment
Management Services LLC | | 655 Broad Street
Newark, NJ 07102 |
|
| CUSTODIAN | | The Bank of New York Mellon | | 225 Liberty Street New York, NY 10286 |
|
| TRANSFER AGENT | | Prudential Mutual Fund
Services LLC | | PO Box 9658 Providence, RI 02940 |
|
| INDEPENDENT REGISTERED PUBLIC ACCOUNTING FIRM | | KPMG LLP | | 345 Park Avenue
New York, NY 10154 |
|
| FUND COUNSEL | | Willkie Farr & Gallagher LLP | | 787 Seventh Avenue
New York, NY 10019 |
|
|
| An investor should consider the investment objectives, risks, charges, and expenses of the Fund carefully before investing. The prospectus and summary prospectus contain this and other information about the Fund. An investor may obtain a prospectus and summary prospectus by visiting our website at www.pgiminvestments.com or by calling (800) 225-1852. The prospectus and summary prospectus should be read carefully before investing. |
|
| E-DELIVERY |
| To receive your mutual fund documents on-line, go to www.pgiminvestments.com/edelivery and enroll. Instead of receiving printed documents by mail, you will receive notification via email when new materials are available. You can cancel your enrollment or change your email address at any time by visiting the website address above. |
|
| SHAREHOLDER COMMUNICATIONS WITH TRUSTEES |
| Shareholders can communicate directly with the Board of Trustees by writing to the Chair of the Board, Prudential Jennison Diversified Growth Fund, PGIM Investments, Attn: Board of Trustees, 655 Broad Street, Newark, NJ 07102. Shareholders can communicate directly with an individual Trustee by writing to the same address. Communications are not screened before being delivered to the addressee. |
|
| AVAILABILITY OF PORTFOLIO SCHEDULE |
| The Fund files its complete schedule of portfolio holdings with the Securities and Exchange Commission for the first and third quarters of each fiscal year on Form N-Q. The Fund’s Forms N-Q are available on the Commission’s website at www.sec.gov. The Fund’s Forms N-Q may also be reviewed and copied at the Commission’s Public Reference Room in Washington, D.C. Information on the operation and location of the Public Reference Room may be obtained by calling 1-800-SEC-0330. The Fund’s schedule of portfolio holdings is also available on the Fund’s website as of the end of each month no sooner than 15 days after the end of the month. |
|
| The Fund’s Statement of Additional Information contains additional information about the Fund’s Trustees and is available without charge, upon request, by calling (800) 225-1852. |
Mutual Funds:
| | | | |
| ARE NOT INSURED BY THE FDIC OR ANY FEDERAL GOVERNMENT AGENCY | | MAY LOSE VALUE | | ARE NOT A DEPOSIT OF OR GUARANTEED BY ANY BANK OR ANY BANK AFFILIATE |
PRUDENTIAL JENNISON DIVERSIFIED GROWTH FUND
| | | | | | |
| SHARE CLASS | | A | | B | | C |
| NASDAQ | | TBDAX | | TBDBX | | TBDCX |
| CUSIP | | 74440V104 | | 74440V203 | | 74440V302 |
MF503E

PRUDENTIAL JENNISON RISING DIVIDEND FUND
ANNUAL REPORT
JULY 31, 2017

To enroll in e-delivery, go to pgiminvestments.com/edelivery
|
| Objective: Capital appreciation and income |
Highlights
| • | | Overall stock selection in the financials sector, an overweight allocation to banks, and stock selection in the energy sector contributed the most to relative return, while holdings in the information technology services industry and the industrials sector were also among the primary contributors to performance during the period. |
| • | | Conversely, stock selection in the health care sector, and within the consumer discretionary sector all detracted the most from relative performance. Additionally, an overweight allocation to the integrated oil & gas segment also hurt relative performance during the period. |
This report is not authorized for distribution to prospective investors unless preceded or accompanied by a current prospectus.
The views expressed in this report and information about the Fund’s portfolio holdings are for the period covered by this report and are subject to change thereafter.
Mutual funds are distributed by Prudential Investment Management Services LLC, member SIPC. Jennison Associates LLC is a registered investment adviser. Both are Prudential Financial companies. © 2017 Prudential Financial, Inc. and its related entities. Jennison Associates, Jennison, the Prudential logo, and the Rock symbol are service marks of Prudential Financial, Inc. and its related entities, registered in many jurisdictions worldwide.
| | |
| 2 | | Visit our website at pgiminvestments.com |
Letter from the President

Dear Shareholder:
We hope you find the annual report for the Prudential Jennison Rising Dividend Fund informative and useful. The report covers performance for the 12-month period ended July 31, 2017.
Effective April 3, 2017, Prudential Investments became known as PGIM® Investments. Why PGIM? This new name was chosen to further align with the global investment management businesses of Prudential Financial, which rebranded from Prudential Investment Management in January 2016. This new name allows for one brand and reflects our ability and commitment to delivering investment solutions to clients around the globe. Please keep in mind that only the Fund adviser’s name was changed: the name of your Fund and its management and operation will not change.
Major global events during the reporting period included the US presidential election and domestic issues related to the new administration’s policy initiatives. The US economy experienced weak growth during the first quarter of 2017, although stronger growth took place in the second quarter. Britain began its formal legal process to leave the European Union, and recent parliamentary elections in Britain resulted in unseating the majority party. Overall, global economic growth picked up slightly.
Equities in the US reached new highs, and international equities gained significantly. European stocks posted impressive results. Asian markets were solid, and emerging markets outperformed most regions.
In mid-June, the Federal Reserve raised its Federal Funds rate by 0.25% for the second time in 2017. Fixed income markets were mixed, as rising interest rates affected bond markets. High yield and emerging markets bonds were among the top performers.
Given the uncertainty in today’s investment environment, we believe that active professional portfolio management offers a potential advantage. Active managers often have the knowledge and flexibility to find the best investment opportunities in the most challenging markets.
Even so, it’s best if investment decisions are based on your long-term goals rather than on short-term market and economic developments. We also encourage you to work with an experienced financial advisor who can help you set goals, determine your tolerance for risk, and build a diversified plan that’s right for you and make adjustments when necessary.
At PGIM Investments, we consider it a great privilege and responsibility to help investors participate in opportunities across global markets while meeting their toughest investment challenges. We’re part of PGIM, a top-10 global investment manager with more than $1 trillion in assets under management. This investment expertise allows us to deliver actively managed funds and strategies to meet the needs of investors around the globe.
Thank you for choosing our family of funds.
Sincerely,

Stuart S. Parker, President
Prudential Jennison Rising Dividend Fund
September 15, 2017
| | | | |
| Prudential Jennison Rising Dividend Fund | | | 3 | |
Your Fund’s Performance (unaudited)
Performance data quoted represent past performance. Past performance does not guarantee future results. The investment return and principal value of an investment will fluctuate, so that an investor’s shares, when redeemed, may be worth more or less than their original cost. Current performance may be lower or higher than the past performance data quoted. An investor may obtain performance data as of the most recent month-end by visiting our website at www.pgiminvestments.com or by calling (800) 225-1852.
| | | | | | |
| | | Average Annual Total Returns as of 7/31/17
(with sales charges) | |
| | | One Year (%) | | Since Inception (%) | |
| Class A | | 5.20 | | | 6.27 (3/5/14) | |
| Class C | | 9.59 | | | 7.28 (3/5/14) | |
| Class Z | | 11.68 | | | 8.36 (3/5/14) | |
| S&P 500 Index | | 16.03 | | | 10.94 | |
| Lipper Equity Income Funds Average | | 11.56 | | | 7.69 | |
| | | | | | |
| | | Average Annual Total Returns as of 7/31/17
(without sales charges) | |
| | | One Year (%) | | Since Inception (%) | |
| Class A | | 11.32 | |
| 8.05 (3/5/14)
|
|
| Class C | | 10.59 | |
| 7.28 (3/5/14)
|
|
Class Z | | 11.68 | |
| 8.36 (3/5/14)
|
|
| S&P 500 Index | | 16.03 | | | 10.94 | |
| Lipper Equity Income Funds Average | | 11.56 | | | 7.69 | |
Source: PGIM Investments LLC and Lipper Inc.
The Since Inception returns for the Indexes and the Lipper Average are measured from the closest month-end to the Fund’s inception date. Inception returns are provided since the Fund has less than 10 fiscal years of returns.
| | |
| 4 | | Visit our website at pgiminvestments.com |
Growth of a $10,000 Investment
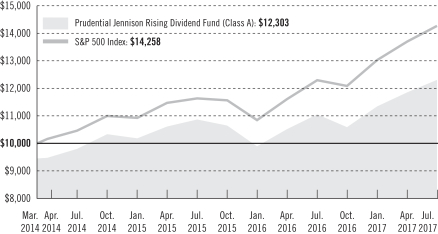
The graph compares a $10,000 investment in the Fund’s Class A shares with a similar investment in the S&P 500 Index by portraying the initial account values at the commencement of operations of Class A shares (March 5, 2014) and the account values at the end of the current fiscal year (July 31, 2017), as measured on a quarterly basis. For purposes of the graph, and unless otherwise indicated, it has been assumed that (a) the maximum applicable front-end sales charge was deducted from the initial $10,000 investment in Class A shares; (b) all recurring fees (including management fees) were deducted; and (c) all dividends and distributions were reinvested. The line graph provides information for Class A shares only. As indicated in the tables provided earlier, performance for Class C and Class Z shares will vary due to the differing charges and expenses applicable to each share class (as indicated in the following paragraphs). Without waiver of fees and/or expense reimbursements, if any, the returns would have been lower.
Past performance does not predict future performance. Total returns and the ending account values in the graph include changes in share price and reinvestment of dividends and capital gains distributions in a hypothetical investment for the periods shown. The Fund’s total returns do not reflect the deduction of income taxes on an individual’s investment. Taxes may reduce your actual investment returns on income or gains paid by the Fund or any gains you may realize if you sell your shares.
| | | | |
| Prudential Jennison Rising Dividend Fund | | | 5 | |
Your Fund’s Performance (continued)
The returns in the tables do not reflect the deduction of taxes that a shareholder would pay on Fund distributions or following the redemption of Fund shares. The average annual total returns take into account applicable sales charges, which are described for each share class in the table below.
| | | | | | |
| | | Class A | | Class C | | Class Z |
| Maximum initial sales charge | | 5.50% of the public offering price | | None | | None |
| Contingent deferred sales charge (CDSC) (as a percentage of the lower of original purchase price or net asset value at redemption) | | 1% on sales of $1 million or more made within 12 months of purchase | | 1% on sales made within 12 months of purchase | | None |
| Annual distribution and service (12b-1) fees (shown as a percentage of average daily net assets) | | .30%
(.25%
currently) | | 1% | | None |
Benchmark Definitions
S&P 500 Index—The Standard & Poor’s 500 Composite Stock Price Index (S&P 500 Index) is an unmanaged index of over 500 stocks of large US public companies. It gives a broad look at how stock prices in the United States have performed.
Lipper Equity Income Funds Average—The Lipper Equity Income Funds Average (Lipper Average) is based on the return of all mutual funds in the Lipper Equity Income Funds universe and does not include the effect of any sales charges or taxes payable by an investor. Funds in the Lipper Average seek relatively high current income and growth of income through investing 65% or more of their portfolios in dividend-paying equity securities.
Investors cannot invest directly in an index or average. The returns for the Index would be lower if they included the effects of sales charges, operating expenses of a mutual fund, or taxes that may be paid by an investor. Returns for the Lipper Average reflect the deduction of operating expenses, but not sales charges or taxes. The Since Inception returns for the Index and Lipper Average are measured from the closest month-end to the inception date for the indicated share class.
| | |
| 6 | | Visit our website at pgiminvestments.com |
| | | | |
Five Largest Holdings expressed as a
percentage of net assets as of 7/31/17 (%) | | | |
| JPMorgan Chase & Co., Banks | | | 2.9 | |
| Microsoft Corp., Software | | | 2.9 | |
| Allergan PLC, Pharmaceuticals | | | 2.7 | |
| Bank of America Corp., Banks | | | 2.5 | |
| Citigroup, Inc., Banks | | | 2.2 | |
Holdings reflect only long-term investments and are subject to change.
| | | | |
Five Largest Industries expressed as a
percentage of net assets as of 7/31/17 (%) | | | |
| Banks | | | 11.0 | |
| Pharmaceuticals | | | 7.6 | |
| IT Services | | | 7.4 | |
| Software | | | 7.0 | |
| Oil, Gas & Consumable Fuels | | | 6.2 | |
Industry weightings reflect only long-term investments and are subject to change.
| | | | |
| Prudential Jennison Rising Dividend Fund | | | 7 | |
Strategy and Performance Overview
How did the Fund perform?
The Prudential Jennison Rising Dividend Fund’s Class A shares rose 11.32% for the 12-month period ending July 31, 2017. Over the same period, the S&P 500 Index (the Index) climbed 16.03%, and the Lipper Equity Income Funds Average gained 11.56%.
In the Index, nine out of the eleven sectors were positive with five of the sectors producing double-digit returns during the period, with financials, information technology, industrials, and materials being among the strongest performing sectors in the group. Telecommunication services and real estate were the only two sectors that declined during the period.
Overall stock selection in the financials sector, an overweight allocation to banks, and stock selection in the energy sector contributed the most to relative return, while holdings in the information technology services industry and the industrials sector were also among the primary contributors to performance during the period. Conversely, stock selection in the health care sector and within the consumer discretionary sector detracted the most from relative performance. Additionally, an overweight allocation to the integrated oil & gas segment also hurt relative performance during the period.
What was the market environment?
| • | | The unconventional US presidential election and the new administration’s shaky start contributed to market volatility in the 12-month period ended July 31, 2017. |
| • | | The market’s initial favorable response to the election reflected anticipation of lower corporate tax rates, a less onerous regulatory environment, and increased fiscal spending on infrastructure. With legislative accomplishments elusive and factionalism impeding cooperation, market expectations moderated. |
| • | | Solid economic fundamentals in the US included moderate GDP expansion, robust employment, and accelerating corporate profit growth. Inflation remained benign. The Federal Reserve (Fed) raised the federal funds target rate to 1.00%-1.25%. |
What worked?
| | • | | Bank of America is a financial institution with a range of banking, investing, asset management and other financial and risk management products and services. Jennison favors the company and believes its shares provide an attractive risk/reward proposition on improving fundamentals. Shares rose on expectations of major potential bank environment changes in the form of anticipated lower regulation and tax cuts. Moreover, the Fed’s recent interest rate hikes benefited most banks, specifically Bank of America, given its earnings sensitivity to interest rates. |
| | |
| 8 | | Visit our website at pgiminvestments.com |
| | • | | JPMorgan Chase & Co., along with its subsidiaries, provides financial services worldwide. Jennison favors the company for its potential to take longer-term market share away from competitors while growing its credit card accounts business. In Jennison’s view, the company is attractively valued given its relatively higher return profile compared to its peers. Shares outperformed during the period on expectations of major potential bank environment changes in the form of anticipated lower regulation and tax cuts. Additionally, the company reported earnings ahead of consensus during the first-half of 2017, as net interest income rose after the after the Fed’s rate hikes over the period. |
| | • | | PNC Financial Services Group is one of the largest diversified financial services companies in the US. Jennison favors the company and believes PNC is a strong and improving franchise that has proven its ability to execute, along with a reasonable valuation relative to its peers. Shares performed well during the period as overall investor sentiment for the industry rose given expectations that the financial services regulations would be eased, along with corporate tax cuts and a new interest rate environment. The company benefited from the Fed’s interest rate hikes. |
What didn’t work?
In healthcare, specifically within pharmaceuticals:
| | • | | Bristol-Myers Squibb Company is a leader in the development of immuno-oncology, an approach that leverages a patient’s own immune system to attack tumors. Jennison believes immuno-oncology could result in longer-lasting responses to cancers and become the backbone of cancer treatment protocols. Shares have suffered over the period after the company stated it would not hold specific combination drug trials. After reducing an outsized position during the period, Jennison continues to hold the stock, awaiting the upcoming results for a study which should provide more confidence. Jennison continues to expect favorable data in early 2018 and maintains conviction in the long-term value creation of Bristol’s immuno-oncology franchise. |
| • | | In energy, specifically within energy equipment & services: |
| | • | | Halliburton Company is a global provider of services and products to the upstream oil and natural gas industry. Jennison favors the company for its strong execution on increased North American onshore market share and operating leverage. Shares of the company, along with the entire energy complex, underperformed during the period, as market concerns over increased US production growth, poor investor sentiment, and high volatility in crude-oil prices have hampered the overall energy sector. |
| • | | In consumer staples, specifically within food products: |
| | • | | J.M. Smucker Company is a manufacturer and marketer of consumer foods & beverages, and pet food products & snacks. The company acquired a value-based |
| | | | |
| Prudential Jennison Rising Dividend Fund | | | 9 | |
Strategy and Performance Overview (continued)
| | pet food business and is now in the process of transitioning this into more of a “good for you” wellness pet food business. In Jennison’s view, this represented additional growth potential. However, shares underperformed during the period as investors focused not only on the company’s inability to raise its full-year guidance, but also setting its 2017 second quarter guidance below consensus expectations. The Fund exited the position in favor of more attractive investment opportunities. |
The percentage points shown in the tables identify each security’s positive or negative contribution to the Fund’s return, which is the sum of all contributions by individual holdings.
| | | | | | |
| Top Contributors (%) | | Top Detractors (%) |
| Bank of America Corporation | | 1.21 | | Bristol-Myers Squibb Company | | –0.88 |
| JPMorgan Chase & Co. | | 1.20 | | Halliburton Company | | –0.36 |
| PNC Financial Services Group | | 1.04 | | J.M. Smucker Company | | –0.36 |
| Microsoft Corporation | | 0.89 | | Dollar General Corporation | | –0.35 |
| Goldman Sachs Group | | 0.81 | | Philip Morris International | | –0.31 |
Current outlook
| • | | Jennison continues to build the Fund from the bottom up, looking for investment opportunities that can consistently grow their dividends. The key to success for the strategy is finding those companies that can generate high free cash-flow that can be returned to investors in the form of a growing dividend. While the portfolio is currently experiencing low, double-digit dividend growth, based on Jennison’s analysis, it is expected that the portfolio should average at least a high single-digit rate of dividend growth over time. |
| • | | The Fund maintains an allocation to all major sector groups and relative to the Index and currently has more exposure in the overall energy sector, where the Fund tends to invest in established integrated oil companies viewed as best-in-class. Jennison also likes companies with more exposure to energy infrastructure, as well as exploration and production companies whose growth appears more sustainable from a balance-sheet perspective. The Fund also maintains an overweight to banks. |
| • | | On the other hand, Jennison believes the valuations and bottom-up fundamentals within the consumer staples sector have led to an underweight position relative to the Index. The Fund also maintains an underweight to health care and information technology. Additionally, the tech sector has fewer dividend-paying companies versus other sectors, which makes it more challenging for the Fund to identify those firms that meet Jennison’s fundamental investment criteria. |
| | |
| 10 | | Visit our website at pgiminvestments.com |
| • | | While the market has priced in some or many of the US President’s economic initiatives, Jennison is cautiously watching the legislative process to determine the winners and losers under the new administration. |
| | | | |
| Prudential Jennison Rising Dividend Fund | | | 11 | |
Fees and Expenses (unaudited)
As a shareholder of the Fund, you incur two types of costs: (1) transaction costs, including sales charges (loads) on purchase payments and redemptions, as applicable, and (2) ongoing costs, including management fees, distribution, and/or service (12b-1) fees, and other Fund expenses, as applicable. This example is intended to help you understand your ongoing costs (in dollars) of investing in the Fund and to compare these costs with the ongoing costs of investing in other mutual funds.
The example is based on an investment of $1,000 held through the six-month period ended July 31, 2017. The example is for illustrative purposes only; you should consult the Prospectus for information on initial and subsequent minimum investment requirements.
Actual Expenses
The first line for each share class in the table on the following page provides information about actual account values and actual expenses. You may use the information on this line, together with the amount you invested, to estimate the expenses that you paid over the period. Simply divide your account value by $1,000 (for example, an $8,600 account value ÷ $1,000 = 8.6), then multiply the result by the number on the first line under the heading “Expenses Paid During the Six-Month Period” to estimate the expenses you paid on your account during this period.
Hypothetical Example for Comparison Purposes
The second line for each share class in the table on the following page provides information about hypothetical account values and hypothetical expenses based on the Fund’s actual expense ratio and an assumed rate of return of 5% per year before expenses, which is not the Fund’s actual return. The hypothetical account values and expenses may not be used to estimate the actual ending account balance or expenses you paid for the period. You may use this information to compare the ongoing costs of investing in the Fund and other funds. To do so, compare this 5% hypothetical example with the 5% hypothetical examples that appear in the shareholder reports of the other funds.
The Fund’s transfer agent may charge additional fees to holders of certain accounts that are not included in the expenses shown in the table on the following page. These fees apply to individual retirement accounts (IRAs) and Section 403(b) accounts. As of the close of the period covered by the table, IRA fees included an annual maintenance fee of $15 per account (subject to a maximum annual maintenance fee of $25 for all accounts held by the same shareholder). Section 403(b) accounts are charged an annual $25 fiduciary maintenance fee. Some of the fees may vary in amount, or may be waived, based on your total account balance or the number of Prudential funds, including the Fund, that you own. You should consider the additional fees that were charged to your Fund account over the six-month period when you estimate the total ongoing expenses paid over the period and
| | |
| 12 | | Visit our website at pgiminvestments.com |
the impact of these fees on your ending account value, as these additional expenses are not reflected in the information provided in the expense table. Additional fees have the effect of reducing investment returns.
Please note that the expenses shown in the table are meant to highlight your ongoing costs only and do not reflect any transactional costs such as sales charges (loads). Therefore, the second line for each share class in the table is useful in comparing ongoing costs only and will not help you determine the relative total costs of owning different funds. In addition, if these transactional costs were included, your costs would have been higher.
| | | | | | | | | | | | | | | | | | |
Prudential Jennison Rising
Dividend Fund | | Beginning Account
Value
February 1, 2017 | | | Ending Account
Value
July 31, 2017 | | | Annualized
Expense Ratio | | | Expenses Paid
During the
Six-Month Period* | |
| Class A | | Actual | | $ | 1,000.00 | | | $ | 1,085.00 | | | | 1.24 | % | | $ | 6.41 | |
| | Hypothetical | | $ | 1,000.00 | | | $ | 1,018.65 | | | | 1.24 | % | | $ | 6.21 | |
| Class C | | Actual | | $ | 1,000.00 | | | $ | 1,081.30 | | | | 1.99 | % | | $ | 10.27 | |
| | Hypothetical | | $ | 1,000.00 | | | $ | 1,014.93 | | | | 1.99 | % | | $ | 9.94 | |
| Class Z | | Actual | | $ | 1,000.00 | | | $ | 1,087.10 | | | | 0.99 | % | | $ | 5.12 | |
| | | Hypothetical | | $ | 1,000.00 | | | $ | 1,019.89 | | | | 0.99 | % | | $ | 4.96 | |
*Fund expenses (net of fee waivers or subsidies, if any) for each share class are equal to the annualized expense ratio for each share class (provided in the table), multiplied by the average account value over the period, multiplied by the 181 days in the six-month period ended July 31, 2017, and divided by the 365 days in the Fund’s fiscal year ended July 31, 2017 (to reflect the six-month period). Expenses presented in the table include the expenses of any underlying portfolios in which the Fund may invest.
| | | | |
| Prudential Jennison Rising Dividend Fund | | | 13 | |
Schedule of Investments
as of July 31, 2017
| | | | | | | | |
| Description | | Shares | | | Value | |
LONG-TERM INVESTMENTS 98.8% | | | | | | | | |
| | |
COMMON STOCKS | | | | | | | | |
| | |
Aerospace & Defense 3.5% | | | | | | | | |
General Dynamics Corp. | | | 917 | | | $ | 180,035 | |
Lockheed Martin Corp. | | | 871 | | | | 254,445 | |
| | | | | | | | |
| | | | | | | 434,480 | |
| | |
Air Freight & Logistics 2.1% | | | | | | | | |
FedEx Corp. | | | 1,230 | | | | 255,877 | |
| | |
Airlines 1.1% | | | | | | | | |
Delta Air Lines, Inc. | | | 2,680 | | | | 132,285 | |
| | |
Banks 11.0% | | | | | | | | |
Bank of America Corp. | | | 12,771 | | | | 308,037 | |
BB&T Corp. | | | 3,155 | | | | 149,295 | |
Citigroup, Inc. | | | 4,045 | | | | 276,880 | |
JPMorgan Chase & Co. | | | 3,973 | | | | 364,721 | |
PNC Financial Services Group, Inc. (The) | | | 2,076 | | | | 267,389 | |
| | | | | | | | |
| | | | | | | 1,366,322 | |
| | |
Beverages 1.9% | | | | | | | | |
Coca-Cola Co. (The) | | | 3,324 | | | | 152,372 | |
Constellation Brands, Inc. (Class A Stock) | | | 403 | | | | 77,920 | |
| | | | | | | | |
| | | | | | | 230,292 | |
| | |
Capital Markets 2.9% | | | | | | | | |
Affiliated Managers Group, Inc. | | | 1,055 | | | | 196,051 | |
Goldman Sachs Group, Inc. (The) | | | 731 | | | | 164,716 | |
| | | | | | | | |
| | | | | | | 360,767 | |
| | |
Chemicals 3.2% | | | | | | | | |
Air Products & Chemicals, Inc. | | | 1,096 | | | | 155,796 | |
Albemarle Corp. | | | 535 | | | | 61,953 | |
Dow Chemical Co. (The) | | | 2,775 | | | | 178,266 | |
| | | | | | | | |
| | | | | | | 396,015 | |
| | |
Communications Equipment 0.7% | | | | | | | | |
Cisco Systems, Inc. | | | 2,728 | | | | 85,796 | |
| | |
Diversified Telecommunication Services 0.9% | | | | | | | | |
Cogent Communications Holdings, Inc. | | | 2,590 | | | | 108,133 | |
See Notes to Financial Statements.
| | | | |
| Prudential Jennison Rising Dividend Fund | | | 15 | |
Schedule of Investments (continued)
as of July 31, 2017
| | | | | | | | |
| Description | | Shares | | | Value | |
COMMON STOCKS (Continued) | | | | | | | | |
| | |
Electric Utilities 2.1% | | | | | | | | |
NextEra Energy, Inc. | | | 855 | | | $ | 124,907 | |
PG&E Corp. | | | 2,100 | | | | 142,149 | |
| | | | | | | | |
| | | | | | | 267,056 | |
| | |
Electronic Equipment, Instruments & Components 1.0% | | | | | | | | |
Corning, Inc. | | | 4,102 | | | | 119,532 | |
| | |
Equity Real Estate Investment Trusts (REITs) 4.6% | | | | | | | | |
Crown Castle International Corp. | | | 1,170 | | | | 117,679 | |
CyrusOne, Inc. | | | 3,198 | | | | 190,952 | |
Equinix, Inc. | | | 383 | | | | 172,630 | |
QTS Realty Trust, Inc. (Class A Stock) | | | 1,730 | | | | 92,503 | |
| | | | | | | | |
| | | | | | | 573,764 | |
| | |
Food & Staples Retailing 2.6% | | | | | | | | |
Costco Wholesale Corp. | | | 817 | | | | 129,503 | |
Wal-Mart Stores, Inc. | | | 2,376 | | | | 190,056 | |
| | | | | | | | |
| | | | | | | 319,559 | |
| | |
Food Products 0.9% | | | | | | | | |
Hershey Co. (The) | | | 1,018 | | | | 107,206 | |
| | |
Health Care Equipment & Supplies 1.2% | | | | | | | | |
Abbott Laboratories | | | 3,113 | | | | 153,097 | |
| | |
Health Care Providers & Services 1.3% | | | | | | | | |
Aetna, Inc. | | | 1,050 | | | | 162,026 | |
| | |
Hotels, Restaurants & Leisure 4.1% | | | | | | | | |
Dunkin’ Brands Group, Inc. | | | 2,070 | | | | 109,772 | |
McDonald’s Corp. | | | 1,497 | | | | 232,244 | |
Starbucks Corp. | | | 3,016 | | | | 162,804 | |
| | | | | | | | |
| | | | | | | 504,820 | |
| | |
Household Products 0.9% | | | | | | | | |
Procter & Gamble Co. (The) | | | 1,261 | | | | 114,524 | |
| | |
Industrial Conglomerates 3.0% | | | | | | | | |
3M Co. | | | 628 | | | | 126,335 | |
Honeywell International, Inc. | | | 1,842 | | | | 250,733 | |
| | | | | | | | |
| | | | | | | 377,068 | |
See Notes to Financial Statements.
| | | | | | | | |
| Description | | Shares | | | Value | |
COMMON STOCKS (Continued) | | | | | | | | |
| | |
IT Services 7.4% | | | | | | | | |
Accenture PLC (Class A Stock) | | | 1,622 | | | $ | 208,946 | |
Automatic Data Processing, Inc. | | | 1,213 | | | | 144,238 | |
DXC Technology Co. | | | 1,733 | | | | 135,832 | |
Mastercard, Inc. (Class A Stock) | | | 1,917 | | | | 244,993 | |
Visa, Inc. (Class A Stock) | | | 1,905 | | | | 189,662 | |
| | | | | | | | |
| | | | | | | 923,671 | |
| | |
Life Sciences Tools & Services 3.8% | | | | | | | | |
Agilent Technologies, Inc. | | | 3,569 | | | | 213,390 | |
Thermo Fisher Scientific, Inc. | | | 1,498 | | | | 262,944 | |
| | | | | | | | |
| | | | | | | 476,334 | |
| | |
Media 3.4% | | | | | | | | |
CBS Corp. (Class B Stock) | | | 2,820 | | | | 185,640 | |
Time Warner, Inc. | | | 1,209 | | | | 123,826 | |
Twenty-First Century Fox, Inc. (Class A Stock) | | | 3,808 | | | | 110,813 | |
| | | | | | | | |
| | | | | | | 420,279 | |
| | |
Multi-Utilities 1.0% | | | | | | | | |
Sempra Energy | | | 1,131 | | | | 127,814 | |
| | |
Oil, Gas & Consumable Fuels 6.2% | | | | | | | | |
Marathon Petroleum Corp. | | | 2,235 | | | | 125,137 | |
Royal Dutch Shell PLC (Netherlands) (Class A Stock), ADR | | | 4,673 | | | | 264,165 | |
Suncor Energy, Inc. (Canada) | | | 6,208 | | | | 202,505 | |
Williams Cos., Inc. (The) | | | 5,547 | | | | 176,284 | |
| | | | | | | | |
| | | | | | | 768,091 | |
| | |
Pharmaceuticals 7.6% | | | | | | | | |
Allergan PLC | | | 1,342 | | | | 338,627 | |
Bristol-Myers Squibb Co. | | | 3,084 | | | | 175,479 | |
Eli Lilly & Co. | | | 2,954 | | | | 244,178 | |
Pfizer, Inc. | | | 5,588 | | | | 185,298 | |
| | | | | | | | |
| | | | | | | 943,582 | |
| | |
Road & Rail 2.6% | | | | | | | | |
CSX Corp. | | | 2,428 | | | | 119,798 | |
Ryder System, Inc. | | | 1,032 | | | | 75,088 | |
Union Pacific Corp. | | | 1,193 | | | | 122,831 | |
| | | | | | | | |
| | | | | | | 317,717 | |
See Notes to Financial Statements.
| | | | |
| Prudential Jennison Rising Dividend Fund | | | 17 | |
Schedule of Investments (continued)
as of July 31, 2017
| | | | | | | | |
| Description | | Shares | | | Value | |
COMMON STOCKS (Continued) | | | | | | | | |
| | |
Semiconductors & Semiconductor Equipment 5.1% | | | | | | | | |
Analog Devices, Inc. | | | 2,323 | | | $ | 183,540 | |
NVIDIA Corp. | | | 1,328 | | | | 215,813 | |
Texas Instruments, Inc. | | | 2,918 | | | | 237,467 | |
| | | | | | | | |
| | | | | | | 636,820 | |
| | |
Software 7.0% | | | | | | | | |
Intuit, Inc. | | | 1,938 | | | | 265,913 | |
Microsoft Corp. | | | 4,862 | | | | 353,467 | |
Oracle Corp. | | | 4,872 | | | | 243,259 | |
| | | | | | | | |
| | | | | | | 862,639 | |
| | |
Specialty Retail 1.4% | | | | | | | | |
Home Depot, Inc. (The) | | | 773 | | | | 115,641 | |
Ross Stores, Inc. | | | 1,159 | | | | 64,116 | |
| | | | | | | | |
| | | | | | | 179,757 | |
| | |
Technology Hardware, Storage & Peripherals 2.2% | | | | | | | | |
Apple, Inc. | | | 1,836 | | | | 273,068 | |
| | |
Textiles, Apparel & Luxury Goods 1.1% | | | | | | | | |
Coach, Inc. | | | 2,905 | | | | 136,942 | |
| | |
Tobacco 1.0% | | | | | | | | |
Altria Group, Inc. | | | 867 | | | | 56,329 | |
Philip Morris International, Inc. | | | 531 | | | | 61,973 | |
| | | | | | | | |
| | | | | | | 118,302 | |
| | | | | | | | |
TOTAL LONG-TERM INVESTMENTS
(cost $10,180,532) | | | | | | | 12,253,635 | |
| | | | | | | | |
| | |
SHORT-TERM INVESTMENT 1.2% | | | | | | | | |
| | |
AFFILIATED MUTUAL FUND | | | | | | | | |
Prudential Investment Portfolios 2 - Prudential Core Ultra Short Bond Fund
(cost $151,745)(w) | | | 151,745 | | | | 151,745 | |
| | | | | | | | |
TOTAL INVESTMENTS 100.0%
(cost $10,332,277) | | | | | | | 12,405,380 | |
Liabilities in excess of other assets 0.0% | | | | | | | (4,891 | ) |
| | | | | | | | |
NET ASSETS 100.0% | | | | | | $ | 12,400,489 | |
| | | | | | | | |
See Notes to Financial Statements.
The following abbreviations are used in the annual report:
ADR—American Depositary Receipt
LIBOR—London Interbank Offered Rate
REITs—Real Estate Investment Trusts
| (w) | PGIM Investments LLC, the manager of the Fund, also serves as manager of the Prudential Investment Portfolios 2 - Prudential Core Ultra Short Bond Fund. |
Fair Value Measurements:
Various inputs are used in determining the value of the Fund’s investments. These inputs are summarized in the three broad levels listed below.
Level 1—unadjusted quoted prices generally in active markets for identical securities.
Level 2—quoted prices for similar securities, interest rates and yield curves, prepayment speeds, foreign currency exchange rates and other observable inputs.
Level 3—unobservable inputs for securities valued in accordance with Board approved fair valuation procedures.
The following is a summary of the inputs used as of July 31, 2017 in valuing such portfolio securities:
| | | | | | | | | | | | |
| | | Level 1 | | | Level 2 | | | Level 3 | |
Investments in Securities | | | | | | | | | | | | |
Common Stocks | | | | | | | | | | | | |
Aerospace & Defense | | $ | 434,480 | | | $ | — | | | $ | — | |
Air Freight & Logistics | | | 255,877 | | | | — | | | | — | |
Airlines | | | 132,285 | | | | — | | | | — | |
Banks | | | 1,366,322 | | | | — | | | | — | |
Beverages | | | 230,292 | | | | — | | | | — | |
Capital Markets | | | 360,767 | | | | — | | | | — | |
Chemicals | | | 396,015 | | | | — | | | | — | |
Communications Equipment | | | 85,796 | | | | — | | | | — | |
Diversified Telecommunication Services | | | 108,133 | | | | — | | | | — | |
Electric Utilities | | | 267,056 | | | | — | | | | — | |
Electronic Equipment, Instruments & Components | | | 119,532 | | | | — | | | | — | |
Equity Real Estate Investment Trusts (REITs) | | | 573,764 | | | | — | | | | — | |
Food & Staples Retailing | | | 319,559 | | | | — | | | | — | |
Food Products | | | 107,206 | | | | — | | | | — | |
Health Care Equipment & Supplies | | | 153,097 | | | | — | | | | — | |
Health Care Providers & Services | | | 162,026 | | | | — | | | | — | |
Hotels, Restaurants & Leisure | | | 504,820 | | | | — | | | | — | |
Household Products | | | 114,524 | | | | — | | | | — | |
Industrial Conglomerates | | | 377,068 | | | | — | | | | — | |
See Notes to Financial Statements.
| | | | |
| Prudential Jennison Rising Dividend Fund | | | 19 | |
Schedule of Investments (continued)
as of July 31, 2017
| | | | | | | | | | | | |
| | | Level 1 | | | Level 2 | | | Level 3 | |
Investments in Securities (continued) | | | | | | | | | | | | |
Common Stocks (continued) | | | | | | | | | | | | |
IT Services | | $ | 923,671 | | | $ | — | | | $ | — | |
Life Sciences Tools & Services | | | 476,334 | | | | — | | | | — | |
Media | | | 420,279 | | | | — | | | | — | |
Multi-Utilities | | | 127,814 | | | | — | | | | — | |
Oil, Gas & Consumable Fuels | | | 768,091 | | | | — | | | | — | |
Pharmaceuticals | | | 943,582 | | | | — | | | | — | |
Road & Rail | | | 317,717 | | | | — | | | | — | |
Semiconductors & Semiconductor Equipment | | | 636,820 | | | | — | | | | — | |
Software | | | 862,639 | | | | — | | | | — | |
Specialty Retail | | | 179,757 | | | | — | | | | — | |
Technology Hardware, Storage & Peripherals | | | 273,068 | | | | — | | | | — | |
Textiles, Apparel & Luxury Goods | | | 136,942 | | | | — | | | | — | |
Tobacco | | | 118,302 | | | | — | | | | — | |
Affiliated Mutual Fund | | | 151,745 | | | | — | | | | — | |
| | | | | | | | | | | | |
Total | | $ | 12,405,380 | | | $ | — | | | $ | — | |
| | | | | | | | | | | | |
During the period, there were no transfers between Level 1, Level 2 and Level 3 to report.
Industry Classification:
The industry classification of investments and liabilities in excess of other assets shown as a percentage of net assets as of July 31, 2017 were as follows (unaudited):
| | | | |
Banks | | | 11.0 | % |
Pharmaceuticals | | | 7.6 | |
IT Services | | | 7.4 | |
Software | | | 7.0 | |
Oil, Gas & Consumable Fuels | | | 6.2 | |
Semiconductors & Semiconductor Equipment | | | 5.1 | |
Equity Real Estate Investment Trusts (REITs) | | | 4.6 | |
Hotels, Restaurants & Leisure | | | 4.1 | |
Life Sciences Tools & Services | | | 3.8 | |
Aerospace & Defense | | | 3.5 | |
Media | | | 3.4 | |
Chemicals | | | 3.2 | |
Industrial Conglomerates | | | 3.0 | |
Capital Markets | | | 2.9 | |
Food & Staples Retailing | | | 2.6 | |
Road & Rail | | | 2.6 | |
Technology Hardware, Storage & Peripherals | | | 2.2 | |
Electric Utilities | | | 2.1 | |
Air Freight & Logistics | | | 2.1 | |
Beverages | | | 1.9 | |
Specialty Retail | | | 1.4 | % |
Health Care Providers & Services | | | 1.3 | |
Health Care Equipment & Supplies | | | 1.2 | |
Affiliated Mutual Fund | | | 1.2 | |
Textiles, Apparel & Luxury Goods | | | 1.1 | |
Airlines | | | 1.1 | |
Multi-Utilities | | | 1.0 | |
Electronic Equipment, Instruments & Components | | | 1.0 | |
Tobacco | | | 1.0 | |
Household Products | | | 0.9 | |
Diversified Telecommunication Services | | | 0.9 | |
Food Products | | | 0.9 | |
Communications Equipment | | | 0.7 | |
| | | | |
| | | 100.0 | |
Liabilities in excess of other assets | | | 0.0 | * |
| | | | |
| | | 100.0 | % |
| | | | |
See Notes to Financial Statements.
This Page Intentionally Left Blank
Statement of Assets & Liabilities
as of July 31, 2017
| | | | |
Assets | | | | |
Investments at value: | | | | |
Unaffiliated investments (cost $10,180,532) | | $ | 12,253,635 | |
Affiliated investments (cost $151,745) | | | 151,745 | |
Receivable for investments sold | | | 84,478 | |
Dividends receivable | | | 10,724 | |
Receivable for Fund shares sold | | | 177 | |
| | | | |
Total assets | | | 12,500,759 | |
| | | | |
| |
Liabilities | | | | |
Payable for investments purchased | | | 31,775 | |
Audit fee payable | | | 24,231 | |
Custodian and accounting fees payable | | | 18,219 | |
Accrued expenses and other liabilities | | | 14,131 | |
Shareholders’ reports payable | | | 6,145 | |
Distribution fee payable | | | 2,042 | |
Payable for Fund shares reacquired | | | 1,959 | |
Management fee payable | | | 1,216 | |
Affiliated transfer agent fee payable | | | 552 | |
| | | | |
Total liabilities | | | 100,270 | |
| | | | |
| |
Net Assets | | $ | 12,400,489 | |
| | | | |
| | | | | |
Net assets were comprised of: | | | | |
Shares of beneficial interest, at par | | $ | 991 | |
Paid-in capital in excess of par | | | 10,398,764 | |
| | | | |
| | | 10,399,755 | |
Undistributed net investment income | | | 3,721 | |
Accumulated net realized loss on investment and foreign currency transactions | | | (76,090 | ) |
Net unrealized appreciation on investments | | | 2,073,103 | |
| | | | |
Net assets, July 31, 2017 | | $ | 12,400,489 | |
| | | | |
See Notes to Financial Statements.
| | | | |
Class A | | | | |
Net asset value, offering price and redemption price per share ($3,474,141 ÷ 277,849 shares of beneficial interest issued and outstanding) | | $ | 12.50 | |
Maximum sales charge (5.50% of offering price) | | | 0.73 | |
| | | | |
Maximum offering price to public | | $ | 13.23 | |
| | | | |
| |
Class C | | | | |
Net asset value, offering price and redemption price per share, ($1,607,779 ÷ 128,578 shares of beneficial interest issued and outstanding) | | $ | 12.50 | |
| | | | |
| |
Class Z | | | | |
Net asset value, offering price and redemption price per share, ($7,318,569 ÷ 584,715 shares of beneficial interest issued and outstanding) | | $ | 12.52 | |
| | | | |
See Notes to Financial Statements.
| | | | |
| Prudential Jennison Rising Dividend Fund | | | 23 | |
Statement of Operations
Year Ended July 31, 2017
| | | | |
Net Investment Income (Loss) | | | | |
Income | | | | |
Unaffiliated dividend income (net of foreign withholding taxes of $1,783) | | $ | 267,748 | |
Affiliated dividend income | | | 2,304 | |
Income from securities lending, net (including affiliated income of $137) | | | 1,848 | |
| | | | |
Total income | | | 271,900 | |
| | | | |
| |
Expenses | | | | |
Management fee | | | 85,380 | |
Distribution fee—Class A | | | 8,736 | |
Distribution fee—Class C | | | 14,012 | |
Registration fees | | | 47,000 | |
Custodian and accounting fees | | | 45,000 | |
Audit fee | | | 24,000 | |
Legal fees and expenses | | | 20,000 | |
Shareholders’ reports | | | 10,000 | |
Trustees’ fees | | | 9,000 | |
Transfer agent’s fees and expenses (including affiliated expense of $2,700) | | | 6,000 | |
Loan interest expense | | | 31 | |
Miscellaneous | | | 13,444 | |
| | | | |
Total expenses | | | 282,603 | |
Less: Management fee waiver and/or expense reimbursement | | | (150,757 | ) |
Less: Distribution fee waiver—Class A | | | (1,456 | ) |
| | | | |
Net expenses | | | 130,390 | |
| | | | |
Net investment income (loss) | | | 141,510 | |
| | | | |
| |
Realized And Unrealized Gain (Loss) On Investments And Foreign Currency Transactions | | | | |
Net realized gain (loss) on: | | | | |
Investment transactions | | | 195,768 | |
Foreign currency transactions | | | (92 | ) |
| | | | |
| | | 195,676 | |
| | | | |
Net change in unrealized appreciation (depreciation) on investments | | | 863,332 | |
| | | | |
Net gain (loss) on investment and foreign currency transactions | | | 1,059,008 | |
| | | | |
Net Increase (Decrease) In Net Assets Resulting From Operations | | $ | 1,200,518 | |
| | | | |
See Notes to Financial Statements.
Statement of Changes in Net Assets
| | | | | | | | |
| | | Year Ended July 31, | |
| | | 2017 | | | 2016 | |
Increase (Decrease) in Net Assets | | | | | | | | |
Operations | | | | | | | | |
Net investment income (loss) | | $ | 141,510 | | | $ | 117,959 | |
Net realized gain (loss) on investment and foreign currency transactions | | | 195,676 | | | | (252,084 | ) |
Net change in unrealized appreciation (depreciation) on investments | | | 863,332 | | | | 436,905 | |
| | | | | | | | |
Net increase (decrease) in net assets resulting from operations | | | 1,200,518 | | | | 302,780 | |
| | | | | | | | |
| | |
Dividends from net investment income | | | | | | | | |
Class A | | | (36,605 | ) | | | (23,924 | ) |
Class C | | | (7,173 | ) | | | (7,104 | ) |
Class Z | | | (100,464 | ) | | | (87,951 | ) |
| | | | | | | | |
| | | (144,242 | ) | | | (118,979 | ) |
| | | | | | | | |
| | |
Fund share transactions (Net of share conversions) | | | | | | | | |
Net proceeds from shares sold | | | 2,398,464 | | | | 3,621,439 | |
Net asset value of shares issued in reinvestment of dividends and distributions | | | 143,489 | | | | 118,864 | |
Cost of shares reacquired | | | (1,742,268 | ) | | | (1,080,035 | ) |
| | | | | | | | |
Net increase (decrease) in net assets from Fund share transactions | | | 799,685 | | | | 2,660,268 | |
| | | | | | | | |
Total increase (decrease) | | | 1,855,961 | | | | 2,844,069 | |
| | |
Net Assets: | | | | | | | | |
Beginning of year | | | 10,544,528 | | | | 7,700,459 | |
| | | | | | | | |
End of year(a) | | $ | 12,400,489 | | | $ | 10,544,528 | |
| | | | | | | | |
(a) Includes undistributed net investment income of: | | $ | 3,721 | | | $ | 6,545 | |
| | | | | | | | |
See Notes to Financial Statements.
| | | | |
| Prudential Jennison Rising Dividend Fund | | | 25 | |
Notes to Financial Statements
Prudential Investment Portfolios 5 (the “Trust”) is registered under the Investment Company Act of 1940, as amended (“1940 Act”), as an open-end management investment company, which was established as a Delaware business trust on July 8, 1999. The Trust consists of fourteen separate funds: Prudential Day One Income Fund, Prudential Day One 2010 Fund, Prudential Day One 2015 Fund, Prudential Day One 2020 Fund, Prudential Day One 2025 Fund, Prudential Day One 2030 Fund, Prudential Day One 2035 Fund, Prudential Day One 2040 Fund, Prudential Day One 2045 Fund, Prudential Day One 2050 Fund, Prudential Day One 2055 Fund, Prudential Day One 2060 Fund, Prudential Jennison Diversified Growth Fund (formerly Prudential Jennison Conservative Growth Fund) and Prudential Jennison Rising Dividend Fund. These financial statements relate to Prudential Jennison Rising Dividend Fund (the “Fund”). The financial statements of the other funds are not presented herein.
The investment objective of the Fund is capital appreciation and income.
1. Accounting Policies
The Fund follows investment company accounting and reporting guidance of the Financial Accounting Standards Board (“FASB”) Accounting Standard Codification Topic 946 Financial Services—Investment Companies. The following accounting policies conform to U.S. generally accepted accounting principles. The Fund consistently follows such policies in the preparation of its financial statements.
Securities Valuation: The Fund holds securities and other assets and liabilities that are fair valued at the close of each day (generally, 4:00 PM Eastern time) the New York Stock Exchange (“NYSE”) is open for trading. Fair value is the price that would be received to sell an asset or paid to transfer a liability in an orderly transaction between market participants on the measurement date. The Board of Trustees (the “Board”) has adopted valuation procedures for security valuation under which fair valuation responsibilities have been delegated to PGIM Investments LLC (“PGIM Investments” or “the Manager”) (formerly known as Prudential Investments LLC). Under the current valuation procedures, the Valuation Committee is responsible for supervising the valuation of portfolio securities and other assets and liabilities. The valuation procedures permit the Fund to utilize independent pricing vendor services, quotations from market makers, and alternative valuation methods when market quotations are either not readily available or not deemed representative of fair value. A record of the Valuation Committee’s actions is subject to the Board’s review, approval, and ratification at its next regularly scheduled quarterly meeting.
Various inputs determine how the Fund’s investments are valued, all of which are categorized according to the three broad levels (Level 1, 2, or 3) detailed in the Schedule of Investments.
Common and preferred stocks, exchange-traded funds, and derivative instruments, such as futures or options, that are traded on a national securities exchange are valued at the last sale price as of the close of trading on the applicable exchange where the security principally trades. Securities traded via NASDAQ are valued at the NASDAQ official closing price. To the extent these securities are valued at the last sale price or NASDAQ official closing price, they are classified as Level 1 in the fair value hierarchy. In the event that no sale or official closing price on valuation date exists, these securities are generally valued at the mean between the last reported bid and ask prices, or at the last bid price in the absence of an ask price. These securities are classified as Level 2 in the fair value hierarchy.
Foreign equities traded on foreign securities exchanges are generally valued using pricing vendor services that provide model prices derived using adjustment factors based on information such as local closing price, relevant general and sector indices, currency fluctuations, depositary receipts, and futures, as applicable. Securities valued using such model prices are classified as Level 2 in the fair value hierarchy. The models generate an evaluated adjustment factor for each security, which is applied to the local closing price to adjust it for post closing market movements. Utilizing that evaluated adjustment factor, the vendor provides an evaluated price for each security. If the vendor does not provide an evaluated price, securities are valued in accordance with exchange-traded common and preferred stock valuation policies discussed above.
Investments in open-end, non-exchange-traded mutual funds are valued at their net asset values as of the close of the NYSE on the date of valuation. These securities are classified as Level 1 in the fair value hierarchy since they may be purchased or sold at their net asset values on the date of valuation.
Securities and other assets that cannot be priced according to the methods described above are valued based on pricing methodologies approved by the Board. In the event that unobservable inputs are used when determining such valuations, the securities will be classified as Level 3 in the fair value hierarchy.
When determining the fair value of securities, some of the factors influencing the valuation include: the nature of any restrictions on disposition of the securities; assessment of the general liquidity of the securities; the issuer’s financial condition and the markets in which it does business; the cost of the investment; the size of the holding and the capitalization of the issuer; the prices of any recent transactions or bids/offers for such securities or any comparable securities; any available analyst media or other reports or information deemed reliable by the investment adviser regarding the issuer or the markets or industry in which it operates. Using fair value to price securities may result in a value that is different from a security’s most recent closing price and from the price used by other unaffiliated mutual funds to calculate their net asset values.
Restricted and Illiquid Securities: Subject to guidelines adopted by the Board, the Fund may invest up to 15% of its net assets in illiquid securities, including those which are
| | | | |
| Prudential Jennison Rising Dividend Fund | | | 27 | |
Notes to Financial Statements (continued)
restricted as to disposition under securities law (“restricted securities”). Restricted securities are valued pursuant to the valuation procedures noted above. Illiquid securities are those that, because of the absence of a readily available market or due to legal or contractual restrictions on resale, cannot be sold within seven days in the ordinary course of business at approximately the amount at which the Fund has valued the investment. Therefore, the Fund may find it difficult to sell illiquid securities at the time considered most advantageous by its Subadviser and may incur expenses that would not be incurred in the sale of securities that were freely marketable. Certain securities that would otherwise be considered illiquid because of legal restrictions on resale to the general public may be traded among qualified institutional buyers under Rule 144A of the Securities Act of 1933. These Rule 144A securities, as well as commercial paper that is sold in private placements under Section 4(2) of the Securities Act, may be deemed liquid by the Fund’s Subadviser under the guidelines adopted by the Directors of the Fund. However, the liquidity of the Fund’s investments in Rule 144A securities could be impaired if trading does not develop or declines.
Foreign Currency Translation: The books and records of the Fund are maintained in U.S. dollars. Foreign currency amounts are translated into U.S. dollars on the following basis:
(i) market value of investment securities, other assets and liabilities—at the current rates of exchange;
(ii) purchases and sales of investment securities, income and expenses—at the rates of exchange prevailing on the respective dates of such transactions.
Although the net assets of the Fund are presented at the foreign exchange rates and market values at the close of the period, the Fund does not generally isolate that portion of the results of operations arising as a result of changes in the foreign exchange rates from the fluctuations arising from changes in the market prices of long-term portfolio securities held at the end of the period. Similarly, the Fund does not isolate the effect of changes in foreign exchange rates from the fluctuations arising from changes in the market prices of long-term portfolio securities sold during the period. Accordingly, holding period realized foreign currency gains (losses) are included in the reported net realized gains (losses) on investment transactions.
Additionally, net realized gains (losses) on foreign currency transactions represent net foreign exchange gains (losses) from the disposition of holdings of foreign currencies, forward currency contracts, currency gains (losses) realized between the trade and settlement dates on securities transactions, and the difference between the amounts of interest, dividends and foreign withholding taxes recorded on the Fund’s books and the U.S. dollar equivalent amounts actually received or paid. Net unrealized currency gains (losses) from valuing foreign currency denominated assets and liabilities (other than
investments) at period end exchange rates are reflected as a component of net unrealized appreciation (depreciation) on foreign currencies.
Master Netting Arrangements: The Trust, on behalf of the Fund, is subject to various Master Agreements, or netting arrangements, with select counterparties. These are agreements which a subadviser may have negotiated and entered into on behalf of the Fund. A master netting arrangement between the Fund and the counterparty permits the Fund to offset amounts payable by the Fund to the same counterparty against amounts to be received; and by the receipt of collateral from the counterparty by the Fund to cover the Fund’s exposure to the counterparty. However, there is no assurance that such mitigating factors are easily enforceable. In addition to master netting arrangements, the right to set-off exists when all the conditions are met such that each of the parties owes the other determinable amounts, the reporting party has the right to set-off the amount owed with the amount owed by the other party, the reporting party intends to set-off and the right of set-off is enforceable by law. During the reporting period, there was no intention to settle on a net basis and all amounts are presented on a gross basis on the Statement of Assets and Liabilities.
Securities Lending: The Fund may lend its portfolio securities to banks and broker-dealers. The loans are secured by collateral at least equal to the market value of the securities loaned. Collateral pledged by each borrower is invested in an affiliated money market fund and is marked to market daily, based on the previous day’s market value, such that the value of the collateral exceeds the value of the loaned securities. Loans are subject to termination at the option of the borrower or the Fund. Upon termination of the loan, the borrower will return to the Fund securities identical to the loaned securities. Should the borrower of the securities fail financially, the Fund has the right to repurchase the securities in the open market using the collateral. The Fund recognizes income, net of any rebate and securities lending agent fees, for lending its securities in the form of fees or interest on the investment of any cash received as collateral. The borrower receives all interest and dividends from the securities loaned and such payments are passed back to the lender in amounts equivalent thereto. The Fund also continues to recognize any unrealized gain (loss) in the market price of the securities loaned and on the change in the value of the collateral invested that may occur during the term of the loan. In addition, realized gain (loss) is recognized on changes in the value of the collateral invested upon liquidation of the collateral. Net earnings from securities lending are disclosed on the Statement of Operations as “Income from securities lending, net”.
Concentration of Risk: Foreign security and currency transactions may involve certain considerations and risks not typically associated with those of domestic origin as a result of, among other factors, the possibility of political or economic instability or the level of governmental supervision and regulation of foreign securities markets.
Equity Real Estate Investment Trusts (REITs): The Fund invests in Equity REITs, which report information on the source of their distributions annually. Based on current and historical information, a portion of distributions received from Equity REITs during the
| | | | |
| Prudential Jennison Rising Dividend Fund | | | 29 | |
Notes to Financial Statements (continued)
period is estimated to be dividend income, capital gain or return of capital and recorded accordingly. When material these estimates are adjusted periodically when the actual source of distributions is disclosed by the Equity REITs.
Concentration of Risk for REITs: Real estate securities are subject to the same risks as direct investments in real estate and mortgages, and their value will depend on the value of the underlying properties or the underlying loans or interests. The underlying loans may be subject to the risks of default or of prepayments that occur earlier or later than expected, and such loans may also include so-called “subprime” mortgages. The value of these securities will rise and fall in response to many factors, including economic conditions, the demand for rental property and interest rates. In particular, the value of these securities may decline when interest rates rise and will also be affected by the real estate market and by the management of the underlying properties.
In addition, investing in REITs involves certain unique risks in addition to those risks associated with investing in the real estate industry in general. Equity REITs may be affected by changes in the value of the underlying property owned by the REITs, while mortgage REITs may be affected by the quality of any credit extended. REITs are dependent upon management skills, may not be diversified geographically or by property/mortgage asset type, and are subject to heavy cash flow dependency, default by borrowers and self-liquidation. REITs may be more volatile and/or more illiquid than other types of equity securities. REITs (especially mortgage REITs) are subject to interest rate risks. REITs may incur significant amounts of leverage. The Fund will indirectly bear a portion of the expenses, including management fees, paid by each REIT in which it invests, in addition to the expenses of the Fund.
Securities Transactions and Net Investment Income: Securities transactions are recorded on the trade date. Realized gains (losses) from investment and currency transactions are calculated on the specific identification method. Dividend income is recorded on the ex-date. Interest income, including amortization of premium and accretion of discount on debt securities, as required, is recorded on the accrual basis. Expenses are recorded on an accrual basis, which may require the use of certain estimates by management that may differ from actual.
Net investment income or loss (other than distribution fees which are charged directly to the respective class) and unrealized and realized gains (losses) are allocated daily to each class of shares based upon the relative proportion of adjusted net assets of each class at the beginning of the day.
Taxes: It is the Fund’s policy to continue to meet the requirements of the Internal Revenue Code applicable to regulated investment companies and to distribute all of its taxable net
investment income and capital gains, if any, to its shareholders. Therefore, no federal income tax provision is required. Withholding taxes on foreign dividends, interest and capital gains, if any, are recorded, net of reclaimable amounts, at the time the related income is earned.
Dividends and Distributions: The Fund expects to pay dividends from net investment income quarterly. Distributions from net realized capital and currency gains, if any, are declared and paid annually. Dividends and distributions to shareholders, which are determined in accordance with federal income tax regulations and which may differ from generally accepted accounting principles, are recorded on the ex-date. Permanent book/tax differences relating to income and gain(loss) are reclassified amongst undistributed net investment income, accumulated net realized gain (loss) and paid-in capital in excess of par, as appropriate.
Estimates: The preparation of financial statements requires management to make estimates and assumptions that affect the reported amounts and disclosures in the financial statements. Actual results could differ from those estimates.
2. Agreements
The Trust, on behalf of the Fund, has a management agreement with PGIM Investments. Pursuant to this agreement, PGIM Investments has responsibility for all investment advisory services and supervises the subadviser’s performance of such services. PGIM Investments has entered into a subadvisory agreement with Jennison Associates LLC (“Jennison”). The subadvisory agreement provides that Jennison will furnish investment advisory services in connection with the management of the Fund. In connection therewith, Jennison is obligated to keep certain books and records of the Fund. PGIM Investments pays for the services of Jennison, the cost of compensation of officers of the Fund, occupancy and certain clerical and bookkeeping costs of the Fund. The Fund bears all other costs and expenses.
Effective July 1, 2017, the management fee paid to PGIM Investments is accrued daily and payable monthly at an annual rate of .775% of the Fund’s average daily net assets up to and including $1 billion, .755% on the next $2 billion of average daily net assets, .735% on the next $2 billion of average daily net assets, .715% on the next $5 billion of average daily net assets and .705% on the average daily net assets in excess of $10 billion. Prior to July 1, 2017, the management fee paid to PGIM Investments was accrued daily and payable monthly at an annual rate of .775% of the Fund’s average daily net assets. The effective management fee rate, before any waivers and/or expense reimbursement was .775% for the year ended July 31, 2017. The management fee waiver and/or expense reimbursement exceeded the management fee for the year ended July 31, 2017.
PGIM Investments has contractually agreed through November 30, 2018 to limit net annual Fund operating expenses (exclusive of distribution and service (12b-1) fees, taxes (such as income and foreign withholding taxes, stamp duty and deferred tax expenses),
| | | | |
| Prudential Jennison Rising Dividend Fund | | | 31 | |
Notes to Financial Statements (continued)
interest, underlying funds, brokerage, extraordinary and certain other expenses such as dividend, broker charges and interest expense on short sales) of each class of shares of the Fund to .99% of the Fund’s average daily net assets. Expenses waived/reimbursed by the Manager in accordance with this agreement may be recouped by the Manager within the same fiscal year during which such waiver/reimbursement is made if such recoupment can be realized without exceeding the expense limit in effect at the time of the recoupment for that fiscal year.
The Trust, on behalf of the Fund, has a distribution agreement with Prudential Investment Management Services LLC (“PIMS”), which acts as the distributor of the Class A, Class C and Class Z shares of the Fund. The Fund compensates PIMS for distributing and servicing the Fund’s Class A and Class C shares, pursuant to plans of distribution (the “Distribution Plans”), regardless of expenses actually incurred by PIMS. The distribution fees are accrued daily and payable monthly. No distribution or service fees are paid to PIMS as distributor of the Class Z shares of the Fund.
Pursuant to the Distribution Plans, the Fund compensates PIMS for distribution related activities at an annual rate of up to .30% and 1% of the average daily net assets of the Class A and C shares, respectively. PIMS has contractually agreed through November 30, 2018 to reduce its distribution and service (12b-1) fees for Class A shares to .25% of the average daily net assets of the Class A shares.
PIMS has advised the Fund that it received $22,996 in front-end sales charges resulting from sales of Class A shares during the year ended July 31, 2017. From these fees, PIMS paid such sales charges to affiliated broker-dealers, which in turn paid commissions to salespersons and incurred other distribution costs.
PIMS has advised the Fund that for the year ended July 31, 2017, it received $345 in contingent deferred sales charges imposed upon certain redemptions by Class C shareholders.
PGIM Investments, PIMS and Jennison are indirect, wholly-owned subsidiaries of Prudential Financial, Inc. (“Prudential”).
3. Other Transactions with Affiliates
Prudential Mutual Fund Services LLC (“PMFS”), an affiliate of PGIM Investments and an indirect, wholly-owned subsidiary of Prudential, serves as the Fund’s transfer agent. Transfer agent’s fees and expenses in the Statement of Operations include certain out-of-pocket expenses paid to non-affiliates, where applicable.
The Fund may enter into certain securities purchase or sale transactions under Board approved Rule 17a-7 procedures. Rule 17a-7 is an exemptive rule under the 1940 Act, that permits purchase and sale transactions among affiliated investment companies, or between an investment company and a person that is affiliated solely by reason of having a common (or affiliated) investment adviser, common directors, and/or common officers. Such transactions are subject to ratification by the Board. For the period ended July 31, 2017 no such transactions were entered into by the Fund.
The Fund may invest its overnight sweep cash in the Prudential Core Ultra Short Bond Fund (the “Core Fund”), and its securities lending cash collateral in the Prudential Institutional Money Market Fund (the “Money Market Fund”), each a series of the Prudential Investment Portfolios 2, registered under the 1940 Act and managed by PGIM Investments. For the reporting period ended July 31, 2017, PGIM, Inc. was compensated $24 by PGIM Investments for managing the Fund’s securities lending cash collateral as subadviser to the Money Market Fund. Earnings from the Core Fund and Money Market Fund are disclosed on the Statement of Operations as “Affiliated dividend income” and “Income from securities lending, net”, respectively.
4. Portfolio Securities
The aggregate cost of purchases and proceeds from sales of portfolio securities (excluding short-term investments and U.S. Treasury securities) for the year ended July 31, 2017, were $8,151,636 and $7,297,473, respectively.
5. Distributions and Tax Information
Distributions to shareholders, which are determined in accordance with federal income tax regulations and which may differ from generally accepted accounting principles, are recorded on the ex-date. In order to present undistributed net investment income, accumulated net realized loss on investment and foreign currency transactions and paid-in capital in excess of par on the Statement of Assets and Liabilities that more closely represent their tax character, certain adjustments have been made to undistributed net investment income and accumulated net realized loss on investment and foreign currency transactions. For the year ended July 31, 2017, the adjustments were to decrease undistributed net investment income and decrease accumulated net realized loss on investment and foreign currency transactions by $92 due to differences in the treatment for book and tax purposes of certain transactions involving foreign currencies. Net investment income, net realized gain (loss) on investments and foreign currency transactions and net assets were not affected by this change.
For the years ended July 31, 2017 and July 31, 2016, the tax character of dividends paid by the Fund was $144,242 and $118,979 of ordinary income, respectively.
As of July 31, 2017, the accumulated undistributed earnings on a tax basis was $3,721 of ordinary income.
| | | | |
| Prudential Jennison Rising Dividend Fund | | | 33 | |
Notes to Financial Statements (continued)
The United States federal income tax basis of the Fund’s investments and the net unrealized appreciation as of July 31, 2017 were as follows:
| | | | | | |
Tax Basis | | Appreciation | | Depreciation | | Net
Unrealized
Appreciation |
| $10,333,932 | | $2,118,436 | | $(46,988) | | $2,071,448 |
The difference between book basis and tax basis was primarily attributable to deferred losses on wash sales.
For federal income tax purposes, the Fund had a capital loss carryforward as of July 31, 2017 of approximately $74,000 which can be carried forward for an unlimited period. No capital gains distributions are expected to be paid to shareholders until net gains have been realized in excess of such losses.
Management has analyzed the Fund’s tax positions taken on federal, state and local income tax returns for all open tax years and has concluded that no provision for income tax is required in the Fund’s financial statements for the current reporting period. The Fund’s federal, state and local income and federal excise tax returns for tax years for which the applicable statutes of limitations have not expired are subject to examination by the Internal Revenue Service and state departments of revenue.
6. Capital
The Fund offers Class A, Class C, and Class Z shares. Class A shares are sold with a maximum front-end sales charge of up to 5.50%. Investors who purchase $1 million or more of Class A shares and redeem those shares within 12 months of purchase are subject to a contingent deferred sales charge (“CDSC”) of 1%, but are not subject to an initial sales charge. The Class A CDSC is waived for purchases by certain retirement or benefit plans. Class C shares are sold with a CDSC of 1% for shares redeemed within 12 months of purchase. A special exchange privilege is also available for shareholders who qualify to purchase Class A shares at net asset value. Class Z shares are not subject to any sales or redemption charge and are offered exclusively for sale to a limited group of investors.
Under certain circumstances, an exchange may be made from specified share classes of the Fund to one or more other share classes of the Fund as presented in the table of transactions in shares of beneficial interest.
There is an unlimited number of shares of beneficial interest at $.001 par value of share.
As of July 31, 2017, Prudential owned 1,016 and 526,052 Class C and Z shares of the Fund, respectively. At reporting period end, three shareholders of record held 73% of the Fund’s outstanding shares on behalf of multiple beneficial owners, of which 53% were held by an affiliate of Prudential.
Transactions in shares of beneficial interest were as follows:
| | | | | | | | |
Class A | | Shares | | | Amount | |
Year ended July 31, 2017: | | | | | | | | |
Shares sold | | | 145,744 | | | $ | 1,703,412 | |
Shares issued in reinvestment of dividends and distributions | | | 3,063 | | | | 35,852 | |
Shares reacquired | | | (102,095 | ) | | | (1,150,601 | ) |
| | | | | | | | |
Net increase (decrease) in shares outstanding before conversion | | | 46,712 | | | | 588,663 | |
Shares issued upon conversion from other share class(es) | | | 132 | | | | 1,591 | |
Shares reacquired upon conversion into other share class(es) | | | (14,027 | ) | | | (162,683 | ) |
| | | | | | | | |
Net increase (decrease) in shares outstanding | | | 32,817 | | | $ | 427,571 | |
| | | | | | | | |
Year ended July 31, 2016: | | | | | | | | |
Shares sold | | | 186,585 | | | $ | 1,987,505 | |
Shares issued in reinvestment of dividends and distributions | | | 2,229 | | | | 23,809 | |
Shares reacquired† | | | (35,588 | ) | | | (373,469 | ) |
| | | | | | | | |
Net increase (decrease) in shares outstanding before conversion | | | 153,226 | | | | 1,637,845 | |
Shares reacquired upon conversion into other share class(es) | | | (4,168 | ) | | | (42,362 | ) |
| | | | | | | | |
Net increase (decrease) in shares outstanding | | | 149,058 | | | $ | 1,595,483 | |
| | | | | | | | |
Class C | | | | | | |
Year ended July 31, 2017: | | | | | | | | |
Shares sold | | | 49,504 | | | $ | 580,091 | |
Shares issued in reinvestment of dividends and distributions | | | 611 | | | | 7,173 | |
Shares reacquired | | | (40,310 | ) | | | (464,159 | ) |
| | | | | | | | |
Net increase (decrease) in shares outstanding before conversion | | | 9,805 | | | | 123,105 | |
Shares reacquired upon conversion into other share class(es) | | | (5,377 | ) | | | (60,156 | ) |
| | | | | | | | |
Net increase (decrease) in shares outstanding | | | 4,428 | | | $ | 62,949 | |
| | | | | | | | |
Year ended July 31, 2016: | | | | | | | | |
Shares sold | | | 138,100 | | | $ | 1,488,575 | |
Shares issued in reinvestment of dividends and distributions | | | 664 | | | | 7,104 | |
Shares reacquired | | | (46,866 | ) | | | (503,286 | ) |
| | | | | | | | |
Net increase (decrease) in shares outstanding before conversion | | | 91,898 | | | | 992,393 | |
Shares reacquired upon conversion into other share class(es) | | | (5,139 | ) | | | (54,677 | ) |
| | | | | | | | |
Net increase (decrease) in shares outstanding | | | 86,759 | | | $ | 937,716 | |
| | | | | | | | |
| | | | |
| Prudential Jennison Rising Dividend Fund | | | 35 | |
Notes to Financial Statements (continued)
| | | | | | | | |
Class Z | | Shares | | | Amount | |
Year ended July 31, 2017: | | | | | | | | |
Shares sold | | | 9,966 | | | $ | 114,961 | |
Shares issued in reinvestment of dividends and distributions | | | 8,578 | | | | 100,464 | |
Shares reacquired | | | (11,146 | ) | | | (127,508 | ) |
| | | | | | | | |
Net increase (decrease) in shares outstanding before conversion | | | 7,398 | | | | 87,917 | |
Shares issued upon conversion from other share class(es) | | | 19,251 | | | | 221,248 | |
| | | | | | | | |
Net increase (decrease) in shares outstanding | | | 26,649 | | | $ | 309,165 | |
| | | | | | | | |
Year ended July 31, 2016: | | | | | | | | |
Shares sold | | | 13,610 | | | $ | 145,359 | |
Shares issued in reinvestment of dividends and distributions | | | 8,256 | | | | 87,951 | |
Shares reacquired | | | (19,201 | ) | | | (203,280 | ) |
| | | | | | | | |
Net increase (decrease) in shares outstanding before conversion | | | 2,665 | | | | 30,030 | |
Shares issued upon conversion from other share class(es) | | | 9,291 | | | | 97,039 | |
| | | | | | | | |
Net increase (decrease) in shares outstanding | | | 11,956 | | | $ | 127,069 | |
| | | | | | | | |
| † | Includes affiliated redemption of 1,018 shares with a value of $11,037 for Class A shares. |
7. Borrowings
The Trust, on behalf of the Fund, along with other affiliated registered investment companies (the “Funds”), is a party to a Syndicated Credit Agreement (“SCA”) with a group of banks. The purpose of the SCA is to provide an alternative source of temporary funding for capital share redemptions. The SCA provides for a commitment of $900 million for the period October 6, 2016 through October 5, 2017. The Funds pay an annualized commitment fee of .15% of the unused portion of the SCA. The Fund’s portion of the commitment fee for the unused amount, allocated based upon a method approved by the Board, is accrued daily and paid quarterly. The interest on borrowings under the SCA is paid monthly and at a per annum interest rate based upon a contractual spread plus the higher of (1) the effective federal funds rate, (2) the 1-month LIBOR rate or (3) zero percent.
Other affiliated registered investment companies that are parties to the SCA include portfolios that are subject to a predetermined mathematical formula used to manage certain benefit guarantees offered under variable annuity contracts. The formula may result in large scale asset flows into and out of the portfolios. Consequently, the portfolios may be more likely to utilize the SCA for purposes of funding redemptions. It may be possible for those portfolios to fully exhaust the committed amount of the SCA, thereby requiring the Manager to allocate available funding per a Board-approved methodology designed to treat the Funds in the SCA equitably.
The Fund utilized the SCA during the year ended July 31, 2017. The average daily balance for the 3 days that the Fund had loans outstanding during the period was $206,000
borrowed at a weighted average interest rate of 1.79%. The maximum loan balance outstanding during the period was $206,000. At July 31, 2017, the Fund did not have an outstanding loan balance.
8. Recent Accounting Pronouncements and Reporting Updates
On October 13, 2016, the Securities and Exchange Commission (the “SEC”) adopted new rules and forms and amended existing rules and forms which are intended to modernize and enhance the reporting and disclosure of information by registered investment companies and to improve the quality of information that funds provide to investors, including modifications to Regulation S-X which would require standardized, enhanced disclosure about derivatives in investment company financial statements. The compliance dates of the modifications to Regulation S-X are August 1, 2017 and other amendments and rules are generally June 1, 2018 and December 1, 2018. Management is currently evaluating the impacts to the financial statement disclosures.
9. Other
At the Trust’s Board meeting in March, 2017, the Board of Trustees approved a change in the methodology of allocating certain expenses, like Transfer Agent fees (including sub-transfer agent and networking fees) and Blue Sky fees. PGIM Investments implemented the changes effective August 1, 2017.
| | | | |
| Prudential Jennison Rising Dividend Fund | | | 37 | |
Financial Highlights
| | | | | | | | | | | | | | | | | | | | | | | | | | | | |
| Class A Shares | |
| | | Year Ended
July 31, 2017(c) | | | | | | Year Ended
July 31, 2016(c) | | | | | | Year Ended
July 31, 2015 | | | | | | March 5, 2014(b)
through
July 31, 2014(c) | |
| Per Share Operating Performance: | | | | | | | | | | | | | | | | | | | | | | | | | | | | |
| Net Asset Value, Beginning of Period | | | $11.37 | | | | | | | | $11.33 | | | | | | | | $10.34 | | | | | | | | $10.00 | |
| Income (loss) from investment operations: | | | | | | | | | | | | | | | | | | | | | | | | | | | | |
| Net investment income (loss) | | | .14 | | | | | | | | .13 | | | | | | | | .10 | | | | | | | | .04 | |
| Net realized and unrealized gain (loss) on investments | | | 1.14 | | | | | | | | .04 | | | | | | | | 1.03 | | | | | | | | .33 | |
| Total from investment operations | | | 1.28 | | | | | | | | .17 | | | | | | | | 1.13 | | | | | | | | .37 | |
| Less Dividends and Distributions: | | | | | | | | | | | | | | | | | | | | | | | | | | | | |
| Dividends from net investment income | | | (.15 | ) | | | | | | | (.13 | ) | | | | | | | (.11 | ) | | | | | | | (.03 | ) |
| Distributions from net realized gains on investments | | | - | | | | | | | | - | | | | | | | | (.03 | ) | | | | | | | - | |
| Total dividends and distributions | | | (.15 | ) | | | | | | | (.13 | ) | | | | | | | (.14 | ) | | | | | | | (.03 | ) |
| Net Asset Value, end of period | | | $12.50 | | | | | | | | $11.37 | | | | | | | | $11.33 | | | | | | | | $10.34 | |
| Total Return(a): | | | 11.32% | | | | | | | | 1.61% | | | | | | | | 11.03% | | | | | | | | 3.66% | |
| | | | | | | | | | | | | | | | | | | | | | | | | | | | |
| Ratios/Supplemental Data: | |
| Net assets, end of period (000) | | | $3,474 | | | | | | | | $2,785 | | | | | | | | $1,087 | | | | | | | | $383 | |
| Average net assets (000) | | | $2,912 | | | | | | | | $1,831 | | | | | | | | $822 | | | | | | | | $192 | |
| Ratios to average net assets(d): | | | | | | | | | | | | | | | | | | | | | | | | | | | | |
| Expenses after waivers and/or expense reimbursement | | | 1.24% | | | | | | | | 1.24% | | | | | | | | 1.24% | | | | | | | | 1.24% | (e) |
| Expenses before waivers and/or expense reimbursement | | | 2.65% | | | | | | | | 3.38% | | | | | | | | 3.54% | | | | | | | | 8.18% | (e) |
| Net investment income (loss) | | | 1.22% | | | | | | | | 1.24% | | | | | | | | 1.09% | | | | | | | | .85% | (e) |
| Portfolio turnover rate | | | 67% | | | | | | | | 51% | | | | | | | | 45% | | | | | | | | 9% | (f) |
| (a) | Total return does not consider the effect of sales loads. Total return is calculated assuming a purchase of a share on the first day and a sale on the last day of each period reported, and includes reinvestment of dividends and distributions, if any. Total returns may reflect adjustments to conform to generally accepted accounting principles. Total returns for periods less than one full year are not annualized. |
| (b) | Commencement of operations. |
| (c) | Calculated based on the average shares outstanding during the period. |
| (d) | Does not include expenses of the underlying portfolio in which the Fund invests. |
See Notes to Financial Statements.
| | | | | | | | | | | | | | | | | | | | | | | | | | | | |
| Class C Shares | |
| | | Year Ended
July 31, 2017(c) | | | | | | Year Ended July 31, 2016(c) | | | | | | Year Ended July 31, 2015 | | | | | | March 5, 2014(b)
through
July 31, 2014(c) | |
| Per Share Operating Performance: | | | | | | | | | | | | | | | | | | | | | | | | | | | | |
| Net Asset Value, Beginning of Period | | | $11.36 | | | | | | | | $11.32 | | | | | | | | $10.33 | | | | | | | | $10.00 | |
| Income (loss) from investment operations: | | | | | | | | | | | | | | | | | | | | | | | | | | | | |
| Net investment income (loss) | | | .06 | | | | | | | | .06 | | | | | | | | .02 | | | | | | | | - | (g) |
| Net realized and unrealized gain (loss) on investments | | | 1.14 | | | | | | | | .03 | | | | | | | | 1.03 | | | | | | | | .33 | |
| Total from investment operations | | | 1.20 | | | | | | | | .09 | | | | | | | | 1.05 | | | | | | | | .33 | |
| Less Dividends and Distributions: | | | | | | | | | | | | | | | | | | | | | | | | | | | | |
| Dividends from net investment income | | | (.06 | ) | | | | | | | (.05 | ) | | | | | | | (.03 | ) | | | | | | | - | (g) |
| Distributions from net realized gains on investments | | | - | | | | | | | | - | | | | | | | | (.03 | ) | | | | | | | - | |
| Total dividends and distributions | | | (.06 | ) | | | | | | | (.05 | ) | | | | | | | (.06 | ) | | | | | | | - | (g) |
| Net Asset Value, end of period | | | $12.50 | | | | | | | | $11.36 | | | | | | | | $11.32 | | | | | | | | $10.33 | |
| Total Return(a): | | | 10.59% | | | | | | | | .85% | | | | | | | | 10.23% | | | | | | | | 3.35% | |
| | | | | | | | | | | | | | | | | | | | | | | | | | | | |
| Ratios/Supplemental Data: | |
| Net assets, end of period (000) | | | $1,608 | | | | | | | | $1,411 | | | | | | | | $423 | | | | | | | | $33 | |
| Average net assets (000) | | | $1,401 | | | | | | | | $1,160 | | | | | | | | $188 | | | | | | | | $16 | |
| Ratios to average net assets(d): | | | | | | | | | | | | | | | | | | | | | | | | | | | | |
| Expenses after waivers and/or expense reimbursement | | | 1.99% | | | | | | | | 1.99% | | | | | | | | 1.99% | | | | | | | | 1.99% | (e) |
| Expenses before waivers and/or expense reimbursement | | | 3.36% | | | | | | | | 4.02% | | | | | | | | 4.16% | | | | | | | | 8.95% | (e) |
| Net investment income (loss) | | | .48% | | | | | | | | .56% | | | | | | | | .32% | | | | | | | | .08% | (e) |
| Portfolio turnover rate | | | 67% | | | | | | | | 51% | | | | | | | | 45% | | | | | | | | 9% | (f) |
| (a) | Total return does not consider the effect of sales loads. Total return is calculated assuming a purchase of a share on the first day and a sale on the last day of each period reported, and includes reinvestment of dividends and distributions, if any. Total returns may reflect adjustments to conform to generally accepted accounting principles. Total returns for periods less than one full year are not annualized. |
| (b) | Commencement of operations. |
| (c) | Calculated based on the average shares outstanding during the period. |
| (d) | Does not include expenses of the underlying portfolio in which the Fund invests. |
See Notes to Financial Statements.
| | | | |
| Prudential Jennison Rising Dividend Fund | | | 39 | |
Financial Highlights (continued)
| | | | | | | | | | | | | | | | | | | | | | | | | | | | |
| Class Z Shares | |
| | | Year Ended
July 31, 2017(c) | | | | | | Year Ended July 31, 2016(c) | | | | | | Year Ended July 31, 2015 | | | | | | March 5, 2014(b)
through
July 31, 2014(c) | |
| Per Share Operating Performance: | | | | | | | | | | | | | | | | | | | | | | | | | | | | |
| Net Asset Value, Beginning of Period | | | $11.38 | | | | | | | | $11.33 | | | | | | | | $10.35 | | | | | | | | $10.00 | |
| Income (loss) from investment operations: | | | | | | | | | | | | | | | | | | | | | | | | | | | | |
| Net investment income (loss) | | | .17 | | | | | | | | .16 | | | | | | | | .14 | | | | | | | | .05 | |
| Net realized and unrealized gain (loss) on investments | | | 1.15 | | | | | | | | .05 | | | | | | | | 1.01 | | | | | | | | .33 | |
| Total from investment operations | | | 1.32 | | | | | | | | .21 | | | | | | | | 1.15 | | | | | | | | .38 | |
| Less Dividends and Distributions: | | | | | | | | | | | | | | | | | | | | | | | | | | | | |
| Dividends from net investment income | | | (.18 | ) | | | | | | | (.16 | ) | | | | | | | (.14 | ) | | | | | | | (.03 | ) |
| Distributions from net realized gains on investments | | | - | | | | | | | | - | | | | | | | | (.03 | ) | | | | | | | - | |
| Total dividends and distributions | | | (.18 | ) | | | | | | | (.16 | ) | | | | | | | (.17 | ) | | | | | | | (.03 | ) |
| Net Asset Value, end of period | | | $12.52 | | | | | | | | $11.38 | | | | | | | | $11.33 | | | | | | | | $10.35 | |
| Total Return(a): | | | 11.68% | | | | | | | | 1.95% | | | | | | | | 11.19% | | | | | | | | 3.84% | |
| | | | | | | | | | | | | | | | | | | | | | | | | | | | |
| Ratios/Supplemental Data: | |
| Net assets, end of period (000) | | | $7,319 | | | | | | | | $6,349 | | | | | | | | $6,190 | | | | | | | | $5,299 | |
| Average net assets (000) | | | $6,704 | | | | | | | | $5,935 | | | | | | | | $5,953 | | | | | | | | $5,133 | |
| Ratios to average net assets(d): | | | | | | | | | | | | | | | | | | | | | | | | | | | | |
| Expenses after waivers and/or expense reimbursement | | | .99% | | | | | | | | .99% | | | | | | | | .99% | | | | | | | | .99% | (e) |
| Expenses before waivers and/or expense reimbursement | | | 2.36% | | | | | | | | 3.08% | | | | | | | | 3.31% | | | | | | | | 8.04% | (e) |
| Net investment income (loss) | | | 1.48% | | | | | | | | 1.49% | | | | | | | | 1.33% | | | | | | | | 1.09% | (e) |
| Portfolio turnover rate | | | 67% | | | | | | | | 51% | | | | | | | | 45% | | | | | | | | 9% | (f) |
| (a) | Total return is calculated assuming a purchase of a share on the first day and a sale on the last day of each period reported, and includes reinvestment of dividends and distributions, if any. Total returns may reflect adjustments to conform to generally accepted accounting principles. Total returns for periods less than one full year are not annualized. |
| (b) | Commencement of operations. |
| (c) | Calculated based on the average shares outstanding during the period. |
| (d) | Does not include expenses of the underlying portfolio in which the Fund invests. |
See Notes to Financial Statements.
Report of Independent Registered Public
Accounting Firm
The Board of Trustees and Shareholders
Prudential Investment Portfolios 5:
We have audited the accompanying statement of assets and liabilities of Prudential Jennison Rising Dividend Fund (the “Fund”), a series of Prudential Investment Portfolio 5, including the portfolio of investments, as of July 31, 2017, and the related statement of operations for the year then ended, the statements of changes in net assets for each of the years in the two-year period then ended, and the financial highlights for each of the years in the three-year period then ended and the period from March 5, 2014 (commencement of operations) to July 31, 2014. These financial statements and financial highlights are the responsibility of the Fund’s management. Our responsibility is to express an opinion on these financial statements and financial highlights based on our audits.
We conducted our audits in accordance with the standards of the Public Company Accounting Oversight Board (United States). Those standards require that we plan and perform the audit to obtain reasonable assurance about whether the financial statements and financial highlights are free of material misstatement. An audit includes examining, on a test basis, evidence supporting the amounts and disclosures in the financial statements. Our procedures included confirmation of securities owned as of July 31, 2017, by correspondence with the custodian, transfer agent and brokers or by other appropriate auditing procedures when replies from brokers were not received. An audit also includes assessing the accounting principles used and significant estimates made by management, as well as evaluating the overall financial statement presentation. We believe that our audits provide a reasonable basis for our opinion.
In our opinion, the financial statements and financial highlights referred to above present fairly, in all material respects, the financial position of the Fund as of July 31, 2017, and the results of its operations, changes in its net assets, and the financial highlights for the periods described in the first paragraph above, in conformity with U.S. generally accepted accounting principles.

New York, New York
September 18, 2017
| | | | |
| Prudential Jennison Rising Dividend Fund | | | 41 | |
Tax Information (unaudited)
For the year ended July 31, 2017, the Fund reports the maximum amount allowable under Section 854 of the Internal Revenue Code, but not less than, the following percentages of the ordinary income dividends paid as: 1) qualified dividend income (QDI); and 2) eligible for corporate dividends received deduction (DRD):
| | | | | | | | |
| | | QDI | | | DRD | |
Prudential Jennison Rising Dividend Fund | | | 100.00 | % | | | 100.00 | % |
In January 2018, you will be advised on IRS Form 1099-DIV or substitute 1099-DIV as to the federal tax status of the distributions received by you in calendar year 2017.
INFORMATION ABOUT BOARD MEMBERS AND OFFICERS
(Unaudited)
Information about Board Members and Officers of the Fund is set forth below. Board Members who are not deemed to be “interested persons” of the Fund, as defined in the 1940 Act, are referred to as “Independent Board Members.” Board Members who are deemed to be “interested persons” of the Fund are referred to as “Interested Board Members.” The Board Members are responsible for the overall supervision of the operations of the Fund and perform the various duties imposed on the directors of investment companies by the 1940 Act. The Board in turn elects the Officers, who are responsible for administering the day-to-day operations of the Fund.
| | | | |
| Independent Board Members(1) |
Name, Address, Age Position(s) Portfolios Overseen | | Principal Occupation(s) During Past Five Years | | Other Directorships Held During Past Five Years |
Ellen S. Alberding (59) Board Member Portfolios Overseen: 87 | | President and Board Member, The Joyce Foundation (charitable foundation) (since 2002); Vice Chair, City Colleges of Chicago (community college system) (since 2011); Trustee, Skills for America’s Future (national initiative to connect employers to community colleges) (since 2011); Trustee, National Park Foundation (charitable foundation for national park system) (since 2009); Trustee, Economic Club of Chicago (since 2009). | | None. |
Kevin J. Bannon (65) Board Member Portfolios Overseen: 87 | | Retired; Managing Director (April 2008-May 2015) and Chief Investment Officer (October 2008-November 2013) of Highmount Capital LLC (registered investment adviser); formerly Executive Vice President and Chief Investment Officer (April 1993-August 2007) of Bank of New York Company; President (May 2003-May 2007) of BNY Hamilton Family of Mutual Funds. | | Director of Urstadt Biddle Properties (equity real estate investment trust) (since September 2008). |
Linda W. Bynoe (65) Board Member Portfolios Overseen: 87 | | President and Chief Executive Officer (since March 1995) and formerly Chief Operating Officer (December 1989-February 1995) of Telemat Ltd. (management consulting); formerly Vice President (January 1985-June 1989) at Morgan Stanley & Co. (broker-dealer). | | Director of Simon Property Group, Inc. (retail real estate) (May 2003-May 2012); Director of Anixter International, Inc. (communication products distributor) (since January 2006); Director of Northern Trust Corporation (financial services) (since April 2006); Trustee of Equity Residential (residential real estate) (since December 2009). |
Prudential Jennison Rising Dividend Fund
| | | | |
| Independent Board Members(1) |
Name, Address, Age Position(s) Portfolios Overseen | | Principal Occupation(s) During Past Five Years | | Other Directorships Held During Past Five Years |
Barry H. Evans (56)± Board Member Portfolios Overseen: 87 | | Retired; Formerly President (2005–2016), Global Chief Operating Officer (2014–2016), Chief Investment Officer – Global Head of Fixed Income (1998-2014), and various portfolio manager roles (1986-2006), Manulife Asset Management U.S. | | Director, Manulife Trust Company (2011- present); Director, Manulife Asset Management Limited (2015-present); Formerly Chairman of the Board of Directors of Manulife Asset Management U.S. (2005-2016); Formerly Chairman of the Board, Declaration Investment Management and Research (2008-2016) |
Keith F. Hartstein (60) Board Member & Independent Chair Portfolios Overseen: 87 | | Retired; Member (since November 2014) of the Governing Council of the Independent Directors Council (organization of independent mutual fund directors); formerly President and Chief Executive Officer (2005-2012), Senior Vice President (2004-2005), Senior Vice President of Sales and Marketing (1997-2004), and various executive management positions (1990-1997), John Hancock Funds, LLC (asset management); Chairman, Investment Company Institute’s Sales Force Marketing Committee (2003-2008). | | None. |
Laurie Simon Hodrick (55)± Board Member Portfolios Overseen: 87 | | A. Barton Hepburn Professor of Economics in the Faculty of Business, Columbia Business School (since 1996); Visiting Professor of Law and Rock Center for Corporate Governance Fellow, Stanford Law School (since 2015); Visiting Fellow, Hoover Institution, Stanford University (since 2015); Sole Member, ReidCourt LLC (since 2008) (a consulting firm); Formerly Managing Director, Global Head of Alternative Investment Strategies, Deutsche Bank (2006-2008); Formerly Director/Trustee, Merrill Lynch Investment Managers Funds (1999-2006) | | Independent Director, Corporate Capital Trust (since April 2017) (a business development company) |
Michael S. Hyland, CFA (71) Board Member Portfolios Overseen: 87 | | Retired (since February 2005); formerly Senior Managing Director (July 2001-February 2005) of Bear Stearns & Co, Inc.; Global Partner, INVESCO (1999-2001); Managing Director and President of Salomon Brothers Asset Management (1989-1999). | | None. |
Visit our website at pgiminvestments.com
| | | | |
| Independent Board Members(1) |
Name, Address, Age Position(s) Portfolios Overseen | | Principal Occupation(s) During Past Five Years | | Other Directorships Held During Past Five Years |
Richard A. Redeker (74) Board Member & Independent Vice Chair Portfolios Overseen: 87 | | Retired Mutual Fund Senior Executive (47 years); Management Consultant; Director, Mutual Fund Directors Forum (since 2014); Independent Directors Council (organization of independent mutual fund directors)-Executive Committee, Chair of Policy Steering Committee, Governing Council. | | None. |
Stephen G. Stoneburn (74) Board Member Portfolios Overseen: 87 | | Chairman (since July 2011), President and Chief Executive Officer (since June 1996) of Frontline Medical Communications (publishing company); formerly President (June 1995-June 1996) of Argus Integrated Media, Inc.; Senior Vice President and Managing Director (January 1993-1995) of Cowles Business Media; Senior Vice President of Fairchild Publications, Inc. (1975-1989). | | None. |
| ± | Mr. Evans and Ms. Hodrick joined the Board effective as of September 1, 2017. |
| | | | |
| Interested Board Members(1) |
Name, Address, Age Position(s) Portfolios Overseen | | Principal Occupation(s) During Past Five Years | | Other Directorships Held During Past Five Years |
Stuart S. Parker (54) Board Member & President Portfolios Overseen: 87 | | President of PGIM Investments LLC (formerly known as Prudential Investments LLC) (since January 2012); Executive Vice President of Prudential Investment Management Services LLC (since December 2012); Executive Vice President of Jennison Associates LLC and Head of Retail Distribution of PGIM Investments LLC (June 2005-December 2011). | | None. |
Prudential Jennison Rising Dividend Fund
| | | | |
| Interested Board Members(1) |
Name, Address, Age Position(s) Portfolios Overseen | | Principal Occupation(s) During Past Five Years | | Other Directorships Held During Past Five Years |
Scott E. Benjamin (44) Board Member & Vice President Portfolios Overseen: 87 | | Executive Vice President (since June 2009) of PGIM Investments LLC; Executive Vice President (June 2009-June 2012) and Vice President (since June 2012) of Prudential Investment Management Services LLC; Executive Vice President (since September 2009) of AST Investment Services, Inc.; Senior Vice President of Product Development and Marketing, PGIM Investments (since February 2006); Vice President of Product Development and Product Management, Prudential Investments (2003-2006). | | None. |
Grace C. Torres* (58) Board Member Portfolios Overseen: 86 | | Retired; formerly Treasurer and Principal Financial and Accounting Officer of the Prudential Funds, Target Funds, Advanced Series Trust, Prudential Variable Contract Accounts and The Prudential Series Fund (1998-June 2014); Assistant Treasurer (March 1999-June 2014) and Senior Vice President (September 1999-June 2014) of PGIM Investments LLC; Assistant Treasurer (May 2003-June 2014) and Vice President (June 2005-June 2014) of AST Investment Services, Inc.; Senior Vice President and Assistant Treasurer (May 2003-June 2014) of Prudential Annuities Advisory Services, Inc. | | Director (since July 2015) of Sun Bancorp, Inc. N.A. and Sun National Bank |
| * | Note: Prior to her retirement in 2014, Ms. Torres was employed by PGIM Investments LLC. Due to her prior employment, she is considered to be an “interested person” under the 1940 Act. Ms. Torres is a Non-Management Interested Board Member. |
| (1) | The year that each Board Member joined the Board is as follows: |
Ellen S. Alberding, 2013; Kevin J. Bannon, 2008; Linda W. Bynoe, 2005; Barry H. Evans, 2017; Keith F. Hartstein, 2013; Laurie Simon Hodrick, 2017; Michael S. Hyland, 2008; Richard A. Redeker, 2003; Stephen G. Stoneburn, 1999; Grace C. Torres, 2014; Stuart S. Parker, Board Member and President since 2012; Scott E. Benjamin, Board Member since 2010 and Vice President since 2009.
Visit our website at pgiminvestments.com
| | | | |
| Fund Officers(a) |
Name, Address and Age Position with Fund | | Principal Occupation(s) During Past Five Years | | Length of
Service as Fund
Officer |
Raymond A. O’Hara (62) Chief Legal Officer | | Vice President and Corporate Counsel (since July 2010) of Prudential Insurance Company of America (Prudential); Vice President (March 2011-Present) of Pruco Life Insurance Company and Pruco Life Insurance Company of New Jersey; Vice President and Corporate Counsel (March 2011-Present) of Prudential Annuities Life Assurance Corporation; Chief Legal Officer of PGIM Investments LLC (since June 2012); Chief Legal Officer of Prudential Mutual Fund Services LLC (since June 2012) and Corporate Counsel of AST Investment Services, Inc. (since June 2012); formerly Assistant Vice President and Corporate Counsel (September 2008-July 2010) of The Hartford Financial Services Group, Inc.; formerly Associate (September 1980-December 1987) and Partner (January 1988–August 2008) of Blazzard & Hasenauer, P.C. (formerly, Blazzard, Grodd & Hasenauer, P.C.). | | Since 2012 |
Chad A. Earnst (42) Chief Compliance Officer | | Chief Compliance Officer (September 2014-Present) of PGIM Investments LLC; Chief Compliance Officer (September 2014-Present) of the Prudential Funds, Target Funds, Advanced Series Trust, The Prudential Series Fund, Prudential’s Gibraltar Fund, Inc., Prudential Global Short Duration High Yield Income Fund, Inc., Prudential Short Duration High Yield Fund, Inc. and Prudential Jennison MLP Income Fund, Inc.; formerly Assistant Director (March 2010-August 2014) of the Asset Management Unit, Division of Enforcement, US Securities & Exchange Commission; Assistant Regional Director (January 2010-August 2014), Branch Chief (June 2006–December 2009) and Senior Counsel (April 2003-May 2006) of the Miami Regional Office, Division of Enforcement, US Securities & Exchange Commission. | | Since 2014 |
Deborah A. Docs (59) Secretary | | Vice President and Corporate Counsel (since January 2001) of Prudential; Vice President (since December 1996) and Assistant Secretary (since March 1999) of PGIM Investments LLC; formerly Vice President and Assistant Secretary (May 2003-June 2005) of AST Investment Services, Inc. | | Since 2004 |
Jonathan D. Shain (59) Assistant Secretary | | Vice President and Corporate Counsel (since August 1998) of Prudential; Vice President and Assistant Secretary (since May 2001) of PGIM Investments LLC; Vice President and Assistant Secretary (since February 2001) of Prudential Mutual Fund Services LLC; formerly Vice President and Assistant Secretary (May 2003-June 2005) of AST Investment Services, Inc. | | Since 2005 |
Claudia DiGiacomo (42) Assistant Secretary | | Vice President and Corporate Counsel (since January 2005) of Prudential; Vice President and Assistant Secretary of PGIM Investments LLC (since December 2005); Associate at Sidley Austin Brown & Wood LLP (1999-2004). | | Since 2005 |
Prudential Jennison Rising Dividend Fund
| | | | |
| Fund Officers(a) |
Name, Address and Age Position with Fund | | Principal Occupation(s) During Past Five Years | | Length of Service as Fund Officer |
Andrew R. French (54) Assistant Secretary | | Vice President and Corporate Counsel (since February 2010) of Prudential; formerly Director and Corporate Counsel (2006-2010) of Prudential; Vice President and Assistant Secretary (since January 2007) of PGIM Investments LLC; Vice President and Assistant Secretary (since January 2007) of Prudential Mutual Fund Services LLC. | | Since 2006 |
Charles H. Smith (44) Anti-Money Laundering Compliance Officer | | Vice President, Corporate Compliance, Anti-Money Laundering Unit (since January 2015) of Prudential; committee member of the American Council of Life Insurers Anti-Money Laundering and Critical Infrastructure Committee (since January 2016); formerly Global Head of Economic Sanctions Compliance at AIG Property Casualty (February 2007–December 2014); Assistant Attorney General at the New York State Attorney General’s Office, Division of Public Advocacy. (August 1998—January 2007). | | Since 2016 |
M. Sadiq Peshimam (53) Treasurer and Principal Financial and Accounting Officer | | Vice President (since 2005) of PGIM Investments LLC; formerly Assistant Treasurer of funds in the Prudential Mutual Fund Complex (2006-2014). | | Since 2006 |
Peter Parrella (59) Assistant Treasurer | | Vice President (since 2007) and Director (2004-2007) within Prudential Mutual Fund Administration; formerly Tax Manager at SSB Citi Fund Management LLC (1997-2004). | | Since 2007 |
Lana Lomuti (50) Assistant Treasurer | | Vice President (since 2007) and Director (2005-2007), within Prudential Mutual Fund Administration; formerly Assistant Treasurer (December 2007-February 2014) of The Greater China Fund, Inc. | | Since 2014 |
Linda McMullin (56) Assistant Treasurer | | Vice President (since 2011) and Director (2008-2011) within Prudential Mutual Fund Administration. | | Since 2014 |
Kelly A. Coyne (49) Assistant Treasurer | | Director, Investment Operations of Prudential Mutual Fund Services LLC (since 2010). | | Since 2015 |
| (a) | Excludes Mr. Parker and Mr. Benjamin, interested Board Members who also serve as President and Vice President, respectively. |
Explanatory Notes to Tables:
| • | | Board Members are deemed to be “Interested,” as defined in the 1940 Act, by reason of their affiliation with PGIM Investments LLC and/or an affiliate of PGIM Investments LLC. |
| • | | Unless otherwise noted, the address of all Board Members and Officers is c/o PGIM Investments LLC, 655 Broad Street, Newark, New Jersey 07102-4410. |
| • | | There is no set term of office for Board Members or Officers. The Board Members have adopted a retirement policy, which calls for the retirement of Board Members on December 31 of the year in which they reach the age of 75. |
| • | | “Other Directorships Held” includes only directorships of companies required to register or file reports with the SEC under the 1934 Act (that is, “public companies”) or other investment companies registered under the 1940 Act. |
| • | | “Portfolios Overseen” includes all investment companies managed by PGIM Investments LLC. The investment companies for which PGIM Investments LLC serves as manager include the Prudential Mutual Funds, The Prudential Variable Contract Accounts, Target Mutual Funds, Prudential Short Duration High Yield Fund, Inc., Prudential Global Short Duration High Yield Fund, Inc., The Prudential Series Fund, Prudential’s Gibraltar Fund, Inc. and the Advanced Series Trust. |
Visit our website at pgiminvestments.com
Approval of Advisory Agreements
The Fund’s Board of Trustees
The Board of Trustees (the “Board”) of Prudential Jennison Rising Dividend Fund (the “Fund”)1 consists of twelve individuals, nine of whom are not “interested persons” of the Fund, as defined in the Investment Company Act of 1940, as amended (the “1940 Act”) (the “Independent Trustees”). The Board is responsible for the oversight of the Fund and its operations, and performs the various duties imposed on the directors of investment companies by the 1940 Act. The Independent Trustees have retained independent legal counsel to assist them in connection with their duties. The Chair of the Board is an Independent Trustee. The Board has established four standing committees: the Audit Committee, the Nominating and Governance Committee, and two Investment Committees. Each committee is chaired by, and composed of, Independent Trustees.
Annual Approval of the Fund’s Advisory Agreements
As required under the 1940 Act, the Board determines annually whether to renew the Fund’s management agreement with PGIM Investments LLC (“PGIM Investments”) and the Fund’s subadvisory agreement with Jennison Associates LLC (“Jennison”). In considering the renewal of the agreements, the Board, including all of the Independent Trustees2, met on June 6-8, 2017 and approved the renewal of the agreements through July 31, 2018, after concluding that the renewal of the agreements was in the best interests of the Fund and its shareholders.
In advance of the meetings, the Board requested and received materials relating to the agreements, and had the opportunity to ask questions and request further information in connection with its consideration. Among other things, the Board considered comparative fee information from PGIM Investments and Jennison. Also, the Board considered comparisons with other mutual funds in relevant Peer Universes and Peer Groups, as is further discussed below.
In approving the agreements, the Board, including the Independent Trustees advised by independent legal counsel, considered the factors it deemed relevant, including the nature, quality and extent of services provided by PGIM Investments and the subadviser, the performance of the Fund, the profitability of PGIM Investments and its affiliates, expenses and fees, and the potential for economies of scale that may be shared with the Fund and its shareholders as the Fund’s assets grow. In their deliberations, the Trustees did not identify any single factor which alone was responsible for the Board’s decision to approve the agreements with respect to the Fund. In connection with its deliberations, the Board considered information provided by PGIM Investments throughout the year at regular
| 1 | Prudential Jennison Rising Dividend Fund is a series of Prudential Investment Portfolios 5. |
| 2 | Barry H. Evans and Laurie Simon Hodrick joined the Board effective as of September 1, 2017. Neither Mr. Evans nor Ms. Hodrick participated in the consideration of the approval of the Fund’s advisory agreements. |
| | |
| Prudential Jennison Rising Dividend Fund |
Approval of Advisory Agreements (continued)
Board meetings, presentations from portfolio managers and other information, as well as information furnished at or in advance of the meetings on June 6-8, 2017.
The Trustees determined that the overall arrangements between the Fund and PGIM Investments, which serves as the Fund’s investment manager pursuant to a management agreement, and between PGIM Investments and Jennison, which serves as the Fund’s subadviser pursuant to the terms of a subadvisory agreement with PGIM Investments, are in the best interests of the Fund and its shareholders in light of the services performed, fees charged and such other matters as the Trustees considered relevant in the exercise of their business judgment.
Several of the material factors and conclusions that formed the basis for the Trustees’ reaching their determinations to approve the renewal of the agreements are discussed separately below.
Nature, Quality and Extent of services
The Board received and considered information regarding the nature, quality and extent of services provided to the Fund by PGIM Investments and Jennison. The Board considered the services provided by PGIM Investments, including but not limited to the oversight of the subadviser for the Fund, as well as the provision of fund recordkeeping, compliance, and other services to the Fund. With respect to PGIM Investments’ oversight of the subadviser, the Board noted that PGIM Investments’ Strategic Investment Research Group (“SIRG”), which is a business unit of PGIM Investments, is responsible for monitoring and reporting to PGIM Investments’ senior management on the performance and operations of the subadviser. The Board also considered that PGIM Investments pays the salaries of all of the officers and interested Trustees of the Fund who are part of Fund management. The Board also considered the investment subadvisory services provided by Jennison, as well as compliance with the Fund’s investment restrictions, policies and procedures. The Board considered PGIM Investments’ evaluation of Jennison, as well as PGIM Investments’ recommendation, based on its review of Jennison, to renew the subadvisory agreement.
The Board considered the qualifications, backgrounds and responsibilities of PGIM Investments’ senior management responsible for the oversight of the Fund and Jennison, and also considered the qualifications, backgrounds and responsibilities of Jennison’s portfolio managers who are responsible for the day-to-day management of the Fund’s portfolio. The Board was provided with information pertaining to PGIM Investments’ and Jennison’s organizational structure, senior management, investment operations, and other relevant information pertaining to both PGIM Investments and Jennison. The Board also noted that it received favorable compliance reports from the Fund’s Chief Compliance
| | |
| Visit our website at pgiminvestments.com | | |
Officer (“CCO”) as to both PGIM Investments and Jennison. The Board noted that Jennison is affiliated with PGIM Investments.
The Board concluded that it was satisfied with the nature, extent and quality of the investment management services provided by PGIM Investments and the subadvisory services provided to the Fund by Jennison, and that there was a reasonable basis on which to conclude that the Fund benefits from the services provided by PGIM Investments and Jennison under the management and subadvisory agreements.
Costs of Services and Profits Realized by PGIM Investments
The Board was provided with information on the profitability of PGIM Investments and its affiliates in serving as the Fund’s investment manager. The Board discussed with PGIM Investments the methodology utilized in assembling the information regarding profitability and considered its reasonableness. The Board recognized that it is difficult to make comparisons of profitability from fund management contracts because comparative information is not generally publicly available and is affected by numerous factors, including the structure of the particular adviser, the types of funds it manages, its business mix, numerous assumptions regarding allocations and the adviser’s capital structure and cost of capital. However, the Board considered that the cost of services provided by PGIM Investments to the Fund during the year ended December 31, 2016 exceeded the management fees paid by the Fund, resulting in an operating loss to PGIM Investments. The Board further noted that the subadviser is affiliated with PGIM Investments and that its profitability is reflected in PGIM Investments’ profitability report. Taking these factors into account, the Board concluded that the profitability of PGIM Investments and its affiliates in relation to the services rendered was not unreasonable.
Economies of Scale
The Board received and discussed information concerning economies of scale that PGIM Investments may realize as the Fund’s assets grow beyond current levels. The Board considered information provided by PGIM Investments regarding the launch date of the Fund, the management fees of the Fund compared to those of similarly managed funds and PGIM Investments’ investment in the Fund over time. The Board noted that economies of scale, if any, may be shared with the Fund in several ways, including low management fees from inception, additional technological and personnel investments to enhance shareholder services, and maintaining existing expense structures in the face of a rising cost environment. The Board considered PGIM Investments’ assertion that it continually evaluates the management fee schedule of the Fund and the potential to share economies of scale through breakpoints or fee waivers as asset levels increase.
| | |
| Prudential Jennison Rising Dividend Fund |
Approval of Advisory Agreements (continued)
The Board recognized the inherent limitations of any analysis of economies of scale, stemming largely from the Board’s understanding that most of PGIM Investments’ costs are not specific to individual funds, but rather are incurred across a variety of products and services.
Other Benefits to PGIM Investments and Jennison
The Board considered potential ancillary benefits that might be received by PGIM Investments and Jennison and their affiliates as a result of their relationship with the Fund. The Board concluded that potential benefits to be derived by PGIM Investments included transfer agency fees received by the Fund’s transfer agent (which is affiliated with PGIM Investments), as well as benefits to its reputation or other intangible benefits resulting from PGIM Investments’ association with the Fund. The Board concluded that the potential benefits to be derived by Jennison included its ability to use soft dollar credits, as well as the potential benefits consistent with those generally resulting from an increase in assets under management, specifically, potential access to additional research resources and benefits to its reputation. The Board concluded that the benefits derived by PGIM Investments and Jennison were consistent with the types of benefits generally derived by investment managers and subadvisers to mutual funds.
Performance of the Fund / Fees and Expenses
The Board considered certain additional specific factors and made related conclusions relating to the historical performance of the Fund for the one-year period ended December 31, 2016. The Board considered that the Fund commenced operations on March 5, 2014 and that longer-term performance was not yet available.
The Board also considered the Fund’s actual management fee, as well as the Fund’s net total expense ratio, for the fiscal year ended July 31, 2016. The Board considered the management fee for the Fund as compared to the management fee charged by PGIM Investments to other funds and the fee charged by other advisers to comparable mutual funds in a Peer Group. The actual management fee represents the fee rate actually paid by Fund shareholders and includes any fee waivers or reimbursements. The net total expense ratio for the Fund represents the actual expense ratio incurred by Fund shareholders.
The mutual funds included in the Peer Universe (the Lipper Equity Income Funds Performance Universe), which was used to consider performance, and the Peer Group, which was used to consider expenses and fees, were objectively determined by Broadridge, an independent provider of mutual fund data. The comparisons placed the Fund in various quartiles, with the first quartile being the best 25% of the mutual funds (for performance, the best performing mutual funds and, for expenses, the lowest cost mutual funds).
| | |
| Visit our website at pgiminvestments.com | | |
The section below summarizes key factors considered by the Board and the Board’s conclusions regarding the Fund’s performance, fees and overall expenses. The table sets forth gross performance comparisons (which do not reflect the impact on performance of fund expenses, or any subsidies, expense caps or waivers that may be applicable) with the Peer Universe, actual management fees with the Peer Group (which reflect the impact of any subsidies or fee waivers), and net total expenses with the Peer Group, each of which were key factors considered by the Board.
| | | | | | | | |
| Performance | | 1 Year | | 3 Years | | 5 Years | | 10 Years |
| | | 4th Quartile | | N/A | | N/A | | N/A |
| Actual Management Fees: 1st Quartile |
| Net Total Expenses: 2nd Quartile |
| | • | | The Board noted that the Fund underperformed its benchmark index for the one year period. |
| | • | | The Board noted that the Fund does not yet have a three-year performance record and that, therefore, the subadviser should have more time to develop that record. |
| | • | | The Board and PGIM Investments agreed to continue the Fund’s existing expense cap, which caps the Fund’s annual operating expenses at 0.99% (exclusive of 12b-1 and certain other fees) through November 30, 2017. |
| | • | | The Board and PGIM Investments also agreed to permanently reduce the Fund’s management fee schedule. The current management fee schedule is 0.775% on average daily net assets. The new management fee schedule is 0.775% on average daily net assets to $1 billion, 0.755% on average daily net assets over $1 billion to $3 billion, 0.735% on average daily net assets from $3 billion to $5 billion, 0.715% on average daily net assets from $5 billion to $10 billion, and 0.705% on average daily net assets over $10 billion. |
| | • | | The Board concluded that in light of the above, it would be in the best interests of the Fund and its shareholders to continue to allow the Fund to create a performance record, and to renew the agreements with the permanent management fee reduction. |
| | • | | The Board concluded that the management fees (including subadvisory fees) and total expenses were reasonable in light of the services provided. |
* * *
After full consideration of these factors, the Board concluded that the approval of the agreements was in the best interests of the Fund and its shareholders.
| | |
| Prudential Jennison Rising Dividend Fund |
| | | | |
| ∎ MAIL | | ∎ TELEPHONE | | ∎ WEBSITE |
655 Broad Street Newark, NJ 07102 | | (800) 225-1852 | | www.pgiminvestments.com |
|
| PROXY VOTING |
| The Board of Trustees of the Fund has delegated to the Fund’s investment subadviser the responsibility for voting any proxies and maintaining proxy recordkeeping with respect to the Fund. A description of these proxy voting policies and procedures is available without charge, upon request, by calling (800) 225-1852. Information regarding how the Fund voted proxies relating to portfolio securities during the most recent 12-month period ended June 30 is available on the Fund’s website and on the Securities and Exchange Commission’s website. |
|
| TRUSTEES |
| Ellen S. Alberding • Kevin J. Bannon • Scott E. Benjamin • Linda W. Bynoe • Barry H. Evans • Keith F. Hartstein • Laurie Simon Hodrick • Michael S. Hyland • Stuart S. Parker • Richard A. Redeker • Stephen G. Stoneburn • Grace C. Torres |
|
| OFFICERS |
| Stuart S. Parker, President • Scott E. Benjamin, Vice President • M. Sadiq Peshimam, Treasurer and Principal Financial and Accounting Officer • Raymond A. O’Hara, Chief Legal Officer • Chad A. Earnst, Chief Compliance Officer • Deborah A. Docs, Secretary • Charles H. Smith, Anti-Money Laundering Compliance Officer • Jonathan D. Shain, Assistant Secretary • Claudia DiGiacomo, Assistant Secretary • Andrew R. French, Assistant Secretary • Peter Parrella, Assistant Treasurer • Lana Lomuti, Assistant Treasurer • Linda McMullin, Assistant Treasurer • Kelly A. Coyne, Assistant Treasurer |
| | | | |
| MANAGER | | PGIM Investments LLC | | 655 Broad Street
Newark, NJ 07102 |
|
| INVESTMENT SUBADVISER | | Jennison Associates LLC | | 466 Lexington Avenue
New York, NY 10017 |
|
| DISTRIBUTOR | | Prudential Investment
Management Services LLC | | 655 Broad Street Newark, NJ 07102 |
|
| CUSTODIAN | | The Bank of New York Mellon | | 225 Liberty Street
New York, NY 10286 |
|
| TRANSFER AGENT | | Prudential Mutual Fund
Services LLC | | PO Box 9658
Providence, RI 02940 |
|
INDEPENDENT REGISTERED
PUBLIC ACCOUNTING FIRM | | KPMG LLP | | 345 Park Avenue New York, NY 10154 |
|
| FUND COUNSEL | | Willkie Farr & Gallagher LLP | | 787 Seventh Avenue
New York, NY 10019 |
|
|
| An investor should consider the investment objectives, risks, charges, and expenses of the Fund carefully before investing. The prospectus and summary prospectus contain this and other information about the Fund. An investor may obtain a prospectus and summary prospectus by visiting our website at www.pgiminvestments.com or by calling (800) 225-1852. The prospectus and summary prospectus should be read carefully before investing. |
|
| E-DELIVERY |
To receive your mutual fund documents online, go to www.pgiminvestments.com/edelivery
and enroll. Instead of receiving printed documents by mail, you will receive notification via email when new materials are available. You can cancel your enrollment or change your email address at any time by visiting the website address above. |
|
| SHAREHOLDER COMMUNICATIONS WITH TRUSTEES |
| Shareholders can communicate directly with the Board of Trustees by writing to the Chair of the Board, Prudential Jennison Rising Dividend Fund, PGIM Investments, Attn: Board of Trustees, 655 Broad Street, Newark, NJ 07102. Shareholders can communicate directly with an individual Director by writing to the same address. Communications are not screened before being delivered to the addressee. |
|
| AVAILABILITY OF PORTFOLIO SCHEDULE |
| The Fund files its complete schedule of portfolio holdings with the Securities and Exchange Commission for the first and third quarters of each fiscal year on Form N-Q. The Fund’s Forms N-Q are available on the Commission’s website at www.sec.gov. The Fund’s Forms N-Q may also be reviewed and copied at the Commission’s Public Reference Room in Washington, D.C. Information on the operation and location of the Public Reference Room may be obtained by calling (202) 551-8090. The Fund’s schedule of portfolio holdings is also available on the Fund’s website as of the end of each month no sooner than 15 days after the end of the month. |
|
| The Fund’s Statement of Additional Information contains additional information about the Fund’s Trustees and is available without charge, upon request, by calling (800) 225-1852. |
Mutual Funds:
| | | | |
| ARE NOT INSURED BY THE FDIC OR ANY FEDERAL GOVERNMENT AGENCY | | MAY LOSE VALUE | | ARE NOT A DEPOSIT OF OR GUARANTEED BY ANY BANK OR ANY BANK AFFILIATE |
PRUDENTIAL JENNISON RISING DIVIDEND FUND
| | | | | | |
| SHARE CLASS | | A | | C | | Z |
| NASDAQ | | PJDAX | | PJDCX | | PJDZX |
| CUSIP | | 74440V823 | | 74440V815 | | 74440V799 |
MF220E

PRUDENTIAL DAY ONE FUNDS
ANNUAL REPORT
JULY 31, 2017

To enroll in e-delivery, go to pgiminvestments.com/edelivery
|
| Objective: Seek a balance between growth and conservation of capital |
Highlights
Since the inception of the Prudential Day One Funds (12/13/2016), through the end of the fiscal year (7/31/17), returns ranged from 4.46% for the Class R6 shares of the Prudential Day One Income Fund, which invests conservatively, to 11.30% for the Class R6 shares of the Prudential Day One 2055 Fund, which invest more aggressively, to maintain their respective glidepath targets.
Exposure to stocks and bonds contributed to the performance of the Funds during the reporting period, as both stocks and bonds turned in positive returns.
Allocations to commodities detracted from performance, as commodities were one of the worst-performing asset classes over the reporting period.
This report is not authorized for distribution to prospective investors unless preceded or accompanied by a current prospectus.
The views expressed in this report and information about the Funds’ portfolio holdings are for the period covered by this report and are subject to change thereafter.
Mutual funds are distributed by Prudential Investment Management Services LLC, a Prudential Financial company and member SIPC. QMA is the primary business name for Quantitative Management Associates LLC, a wholly owned subsidiary of PGIM, Inc. (PGIM) a Prudential Financial company. © 2017 Prudential Financial, Inc. and its related entities. The Prudential logo and the Rock symbol are service marks of Prudential Financial, Inc. and its related entities, registered in many jurisdictions worldwide.
| | |
| 2 | | Visit our website at pgiminvestments.com |
Prudential Day One Funds
TABLE OF CONTENTS
| | | | |
| Prudential Day One Funds | | | 3 | |
This Page Intentionally Left Blank
Letter from the President

Dear Shareholder:
We hope you find the annual report for the Prudential Day One Funds informative and useful. The report covers performance for the period from the inception of the Funds on December 13, 2016 through the end of the fiscal year on July 31, 2017.
Effective April 3, 2017, Prudential Investments became known as PGIM® Investments. Why PGIM? This new name was chosen to further align with the global investment management businesses of Prudential Financial, which rebranded from Prudential Investment Management in January 2016. This new name allows for one brand and reflects our ability and commitment to delivering investment solutions to clients around the globe. Please keep in mind that only the Fund adviser’s name was changed: the name of your Fund and its management and operation will not change.
Major global events during the reporting period included the US presidential election and domestic issues related to the new administration’s policy initiatives. The US economy experienced weak growth during the first quarter of 2017, although stronger growth took place in the second quarter. Britain began its formal legal process to leave the European Union, and recent parliamentary elections in Britain resulted in unseating the majority party. Overall, global economic growth picked up slightly.
Equities in the US reached new highs, and international equities gained significantly. European stocks posted impressive results. Asian markets were solid, and emerging markets outperformed most regions.
In mid-June, the Federal Reserve raised its Federal Funds rate by 0.25% for the second time in 2017. Fixed income markets were mixed, as rising interest rates affected bond markets. High yield and emerging markets bonds were among the top performers.
Given the uncertainty in today’s investment environment, we believe that active professional portfolio management offers a potential advantage. Active managers often have the knowledge and flexibility to find the best investment opportunities in the most challenging markets.
Even so, it’s best if investment decisions are based on your long-term goals rather than on short-term market and economic developments. We also encourage you to work with an experienced financial advisor who can help you set goals, determine your tolerance for risk, and build a diversified plan that’s right for you and make adjustments when necessary.
At PGIM Investments, we consider it a great privilege and responsibility to help investors participate in opportunities across global markets while meeting their toughest investment challenges. We’re part of PGIM, a top-10 global investment manager with more than $1 trillion in assets under management. This investment expertise allows us to deliver actively managed funds and strategies to meet the needs of investors around the globe.
Thank you for choosing our family of funds.
Sincerely,

Stuart S. Parker, President
Prudential Day One Funds
September 15, 2017
| | | | |
| Prudential Day One Funds | | | 5 | |
Prudential Day One Income Fund
Your Fund’s Performance (unaudited)
Performance data quoted represent past performance. Past performance does not guarantee future results. The investment return and principal value of an investment will fluctuate, so that an investor’s shares, when redeemed, may be worth more or less than their original cost. Current performance may be lower or higher than the past performance data quoted. An investor may obtain performance data as of the most recent month-end by visiting our website at www.pgiminvestments.com or by calling (800) 225-1852.
| | |
| | | Total Returns as of 7/31/17 |
| | | Since Inception* (%) |
| Class R1 | | 3.89 |
| Class R2 | | 4.09 |
| Class R3 | | 4.17 |
| Class R4 | | 4.23 |
| Class R5 | | 4.29 |
| Class R6 | | 4.46 |
| Prudential Day One Income Custom Benchmark | | 5.20 |
| Lipper Mixed-Asset Target Today Funds Average | | 6.56 |
| S&P Target Date Retirement Income Index | | 5.89 |
*Not annualized
Fund inception date: December 13, 2016.
Source: PGIM Investments LLC and Lipper Inc.
The returns in the tables do not reflect the deduction of taxes that a shareholder would pay on Fund distributions or following the redemption of Fund shares. The Since Inception returns for the Indexes and Lipper Average are measured from the closest month-end to the Fund’s inception date.
| | |
| 6 | | Visit our website at pgiminvestments.com |
Growth of a $10,000 Investment
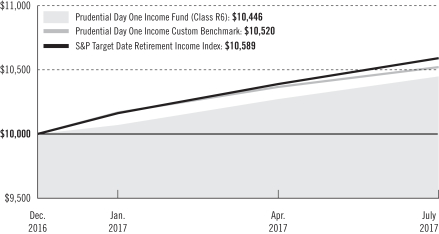
The graph compares a $10,000 investment in the Prudential Day One Income Fund (Class R6 shares) with a similar investment in the Prudential Day One Income Custom Benchmark and S&P Target Date Retirement Income Index (Index) over time periods ending on July 31, 2017 (the end of the Fund’s current fiscal year). The R6 share class assumes an initial investment on December 13, 2016, while the Custom Benchmark and the Index assume that the initial investment occurs on November 30, 2016. For purposes of the graph, and unless otherwise indicated, it has been assumed that (a) all recurring fees (including management fees) were deducted; and (b) all dividends and distributions were reinvested. The line graph provides information for Class R6 shares only. As indicated in the tables provided earlier and in the following paragraphs, performance for Class R1, Class R2, Class R3, Class R4 and Class R5 shares will vary due to the differing fees and expenses applicable to each share class. Without waiver of fees and/or expense reimbursements, the Fund’s returns would have been lower.
Past performance does not predict future performance. Total returns and the ending account values in the graph include changes in share price and reinvestment of dividends and capital gains distributions in a hypothetical investment for the periods shown. The Fund’s total returns do not reflect the deduction of income taxes on an individual’s investment. Taxes may reduce your actual investment returns on income or gains paid by the Fund or any gains you may realize if you sell your shares.
| | | | |
| Prudential Day One Funds | | | 7 | |
Prudential Day One Income Fund
Your Fund’s Performance (continued)
The average annual total returns take into account applicable charges and fees, which are described for each share class in the table below.
| | | | | | | | | | | | |
| | | Class R1 | | Class R2 | | Class R3 | | Class R4 | | Class R5 | | Class R6 |
| Maximum initial sales charge | | None | | None | | None | | None | | None | | None |
| Contingent deferred sales charge (CDSC) (as a percentage of the lower of original purchase price or net asset value at redemption) | | None | | None | | None | | None | | None | | None |
| Annual distribution and service (12b-1) fees (shown as a percentage of average daily net assets) | | .50% | | .25% | | .10% | | None | | None | | None |
| Shareholder service fees | | .10% | | .10% | | .10% | | .10% | | None | | None |
Benchmark Definitions
Prudential Day One Income Custom Benchmark—The Prudential Day One Income Custom Benchmark reflects the normal weighted average of the underlying funds’ stock/non-traditional assets/bond/cash allocation, as represented by the S&P 1500 Composite Index, Russell Developed ex-North America Large Cap Index, MSCI Emerging Markets Net Dividend Index, Bloomberg Barclays US TIPS Index, Bloomberg Barclays US Aggregate Bond Index, Citigroup Three Month T-Bill, Bloomberg Commodities Index, and the FTSE EPRA/NAREIT Developed Real Estate Net Index. Because the asset allocation of each Fund changes over time with the Glidepath, the custom benchmark allocations also change over time. All indices are unmanaged.
Lipper Mixed-Asset Target Today Funds Average—The Lipper Mixed-Asset Target Today Funds (Lipper Average) are funds that by portfolio practice, maintain a conservative mix of equity, bonds, cash, and cash equivalents designed to provide income to investors who are in or close to retirement.
S&P Target Date® Index—The S&P Target Date Series comprises 11 multi-asset class indices, each corresponding to a particular target retirement date. Each index provides varying levels of exposure to equities and fixed income. Each target date allocation is created and retired according to a predetermined schedule related to the respective target date.
Investors cannot invest directly in an index or average. The returns for the Indexes would be lower if they included the effects of sales charges, operating expenses of a mutual fund, or taxes. Returns for the Lipper Average reflect the deduction of operating expenses, but not sales charges or taxes.
| | |
| 8 | | Visit our website at pgiminvestments.com |
Prudential Day One 2010 Fund
Your Fund’s Performance (unaudited)
Performance data quoted represent past performance. Past performance does not guarantee future results. The investment return and principal value of an investment will fluctuate, so that an investor’s shares, when redeemed, may be worth more or less than their original cost. Current performance may be lower or higher than the past performance data quoted. An investor may obtain performance data as of the most recent month-end by visiting our website at www.pgiminvestments.com or by calling (800) 225-1852.
| | |
| | | Total Returns as of 7/31/17 |
| | | Since Inception* (%) |
| Class R1 | | 4.30 |
| Class R2 | | 4.50 |
| Class R3 | | 4.60 |
| Class R4 | | 4.60 |
| Class R5 | | 4.80 |
| Class R6 | | 4.80 |
| Prudential Day One 2010 Custom Benchmark | | 5.44 |
| Lipper Mixed-Asset Target 2010 Funds Average | | 7.56 |
| S&P Target Date 2010 Index | | 7.04 |
*Not annualized
Fund inception date: December 13, 2016.
Source: PGIM Investments LLC and Lipper Inc.
The returns in the tables do not reflect the deduction of taxes that a shareholder would pay on Fund distributions or following the redemption of Fund shares. The Since Inception returns for the Indexes and Lipper Average are measured from the closest month-end to the Fund’s inception date.
| | | | |
| Prudential Day One Funds | | | 9 | |
Prudential Day One 2010 Fund
Your Fund’s Performance (continued)
Growth of a $10,000 Investment
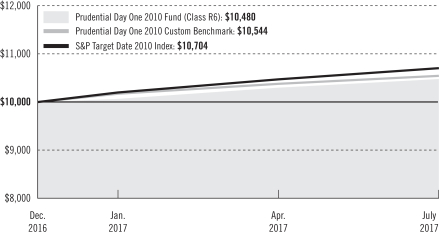
The graph compares a $10,000 investment in the Prudential Day One 2010 Fund (Class R6 shares) with a similar investment in the Prudential Day One 2010 Custom Benchmark and S&P Target Date 2010 Index (Index) over time periods ending on July 31, 2017 (the end of the Fund’s current fiscal year). The R6 share class assumes an initial investment on December 13, 2016, while the Custom Benchmark and the Index assume that the initial investment occurs on November 30, 2016. For purposes of the graph, and unless otherwise indicated, it has been assumed that (a) all recurring fees (including management fees) were deducted; and (b) all dividends and distributions were reinvested. The line graph provides information for Class R6 shares only. As indicated in the tables provided earlier and in the following paragraphs, performance for Class R1, Class R2, Class R3, Class R4 and Class R5 shares will vary due to the differing fees and expenses applicable to each share class. Without waiver of fees and/or expense reimbursements, the Fund’s returns would have been lower.
Past performance does not predict future performance. Total returns and the ending account values in the graph include changes in share price and reinvestment of dividends and capital gains distributions in a hypothetical investment for the periods shown. The Fund’s total returns do not reflect the deduction of income taxes on an individual’s investment. Taxes may reduce your actual investment returns on income or gains paid by the Fund or any gains you may realize if you sell your shares.
| | |
| 10 | | Visit our website at pgiminvestments.com |
The average annual total returns take into account applicable charges and fees, which are described for each share class in the table below.
| | | | | | | | | | | | |
| | | Class R1 | | Class R2 | | Class R3 | | Class R4 | | Class R5 | | Class R6 |
| Maximum initial sales charge | | None | | None | | None | | None | | None | | None |
| Contingent deferred sales charge (CDSC) (as a percentage of the lower of original purchase price or net asset value at redemption) | | None | | None | | None | | None | | None | | None |
| Annual distribution and service (12b-1) fees (shown as a percentage of average daily net assets) | | .50% | | .25% | | .10% | | None | | None | | None |
| Shareholder service fees | | .10% | | .10% | | .10% | | .10% | | None | | None |
Benchmark Definitions
Prudential Day One 2010 Custom Benchmark—The Prudential Day One 2010 Custom Benchmark reflects the normal weighted average of the underlying funds’ stock/non-traditional assets/bond/cash allocation, as represented by the S&P 1500 Composite Index, Russell Developed ex-North America Large Cap Index, MSCI Emerging Markets Net Dividend Index, Bloomberg Barclays US TIPS Index, Bloomberg Barclays US Aggregate Bond Index, Citigroup Three Month T-Bill, Bloomberg Commodities Index, and the FTSE EPRA/NAREIT Developed Real Estate Net Index. Because the asset allocation of each Fund changes over time with the Glidepath, the custom benchmark allocations also change over time. All indices are unmanaged.
Lipper Mixed-Asset Target 2010 Funds Average—The Lipper Mixed-Asset Target 2010 Funds (Lipper Average) are funds that seek to maximize assets for retirement or other purposes with an expected time horizon not to exceed the year 2010.
S&P Target Date® Index—The S&P Target Date Series comprises 11 multi-asset class indices, each corresponding to a particular target retirement date. Each index provides varying levels of exposure to equities and fixed income. Each target date allocation is created and retired according to a predetermined schedule related to the respective target date.
Investors cannot invest directly in an index or average. The returns for the Indexes would be lower if they included the effects of sales charges, operating expenses of a mutual fund, or taxes. Returns for the Lipper Average reflect the deduction of operating expenses, but not sales charges or taxes.
| | | | |
| Prudential Day One Funds | | | 11 | |
Prudential Day One 2015 Fund
Your Fund’s Performance (unaudited)
Performance data quoted represent past performance. Past performance does not guarantee future results. The investment return and principal value of an investment will fluctuate, so that an investor’s shares, when redeemed, may be worth more or less than their original cost. Current performance may be lower or higher than the past performance data quoted. An investor may obtain performance data as of the most recent month-end by visiting our website at www.pgiminvestments.com or by calling (800) 225-1852.
| | |
| | | Total Returns as of 7/31/17 |
| | | Since Inception* (%) |
| Class R1 | | 4.90 |
| Class R2 | | 5.00 |
| Class R3 | | 5.10 |
| Class R4 | | 5.10 |
| Class R5 | | 5.30 |
| Class R6 | | 5.30 |
| Prudential Day One 2015 Custom Benchmark | | 6.12 |
| Lipper Mixed-Asset Target 2015 Funds Average | | 8.33 |
| S&P Target Date 2015 Index | | 8.21 |
*Not annualized
Fund inception date: December 13, 2016.
Source: PGIM Investments LLC and Lipper Inc.
The returns in the tables do not reflect the deduction of taxes that a shareholder would pay on Fund distributions or following the redemption of Fund shares. The Since Inception returns for the Indexes and Lipper Average are measured from the closest month-end to the Fund’s inception date.
| | |
| 12 | | Visit our website at pgiminvestments.com |
Growth of a $10,000 Investment
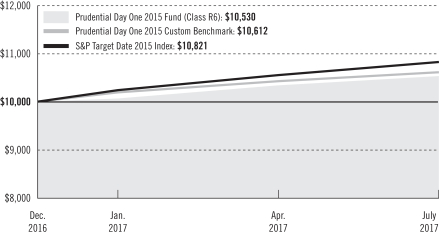
The graph compares a $10,000 investment in the Prudential Day One 2015 (Class R6 shares) with a similar investment in the Prudential Day One 2015 Custom Benchmark and S&P Target Date 2015 Index (Index) over time periods ending on July 31, 2017 (the end of the Fund’s current fiscal year). The R6 share class assumes an initial investment on December 13, 2016, while the Custom Benchmark and the Index assume that the initial investment occurs on November 30, 2016. For purposes of the graph, and unless otherwise indicated, it has been assumed that (a) all recurring fees (including management fees) were deducted; and (b) all dividends and distributions were reinvested. The line graph provides information for Class R6 shares only. As indicated in the tables provided earlier and in the following paragraphs, performance for Class R1, Class R2, Class R3, Class R4 and Class R5 shares will vary due to the differing fees and expenses applicable to each share class. Without waiver of fees and/or expense reimbursements, the Fund’s returns would have been lower.
Past performance does not predict future performance. Total returns and the ending account values in the graph include changes in share price and reinvestment of dividends and capital gains distributions in a hypothetical investment for the periods shown. The Fund’s total returns do not reflect the deduction of income taxes on an individual’s investment. Taxes may reduce your actual investment returns on income or gains paid by the Fund or any gains you may realize if you sell your shares.
| | | | |
| Prudential Day One Funds | | | 13 | |
Prudential Day One 2015 Fund
Your Fund’s Performance (continued)
The average annual total returns take into account applicable charges and fees, which are described for each share class in the table below.
| | | | | | | | | | | | |
| | | Class R1 | | Class R2 | | Class R3 | | Class R4 | | Class R5 | | Class R6 |
| Maximum initial sales charge | | None | | None | | None | | None | | None | | None |
| Contingent deferred sales charge (CDSC) (as a percentage of the lower of original purchase price or net asset value at redemption) | | None | | None | | None | | None | | None | | None |
| Annual distribution and service (12b-1) fees (shown as a percentage of average daily net assets) | | .50% | | .25% | | .10% | | None | | None | | None |
| Shareholder service fees | | .10% | | .10% | | .10% | | .10% | | None | | None |
Benchmark Definitions
Prudential Day One 2015 Custom Benchmark—The Prudential Day One 2015 Custom Benchmark reflects the normal weighted average of the underlying funds’ stock/non-traditional assets/bond/cash allocation, as represented by the S&P 1500 Composite Index, Russell Developed ex-North America Large Cap Index, MSCI Emerging Markets Net Dividend Index, Bloomberg Barclays US TIPS Index, Bloomberg Barclays US Aggregate Bond Index, Citigroup Three Month T-Bill, Bloomberg Commodities Index, and the FTSE EPRA/NAREIT Developed Real Estate Net Index. Because the asset allocation of each Fund changes over time with the Glidepath, the custom benchmark allocations also change over time. All indices are unmanaged.
Lipper Mixed-Asset Target 2015 Funds Average—The Lipper Mixed-Asset Target 2015 Funds (Lipper Average) are funds that seek to maximize assets for retirement or other purposes with an expected time horizon from January 1, 2011 to December 31, 2015.
S&P Target Date® Index—The S&P Target Date Series comprises 11 multi-asset class indices, each corresponding to a particular target retirement date. Each index provides varying levels of exposure to equities and fixed income. Each target date allocation is created and retired according to a predetermined schedule related to the respective target date.
Investors cannot invest directly in an index or average. The returns for the Indexes would be lower if they included the effects of sales charges, operating expenses of a mutual fund, or taxes. Returns for the Lipper Average reflect the deduction of operating expenses, but not sales charges or taxes.
| | |
| 14 | | Visit our website at pgiminvestments.com |
Prudential Day One 2020 Fund
Your Fund’s Performance (unaudited)
Performance data quoted represent past performance. Past performance does not guarantee future results. The investment return and principal value of an investment will fluctuate, so that an investor’s shares, when redeemed, may be worth more or less than their original cost. Current performance may be lower or higher than the past performance data quoted. An investor may obtain performance data as of the most recent month-end by visiting our website at www.pgiminvestments.com or by calling (800) 225-1852.
| | |
| | | Total Returns as of 7/31/17 |
| | | Since Inception* (%) |
| Class R1 | | 5.20 |
| Class R2 | | 5.40 |
| Class R3 | | 5.50 |
| Class R4 | | 5.50 |
| Class R5 | | 5.60 |
| Class R6 | | 5.40 |
| Prudential Day One 2020 Custom Benchmark | | 6.77 |
| Lipper Mixed-Asset Target 2020 Funds Average | | 8.40 |
| S&P Target Date 2020 Index | | 9.25 |
*Not annualized
Fund inception date: December 13, 2016.
Source: PGIM Investments LLC and Lipper Inc.
The returns in the tables do not reflect the deduction of taxes that a shareholder would pay on Fund distributions or following the redemption of Fund shares. The Since Inception returns for the Indexes and Lipper Average are measured from the closest month-end to the Fund’s inception date.
| | | | |
| Prudential Day One Funds | | | 15 | |
Prudential Day One 2020 Fund
Your Fund’s Performance (continued)
Growth of a $10,000 Investment
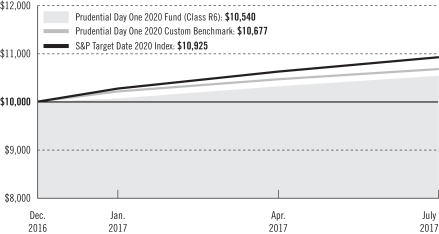
The graph compares a $10,000 investment in the Prudential Day One 2020 Fund (Class R6 shares) with a similar investment in the Prudential Day One 2020 Custom Benchmark and S&P Target Date 2020 Index (Index) over time periods ending on July 31, 2017 (the end of the Fund’s current fiscal year). The R6 share class assumes an initial investment on December 13, 2016, while the Custom Benchmark and the Index assume that the initial investment occurs on November 30, 2016. For purposes of the graph, and unless otherwise indicated, it has been assumed that (a) all recurring fees (including management fees) were deducted; and (b) all dividends and distributions were reinvested. The line graph provides information for Class R6 shares only. As indicated in the tables provided earlier and in the following paragraphs, performance for Class R1, Class R2, Class R3, Class R4 and Class R5 shares will vary due to the differing fees and expenses applicable to each share class. Without waiver of fees and/or expense reimbursements, the Fund’s returns would have been lower.
Past performance does not predict future performance. Total returns and the ending account values in the graph include changes in share price and reinvestment of dividends and capital gains distributions in a hypothetical investment for the periods shown. The Fund’s total returns do not reflect the deduction of income taxes on an individual’s investment. Taxes may reduce your actual investment returns on income or gains paid by the Fund or any gains you may realize if you sell your shares.
| | |
| 16 | | Visit our website at pgiminvestments.com |
The average annual total returns take into account applicable charges and fees, which are described for each share class in the table below.
| | | | | | | | | | | | |
| | | Class R1 | | Class R2 | | Class R3 | | Class R4 | | Class R5 | | Class R6 |
| Maximum initial sales charge | | None | | None | | None | | None | | None | | None |
| Contingent deferred sales charge (CDSC) (as a percentage of the lower of original purchase price or net asset value at redemption) | | None | | None | | None | | None | | None | | None |
| Annual distribution and service (12b-1) fees (shown as a percentage of average daily net assets) | | .50% | | .25% | | .10% | | None | | None | | None |
| Shareholder service fees | | .10% | | .10% | | .10% | | .10% | | None | | None |
Benchmark Definitions
Prudential Day One 2020 Custom Benchmark—The Prudential Day One 2020 Custom Benchmark reflects the normal weighted average of the underlying funds’ stock/non-traditional assets/bond/cash allocation, as represented by the S&P 1500 Composite Index, Russell Developed ex-North America Large Cap Index, MSCI Emerging Markets Net Dividend Index, Bloomberg Barclays US TIPS Index, Bloomberg Barclays US Aggregate Bond Index, Citigroup Three Month T-Bill, Bloomberg Commodities Index, and the FTSE EPRA/NAREIT Developed Real Estate Net Index. Because the asset allocation of each Fund changes over time with the Glidepath, the custom benchmark allocations also change over time. All indices are unmanaged.
Lipper Mixed-Asset Target 2020 Funds Average—The Lipper Mixed-Asset Target 2020 Funds (Lipper Average) are funds that seek to maximize assets for retirement or other purposes with an expected time horizon from January 1, 2016 to December 31, 2020.
S&P Target Date® Index—The S&P Target Date Series comprises 11 multi-asset class indices, each corresponding to a particular target retirement date. Each index provides varying levels of exposure to equities and fixed income. Each target date allocation is created and retired according to a predetermined schedule related to the respective target date.
Investors cannot invest directly in an index or average. The returns for the Indexes would be lower if they included the effects of sales charges, operating expenses of a mutual fund, or taxes. Returns for the Lipper Average reflect the deduction of operating expenses, but not sales charges or taxes.
| | | | |
| Prudential Day One Funds | | | 17 | |
Prudential Day One 2025 Fund
Your Fund’s Performance (unaudited)
Performance data quoted represent past performance. Past performance does not guarantee future results. The investment return and principal value of an investment will fluctuate, so that an investor’s shares, when redeemed, may be worth more or less than their original cost. Current performance may be lower or higher than the past performance data quoted. An investor may obtain performance data as of the most recent month-end by visiting our website at www.pgiminvestments.com or by calling (800) 225-1852.
| | |
| | | Total Returns as of 7/31/17 |
| | | Since Inception* (%) |
| Class R1 | | 5.80 |
| Class R2 | | 5.90 |
| Class R3 | | 6.10 |
| Class R4 | | 6.10 |
| Class R5 | | 6.20 |
| Class R6 | | 6.40 |
| Prudential Day One 2025 Custom Benchmark | | 7.87 |
| Lipper Mixed-Asset Target 2025 Funds Average | | 10.08 |
| S&P Target Date 2025 Index | | 10.33 |
*Not annualized
Fund inception date: December 13, 2016.
Source: PGIM Investments LLC and Lipper Inc.
The returns in the tables do not reflect the deduction of taxes that a shareholder would pay on Fund distributions or following the redemption of Fund shares. The Since Inception returns for the Indexes and Lipper Average are measured from the closest month-end to the Fund’s inception date.
| | |
| 18 | | Visit our website at pgiminvestments.com |
Growth of a $10,000 Investment
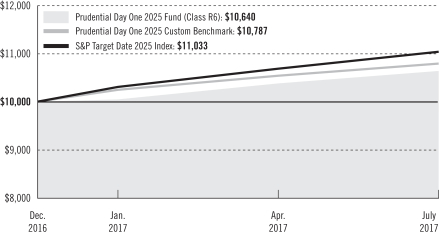
The graph compares a $10,000 investment in the Prudential Day One 2025 Fund (Class R6 shares) with a similar investment in the Prudential Day One 2025 Custom Benchmark and S&P Target Date 2025 Index (Index) over time periods ending on July 31, 2017 (the end of the Fund’s current fiscal year). The R6 share class assumes an initial investment on December 13, 2016, while the Custom Benchmark and the Index assume that the initial investment occurs on November 30, 2016. For purposes of the graph, and unless otherwise indicated, it has been assumed that (a) all recurring fees (including management fees) were deducted; and (b) all dividends and distributions were reinvested. The line graph provides information for Class R6 shares only. As indicated in the tables provided earlier and in the following paragraphs, performance for Class R1, Class R2, Class R3, Class R4 and Class R5 shares will vary due to the differing fees and expenses applicable to each share class. Without waiver of fees and/or expense reimbursements, the Fund’s returns would have been lower.
Past performance does not predict future performance. Total returns and the ending account values in the graph include changes in share price and reinvestment of dividends and capital gains distributions in a hypothetical investment for the periods shown. The Fund’s total returns do not reflect the deduction of income taxes on an individual’s investment. Taxes may reduce your actual investment returns on income or gains paid by the Fund or any gains you may realize if you sell your shares.
| | | | |
| Prudential Day One Funds | | | 19 | |
Prudential Day One 2025 Fund
Your Fund’s Performance (continued)
The average annual total returns take into account applicable charges and fees, which are described for each share class in the table below.
| | | | | | | | | | | | |
| | | Class R1 | | Class R2 | | Class R3 | | Class R4 | | Class R5 | | Class R6 |
| Maximum initial sales charge | | None | | None | | None | | None | | None | | None |
| Contingent deferred sales charge (CDSC) (as a percentage of the lower of original purchase price or net asset value at redemption) | | None | | None | | None | | None | | None | | None |
| Annual distribution and service (12b-1) fees (shown as a percentage of average daily net assets) | | .50% | | .25% | | .10% | | None | | None | | None |
| Shareholder service fees | | .10% | | .10% | | .10% | | .10% | | None | | None |
Benchmark Definitions
Prudential Day One 2025 Custom Benchmark—The Prudential Day One 2025 Custom Benchmark reflects the normal weighted average of the underlying funds’ stock/non-traditional assets/bond/cash allocation, as represented by the S&P 1500 Composite Index, Russell Developed ex-North America Large Cap Index, MSCI Emerging Markets Net Dividend Index, Bloomberg Barclays US TIPS Index, Bloomberg Barclays US Aggregate Bond Index, Citigroup Three Month T-Bill, Bloomberg Commodities Index, and the FTSE EPRA/NAREIT Developed Real Estate Net Index. Because the asset allocation of each Fund changes over time with the Glidepath, the custom benchmark allocations also change over time. All indices are unmanaged.
Lipper Mixed-Asset Target 2025 Funds Average—The Lipper Mixed-Asset Target 2025 Funds (Lipper Average) are funds that seek to maximize assets for retirement or other purposes with an expected time horizon from January 1, 2021 to December 31, 2025.
S&P Target Date® Index—The S&P Target Date Series comprises 11 multi-asset class indices, each corresponding to a particular target retirement date. Each index provides varying levels of exposure to equities and fixed income. Each target date allocation is created and retired according to a predetermined schedule related to the respective target date.
Investors cannot invest directly in an index or average. The returns for the Indexes would be lower if they included the effects of sales charges, operating expenses of a mutual fund, or taxes. Returns for the Lipper Average reflect the deduction of operating expenses, but not sales charges or taxes.
| | |
| 20 | | Visit our website at pgiminvestments.com |
Prudential Day One 2030 Fund
Your Fund’s Performance (unaudited)
Performance data quoted represent past performance. Past performance does not guarantee future results. The investment return and principal value of an investment will fluctuate, so that an investor’s shares, when redeemed, may be worth more or less than their original cost. Current performance may be lower or higher than the past performance data quoted. An investor may obtain performance data as of the most recent month-end by visiting our website at www.pgiminvestments.com or by calling (800) 225-1852.
| | |
| | | Total Returns as of 7/31/17 |
| | | Since Inception* (%) |
| Class R1 | | 7.40 |
| Class R2 | | 7.50 |
| Class R3 | | 7.60 |
| Class R4 | | 7.70 |
| Class R5 | | 7.80 |
| Class R6 | | 7.90 |
| Prudential Day One 2030 Custom Benchmark | | 9.98 |
| Lipper Mixed-Asset Target 2030 Funds Average | | 11.32 |
| S&P Target Date 2030 Index | | 11.30 |
*Not annualized
Fund inception date: December 13, 2016.
Source: PGIM Investments LLC and Lipper Inc.
The returns in the tables do not reflect the deduction of taxes that a shareholder would pay on Fund distributions or following the redemption of Fund shares. The Since Inception returns for the Indexes and Lipper Average are measured from the closest month-end to the Fund’s inception date.
| | | | |
| Prudential Day One Funds | | | 21 | |
Prudential Day One 2030 Fund
Your Fund’s Performance (continued)
Growth of a $10,000 Investment
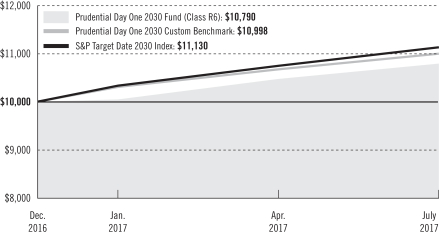
The graph compares a $10,000 investment in the Prudential Day One 2030 Fund (Class R6 shares) with a similar investment in the Prudential Day One 2030 Custom Benchmark and S&P Target Date 2030 Index (Index) over time periods ending on July 31, 2017 (the end of the Fund’s current fiscal year). The R6 share class assumes an initial investment on December 13, 2016, while the Custom Benchmark and the Index assume that the initial investment occurs on November 30, 2016. For purposes of the graph, and unless otherwise indicated, it has been assumed that (a) all recurring fees (including management fees) were deducted; and (b) all dividends and distributions were reinvested. The line graph provides information for Class R6 shares only. As indicated in the tables provided earlier and in the following paragraphs, performance for Class R1, Class R2, Class R3, Class R4 and Class R5 shares will vary due to the differing fees and expenses applicable to each share class. Without waiver of fees and/or expense reimbursements, the Fund’s returns would have been lower.
Past performance does not predict future performance. Total returns and the ending account values in the graph include changes in share price and reinvestment of dividends and capital gains distributions in a hypothetical investment for the periods shown. The Fund’s total returns do not reflect the deduction of income taxes on an individual’s investment. Taxes may reduce your actual investment returns on income or gains paid by the Fund or any gains you may realize if you sell your shares.
| | |
| 22 | | Visit our website at pgiminvestments.com |
The average annual total returns take into account applicable charges and fees, which are described for each share class in the table below.
| | | | | | | | | | | | |
| | | Class R1 | | Class R2 | | Class R3 | | Class R4 | | Class R5 | | Class R6 |
| Maximum initial sales charge | | None | | None | | None | | None | | None | | None |
| Contingent deferred sales charge (CDSC) (as a percentage of the lower of original purchase price or net asset value at redemption) | | None | | None | | None | | None | | None | | None |
| Annual distribution and service (12b-1) fees (shown as a percentage of average daily net assets) | | .50% | | .25% | | .10% | | None | | None | | None |
| Shareholder service fees | | .10% | | .10% | | .10% | | .10% | | None | | None |
Benchmark Definitions
Prudential Day One 2030 Custom Benchmark—The Prudential Day One 2030 Custom Benchmark reflects the normal weighted average of the underlying funds’ stock/non-traditional assets/bond/cash allocation, as represented by the S&P 1500 Composite Index, Russell Developed ex-North America Large Cap Index, MSCI Emerging Markets Net Dividend Index, Bloomberg Barclays US TIPS Index, Bloomberg Barclays US Aggregate Bond Index, Citigroup Three Month T-Bill, Bloomberg Commodities Index, and the FTSE EPRA/NAREIT Developed Real Estate Net Index. Because the asset allocation of each Fund changes over time with the Glidepath, the custom benchmark allocations also change over time. All indices are unmanaged.
Lipper Mixed-Asset Target 2030 Funds Average—The Lipper Mixed-Asset Target 2030 Funds (Lipper Average) are funds that seek to maximize assets for retirement or other purposes with an expected time horizon from January 1, 2026 to December 31, 2030.
S&P Target Date® Index—The S&P Target Date Series comprises 11 multi-asset class indices, each corresponding to a particular target retirement date. Each index provides varying levels of exposure to equities and fixed income. Each target date allocation is created and retired according to a predetermined schedule related to the respective target date.
Investors cannot invest directly in an index or average. The returns for the Indexes would be lower if they included the effects of sales charges, operating expenses of a mutual fund, or taxes. Returns for the Lipper Average reflect the deduction of operating expenses, but not sales charges or taxes.
| | | | |
| Prudential Day One Funds | | | 23 | |
Prudential Day One 2035 Fund
Your Fund’s Performance (unaudited)
Performance data quoted represent past performance. Past performance does not guarantee future results. The investment return and principal value of an investment will fluctuate, so that an investor’s shares, when redeemed, may be worth more or less than their original cost. Current performance may be lower or higher than the past performance data quoted. An investor may obtain performance data as of the most recent month-end by visiting our website at www.pgiminvestments.com or by calling (800) 225-1852.
| | |
| | | Total Returns as of 7/31/17 |
| | | Since Inception* (%) |
| Class R1 | | 8.10 |
| Class R2 | | 8.30 |
| Class R3 | | 8.40 |
| Class R4 | | 8.50 |
| Class R5 | | 8.50 |
| Class R6 | | 8.70 |
| Prudential Day One 2035 Custom Benchmark | | 11.44 |
| Lipper Mixed-Asset Target 2035 Funds Average | | 12.88 |
| S&P Target Date 2035 Index | | 12.26 |
*Not annualized
Fund inception date: December 13, 2016.
Source: PGIM Investments LLC and Lipper Inc.
The returns in the tables do not reflect the deduction of taxes that a shareholder would pay on Fund distributions or following the redemption of Fund shares. The Since Inception returns for the Indexes and Lipper Average are measured from the closest month-end to the Fund’s inception date.
| | |
| 24 | | Visit our website at pgiminvestments.com |
Growth of a $10,000 Investment
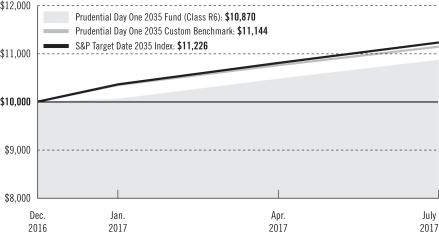
The graph compares a $10,000 investment in the Prudential Day One 2035 Fund (Class R6 shares) with a similar investment in the Prudential Day One 2035 Custom Benchmark and S&P Target Date 2035 Index (Index) over time periods ending on July 31, 2017 (the end of the Fund’s current fiscal year). The R6 share class assumes an initial investment on December 13, 2016, while the Custom Benchmark and the Index assume that the initial investment occurs on November 30, 2016. For purposes of the graph, and unless otherwise indicated, it has been assumed that (a) all recurring fees (including management fees) were deducted; and (b) all dividends and distributions were reinvested. The line graph provides information for Class R6 shares only. As indicated in the tables provided earlier and in the following paragraphs, performance for Class R1, Class R2, Class R3, Class R4 and Class R5 shares will vary due to the differing fees and expenses applicable to each share class. Without waiver of fees and/or expense reimbursements, the Fund’s returns would have been lower.
Past performance does not predict future performance. Total returns and the ending account values in the graph include changes in share price and reinvestment of dividends and capital gains distributions in a hypothetical investment for the periods shown. The Fund’s total returns do not reflect the deduction of income taxes on an individual’s investment. Taxes may reduce your actual investment returns on income or gains paid by the Fund or any gains you may realize if you sell your shares.
| | | | |
| Prudential Day One Funds | | | 25 | |
Prudential Day One 2035 Fund
Your Fund’s Performance (continued)
The average annual total returns take into account applicable charges and fees, which are described for each share class in the table below.
| | | | | | | | | | | | |
| | | Class R1 | | Class R2 | | Class R3 | | Class R4 | | Class R5 | | Class R6 |
| Maximum initial sales charge | | None | | None | | None | | None | | None | | None |
| Contingent deferred sales charge (CDSC) (as a percentage of the lower of original purchase price or net asset value at redemption) | | None | | None | | None | | None | | None | | None |
| Annual distribution and service (12b-1) fees (shown as a percentage of average daily net assets) | | .50% | | .25% | | .10% | | None | | None | | None |
| Shareholder service fees | | .10% | | .10% | | .10% | | .10% | | None | | None |
Benchmark Definitions
Prudential Day One 2035 Custom Benchmark—The Prudential Day One 2035 Custom Benchmark reflects the normal weighted average of the underlying funds’ stock/non-traditional assets/bond/cash allocation, as represented by the S&P 1500 Composite Index, Russell Developed ex-North America Large Cap Index, MSCI Emerging Markets Net Dividend Index, Bloomberg Barclays US TIPS Index, Bloomberg Barclays US Aggregate Bond Index, Citigroup Three Month T-Bill, Bloomberg Commodities Index, and the FTSE EPRA/NAREIT Developed Real Estate Net Index. Because the asset allocation of each Fund changes over time with the Glidepath, the custom benchmark allocations also change over time. All indices are unmanaged.
Lipper Mixed-Asset Target 2035 Funds Average—The Lipper Mixed-Asset Target 2035 Funds (Lipper Average) are funds that seek to maximize assets for retirement or other purposes with an expected time horizon from January 1, 2031 to December 31, 2035.
S&P Target Date® Index—The S&P Target Date Series comprises 11 multi-asset class indices, each corresponding to a particular target retirement date. Each index provides varying levels of exposure to equities and fixed income. Each target date allocation is created and retired according to a predetermined schedule related to the respective target date.
Investors cannot invest directly in an index or average. The returns for the Indexes would be lower if they included the effects of sales charges, operating expenses of a mutual fund, or taxes. Returns for the Lipper Average reflect the deduction of operating expenses, but not sales charges or taxes.
| | |
| 26 | | Visit our website at pgiminvestments.com |
Prudential Day One 2040 Fund
Your Fund’s Performance (unaudited)
Performance data quoted represent past performance. Past performance does not guarantee future results. The investment return and principal value of an investment will fluctuate, so that an investor’s shares, when redeemed, may be worth more or less than their original cost. Current performance may be lower or higher than the past performance data quoted. An investor may obtain performance data as of the most recent month-end by visiting our website at www.pgiminvestments.com or by calling (800) 225-1852.
| | |
| | | Total Returns as of 7/31/17 |
| | | Since Inception* (%) |
| Class R1 | | 9.00 |
| Class R2 | | 9.20 |
| Class R3 | | 9.30 |
| Class R4 | | 9.40 |
| Class R5 | | 9.50 |
| Class R6 | | 9.60 |
| Prudential Day One 2040 Custom Benchmark | | 12.44 |
| Lipper Mixed-Asset Target 2040 Funds Average | | 13.28 |
| S&P Target Date 2040 Index | | 12.91 |
*Not annualized
Fund inception date: December 13, 2016.
Source: PGIM Investments LLC and Lipper Inc.
The returns in the tables do not reflect the deduction of taxes that a shareholder would pay on Fund distributions or following the redemption of Fund shares. The Since Inception returns for the Indexes and Lipper Average are measured from the closest month-end to the Fund’s inception date.
| | | | |
| Prudential Day One Funds | | | 27 | |
Prudential Day One 2040 Fund
Your Fund’s Performance (continued)
Growth of a $10,000 Investment
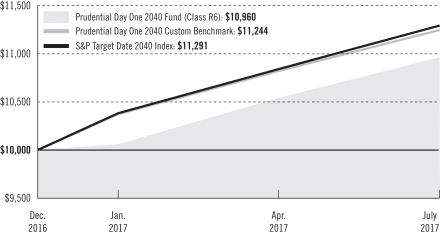
The graph compares a $10,000 investment in the Prudential Day One 2040 Fund (Class R6 shares) with a similar investment in the Prudential Day One 2040 Custom Benchmark and S&P Target Date 2040 Index (Index) over time periods ending on July 31, 2017 (the end of the Fund’s current fiscal year). The R6 share class assumes an initial investment on December 13, 2016, while the Custom Benchmark and the Index assume that the initial investment occurs on November 30, 2016. For purposes of the graph, and unless otherwise indicated, it has been assumed that (a) all recurring fees (including management fees) were deducted; and (b) all dividends and distributions were reinvested. The line graph provides information for Class R6 shares only. As indicated in the tables provided earlier and in the following paragraphs, performance for Class R1, Class R2, Class R3, Class R4 and Class R5 shares will vary due to the differing fees and expenses applicable to each share class. Without waiver of fees and/or expense reimbursements, the Fund’s returns would have been lower.
Past performance does not predict future performance. Total returns and the ending account values in the graph include changes in share price and reinvestment of dividends and capital gains distributions in a hypothetical investment for the periods shown. The Fund’s total returns do not reflect the deduction of income taxes on an individual’s investment. Taxes may reduce your actual investment returns on income or gains paid by the Fund or any gains you may realize if you sell your shares.
| | |
| 28 | | Visit our website at pgiminvestments.com |
The average annual total returns take into account applicable charges and fees, which are described for each share class in the table below.
| | | | | | | | | | | | |
| | | Class R1 | | Class R2 | | Class R3 | | Class R4 | | Class R5 | | Class R6 |
| Maximum initial sales charge | | None | | None | | None | | None | | None | | None |
| Contingent deferred sales charge (CDSC) (as a percentage of the lower of original purchase price or net asset value at redemption) | | None | | None | | None | | None | | None | | None |
| Annual distribution and service (12b-1) fees (shown as a percentage of average daily net assets) | | .50% | | .25% | | .10% | | None | | None | | None |
| Shareholder service fees | | .10% | | .10% | | .10% | | .10% | | None | | None |
Benchmark Definitions
Prudential Day One 2040 Custom Benchmark—The Prudential Day One 2040 Custom Benchmark reflects the normal weighted average of the underlying funds’ stock/non-traditional assets/bond/cash allocation, as represented by the S&P 1500 Composite Index, Russell Developed ex-North America Large Cap Index, MSCI Emerging Markets Net Dividend Index, Bloomberg Barclays US TIPS Index, Bloomberg Barclays US Aggregate Bond Index, Citigroup Three Month T-Bill, Bloomberg Commodities Index, and the FTSE EPRA/NAREIT Developed Real Estate Net Index. Because the asset allocation of each Fund changes over time with the Glidepath, the custom benchmark allocations also change over time. All indices are unmanaged.
Lipper Mixed-Asset Target 2040 Funds Average—The Lipper Mixed-Asset Target 2040 Funds (Lipper Average) are funds that seek to maximize assets for retirement or other purposes with an expected time horizon from January 1, 2036 to December 31, 2040.
S&P Target Date® Index—The S&P Target Date Series comprises 11 multi-asset class indices, each corresponding to a particular target retirement date. Each index provides varying levels of exposure to equities and fixed income. Each target date allocation is created and retired according to a predetermined schedule related to the respective target date.
Investors cannot invest directly in an index or average. The returns for the Indexes would be lower if they included the effects of sales charges, operating expenses of a mutual fund, or taxes. Returns for the Lipper Average reflect the deduction of operating expenses, but not sales charges or taxes.
| | | | |
| Prudential Day One Funds | | | 29 | |
Prudential Day One 2045 Fund
Your Fund’s Performance (unaudited)
Performance data quoted represent past performance. Past performance does not guarantee future results. The investment return and principal value of an investment will fluctuate, so that an investor’s shares, when redeemed, may be worth more or less than their original cost. Current performance may be lower or higher than the past performance data quoted. An investor may obtain performance data as of the most recent month-end by visiting our website at www.pgiminvestments.com or by calling (800) 225-1852.
| | |
| | | Total Returns as of 7/31/17 |
| | | Since Inception* (%) |
| Class R1 | | 9.70 |
| Class R2 | | 9.80 |
| Class R3 | | 9.90 |
| Class R4 | | 10.00 |
| Class R5 | | 10.10 |
| Class R6 | | 10.30 |
| Prudential Day One 2045 Custom Benchmark | | 13.18 |
| Lipper Mixed-Asset Target 2045 Funds Average | | 14.06 |
| S&P Target Date 2045 Index | | 13.40 |
*Not annualized
Fund inception date: December 13, 2016.
Source: PGIM Investments LLC and Lipper Inc.
The returns in the tables do not reflect the deduction of taxes that a shareholder would pay on Fund distributions or following the redemption of Fund shares. The Since Inception returns for the Indexes and Lipper Average are measured from the closest month-end to the Fund’s inception date.
| | |
| 30 | | Visit our website at pgiminvestments.com |
Growth of a $10,000 Investment
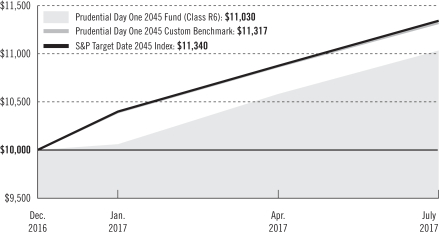
The graph compares a $10,000 investment in the Prudential Day One 2045 Fund (Class R6 shares) with a similar investment in the Prudential Day One 2045 Custom Benchmark and S&P Target Date 2045 Index (Index) over time periods ending on July 31, 2017 (the end of the Fund’s current fiscal year). The R6 share class assumes an initial investment on December 13, 2016, while the Custom Benchmark and the Index assume that the initial investment occurs on November 30, 2016. For purposes of the graph, and unless otherwise indicated, it has been assumed that (a) all recurring fees (including management fees) were deducted; and (b) all dividends and distributions were reinvested. The line graph provides information for Class R6 shares only. As indicated in the tables provided earlier and in the following paragraphs, performance for Class R1, Class R2, Class R3, Class R4 and Class R5 shares will vary due to the differing fees and expenses applicable to each share class. Without waiver of fees and/or expense reimbursements, the Fund’s returns would have been lower.
Past performance does not predict future performance. Total returns and the ending account values in the graph include changes in share price and reinvestment of dividends and capital gains distributions in a hypothetical investment for the periods shown. The Fund’s total returns do not reflect the deduction of income taxes on an individual’s investment. Taxes may reduce your actual investment returns on income or gains paid by the Fund or any gains you may realize if you sell your shares.
| | | | |
| Prudential Day One Funds | | | 31 | |
Prudential Day One 2045 Fund
Your Fund’s Performance (continued)
The average annual total returns take into account applicable charges and fees, which are described for each share class in the table below.
| | | | | | | | | | | | |
| | | Class R1 | | Class R2 | | Class R3 | | Class R4 | | Class R5 | | Class R6 |
| Maximum initial sales charge | | None | | None | | None | | None | | None | | None |
| Contingent deferred sales charge (CDSC) (as a percentage of the lower of original purchase price or net asset value at redemption) | | None | | None | | None | | None | | None | | None |
| Annual distribution and service (12b-1) fees (shown as a percentage of average daily net assets) | | .50% | | .25% | | .10% | | None | | None | | None |
| Shareholder service fees | | .10% | | .10% | | .10% | | .10% | | None | | None |
Benchmark Definitions
Prudential Day One 2045 Custom Benchmark—The Prudential Day One 2045 Custom Benchmark reflects the normal weighted average of the underlying funds’ stock/non-traditional assets/bond/cash allocation, as represented by the S&P 1500 Composite Index, Russell Developed ex-North America Large Cap Index, MSCI Emerging Markets Net Dividend Index, Bloomberg Barclays US TIPS Index, Bloomberg Barclays US Aggregate Bond Index, Citigroup Three Month T-Bill, Bloomberg Commodities Index, and the FTSE EPRA/NAREIT Developed Real Estate Net Index. Because the asset allocation of each Fund changes over time with the Glidepath, the custom benchmark allocations also change over time. All indices are unmanaged.
Lipper Mixed-Asset Target 2045 Funds Average—The Lipper Mixed-Asset Target 2045 Funds (Lipper Average) are funds that seek to maximize assets for retirement or other purposes with an expected time horizon from January 1, 2041 to December 31, 2045.
S&P Target Date® Index—The S&P Target Date Series comprises 11 multi-asset class indices, each corresponding to a particular target retirement date. Each index provides varying levels of exposure to equities and fixed income. Each target date allocation is created and retired according to a predetermined schedule related to the respective target date.
Investors cannot invest directly in an index or average. The returns for the Indexes would be lower if they included the effects of sales charges, operating expenses of a mutual fund, or taxes. Returns for the Lipper Average reflect the deduction of operating expenses, but not sales charges or taxes.
| | |
| 32 | | Visit our website at pgiminvestments.com |
Prudential Day One 2050 Fund
Your Fund’s Performance (unaudited)
Performance data quoted represent past performance. Past performance does not guarantee future results. The investment return and principal value of an investment will fluctuate, so that an investor’s shares, when redeemed, may be worth more or less than their original cost. Current performance may be lower or higher than the past performance data quoted. An investor may obtain performance data as of the most recent month-end by visiting our website at www.pgiminvestments.com or by calling (800) 225-1852.
| | |
| | | Total Returns as of 7/31/17 |
| | | Since Inception* (%) |
| Class R1 | | 9.50 |
| Class R2 | | 9.60 |
| Class R3 | | 9.70 |
| Class R4 | | 9.80 |
| Class R5 | | 9.90 |
| Class R6 | | 10.00 |
| Prudential Day One 2050 Custom Benchmark | | 13.64 |
| Lipper Mixed-Asset Target 2050 Funds Average | | 13.92 |
| S&P Target Date 2050 Index | | 13.85 |
*Not annualized
Fund inception date: December 13, 2016.
Source: PGIM Investments LLC and Lipper Inc.
The returns in the tables do not reflect the deduction of taxes that a shareholder would pay on Fund distributions or following the redemption of Fund shares. The Since Inception returns for the Indexes and Lipper Average are measured from the closest month-end to the Fund’s inception date.
| | | | |
| Prudential Day One Funds | | | 33 | |
Prudential Day One 2050 Fund
Your Fund’s Performance (continued)
Growth of a $10,000 Investment
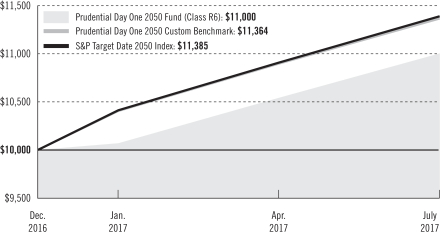
The graph compares a $10,000 investment in the Prudential Day One 2050 Fund (Class R6 shares) with a similar investment in the Prudential Day One 2050 Custom Benchmark and S&P Target Date 2050 Index (Index) over time periods ending on July 31, 2017 (the end of the Fund’s current fiscal year). The R6 share class assumes an initial investment on December 13, 2016, while the Custom Benchmark and the Index assume that the initial investment occurs on November 30, 2016. For purposes of the graph, and unless otherwise indicated, it has been assumed that (a) all recurring fees (including management fees) were deducted; and (b) all dividends and distributions were reinvested. The line graph provides information for Class R6 shares only. As indicated in the tables provided earlier and in the following paragraphs, performance for Class R1, Class R2, Class R3, Class R4 and Class R5 shares will vary due to the differing fees and expenses applicable to each share class. Without waiver of fees and/or expense reimbursements, the Fund’s returns would have been lower.
Past performance does not predict future performance. Total returns and the ending account values in the graph include changes in share price and reinvestment of dividends and capital gains distributions in a hypothetical investment for the periods shown. The Fund’s total returns do not reflect the deduction of income taxes on an individual’s investment. Taxes may reduce your actual investment returns on income or gains paid by the Fund or any gains you may realize if you sell your shares.
| | |
| 34 | | Visit our website at pgiminvestments.com |
The average annual total returns take into account applicable charges and fees, which are described for each share class in the table below.
| | | | | | | | | | | | |
| | | Class R1 | | Class R2 | | Class R3 | | Class R4 | | Class R5 | | Class R6 |
| Maximum initial sales charge | | None | | None | | None | | None | | None | | None |
| Contingent deferred sales charge (CDSC) (as a percentage of the lower of original purchase price or net asset value at redemption) | | None | | None | | None | | None | | None | | None |
| Annual distribution and service (12b-1) fees (shown as a percentage of average daily net assets) | | .50% | | .25% | | .10% | | None | | None | | None |
| Shareholder service fees | | .10% | | .10% | | .10% | | .10% | | None | | None |
Benchmark Definitions
Prudential Day One 2050 Custom Benchmark—The Prudential Day One 2050 Custom Benchmark reflects the normal weighted average of the underlying funds’ stock/non-traditional assets/bond/cash allocation, as represented by the S&P 1500 Composite Index, Russell Developed ex-North America Large Cap Index, MSCI Emerging Markets Net Dividend Index, Bloomberg Barclays US TIPS Index, Bloomberg Barclays US Aggregate Bond Index, Citigroup Three Month T-Bill, Bloomberg Commodities Index, and the FTSE EPRA/NAREIT Developed Real Estate Net Index. Because the asset allocation of each Fund changes over time with the Glidepath, the custom benchmark allocations also change over time. All indices are unmanaged.
Lipper Mixed-Asset Target 2050 Funds Average—The Lipper Mixed-Asset Target 2050 Funds (Lipper Average) are funds that seek to maximize assets for retirement or other purposes with an expected time horizon from January 1, 2046 to December 31, 2050.
S&P Target Date® Index—The S&P Target Date Series comprises 11 multi-asset class indices, each corresponding to a particular target retirement date. Each index provides varying levels of exposure to equities and fixed income. Each target date allocation is created and retired according to a predetermined schedule related to the respective target date.
Investors cannot invest directly in an index or average. The returns for the Indexes would be lower if they included the effects of sales charges, operating expenses of a mutual fund, or taxes. Returns for the Lipper Average reflect the deduction of operating expenses, but not sales charges or taxes.
| | | | |
| Prudential Day One Funds | | | 35 | |
Prudential Day One 2055 Fund
Your Fund’s Performance (unaudited)
Performance data quoted represent past performance. Past performance does not guarantee future results. The investment return and principal value of an investment will fluctuate, so that an investor’s shares, when redeemed, may be worth more or less than their original cost. Current performance may be lower or higher than the past performance data quoted. An investor may obtain performance data as of the most recent month-end by visiting our website at www.pgiminvestments.com or by calling (800) 225-1852.
| | |
| | | Total Returns as of 7/31/17 |
| | | Since Inception* (%) |
| Class R1 | | 10.70 |
| Class R2 | | 10.90 |
| Class R3 | | 11.00 |
| Class R4 | | 11.10 |
| Class R5 | | 11.20 |
| Class R6 | | 11.30 |
| Prudential Day One 2055 Custom Benchmark | | 14.17 |
| Lipper Mixed-Asset Target 2055 Average | | 14.40 |
| S&P Target Date 2055+ Index | | 14.11 |
*Not annualized
Fund inception date: December 13, 2016.
Source: PGIM Investments LLC and Lipper Inc.
The returns in the tables do not reflect the deduction of taxes that a shareholder would pay on Fund distributions or following the redemption of Fund shares. The Since Inception returns for the Indexes and Lipper Average are measured from the closest month-end to the Fund’s inception date.
| | |
| 36 | | Visit our website at pgiminvestments.com |
Growth of a $10,000 Investment
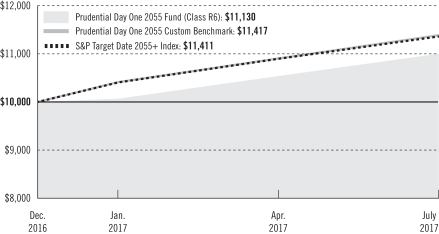
The graph compares a $10,000 investment in the Prudential Day One 2055 Fund (Class R6 shares) with a similar investment in the Prudential Day One 2055 Custom Benchmark and S&P Target Date 2055+ Index (Index) over time periods ending on July 31, 2017 (the end of the Fund’s current fiscal year). The R6 share class assumes an initial investment on December 13, 2016, while the Custom Benchmark and the Index assume that the initial investment occurs on November 30, 2016. For purposes of the graph, and unless otherwise indicated, it has been assumed that (a) all recurring fees (including management fees) were deducted; and (b) all dividends and distributions were reinvested. The line graph provides information for Class R6 shares only. As indicated in the tables provided earlier and in the following paragraphs, performance for Class R1, Class R2, Class R3, Class R4 and Class R5 shares will vary due to the differing fees and expenses applicable to each share class. Without waiver of fees and/or expense reimbursements, the Fund’s returns would have been lower.
Past performance does not predict future performance. Total returns and the ending account values in the graph include changes in share price and reinvestment of dividends and capital gains distributions in a hypothetical investment for the periods shown. The Fund’s total returns do not reflect the deduction of income taxes on an individual’s investment. Taxes may reduce your actual investment returns on income or gains paid by the Fund or any gains you may realize if you sell your shares.
| | | | |
| Prudential Day One Funds | | | 37 | |
Prudential Day One 2055 Fund
Your Fund’s Performance (continued)
The average annual total returns take into account applicable charges and fees, which are described for each share class in the table below.
| | | | | | | | | | | | |
| | | Class R1 | | Class R2 | | Class R3 | | Class R4 | | Class R5 | | Class R6 |
| Maximum initial sales charge | | None | | None | | None | | None | | None | | None |
| Contingent deferred sales charge (CDSC) (as a percentage of the lower of original purchase price or net asset value at redemption) | | None | | None | | None | | None | | None | | None |
| Annual distribution and service (12b-1) fees (shown as a percentage of average daily net assets) | | .50% | | .25% | | .10% | | None | | None | | None |
| Shareholder service fees | | .10% | | .10% | | .10% | | .10% | | None | | None |
Benchmark Definitions
Prudential Day One 2055 Custom Benchmark—The Prudential Day One 2055 Custom Benchmark reflects the normal weighted average of the underlying funds’ stock/non-traditional assets/bond/cash allocation, as represented by the S&P 1500 Composite Index, Russell Developed ex-North America Large Cap Index, MSCI Emerging Markets Net Dividend Index, Bloomberg Barclays US TIPS Index, Bloomberg Barclays US Aggregate Bond Index, Citigroup Three Month T-Bill, Bloomberg Commodities Index, and the FTSE EPRA/NAREIT Developed Real Estate Net Index. Because the asset allocation of each Fund changes over time with the Glidepath, the custom benchmark allocations also change over time. All indices are unmanaged.
Lipper Mixed-Asset Target 2055 Funds Average—The Lipper Mixed-Asset Target 2055 Funds (Lipper Average) are funds that seek to maximize assets for retirement or other purposes with an expected time horizon from January 1, 2051 to December 31, 2055.
S&P Target Date® Index—The S&P Target Date Series comprises 11 multi-asset class indices, each corresponding to a particular target retirement date. Each index provides varying levels of exposure to equities and fixed income. Each target date allocation is created and retired according to a predetermined schedule related to the respective target date.
Investors cannot invest directly in an index or average. The returns for the Indexes would be lower if they included the effects of sales charges, operating expenses of a mutual fund, or taxes. Returns for the Lipper Average reflect the deduction of operating expenses, but not sales charges or taxes.
| | |
| 38 | | Visit our website at pgiminvestments.com |
Prudential Day One 2060 Fund
Your Fund’s Performance (unaudited)
Performance data quoted represent past performance. Past performance does not guarantee future results. The investment return and principal value of an investment will fluctuate, so that an investor’s shares, when redeemed, may be worth more or less than their original cost. Current performance may be lower or higher than the past performance data quoted. An investor may obtain performance data as of the most recent month-end by visiting our website at www.pgiminvestments.com or by calling (800) 225-1852.
| | |
| | | Total Returns as of 7/31/17 |
| | | Since Inception* (%) |
| Class R1 | | 10.10 |
| Class R2 | | 10.30 |
| Class R3 | | 10.40 |
| Class R4 | | 10.40 |
| Class R5 | | 10.50 |
| Class R6 | | 10.60 |
| Prudential Day One 2060 Custom Benchmark | | 14.39 |
| Lipper Mixed-Asset Target 2060 Funds Average | | 14.40 |
| S&P Target Date 2060+ Index | | 14.27 |
*Not annualized
Fund inception date: December 13, 2016.
Source: PGIM Investments LLC and Lipper Inc.
The returns in the tables do not reflect the deduction of taxes that a shareholder would pay on Fund distributions or following the redemption of Fund shares. The Since Inception returns for the Indexes and Lipper Average are measured from the closest month-end to the Fund’s inception date.
| | | | |
| Prudential Day One Funds | | | 39 | |
Prudential Day One 2060 Fund
Your Fund’s Performance (continued)
Growth of a $10,000 Investment
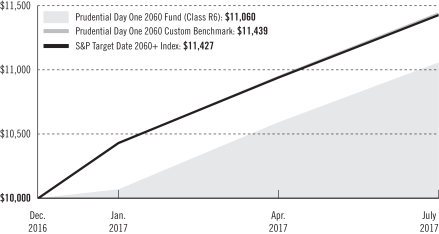
The graph compares a $10,000 investment in the Prudential Day One 2060 Fund (Class R6 shares) with a similar investment in the Prudential Day One 2060 Custom Benchmark and S&P Target Date 2060+ Index (Index) over time periods ending on July 31, 2017 (the end of the Fund’s current fiscal year). The R6 share class assumes an initial investment on December 13, 2016, while the Custom Benchmark and the Index assume that the initial investment occurs on November 30, 2016. For purposes of the graph, and unless otherwise indicated, it has been assumed that (a) all recurring fees (including management fees) were deducted; and (b) all dividends and distributions were reinvested. The line graph provides information for Class R6 shares only. As indicated in the tables provided earlier and in the following paragraphs, performance for Class R1, Class R2, Class R3, Class R4 and Class R5 shares will vary due to the differing fees and expenses applicable to each share class. Without waiver of fees and/or expense reimbursements, the Fund’s returns would have been lower.
Past performance does not predict future performance. Total returns and the ending account values in the graph include changes in share price and reinvestment of dividends and capital gains distributions in a hypothetical investment for the periods shown. The Fund’s total returns do not reflect the deduction of income taxes on an individual’s investment. Taxes may reduce your actual investment returns on income or gains paid by the Fund or any gains you may realize if you sell your shares.
| | |
| 40 | | Visit our website at pgiminvestments.com |
The average annual total returns take into account applicable charges and fees, which are described for each share class in the table below.
| | | | | | | | | | | | |
| | | Class R1 | | Class R2 | | Class R3 | | Class R4 | | Class R5 | | Class R6 |
| Maximum initial sales charge | | None | | None | | None | | None | | None | | None |
| Contingent deferred sales charge (CDSC) (as a percentage of the lower of original purchase price or net asset value at redemption) | | None | | None | | None | | None | | None | | None |
| Annual distribution and service (12b-1) fees (shown as a percentage of average daily net assets) | | .50% | | .25% | | .10% | | None | | None | | None |
| Shareholder service fees | | .10% | | .10% | | .10% | | .10% | | None | | None |
Benchmark Definitions
Prudential Day One 2060 Custom Benchmark—The Prudential Day One 2060 Custom Benchmark reflects the normal weighted average of the underlying funds’ stock/non-traditional assets/bond/cash allocation, as represented by the S&P 1500 Composite Index, Russell Developed ex-North America Large Cap Index, MSCI Emerging Markets Net Dividend Index, Bloomberg Barclays US TIPS Index, Bloomberg Barclays US Aggregate Bond Index, Citigroup Three Month T-Bill, Bloomberg Commodities Index, and the FTSE EPRA/NAREIT Developed Real Estate Net Index. Because the asset allocation of each Fund changes over time with the Glidepath, the custom benchmark allocations also change over time. All indices are unmanaged.
Lipper Mixed-Asset Target 2060 Funds Average—The Lipper Mixed-Asset Target 2060 Funds (Lipper Average) are funds that seek to maximize assets for retirement or other purposes with an expected time horizon exceeding the year 2055.
S&P Target Date® Index—The S&P Target Date Series comprises 11 multi-asset class indices, each corresponding to a particular target retirement date. Each index provides varying levels of exposure to equities and fixed income. Each target date allocation is created and retired according to a predetermined schedule related to the respective target date.
Investors cannot invest directly in an index or average. The returns for the Indexes would be lower if they included the effects of sales charges, operating expenses of a mutual fund, or taxes. Returns for the Lipper Average reflect the deduction of operating expenses, but not sales charges or taxes.
| | | | |
| Prudential Day One Funds | | | 41 | |
Prudential Day One Funds
Strategy and Performance Overview
What were market conditions?
| • | | Stocks turned in strong performance since the inception of the Prudential Day One Funds on December 13, 2016 through the end of the reporting period, July 31, 2017. US equities firmly advanced on strong earnings and positive investor sentiment. International stock markets and emerging markets stocks also performed well during the reporting period. |
| • | | During the reporting period, the bond market delivered respectable performance, especially given the trend toward tighter monetary policy in both the US and Europe. Over this time, the best bond performance was in the higher-yielding, more economically sensitive sectors, which outperformed lower-yielding market segments. US corporate bonds delivered a solid return against a backdrop of modest economic growth, solid investor demand in the face of record issuance, and positive earnings momentum. However, US Government bonds faltered somewhat. |
| • | | In commodities, the industrial metals, precious metals and livestock sectors rallied, while the energy and agriculture (grains and soft commodities) sectors fell. |
| • | | Headline macro-events included fiercely contested disputes in the US Congress over the Trump administration’s policy initiatives, especially on health care and tax reform. Investors shrugged off the political impasse, as stocks sailed smoothly to new highs on strong earnings and positive investor sentiment. However, the extended low-volatility environment had some investors concerned that a sense of complacency may have taken hold. |
| • | | Solid economic fundamentals in the US included moderate GDP expansion, robust employment, and accelerating corporate profit growth. Inflation remained benign. The Federal Reserve raised the federal funds target rate to 1.00%-1.25%. |
How did the Funds perform?
The performance for each Fund referenced below is that of the R6 share class.
The Prudential Day One Income Fund returned 4.46% from inception (12/13/16) through July 31, 2017, underperforming the 5.20% return of the Custom Index* (the Index) and the 6.56% return of the Lipper Mixed-Asset Target Today Funds Average*.
The Prudential Day One 2010 Fund returned 4.80% from inception (12/13/16) through July 31, 2017, underperforming the 5.44% return of the Custom Index* (the Index) and the 7.56% return of the Lipper Mixed-Asset Target 2010 Funds Average*.
| * | While the Day One Funds’ performance results reflect the performance from the Funds’ inception on 12/13/16, the returns of the Custom Index and the Lipper Mixed-Asset Target Today Funds Average reflect a start date of 12/31/16. |
| | |
| 42 | | Visit our website at pgiminvestments.com |
The Prudential Day One 2015 Fund returned 5.30% from inception (12/13/16) through July 31, 2017, underperforming the 6.12% return of the Custom Index* (the Index) and the 8.33% return of the Lipper Mixed-Asset Target 2015 Funds Average*.
The Prudential Day One 2020 Fund returned 5.40% from inception (12/13/16) through July 31, 2017, underperforming the 6.77% return of the Custom Index* (the Index) and the 8.40% return of the Lipper Mixed-Asset Target 2020 Funds Average*.
The Prudential Day One 2025 Fund returned 6.40% from inception (12/13/16) through July 31, 2017, underperforming the 7.87% return of the Custom Index* (the Index) and the 10.08% return of the Lipper Mixed-Asset Target 2025 Funds Average*.
The Prudential Day One 2030 Fund returned 7.90% from inception (12/13/16) through July 31, 2017, underperforming the 9.98% return of the Custom Index* (the Index) and the 11.32% return of the Lipper Mixed-Asset Target 2030 Funds Average*.
The Prudential Day One 2035 Fund returned 8.70% from inception (12/13/16) through July 31, 2017, underperforming the 11.44% return of the Custom Index* (the Index) and the 12.88% return of the Lipper Mixed-Asset Target 2035 Funds Average*.
The Prudential Day One 2040 Fund returned 9.60% from inception (12/13/16) through July 31, 2017, underperforming the 12.44% return of the Custom Index* (the Index) and the 13.28% return of the Lipper Mixed-Asset Target 2040 Funds Average*.
The Prudential Day One 2045 Fund returned 10.30% from inception (12/13/16) through July 31, 2017, underperforming the 13.18% return of the Custom Index* (the Index) and the 14.06% return of the Lipper Mixed-Asset Target 2045 Funds Average*.
The Prudential Day One 2050 Fund returned 10.00% from inception (12/13/16) through July 31, 2017, underperforming the 13.64% return of the Custom Index* (the Index) and the 13.92% return of the Lipper Mixed-Asset Target 2050 Funds Average*.
The Prudential Day One 2055 Fund returned 11.30% from inception (12/13/16) through July 31, 2017, underperforming the 14.17% return of the Custom Index* (the Index) and the 14.40% return of the Lipper Mixed-Asset Target 2055 Funds Average*.
The Prudential Day One 2060 Fund returned 10.60% from inception (12/13/16) through July 31, 2017, underperforming the 14.39% return of the Custom Index* (the Index) and the 14.40% return of the Lipper Mixed-Asset Target 2060 Funds Average*.
| | | | |
| Prudential Day One Funds | | | 43 | |
Prudential Day One Funds
Strategy and Performance Overview (continued)
What worked?
| • | | Each fund in the Day One Funds series is allocated to a combination of stocks and bonds. Each fund in the series benefited from exposure to both asset classes during the reporting period. |
| • | | Within equities, the Funds’ bias toward US large-cap stocks relative to US mid-cap and US small-cap stock exposure contributed to overall results as US large-cap stocks outperformed their smaller-cap counterparts. |
| • | | At the underlying fund level, the Prudential Jennison Small-Cap Core Equity and the Prudential Total Return Bond Funds were the greatest contributors to relative performance, as both Funds significantly outperformed their respective benchmark indexes. |
What didn’t work?
| • | | Relative to industry peers, the Funds had less exposure to developed international and emerging markets stocks, which were two of the strongest-performing asset classes during this period. Relative to the Lipper peer average this underweight hampered returns. |
| • | | The Funds’ allocation to commodities detracted from performance as commodities were one of the worst-performing asset classes over this period. |
| • | | Weak results from the Prudential QMA Large-Cap Core Equity Fund, relative to its benchmark, detracted somewhat from overall results. |
| | |
| 44 | | Visit our website at pgiminvestments.com |
Fees and Expenses (unaudited)
As a shareholder of a Fund, you incur two types of costs: (1) transaction costs, including sales charges (loads) on purchase payments and redemptions, as applicable, and (2) ongoing costs, including management fees, distribution and/or service (12b-1) fees, and other Fund expenses, as applicable. These examples are intended to help you understand your ongoing costs (in dollars) of investing in the Funds and to compare these costs with the ongoing costs of investing in other mutual funds.
These examples are based on an investment of $1,000 held through the six-month period ended July 31, 2017. These examples are for illustrative purposes only; you should consult the Prospectus for information on initial and subsequent minimum investment requirements.
Actual Expenses
The first line for each share class in the tables on the following pages provides information about actual account values and actual expenses. You may use the information on this line, together with the amount you invested, to estimate the expenses that you paid over the period. Simply divide your account value by $1,000 (for example, an $8,600 account value ÷ $1,000 = 8.6), then multiply the result by the number on the first line under the heading “Expenses Paid During the Period” to estimate the expenses you paid on your account during this period.
Hypothetical Example for Comparison Purposes
The second line for each share class in the tables below provides information about hypothetical account values and hypothetical expenses based on each Fund’s actual expense ratio and an assumed rate of return of 5% per year before expenses, which is not each Fund’s actual return. The hypothetical account values and expenses may not be used to estimate the actual ending account balance or expenses you paid for the period. You may use this information to compare the ongoing costs of investing in each Fund and other funds. To do so, compare this 5% hypothetical example with the 5% hypothetical examples that appear in the shareholder reports of the other funds.
The Funds’ transfer agent may charge additional fees to holders of certain accounts that are not included in the expenses shown in the tables on the following pages. These fees apply to individual retirement accounts (IRAs) and Section 403(b) accounts. As of the close of the period covered by the tables, IRA fees included an annual maintenance fee of $15 per account (subject to a maximum annual maintenance fee of $25 for all accounts held by the same shareholder). Section 403(b) accounts are charged an annual $25 fiduciary maintenance fee. Some of the fees may vary in amount, or may be waived, based on your total account balance or the number of Prudential funds, including the Funds, that you own. You should consider the additional fees that were charged to your Fund account over
| | | | |
| Prudential Day One Funds | | | 45 | |
Fees and Expenses (unaudited) (continued)
the period when you estimate the total ongoing expenses paid over the period and the impact of these fees on your ending account value, as these additional expenses are not reflected in the information provided in the expense tables. Additional fees have the effect of reducing investment returns.
Please note that the expenses shown in the tables are meant to highlight your ongoing costs only and do not reflect any transactional costs such as sales charges (loads). Therefore, the second line for each share class in the tables is useful in comparing ongoing costs only and will not help you determine the relative total costs of owning different funds. In addition, if these transactional costs were included, your costs would have been higher.
| | | | | | | | | | | | | | | | | | |
| Prudential Day One Income Fund | | Beginning Account
Value
February 1, 2017 | | | Ending Account
Value July 31, 2017 | | | Annualized
Expense Ratio
Based on the
Period | | | Expenses Paid
During the
Six-Month Period* | |
| Class R1 | | Actual | | $ | 1,000.00 | | | $ | 1,036.90 | | | | 1.15 | % | | $ | 5.81 | |
| | Hypothetical | | $ | 1,000.00 | | | $ | 1,019.09 | | | | 1.15 | % | | $ | 5.76 | |
| Class R2 | | Actual | | $ | 1,000.00 | | | $ | 1,038.90 | | | | 0.90 | % | | $ | 4.55 | |
| | Hypothetical | | $ | 1,000.00 | | | $ | 1,020.33 | | | | 0.90 | % | | $ | 4.51 | |
| Class R3 | | Actual | | $ | 1,000.00 | | | $ | 1,039.60 | | | | 0.75 | % | | $ | 3.79 | |
| | Hypothetical | | $ | 1,000.00 | | | $ | 1,021.08 | | | | 0.75 | % | | $ | 3.76 | |
| Class R4 | | Actual | | $ | 1,000.00 | | | $ | 1,039.20 | | | | 0.65 | % | | $ | 3.29 | |
| | Hypothetical | | $ | 1,000.00 | | | $ | 1,021.57 | | | | 0.65 | % | | $ | 3.26 | |
| Class R5 | | Actual | | $ | 1,000.00 | | | $ | 1,039.80 | | | | 0.55 | % | | $ | 2.78 | |
| | Hypothetical | | $ | 1,000.00 | | | $ | 1,022.07 | | | | 0.55 | % | | $ | 2.76 | |
| Class R6 | | Actual | | $ | 1,000.00 | | | $ | 1,037.40 | | | | 0.40 | % | | $ | 2.02 | |
| | | Hypothetical | | $ | 1,000.00 | | | $ | 1,022.81 | | | | 0.40 | % | | $ | 2.01 | |
| | |
| 46 | | Visit our website at pgiminvestments.com |
| | | | | | | | | | | | | | | | | | |
Prudential Day One
2010 Fund | | Beginning Account
Value
February 1, 2017 | | | Ending Account
Value July 31, 2017 | | | Annualized
Expense Ratio
Based on the
Period | | | Expenses Paid
During the
Six-Month Period* | |
| Class R1 | | Actual | | $ | 1,000.00 | | | $ | 1,040.90 | | | | 1.15 | % | | $ | 5.82 | |
| | Hypothetical | | $ | 1,000.00 | | | $ | 1,019.09 | | | | 1.15 | % | | $ | 5.76 | |
| Class R2 | | Actual | | $ | 1,000.00 | | | $ | 1,042.90 | | | | 0.90 | % | | $ | 4.56 | |
| | Hypothetical | | $ | 1,000.00 | | | $ | 1,020.33 | | | | 0.90 | % | | $ | 4.51 | |
| Class R3 | | Actual | | $ | 1,000.00 | | | $ | 1,043.90 | | | | 0.75 | % | | $ | 3.80 | |
| | Hypothetical | | $ | 1,000.00 | | | $ | 1,021.08 | | | | 0.75 | % | | $ | 3.76 | |
| Class R4 | | Actual | | $ | 1,000.00 | | | $ | 1,043.90 | | | | 0.65 | % | | $ | 3.29 | |
| | Hypothetical | | $ | 1,000.00 | | | $ | 1,021.57 | | | | 0.65 | % | | $ | 3.26 | |
| Class R5 | | Actual | | $ | 1,000.00 | | | $ | 1,044.90 | | | | 0.55 | % | | $ | 2.79 | |
| | Hypothetical | | $ | 1,000.00 | | | $ | 1,022.07 | | | | 0.55 | % | | $ | 2.76 | |
| Class R6 | | Actual | | $ | 1,000.00 | | | $ | 1,040.70 | | | | 0.40 | % | | $ | 2.02 | |
| | | Hypothetical | | $ | 1,000.00 | | | $ | 1,022.81 | | | | 0.40 | % | | $ | 2.01 | |
| | | | | | | | | | | | | | | | | | |
Prudential Day One
2015 Fund | | Beginning Account
Value February 1, 2017 | | | Ending Account
Value
July 31, 2017 | | | Annualized
Expense Ratio Based on the
Period | | | Expenses Paid
During the
Six-Month Period* | |
| Class R1 | | Actual | | $ | 1,000.00 | | | $ | 1,048.00 | | | | 1.15 | % | | $ | 5.84 | |
| | Hypothetical | | $ | 1,000.00 | | | $ | 1,019.09 | | | | 1.15 | % | | $ | 5.76 | |
| Class R2 | | Actual | | $ | 1,000.00 | | | $ | 1,047.90 | | | | 0.90 | % | | $ | 4.57 | |
| | Hypothetical | | $ | 1,000.00 | | | $ | 1,020.33 | | | | 0.90 | % | | $ | 4.51 | |
| Class R3 | | Actual | | $ | 1,000.00 | | | $ | 1,048.90 | | | | 0.75 | % | | $ | 3.81 | |
| | Hypothetical | | $ | 1,000.00 | | | $ | 1,021.08 | | | | 0.75 | % | | $ | 3.76 | |
| Class R4 | | Actual | | $ | 1,000.00 | | | $ | 1,048.90 | | | | 0.65 | % | | $ | 3.30 | |
| | Hypothetical | | $ | 1,000.00 | | | $ | 1,021.57 | | | | 0.65 | % | | $ | 3.26 | |
| Class R5 | | Actual | | $ | 1,000.00 | | | $ | 1,050.90 | | | | 0.55 | % | | $ | 2.80 | |
| | Hypothetical | | $ | 1,000.00 | | | $ | 1,022.07 | | | | 0.55 | % | | $ | 2.76 | |
| Class R6 | | Actual | | $ | 1,000.00 | | | $ | 1,045.70 | | | | 0.40 | % | | $ | 2.03 | |
| | | Hypothetical | | $ | 1,000.00 | | | $ | 1,022.81 | | | | 0.40 | % | | $ | 2.01 | |
| | | | |
| Prudential Day One Funds | | | 47 | |
Fees and Expenses (unaudited) (continued)
| | | | | | | | | | | | | | | | | | |
Prudential Day One
2020 Fund | | Beginning Account
Value
February 1, 2017 | | | Ending Account
Value
July 31, 2017 | | | Annualized
Expense Ratio
Based on the
Period | | | Expenses Paid
During the
Six-Month Period* | |
| Class R1 | | Actual | | $ | 1,000.00 | | | $ | 1,050.90 | | | | 1.15 | % | | $ | 5.85 | |
| | Hypothetical | | $ | 1,000.00 | | | $ | 1,019.09 | | | | 1.15 | % | | $ | 5.76 | |
| Class R2 | | Actual | | $ | 1,000.00 | | | $ | 1,051.90 | | | | 0.90 | % | | $ | 4.58 | |
| | Hypothetical | | $ | 1,000.00 | | | $ | 1,020.33 | | | | 0.90 | % | | $ | 4.51 | |
| Class R3 | | Actual | | $ | 1,000.00 | | | $ | 1,052.90 | | | | 0.75 | % | | $ | 3.82 | |
| | Hypothetical | | $ | 1,000.00 | | | $ | 1,021.08 | | | | 0.75 | % | | $ | 3.76 | |
| Class R4 | | Actual | | $ | 1,000.00 | | | $ | 1,052.90 | | | | 0.65 | % | | $ | 3.31 | |
| | Hypothetical | | $ | 1,000.00 | | | $ | 1,021.57 | | | | 0.65 | % | | $ | 3.26 | |
| Class R5 | | Actual | | $ | 1,000.00 | | | $ | 1,053.90 | | | | 0.55 | % | | $ | 2.80 | |
| | Hypothetical | | $ | 1,000.00 | | | $ | 1,022.07 | | | | 0.55 | % | | $ | 2.76 | |
| Class R6 | | Actual | | $ | 1,000.00 | | | $ | 1,046.70 | | | | 0.40 | % | | $ | 2.03 | |
| | | Hypothetical | | $ | 1,000.00 | | | $ | 1,022.81 | | | | 0.40 | % | | $ | 2.01 | |
| | | | | | | | | | | | | | | | | | |
Prudential Day One
2025 Fund | | Beginning Account
Value
February 1, 2017 | | | Ending Account
Value
July 31, 2017 | | | Annualized
Expense Ratio Based on the
Period | | | Expenses Paid
During the
Six-Month Period* | |
| Class R1 | | Actual | | $ | 1,000.00 | | | $ | 1,058.00 | | | | 1.15 | % | | $ | 5.87 | |
| | Hypothetical | | $ | 1,000.00 | | | $ | 1,019.09 | | | | 1.15 | % | | $ | 5.76 | |
| Class R2 | | Actual | | $ | 1,000.00 | | | $ | 1,059.00 | | | | 0.90 | % | | $ | 4.59 | |
| | Hypothetical | | $ | 1,000.00 | | | $ | 1,020.33 | | | | 0.90 | % | | $ | 4.51 | |
| Class R3 | | Actual | | $ | 1,000.00 | | | $ | 1,061.00 | | | | 0.75 | % | | $ | 3.83 | |
| | Hypothetical | | $ | 1,000.00 | | | $ | 1,021.08 | | | | 0.75 | % | | $ | 3.76 | |
| Class R4 | | Actual | | $ | 1,000.00 | | | $ | 1,061.00 | | | | 0.65 | % | | $ | 3.32 | |
| | Hypothetical | | $ | 1,000.00 | | | $ | 1,021.57 | | | | 0.65 | % | | $ | 3.26 | |
| Class R5 | | Actual | | $ | 1,000.00 | | | $ | 1,060.90 | | | | 0.55 | % | | $ | 2.81 | |
| | Hypothetical | | $ | 1,000.00 | | | $ | 1,022.07 | | | | 0.55 | % | | $ | 2.76 | |
| Class R6 | | Actual | | $ | 1,000.00 | | | $ | 1,058.70 | | | | 0.40 | % | | $ | 2.04 | |
| | | Hypothetical | | $ | 1,000.00 | | | $ | 1,022.81 | | | | 0.40 | % | | $ | 2.01 | |
| | |
| 48 | | Visit our website at pgiminvestments.com |
| | | | | | | | | | | | | | | | | | |
Prudential Day One
2030 Fund | | Beginning Account
Value
February 1, 2017 | | | Ending Account
Value July 31, 2017 | | | Annualized
Expense Ratio
Based on the
Period | | | Expenses Paid
During the
Six-Month Period* | |
| Class R1 | | Actual | | $ | 1,000.00 | | | $ | 1,075.10 | | | | 1.15 | % | | $ | 5.92 | |
| | Hypothetical | | $ | 1,000.00 | | | $ | 1,019.09 | | | | 1.15 | % | | $ | 5.76 | |
| Class R2 | | Actual | | $ | 1,000.00 | | | $ | 1,075.00 | | | | 0.90 | % | | $ | 4.63 | |
| | Hypothetical | | $ | 1,000.00 | | | $ | 1,020.33 | | | | 0.90 | % | | $ | 4.51 | |
| Class R3 | | Actual | | $ | 1,000.00 | | | $ | 1,076.00 | | | | 0.75 | % | | $ | 3.86 | |
| | Hypothetical | | $ | 1,000.00 | | | $ | 1,021.08 | | | | 0.75 | % | | $ | 3.76 | |
| Class R4 | | Actual | | $ | 1,000.00 | | | $ | 1,077.00 | | | | 0.65 | % | | $ | 3.35 | |
| | Hypothetical | | $ | 1,000.00 | | | $ | 1,021.57 | | | | 0.65 | % | | $ | 3.26 | |
| Class R5 | | Actual | | $ | 1,000.00 | | | $ | 1,078.00 | | | | 0.55 | % | | $ | 2.83 | |
| | Hypothetical | | $ | 1,000.00 | | | $ | 1,022.07 | | | | 0.55 | % | | $ | 2.76 | |
| Class R6 | | Actual | | $ | 1,000.00 | | | $ | 1,073.60 | | | | 0.40 | % | | $ | 2.06 | |
| | | Hypothetical | | $ | 1,000.00 | | | $ | 1,022.81 | | | | 0.40 | % | | $ | 2.01 | |
| | | | | | | | | | | | | | | | | | |
Prudential Day One
2035 Fund | | Beginning Account
Value
February 1, 2017 | | | Ending Account
Value
July 31, 2017 | | | Annualized
Expense Ratio Based on the
Period | | | Expenses Paid
During the
Six-Month Period* | |
| Class R1 | | Actual | | $ | 1,000.00 | | | $ | 1,079.90 | | | | 1.15 | % | | $ | 5.93 | |
| | Hypothetical | | $ | 1,000.00 | | | $ | 1,019.09 | | | | 1.15 | % | | $ | 5.76 | |
| Class R2 | | Actual | | $ | 1,000.00 | | | $ | 1,081.90 | | | | 0.90 | % | | $ | 4.65 | |
| | Hypothetical | | $ | 1,000.00 | | | $ | 1,020.33 | | | | 0.90 | % | | $ | 4.51 | |
| Class R3 | | Actual | | $ | 1,000.00 | | | $ | 1,082.90 | | | | 0.75 | % | | $ | 3.87 | |
| | Hypothetical | | $ | 1,000.00 | | | $ | 1,021.08 | | | | 0.75 | % | | $ | 3.76 | |
| Class R4 | | Actual | | $ | 1,000.00 | | | $ | 1,083.90 | | | | 0.65 | % | | $ | 3.36 | |
| | Hypothetical | | $ | 1,000.00 | | | $ | 1,021.57 | | | | 0.65 | % | | $ | 3.26 | |
| Class R5 | | Actual | | $ | 1,000.00 | | | $ | 1,083.90 | | | | 0.55 | % | | $ | 2.84 | |
| | Hypothetical | | $ | 1,000.00 | | | $ | 1,022.07 | | | | 0.55 | % | | $ | 2.76 | |
| Class R6 | | Actual | | $ | 1,000.00 | | | $ | 1,080.50 | | | | 0.40 | % | | $ | 2.06 | |
| | | Hypothetical | | $ | 1,000.00 | | | $ | 1,022.81 | | | | 0.40 | % | | $ | 2.01 | |
| | | | |
| Prudential Day One Funds | | | 49 | |
Fees and Expenses (unaudited) (continued)
| | | | | | | | | | | | | | | | | | |
Prudential Day One
2040 Fund | | Beginning Account
Value
February 1, 2017 | | | Ending Account
Value July 31, 2017 | | | Annualized
Expense Ratio
Based on the
Period | | | Expenses Paid
During the
Six-Month Period* | |
| Class R1 | | Actual | | $ | 1,000.00 | | | $ | 1,088.90 | | | | 1.15 | % | | $ | 5.96 | |
| | Hypothetical | | $ | 1,000.00 | | | $ | 1,019.09 | | | | 1.15 | % | | $ | 5.76 | |
| Class R2 | | Actual | | $ | 1,000.00 | | | $ | 1,090.90 | | | | 0.90 | % | | $ | 4.67 | |
| | Hypothetical | | $ | 1,000.00 | | | $ | 1,020.33 | | | | 0.90 | % | | $ | 4.51 | |
| Class R3 | | Actual | | $ | 1,000.00 | | | $ | 1,091.90 | | | | 0.75 | % | | $ | 3.89 | |
| | Hypothetical | | $ | 1,000.00 | | | $ | 1,021.08 | | | | 0.75 | % | | $ | 3.76 | |
| Class R4 | | Actual | | $ | 1,000.00 | | | $ | 1,092.90 | | | | 0.65 | % | | $ | 3.37 | |
| | Hypothetical | | $ | 1,000.00 | | | $ | 1,021.57 | | | | 0.65 | % | | $ | 3.26 | |
| Class R5 | | Actual | | $ | 1,000.00 | | | $ | 1,092.80 | | | | 0.55 | % | | $ | 2.85 | |
| | Hypothetical | | $ | 1,000.00 | | | $ | 1,022.07 | | | | 0.55 | % | | $ | 2.76 | |
| Class R6 | | Actual | | $ | 1,000.00 | | | $ | 1,089.50 | | | | 0.40 | % | | $ | 2.07 | |
| | | Hypothetical | | $ | 1,000.00 | | | $ | 1,022.81 | | | | 0.40 | % | | $ | 2.01 | |
| | | | | | | | | | | | | | | | | | |
Prudential Day One
2045 Fund | | Beginning Account
Value
February 1, 2017 | | | Ending Account
Value
July 31, 2017 | | | Annualized
Expense Ratio Based on the
Period | | | Expenses Paid
During the
Six-Month Period* | |
| Class R1 | | Actual | | $ | 1,000.00 | | | $ | 1,095.90 | | | | 1.15 | % | | $ | 5.98 | |
| | Hypothetical | | $ | 1,000.00 | | | $ | 1,019.09 | | | | 1.15 | % | | $ | 5.76 | |
| Class R2 | | Actual | | $ | 1,000.00 | | | $ | 1,096.90 | | | | 0.90 | % | | $ | 4.68 | |
| | Hypothetical | | $ | 1,000.00 | | | $ | 1,020.33 | | | | 0.90 | % | | $ | 4.51 | |
| Class R3 | | Actual | | $ | 1,000.00 | | | $ | 1,096.80 | | | | 0.75 | % | | $ | 3.90 | |
| | Hypothetical | | $ | 1,000.00 | | | $ | 1,021.08 | | | | 0.75 | % | | $ | 3.76 | |
| Class R4 | | Actual | | $ | 1,000.00 | | | $ | 1,097.80 | | | | 0.65 | % | | $ | 3.38 | |
| | Hypothetical | | $ | 1,000.00 | | | $ | 1,021.57 | | | | 0.65 | % | | $ | 3.26 | |
| Class R5 | | Actual | | $ | 1,000.00 | | | $ | 1,098.80 | | | | 0.55 | % | | $ | 2.86 | |
| | Hypothetical | | $ | 1,000.00 | | | $ | 1,022.07 | | | | 0.55 | % | | $ | 2.76 | |
| Class R6 | | Actual | | $ | 1,000.00 | | | $ | 1,096.40 | | | | 0.40 | % | | $ | 2.08 | |
| | | Hypothetical | | $ | 1,000.00 | | | $ | 1,022.81 | | | | 0.40 | % | | $ | 2.01 | |
| | |
| 50 | | Visit our website at pgiminvestments.com |
| | | | | | | | | | | | | | | | | | |
Prudential Day One
2050 Fund | | Beginning Account
Value
February 1, 2017 | | | Ending Account
Value July 31, 2017 | | | Annualized
Expense Ratio
Based on the
Period | | | Expenses Paid
During the
Six-Month Period* | |
| Class R1 | | Actual | | $ | 1,000.00 | | | $ | 1,092.80 | | | | 1.15 | % | | $ | 5.97 | |
| | Hypothetical | | $ | 1,000.00 | | | $ | 1,019.09 | | | | 1.15 | % | | $ | 5.76 | |
| Class R2 | | Actual | | $ | 1,000.00 | | | $ | 1,093.80 | | | | 0.90 | % | | $ | 4.67 | |
| | Hypothetical | | $ | 1,000.00 | | | $ | 1,020.33 | | | | 0.90 | % | | $ | 4.51 | |
| Class R3 | | Actual | | $ | 1,000.00 | | | $ | 1,094.80 | | | | 0.75 | % | | $ | 3.90 | |
| | Hypothetical | | $ | 1,000.00 | | | $ | 1,021.08 | | | | 0.75 | % | | $ | 3.76 | |
| Class R4 | | Actual | | $ | 1,000.00 | | | $ | 1,095.80 | | | | 0.65 | % | | $ | 3.38 | |
| | Hypothetical | | $ | 1,000.00 | | | $ | 1,021.57 | | | | 0.65 | % | | $ | 3.26 | |
| Class R5 | | Actual | | $ | 1,000.00 | | | $ | 1,096.80 | | | | 0.55 | % | | $ | 2.86 | |
| | Hypothetical | | $ | 1,000.00 | | | $ | 1,022.07 | | | | 0.55 | % | | $ | 2.76 | |
| Class R6 | | Actual | | $ | 1,000.00 | | | $ | 1,092.40 | | | | 0.40 | % | | $ | 2.08 | |
| | | Hypothetical | | $ | 1,000.00 | | | $ | 1,022.81 | | | | 0.40 | % | | $ | 2.01 | |
| | | | | | | | | | | | | | | | | | |
Prudential Day One
2055 Fund | | Beginning Account
Value February 1, 2017 | | | Ending Account
Value July 31, 2017 | | | Annualized
Expense Ratio Based on the
Period | | | Expenses Paid
During the
Six-Month Period* | |
| Class R1 | | Actual | | $ | 1,000.00 | | | $ | 1,105.90 | | | | 1.15 | % | | $ | 6.00 | |
| | Hypothetical | | $ | 1,000.00 | | | $ | 1,019.09 | | | | 1.15 | % | | $ | 5.76 | |
| Class R2 | | Actual | | $ | 1,000.00 | | | $ | 1,106.80 | | | | 0.90 | % | | $ | 4.70 | |
| | Hypothetical | | $ | 1,000.00 | | | $ | 1,020.33 | | | | 0.90 | % | | $ | 4.51 | |
| Class R3 | | Actual | | $ | 1,000.00 | | | $ | 1,107.80 | | | | 0.75 | % | | $ | 3.92 | |
| | Hypothetical | | $ | 1,000.00 | | | $ | 1,021.08 | | | | 0.75 | % | | $ | 3.76 | |
| Class R4 | | Actual | | $ | 1,000.00 | | | $ | 1,108.80 | | | | 0.65 | % | | $ | 3.40 | |
| | Hypothetical | | $ | 1,000.00 | | | $ | 1,021.57 | | | | 0.65 | % | | $ | 3.26 | |
| Class R5 | | Actual | | $ | 1,000.00 | | | $ | 1,109.80 | | | | 0.55 | % | | $ | 2.88 | |
| | Hypothetical | | $ | 1,000.00 | | | $ | 1,022.07 | | | | 0.55 | % | | $ | 2.76 | |
| Class R6 | | Actual | | $ | 1,000.00 | | | $ | 1,105.30 | | | | 0.40 | % | | $ | 2.09 | |
| | | Hypothetical | | $ | 1,000.00 | | | $ | 1,022.81 | | | | 0.40 | % | | $ | 2.01 | |
| | | | |
| Prudential Day One Funds | | | 51 | |
Fees and Expenses (unaudited) (continued)
| | | | | | | | | | | | | | | | | | |
Prudential Day One
2060 Fund | | Beginning Account
Value
February 1, 2017 | | | Ending Account
Value July 31, 2017 | | | Annualized
Expense Ratio
Based on the
Period | | | Expenses Paid
During the
Six-Month Period* | |
| Class R1 | | Actual | | $ | 1,000.00 | | | $ | 1,099.90 | | | | 1.15 | % | | $ | 5.99 | |
| | Hypothetical | | $ | 1,000.00 | | | $ | 1,019.09 | | | | 1.15 | % | | $ | 5.76 | |
| Class R2 | | Actual | | $ | 1,000.00 | | | $ | 1,100.80 | | | | 0.90 | % | | $ | 4.69 | |
| | Hypothetical | | $ | 1,000.00 | | | $ | 1,020.33 | | | | 0.90 | % | | $ | 4.51 | |
| Class R3 | | Actual | | $ | 1,000.00 | | | $ | 1,101.80 | | | | 0.75 | % | | $ | 3.91 | |
| | Hypothetical | | $ | 1,000.00 | | | $ | 1,021.08 | | | | 0.75 | % | | $ | 3.76 | |
| Class R4 | | Actual | | $ | 1,000.00 | | | $ | 1,101.80 | | | | 0.65 | % | | $ | 3.39 | |
| | Hypothetical | | $ | 1,000.00 | | | $ | 1,021.57 | | | | 0.65 | % | | $ | 3.26 | |
| Class R5 | | Actual | | $ | 1,000.00 | | | $ | 1,102.80 | | | | 0.55 | % | | $ | 2.87 | |
| | Hypothetical | | $ | 1,000.00 | | | $ | 1,022.07 | | | | 0.55 | % | | $ | 2.76 | |
| Class R6 | | Actual | | $ | 1,000.00 | | | $ | 1,098.30 | | | | 0.40 | % | | $ | 2.08 | |
| | | Hypothetical | | $ | 1,000.00 | | | $ | 1,022.81 | | | | 0.40 | % | | $ | 2.01 | |
*Fund expenses (net of fee waivers or subsidies, if any) for each share class are equal to the annualized expense ratio for each share class (provided in the tables), multiplied by the average account value over the period, multiplied by the 181 days in the six-month period ended July 31, 2017, and divided by the 365 days in the Fund's fiscal year ended July 31, 2017 (to reflect the six-month period). Expenses presented in the table include the expenses of any underlying portfolios in which the Fund may invest.
| | |
| 52 | | Visit our website at pgiminvestments.com |
Prudential Day One Income Fund
Schedule of Investments
as of July 31, 2017
| | | | | | | | |
| Description | | Shares | | | Value | |
LONG-TERM INVESTMENTS 89.9% | | | | | | | | |
| | |
AFFILIATED MUTUAL FUNDS | | | | | | | | |
Prudential Commodity Strategies Fund (Class Q)* | | | 10,027 | | | $ | 101,774 | |
Prudential Core Conservative Bond Fund (Class Q) | | | 28,458 | | | | 285,435 | |
Prudential Global Real Estate Fund (Class Q) | | | 4,203 | | | | 101,918 | |
Prudential Jennison Small-Cap Core Equity Fund (Class Q) | | | 1,805 | | | | 20,340 | |
Prudential QMA International Developed Markets Index Fund (Class Q) | | | 8,454 | | | | 102,045 | |
Prudential QMA Large-Cap Core Equity Fund (Class Q) | | | 13,814 | | | | 244,363 | |
Prudential QMA Mid-Cap Core Equity Fund (Class Q) | | | 1,824 | | | | 20,357 | |
Prudential QMA US Broad Market Index Fund (Class Q) | | | 10,752 | | | | 122,143 | |
Prudential TIPS Fund (Class Q) | | | 53,699 | | | | 529,468 | |
Prudential Total Return Bond Fund (Class Q) | | | 21,066 | | | | 305,886 | |
| | | | | | | | |
TOTAL LONG-TERM INVESTMENTS
(cost $1,823,678) | | | | | | | 1,833,729 | |
| | | | | | | | |
| | |
SHORT-TERM INVESTMENT 10.7% | | | | | | | | |
| | |
AFFILIATED MUTUAL FUND | | | | | | | | |
Prudential Investment Portfolios 2 - Prudential Core
Ultra Short Bond Fund
(cost $218,779) | | | 218,779 | | | | 218,779 | |
| | | | | | | | |
TOTAL INVESTMENTS 100.6%
(cost $2,042,457)(w) | | | | | | | 2,052,508 | |
Liabilities in excess of other assets (0.6)% | | | | | | | (13,389 | ) |
| | | | | | | | |
NET ASSETS 100.0% | | | | | | $ | 2,039,119 | |
| | | | | | | | |
The following abbreviation is used in the annual report:
LIBOR—London Interbank Offered Rate
| * | Non-income producing security. |
| (w) | PGIM Investments LLC, the manager of the Fund, also serves as the manager of the underlying funds in which the Fund invests. |
Fair Value Measurements:
Various inputs are used in determining the value of the Fund’s investments. These inputs are summarized in the three broad levels listed below.
Level 1—unadjusted quoted prices generally in active markets for identical securities.
Level 2—quoted prices for similar securities, interest rates and yield curves, prepayment speeds, foreign currency exchange rates and other observable inputs.
Level 3—unobservable inputs for securities valued in accordance with Board approved fair valuation procedures.
See Notes to Financial Statements.
| | | | |
| Prudential Day One Funds | | | 53 | |
Prudential Day One Income Fund
Schedule of Investments (continued)
as of July 31, 2017
The following is a summary of the inputs used as of July 31, 2017 in valuing such portfolio securities:
| | | | | | | | | | | | |
| | | Level 1 | | | Level 2 | | | Level 3 | |
Investments in Securities | |
Affiliated Mutual Funds | | $ | 2,052,508 | | | $ | — | | | $ | — | |
| | | | | | | | | | | | |
During the period, there were no transfers between Level 1, Level 2 and Level 3 to report.
Investment Allocation:
The investment allocation of investments and liabilities in excess of other assets shown as a percentage of net assets as of July 31, 2017 were as follows (unaudited):
| | | | |
TIPS | | | 25.9 | % |
Total Return Bond | | | 15.0 | |
Core Conservative Bond | | | 14.0 | |
Large-Cap Core Equity | | | 12.0 | |
Core Ultra Short Bond | | | 10.7 | |
U.S. Broad Market Index | | | 6.0 | |
International Developed Markets Index | | | 5.0 | |
Global Real Estate | | | 5.0 | |
Commodities Strategies | | | 5.0 | % |
Mid-Cap Core Equity | | | 1.0 | |
Small-Cap Core Equity | | | 1.0 | |
| | | | |
| | | 100.6 | |
Liabilities in excess of other assets | | | (0.6 | ) |
| | | | |
| | | 100.0 | % |
| | | | |
See Notes to Financial Statements.
Prudential Day One 2010 Fund
Schedule of Investments
as of July 31, 2017
| | | | | | | | |
| Description | | Shares | | | Value | |
LONG-TERM INVESTMENTS 90.9% | | | | | | | | |
| | |
AFFILIATED MUTUAL FUNDS | | | | | | | | |
Prudential Commodity Strategies Fund (Class Q)* | | | 22,219 | | | $ | 225,521 | |
Prudential Core Conservative Bond Fund (Class Q) | | | 63,104 | | | | 632,932 | |
Prudential Global Real Estate Fund (Class Q) | | | 9,313 | | | | 225,843 | |
Prudential Jennison Small-Cap Core Equity Fund (Class Q) | | | 3,999 | | | | 45,070 | |
Prudential QMA International Developed Markets Index Fund (Class Q) | | | 18,735 | | | | 226,129 | |
Prudential QMA Large-Cap Core Equity Fund (Class Q) | | | 30,610 | | | | 541,487 | |
Prudential QMA Mid-Cap Core Equity Fund (Class Q) | | | 8,084 | | | | 90,218 | |
Prudential QMA US Broad Market Index Fund (Class Q) | | | 27,796 | | | | 315,767 | |
Prudential TIPS Fund (Class Q) | | | 114,476 | | | | 1,128,731 | |
Prudential Total Return Bond Fund (Class Q) | | | 46,724 | | | | 678,427 | |
| | | | | | | | |
TOTAL LONG-TERM INVESTMENTS
(cost $4,054,686) | | | | | | | 4,110,125 | |
| | | | | | | | |
| | |
SHORT-TERM INVESTMENT 9.3% | | | | | | | | |
| | |
AFFILIATED MUTUAL FUND | | | | | | | | |
Prudential Investment Portfolios 2 - Prudential Core
Ultra Short Bond Fund
(cost $418,993) | | | 418,993 | | | | 418,993 | |
| | | | | | | | |
TOTAL INVESTMENTS 100.2%
(cost $4,473,679)(w) | | | | | | | 4,529,118 | |
Liabilities in excess of other assets (0.2)% | | | | | | | (9,019 | ) |
| | | | | | | | |
NET ASSETS 100.0% | | | | | | $ | 4,520,099 | |
| | | | | | | | |
The following abbreviation is used in the annual report:
LIBOR—London Interbank Offered Rate
| * | Non-income producing security. |
| (w) | PGIM Investments LLC, the manager of the Fund, also serves as the manager of the underlying funds in which the Fund invests. |
Fair Value Measurements:
Various inputs are used in determining the value of the Fund’s investments. These inputs are summarized in the three broad levels listed below.
Level 1—unadjusted quoted prices generally in active markets for identical securities.
Level 2—quoted prices for similar securities, interest rates and yield curves, prepayment speeds, foreign currency exchange rates and other observable inputs.
Level 3—unobservable inputs for securities valued in accordance with Board approved fair valuation procedures.
See Notes to Financial Statements.
| | | | |
| Prudential Day One Funds | | | 55 | |
Prudential Day One 2010 Fund
Schedule of Investments (continued)
as of July 31, 2017
The following is a summary of the inputs used as of July 31, 2017 in valuing such portfolio securities:
| | | | | | | | | | | | |
| | | Level 1 | | | Level 2 | | | Level 3 | |
Investments in Securities | |
Affiliated Mutual Funds | | $ | 4,529,118 | | | $ | — | | | $ | — | |
| | | | | | | | | | | | |
During the period, there were no transfers between Level 1, Level 2 and Level 3 to report.
Investment Allocation:
The investment allocation of investments and liabilities in excess of other assets shown as a percentage of net assets as of July 31, 2017 were as follows (unaudited):
| | | | |
TIPS | | | 24.9 | % |
Total Return Bond | | | 15.0 | |
Core Conservative Bond | | | 14.0 | |
Large-Cap Core Equity | | | 12.0 | |
Core Ultra Short Bond | | | 9.3 | |
U.S. Broad Market Index | | | 7.0 | |
International Developed Markets Index | | | 5.0 | |
Global Real Estate | | | 5.0 | |
Commodities Strategies | | | 5.0 | % |
Mid-Cap Core Equity | | | 2.0 | |
Small-Cap Core Equity | | | 1.0 | |
| | | | |
| | | 100.2 | |
Liabilities in excess of other assets | | | (0.2 | ) |
| | | | |
| | | 100.0 | % |
| | | | |
See Notes to Financial Statements.
Prudential Day One 2015 Fund
Schedule of Investments
as of July 31, 2017
| | | | | | | | |
| Description | | Shares | | | Value | |
LONG-TERM INVESTMENTS 90.9% | | | | | | | | |
| | |
AFFILIATED MUTUAL FUNDS | | | | | | | | |
Prudential Commodity Strategies Fund (Class Q)* | | | 20,605 | | | $ | 209,145 | |
Prudential Core Conservative Bond Fund (Class Q) | | | 50,166 | | | | 503,161 | |
Prudential Global Real Estate Fund (Class Q) | | | 8,637 | | | | 209,440 | |
Prudential Jennison Small-Cap Core Equity Fund (Class Q) | | | 3,709 | | | | 41,798 | |
Prudential QMA International Developed Markets Index Fund (Class Q) | | | 24,323 | | | | 293,581 | |
Prudential QMA Large-Cap Core Equity Fund (Class Q) | | | 33,118 | | | | 585,861 | |
Prudential QMA Mid-Cap Core Equity Fund (Class Q) | | | 7,497 | | | | 83,668 | |
Prudential QMA US Broad Market Index Fund (Class Q) | | | 29,461 | | | | 334,673 | |
Prudential TIPS Fund (Class Q) | | | 101,924 | | | | 1,004,967 | |
Prudential Total Return Bond Fund (Class Q) | | | 37,558 | | | | 545,337 | |
| | | | | | | | |
TOTAL LONG-TERM INVESTMENTS
(cost $3,748,641) | | | | | | | 3,811,631 | |
| | | | | | | | |
| | |
SHORT-TERM INVESTMENT 9.2% | | | | | | | | |
| | |
AFFILIATED MUTUAL FUND | | | | | | | | |
Prudential Investment Portfolios 2 - Prudential Core
Ultra Short Bond Fund
(cost $382,917) | | | 382,917 | | | | 382,917 | |
| | | | | | | | |
TOTAL INVESTMENTS 100.1%
(cost $4,131,558)(w) | | | | | | | 4,194,548 | |
Liabilities in excess of other assets (0.1)% | | | | | | | (2,768 | ) |
| | | | | | | | |
NET ASSETS 100.0% | | | | | | $ | 4,191,780 | |
| | | | | | | | |
The following abbreviation is used in the annual report:
LIBOR—London Interbank Offered Rate
| * | Non-income producing security. |
| (w) | PGIM Investments LLC, the manager of the Fund, also serves as the manager of the underlying funds in which the Fund invests. |
Fair Value Measurements:
Various inputs are used in determining the value of the Fund’s investments. These inputs are summarized in the three broad levels listed below.
Level 1—unadjusted quoted prices generally in active markets for identical securities.
Level 2—quoted prices for similar securities, interest rates and yield curves, prepayment speeds, foreign currency exchange rates and other observable inputs.
Level 3—unobservable inputs for securities valued in accordance with Board approved fair valuation procedures.
See Notes to Financial Statements.
| | | | |
| Prudential Day One Funds | | | 57 | |
Prudential Day One 2015 Fund
Schedule of Investments (continued)
as of July 31, 2017
The following is a summary of the inputs used as of July 31, 2017 in valuing such portfolio securities:
| | | | | | | | | | | | |
| | | Level 1 | | | Level 2 | | | Level 3 | |
Investments in Securities | |
Affiliated Mutual Funds | | $ | 4,194,548 | | | $ | — | | | $ | — | |
| | | | | | | | | | | | |
During the period, there were no transfers between Level 1, Level 2 and Level 3 to report.
Investment Allocation:
The investment allocation of investments and liabilities in excess of other assets shown as a percentage of net assets as of July 31, 2017 were as follows (unaudited):
| | | | |
TIPS | | | 24.0 | % |
Large-Cap Core Equity | | | 14.0 | |
Total Return Bond | | | 13.0 | |
Core Conservative Bond | | | 12.0 | |
Core Ultra Short Bond | | | 9.1 | |
U.S. Broad Market Index | | | 8.0 | |
International Developed Markets Index | | | 7.0 | |
Global Real Estate | | | 5.0 | |
Commodities Strategies | | | 5.0 | % |
Mid-Cap Core Equity | | | 2.0 | |
Small-Cap Core Equity | | | 1.0 | |
| | | | |
| | | 100.1 | |
Liabilities in excess of other assets | | | (0.1 | ) |
| | | | |
| | | 100.0 | % |
| | | | |
See Notes to Financial Statements.
Prudential Day One 2020 Fund
Schedule of Investments
as of July 31, 2017
| | | | | | | | |
| Description | | Shares | | | Value | |
LONG-TERM INVESTMENTS 91.9% | | | | | | | | |
| | |
AFFILIATED MUTUAL FUNDS | | | | | | | | |
Prudential Commodity Strategies Fund (Class Q)* | | | 61,880 | | | $ | 628,081 | |
Prudential Core Conservative Bond Fund (Class Q) | | | 138,097 | | | | 1,385,113 | |
Prudential Global Real Estate Fund (Class Q) | | | 25,937 | | | | 628,977 | |
Prudential Jennison Small-Cap Core Equity Fund (Class Q) | | | 11,138 | | | | 125,521 | |
Prudential QMA International Developed Markets Index Fund (Class Q) | | | 83,483 | | | | 1,007,635 | |
Prudential QMA Large-Cap Core Equity Fund (Class Q) | | | 120,770 | | | | 2,136,415 | |
Prudential QMA Mid-Cap Core Equity Fund (Class Q) | | | 22,514 | | | | 251,261 | |
Prudential QMA US Broad Market Index Fund (Class Q) | | | 99,532 | | | | 1,130,686 | |
Prudential TIPS Fund (Class Q) | | | 280,574 | | | | 2,766,461 | |
Prudential Total Return Bond Fund (Class Q) | | | 104,112 | | | | 1,511,709 | |
| | | | | | | | |
TOTAL LONG-TERM INVESTMENTS
(cost $11,380,428) | | | | | | | 11,571,859 | |
| | | | | | | | |
| | |
SHORT-TERM INVESTMENT 8.1% | | | | | | | | |
| | |
AFFILIATED MUTUAL FUND | | | | | | | | |
Prudential Investment Portfolios 2 - Prudential Core
Ultra Short Bond Fund
(cost $1,015,961) | | | 1,015,961 | | | | 1,015,961 | |
| | | | | | | | |
TOTAL INVESTMENTS 100.0%
(cost $12,396,389)(w) | | | | | | | 12,587,820 | |
Other assets in excess of liabilities 0.0% | | | | | | | 76 | |
| | | | | | | | |
NET ASSETS 100.0% | | | | | | $ | 12,587,896 | |
| | | | | | | | |
The following abbreviation is used in the annual report:
LIBOR—London Interbank Offered Rate
| * | Non-income producing security. |
| (w) | PGIM Investments LLC, the manager of the Fund, also serves as the manager of the underlying funds in which the Fund invests. |
Fair Value Measurements:
Various inputs are used in determining the value of the Fund’s investments. These inputs are summarized in the three broad levels listed below.
Level 1—unadjusted quoted prices generally in active markets for identical securities.
Level 2—quoted prices for similar securities, interest rates and yield curves, prepayment speeds, foreign currency exchange rates and other observable inputs.
Level 3—unobservable inputs for securities valued in accordance with Board approved fair valuation procedures.
See Notes to Financial Statements.
| | | | |
| Prudential Day One Funds | | | 59 | |
Prudential Day One 2020 Fund
Schedule of Investments (continued)
as of July 31, 2017
The following is a summary of the inputs used as of July 31, 2017 in valuing such portfolio securities:
| | | | | | | | | | | | |
| | | Level 1 | | | Level 2 | | | Level 3 | |
Investments in Securities | |
Affiliated Mutual Funds | | $ | 12,587,820 | | | $ | — | | | $ | — | |
| | | | | | | | | | | | |
During the period, there were no transfers between Level 1, Level 2 and Level 3 to report.
Investment Allocation:
The investment allocation of investments and other assets in excess of liabilities shown as a percentage of net assets as of July 31, 2017 were as follows (unaudited):
| | | | |
TIPS | | | 22.0 | % |
Large-Cap Core Equity | | | 16.9 | |
Total Return Bond | | | 12.0 | |
Core Conservative Bond | | | 11.0 | |
U.S. Broad Market Index | | | 9.0 | |
Core Ultra Short Bond | | | 8.1 | |
International Developed Markets Index | | | 8.0 | |
Global Real Estate | | | 5.0 | |
Commodities Strategies | | | 5.0 | % |
Mid-Cap Core Equity | | | 2.0 | |
Small-Cap Core Equity | | | 1.0 | |
| | | | |
| | | 100.0 | |
Other assets in excess of liabilities | | | 0.0 | * |
| | | | |
| | | 100.0 | % |
| | | | |
See Notes to Financial Statements.
Prudential Day One 2025 Fund
Schedule of Investments
as of July 31, 2017
| | | | | | | | |
| Description | | Shares | | | Value | |
LONG-TERM INVESTMENTS 92.9% | | | | | | | | |
| | |
AFFILIATED MUTUAL FUNDS | | | | | | | | |
Prudential Commodity Strategies Fund (Class Q)* | | | 88,687 | | | $ | 900,175 | |
Prudential Core Conservative Bond Fund (Class Q) | | | 143,899 | | | | 1,443,307 | |
Prudential Global Real Estate Fund (Class Q) | | | 37,173 | | | | 901,454 | |
Prudential Jennison Small-Cap Core Equity Fund (Class Q) | | | 15,963 | | | | 179,899 | |
Prudential QMA International Developed Markets Index Fund (Class Q) | | | 134,603 | | | | 1,624,657 | |
Prudential QMA Large-Cap Core Equity Fund (Class Q) | | | 213,815 | | | | 3,782,386 | |
Prudential QMA Mid-Cap Core Equity Fund (Class Q) | | | 48,402 | | | | 540,165 | |
Prudential QMA US Broad Market Index (Class Q) | | | 190,201 | | | | 2,160,681 | |
Prudential TIPS Fund (Class Q) | | | 328,933 | | | | 3,243,276 | |
Prudential Total Return Bond Fund (Class Q) | | | 136,724 | | | | 1,985,239 | |
| | | | | | | | |
TOTAL LONG-TERM INVESTMENTS
(cost $16,543,150) | | | | | | | 16,761,239 | |
| | | | | | | | |
| | |
SHORT-TERM INVESTMENT 7.1% | | | | | | | | |
| | |
AFFILIATED MUTUAL FUND | | | | | | | | |
Prudential Investment Portfolios 2 - Prudential Core
Ultra Short Bond Fund
(cost $1,272,401) | | | 1,272,401 | | | | 1,272,401 | |
| | | | | | | | |
TOTAL INVESTMENTS 100.0%
(cost $17,815,551)(w) | | | | | | | 18,033,640 | |
Other assets in excess of liabilities 0.0% | | | | | | | 3,571 | |
| | | | | | | | |
NET ASSETS 100.0% | | | | | | $ | 18,037,211 | |
| | | | | | | | |
The following abbreviation is used in the annual report:
LIBOR—London Interbank Offered Rate
| * | Non-income producing security. |
| (w) | PGIM Investments LLC, the manager of the Fund, also serves as the manager of the underlying funds in which the Fund invests. |
Fair Value Measurements:
Various inputs are used in determining the value of the Fund’s investments. These inputs are summarized in the three broad levels listed below.
Level 1—unadjusted quoted prices generally in active markets for identical securities.
Level 2—quoted prices for similar securities, interest rates and yield curves, prepayment speeds, foreign currency exchange rates and other observable inputs.
Level 3—unobservable inputs for securities valued in accordance with Board approved fair valuation procedures.
See Notes to Financial Statements.
| | | | |
| Prudential Day One Funds | | | 61 | |
Prudential Day One 2025 Fund
Schedule of Investments (continued)
as of July 31, 2017
The following is a summary of the inputs used as of July 31, 2017 in valuing such portfolio securities:
| | | | | | | | | | | | |
| | | Level 1 | | | Level 2 | | | Level 3 | |
Investments in Securities | |
Affiliated Mutual Funds | | $ | 18,033,640 | | | $ | — | | | $ | — | |
| | | | | | | | | | | | |
During the period, there were no transfers between Level 1, Level 2 and Level 3 to report.
Investment Allocation:
The investment allocation of investments and other assets in excess of liabilities shown as a percentage of net assets as of July 31, 2017 were as follows (unaudited):
| | | | |
Large-Cap Core Equity | | | 20.9 | % |
TIPS | | | 18.0 | |
U.S. Broad Market Index | | | 12.0 | |
Total Return Bond | | | 11.0 | |
International Developed Markets Index | | | 9.0 | |
Core Conservative Bond | | | 8.0 | |
Core Ultra Short Bond | | | 7.1 | |
Global Real Estate | | | 5.0 | |
Commodities Strategies | | | 5.0 | % |
Mid-Cap Core Equity | | | 3.0 | |
Small-Cap Core Equity | | | 1.0 | |
| | | | |
| | | 100.0 | |
Other assets in excess of liabilities | | | 0.0 | * |
| | | | |
| | | 100.0 | % |
| | | | |
See Notes to Financial Statements.
Prudential Day One 2030 Fund
Schedule of Investments
as of July 31, 2017
| | | | | | | | |
| Description | | Shares | | | Value | |
LONG-TERM INVESTMENTS 94.9% | | | | | | | | |
| | |
AFFILIATED MUTUAL FUNDS | | | | | | | | |
Prudential Commodity Strategies Fund (Class Q)* | | | 40,637 | | | $ | 412,465 | |
Prudential Core Conservative Bond Fund (Class Q) | | | 61,833 | | | | 620,181 | |
Prudential Global Real Estate Fund (Class Q) | | | 21,291 | | | | 516,314 | |
Prudential Jennison Small-Cap Core Equity Fund (Class Q) | | | 9,143 | | | | 103,038 | |
Prudential QMA Emerging Markets Equity Fund (Class Q) | | | 8,179 | | | | 103,305 | |
Prudential QMA International Developed Markets Index Fund (Class Q) | | | 111,359 | | | | 1,344,106 | |
Prudential QMA Large-Cap Core Equity Fund (Class Q) | | | 163,285 | | | | 2,888,518 | |
Prudential QMA Mid-Cap Core Equity Fund (Class Q) | | | 27,723 | | | | 309,384 | |
Prudential QMA US Broad Market Index Fund (Class Q) | | | 127,095 | | | | 1,443,804 | |
Prudential TIPS Fund (Class Q) | | | 115,158 | | | | 1,135,455 | |
Prudential Total Return Bond Fund (Class Q) | | | 64,097 | | | | 930,684 | |
| | | | | | | | |
TOTAL LONG-TERM INVESTMENTS
(cost $9,582,494) | | | | | | | 9,807,254 | |
| | | | | | | | |
| | |
SHORT-TERM INVESTMENT 5.1% | | | | | | | | |
| | |
AFFILIATED MUTUAL FUND | | | | | | | | |
Prudential Investment Portfolios 2 - Prudential Core
Ultra Short Bond Fund
(cost $524,228) | | | 524,228 | | | | 524,228 | |
| | | | | | | | |
TOTAL INVESTMENTS 100.0%
(cost $10,106,722)(w) | | | | | | | 10,331,482 | |
Other assets in excess of liabilities 0.0% | | | | | | | 145 | |
| | | | | | | | |
NET ASSETS 100.0% | | | | | | $ | 10,331,627 | |
| | | | | | | | |
The following abbreviation is used in the annual report:
LIBOR—London Interbank Offered Rate
| * | Non-income producing security. |
| (w) | PGIM Investments LLC, the manager of the Fund, also serves as the manager of the underlying funds in which the Fund invests. |
Fair Value Measurements:
Various inputs are used in determining the value of the Fund’s investments. These inputs are summarized in the three broad levels listed below.
Level 1—unadjusted quoted prices generally in active markets for identical securities.
Level 2—quoted prices for similar securities, interest rates and yield curves, prepayment speeds, foreign currency exchange rates and other observable inputs.
Level 3—unobservable inputs for securities valued in accordance with Board approved fair valuation procedures.
See Notes to Financial Statements.
| | | | |
| Prudential Day One Funds | | | 63 | |
Prudential Day One 2030 Fund
Schedule of Investments (continued)
as of July 31, 2017
The following is a summary of the inputs used as of July 31, 2017 in valuing such portfolio securities:
| | | | | | | | | | | | |
| | | Level 1 | | | Level 2 | | | Level 3 | |
Investments in Securities | |
Affiliated Mutual Funds | | $ | 10,331,482 | | | $ | — | | | $ | — | |
| | | | | | | | | | | | |
During the period, there were no transfers between Level 1, Level 2 and Level 3 to report.
Investment Allocation:
The investment allocation of investments and other assets in excess of liabilities shown as a percentage of net assets as of July 31, 2017 were as follows (unaudited):
| | | | |
Large-Cap Core Equity | | | 27.9 | % |
U.S. Broad Market Index | | | 14.0 | |
International Developed Markets Index | | | 13.0 | |
TIPS | | | 11.0 | |
Total Return Bond | | | 9.0 | |
Core Conservative Bond | | | 6.0 | |
Core Ultra Short Bond | | | 5.1 | |
Global Real Estate | | | 5.0 | |
Commodities Strategies | | | 4.0 | % |
Mid-Cap Core Equity | | | 3.0 | |
Emerging Markets Equity | | | 1.0 | |
Small-Cap Core Equity | | | 1.0 | |
| | | | |
| | | 100.0 | |
Other assets in excess of liabilities | | | 0.0 | * |
| | | | |
| | | 100.0 | % |
| | | | |
See Notes to Financial Statements.
Prudential Day One 2035 Fund
Schedule of Investments
as of July 31, 2017
| | | | | | | | |
| Description | | Shares | | | Value | |
LONG-TERM INVESTMENTS 97.9% | | | | | | | | |
| | |
AFFILIATED MUTUAL FUNDS | | | | | | | | |
Prudential Commodity Strategies Fund (Class Q)* | | | 43,370 | | | $ | 440,203 | |
Prudential Core Conservative Bond Fund (Class Q) | | | 54,969 | | | | 551,343 | |
Prudential Global Real Estate Fund (Class Q) | | | 22,723 | | | | 551,032 | |
Prudential Jennison Small-Cap Core Equity Fund (Class Q) | | | 19,515 | | | | 219,935 | |
Prudential QMA Emerging Markets Equity Fund (Class Q) | | | 34,917 | | | | 441,000 | |
Prudential QMA International Developed Markets Index Fund (Class Q) | | | 118,846 | | | | 1,434,477 | |
Prudential QMA Large-Cap Core Equity (Class Q) | | | 174,266 | | | | 3,082,758 | |
Prudential QMA Mid-Cap Core Equity Fund (Class Q) | | | 39,449 | | | | 440,251 | |
Prudential QMA US Broad Market Index Fund (Class Q) | | | 174,397 | | | | 1,981,149 | |
Prudential TIPS Fund (Class Q) | | | 78,186 | | | | 770,912 | |
Prudential Total Return Bond Fund (Class Q) | | | 60,773 | | | | 882,423 | |
| | | | | | | | |
TOTAL LONG-TERM INVESTMENTS
(cost $10,629,203) | | | | | | | 10,795,483 | |
| | | | | | | | |
| | |
SHORT-TERM INVESTMENT 2.1% | | | | | | | | |
| | |
AFFILIATED MUTUAL FUND | | | | | | | | |
Prudential Investment Portfolios 2 - Prudential Core
Ultra Short Bond Fund
(cost $233,602) | | | 233,602 | | | | 233,602 | |
| | | | | | | | |
TOTAL INVESTMENTS 100.0%
(cost $10,862,805)(w) | | | | | | | 11,029,085 | |
Liabilities in excess of other assets 0.0% | | | | | | | (4,462 | ) |
| | | | | | | | |
NET ASSETS 100.0% | | | | | | $ | 11,024,623 | |
| | | | | | | | |
The following abbreviation is used in the annual report:
LIBOR—London Interbank Offered Rate
| * | Non-income producing security. |
| (w) | PGIM Investments LLC, the manager of the Fund, also serves as the manager of the underlying funds in which the Fund invests. |
Fair Value Measurements:
Various inputs are used in determining the value of the Fund’s investments. These inputs are summarized in the three broad levels listed below.
Level 1—unadjusted quoted prices generally in active markets for identical securities.
Level 2—quoted prices for similar securities, interest rates and yield curves, prepayment speeds, foreign currency exchange rates and other observable inputs.
Level 3—unobservable inputs for securities valued in accordance with Board approved fair valuation procedures.
See Notes to Financial Statements.
| | | | |
| Prudential Day One Funds | | | 65 | |
Prudential Day One 2035 Fund
Schedule of Investments (continued)
as of July 31, 2017
The following is a summary of the inputs used as of July 31, 2017 in valuing such portfolio securities:
| | | | | | | | | | | | |
| | | Level 1 | | | Level 2 | | | Level 3 | |
Investments in Securities | |
Affiliated Mutual Funds | | $ | 11,029,085 | | | $ | — | | | $ | — | |
| | | | | | | | | | | | |
During the period, there were no transfers between Level 1, Level 2 and Level 3 to report.
Investment Allocation:
The investment allocation of investments and liabilities in excess of other assets shown as a percentage of net assets as of July 31, 2017 were as follows (unaudited):
| | | | |
Large-Cap Core Equity | | | 27.9 | % |
U.S. Broad Market Index | | | 18.0 | |
International Developed Markets Index | | | 13.0 | |
Total Return Bond | | | 8.0 | |
TIPS | | | 7.0 | |
Core Conservative Bond | | | 5.0 | |
Global Real Estate | | | 5.0 | |
Emerging Markets Equity | | | 4.0 | |
Mid-Cap Core Equity | | | 4.0 | % |
Commodities Strategies | | | 4.0 | |
Core Ultra Short Bond | | | 2.1 | |
Small-Cap Core Equity | | | 2.0 | |
| | | | |
| | | 100.0 | |
Liabilities in excess of other assets | | | 0.0 | * |
| | | | |
| | | 100.0 | % |
| | | | |
See Notes to Financial Statements.
Prudential Day One 2040 Fund
Schedule of Investments
as of July 31, 2017
| | | | | | | | |
| Description | | Shares | | | Value | |
LONG-TERM INVESTMENTS 98.9% | | | | | | | | |
| | |
AFFILIATED MUTUAL FUNDS | | | | | | | | |
Prudential Commodity Strategies Fund (Class Q)* | | | 23,023 | | | $ | 233,687 | |
Prudential Core Conservative Bond Fund (Class Q) | | | 23,357 | | | | 234,270 | |
Prudential Global Real Estate Fund (Class Q) | | | 12,063 | | | | 292,522 | |
Prudential Jennison Small-Cap Core Equity Fund (Class Q) | | | 15,540 | | | | 175,133 | |
Prudential QMA Emerging Markets Equity Fund (Class Q) | | | 23,170 | | | | 292,641 | |
Prudential QMA International Developed Markets Index Fund (Class Q) | | | 72,797 | | | | 878,666 | |
Prudential QMA Large-Cap Core Equity Fund (Class Q) | | | 92,511 | | | | 1,636,524 | |
Prudential QMA Mid-Cap Core Equity Fund (Class Q) | | | 26,178 | | | | 292,142 | |
Prudential QMA US Broad Market Index Fund (Class Q) | | | 97,724 | | | | 1,110,150 | |
Prudential TIPS Fund (Class Q) | | | 23,727 | | | | 233,945 | |
Prudential Total Return Bond Fund (Class Q) | | | 28,248 | | | | 410,167 | |
| | | | | | | | |
TOTAL LONG-TERM INVESTMENTS
(cost $5,609,045) | | | | | | | 5,789,847 | |
| | | | | | | | |
| | |
SHORT-TERM INVESTMENT 1.3% | | | | | | | | |
| | |
AFFILIATED MUTUAL FUND | | | | | | | | |
Prudential Investment Portfolios 2 - Prudential Core
Ultra Short Bond Fund
(cost $73,398) | | | 73,398 | | | | 73,398 | |
| | | | | | | | |
TOTAL INVESTMENTS 100.2%
(cost $5,682,443)(w) | | | | | | | 5,863,245 | |
Liabilities in excess of other assets (0.2)% | | | | | | | (10,243 | ) |
| | | | | | | | |
NET ASSETS 100.0% | | | | | | $ | 5,853,002 | |
| | | | | | | | |
The following abbreviation is used in the annual report:
LIBOR—London Interbank Offered Rate
| * | Non-income producing security. |
| (w) | PGIM Investments LLC, the manager of the Fund, also serves as the manager of the underlying funds in which the Fund invests. |
Fair Value Measurements:
Various inputs are used in determining the value of the Fund’s investments. These inputs are summarized in the three broad levels listed below.
Level 1—unadjusted quoted prices generally in active markets for identical securities.
Level 2—quoted prices for similar securities, interest rates and yield curves, prepayment speeds, foreign currency exchange rates and other observable inputs.
Level 3—unobservable inputs for securities valued in accordance with Board approved fair valuation procedures.
See Notes to Financial Statements.
| | | | |
| Prudential Day One Funds | | | 67 | |
Prudential Day One 2040 Fund
Schedule of Investments (continued)
as of July 31, 2017
The following is a summary of the inputs used as of July 31, 2017 in valuing such portfolio securities:
| | | | | | | | | | | | |
| | | Level 1 | | | Level 2 | | | Level 3 | |
Investments in Securities | | | | | | | | | | | | |
Affiliated Mutual Funds | | $ | 5,863,245 | | | $ | — | | | $ | — | |
| | | | | | | | | | | | |
During the period, there were no transfers between Level 1, Level 2 and Level 3 to report.
Investment Allocation:
The investment allocation of portfolio holdings and liabilities in excess of other assets shown as a percentage of net assets as of July 31, 2017 were as follows (unaudited):
| | | | |
Large-Cap Core Equity | | | 27.9 | % |
U.S. Broad Market Index | | | 19.0 | |
International Developed Markets Index | | | 15.0 | |
Total Return Bond | | | 7.0 | |
Emerging Markets Equity | | | 5.0 | |
Global Real Estate | | | 5.0 | |
Mid-Cap Core Equity | | | 5.0 | |
Core Conservative Bond | | | 4.0 | |
TIPS | | | 4.0 | % |
Commodities Strategies | | | 4.0 | |
Small-Cap Core Equity | | | 3.0 | |
Core Ultra Short Bond | | | 1.3 | |
| | | | |
| | | 100.2 | |
Liabilities in excess of other assets | | | (0.2 | ) |
| | | | |
| | | 100.0 | % |
| | | | |
See Notes to Financial Statements.
Prudential Day One 2045 Fund
Schedule of Investments
as of July 31, 2017
| | | | | | | | |
| Description | | Shares | | | Value | |
LONG-TERM INVESTMENTS 99.9% | | | | | | | | |
| | |
AFFILIATED MUTUAL FUNDS | | | | | | | | |
Prudential Commodity Strategies Fund (Class Q)* | | | 29,677 | | | $ | 301,222 | |
Prudential Core Conservative Bond Fund (Class Q) | | | 22,565 | | | | 226,331 | |
Prudential Global Real Estate Fund (Class Q) | | | 15,549 | | | | 377,059 | |
Prudential Jennison Small-Cap Core Equity Fund (Class Q) | | | 20,031 | | | | 225,746 | |
Prudential QMA Emerging Markets Equity Fund (Class Q) | | | 29,866 | | | | 377,207 | |
Prudential QMA International Developed Markets Index Fund (Class Q) | | | 112,602 | | | | 1,359,111 | |
Prudential QMA Large-Cap Core Equity (Class Q) | | | 123,505 | | | | 2,184,808 | |
Prudential QMA Mid-Cap Core Equity Fund (Class Q) | | | 40,491 | | | | 451,883 | |
Prudential QMA US Broad Market Index Fund (Class Q) | | | 119,336 | | | | 1,355,661 | |
Prudential TIPS Fund (Class Q) | | | 15,284 | | | | 150,703 | |
Prudential Total Return Bond Fund (Class Q) | | | 36,380 | | | | 528,244 | |
| | | | | | | | |
TOTAL LONG-TERM INVESTMENTS
(cost $7,436,373) | | | | | | | 7,537,975 | |
| | | | | | | | |
| | |
SHORT-TERM INVESTMENT 0.3% | | | | | | | | |
| | |
AFFILIATED MUTUAL FUND | | | | | | | | |
Prudential Investment Portfolios 2 - Prudential Core
Ultra Short Bond Fund
(cost $20,039) | | | 20,039 | | | | 20,039 | |
| | | | | | | | |
TOTAL INVESTMENTS 100.2%
(cost $7,456,412)(w) | | | | | | | 7,558,014 | |
Liabilities in excess of other assets (0.2)% | | | | | | | (14,008 | ) |
| | | | | | | | |
NET ASSETS 100.0% | | | | | | $ | 7,544,006 | |
| | | | | | | | |
The following abbreviation is used in the annual report:
LIBOR—London Interbank Offered Rate
| * | Non-income producing security. |
| (w) | PGIM Investments LLC, the manager of the Fund, also serves as the manager of the underlying funds in which the Fund invests. |
Fair Value Measurements:
Various inputs are used in determining the value of the Fund’s investments. These inputs are summarized in the three broad levels listed below.
Level 1—unadjusted quoted prices generally in active markets for identical securities.
Level 2—quoted prices for similar securities, interest rates and yield curves, prepayment speeds, foreign currency exchange rates and other observable inputs.
Level 3—unobservable inputs for securities valued in accordance with Board approved fair valuation procedures.
See Notes to Financial Statements.
| | | | |
| Prudential Day One Funds | | | 69 | |
Prudential Day One 2045 Fund
Schedule of Investments (continued)
as of July 31, 2017
The following is a summary of the inputs used as of July 31, 2017 in valuing such portfolio securities:
| | | | | | | | | | | | |
| | | Level 1 | | | Level 2 | | | Level 3 | |
Investments in Securities | |
Affiliated Mutual Funds | | $ | 7,558,014 | | | $ | — | | | $ | — | |
| | | | | | | | | | | | |
During the period, there were no transfers between Level 1, Level 2 and Level 3 to report.
Investment Allocation:
The investment allocation of investments and liabilities in excess of other assets shown as a percentage of net assets as of July 31, 2017 were as follows (unaudited):
| | | | |
Large-Cap Core Equity | | | 28.9 | % |
International Developed Markets Index | | | 18.0 | |
U.S. Broad Market Index | | | 18.0 | |
Total Return Bond | | | 7.0 | |
Mid-Cap Core Equity | | | 6.0 | |
Emerging Markets Equity | | | 5.0 | |
Global Real Estate | | | 5.0 | |
Commodities Strategies | | | 4.0 | |
Core Conservative Bond | | | 3.0 | % |
Small-Cap Core Equity | | | 3.0 | |
TIPS | | | 2.0 | |
Core Ultra Short Bond | | | 0.3 | |
| | | | |
| | | 100.2 | |
Liabilities in excess of other assets | | | (0.2 | ) |
| | | | |
| | | 100.0 | % |
| | | | |
See Notes to Financial Statements.
Prudential Day One 2050 Fund
Schedule of Investments
as of July 31, 2017
| | | | | | | | |
| Description | | Shares | | | Value | |
LONG-TERM INVESTMENTS 99.9% | | | | | | | | |
| | |
AFFILIATED MUTUAL FUNDS | | | | | | | | |
Prudential Commodity Strategies Fund (Class Q)* | | | 8,752 | | | $ | 88,834 | |
Prudential Core Conservative Bond Fund (Class Q) | | | 4,439 | | | | 44,522 | |
Prudential Global Real Estate Fund (Class Q) | | | 4,586 | | | | 111,200 | |
Prudential Jennison Small-Cap Core Equity Fund (Class Q) | | | 5,907 | | | | 66,576 | |
Prudential QMA Emerging Markets Equity Fund (Class Q) | | | 10,570 | | | | 133,494 | |
Prudential QMA International Developed Markets Index Fund (Class Q) | | | 33,208 | | | | 400,822 | |
Prudential QMA Large-Cap Core Equity (Class Q) | | | 36,423 | | | | 644,330 | |
Prudential QMA Mid-Cap Core Equity Fund (Class Q) | | | 13,932 | | | | 155,478 | |
Prudential QMA US Broad Market Index Fund (Class Q) | | | 37,149 | | | | 422,015 | |
Prudential TIPS Fund (Class Q) | | | 2,255 | | | | 22,231 | |
Prudential Total Return Bond Fund (Class Q) | | | 9,203 | | | | 133,623 | |
| | | | | | | | |
TOTAL LONG-TERM INVESTMENTS
(cost $2,160,686) | | | | | | | 2,223,125 | |
| | | | | | | | |
| | |
SHORT-TERM INVESTMENT 0.7% | | | | | | | | |
| | |
AFFILIATED MUTUAL FUND | | | | | | | | |
Prudential Investment Portfolios 2 - Prudential Core
Ultra Short Bond Fund
(cost $14,698) | | | 14,698 | | | | 14,698 | |
| | | | | | | | |
TOTAL INVESTMENTS 100.6%
(cost $2,175,384)(w) | | | | | | | 2,237,823 | |
Liabilities in excess of other assets (0.6)% | | | | | | | (12,919 | ) |
| | | | | | | | |
NET ASSETS 100.0% | | | | | | $ | 2,224,904 | |
| | | | | | | | |
The following abbreviation is used in the annual report:
LIBOR—London Interbank Offered Rate
| * | Non-income producing security. |
| (w) | PGIM Investments LLC, the manager of the Fund, also serves as the manager of the underlying funds in which the Fund invests. |
Fair Value Measurements:
Various inputs are used in determining the value of the Fund’s investments. These inputs are summarized in the three broad levels listed below.
Level 1—unadjusted quoted prices generally in active markets for identical securities.
Level 2—quoted prices for similar securities, interest rates and yield curves, prepayment speeds, foreign currency exchange rates and other observable inputs.
Level 3—unobservable inputs for securities valued in accordance with Board approved fair valuation procedures.
See Notes to Financial Statements.
| | | | |
| Prudential Day One Funds | | | 71 | |
Prudential Day One 2050 Fund
Schedule of Investments (continued)
as of July 31, 2017
The following is a summary of the inputs used as of July 31, 2017 in valuing such portfolio securities:
| | | | | | | | | | | | |
| | | Level 1 | | | Level 2 | | | Level 3 | |
Investments in Securities | |
Affiliated Mutual Funds | | $ | 2,237,823 | | | $ | — | | | $ | — | |
| | | | | | | | | | | | |
During the period, there were no transfers between Level 1, Level 2 and Level 3 to report.
Investment Allocation:
The investment allocation of investments and liabilities in excess of other assets shown as a percentage of net assets as of July 31, 2017 were as follows (unaudited):
| | | | |
Large-Cap Core Equity | | | 28.9 | % |
U.S. Broad Market Index | | | 19.0 | |
International Developed Markets Index | | | 18.0 | |
Mid-Cap Core Equity | | | 7.0 | |
Total Return Bond | | | 6.0 | |
Emerging Markets Equity | | | 6.0 | |
Global Real Estate | | | 5.0 | |
Commodities Strategies | | | 4.0 | |
Small-Cap Core Equity | | | 3.0 | % |
Core Conservative Bond | | | 2.0 | |
TIPS | | | 1.0 | |
Core Ultra Short Bond | | | 0.7 | |
| | | | |
| | | 100.6 | |
Liabilities in excess of other assets | | | (0.6 | ) |
| | | | |
| | | 100.0 | % |
| | | | |
See Notes to Financial Statements.
Prudential Day One 2055 Fund
Schedule of Investments
as of July 31, 2017
| | | | | | | | |
| Description | | Shares | | | Value | |
LONG-TERM INVESTMENTS 99.9% | | | | | | | | |
| | |
AFFILIATED MUTUAL FUNDS | | | | | | | | |
Prudential Commodity Strategies Fund (Class Q)* | | | 11,133 | | | $ | 113,000 | |
Prudential Global Real Estate Fund (Class Q) | | | 5,833 | | | | 141,450 | |
Prudential Jennison Small-Cap Core Equity Fund (Class Q) | | | 7,514 | | | | 84,687 | |
Prudential QMA Emerging Markets Equity Fund (Class Q) | | | 13,445 | | | | 169,806 | |
Prudential QMA International Developed Markets Index Fund (Class Q) | | | 44,588 | | | | 538,181 | |
Prudential QMA Large-Cap Core Equity Fund (Class Q) | | | 47,929 | | | | 847,872 | |
Prudential QMA Mid-Cap Core Equity Fund (Class Q) | | | 17,722 | | | | 197,773 | |
Prudential QMA US Broad Market Index Fund (Class Q) | | | 52,229 | | | | 593,324 | |
Prudential Total Return Bond Fund (Class Q) | | | 9,747 | | | | 141,530 | |
| | | | | | | | |
TOTAL LONG-TERM INVESTMENTS
(cost $2,789,364) | | | | | | | 2,827,623 | |
| | | | | | | | |
| | |
SHORT-TERM INVESTMENT 0.5% | | | | | | | | |
| | |
AFFILIATED MUTUAL FUND | | | | | | | | |
Prudential Investment Portfolios 2 - Prudential Core
Ultra Short Bond Fund
(cost $14,774) | | | 14,774 | | | | 14,774 | |
| | | | | | | | |
TOTAL INVESTMENTS 100.4%
(cost $2,804,138)(w) | | | | | | | 2,842,397 | |
Liabilities in excess of other assets (0.4)% | | | | | | | (12,514 | ) |
| | | | | | | | |
NET ASSETS 100.0% | | | | | | $ | 2,829,883 | |
| | | | | | | | |
The following abbreviation is used in the annual report:
LIBOR—London Interbank Offered Rate
| * | Non-income producing security. |
| (w) | PGIM Investments LLC, the manager of the Fund, also serves as the manager of the underlying funds in which the Fund invests. |
Fair Value Measurements:
Various inputs are used in determining the value of the Fund’s investments. These inputs are summarized in the three broad levels listed below.
Level 1—unadjusted quoted prices generally in active markets for identical securities.
Level 2—quoted prices for similar securities, interest rates and yield curves, prepayment speeds, foreign currency exchange rates and other observable inputs.
Level 3—unobservable inputs for securities valued in accordance with Board approved fair valuation procedures.
See Notes to Financial Statements.
| | | | |
| Prudential Day One Funds | | | 73 | |
Prudential Day One 2055 Fund
Schedule of Investments (continued)
as of July 31, 2017
The following is a summary of the inputs used as of July 31, 2017 in valuing such portfolio securities:
| | | | | | | | | | | | |
| | | Level 1 | | | Level 2 | | | Level 3 | |
Investments in Securities | |
Affiliated Mutual Funds | | $ | 2,842,397 | | | $ | — | | | $ | — | |
| | | | | | | | | | | | |
During the period, there were no transfers between Level 1, Level 2 and Level 3 to report.
Investment Allocation:
The investment allocation of investments and liabilities in excess of other assets shown as a percentage of net assets as of July 31, 2017 were as follows (unaudited):
| | | | |
Large-Cap Core Equity | | | 29.9 | % |
U.S. Broad Market Index | | | 21.0 | |
International Developed Markets Index | | | 19.0 | |
Mid-Cap Core Equity | | | 7.0 | |
Emerging Markets Equity | | | 6.0 | |
Total Return Bond | | | 5.0 | |
Global Real Estate | | | 5.0 | |
Commodities Strategies | | | 4.0 | % |
Small-Cap Core Equity | | | 3.0 | |
Core Ultra Short Bond | | | 0.5 | |
| | | | |
| | | 100.4 | |
Liabilities in excess of other assets | | | (0.4 | ) |
| | | | |
| | | 100.0 | % |
| | | | |
See Notes to Financial Statements.
Prudential Day One 2060 Fund
Schedule of Investments
as of July 31, 2017
| | | | | | | | |
| Description | | Shares | | | Value | |
LONG-TERM INVESTMENTS 99.9% | | | | | | | | |
| | |
AFFILIATED MUTUAL FUNDS | | | | | | | | |
Prudential Commodity Strategies Fund (Class Q)* | | | 421 | | | $ | 4,270 | |
Prudential Global Real Estate Fund (Class Q) | | | 220 | | | | 5,344 | |
Prudential Jennison Small-Cap Core Equity Fund (Class Q) | | | 379 | | | | 4,266 | |
Prudential QMA Emerging Markets Equity Fund (Class Q) | | | 508 | | | | 6,416 | |
Prudential QMA International Developed Markets Index Fund (Class Q) | | | 1,685 | | | | 20,335 | |
Prudential QMA Large-Cap Core Equity Fund (Class Q) | | | 1,871 | | | | 33,104 | |
Prudential QMA Mid-Cap Core Equity Fund (Class Q) | | | 670 | | | | 7,473 | |
Prudential QMA US Broad Market Index Fund (Class Q) | | | 1,973 | | | | 22,418 | |
Prudential Total Return Bond Fund (Class Q) | | | 221 | | | | 3,212 | |
| | | | | | | | |
TOTAL LONG-TERM INVESTMENTS
(cost $99,473) | | | | | | | 106,838 | |
| | | | | | | | |
| | |
SHORT-TERM INVESTMENT 13.4% | | | | | | | | |
| | |
AFFILIATED MUTUAL FUND | | | | | | | | |
Prudential Investment Portfolios 2 - Prudential Core
Ultra Short Bond Fund
(cost $14,328) | | | 14,328 | | | | 14,328 | |
| | | | | | | | |
TOTAL INVESTMENTS 113.3%
(cost $113,801)(w) | | | | | | | 121,166 | |
Liabilities in excess of other assets (13.3)% | | | | | | | (14,241 | ) |
| | | | | | | | |
NET ASSETS 100.0% | | | | | | $ | 106,925 | |
| | | | | | | | |
The following abbreviation is used in the annual report:
LIBOR—London Interbank Offered Rate
| * | Non-income producing security. |
| (w) | PGIM Investments LLC, the manager of the Fund, also serves as the manager of the underlying funds in which the Fund invests. |
Fair Value Measurements:
Various inputs are used in determining the value of the Fund’s investments. These inputs are summarized in the three broad levels listed below.
Level 1—unadjusted quoted prices generally in active markets for identical securities.
Level 2—quoted prices for similar securities, interest rates and yield curves, prepayment speeds, foreign currency exchange rates and other observable inputs.
Level 3—unobservable inputs for securities valued in accordance with Board approved fair valuation procedures.
See Notes to Financial Statements.
| | | | |
| Prudential Day One Funds | | | 75 | |
Prudential Day One 2060 Fund
Schedule of Investments (continued)
as of July 31, 2017
The following is a summary of the inputs used as of July 31, 2017 in valuing such portfolio securities:
| | | | | | | | | | | | |
| | | Level 1 | | | Level 2 | | | Level 3 | |
Investments in Securities | |
Affiliated Mutual Funds | | $ | 121,166 | | | $ | — | | | $ | — | |
| | | | | | | | | | | | |
During the period, there were no transfers between Level 1, Level 2 and Level 3 to report.
Investment Allocation:
The investment allocation of investments and liabilities in excess of other assets shown as a percentage of net assets as of July 31, 2017 were as follows (unaudited):
| | | | |
Large-Cap Core Equity | | | 30.9 | % |
U.S. Broad Market Index | | | 21.0 | |
International Developed Markets Index | | | 19.0 | |
Core Ultra Short Bond | | | 13.4 | |
Mid-Cap Core Equity | | | 7.0 | |
Emerging Markets Equity | | | 6.0 | |
Global Real Estate | | | 5.0 | |
Commodities Strategies | | | 4.0 | % |
Small-Cap Core Equity | | | 4.0 | |
Total Return Bond | | | 3.0 | |
| | | | |
| | | 113.3 | |
Liabilities in excess of other assets | | | (13.3 | ) |
| | | | |
| | | 100.0 | % |
| | | | |
See Notes to Financial Statements.
This Page Intentionally Left Blank
Prudential Day One Income Fund
Statement of Assets & Liabilities
as of July 31, 2017
| | | | |
Assets | |
Affiliated investments (cost $2,042,457) | | $ | 2,052,508 | |
Due from manager | | | 36,636 | |
Receivable for investments sold | | | 2,672 | |
| | | | |
Total assets | | | 2,091,816 | |
| | | | |
|
Liabilities | |
Audit fee payable | | | 20,000 | |
Custodian and accounting fees payable | | | 19,344 | |
Shareholders’ reports payable | | | 4,451 | |
Legal fees and expenses payable | | | 4,058 | |
Accrued expenses | | | 2,656 | |
Payable for investments purchased | | | 2,080 | |
Affiliated transfer agent fee payable | | | 68 | |
Distribution fee payable | | | 21 | |
Shareholder service fee payable | | | 19 | |
| | | | |
Total liabilities | | | 52,697 | |
| | | | |
| |
Net Assets | | $ | 2,039,119 | |
| | | | |
| | | | | |
Net assets were comprised of: | |
Shares of beneficial interest, at par | | $ | 197 | |
Paid-in capital in excess of par | | | 2,028,777 | |
| | | | |
| | | 2,028,974 | |
Undistributed net investment income | | | 1,596 | |
Accumulated net realized loss on investment transactions | | | (1,502 | ) |
Net unrealized appreciation on investments | | | 10,051 | |
| | | | |
Net assets, July 31, 2017 | | $ | 2,039,119 | |
| | | | |
See Notes to Financial Statements.
| | | | |
Class R1 | | | | |
Net asset value, offering price and redemption price per share
($10,391 ÷ 1,003 shares of beneficial interest issued and outstanding) | | $ | 10.36 | |
| | | | |
| |
Class R2 | | | | |
Net asset value, offering price and redemption price per share,
($11,744 ÷ 1,133 shares of beneficial interest issued and outstanding) | | $ | 10.37 | |
| | | | |
| |
Class R3 | | | | |
Net asset value, offering price and redemption price per share,
($1,255,999 ÷ 121,158 shares of beneficial interest issued and outstanding) | | $ | 10.37 | |
| | | | |
| |
Class R4 | | | | |
Net asset value, offering price and redemption price per share,
($16,972 ÷ 1,636 shares of beneficial interest issued and outstanding) | | $ | 10.37 | |
| | | | |
| |
Class R5 | | | | |
Net asset value, offering price and redemption price per share,
($10,432 ÷ 1,006 shares of beneficial interest issued and outstanding) | | $ | 10.37 | |
| | | | |
| |
Class R6 | | | | |
Net asset value, offering price and redemption price per share,
($733,581 ÷ 70,680 shares of beneficial interest issued and outstanding) | | $ | 10.38 | |
| | | | |
See Notes to Financial Statements.
| | | | |
| Prudential Day One Funds | | | 79 | |
Prudential Day One 2010 Fund
Statement of Assets & Liabilities
as of July 31, 2017
| | | | |
Assets | |
Affiliated investments (cost $4,473,679) | | $ | 4,529,118 | |
Due from manager | | | 37,142 | |
Receivable for investments sold | | | 17,582 | |
| | | | |
Total assets | | | 4,583,842 | |
| | | | |
|
Liabilities | |
Audit fee payable | | | 20,000 | |
Custodian and accounting fees payable | | | 19,350 | |
Payable for investments purchased | | | 13,222 | |
Shareholders’ reports payable | | | 4,452 | |
Legal fees and expenses payable | | | 4,058 | |
Accrued expenses | | | 2,586 | |
Affiliated transfer agent fee payable | | | 60 | |
Shareholder service fee payable | | | 8 | |
Distribution fee payable | | | 7 | |
| | | | |
Total liabilities | | | 63,743 | |
| | | | |
| |
Net Assets | | $ | 4,520,099 | |
| | | | |
| | | | | |
Net assets were comprised of: | |
Shares of beneficial interest, at par | | $ | 431 | |
Paid-in capital in excess of par | | | 4,457,588 | |
| | | | |
| | | 4,458,019 | |
Undistributed net investment income | | | 7,001 | |
Accumulated net realized loss on investment transactions | | | (360 | ) |
Net unrealized appreciation on investments | | | 55,439 | |
| | | | |
Net assets, July 31, 2017 | | $ | 4,520,099 | |
| | | | |
See Notes to Financial Statements.
| | | | |
Class R1 | | | | |
Net asset value, offering price and redemption price per share,
($10,434 ÷ 1,000 shares of beneficial interest issued and outstanding) | | $ | 10.43 | |
| | | | |
| |
Class R2 | | | | |
Net asset value, offering price and redemption price per share,
($10,452 ÷ 1,000 shares of beneficial interest issued and outstanding) | | $ | 10.45 | |
| | | | |
| |
Class R3 | | | | |
Net asset value, offering price and redemption price per share,
($10,461 ÷ 1,000 shares of beneficial interest issued and outstanding) | | $ | 10.46 | |
| | | | |
| |
Class R4 | | | | |
Net asset value, offering price and redemption price per share,
($42,635 ÷ 4,075 shares of beneficial interest issued and outstanding) | | $ | 10.46 | |
| | | | |
| |
Class R5 | | | | |
Net asset value, offering price and redemption price per share,
($10,474 ÷ 1,000 shares of beneficial interest issued and outstanding) | | $ | 10.47 | |
| | | | |
| |
Class R6 | | | | |
Net asset value, offering price and redemption price per share,
($4,435,643 ÷ 423,146 shares of beneficial interest issued and outstanding) | | $ | 10.48 | |
| | | | |
See Notes to Financial Statements.
| | | | |
| Prudential Day One Funds | | | 81 | |
Prudential Day One 2015 Fund
Statement of Assets & Liabilities
as of July 31, 2017
| | | | |
Assets | |
Affiliated investments (cost $4,131,558) | | $ | 4,194,548 | |
Receivable for Fund shares sold | | | 63,839 | |
Due from manager | | | 37,117 | |
Receivable for investments sold | | | 18,711 | |
| | | | |
Total assets | | | 4,314,215 | |
| | | | |
|
Liabilities | |
Payable for investments purchased | | | 71,687 | |
Audit fees payable | | | 20,000 | |
Custodian and accounting fees payable | | | 19,355 | |
Accrued expenses | | | 11,314 | |
Affiliated transfer agent fee payable | | | 64 | |
Shareholder service fee payable | | | 8 | |
Distribution fee payable | | | 7 | |
| | | | |
Total liabilities | | | 122,435 | |
| | | | |
| |
Net Assets | | $ | 4,191,780 | |
| | | | |
| | | | | |
Net assets were comprised of: | |
Shares of beneficial interest, at par | | $ | 398 | |
Paid-in capital in excess of par | | | 4,118,189 | |
| | | | |
| | | 4,118,587 | |
Undistributed net investment income | | | 8,699 | |
Accumulated net realized gain on investment transactions | | | 1,504 | |
Net unrealized appreciation on investments | | | 62,990 | |
| | | | |
Net assets, July 31, 2017 | | $ | 4,191,780 | |
| | | | |
See Notes to Financial Statements.
| | | | |
Class R1 | | | | |
Net asset value, offering price and redemption price per share
($10,487 ÷ 1,000 shares of beneficial interest issued and outstanding) | | $ | 10.49 | |
| | | | |
| |
Class R2 | | | | |
Net asset value, offering price and redemption price per share,
($10,504 ÷ 1,000 shares of beneficial interest issued and outstanding) | | $ | 10.50 | |
| | | | |
| |
Class R3 | | | | |
Net asset value, offering price and redemption price per share,
($10,513 ÷ 1,000 shares of beneficial interest issued and outstanding) | | $ | 10.51 | |
| | | | |
| |
Class R4 | | | | |
Net asset value, offering price and redemption price per share,
($51,102 ÷ 4,862 shares of beneficial interest issued and outstanding) | | $ | 10.51 | |
| | | | |
| |
Class R5 | | | | |
Net asset value, offering price and redemption price per share,
($10,527 ÷ 1,000 shares of beneficial interest issued and outstanding) | | $ | 10.53 | |
| | | | |
| |
Class R6 | | | | |
Net asset value, offering price and redemption price per share,
($4,098,647 ÷ 389,189 shares of beneficial interest issued and outstanding) | | $ | 10.53 | |
| | | | |
See Notes to Financial Statements.
| | | | |
| Prudential Day One Funds | | | 83 | |
Prudential Day One 2020 Fund
Statement of Assets & Liabilities
as of July 31, 2017
| | | | |
Assets | |
Affiliated investments (cost $12,396,389) | | $ | 12,587,820 | |
Receivable for investments sold | | | 53,875 | |
Due from manager | | | 38,415 | |
Receivable for Fund shares sold | | | 5,991 | |
| | | | |
Total assets | | | 12,686,101 | |
| | | | |
|
Liabilities | |
Payable for investments purchased | | | 47,355 | |
Audit fee payable | | | 20,000 | |
Custodian and accounting fees payable | | | 19,390 | |
Accrued expenses | | | 11,307 | |
Affiliated transfer agent fee payable | | | 126 | |
Shareholder service fee payable | | | 20 | |
Distribution fee payable | | | 7 | |
| | | | |
Total liabilities | | | 98,205 | |
| | | | |
| |
Net Assets | | $ | 12,587,896 | |
| | | | |
| | | | | |
Net assets were comprised of: | |
Shares of beneficial interest, at par | | $ | 1,195 | |
Paid-in capital in excess of par | | | 12,372,779 | |
| | | | |
| | | 12,373,974 | |
Undistributed net investment income | | | 23,917 | |
Accumulated net realized loss on investment transactions | | | (1,426 | ) |
Net unrealized appreciation on investments | | | 191,431 | |
| | | | |
Net assets, July 31, 2017 | | $ | 12,587,896 | |
| | | | |
See Notes to Financial Statements.
| | | | |
Class R1 | | | | |
Net asset value, offering price and redemption price per share,
($10,520 ÷ 1,000 shares of beneficial interest issued and outstanding) | | $ | 10.52 | |
| | | | |
| |
Class R2 | | | | |
Net asset value, offering price and redemption price per share,
($10,537 ÷ 1,000 shares of beneficial interest issued and outstanding) | | $ | 10.54 | |
| | | | |
| |
Class R3 | | | | |
Net asset value, offering price and redemption price per share,
($10,547 ÷ 1,000 shares of beneficial interest issued and outstanding) | | $ | 10.55 | |
| | | | |
| |
Class R4 | | | | |
Net asset value, offering price and redemption price per share,
($177,717 ÷ 16,841 shares of beneficial interest issued and outstanding) | | $ | 10.55 | |
| | | | |
| |
Class R5 | | | | |
Net asset value, offering price and redemption price per share,
($10,561 ÷ 1,000 shares of beneficial interest issued and outstanding) | | $ | 10.56 | |
| | | | |
| |
Class R6 | | | | |
Net asset value, offering price and redemption price per share,
($12,368,014 ÷ 1,173,706 shares of beneficial interest issued and outstanding) | | $ | 10.54 | |
| | | | |
See Notes to Financial Statements.
| | | | |
| Prudential Day One Funds | | | 85 | |
Prudential Day One 2025 Fund
Statement of Assets & Liabilities
as of July 31, 2017
| | | | |
Assets | |
Affiliated investments (cost $17,815,551) | | $ | 18,033,640 | |
Receivable for investments sold | | | 55,314 | |
Due from manager | | | 38,397 | |
Receivable for Fund shares sold | | | 8,331 | |
| | | | |
Total assets | | | 18,135,682 | |
| | | | |
|
Liabilities | |
Payable for investments purchased | | | 47,401 | |
Audit fee payable | | | 20,000 | |
Custodian and accounting fees payable | | | 19,394 | |
Accrued expenses | | | 11,320 | |
Distribution fee payable | | | 153 | |
Affiliated transfer agent fee payable | | | 122 | |
Shareholder service fee payable | | | 81 | |
| | | | |
Total liabilities | | | 98,471 | |
| | | | |
| |
Net Assets | | $ | 18,037,211 | |
| | | | |
| | | | | |
Net assets were comprised of: | |
Shares of beneficial interest, at par | | $ | 1,697 | |
Paid-in capital in excess of par | | | 17,796,409 | |
| | | | |
| | | 17,798,106 | |
Undistributed net investment income | | | 21,918 | |
Accumulated net realized loss on investment transactions | | | (902 | ) |
Net unrealized appreciation on investments | | | 218,089 | |
| | | | |
Net assets, July 31, 2017 | | $ | 18,037,211 | |
| | | | |
See Notes to Financial Statements.
| | | | |
Class R1 | | | | |
Net asset value, offering price and redemption price per share
($592,018 ÷ 55,971 shares of beneficial interest issued and outstanding) | | $ | 10.58 | |
| | | | |
| |
Class R2 | | | | |
Net asset value, offering price and redemption price per share,
($10,592 ÷ 1,000 shares of beneficial interest issued and outstanding) | | $ | 10.59 | |
| | | | |
| |
Class R3 | | | | |
Net asset value, offering price and redemption price per share,
($3,863,271 ÷ 364,247 shares of beneficial interest issued and outstanding) | | $ | 10.61 | |
| | | | |
| |
Class R4 | | | | |
Net asset value, offering price and redemption price per share,
($174,787 ÷ 16,479 shares of beneficial interest issued and outstanding) | | $ | 10.61 | |
| | | | |
| |
Class R5 | | | | |
Net asset value, offering price and redemption price per share,
($16,376 ÷ 1,542 shares of beneficial interest issued and outstanding) | | $ | 10.62 | |
| | | | |
| |
Class R6 | | | | |
Net asset value, offering price and redemption price per share,
($13,380,167 ÷ 1,257,795 shares of beneficial interest issued and outstanding) | | $ | 10.64 | |
| | | | |
See Notes to Financial Statements.
| | | | |
| Prudential Day One Funds | | | 87 | |
Prudential Day One 2030 Fund
Statement of Assets & Liabilities
as of July 31, 2017
| | | | |
Assets | |
Affiliated investments (cost $10,106,722) | | $ | 10,331,482 | |
Receivable for investments sold | | | 42,111 | |
Due from manager | | | 37,470 | |
Receivable for Fund shares sold | | | 8,908 | |
| | | | |
Total assets | | | 10,419,971 | |
| | | | |
|
Liabilities | |
Payable for investments purchased | | | 37,302 | |
Custodian and accounting fees payable | | | 21,086 | |
Audit fee payable | | | 20,000 | |
Shareholders’ reports payable | | | 4,450 | |
Legal fees and expenses payable | | | 4,058 | |
Accrued expenses | | | 1,096 | |
Affiliated transfer agent fee payable | | | 268 | |
Shareholder service fee payable | | | 75 | |
Distribution fee payable | | | 9 | |
| | | | |
Total liabilities | | | 88,344 | |
| | | | |
| |
Net Assets | | $ | 10,331,627 | |
| | | | |
| | | | | |
Net assets were comprised of: | |
Shares of beneficial interest, at par | | $ | 957 | |
Paid-in capital in excess of par | | | 10,091,708 | |
| | | | |
| | | 10,092,665 | |
Undistributed net investment income | | | 14,933 | |
Accumulated net realized loss on investment transactions | | | (731 | ) |
Net unrealized appreciation on investments | | | 224,760 | |
| | | | |
Net assets, July 31, 2017 | | $ | 10,331,627 | |
| | | | |
See Notes to Financial Statements.
| | | | |
Class R1 | | | | |
Net asset value, offering price and redemption price per share,
($14,213 ÷ 1,323 shares of beneficial interest issued and outstanding) | | $ | 10.74 | |
| | | | |
| |
Class R2 | | | | |
Net asset value, offering price and redemption price per share,
($12,949 ÷ 1,204 shares of beneficial interest issued and outstanding) | | $ | 10.75 | |
| | | | |
| |
Class R3 | | | | |
Net asset value, offering price and redemption price per share,
($10,764 ÷ 1,000 shares of beneficial interest issued and outstanding) | | $ | 10.76 | |
| | | | |
| |
Class R4 | | | | |
Net asset value, offering price and redemption price per share,
($856,515 ÷ 79,537 shares of beneficial interest issued and outstanding) | | $ | 10.77 | |
| | | | |
| |
Class R5 | | | | |
Net asset value, offering price and redemption price per share,
($10,779 ÷ 1,000 shares of beneficial interest issued and outstanding) | | $ | 10.78 | |
| | | | |
| |
Class R6 | | | | |
Net asset value, offering price and redemption price per share,
($9,426,407 ÷ 873,350 shares of beneficial interest issued and outstanding) | | $ | 10.79 | |
| | | | |
See Notes to Financial Statements.
| | | | |
| Prudential Day One Funds | | | 89 | |
Prudential Day One 2035 Fund
Statement of Assets & Liabilities
as of July 31, 2017
| | | | |
Assets | |
Affiliated investments (cost $10,862,805) | | $ | 11,029,085 | |
Due from manager | | | 37,352 | |
Receivable for investments sold | | | 30,588 | |
Receivable for Fund shares sold | | | 13,893 | |
| | | | |
Total assets | | | 11,110,918 | |
| | | | |
|
Liabilities | |
Payable for investments purchased | | | 32,839 | |
Custodian and accounting fees payable | | | 19,371 | |
Audit fee payable | | | 20,000 | |
Accrued expenses | | | 6,854 | |
Shareholders’ reports payable | | | 4,452 | |
Payable for Fund shares reacquired | | | 2,600 | |
Affiliated transfer agent fee payable | | | 74 | |
Shareholder service fee payable | | | 53 | |
Distribution fee payable | | | 52 | |
| | | | |
Total liabilities | | | 86,295 | |
| | | | |
| |
Net Assets | | $ | 11,024,623 | |
| | | | |
| | | | | |
Net assets were comprised of: | |
Shares of beneficial interest, at par | | $ | 1,015 | |
Paid-in capital in excess of par | | | 10,847,489 | |
| | | | |
| | | 10,848,504 | |
Undistributed net investment income | | | 8,983 | |
Accumulated net realized gain on investment transactions | | | 856 | |
Net unrealized appreciation on investments | | | 166,280 | |
| | | | |
Net assets, July 31, 2017 | | $ | 11,024,623 | |
| | | | |
See Notes to Financial Statements.
| | | | |
Class R1 | | | | |
Net asset value, offering price and redemption price per share,
($13,413 ÷ 1,241 shares of beneficial interest issued and outstanding) | | $ | 10.81 | |
| | | | |
| |
Class R2 | | | | |
Net asset value, offering price and redemption price per share,
($10,830 ÷ 1,000 shares of beneficial interest issued and outstanding) | | $ | 10.83 | |
| | | | |
| |
Class R3 | | | | |
Net asset value, offering price and redemption price per share,
($4,043,643 ÷ 372,867 shares of beneficial interest issued and outstanding) | | $ | 10.84 | |
| | | | |
| |
Class R4 | | | | |
Net asset value, offering price and redemption price per share,
($57,379 ÷ 5,289 shares of beneficial interest issued and outstanding) | | $ | 10.85 | |
| | | | |
| |
Class R5 | | | | |
Net asset value, offering price and redemption price per share,
($10,854 ÷ 1,000 shares of beneficial interest issued and outstanding) | | $ | 10.85 | |
| | | | |
| |
Class R6 | | | | |
Net asset value, offering price and redemption price per share,
($6,888,504 ÷ 633,895 shares of beneficial interest issued and outstanding) | | $ | 10.87 | |
| | | | |
See Notes to Financial Statements.
| | | | |
| Prudential Day One Funds | | | 91 | |
Prudential Day One 2040 Fund
Statement of Assets & Liabilities
as of July 31, 2017
| | | | |
Assets | |
Affiliated investments (cost $5,682,443) | | $ | 5,863,245 | |
Due from manager | | | 37,298 | |
Receivable for investments sold | | | 22,445 | |
Receivable for Fund shares sold | | | 12,912 | |
| | | | |
Total assets | | | 5,935,900 | |
| | | | |
|
Liabilities | |
Payable for investments purchased | | | 32,114 | |
Audit fee payable | | | 20,000 | |
Custodian and accounting fees payable | | | 19,372 | |
Accrued expenses | | | 6,858 | |
Shareholders’ reports payable | | | 4,447 | |
Affiliated transfer agent fee payable | | | 86 | |
Shareholder service fee payable | | | 13 | |
Distribution fee payable | | | 8 | |
| | | | |
Total liabilities | | | 82,898 | |
| | | | |
| |
Net Assets | | $ | 5,853,002 | |
| | | | |
| | | | | |
Net assets were comprised of: | |
Shares of beneficial interest, at par | | $ | 534 | |
Paid-in capital in excess of par | | | 5,658,375 | |
| | | | |
| | | 5,658,909 | |
Undistributed net investment income | | | 7,832 | |
Accumulated net realized gain on investment transactions | | | 5,459 | |
Net unrealized appreciation on investments | | | 180,802 | |
| | | | |
Net assets, July 31, 2017 | | $ | 5,853,002 | |
| | | | |
See Notes to Financial Statements.
| | | | |
Class R1 | | | | |
Net asset value, offering price and redemption price per share,
($10,904 ÷ 1,000 shares of beneficial interest issued and outstanding) | | $ | 10.90 | |
| | | | |
| |
Class R2 | | | | |
Net asset value, offering price and redemption price per share,
($12,032 ÷ 1,102 shares of beneficial interest issued and outstanding) | | $ | 10.92 | |
| | | | |
| |
Class R3 | | | | |
Net asset value, offering price and redemption price per share,
($10,932 ÷ 1,000 shares of beneficial interest issued and outstanding) | | $ | 10.93 | |
| | | | |
| |
Class R4 | | | | |
Net asset value, offering price and redemption price per share,
($114,982 ÷ 10,512 shares of beneficial interest issued and outstanding) | | $ | 10.94 | |
| | | | |
| |
Class R5 | | | | |
Net asset value, offering price and redemption price per share,
($10,946 ÷ 1,000 shares of beneficial interest issued and outstanding) | | $ | 10.95 | |
| | | | |
| |
Class R6 | | | | |
Net asset value, offering price and redemption price per share,
($5,693,206 ÷ 519,476 shares of beneficial interest issued and outstanding) | | $ | 10.96 | |
| | | | |
See Notes to Financial Statements.
| | | | |
| Prudential Day One Funds | | | 93 | |
Prudential Day One 2045 Fund
Statement of Assets & Liabilities
as of July 31, 2017
| | | | |
Assets | |
Affiliated investments (cost $7,456,412) | | $ | 7,558,014 | |
Due from manager | | | 36,934 | |
Receivable for investments sold | | | 18,495 | |
Receivable for Fund shares sold | | | 7,556 | |
| | | | |
Total assets | | | 7,620,999 | |
| | | | |
|
Liabilities | |
Payable for investments purchased | | | 24,737 | |
Audit fee payable | | | 20,000 | |
Custodian and accounting fees payable | | | 19,358 | |
Shareholders’ reports payable | | | 4,450 | |
Legal fees and expenses payable | | | 4,058 | |
Accrued expenses | | | 2,809 | |
Payable for Fund shares reacquired | | | 1,345 | |
Affiliated transfer agent fee payable | | | 120 | |
Shareholder service fee payable | | | 66 | |
Distribution fee payable | | | 50 | |
| | | | |
Total liabilities | | | 76,993 | |
| | | | |
| |
Net Assets | | $ | 7,544,006 | |
| | | | |
| | | | | |
Net assets were comprised of: | |
Shares of beneficial interest, at par | | $ | 685 | |
Paid-in capital in excess of par | | | 7,433,611 | |
| | | | |
| | | 7,434,296 | |
Undistributed net investment income | | | 4,042 | |
Accumulated net realized gain on investment transactions | | | 4,066 | |
Net unrealized appreciation on investments | | | 101,602 | |
| | | | |
Net assets, July 31, 2017 | | $ | 7,544,006 | |
| | | | |
See Notes to Financial Statements.
| | | | |
Class R1 | | | | |
Net asset value, offering price and redemption price per share,
($10,967 ÷ 1,000 shares of beneficial interest issued and outstanding) | | $ | 10.97 | |
| | | | |
| |
Class R2 | | | | |
Net asset value, offering price and redemption price per share,
($11,921 ÷ 1,086 shares of beneficial interest issued and outstanding) | | $ | 10.98 | |
| | | | |
| |
Class R3 | | | | |
Net asset value, offering price and redemption price per share,
($3,811,772 ÷ 346,850 shares of beneficial interest issued and outstanding) | | $ | 10.99 | |
| | | | |
| |
Class R4 | | | | |
Net asset value, offering price and redemption price per share,
($247,158 ÷ 22,477 shares of beneficial interest issued and outstanding) | | $ | 11.00 | |
| | | | |
| |
Class R5 | | | | |
Net asset value, offering price and redemption price per share,
($11,503 ÷ 1,045 shares of beneficial interest issued and outstanding) | | $ | 11.01 | |
| | | | |
| |
Class R6 | | | | |
Net asset value, offering price and redemption price per share,
($3,450,685 ÷ 312,884 shares of beneficial interest issued and outstanding) | | $ | 11.03 | |
| | | | |
See Notes to Financial Statements.
| | | | |
| Prudential Day One Funds | | | 95 | |
Prudential Day One 2050 Fund
Statement of Assets & Liabilities
as of July 31, 2017
| | | | |
Assets | |
Affiliated investments (cost $2,175,384) | | $ | 2,237,823 | |
Due from manager | | | 36,747 | |
Receivable for investments sold | | | 8,982 | |
Receivable for Fund shares sold | | | 2,088 | |
| | | | |
Total assets | | | 2,285,640 | |
| | | | |
|
Liabilities | |
Audit fee payable | | | 20,000 | |
Custodian and accounting fees payable | | | 19,345 | |
Payable for investments purchased | | | 9,962 | |
Shareholders’ reports payable | | | 4,445 | |
Legal fees and expenses payable | | | 4,058 | |
Accrued expenses | | | 2,813 | |
Affiliated transfer agent fee payable | | | 76 | |
Distribution fee payable | | | 24 | |
Shareholder service fee payable | | | 13 | |
| | | | |
Total liabilities | | | 60,736 | |
| | | | |
| |
Net Assets | | $ | 2,224,904 | |
| | | | |
| | | | | |
Net assets were comprised of: | |
Shares of beneficial interest, at par | | $ | 202 | |
Paid-in capital in excess of par | | | 2,160,781 | |
| | | | |
| | | 2,160,983 | |
Undistributed net investment income | | | 1,942 | |
Accumulated net realized loss on investment transactions | | | (460 | ) |
Net unrealized appreciation on investments | | | 62,439 | |
| | | | |
Net assets, July 31, 2017 | | $ | 2,224,904 | |
| | | | |
See Notes to Financial Statements.
| | | | |
Class R1 | | | | |
Net asset value, offering price and redemption price per share,
($97,653 ÷ 8,921 shares of beneficial interest issued and outstanding) | | $ | 10.95 | |
| | | | |
| |
Class R2 | | | | |
Net asset value, offering price and redemption price per share,
($17,858 ÷ 1,629 shares of beneficial interest issued and outstanding) | | $ | 10.96 | |
| | | | |
| |
Class R3 | | | | |
Net asset value, offering price and redemption price per share,
($10,972 ÷ 1,000 shares of beneficial interest issued and outstanding) | | $ | 10.97 | |
| | | | |
| |
Class R4 | | | | |
Net asset value, offering price and redemption price per share,
($74,877 ÷ 6,820 shares of beneficial interest issued and outstanding) | | $ | 10.98 | |
| | | | |
| |
Class R5 | | | | |
Net asset value, offering price and redemption price per share,
($10,987 ÷ 1,000 shares of beneficial interest issued and outstanding) | | $ | 10.99 | |
| | | | |
| |
Class R6 | | | | |
Net asset value, offering price and redemption price per share,
($2,012,557 ÷ 182,879 shares of beneficial interest issued and outstanding) | | $ | 11.00 | |
| | | | |
See Notes to Financial Statements.
| | | | |
| Prudential Day One Funds | | | 97 | |
Prudential Day One 2055 Fund
Statement of Assets & Liabilities
as of July 31, 2017
| | | | |
Assets | |
Affiliated investments (cost $2,804,138) | | $ | 2,842,397 | |
Due from manager | | | 36,571 | |
Receivable for investments sold | | | 6,122 | |
Receivable for Fund shares sold | | | 5,603 | |
| | | | |
Total assets | | | 2,890,693 | |
| | | | |
|
Liabilities | |
Audit fee payable | | | 20,000 | |
Custodian and accounting fees payable | | | 19,345 | |
Payable for investments purchased | | | 10,043 | |
Shareholders’ reports payable | | | 4,452 | |
Legal fees and expenses payable | | | 4,058 | |
Accrued expenses | | | 2,794 | |
Affiliated transfer agent fee payable | | | 63 | |
Distribution fee payable | | | 28 | |
Shareholder service fee payable | | | 27 | |
| | | | |
Total liabilities | | | 60,810 | |
| | | | |
| |
Net Assets | | $ | 2,829,883 | |
| | | | |
| | | | | |
Net assets were comprised of: | |
Shares of beneficial interest, at par | | $ | 255 | |
Paid-in capital in excess of par | | | 2,790,653 | |
| | | | |
| | | 2,790,908 | |
Undistributed net investment income | | | 1,197 | |
Accumulated net realized loss on investment transactions | | �� | (481 | ) |
Net unrealized appreciation on investments | | | 38,259 | |
| | | | |
Net assets, July 31, 2017 | | $ | 2,829,883 | |
| | | | |
See Notes to Financial Statements.
| | | | |
Class R1 | | | | |
Net asset value, offering price and redemption price per share,
($11,073 ÷ 1,000 shares of beneficial interest issued and outstanding) | | $ | 11.07 | |
| | | | |
| |
Class R2 | | | | |
Net asset value, offering price and redemption price per share,
($17,126 ÷ 1,544 shares of beneficial interest issued and outstanding) | | $ | 11.09 | |
| | | | |
| |
Class R3 | | | | |
Net asset value, offering price and redemption price per share,
($1,795,125 ÷ 161,779 shares of beneficial interest issued and outstanding) | | $ | 11.10 | |
| | | | |
| |
Class R4 | | | | |
Net asset value, offering price and redemption price per share,
($45,059 ÷ 4,056 shares of beneficial interest issued and outstanding) | | $ | 11.11 | |
| | | | |
| |
Class R5 | | | | |
Net asset value, offering price and redemption price per share,
($11,115 ÷ 1,000 shares of beneficial interest issued and outstanding) | | $ | 11.12 | |
| | | | |
| |
Class R6 | | | | |
Net asset value, offering price and redemption price per share,
($950,385 ÷ 85,424 shares of beneficial interest issued and outstanding) | | $ | 11.13 | |
| | | | |
See Notes to Financial Statements.
| | | | |
| Prudential Day One Funds | | | 99 | |
Prudential Day One 2060 Fund
Statement of Assets & Liabilities
as of July 31, 2017
| | | | |
Assets | |
Affiliated investments (cost $113,801) | | $ | 121,166 | |
Due from manager | | | 36,460 | |
Receivable for Fund shares sold | | | 341 | |
Receivable for investments sold | | | 326 | |
| | | | |
Total assets | | | 158,293 | |
| | | | |
|
Liabilities | |
Audit fee payable | | | 20,000 | |
Custodian and accounting fees payable | | | 19,337 | |
Shareholders’ reports payable | | | 4,452 | |
Legal fees and expenses payable | | | 4,058 | |
Accrued expenses | | | 2,803 | |
Payable for investments purchased | | | 643 | |
Affiliated transfer agent fee payable | | | 62 | |
Distribution fee payable | | | 8 | |
Shareholder service fee payable | | | 5 | |
| | | | |
Total liabilities | | | 51,368 | |
| | | | |
| |
Net Assets | | $ | 106,925 | |
| | | | |
| | | | | |
Net assets were comprised of: | |
Shares of beneficial interest, at par | | $ | 10 | |
Paid-in capital in excess of par | | | 99,354 | |
| | | | |
| | | 99,364 | |
Undistributed net investment income | | | 307 | |
Accumulated net realized loss on investment transactions | | | (111 | ) |
Net unrealized appreciation on investments | | | 7,365 | |
| | | | |
Net assets, July 31, 2017 | | $ | 106,925 | |
| | | | |
See Notes to Financial Statements.
| | | | |
Class R1 | | | | |
Net asset value, offering price and redemption price per share
($11,010 ÷ 1,000 shares of beneficial interest issued and outstanding) | | $ | 11.01 | |
| | | | |
| |
Class R2 | | | | |
Net asset value, offering price and redemption price per share,
($11,181 ÷ 1,014 shares of beneficial interest issued and outstanding) | | $ | 11.03 | |
| | | | |
| |
Class R3 | | | | |
Net asset value, offering price and redemption price per share,
($11,038 ÷ 1,000 shares of beneficial interest issued and outstanding) | | $ | 11.04 | |
| | | | |
| |
Class R4 | | | | |
Net asset value, offering price and redemption price per share,
($11,083 ÷ 1,004 shares of beneficial interest issued and outstanding) | | $ | 11.04 | |
| | | | |
| |
Class R5 | | | | |
Net asset value, offering price and redemption price per share,
($11,052 ÷ 1,000 shares of beneficial interest issued and outstanding) | | $ | 11.05 | |
| | | | |
| |
Class R6 | | | | |
Net asset value, offering price and redemption price per share,
($51,561 ÷ 4,661 shares of beneficial interest issued and outstanding) | | $ | 11.06 | |
| | | | |
See Notes to Financial Statements.
| | | | |
| Prudential Day One Funds | | | 101 | |
Prudential Day One Income Fund
Statement of Operations
Period* Ended July 31, 2017
| | | | |
Net Investment Income (Loss) | |
Affiliated dividend income | | $ | 3,048 | |
| | | | |
|
Expenses | |
Management fee | | | 35 | |
Distribution fee—Class R1 | | | 32 | |
Distribution fee—Class R2 | | | 17 | |
Distribution fee—Class R3 | | | 21 | |
Shareholder service fee—Class R1 | | | 7 | |
Shareholder service fee—Class R2 | | | 7 | |
Shareholder service fee—Class R3 | | | 21 | |
Shareholder service fee—Class R4 | | | 10 | |
Registration fees | | | 118,000 | |
Custodian and accounting fees | | | 29,000 | |
Audit fee | | | 20,000 | |
Legal fees and expenses | | | 19,000 | |
Shareholders’ reports | | | 12,000 | |
Trustees’ fees | | | 6,000 | |
Transfer agent’s fees and expenses (including affiliated expense of $270) | | | 370 | |
Miscellaneous | | | 8,212 | |
| | | | |
Total expenses | | | 212,732 | |
Less: Management fee waiver and/or expense reimbursement | | | (212,870 | ) |
| | | | |
Net expenses | | | (138 | ) |
| | | | |
Net investment income (loss) | | | 3,186 | |
| | | | |
|
Realized And Unrealized Gain (Loss) On Affiliated Investments | |
Net realized gain (loss) on investment transactions | | | (1,760 | ) |
Net capital gain distributions received | | | 258 | |
| | | | |
| | | (1,502 | ) |
| | | | |
Net change in unrealized appreciation (depreciation) on investments | | | 10,051 | |
| | | | |
Net gain (loss) on investment transactions | | | 8,549 | |
| | | | |
Net Increase (Decrease) In Net Assets Resulting From Operations | | $ | 11,735 | |
| | | | |
| * | Commencement of operations was December 13, 2016. |
See Notes to Financial Statements.
Prudential Day One 2010 Fund
Statement of Operations
Period* Ended July 31, 2017
| | | | |
Net Investment Income (Loss) | |
Affiliated dividend income | | $ | 6,348 | |
| | | | |
|
Expenses | |
Management fee | | | 66 | |
Distribution fee—Class R1 | | | 32 | |
Distribution fee—Class R2 | | | 16 | |
Distribution fee—Class R3 | | | 7 | |
Shareholder service fee—Class R1 | | | 7 | |
Shareholder service fee—Class R2 | | | 7 | |
Shareholder service fee—Class R3 | | | 7 | |
Shareholder service fee—Class R4 | | | 19 | |
Registration fees | | | 118,000 | |
Custodian and accounting fees | | | 29,000 | |
Audit fee | | | 20,000 | |
Legal fees and expenses | | | 19,000 | |
Shareholders’ reports | | | 12,000 | |
Trustees’ fees | | | 6,000 | |
Transfer agent’s fees and expenses (including affiliated expense of $250) | | | 350 | |
Miscellaneous | | | 8,218 | |
| | | | |
Total expenses | | | 212,729 | |
Less: Management fee waiver and/or expense reimbursement | | | (213,379 | ) |
| | | | |
Net expenses | | | (650 | ) |
| | | | |
Net investment income (loss) | | | 6,998 | |
| | | | |
|
Realized And Unrealized Gain (Loss) On Affiliated Investments | |
Net realized gain (loss) on investment transactions | | | (641 | ) |
Net capital gain distributions received | | | 281 | |
| | | | |
| | | (360 | ) |
| | | | |
Net change in unrealized appreciation (depreciation) on investments | | | 55,439 | |
| | | | |
Net gain (loss) on investment transactions | | | 55,079 | |
| | | | |
Net Increase (Decrease) In Net Assets Resulting From Operations | | $ | 62,077 | |
| | | | |
| * | Commencement of operations was December 13, 2016. |
See Notes to Financial Statements.
| | | | |
| Prudential Day One Funds | | | 103 | |
Prudential Day One 2015 Fund
Statement of Operations
Period* Ended July 31, 2017
| | | | |
Net Investment Income (Loss) | |
Affiliated dividend income | | $ | 7,922 | |
| | | | |
|
Expenses | |
Management fee | | | 91 | |
Distribution fee—Class R1 | | | 32 | |
Distribution fee—Class R2 | | | 16 | |
Distribution fee—Class R3 | | | 7 | |
Shareholder service fee—Class R1 | | | 7 | |
Shareholder service fee—Class R2 | | | 7 | |
Shareholder service fee—Class R3 | | | 7 | |
Shareholder service fee—Class R4 | | | 26 | |
Registration fees | | | 118,000 | |
Custodian and accounting fees | | | 29,000 | |
Audit fee | | | 20,000 | |
Legal fees and expenses | | | 19,000 | |
Shareholders’ reports | | | 12,000 | |
Trustees’ fees | | | 6,000 | |
Transfer agent’s fees and expenses (including affiliated expense of $300) | | | 360 | |
Miscellaneous | | | 8,225 | |
| | | | |
Total expenses | | | 212,778 | |
Less: Management fee waiver and/or expense reimbursement | | | (213,551 | ) |
| | | | |
Net expenses | | | (773 | ) |
| | | | |
Net investment income (loss) | | | 8,695 | |
| | | | |
|
Realized And Unrealized Gain (Loss) On Affiliated Investments | |
Net realized gain (loss) on investment transactions | | | 1,152 | |
Net capital gain distributions received | | | 352 | |
| | | | |
| | | 1,504 | |
| | | | |
Net change in unrealized appreciation (depreciation) on investments | | | 62,990 | |
| | | | |
Net gain (loss) on investment transactions | | | 64,494 | |
| | | | |
Net Increase (Decrease) In Net Assets Resulting From Operations | | $ | 73,189 | |
| | | | |
| * | Commencement of operations was December 13, 2016. |
See Notes to Financial Statements.
Prudential Day One 2020 Fund
Statement of Operations
Period* Ended July 31, 2017
| | | | |
Net Investment Income (Loss) | |
Affiliated dividend income | | $ | 21,548 | |
| | | | |
|
Expenses | |
Management fee | | | 271 | |
Distribution fee—Class R1 | | | 32 | |
Distribution fee—Class R2 | | | 16 | |
Distribution fee—Class R3 | | | 7 | |
Shareholder service fee—Class R1 | | | 7 | |
Shareholder service fee—Class R2 | | | 7 | |
Shareholder service fee—Class R3 | | | 7 | |
Shareholder service fee—Class R4 | | | 101 | |
Registration fees | | | 118,000 | |
Custodian and accounting fees | | | 29,000 | |
Audit fee | | | 20,000 | |
Legal fees and expenses | | | 19,000 | |
Shareholders’ reports | | | 12,000 | |
Trustees’ fees | | | 6,000 | |
Transfer agent’s fees and expenses (including affiliated expense of $360) | | | 462 | |
Miscellaneous | | | 8,257 | |
| | | | |
Total expenses | | | 213,167 | |
Less: Management fee waiver and/or expense reimbursement | | | (215,532 | ) |
| | | | |
Net expenses | | | (2,365 | ) |
| | | | |
Net investment income (loss) | | | 23,913 | |
| | | | |
|
Realized And Unrealized Gain (Loss) On Affiliated Investments | |
Net realized gain (loss) on investment transactions | | | (1,824 | ) |
Net capital gain distributions received | | | 398 | |
| | | | |
| | | (1,426 | ) |
| | | | |
Net change in unrealized appreciation (depreciation) on investments | | | 191,431 | |
| | | | |
Net gain (loss) on investment transactions | | | 190,005 | |
| | | | |
Net Increase (Decrease) In Net Assets Resulting From Operations | | $ | 213,918 | |
| | | | |
| * | Commencement of operations was December 13, 2016. |
See Notes to Financial Statements.
| | | | |
| Prudential Day One Funds | | | 105 | |
Prudential Day One 2025 Fund
Statement of Operations
Period* Ended July 31, 2017
| | | | |
Net Investment Income (Loss) | |
Affiliated dividend income | | $ | 19,843 | |
| | | | |
|
Expenses | |
Management fee | | | 291 | |
Distribution fee—Class R1 | | | 136 | |
Distribution fee—Class R2 | | | 16 | |
Distribution fee—Class R3 | | | 49 | |
Shareholder service fee—Class R1 | | | 28 | |
Shareholder service fee—Class R2 | | | 7 | |
Shareholder service fee—Class R3 | | | 49 | |
Shareholder service fee—Class R4 | | | 84 | |
Registration fees | | | 118,000 | |
Custodian and accounting fees | | | 29,000 | |
Audit fee | | | 20,000 | |
Legal fees and expenses | | | 19,000 | |
Shareholders’ reports | | | 12,000 | |
Trustees’ fees | | | 6,000 | |
Transfer agent’s fees and expenses (including affiliated expense of $400) | | | 480 | |
Miscellaneous | | | 8,258 | |
| | | | |
Total expenses | | | 213,398 | |
Less: Management fee waiver and/or expense reimbursement | | | (215,467 | ) |
| | | | |
Net expenses | | | (2,069 | ) |
| | | | |
Net investment income (loss) | | | 21,912 | |
| | | | |
|
Realized And Unrealized Gain (Loss) On Affiliated Investments | |
Net realized gain (loss) on investment transactions | | | (1,441 | ) |
Net capital gain distributions received | | | 539 | |
| | | | |
| | | (902 | ) |
| | | | |
Net change in unrealized appreciation (depreciation) on investments | | | 218,089 | |
| | | | |
Net gain (loss) on investment transactions | | | 217,187 | |
| | | | |
Net Increase (Decrease) In Net Assets Resulting From Operations | | $ | 239,099 | |
| | | | |
| * | Commencement of operations was December 13, 2016. |
See Notes to Financial Statements.
Prudential Day One 2030 Fund
Statement of Operations
Period* Ended July 31, 2017
| | | | |
Net Investment Income (Loss) | |
Affiliated dividend income | | $ | 14,151 | |
| | | | |
|
Expenses | |
Management fee | | | 266 | |
Distribution fee—Class R1 | | | 33 | |
Distribution fee—Class R2 | | | 18 | |
Distribution fee—Class R3 | | | 7 | |
Shareholder service fee—Class R1 | | | 7 | |
Shareholder service fee—Class R2 | | | 7 | |
Shareholder service fee—Class R3 | | | 7 | |
Shareholder service fee—Class R4 | | | 321 | |
Registration fees | | | 118,000 | |
Custodian and accounting fees | | | 29,000 | |
Audit fee | | | 20,000 | |
Legal fees and expenses | | | 19,000 | |
Shareholders’ reports | | | 12,000 | |
Trustees’ fees | | | 6,000 | |
Transfer agent’s fees and expenses (including affiliated expense of $600) | | | 1,000 | |
Miscellaneous | | | 7,956 | |
| | | | |
Total expenses | | | 213,622 | |
Less: Management fee waiver and/or expense reimbursement | | | (214,397 | ) |
| | | | |
Net expenses | | | (775 | ) |
| | | | |
Net investment income (loss) | | | 14,926 | |
| | | | |
|
Realized And Unrealized Gain (Loss) On Affiliated Investments | |
Net realized gain (loss) on investment transactions | | | (1,364 | ) |
Net capital gain distributions received | | | 633 | |
| | | | |
| | | (731 | ) |
| | | | |
Net change in unrealized appreciation (depreciation) on investments | | | 224,760 | |
| | | | |
Net gain (loss) on investment transactions | | | 224,029 | |
| | | | |
Net Increase (Decrease) In Net Assets Resulting From Operations | | $ | 238,955 | |
| | | | |
| * | Commencement of operations was December 13, 2016. |
See Notes to Financial Statements.
| | | | |
| Prudential Day One Funds | | | 107 | |
Prudential Day One 2035 Fund
Statement of Operations
Period* Ended July 31, 2017
| | | | |
Net Investment Income (Loss) | |
Affiliated dividend income | | $ | 7,819 | |
| | | | |
|
Expenses | |
Management fee | | | 181 | |
Distribution fee—Class R1 | | | 33 | |
Distribution fee—Class R2 | | | 16 | |
Distribution fee—Class R3 | | | 51 | |
Shareholder service fee—Class R1 | | | 7 | |
Shareholder service fee—Class R2 | | | 7 | |
Shareholder service fee—Class R3 | | | 51 | |
Shareholder service fee—Class R4 | | | 23 | |
Registration fees | | | 118,000 | |
Custodian and accounting fees | | | 29,000 | |
Audit fee | | | 20,000 | |
Legal fees and expenses | | | 19,000 | |
Shareholders’ reports | | | 12,000 | |
Trustees’ fees | | | 6,000 | |
Transfer agent’s fees and expenses (including affiliated expense of $270) | | | 380 | |
Miscellaneous | | | 8,235 | |
| | | | |
Total expenses | | | 212,984 | |
Less: Management fee waiver and/or expense reimbursement | | | (214,140 | ) |
| | | | |
Net expenses | | | (1,156 | ) |
| | | | |
Net investment income (loss) | | | 8,975 | |
| | | | |
|
Realized And Unrealized Gain (Loss) On Affiliated Investments | |
Net realized gain (loss) on investment transactions | | | 200 | |
Net capital gain distributions received | | | 656 | |
| | | | |
| | | 856 | |
| | | | |
Net change in unrealized appreciation (depreciation) on investments | | | 166,280 | |
| | | | |
Net gain (loss) on investment transactions | | | 167,136 | |
| | | | |
Net Increase (Decrease) In Net Assets Resulting From Operations | | $ | 176,111 | |
| | | | |
| * | Commencement of operations was December 13, 2016. |
See Notes to Financial Statements.
Prudential Day One 2040 Fund
Statement of Operations
Period* Ended July 31, 2017
| | | | |
Net Investment Income (Loss) | |
Affiliated dividend income | | $ | 6,494 | |
| | | | |
|
Expenses | |
Management fee | | | 188 | |
Distribution fee—Class R1 | | | 33 | |
Distribution fee—Class R2 | | | 17 | |
Distribution fee—Class R3 | | | 7 | |
Shareholder service fee—Class R1 | | | 7 | |
Shareholder service fee—Class R2 | | | 7 | |
Shareholder service fee—Class R3 | | | 7 | |
Shareholder service fee—Class R4 | | | 45 | |
Registration fees | | | 118,000 | |
Custodian and accounting fees | | | 29,000 | |
Audit fee | | | 20,000 | |
Legal fees and expenses | | | 19,000 | |
Shareholders’ reports | | | 12,000 | |
Trustees’ fees | | | 6,000 | |
Transfer agent’s fees and expenses (including affiliated expense of $290) | | | 410 | |
Miscellaneous | | | 8,240 | |
| | | | |
Total expenses | | | 212,961 | |
Less: Management fee waiver and/or expense reimbursement | | | (214,291 | ) |
| | | | |
Net expenses | | | (1,330 | ) |
| | | | |
Net investment income (loss) | | | 7,824 | |
| | | | |
|
Realized And Unrealized Gain (Loss) On Affiliated Investments | |
Net realized gain (loss) on investment transactions | | | 4,803 | |
Net capital gain distributions received | | | 656 | |
| | | | |
| | | 5,459 | |
| | | | |
Net change in unrealized appreciation (depreciation) on investments | | | 180,802 | |
| | | | |
Net gain (loss) on investment transactions | | | 186,261 | |
| | | | |
Net Increase (Decrease) In Net Assets Resulting From Operations | | $ | 194,085 | |
| | | | |
| * | Commencement of operations was December 13, 2016. |
See Notes to Financial Statements.
| | | | |
| Prudential Day One Funds | | | 109 | |
Prudential Day One 2045 Fund
Statement of Operations
Period* Ended July 31, 2017
| | | | |
Net Investment Income (Loss) | |
Affiliated dividend income | | $ | 3,587 | |
| | | | |
|
Expenses | |
Management fee | | | 116 | |
Distribution fee—Class R1 | | | 33 | |
Distribution fee—Class R2 | | | 17 | |
Distribution fee—Class R3 | | | 49 | |
Shareholder service fee—Class R1 | | | 7 | |
Shareholder service fee—Class R2 | | | 7 | |
Shareholder service fee—Class R3 | | | 49 | |
Shareholder service fee—Class R4 | | | 90 | |
Registration fees | | | 118,000 | |
Custodian and accounting fees | | | 29,000 | |
Audit fee | | | 20,000 | |
Legal fees and expenses | | | 19,000 | |
Shareholders’ reports | | | 12,000 | |
Trustees’ fees | | | 6,000 | |
Transfer agent’s fees and expenses (including affiliated expense of $350) | | | 470 | |
Miscellaneous | | | 8,228 | |
| | | | |
Total expenses | | | 213,066 | |
Less: Management fee waiver and/or expense reimbursement | | | (213,513 | ) |
| | | | |
Net expenses | | | (447 | ) |
| | | | |
Net investment income (loss) | | | 4,034 | |
| | | | |
|
Realized And Unrealized Gain (Loss) On Affiliated Investments | |
Net realized gain (loss) on investment transactions | | | 3,410 | |
Net capital gain distributions received | | | 656 | |
| | | | |
| | | 4,066 | |
| | | | |
Net change in unrealized appreciation (depreciation) on investments | | | 101,602 | |
| | | | |
Net gain (loss) on investment transactions | | | 105,668 | |
| | | | |
Net Increase (Decrease) In Net Assets Resulting From Operations | | $ | 109,702 | |
| | | | |
| * | Commencement of operations was December 13, 2016. |
See Notes to Financial Statements.
Prudential Day One 2050 Fund
Statement of Operations
Period* Ended July 31, 2017
| | | | |
Net Investment Income (Loss) | |
Affiliated dividend income | | $ | 1,691 | |
| | | | |
|
Expenses | |
Management fee | | | 52 | |
Distribution fee—Class R1 | | | 49 | |
Distribution fee—Class R2 | | | 17 | |
Distribution fee—Class R3 | | | 7 | |
Shareholder service fee—Class R1 | | | 10 | |
Shareholder service fee—Class R2 | | | 7 | |
Shareholder service fee—Class R3 | | | 7 | |
Shareholder service fee—Class R4 | | | 29 | |
Registration fees | | | 118,000 | |
Custodian and accounting fees | | | 29,000 | |
Audit fee | | | 20,000 | |
Legal fees and expenses | | | 19,000 | |
Shareholders’ reports | | | 12,000 | |
Trustees’ fees | | | 6,000 | |
Transfer agent’s fees and expenses (including affiliated expense of $280) | | | 420 | |
Miscellaneous | | | 8,210 | |
| | | | |
Total expenses | | | 212,808 | |
Less: Management fee waiver and/or expense reimbursement | | | (213,051 | ) |
| | | | |
Net expenses | | | (243 | ) |
| | | | |
Net investment income (loss) | | | 1,934 | |
| | | | |
|
Realized And Unrealized Gain (Loss) On Affiliated Investments | |
Net realized gain (loss) on investment transactions | | | (1,093 | ) |
Net capital gain distributions received | | | 633 | |
| | | | |
| | | (460 | ) |
| | | | |
Net change in unrealized appreciation (depreciation) on investments | | | 62,439 | |
| | | | |
Net gain (loss) on investment transactions | | | 61,979 | |
| | | | |
Net Increase (Decrease) In Net Assets Resulting From Operations | | $ | 63,913 | |
| | | | |
| * | Commencement of operations was December 13, 2016. |
See Notes to Financial Statements.
| | | | |
| Prudential Day One Funds | | | 111 | |
Prudential Day One 2055 Fund
Statement of Operations
Period* Ended July 31, 2017
| | | | |
Net Investment Income (Loss) | |
Affiliated dividend income | | $ | 1,035 | |
| | | | |
|
Expenses | |
Management fee | | | 48 | |
Distribution fee—Class R1 | | | 33 | |
Distribution fee—Class R2 | | | 17 | |
Distribution fee—Class R3 | | | 26 | |
Shareholder service fee—Class R1 | | | 7 | |
Shareholder service fee—Class R2 | | | 7 | |
Shareholder service fee—Class R3 | | | 26 | |
Shareholder service fee—Class R4 | | | 16 | |
Registration fees | | | 118,000 | |
Custodian and accounting fees | | | 29,000 | |
Audit fee | | | 20,000 | |
Legal fees and expenses | | | 19,000 | |
Shareholders’ reports | | | 12,000 | |
Trustees’ fees | | | 6,000 | |
Transfer agent’s fees and expenses (including affiliated expense of $260) | | | 350 | |
Miscellaneous | | | 8,216 | |
| | | | |
Total expenses | | | 212,746 | |
Less: Management fee waiver and/or expense reimbursement | | | (212,900 | ) |
| | | | |
Net expenses | | | (154 | ) |
| | | | |
Net investment income (loss) | | | 1,189 | |
| | | | |
|
Realized And Unrealized Gain (Loss) On Affiliated Investments | |
Net realized gain (loss) on investment transactions | | | (1,137 | ) |
Net capital gain distributions received | | | 656 | |
| | | | |
| | | (481 | ) |
| | | | |
Net change in unrealized appreciation (depreciation) on investments | | | 38,259 | |
| | | | |
Net gain (loss) on investment transactions | | | 37,778 | |
| | | | |
Net Increase (Decrease) In Net Assets Resulting From Operations | | $ | 38,967 | |
| | | | |
| * | Commencement of operations was December 13, 2016. |
See Notes to Financial Statements.
Prudential Day One 2060 Fund
Statement of Operations
Period* Ended July 31, 2017
| | | | |
Net Investment Income (Loss) | |
Affiliated dividend income | | $ | 354 | |
| | | | |
|
Expenses | |
Management fee | | | 9 | |
Distribution fee—Class R1 | | | 33 | |
Distribution fee—Class R2 | | | 16 | |
Distribution fee—Class R3 | | | 7 | |
Shareholder service fee—Class R1 | | | 7 | |
Shareholder service fee—Class R2 | | | 7 | |
Shareholder service fee—Class R3 | | | 7 | |
Shareholder service fee—Class R4 | | | 7 | |
Registration fees | | | 118,000 | |
Custodian and accounting fees | | | 29,000 | |
Audit fee | | | 20,000 | |
Legal fees and expenses | | | 19,000 | |
Shareholders’ reports | | | 12,000 | |
Trustees’ fees | | | 6,000 | |
Transfer agent’s fees and expenses (including affiliated expense of $270) | | | 380 | |
Miscellaneous | | | 8,199 | |
| | | | |
Total expenses | | | 212,672 | |
Less: Management fee waiver and/or expense reimbursement | | | (212,600 | ) |
| | | | |
Net expenses | | | 72 | |
| | | | |
Net investment income (loss) | | | 282 | |
| | | | |
|
Realized And Unrealized Gain (Loss) On Affiliated Investments | |
Net realized gain (loss) on investment transactions | | | (791 | ) |
Net capital gain distributions received | | | 680 | |
| | | | |
| | | (111 | ) |
| | | | |
Net change in unrealized appreciation (depreciation) on investments | | | 7,365 | |
| | | | |
Net gain (loss) on investment transactions | | | 7,254 | |
| | | | |
Net Increase (Decrease) In Net Assets Resulting From Operations | | $ | 7,536 | |
| | | | |
| * | Commencement of operations was December 13, 2016. |
See Notes to Financial Statements.
| | | | |
| Prudential Day One Funds | | | 113 | |
Prudential Day One Income Fund
Statement of Changes in Net Assets
| | | | |
| | | December 13, 2016*
through
July 31, 2017 | |
Increase (Decrease) in Net Assets | |
Operations | |
Net investment income (loss) | | $ | 3,186 | |
Net realized gain (loss) on investment transactions | | | (1,760 | ) |
Net capital gain distributions received | | | 258 | |
Net change in unrealized appreciation (depreciation) on investments | | | 10,051 | |
| | | | |
Net increase (decrease) in net assets resulting from operations | | | 11,735 | |
| | | | |
|
Dividends from net investment income | |
Class R1 | | | (29 | ) |
Class R2 | | | (39 | ) |
Class R3 | | | (46 | ) |
Class R4 | | | (83 | ) |
Class R5 | | | (57 | ) |
Class R6 | | | (1,339 | ) |
| | | | |
| | | (1,593 | ) |
| | | | |
|
Fund share transactions | |
Net proceeds from shares sold | | | 2,630,195 | |
Net asset value of shares issued in reinvestment of dividends and distributions | | | 1,593 | |
Cost of shares reacquired | | | (602,811 | ) |
| | | | |
Net increase (decrease) in net assets from Fund share transactions | | | 2,028,977 | |
| | | | |
Total increase (decrease) | | | 2,039,119 | |
|
Net Assets: | |
Beginning of period | | | — | |
| | | | |
End of period(a) | | $ | 2,039,119 | |
| | | | |
(a) Includes undistributed net investment income of: | | $ | 1,596 | |
| | | | |
| * | Commencement of operations. |
See Notes to Financial Statements.
Prudential Day One 2010 Fund
Statement of Changes in Net Assets
| | | | |
| | | December 13, 2016*
through
July 31, 2017 | |
Increase (Decrease) in Net Assets | |
Operations | |
Net investment income (loss) | | $ | 6,998 | |
Net realized gain (loss) on investment transactions | | | (641 | ) |
Net capital gain distributions received | | | 281 | |
Net change in unrealized appreciation (depreciation) on investments | | | 55,439 | |
| | | | |
Net increase (decrease) in net assets resulting from operations | | | 62,077 | |
| | | | |
|
Fund share transactions | |
Net proceeds from shares sold | | | 4,488,653 | |
Cost of shares reacquired | | | (30,631 | ) |
| | | | |
Net increase (decrease) in net assets from Fund share transactions | | | 4,458,022 | |
| | | | |
Total increase (decrease) | | | 4,520,099 | |
|
Net Assets: | |
Beginning of period | | | — | |
| | | | |
End of period(a) | | $ | 4,520,099 | |
| | | | |
(a) Includes undistributed net investment income of: | | $ | 7,001 | |
| | | | |
| * | Commencement of operations. |
See Notes to Financial Statements.
| | | | |
| Prudential Day One Funds | | | 115 | |
Prudential Day One 2015 Fund
Statement of Changes in Net Assets
| | | | |
| | | December 13, 2016* through July 31, 2017 | |
Increase (Decrease) in Net Assets | |
Operations | |
Net investment income (loss) | | $ | 8,695 | |
Net realized gain (loss) on investment transactions | | | 1,152 | |
Net capital gain distributions received | | | 352 | |
Net change in unrealized appreciation (depreciation) on investments | | | 62,990 | |
| | | | |
Net increase (decrease) in net assets resulting from operations | | | 73,189 | |
| | | | |
|
Fund share transactions | |
Net proceeds from shares sold | | | 4,846,667 | |
Cost of shares reacquired | | | (728,076 | ) |
| | | | |
Net increase (decrease) in net assets from Fund share transactions | | | 4,118,591 | |
| | | | |
Total increase (decrease) | | | 4,191,780 | |
|
Net Assets: | |
Beginning of period | | | — | |
| | | | |
End of period(a) | | $ | 4,191,780 | |
| | | | |
(a) Includes undistributed net investment income of: | | $ | 8,699 | |
| | | | |
| * | Commencement of operations. |
See Notes to Financial Statements.
Prudential Day One 2020 Fund
Statement of Changes in Net Assets
| | | | |
| | | December 13, 2016*
through
July 31, 2017 | |
Increase (Decrease) in Net Assets | |
Operations | |
Net investment income (loss) | | $ | 23,913 | |
Net realized gain (loss) on investment transactions | | | (1,824 | ) |
Net capital gain distributions received | | | 398 | |
Net change in unrealized appreciation (depreciation) on investments | | | 191,431 | |
| | | | |
Net increase (decrease) in net assets resulting from operations | | | 213,918 | |
| | | | |
|
Fund share transactions | |
Net proceeds from shares sold | | | 12,908,699 | |
Cost of shares reacquired | | | (534,721 | ) |
| | | | |
Net increase (decrease) in net assets from Fund share transactions | | | 12,373,978 | |
| | | | |
Total increase (decrease) | | | 12,587,896 | |
|
Net Assets: | |
Beginning of period | | | — | |
| | | | |
End of period(a) | | $ | 12,587,896 | |
| | | | |
(a) Includes undistributed net investment income of: | | $ | 23,917 | |
| | | | |
| * | Commencement of operations. |
See Notes to Financial Statements.
| | | | |
| Prudential Day One Funds | | | 117 | |
Prudential Day One 2025 Fund
Statement of Changes in Net Assets
| | | | |
| | | December 13, 2016*
through
July 31, 2017 | |
Increase (Decrease) in Net Assets | |
Operations | |
Net investment income (loss) | | $ | 21,912 | |
Net realized gain (loss) on investment transactions | | | (1,441 | ) |
Net capital gain distributions received | | | 539 | |
Net change in unrealized appreciation (depreciation) on investments | | | 218,089 | |
| | | | |
Net increase (decrease) in net assets resulting from operations | | | 239,099 | |
| | | | |
|
Fund share transactions | |
Net proceeds from shares sold | | | 17,955,468 | |
Cost of shares reacquired | | | (157,356 | ) |
| | | | |
Net increase (decrease) in net assets from Fund share transactions | | | 17,798,112 | |
| | | | |
Total increase (decrease) | | | 18,037,211 | |
|
Net Assets: | |
Beginning of period | | | — | |
| | | | |
End of period(a) | | $ | 18,037,211 | |
| | | | |
(a) Includes undistributed net investment income of: | | $ | 21,918 | |
| | | | |
| * | Commencement of operations. |
See Notes to Financial Statements.
Prudential Day One 2030 Fund
Statement of Changes in Net Assets
| | | | |
| | | December 13, 2016*
through
July 31, 2017 | |
Increase (Decrease) in Net Assets | |
Operations | |
Net investment income (loss) | | $ | 14,926 | |
Net realized gain (loss) on investment transactions | | | (1,364 | ) |
Net capital gain distributions received | | | 633 | |
Net change in unrealized appreciation (depreciation) on investments | | | 224,760 | |
| | | | |
Net increase (decrease) in net assets resulting from operations | | | 238,955 | |
| | | | |
|
Fund share transactions | |
Net proceeds from shares sold | | | 10,121,534 | |
Cost of shares reacquired | | | (28,862 | ) |
| | | | |
Net increase (decrease) in net assets from Fund share transactions | | | 10,092,672 | |
| | | | |
Total increase (decrease) | | | 10,331,627 | |
|
Net Assets: | |
Beginning of period | | | — | |
| | | | |
End of period(a) | | $ | 10,331,627 | |
| | | | |
(a) Includes undistributed net investment income of: | | $ | 14,933 | |
| | | | |
| * | Commencement of operations. |
See Notes to Financial Statements.
| | | | |
| Prudential Day One Funds | | | 119 | |
Prudential Day One 2035 Fund
Statement of Changes in Net Assets
| | | | |
| | | December 13, 2016* through
July 31, 2017 | |
Increase (Decrease) in Net Assets | |
Operations | |
Net investment income (loss) | | $ | 8,975 | |
Net realized gain (loss) on investment transactions | | | 200 | |
Net capital gain distributions received | | | 656 | |
Net change in unrealized appreciation (depreciation) on investments | | | 166,280 | |
| | | | |
Net increase (decrease) in net assets resulting from operations | | | 176,111 | |
| | | | |
|
Fund share transactions | |
Net proceeds from shares sold | | | 11,087,629 | |
Cost of shares reacquired | | | (239,117 | ) |
| | | | |
Net increase (decrease) in net assets from Fund share transactions | | | 10,848,512 | |
| | | | |
Total increase (decrease) | | | 11,024,623 | |
|
Net Assets: | |
Beginning of period | | | — | |
| | | | |
End of period(a) | | $ | 11,024,623 | |
| | | | |
(a) Includes undistributed net investment income of: | | $ | 8,983 | |
| | | | |
| * | Commencement of operations. |
See Notes to Financial Statements.
Prudential Day One 2040 Fund
Statement of Changes in Net Assets
| | | | |
| | | December 13, 2016*
through
July 31, 2017 | |
Increase (Decrease) in Net Assets | |
Operations | |
Net investment income (loss) | | $ | 7,824 | |
Net realized gain (loss) on investment transactions | | | 4,803 | |
Net capital gain distributions received | | | 656 | |
Net change in unrealized appreciation (depreciation) on investments | | | 180,802 | |
| | | | |
Net increase (decrease) in net assets resulting from operations | | | 194,085 | |
| | | | |
|
Fund share transactions | |
Net proceeds from shares sold | | | 6,044,148 | |
Cost of shares reacquired | | | (385,231 | ) |
| | | | |
Net increase (decrease) in net assets from Fund share transactions | | | 5,658,917 | |
| | | | |
Total increase (decrease) | | | 5,853,002 | |
|
Net Assets: | |
Beginning of period | | | — | |
| | | | |
End of period(a) | | $ | 5,853,002 | |
| | | | |
(a) Includes undistributed net investment income of: | | $ | 7,832 | |
| | | | |
| * | Commencement of operations. |
See Notes to Financial Statements.
| | | | |
| Prudential Day One Funds | | | 121 | |
Prudential Day One 2045 Fund
Statement of Changes in Net Assets
| | | | |
| | | December 13, 2016*
through
July 31, 2017 | |
Increase (Decrease) in Net Assets | |
Operations | |
Net investment income (loss) | | $ | 4,034 | |
Net realized gain (loss) on investment transactions | | | 3,410 | |
Net capital gain distributions received | | | 656 | |
Net change in unrealized appreciation (depreciation) on investments | | | 101,602 | |
| | | | |
Net increase (decrease) in net assets resulting from operations | | | 109,702 | |
| | | | |
|
Fund share transactions | |
Net proceeds from shares sold | | | 7,680,944 | |
Cost of shares reacquired | | | (246,640 | ) |
| | | | |
Net increase (decrease) in net assets from Fund share transactions | | | 7,434,304 | |
| | | | |
Total increase (decrease) | | | 7,544,006 | |
|
Net Assets: | |
Beginning of period | | | — | |
| | | | |
End of period(a) | | $ | 7,544,006 | |
| | | | |
(a) Includes undistributed net investment income of: | | $ | 4,042 | |
| | | | |
| * | Commencement of operations. |
See Notes to Financial Statements.
Prudential Day One 2050 Fund
Statement of Changes in Net Assets
| | | | |
| | | December 13, 2016*
through
July 31, 2017 | |
Increase (Decrease) in Net Assets | |
Operations | |
Net investment income (loss) | | $ | 1,934 | |
Net realized gain (loss) on investment transactions | | | (1,093 | ) |
Net capital gain distributions received | | | 633 | |
Net change in unrealized appreciation (depreciation) on investments | | | 62,439 | |
| | | | |
Net increase (decrease) in net assets resulting from operations | | | 63,913 | |
| | | | |
|
Fund share transactions | |
Net proceeds from shares sold | | | 2,232,116 | |
Cost of shares reacquired | | | (71,125 | ) |
| | | | |
Net increase (decrease) in net assets from Fund share transactions | | | 2,160,991 | |
| | | | |
Total increase (decrease) | | | 2,224,904 | |
|
Net Assets: | |
Beginning of period | | | — | |
| | | | |
End of period(a) | | $ | 2,224,904 | |
| | | | |
(a) Includes undistributed net investment income of: | | $ | 1,942 | |
| | | | |
| * | Commencement of operations. |
See Notes to Financial Statements.
| | | | |
| Prudential Day One Funds | | | 123 | |
Prudential Day One 2055 Fund
Statement of Changes in Net Assets
| | | | |
| | | December 13, 2016*
through
July 31, 2017 | |
Increase (Decrease) in Net Assets | |
Operations | |
Net investment income (loss) | | $ | 1,189 | |
Net realized gain (loss) on investment transactions | | | (1,137 | ) |
Net capital gain distributions received | | | 656 | |
Net change in unrealized appreciation (depreciation) on investments | | | 38,259 | |
| | | | |
Net increase (decrease) in net assets resulting from operations | | | 38,967 | |
| | | | |
|
Fund share transactions | |
Net proceeds from shares sold | | | 2,797,316 | |
Cost of shares reacquired | | | (6,400 | ) |
| | | | |
Net increase (decrease) in net assets from Fund share transactions | | | 2,790,916 | |
| | | | |
Total increase (decrease) | | | 2,829,883 | |
|
Net Assets: | |
Beginning of period | | | — | |
| | | | |
End of period(a) | | $ | 2,829,883 | |
| | | | |
(a) Includes undistributed net investment income of: | | $ | 1,197 | |
| | | | |
| * | Commencement of operations. |
See Notes to Financial Statements.
Prudential Day One 2060 Fund
Statement of Changes in Net Assets
| | | | |
| | | December 13, 2016*
through
July 31, 2017 | |
Increase (Decrease) in Net Assets | |
Operations | |
Net investment income (loss) | | $ | 282 | |
Net realized gain (loss) on investment transactions | | | (791 | ) |
Net capital gain distributions received | | | 680 | |
Net change in unrealized appreciation (depreciation) on investments | | | 7,365 | |
| | | | |
Net increase (decrease) in net assets resulting from operations | | | 7,536 | |
| | | | |
|
Fund share transactions | |
Net proceeds from shares sold | | | 107,447 | |
Cost of shares reacquired | | | (8,058 | ) |
| | | | |
Net increase (decrease) in net assets from Fund share transactions | | | 99,389 | |
| | | | |
Total increase (decrease) | | | 106,925 | |
|
Net Assets: | |
Beginning of period | | | — | |
| | | | |
End of period(a) | | $ | 106,925 | |
| | | | |
(a) Includes undistributed net investment income of: | | $ | 307 | |
| | | | |
| * | Commencement of operations. |
See Notes to Financial Statements.
| | | | |
| Prudential Day One Funds | | | 125 | |
Notes to Financial Statements
Prudential Investment Portfolios 5 (the “Trust”) is registered under the Investment Company Act of 1940, as amended (“1940 Act”), as an open-end management investment company, which was established as a Delaware business trust on July 8, 1999. The Trust consists of fourteen separate funds: Prudential Day One Income Fund, Prudential Day One 2010 Fund, Prudential Day One 2015 Fund, Prudential Day One 2020 Fund, Prudential Day One 2025 Fund, Prudential Day One 2030 Fund, Prudential Day One 2035 Fund, Prudential Day One 2040 Fund, Prudential Day One 2045 Fund, Prudential Day One 2050 Fund, Prudential Day One 2055 Fund, Prudential Day One 2060 Fund, Prudential Jennison Diversified Growth Fund (formerly Prudential Jennison Conservative Growth Fund) and Prudential Jennison Rising Dividend Fund. These financial statements relate to Prudential Day One Income Fund, Prudential Day One 2010 Fund, Prudential Day One 2015 Fund, Prudential Day One 2020 Fund, Prudential Day One 2025 Fund, Prudential Day One 2030 Fund, Prudential Day One 2035 Fund, Prudential Day One 2040 Fund, Prudential Day One 2045 Fund, Prudential Day One 2050 Fund, Prudential Day One 2055 Fund, Prudential Day One 2060 Fund (collectively referred to as the “Day One Funds”). The financial statements of the other funds are not presented herein.
The investment objective of the Day One Funds is to seek a balance between growth and conservation of capital. Each Day One Fund seeks to achieve its objective by investing in a combination of mutual funds in the Prudential mutual fund family (each, an underlying fund). Each Fund in the Day One Funds is typically referred to as a “Fund of Funds” because it invests in other mutual funds. The Day One Funds may also invest directly in U.S. Government securities and money market instruments for cash management purposes or when assuming a defensive position.
1. Accounting Policies
The Day One Funds follow investment company accounting and reporting guidance of the Financial Accounting Standards Board (“FASB”) Accounting Standard Codification Topic 946 Financial Services—Investment Companies. The following accounting policies conform to U.S. generally accepted accounting principles. The Day One Funds consistently follow such policies in the preparation of their financial statements.
Securities Valuation: The Day One Funds hold securities and other assets and liabilities that are fair valued at the close of each day (generally, 4:00 PM Eastern time) the New York Stock Exchange (“NYSE”) is open for trading. Fair value is the price that would be received to sell an asset or paid to transfer a liability in an orderly transaction between market participants on the measurement date. The Board of Trustees (the “Board”) has adopted valuation procedures for security valuation under which fair valuation responsibilities have been delegated to PGIM Investments LLC (“PGIM Investments” or “the Manager”) (formerly known as Prudential Investments LLC). Under the current valuation procedures, the Valuation Committee is responsible for supervising the valuation of portfolio securities and other assets and liabilities. The valuation procedures permit the Day One Funds to
utilize independent pricing vendor services, quotations from market makers, and alternative valuation methods when market quotations are either not readily available or not deemed representative of fair value. A record of the Valuation Committee’s actions is subject to the Board’s review, approval, and ratification at its next regularly scheduled quarterly meeting.
Various inputs determine how each Day One Fund’s investments are valued, all of which are categorized according to the three broad levels (Level 1, 2, or 3) detailed in the Schedule of Investments.
Investments in open-end, non-exchange-traded mutual funds are valued at their net asset values as of the close of the NYSE on the date of valuation. These securities are classified as Level 1 in the fair value hierarchy since they may be purchased or sold at their net asset values on the date of valuation.
Securities and other assets that cannot be priced according to the methods described above are valued based on pricing methodologies approved by the Board. In the event that unobservable inputs are used when determining such valuations, the securities will be classified as Level 3 in the fair value hierarchy.
When determining the fair value of securities, some of the factors influencing the valuation include: the nature of any restrictions on disposition of the securities; assessment of the general liquidity of the securities; the issuer’s financial condition and the markets in which it does business; the cost of the investment; the size of the holding and the capitalization of the issuer; the prices of any recent transactions or bids/offers for such securities or any comparable securities; any available analyst media or other reports or information deemed reliable by the investment adviser regarding the issuer or the markets or industry in which it operates. Using fair value to price securities may result in a value that is different from a security’s most recent closing price and from the price used by other unaffiliated mutual funds to calculate their net asset values.
Securities Transactions and Net Investment Income: Securities transactions are recorded on the trade date. Realized gains (losses) from investment and currency transactions are calculated on the specific identification method. Dividend income is recorded on the ex-date. Interest income, including amortization of premium and accretion of discount on debt securities, as required, is recorded on the accrual basis. Expenses are recorded on an accrual basis, which may require the use of certain estimates by management that may differ from actual and such expenses exclude those of the underlying funds. Expenses on the underlying funds are reflected in the net asset values of those funds. The Trust’s expenses are allocated to the respective fund on the basis of relative net assets except the expenses that are charged directly at the fund or class level.
Net investment income or loss (other than distribution fees, transfer agency fees and shareholder service fees, which are charged directly to the respective share class) and unrealized and realized gains (losses) are allocated daily to each class of shares based upon the relative proportion of adjusted net assets of each class at the beginning of the day.
| | | | |
| Prudential Day One Funds | | | 127 | |
Notes to Financial Statements (continued)
Taxes: It is each of the Day One Funds’ policy to meet the requirements of the Internal Revenue Code applicable to regulated investment companies and to distribute all of its taxable net investment income and capital gains, if any, to its shareholders. Therefore, no federal income tax provision is required. Withholding taxes on foreign dividends, interest and capital gains, if any, are recorded, net of reclaimable amounts, at the time the related income is earned.
Dividends and Distributions: The Prudential Day One Income Fund expects to pay dividends from net investment income quarterly. All other Day One Funds expect to pay dividends from net investment income annually. Each Day One Fund declares and pays its net realized capital gains, if any, annually. Dividends and distributions to shareholders, which are determined in accordance with federal income tax regulations and which may differ from generally accepted accounting principles, are recorded on the ex-date. Permanent book/tax differences relating to income and gain (loss) are reclassified amongst undistributed net investment income, accumulated net realized gain (loss) and paid-in capital in excess of par, as appropriate.
Estimates: The preparation of financial statements requires management to make estimates and assumptions that affect the reported amounts and disclosures in the financial statements. Actual results could differ from those estimates.
2. Agreements
The Trust, on behalf of the Day One Funds, has a management agreement with PGIM Investments. Pursuant to this agreement, PGIM Investments has responsibility for all investment advisory services and supervises the subadviser’s performance of such services. PGIM Investments has entered into a subadvisory agreement with Quantitative Management Associates LLC (“QMA”). The subadvisory agreement provides that QMA will furnish investment advisory services in connection with the management of the Day One Funds. In connection therewith, QMA is obligated to keep certain books and records of the Day One Funds. PGIM Investments pays for the services of QMA, the cost of compensation of officers of the Day One Funds, occupancy and certain clerical and bookkeeping costs of the Day One Funds. The Day One Funds bear all other costs and expenses.
The management fee paid to PGIM Investments is accrued daily and payable monthly at an annual rate of .02% of each Day One Fund’s average daily net assets. For all Day One Funds the management fee amount waived exceeded the management fee for the period ended July 31, 2017.
PGIM Investments has contractually agreed through November 30, 2018 to limit each Day One Fund’s net annual operating expenses and acquired fund fees and expenses
(exclusive of distribution and service (12b-1) fees, shareholder service fees, transfer agency expenses (including sub-transfer agency and networking fees), taxes (including acquired fund taxes and taxes such as income and foreign withholding taxes, stamp duty and deferred tax expenses), interest, brokerage, extraordinary and certain other expenses such as dividend, broker charges and interest expense on short sales (including acquired fund dividend and interest expense on short sales)) of each class of shares to .40% of each Day One Fund’s average daily net assets. In addition, through July 31, 2017, PGIM Investments has voluntarily agreed to limit each Day One Fund’s net annual operating expenses and acquired fund fees and expenses (exclusive of distribution and service (12b-1) fees, shareholder service fees, taxes (including acquired fund taxes and taxes such as income and foreign withholding taxes, stamp duty and deferred tax expenses), interest, brokerage, extraordinary and certain other expenses such as dividend, broker charges and interest expense on short sales (including acquired fund dividend and interest expense on short sales)) of each class of shares to .55% of each Day One Fund’s average daily net assets. Expenses waived/reimbursed by the manager may be recouped by the manager within the same fiscal year during which such waiver/reimbursement is made if such recoupment can be realized without exceeding the expense limit in effect at the time of the recoupment for that fiscal year.
The Trust, on behalf of the Day One Funds, has a distribution agreement pursuant to Rule 12b-1 under the 1940 Act, with Prudential Investment Management Services LLC (“PIMS”), which acts as the distributor of the Class R1, Class R2, Class R3, Class R4, Class R5 and Class R6 shares of the Day One Funds. The Day One Funds compensate PIMS for distributing and servicing the Day One Funds’ Class R1, Class R2 and Class R3 shares, pursuant to plans of distribution (the “Distribution Plans”), regardless of expenses actually incurred by PIMS. The distribution fees are accrued daily and payable monthly. No distribution or service fees are paid to PIMS as distributor of the Class R4, Class R5 and Class R6 shares of the Day One Funds.
Pursuant to the Distribution Plans, the Day One Funds compensate PIMS for distribution related activities at an annual rate of up to .50%, .25% and .10% of the average daily net assets of the Class R1, Class R2 and Class R3 shares, respectively.
The Day One Funds have adopted a Shareholder Services Plan with respect to Class R1, Class R2, Class R3 and Class R4 shares. Under the terms of the Shareholder Services Plan, each Fund’s Class R1, Class R2, Class R3 and Class R4 shares are authorized to pay to Prudential Mutual Fund Services LLC (“PMFS”), its affiliates or third-party service providers, as compensation for services rendered to the shareholders of such Class R1, Class R2, Class R3 or Class R4 shares, a shareholder service fee at an annual rate of 0.10% of the average daily net assets attributable to Class R1, Class R2, Class R3 and Class R4 shares. The shareholder service fee is accrued daily and paid monthly.
PGIM Investments, PIMS, QMA and PMFS are indirect, wholly-owned subsidiaries of Prudential Financial, Inc. (“Prudential”).
| | | | |
| Prudential Day One Funds | | | 129 | |
Notes to Financial Statements (continued)
3. Other Transactions with Affiliates
PMFS serves as the Trust’s transfer agent. The transfer agent’s fees and expenses in the Statement of Operations include certain out-of-pocket expenses paid to non-affiliates, where applicable.
The Day One Funds may enter into certain securities purchase or sale transactions under Board approved Rule 17a-7 procedures. Rule 17a-7 is an exemptive rule under the 1940 Act, that permits purchase and sale transactions among affiliated investment companies, or between an investment company and a person that is affiliated solely by reason of having a common (or affiliated) investment adviser, common directors, and/or common officers. Such transactions are subject to ratification by the Board. For the reporting period ended July 31, 2017 no such transactions were entered into by the Day One Funds.
The Day One Funds may invest their overnight sweep cash in the Prudential Core Ultra Short Bond Fund (the “Core Fund”), a series of Prudential Investment Portfolios 2, registered under the 1940 Act and managed by PGIM Investments. Earnings from the Core Fund and other affiliated mutual funds are disclosed on the Statement of Operations as “Affiliated dividend income”.
4. Investments in Affiliated Issuers
The aggregate cost of purchases and proceeds from sales of portfolio securities, (excluding short-term investments and U.S. Treasury securities), for the period ended July 31, 2017, were as follows:
| | | | | | | | |
| | | Cost of
Purchases | | | Proceeds
from Sales | |
Prudential Day One Income Fund | | $ | 2,375,819 | | | $ | 550,381 | |
Prudential Day One 2010 Fund | | | 4,108,790 | | | | 53,463 | |
Prudential Day One 2015 Fund | | | 4,357,798 | | | | 610,309 | |
Prudential Day One 2020 Fund | | | 11,871,270 | | | | 489,018 | |
Prudential Day One 2025 Fund | | | 16,732,319 | | | | 187,728 | |
Prudential Day One 2030 Fund | | | 9,692,629 | | | | 108,771 | |
Prudential Day One 2035 Fund | | | 10,887,283 | | | | 258,280 | |
Prudential Day One 2040 Fund | | | 6,033,194 | | | | 428,952 | |
Prudential Day One 2045 Fund | | | 7,721,586 | | | | 288,623 | |
Prudential Day One 2050 Fund | | | 2,251,250 | | | | 89,471 | |
Prudential Day One 2055 Fund | | | 2,813,299 | | | | 22,798 | |
Prudential Day One 2060 Fund | | | 113,291 | | | | 13,027 | |
A summary of cost of purchases and proceeds from sales from shares of affiliated mutual funds, other than short-term investments, for the period ended July 31, 2017, is presented as follows:
Prudential Day One Income Fund
| | | | | | | | | | | | | | | | | | | | | | | | | | | | | | | | | | | | | | | | |
Affiliated Mutual Funds | | Value,
Beginning
of Period | | | Cost of
Purchases | | | Exchange | | | Proceeds
from Sales | | | Change in
Unrealized
Gain
(Loss) | | | Realized
Gain
(Loss) | | | Value,
End of
Period | | | Shares,
End of
Period | | | Dividend
Income | | | Capital Gain
Distributions | |
Prudential Commodity Strategies Fund (Class Q) | | $ | — | | | $ | 133,804 | | | $ | — | | | $ | 32,074 | | | $ | 1,899 | | | $ | (1,855 | ) | | $ | 101,774 | | | | 10,027 | | | $ | — | | | $ | — | |
Prudential Core Conservative Bond Fund (Class Q) | | | — | | | | 369,015 | | | | — | | | | 84,356 | | | | 465 | | | | 311 | | | | 285,435 | | | | 28,458 | | | | 527 | | | | — | |
Prudential Global Real Estate Fund (Class Q) | | | — | | | | 131,571 | | | | — | | | | 30,788 | | | | 1,204 | | | | (69 | ) | | | 101,918 | | | | 4,203 | | | | 211 | | | | — | |
Prudential Jennison Small-Cap Core Equity Fund (Class Q) | | | — | | | | 26,550 | | | | — | | | | 6,143 | | | | (42 | ) | | | (25 | ) | | | 20,340 | | | | 1,805 | | | | 1 | | | | — | |
Prudential QMA International Developed Markets Index Fund (Class Q) | | | — | | | | 131,312 | | | | — | | | | 31,613 | | | | 2,173 | | | | 173 | | | | 102,045 | | | | 8,454 | | | | 3 | | | | — | |
Prudential QMA Large-Cap Core Equity Fund (Class Q) | | | — | | | | 309,005 | | | | 6,524 | | | | 73,493 | | | | 2,067 | | | | 260 | | | | 244,363 | | | | 13,814 | | | | — | | | | — | |
Prudential QMA Large-Cap Core Equity Fund (Class Z) | | | — | | | | 6,931 | | | | (6,524 | ) | | | — | | | | — | | | | (407 | ) | | | — | | | | — | | | | 73 | | | | 258 | |
Prudential QMA Mid-Cap Core Equity Fund (Class Q) | | | — | | | �� | 26,583 | | | | — | | | | 6,146 | | | | (8 | ) | | | (72 | ) | | | 20,357 | | | | 1,824 | | | | 1 | | | | — | |
Prudential QMA US Broad Market Index Fund (Class Q) | | | — | | | | 158,249 | | | | — | | | | 37,315 | | | | 1,118 | | | | 91 | | | | 122,143 | | | | 10,752 | | | | 8 | | | | — | |
Prudential TIPS Fund (Class Q) | | | — | | | | 687,636 | | | | — | | | | 157,557 | | | | 48 | | | | (659 | ) | | | 529,468 | | | | 53,699 | | | | 1,235 | | | | — | |
Prudential Total Return Bond Fund (Class Q) | | | — | | | | 395,163 | | | | — | | | | 90,896 | | | | 1,127 | | | | 492 | | | | 305,886 | | | | 21,066 | | | | 766 | | | | — | |
| | | | | | | | | | | | | | | | | | | | | | | | | | | | | | | | | | | | | | | | |
| | $ | — | | | $ | 2,375,819 | | | $ | — | | | $ | 550,381 | | | $ | 10,051 | | | $ | (1,760 | ) | | $ | 1,833,729 | | | | | | | $ | 2,825 | | | $ | 258 | |
| | | | | | | | | | | | | | | | | | | | | | | | | | | | | | | | | | | | | | | | |
Prudential Day One 2010 Fund
| | | | | | | | | | | | | | | | | | | | | | | | | | | | | | | | | | | | | | | | |
Affiliated Mutual Funds | | Value,
Beginning
of Period | | | Cost of
Purchases | | | Exchange | | | Proceeds
from Sales | | | Change in
Unrealized
Gain
(Loss) | | | Realized
Gain
(Loss) | | | Value,
End of
Period | | | Shares,
End of
Period | | | Dividend
Income | | | Capital Gain
Distributions | |
Prudential Commodity Strategies Fund (Class Q) | | | — | | | $ | 225,015 | | | $ | — | | | $ | 6,958 | | | $ | 7,656 | | | $ | (192 | ) | | $ | 225,521 | | | | 22,219 | | | $ | — | | | $ | — | |
Prudential Core Conservative Bond Fund (Class Q) | | | — | | | | 634,515 | | | | — | | | | 5,130 | | | | 3,583 | | | | (36 | ) | | | 632,932 | | | | 63,104 | | | | 1,023 | | | | — | |
| | | | |
| Prudential Day One Funds | | | 131 | |
Notes to Financial Statements (continued)
Prudential Day One 2010 Fund (cont’d)
| | | | | | | | | | | | | | | | | | | | | | | | | | | | | | | | | | | | | | | | |
Affiliated Mutual Funds | | Value,
Beginning
of Period | | | Cost of
Purchases | | | Exchange | | | Proceeds
from Sales | | | Change in
Unrealized
Gain
(Loss) | | | Realized
Gain
(Loss) | | | Value,
End of
Period | | | Shares,
End of
Period | | | Dividend
Income | | | Capital Gain
Distributions | |
Prudential Global Real Estate Fund (Class Q) | | $ | — | | | $ | 226,140 | | | $ | — | | | $ | 5,863 | | | $ | 5,582 | | | $ | (16 | ) | | $ | 225,843 | | | | 9,313 | | | $ | 1,680 | | | $ | — | |
Prudential Jennison Small-Cap Core Equity Fund (Class Q) | | | — | | | | 45,008 | | | | — | | | | 408 | | | | 465 | | | | 5 | | | | 45,070 | | | | 3,999 | | | | 1 | | | | — | |
Prudential QMA International Developed Markets Index Fund (Class Q) | | | — | | | | 224,534 | | | | — | | | | 5,847 | | | | 7,362 | | | | 80 | | | | 226,129 | | | | 18,735 | | | | 3 | | | | — | |
Prudential QMA Large-Cap Core Equity Fund (Class Q) | | | — | | | | 531,670 | | | | 7,117 | | | | 7,670 | | | | 10,289 | | | | 81 | | | | 541,487 | | | | 30,610 | | | | — | | | | — | |
Prudential QMA Large-Cap Core Equity Fund (Class Z) | | | — | | | | 7,561 | | | | (7,117 | ) | | | — | | | | — | | | | (444 | ) | | | — | | | | — | | | | 80 | | | | 281 | |
Prudential QMA Mid-Cap Core Equity Fund (Class Q) | | | — | | | | 90,117 | | | | — | | | | 817 | | | | 909 | | | | 9 | | | | 90,218 | | | | 8,084 | | | | 1 | | | | — | |
Prudential QMA US Broad Market Index Fund (Class Q) | | | — | | | | 314,313 | | | | — | | | | 4,481 | | | | 5,900 | | | | 35 | | | | 315,767 | | | | 27,796 | | | | 8 | | | | — | |
Prudential TIPS Fund (Class Q) | | | — | | | | 1,131,894 | | | | — | | | | 10,678 | | | | 7,636 | | | | (121 | ) | | | 1,128,731 | | | | 114,476 | | | | 1,688 | | | | — | |
Prudential Total Return Bond Fund (Class Q) | | | — | | | | 678,023 | | | | — | | | | 5,611 | | | | 6,057 | | | | (42 | ) | | | 678,427 | | | | 46,724 | | | | 1,463 | | | | — | |
| | | | | | | | | | | | | | | | | | | | | | | | | | | | | | | | | | | | | | | | |
| | $ | — | | | $ | 4,108,790 | | | $ | — | | | $ | 53,463 | | | $ | 55,439 | | | $ | (641 | ) | | $ | 4,110,125 | | | | | | | $ | 5,947 | | | $ | 281 | |
| | | | | | | | | | | | | | | | | | | | | | | | | | | | | | | | | | | | | | | | |
Prudential Day One 2015 Fund
| | | | | | | | | | | | | | | | | | | | | | | | | | | | | | | | | | | | | | | | |
Affiliated Mutual Funds | | Value,
Beginning
of Period | | | Cost of
Purchases | | | Exchange | | | Proceeds
from Sales | | | Change in
Unrealized
Gain
(Loss) | | | Realized
Gain
(Loss) | | | Value,
End of
Period | | | Shares,
End of
Period | | | Dividend
Income | | | Capital Gain
Distributions | |
Prudential Commodity Strategies Fund (Class Q) | | $ | — | | | $ | 239,824 | | | $ | — | | | $ | 36,568 | | | $ | 6,901 | | | $ | (1,012 | ) | | $ | 209,145 | | | | 20,605 | | | $ | — | | | $ | — | |
Prudential Core Conservative Bond Fund (Class Q) | | | — | | | | 577,371 | | | | — | | | | 77,675 | | | | 3,164 | | | | 301 | | | | 503,161 | | | | 50,166 | | | | 1,196 | | | | — | |
Prudential Global Real Estate Fund (Class Q) | | | — | | | | 239,101 | | | | — | | | | 35,714 | | | | 5,786 | | | | 267 | | | | 209,440 | | | | 8,637 | | | | 1,733 | | | | — | |
Prudential Jennison Small-Cap Core Equity Fund (Class Q) | | | — | | | | 47,689 | | | | — | | | | 6,617 | | | | 630 | | | | 96 | | | | 41,798 | | | | 3,709 | | | | 1 | | | | — | |
Prudential QMA International Developed Markets Index Fund (Class Q) | | | — | | | | 332,743 | | | | — | | | | 51,909 | | | | 11,737 | | | | 1,010 | | | | 293,581 | | | | 24,323 | | | | 4 | | | | — | |
Prudential Day One 2015 Fund (cont’d)
| | | | | | | | | | | | | | | | | | | | | | | | | | | | | | | | | | | | | | | | |
Affiliated Mutual Funds | | Value,
Beginning
of Period | | | Cost of
Purchases | | | Exchange | | | Proceeds
from Sales | | | Change in
Unrealized
Gain
(Loss) | | | Realized
Gain
(Loss) | | | Value,
End of
Period | | | Shares,
End of
Period | | | Dividend
Income | | | Capital Gain
Distributions | |
Prudential QMA Large-Cap Core Equity Fund (Class Q) | | $ | — | | | $ | 657,982 | | | $ | 8,896 | | | $ | 95,899 | | | $ | 13,725 | | | $ | 1,157 | | | $ | 585,861 | | | | 33,118 | | | $ | — | | | $ | — | |
Prudential QMA Large-Cap Core Equity Fund (Class Z) | | | — | | | | 9,451 | | | | (8,896 | ) | | | — | | | | — | | | | (555 | ) | | | — | | | | — | | | | 99 | | | | 352 | |
Prudential QMA Mid-Cap Core Equity Fund (Class Q) | | | — | | | | 95,527 | | | | — | | | | 13,069 | | | | 1,073 | | | | 137 | | | | 83,668 | | | | 7,497 | | | | 1 | | | | — | |
Prudential QMA US Broad Market Index Fund (Class Q) | | | — | | | | 380,642 | | | | — | | | | 54,187 | | | | 7,590 | | | | 628 | | | | 334,673 | | | | 29,461 | | | | 10 | | | | — | |
Prudential TIPS Fund (Class Q) | | | — | | | | 1,153,916 | | | | — | | | | 154,440 | | | | 6,852 | | | | (1,361 | ) | | | 1,004,967 | | | | 101,924 | | | | 2,612 | | | | — | |
Prudential Total Return Bond Fund (Class Q) | | | — | | | | 623,552 | | | | — | | | | 84,231 | | | | 5,532 | | | | 484 | | | | 545,337 | | | | 37,558 | | | | 1,738 | | | | — | |
| | | | | | | | | | | | | | | | | | | | | | | | | | | | | | | | | | | | | | | | |
| | $ | — | | | $ | 4,357,798 | | | $ | — | | | $ | 610,309 | | | $ | 62,990 | | | $ | 1,152 | | | $ | 3,811,631 | | | | | | | $ | 7,394 | | | $ | 352 | |
| | | | | | | | | | | | | | | | | | | | | | | | | | | | | | | | | | | | | | | | |
Prudential Day One 2020 Fund
| | | | | | | | | | | | | | | | | | | | | | | | | | | | | | | | | | | | | | | | |
Affiliated Mutual Funds | | Value,
Beginning
of Period | | | Cost of
Purchases | | | Exchange | | | Proceeds
from Sales | | | Change in
Unrealized
Gain
(Loss) | | | Realized
Gain
(Loss) | | | Value,
End of
Period | | | Shares,
End of
Period | | | Dividend
Income | | | Capital Gain
Distributions | |
Prudential Commodity Strategies Fund (Class Q) | | $ | — | | | $ | 647,511 | | | $ | — | | | $ | 36,365 | | | $ | 18,012 | | | $ | (1,077 | ) | | $ | 628,081 | | | | 61,880 | | | $ | — | | | $ | — | |
Prudential Core Conservative Bond Fund (Class Q) | | | — | | | | 1,427,182 | | | | — | | | | 50,054 | | | | 8,174 | | | | (189 | ) | | | 1,385,113 | | | | 138,097 | | | | 3,266 | | | | — | |
Prudential Global Real Estate Fund (Class Q) | | | — | | | | 645,015 | | | | — | | | | 32,819 | | | | 16,914 | | | | (133 | ) | | | 628,977 | | | | 25,937 | | | | 4,794 | | | | — | |
Prudential Jennison Small-Cap Core Equity Fund (Class Q) | | | — | | | | 128,547 | | | | — | | | | 5,000 | | | | 1,983 | | | | (9 | ) | | | 125,521 | | | | 11,138 | | | | 1 | | | | — | |
Prudential QMA International Developed Markets Index Fund (Class Q) | | | — | | | | 1,021,584 | | | | — | | | | 55,086 | | | | 40,546 | | | | 591 | | | | 1,007,635 | | | | 83,483 | | | | 4 | | | | — | |
Prudential QMA Large-Cap Core Equity Fund (Class Q) | | | — | | | | 2,169,318 | | | | 10,082 | | | | 93,962 | | | | 50,333 | | | | 644 | | | | 2,136,415 | | | | 120,770 | | | | — | | | | — | |
Prudential QMA Large-Cap Core Equity Fund (Class Z) | | | — | | | | 10,711 | | | | (10,082 | ) | | | — | | | | — | | | | (629 | ) | | | — | | | | — | | | | 113 | | | | 398 | |
Prudential QMA Mid-Cap Core Equity Fund (Class Q) | | | — | | | | 258,028 | | | | — | | | | 10,126 | | | | 3,371 | | | | (12 | ) | | | 251,261 | | | | 22,514 | | | | 1 | | | | — | |
| | | | |
| Prudential Day One Funds | | | 133 | |
Notes to Financial Statements (continued)
Prudential Day One 2020 Fund (cont’d)
| | | | | | | | | | | | | | | | | | | | | | | | | | | | | | | | | | | | | | | | |
Affiliated Mutual Funds | | Value,
Beginning
of Period | | | Cost of
Purchases | | | Exchange | | | Proceeds
from Sales | | | Change in
Unrealized
Gain
(Loss) | | | Realized
Gain
(Loss) | | | Value,
End of
Period | | | Shares,
End of
Period | | | Dividend
Income | | | Capital Gain
Distributions | |
Prudential QMA US Broad Market Index Fund (Class Q) | | $ | — | | | $ | 1,153,791 | | | $ | — | | | $ | 49,092 | | | $ | 25,695 | | | $ | 292 | | | $ | 1,130,686 | | | | 99,532 | | | $ | 12 | | | $ | — | |
Prudential TIPS Fund (Class Q) | | | — | | | | 2,857,184 | | | | — | | | | 101,143 | | | | 11,597 | | | | (1,177 | ) | | | 2,766,461 | | | | 280,574 | | | | 7,219 | | | | — | |
Prudential Total Return Bond Fund (Class Q) | | | — | | | | 1,552,399 | | | | — | | | | 55,371 | | | | 14,806 | | | | (125 | ) | | | 1,511,709 | | | | 104,112 | | | | 4,764 | | | | — | |
| | | | | | | | | | | | | | | | | | | | | | | | | | | | | | | | | | | | | | | | |
| | $ | — | | | $ | 11,871,270 | | | $ | — | | | $ | 489,018 | | | $ | 191,431 | | | $ | (1,824 | ) | | $ | 11,571,859 | | | | | | | $ | 20,174 | | | $ | 398 | |
| | | | | | | | | | | | | | | | | | | | | | | | | | | | | | | | | | | | | | | | |
Prudential Day One 2025 Fund
| | | | | | | | | | | | | | | | | | | | | | | | | | | | | | | | | | | | | | | | |
Affiliated Mutual Funds | | Value,
Beginning
of Period | | | Cost of
Purchases | | | Exchange | | | Proceeds
from Sales | | | Change in
Unrealized
Gain
(Loss) | | | Realized
Gain
(Loss) | | | Value,
End of
Period | | | Shares,
End of
Period | | | Dividend
Income | | | Capital Gain
Distributions | |
Prudential Commodity Strategies Fund (Class Q) | | $ | — | | | $ | 902,938 | | | $ | — | | | $ | 23,330 | | | $ | 21,322 | | | $ | (755 | ) | | $ | 900,175 | | | | 88,687 | | | $ | — | | | $ | — | |
Prudential Core Conservative Bond Fund (Class Q) | | | — | | | | 1,446,532 | | | | — | | | | 9,432 | | | | 6,195 | | | | 12 | | | | 1,443,307 | | | | 143,899 | | | | 2,575 | | | | — | |
Prudential Global Real Estate Fund (Class Q) | | | — | | | | 901,242 | | | | — | | | | 18,797 | | | | 19,037 | | | | (28 | ) | | | 901,454 | | | | 37,173 | | | | 4,838 | | | | — | |
Prudential Jennison Small-Cap Core Equity Fund (Class Q) | | | — | | | | 180,452 | | | | — | | | | 1,855 | | | | 1,295 | | | | 7 | | | | 179,899 | | | | 15,963 | | | | 1 | | | | — | |
Prudential QMA International Developed Markets Index Fund (Class Q) | | | — | | | | 1,608,416 | | | | — | | | | 32,581 | | | | 48,679 | | | | 143 | | | | 1,624,657 | | | | 134,603 | | | | 5 | | | | — | |
Prudential QMA Large-Cap Core Equity Fund (Class Q) | | | — | | | | 3,747,908 | | | | 13,641 | | | | 39,084 | | | | 59,847 | | | | 74 | | | | 3,782,386 | | | | 213,815 | | | | — | | | | — | |
Prudential QMA Large-Cap Core Equity Fund (Class Z) | | | — | | | | 14,492 | | | | (13,641 | ) | | | — | | | | — | | | | (851 | ) | | | — | | | | — | | | | 152 | | | | 539 | |
Prudential QMA Mid-Cap Core Equity Fund (Class Q) | | | — | | | | 542,027 | | | | — | | | | 5,661 | | | | 3,818 | | | | (19 | ) | | | 540,165 | | | | 48,402 | | | | 2 | | | | — | |
Prudential QMA US Broad Market Index Fund (Class Q) | | | — | | | | 2,148,828 | | | | — | | | | 22,273 | | | | 34,070 | | | | 56 | | | | 2,160,681 | | | | 190,201 | | | | 16 | | | | — | |
Prudential TIPS Fund (Class Q) | | | — | | | | 3,254,891 | | | | — | | | | 21,129 | | | | 9,622 | | | | (108 | ) | | | 3,243,276 | | | | 328,933 | | | | 6,213 | | | | — | |
Prudential Day One 2025 Fund (cont’d)
| | | | | | | | | | | | | | | | | | | | | | | | | | | | | | | | | | | | | | | | |
Affiliated Mutual Funds | | Value,
Beginning
of Period | | | Cost of
Purchases | | | Exchange | | | Proceeds
from Sales | | | Change in
Unrealized
Gain
(Loss) | | | Realized
Gain
(Loss) | | | Value,
End of
Period | | | Shares,
End of
Period | | | Dividend
Income | | | Capital Gain
Distributions | |
Prudential Total Return Bond Fund (Class Q) | | $ | — | | | $ | 1,984,593 | | | $ | — | | | $ | 13,586 | | | $ | 14,204 | | | $ | 28 | | | $ | 1,985,239 | | | $ | 136,724 | | | $ | 4,724 | | | $ | — | |
| | | | | | | | | | | | | | | | | | | | | | | | | | | | | | | | | | | | | | | | |
| | $ | — | | | $ | 16,732,319 | | | $ | — | | | $ | 187,728 | | | $ | 218,089 | | | $ | (1,441 | ) | | $ | 16,761,239 | | | | | | | $ | 18,526 | | | $ | 539 | |
| | | | | | | | | | | | | | | | | | | | | | | | | | | | | | | | | | | | | | | | |
Prudential Day One 2030 Fund
| | | | | | | | | | | | | | | | | | | | | | | | | | | | | | | | | | | | | | | | |
Affiliated Mutual Funds | | Value,
Beginning
of Period | | | Cost of
Purchases | | | Exchange | | | Proceeds
from Sales | | | Change in
Unrealized
Gain
(Loss) | | | Realized
Gain
(Loss) | | | Value,
End of
Period | | | Shares,
End of
Period | | | Dividend
Income | | | Capital Gain
Distributions | |
Prudential Commodity Strategies Fund (Class Q) | | $ | — | | | $ | 416,652 | | | $ | — | | | $ | 13,486 | | | $ | 9,870 | | | $ | (571 | ) | | $ | 412,465 | | | | 40,637 | | | $ | — | | | $ | — | |
Prudential Core Conservative Bond Fund (Class Q) | | | — | | | | 618,390 | | | | — | | | | 2,375 | | | | 4,171 | | | | (5 | ) | | | 620,181 | | | | 61,833 | | | | 1,742 | | | | — | |
Prudential Global Real Estate Fund (Class Q) | | | — | | | | 511,951 | | | | — | | | | 10,501 | | | | 14,888 | | | | (24 | ) | | | 516,314 | | | | 21,291 | | | | 3,863 | | | | — | |
Prudential Jennison Small-Cap Core Equity Fund (Class Q) | | | — | | | | 102,752 | | | | — | | | | 1,503 | | | | 1,793 | | | | (4 | ) | | | 103,038 | | | | 9,143 | | | | 2 | | | | — | |
Prudential QMA Emerging Markets Equity Fund (Class Q) | | | — | | | | 101,366 | | | | — | | | | 5,760 | | | | 7,529 | | | | 170 | | | | 103,305 | | | | 8,179 | | | | 4 | | | | — | |
Prudential QMA International Developed Markets Index Fund (Class Q) | | | — | | | | 1,308,992 | | | | — | | | | 26,395 | | | | 61,305 | | | | 204 | | | | 1,344,106 | | | | 111,359 | | | | 6 | | | | — | |
Prudential QMA Large-Cap Core Equity Fund (Class Q) | | | — | | | | 2,824,193 | | | | 16,013 | | | | 23,952 | | | | 72,305 | | | | (41 | ) | | | 2,888,518 | | | | 163,285 | | | | — | | | | — | |
Prudential QMA Large-Cap Core Equity Fund (Class Z) | | | — | | | | 17,012 | | | | (16,013 | ) | | | — | | | | — | | | | (999 | ) | | | — | | | | — | | | | 179 | | | | 633 | |
Prudential QMA Mid-Cap Core Equity Fund (Class Q) | | | — | | | | 308,605 | | | | — | | | | 3,356 | | | | 4,151 | | | | (16 | ) | | | 309,384 | | | | 27,723 | | | | 2 | | | | — | |
Prudential QMA US Broad Market Index Fund (Class Q) | | | — | | | | 1,421,308 | | | | — | | | | 12,374 | | | | 34,902 | | | | (32 | ) | | | 1,443,804 | | | | 127,095 | | | | 20 | | | | — | |
Prudential TIPS Fund (Class Q) | | | — | | | | 1,136,331 | | | | — | | | | 4,407 | | | | 3,571 | | | | (40 | ) | | | 1,135,455 | | | | 115,158 | | | | 3,955 | | | | — | |
Prudential Total Return Bond Fund (Class Q) | | | — | | | | 925,077 | | | | — | | | | 4,662 | | | | 10,275 | | | | (6 | ) | | | 930,684 | | | | 64,097 | | | | 3,503 | | | | — | |
| | | | | | | | | | | | | | | | | | | | | | | | | | | | | | | | | | | | | | | | |
| | $ | — | | | $ | 9,692,629 | | | $ | — | | | $ | 108,771 | | | $ | 224,760 | | | $ | (1,364 | ) | | $ | 9,807,254 | | | | | | | $ | 13,276 | | | $ | 633 | |
| | | | | | | | | | | | | | | | | | | | | | | | | | | | | | | | | | | | | | | | |
| | | | |
| Prudential Day One Funds | | | 135 | |
Notes to Financial Statements (continued)
Prudential Day One 2035 Fund
| | | | | | | | | | | | | | | | | | | | | | | | | | | | | | | | | | | | | | | | |
Affiliated Mutual Funds | | Value,
Beginning
of Period | | | Cost of
Purchases | | | Exchange | | | Proceeds
from Sales | | | Change in
Unrealized
Gain
(Loss) | | | Realized
Gain
(Loss) | | | Value,
End of
Period | | | Shares,
End of
Period | | | Dividend
Income | | | Capital Gain
Distributions | |
Prudential Commodity Strategies Fund (Class Q) | | $ | — | | | $ | 450,221 | | | $ | — | | | $ | 17,661 | | | $ | 8,306 | | | $ | (663 | ) | | $ | 440,203 | | | | 43,370 | | | $ | 997 | | | $ | — | |
Prudential Core Conservative Bond Fund (Class Q) | | | — | | | | 559,851 | | | | — | | | | 10,642 | | | | 2,145 | | | | (11 | ) | | | 551,343 | | | | 54,969 | | | | — | | | | — | |
Prudential Global Real Estate Fund (Class Q) | | | — | | | | 556,435 | | | | — | | | | 15,963 | | | | 10,583 | | | | (23 | ) | | | 551,032 | | | | 22,723 | | | | 2,621 | | | | — | |
Prudential Jennison Small-Cap Core Equity Fund (Class Q) | | | — | | | | 223,417 | | | | — | | | | 4,697 | | | | 1,158 | | | | 57 | | | | 219,935 | | | | 19,515 | | | | 2 | | | | — | |
Prudential QMA Emerging Markets Equity Fund (Class Q) | | | — | | | | 440,972 | | | | — | | | | 20,217 | | | | 19,928 | | | | 317 | | | | 441,000 | | | | 34,917 | | | | 9 | | | | — | |
Prudential QMA International Developed Markets Index Fund (Class Q) | | | — | | | | 1,431,694 | | | | — | | | | 38,792 | | | | 41,187 | | | | 388 | | | | 1,434,477 | | | | 118,846 | | | | 7 | | | | — | |
Prudential QMA Large-Cap Core Equity Fund (Class Q) | | | — | | | | 3,087,259 | | | | 16,606 | | | | 66,379 | | | | 44,476 | | | | 796 | | | | 3,082,758 | | | | 174,266 | | | | — | | | | — | |
Prudential QMA Large-Cap Core Equity Fund (Class Z) | | | — | | | | 17,642 | | | | (16,606 | ) | | | — | | | | — | | | | (1,036 | ) | | | — | | | | — | | | | 186 | | | | 656 | |
Prudential QMA Mid-Cap Core Equity Fund (Class Q) | | | — | | | | 447,620 | | | | — | | | | 9,760 | | | | 2,312 | | | | 79 | | | | 440,251 | | | | 39,449 | | | | 3 | | | | — | |
Prudential QMA US Broad Market Index Fund (Class Q) | | | — | | | | 1,994,004 | | | | — | | | | 42,184 | | | | 28,857 | | | | 472 | | | | 1,981,149 | | | | 174,397 | | | | 22 | | | | — | |
Prudential TIPS Fund (Class Q) | | | — | | | | 784,276 | | | | — | | | | 14,677 | | | | 1,513 | | | | (200 | ) | | | 770,912 | | | | 78,186 | | | | 1,550 | | | | — | |
Prudential Total Return Bond Fund (Class Q) | | | — | | | | 893,892 | | | | — | | | | 17,308 | | | | 5,815 | | | | 24 | | | | 882,423 | | | | 60,773 | | | | 2,134 | | | | — | |
| | | | | | | | | | | | | | | | | | | | | | | | | | | | | | | | | | | | | | | | |
| | $ | — | | | $ | 10,887,283 | | | $ | — | | | $ | 258,280 | | | $ | 166,280 | | | $ | 200 | | | $ | 10,795,483 | | | | | | | $ | 7,531 | | | $ | 656 | |
| | | | | | | | | | | | | | | | | | | | | | | | | | | | | | | | | | | | | | | | |
Prudential Day One 2040 Fund
| | | | | | | | | | | | | | | | | | | | | | | | | | | | | | | | | | | | | | | | |
Affiliated Mutual Funds | | Value,
Beginning
of Period | | | Cost of
Purchases | | | Exchange | | | Proceeds
from Sales | | | Change in
Unrealized
Gain
(Loss) | | | Realized
Gain
(Loss) | | | Value,
End of
Period | | | Shares,
End of
Period | | | Dividend
Income | | | Capital Gain
Distributions | |
Prudential Commodity Strategies Fund (Class Q) | | $ | — | | | $ | 250,698 | | | $ | — | | | $ | 21,375 | | | $ | 5,084 | | | $ | (720 | ) | | $ | 233,687 | | | | 23,023 | | | $ | — | | | $ | — | |
Prudential Core Conservative Bond Fund (Class Q) | | | — | | | | 248,313 | | | | — | | | | 15,579 | | | | 1,540 | | | | (4 | ) | | | 234,270 | | | | 23,357 | | | | 813 | | | | — | |
Prudential Global Real Estate Fund (Class Q) | | | — | | | | 306,190 | | | | — | | | | 22,874 | | | | 9,238 | | | | (32 | ) | | | 292,522 | | | | 12,063 | | | | 2,361 | | | | — | |
Prudential Jennison Small-Cap Core Equity Fund (Class Q) | | | — | | | | 183,569 | | | | — | | | | 12,809 | | | | 4,134 | | | | 239 | | | | 175,133 | | | | 15,540 | | | | 3 | | | | — | |
Prudential QMA Emerging Markets Equity Fund (Class Q) | | | — | | | | 302,129 | | | | — | | | | 33,750 | | | | 22,776 | | | | 1,486 | | | | 292,641 | | | | 23,170 | | | | 11 | | | | — | |
Prudential QMA International Developed Markets Index Fund (Class Q) | | | — | | | | 906,199 | | | | — | | | | 74,865 | | | | 45,864 | | | | 1,468 | | | | 878,666 | | | | 72,797 | | | | 8 | | | | — | |
Prudential QMA Large-Cap Core Equity Fund (Class Q) | | | — | | | | 1,677,408 | | | | 16,606 | | | | 109,400 | | | | 49,839 | | | | 2,071 | | | | 1,636,524 | | | | 92,511 | | | | — | | | | — | |
Prudential QMA Large-Cap Core Equity Fund (Class Z) | | | — | | | | 17,642 | | | | (16,606 | ) | | | — | | | | — | | | | (1,036 | ) | | | — | | | | — | | | | 185 | | | | 656 | |
Prudential QMA Mid-Cap Core Equity Fund (Class Q) | | | — | | | | 308,605 | | | | — | | | | 21,993 | | | | 5,215 | | | | 315 | | | | 292,142 | | | | 26,178 | | | | 4 | | | | — | |
Prudential QMA US Broad Market Index Fund (Class Q) | | | — | | | | 1,150,366 | | | | — | | | | 73,548 | | | | 32,152 | | | | 1,180 | | | | 1,110,150 | | | | 97,724 | | | | 23 | | | | — | |
Prudential TIPS Fund (Class Q) | | | — | | | | 249,601 | | | | — | | | | 15,662 | | | | 230 | | | | (224 | ) | | | 233,945 | | | | 23,727 | | | | 986 | | | | — | |
Prudential Total Return Bond Fund (Class Q) | | | — | | | | 432,474 | | | | — | | | | 27,097 | | | | 4,730 | | | | 60 | | | | 410,167 | | | | 28,248 | | | | 1,911 | | | | — | |
| | | | | | | | | | | | | | | | | | | | | | | | | | | | | | | | | | | | | | | | |
| | $ | — | | | $ | 6,033,194 | | | $ | — | | | $ | 428,952 | | | $ | 180,802 | | | $ | 4,803 | | | $ | 5,789,847 | | | | | | | $ | 6,305 | | | $ | 656 | |
| | | | | | | | | | | | | | | | | | | | | | | | | | | | | | | | | | | | | | | | |
Prudential Day One 2045 Fund
| | | | | | | | | | | | | | | | | | | | | | | | | | | | | | | | | | | | | | | | |
Affiliated Mutual Funds | | Value,
Beginning
of Period | | | Cost of
Purchases | | | Exchange | | | Proceeds
from Sales | | | Change in
Unrealized
Gain
(Loss) | | | Realized
Gain
(Loss) | | | Value,
End of
Period | | | Shares,
End of
Period | | | Dividend
Income | | | Capital Gain
Distributions | |
Prudential Commodity Strategies Fund (Class Q) | | $ | — | | | $ | 312,755 | | | $ | — | | | $ | 15,705 | | | $ | 4,892 | | | $ | (720 | ) | | $ | 301,222 | | | | 29,677 | | | $ | — | | | $ | — | |
Prudential Core Conservative Bond Fund (Class Q) | | | — | | | | 233,456 | | | | — | | | | 7,924 | | | | 762 | | | | 37 | | | | 226,331 | | | | 22,565 | | | | 382 | | | | — | |
Prudential Global Real Estate Fund (Class Q) | | | — | | | | 386,405 | | | | — | | | | 16,019 | | | | 6,302 | | | | 371 | | | | 377,059 | | | | 15,549 | | | | 1,417 | | | | — | |
| | | | |
| Prudential Day One Funds | | | 137 | |
Notes to Financial Statements (continued)
Prudential Day One 2045 Fund (cont’d)
| | | | | | | | | | | | | | | | | | | | | | | | | | | | | | | | | | | | | | | | |
Affiliated Mutual Funds | | Value,
Beginning
of Period | | | Cost of
Purchases | | | Exchange | | | Proceeds
from Sales | | | Change in
Unrealized
Gain
(Loss) | | | Realized
Gain
(Loss) | | | Value,
End of
Period | | | Shares,
End of
Period | | | Dividend
Income | | | Capital Gain
Distributions | |
Prudential Jennison Small-Cap Core Equity Fund (Class Q) | | $ | — | | | $ | 233,171 | | | $ | — | | | $ | 7,848 | | | $ | 243 | | | $ | 180 | | | $ | 225,746 | | | | 20,031 | | | $ | 3 | | | $ | — | |
Prudential QMA Emerging Markets Equity Fund (Class Q) | | | — | | | | 384,933 | | | | — | | | | 22,062 | | | | 13,944 | | | | 392 | | | | 377,207 | | | | 29,866 | | | | 13 | | | | — | |
Prudential QMA International Developed Markets Index Fund (Class Q) | | | — | | | | 1,384,104 | | | | — | | | | 60,088 | | | | 32,790 | | | | 2,305 | | | | 1,359,111 | | | | 112,602 | | | | 9 | | | | — | |
Prudential QMA Large-Cap Core Equity Fund (Class Q) | | | — | | | | 2,217,381 | | | | 16,606 | | | | 73,448 | | | | 23,264 | | | | 1,005 | | | | 2,184,808 | | | | 123,505 | | | | — | | | | — | |
Prudential QMA Large-Cap Core Equity Fund (Class Z) | | | — | | | | 17,641 | | | | (16,606 | ) | | | — | | | | — | | | | (1,035 | ) | | | — | | | | — | | | | 186 | | | | 656 | |
Prudential QMA Mid-Cap Core Equity Fund (Class Q) | | | — | | | | 465,019 | | | | — | | | | 14,299 | | | | 1,034 | | | | 129 | | | | 451,883 | | | | 40,491 | | | | 4 | | | | — | |
Prudential QMA US Broad Market Index Fund (Class Q) | | | — | | | | 1,386,711 | | | | — | | | | 46,875 | | | | 15,193 | | | | 632 | | | | 1,355,661 | | | | 119,336 | | | | 25 | | | | — | |
Prudential TIPS Fund (Class Q) | | | — | | | | 156,250 | | | | — | | | | 5,729 | | | | 217 | | | | (35 | ) | | | 150,703 | | | | 15,284 | | | | 302 | | | | — | |
Prudential Total Return Bond Fund (Class Q) | | | — | | | | 543,760 | | | | — | | | | 18,626 | | | | 2,961 | | | | 149 | | | | 528,244 | | | | 36,380 | | | | 1,194 | | | | — | |
| | | | | | | | | | | | | | | | | | | | | | | | | | | | | | | | | | | | | | | | |
| | $ | — | | | $ | 7,721,586 | | | $ | — | | | $ | 288,623 | | | $ | 101,602 | | | $ | 3,410 | | | $ | 7,537,975 | | | | | | | $ | 3,535 | | | $ | 656 | |
| | | | | | | | | | | | | | | | | | | | | | | | | | | | | | | | | | | | | | | | |
Prudential Day One 2050 Fund
| | | | | | | | | | | | | | | | | | | | | | | | | | | | | | | | | | | | | | | | |
Affiliated Mutual Funds | | Value,
Beginning
of Period | | | Cost of
Purchases | | | Exchange | | | Proceeds
from Sales | | | Change in
Unrealized
Gain
(Loss) | | | Realized
Gain
(Loss) | | | Value,
End of
Period | | | Shares,
End of
Period | | | Dividend
Income | | | Capital Gain
Distributions | |
Prudential Commodity Strategies Fund (Class Q) | | $ | — | | | $ | 92,093 | | | $ | — | | | $ | 5,525 | | | $ | 2,453 | | | $ | (187 | ) | | $ | 88,834 | | | | 8,752 | | | $ | — | | | $ | — | |
Prudential Core Conservative Bond Fund (Class Q) | | | — | | | | 45,753 | | | | — | | | | 1,500 | | | | 268 | | | | 1 | | | | 44,522 | | | | 4,439 | | | | 112 | | | | — | |
Prudential Global Real Estate Fund (Class Q) | | | — | | | | 112,923 | | | | — | | | | 4,834 | | | | 3,074 | | | | 37 | | | | 111,200 | | | | 4,586 | | | | 796 | | | | — | |
Prudential Jennison Small-Cap Core Equity Fund (Class Q) | | | — | | | | 68,508 | | | | — | | | | 3,046 | | | | 1,115 | | | | (1 | ) | | | 66,576 | | | | 5,907 | | | | 4 | | | | — | |
Prudential QMA Emerging Markets Equity Fund (Class Q) | | | — | | | | 133,582 | | | | — | | | | 9,346 | | | | 9,195 | | | | 63 | | | | 133,494 | | | | 10,570 | | | | 13 | | | | — | |
Prudential QMA International Developed Markets Index Fund (Class Q) | | | — | | | | 401,390 | | | | — | | | | 17,592 | | | | 16,915 | | | | 109 | | | | 400,822 | | | | 33,208 | | | | 10 | | | | — | |
Prudential Day One 2050 Fund (cont’d)
| | | | | | | | | | | | | | | | | | | | | | | | | | | | | | | | | | | | | | | | |
Affiliated Mutual Funds | | Value,
Beginning
of Period | | | Cost of
Purchases | | | Exchange | | | Proceeds
from Sales | | | Change in
Unrealized
Gain
(Loss) | | | Realized
Gain
(Loss) | | | Value,
End of
Period | | | Shares,
End of
Period | | | Dividend
Income | | | Capital Gain
Distributions | |
Prudential QMA Large-Cap Core Equity Fund (Class Q) | | $ | — | | | $ | 633,989 | | | $ | 16,013 | | | $ | 21,444 | | | $ | 15,846 | | | $ | (74 | ) | | $ | 644,330 | | | | 36,423 | | | $ | — | | | $ | — | |
Prudential QMA Large-Cap Core Equity Fund (Class Z) | | | — | | | | 17,012 | | | | (16,013 | ) | | | — | | | | — | | | | (999 | ) | | | — | | | | — | | | | 179 | | | | 633 | |
Prudential QMA Mid-Cap Core Equity Fund (Class Q) | | | — | | | | 158,965 | | | | — | | | | 5,622 | | | | 2,146 | | | | (11 | ) | | | 155,478 | | | | 13,932 | | | | 4 | | | | — | |
Prudential QMA US Broad Market Index Fund (Class Q) | | | — | | | | 426,703 | | | | — | | | | 14,658 | | | | 10,007 | | | | (37 | ) | | | 422,015 | | | | 37,149 | | | | 25 | | | | — | |
Prudential TIPS Fund (Class Q) | | | — | | | | 23,510 | | | | — | | | | 1,362 | | | | 83 | | | | — | | | | 22,231 | | | | 2,255 | | | | 64 | | | | — | |
Prudential Total Return Bond Fund (Class Q) | | | — | | | | 136,822 | | | | — | | | | 4,542 | | | | 1,337 | | | | 6 | | | | 133,623 | | | | 9,203 | | | | 452 | | | | — | |
| | | | | | | | | | | | | | | | | | | | | | | | | | | | | | | | | | | | | | | | |
| | $ | — | | | $ | 2,251,250 | | | $ | — | | | $ | 89,471 | | | $ | 62,439 | | | $ | (1,093 | ) | | $ | 2,223,125 | | | | | | | $ | 1,659 | | | $ | 633 | |
| | | | | | | | | | | | | | | | | | | | | | | | | | | | | | | | | | | | | | | | |
Prudential Day One 2055 Fund
| | | | | | | | | | | | | | | | | | | | | | | | | | | | | | | | | | | | | | | | |
Affiliated Mutual Funds | | Value,
Beginning
of Period | | | Cost of
Purchases | | | Exchange | | | Proceeds
from Sales | | | Change in
Unrealized
Gain
(Loss) | | | Realized
Gain
(Loss) | | | Value,
End of
Period | | | Shares,
End of
Period | | | Dividend
Income | | | Capital Gain
Distributions | |
Prudential Commodity Strategies Fund (Class Q) | | $ | — | | | $ | 115,075 | | | $ | — | | | $ | 3,142 | | | $ | 1,211 | | | $ | (144 | ) | | $ | 113,000 | | | | 11,133 | | | $ | — | | | $ | — | |
Prudential Core Conservative Bond Fund (Class Q) | | | — | | | | 600 | | | | — | | | | 602 | | | | — | | | | 2 | | | | — | | | | — | | | | — | | | | — | |
Prudential Global Real Estate Fund (Class Q) | | | — | | | | 140,778 | | | | — | | | | 1,481 | | | | 2,151 | | | | 2 | | | | 141,450 | | | | 5,833 | | | | 399 | | | | — | |
Prudential Jennison Small-Cap Core Equity Fund (Class Q) | | | — | | | | 85,781 | | | | — | | | | 1,184 | | | | 93 | | | | (3 | ) | | | 84,687 | | | | 7,514 | | | | 4 | | | | — | |
Prudential QMA Emerging Markets Equity Fund (Class Q) | | | — | | | | 167,896 | | | | — | | | | 3,722 | | | | 5,642 | | | | (10 | ) | | | 169,806 | | | | 13,445 | | | | 15 | | | | — | |
Prudential QMA International Developed Markets Index Fund (Class Q) | | | — | | | | 530,343 | | | | — | | | | 4,856 | | | | 12,663 | | | | 31 | | | | 538,181 | | | | 44,588 | | | | 10 | | | | — | |
Prudential QMA Large-Cap Core Equity Fund (Class Q) | | | — | | | | 825,633 | | | | 16,606 | | | | 3,277 | | | | 8,899 | | | | 11 | | | | 847,872 | | | | 47,929 | | | | 187 | | | | 656 | |
Prudential QMA Large-Cap Core Equity Fund (Class Z) | | | — | | | | 17,642 | | | | (16,606 | ) | | | — | | | | — | | | | (1,036 | ) | | | — | | | | — | | | | — | | | | — | |
Prudential QMA Mid-Cap Core Equity Fund (Class Q) | | | — | | | | 198,583 | | | | — | | | | 1,274 | | | | 460 | | | | 4 | | | | 197,773 | | | | 17,722 | | | | 4 | | | | — | |
Prudential QMA US Broad Market Index Fund (Class Q) | | | — | | | | 589,012 | | | | — | | | | 2,145 | | | | 6,453 | | | | 4 | | | | 593,324 | | | | 52,229 | | | | 26 | | | | — | |
Prudential TIPS Fund (Class Q) | | | — | | | | 600 | | | | — | | | | 602 | | | | — | | | | 2 | | | | — | | | | — | | | | — | | | | — | |
Prudential Total Return Bond Fund (Class Q) | | | — | | | | 141,356 | | | | — | | | | 513 | | | | 687 | | | | — | | | | 141,530 | | | | 9,747 | | | | 358 | | | | — | |
| | | | | | | | | | | | | | | | | | | | | | | | | | | | | | | | | | | | | | | | |
| | $ | — | | | $ | 2,813,299 | | | $ | — | | | $ | 22,798 | | | $ | 38,259 | | | $ | (1,137 | ) | | $ | 2,827,623 | | | | | | | $ | 1,003 | | | $ | 656 | |
| | | | | | | | | | | | | | | | | | | | | | | | | | | | | | | | | | | | | | | | |
| | | | |
| Prudential Day One Funds | | | 139 | |
Notes to Financial Statements (continued)
Prudential Day One 2060 Fund
| | | | | | | | | | | | | | | | | | | | | | | | | | | | | | | | | | | | | | | | |
Affiliated Mutual Funds | | Value,
Beginning
of Period | | | Cost of
Purchases | | | Exchange | | | Proceeds
from Sales | | | Change in
Unrealized
Gain
(Loss) | | | Realized
Gain
(Loss) | | | Value,
End of
Period | | | Shares,
End of
Period | | | Dividend
Income | | | Capital Gain
Distributions | |
Prudential Commodity Strategies Fund (Class Q) | | $ | — | | | $ | 5,448 | | | $ | — | | | $ | 1,111 | | | $ | (29 | ) | | $ | (38 | ) | | $ | 4,270 | | | | 421 | | | $ | — | | | $ | — | |
Prudential Core Conservative Bond Fund (Class Q) | | | — | | | | 600 | | | | — | | | | 602 | | | | — | | | | 2 | | | | — | | | | — | | | | — | | | | — | |
Prudential Global Real Estate Fund (Class Q) | | | — | | | | 5,619 | | | | — | | | | 547 | | | | 259 | | | | 13 | | | | 5,344 | | | | 220 | | | | 43 | | | | — | |
Prudential Jennison Small-Cap Core Equity Fund (Class Q) | | | — | | | | 4,435 | | | | — | | | | 423 | | | | 240 | | | | 14 | | | | 4,266 | | | | 379 | | | | 4 | | | | — | |
Prudential QMA Emerging Markets Equity Fund (Class Q) | | | — | | | | 6,995 | | | | — | | | | 1,557 | | | | 951 | | | | 27 | | | | 6,416 | | | | 508 | | | | 15 | | | | — | |
Prudential QMA International Developed Markets Index Fund (Class Q) | | | — | | | | 20,513 | | | | — | | | | 2,400 | | | | 2,106 | | | | 116 | | | | 20,335 | | | | 1,685 | | | | 10 | | | | — | |
Prudential QMA Large-Cap Core Equity Fund (Class Q) | | | — | | | | 16,570 | | | | 17,199 | | | | 2,903 | | | | 2,160 | | | | 78 | | | | 33,104 | | | | 1,871 | | | | — | | | | — | |
Prudential QMA Large-Cap Core Equity Fund (Class Z) | | | — | | | | 18,271 | | | | (17,199 | ) | | | — | | | | — | | | | (1,072 | ) | | | — | | | | — | | | | 192 | | | | 680 | |
Prudential QMA Mid-Cap Core Equity Fund (Class Q) | | | — | | | | 7,874 | | | | — | | | | 703 | | | | 289 | | | | 13 | | | | 7,473 | | | | 670 | | | | 5 | | | | — | |
Prudential QMA US Broad Market Index Fund (Class Q) | | | — | | | | 22,965 | | | | — | | | | 1,917 | | | | 1,319 | | | | 51 | | | | 22,418 | | | | 1,973 | | | | 26 | | | | — | |
Prudential TIPS Fund (Class Q) | | | — | | | | 600 | | | | — | | | | 602 | | | | — | | | | 2 | | | | — | | | | — | | | | — | | | | — | |
Prudential Total Return Bond Fund (Class Q) | | | — | | | | 3,401 | | | | — | | | | 262 | | | | 70 | | | | 3 | | | | 3,212 | | | | 221 | | | | 38 | | | | — | |
| | | | | | | | | | | | | | | | | | | | | | | | | | | | | | | | | | | | | | | | |
| | $ | — | | | $ | 113,291 | | | $ | — | | | $ | 13,027 | | | $ | 7,365 | | | $ | (791 | ) | | $ | 106,838 | | | | | | | $ | 333 | | | $ | 680 | |
| | | | | | | | | | | | | | | | | | | | | | | | | | | | | | | | | | | | | | | | |
5. Distributions and Tax Information
Distributions to shareholders, which are determined in accordance with federal income tax regulations, which may differ from generally accepted accounting principles, are recorded on the ex-date. In order to present undistributed net investment income, accumulated net realized gains or losses and paid-in capital in excess of par on the Statement of Assets and Liabilities that more closely represent their tax character, certain adjustments have been made to undistributed net investment income and paid-in capital in excess of par.
For the period ended July 31, 2017, the adjustments were as follows:
| | | | | | | | |
| | | Undistributed
Net Investment
Income | | | Paid-In
Capital In
Excess of Par | |
Prudential Day One Income Fund(a) | | $ | 3 | | | $ | (3 | ) |
Prudential Day One 2010 Fund(a) | | | 3 | | | | (3 | ) |
Prudential Day One 2015 Fund(a) | | | 4 | | | | (4 | ) |
Prudential Day One 2020 Fund(a) | | | 4 | | | | (4 | ) |
Prudential Day One 2025 Fund(a) | | | 6 | | | | (6 | ) |
Prudential Day One 2030 Fund(a) | | | 7 | | | | (7 | ) |
Prudential Day One 2035 Fund(a) | | | 8 | | | | (8 | ) |
Prudential Day One 2040 Fund(a) | | | 8 | | | | (8 | ) |
Prudential Day One 2045 Fund(a) | | | 8 | | | | (8 | ) |
Prudential Day One 2050 Fund(a) | | | 8 | | | | (8 | ) |
Prudential Day One 2055 Fund(a) | | | 8 | | | | (8 | ) |
Prudential Day One 2060 Fund(a) | | | 25 | | | | (25 | ) |
| (a) | Due to non-deductible expenses. |
Net investment income or loss, net realized gains or losses and net assets were not affected by these adjustments.
For the period ended July 31, 2017, the tax character of dividends paid as reflected in the Statement of Changes in Net Assets were as follows:
| | | | |
| | | Ordinary
Income | |
Prudential Day One Income Fund | | $ | 1,593 | |
No dividends were paid by the other Funds during the period ended July 31, 2017.
For the period ended July 31, 2017, the Funds had the following amounts of accumulated undistributed earnings on a tax basis:
| | | | |
| | | Undistributed
Ordinary
Income | |
Prudential Day One Income Fund | | $ | 1,747 | |
Prudential Day One 2010 Fund | | | 7,093 | |
Prudential Day One 2015 Fund | | | 12,939 | |
Prudential Day One 2020 Fund | | | 25,587 | |
Prudential Day One 2025 Fund | | | 22,204 | |
Prudential Day One 2030 Fund | | | 14,984 | |
Prudential Day One 2035 Fund | | | 10,839 | |
Prudential Day One 2040 Fund | | | 14,348 | |
Prudential Day One 2045 Fund | | | 8,957 | |
Prudential Day One 2050 Fund | | | 2,000 | |
Prudential Day One 2055 Fund | | | 1,197 | |
Prudential Day One 2060 Fund | | | 307 | |
| | | | |
| Prudential Day One Funds | | | 141 | |
Notes to Financial Statements (continued)
These amounts may differ from the amounts shown on the Statement of Assets and Liabilities primarily due to cumulative timing differences between financial and tax reporting.
The United States federal income tax basis of the Day One Funds’ investments and the net unrealized appreciation as of July 31, 2017 were as follows:
| | | | | | | | | | | | | | | | |
| | | Tax Basis | | | Appreciation | | | Depreciation | | | Net
Unrealized
Appreciation | |
Prudential Day One Income Fund | | $ | 2,044,110 | | | $ | 10,101 | | | $ | (1,703 | ) | | $ | 8,398 | |
Prudential Day One 2010 Fund | | | 4,474,131 | | | | 55,439 | | | | (452 | ) | | | 54,987 | |
Prudential Day One 2015 Fund | | | 4,134,294 | | | | 62,990 | | | | (2,736 | ) | | | 60,254 | |
Prudential Day One 2020 Fund | | | 12,399,485 | | | | 191,431 | | | | (3,096 | ) | | | 188,335 | |
Prudential Day One 2025 Fund | | | 17,816,739 | | | | 218,089 | | | | (1,188 | ) | | | 216,901 | |
Prudential Day One 2030 Fund | | | 10,107,504 | | | | 224,760 | | | | (782 | ) | | | 223,978 | |
Prudential Day One 2035 Fund | | | 10,863,805 | | | | 166,280 | | | | (1,000 | ) | | | 165,280 | |
Prudential Day One 2040 Fund | | | 5,683,500 | | | | 180,802 | | | | (1,057 | ) | | | 179,745 | |
Prudential Day One 2045 Fund | | | 7,457,261 | | | | 101,602 | | | | (849 | ) | | | 100,753 | |
Prudential Day One 2050 Fund | | | 2,175,902 | | | | 62,439 | | | | (518 | ) | | | 61,921 | |
Prudential Day One 2055 Fund | | | 2,804,300 | | | | 38,259 | | | | (162 | ) | | | 38,097 | |
Prudential Day One 2060 Fund | | | 113,836 | | | | 7,394 | | | | (64 | ) | | | 7,330 | |
The difference between book basis and tax basis was primarily attributable to deferred losses on wash sales.
For federal income tax purposes, the following Funds had a capital loss carryforward as of July 31, 2017 which can be carried forward for an unlimited period. No capital gains distributions are expected to be paid to shareholders until net gains have been realized in excess of such losses.
| | | | |
| | | Capital Loss
Carryforward | |
Prudential Day One 2055 Fund | | $ | 319 | |
Prudential Day One 2060 Fund | | | 76 | |
Management has analyzed the Day One Funds’ tax positions and has concluded that no provision for income tax is required in the Day One Funds’ financial statements for the current reporting period. The Day One Funds’ federal excise tax returns for tax years for which the applicable statutes of limitations have not expired are subject to examination by the Internal Revenue Service.
6. Capital
The Trust is authorized to issue an unlimited number of shares of beneficial interest, $.001 par value per share. The Day One Funds offer Class R1, Class R2, Class R3, Class R4, Class R5 and Class R6 shares.
Under certain circumstances, an exchange may be made from specified share classes of the Day One Funds to one or more other share classes of the Day One Funds as presented in the table of transactions in shares of beneficial interest.
At reporting period end, Prudential owned the following number of shares of the Day One Funds:
| | | | | | | | | | | | | | | | | | | | | | | | |
| | | Class R1 | | | Class R2 | | | Class R3 | | | Class R4 | | | Class R5 | | | Class R6 | |
Prudential Day One Income Fund | | $ | 1,003 | | | $ | 1,004 | | | $ | 1,005 | | | $ | 1,005 | | | $ | 1,006 | | | $ | 1,006 | |
Prudential Day One 2010 Fund | | | 1,000 | | | | 1,000 | | | | 1,000 | | | | 1,000 | | | | 1,000 | | | | 1,000 | |
Prudential Day One 2015 Fund | | | 1,000 | | | | 1,000 | | | | 1,000 | | | | 1,000 | | | | 1,000 | | | | 1,000 | |
Prudential Day One 2020 Fund | | | 1,000 | | | | 1,000 | | | | 1,000 | | | | 1,000 | | | | 1,000 | | | | 1,000 | |
Prudential Day One 2025 Fund | | | 1,000 | | | | 1,000 | | | | 1,000 | | | | 1,000 | | | | 1,000 | | | | 1,000 | |
Prudential Day One 2030 Fund | | | 1,000 | | | | 1,000 | | | | 1,000 | | | | 1,000 | | | | 1,000 | | | | 1,000 | |
Prudential Day One 2035 Fund | | | 1,000 | | | | 1,000 | | | | 1,000 | | | | 1,000 | | | | 1,000 | | | | 1,000 | |
Prudential Day One 2040 Fund | | | 1,000 | | | | 1,000 | | | | 1,000 | | | | 1,000 | | | | 1,000 | | | | 1,000 | |
Prudential Day One 2045 Fund | | | 1,000 | | | | 1,000 | | | | 1,000 | | | | 1,000 | | | | 1,000 | | | | 1,000 | |
Prudential Day One 2050 Fund | | | 1,000 | | | | 1,000 | | | | 1,000 | | | | 1,000 | | | | 1,000 | | | | 1,000 | |
Prudential Day One 2055 Fund | | | 1,000 | | | | 1,000 | | | | 1,000 | | | | 1,000 | | | | 1,000 | | | | 1,000 | |
Prudential Day One 2060 Fund | | | 1,000 | | | | 1,000 | | | | 1,000 | | | | 1,000 | | | | 1,000 | | | | 1,000 | |
In addition, the following number of shareholders held the following percentages of outstanding shares of the Day One Funds on behalf of multiple beneficial owners:
| | | | | | | | | | | | |
| | | Number of
Shareholders | | | % of Outstanding
Shares | | | % held by
an Affiliate
of Prudential | |
Prudential Day One Income Fund | | | 4 | | | | 94 | | | | 94 | |
Prudential Day One 2010 Fund | | | 3 | | | | 98 | | | | 98 | |
Prudential Day One 2015 Fund | | | 4 | | | | 97 | | | | 88 | |
Prudential Day One 2020 Fund | | | 4 | | | | 98 | | | | 87 | |
Prudential Day One 2025 Fund | | | 6 | | | | 93 | | | | 83 | |
Prudential Day One 2030 Fund | | | 5 | | | | 98 | | | | 87 | |
Prudential Day One 2035 Fund | | | 6 | | | | 99 | | | | 86 | |
Prudential Day One 2040 Fund | | | 4 | | | | 97 | | | | 65 | |
Prudential Day One 2045 Fund | | | 5 | | | | 95 | | | | 86 | |
Prudential Day One 2050 Fund | | | 3 | | | | 84 | | | | 71 | |
Prudential Day One 2055 Fund | | | 5 | | | | 93 | | | | 82 | |
Prudential Day One 2060 Fund | | | 3 | | | | 92 | | | | 92 | |
Transactions in shares of beneficial interest were as follows:
Prudential Day One Income Fund
| | | | | | | | |
Class R1 | | Shares | | | Amount | |
Period ended July 31, 2017*: | |
Shares sold | | | 1,000 | | | $ | 10,000 | |
Shares issued in reinvestment of dividends and distributions | | | 3 | | | | 29 | |
| | | | | | | | |
Net increase (decrease) in shares outstanding | | | 1,003 | | | $ | 10,029 | |
| | | | | | | | |
Class R2 | |
Period ended July 31, 2017*: | |
Shares sold | | | 1,129 | | | $ | 11,309 | |
Shares issued in reinvestment of dividends and distributions | | | 4 | | | | 39 | |
| | | | | | | | |
Net increase (decrease) in shares outstanding | | | 1,133 | | | $ | 11,348 | |
| | | | | | | | |
| | | | |
| Prudential Day One Funds | | | 143 | |
Notes to Financial Statements (continued)
Prudential Day One Income Fund (cont’d.)
| | | | | | | | |
Class R3 | | Shares | | | Amount | |
Period ended July 31, 2017*: | |
Shares sold | | | 121,154 | | | $ | 1,255,995 | |
Shares issued in reinvestment of dividends and distributions | | | 4 | | | | 46 | |
| | | | | | | | |
Net increase (decrease) in shares outstanding | | | 121,158 | | | $ | 1,256,041 | |
| | | | | | | | |
Class R4 | |
Period ended July 31, 2017*: | |
Shares sold | | | 1,628 | | | $ | 16,332 | |
Shares issued in reinvestment of dividends and distributions | | | 8 | | | | 83 | |
| | | | | | | | |
Net increase (decrease) in shares outstanding | | | 1,636 | | | $ | 16,415 | |
| | | | | | | | |
Class R5 | |
Period ended July 31, 2017*: | |
Shares sold | | | 1,000 | | | $ | 10,000 | |
Shares issued in reinvestment of dividends and distributions | | | 6 | | | | 57 | |
| | | | | | | | |
Net increase (decrease) in shares outstanding | | | 1,006 | | | $ | 10,057 | |
| | | | | | | | |
Class R6 | |
Period ended July 31, 2017*: | |
Shares sold | | | 129,177 | | | $ | 1,326,559 | |
Shares issued in reinvestment of dividends and distributions | | | 130 | | | | 1,339 | |
Shares reacquired | | | (58,627 | ) | | | (602,811 | ) |
| | | | | | | | |
Net increase (decrease) in shares outstanding | | | 70,680 | | | $ | 725,087 | |
| | | | | | | | |
| * | Commencement of operations was December 13, 2016. |
Prudential Day One 2010 Fund
| | | | | | | | |
Class R1 | | Shares | | | Amount | |
Period ended July 31, 2017*: | |
Shares sold | | | 1,000 | | | $ | 10,000 | |
| | | | | | | | |
Net increase (decrease) in shares outstanding | | | 1,000 | | | $ | 10,000 | |
| | | | | | | | |
Class R2 | |
Period ended July 31, 2017*: | |
Shares sold | | | 1,000 | | | $ | 10,000 | |
| | | | | | | | |
Net increase (decrease) in shares outstanding | | | 1,000 | | | $ | 10,000 | |
| | | | | | | | |
Class R3 | |
Period ended July 31, 2017*: | |
Shares sold | | | 1,000 | | | $ | 10,000 | |
| | | | | | | | |
Net increase (decrease) in shares outstanding | | | 1,000 | | | $ | 10,000 | |
| | | | | | | | |
Prudential Day One 2010 Fund (cont’d.)
| | | | | | | | |
Class R4 | | Shares | | | Amount | |
Period ended July 31, 2017*: | |
Shares sold | | | 4,075 | | | $ | 41,393 | |
| | | | | | | | |
Net increase (decrease) in shares outstanding | | | 4,075 | | | $ | 41,393 | |
| | | | | | | | |
Class R5 | |
Period ended July 31, 2017*: | |
Shares sold | | | 1,000 | | | $ | 10,000 | |
| | | | | | | | |
Net increase (decrease) in shares outstanding | | | 1,000 | | | $ | 10,000 | |
| | | | | | | | |
Class R6 | |
Period ended July 31, 2017*: | |
Shares sold | | | 426,083 | | | $ | 4,407,260 | |
Shares reacquired | | | (2,937 | ) | | | (30,631 | ) |
| | | | | | | | |
Net increase (decrease) in shares outstanding | | | 423,146 | | | $ | 4,376,629 | |
| | | | | | | | |
| * | Commencement of operations was December 13, 2016. |
Prudential Day One 2015 Fund
| | | | | | | | |
Class R1 | | Shares | | | Amount | |
Period ended July 31, 2017*: | |
Shares sold | | | 1,000 | | | $ | 10,000 | |
| | | | | | | | |
Net increase (decrease) in shares outstanding | | | 1,000 | | | $ | 10,000 | |
| | | | | | | | |
Class R2 | |
Period ended July 31, 2017*: | |
Shares sold | | | 1,000 | | | $ | 10,000 | |
| | | | | | | | |
Net increase (decrease) in shares outstanding | | | 1,000 | | | $ | 10,000 | |
| | | | | | | | |
Class R3 | |
Period ended July 31, 2017*: | |
Shares sold | | | 1,000 | | | $ | 10,000 | |
| | | | | | | | |
Net increase (decrease) in shares outstanding | | | 1,000 | | | $ | 10,000 | |
| | | | | | | | |
Class R4 | |
Period ended July 31, 2017*: | |
Shares sold | | | 12,427 | | | $ | 126,967 | |
Shares reacquired | | | (7,565 | ) | | | (77,317 | ) |
| | | | | | | | |
Net increase (decrease) in shares outstanding | | | 4,862 | | | $ | 49,650 | |
| | | | | | | | |
Class R5 | |
Period ended July 31, 2017*: | |
Shares sold | | | 1,000 | | | $ | 10,000 | |
| | | | | | | | |
Net increase (decrease) in shares outstanding | | | 1,000 | | | $ | 10,000 | |
| | | | | | | | |
| | | | |
| Prudential Day One Funds | | | 145 | |
Notes to Financial Statements (continued)
Prudential Day One 2015 Fund (cont’d.)
| | | | | | | | |
Class R6 | | Shares | | | Amount | |
Period ended July 31, 2017*: | |
Shares sold | | | 451,154 | | | $ | 4,679,700 | |
Shares reacquired | | | (61,965 | ) | | | (650,759 | ) |
| | | | | | | | |
Net increase (decrease) in shares outstanding | | | 389,189 | | | $ | 4,028,941 | |
| | | | | | | | |
| * | Commencement of operations was December 13, 2016. |
Prudential Day One 2020 Fund
| | | | | | | | |
Class R1 | | Shares | | | Amount | |
Period ended July 31, 2017*: | |
Shares sold | | | 1,000 | | | $ | 10,000 | |
| | | | | | | | |
Net increase (decrease) in shares outstanding | | | 1,000 | | | $ | 10,000 | |
| | | | | | | | |
Class R2 | |
Period ended July 31, 2017*: | |
Shares sold | | | 1,000 | | | $ | 10,000 | |
| | | | | | | | |
Net increase (decrease) in shares outstanding | | | 1,000 | | | $ | 10,000 | |
| | | | | | | | |
Class R3 | |
Period ended July 31, 2017*: | |
Shares sold | | | 1,000 | | | $ | 10,000 | |
| | | | | | | | |
Net increase (decrease) in shares outstanding | | | 1,000 | | | $ | 10,000 | |
| | | | | | | | |
Class R4 | |
Period ended July 31, 2017*: | |
Shares sold | | | 25,303 | | | $ | 259,167 | |
Shares reacquired | | | (8,462 | ) | | | (88,253 | ) |
| | | | | | | | |
Net increase (decrease) in shares outstanding | | | 16,841 | | | $ | 170,914 | |
| | | | | | | | |
Class R5 | |
Period ended July 31, 2017*: | |
Shares sold | | | 1,000 | | | $ | 10,000 | |
| | | | | | | | |
Net increase (decrease) in shares outstanding | | | 1,000 | | | $ | 10,000 | |
| | | | | | | | |
Class R6 | |
Period ended July 31, 2017*: | |
Shares sold | | | 1,216,471 | | | $ | 12,609,532 | |
Shares reacquired | | | (42,765 | ) | | | (446,468 | ) |
| | | | | | | | |
Net increase (decrease) in shares outstanding | | | 1,173,706 | | | $ | 12,163,064 | |
| | | | | | | | |
| * | Commencement of operations was December 13, 2016. |
Prudential Day One 2025 Fund
| | | | | | | | |
Class R1 | | Shares | | | Amount | |
Period ended July 31, 2017*: | |
Shares sold | | | 55,971 | | | $ | 588,847 | |
| | | | | | | | |
Net increase (decrease) in shares outstanding | | | 55,971 | | | $ | 588,847 | |
| | | | | | | | |
Class R2 | |
Period ended July 31, 2017*: | |
Shares sold | | | 1,000 | | | $ | 10,000 | |
| | | | | | | | |
Net increase (decrease) in shares outstanding | | | 1,000 | | | $ | 10,000 | |
| | | | | | | | |
Class R3 | |
Period ended July 31, 2017*: | |
Shares sold | | | 364,247 | | | $ | 3,867,684 | |
| | | | | | | | |
Net increase (decrease) in shares outstanding | | | 364,247 | | | $ | 3,867,684 | |
| | | | | | | | |
Class R4 | |
Period ended July 31, 2017*: | |
Shares sold | | | 27,082 | | | $ | 278,277 | |
Shares reacquired | | | (10,603 | ) | | | (110,818 | ) |
| | | | | | | | |
Net increase (decrease) in shares outstanding | | | 16,479 | | | $ | 167,459 | |
| | | | | | | | |
Class R5 | |
Period ended July 31, 2017*: | |
Shares sold | | | 1,542 | | | $ | 15,596 | |
| | | | | | | | |
Net increase (decrease) in shares outstanding | | | 1,542 | | | $ | 15,596 | |
| | | | | | | | |
Class R6 | |
Period ended July 31, 2017*: | |
Shares sold | | | 1,262,205 | | | $ | 13,195,064 | |
Shares reacquired | | | (4,410 | ) | | | (46,538 | ) |
| | | | | | | | |
Net increase (decrease) in shares outstanding | | | 1,257,795 | | | $ | 13,148,526 | |
| | | | | | | | |
| * | Commencement of operations was December 13, 2016. |
Prudential Day One 2030 Fund
| | | | | | | | |
Class R1 | | Shares | | | Amount | |
Period ended July 31, 2017*: | |
Shares sold | | | 1,323 | | | $ | 13,462 | |
| | | | | | | | |
Net increase (decrease) in shares outstanding | | | 1,323 | | | $ | 13,462 | |
| | | | | | | | |
Class R2 | |
Period ended July 31, 2017*: | |
Shares sold | | | 1,204 | | | $ | 12,118 | |
| | | | | | | | |
Net increase (decrease) in shares outstanding | | | 1,204 | | | $ | 12,118 | |
| | | | | | | | |
| | | | |
| Prudential Day One Funds | | | 147 | |
Notes to Financial Statements (continued)
Prudential Day One 2030 Fund (cont’d.)
| | | | | | | | |
Class R3 | | Shares | | | Amount | |
Period ended July 31, 2017*: | |
Shares sold | | | 1,000 | | | $ | 10,000 | |
| | | | | | | | |
Net increase (decrease) in shares outstanding | | | 1,000 | | | $ | 10,000 | |
| | | | | | | | |
Class R4 | |
Period ended July 31, 2017*: | |
Shares sold | | | 79,537 | | | $ | 823,497 | |
| | | | | | | | |
Net increase (decrease) in shares outstanding | | | 79,537 | | | $ | 823,497 | |
| | | | | | | | |
Class R5 | |
Period ended July 31, 2017*: | |
Shares sold | | | 1,000 | | | $ | 10,000 | |
| | | | | | | | |
Net increase (decrease) in shares outstanding | | | 1,000 | | | $ | 10,000 | |
| | | | | | | | |
Class R6 | |
Period ended July 31, 2017*: | |
Shares sold | | | 876,042 | | | $ | 9,252,457 | |
Shares reacquired | | | (2,692 | ) | | | (28,862 | ) |
| | | | | | | | |
Net increase (decrease) in shares outstanding | | | 873,350 | | | $ | 9,223,595 | |
| | | | | | | | |
| * | Commencement of operations was December 13, 2016. |
Prudential Day One 2035 Fund
| | | | | | | | |
Class R1 | | Shares | | | Amount | |
Period ended July 31, 2017*: | |
Shares sold | | | 1,701 | | | $ | 17,179 | |
Shares reacquired | | | (460 | ) | | | (4,580 | ) |
| | | | | | | | |
Net increase (decrease) in shares outstanding | | | 1,241 | | | $ | 12,599 | |
| | | | | | | | |
Class R2 | |
Period ended July 31, 2017*: | |
Shares sold | | | 1,000 | | | $ | 10,007 | |
| | | | | | | | |
Net increase (decrease) in shares outstanding | | | 1,000 | | | $ | 10,007 | |
| | | | | | | | |
Class R3 | |
Period ended July 31, 2017*: | |
Shares sold | | | 372,867 | | | $ | 4,052,200 | |
| | | | | | | | |
Net increase (decrease) in shares outstanding | | | 372,867 | | | $ | 4,052,200 | |
| | | | | | | | |
Prudential Day One 2035 Fund (cont’d.)
| | | | | | | | |
Class R4 | | Shares | | | Amount | |
Period ended July 31, 2017*: | |
Shares sold | | | 5,289 | | | $ | 54,535 | |
| | | | | | | | |
Net increase (decrease) in shares outstanding | | | 5,289 | | | $ | 54,535 | |
| | | | | | | | |
Class R5 | |
Period ended July 31, 2017*: | |
Shares sold | | | 1,000 | | | $ | 10,007 | |
| | | | | | | | |
Net increase (decrease) in shares outstanding | | | 1,000 | | | $ | 10,007 | |
| | | | | | | | |
Class R6 | |
Period ended July 31, 2017*: | |
Shares sold | | | 655,572 | | | $ | 6,943,701 | |
Shares reacquired | | | (21,677 | ) | | | (234,537 | ) |
| | | | | | | | |
Net increase (decrease) in shares outstanding | | | 633,895 | | | $ | 6,709,164 | |
| | | | | | | | |
| * | Commencement of operations was December 13, 2016. |
Prudential Day One 2040 Fund
| | | | | | | | |
Class R1 | | Shares | | | Amount | |
Period ended July 31, 2017*: | |
Shares sold | | | 1,000 | | | $ | 10,000 | |
| | | | | | | | |
Net increase (decrease) in shares outstanding | | | 1,000 | | | $ | 10,000 | |
| | | | | | | | |
Class R2 | |
Period ended July 31, 2017*: | |
Shares sold | | | 1,102 | | | $ | 11,071 | |
| | | | | | | | |
Net increase (decrease) in shares outstanding | | | 1,102 | | | $ | 11,071 | |
| | | | | | | | |
Class R3 | |
Period ended July 31, 2017*: | |
Shares sold | | | 1,000 | | | $ | 10,000 | |
| | | | | | | | |
Net increase (decrease) in shares outstanding | | | 1,000 | | | $ | 10,000 | |
| | | | | | | | |
Class R4 | |
Period ended July 31, 2017*: | |
Shares sold | | | 10,541 | | | $ | 109,621 | |
Shares reacquired | | | (29 | ) | | | (299 | ) |
| | | | | | | | |
Net increase (decrease) in shares outstanding | | | 10,512 | | | $ | 109,322 | |
| | | | | | | | |
Class R5 | |
Period ended July 31, 2017*: | |
Shares sold | | | 1,000 | | | $ | 10,000 | |
| | | | | | | | |
Net increase (decrease) in shares outstanding | | | 1,000 | | | $ | 10,000 | |
| | | | | | | | |
| | | | |
| Prudential Day One Funds | | | 149 | |
Notes to Financial Statements (continued)
Prudential Day One 2040 Fund (cont’d.)
| | | | | | | | |
Class R6 | | Shares | | | Amount | |
Period ended July 31, 2017*: | |
Shares sold | | | 554,610 | | | $ | 5,893,456 | |
Shares reacquired | | | (35,134 | ) | | | (384,932 | ) |
| | | | | | | | |
Net increase (decrease) in shares outstanding | | | 519,476 | | | $ | 5,508,524 | |
| | | | | | | | |
| * | Commencement of operations was December 13, 2016. |
Prudential Day One 2045 Fund
| | | | | | | | |
Class R1 | | Shares | | | Amount | |
Period ended July 31, 2017*: | |
Shares sold | | | 1,000 | | | $ | 10,000 | |
| | | | | | | | |
Net increase (decrease) in shares outstanding | | | 1,000 | | | $ | 10,000 | |
| | | | | | | | |
Class R2 | |
Period ended July 31, 2017*: | |
Shares sold | | | 1,086 | | | $ | 10,923 | |
| | | | | | | | |
Net increase (decrease) in shares outstanding | | | 1,086 | | | $ | 10,923 | |
| | | | | | | | |
Class R3 | |
Period ended July 31, 2017*: | |
Shares sold | | | 346,850 | | | $ | 3,821,271 | |
| | | | | | | | |
Net increase (decrease) in shares outstanding | | | 346,850 | | | $ | 3,821,271 | |
| | | | | | | | |
Class R4 | |
Period ended July 31, 2017*: | |
Shares sold | | | 22,477 | | | $ | 234,829 | |
| | | | | | | | |
Net increase (decrease) in shares outstanding | | | 22,477 | | | $ | 234,829 | |
| | | | | | | | |
Class R5 | |
Period ended July 31, 2017*: | |
Shares sold | | | 1,045 | | | $ | 10,486 | |
| | | | | | | | |
Net increase (decrease) in shares outstanding | | | 1,045 | | | $ | 10,486 | |
| | | | | | | | |
Class R6 | |
Period ended July 31, 2017*: | |
Shares sold | | | 335,855 | | | $ | 3,593,435 | |
Shares reacquired | | | (22,971 | ) | | | (246,640 | ) |
| | | | | | | | |
Net increase (decrease) in shares outstanding | | | 312,884 | | | $ | 3,346,795 | |
| | | | | | | | |
| * | Commencement of operations was December 13, 2016. |
Prudential Day One 2050 Fund
| | | | | | | | |
Class R1 | | Shares | | | Amount | |
Period ended July 31, 2017*: | |
Shares sold | | | 8,921 | | | $ | 96,260 | |
| | | | | | | | |
Net increase (decrease) in shares outstanding | | | 8,921 | | | $ | 96,260 | |
| | | | | | | | |
Class R2 | |
Period ended July 31, 2017*: | |
Shares sold | | | 1,629 | | | $ | 16,843 | |
| | | | | | | | |
Net increase (decrease) in shares outstanding | | | 1,629 | | | $ | 16,843 | |
| | | | | | | | |
Class R3 | |
Period ended July 31, 2017*: | |
Shares sold | | | 1,000 | | | $ | 10,000 | |
| | | | | | | | |
Net increase (decrease) in shares outstanding | | | 1,000 | | | $ | 10,000 | |
| | | | | | | | |
Class R4 | |
Period ended July 31, 2017*: | |
Shares sold | | | 6,887 | | | $ | 71,353 | |
Shares reacquired | | | (67 | ) | | | (718 | ) |
| | | | | | | | |
Net increase (decrease) in shares outstanding | | | 6,820 | | | $ | 70,635 | |
| | | | | | | | |
Class R5 | |
Period ended July 31, 2017*: | |
Shares sold | | | 1,000 | | | $ | 10,000 | |
| | | | | | | | |
Net increase (decrease) in shares outstanding | | | 1,000 | | | $ | 10,000 | |
| | | | | | | | |
Class R6 | |
Period ended July 31, 2017*: | |
Shares sold | | | 189,540 | | | $ | 2,027,660 | |
Shares reacquired | | | (6,661 | ) | | | (70,407 | ) |
| | | | | | | | |
Net increase (decrease) in shares outstanding | | | 182,879 | | | $ | 1,957,253 | |
| | | | | | | | |
| * | Commencement of operations was December 13, 2016. |
Prudential Day One 2055 Fund
| | | | | | | | |
Class R1 | | Shares | | | Amount | |
Period ended July 31, 2017*: | |
Shares sold | | | 1,000 | | | $ | 10,000 | |
| | | | | | | | |
Net increase (decrease) in shares outstanding | | | 1,000 | | | $ | 10,000 | |
| | | | | | | | |
Class R2 | |
Period ended July 31, 2017*: | |
Shares sold | | | 1,544 | | | $ | 16,004 | |
| | | | | | | | |
Net increase (decrease) in shares outstanding | | | 1,544 | | | $ | 16,004 | |
| | | | | | | | |
| | | | |
| Prudential Day One Funds | | | 151 | |
Notes to Financial Statements (continued)
Prudential Day One 2055 Fund (cont’d.)
| | | | | | | | |
Class R3 | | Shares | | | Amount | |
Period ended July 31, 2017*: | |
Shares sold | | | 161,779 | | | $ | 1,799,470 | |
| | | | | | | | |
Net increase (decrease) in shares outstanding | | | 161,779 | | | $ | 1,799,470 | |
| | | | | | | | |
Class R4 | |
Period ended July 31, 2017*: | |
Shares sold | | | 4,056 | | | $ | 42,506 | |
| | | | | | | | |
Net increase (decrease) in shares outstanding | | | 4,056 | | | $ | 42,506 | |
| | | | | | | | |
Class R5 | |
Period ended July 31, 2017*: | |
Shares sold | | | 1,000 | | | $ | 10,000 | |
| | | | | | | | |
Net increase (decrease) in shares outstanding | | | 1,000 | | | $ | 10,000 | |
| | | | | | | | |
Class R6 | |
Period ended July 31, 2017*: | |
Shares sold | | | 86,013 | | | $ | 919,336 | |
Shares reacquired | | | (589 | ) | | | (6,400 | ) |
| | | | | | | | |
Net increase (decrease) in shares outstanding | | | 85,424 | | | $ | 912,936 | |
| | | | | | | | |
| * | Commencement of operations was December 13, 2016. |
Prudential Day One 2060 Fund
| | | | | | | | |
Class R1 | | Shares | | | Amount | |
Period ended July 31, 2017*: | |
Shares sold | | | 1,000 | | | $ | 10,000 | |
| | | | | | | | |
Net increase (decrease) in shares outstanding | | | 1,000 | | | $ | 10,000 | |
| | | | | | | | |
Class R2 | |
Period ended July 31, 2017*: | |
Shares sold | | | 1,014 | | | $ | 10,154 | |
| | | | | | | | |
Net increase (decrease) in shares outstanding | | | 1,014 | | | $ | 10,154 | |
| | | | | | | | |
Class R3 | |
Period ended July 31, 2017*: | |
Shares sold | | | 1,000 | | | $ | 10,000 | |
| | | | | | | | |
Net increase (decrease) in shares outstanding | | | 1,000 | | | $ | 10,000 | |
| | | | | | | | |
Prudential Day One 2060 Fund (cont’d.)
| | | | | | | | |
Class R4 | | Shares | | | Amount | |
Period ended July 31, 2017*: | |
Shares sold | | | 1,004 | | | $ | 10,037 | |
| | | | | | | | |
Net increase (decrease) in shares outstanding | | | 1,004 | | | $ | 10,037 | |
| | | | | | | | |
Class R5 | |
Period ended July 31, 2017*: | |
Shares sold | | | 1,000 | | | $ | 10,000 | |
| | | | | | | | |
Net increase (decrease) in shares outstanding | | | 1,000 | | | $ | 10,000 | |
| | | | | | | | |
Class R6 | |
Period ended July 31, 2017*: | |
Shares sold | | | 5,403 | | | $ | 57,256 | |
Shares reacquired | | | (742 | ) | | | (8,058 | ) |
| | | | | | | | |
Net increase (decrease) in shares outstanding | | | 4,661 | | | $ | 49,198 | |
| | | | | | | | |
| * | Commencement of operations was December 13, 2016. |
7. Borrowings
The Trust, on behalf of the Day One Funds, along with other affiliated registered investment companies (the “Funds”), is a party to a Syndicated Credit Agreement (“SCA”) with a group of banks. The purpose of the SCA is to provide an alternative source of temporary funding for capital share redemptions. The SCA provides for a commitment of $900 million for the period October 6, 2016 through October 5, 2017. The Funds pay an annualized commitment fee of .15% of the unused portion of the SCA. The Fund’s portion of the commitment fee for the unused amount, allocated based upon a method approved by the Board, is accrued daily and paid quarterly. The interest on borrowings under the SCA is paid monthly and at a per annum interest rate based upon a contractual spread plus the higher of (1) the effective federal funds rate, (2) the 1-month LIBOR rate or (3) zero percent.
Other affiliated registered investment companies that are parties to the SCA include portfolios that are subject to a predetermined mathematical formula used to manage certain benefit guarantees offered under variable annuity contracts. The formula may result in large scale asset flows into and out of the portfolios. Consequently, the portfolios may be more likely to utilize the SCA for purposes of funding redemptions. It may be possible for those portfolios to fully exhaust the committed amount of the SCA, thereby requiring the Manager to allocate available funding per a Board-approved methodology designed to treat the Funds in the SCA equitably.
The Day One Funds did not utilize the SCA during the period ended July 31, 2017.
| | | | |
| Prudential Day One Funds | | | 153 | |
Notes to Financial Statements (continued)
8. Recent Accounting Pronouncements and Reporting Updates
On October 13, 2016, the Securities and Exchange Commission (the “SEC”) adopted new rules and forms and amended existing rules and forms which are intended to modernize and enhance the reporting and disclosure of information by registered investment companies and to improve the quality of information that funds provide to investors, including modifications to Regulation S-X which would require standardized, enhanced disclosure about derivatives in investment company financial statements. The compliance dates of the modifications to Regulation S-X are August 1, 2017 and other amendments and rules are generally June 1, 2018 and December 1, 2018. Management is currently evaluating the impacts to the financial statement disclosures.
9. Other
At the Trust’s Board meeting in March 2017, the Board of Trustees approved a change in the methodology of allocating certain expenses, like Transfer Agent fees (including sub-transfer agent and networking fees) and Blue Sky fees. PGIM Investments implemented the changes effective August 1, 2017.
Prudential Day One Income Fund
Financial Highlights
| | | | |
| Class R1 Shares | | | |
| | | December 13,
2016(a)
through
July 31,
2017 | |
| Per Share Operating Performance(b): | | | | |
| Net Asset Value, Beginning of Period | | | $10.00 | |
| Income (loss) from investment operations: | | | | |
| Net investment income (loss) | | | .08 | |
| Net realized and unrealized gain (loss) on investment transactions | | | .31 | |
| Total from investment operations | | | .39 | |
| Less Dividends and Distributions: | | | | |
| Dividends from net investment income | | | (.03 | ) |
| Net asset value, end of period | | | $10.36 | |
| Total Return(c): | | | 3.89% | |
| |
| Ratios/Supplemental Data: | | | |
| Net assets, end of period (000) | | | $10 | |
| Average net assets (000) | | | $10 | |
| Ratios to average net assets(d): | | | | |
| Expenses after waivers and/or expense reimbursement | | | .64% | (e) |
| Expenses before waivers and/or expense reimbursement | | | 299.81% | (e) |
| Net investment income (loss) | | | 1.18% | (e) |
| Portfolio turnover rate | | | 146% | (f) |
| (a) | Commencement of operations. |
| (b) | Calculated based on average shares outstanding during the period. |
| (c) | Total return is calculated assuming a purchase of a share on the first day and a sale on the last day of each period reported and includes reinvestment of dividends and distributions, if any. Total returns may reflect adjustments to conform to generally accepted accounting principles. Total returns for periods less than one full year are not annualized. |
| (d) | Does not include expenses of the underlying funds in which the Fund invests. Expenses waived/reimbursed include those of underlying funds in which the Fund invests. Consequently, the amount waived/reimbursed may be greater than the expense ratio reflected in the financial highlights. |
See Notes to Financial Statements.
| | | | |
| Prudential Day One Funds | | | 155 | |
Prudential Day One Income Fund
Financial Highlights (continued)
| | | | |
| Class R2 Shares | | | |
| | | December 13,
2016(a)
through
July 31,
2017 | |
| Per Share Operating Performance(b): | | | | |
| Net Asset Value, Beginning of Period | | | $10.00 | |
| Income (loss) from investment operations: | | | | |
| Net investment income (loss) | | | .09 | |
| Net realized and unrealized gain (loss) on investment transactions | | | .32 | |
| Total from investment operations | | | .41 | |
| Less Dividends and Distributions: | | | | |
| Dividends from net investment income | | | (.04 | ) |
| Net asset value, end of period | | | $10.37 | |
| Total Return(c): | | | 4.09% | |
| |
| Ratios/Supplemental Data: | | | |
| Net assets, end of period (000) | | | $12 | |
| Average net assets (000) | | | $11 | |
| Ratios to average net assets(d): | | | | |
| Expenses after waivers and/or expense reimbursement | | | .39% | (e) |
| Expenses before waivers and/or expense reimbursement | | | 286.56% | (e) |
| Net investment income (loss) | | | 1.43% | (e) |
| Portfolio turnover rate | | | 146% | (f) |
| (a) | Commencement of operations. |
| (b) | Calculated based on average shares outstanding during the period. |
| (c) | Total return is calculated assuming a purchase of a share on the first day and a sale on the last day of each period reported and includes reinvestment of dividends and distributions, if any. Total returns may reflect adjustments to conform to generally accepted accounting principles. Total returns for periods less than one full year are not annualized. |
| (d) | Does not include expenses of the underlying funds in which the Fund invests. Expenses waived/reimbursed include those of underlying funds in which the Fund invests. Consequently, the amount waived/reimbursed may be greater than the expense ratio reflected in the financial highlights. |
See Notes to Financial Statements.
| | | | |
| Class R3 Shares | | | |
| | | December 13,
2016(a)
through
July 31,
2017 | |
| Per Share Operating Performance(b): | | | | |
| Net Asset Value, Beginning of Period | | | $10.00 | |
| Income (loss) from investment operations: | | | | |
| Net investment income (loss) | | | .11 | |
| Net realized and unrealized gain (loss) on investment transactions | | | .31 | |
| Total from investment operations | | | .42 | |
| Less Dividends and Distributions: | | | | |
| Dividends from net investment income | | | (.05 | ) |
| Net asset value, end of period | | | $10.37 | |
| Total Return(c): | | | 4.17% | |
| |
Ratios/Supplemental Data: | |
| Net assets, end of period (000) | | | $1,256 | |
| Average net assets (000) | | | $32 | |
| Ratios to average net assets(d): | | | | |
| Expenses after waivers and/or expense reimbursement | | | .09% | (e) |
| Expenses before waivers and/or expense reimbursement | | | 132.21% | (e) |
| Net investment income (loss) | | | 1.63% | (e) |
| Portfolio turnover rate | | | 146% | (f) |
| (a) | Commencement of operations. |
| (b) | Calculated based on average shares outstanding during the period. |
| (c) | Total return is calculated assuming a purchase of a share on the first day and a sale on the last day of each period reported and includes reinvestment of dividends and distributions, if any. Total returns may reflect adjustments to conform to generally accepted accounting principles. Total returns for periods less than one full year are not annualized. |
| (d) | Does not include expenses of the underlying funds in which the Fund invests. Expenses waived/reimbursed include those of underlying funds in which the Fund invests. Consequently, the amount waived/reimbursed may be greater than the expense ratio reflected in the financial highlights. |
See Notes to Financial Statements.
| | | | |
| Prudential Day One Funds | | | 157 | |
Prudential Day One Income Fund
Financial Highlights (continued)
| | | | |
| Class R4 Shares | | | |
| | | December 13,
2016(a)
through
July 31,
2017 | |
| Per Share Operating Performance(b): | | | | |
| Net Asset Value, Beginning of Period | | | $10.00 | |
| Income (loss) from investment operations: | | | | |
| Net investment income (loss) | | | .11 | |
| Net realized and unrealized gain (loss) on investment transactions | | | .31 | |
| Total from investment operations | | | .42 | |
| Less Dividends and Distributions: | | | | |
| Dividends from net investment income | | | (.05 | ) |
| Net asset value, end of period | | | $10.37 | |
| Total Return(c): | | | 4.23% | |
| |
| Ratios/Supplemental Data: | | | |
| Net assets, end of period (000) | | | $17 | |
| Average net assets (000) | | | $15 | |
| Ratios to average net assets(d): | | | | |
| Expenses after waivers and/or expense reimbursement | | | .14% | (e) |
| Expenses before waivers and/or expense reimbursement | | | 275.84% | (e) |
| Net investment income (loss) | | | 1.67% | (e) |
| Portfolio turnover rate | | | 146% | (f) |
| (a) | Commencement of operations. |
| (b) | Calculated based on average shares outstanding during the period. |
| (c) | Total return is calculated assuming a purchase of a share on the first day and a sale on the last day of each period reported and includes reinvestment of dividends and distributions, if any. Total returns may reflect adjustments to conform to generally accepted accounting principles. Total returns for periods less than one full year are not annualized. |
| (d) | Does not include expenses of the underlying funds in which the Fund invests. Expenses waived/reimbursed include those of underlying funds in which the Fund invests. Consequently, the amount waived/reimbursed may be greater than the expense ratio reflected in the financial highlights. |
See Notes to Financial Statements.
| | | | |
| Class R5 Shares | | | |
| | | December 13,
2016(a)
through
July 31,
2017 | |
| Per Share Operating Performance(b): | | | | |
| Net Asset Value, Beginning of Period | | | $10.00 | |
| Income (loss) from investment operations: | | | | |
| Net investment income (loss) | | | .12 | |
| Net realized and unrealized gain (loss) on investment transactions | | | .31 | |
| Total from investment operations | | | .43 | |
| Less Dividends and Distributions: | | | | |
| Dividends from net investment income | | | (.06 | ) |
| Net asset value, end of period | | | $10.37 | |
| Total Return(c): | | | 4.29% | |
| |
| Ratios/Supplemental Data: | | | |
| Net assets, end of period (000) | | | $10 | |
| Average net assets (000) | | | $10 | |
| Ratios to average net assets(d): | | | | |
| Expenses after waivers and/or expense reimbursement | | | .03% | (e) |
| Expenses before waivers and/or expense reimbursement | | | 298.99% | (e) |
| Net investment income (loss) | | | 1.79% | (e) |
| Portfolio turnover rate | | | 146% | (f) |
| (a) | Commencement of operations. |
| (b) | Calculated based on average shares outstanding during the period. |
| (c) | Total return is calculated assuming a purchase of a share on the first day and a sale on the last day of each period reported and includes reinvestment of dividends and distributions, if any. Total returns may reflect adjustments to conform to generally accepted accounting principles. Total returns for periods less than one full year are not annualized. |
| (d) | Does not include expenses of the underlying funds in which the Fund invests. Expenses waived/reimbursed include those of underlying funds in which the Fund invests. Consequently, the amount waived/reimbursed may be greater than the expense ratio reflected in the financial highlights. |
See Notes to Financial Statements.
| | | | |
| Prudential Day One Funds | | | 159 | |
Prudential Day One Income Fund
Financial Highlights (continued)
| | | | |
| Class R6 Shares | | | |
| | | December 13,
2016(a)
through
July 31,
2017 | |
| Per Share Operating Performance(b): | | | | |
| Net Asset Value, Beginning of Period | | | $10.00 | |
| Income (loss) from investment operations: | | | | |
| Net investment income (loss) | | | .12 | |
| Net realized and unrealized gain (loss) on investment transactions | | | .32 | |
| Total from investment operations | | | .44 | |
| Less Dividends and Distributions: | | | | |
| Dividends from net investment income | | | (.06) | |
| Net asset value, end of period | | | $10.38 | |
| Total Return(c): | | | 4.46% | |
| |
| Ratios/Supplemental Data: | | | |
| Net assets, end of period (000) | | | $734 | |
| Average net assets (000) | | | $199 | |
| Ratios to average net assets(d): | | | | |
| Expenses after waivers and/or expense reimbursement | | | (.19)% | (e) |
| Expenses before waivers and/or expense reimbursement | | | 80.76% | (e) |
| Net investment income (loss) | | | 1.91% | (e) |
| Portfolio turnover rate | | | 146% | (f) |
| (a) | Commencement of operations. |
| (b) | Calculated based on average shares outstanding during the period. |
| (c) | Total return is calculated assuming a purchase of a share on the first day and a sale on the last day of each period reported and includes reinvestment of dividends and distributions, if any. Total returns may reflect adjustments to conform to generally accepted accounting principles. Total returns for periods less than one full year are not annualized. |
| (d) | Does not include expenses of the underlying funds in which the Fund invests. Expenses waived/reimbursed include those of underlying funds in which the Fund invests. Consequently, the amount waived/reimbursed may be greater than the expense ratio reflected in the financial highlights. |
See Notes to Financial Statements.
Prudential Day One 2010 Fund
Financial Highlights
| | | | |
| Class R1 Shares | | | |
| | | December 13,
2016(a)
through
July 31, 2017 | |
| Per Share Operating Performance(b): | | | | |
| Net Asset Value, Beginning of Period | | | $10.00 | |
| Income (loss) from investment operations: | | | | |
| Net investment income (loss) | | | .08 | |
| Net realized and unrealized gain (loss) on investment transactions | | | .35 | |
| Total from investment operations | | | .43 | |
| Net asset value, end of period | | | $10.43 | |
| Total Return(c): | | | 4.30% | |
| |
| Ratios/Supplemental Data: | | | |
| Net assets, end of period (000) | | | $10 | |
| Average net assets (000) | | | $10 | |
| Ratios to average net assets(d): | | | | |
| Expenses after waivers and/or expense reimbursement | | | .65% | (e) |
| Expenses before waivers and/or expense reimbursement | | | 336.61% | (e) |
| Net investment income (loss) | | | 1.16% | (e) |
| Portfolio turnover rate | | | 9% | (f) |
| (a) | Commencement of operations. |
| (b) | Calculated based on average shares outstanding during the period. |
| (c) | Total return is calculated assuming a purchase of a share on the first day and a sale on the last day of each period reported and includes reinvestment of dividends and distributions, if any. Total returns may reflect adjustments to conform to generally accepted accounting principles. Total returns for periods less than one full year are not annualized. |
| (d) | Does not include expenses of the underlying funds in which the Fund invests. Expenses waived/reimbursed include those of underlying funds in which the Fund invests. Consequently, the amount waived/reimbursed may be greater than the expense ratio reflected in the financial highlights. |
See Notes to Financial Statements.
| | | | |
| Prudential Day One Funds | | | 161 | |
Prudential Day One 2010 Fund
Financial Highlights (continued)
| | | | |
| Class R2 Shares | | | |
| | | December 13,
2016(a)
through
July 31, 2017 | |
| Per Share Operating Performance(b): | | | | |
| Net Asset Value, Beginning of Period | | | $10.00 | |
| Income (loss) from investment operations: | | | | |
| Net investment income (loss) | | | .09 | |
| Net realized and unrealized gain (loss) on investment transactions | | | .36 | |
| Total from investment operations | | | .45 | |
| Net asset value, end of period | | | $10.45 | |
| Total Return(c): | | | 4.50% | |
| |
| Ratios/Supplemental Data: | | | |
| Net assets, end of period (000) | | | $10 | |
| Average net assets (000) | | | $10 | |
| Ratios to average net assets(d): | | | | |
| Expenses after waivers and/or expense reimbursement | | | .40% | (e) |
| Expenses before waivers and/or expense reimbursement | | | 336.27% | (e) |
| Net investment income (loss) | | | 1.41% | (e) |
| Portfolio turnover rate | | | 9% | (f) |
| (a) | Commencement of operations. |
| (b) | Calculated based on average shares outstanding during the period. |
| (c) | Total return is calculated assuming a purchase of a share on the first day and a sale on the last day of each period reported and includes reinvestment of dividends and distributions, if any. Total returns may reflect adjustments to conform to generally accepted accounting principles. Total returns for periods less than one full year are not annualized. |
| (d) | Does not include expenses of the underlying funds in which the Fund invests. Expenses waived/reimbursed include those of underlying funds in which the Fund invests. Consequently, the amount waived/reimbursed may be greater than the expense ratio reflected in the financial highlights. |
See Notes to Financial Statements.
| | | | |
| Class R3 Shares | | | |
| | | December 13,
2016(a)
through
July 31,
2017 | |
| Per Share Operating Performance(b): | | | | |
| Net Asset Value, Beginning of Period | | | $10.00 | |
| Income (loss) from investment operations: | | | | |
| Net investment income (loss) | | | .10 | |
| Net realized and unrealized gain (loss) on investment transactions | | | .36 | |
| Total from investment operations | | | .46 | |
| Net asset value, end of period | | | $10.46 | |
| Total Return(c): | | | 4.60% | |
| |
| Ratios/Supplemental Data: | | | |
| Net assets, end of period (000) | | | $10 | |
| Average net assets (000) | | | $10 | |
| Ratios to average net assets(d): | | | | |
| Expenses after waivers and/or expense reimbursement | | | .26% | (e) |
| Expenses before waivers and/or expense reimbursement | | | 336.07% | (e) |
| Net investment income (loss) | | | 1.56% | (e) |
| Portfolio turnover rate | | | 9% | (f) |
| (a) | Commencement of operations. |
| (b) | Calculated based on average shares outstanding during the period. |
| (c) | Total return is calculated assuming a purchase of a share on the first day and a sale on the last day of each period reported and includes reinvestment of dividends and distributions, if any. Total returns may reflect adjustments to conform to generally accepted accounting principles. Total returns for periods less than one full year are not annualized. |
| (d) | Does not include expenses of the underlying funds in which the Fund invests. Expenses waived/reimbursed include those of underlying funds in which the Fund invests. Consequently, the amount waived/reimbursed may be greater than the expense ratio reflected in the financial highlights. |
See Notes to Financial Statements.
| | | | |
| Prudential Day One Funds | | | 163 | |
Prudential Day One 2010 Fund
Financial Highlights (continued)
| | | | |
| Class R4 Shares | | | |
| | | December 13,
2016(a)
through
July 31,
2017 | |
| Per Share Operating Performance(b): | | | | |
| Net Asset Value, Beginning of Period | | | $10.00 | |
| Income (loss) from investment operations: | | | | |
| Net investment income (loss) | | | .11 | |
| Net realized and unrealized gain (loss) on investment transactions | | | .35 | |
| Total from investment operations | | | .46 | |
| Net asset value, end of period | | | $10.46 | |
| Total Return(c): | | | 4.60% | |
| |
| Ratios/Supplemental Data: | | | |
| Net assets, end of period (000) | | | $43 | |
| Average net assets (000) | | | $31 | |
| Ratios to average net assets(d): | | | | |
| Expenses after waivers and/or expense reimbursement | | | .12% | (e) |
| Expenses before waivers and/or expense reimbursement | | | 259.21% | (e) |
| Net investment income (loss) | | | 1.71% | (e) |
| Portfolio turnover rate | | | 9% | (f) |
| (a) | Commencement of operations. |
| (b) | Calculated based on average shares outstanding during the period. |
| (c) | Total return is calculated assuming a purchase of a share on the first day and a sale on the last day of each period reported and includes reinvestment of dividends and distributions, if any. Total returns may reflect adjustments to conform to generally accepted accounting principles. Total returns for periods less than one full year are not annualized. |
| (d) | Does not include expenses of the underlying funds in which the Fund invests. Expenses waived/reimbursed include those of underlying funds in which the Fund invests. Consequently, the amount waived/reimbursed may be greater than the expense ratio reflected in the financial highlights. |
See Notes to Financial Statements.
| | | | |
| Class R5 Shares | | | |
| | | December 13,
2016(a)
through
July 31,
2017 | |
| Per Share Operating Performance(b): | | | | |
| Net Asset Value, Beginning of Period | | | $10.00 | |
| Income (loss) from investment operations: | | | | |
| Net investment income (loss) | | | .11 | |
| Net realized and unrealized gain (loss) on investment transactions | | | .36 | |
| Total from investment operations | | | .47 | |
| Net asset value, end of period | | | $10.47 | |
| Total Return(c): | | | 4.70% | |
| |
| Ratios/Supplemental Data: | | | |
| Net assets, end of period (000) | | | $10 | |
| Average net assets (000) | | | $10 | |
| Ratios to average net assets(d): | | | | |
| Expenses after waivers and/or expense reimbursement | | | .04% | (e) |
| Expenses before waivers and/or expense reimbursement | | | 335.77% | (e) |
| Net investment income (loss) | | | 1.77% | (e) |
| Portfolio turnover rate | | | 9% | (f) |
| (a) | Commencement of operations. |
| (b) | Calculated based on average shares outstanding during the period. |
| (c) | Total return is calculated assuming a purchase of a share on the first day and a sale on the last day of each period reported and includes reinvestment of dividends and distributions, if any. Total returns may reflect adjustments to conform to generally accepted accounting principles. Total returns for periods less than one full year are not annualized. |
| (d) | Does not include expenses of the underlying funds in which the Fund invests. Expenses waived/reimbursed include those of underlying funds in which the Fund invests. Consequently, the amount waived/reimbursed may be greater than the expense ratio reflected in the financial highlights. |
See Notes to Financial Statements.
| | | | |
| Prudential Day One Funds | | | 165 | |
Prudential Day One 2010 Fund
Financial Highlights (continued)
| | | | |
| Class R6 Shares | | | |
| | | December 13,
2016(a)
through
July 31,
2017 | |
| Per Share Operating Performance(b): | | | | |
| Net Asset Value, Beginning of Period | | | $10.00 | |
| Income (loss) from investment operations: | | | | |
| Net investment income (loss) | | | .15 | |
| Net realized and unrealized gain (loss) on investment transactions | | | .33 | |
| Total from investment operations | | | .48 | |
| Net asset value, end of period | | | $10.48 | |
| Total Return(c): | | | 4.80% | |
| |
| Ratios/Supplemental Data: | | | |
| Net assets, end of period (000) | | | $4,436 | |
| Average net assets (000) | | | $452 | |
| Ratios to average net assets(d): | | | | |
| Expenses after waivers and/or expense reimbursement | | | (.27)% | (e) |
| Expenses before waivers and/or expense reimbursement | | | 26.49% | (e) |
| Net investment income (loss) | | | 2.20% | (e) |
| Portfolio turnover rate | | | 9% | (f) |
| (a) | Commencement of operations. |
| (b) | Calculated based on average shares outstanding during the period. |
| (c) | Total return is calculated assuming a purchase of a share on the first day and a sale on the last day of each period reported and includes reinvestment of dividends and distributions, if any. Total returns may reflect adjustments to conform to generally accepted accounting principles. Total returns for periods less than one full year are not annualized. |
| (d) | Does not include expenses of the underlying funds in which the Fund invests. Expenses waived/reimbursed include those of underlying funds in which the Fund invests. Consequently, the amount waived/reimbursed may be greater than the expense ratio reflected in the financial highlights. |
See Notes to Financial Statements.
Prudential Day One 2015 Fund
Financial Highlights
| | | | |
| Class R1 Shares | | | |
| | | December 13,
2016(a)
through
July 31,
2017 | |
| Per Share Operating Performance(b): | | | | |
| Net Asset Value, Beginning of Period | | | $10.00 | |
| Income (loss) from investment operations: | | | | |
| Net investment income (loss) | | | .07 | |
| Net realized and unrealized gain (loss) on investment transactions | | | .42 | |
| Total from investment operations | | | .49 | |
| Net asset value, end of period | | | $10.49 | |
| Total Return(c): | | | 4.90% | |
| |
| Ratios/Supplemental Data: | | | |
| Net assets, end of period (000) | | | $10 | |
| Average net assets (000) | | | $10 | |
| Ratios to average net assets(d): | | | | |
| Expenses after waivers and/or expense reimbursement | | | .65% | (e) |
| Expenses before waivers and/or expense reimbursement | | | 244.08% | (e) |
| Net investment income (loss) | | | 1.10% | (e) |
| Portfolio turnover rate | | | 82% | (f) |
| (a) | Commencement of operations. |
| (b) | Calculated based on average shares outstanding during the period. |
| (c) | Total return is calculated assuming a purchase of a share on the first day and a sale on the last day of each period reported and includes reinvestment of dividends and distributions, if any. Total returns may reflect adjustments to conform to generally accepted accounting principles. Total returns for periods less than one full year are not annualized. |
| (d) | Does not include expenses of the underlying funds in which the Fund invests. Expenses waived/reimbursed include those of underlying funds in which the Fund invests. Consequently, the amount waived/reimbursed may be greater than the expense ratio reflected in the financial highlights. |
See Notes to Financial Statements.
| | | | |
| Prudential Day One Funds | | | 167 | |
Prudential Day One 2015 Fund
Financial Highlights (continued)
| | | | |
| Class R2 Shares | | | |
| | | December 13,
2016(a)
through
July 31,
2017 | |
| Per Share Operating Performance(b): | | | | |
| Net Asset Value, Beginning of Period | | | $10.00 | |
| Income (loss) from investment operations: | | | | |
| Net investment income (loss) | | | .09 | |
| Net realized and unrealized gain (loss) on investment transactions | | | .41 | |
| Total from investment operations | | | .50 | |
| Net asset value, end of period | | | $10.50 | |
| Total Return(c): | | | 5.00% | |
| |
| Ratios/Supplemental Data: | | | |
| Net assets, end of period (000) | | | $11 | |
| Average net assets (000) | | | $10 | |
| Ratios to average net assets(d): | | | | |
| Expenses after waivers and/or expense reimbursement | | | .40% | (e) |
| Expenses before waivers and/or expense reimbursement | | | 243.71% | (e) |
| Net investment income (loss) | | | 1.35% | (e) |
| Portfolio turnover rate | | | 82% | (f) |
| (a) | Commencement of operations. |
| (b) | Calculated based on average shares outstanding during the period. |
| (c) | Total return is calculated assuming a purchase of a share on the first day and a sale on the last day of each period reported and includes reinvestment of dividends and distributions, if any. Total returns may reflect adjustments to conform to generally accepted accounting principles. Total returns for periods less than one full year are not annualized. |
| (d) | Does not include expenses of the underlying funds in which the Fund invests. Expenses waived/reimbursed include those of underlying funds in which the Fund invests. Consequently, the amount waived/reimbursed may be greater than the expense ratio reflected in the financial highlights. |
See Notes to Financial Statements.
| | | | |
| Class R3 Shares | | | |
| | | December 13,
2016(a)
through
July 31,
2017 | |
| Per Share Operating Performance(b): | | | | |
| Net Asset Value, Beginning of Period | | | $10.00 | |
| Income (loss) from investment operations: | | | | |
| Net investment income (loss) | | | .10 | |
| Net realized and unrealized gain (loss) on investment transactions | | | .41 | |
| Total from investment operations | | | .51 | |
| Net asset value, end of period | | | $10.51 | |
| Total Return(c): | | | 5.10% | |
| |
| Ratios/Supplemental Data: | | | |
| Net assets, end of period (000) | | | $11 | |
| Average net assets (000) | | | $10 | |
| Ratios to average net assets(d): | | | | |
| Expenses after waivers and/or expense reimbursement | | | .26% | (e) |
| Expenses before waivers and/or expense reimbursement | | | 243.52% | (e) |
| Net investment income (loss) | | | 1.50% | (e) |
| Portfolio turnover rate | | | 82% | (f) |
| (a) | Commencement of operations. |
| (b) | Calculated based on average shares outstanding during the period. |
| (c) | Total return is calculated assuming a purchase of a share on the first day and a sale on the last day of each period reported and includes reinvestment of dividends and distributions, if any. Total returns may reflect adjustments to conform to generally accepted accounting principles. Total returns for periods less than one full year are not annualized. |
| (d) | Does not include expenses of the underlying funds in which the Fund invests. Expenses waived/reimbursed include those of underlying funds in which the Fund invests. Consequently, the amount waived/reimbursed may be greater than the expense ratio reflected in the financial highlights. |
See Notes to Financial Statements.
| | | | |
| Prudential Day One Funds | | | 169 | |
Prudential Day One 2015 Fund
Financial Highlights (continued)
| | | | |
| Class R4 Shares | | | |
| | | December 13,
2016(a)
through
July 31,
2017 | |
| Per Share Operating Performance(b): | | | | |
| Net Asset Value, Beginning of Period | | | $10.00 | |
| Income (loss) from investment operations: | | | | |
| Net investment income (loss) | | | .11 | |
| Net realized and unrealized gain (loss) on investment transactions | | | .40 | |
| Total from investment operations | | | .51 | |
| Net asset value, end of period | | | $10.51 | |
| Total Return(c): | | | 5.10% | |
| |
| Ratios/Supplemental Data: | | | |
| Net assets, end of period (000) | | | $51 | |
| Average net assets (000) | | | $42 | |
| Ratios to average net assets(d): | | | | |
| Expenses after waivers and/or expense reimbursement | | | .16% | (e) |
| Expenses before waivers and/or expense reimbursement | | | 144.74% | (e) |
| Net investment income (loss) | | | 1.72% | (e) |
| Portfolio turnover rate | | | 82% | (f) |
| (a) | Commencement of operations. |
| (b) | Calculated based on average shares outstanding during the period. |
| (c) | Total return is calculated assuming a purchase of a share on the first day and a sale on the last day of each period reported and includes reinvestment of dividends and distributions, if any. Total returns may reflect adjustments to conform to generally accepted accounting principles. Total returns for periods less than one full year are not annualized. |
| (d) | Does not include expenses of the underlying funds in which the Fund invests. Expenses waived/reimbursed include those of underlying funds in which the Fund invests. Consequently, the amount waived/reimbursed may be greater than the expense ratio reflected in the financial highlights. |
See Notes to Financial Statements.
| | | | |
| Class R5 Shares | | | |
| | | December 13,
2016(a)
through
July 31,
2017 | |
| Per Share Operating Performance(b): | | | | |
| Net Asset Value, Beginning of Period | | | $10.00 | |
| Income (loss) from investment operations: | | | | |
| Net investment income (loss) | | | .11 | |
| Net realized and unrealized gain (loss) on investment transactions | | | .42 | |
| Total from investment operations | | | .53 | |
| Net asset value, end of period | | | $10.53 | |
| Total Return(c): | | | 5.30% | |
| |
| Ratios/Supplemental Data: | | | |
| Net assets, end of period (000) | | | $11 | |
| Average net assets (000) | | | $10 | |
| Ratios to average net assets(d): | | | | |
| Expenses after waivers and/or expense reimbursement | | | .05% | (e) |
| Expenses before waivers and/or expense reimbursement | | | 243.22% | (e) |
| Net investment income (loss) | | | 1.71% | (e) |
| Portfolio turnover rate | | | 82% | (f) |
| (a) | Commencement of operations. |
| (b) | Calculated based on average shares outstanding during the period. |
| (c) | Total return is calculated assuming a purchase of a share on the first day and a sale on the last day of each period reported and includes reinvestment of dividends and distributions, if any. Total returns may reflect adjustments to conform to generally accepted accounting principles. Total returns for periods less than one full year are not annualized. |
| (d) | Does not include expenses of the underlying funds in which the Fund invests. Expenses waived/reimbursed include those of underlying funds in which the Fund invests. Consequently, the amount waived/reimbursed may be greater than the expense ratio reflected in the financial highlights. |
See Notes to Financial Statements.
| | | | |
| Prudential Day One Funds | | | 171 | |
Prudential Day One 2015 Fund
Financial Highlights (continued)
| | | | | | | | |
| Class R6 Shares | | | | | | |
| | | December 13,
2016(a)
through
July 31,
2017 | | | | |
| Per Share Operating Performance(b): | | | | | | | | |
| Net Asset Value, Beginning of Period | | | $10.00 | | | | | |
| Income (loss) from investment operations: | | | | | | | | |
| Net investment income (loss) | | | .13 | | | | | |
| Net realized and unrealized gain (loss) on investment transactions | | | .40 | | | | | |
| Total from investment operations | | | .53 | | | | | |
| Net asset value, end of period | | | $10.53 | | | | | |
| Total Return(c): | | | 5.30% | | | | | |
| |
| Ratios/Supplemental Data: | | | | | | |
| Net assets, end of period (000) | | | $4,099 | | | | | |
| Average net assets (000) | | | $640 | | | | | |
| Ratios to average net assets(d): | | | | | | | | |
| Expenses after waivers and/or expense reimbursement | | | (.22)% | (e) | | | | |
| Expenses before waivers and/or expense reimbursement | | | 27.57% | (e) | | | | |
| Net investment income (loss) | | | 1.94% | (e) | | | | |
| Portfolio turnover rate | | | 82% | (f) | | | | |
| (a) | Commencement of operations. |
| (b) | Calculated based on average shares outstanding during the period. |
| (c) | Total return is calculated assuming a purchase of a share on the first day and a sale on the last day of each period reported and includes reinvestment of dividends and distributions, if any. Total returns may reflect adjustments to conform to generally accepted accounting principles. Total returns for periods less than one full year are not annualized. |
| (d) | Does not include expenses of the underlying funds in which the Fund invests. Expenses waived/reimbursed include those of underlying funds in which the Fund invests. Consequently, the amount waived/reimbursed may be greater than the expense ratio reflected in the financial highlights. |
See Notes to Financial Statements.
Prudential Day One 2020 Fund
Financial Highlights
| | | | |
| Class R1 Shares | | | |
| | | December 13,
2016(a)
through
July 31, 2017 | |
| Per Share Operating Performance(b): | | | | |
| Net Asset Value, Beginning of Period | | | $10.00 | |
| Income (loss) from investment operations: | | | | |
| Net investment income (loss) | | | .07 | |
| Net realized and unrealized gain (loss) on investment transactions | | | .45 | |
| Total from investment operations | | | .52 | |
| Net asset value, end of period | | | $10.52 | |
| Total Return(c): | | | 5.20% | |
| |
| Ratios/Supplemental Data: | | | |
| Net assets, end of period (000) | | | $11 | |
| Average net assets (000) | | | $10 | |
| Ratios to average net assets(d): | | | | |
| Expenses after waivers and/or expense reimbursement | | | .67% | (e) |
| Expenses before waivers and/or expense reimbursement | | | 211.29% | (e) |
| Net investment income (loss) | | | 1.02% | (e) |
| Portfolio turnover rate | | | 21% | (f) |
| (a) | Commencement of operations. |
| (b) | Calculated based on average shares outstanding during the period. |
| (c) | Total return is calculated assuming a purchase of a share on the first day and a sale on the last day of each period reported and includes reinvestment of dividends and distributions, if any. Total returns may reflect adjustments to conform to generally accepted accounting principles. Total returns for periods less than one full year are not annualized. |
| (d) | Does not include expenses of the underlying funds in which the Fund invests. Expenses waived/reimbursed include those of underlying funds in which the Fund invests. Consequently, the amount waived/reimbursed may be greater than the expense ratio reflected in the financial highlights. |
See Notes to Financial Statements.
| | | | |
| Prudential Day One Funds | | | 173 | |
Prudential Day One 2020 Fund
Financial Highlights (continued)
| | | | |
| Class R2 Shares | | | |
| | | December 13,
2016(a)
through
July 31, 2017 | |
| Per Share Operating Performance(b): | | | | |
| Net Asset Value, Beginning of Period | | | $10.00 | |
| Income (loss) from investment operations: | | | | |
| Net investment income (loss) | | | .08 | |
| Net realized and unrealized gain (loss) on investment transactions | | | .46 | |
| Total from investment operations | | | .54 | |
| Net asset value, end of period | | | $10.54 | |
| Total Return(c): | | | 5.40% | |
| |
| Ratios/Supplemental Data: | | | |
| Net assets, end of period (000) | | | $11 | |
| Average net assets (000) | | | $10 | |
| Ratios to average net assets(d): | | | | |
| Expenses after waivers and/or expense reimbursement | | | .42% | (e) |
| Expenses before waivers and/or expense reimbursement | | | 210.95% | (e) |
| Net investment income (loss) | | | 1.27% | (e) |
| Portfolio turnover rate | | | 21% | (f) |
| (a) | Commencement of operations. |
| (b) | Calculated based on average shares outstanding during the period. |
| (c) | Total return is calculated assuming a purchase of a share on the first day and a sale on the last day of each period reported and includes reinvestment of dividends and distributions, if any. Total returns may reflect adjustments to conform to generally accepted accounting principles. Total returns for periods less than one full year are not annualized. |
| (d) | Does not include expenses of the underlying funds in which the Fund invests. Expenses waived/reimbursed include those of underlying funds in which the Fund invests. Consequently, the amount waived/reimbursed may be greater than the expense ratio reflected in the financial highlights. |
See Notes to Financial Statements.
| | | | |
| Class R3 Shares | | | |
| | | December 13,
2016(a)
through
July 31, 2017 | |
| Per Share Operating Performance(b): | | | | |
| Net Asset Value, Beginning of Period | | | $10.00 | |
| Income (loss) from investment operations: | | | | |
| Net investment income (loss) | | | .09 | |
| Net realized and unrealized gain (loss) on investment transactions | | | .46 | |
| Total from investment operations | | | .55 | |
| Net asset value, end of period | | | $10.55 | |
| Total Return(c): | | | 5.50% | |
| |
| Ratios/Supplemental Data: | | | |
| Net assets, end of period (000) | | | $11 | |
| Average net assets (000) | | | $10 | |
| Ratios to average net assets(d): | | | | |
| Expenses after waivers and/or expense reimbursement | | | .27% | (e) |
| Expenses before waivers and/or expense reimbursement | | | 210.74% | (e) |
| Net investment income (loss) | | | 1.41% | (e) |
| Portfolio turnover rate | | | 21% | (f) |
| (a) | Commencement of operations. |
| (b) | Calculated based on average shares outstanding during the period. |
| (c) | Total return is calculated assuming a purchase of a share on the first day and a sale on the last day of each period reported and includes reinvestment of dividends and distributions, if any. Total returns may reflect adjustments to conform to generally accepted accounting principles. Total returns for periods less than one full year are not annualized. |
| (d) | Does not include expenses of the underlying funds in which the Fund invests. Expenses waived/reimbursed include those of underlying funds in which the Fund invests. Consequently, the amount waived/reimbursed may be greater than the expense ratio reflected in the financial highlights. |
See Notes to Financial Statements.
| | | | |
| Prudential Day One Funds | | | 175 | |
Prudential Day One 2020 Fund
Financial Highlights (continued)
| | | | |
| Class R4 Shares | | | |
| | | December 13,
2016(a)
through
July 31, 2017 | |
| Per Share Operating Performance(b): | | | | |
| Net Asset Value, Beginning of Period | | | $10.00 | |
| Income (loss) from investment operations: | | | | |
| Net investment income (loss) | | | .10 | |
| Net realized and unrealized gain (loss) on investment transactions | | | .45 | |
| Total from investment operations | | | .55 | |
| Net asset value, end of period | | | $10.55 | |
| Total Return(c): | | | 5.50% | |
| |
| Ratios/Supplemental Data: | | | |
| Net assets, end of period (000) | | | $178 | |
| Average net assets (000) | | | $160 | |
| Ratios to average net assets(d): | | | | |
| Expenses after waivers and/or expense reimbursement | | | .14% | (e) |
| Expenses before waivers and/or expense reimbursement | | | 45.98% | (e) |
| Net investment income (loss) | | | 1.45% | (e) |
| Portfolio turnover rate | | | 21% | (f) |
| (a) | Commencement of operations. |
| (b) | Calculated based on average shares outstanding during the period. |
| (c) | Total return is calculated assuming a purchase of a share on the first day and a sale on the last day of each period reported and includes reinvestment of dividends and distributions, if any. Total returns may reflect adjustments to conform to generally accepted accounting principles. Total returns for periods less than one full year are not annualized. |
| (d) | Does not include expenses of the underlying funds in which the Fund invests. Expenses waived/reimbursed include those of underlying funds in which the Fund invests. Consequently, the amount waived/reimbursed may be greater than the expense ratio reflected in the financial highlights. |
See Notes to Financial Statements.
| | | | |
| Class R5 Shares | | | |
| | | December 13,
2016(a)
through
July 31, 2017 | |
| Per Share Operating Performance(b): | | | | |
| Net Asset Value, Beginning of Period | | | $10.00 | |
| Income (loss) from investment operations: | | | | |
| Net investment income (loss) | | | .11 | |
| Net realized and unrealized gain (loss) on investment transactions | | | .45 | |
| Total from investment operations | | | .56 | |
| Net asset value, end of period | | | $10.56 | |
| Total Return(c): | | | 5.60% | |
| |
| Ratios/Supplemental Data: | | | |
| Net assets, end of period (000) | | | $11 | |
| Average net assets (000) | | | $10 | |
| Ratios to average net assets(d): | | | | |
| Expenses after waivers and/or expense reimbursement | | | .06% | (e) |
| Expenses before waivers and/or expense reimbursement | | | 210.44% | (e) |
| Net investment income (loss) | | | 1.62% | (e) |
| Portfolio turnover rate | | | 21% | (f) |
| (a) | Commencement of operations. |
| (b) | Calculated based on average shares outstanding during the period. |
| (c) | Total return is calculated assuming a purchase of a share on the first day and a sale on the last day of each period reported and includes reinvestment of dividends and distributions, if any. Total returns may reflect adjustments to conform to generally accepted accounting principles. Total returns for periods less than one full year are not annualized. |
| (d) | Does not include expenses of the underlying funds in which the Fund invests. Expenses waived/reimbursed include those of underlying funds in which the Fund invests. Consequently, the amount waived/reimbursed may be greater than the expense ratio reflected in the financial highlights. |
See Notes to Financial Statements.
| | | | |
| Prudential Day One Funds | | | 177 | |
Prudential Day One 2020 Fund
Financial Highlights (continued)
| | | | |
| Class R6 Shares | | | |
| | | December 13,
2016(a)
through
July 31, 2017 | |
| Per Share Operating Performance(b): | | | | |
| Net Asset Value, Beginning of Period | | | $10.00 | |
| Income (loss) from investment operations: | | | | |
| Net investment income (loss) | | | .12 | |
| Net realized and unrealized gain (loss) on investment transactions | | | .42 | |
| Total from investment operations | | | .54 | |
| Net asset value, end of period | | | $10.54 | |
| Total Return(c): | | | 5.40% | |
| |
| Ratios/Supplemental Data: | | | |
| Net assets, end of period (000) | | | $12,368 | |
| Average net assets (000) | | | $1,944 | |
| Ratios to average net assets(d): | | | | |
| Expenses after waivers and/or expense reimbursement | | | (.21)% | (e) |
| Expenses before waivers and/or expense reimbursement | | | 9.10% | (e) |
| Net investment income (loss) | | | 1.80% | (e) |
| Portfolio turnover rate | | | 21% | (f) |
| (a) | Commencement of operations. |
| (b) | Calculated based on average shares outstanding during the period. |
| (c) | Total return is calculated assuming a purchase of a share on the first day and a sale on the last day of each period reported and includes reinvestment of dividends and distributions, if any. Total returns may reflect adjustments to conform to generally accepted accounting principles. Total returns for periods less than one full year are not annualized. |
| (d) | Does not include expenses of the underlying funds in which the Fund invests. Expenses waived/reimbursed include those of underlying funds in which the Fund invests. Consequently, the amount waived/reimbursed may be greater than the expense ratio reflected in the financial highlights. |
See Notes to Financial Statements.
Prudential Day One 2025 Fund
Financial Highlights
| | | | |
| Class R1 Shares | | | |
| | | December 13,
2016(a)
through
July 31,
2017 | |
| Per Share Operating Performance(b): | | | | |
| Net Asset Value, Beginning of Period | | | $10.00 | |
| Income (loss) from investment operations: | | | | |
| Net investment income (loss) | | | .04 | |
| Net realized and unrealized gain (loss) on investment transactions | | | .54 | |
| Total from investment operations | | | .58 | |
| Net asset value, end of period | | | $10.58 | |
| Total Return(c): | | | 5.80% | |
| |
| Ratios/Supplemental Data: | | | |
| Net assets, end of period (000) | | | $592 | |
| Average net assets (000) | | | $43 | |
| Ratios to average net assets(d): | | | | |
| Expenses after waivers and/or expense reimbursement | | | .53% | (e) |
| Expenses before waivers and/or expense reimbursement | | | 55.43% | (e) |
| Net investment income (loss) | | | .55% | (e) |
| Portfolio turnover rate | | | 6% | (f) |
| (a) | Commencement of operations. |
| (b) | Calculated based on average shares outstanding during the period. |
| (c) | Total return is calculated assuming a purchase of a share on the first day and a sale on the last day of each period reported and includes reinvestment of dividends and distributions, if any. Total returns may reflect adjustments to conform to generally accepted accounting principles. Total returns for periods less than one full year are not annualized. |
| (d) | Does not include expenses of the underlying funds in which the Fund invests. Expenses waived/reimbursed include those of underlying funds in which the Fund invests. Consequently, the amount waived/reimbursed may be greater than the expense ratio reflected in the financial highlights. |
See Notes to Financial Statements.
| | | | |
| Prudential Day One Funds | | | 179 | |
Prudential Day One 2025 Fund
Financial Highlights (continued)
| | | | |
| Class R2 Shares | | | |
| | | December 13,
2016(a)
through
July 31,
2017 | |
| Per Share Operating Performance(b): | | | | |
| Net Asset Value, Beginning of Period | | | $10.00 | |
| Income (loss) from investment operations: | | | | |
| Net investment income (loss) | | | .08 | |
| Net realized and unrealized gain (loss) on investment transactions | | | .51 | |
| Total from investment operations | | | .59 | |
| Net asset value, end of period | | | $10.59 | |
| Total Return(c): | | | 5.90% | |
| |
| Ratios/Supplemental Data: | | | |
| Net assets, end of period (000) | | | $11 | |
| Average net assets (000) | | | $10 | |
| Ratios to average net assets(d): | | | | |
| Expenses after waivers and/or expense reimbursement | | | .42% | (e) |
| Expenses before waivers and/or expense reimbursement | | | 215.71% | (e) |
| Net investment income (loss) | | | 1.16% | (e) |
| Portfolio turnover rate | | | 6% | (f) |
| (a) | Commencement of operations. |
| (b) | Calculated based on average shares outstanding during the period. |
| (c) | Total return is calculated assuming a purchase of a share on the first day and a sale on the last day of each period reported and includes reinvestment of dividends and distributions, if any. Total returns may reflect adjustments to conform to generally accepted accounting principles. Total returns for periods less than one full year are not annualized. |
| (d) | Does not include expenses of the underlying funds in which the Fund invests. Expenses waived/reimbursed include those of underlying funds in which the Fund invests. Consequently, the amount waived/reimbursed may be greater than the expense ratio reflected in the financial highlights. |
See Notes to Financial Statements.
| | | | |
| Class R3 Shares | | | |
| | | December 13,
2016(a)
through
July 31,
2017 | |
| Per Share Operating Performance(b): | | | | |
| Net Asset Value, Beginning of Period | | | $10.00 | |
| Income (loss) from investment operations: | | | | |
| Net investment income (loss) | | | .07 | |
| Net realized and unrealized gain (loss) on investment transactions | | | .54 | |
| Total from investment operations | | | .61 | |
| Net asset value, end of period | | | $10.61 | |
| Total Return(c): | | | 6.10% | |
| |
| Ratios/Supplemental Data: | | | |
| Net assets, end of period (000) | | | $3,863 | |
| Average net assets (000) | | | $77 | |
| Ratios to average net assets(d): | | | | |
| Expenses after waivers and/or expense reimbursement | | | .04% | (e) |
| Expenses before waivers and/or expense reimbursement | | | 34.35% | (e) |
| Net investment income (loss) | | | 1.06% | (e) |
| Portfolio turnover rate | | | 6% | (f) |
| (a) | Commencement of operations. |
| (b) | Calculated based on average shares outstanding during the period. |
| (c) | Total return is calculated assuming a purchase of a share on the first day and a sale on the last day of each period reported and includes reinvestment of dividends and distributions, if any. Total returns may reflect adjustments to conform to generally accepted accounting principles. Total returns for periods less than one full year are not annualized. |
| (d) | Does not include expenses of the underlying funds in which the Fund invests. Expenses waived/reimbursed include those of underlying funds in which the Fund invests. Consequently, the amount waived/reimbursed may be greater than the expense ratio reflected in the financial highlights. |
See Notes to Financial Statements.
| | | | |
| Prudential Day One Funds | | | 181 | |
Prudential Day One 2025 Fund
Financial Highlights (continued)
| | | | |
| Class R4 Shares | | | |
| | | December 13,
2016(a)
through
July 31,
2017 | |
| Per Share Operating Performance(b): | | | | |
| Net Asset Value, Beginning of Period | | | $10.00 | |
| Income (loss) from investment operations: | | | | |
| Net investment income (loss) | | | .08 | |
| Net realized and unrealized gain (loss) on investment transactions | | | .53 | |
| Total from investment operations | | | .61 | |
| Net asset value, end of period | | | $10.61 | |
| Total Return(c): | | | 6.10% | |
| |
| Ratios/Supplemental Data: | | | |
| Net assets, end of period (000) | | | $175 | |
| Average net assets (000) | | | $133 | |
| Ratios to average net assets(d): | | | | |
| Expenses after waivers and/or expense reimbursement | | | .15% | (e) |
| Expenses before waivers and/or expense reimbursement | | | 49.61% | (e) |
| Net investment income (loss) | | | 1.17% | (e) |
| Portfolio turnover rate | | | 6% | (f) |
| (a) | Commencement of operations. |
| (b) | Calculated based on average shares outstanding during the period. |
| (c) | Total return is calculated assuming a purchase of a share on the first day and a sale on the last day of each period reported and includes reinvestment of dividends and distributions, if any. Total returns may reflect adjustments to conform to generally accepted accounting principles. Total returns for periods less than one full year are not annualized. |
| (d) | Does not include expenses of the underlying funds in which the Fund invests. Expenses waived/reimbursed include those of underlying funds in which the Fund invests. Consequently, the amount waived/reimbursed may be greater than the expense ratio reflected in the financial highlights. |
See Notes to Financial Statements.
| | | | |
| Class R5 Shares | | | |
| | | December 13,
2016(a)
through
July 31,
2017 | |
| Per Share Operating Performance(b): | | | | |
| Net Asset Value, Beginning of Period | | | $10.00 | |
| Income (loss) from investment operations: | | | | |
| Net investment income (loss) | | | .10 | |
| Net realized and unrealized gain (loss) on investment transactions | | | .52 | |
| Total from investment operations | | | .62 | |
| Net asset value, end of period | | | $10.62 | |
| Total Return(c): | | | 6.20% | |
| |
| Ratios/Supplemental Data: | | | |
| Net assets, end of period (000) | | | $16 | |
| Average net assets (000) | | | $12 | |
| Ratios to average net assets(d): | | | | |
| Expenses after waivers and/or expense reimbursement | | | .06% | (e) |
| Expenses before waivers and/or expense reimbursement | | | 179.75% | (e) |
| Net investment income (loss) | | | 1.47% | (e) |
| Portfolio turnover rate | | | 6% | (f) |
| (a) | Commencement of operations. |
| (b) | Calculated based on average shares outstanding during the period. |
| (c) | Total return is calculated assuming a purchase of a share on the first day and a sale on the last day of each period reported and includes reinvestment of dividends and distributions, if any. Total returns may reflect adjustments to conform to generally accepted accounting principles. Total returns for periods less than one full year are not annualized. |
| (d) | Does not include expenses of the underlying funds in which the Fund invests. Expenses waived/reimbursed include those of underlying funds in which the Fund invests. Consequently, the amount waived/reimbursed may be greater than the expense ratio reflected in the financial highlights. |
See Notes to Financial Statements.
| | | | |
| Prudential Day One Funds | | | 183 | |
Prudential Day One 2025 Fund
Financial Highlights (continued)
| | | | |
| Class R6 Shares | | | |
| | | December 13,
2016(a)
through
July 31,
2017 | |
| Per Share Operating Performance(b): | | | | |
| Net Asset Value, Beginning of Period | | | $10.00 | |
| Income (loss) from investment operations: | | | | |
| Net investment income (loss) | | | .10 | |
| Net realized and unrealized gain (loss) on investment transactions | | | .54 | |
| Total from investment operations | | | .64 | |
| Net asset value, end of period | | | $10.64 | |
| Total Return(c): | | | 6.40% | |
| |
| Ratios/Supplemental Data: | | | |
| Net assets, end of period (000) | | | $13,380 | |
| Average net assets (000) | | | $2,024 | |
| Ratios to average net assets(d): | | | | |
| Expenses after waivers and/or expense reimbursement | | | (.19)% | (e) |
| Expenses before waivers and/or expense reimbursement | | | 8.73% | (e) |
| Net investment income (loss) | | | 1.57% | (e) |
| Portfolio turnover rate | | | 6% | (f) |
| (a) | Commencement of operations. |
| (b) | Calculated based on average shares outstanding during the period. |
| (c) | Total return is calculated assuming a purchase of a share on the first day and a sale on the last day of each period reported and includes reinvestment of dividends and distributions, if any. Total returns may reflect adjustments to conform to generally accepted accounting principles. Total returns for periods less than one full year are not annualized. |
| (d) | Does not include expenses of the underlying funds in which the Fund invests. Expenses waived/reimbursed include those of underlying funds in which the Fund invests. Consequently, the amount waived/reimbursed may be greater than the expense ratio reflected in the financial highlights. |
See Notes to Financial Statements.
Prudential Day One 2030 Fund
Financial Highlights
| | | | |
| Class R1 Shares | | | |
| | | December 13,
2016(a)
through
July 31,
2017 | |
| Per Share Operating Performance(b): | | | | |
| Net Asset Value, Beginning of Period | | | $10.00 | |
| Income (loss) from investment operations: | | | | |
| Net investment income (loss) | | | .04 | |
| Net realized and unrealized gain (loss) on investment transactions | | | .70 | |
| Total from investment operations | | | .74 | |
| Net asset value, end of period | | | $10.74 | |
| Total Return(c): | | | 7.40% | |
| | | | |
Ratios/Supplemental Data: | |
| Net assets, end of period (000) | | | $14 | |
| Average net assets (000) | | | $10 | |
| Ratios to average net assets(d): | | | | |
| Expenses after waivers and/or expense reimbursement | | | .69% | (e) |
| Expenses before waivers and/or expense reimbursement | | | 195.73% | (e) |
| Net investment income (loss) | | | .68% | (e) |
| Portfolio turnover rate | | | 5% | (f) |
| (a) | Commencement of operations. |
| (b) | Calculated based on average shares outstanding during the period. |
| (c) | Total return is calculated assuming a purchase of a share on the first day and a sale on the last day of each period reported and includes reinvestment of dividends and distributions, if any. Total returns may reflect adjustments to conform to generally accepted accounting principles. Total returns for periods less than one full year are not annualized. |
| (d) | Does not include expenses of the underlying funds in which the Fund invests. Expenses waived/reimbursed include those of underlying funds in which the Fund invests. Consequently, the amount waived/reimbursed may be greater than the expense ratio reflected in the financial highlights. |
See Notes to Financial Statements.
| | | | |
| Prudential Day One Funds | | | 185 | |
Prudential Day One 2030 Fund
Financial Highlights (continued)
| | | | |
| Class R2 Shares | | �� | |
| | | December 13,
2016(a)
through
July 31,
2017 | |
| Per Share Operating Performance(b): | | | | |
| Net Asset Value, Beginning of Period | | | $10.00 | |
| Income (loss) from investment operations: | | | | |
| Net investment income (loss) | | | .06 | |
| Net realized and unrealized gain (loss) on investment transactions | | | .69 | |
| Total from investment operations | | | .75 | |
| Net asset value, end of period | | | $10.75 | |
| Total Return(c): | | | 7.50% | |
| | | | |
| Ratios/Supplemental Data: | | | |
| Net assets, end of period (000) | | | $13 | |
| Average net assets (000) | | | $11 | |
| Ratios to average net assets(d): | | | | |
| Expenses after waivers and/or expense reimbursement | | | .43% | (e) |
| Expenses before waivers and/or expense reimbursement | | | 183.27% | (e) |
| Net investment income (loss) | | | .91% | (e) |
| Portfolio turnover rate | | | 5% | (f) |
| (a) | Commencement of operations. |
| (b) | Calculated based on average shares outstanding during the period. |
| (c) | Total return is calculated assuming a purchase of a share on the first day and a sale on the last day of each period reported and includes reinvestment of dividends and distributions, if any. Total returns may reflect adjustments to conform to generally accepted accounting principles. Total returns for periods less than one full year are not annualized. |
| (d) | Does not include expenses of the underlying funds in which the Fund invests. Expenses waived/reimbursed include those of underlying funds in which the Fund invests. Consequently, the amount waived/reimbursed may be greater than the expense ratio reflected in the financial highlights. |
See Notes to Financial Statements.
| | | | |
| Class R3 Shares | | | |
| | | December 13,
2016(a)
through
July 31,
2017 | |
| Per Share Operating Performance(b): | | | | |
| Net Asset Value, Beginning of Period | | | $10.00 | |
| Income (loss) from investment operations: | | | | |
| Net investment income (loss) | | | .07 | |
| Net realized and unrealized gain (loss) on investment transactions | | | .69 | |
| Total from investment operations | | | .76 | |
| Net asset value, end of period | | | $10.76 | |
| Total Return(c): | | | 7.60% | |
| | | | |
| Ratios/Supplemental Data: | | | |
| Net assets, end of period (000) | | | $11 | |
| Average net assets (000) | | | $10 | |
| Ratios to average net assets(d): | | | | |
| Expenses after waivers and/or expense reimbursement | | | .29% | (e) |
| Expenses before waivers and/or expense reimbursement | | | 198.46% | (e) |
| Net investment income (loss) | | | 1.09% | (e) |
| Portfolio turnover rate | | | 5% | (f) |
| (a) | Commencement of operations. |
| (b) | Calculated based on average shares outstanding during the period. |
| (c) | Total return is calculated assuming a purchase of a share on the first day and a sale on the last day of each period reported and includes reinvestment of dividends and distributions, if any. Total returns may reflect adjustments to conform to generally accepted accounting principles. Total returns for periods less than one full year are not annualized. |
| (d) | Does not include expenses of the underlying funds in which the Fund invests. Expenses waived/reimbursed include those of underlying funds in which the Fund invests. Consequently, the amount waived/reimbursed may be greater than the expense ratio reflected in the financial highlights. |
See Notes to Financial Statements.
| | | | |
| Prudential Day One Funds | | | 187 | |
Prudential Day One 2030 Fund
Financial Highlights (continued)
| | | | |
| Class R4 Shares | | | |
| | | December 13,
2016(a)
through
July 31,
2017 | |
| Per Share Operating Performance(b): | | | | |
| Net Asset Value, Beginning of Period | | | $10.00 | |
| Income (loss) from investment operations: | | | | |
| Net investment income (loss) | | | .05 | |
| Net realized and unrealized gain (loss) on investment transactions | | | .72 | |
| Total from investment operations | | | .77 | |
| Net asset value, end of period | | | $10.77 | |
| Total Return(c): | | | 7.70% | |
| | | | |
Ratios/Supplemental Data: | |
| Net assets, end of period (000) | | | $857 | |
| Average net assets (000) | | | $507 | |
| Ratios to average net assets(d): | | | | |
| Expenses after waivers and/or expense reimbursement | | | .17% | (e) |
| Expenses before waivers and/or expense reimbursement | | | 20.56% | (e) |
| Net investment income (loss) | | | .80% | (e) |
| Portfolio turnover rate | | | 5% | (f) |
| (a) | Commencement of operations. |
| (b) | Calculated based on average shares outstanding during the period. |
| (c) | Total return is calculated assuming a purchase of a share on the first day and a sale on the last day of each period reported and includes reinvestment of dividends and distributions, if any. Total returns may reflect adjustments to conform to generally accepted accounting principles. Total returns for periods less than one full year are not annualized. |
| (d) | Does not include expenses of the underlying funds in which the Fund invests. Expenses waived/reimbursed include those of underlying funds in which the Fund invests. Consequently, the amount waived/reimbursed may be greater than the expense ratio reflected in the financial highlights. |
See Notes to Financial Statements.
| | | | |
| Class R5 Shares | | | |
| | | December 13,
2016(a)
through
July 31,
2017 | |
| Per Share Operating Performance(b): | | | | |
| Net Asset Value, Beginning of Period | | | $10.00 | |
| Income (loss) from investment operations: | | | | |
| Net investment income (loss) | | | .08 | |
| Net realized and unrealized gain (loss) on investment transactions | | | .70 | |
| Total from investment operations | | | .78 | |
| Net asset value, end of period | | | $10.78 | |
| Total Return(c): | | | 7.80% | |
| | | | |
| Ratios/Supplemental Data: | | | |
| Net assets, end of period (000) | | | $11 | |
| Average net assets (000) | | | $10 | |
| Ratios to average net assets(d): | | | | |
| Expenses after waivers and/or expense reimbursement | | | .08% | (e) |
| Expenses before waivers and/or expense reimbursement | | | 198.14% | (e) |
| Net investment income (loss) | | | 1.30% | (e) |
| Portfolio turnover rate | | | 5% | (f) |
| (a) | Commencement of operations. |
| (b) | Calculated based on average shares outstanding during the period. |
| (c) | Total return is calculated assuming a purchase of a share on the first day and a sale on the last day of each period reported and includes reinvestment of dividends and distributions, if any. Total returns may reflect adjustments to conform to generally accepted accounting principles. Total returns for periods less than one full year are not annualized. |
| (d) | Does not include expenses of the underlying funds in which the Fund invests. Expenses waived/reimbursed include those of underlying funds in which the Fund invests. Consequently, the amount waived/reimbursed may be greater than the expense ratio reflected in the financial highlights. |
See Notes to Financial Statements.
| | | | |
| Prudential Day One Funds | | | 189 | |
Prudential Day One 2030 Fund
Financial Highlights (continued)
| | | | |
| Class R6 Shares | | | |
| | | December 13,
2016(a)
through
July 31,
2017 | |
| Per Share Operating Performance(b): | | | | |
| Net Asset Value, Beginning of Period | | | $10.00 | |
| Income (loss) from investment operations: | | | | |
| Net investment income (loss) | | | .08 | |
| Net realized and unrealized gain (loss) on investment transactions | | | .71 | |
| Total from investment operations | | | .79 | |
| Net asset value, end of period | | | $10.79 | |
| Total Return(c): | | | 7.90% | |
| | | | |
| Ratios/Supplemental Data: | | | |
| Net assets, end of period (000) | | | $9,426 | |
| Average net assets (000) | | | $1,557 | |
| Ratios to average net assets(d): | | | | |
| Expenses after waivers and/or expense reimbursement | | | (.14)% | (e) |
| Expenses before waivers and/or expense reimbursement | | | 9.71% | (e) |
| Net investment income (loss) | | | 1.23% | (e) |
| Portfolio turnover rate | | | 5% | (f) |
| (a) | Commencement of operations. |
| (b) | Calculated based on average shares outstanding during the period. |
| (c) | Total return is calculated assuming a purchase of a share on the first day and a sale on the last day of each period reported and includes reinvestment of dividends and distributions, if any. Total returns may reflect adjustments to conform to generally accepted accounting principles. Total returns for periods less than one full year are not annualized. |
| (d) | Does not include expenses of the underlying funds in which the Fund invests. Expenses waived/reimbursed include those of underlying funds in which the Fund invests. Consequently, the amount waived/reimbursed may be greater than the expense ratio reflected in the financial highlights. |
See Notes to Financial Statements.
Prudential Day One 2035 Fund
Financial Highlights
| | | | |
| Class R1 Shares | | | |
| | | December 13,
2016(a)
through
July 31,
2017 | |
| Per Share Operating Performance(b): | | | | |
| Net Asset Value, Beginning of Period | | | $10.00 | |
| Income (loss) from investment operations: | | | | |
| Net investment income (loss) | | | .04 | |
| Net realized and unrealized gain (loss) on investment transactions | | | .77 | |
| Total from investment operations | | | .81 | |
| Net asset value, end of period | | | $10.81 | |
| Total Return(c): | | | 8.10% | |
| |
| Ratios/Supplemental Data: | | | |
| Net assets, end of period (000) | | | $13 | |
| Average net assets (000) | | | $10 | |
| Ratios to average net assets(d): | | | | |
| Expenses after waivers and/or expense reimbursement | | | .65% | (e) |
| Expenses before waivers and/or expense reimbursement | | | 250.51% | (e) |
| Net investment income (loss) | | | .58% | (e) |
| Portfolio turnover rate | | | 13% | (f) |
| (a) | Commencement of operations. |
| (b) | Calculated based on average shares outstanding during the period. |
| (c) | Total return is calculated assuming a purchase of a share on the first day and a sale on the last day of each period reported and includes reinvestment of dividends and distributions, if any. Total returns may reflect adjustments to conform to generally accepted accounting principles. Total returns for periods less than one full year are not annualized. |
| (d) | Does not include expenses of the underlying funds in which the Fund invests. Expenses waived/reimbursed include those of underlying funds in which the Fund invests. Consequently, the amount waived/reimbursed may be greater than the expense ratio reflected in the financial highlights. |
See Notes to Financial Statements.
| | | | |
| Prudential Day One Funds | | | 191 | |
Prudential Day One 2035 Fund
Financial Highlights (continued)
| | | | |
| Class R2 Shares | | | |
| | | December 13,
2016(a)
through
July 31,
2017 | |
| Per Share Operating Performance(b): | | | | |
| Net Asset Value, Beginning of Period | | | $10.00 | |
| Income (loss) from investment operations: | | | | |
| Net investment income (loss) | | | .05 | |
| Net realized and unrealized gain (loss) on investment transactions | | | .78 | |
| Total from investment operations | | | .83 | |
| Net asset value, end of period | | | $10.83 | |
| Total Return(c): | | | 8.30% | |
| |
| Ratios/Supplemental Data: | | | |
| Net assets, end of period (000) | | | $11 | |
| Average net assets (000) | | | $10 | |
| Ratios to average net assets(d): | | | | |
| Expenses after waivers and/or expense reimbursement | | | .40% | (e) |
| Expenses before waivers and/or expense reimbursement | | | 246.60% | (e) |
| Net investment income (loss) | | | .84% | (e) |
| Portfolio turnover rate | | | 13% | (f) |
| (a) | Commencement of operations. |
| (b) | Calculated based on average shares outstanding during the period. |
| (c) | Total return is calculated assuming a purchase of a share on the first day and a sale on the last day of each period reported and includes reinvestment of dividends and distributions, if any. Total returns may reflect adjustments to conform to generally accepted accounting principles. Total returns for periods less than one full year are not annualized. |
| (d) | Does not include expenses of the underlying funds in which the Fund invests. Expenses waived/reimbursed include those of underlying funds in which the Fund invests. Consequently, the amount waived/reimbursed may be greater than the expense ratio reflected in the financial highlights. |
See Notes to Financial Statements.
| | | | |
| Class R3 Shares | | | |
| | | December 13,
2016(a)
through
July 31,
2017 | |
| Per Share Operating Performance(b): | | | | |
| Net Asset Value, Beginning of Period | | | $10.00 | |
| Income (loss) from investment operations: | | | | |
| Net investment income (loss) | | | .04 | |
| Net realized and unrealized gain (loss) on investment transactions | | | .80 | |
| Total from investment operations | | | .84 | |
| Net asset value, end of period | | | $10.84 | |
| Total Return(c): | | | 8.40% | |
| |
| Ratios/Supplemental Data: | | | |
| Net assets, end of period (000) | | | $4,044 | |
| Average net assets (000) | | | $80 | |
| Ratios to average net assets(d): | | | | |
| Expenses after waivers and/or expense reimbursement | | | .08% | (e) |
| Expenses before waivers and/or expense reimbursement | | | 40.80% | (e) |
| Net investment income (loss) | | | .59% | (e) |
| Portfolio turnover rate | | | 13% | (f) |
| (a) | Commencement of operations. |
| (b) | Calculated based on average shares outstanding during the period. |
| (c) | Total return is calculated assuming a purchase of a share on the first day and a sale on the last day of each period reported and includes reinvestment of dividends and distributions, if any. Total returns may reflect adjustments to conform to generally accepted accounting principles. Total returns for periods less than one full year are not annualized. |
| (d) | Does not include expenses of the underlying funds in which the Fund invests. Expenses waived/reimbursed include those of underlying funds in which the Fund invests. Consequently, the amount waived/reimbursed may be greater than the expense ratio reflected in the financial highlights. |
See Notes to Financial Statements.
| | | | |
| Prudential Day One Funds | | | 193 | |
Prudential Day One 2035 Fund
Financial Highlights (continued)
| | | | |
| Class R4 Shares | | | |
| | | December 13,
2016(a)
through
July 31,
2017 | |
| Per Share Operating Performance(b): | | | | |
| Net Asset Value, Beginning of Period | | | $10.00 | |
| Income (loss) from investment operations: | | | | |
| Net investment income (loss) | | | .05 | |
| Net realized and unrealized gain (loss) on investment transactions | | | .80 | |
| Total from investment operations | | | .85 | |
| Net asset value, end of period | | | $10.85 | |
| Total Return(c): | | | 8.50% | |
| |
| Ratios/Supplemental Data: | | | |
| Net assets, end of period (000) | | | $57 | |
| Average net assets (000) | | | $37 | |
| Ratios to average net assets(d): | | | | |
| Expenses after waivers and/or expense reimbursement | | | .14% | (e) |
| Expenses before waivers and/or expense reimbursement | | | 122.15% | (e) |
| Net investment income (loss) | | | .73% | (e) |
| Portfolio turnover rate | | | 13% | (f) |
| (a) | Commencement of operations. |
| (b) | Calculated based on average shares outstanding during the period. |
| (c) | Total return is calculated assuming a purchase of a share on the first day and a sale on the last day of each period reported and includes reinvestment of dividends and distributions, if any. Total returns may reflect adjustments to conform to generally accepted accounting principles. Total returns for periods less than one full year are not annualized. |
| (d) | Does not include expenses of the underlying funds in which the Fund invests. Expenses waived/reimbursed include those of underlying funds in which the Fund invests. Consequently, the amount waived/reimbursed may be greater than the expense ratio reflected in the financial highlights. |
See Notes to Financial Statements.
| | | | |
| Class R5 Shares | | | |
| | | December 13,
2016(a)
through
July 31,
2017 | |
| Per Share Operating Performance(b): | | | | |
| Net Asset Value, Beginning of Period | | | $10.00 | |
| Income (loss) from investment operations: | | | | |
| Net investment income (loss) | | | .08 | |
| Net realized and unrealized gain (loss) on investment transactions | | | .77 | |
| Total from investment operations | | | .85 | |
| Net asset value, end of period | | | $10.85 | |
| Total Return(c): | | | 8.50% | |
| |
| Ratios/Supplemental Data: | | | |
| Net assets, end of period (000) | | | $11 | |
| Average net assets (000) | | | $10 | |
| Ratios to average net assets(d): | | | | |
| Expenses after waivers and/or expense reimbursement | | | .05% | (e) |
| Expenses before waivers and/or expense reimbursement | | | 246.10% | (e) |
| Net investment income (loss) | | | 1.19% | (e) |
| Portfolio turnover rate | | | 13% | (f) |
| (a) | Commencement of operations. |
| (b) | Calculated based on average shares outstanding during the period. |
| (c) | Total return is calculated assuming a purchase of a share on the first day and a sale on the last day of each period reported and includes reinvestment of dividends and distributions, if any. Total returns may reflect adjustments to conform to generally accepted accounting principles. Total returns for periods less than one full year are not annualized. |
| (d) | Does not include expenses of the underlying funds in which the Fund invests. Expenses waived/reimbursed include those of underlying funds in which the Fund invests. Consequently, the amount waived/reimbursed may be greater than the expense ratio reflected in the financial highlights. |
See Notes to Financial Statements.
| | | | |
| Prudential Day One Funds | | | 195 | |
Prudential Day One 2035 Fund
Financial Highlights (continued)
| | | | |
| Class R6 Shares | | | |
| | | December 13,
2016(a)
through
July 31,
2017 | |
| Per Share Operating Performance(b): | | | | |
| Net Asset Value, Beginning of Period | | | $10.00 | |
| Income (loss) from investment operations: | | | | |
| Net investment income (loss) | | | .07 | |
| Net realized and unrealized gain (loss) on investment transactions | | | .80 | |
| Total from investment operations | | | .87 | |
| Net asset value, end of period | | | $10.87 | |
| Total Return(c): | | | 8.70% | |
| |
| Ratios/Supplemental Data: | | | |
| Net assets, end of period (000) | | | $6,889 | |
| Average net assets (000) | | | $1,284 | |
| Ratios to average net assets(d): | | | | |
| Expenses after waivers and/or expense reimbursement | | | (.16)% | (e) |
| Expenses before waivers and/or expense reimbursement | | | 14.16% | (e) |
| Net investment income (loss) | | | 1.03% | (e) |
| Portfolio turnover rate | | | 13% | (f) |
| (a) | Commencement of operations. |
| (b) | Calculated based on average shares outstanding during the period. |
| (c) | Total return is calculated assuming a purchase of a share on the first day and a sale on the last day of each period reported and includes reinvestment of dividends and distributions, if any. Total returns may reflect adjustments to conform to generally accepted accounting principles. Total returns for periods less than one full year are not annualized. |
| (d) | Does not include expenses of the underlying funds in which the Fund invests. Expenses waived/reimbursed include those of underlying funds in which the Fund invests. Consequently, the amount waived/reimbursed may be greater than the expense ratio reflected in the financial highlights. |
See Notes to Financial Statements.
Prudential Day One 2040 Fund
Financial Highlights
| | | | |
| Class R1 Shares | | | |
| | | December 13,
2016(a)
through
July 31,
2017 | |
| Per Share Operating Performance(b): | | | | |
| Net Asset Value, Beginning of Period | | | $10.00 | |
| Income (loss) from investment operations: | | | | |
| Net investment income (loss) | | | .03 | |
| Net realized and unrealized gain (loss) on investment transactions | | | .87 | |
| Total from investment operations | | | .90 | |
| Net asset value, end of period | | | $10.90 | |
| Total Return(c): | | | 9.00% | |
| |
| Ratios/Supplemental Data: | | | |
| Net assets, end of period (000) | | | $11 | |
| Average net assets (000) | | | $10 | |
| Ratios to average net assets(d): | | | | |
| Expenses after waivers and/or expense reimbursement | | | .64% | (e) |
| Expenses before waivers and/or expense reimbursement | | | 226.80% | (e) |
| Net investment income (loss) | | | .46% | (e) |
| Portfolio turnover rate | | | 27% | (f) |
| (a) | Commencement of operations. |
| (b) | Calculated based on average shares outstanding during the period. |
| (c) | Total return is calculated assuming a purchase of a share on the first day and a sale on the last day of each period reported and includes reinvestment of dividends and distributions, if any. Total returns may reflect adjustments to conform to generally accepted accounting principles. Total returns for periods less than one full year are not annualized. |
| (d) | Does not include expenses of the underlying funds in which the Fund invests. Expenses waived/reimbursed include those of underlying funds in which the Fund invests. Consequently, the amount waived/reimbursed may be greater than the expense ratio reflected in the financial highlights. |
See Notes to Financial Statements.
| | | | |
| Prudential Day One Funds | | | 197 | |
Prudential Day One 2040 Fund
Financial Highlights (continued)
| | | | |
| Class R2 Shares | | | |
| | | December 13,
2016(a)
through
July 31,
2017 | |
| Per Share Operating Performance(b): | | | | |
| Net Asset Value, Beginning of Period | | | $10.00 | |
| Income (loss) from investment operations: | | | | |
| Net investment income (loss) | | | .05 | |
| Net realized and unrealized gain (loss) on investment transactions | | | .87 | |
| Total from investment operations | | | .92 | |
| Net asset value, end of period | | | $10.92 | |
| Total Return(c): | | | 9.20% | |
| |
| Ratios/Supplemental Data: | | | |
| Net assets, end of period (000) | | | $12 | |
| Average net assets (000) | | | $11 | |
| Ratios to average net assets(d): | | | | |
| Expenses after waivers and/or expense reimbursement | | | .39% | (e) |
| Expenses before waivers and/or expense reimbursement | | | 219.37% | (e) |
| Net investment income (loss) | | | .69% | (e) |
| Portfolio turnover rate | | | 27% | (f) |
| (a) | Commencement of operations. |
| (b) | Calculated based on average shares outstanding during the period. |
| (c) | Total return is calculated assuming a purchase of a share on the first day and a sale on the last day of each period reported and includes reinvestment of dividends and distributions, if any. Total returns may reflect adjustments to conform to generally accepted accounting principles. Total returns for periods less than one full year are not annualized. |
| (d) | Does not include expenses of the underlying funds in which the Fund invests. Expenses waived/reimbursed include those of underlying funds in which the Fund invests. Consequently, the amount waived/reimbursed may be greater than the expense ratio reflected in the financial highlights. |
See Notes to Financial Statements.
| | | | |
| Class R3 Shares | | | |
| | | December 13,
2016(a)
through
July 31,
2017 | |
| Per Share Operating Performance(b): | | | | |
| Net Asset Value, Beginning of Period | | | $10.00 | |
| Income (loss) from investment operations: | | | | |
| Net investment income (loss) | | | .06 | |
| Net realized and unrealized gain (loss) on investment transactions | | | .87 | |
| Total from investment operations | | | .93 | |
| Net asset value, end of period | | | $10.93 | |
| Total Return(c): | | | 9.30% | |
| |
| Ratios/Supplemental Data: | | | |
| Net assets, end of period (000) | | | $11 | |
| Average net assets (000) | | | $10 | |
| Ratios to average net assets(d): | | | | |
| Expenses after waivers and/or expense reimbursement | | | .24% | (e) |
| Expenses before waivers and/or expense reimbursement | | | 226.24% | (e) |
| Net investment income (loss) | | | .86% | (e) |
| Portfolio turnover rate | | | 27% | (f) |
| (a) | Commencement of operations. |
| (b) | Calculated based on average shares outstanding during the period. |
| (c) | Total return is calculated assuming a purchase of a share on the first day and a sale on the last day of each period reported and includes reinvestment of dividends and distributions, if any. Total returns may reflect adjustments to conform to generally accepted accounting principles. Total returns for periods less than one full year are not annualized. |
| (d) | Does not include expenses of the underlying funds in which the Fund invests. Expenses waived/reimbursed include those of underlying funds in which the Fund invests. Consequently, the amount waived/reimbursed may be greater than the expense ratio reflected in the financial highlights. |
See Notes to Financial Statements.
| | | | |
| Prudential Day One Funds | | | 199 | |
Prudential Day One 2040 Fund
Financial Highlights (continued)
| | | | |
| Class R4 Shares | | | |
| | | December 13,
2016(a)
through
July 31,
2017 | |
| Per Share Operating Performance(b): | | | | |
| Net Asset Value, Beginning of Period | | | $10.00 | |
| Income (loss) from investment operations: | | | | |
| Net investment income (loss) | | | .03 | |
| Net realized and unrealized gain (loss) on investment transactions | | | .91 | |
| Total from investment operations | | | .94 | |
| Net asset value, end of period | | | $10.94 | |
| Total Return(c): | | | 9.40% | |
| |
| Ratios/Supplemental Data: | | | |
| Net assets, end of period (000) | | | $115 | |
| Average net assets (000) | | | $71 | |
| Ratios to average net assets(d): | | | | |
| Expenses after waivers and/or expense reimbursement | | | .13% | (e) |
| Expenses before waivers and/or expense reimbursement | | | 81.65% | (e) |
| Net investment income (loss) | | | .52% | (e) |
| Portfolio turnover rate | | | 27% | (f) |
| (a) | Commencement of operations. |
| (b) | Calculated based on average shares outstanding during the period. |
| (c) | Total return is calculated assuming a purchase of a share on the first day and a sale on the last day of each period reported and includes reinvestment of dividends and distributions, if any. Total returns may reflect adjustments to conform to generally accepted accounting principles. Total returns for periods less than one full year are not annualized. |
| (d) | Does not include expenses of the underlying funds in which the Fund invests. Expenses waived/reimbursed include those of underlying funds in which the Fund invests. Consequently, the amount waived/reimbursed may be greater than the expense ratio reflected in the financial highlights. |
See Notes to Financial Statements.
| | | | |
| Class R5 Shares | | | |
| | | December 13,
2016(a)
through
July 31,
2017 | |
| Per Share Operating Performance(b): | | | | |
| Net Asset Value, Beginning of Period | | | $10.00 | |
| Income (loss) from investment operations: | | | | |
| Net investment income (loss) | | | .07 | |
| Net realized and unrealized gain (loss) on investment transactions | | | .88 | |
| Total from investment operations | | | .95 | |
| Net asset value, end of period | | | $10.95 | |
| Total Return(c): | | | 9.50% | |
| |
| Ratios/Supplemental Data: | | | |
| Net assets, end of period (000) | | | $11 | |
| Average net assets (000) | | | $10 | |
| Ratios to average net assets(d): | | | | |
| Expenses after waivers and/or expense reimbursement | | | .03% | (e) |
| Expenses before waivers and/or expense reimbursement | | | 225.96% | (e) |
| Net investment income (loss) | | | 1.07% | (e) |
| Portfolio turnover rate | | | 27% | (f) |
| (a) | Commencement of operations. |
| (b) | Calculated based on average shares outstanding during the period. |
| (c) | Total return is calculated assuming a purchase of a share on the first day and a sale on the last day of each period reported and includes reinvestment of dividends and distributions, if any. Total returns may reflect adjustments to conform to generally accepted accounting principles. Total returns for periods less than one full year are not annualized. |
| (d) | Does not include expenses of the underlying funds in which the Fund invests. Expenses waived/reimbursed include those of underlying funds in which the Fund invests. Consequently, the amount waived/reimbursed may be greater than the expense ratio reflected in the financial highlights. |
See Notes to Financial Statements.
| | | | |
| Prudential Day One Funds | | | 201 | |
Prudential Day One 2040 Fund
Financial Highlights (continued)
| | | | |
| Class R6 Shares | | | |
| | | December 13,
2016(a)
through
July 31,
2017 | |
| Per Share Operating Performance(b): | | | | |
| Net Asset Value, Beginning of Period | | | $10.00 | |
| Income (loss) from investment operations: | | | | |
| Net investment income (loss) | | | .06 | |
| Net realized and unrealized gain (loss) on investment transactions | | | .90 | |
| Total from investment operations | | | .96 | |
| Net asset value, end of period | | | $10.96 | |
| Total Return(c): | | | 9.60% | |
| |
| Ratios/Supplemental Data: | | | |
| Net assets, end of period (000) | | | $5,693 | |
| Average net assets (000) | | | $1,375 | |
| Ratios to average net assets(d): | | | | |
| Expenses after waivers and/or expense reimbursement | | | (.17)% | (e) |
| Expenses before waivers and/or expense reimbursement | | | 13.42% | (e) |
| Net investment income (loss) | | | .85% | (e) |
| Portfolio turnover rate | | | 27% | (f) |
| (a) | Commencement of operations. |
| (b) | Calculated based on average shares outstanding during the period. |
| (c) | Total return is calculated assuming a purchase of a share on the first day and a sale on the last day of each period reported and includes reinvestment of dividends and distributions, if any. Total returns may reflect adjustments to conform to generally accepted accounting principles. Total returns for periods less than one full year are not annualized. |
| (d) | Does not include expenses of the underlying funds in which the Fund invests. Expenses waived/reimbursed include those of underlying funds in which the Fund invests. Consequently, the amount waived/reimbursed may be greater than the expense ratio reflected in the financial highlights. |
See Notes to Financial Statements.
Prudential Day One 2045 Fund
Financial Highlights
| | | | |
| Class R1 Shares | | | |
| | | December 13,
2016(a)
through
July 31,
2017 | |
| Per Share Operating Performance(b): | | | | |
| Net Asset Value, Beginning of Period | | | $10.00 | |
| Income (loss) from investment operations: | | | | |
| Net investment income (loss) | | | .03 | |
| Net realized and unrealized gain (loss) on investment transactions | | | .94 | |
| Total from investment operations | | | .97 | |
| Net asset value, end of period | | | $10.97 | |
| Total Return(c): | | | 9.70% | |
| |
| Ratios/Supplemental Data: | | | |
| Net assets, end of period (000) | | | $11 | |
| Average net assets (000) | | | $10 | |
| Ratios to average net assets(d): | | | | |
| Expenses after waivers and/or expense reimbursement | | | .64% | (e) |
| Expenses before waivers and/or expense reimbursement | | | 218.87% | (e) |
| Net investment income (loss) | | | .39% | (e) |
| Portfolio turnover rate | | | 21% | (f) |
| (a) | Commencement of operations. |
| (b) | Calculated based on average shares outstanding during the period. |
| (c) | Total return is calculated assuming a purchase of a share on the first day and a sale on the last day of each period reported and includes reinvestment of dividends and distributions, if any. Total returns may reflect adjustments to conform to generally accepted accounting principles. Total returns for periods less than one full year are not annualized. |
| (d) | Does not include expenses of the underlying funds in which the Fund invests. Expenses waived/reimbursed include those of underlying funds in which the Fund invests. Consequently, the amount waived/reimbursed may be greater than the expense ratio reflected in the financial highlights. |
See Notes to Financial Statements.
| | | | |
| Prudential Day One Funds | | | 203 | |
Prudential Day One 2045 Fund
Financial Highlights (continued)
| | | | |
| Class R2 Shares | | | |
| | | December 13,
2016(a)
through
July 31,
2017 | |
| Per Share Operating Performance(b): | | | | |
| Net Asset Value, Beginning of Period | | | $10.00 | |
| Income (loss) from investment operations: | | | | |
| Net investment income (loss) | | | .04 | |
| Net realized and unrealized gain (loss) on investment transactions | | | .94 | |
| Total from investment operations | | | .98 | |
| Net asset value, end of period | | | $10.98 | |
| Total Return(c): | | | 9.80% | |
| |
| Ratios/Supplemental Data: | | | |
| Net assets, end of period (000) | | | $12 | |
| Average net assets (000) | | | $11 | |
| Ratios to average net assets(d): | | | | |
| Expenses after waivers and/or expense reimbursement | | | .39% | (e) |
| Expenses before waivers and/or expense reimbursement | | | 216.07% | (e) |
| Net investment income (loss) | | | .63% | (e) |
| Portfolio turnover rate | | | 21% | (f) |
| (a) | Commencement of operations. |
| (b) | Calculated based on average shares outstanding during the period. |
| (c) | Total return is calculated assuming a purchase of a share on the first day and a sale on the last day of each period reported and includes reinvestment of dividends and distributions, if any. Total returns may reflect adjustments to conform to generally accepted accounting principles. Total returns for periods less than one full year are not annualized. |
| (d) | Does not include expenses of the underlying funds in which the Fund invests. Expenses waived/reimbursed include those of underlying funds in which the Fund invests. Consequently, the amount waived/reimbursed may be greater than the expense ratio reflected in the financial highlights. |
See Notes to Financial Statements.
| | | | |
| Class R3 Shares | | | |
| | | December 13,
2016(a)
through
July 31,
2017 | |
| Per Share Operating Performance(b): | | | | |
| Net Asset Value, Beginning of Period | | | $10.00 | |
| Income (loss) from investment operations: | | | | |
| Net investment income (loss) | | | .03 | |
| Net realized and unrealized gain (loss) on investment transactions | | | .96 | |
| Total from investment operations | | | .99 | |
| Net asset value, end of period | | | $10.99 | |
| Total Return(c): | | | 9.90% | |
| |
| Ratios/Supplemental Data: | | | |
| Net assets, end of period (000) | | | $3,812 | |
| Average net assets (000) | | | $76 | |
| Ratios to average net assets(d): | | | | |
| Expenses after waivers and/or expense reimbursement | | | .09% | (e) |
| Expenses before waivers and/or expense reimbursement | | | 42.49% | (e) |
| Net investment income (loss) | | | .38% | (e) |
| Portfolio turnover rate | | | 21% | (f) |
| (a) | Commencement of operations. |
| (b) | Calculated based on average shares outstanding during the period. |
| (c) | Total return is calculated assuming a purchase of a share on the first day and a sale on the last day of each period reported and includes reinvestment of dividends and distributions, if any. Total returns may reflect adjustments to conform to generally accepted accounting principles. Total returns for periods less than one full year are not annualized. |
| (d) | Does not include expenses of the underlying funds in which the Fund invests. Expenses waived/reimbursed include those of underlying funds in which the Fund invests. Consequently, the amount waived/reimbursed may be greater than the expense ratio reflected in the financial highlights. |
See Notes to Financial Statements.
| | | | |
| Prudential Day One Funds | | | 205 | |
Prudential Day One 2045 Fund
Financial Highlights (continued)
| | | | |
| Class R4 Shares | | | |
| | | December 13,
2016(a)
through
July 31,
2017 | |
| Per Share Operating Performance(b): | | | | |
| Net Asset Value, Beginning of Period | | | $10.00 | |
| Income (loss) from investment operations: | | | | |
| Net investment income (loss) | | | .03 | |
| Net realized and unrealized gain (loss) on investment transactions | | | .97 | |
| Total from investment operations | | | 1.00 | |
| Net asset value, end of period | | | $11.00 | |
| Total Return(c): | | | 10.00% | |
| |
| Ratios/Supplemental Data: | | | |
| Net assets, end of period (000) | | | $247 | |
| Average net assets (000) | | | $142 | |
| Ratios to average net assets(d): | | | | |
| Expenses after waivers and/or expense reimbursement | | | .12% | (e) |
| Expenses before waivers and/or expense reimbursement | | | 59.08% | (e) |
| Net investment income (loss) | | | .38% | (e) |
| Portfolio turnover rate | | | 21% | (f) |
| (a) | Commencement of operations. |
| (b) | Calculated based on average shares outstanding during the period. |
| (c) | Total return is calculated assuming a purchase of a share on the first day and a sale on the last day of each period reported and includes reinvestment of dividends and distributions, if any. Total returns may reflect adjustments to conform to generally accepted accounting principles. Total returns for periods less than one full year are not annualized. |
| (d) | Does not include expenses of the underlying funds in which the Fund invests. Expenses waived/reimbursed include those of underlying funds in which the Fund invests. Consequently, the amount waived/reimbursed may be greater than the expense ratio reflected in the financial highlights. |
See Notes to Financial Statements.
| | | | |
| Class R5 Shares | | | |
| | | December 13,
2016(a)
through
July 31,
2017 | |
| Per Share Operating Performance(b): | | | | |
| Net Asset Value, Beginning of Period | | | $10.00 | |
| Income (loss) from investment operations: | | | | |
| Net investment income (loss) | | | .07 | |
| Net realized and unrealized gain (loss) on investment transactions | | | .94 | |
| Total from investment operations | | | 1.01 | |
| Net asset value, end of period | | | $11.01 | |
| Total Return(c): | | | 10.10% | |
| |
| Ratios/Supplemental Data: | | | |
| Net assets, end of period (000) | | | $12 | |
| Average net assets (000) | | | $11 | |
| Ratios to average net assets(d): | | | | |
| Expenses after waivers and/or expense reimbursement | | | .04% | (e) |
| Expenses before waivers and/or expense reimbursement | | | 216.62% | (e) |
| Net investment income (loss) | | | .99% | (e) |
| Portfolio turnover rate | | | 21% | (f) |
| (a) | Commencement of operations. |
| (b) | Calculated based on average shares outstanding during the period. |
| (c) | Total return is calculated assuming a purchase of a share on the first day and a sale on the last day of each period reported and includes reinvestment of dividends and distributions, if any. Total returns may reflect adjustments to conform to generally accepted accounting principles. Total returns for periods less than one full year are not annualized. |
| (d) | Does not include expenses of the underlying funds in which the Fund invests. Expenses waived/reimbursed include those of underlying funds in which the Fund invests. Consequently, the amount waived/reimbursed may be greater than the expense ratio reflected in the financial highlights. |
See Notes to Financial Statements.
| | | | |
| Prudential Day One Funds | | | 207 | |
Prudential Day One 2045 Fund
Financial Highlights (continued)
| | | | |
| Class R6 Shares | | | |
| | | December 13,
2016(a)
through
July 31,
2017 | |
| Per Share Operating Performance(b): | | | | |
| Net Asset Value, Beginning of Period | | | $10.00 | |
| Income (loss) from investment operations: | | | | |
| Net investment income (loss) | | | .05 | |
| Net realized and unrealized gain (loss) on investment transactions | | | .98 | |
| Total from investment operations | | | 1.03 | |
| Net asset value, end of period | | | $11.03 | |
| Total Return(c): | | | 10.30% | |
| |
| Ratios/Supplemental Data: | | | |
| Net assets, end of period (000) | | | $3,451 | |
| Average net assets (000) | | | $665 | |
| Ratios to average net assets(d): | | | | |
| Expenses after waivers and/or expense reimbursement | | | (.16)% | (e) |
| Expenses before waivers and/or expense reimbursement | | | 22.86% | (e) |
| Net investment income (loss) | | | .80% | (e) |
| Portfolio turnover rate | | | 21% | (f) |
| (a) | Commencement of operations. |
| (b) | Calculated based on average shares outstanding during the period. |
| (c) | Total return is calculated assuming a purchase of a share on the first day and a sale on the last day of each period reported and includes reinvestment of dividends and distributions, if any. Total returns may reflect adjustments to conform to generally accepted accounting principles. Total returns for periods less than one full year are not annualized. |
| (d) | Does not include expenses of the underlying funds in which the Fund invests. Expenses waived/reimbursed include those of underlying funds in which the Fund invests. Consequently, the amount waived/reimbursed may be greater than the expense ratio reflected in the financial highlights. |
See Notes to Financial Statements.
Prudential Day One 2050 Fund
Financial Highlights
| | | | |
| Class R1 Shares | | | |
| | | December 13,
2016(a)
through
July 31,
2017 | |
| Per Share Operating Performance(b): | | | | |
| Net Asset Value, Beginning of Period | | | $10.00 | |
| Income (loss) from investment operations: | | | | |
| Net investment income (loss) | | | .01 | |
| Net realized and unrealized gain (loss) on investment transactions | | | .94 | |
| Total from investment operations | | | .95 | |
| Net asset value, end of period | | | $10.95 | |
| Total Return(c): | | | 9.50% | |
| |
| Ratios/Supplemental Data: | | | |
| Net assets, end of period (000) | | | $98 | |
| Average net assets (000) | | | $15 | |
| Ratios to average net assets(d): | | | | |
| Expenses after waivers and/or expense reimbursement | | | .59% | (e) |
| Expenses before waivers and/or expense reimbursement | | | 192.34% | (e) |
| Net investment income (loss) | | | .14% | (e) |
| Portfolio turnover rate | | | 18% | (f) |
| (a) | Commencement of operations. |
| (b) | Calculated based on average shares outstanding during the period. |
| (c) | Total return is calculated assuming a purchase of a share on the first day and a sale on the last day of each period reported and includes reinvestment of dividends and distributions, if any. Total returns may reflect adjustments to conform to generally accepted accounting principles. Total returns for periods less than one full year are not annualized. |
| (d) | Does not include expenses of the underlying funds in which the Fund invests. Expenses waived/reimbursed include those of underlying funds in which the Fund invests. Consequently, the amount waived/reimbursed may be greater than the expense ratio reflected in the financial highlights. |
See Notes to Financial Statements.
| | | | |
| Prudential Day One Funds | | | 209 | |
Prudential Day One 2050 Fund
Financial Highlights (continued)
| | | | |
| Class R2 Shares | | | |
| | | December 13,
2016(a)
through
July 31,
2017 | |
| Per Share Operating Performance(b): | | | | |
| Net Asset Value, Beginning of Period | | | $10.00 | |
| Income (loss) from investment operations: | | | | |
| Net investment income (loss) | | | .04 | |
| Net realized and unrealized gain (loss) on investment transactions | | | .92 | |
| Total from investment operations | | | .96 | |
| Net asset value, end of period | | | $10.96 | |
| Total Return(c): | | | 9.60% | |
| |
| Ratios/Supplemental Data: | | | |
| Net assets, end of period (000) | | | $18 | |
| Average net assets (000) | | | $11 | |
| Ratios to average net assets(d): | | | | |
| Expenses after waivers and/or expense reimbursement | | | .38% | (e) |
| Expenses before waivers and/or expense reimbursement | | | 257.36% | (e) |
| Net investment income (loss) | | | .54% | (e) |
| Portfolio turnover rate | | | 18% | (f) |
| (a) | Commencement of operations. |
| (b) | Calculated based on average shares outstanding during the period. |
| (c) | Total return is calculated assuming a purchase of a share on the first day and a sale on the last day of each period reported and includes reinvestment of dividends and distributions, if any. Total returns may reflect adjustments to conform to generally accepted accounting principles. Total returns for periods less than one full year are not annualized. |
| (d) | Does not include expenses of the underlying funds in which the Fund invests. Expenses waived/reimbursed include those of underlying funds in which the Fund invests. Consequently, the amount waived/reimbursed may be greater than the expense ratio reflected in the financial highlights. |
See Notes to Financial Statements.
| | | | |
| Class R3 Shares | | | |
| | | December 13,
2016(a)
through
July 31,
2017 | |
| Per Share Operating Performance(b): | | | | |
| Net Asset Value, Beginning of Period | | | $10.00 | |
| Income (loss) from investment operations: | | | | |
| Net investment income (loss) | | | .05 | |
| Net realized and unrealized gain (loss) on investment transactions | | | .92 | |
| Total from investment operations | | | .97 | |
| Net asset value, end of period | | | $10.97 | |
| Total Return(c): | | | 9.70% | |
| |
| Ratios/Supplemental Data: | | | |
| Net assets, end of period (000) | | | $11 | |
| Average net assets (000) | | | $10 | |
| Ratios to average net assets(d): | | | | |
| Expenses after waivers and/or expense reimbursement | | | .23% | (e) |
| Expenses before waivers and/or expense reimbursement | | | 267.71% | (e) |
| Net investment income (loss) | | | .71% | (e) |
| Portfolio turnover rate | | | 18% | (f) |
| (a) | Commencement of operations. |
| (b) | Calculated based on average shares outstanding during the period. |
| (c) | Total return is calculated assuming a purchase of a share on the first day and a sale on the last day of each period reported and includes reinvestment of dividends and distributions, if any. Total returns may reflect adjustments to conform to generally accepted accounting principles. Total returns for periods less than one full year are not annualized. |
| (d) | Does not include expenses of the underlying funds in which the Fund invests. Expenses waived/reimbursed include those of underlying funds in which the Fund invests. Consequently, the amount waived/reimbursed may be greater than the expense ratio reflected in the financial highlights. |
See Notes to Financial Statements.
| | | | |
| Prudential Day One Funds | | | 211 | |
Prudential Day One 2050 Fund
Financial Highlights (continued)
| | | | |
| Class R4 Shares | | | |
| | | December 13,
2016(a)
through
July 31,
2017 | |
| Per Share Operating Performance(b): | | | | |
| Net Asset Value, Beginning of Period | | | $10.00 | |
| Income (loss) from investment operations: | | | | |
| Net investment income (loss) | | | .03 | |
| Net realized and unrealized gain (loss) on investment transactions | | | .95 | |
| Total from investment operations | | | .98 | |
| Net asset value, end of period | | | $10.98 | |
| Total Return(c): | | | 9.80% | |
| |
| Ratios/Supplemental Data: | | | |
| Net assets, end of period (000) | | | $75 | |
| Average net assets (000) | | | $45 | |
| Ratios to average net assets(d): | | | | |
| Expenses after waivers and/or expense reimbursement | | | .11% | (e) |
| Expenses before waivers and/or expense reimbursement | | | 141.42% | (e) |
| Net investment income (loss) | | | .39% | (e) |
| Portfolio turnover rate | | | 18% | (f) |
| (a) | Commencement of operations. |
| (b) | Calculated based on average shares outstanding during the period. |
| (c) | Total return is calculated assuming a purchase of a share on the first day and a sale on the last day of each period reported and includes reinvestment of dividends and distributions, if any. Total returns may reflect adjustments to conform to generally accepted accounting principles. Total returns for periods less than one full year are not annualized. |
| (d) | Does not include expenses of the underlying funds in which the Fund invests. Expenses waived/reimbursed include those of underlying funds in which the Fund invests. Consequently, the amount waived/reimbursed may be greater than the expense ratio reflected in the financial highlights. |
See Notes to Financial Statements.
| | | | |
| Class R5 Shares | | | |
| | | December 13,
2016(a)
through
July 31,
2017 | |
| Per Share Operating Performance(b): | | | | |
| Net Asset Value, Beginning of Period | | | $10.00 | |
| Income (loss) from investment operations: | | | | |
| Net investment income (loss) | | | .06 | |
| Net realized and unrealized gain (loss) on investment transactions | | | .93 | |
| Total from investment operations | | | .99 | |
| Net asset value, end of period | | | $10.99 | |
| Total Return(c): | | | 9.90% | |
| |
| Ratios/Supplemental Data: | | | |
| Net assets, end of period (000) | | | $11 | |
| Average net assets (000) | | | $10 | |
| Ratios to average net assets(d): | | | | |
| Expenses after waivers and/or expense reimbursement | | | .02% | (e) |
| Expenses before waivers and/or expense reimbursement | | | 267.38% | (e) |
| Net investment income (loss) | | | .92% | (e) |
| Portfolio turnover rate | | | 18% | (f) |
| (a) | Commencement of operations. |
| (b) | Calculated based on average shares outstanding during the period. |
| (c) | Total return is calculated assuming a purchase of a share on the first day and a sale on the last day of each period reported and includes reinvestment of dividends and distributions, if any. Total returns may reflect adjustments to conform to generally accepted accounting principles. Total returns for periods less than one full year are not annualized. |
| (d) | Does not include expenses of the underlying funds in which the Fund invests. Expenses waived/reimbursed include those of underlying funds in which the Fund invests. Consequently, the amount waived/reimbursed may be greater than the expense ratio reflected in the financial highlights. |
See Notes to Financial Statements.
| | | | |
| Prudential Day One Funds | | | 213 | |
Prudential Day One 2050 Fund
Financial Highlights (continued)
| | | | |
| Class R6 Shares | | | |
| | | December 13,
2016(a)
through
July 31,
2017 | |
| Per Share Operating Performance(b): | | | | |
| Net Asset Value, Beginning of Period | | | $10.00 | |
| Income (loss) from investment operations: | | | | |
| Net investment income (loss) | | | .06 | |
| Net realized and unrealized gain (loss) on investment transactions | | | .94 | |
| Total from investment operations | | | 1.00 | |
| Net asset value, end of period | | | $11.00 | |
| Total Return(c): | | | 10.00% | |
| |
| Ratios/Supplemental Data: | | | |
| Net assets, end of period (000) | | | $2,013 | |
| Average net assets (000) | | | $318 | |
| Ratios to average net assets(d): | | | | |
| Expenses after waivers and/or expense reimbursement | | | (.19)% | (e) |
| Expenses before waivers and/or expense reimbursement | | | 49.96% | (e) |
| Net investment income (loss) | | | .83% | (e) |
| Portfolio turnover rate | | | 18% | (f) |
| (a) | Commencement of operations. |
| (b) | Calculated based on average shares outstanding during the period. |
| (c) | Total return is calculated assuming a purchase of a share on the first day and a sale on the last day of each period reported and includes reinvestment of dividends and distributions, if any. Total returns may reflect adjustments to conform to generally accepted accounting principles. Total returns for periods less than one full year are not annualized. |
| (d) | Does not include expenses of the underlying funds in which the Fund invests. Expenses waived/reimbursed include those of underlying funds in which the Fund invests. Consequently, the amount waived/reimbursed may be greater than the expense ratio reflected in the financial highlights. |
See Notes to Financial Statements.
Prudential Day One 2055 Fund
Financial Highlights
| | | | |
| Class R1 Shares | |
| | | December 13,
2016(a)
through
July 31,
2017 | |
| Per Share Operating Performance(b): | | | | |
| Net Asset Value, Beginning of Period | | | $10.00 | |
| Income (loss) from investment operations: | | | | |
| Net investment income (loss) | | | .02 | |
| Net realized and unrealized gain (loss) on investment transactions | | | 1.05 | |
| Total from investment operations | | | 1.07 | |
| Net asset value, end of period | | | $11.07 | |
| Total Return(c) | | | 10.70% | |
| |
| Ratios/Supplemental Data: | | | |
| Net assets, end of period (000) | | | $11 | |
| Average net assets (000) | | | $10 | |
| Ratios to average net assets(d): | | | | |
| Expenses after waivers and/or expense reimbursement | | | .64% | (e) |
| Expenses before waivers and/or expense reimbursement | | | 257.86% | (e) |
| Net investment income (loss) | | | .23% | (e) |
| Portfolio turnover rate | | | 4% | (f) |
| (a) | Commencement of operations. |
| (b) | Calculated based on average shares outstanding during the period. |
| (c) | Total return is calculated assuming a purchase of a share on the first day and a sale on the last day of each period reported and includes reinvestment of dividends and distributions, if any. Total returns may reflect adjustments to conform to generally accepted accounting principles. Total returns for periods less than one full year are not annualized. |
| (d) | Does not include expenses of the underlying funds in which the Fund invests. Expenses waived/reimbursed include those of underlying funds in which the Fund invests. Consequently, the amount waived/reimbursed may be greater than the expense ratio reflected in the financial highlights. |
See Notes to Financial Statements.
| | | | |
| Prudential Day One Funds | | | 215 | |
Prudential Day One 2055 Fund
Financial Highlights (continued)
| | | | |
| Class R2 Shares | |
| | | December 13,
2016(a)
through
July 31,
2017 | |
| Per Share Operating Performance(b): | | | | |
| Net Asset Value, Beginning of Period | | | $10.00 | |
| Income (loss) from investment operations: | | | | |
| Net investment income (loss) | | | .03 | |
| Net realized and unrealized gain (loss) on investment transactions | | | 1.06 | |
| Total from investment operations | | | 1.09 | |
| Net asset value, end of period | | | $11.09 | |
| Total Return(c) | | | 10.90% | |
| |
| Ratios/Supplemental Data: | | | |
| Net assets, end of period (000) | | | $17 | |
| Average net assets (000) | | | $11 | |
| Ratios to average net assets(d): | | | | |
| Expenses after waivers and/or expense reimbursement | | | .38% | (e) |
| Expenses before waivers and/or expense reimbursement | | | 250.88% | (e) |
| Net investment income (loss) | | | .47% | (e) |
| Portfolio turnover rate | | | 4% | (f) |
| (a) | Commencement of operations. |
| (b) | Calculated based on average shares outstanding during the period. |
| (c) | Total return is calculated assuming a purchase of a share on the first day and a sale on the last day of each period reported and includes reinvestment of dividends and distributions, if any. Total returns may reflect adjustments to conform to generally accepted accounting principles. Total returns for periods less than one full year are not annualized. |
| (d) | Does not include expenses of the underlying funds in which the Fund invests. Expenses waived/reimbursed include those of underlying funds in which the Fund invests. Consequently, the amount waived/reimbursed may be greater than the expense ratio reflected in the financial highlights. |
See Notes to Financial Statements.
| | | | |
| Class R3 Shares | |
| | | December 13,
2016(a)
through
July 31,
2017 | |
| Per Share Operating Performance(b): | | | | |
| Net Asset Value, Beginning of Period | | | $10.00 | |
| Income (loss) from investment operations: | | | | |
| Net investment income (loss) | | | .02 | |
| Net realized and unrealized gain (loss) on investment transactions | | | 1.08 | |
| Total from investment operations | | | 1.10 | |
| Net asset value, end of period | | | $11.10 | |
| Total Return(c) | | | 11.00% | |
| |
| Ratios/Supplemental Data: | | | |
| Net assets, end of period (000) | | | $1,795 | |
| Average net assets (000) | | | $41 | |
| Ratios to average net assets(d): | | | | |
| Expenses after waivers and/or expense reimbursement | | | .13% | (e) |
| Expenses before waivers and/or expense reimbursement | | | 93.88% | (e) |
| Net investment income (loss) | | | .25% | (e) |
| Portfolio turnover rate | | | 4% | (f) |
| (a) | Commencement of operations. |
| (b) | Calculated based on average shares outstanding during the period. |
| (c) | Total return is calculated assuming a purchase of a share on the first day and a sale on the last day of each period reported and includes reinvestment of dividends and distributions, if any. Total returns may reflect adjustments to conform to generally accepted accounting principles. Total returns for periods less than one full year are not annualized. |
| (d) | Does not include expenses of the underlying funds in which the Fund invests. Expenses waived/reimbursed include those of underlying funds in which the Fund invests. Consequently, the amount waived/reimbursed may be greater than the expense ratio reflected in the financial highlights. |
See Notes to Financial Statements.
| | | | |
| Prudential Day One Funds | | | 217 | |
Prudential Day One 2055 Fund
Financial Highlights (continued)
| | | | |
| Class R4 Shares | |
| | | December 13,
2016(a)
through
July 31,
2017 | |
| Per Share Operating Performance(b): | | | | |
| Net Asset Value, Beginning Of Period | | | $10.00 | |
| Income (loss) from investment operations: | | | | |
| Net investment income | | | .03 | |
| Net realized and unrealized gain (loss) on investment transactions | | | 1.08 | |
| Total from investment operations | | | 1.11 | |
| Net asset value, end of period | | | $11.11 | |
| Total Return(c) | | | 11.10% | |
| |
| Ratios/Supplemental Data: | | | |
| Net assets, end of period (000) | | | $45 | |
| Average net assets (000) | | | $25 | |
| Ratios to average net assets(d): | | | | |
| Expense after waivers and/or expense reimbursement | | | .13% | (e) |
| Expense before waivers and/or expense reimbursement | | | 166.78% | (e) |
| Net investment income (loss) | | | .41% | (e) |
| Portfolio turnover rate | | | 4% | (f) |
| (a) | Commencement of operations. |
| (b) | Calculated based on average shares outstanding during the period. |
| (c) | Total return is calculated assuming a purchase of a share on the first day and a sale on the last day of each period reported and includes reinvestment of dividends and distributions, if any. Total returns may reflect adjustments to conform to generally accepted accounting principles. Total returns for periods less than one full year are not annualized. |
| (d) | Does not include expenses of the underlying funds in which the Fund invests. Expenses waived/reimbursed include those of underlying funds in which the Fund invests. Consequently, the amount waived/reimbursed may be greater than the expense ratio reflected in the financial highlights. |
See Notes to Financial Statements.
| | | | |
| Class R5 Shares | |
| | | December 13,
2016(a) through
July 31, 2017 | |
| Per Share Operating Performance(b): | | | | |
| Net Asset Value, Beginning Of Period | | | $10.00 | |
| Income (loss) from investment operations: | | | | |
| Net investment income | | | .06 | |
| Net realized and unrealized gain (loss) on investment transactions | | | 1.06 | |
| Total from investment operations | | | 1.12 | |
| Net asset value, end of period | | | $11.12 | |
| Total Return(c) | | | 11.20% | |
| |
| Ratios/Supplemental Data: | | | |
| Net assets, end of period (000) | | | $11 | |
| Average net assets (000) | | | $10 | |
| Ratios to average net assets(d): | | | | |
| Expense after waivers and/or expense reimbursement | | | .03% | (e) |
| Expense before waivers and/or expense reimbursement | | | 257.05% | (e) |
| Net investment income (loss) | | | .84% | (e) |
| Portfolio turnover rate | | | 4% | (f) |
| (a) | Commencement of operations. |
| (b) | Calculated based on average shares outstanding during the period. |
| (c) | Total return is calculated assuming a purchase of a share on the first day and a sale on the last day of each period reported and includes reinvestment of dividends and distributions, if any. Total returns may reflect adjustments to conform to generally accepted accounting principles. Total returns for periods less than one full year are not annualized. |
| (d) | Does not include expenses of the underlying funds in which the Fund invests. Expenses waived/reimbursed include those of underlying funds in which the Fund invests. Consequently, the amount waived/reimbursed may be greater than the expense ratio reflected in the financial highlights. |
See Notes to Financial Statements.
| | | | |
| Prudential Day One Funds | | | 219 | |
Prudential Day One 2055 Fund
Financial Highlights (continued)
| | | | |
| Class R6 Shares | | | |
| | | December 13,
2016(a) through July 31, 2017 | |
| Per Share Operating Performance(b): | | | | |
| Net Asset Value, Beginning Of Period | | | $10.00 | |
| Income (loss) from investment operations: | | | | |
| Net investment income | | | .04 | |
| Net realized and unrealized gain (loss) on investment transactions | | | 1.09 | |
| Total from investment operations | | | 1.13 | |
| Net asset value, end of period | | | $11.13 | |
| Total Return(c) | | | 11.30% | |
| |
| Ratios/Supplemental Data: | | | |
| Net assets, end of period (000) | | | $950 | |
| Average net assets (000) | | | $287 | |
| Ratios to average net assets(d): | | | | |
| Expense after waivers and/or expense reimbursement | | | (.15)% | (e) |
| Expense before waivers and/or expense reimbursement | | | 60.80% | (e) |
| Net investment income (loss) | | | .53% | (e) |
| Portfolio turnover rate | | | 4% | (f) |
| (a) | Commencement of operations. |
| (b) | Calculated based on average shares outstanding during the period. |
| (c) | Total return is calculated assuming a purchase of a share on the first day and a sale on the last day of each period reported and includes reinvestment of dividends and distributions, if any. Total returns may reflect adjustments to conform to generally accepted accounting principles. Total returns for periods less than one full year are not annualized. |
| (d) | Does not include expenses of the underlying funds in which the Fund invests. Expenses waived/reimbursed include those of underlying funds in which the Fund invests. Consequently, the amount waived/reimbursed may be greater than the expense ratio reflected in the financial highlights. |
See Notes to Financial Statements.
Prudential Day One 2060 Fund
Financial Highlights
| | | | |
| Class R1 Shares | | | |
| | | December 13,
2016(a)
through
July 31,
2017 | |
| Per Share Operating Performance(b): | | | | |
| Net Asset Value, Beginning of Period | | | $10.00 | |
| Income (loss) from investment operations: | | | | |
| Net investment income (loss) | | | .01 | |
| Net realized and unrealized gain (loss) on investment transactions | | | 1.00 | |
| Total from investment operations | | | 1.01 | |
| Net asset value, end of period | | | $11.01 | |
| Total Return(c): | | | 10.10% | |
| |
| Ratios/Supplemental Data: | | | |
| Net assets, end of period (000) | | | $11 | |
| Average net assets (000) | | | $10 | |
| Ratios to average net assets(d): | | | | |
| Expenses after waivers and/or expense reimbursement | | | .63% | (e) |
| Expenses before waivers and/or expense reimbursement | | | 479.61% | (e) |
| Net investment income (loss) | | | .22% | (e) |
| Portfolio turnover rate | | | 18% | (f) |
| (a) | Commencement of operations. |
| (b) | Calculated based on average shares outstanding during the period. |
| (c) | Total return is calculated assuming a purchase of a share on the first day and a sale on the last day of each period reported and includes reinvestment of dividends and distributions, if any. Total returns may reflect adjustments to conform to generally accepted accounting principles. Total returns for periods less than one full year are not annualized. |
| (d) | Does not include expenses of the underlying funds in which the Fund invests. Expenses waived/reimbursed include those of underlying funds in which the Fund invests. Consequently, the amount waived/reimbursed may be greater than the expense ratio reflected in the financial highlights. |
See Notes to Financial Statements.
| | | | |
| Prudential Day One Funds | | | 221 | |
Prudential Day One 2060 Fund
Financial Highlights (continued)
| | | | |
| Class R2 Shares | | | |
| | | December 13,
2016(a)
through
July 31,
2017 | |
| Per Share Operating Performance(b): | | | | |
| Net Asset Value, Beginning of Period | | | $10.00 | |
| Income (loss) from investment operations: | | | | |
| Net investment income (loss) | | | .03 | |
| Net realized and unrealized gain (loss) on investment transactions | | | 1.00 | |
| Total from investment operations | | | 1.03 | |
| Net asset value, end of period | | | $11.03 | |
| Total Return(c): | | | 10.30% | |
| |
| Ratios/Supplemental Data: | | | |
| Net assets, end of period (000) | | | $11 | |
| Average net assets (000) | | | $10 | |
| Ratios to average net assets(d): | | | | |
| Expenses after waivers and/or expense reimbursement | | | .37% | (e) |
| Expenses before waivers and/or expense reimbursement | | | 479.48% | (e) |
| Net investment income (loss) | | | .47% | (e) |
| Portfolio turnover rate | | | 18% | (f) |
| (a) | Commencement of operations. |
| (b) | Calculated based on average shares outstanding during the period. |
| (c) | Total return is calculated assuming a purchase of a share on the first day and a sale on the last day of each period reported and includes reinvestment of dividends and distributions, if any. Total returns may reflect adjustments to conform to generally accepted accounting principles. Total returns for periods less than one full year are not annualized. |
| (d) | Does not include expenses of the underlying funds in which the Fund invests. Expenses waived/reimbursed include those of underlying funds in which the Fund invests. Consequently, the amount waived/reimbursed may be greater than the expense ratio reflected in the financial highlights. |
See Notes to Financial Statements.
| | | | |
| Class R3 Shares | | | |
| | | December 13,
2016(a)
through
July 31,
2017 | |
| Per Share Operating Performance(b): | | | | |
| Net Asset Value, Beginning of Period | | | $10.00 | |
| Income (loss) from investment operations: | | | | |
| Net investment income (loss) | | | .04 | |
| Net realized and unrealized gain (loss) on investment transactions | | | 1.00 | |
| Total from investment operations | | | 1.04 | |
| Net asset value, end of period | | | $11.04 | |
| Total Return(c): | | | 10.40% | |
| |
| Ratios/Supplemental Data: | | | |
| Net assets, end of period (000) | | | $11 | |
| Average net assets (000) | | | $10 | |
| Ratios to average net assets(d): | | | | |
| Expenses after waivers and/or expense reimbursement | | | .23% | (e) |
| Expenses before waivers and/or expense reimbursement | | | 479.19% | (e) |
| Net investment income (loss) | | | .61% | (e) |
| Portfolio turnover rate | | | 18% | (f) |
| (a) | Commencement of operations. |
| (b) | Calculated based on average shares outstanding during the period. |
| (c) | Total return is calculated assuming a purchase of a share on the first day and a sale on the last day of each period reported and includes reinvestment of dividends and distributions, if any. Total returns may reflect adjustments to conform to generally accepted accounting principles. Total returns for periods less than one full year are not annualized. |
| (d) | Does not include expenses of the underlying funds in which the Fund invests. Expenses waived/reimbursed include those of underlying funds in which the Fund invests. Consequently, the amount waived/reimbursed may be greater than the expense ratio reflected in the financial highlights. |
See Notes to Financial Statements.
| | | | |
| Prudential Day One Funds | | | 223 | |
Prudential Day One 2060 Fund
Financial Highlights (continued)
| | | | |
| Class R4 Shares | | | |
| | | December 13,
2016(a)
through
July 31,
2017 | |
| Per Share Operating Performance(b): | | | | |
| Net Asset Value, Beginning of Period | | | $10.00 | |
| Income (loss) from investment operations: | | | | |
| Net investment income (loss) | | | .05 | |
| Net realized and unrealized gain (loss) on investment transactions | | | .99 | |
| Total from investment operations | | | 1.04 | |
| Net asset value, end of period | | | $11.04 | |
| Total Return(c): | | | 10.40% | |
| |
| Ratios/Supplemental Data: | | | |
| Net assets, end of period (000) | | | $11 | |
| Average net assets (000) | | | $10 | |
| Ratios to average net assets(d): | | | | |
| Expenses after waivers and/or expense reimbursement | | | .12% | (e) |
| Expenses before waivers and/or expense reimbursement | | | 479.00% | (e) |
| Net investment income (loss) | | | .72% | (e) |
| Portfolio turnover rate | | | 18% | (f) |
| (a) | Commencement of operations. |
| (b) | Calculated based on average shares outstanding during the period. |
| (c) | Total return is calculated assuming a purchase of a share on the first day and a sale on the last day of each period reported and includes reinvestment of dividends and distributions, if any. Total returns may reflect adjustments to conform to generally accepted accounting principles. Total returns for periods less than one full year are not annualized. |
| (d) | Does not include expenses of the underlying funds in which the Fund invests. Expenses waived/reimbursed include those of underlying funds in which the Fund invests. Consequently, the amount waived/reimbursed may be greater than the expense ratio reflected in the financial highlights. |
See Notes to Financial Statements.
| | | | |
| Class R5 Shares | | | |
| | | December 13,
2016(a)
through
July 31,
2017 | |
| Per Share Operating Performance(b): | | | | |
| Net Asset Value, Beginning of Period | | | $10.00 | |
| Income (loss) from investment operations: | | | | |
| Net investment income (loss) | | | .05 | |
| Net realized and unrealized gain (loss) on investment transactions | | | 1.00 | |
| Total from investment operations | | | 1.05 | |
| Net asset value, end of period | | | $11.05 | |
| Total Return(c): | | | 10.50% | |
| |
| Ratios/Supplemental Data: | | | |
| Net assets, end of period (000) | | | $11 | |
| Average net assets (000) | | | $10 | |
| Ratios to average net assets(d): | | | | |
| Expenses after waivers and/or expense reimbursement | | | .02% | (e) |
| Expenses before waivers and/or expense reimbursement | | | 478.98% | (e) |
| Net investment income (loss) | | | .83% | (e) |
| Portfolio turnover rate | | | 18% | (f) |
| (a) | Commencement of operations. |
| (b) | Calculated based on average shares outstanding during the period. |
| (c) | Total return is calculated assuming a purchase of a share on the first day and a sale on the last day of each period reported and includes reinvestment of dividends and distributions, if any. Total returns may reflect adjustments to conform to generally accepted accounting principles. Total returns for periods less than one full year are not annualized. |
| (d) | Does not include expenses of the underlying funds in which the Fund invests. Expenses waived/reimbursed include those of underlying funds in which the Fund invests. Consequently, the amount waived/reimbursed may be greater than the expense ratio reflected in the financial highlights. |
See Notes to Financial Statements.
| | | | |
| Prudential Day One Funds | | | 225 | |
Prudential Day One 2060 Fund
Financial Highlights (continued)
| | | | |
| Class R6 Shares | | | |
| | | December 13,
2016(a)
through
July 31,
2017 | |
| Per Share Operating Performance(b): | | | | |
| Net Asset Value, Beginning of Period | | | $10.00 | |
| Income (loss) from investment operations: | | | | |
| Net investment income (loss) | | | .05 | |
| Net realized and unrealized gain (loss) on investment transactions | | | 1.01 | |
| Total from investment operations | | | 1.06 | |
| Net asset value, end of period | | | $11.06 | |
| Total Return(c): | | | 10.60% | |
| |
| Ratios/Supplemental Data: | | | |
| Net assets, end of period (000) | | | $52 | |
| Average net assets (000) | | | $19 | |
| Ratios to average net assets(d): | | | | |
| Expenses after waivers and/or expense reimbursement | | | (.15)%(e | ) |
| Expenses before waivers and/or expense reimbursement | | | 459.90%(e | ) |
| Net investment income (loss) | | | .79%(e | ) |
| Portfolio turnover rate | | | 18%(f | ) |
| (a) | Commencement of operations. |
| (b) | Calculated based on average shares outstanding during the period. |
| (c) | Total return is calculated assuming a purchase of a share on the first day and a sale on the last day of each period reported and includes reinvestment of dividends and distributions, if any. Total returns may reflect adjustments to conform to generally accepted accounting principles. Total returns for periods less than one full year are not annualized. |
| (d) | Does not include expenses of the underlying funds in which the Fund invests. Expenses waived/reimbursed include those of underlying funds in which the Fund invests. Consequently, the amount waived/reimbursed may be greater than the expense ratio reflected in the financial highlights. |
See Notes to Financial Statements.
Report of Independent Registered Public Accounting Firm
The Board of Trustees and Shareholders
Prudential Investment Portfolios 5:
We have audited the accompanying statements of assets and liabilities of Prudential Day One Income Fund, Prudential Day One 2010 Fund, Prudential Day One 2015 Fund, Prudential Day One 2020 Fund, Prudential Day One 2025 Fund, Prudential Day One 2030 Fund, Prudential Day One 2035 Fund, Prudential Day One 2040 Fund, Prudential Day One 2045 Fund, Prudential Day One 2050 Fund, Prudential Day One 2055 Fund, Prudential Day One 2060 (the “Funds”), each a series of Prudential Investment Portfolios 5, including their respective schedules of investments, as of July 31, 2017, and the related statements of operations, changes in net assets, and the financial highlights for the period from December 13, 2016 (commencement of operations) to July 31, 2017. These financial statements and financial highlights are the responsibility of the Funds’ management. Our responsibility is to express an opinion on these financial statements and financial highlights based on our audits.
We conducted our audits in accordance with the standards of the Public Company Accounting Oversight Board (United States). Those standards require that we plan and perform the audit to obtain reasonable assurance about whether the financial statements and financial highlights are free of material misstatement. An audit includes examining, on a test basis, evidence supporting the amounts and disclosures in the financial statements. Our procedures included confirmation of securities owned as of July 31, 2017, by correspondence with the custodian, transfer agents and brokers or by other appropriate auditing procedures when replies from brokers or transfer agents were not received. An audit also includes assessing the accounting principles used and significant estimates made by management, as well as evaluating the overall financial statement presentation. We believe that our audits provide a reasonable basis for our opinion.
In our opinion, the financial statements and financial highlights referred to above present fairly, in all material respects, the financial position of the Funds as of July 31, 2017, and the results of their operations, the changes in their net assets and their financial highlights for the period described in the first paragraph above, in conformity with U.S. generally accepted accounting principles.

New York, New York
September 19, 2017
| | | | |
| Prudential Day One Funds | | | 227 | |
Tax Information (unaudited)
For the period ended July 31, 2017, the following Fund reports the maximum amount allowable under Section 854 of the Internal Revenue Code, but not less than, the following percentages of the ordinary income dividends paid as: 1) qualified dividend income (QDI); and 2) eligible for corporate dividends received deduction (DRD):
| | | | | | | | |
| | | QDI | | | DRD | |
Prudential Day One Income Fund | | | 3.47 | % | | | 2.04 | % |
In January 2018, you will be advised on IRS Form 1099-DIV or substitute 1099-DIV as to the federal tax status of the distributions received by you in calendar year 2017.
INFORMATION ABOUT BOARD MEMBERS AND OFFICERS
(Unaudited)
Information about Board Members and Officers of the Fund is set forth below. Board Members who are not deemed to be “interested persons” of the Fund, as defined in the 1940 Act, are referred to as “Independent Board Members.” Board Members who are deemed to be “interested persons” of the Fund are referred to as “Interested Board Members.” The Board Members are responsible for the overall supervision of the operations of the Fund and perform the various duties imposed on the directors of investment companies by the 1940 Act. The Board in turn elects the Officers, who are responsible for administering the day-to-day operations of the Fund.
| | | | |
| Independent Board Members(1) |
Name, Address, Age Position(s) Portfolios Overseen | | Principal Occupation(s) During Past Five Years | | Other Directorships Held During Past Five Years |
Ellen S. Alberding (59) Board Member Portfolios Overseen: 87 | | President and Board Member, The Joyce Foundation (charitable foundation) (since 2002); Vice Chair, City Colleges of Chicago (community college system) (since 2011); Trustee, Skills for America’s Future (national initiative to connect employers to community colleges) (since 2011); Trustee, National Park Foundation (charitable foundation for national park system) (since 2009); Trustee, Economic Club of Chicago (since 2009). | | None. |
Kevin J. Bannon (65) Board Member Portfolios Overseen: 87 | | Retired; Managing Director (April 2008-May 2015) and Chief Investment Officer (October 2008-November 2013) of Highmount Capital LLC (registered investment adviser); formerly Executive Vice President and Chief Investment Officer (April 1993-August 2007) of Bank of New York Company; President (May 2003-May 2007) of BNY Hamilton Family of Mutual Funds. | | Director of Urstadt Biddle Properties (equity real estate investment trust) (since September 2008). |
Linda W. Bynoe (65) Board Member Portfolios Overseen: 87 | | President and Chief Executive Officer (since March 1995) and formerly Chief Operating Officer (December 1989-February 1995) of Telemat Ltd. (management consulting); formerly Vice President (January 1985-June 1989) at Morgan Stanley & Co. (broker-dealer). | | Director of Simon Property Group, Inc. (retail real estate) (May 2003-May 2012); Director of Anixter International, Inc. (communication products distributor) (since January 2006); Director of Northern Trust Corporation (financial services) (since April 2006); Trustee of Equity Residential (residential real estate) (since December 2009). |
Prudential Day One Funds
| | | | |
| Independent Board Members(1) |
Name, Address, Age Position(s) Portfolios Overseen | | Principal Occupation(s) During Past Five Years | | Other Directorships Held During Past Five Years |
Barry H. Evans (56)± Board Member Portfolios Overseen: 87 | | Retired; Formerly President (2005–2016), Global Chief Operating Officer (2014–2016), Chief Investment Officer–Global Head of Fixed Income (1998-2014), and various portfolio manager roles (1986-2006), Manulife Asset Management U.S. | | Director, Manulife Trust Company (2011-present); Director, Manulife Asset Management Limited (2015-present); Formerly Chairman of the Board of Directors of Manulife Asset Management U.S. (2005-2016); Formerly Chairman of the Board, Declaration Investment Management and Research (2008-2016) |
Keith F. Hartstein (60) Board Member & Independent Chair Portfolios Overseen: 87 | | Retired; Member (since November 2014) of the Governing Council of the Independent Directors Council (organization of independent mutual fund directors); formerly President and Chief Executive Officer (2005-2012), Senior Vice President (2004-2005), Senior Vice President of Sales and Marketing (1997-2004), and various executive management positions (1990-1997), John Hancock Funds, LLC (asset management); Chairman, Investment Company Institute’s Sales Force Marketing Committee (2003-2008). | | None. |
Laurie Simon Hodrick (55)± Board Member Portfolios Overseen: 87 | | A. Barton Hepburn Professor of Economics in the Faculty of Business, Columbia Business School (since 1996); Visiting Professor of Law and Rock Center for Corporate Governance Fellow, Stanford Law School (since 2015); Visiting Fellow, Hoover Institution, Stanford University (since 2015); Sole Member, ReidCourt LLC (since 2008) (a consulting firm); Formerly Managing Director, Global Head of Alternative Investment Strategies, Deutsche Bank (2006-2008); Formerly Director/Trustee, Merrill Lynch Investment Managers Funds (1999-2006) | | Independent Director, Corporate Capital Trust (since April 2017) (a business development company) |
Michael S. Hyland, CFA (71) Board Member Portfolios Overseen: 87 | | Retired (since February 2005); formerly Senior Managing Director (July 2001-February 2005) of Bear Stearns & Co, Inc.; Global Partner, INVESCO (1999-2001); Managing Director and President of Salomon Brothers Asset Management (1989-1999). | | None. |
Visit our website at pgiminvestments.com
| | | | |
| Independent Board Members(1) |
Name, Address, Age Position(s) Portfolios Overseen | | Principal Occupation(s) During Past Five Years | | Other Directorships Held During Past Five Years |
Richard A. Redeker (74) Board Member & Independent Vice Chair Portfolios Overseen: 87 | | Retired Mutual Fund Senior Executive (47 years); Management Consultant; Director, Mutual Fund Directors Forum (since 2014); Independent Directors Council (organization of independent mutual fund directors)-Executive Committee, Chair of Policy Steering Committee, Governing Council. | | None. |
Stephen G. Stoneburn (74) Board Member Portfolios Overseen: 87 | | Chairman (since July 2011), President and Chief Executive Officer (since June 1996) of Frontline Medical Communications (publishing company); formerly President (June 1995-June 1996) of Argus Integrated Media, Inc.; Senior Vice President and Managing Director (January 1993-1995) of Cowles Business Media; Senior Vice President of Fairchild Publications, Inc. (1975-1989). | | None. |
| ± | Mr. Evans and Ms. Hodrick joined the Board effective as of September 1, 2017. |
| | | | |
| Interested Board Members(1) |
Name, Address, Age Position(s) Portfolios Overseen | | Principal Occupation(s) During Past Five Years | | Other Directorships Held During Past Five Years |
Stuart S. Parker (54) Board Member & President Portfolios Overseen: 87 | | President of PGIM Investments LLC (formerly known as Prudential Investments LLC) (since January 2012); Executive Vice President of Prudential Investment Management Services LLC (since December 2012); Executive Vice President of Jennison Associates LLC and Head of Retail Distribution of PGIM Investments LLC (June 2005-December 2011). | | None. |
Prudential Day One Funds
| | | | |
| Interested Board Members(1) |
Name, Address, Age Position(s) Portfolios Overseen | | Principal Occupation(s) During Past Five Years | | Other Directorships Held During Past Five Years |
Scott E. Benjamin (44) Board Member & Vice President Portfolios Overseen: 87 | | Executive Vice President (since June 2009) of PGIM Investments LLC; Executive Vice President (June 2009-June 2012) and Vice President (since June 2012) of Prudential Investment Management Services LLC; Executive Vice President (since September 2009) of AST Investment Services, Inc.; Senior Vice President of Product Development and Marketing, PGIM Investments (since February 2006); Vice President of Product Development and Product Management, Prudential Investments (2003-2006). | | None. |
Grace C. Torres* (58) Board Member Portfolios Overseen: 86 | | Retired; formerly Treasurer and Principal Financial and Accounting Officer of the Prudential Funds, Target Funds, Advanced Series Trust, Prudential Variable Contract Accounts and The Prudential Series Fund (1998-June 2014); Assistant Treasurer (March 1999-June 2014) and Senior Vice President (September 1999-June 2014) of PGIM Investments LLC; Assistant Treasurer (May 2003-June 2014) and Vice President (June 2005-June 2014) of AST Investment Services, Inc.; Senior Vice President and Assistant Treasurer (May 2003-June 2014) of Prudential Annuities Advisory Services, Inc. | | Director (since July 2015) of Sun Bancorp, Inc. N.A. and Sun National Bank |
| * | Note: Prior to her retirement in 2014, Ms. Torres was employed by PGIM Investments LLC. Due to her prior employment, she is considered to be an “interested person” under the 1940 Act. Ms. Torres is a Non-Management Interested Board Member. |
| (1) | The year that each Board Member joined the Board is as follows: |
Ellen S. Alberding, 2013; Kevin J. Bannon, 2008; Linda W. Bynoe, 2005; Barry H. Evans, 2017; Keith F. Hartstein, 2013; Laurie Simon Hodrick, 2017; Michael S. Hyland, 2008; Richard A. Redeker, 2003; Stephen G. Stoneburn, 1999; Grace C. Torres, 2014; Stuart S. Parker, Board Member and President since 2012; Scott E. Benjamin, Board Member since 2010 and Vice President since 2009.
Visit our website at pgiminvestments.com
| | | | |
| Fund Officers(a) |
Name, Address and Age Position with Fund | | Principal Occupation(s) During Past Five Years | | Length of Service as Fund Officer |
Raymond A. O’Hara (62) Chief Legal Officer | | Vice President and Corporate Counsel (since July 2010) of Prudential Insurance Company of America (Prudential); Vice President (March 2011-Present) of Pruco Life Insurance Company and Pruco Life Insurance Company of New Jersey; Vice President and Corporate Counsel (March 2011-Present) of Prudential Annuities Life Assurance Corporation; Chief Legal Officer of PGIM Investments LLC (since June 2012); Chief Legal Officer of Prudential Mutual Fund Services LLC (since June 2012) and Corporate Counsel of AST Investment Services, Inc. (since June 2012); formerly Assistant Vice President and Corporate Counsel (September 2008-July 2010) of The Hartford Financial Services Group, Inc.; formerly Associate (September 1980-December 1987) and Partner (January 1988–August 2008) of Blazzard & Hasenauer, P.C. (formerly, Blazzard, Grodd & Hasenauer, P.C.). | | Since 2012 |
Chad A. Earnst (42) Chief Compliance Officer | | Chief Compliance Officer (September 2014-Present) of PGIM Investments LLC; Chief Compliance Officer (September 2014-Present) of the Prudential Funds, Target Funds, Advanced Series Trust, The Prudential Series Fund, Prudential’s Gibraltar Fund, Inc., Prudential Global Short Duration High Yield Income Fund, Inc., Prudential Short Duration High Yield Fund, Inc. and Prudential Jennison MLP Income Fund, Inc.; formerly Assistant Director (March 2010-August 2014) of the Asset Management Unit, Division of Enforcement, US Securities & Exchange Commission; Assistant Regional Director (January 2010-August 2014), Branch Chief (June 2006–December 2009) and Senior Counsel (April 2003-May 2006) of the Miami Regional Office, Division of Enforcement, US Securities & Exchange Commission. | | Since 2014 |
| Deborah A. Docs (59) Secretary | | Vice President and Corporate Counsel (since January 2001) of Prudential; Vice President (since December 1996) and Assistant Secretary (since March 1999) of PGIM Investments LLC; formerly Vice President and Assistant Secretary (May 2003-June 2005) of AST Investment Services, Inc. | | Since 2004 |
Jonathan D. Shain (59) Assistant Secretary | | Vice President and Corporate Counsel (since August 1998) of Prudential; Vice President and Assistant Secretary (since May 2001) of PGIM Investments LLC; Vice President and Assistant Secretary (since February 2001) of Prudential Mutual Fund Services LLC; formerly Vice President and Assistant Secretary (May 2003-June 2005) of AST Investment Services, Inc. | | Since 2005 |
Claudia DiGiacomo (42) Assistant Secretary | | Vice President and Corporate Counsel (since January 2005) of Prudential; Vice President and Assistant Secretary of PGIM Investments LLC (since December 2005); Associate at Sidley Austin Brown & Wood LLP (1999-2004). | | Since 2005 |
Prudential Day One Funds
| | | | |
| Fund Officers(a) |
Name, Address and Age Position with Fund | | Principal Occupation(s) During Past Five Years | | Length of Service as Fund Officer |
Andrew R. French (54) Assistant Secretary | | Vice President and Corporate Counsel (since February 2010) of Prudential; formerly Director and Corporate Counsel (2006-2010) of Prudential; Vice President and Assistant Secretary (since January 2007) of PGIM Investments LLC; Vice President and Assistant Secretary (since January 2007) of Prudential Mutual Fund Services LLC. | | Since 2006 |
Charles H. Smith (44) Anti-Money Laundering Compliance Officer | | Vice President, Corporate Compliance, Anti-Money Laundering Unit (since January 2015) of Prudential; committee member of the American Council of Life Insurers Anti-Money Laundering and Critical Infrastructure Committee (since January 2016); formerly Global Head of Economic Sanctions Compliance at AIG Property Casualty (February 2007–December 2014); Assistant Attorney General at the New York State Attorney General’s Office, Division of Public Advocacy. (August 1998 —January 2007). | | Since 2016 |
M. Sadiq Peshimam (53) Treasurer and Principal Financial and Accounting Officer | | Vice President (since 2005) of PGIM Investments LLC; formerly Assistant Treasurer of funds in the Prudential Mutual Fund Complex (2006-2014). | | Since 2006 |
Peter Parrella (59) Assistant Treasurer | | Vice President (since 2007) and Director (2004-2007) within Prudential Mutual Fund Administration; formerly Tax Manager at SSB Citi Fund Management LLC (1997-2004). | | Since 2007 |
Lana Lomuti (50) Assistant Treasurer | | Vice President (since 2007) and Director (2005-2007), within Prudential Mutual Fund Administration; formerly Assistant Treasurer (December 2007-February 2014) of The Greater China Fund, Inc. | | Since 2014 |
Linda McMullin (56) Assistant Treasurer | | Vice President (since 2011) and Director (2008-2011) within Prudential Mutual Fund Administration. | | Since 2014 |
Kelly A. Coyne (49) Assistant Treasurer | | Director, Investment Operations of Prudential Mutual Fund Services LLC (since 2010). | | Since 2015 |
| (a) | Excludes Mr. Parker and Mr. Benjamin, interested Board Members who also serve as President and Vice President, respectively. |
Explanatory Notes to Tables:
| • | | Board Members are deemed to be “Interested,” as defined in the 1940 Act, by reason of their affiliation with PGIM Investments LLC and/or an affiliate of PGIM Investments LLC. |
| • | | Unless otherwise noted, the address of all Board Members and Officers is c/o PGIM Investments LLC, 655 Broad Street, Newark, New Jersey 07102-4410. |
| • | | There is no set term of office for Board Members or Officers. The Board Members have adopted a retirement policy, which calls for the retirement of Board Members on December 31 of the year in which they reach the age of 75. |
| • | | “Other Directorships Held” includes only directorships of companies required to register or file reports with the SEC under the 1934 Act (that is, “public companies”) or other investment companies registered under the 1940 Act. |
| • | | “Portfolios Overseen” includes all investment companies managed by PGIM Investments LLC. The investment companies for which PGIM Investments LLC serves as manager include the Prudential Mutual Funds, The Prudential Variable Contract Accounts, Target Mutual Funds, Prudential Short Duration High Yield Fund, Inc., Prudential Global Short Duration High Yield Fund, Inc., The Prudential Series Fund, Prudential’s Gibraltar Fund, Inc. and the Advanced Series Trust. |
Visit our website at pgiminvestments.com
| | | | |
| ∎ MAIL | | ∎ TELEPHONE | | ∎ WEBSITE |
655 Broad Street Newark, NJ 07102 | | (800) 225-1852 | | www.pgiminvestments.com |
|
| PROXY VOTING |
The Board of Trustees of the Funds has delegated to the Funds’ investment subadviser the responsibility for voting any proxies and maintaining proxy recordkeeping with respect to the Funds. A description of these proxy voting policies and procedures is available without charge, upon request, by calling
(800) 225-1852 or by visiting the Securities and Exchange Commission’s website at www.sec.gov. Information regarding how the Funds voted proxies relating to portfolio securities during the most recent 12-month period ended June 30 is available on the Funds’ website and on the Securities and Exchange Commission’s website. |
|
| TRUSTEES |
| Ellen S. Alberding • Kevin J. Bannon • Scott E. Benjamin • Linda W. Bynoe • Barry H. Evans • Keith F. Hartstein • Laurie Simon Hodrick • Michael S. Hyland • Stuart S. Parker • Richard A. Redeker • Stephen G. Stoneburn • Grace C. Torres |
|
| OFFICERS |
| Stuart S. Parker, President • Scott E. Benjamin, Vice President • M. Sadiq Peshimam, Treasurer and Principal Financial and Accounting Officer • Raymond A. O’Hara, Chief Legal Officer • Deborah A. Docs, Secretary • Chad A. Earnst, Chief Compliance Officer • Charles H. Smith, Anti-Money Laundering Compliance Officer • Jonathan D. Shain, Assistant Secretary • Claudia DiGiacomo, Assistant Secretary • Andrew R. French, Assistant Secretary • Peter Parrella, Assistant Treasurer • Lana Lomuti, Assistant Treasurer • Linda McMullin, Assistant Treasurer • Kelly A. Coyne, Assistant Treasurer |
| | | | |
| MANAGER | | PGIM Investments LLC | | 655 Broad Street Newark, NJ 07102 |
|
| INVESTMENT SUBADVISER | | Quantitative Management Associates LLC | | Gateway Center Two 100 Mulberry Street Newark, NJ 07102 |
|
| DISTRIBUTOR | | Prudential Investment Management Services LLC | | 655 Broad Street Newark, NJ 07102 |
|
| CUSTODIAN | | The Bank of New York Mellon | | 225 Liberty Street New York, NY 10286 |
|
| TRANSFER AGENT | | Prudential Mutual Fund Services LLC | | PO Box 9658 Providence, RI 02940 |
|
INDEPENDENT REGISTERED
PUBLIC ACCOUNTING FIRM | | KPMG LLP | | 345 Park Avenue New York, NY 10154 |
|
| FUND COUNSEL | | Willkie Farr & Gallagher LLP | | 787 Seventh Avenue New York, NY 10019 |
|
|
| An investor should consider the investment objectives, risks, charges, and expenses of the Funds carefully before investing. The prospectus and summary prospectus for each Fund contain this and other information about the Funds. An investor may obtain a prospectus and summary prospectus by visiting our website at www.pgiminvestments.com or by calling (800) 225-1852. The prospectus and summary prospectus should be read carefully before investing. |
|
| E-DELIVERY |
| To receive your mutual fund documents online, go to www.pgiminvestments.com/edelivery and enroll. Instead of receiving printed documents by mail, you will receive notification via email when new materials are available. You can cancel your enrollment or change your email address at any time by visiting the website address above. |
|
| SHAREHOLDER COMMUNICATIONS WITH TRUSTEES |
| Shareholders can communicate directly with the Board of Trustees by writing to the Chair of the Board, Prudential Day One Funds, PGIM Investments, Attn: Board of Trustees, 655 Broad Street, Newark, NJ 07102. Shareholders can communicate directly with an individual Trustee by writing to the same address. Communications are not screened before being delivered to the addressee. |
|
| AVAILABILITY OF PORTFOLIO SCHEDULE |
| Each Fund files its complete schedule of portfolio holdings with the Securities and Exchange Commission for the first and third quarters of each fiscal year on Form N-Q. Each Fund’s Forms N-Q will be available on the Commission’s website at www.sec.gov. Each Fund’s Forms N-Q may also be reviewed and copied at the Commission’s Public Reference Room in Washington, D.C. Information on the operation and location of the Public Reference Room may be obtained by calling 1-800-SEC-0330. Each Fund’s schedule of portfolio holdings is also available on the Funds’ website as of the end of each month no sooner than 15 days after the end of the month. |
|
| The Fund’s Statement of Additional Information contains additional information about the Fund’s Trustees and is available without charge, upon request, by calling (800) 225-1852. |
Mutual Funds:
| | | | |
ARE NOT INSURED BY THE FDIC OR ANY
FEDERAL GOVERNMENT AGENCY | | MAY LOSE VALUE | | ARE NOT A DEPOSIT OF OR GUARANTEED
BY ANY BANK OR ANY BANK AFFILIATE |
| | | | | | | | | | | | | | | | | | | | |
| PRUDENTIAL DAY ONE FUNDS | | NASDAQ | | CUSIP | | | | | | NASDAQ | | CUSIP | | | | | | NASDAQ | | CUSIP |
| Prudential Day One Income Fund (Share Class R1) | | PDADX | | 74445D109 | | | | Prudential Day One 2025 Fund (Share Class R1) | | PDEDX | | 74445D711 | | | | Prudential Day One 2045 Fund (Share Class R1) | | PDIDX | | 74445D448 |
| Prudential Day One Income Fund (Share Class R2) | | PDAEX | | 74445D208 | | | | Prudential Day One 2025 Fund (Share Class R2) | | PDEEX | | 74445D695 | | | | Prudential Day One 2045 Fund (Share Class R2) | | PDIEX | | 74445D430 |
| Prudential Day One Income Fund (Share Class R3) | | PDAFX | | 74445D307 | | | | Prudential Day One 2025 Fund (Share Class R3) | | PDEFX | | 74445D687 | | | | Prudential Day One 2045 Fund (Share Class R3) | | PDIKX | | 74445D422 |
| Prudential Day One Income Fund (Share Class R4) | | PDAGX | | 74445D406 | | | | Prudential Day One 2025 Fund (Share Class R4) | | PDEGX | | 74445D679 | | | | Prudential Day One 2045 Fund (Share Class R4) | | PDIGX | | 74445D414 |
| Prudential Day One Income Fund (Share Class R5) | | PDAHX | | 74445D505 | | | | Prudential Day One 2025 Fund (Share Class R5) | | PDEHX | | 74445D661 | | | | Prudential Day One 2045 Fund (Share Class R5) | | PDIHX | | 74445D398 |
| Prudential Day One Income Fund (Share Class R6) | | PDAJX | | 74445D604 | | | | Prudential Day One 2025 Fund (Share Class R6) | | PDEJX | | 74445D653 | | | | Prudential Day One 2045 Fund (Share Class R6) | | PDIJX | | 74445D380 |
| Prudential Day One 2010 Fund (Share Class R1) | | PDBDX | | 74445D703 | | | | Prudential Day One 2030 Fund (Share Class R1) | | PDFCX | | 74445D646 | | | | Prudential Day One 2050 Fund (Share Class R1) | | PDJDX | | 74445D372 |
| Prudential Day One 2010 Fund (Share Class R2) | | PDBEX | | 74445D802 | | | | Prudential Day One 2030 Fund (Share Class R2) | | PDFEX | | 74445D638 | | | | Prudential Day One 2050 Fund (Share Class R2) | | PDJEX | | 74445D364 |
| Prudential Day One 2010 Fund (Share Class R3) | | PDBFX | | 74445D885 | | | | Prudential Day One 2030 Fund (Share Class R3) | | PDFFX | | 74445D620 | | | | Prudential Day One 2050 Fund (Share Class R3) | | PDJFX | | 74445D356 |
| Prudential Day One 2010 Fund (Share Class R4) | | PDBGX | | 74445D877 | | | | Prudential Day One 2030 Fund (Share Class R4) | | PDFGX | | 74445D612 | | | | Prudential Day One 2050 Fund (Share Class R4) | | PDJGX | | 74445D349 |
| Prudential Day One 2010 Fund (Share Class R5) | | PDBHX | | 74445D869 | | | | Prudential Day One 2030 Fund (Share Class R5) | | PDFHX | | 74445D596 | | | | Prudential Day One 2050 Fund (Share Class R5) | | PDJHX | | 74445D331 |
| Prudential Day One 2010 Fund (Share Class R6) | | PDBJX | | 74445D851 | | | | Prudential Day One 2030 Fund (Share Class R6) | | PDFJX | | 74445D588 | | | | Prudential Day One 2050 Fund (Share Class R6) | | PDJJX | | 74445D323 |
| Prudential Day One 2015 Fund (Share Class R1) | | PDCDX | | 74445D844 | | | | Prudential Day One 2035 Fund (Share Class R1) | | PDGCX | | 74445D570 | | | | Prudential Day One 2055 Fund (Share Class R1) | | PDKDX | | 74445D315 |
| Prudential Day One 2015 Fund (Share Class R2) | | PDCEX | | 74445D836 | | | | Prudential Day One 2035 Fund (Share Class R2) | | PDGEX | | 74445D562 | | | | Prudential Day One 2055 Fund (Share Class R2) | | PDKEX | | 74445D299 |
| Prudential Day One 2015 Fund (Share Class R3) | | PDCFX | | 74445D828 | | | | Prudential Day One 2035 Fund (Share Class R3) | | PDGFX | | 74445D554 | | | | Prudential Day One 2055 Fund (Share Class R3) | | PDKFX | | 74445D281 |
| Prudential Day One 2015 Fund (Share Class R4) | | PDCGX | | 74445D810 | | | | Prudential Day One 2035 Fund (Share Class R4) | | PDGGX | | 74445D547 | | | | Prudential Day One 2055 Fund (Share Class R4) | | PDKGX | | 74445D273 |
| Prudential Day One 2015 Fund (Share Class R5) | | PDCHX | | 74445D794 | | | | Prudential Day One 2035 Fund (Share Class R5) | | PDGHX | | 74445D539 | | | | Prudential Day One 2055 Fund (Share Class R5) | | PDKHX | | 74445D265 |
| Prudential Day One 2015 Fund (Share Class R6) | | PDCJX | | 74445D786 | | | | Prudential Day One 2035 Fund (Share Class R6) | | PDGJX | | 74445D521 | | | | Prudential Day One 2055 Fund (Share Class R6) | | PDKJX | | 74445D257 |
| Prudential Day One 2020 Fund (Share Class R1) | | PDDDX | | 74445D778 | | | | Prudential Day One 2040 Fund (Share Class R1) | | PDHDX | | 74445D513 | | | | Prudential Day One 2060 Fund (Share Class R1) | | PDLDX | | 74445D240 |
| Prudential Day One 2020 Fund (Share Class R2) | | PDDEX | | 74445D760 | | | | Prudential Day One 2040 Fund (Share Class R2) | | PDHEX | | 74445D497 | | | | Prudential Day One 2060 Fund (Share Class R2) | | PDLEX | | 74445D232 |
| Prudential Day One 2020 Fund (Share Class R3) | | PDDFX | | 74445D752 | | | | Prudential Day One 2040 Fund (Share Class R3) | | PDHFX | | 74445D489 | | | | Prudential Day One 2060 Fund (Share Class R3) | | PDLFX | | 74445D224 |
| Prudential Day One 2020 Fund (Share Class R4) | | PDDGX | | 74445D745 | | | | Prudential Day One 2040 Fund (Share Class R4) | | PDHGX | | 74445D471 | | | | Prudential Day One 2060 Fund (Share Class R4) | | PDLGX | | 74445D216 |
| Prudential Day One 2020 Fund (Share Class R5) | | PDDHX | | 74445D737 | | | | Prudential Day One 2040 Fund (Share Class R5) | | PDHHX | | 74445D463 | | | | Prudential Day One 2060 Fund (Share Class R5) | | PDLHX | | 74445D190 |
| Prudential Day One 2020 Fund (Share Class R6) | | PDDJX | | 74445D729 | | | | Prudential Day One 2040 Fund (Share Class R6) | | PDHJX | | 74445D455 | | | | Prudential Day One 2060 Fund (Share Class R6) | | PDLJX | | 74445D182 |
MF236E
| Item | 2 – Code of Ethics – – See Exhibit (a) |
As of the end of the period covered by this report, the registrant has adopted a code of ethics (the “Section 406 Standards for Investment Companies – Ethical Standards for Principal Executive and Financial Officers”) that applies to the registrant’s Principal Executive Officer and Principal Financial Officer; the registrant’s Principal Financial Officer also serves as the Principal Accounting Officer.
The registrant hereby undertakes to provide any person, without charge, upon request, a copy of the code of ethics. To request a copy of the code of ethics, contact the registrant 800-225-1852, and ask for a copy of the Section 406 Standards for Investment Companies - Ethical Standards for Principal Executive and Financial Officers.
| Item | 3 – Audit Committee Financial Expert – |
The registrant’s Board has determined that Mr. Kevin J. Bannon, member of the Board’s Audit Committee is an “audit committee financial expert,” and that he is “independent,” for purposes of this Item.
| Item | 4 – Principal Accountant Fees and Services – |
(a) Audit Fees
For the fiscal years ended July 31, 2017 and July 31, 2016, KPMG LLP (“KPMG”), the Registrant’s principal accountant, billed the Registrant $287,152 and $50,407 respectively, for professional services rendered for the audit of the Registrant’s annual financial statements or services that are normally provided in connection with statutory and regulatory filings.
(b) Audit-Related Fees
For the fiscal years ended July 31, 2017 and July 31, 2016: none.
(c) Tax Fees
For the fiscal years ended July 31, 2017 and July 31, 2016: none.
(d) All Other Fees
For the fiscal years ended July 31, 2017 and July 31, 2016: none.
(e) (1) Audit Committee Pre-Approval Policies and Procedures
THE PRUDENTIAL MUTUAL FUNDS
AUDIT COMMITTEE POLICY
on
Pre-Approval of Services Provided by the Independent Accountants
The Audit Committee of each Prudential Mutual Fund is charged with the responsibility to monitor the independence of the Fund’s independent accountants. As part of this responsibility, the Audit Committee must pre-approve the independent accounting firm’s engagement to render audit and/or permissible non-audit services, as required by law. In evaluating a proposed engagement of the independent accountants, the Audit Committee will assess the effect that the engagement might reasonably be expected to have on the accountant’s independence. The Committee’s evaluation will be based on:
| | ● | a review of the nature of the professional services expected to be provided, |
| | ● | a review of the safeguards put into place by the accounting firm to safeguard independence, and |
| | ● | periodic meetings with the accounting firm. |
Policy for Audit and Non-Audit Services Provided to the Funds
On an annual basis, the scope of audits for each Fund, audit fees and expenses, and audit-related and non-audit services (and fees proposed in respect thereof) proposed to be performed by the Fund’s independent accountants will be presented by the Treasurer and the independent accountants to the Audit Committee for review and, as appropriate, approval prior to the initiation of such services. Such presentation shall be accompanied by confirmation by both the Treasurer and the independent accountants that the proposed non-audit services will not adversely affect the independence of the independent accountants. Such proposed non-audit services shall be described in sufficient detail to enable the Audit Committee to assess the appropriateness of such services and fees, and the compatibility of the provision of such services with the auditor’s independence. The Committee shall receive periodic reports on the progress of the audit and other services which are approved by the Committee or by the Committee Chair pursuant to authority delegated in this Policy.
The categories of services enumerated under “Audit Services”, “Audit-related Services”, and “Tax Services” are intended to provide guidance to the Treasurer and the independent accountants as to those categories of services which the Committee believes are generally consistent with the independence of the independent accountants and which the Committee (or the Committee Chair) would expect upon the presentation of specific proposals to pre-approve. The enumerated categories are not intended as an exclusive list of audit, audit-related or tax services, which the Committee (or the Committee Chair) would consider for pre-approval.
Audit Services
The following categories of audit services are considered to be consistent with the role of the Fund’s independent accountants:
| | Ø | Annual Fund financial statement audits |
| | Ø | Seed audits (related to new product filings, as required) |
| | Ø | SEC and regulatory filings and consents |
Audit-related Services
The following categories of audit-related services are considered to be consistent with the role of the Fund’s independent accountants:
| | Ø | Accounting consultations |
| | Ø | Fund merger support services |
| | Ø | Agreed Upon Procedure Reports |
| | Ø | Other Internal Control Reports |
Individual audit-related services that fall within one of these categories (except for fund merger support services) and are not presented to the Audit Committee as part of the annual pre-approval process are subject to an authorized pre-approval by the Audit Committee so long as the estimated fee for those services does not exceed $30,000. Any services provided under such pre-approval will be reported to the Audit Committee at its next regular meeting. Should the amount of such services exceed $30,000 any additional fees will be subject to pre-approval by the Committee Chair (or any other Committee member on whom this responsibility has been delegated). Fees related to fund merger support services are subject to a separate authorized pre-approval by the Audit Committee with fees determined on a per occurrence and merger complexity basis.
Tax Services
The following categories of tax services are considered to be consistent with the role of the Fund’s independent accountants:
| | Ø | Tax compliance services related to the filing or amendment of the following: |
| | ◾ | Federal, state and local income tax compliance; and, |
| | ◾ | Sales and use tax compliance |
| | Ø | Timely RIC qualification reviews |
| | Ø | Tax distribution analysis and planning |
| | Ø | Tax authority examination services |
| | Ø | Tax appeals support services |
| | Ø | Accounting methods studies |
| | Ø | Fund merger support services |
| | Ø | Tax consulting services and related projects |
Individual tax services that fall within one of these categories and are not presented to the Audit Committee as part of the annual pre-approval process are subject to an authorized pre-approval by the Audit Committee so long as the estimated fee for those services does not exceed $30,000. Any services provided under such pre-approval will be reported to the Audit Committee at its next regular meeting. Should the amount of such services exceed $30,000 any additional fees will be subject to pre-approval by the Committee Chair (or any other Committee member on whom this responsibility has been delegated).
Other Non-Audit Services
Certain non-audit services that the independent accountants are legally permitted to render will be subject to pre-approval by the Committee or by one or more Committee members to whom the Committee has delegated this authority and who will report to the full Committee any pre-approval decisions made pursuant to this Policy. Non-audit services presented for pre-approval pursuant to this paragraph will be accompanied by a confirmation from both the Treasurer and the independent accountants that the proposed services will not adversely affect the independence of the independent accountants.
Proscribed Services
The Fund’s independent accountants will not render services in the following categories of non-audit services:
| | Ø | Bookkeeping or other services related to the accounting records or financial statements of the Fund |
| | Ø | Financial information systems design and implementation |
| | Ø | Appraisal or valuation services, fairness opinions, or contribution-in-kind reports |
| | Ø | Internal audit outsourcing services |
| | Ø | Management functions or human resources |
| | Ø | Broker or dealer, investment adviser, or investment banking services |
| | Ø | Legal services and expert services unrelated to the audit |
| | Ø | Any other service that the Public Company Accounting Oversight Board determines, by regulation, is impermissible. |
Pre-approval of Non-Audit Services Provided to Other Entities Within the Prudential Fund Complex
Certain non-audit services provided to PGIM Investments LLC or any of its affiliates that also provide ongoing services to the Prudential Mutual Funds will be subject to pre-approval by the Audit Committee. The only non-audit services provided to these entities that will require pre-approval are those related directly to the operations and financial reporting of the Funds. Individual projects that are not presented to the Audit Committee as part of the annual pre-approval process will be subject to pre-approval by the Committee Chair (or any other Committee member on whom this responsibility has been delegated) so long as the estimated fee for those services does not exceed $30,000. Services presented for pre-approval pursuant to this paragraph will be accompanied by a confirmation from both the Treasurer and the independent accountants that the proposed services will not adversely affect the independence of the independent accountants.
Although the Audit Committee will not pre-approve all services provided to PGIM Investments LLC and its affiliates, the Committee will receive an annual report from the Fund’s independent accounting firm showing the aggregate fees for all services provided to PGIM Investments LLC and its affiliates.
(e) (2) Percentage of services referred to in 4(b) – 4(d) that were approved by the audit committee –
For the fiscal years ended July 31, 2017 and July 31, 2016: none.
(f) Percentage of hours expended attributable to work performed by other than full time employees of principal accountant if greater than 50%.
The percentage of hours expended on the principal accountant’s engagement to audit the registrant’s financial statements for the most recent fiscal year that were attributed to work performed by persons other than the principal accountant’s full-time, permanent employees was 0%.
(g) Non-Audit Fees
The aggregate non-audit fees billed by KPMG for services rendered to the registrant’s investment adviser and any entity controlling, controlled by, or under common control with the investment adviser that provides ongoing services to the registrant for the fiscal years ended July 31, 2017 and July 31, 2016 was $0 and $0, respectively.
(h) Principal Accountant’s Independence
Not applicable as KPMG has not provided non-audit services to the registrant’s investment adviser and any entity controlling, controlled by, or under common control with the investment adviser that provides ongoing services to the registrant that were not pre-approved pursuant to Rule 2-01(c)(7)(ii) of Regulation S-X.
| Item 5 – | Audit Committee of Listed Registrants – Not applicable. |
| Item 6 – | Schedule of Investments – The schedule is included as part of the report to shareholders filed under Item 1 of this Form. |
| Item 7 – | Disclosure of Proxy Voting Policies and Procedures for Closed-End Management Investment Companies – Not applicable. |
| Item 8 – | Portfolio Managers of Closed-End Management Investment Companies – Not applicable. |
| Item 9 – | Purchases of Equity Securities by Closed-End Management Investment Company and Affiliated Purchasers – Not applicable. |
| Item 10 – | Submission of Matters to a Vote of Security Holders – Not applicable. |
| Item 11 – | Controls and Procedures |
| | (a) | It is the conclusion of the registrant’s principal executive officer and principal financial officer that the effectiveness of the registrant’s current disclosure controls and procedures (such disclosure controls and procedures having been evaluated within 90 days of the date of this filing) provide reasonable assurance that the information required to be disclosed by the registrant has been recorded, processed, summarized and reported within the time period specified in the Commission’s rules and forms and that the information required to be disclosed by the registrant has been accumulated and communicated to the registrant’s principal executive officer and principal financial officer in order to allow timely decisions regarding required disclosure. |
| | (b) | There has been no significant change in the registrant’s internal control over financial reporting that occurred during the registrant’s most recent fiscal quarter of the period covered by this report that has materially affected, or is likely to materially affect, the registrant’s internal control over financial reporting. |
| | (a) | (1) Code of Ethics – Attached hereto as Exhibit EX-99.CODE-ETH |
| | (2) Certifications | pursuant to Section 302 of the Sarbanes-Oxley Act – Attached hereto as Exhibit EX-99.CERT. |
| | (3) Any | written solicitation to purchase securities under Rule 23c-1. – Not applicable. |
| | (b) | Certifications pursuant to Section 906 of the Sarbanes-Oxley Act – Attached hereto as Exhibit EX-99.906CERT. |
SIGNATURES
Pursuant to the requirements of the Securities Exchange Act of 1934 and the Investment Company Act of 1940, the registrant has duly caused this report to be signed on its behalf by the undersigned, thereunto duly authorized.
| | |
| Registrant: | | Prudential Investment Portfolios 5 |
| |
| By: | | /s/ Deborah A. Docs |
| | Deborah A. Docs |
| | Secretary |
| |
| Date: | | September 21, 2017 |
Pursuant to the requirements of the Securities Exchange Act of 1934 and the Investment Company Act of 1940, this report has been signed below by the following persons on behalf of the registrant and in the capacities and on the dates indicated.
| | |
| By: | | /s/ Stuart S. Parker |
| | Stuart S. Parker |
| | President and Principal Executive Officer |
| |
| Date: | | September 21, 2017 |
| |
| By: | | /s/ M. Sadiq Peshimam |
| | M. Sadiq Peshimam |
| | Treasurer and Principal Financial and Accounting Officer |
| |
| Date: | | September 21, 2017 |